


Abstract
Urban public spaces are an essential component of everyday life in urban communities, and micro public spaces have become an important vehicle for improving living environment quality and enhancing ecological benefits in community renewal within built-up areas. From an economic perspective, this study focuses on the quantification of carbon value generated through the renewal of micro public spaces. Four micro public spaces of comparable size but differing locational and functional characteristics, completed in Wuhan in 2023, were selected as case studies. Plant carbon sequestration was estimated using the biomass expansion factor method combined with field-based forestry surveys, while indirect emission reduction associated with residents’ outdoor activities was assessed through spatiotemporal observations of user behavior. These results were further translated into carbon value based on China’s carbon trading standards to support comparative analysis and design-oriented recommendations. The results indicate that direct sequestration significantly outweighs indirect reduction: the carbon storage density of trees ranges from 0.40 to 1.97 kg/m2, with the total storage of HRP reaching 11,587.36 kg; in contrast, annual indirect reduction from resident activities is only 1.34–141.19 kg. Carbon sequestration performance is strongly influenced by the presence of large trees, while micro public spaces located in newly developed and commercial areas exhibit substantially lower emission reduction efficiency than those in older and densely populated residential neighborhoods. In addition, the functional attributes of micro public spaces shape age-specific use patterns, thereby significantly affecting emission reduction outcomes. Based on these findings, targeted optimization strategies for micro public space renewal are proposed to support people-oriented, sustainable, and systematic low-carbon urban regeneration.
1. Introduction
“Carbon peaking” and “carbon neutrality” are major strategic decisions formulated by China in response to climate change. The carbon sinks and carbon emissions of urban public spaces represent an important pathway for achieving China’s “dual carbon” goals within the urban living environment. In the context of community renewal, micro public spaces are small in size yet primarily serve urban residents and support everyday urban life. They also function as the “last mile” through which urban green space development reaches communities and residents. Under the current paradigm of high-quality, refined, and sustainable urban development, although micro public spaces are limited in scale, they exhibit a clear trend of widespread implementation and are expected to play an increasingly important role in improving living environment quality and enhancing ecological benefits in the future.
Within this policy and planning context, existing studies by both domestic and international scholars provide a solid foundation for estimating the carbon sequestration and emission reduction benefits of urban public spaces. Drawing on this foundation, the extensive body of research focusing on urban green spaces as primary carbon sinks provides robust methodological support for the present study. Nowak et al. demonstrated that plant species with longer lifespans, greater biomass, and faster growth rates significantly enhance carbon sequestration capacity, while planting density and the proportion of large-diameter trees are key determinants of urban carbon storage [1]. Strohbach et al. were among the first to systematically apply life cycle assessment (LCA) to evaluate the carbon footprint of urban green spaces [2].
At larger spatial scales, carbon sequestration in urban green spaces is commonly estimated using remote sensing data combined with modeling approaches, including the Modeling Urban Biogenic Fluxes (SMUrF) model [3], the Urban Vegetation Photosynthesis Respiration Model (Urban-VPRM) [4], and the Carnegie–Ames–Stanford Approach (CASA) model. For example, Wang et al. employed the CASA model with remote sensing imagery to assess the carbon sequestration capacity and spatiotemporal dynamics of park green spaces in Shanghai [5]. Liu et al. reviewed advances and limitations in carbon sequestration and emission reduction research on urban blue–green infrastructure and summarized carbon efficiency measurement methods across different spatial scales, noting that site-scale studies mainly rely on sample extrapolation and tree proportion estimation methods [6]. In addition, Dong et al. proposed a novel approach to estimating photosynthetic rates by integrating light response curves with meteorological data, thereby improving the accuracy of carbon sequestration assessments for urban green spaces [7].
At the community scale, existing research on micro-scale public spaces has primarily focused on collaborative governance mechanisms and the co-creation of green spaces. From a placemaking perspective, Wesener et al. systematically examined the driving forces and governance barriers involved in the transformation of urban community gardens from physical spaces into socially embedded places [8]. Zhen and Mensah et al. explored how community green spaces foster social capital, emphasizing differences in green space needs among diverse population groups and investigating governance strategies based on green space interventions [9,10]. Yang et al. applied data envelopment analysis to develop low-carbon landscape solutions across multiple dimensions, including land use planning, plant selection, and material application [11].
Overall, existing studies have focused primarily on empirical analyses of large-scale urban green spaces. Although methodological frameworks for estimating carbon sequestration at the site scale have been proposed, empirical applications to small-scale green spaces remain limited. In particular, survey-based methods for micro-scale public spaces still require validation through systematic field investigations. Moreover, while individual micro public spaces are small in size, their cumulative carbon benefits become increasingly significant as this type of renewal is widely implemented. Although scholars have recognized the green, low-carbon benefits and financial driving effects of community public spaces, research that quantifies these spaces from a carbon value perspective remains scarce. To address this gap, this study introduces a carbon-value-based approach to support renewal strategies for community micro public spaces.
Accordingly, this study selects four micro public spaces of similar size but differing characteristics from 24 projects completed during community renewal initiatives in Wuhan in 2023. Focusing on the construction of a carbon accounting framework for community micro public spaces, the study combines on-site forestry surveys of vegetation with continuous observations of pedestrian activity. By integrating national standards for carbon emission and sequestration conversion with carbon trading valuation systems, the study quantifies direct carbon sequestration by green spaces and estimates indirect carbon reduction benefits associated with reduced indoor energy consumption resulting from increased outdoor activity. Compared with previous studies that focus primarily on park-scale or single carbon sequestration measurements, this study develops an integrated accounting framework tailored to micro public spaces. It further proposes an economic valuation method for carbon benefits, providing empirical evidence to inform low-carbon development pathways in community renewal.
2. Materials and Method Methodology
2.1. Case Study Area
Wuhan is located in the eastern Jianghan Plain and serves as the capital of Hubei Province. In recent years, Wuhan has continuously promoted urban greening and environmental quality improvement, aiming to establish an urban green space system with distinct local characteristics. In addition to advancing the development of large urban parks and road-side greenery [12], the city has actively implemented a refined landscape initiative. As early as 2016, Wuhan organized the preparation of planning schemes for community-level micro public spaces in seven central urban districts, resulting in a relatively comprehensive and well-documented planning database for micro public spaces [13].
In 2022, the Wuhan Municipal Bureau of Natural Resources and Planning issued the Three-Year Action Plan for “Seeing the City through Micro Spaces—Refined Wuhan” (2022–2024), which aims to promote community renewal projects for 1000 micro public spaces within the central urban area over three years [14]. The plan defines micro public spaces as small, publicly accessible open spaces ranging from 300 to 4000 m2 in area (smaller than neighborhood parks), designed to support recreation and leisure activities, allow for short stays, and facilitate convenient use by nearby residents. Through the activation of underutilized micro spaces, these projects seek to meet diverse community needs and improve everyday living environments [15].
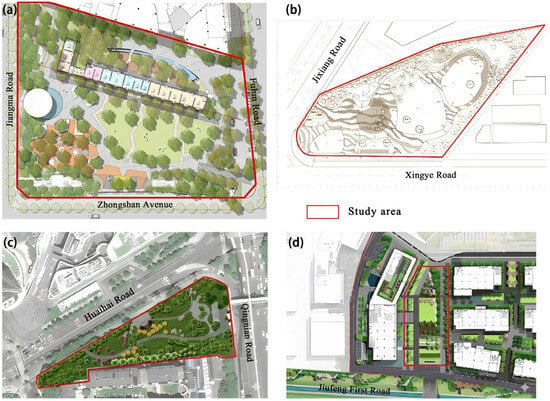
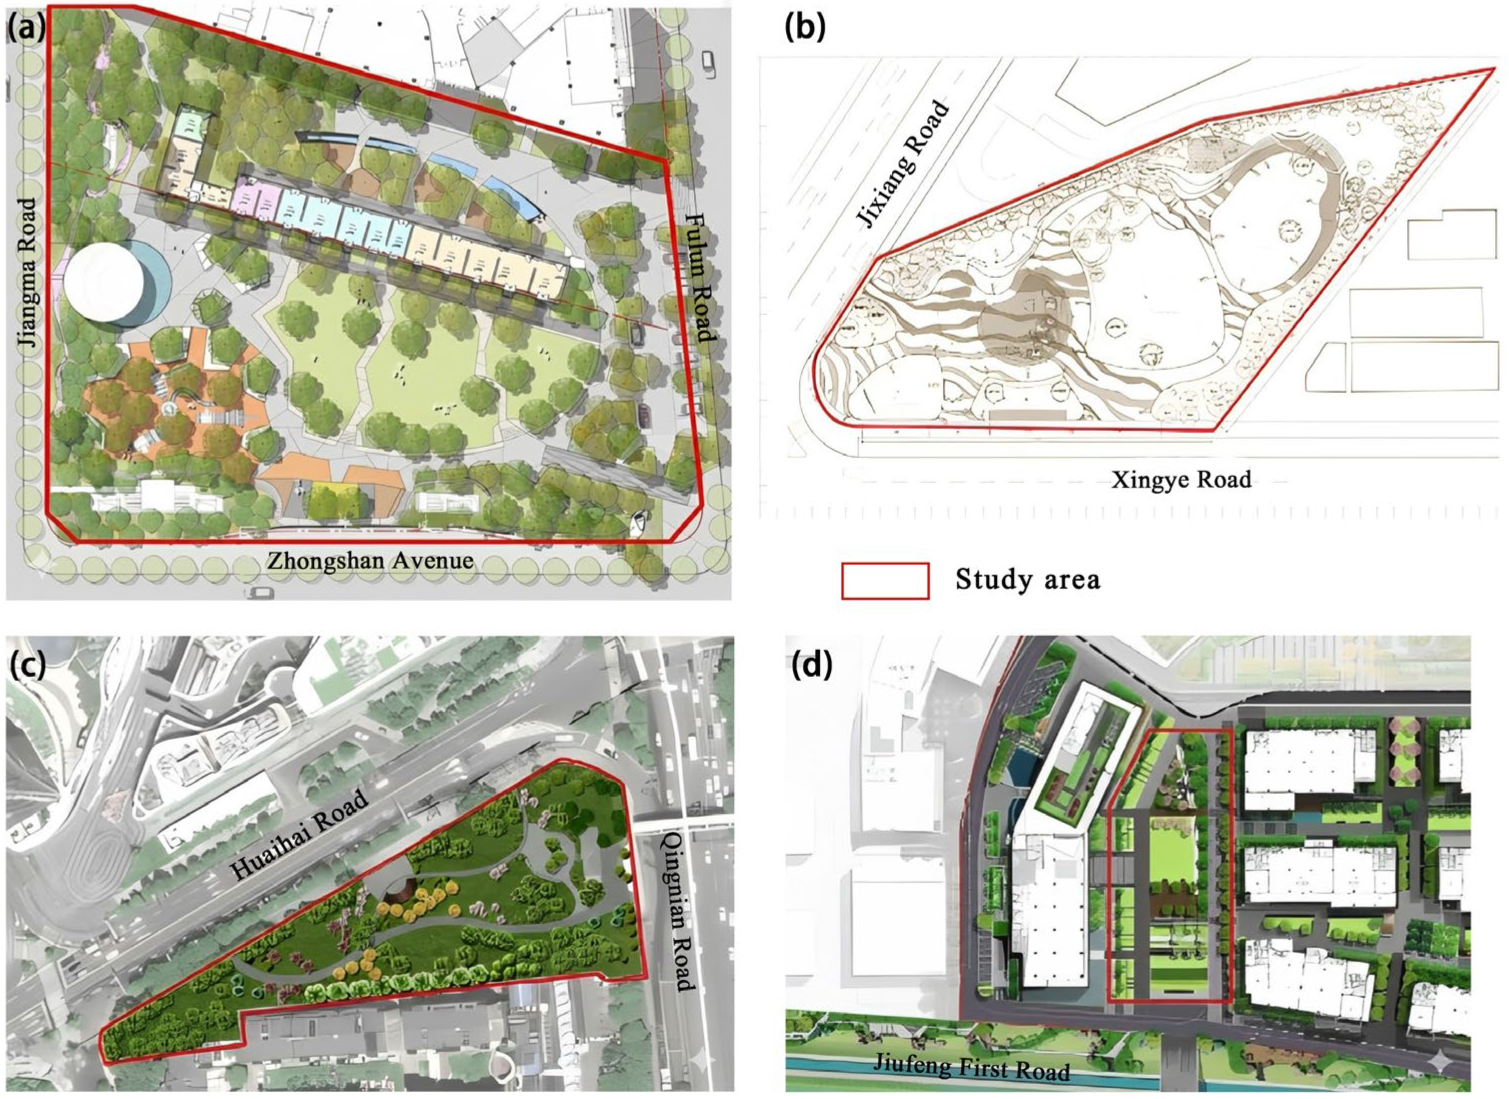
In 2023, the Wuhan Municipal Bureau of Natural Resources and Planning collected 24 representative micro public spaces completed that year from different districts and showcased them as outcomes of the city’s urban renewal initiative. Based on this set of projects, the present study selects four micro public spaces of similar size but differing characteristics as case studies (Table 1). Among them, Yuetai Park (YTP), Jixiang Road Pocket Park (JRP), and the Phase II Central Garden of the Bio-Innovation Park (BIP) are newly developed green spaces, while Huaihai Road Pocket Park (HRP) represents a renovated green space. In terms of typology, the four cases correspond, respectively, to a themed pocket park (YTP), a community park (JRP), a street-side pocket park (HRP), and a green space supporting an industrial park (BIP). Their layout plans are shown in Figure 1.
Table 1.
Summary of Study Area.
Figure 1.
The layout plans of four micro public spaces: (a) YTP; (b) JRP; (c) HRP; (d) BIP.
2.2. Calculating Carbon Storage and Carbon Reduction in Community Micro Public Spaces
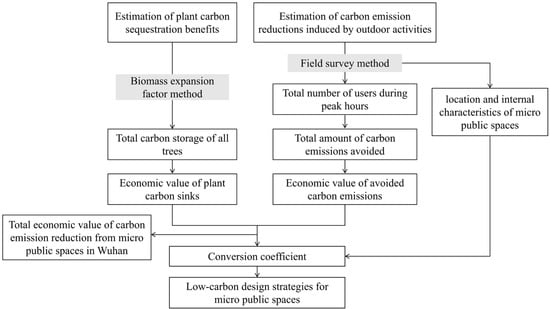
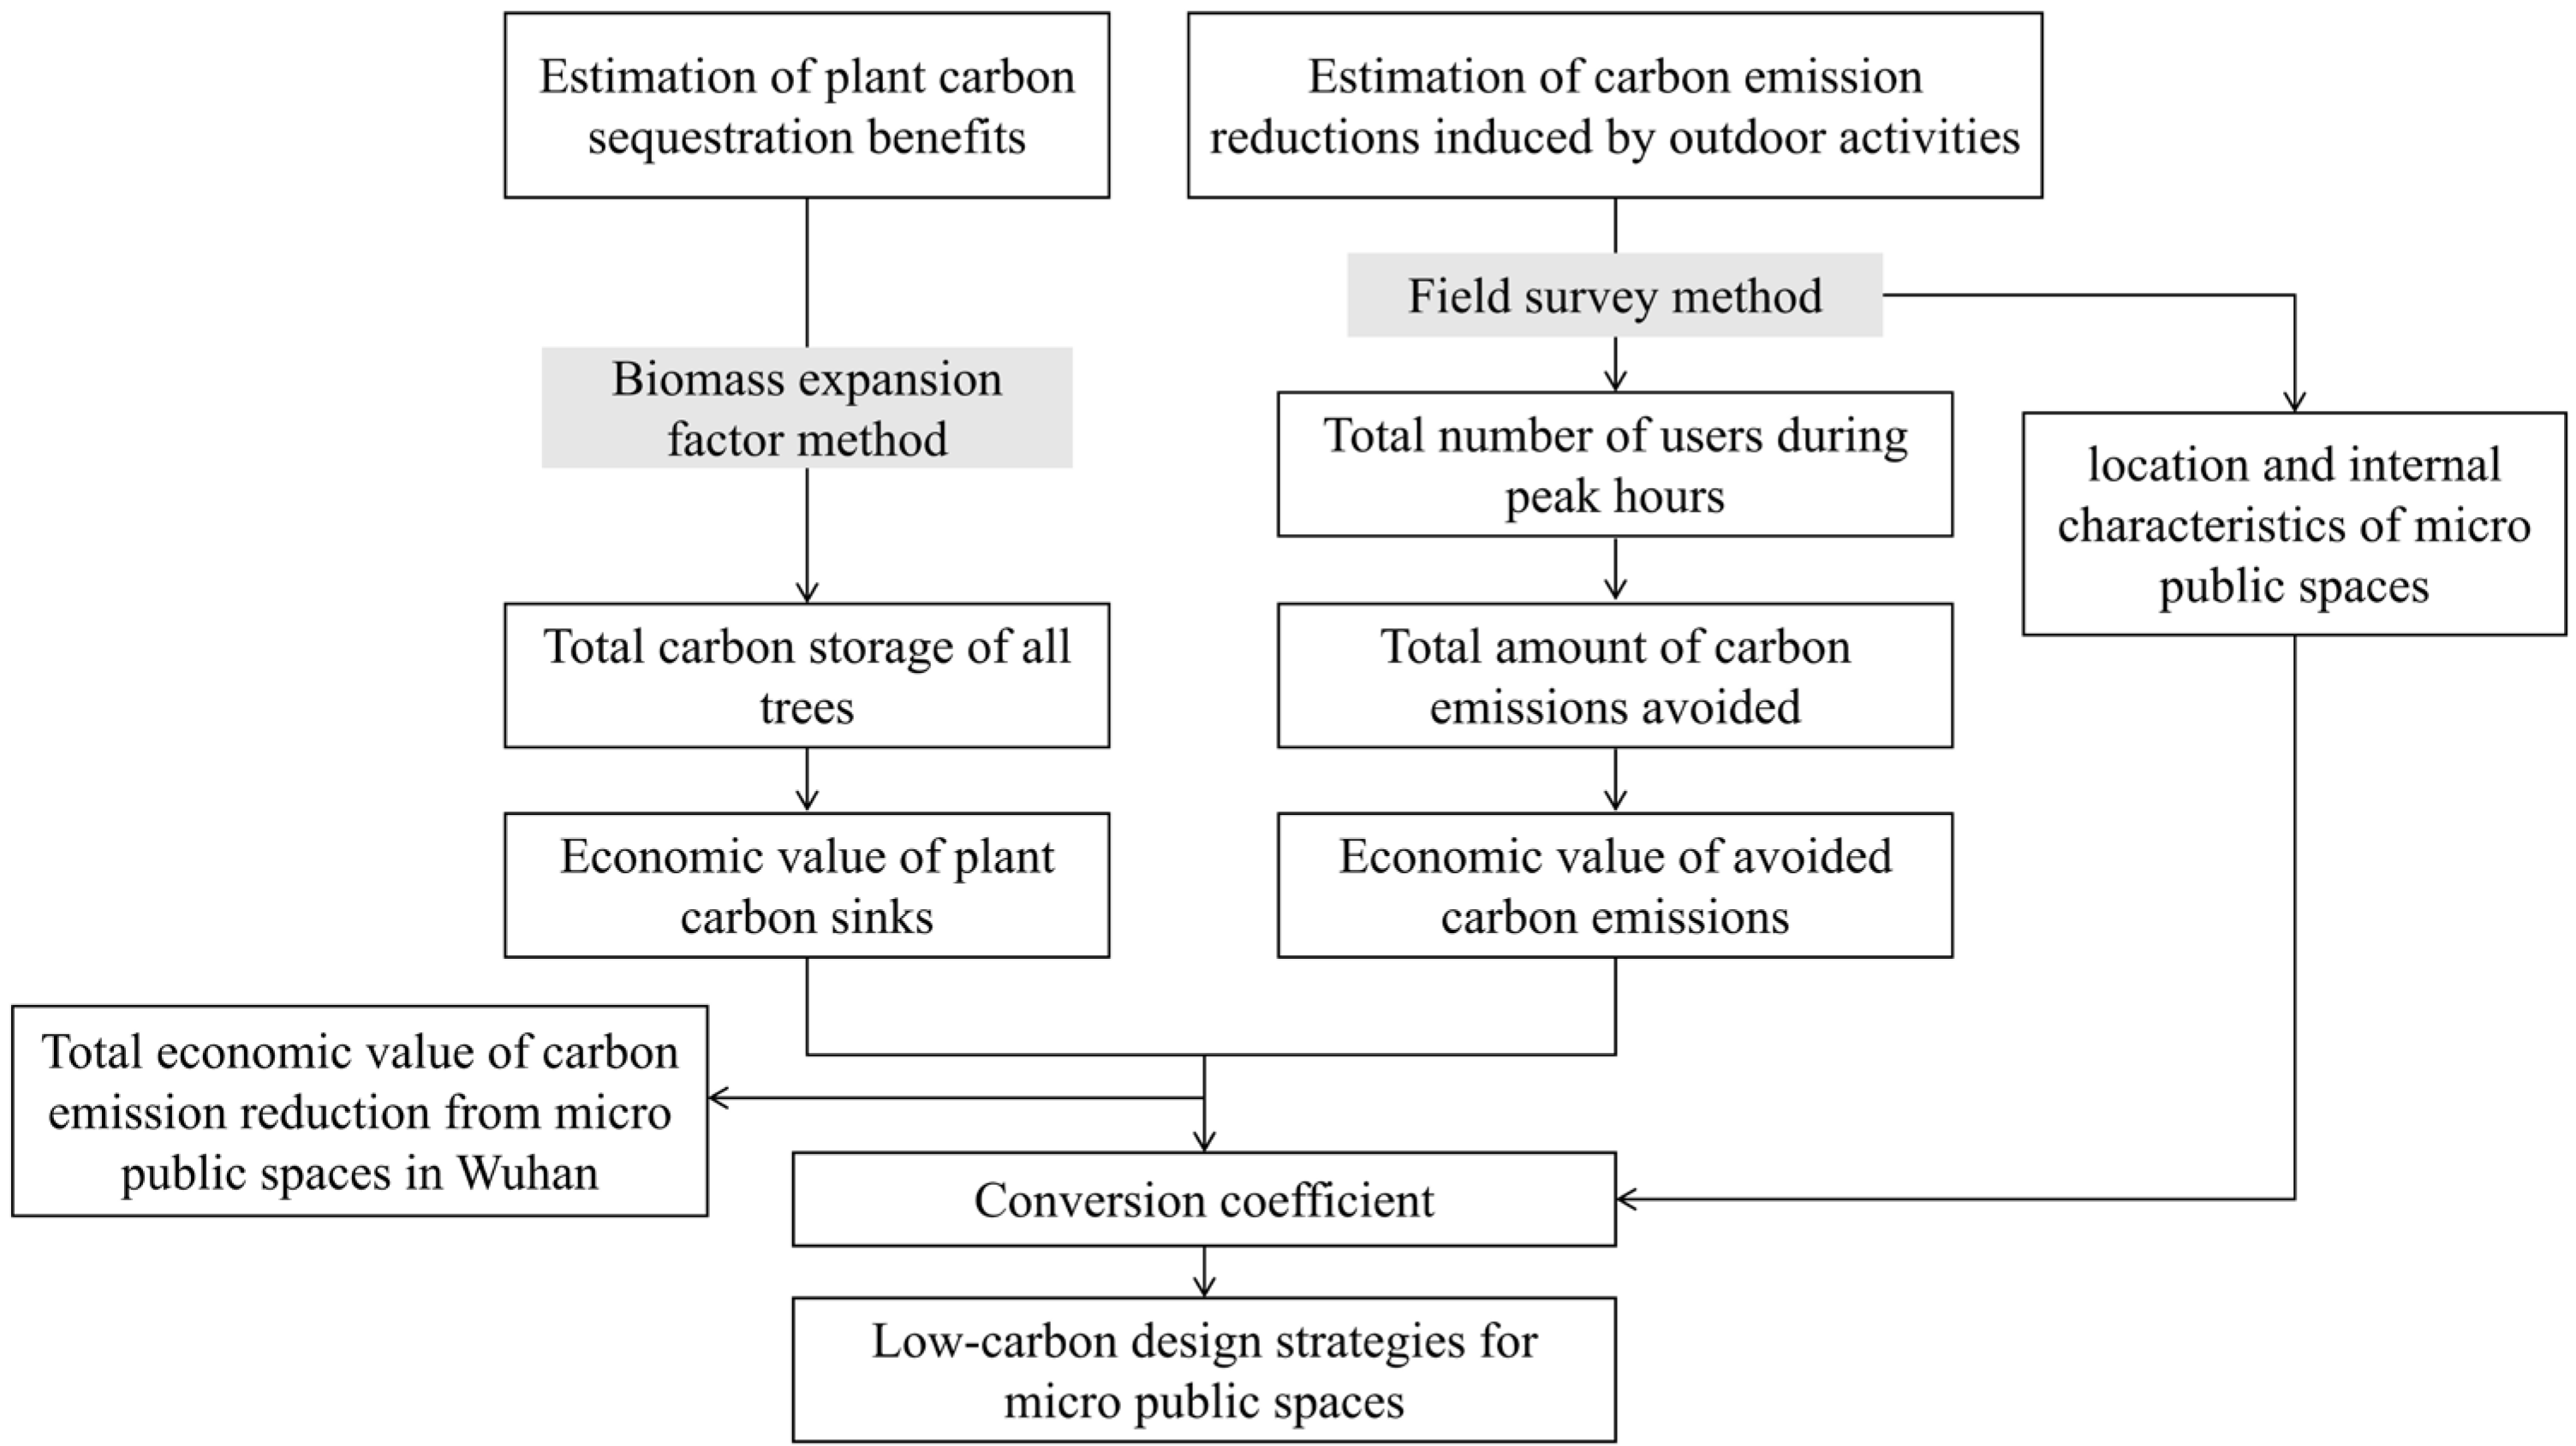
For the four representative micro public spaces, this study estimates both the direct carbon sequestration performance of urban green spaces and the indirect carbon reduction benefits associated with human activity by integrating the biomass expansion factor method, on-site forestry survey methods, and spatiotemporal observation of human activities. Furthermore, by incorporating national standards for carbon emission–sequestration conversion and carbon trading valuation systems, the carbon storage of trees and the carbon reductions resulting from activity-induced energy savings are converted into economic values. These estimates provide a quantitative basis for low-carbon design strategies in the renewal of community micro public spaces (Figure 2).
Figure 2.
Research technical route.
2.2.1. Direct Carbon Sequestration of Micro Public Spaces: Carbon Storage of Trees
Carbon storage refers to the total amount of carbon contained within a specific carbon pool. In this study, each micro public space is treated as a basic unit to estimate its total carbon storage. Because shrubs and herbaceous plants contribute far less to total carbon storage than trees [16], their contributions are excluded. Previous urban green space studies indicate that shrubs and herbaceous layers typically account for less than 5–15% of total aboveground carbon storage in tree-dominated parks, suggesting that their omission may lead to a slight underestimation but does not substantially affect overall magnitude comparisons [7]. However, in shrub-dominated or newly established green spaces with limited tree canopy, this exclusion may have a more noticeable impact [17]. Accordingly, in this study, only trees within each micro public space are considered, including both aboveground and belowground carbon storage.
To enhance methodological rigor and replicability, we reviewed existing open-source carbon (https://www.wkcgroup.com/tools-room/carbon-sequestration-calculator/, accessed on 16 February 2026) and biodiversity assessment tools (https://www.biodiversity-metrics.org/, accessed on 17 February 2026). Compared with widely used platforms primarily developed for large-scale forests, parks, or ecological restoration projects, we adopted a finer-scale approach tailored to the specific sites, using detailed forestry surveys to capture biomass characteristics within micro public spaces. This highlights the necessity of scale-sensitive carbon assessment methods in the context of community renewal. Accordingly, field measurements were conducted using measuring tapes, infrared rangefinders, and a CGQ-1 hypsometer. Following standard forestry carbon sink assessment methods, the species name, diameter at breast height (DBH), and tree height were recorded for each tree. Individual tree volume and biomass were calculated, and total biomass was estimated using the biomass expansion factor method. Carbon storage was then derived based on biomass and carbon content ratios. The main calculation procedures and formulas are as follows.
Tree volume (V):
where is the volume of an individual tree, is the cross-sectional area at 1.3 m height, is the tree height (m), and is the experimental form factor. Reference values for are provided in Table 2 [18].
Table 2.
Average form factors of major tree species.
Tree biomass (P):
where is the biomass of an individual tree, is tree volume, and is basic wood density. Reference values for basic wood density are listed in Table 3. When species-specific data were unavailable, densities of taxonomically similar species or generalized densities for hardwood and softwood species were used [19,20,21,22].
Table 3.
Reference values of basic wood density.
Total carbon storage of all trees ():
where is the total carbon storage of all trees; Pi is the biomass of the th tree; is the biomass expansion factor; is the ratio of belowground to aboveground biomass, set to 0.21 according to the IPCC default value; is the carbon fraction of dry biomass, set to 0.47 following IPCC guidelines; is the urban tree biomass correction coefficient (0.9), accounting for biomass loss due to pruning; and is a tree health coefficient, set to 1.0 for healthy trees, 0.8 for average condition, and 0.6 for poor condition [17,23,24].
It should be noted that the estimation of tree carbon storage depends on several key parameters, including the form factor, biomass expansion factor, wood density, belowground biomass ratio, and carbon fraction recommended by the IPCC. Although these parameters are widely adopted in urban forest carbon accounting studies, moderate variation in their values may influence the absolute magnitude of carbon storage estimates [7,16]. To examine the robustness of the results, a sensitivity test was conducted by varying key coefficients (biomass expansion factor and carbon fraction) within a ±10% range. The analysis indicates that while total carbon storage values change proportionally under different parameter scenarios, the relative ranking among the four case sites and the dominance of vegetation-based sequestration over activity-induced emission reduction remain unchanged. Therefore, the main conclusions of this study are not sensitive to reasonable parameter variation.
2.2.2. Indirect Carbon Reduction Benefits of Micro Public Spaces: Carbon Emissions Saved Through Human Outdoor Activity
High-quality micro public spaces can attract residents to remain outdoors during leisure hours, potentially substituting time that would otherwise be spent indoors. In residential communities, evening leisure activities are typically associated with electricity use for lighting, air conditioning, and electronic appliances. Therefore, when outdoor stay occurs during peak residential electricity demand periods, a substitution effect may arise, whereby part of indoor operational energy consumption is avoided. To estimate the total carbon emission reductions attributable to outdoor activity, pedestrian counts were manually recorded in each study site during the fixed time period from 16:00 to 21:00, which corresponds to peak usage hours for micro public spaces. Compared with morning periods, this time window coincides with peak residential electricity demand, making potential energy savings particularly relevant for carbon reduction. According to publicly available residential electricity load characteristics in central China, household electricity demand generally increases in the late afternoon and evening due to cooking, cooling/heating, and lighting needs [25]. The selected observation period overlaps with this demand peak in Wuhan, strengthening the plausibility that outdoor recreation during this time may partially replace indoor electricity consumption. While not all outdoor activities necessarily substitute indoor energy use, focusing on peak-hour recreational stays increases the likelihood of a substitution effect rather than purely additional activity.
To ensure that the estimated carbon savings closely reflect real conditions, one weekday and one weekend day with similar weather conditions were randomly selected between October and November for each site. Only recreational users were counted; on-site staff, such as property managers and maintenance workers, were excluded. The carbon emission reduction was calculated as follows:
where is the annual carbon emission reduction induced by outdoor activities; and are the peak numbers of users during weekdays and weekends, respectively; and denote the average stay time per person during weekdays and weekends, respectively (h); is the per capita hourly electricity consumption (kWh); is the regional electricity CO2 emission factor (kgCO2/kWh).
The average stay times for weekdays and weekends were obtained through random sampling during field surveys. Per capita hourly electricity consumption in Wuhan was calculated as 0.1046 kWh based on officially published data on total residential electricity consumption and permanent population in 2023 [26]. The average CO2 emission factor for electricity generation in Hubei Province was set to 0.3672 (kgCO2/kWh) according to official announcements by the Ministry of Ecology and Environment and the National Bureau of Statistics [27]. The factor 12/44 represents the molecular weight ratio of carbon to carbon dioxide.
2.3. Valuation of Carbon Sequestration and Emission Reduction Based on Carbon Trading Prices
To explicitly reflect the carbon benefits of micro public spaces, the carbon storage of trees and the emission reductions resulting from increased outdoor activity are converted into economic values. To improve methodological transparency and ensure the reliability of economic valuation, this study further clarifies the specific carbon trading standards and pricing benchmarks adopted. Carbon prices are selected based on officially released transaction data from China’s regional carbon trading markets, which provide the most policy-relevant and market-oriented valuation references currently available. In China’s national voluntary greenhouse gas emission reduction trading system, tradable products mainly include carbon emission allowances, China Certified Emission Reductions (CCERs), and other related products, all priced per tonne of carbon dioxide equivalent (tCO2e). Carbon emission allowances are primarily traded by enterprises to meet compliance requirements, whereas CCERs represent verified emission reductions generated by specific mitigation projects, including forestry carbon sink projects [28]. To ensure consistency in the valuation of carbon storage and emission reductions associated with micro public spaces, this study adopts transaction prices of comparable products from the national voluntary carbon market as reference values [29].
The emission reductions generated by micro public spaces through attracting outdoor activities mainly result from decreased electricity consumption in residential buildings. As electricity production is directly linked to enterprise-level carbon emissions and emission allowance trading, the economic value of these emission reductions is assessed using carbon emission allowance prices. According to transaction data released by the Hubei Emissions Exchange since January 2023, the trading price of emission allowances (Hubei Emission Allowances, HBEA) ranges from 37.20 to 52.13 CNY per tCO2e. Based on 456 transaction records between 1 January 2023 and 30 November 2024, the average transaction price of 42.25 CNY per tCO2e is adopted to estimate the economic value of emission reductions associated with outdoor activity in the study sites [30].
Although trees in community micro public spaces do not formally qualify as CCER projects, their carbon sequestration pathways and accounting principles are comparable to those of forestry carbon sink projects. Therefore, this study uses recent transaction prices of forestry carbon sink projects as a reference to estimate the economic value of tree carbon storage in micro public spaces. As transaction data for forestry carbon sink projects are unavailable in the Hubei Emissions Exchange, this study refers to forestry carbon sink transactions recorded on the Beijing Carbon Emissions Trading Platform between 1 January 2023 and 30 November 2024. Based on seven transaction records with an average price of 96.16 CNY per tCO2e, and adjusted using the relative price ratio between Beijing and Hubei carbon markets, an estimated forestry carbon sink price of 36.05 CNY per tCO2e is adopted for Hubei Province [31].
The economic value of carbon benefits for a single micro public space is calculated as follows:
where is the total carbon-related economic value of a micro public space; is the unit price of forestry carbon sinks; is the carbon emission allowance trading price.
It should be clarified that tree carbon storage represents an existing carbon stock measured at the time of assessment, whereas emission reductions induced by outdoor activity are treated as cumulative carbon flows over a five-year period. In this study, both components are converted into monetary values using prevailing carbon trading prices to enable a unified comparative evaluation framework. Given the relatively short analytical horizon and the study’s primary objective of cross-site comparison rather than long-term carbon accounting, discounting and dynamic tree growth modeling were not incorporated.
To illustrate the overall carbon benefits of micro public spaces within community renewal initiatives, this study further estimates the total economic value of carbon sequestration and emission reduction generated by micro public spaces across Wuhan. According to the “Seeing the City through Micro Spaces: Refined Wuhan” Three-Year Action Plan (2022–2024), approximately 1000 micro public spaces are planned for construction in the central urban area of Wuhan, with a total land area of about 200–400 ha. Using a study site with moderate carbon benefits as a representative sample, the total carbon-related economic benefits of micro public spaces citywide are estimated as follows:
where is the total carbon economic benefit of micro public spaces in Wuhan; is the unit area economic benefit of the sample site; is the total land area of micro public spaces in Wuhan.
Given the market-based and policy-influenced nature of carbon trading systems, carbon prices may fluctuate over time and across regions. To assess the robustness of the valuation results, we compared economic estimates using observed price ranges from regional carbon markets. The results indicate that although absolute economic values vary under different pricing scenarios, the relative differences among micro public spaces and the overall magnitude of carbon benefits remain consistent. Therefore, price fluctuations do not substantially alter the study’s core conclusions regarding the carbon value and comparative performance of micro public spaces.
3. Results
3.1. Direct Carbon Sequestration Performance of Green Spaces
Based on field surveys, a total of 448 trees were recorded across the four study sites. For each tree, diameter at breast height (DBH), height, and growth condition were measured individually. The species composition, number of trees, and average height measured on site are summarized in Table 4. Using these data, the total tree carbon storage and carbon storage per unit area were calculated for each site (Table 5). Among the four cases, HRP exhibited the highest total tree carbon storage. This site is characterized by a high proportion of large, mature trees with greater average DBH and height, resulting in substantially higher carbon storage. In contrast, although JRP contains 112 trees, many of them are small ornamental species, leading to relatively low overall carbon storage compared with the other sites. YTP and BIP showed intermediate levels of carbon storage, reflecting differences in tree composition, planting structure, and site area.
Table 4.
Tree species composition, number of individuals, and average height in four study sites.
Table 5.
Total tree carbon storage and carbon storage per unit area in four study sites.
3.2. Indirect Carbon Reduction Performance of Human Outdoor Activities
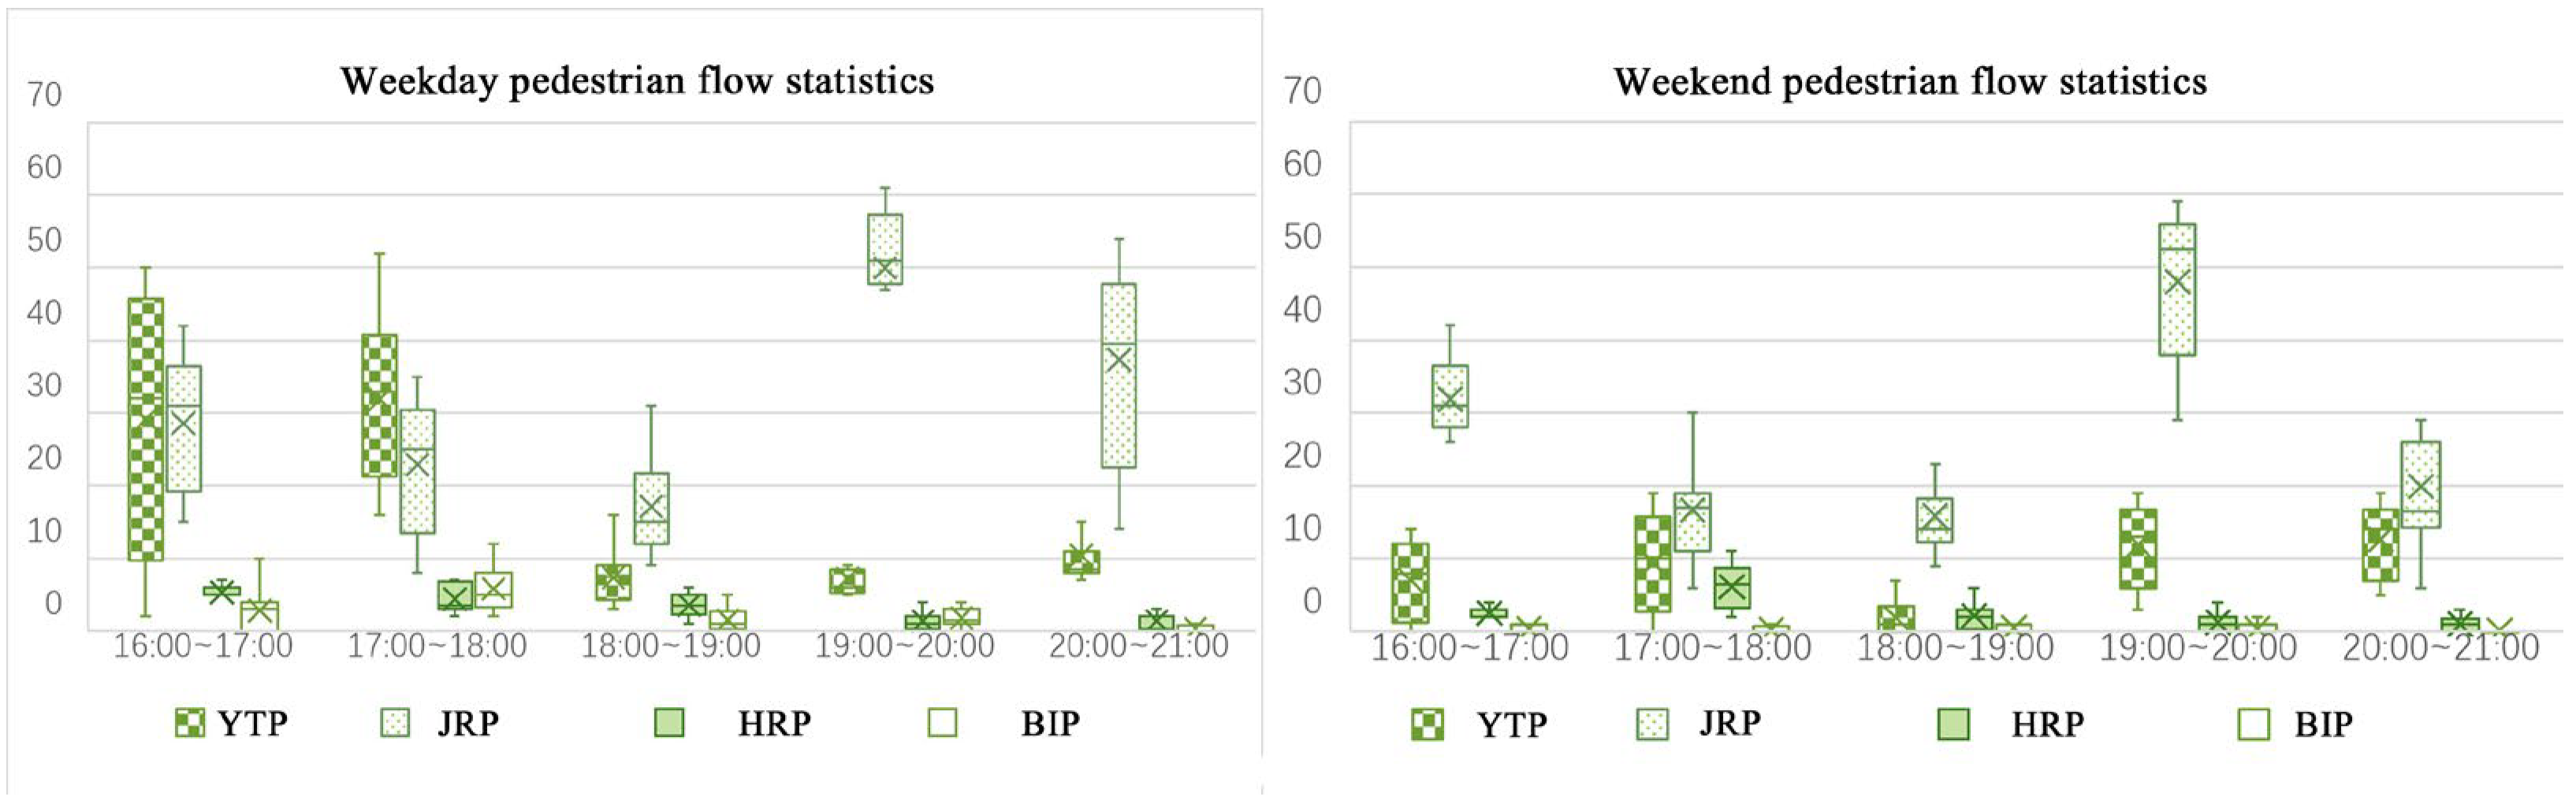
Based on manual observations, pedestrian flows in the four study sites were recorded during both weekdays and weekends from 16:00 to 21:00, and the temporal variation in visitor numbers is illustrated in Figure 3. Overall, YTP and JRP exhibited relatively high visitor volumes with pronounced temporal fluctuations, whereas BIP showed consistently low levels of pedestrian activity.
Figure 3.
Temporal variation in pedestrian flow during weekdays and weekends in four study sites.
Visitor numbers observed during peak periods, dominant user groups, primary activities during peak hours, and the estimated annual carbon emission reductions are summarized in Table 6 and Table 7. YTP and JRP both include dedicated children’s activity areas, which attract a large number of children accompanied by parents for outdoor recreation. In addition, JRP provides an open neighborhood interaction space with adequate nighttime lighting, making it particularly attractive to middle-aged and elderly residents for activities such as square dancing, singing, and physical exercise. In contrast, the dominant users of Huaihai Road Pocket Park (HRP) were mainly flexible or informal workers engaging in short-term rest. Due to insufficient nighttime lighting, the park experiences very limited user presence after dark. As BIP-CG functions primarily as part of an industrial park, no stable or long-term stay behavior was observed on either weekdays or weekends. Consequently, its contribution to indirect carbon emission reduction through outdoor activity substitution is negligible and was not included in the calculation of annual carbon emission savings. In terms of the estimated annual carbon emission reduction achieved through attracting outdoor activities, JRP demonstrated the highest total savings, outperforming the other micro public spaces due to its higher visitor numbers, longer average stay duration, and diversified activity patterns.
Table 6.
Observation results of resident user groups and peak-period activities in four study sites.
Table 7.
Estimated carbon emission reductions associated with outdoor activities in four study sites.
3.3. Economic Valuation of Carbon Sequestration and Emission Reduction
By aggregating the existing tree carbon storage and the carbon emission reductions achieved through attracting outdoor activities over a five-year period, and by referencing relevant carbon trading prices, the economic benefits of carbon sinks in each study site were estimated (Table 8). The results indicate that HRP exhibits the highest economic value derived from existing carbon storage, amounting to CNY 1531.66, while JRP achieves the highest economic benefit from carbon emission reductions associated with attracting residents, with an estimated five-year value of CNY 113.89.
Table 8.
Estimated economic benefits of carbon sequestration and emission reduction.
4. Discussion
4.1. Carbon Sequestration Dominates over Emission Reduction in Pocket Parks: Implications for Coordinated Green Space and Building Renewal Strategies
Based on the unit area economic benefits of tree carbon storage and emission reductions from reduced electricity use, the MTR was taken as a reference case (Table 8) to estimate the overall carbon-related economic benefits of the “Seeing the City through Micro Spaces: Refined Wuhan” Three-Year Action Plan (2022–2024). Given the planned total land area of approximately 200–400 ha, the cumulative economic value of carbon storage from newly built and renovated micro public spaces in Wuhan is estimated at about RMB 0.74–1.48 million, while the economic benefits derived from emission reductions through attracting outdoor activities over five years are only about RMB 26,000–52,000. These results indicate that, in community renewal projects, the direct carbon sequestration capacity of vegetation in micro public spaces exceeds the indirect carbon reduction benefits associated with human activity by one to two orders of magnitude. This finding is consistent with broader patterns observed in the building sector. According to a 2024 report by the China Association of Building Energy Efficiency [32], life cycle carbon emissions from buildings account for 38.2% of national energy-related carbon emissions, with operational emissions representing the largest share (56.6%). This comparison highlights that differentiated low-carbon strategies aligned with functional space characteristics are both necessary and consistent with empirical evidence.
Accordingly, in community renewal, green and outdoor public spaces should prioritize enhancing vegetation-based carbon sequestration, whereas residential and office buildings should focus primarily on improving operational energy efficiency to achieve emission reductions. Although the potential for micro public spaces to reduce indoor energy consumption by attracting residents outdoors remains limited in carbon terms, their value should not be evaluated solely through indirect emission reduction, but also through broader co-benefits such as promoting physical and mental health, facilitating social interaction, and stimulating local consumption. From a practical planning perspective, pocket park renewal should therefore emphasize increasing tree canopy coverage, optimizing multilayer planting structures, and reserving adequate soil volume for long-term tree growth, alongside coordinated building retrofits—such as façade insulation and energy-efficient lighting—to maximize integrated low-carbon benefits at the community scale.
From a methodological perspective, the primary innovation of this study lies in integrating vegetation-based carbon sequestration with activity-induced building emission reductions. Unlike conventional site-scale carbon accounting, which focuses solely on ecological carbon sinks [3,5], this dual approach captures both direct biophysical and indirect human-mediated carbon benefits. By linking user activity patterns to reductions in indoor energy use, the framework extends carbon assessment beyond vegetation alone, providing a more comprehensive and planning-relevant evaluation model for micro public spaces in community renewal.
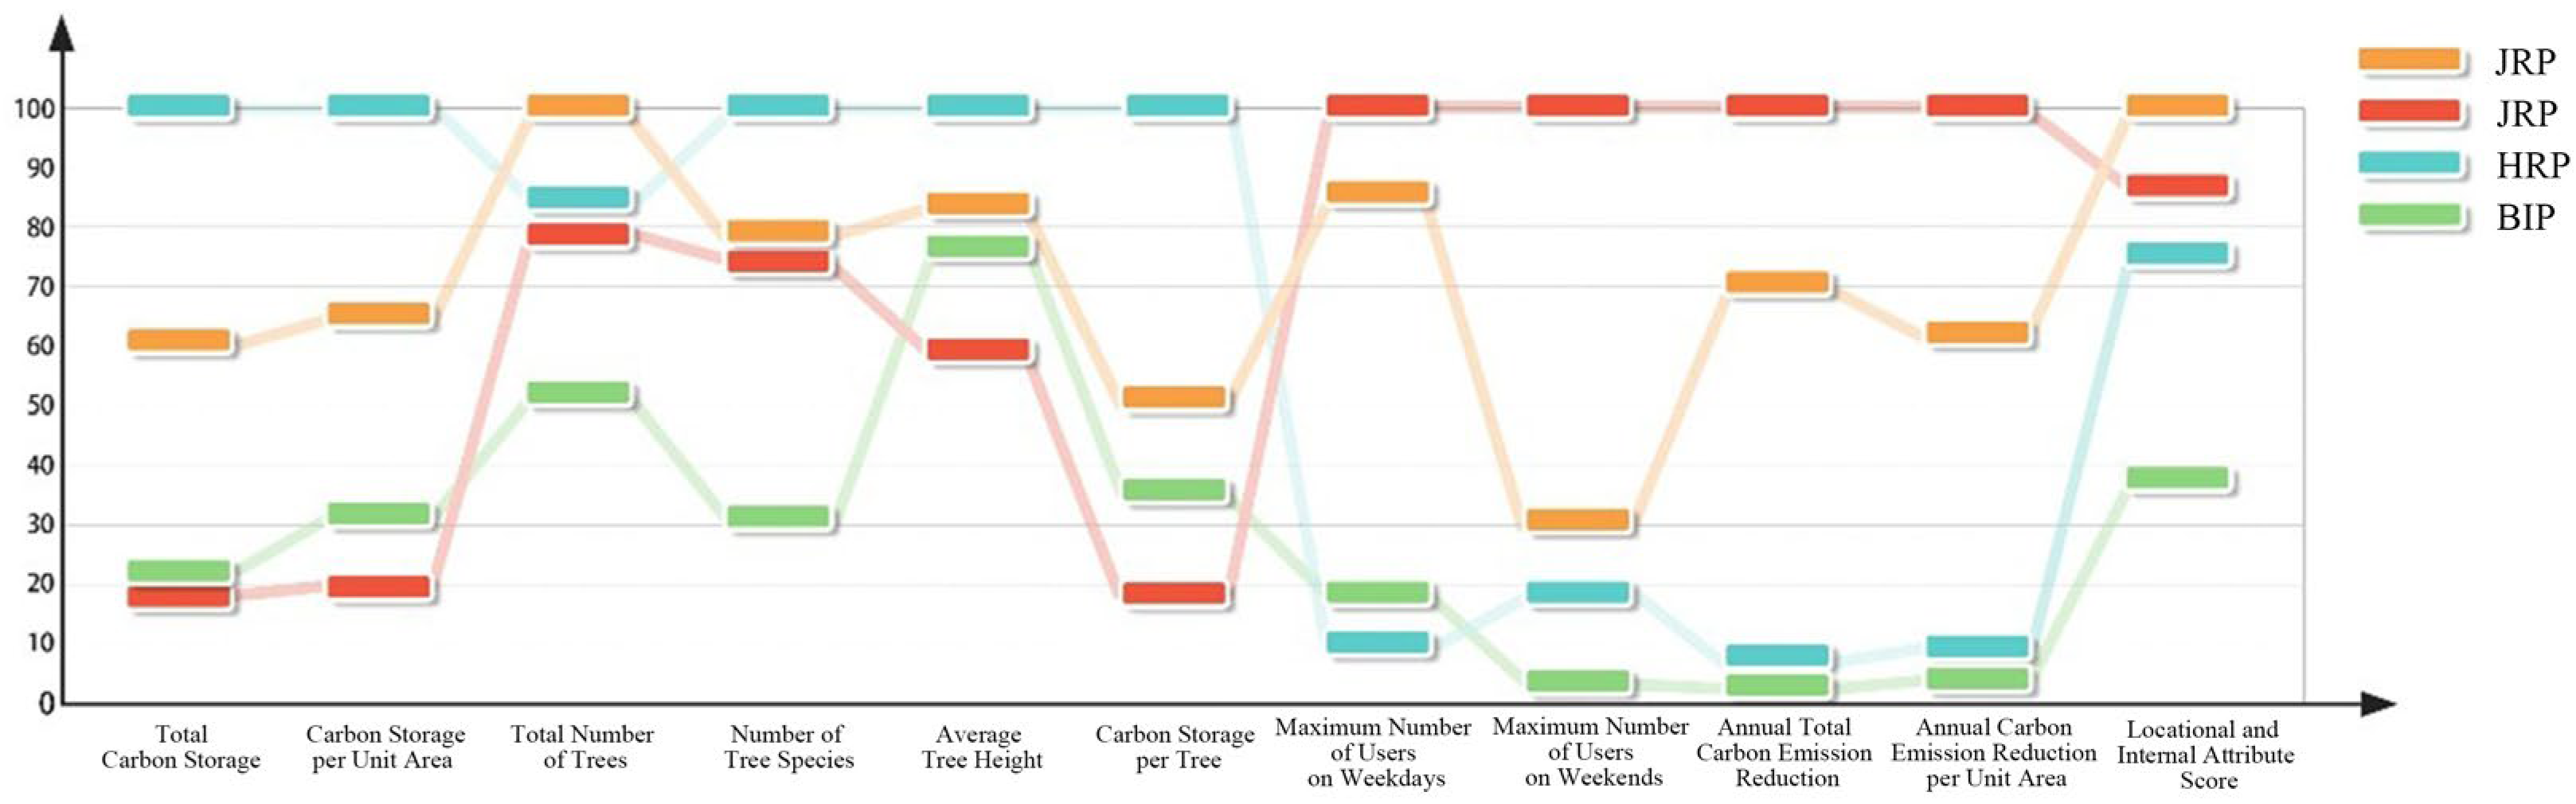
To further support strategy development, the four case sites were evaluated through a multi-dimensional assessment of locational attributes and internal spatial characteristics (Table 9), followed by a comparative analysis of multiple factors influencing emission reduction performance (Figure 4), providing a basis for targeted low-carbon optimization strategies.
Table 9.
Locational attributes and internal spatial characteristics of four case sites.
Figure 4.
Standardized scores of multiple indicators across the study sites.
Based on the various calculations and statistical analyses, all indicators were uniformly converted into standardized scores, with the maximum possible score set at 100. A comparative overview of the standardized indicator scores across the four case sites is presented in Figure 4. The results indicate that HRP performs substantially better than the other sites in indicators related to vegetation carbon storage. YTP shows relatively balanced and consistently high performance across all indicators. In contrast, JRP exhibits comparatively lower scores in carbon storage and tree planting indicators, but demonstrates relatively high levels of popularity and user attraction.
4.2. Uneven Effectiveness of Pocket Parks in Attracting Users Across Urban Contexts: Prioritizing Renewal in Dense Residential and Older Urban Areas
As shown in Figure 4, pocket parks YTP and JRP, located in residential areas, attract substantially more users than HRP and BIP, situated in commercial and industrial contexts. HRP is located at a four-way intersection with limited surrounding residential communities and a dominance of commercial land uses. Strongly oriented commercial activities partially substitute recreational demand, while physical barriers separating the site from nearby housing further constrain accessibility. Similarly, BIP is embedded within an industrial campus and primarily serves company employees; with surrounding land uses dominated by industrial functions, public use remains minimal after working hours. These findings indicate that the locational context of pocket parks plays a decisive role in determining overall utilization intensity. Therefore, in strategies aimed at the citywide promotion of pocket park renewal, spatial prioritization is essential. Concentrating renewal efforts in older urban districts and densely populated residential areas is more likely to enhance carbon reduction efficiency while simultaneously improving the perceived quality and equity of benefits for a broader population. In practical terms, planners should prioritize pocket park provision within 5–10 min walking catchments of high-density residential neighborhoods, particularly in aging communities lacking green amenities.
4.3. Functional Attributes Shape Age-Specific Use Patterns and Carbon Reduction Benefits of Pocket Parks
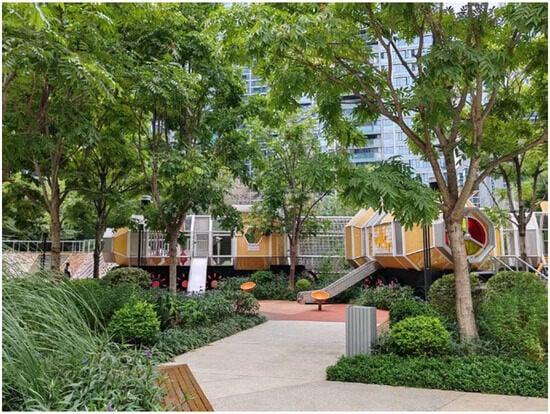
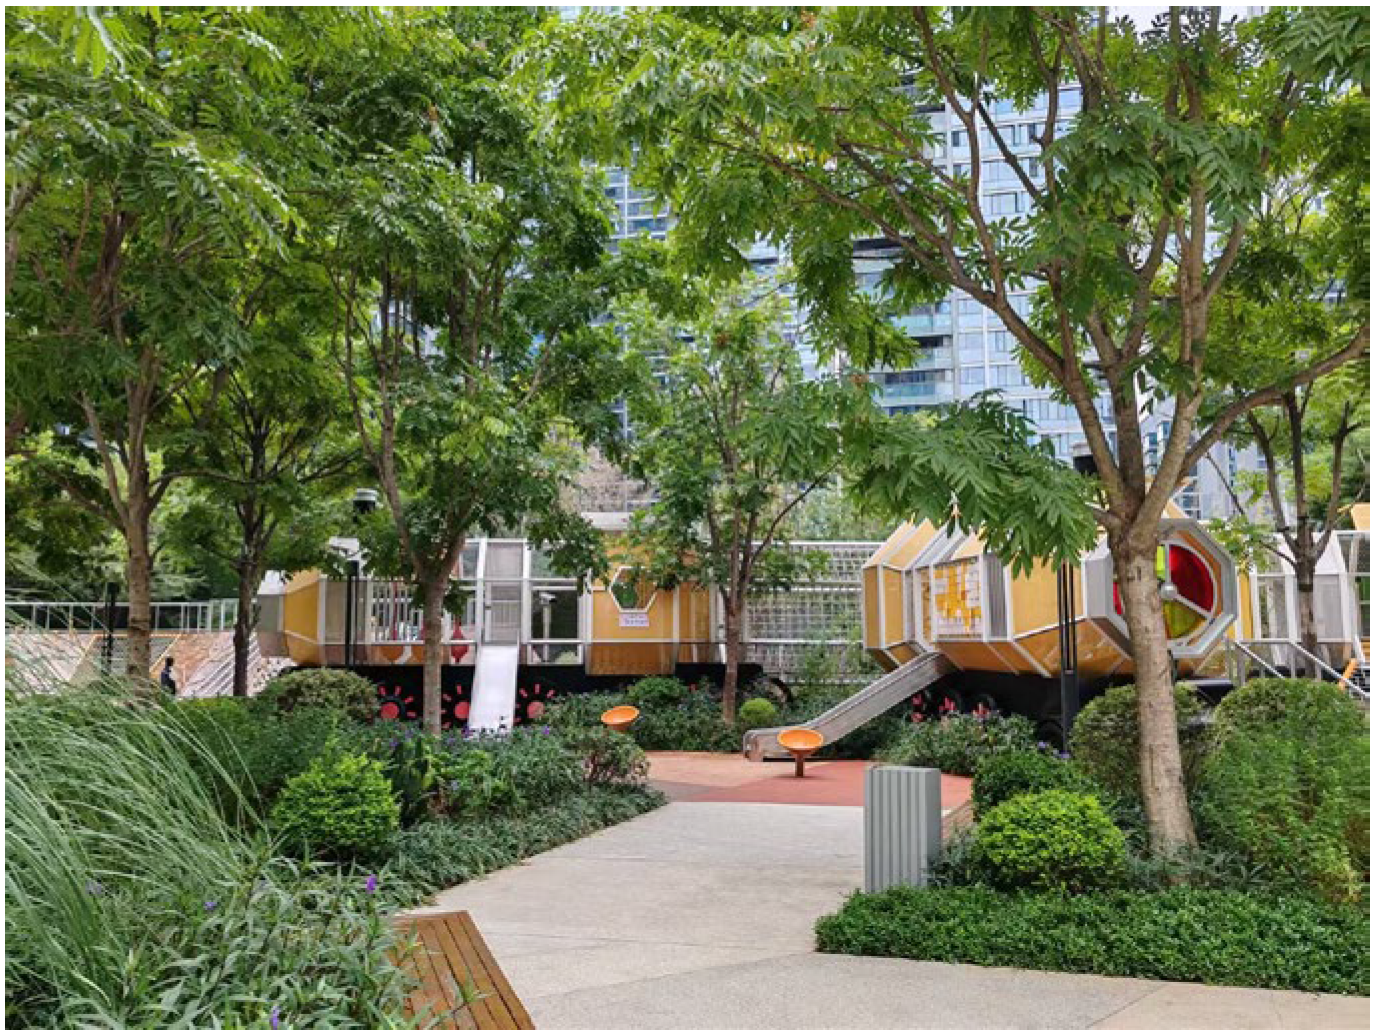
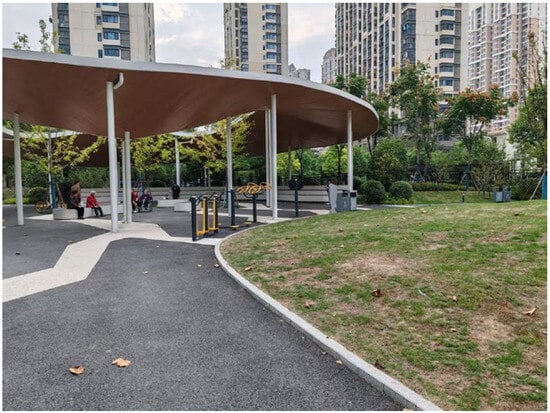
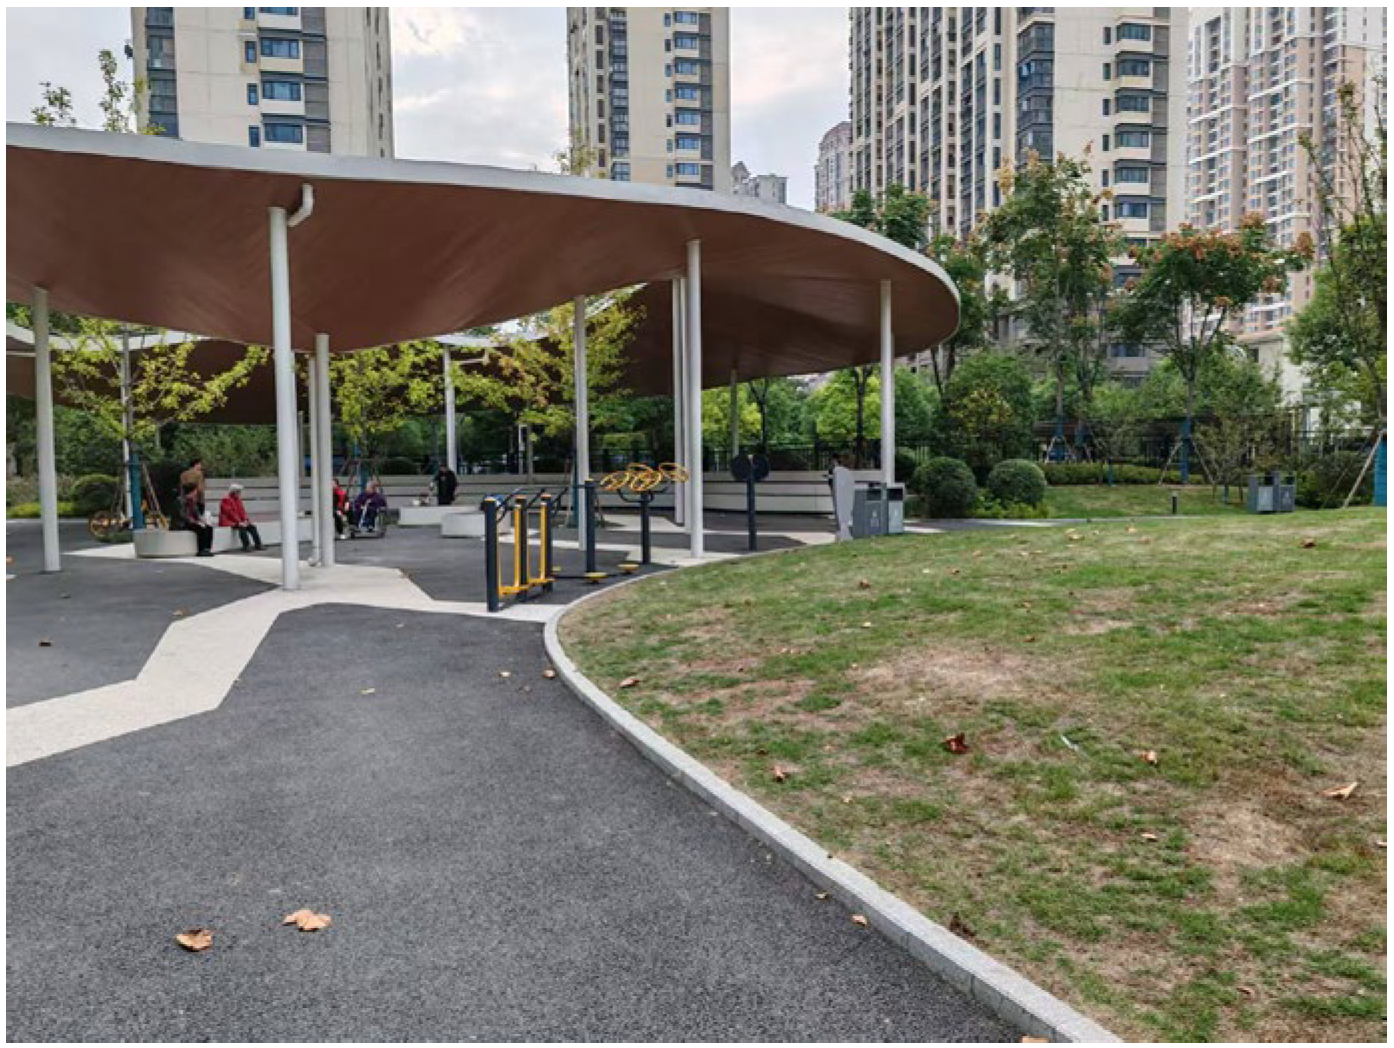
Although both YTP and JRP are located within residential areas, Table 7 reveals clear differences in surrounding demographic structure and associated usage patterns. YTP is surrounded mainly by newly developed housing, with a higher proportion of young and middle-aged residents. Its user flows are dominated by children’s recreational activities, with peak visitation occurring between 16:30 and 17:30. In contrast, JRP is embedded in an older residential neighborhood with a higher proportion of elderly residents, and its peak usage period occurs later in the evening, between 19:35 and 20:35. These temporal differences result in distinct carbon reduction effects. Accordingly, renewal strategies for pocket parks should be differentiated based on target user groups. The “Time Train” themed playground at YTP effectively attracts children and accompanying parents (Figure 5); enhancing linear and point-source lighting along play facilities and pathways could further increase evening use and indirectly improve indoor energy-saving-related emission reductions. Meanwhile, the seating-oriented open spaces in JRP (Figure 6) support social interaction and group activities among middle-aged and elderly users. Here, greater emphasis should be placed on area-based lighting solutions, combined with clean energy technologies such as outdoor solar-powered facilities, to achieve a synergistic balance between low-carbon performance and human-centered benefits.
Figure 5.
The “Time Train” themed playground at YTP.
Figure 6.
The communication space of JRP.
4.4. The Critical Role of Large Trees in Enhancing Carbon Sequestration: Implications for Planting Structure in Pocket Park Renewal
Figure 4 demonstrates that, compared with user-induced emission reduction, vegetation-based carbon sequestration plays a more dominant role in the overall carbon benefits of pocket parks. The ranking of carbon storage per unit area closely corresponds to the ranking of average tree height across sites. Although BIP contains fewer tree individuals and species than JRP, its carbon sink performance remains higher due to the predominance of tall tree species. From the perspective of improving urban environmental quality and supporting carbon mitigation, tree species selection in pocket parks should prioritize a sufficient quantity and diversity of large-canopy trees, such as camphor, zelkova, elm, dawn redwood, and hackberry. At the same time, while emphasizing carbon sequestration capacity, planting design should also address esthetic quality and service functions by incorporating ornamental small trees and shrubs. Such layered planting structures can enhance spatial hierarchy and visual appeal, thereby creating more comfortable and attractive urban environments for surrounding residents.
5. Conclusions
The carbon footprint associated with pocket parks in community renewal extends across the entire life cycle of demolition, construction, and operation, and is not limited to the components examined in this study. Nevertheless, the results effectively demonstrate differentiated low-carbon priorities across functional spaces within a full life cycle framework of urban construction carbon management. Specifically, while public spaces may encourage outdoor activities and thereby reduce indoor energy use, their contribution to emission reduction during the building operation phase remains limited and must primarily be addressed through carbon mitigation strategies at the building level. In contrast, vegetation-based carbon sequestration within public spaces represents the most substantial source of low-carbon benefits, highlighting the importance of increasing tree density and adopting stratified planting structures dominated by large-canopy trees to enhance carbon storage performance. In addition, this study does not account for embodied carbon emissions arising from building material production, transportation, and construction processes. Incorporating these hidden emissions represents an important direction for future research aimed at improving the completeness of life cycle low-carbon assessments in community renewal projects. Future studies may further differentiate carbon stock and flow dynamics by incorporating tree growth trajectories and appropriate discounting mechanisms to enhance long-term valuation robustness.
Notably, this study focuses on the influence of pocket parks on the carbon footprint of surrounding buildings, specifically through the reduction in building operational emissions associated with user attraction to outdoor spaces. Although the carbon reduction achieved through this pathway is relatively small in absolute terms, the analysis provides a valuable comparative perspective that supports differentiated renewal strategies for pocket parks across varying community contexts. It should be acknowledged that this estimation relies on a behavioral substitution assumption, namely that part of the time spent outdoors replaces indoor electricity consumption, and therefore warrants further empirical validation through time use or smart meter data in future research. Moreover, as urban renewal increasingly enters a low-profit phase, pocket parks—characterized by small-unit carbon benefits but large beneficiary populations—remain an important category worthy of attention. It should be noted, however, that the empirical analysis is based on four pocket park cases completed in Wuhan, which may not fully represent the diversity of micro public spaces across different urban contexts. Therefore, future research should not only expand the geographic diversity of cases but also refine biomass accounting models by incorporating understory vegetation, such as shrubs and herbs, to provide a more comprehensive assessment of site-scale ecological benefits. Future efforts may integrate low-carbon benefits with broader dimensions such as public health, mental well-being, and consumption agglomeration, thereby generating synergistic effects. Within a people-oriented, ecologically driven, and economically sustainable framework for urban renewal, such integrated approaches can contribute to mutually beneficial outcomes for residents, cities, and the natural environment.
Author Contributions
Conceptualization, C.L. and Y.C.; methodology, C.L.; software, C.L.; validation, C.L. and Y.C.; formal analysis, C.L. and S.H.; investigation, Y.C. and Y.P.; resources, S.H.; data curation, C.L. and Y.P.; writing—original draft preparation, C.L. and Y.C.; writing—review and editing, Y.P. and Y.L.; visualization, C.L. and Y.P.; supervision, Y.P. and S.H.; project administration, Y.L. and S.H.; funding acquisition, S.H. All authors have read and agreed to the published version of the manuscript.
Funding
This research was funded by the Humanities and Social Sciences Innovation Fund of Huazhong University of Science and Technology (2026WKQN006), the National Natural Science Foundation of China (No. 52578074), the Humanities and Social Science Project of the Ministry of Education (No. 24YJAZH083), and a commissioned research project from the Wuhan Yangtze River Ship Design Institute (N20251412).
Data Availability Statement
The original contributions presented in this study are included in the article. Further inquiries can be directed to the corresponding author.
Conflicts of Interest
The authors declare no conflicts of interest.
References
- Nowak, D.J.; Stevens, J.C.; Sisinni, S.M.; Luley, C.J. Effects of Urban Tree Management and Species Selection on Atmospheric Carbon Dioxide. Int. Soc. Arboric. 2002, 28, 113–122. [Google Scholar] [CrossRef] [Scilit]
- Strohbach, M.W.; Arnold, E.; Haase, D. The Carbon Footprint of Urban Green Space—A Life Cycle Approach. Landsc. Urban Plan. 2012, 104, 220–229. [Google Scholar] [CrossRef] [Scilit]
- Wu, D.; Lin, J.C.; Duarte, H.F.; Yadav, V.; Parazoo, N.C.; Oda, T.; Kort, E.A. A Model for Urban Biogenic CO2 Fluxes: Solar-Induced Fluorescence for Modeling Urban Biogenic Fluxes (SMUrF V1). Geosci. Model Dev. 2021, 14, 3633–3661. [Google Scholar] [CrossRef] [Scilit]
- Winbourne, J.B.; Smith, I.A.; Stoynova, H.; Kohler, C.; Gately, C.K.; Logan, B.A.; Reblin, J.; Reinmann, A.; Allen, D.W.; Hutyra, L.R. Quantification of Urban Forest and Grassland Carbon Fluxes Using Field Measurements and a Satellite-Based Model in Washington DC/Baltimore Area. J. Geophys. Res. Biogeosci. 2022, 127, e2021JG006568. [Google Scholar] [CrossRef] [Scilit]
- Wang, Y.; Yu, J.; Wei, W.; Dong, N. A Multi Source Data-Based Method for Assessing Carbon Sequestration of Urban Parks from a Spatial–Temporal Perspective: A Case Study of Shanghai Century Park. Land 2024, 13, 1914. [Google Scholar] [CrossRef] [Scilit]
- Liu, S.; Bai, Z.; Liu, D.; Shen, P. Research Progress in and Planning Strategies for Multi-scale Measurement of the Efficiency of Urban Blue-Green Infrastructure in Carbon Sink Enhancement and Emission Reduction. Landsc. Archit. 2025, 32, 14–22. [Google Scholar] [CrossRef] [Scilit]
- Dong, L.; Wang, Y.; Ai, L.; Cheng, X.; Luo, Y. A Review of Research Methods for Accounting Urban Green Space Carbon Sinks and Exploration of New Approaches. Front. Environ. Sci. 2024, 12, 1350185. [Google Scholar] [CrossRef] [Scilit]
- Wesener, A.; Fox-Kämper, R.; Sondermann, M.; Münderlein, D. Placemaking in Action: Factors That Support or Obstruct the Development of Urban Community Gardens. Sustainability 2020, 12, 657. [Google Scholar] [CrossRef] [Scilit]
- Zhen, F.; Liu, M.; Yang, R. Deriving the Impact Mechanism of Urban Green Space Environment on Community Social Capital Based on Multi-Source Data Integration: A Case Study of Nanjing City, China. Comput. Urban Sci. 2025, 5, 5. [Google Scholar] [CrossRef] [Scilit]
- Mensah, C.A.; Andres, L.; Perera, U.; Roji, A. Enhancing Quality of Life through the Lens of Green Spaces: A Systematic Review Approach. Int. J. Wellbeing 2016, 6, 142–163. [Google Scholar] [CrossRef] [Scilit]
- Yang, L.; Ye, W. Landscape Design of Garden Plants Based on Green and Low-Carbon Energy under the Background of Big Data. Energy Rep. 2022, 8, 13399–13408. [Google Scholar] [CrossRef] [Scilit]
- Wuhan Municipal People’s Government General Office. Wuhan City’s 2024 Greening Work Plan. Available online: http://ylj.wuhan.gov.cn/zwgk/zwxxgkzl_12298/jhgh_12314/lhfa_/202403/t20240304_2367313.shtml (accessed on 3 February 2026).
- Wuhan Municipal Bureau of Gardens and Forestry. 2023 Wuhan City Greening Status Bulletin. Available online: http://ylj.wuhan.gov.cn/zwgk/zwxxgkzl_12298/tjxx/lhgb_12361/202403/t20240312_2371143.shtml (accessed on 3 February 2026).
- Wuhan Municipal Bureau of Natural Resources and Urban-Rural Construction. Revitalizing Micro Spaces Through Micro-Renovations to Create a Refined New Image of Wuhan. Available online: https://zrzyhgh.wuhan.gov.cn/gsggzx/ghzs/202103/t20210305_1643417.shtml (accessed on 3 February 2026).
- Hubei Provincial Department of Natural Resources. Wuhan Bureau: 1000 Micro Public Spaces to Be Built in the Central Urban Area. Available online: https://zrzyt.hubei.gov.cn/bmdt/sxdt/202212/t20221226_4465480.shtml (accessed on 3 February 2026).
- Jin, S.; Zhang, E.; Guo, H.; Hu, C.; Zhang, Y.; Yan, D. Comprehensive Evaluation of Carbon Sequestration Potential of Landscape Tree Species and Its Influencing Factors Analysis: Implications for Urban Green Space Management. Carbon Balance Manag. 2023, 18, 17. [Google Scholar] [CrossRef] [Scilit] [PubMed]
- Zhang, Y.; Ma, J.; Wang, E.; Bao, Z. Discussion on the Construction Ideas of Low-Carbon and High-Efficiency Urban Landscape based on Carbon Storage Measurement: Taking the West Lake Scenic Area in Hangzhou as an Example. J. Northwest For. Univ. 2013, 28, 221–226. [Google Scholar]
- Wang, G.; Li, X.; Chen, X.; Jiang, T.; Zheng, X.; Wei, Y.; Wan, X.; Wang, J. An Investigation on Microwave Transmissivity at Frequencies of 18.7 and 36.5 GHz for Diverse Forest Types during Snow Season. Int. J. Digit. Earth 2021, 14, 1354–1379. [Google Scholar] [CrossRef] [Scilit]
- Bergès, L.; Nepveu, G.; Franc, A. Effects of Ecological Factors on Radial Growth and Wood Density Components of Sessile Oak (Quercus petraea Liebl.) in Northern France. For. Ecol. Manag. 2008, 255, 567–579. [Google Scholar] [CrossRef] [Scilit]
- Zhang, X.; Leng, H.; Zhao, G.; Jing, J.; Tu, A.; Song, K.; Da, L. Construction of Aboveground Biomass Models for Four Common Urban Greening Tree Species in Shanghai. J. Nanjing For. Univ. (Nat. Sci. Ed.) 2018, 42, 141–146. [Google Scholar]
- Zanne, A.E.; Lopez-Gonzalez, G.; Coomes, D.A.; Ilic, J.; Jansen, S.; Lewis, S.L.; Miller, R.B.; Swenson, N.G.; Wiemann, M.C.; Chave, J. Data from: Towards a Worldwide Wood Economics Spectrum. 2009, 2123413 bytes. Available online: https://cir.nii.ac.jp/crid/1883398392629282560 (accessed on 22 February 2026).
- Yadav, R.; Gupta, S. Wood Anatomy of Broussonetia papyrifera and Antiaris toxicaria of Family Moraceae According to IAWA Feature List. Sci. Lett. 2020, 1, 23–27. [Google Scholar] [CrossRef] [Scilit]
- IPCC. 2019 Refinement to the 2006 IPCC Guidelines for National Greenhouse Gas Inventories; IPCC: Geneva, Switzerland, 2019. [Google Scholar]
- Zhu, J.; Shi, Y.; Fang, L.; Liu, X.; Ji, C. Patterns and Determinants of Wood Physical and Mechanical Properties across Major Tree Species in China. Sci. China Life Sci. 2015, 58, 602–612. [Google Scholar] [CrossRef] [Scilit] [PubMed]
- Li, B.; Yu, R.; Gan, K.; Ruan, G.; Liu, S.; Yang, M.; Xie, D.; Dai, W.; Zhong, H. A Large-Scale Residential Load Dataset in a Southern Province of China. Sci. Data 2025, 12, 450. [Google Scholar] [CrossRef] [Scilit] [PubMed]
- Wuhan Municipal Bureau of Statistics. Wuhan Statistical Bulletin on National Economic and Social Development in 2023. Available online: https://tjj.wuhan.gov.cn/tjfw/tjgb/202404/t20240405_2384677.shtml (accessed on 3 February 2026).
- Ministry of Ecology and Environment; National Bureau of Statistics. Announcement on the Release of 2021 Electricity Carbon Dioxide Emission Factors. Available online: https://www.mee.gov.cn/xxgk2018/xxgk/xxgk01/202404/t20240412_1070565.html (accessed on 3 February 2026).
- State Council. Interim Regulations on the Administration of Carbon Emission Rights Trading. Available online: https://www.gov.cn/zhengce/content/202402/content_6930137.htm (accessed on 3 February 2026).
- Ministry of Ecology and Environment. Measures for the Administration of Voluntary Greenhouse Gas Emission Reduction Trading (Trial). Available online: https://www.mee.gov.cn/xxgk2018/xxgk/xxgk02/202310/t20231020_1043694.html (accessed on 3 February 2026).
- Hubei Carbon Emission Exchange. Data Disclosure. Available online: https://www.hbets.cn/list_30.html (accessed on 3 February 2026).
- Beijing Carbon Emission Rights Electronic Trading Platform. Market Information. Available online: https://www.bjets.com.cn/article/jyxx/ (accessed on 3 February 2026).
- Specialized Committee on Building Energy Consumption and Carbon Emission Data of China Building Energy Efficiency Association. Research Report on Carbon Emissions in China’s Urban and Rural Construction Field (2024 Edition); Specialized Committee on Building Energy Consumption and Carbon Emission Data of China Building Energy Efficiency Association: Beijing, China, 2025. [Google Scholar]

Disclaimer/Publisher’s Note: The statements, opinions and data contained in all publications are solely those of the individual author(s) and contributor(s) and not of MDPI and/or the editor(s). MDPI and/or the editor(s) disclaim responsibility for any injury to people or property resulting from any ideas, methods, instructions or products referred to in the content. |
© 2026 by the authors. Licensee MDPI, Basel, Switzerland. This article is an open access article distributed under the terms and conditions of the Creative Commons Attribution (CC BY) license.