Article

A Study of the Interaction Between Human Behavior in Vertical Built Environments and Three-Dimensional Characteristics of Affiliated Open Spaces

1
School of Architecture and Urban Planning, Guangdong University of Technology, Guangzhou 510090, China
2
Institute for Urban-Rural Integration Development, Guangdong University of Technology, Guangzhou 510090, China
*
Author to whom correspondence should be addressed.
Buildings 2026, 16(5), 1023; https://doi.org/10.3390/buildings16051023
Submission received: 29 December 2025 / Revised: 27 February 2026 / Accepted: 3 March 2026 / Published: 5 March 2026
(This article belongs to the Section Architectural Design, Urban Science, and Real Estate)

Abstract

Affiliated Open Spaces (AOS) constitute vital public assets within high-density vertical cities. However, prevailing scholarship remains largely confined to two-dimensional horizontal perspectives, overlooking the quantitative impact of vertical built environment characteristics on spatial distribution and human behavior. Focusing on four high-density districts in Guangzhou typified by distinct three-dimensional morphologies, this study integrates field surveys, 3D geospatial data acquisition, and 621 valid questionnaires to empirically analyze the impact of 3D spatial features on user behavior and the mediating role of accessibility. Utilizing the ArcGIS 3D Analyst for vertical accessibility measurement and Partial Least Squares Structural Equation Modeling (PLS-SEM) for path analysis, the study tests the hypothesized relationships using multi-source data. The results indicate that (1) a user’s vertical location exerts a significant negative impact on both accessibility and human behavior; (2) building density and building functional diversity indirectly promote user engagement primarily by significantly enhancing accessibility, thereby confirming accessibility as a critical mediator; and (3) significant spatial heterogeneity exists, revealing distinct correlation patterns across varying built environments. This research elucidates the pivotal constraint of “vertical location” and validates the mediating efficacy of accessibility, offering empirical insights for human-centric vertical urban planning.

1. Introduction

With rapid population growth and accelerating urbanization, high-density cities confront an increasingly severe scarcity of spatial resources. To accommodate diverse functional demands within limited urban land, mixed-use and vertical development strategies have emerged as critical solutions to alleviate spatial constraints [1,2,3]. By concentrating diverse functions into walkable vertical spaces, these strategies not only enhance mobility efficiency but also foster sustainable, human-centric urban environments [4,5,6]. Historically, proximity has been prioritized in urban planning to ensure access to essential commercial, recreational, and transportation services, thereby elevating the quality of urban life [7,8]. Proximity serves as a fundamental determinant in assessing pedestrian friendliness and usage willingness [9]. Similarly, Liang et al. (2023), in their study on the mediating role of green space accessibility in health outcomes, underscored that accessibility is a pivotal indicator influencing the human behavior of Affiliated Open Spaces (AOS) and facilitating social interaction [10].
As a vital component of sustainable urban development, public space must evolve to meet the diverse and multicultural needs of modern urban populations. In the Chinese context, AOS refers to outdoor or semi-outdoor spaces situated within building property boundaries [11,12,13], analogous to the concept of Privately Owned Public Spaces (POPS) in international literature. Kostas and Woutter (2020) observed that the densification and mixed-function layouts of high-density urban centers can inadvertently weaken social ties and community cohesion [14]. Against this backdrop, AOS become increasingly valuable; they compensate for these socio-spatial deficiencies in high-density environments by providing venues for informal socialization, subsequently enhancing residents’ subjective well-being and physical and mental health [15].
Despite the growing prevalence of high-density vertical cities, current scholarship on spatial accessibility remains largely confined to two-dimensional planar perspectives. Traditional methodologies predominantly rely on horizontal road network distances as proxies for proximity [16], focusing primarily on macro-scale urban green systems while frequently overlooking the micro-scale built environment within property lines. Furthermore, within compact, vertical urban fabrics, such planar approaches fail to account for critical components of real-world vertical mobility, such as time spent ascending stairs, waiting for elevators, and traversing between floors [17]. This oversight risks introducing significant bias into the assessment of actual spatial accessibility in high-density contexts. To address these limitations, this study employs a mixed-methods case study approach, combining qualitative description with quantitative analysis. This research aims to elucidate the mechanisms by which three-dimensional spatial characteristics influence user behavior in high-density vertical environments, and to identify the mediating role of accessibility and then contribute to the refinement of spatial demand theory under the framework of vertical urbanism. Specifically, this paper addresses three core scientific questions: (1) Do vertical built environment characteristics significantly impact the perceived and actual accessibility of AOS? (2) Does spatial accessibility serve as a full or partial mediator between the vertical built environment and human behavior? (3) Within distinct 3D spatial typologies, can the built environment effectively mitigate or compensate for the negative impacts of vertical elevation by enhancing accessibility

2. Literature Review

2.1. Core Concept Definition

2.1.1. Social Concept Definition

Defining social interaction remains a challenge due to its inherent ambiguity. While sociological theory emphasizes micro-level indicators such as gestures, body language, and group dynamics, urban development research frames social interaction as a critical metric for gauging the vitality and quality of public spaces [18]. However, interactions within urban public spaces are as complex as the city itself, modulated by individual traits, cultural backgrounds, and environmental determinants [19]. To elucidate the activity profiles of diverse user groups, cluster analysis is employed in this study to identify five primary categories of users and their behavioral patterns. Specifically, social interaction is operationalized in this research as “social intimacy”, a variable quantifying the emotional connection residents maintain with AOS and their frequency of interaction.

2.1.2. Human Behavior

Individual behaviors are fundamentally shaped by abstract values and attitudinal responses to phenomena [20,21]. Behavioral geography underscores the significance of spatial selection, perception, and utilization, which are deeply contingent upon subjective cognition, psychological preferences, and the perception of the built environment. Complementarily, Time Geography theory offers a framework for understanding the spatiotemporal paths of individuals, revealing how activity scheduling is governed by multiple constraints. This perspective is vital for decoding the behavioral rhythms and spatiotemporal demands of urban residents. At the same time, a growing body of scholarship recognizes that how individuals perceive, interpret, and emotionally respond to urban environments plays a pivotal role in shaping urban well-being [22,23,24,25]. Consequently, the design of vertical urban complexes that genuinely enhance quality of life relies on a nuanced understanding of human-scale spatial experiences. In this paper, human behavior is quantified through variables such as the willingness to walk to the nearest AOS, duration of stay, and usage frequency.

2.1.3. Affiliated Open Spaces

In the context of Chinese urban planning, AOS typically refer to outdoor or semi-outdoor public activity spaces situated within the property boundaries (often termed “red lines”) of building plots [26,27]. This concept is highly isomorphic with “Privately Owned Public Spaces” (POPS) in Western literature spaces that fulfill public service functions but are constructed and managed by non-public sectors [28]. The AOS defined in this study encompass specific typologies within the property lines, including affiliated green spaces, ground-level elevated spaces, sky gardens, and sky bridges.

2.1.4. Spatial Accessibility

Broadly, accessibility refers to the proximity of a location to essential functions such as housing, employment, healthcare, education, recreation, and commerce, thereby synthesizing spatial and temporal dimensions. It serves as a guiding principle for improving access to district-level amenities and optimizing multi-modal urban infrastructure. Specifically, proximity correlates with increased active mobility, reduced car dependence, and enhanced autonomy for vulnerable groups [29,30,31,32,33,34,35]. Consequently, the proximity of AOS contributes to urban vitality, sustainability, inclusivity, and quality of life [36,37,38,39]. In this study, accessibility is contextualized within the vertical dimension and is defined as the vertical spatial distance from a resident’s living floor to the nearest AOS. This physical proximity is considered to influence user behavior primarily through the mechanism of environmental perception.

2.2. Theoretical Background

This study synthesizes theoretical frameworks including space syntax, behavioral geography, and place theory to elucidate human–environment interactions within high-density vertical built environments.
First, Space Syntax theory provides the morphological foundation for understanding the relationship between spatial configuration and usage behaviors. Hillier and Hanson (1989) posited that street axis integration effectively promotes the utilization of open spaces by reducing psychological distance [40]. This premise draws upon the theory of the movement economy, which argues that the distribution of natural pedestrian flow is conditioned by spatial configuration [41,42]. Complementing this, Jacobs (1961, 2010) emphasizes that the permeability of urban structure and the presence of multi-functional areas (e.g., commercial-residential complexes) are critical for attracting diverse populations and enhancing interaction frequency [43,44]. Furthermore, Cervero and Kockelman (1997) noted that accessibility and usage intensity were intrinsically linked to building environment variables such as land use mix, connectivity, and density [45]. Collectively, these theories offer a morphological basis for examining how physical form specifically building density and network accessibility influences human behavior.
Secondly, Behavioral Geography underscores that the influence of the objective environment on behavior is mediated by subjective cognition. According to the Environment–Perception–Behavior paradigm, an individual’s spatio-temporal path is constrained not only by physical distance but also by psychological perception, subjective preferences, and individual values [46]. Time Geography theory further elucidates how activity scheduling is governed by multiple constraints, thereby offering a framework for decoding the behavioral rhythms of urban residents [47]. In the context of vertical cities, factors such as elevator waiting times and the psychological friction associated with vertical distance constitute unique spatio-temporal constraints. This explains why physically proximate spaces might suffer from underutilization due to low perceived accessibility.
Finally, Place Theory provides the criteria for evaluating the quality and social value of these spaces. Lynch (1960) emphasizes that clear paths and identifiable nodes reduce the cognitive load of wayfinding, thereby enhancing spatial legibility and the willingness to utilize a space [48]. Extending this to the social dimension, Oldenburg’s (1989) “Third Place” theory highlights the critical role of informal public spaces in fostering social interactions [49]. Within this study, AOS are conceptualized as “Third Places” embedded within residential and institutional compounds, serving as vital venues for social contact. Accordingly, this study defines social interaction as the core metric for spatial vitality, specifically quantified as the intensity of emotional connections and the frequency of interaction among residents.

2.3. Research Background

2.3.1. The Direct Effects of the Built Environment on Human Behavior

Specifically, densified environmental features, including transit accessibility, commercial density, and land use diversity, have been found to attract participation and enhance the intensity of user-environment interactions. Liu et al. (2026) indicate that creating comfortable urban outdoor environments helps to increase the frequency, duration, and intensity of public activities in open spaces, and was beneficial for both physical and mental health [50]. However, in high-density vertical contexts, AOS typologies such as sky gardens have been noted to potentially constrain usage due to inefficient vertical circulation systems. Conversely, highly connected vertical nodes have been shown to enhance regional spatial integration and systemic coordination [51], thereby attracting users to AOS and achieving an efficient match between crowd demand and spatial supply in the volumetric dimension. Accordingly, we propose Hypothesis 1 (H1): Vertical built environment characteristics significantly impact the perceived and actual accessibility of AOS; given the prevalence of imperfect vertical circulation, this impact predominantly manifests as a negative correlation.

2.3.2. The Impact of Accessibility on Human Behavior and Its Path Mediating Effects

Within the “Environment–Perception–Behavior” framework, accessibility is posited as a critical mediator between the built environment and human behavior. It is understood that urban planners can enhance urban dynamics and quality of life by emphasizing proximity, while accessibility oriented urban design fosters inclusive environments [52], stimulates social interaction, and promotes AOS utilization. Shan and He (2017) note that improving park accessibility is pivotal for satisfying diverse recreational needs and promoting well-being [53]. Similarly, Zhao et al. (2024) confirm that accessibility significantly dictates usage opportunities and influences residents’ psychological and social well-being [54]. Zhang et al. (2022) further demonstrate a positive correlation between walking accessibility and community park usage patterns [55]. Within residential communities, AOS due to their embedded layout and immediate proximity are identified as key carriers for residents’ high-frequency, interstitial fragmented outdoor activities. Consequently, we propose Hypothesis 2 (H2): Spatial accessibility plays a significant mediating role between the vertical built environment and crowd behavior.

2.3.3. The Direct Impact of the Built Environment on Spatial Accessibility

Amidst the rapid evolution of vertical urbanism, scholars have increasingly scrutinized the impact of urban environmental factors on accessibility. Specifically, the built environment is understood to shape socio-economic outcomes through complex mechanisms that influence human behavior and opportunity structures [56,57]. This perspective aligns with the tenets of critical realism, which posit that the spatial distribution of architectural structures and functions fundamentally conditions the social dimensions of human life. Individual spatial perception is considered to be modulated by both personal attributes and the characteristics of the built and natural environment such as density, land use mix, infrastructure, and topography. These factors have been observed to exert a particularly profound influence on active travelers, including pedestrians and cyclists [58,59,60].
Recent scholarship corroborates these associations. Jiang et al. (2025) observe that built environment attributes, including building typology and greening ratios, significantly determine travel behavior [61]. Similarly, employing the XGBoost algorithm, Zhang et al. (2025) demonstrate that the interaction between built environment factors such as architectural morphology and functional diversity and accessibility plays a critical role in shaping urban vitality [62].
In contrast to traditional ground-level spaces, the accessibility mechanisms of three-dimensional AOS are found to be inherently more complex. Yu et al. (2023) highlighted the physical benefits of integrating open spaces through multi-level and multi-dimensional connectivity [63]. This finding supports the potential for achieving an efficient alignment between user demand and spatial supply within the vertical dimension. Consequently, we propose Hypothesis 3 (H3): The negative externalities associated with vertical height can be mitigated by optimizing the built environment to enhance vertical accessibility. Furthermore, variations in the built environment are expected to differentially influence users’ behavioral characteristics.

2.4. Research Gap

Prior research investigating inequality in the spatial distribution of parks has relied heavily on spatial accessibility metrics [64,65,66]. Typically, these approaches operationalize accessibility by counterbalancing the inherent attractiveness of a park measured by capacity indicators such as surface area or facility count against travel impedance, specifically travel time and population demand within a catchment area [67,68]. However, these established methodologies presented several critical limitations.
First, the calculation of pedestrian travel time is predominantly based on simplified two-dimensional (2D) street network representations. This conventional practice systematically overlooks the profound impact of three-dimensional (3D) urban topography, particularly the complex effects of vertical elevation, slope, and grade-separated pedestrian infrastructure (e.g., sky bridges and underground passages) on route choice. Consequently, traditional 2D models fail to accurately estimate realistic walking times, as they do not account for the actual physical effort and temporal costs incurred by pedestrians when navigating complex vertical terrains.
Second, the operationalization of park attractiveness is often divorced from individual user experience. Existing metrics have largely neglected users’ subjective perceptions of quality, prioritizing easily quantifiable but potentially imprecise proxy indicators, such as size and amenities [69]. In essence, scholarship has tended to isolate environmental factors without integrating the nexus between the built environment and human behavior. There remains a paucity of quantitative analyses examining the interplay between accessibility and specific usage characteristics within this environment–behavior relationship.
Most critically, while existing literature acknowledges the complexity of high-density environments, this is a lack of quantitative empirical evidence concerning human–environment interactions within the vertical dimension. Specifically, the micro-mechanisms by which verticality acts as a physical impedance reshaping usage behavior by altering perceived spatial accessibility remain underexplored. Furthermore, in complex urban morphologies characterized by high density and mixed functions, it remains to be determined whether specific spatial strategies, such as sky bridge systems, can effectively mitigate the negative externalities associated with vertical height.
To address these lacunae, this study adopts a vertical city perspective to investigate the mechanisms through which three-dimensional spatial characteristics influence crowd usage patterns, with accessibility serving as a mediating variable. We select three distinct neighborhood typologies to empirically examine how the built environment shapes accessibility and, consequently, modulated residents’ usage characteristics of AOS.

3. Study Area and Methodology

The research and analytical methods employed in this thesis primarily include case studies, PLE-SEM (IBM SPSS Amos 27 Graphics), ArcGIS (10.8) 3D analysis, and SPSS (IBM SPSS Statistics 27) cluster analysis. Data sources are mainly derived from field research and questionnaire surveys, supplemented by the acquisition of 3D geospatial data.

3.1. Data Sources and Collection

3.1.1. Geospatial Data Acquisition

Baseline architectural data were initially extracted using high-resolution Google Satellite Imagery and the BIGEMAP platform. This was rigorously supplemented by on-site ground truthing to establish a comprehensive database detailing building functions, heights, and density. These datasets serve as the foundation for the quantitative analysis of built environment characteristics.

3.1.2. Questionnaire Surveys

Questionnaire data were derived from the “Public Survey on Crowd Demand Characteristics of AOS”, conducted among residents in Guangzhou’s high-density districts from October 2023 to March 2024 (spanning autumn, winter, and spring seasons). The survey aimed to capture residents’ usage perceptions and satisfaction levels regarding AOS, statistics on the individual social attributes of the research subjects are shown in Table 1. To minimize sampling bias, a temporal stratified sampling strategy was adopted, ensuring coverage across both weekdays and weekends, as well as varying diurnal activity periods. The instrument assessed multiple dimensions, including satisfaction with residential vertical location, travel time to AOS, perceived accessibility, usage frequency, and duration of stay.
A total of 650 questionnaires were distributed, yielding 621 valid responses (Effective Response Rate: 95.5%). The spatial distribution of the valid sample includes Shahe Street (n = 102), Beijing Road (n = 183), Dongfeng Middle Road (n = 205), and Liuyun Community (n = 221). The sample size was determined to ensure statistical representativeness, in related studies, Xie et al. (2024) utilized 379 questionnaires [70], while Mouratidis (2026) employed 1331 questionnaires [71]. The sample size of our study falls between these two figures. Furthermore, this sample size was estimated and controlled based on a 95% confidence level and a ±5% sampling error range. Consequently, the sample size is deemed feasible.

3.2. Variable Description

Table 2 presents the comprehensive set of variables examined in this study, derived from field surveys, geospatial datasets, and questionnaire responses. To accurately capture the three-dimensional attributes of the study area, the variables are categorized as follows: (1) Within the built environment dimension, 3D characteristics are operationalized through building functional diversity, floor level (representing the user’s vertical floor level), and building density; (2) Within the accessibility dimension, the analysis primarily prioritizes proximity accessibility; and (3) Regarding human behavior, the subsequent analysis focuses chiefly on time frequency and the degree of spatial stickiness.
During data processing, all collected variables were normalized using a 5-point scale. This standardization ensures data objectivity and consistency, facilitating a unified framework for the subsequent statistical analyses.

3.3. Statistical Analysis Methods

This study employs cluster analysis and Partial Least Squares Structural Equation Modeling (PLS-SEM) for data analysis, aiming to evaluate the relationship among built environment characteristics, accessibility and human behavior. The reason for choosing PLS-SEM lies in (1) this study aims to elucidate the mechanisms by which three-dimensional spatial characteristics influence user behavior in high-density vertical environments, and to identify the mediating role of accessibility; (2) compared to covariance-based SEM, PLS-SEM possesses higher statistical power in handling non-normal distribution data and small sample data.
Furthermore, the K-means clustering algorithm was used to analyze the crowd behavioral characteristics of three-dimensional affiliated open spaces. Based on the social basic attributes and behavioral preference attributes in the questionnaire, five types of typical user groups were identified. As a classic unsupervised learning method, this algorithm automatically partitions samples into a preset number of mutually exclusive categories based on their similarity measures by iteratively optimizing a specific objective function [72]. Its objective function (loss function) is defined as:
i = 0 n min μ C x i μ j
where xi represents the data point, μj is the j-th cluster center, and C is the set of all cluster centers. Continuous variables were subjected to Z-score standardization. The optimal number of clusters was determined using the Elbow Method within the range of k = 2 to 10 based on the trend of Within-Cluster Sum of Squares (WCSS), combined with actual interpretability for comprehensive judgment. Clustering execution used Euclidean distance, center initialization adopted the k-means++ algorithm, maximum iterations were set to 300, convergence threshold to 0.0001, and operations were repeated 20 times for each k value to select the result with the minimum WCSS. Result interpretation was completed by calculating the distribution of cluster variable center values, combining descriptive statistics and visualization, and using the Silhouette Coefficient to evaluate clustering quality [73].

3.4. Three-Dimensional Analysis Methods

In order to more precisely quantify spatial accessibility, this study conducted further analysis on the influence mechanism of the built environment on crowd human behavior in the region by selecting four blocks and combining them with 3D-GIS (Geographic Information System) technology. Specifically, GIS accessibility analysis was used to measure the spatial distance between the resident’s floor and the affiliated open space, and accessibility indicators under different spatial layouts were calculated. To precisely determine the shortest path from the main building entrance to the nearest affiliated open space with facilities and public open space, we adopted the New OD Cost Matrix method in the ArcGIS Network Analyst tool. The shortest accessible time T was obtained by calculating the sum of two variables: elevator or stair time E and walking time W. The average elevator speed ve1 was set to 1.5 m/s, the average walking speed vw was set to 1 m/s, and the average stair climbing speed ve2 was set to 0.15 m/s.
Its calculation formula is as follows: summing the time for the elevator or stairs to reach the ground Ei from different building floor heights Hi, and the shortest time for walking from the building entrance to the entrance of the affiliated open space and public open space Wi, the shortest accessible time from the plot to the affiliated open space and public open space can be obtained.
T i k = E i + W k = H i v e + m i n   d i k v w
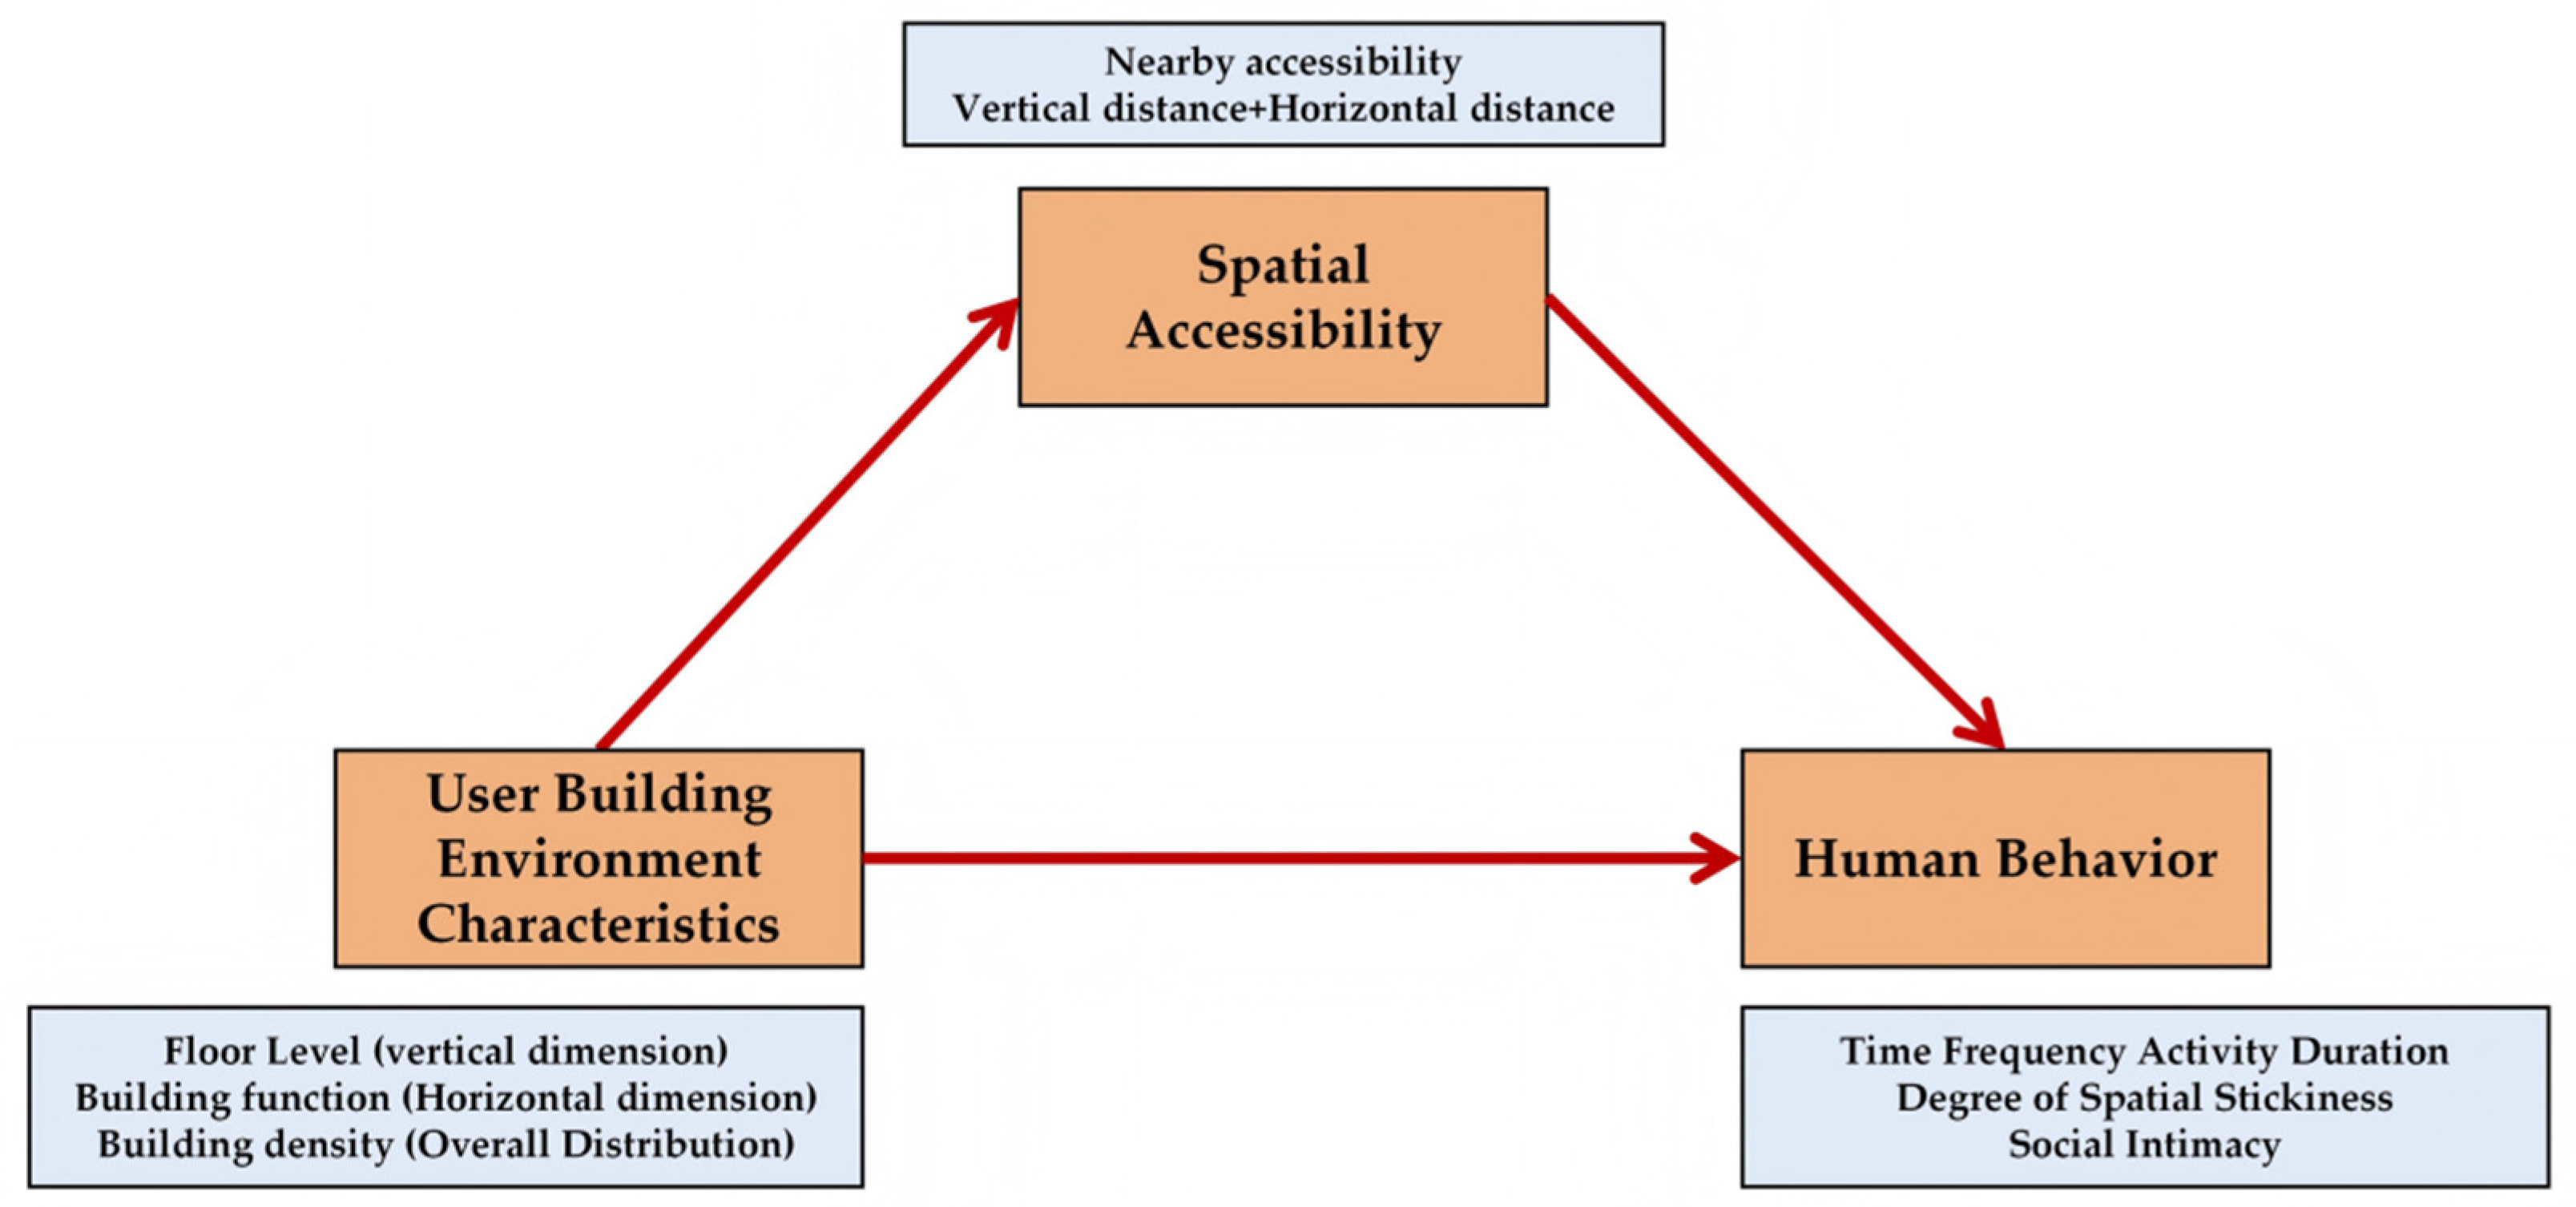
Based on the above analysis of PLS-SEM research methods, guided by the research objectives, we proposed a conceptual model based on the relationship among the built environment, accessibility and human behavior at the beginning of the research (Figure 1). The model includes three latent variables: built environment (independent variable), accessibility (mediator variable), and human behavior (dependent variable), as well as multiple observed variables (such as building functional diversity, floor level, building density, etc.). The influence mechanism across elements is verified through path coefficient analysis.

3.5. Study Area

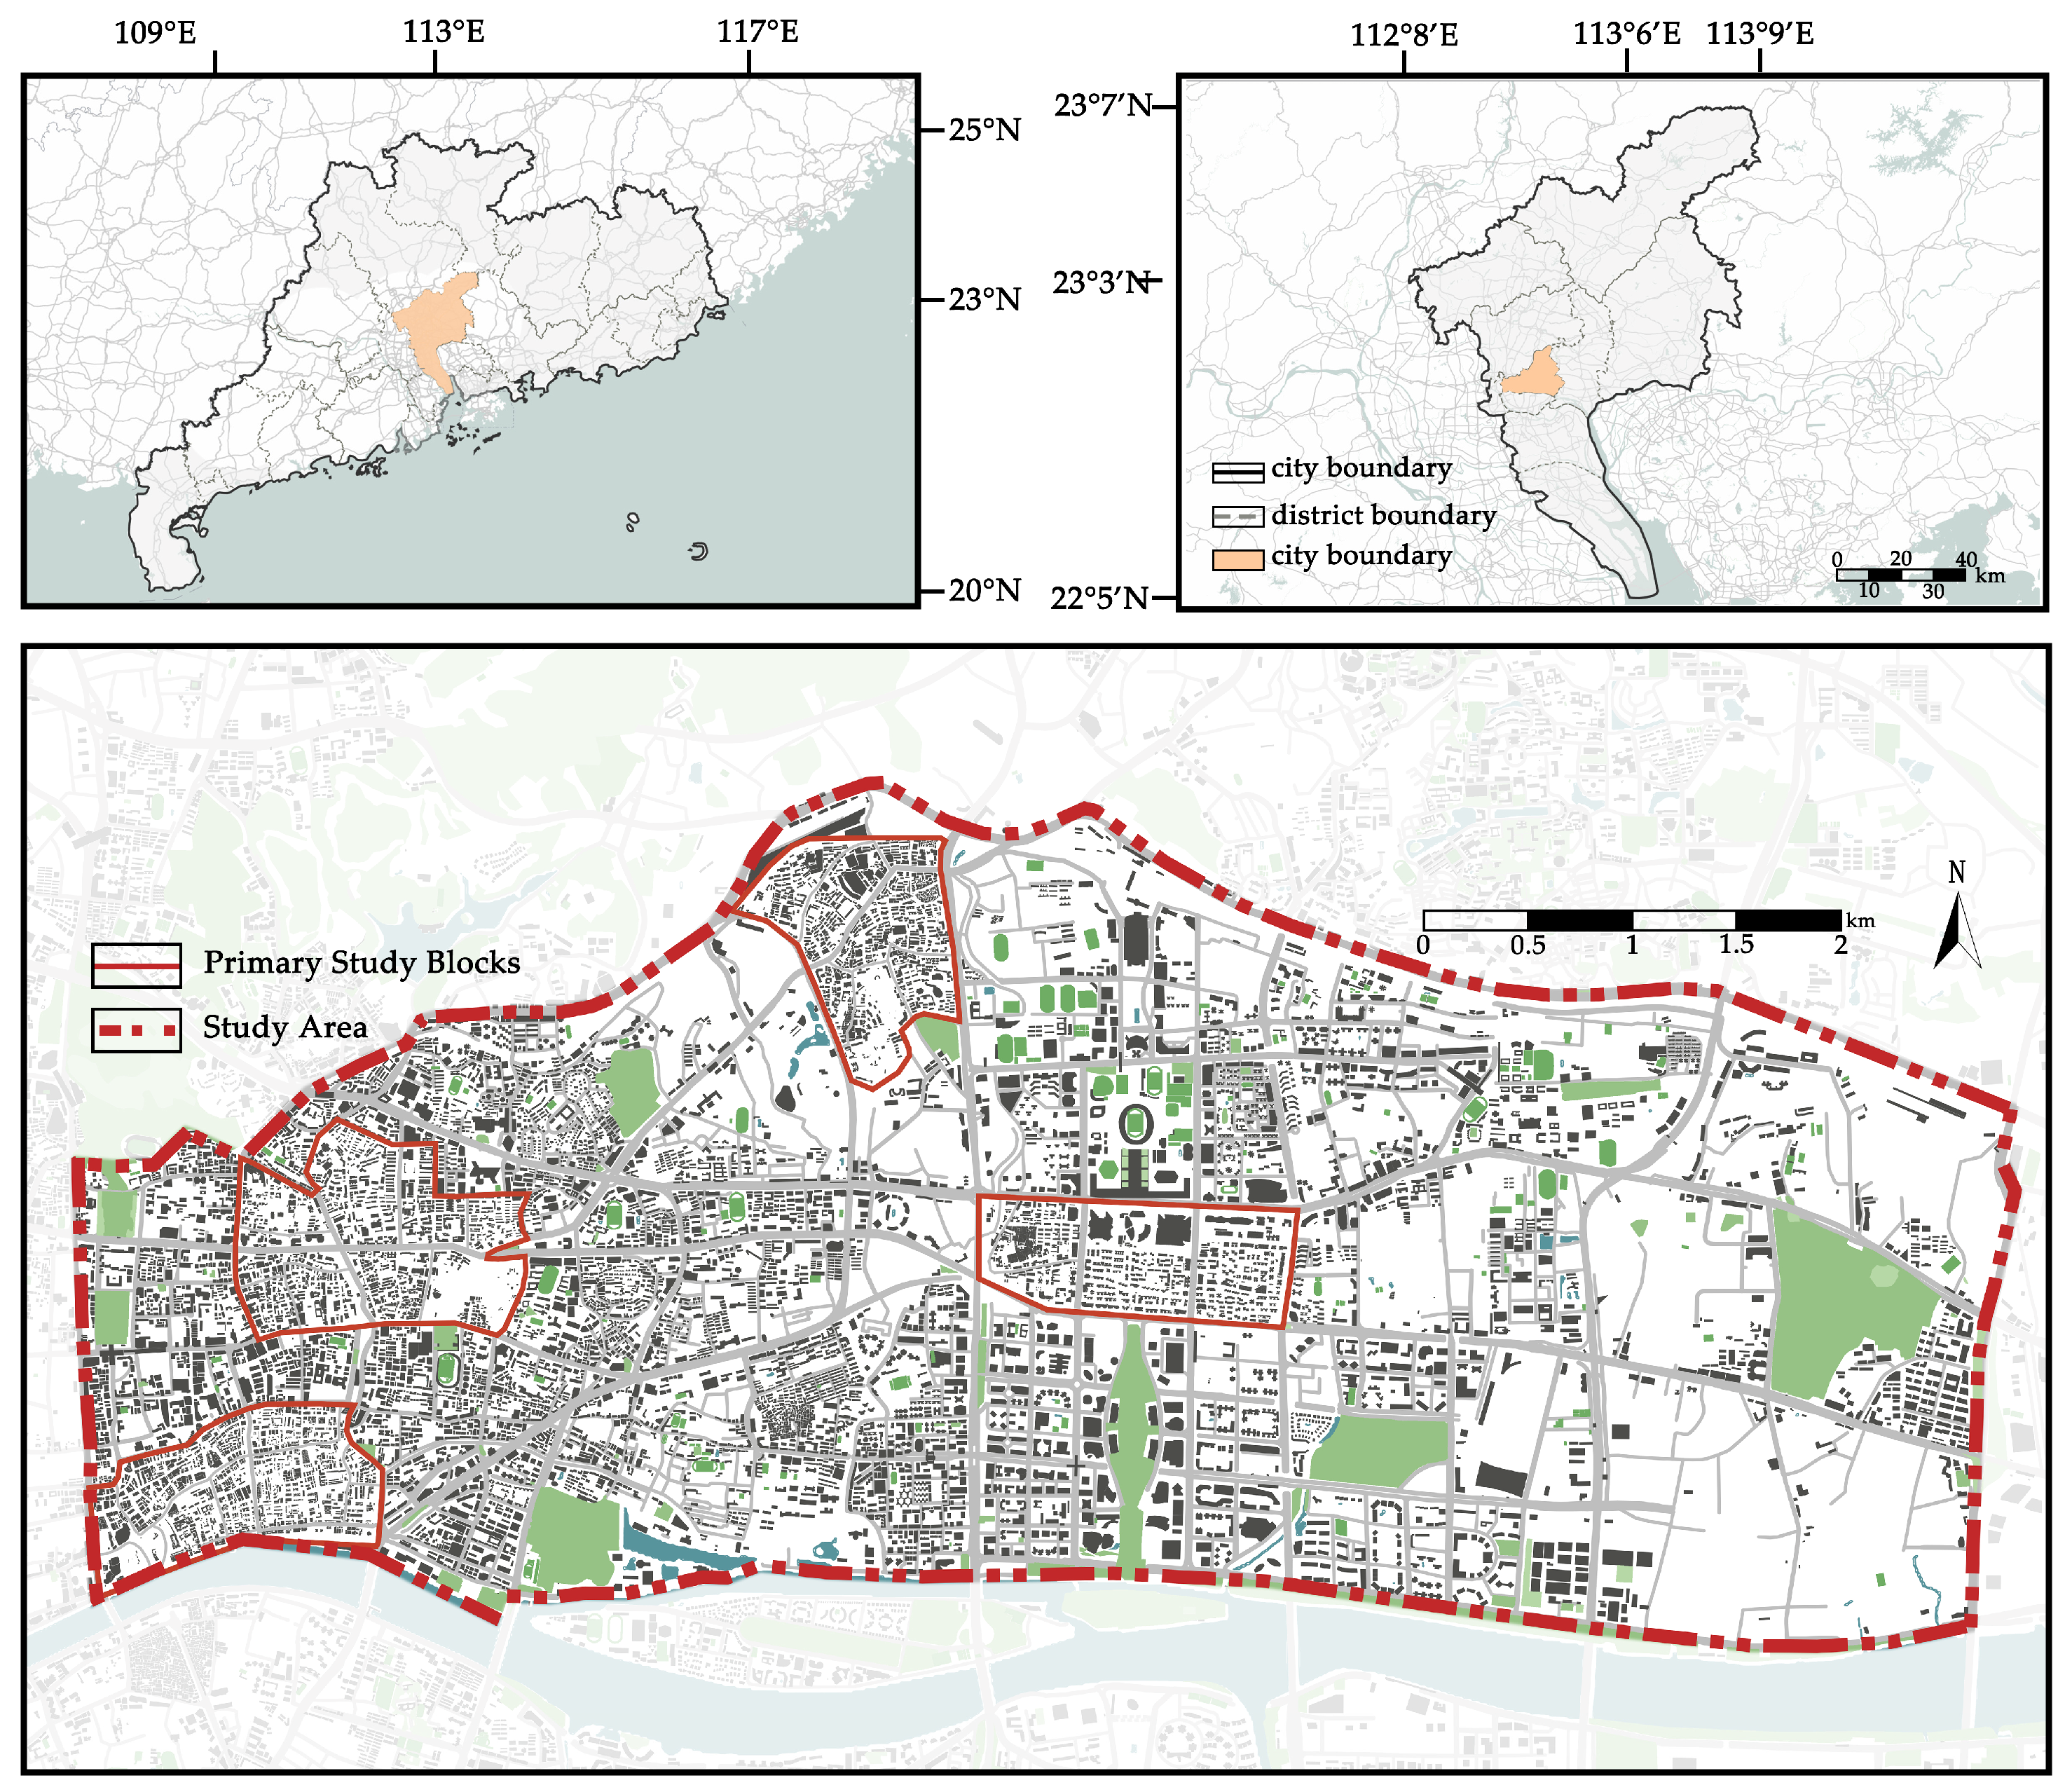
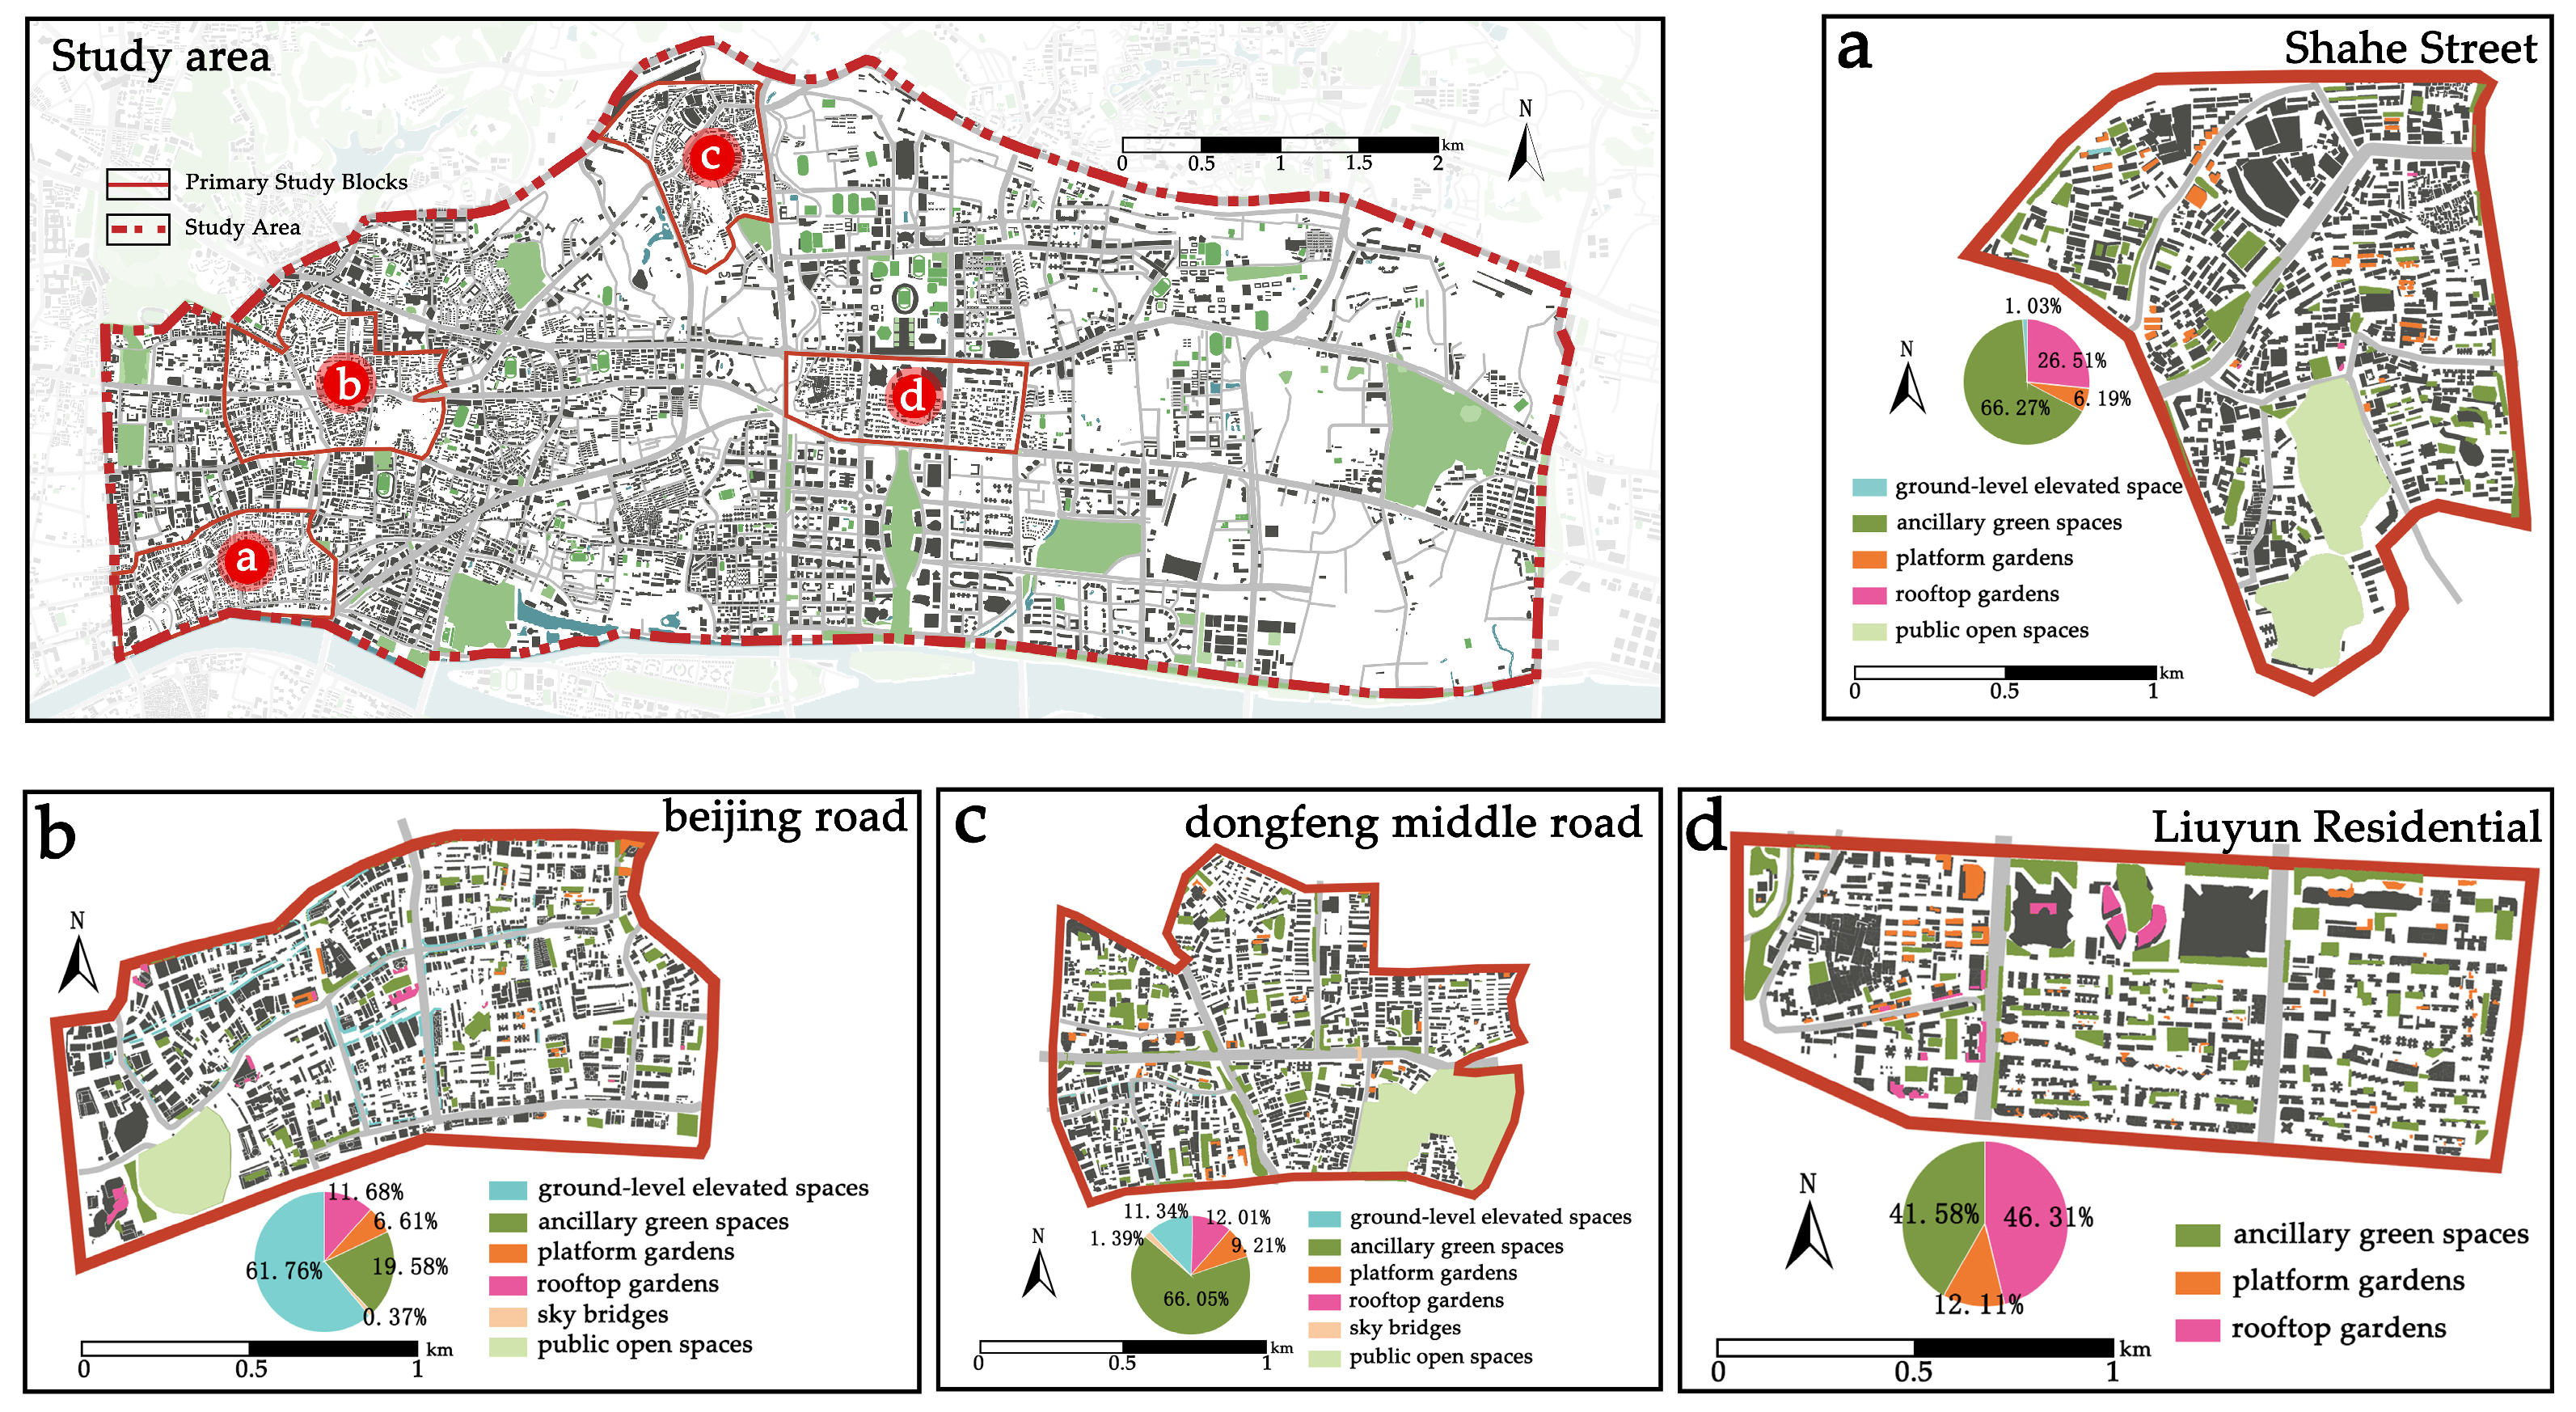
The research focuses on the high-density urban core of Guangzhou, China, specifically within the Yuexiu and Tianhe Districts. This study area is delineated by Keyun Road to the east, Jiefang North Road to the west, and bounded by major arterial routes (Guangyuan Expressway and the Inner Ring Road) to the north and the Pearl River to the south, totaling approximately 50 km2. This region includes both the historic and newly developed urban areas of Guangzhou, as well as the city’s central axes (old and new) (Figure 2).
To account for different forms and differences in Vertical Space Utilization Characteristics, four representative districts were selected: Shahe Street, Beijing Road, Dongfeng Middle Road, and Liuyun Community. The spatial distribution and configurations of AOS across these sites are detailed in Table 3 and Figure 3.
The analysis of Table 3 and Figure 3 reveals distinct spatial typologies:
In Shahe Street, the open space system is characterized by a pronounced horizontal dominance. The aggregate area of ancillary green spaces confirms the ground level as the primary locus of spatial efficiency. Middle and high-level rooftop or platform gardens remain subordinate in both scale and frequency, serving as sporadic ecological supplements rather than integrated components of a multi-level spatial hierarchy. This suggests a lower degree of vertical functional intensity and 3D land-use synergy.
The core characteristic of Beijing Road District lies in its commercial streets dominated by ground-level elevated spaces. The overwhelming majority of elevated ground-level spaces significantly enriches the spatial experience for pedestrians and enhances the connectivity of the pedestrian network. While the ground-level green spaces maintain a scale advantage in terms of area, the quantity of ground-level elevated spaces defines the fundamental characteristics of this block.
In Dongfeng Middle Road, the spatial configuration reinforces the ground level as the fundamental functional platform. Ancillary green spaces predominantly in the form of community gardens and pocket parks are not only quantitatively dominant but also qualitatively irreplaceable for daily social reproduction and recreation. The vertical dimension remains secondary, with high level open spaces serving as fragmented morphological accents, consistent with a planning logic prioritized toward efficient ground-level accessibility.
Liuyun Community exemplifies a proactive Vertical Urbanism approach to spatial resource expansion. The district leads in the total number of rooftop gardens, representing a strategic response to severe land scarcity. Notably, while aggressively reclaiming the atmospheric dimension, the district maintains the ecological integrity of traditional ground-level greening. This creates a synergistic 3D development pattern where vertical expansion complements, rather than replaces, the traditional open space fabric.

4. Results

4.1. Descriptive Statistical Analysis of Variables

Prior to structural equation modeling (SEM), descriptive statistics were calculated to examine the distributional characteristics of the sample data (Table 4). A total of 621 valid questionnaires were collected. Based on specific spatial attributes, the sample was classified into three distinct neighborhood typologies: institutional residential compound, high-rise urban housing complex, and commercial residential mixed-use complex.
Statistical results indicate notable variations across the three typologies. The institutional residential compound recorded mean values of 2.56 for Floor Level, 3.02 for building density, 3.00 for building functional diversity, and 2.76 for accessibility. In comparison, the high-rise urban housing complex exhibited a mean floor level of 3.02, building density of 3.00, building functional diversity of 3.02, and accessibility of 2.77. Finally, the commercial residential mixed-use complex reported the highest figures, with mean values of 3.05 for floor level, 3.09 for building density, 3.07 for building functional diversity, and 2.85 for accessibility.
The quantitative analysis reveals distinct morphological profiles for each area. Area 1 (institutional residential compound) exhibited the lowest mean floor level (2.56), characterizing a distinct “low-rise” morphology. Its relatively lower scores in functional mixture and accessibility are consistent with the attributes of legacy institutional communities, which typically feature fewer stories but high spatial enclosure. Area 2 (high-rise urban housing complex) demonstrated a “high-rise, low-density” spatial configuration. While its floor level (3.02) showed a marked increase compared to Area 1, it recorded the lowest building density (3.00) among the three groups, reflecting the more spacious vertical layout typical of modern high-rise residential developments. Area 3 (commercial residential mixed-use complex) epitomized typical “three-high” characteristics (high verticality, density, and functional mix). It yielded the highest values for floor level (3.05), building density (3.09), and building functional diversity (3.07). This high-intensity composite development model also corresponded to the highest level of accessibility (2.85).
The goodness of fit for both the aggregate model (Model 1) and the three spatial typology sub-models (Models 2–4) was assessed using the Maximum Likelihood (ML) estimation method. As presented in Table 5, the fit indices for all models met the recommended statistical benchmarks. Specifically, Model 1 demonstrated a robust fit with the observed data: the CMIN/DF ratio was 4.788 (below the reference threshold of 5.0), and the RMSEA was 0.078 (below the acceptable upper limit of 0.10). Furthermore, the NFI, GFI, and CFI values all exceeded 0.90 (0.967, 0.951, and 0.973, respectively), confirming the structural validity of the aggregate model.
Regarding the three sub sample models, despite the reduced sample sizes, the models maintained strong structural stability. The CMIN/DF values ranged from 2.555 to 3.254, and RMSEA values fell within the 0.083 to 0.091 range, both satisfying the criteria for acceptable fit (CMIN/DF < 5; RMSEA < 0.10). Although certain incremental fit indices for specific sub-models fell marginally below 0.90 (e.g., CFI = 0.897 for Model 3), the GFI values consistently exceeded the critical threshold of 0.80, and IFI values either approached or surpassed 0.90. These results indicate that, upon holistic assessment, the overall model fit remains within an acceptable range, thereby validating the suitability of the models for subsequent path analysis.

4.2. The Overall Sample Results

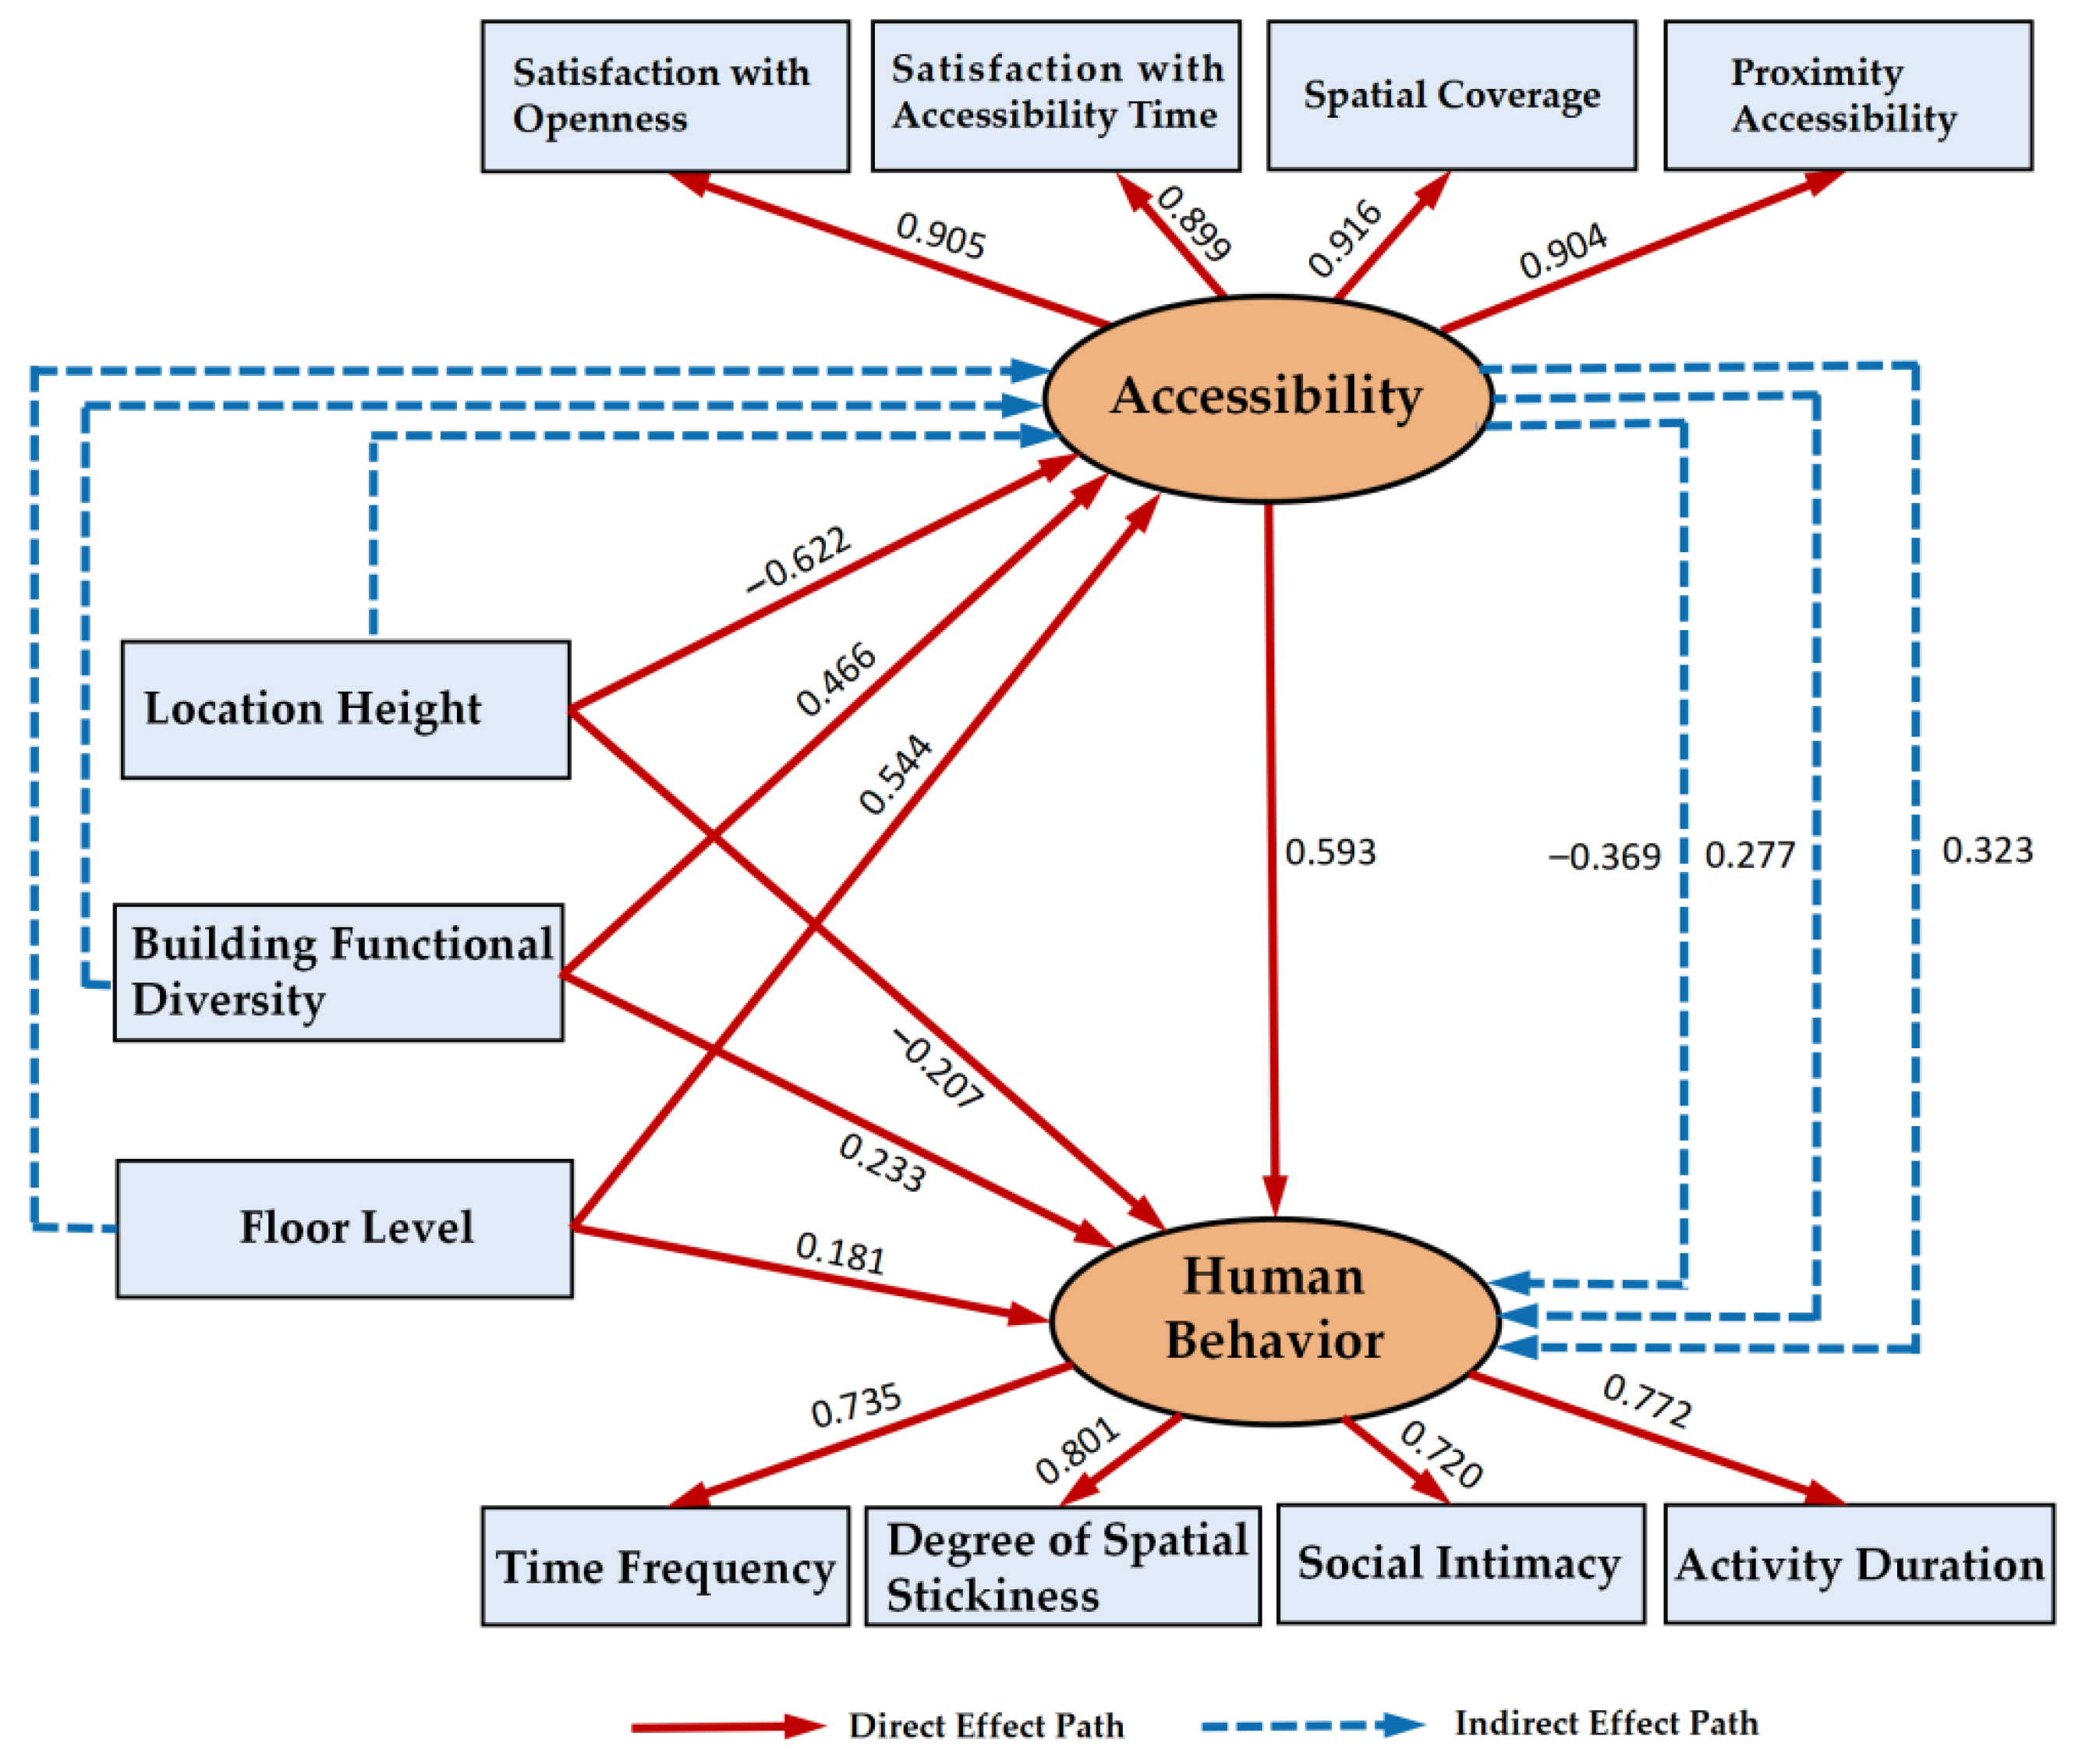
Integrating the path analysis and bootstrap validation results from the PLS-SEM (refer to Figure 4), this study elucidate the mechanisms by which three-dimensional spatial characteristics influence human behavior in high-density vertical environments, and to identify the mediating role of accessibility. The findings highlight a distinct pattern of vertical stratification. Empirical evidence reveals a significant inverse relationship between floor level and accessibility; as verticality increases, both the perceived accessibility and the subsequent utilization of AOS diminish markedly. Conversely, building functional diversity and building density exert a positive indirect influence on AOS utilization, facilitated by the enhancement of spatial accessibility. Notably, the indirect effects channeled through accessibility significantly outweigh the direct effects. This underscores that the impact of 3D built environment characteristics on usage patterns is predominantly mediated by the optimization of spatial accessibility rather than direct environmental stimulation. Raw data are presented in Appendix A Table A1 and Table A2.

4.2.1. Relationship Between Built Environment and Accessibility

Regarding direct effects, floor level exhibited a particularly prominent negative correlation with accessibility within the three-dimensional built environment (Effect value = −0.622, p < 0.001). This suggests that as the vertical position of residents increases (i.e., higher residential floors), their accessibility to affiliated open spaces significantly diminishes. Conversely, building functional diversity (Effect value = 0.466, p < 0.001) and building density (Effect value = 0.544, p < 0.001) showed significant positive correlations with accessibility, implying that functional integration and high-density development facilitate spatial accessibility in a three-dimensional context.

4.2.2. The Significant Mediating Effect of Accessibility

In this study, the direct paths of “Building Density—Human Behavior” and “Floor Level—Human Behavior” were not statistically significant (p > 0.05). This indicates that density and height do not exert a significant direct impact on usage; consequently, the subsequent analysis focuses on their indirect effects mediated by accessibility. Among the built environment variables, only building functional diversity demonstrated a weak direct positive effect on human behavior (Effect value = 0.233, p < 0.001). Given that the indirect effects of all three variables exceeded their direct effects, the results suggest that 3D environmental characteristics influence residents’ usage behaviors and demands primarily by modulating either improving or constraining spatial accessibility.

4.2.3. Relationship Between Floor Level and Human Behavior

The analysis of indirect effects further reveals that floor level exerts a significant negative indirect influence on human behavior (Effect value = −0.369, p < 0.001). Specifically, as a user’s floor level increases, usage intensity characterized by frequency and activity duration in affiliated open spaces tends to decrease. In contrast, Building functional diversity (Effect value = 0.277, p < 0.001) and building density (Effect value = 0.323, p < 0.001) generate positive indirect effects on human behavior by enhancing accessibility. These findings elucidate that within the three-dimensional urban environment, usage behavior is jointly shaped by the “vertical barrier effect” of height and the “three-dimensional integration effect” of function and density.
The aforementioned results validate the research hypotheses proposed earlier. To further investigate whether the interplay between the built environment, accessibility, and human behavior varies across different contexts, the following section employs cluster analysis to identify distinct built environment typologies and explicitly analyze the specific influence mechanisms among these three dimensions.

4.3. Influence Patterns of Typical Spatial Combinations on Human Behavior

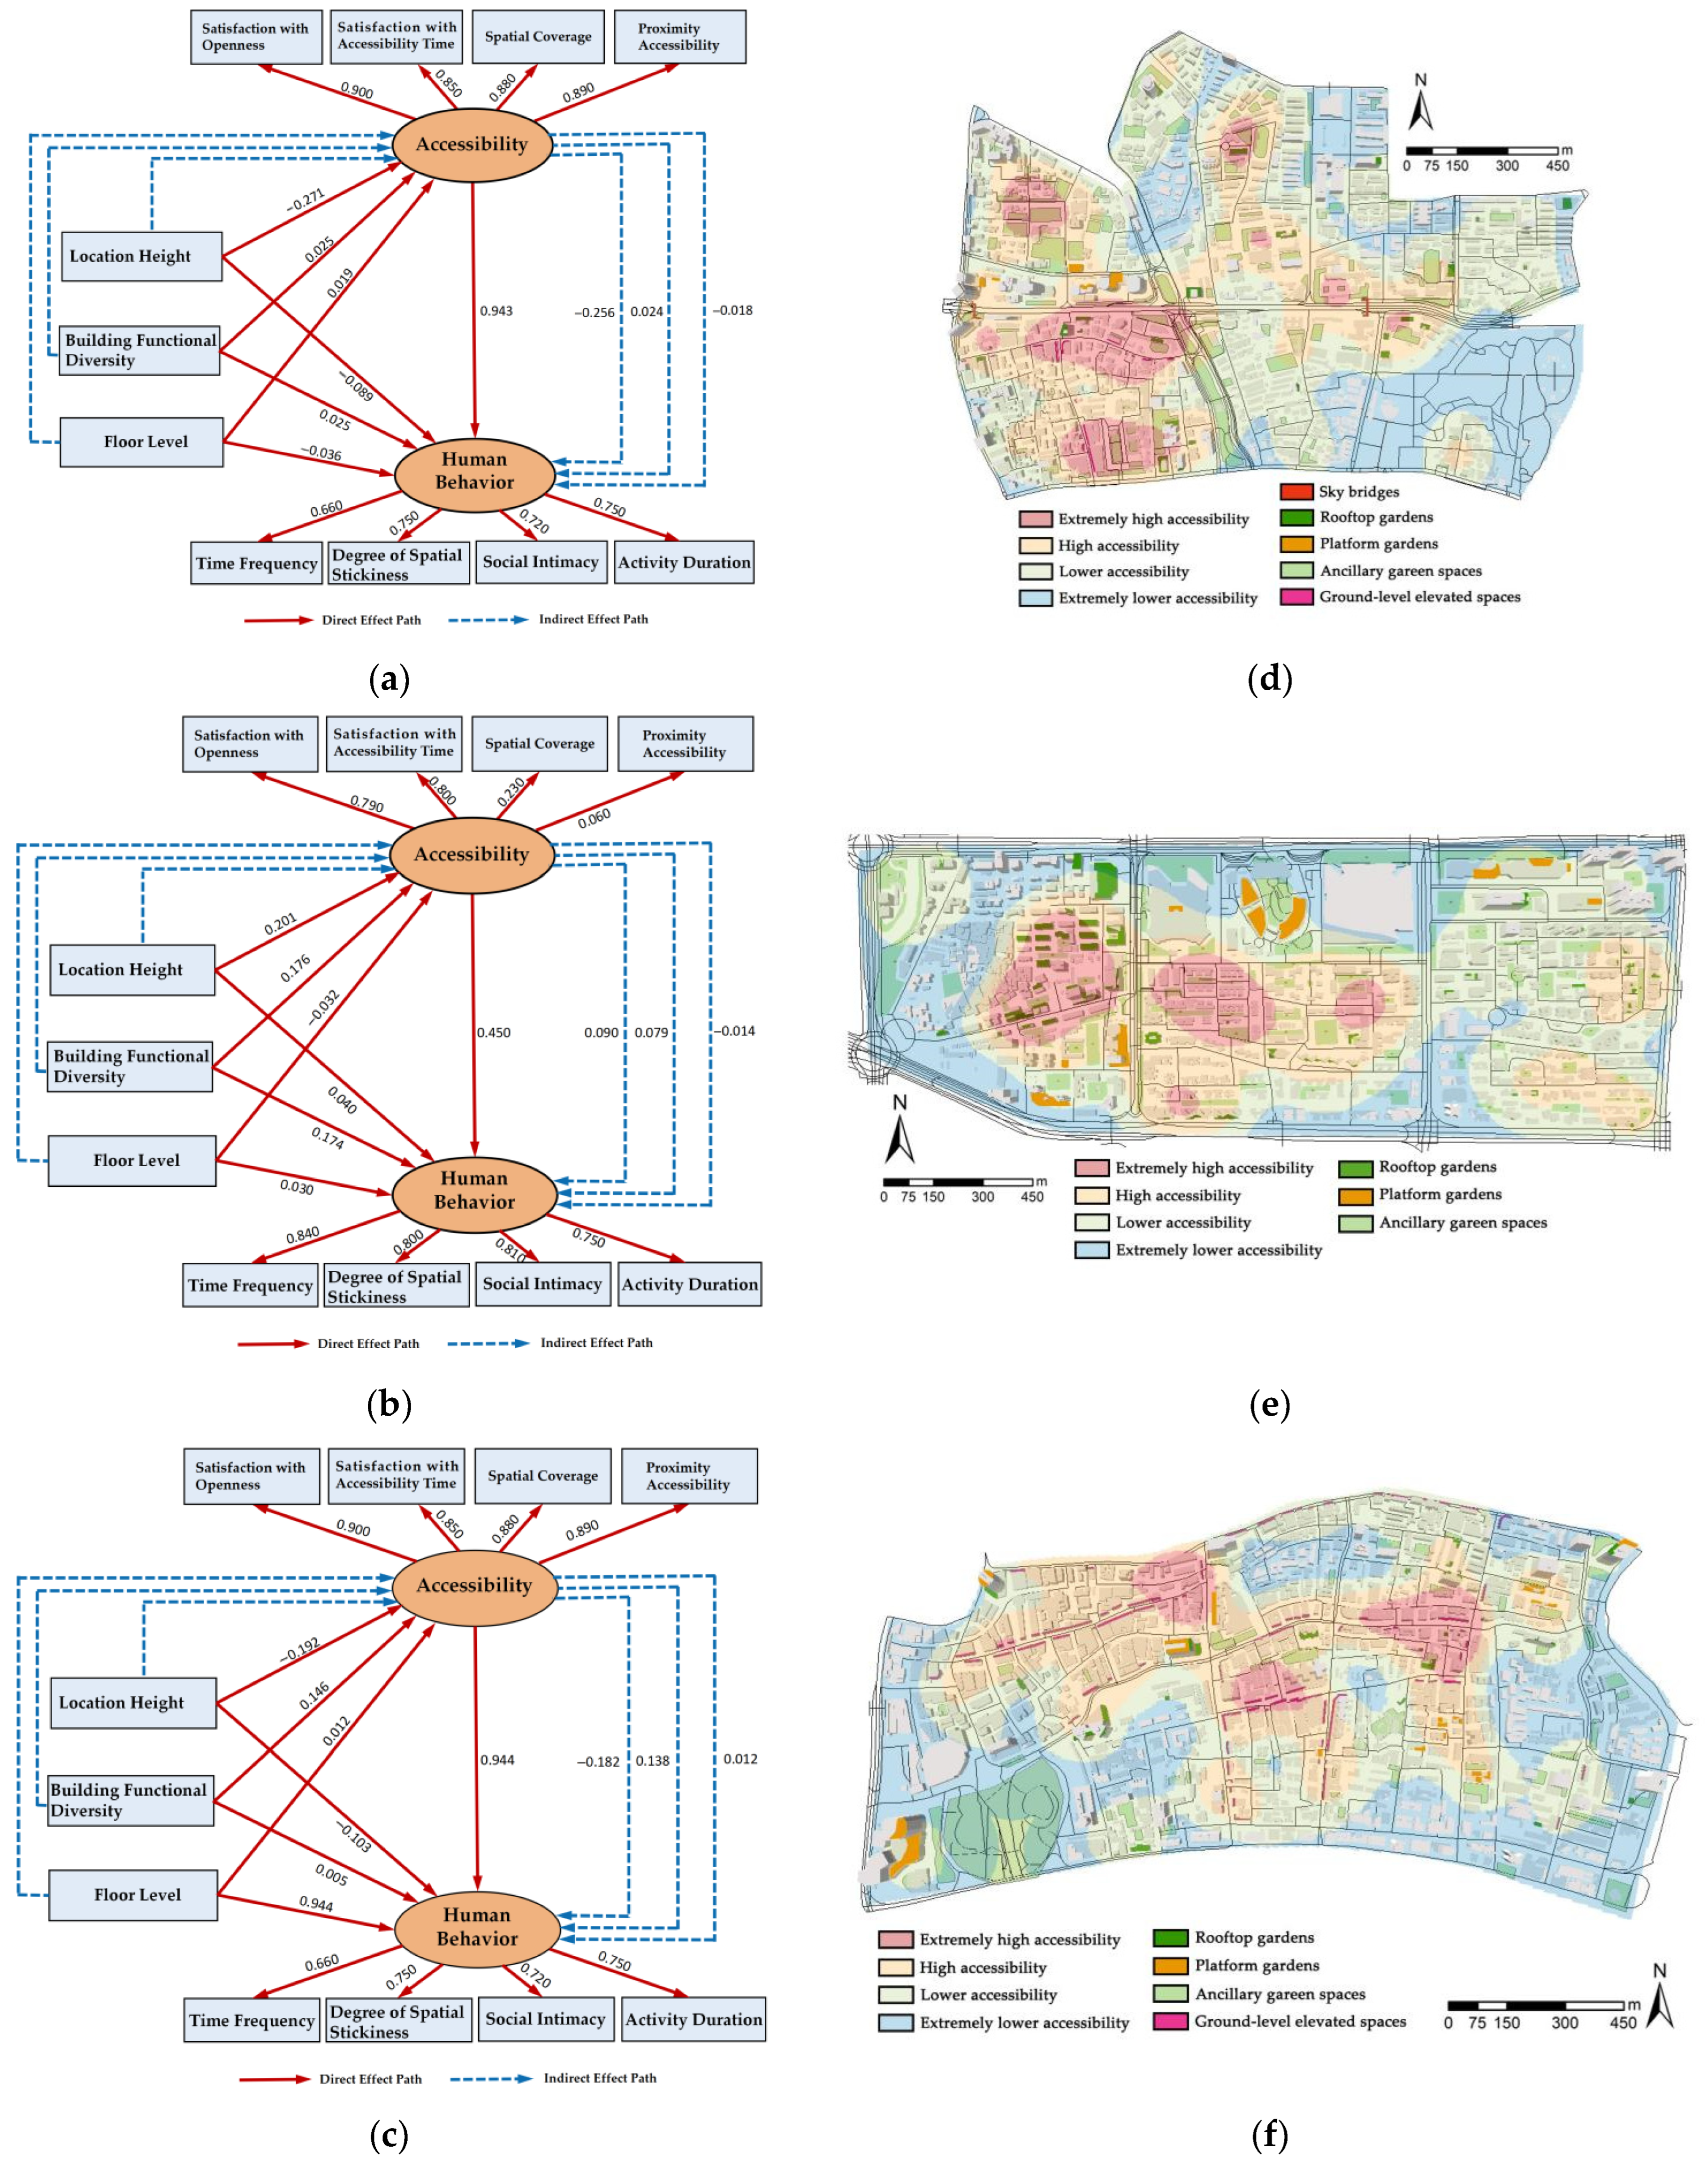
To examine how different spatial configurations within the three-dimensional built environment influenced human behavior, this study conducted a cluster analysis based on floor level, building density and functional diversity. This analysis identified three typical three-dimensional spatial types: spatial type 1 (institutional residential compound), spatial type 2 (high-rise urban housing complex), and spatial type 3 (commercial-residential mixed-use complex). The fit indices for all three models reached acceptable levels (CFI: 0.897–0.952; RMSEA: 0.083–0.091), indicating that the models effectively explain the three-dimensional structural dynamics (Figure 5). Furthermore, to visually assess how built environments affect pedestrian accessibility in three representative neighborhoods, this study generated kernel density maps (Figure 5) using OD matrix data. Raw data are presented in Appendix A Table A3.
In this research, based on the distinct characteristics observed during field surveys, three representative neighborhoods were selected to analyze specific affiliated open space typologies: Shahe Street (Institutional residential compound), Liuyun Community (High-rise urban housing complex), and Beijing Road (Commercial-residential mixed-use complex). This study further investigates the significant heterogeneity of “walking accessibility” within these three-dimensional contexts. From a 3D perspective, the influence mechanisms across the three spatial typologies exhibit marked differentiation, particularly regarding the effects of the vertical dimension:
Institutional residential compound (Space type 1): floor level exerted a significant negative direct effect on accessibility (Effect value = −0.271, p < 0.01) indicating that three-dimensional accessibility declines as vertical height increases and produced a significant negative indirect effect (Effect value = −0.256, p < 0.01) on usage, thereby inhibiting residents’ spatial engagement. This finding aligns with the kernel density analysis of walking accessibility in Shahe Street. The heat map reveals that high accessibility hotspots are distributed in punctiform and clustered patterns, primarily surrounding ground-level ancillary green spaces near low-rise structures. This visual pattern corroborates the statistical finding that residents’ willingness to use space diminishes with increased floor height. Additionally, the heat map indicates that zones featuring sky bridges facilitate the utilization of ancillary green spaces on both sides of the road.
High-rise urban housing complex (Space type 2): In contrast to the institutional residential compound, floor level demonstrated a significant positive influence on accessibility (Effect value = 0.201, p < 0.05), suggesting that within this specific built environment, increased height enhances spatial accessibility at the three-dimensional level. The indirect effect on human behavior was also positive (Effect value = 0.090, p < 0.05). These results imply that in districts equipped with robust vertical transportation and vertical greening amenities, vertical elevation can translate into an accessibility advantage. The kernel density analysis of Liuyun Community supports this observation; high accessibility hotspots are no longer confined to ground-level green spaces but also appear as clusters in mid-to-high-rise zones dense with rooftop gardens. This suggests that overcoming vertical physical barriers enables high-rise users to access affiliated open space resources more conveniently.
Commercial-residential mixed-use complex (Space Type 3): floor level maintained a significant negative impact on Accessibility (Effect value = −0.192, p < 0.05) and generated a negative indirect effect (Effect value = −0.182, p < 0.05). The kernel density map for Beijing Road further illustrates that high accessibility areas are distributed in linear strips around ground-level elevated spaces. This pattern is consistent with the area’s typology, characterized by low-rise commercial podiums and high-rise residential towers. As the central district of Beijing Road is a historic urban area, it features high building density but relatively low commercial floors, whereas accessibility to affiliated open spaces in the surrounding high-rise residential zones remains low, restricted by vertical distance. This spatial configuration is intrinsically linked to Beijing Road’s primary function as a commercial tourism hub serving visitors.
Furthermore, the effects of building functional diversity and building density on accessibility and human behavior did not reach statistical significance across the three typologies. This underscores that within these 3D built environments, vertical floor level is the core variable differentiating spatial efficacy. Accessibility significantly mediated the relationship between the three-dimensional built environment and human behavior in all three cases, indicating that despite differences in spatial typology, Accessibility remains the critical mechanism bridging the physical environment and human behavior.

5. Discussion

5.1. Discussion of Overall Sample Results

This study systematically elucidates the mechanisms by which built environment characteristics influence the accessibility and usage of affiliated open spaces from a three-dimensional perspective, underscoring the critical role of user floor level in shaping both Accessibility and human behavior. The results indicate that in general neighborhoods, an increase in floor level is associated with a progressive decline in accessibility, which subsequently diminishes usage intensity specifically the frequency and duration of residents’ active engagement with affiliated open spaces. Furthermore, higher building density necessitates the implementation of efficient vertical transportation systems during construction, which effectively reduces travel time to nearby open spaces. The findings also demonstrate that building functional diversity attracts larger crowds to these spaces, a conclusion that aligns with Dong (2024) regarding the relationship between functional complementarity and population mobility [74].
Accessibility to affiliated open spaces represents a composite three-dimensional construct encompassing physical distance, visual connectivity, permission hierarchies, and psychological comfort [75]. This distinction arises because, unlike traditional open spaces, AOS exhibit “temporal fragmentation and specific time-slot allocation” in usage for instance, elderly residents exercising in the morning versus young adults strolling at night. Behaviorally, these spaces rely on a “proximity, high-frequency, short-duration” model [76], making vertical transportation and three-dimensional functional integration pivotal for enhancing spatial efficacy [77]. A pertinent example is the Liuyun Community, where sky gardens have significantly mitigated the “high-rise exclusion effect,” presenting a sharp contrast to traditional open spaces that depend primarily on street networks and ground level service radii [78,79].
The three-dimensional Built Environment encompasses not only horizontal layouts but also vertical traffic connections, spatial configurations, and functional integration. Optimizing stereoscopic accessibility and advancing “Ground-Aerial” integrated design are critical pathways for elevating the service efficacy of open spaces in high-density urban districts. For instance, the Star World Center on Beijing Road optimized accessibility through sky bridges; conversely, purely residential super high-rises (e.g., Yuehai Yiguifu) suffered from a deficit in vertical amenities, transforming accessibility from a state of surplus to deficiency. This underscores the imperative for mixed-use zones to reinforce vertical integration [80].

5.2. Typical Spatial Discussion

This study selected three representative neighborhoods based on their distinct characteristics observed during field research, corresponding to three categories of AOS. Then it examines the varying user experiences these AOS provide across the three neighborhood types (Figure 6).
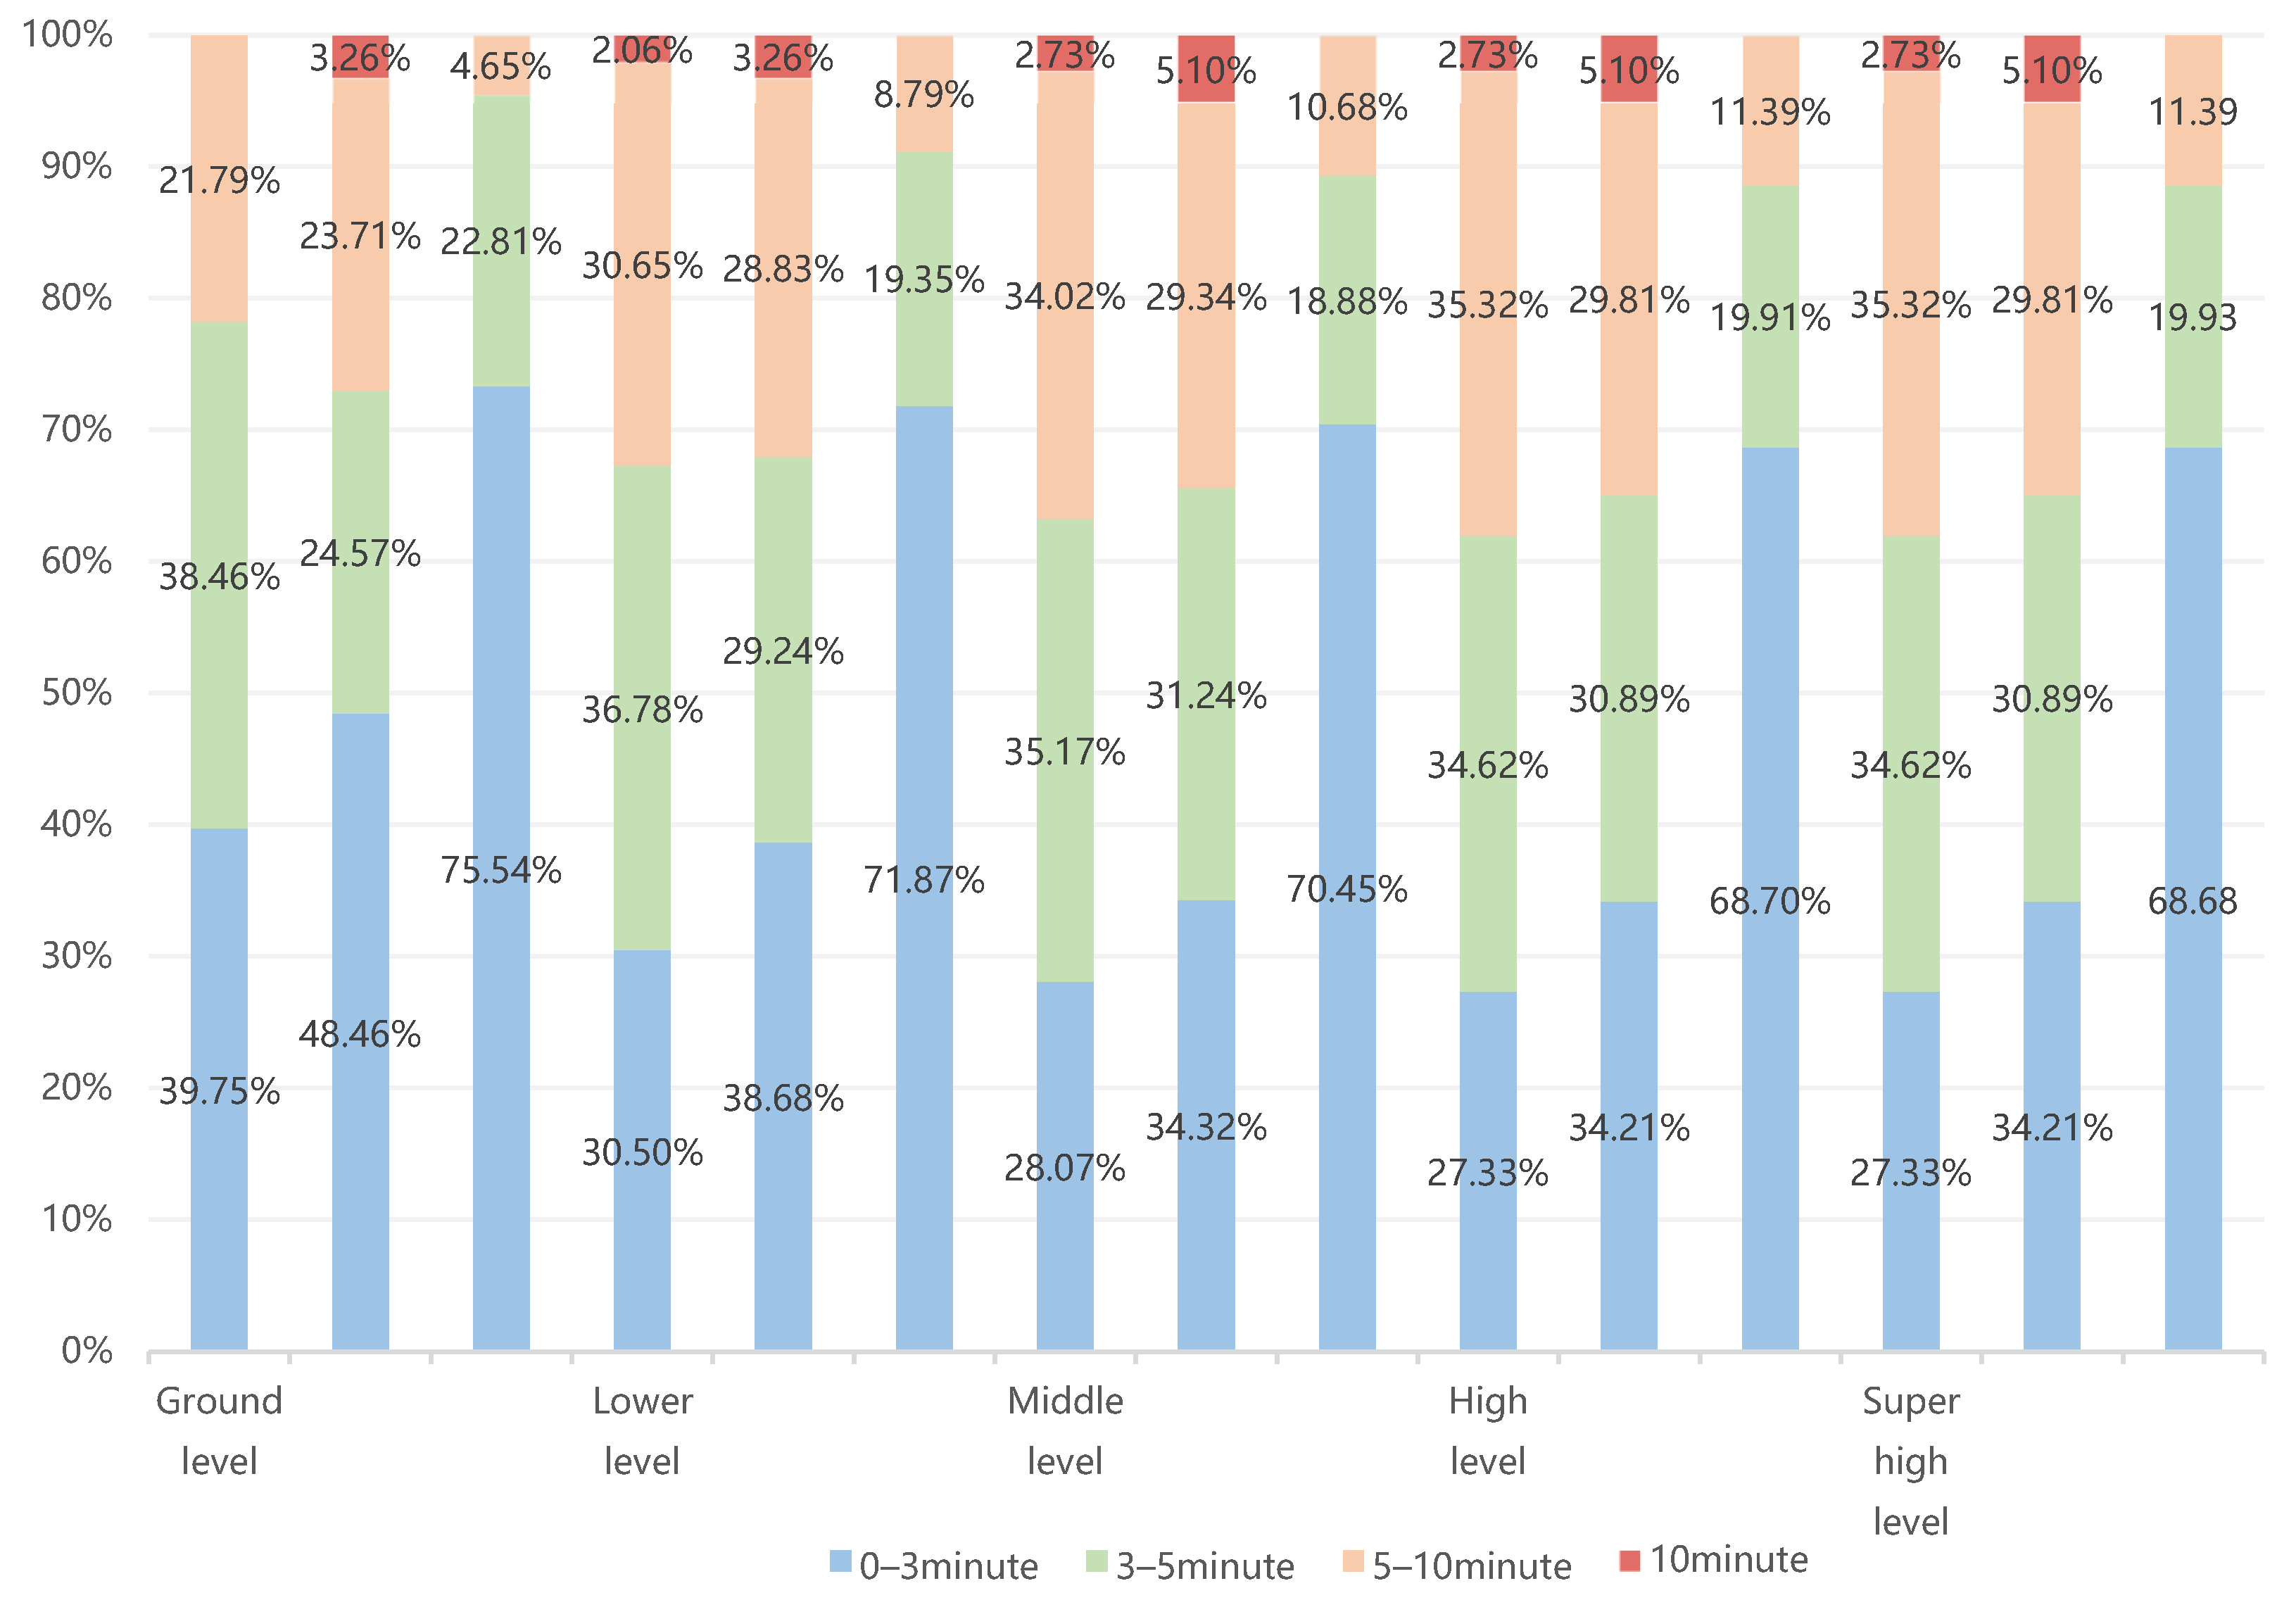
Regarding specific spatial typologies, floor level exerts significantly differentiated effects on usage and accessibility. In general blocks, as the user’s vertical position rises, both usage and accessibility typically decline. This is most evident in the Dongfeng Middle Road block (low-rise dominated): from ground level to super high-rise, 0–3 min accessibility drops from 48.46% to 34.21%, with average activity duration decreasing concurrently. Moreover, the connectivity provided by sky bridges creates clustered secondary hotspots on both sides of the road in Shahe Street’s accessibility heat map. This aligns with Jiang et al. (2022) suggesting that insufficient supply of open spaces and vertical transport in high-rise buildings compromises accessibility [81].
In contrast, within the high-rise urban housing complex (e.g., Liuyun Community), increased floor level positively correlates with accessibility. This inversion is attributed to the robust vertical transportation systems and the provision of multi-level affiliated open spaces (both aerial and ground-level) inherent to this high-rise residential typology. Stereoscopic facilities like sky gardens partially alleviate height constraints; consequently, high-rise accessibility decreased by only 3.86%, while high-frequency usage remained at 53.2%. The heat map for this typology reveals clustered hotspots around sky garden zones, visually corroborating this finding. However, in commercial residential mixed use complexes like Beijing Road, although high-intensity development offers potential aerial resources, the complexity of functional layouts, access permissions, and commercial interference ultimately reduces actual accessibility and convenience for high-rise users. This study explicitly reveals that in high-rise environments, the challenge is not merely the quantity of open spaces, but that vertical accessibility is the determinant factor affecting actual usage efficiency.
Building upon this research, the author employed the k-means clustering algorithm to analyze crowd behavior patterns in 3D AOS, identifying five distinct user groups. Corresponding strategies for optimizing accessibility have been proposed based on the characteristics of each group. Future research will delve deeper into the specific needs of these groups. The identified group characteristics are as follows:
As shown in the results of Table 6: (1) DSR (Daytime Sport fitness Retirees) concentrated between 08:00–10:00 and 15:00–17:00. Design strategies should prioritize Tai Chi plazas and chess corners, integrated with circular fitness trails and barrier-free rest zones to facilitate collective exercise and socialization. Time-slot management is recommended to prevent overcrowding. (2) MRE (Morning Recreation Elders), active during the 05:00–07:00 “morning light” period. Interventions should create tranquil healing spaces using soundproof green walls (e.g., meditation gardens), equipped with sun-oriented massage seating and herbal gardens. Soft lighting (50–100 lx) and smart reservation systems for early morning exclusivity are advised. (3) DAF (Daytime Amusement Family), active primarily on weekends (10:00–17:00). Requirements include multi-functional interactive spaces with soft-surface play areas and family gardening plots. Facilities must feature impact-absorbing protection and guardian seating. Operational adjustments, such as extending hours to 20:00 on holidays and installing stroller lanes and emergency call devices, are essential. (4) ABP (Afternoon Business-Focused Professions), characterized by short, high-frequency usage on weekdays (13:00–15:00). Sky bridges should be retrofitted with mobile office pods featuring charging ports and sound-attenuating green screens to zone business interactions. Amenities like self-service coffee stations and soundproof phone booths can support efficient 30-min breaks. (5) ESY (Evening Socializing Youth), prefer flexible usage between 19:00–22:00. Rooftop gardens should feature modular seating configurations and wireless projection zones. Ambiance can be enhanced through warm lighting and interactive light-shadow installations, while retractable awnings, night security patrols, and emergency lighting ensure safety and weather adaptability.
Management for all groups should rely on smart sensing platforms for dynamic time-sharing regulation. By integrating directional floor connections in vertical transport cores with pedestrian heat map monitoring, spatial functions can switch automatically for example, converting business pods into temporary family storage areas during off peak hours thereby maximizing the composite utilization rate of the space. Future research will delve deeper into specific group behaviors.

5.3. Research Limitations and Future Research Directions

This study acknowledges certain limitations regarding sample diversity and data collection methods, which may constrain the universality of the findings. More important, the study’s scope focused on the immediate 3D morphological features (height, density, functional mix) and their direct relationship with accessibility and behavior. Other potentially significant moderating or confounding variables, such as microclimatic conditions (e.g., wind, solar exposure at height), quality of AOS design and amenities, specific vertical circulation types (e.g., elevator efficiency, stairwell design), and detailed socio-demographic factors, were not exhaustively analyzed. Future work should incorporate these multi-layered environmental and individual factors to build a more comprehensive explanatory framework.
Nevertheless, the article systematically discusses the impact of floor level, building functional diversity, and building density on crowd human behavior and conducts a heterogeneity analysis across different spatial typologies. These contributions provide critical practical guidance for the design optimization of affiliated open spaces in high-density cities and offer flexible response schemes for urban planning.
Future research should expand the sample size of high-rise, high-density blocks to enhance the generalizability of the conclusions. Additionally, adopting multi-dimensional data collection methods, such as GPS tracking and sensor-base.

6. Conclusions

Utilizing PLS-SEM, this study systematically elucidates the intricate interaction mechanisms among built environment characteristics, spatial accessibility and residents’ human behavior within affiliated open spaces. The primary findings are as follows:
First, the floor level of a user’s floor exerts a significant negative direct influence on both the accessibility and human behavior of affiliated open spaces. This confirms that in traditional high-density contexts, vertical distance acts as an objective physical barrier to spatial engagement. Conversely, building density and functional diversity indirectly foster spatial usage by significantly enhancing accessibility, thereby mitigating the friction imposed by vertical distance.
Second, the study establishes spatial accessibility as a critical mediating variable between the built environment and residential usage behavior, with its indirect effects notably surpassing the direct influences of physical environmental factors. This finding resonates with Yang et al. (2025), who emphasize the positive role of accessibility in fostering social interaction [82].
Furthermore, the research identifies pronounced spatial heterogeneity across different urban morphologies. In institutional residential compounds and commercial-residential mixed-use complexes, increased floor level correlates with diminished accessibility, subsequently reducing time frequency and activity duration. However, in high-rise urban housing complexes equipped with optimized vertical transportation and elevated affiliated open spaces, such as sky bridges and rooftop gardens, the detrimental effects of height are effectively neutralized. This suggests that sophisticated vertical integration can convert “vertical resistance” into “vertical connectivity,” thereby enhancing the cohesion of the public realm. These results align with Choi and Wang (2025), who advocate for acknowledging the complexity of the vertical built environment in assessing residents’ spatial perceptions [83].
The findings offer significant policy and practical insights for spatial planning in high-density metropolises like Guangzhou. To optimize the utility of affiliated open spaces, planners must prioritize vertical accessibility and integration to counteract spatial exclusion driven by verticality. Future urban design, particularly in residential sectors, should incorporate robust vertical circulation systems including high-capacity elevators, escalators, and integrated sky bridge networks. Such infrastructure is essential for ensuring equitable access for residents across all floors, thereby fostering a human-centric urban environment [84] a principle synonymous with the “People’s City” concept which seeks to democratize green space access. Additionally, leveraging the synergy between functional mix and density is vital, as high-density development, when coupled with functional diversity, significantly stimulates social interaction and enhances accessibility [85]. Consequently, planning authorities should incentivize mixed-use developments that blend commercial, residential, and recreational functions to catalyze spatial vitality.
Finally, governance must shift toward differentiated, typology-based strategies, as “one-size-fits-all” approaches are often suboptimal. For complex commercial-residential mixed-use complexes, specific guidelines are required to balance public access with private management, preventing these spaces from devolving into exclusive enclaves [86]. The long-term success of affiliated open spaces hinges on rigorous place maintenance and a clear regulatory framework that defines the rights and obligations of both private owners and the public, ensuring that the vertical city remains inclusive, resilient, and responsive to the diverse needs of its inhabitants [87].

Author Contributions

Conceptualization, H.J. and Y.J.; methodology, H.J.; software, Z.L. and J.L.; validation, Z.L.; formal analysis, Z.L. and Y.X.; investigation, Y.J.; resources, Z.L.; data curation, Z.L.; writing—original draft preparation, Z.L.; writing—review and editing, H.J. and Y.J.; visualization, J.L.; supervision, H.J. and Y.J.; project administration, H.J.; funding acquisition, H.J. All authors have read and agreed to the published version of the manuscript.

Funding

This research was funded by “Supply and Demand Matching Measurement and Sharing Mechanism of Attached Open Space in Urban Built-up Area under 3D Perspective”, the National Natural Science Foundation of China (52278053); and the Discipline Co-construction Project of Guangdong Planning Office of Philosophy and Social Science (grant number GD22XSH06).

Data Availability Statement

The original contributions presented in this study are included in the article. Further inquiries can be directed to the corresponding author.

Conflicts of Interest

The authors declare no conflict of interest.

Appendix A. PLS-SEM Result Table

Table A1. Path table of influences among variables in the full sample.
Impact PathStandardized Path Coefficients95% Bootstrap Confidence Intervalp-Value
Floor Level → Accessibility−0.622[−0.659–−0.600]***
Building Function Diversity → Accessibility0.466[0.444–0.502]***
Building Density → Accessibility0.544[0.518–0.583]***
Floor Level → human behavior−0.207[−0.341–−0.070]0.005
Building Function Diversity → Human Behavior0.233[0.119–0.343]***
Building Density → Human Behavior0.181[0.056–0.304]0.006
Accessibility → Human Behavior0.593[0.391–0.796]***
Floor Level → Accessibility → Human Behavior−0.369[−0.503–−0.243]***
Building Function Diversity → Accessibility → Human Behavior0.277[0.185–0.379]***
Building Density → Accessibility → Human Behavior0.323[0.214–0.444]***
Note: *** p < 0.001. Significance levels for direct, indirect, and total effects were calculated using the bootstrap method. Sample size N = 1110. Bootstrap replicates = 5000.
Table A2. Standardized direct, indirect, and total effects among all sample variables.
Direct Effect
Floor LevelBuilding Function DiversityBuilding DensityAccessibilityHuman Behavior
Accessibility−0.622 ***0.466 ***0.544 ***
Human Behavior−0.207 **0.233 ***0.181 **0.593 ***
Proximity Accessibility 0.904 ***
Spatial Coverage 0.916 ***
Satisfaction with Accessibility Time 0.899 ***
Satisfaction with Openness 0.905 ***
Social Intimacy 0.720 ***
Degree of Spatial Stickiness 0.801 ***
Time Frequency 0.735 ***
Activity Duration 0.772 ***
Indirect Effects
Floor LevelBuilding Function DiversityBuilding DensityAccessibilityHuman Behavior
Accessibility
Human Behavior−0.369 ***0.277 ***0.323 ***
Proximity Accessibility−0.563 ***0.422 ***0.492 ***
Spatial Coverage−0.570 ***0.427 ***0.498 ***
Satisfaction with Accessibility Time−0.559 **0.419 ***0.489 ***
Satisfaction with Openness−0.563 ***0.422 ***0.493 ***
Social Intimacy−0.415 ***0.367 ***0.363 ***0.427 ***
Degree of Spatial Stickiness−0.462 ***0.408 ***0.404 ***0.475 ***
Time Frequency−0.423 ***0.374 ***0.307 ***0.436 ***
Activity Duration−0.444 ***0.393 ***0.389 ***0.458 ***
Overall Effect
Floor LevelBuilding Function DiversityBuilding DensityAccessibilityHuman Behavior
Accessibility−0.622 ***0.466 ***0.544 ***
Human Behavior−0.576 ***0.510 ***0.504 ***0.593 ***
Proximity Accessibility−0.563 ***0.422 ***0.492 ***0.904 ***
Spatial Coverage−0.570 **0.427 ***0.498 ***0.916 ***
Satisfaction with Accessibility Time−0.559 ***0.419 ***0.489 ***0.899 ***
Satisfaction with Openness−0.563 ***0.422 ***0.493 ***0.905 ***
Social Intimacy−0.415 ***0.367 ***0.363 ***0.427 ***0.720 ***
Degree of Spatial Stickiness−0.462 ***0.408 ***0.404 ***0.475 ***0.801 ***
Time Frequency−0.423 ***0.374 ***0.370 ***0.436 ***0.735 ***
Activity Duration−0.444 ***0.393 ***0.389 ***0.458 ***0.772 ***
Square Multiple Correlation SMC
Floor LevelBuilding Function DiversityBuilding Density
Accessibility0.3870.2170.296
Human Behavior0.0430.0540.033
Note: ** p < 0.01, *** p < 0.001. Significance levels for direct, indirect, and total effects were calculated using the bootstrap method. Sample size N = 1110. Bootstrap replicates = 5000.
Table A3. Standardized direct, indirect, and total effects among three spatial type variables.
Spatial Type 1 (Institutional Residential Compound)Spatial Type 2 (High-Rise Urban Housing Complex)Type 3 (Commercial-Residential Mixed-Use Complex)
AccessibilityHuman BehaviorAccessibilityHuman BehaviorAccessibilityHuman Behavior
Direct Effect
Floor Level−0.271 **0.089 +0.201 *0.0400.575−0.192 *−0.103 *
Building Function Diversity0.0250.7270.0250.3760.176 *0.174 **0.146 *0.0050.934
Building Density−0.0190.771−0.0360.531−0.0320.6650.0300.6730.0120.8250.944 *
Building Density 0.943 *** 0.448 *** 0.944 **
Human Behavior
Indirect Effect
Floor Level −0.256 ** 0.090 * −0.182 *
Building Function Diversity 0.0240.721 0.079 * 0.138 *
Building Density −0.0180.768 −0.0140.654 0.0120.826
Building Density
Human Behavior
Overall Effect
Floor Level−0.271 **−0.167 *0.201 *0.131 *−0.192 *−0.0790.336
Building Function Diversity0.0250.7270.0730.4060.176 *0.253 ***0.146 *0.143p
Building Density−0.0190.771−0.0530.527−0.0320.6650.0150.8390.0120.825−0.0900.241
Building Density 0.943 *** 0.448 *** 0.944 ***
Human Behavior
Note: + p < 0.10, * p < 0.05, ** p < 0.01, *** p < 0.001. Significance levels for direct, indirect, and total effects were calculated using the bootstrap method. Sample size N = 1110. Bootstrap replicates = 5000.

References

  1. Batty, M.; Longley, P.A. Fractal Cities: A Geometry of Form and Function; Academic Press: Cambridge, MA, USA, 1994. [Google Scholar]
  2. Zhou, Y.; Li, X.; Chen, W.; Meng, L.; Wu, Q.; Gong, P.; Seto, K.C. Satellite mapping of urban built-up heights reveals extreme infrastructure gaps and inequalities in the Global South. Proc. Natl. Acad. Sci. USA 2022, 119, e2214813119. [Google Scholar] [CrossRef]
  3. Chen, Y.; Yang, X.; Li, X.; Yang, L.; Cheng, S.; Tang, G.; Biljecki, F. Vertical 15-minute city: Modeling urban density and functional mix with multi-source geospatial data. Cities 2026, 169, 106516. [Google Scholar] [CrossRef]
  4. Liu, P.; Zhao, T.; Luo, J.; Lei, B.; Frei, M.; Miller, C.; Biljecki, F. Towards human-centric digital twins: Leveraging computer vision and graph models to predict outdoor comfort. Sustain. Cities Soc. 2023, 93, 104480. [Google Scholar] [CrossRef]
  5. Yin, L. Street level urban design qualities for walkability: Combining 2D and 3D GIS measures. Comput. Environ. Urban Syst. 2017, 64, 288–296. [Google Scholar] [CrossRef]
  6. Yue, Y.; Zhuang, Y.; Yeh, A.G.; Xie, J.Y.; Ma, C.L.; Li, Q.Q. Measurements of POI-based mixed use and their relationships with neighbourhood vibrancy. Int. J. Geogr. Inf. Sci. 2017, 31, 658–675. [Google Scholar] [CrossRef]
  7. Megahed, G.; Elshater, A.; Afifi, S.; Elrefaie, M.A. Reconceptualizing proximity measurement approaches through the urban discourse on the x-minute city. Sustainability 2024, 16, 1303. [Google Scholar] [CrossRef]
  8. Moreno, C.; Allam, Z.; Chabaud, D.; Gall, C.; Pratlong, F. Introducing the “15-Minute City”: Sustainability, resilience and place identity in future post-pandemic cities. Smart Cities 2021, 4, 93–111. [Google Scholar] [CrossRef]
  9. Sepehri, B.; Sharifi, A. X-minute cities as a growing notion of sustainable urbanism: A literature review. Cities 2025, 161, 105902. [Google Scholar] [CrossRef]
  10. Ma, L.; Shi, W.; Wu, L. Mediating roles of perceptions and visiting behavior in the relationship between urban greenspace accessibility and personal health: Evidence from Lanzhou, China. Appl. Geogr. 2023, 159, 103085. [Google Scholar] [CrossRef]
  11. Ye, P. Toward Contractual Space: Reflections on Urban Public Space in Transitional China. Archit. J. 2015, 10, 87–91. (In Chinese) [Google Scholar]
  12. Yang, X.; Sima, X.; Hong, T. An Initial Exploration of Planning Methods for Urban Public Open Space Systems: The Case of Shenzhen. Planner 2008, 24, 24–27. (In Chinese) [Google Scholar]
  13. Zhou, L. A Study on Sustainable Design Control Strategies for Public Spaces in Buildings Within the Core Area of Guangzhou’s Zhujiang New Town. Ph.D. Thesis, South China University of Technology, Guangzhou, China, 2026. (In Chinese) [Google Scholar]
  14. Mouratidis, K.; Poortinga, W. Built environment, urban vitality and social cohesion: Do vibrant neighborhoods foster strong communities? Landsc. Urban Plan. 2020, 204, 103951. [Google Scholar] [CrossRef]
  15. de Bell, S.; White, M.; Griffiths, A.; Darlow, A.; Taylor, T.; Wheeler, B.; Lovell, R. Spending time in the garden is positively associated with health and wellbeing: Results from a national survey in England. Landsc. Urban Plan. 2020, 200, 103836. [Google Scholar] [CrossRef]
  16. Zhang, S.; Zhen, F.; Kong, Y.; Lobsang, T.; Zou, S. Towards a 15-minute city: A network-based evaluation framework. Environ. Plan. B Urban Anal. City Sci. 2023, 50, 500–514. [Google Scholar] [CrossRef]
  17. Bassolas, A.; Barbosa-Filho, H.; Dickinson, B.; Dotiwalla, X.; Eastham, P.; Gallotti, R.; Ghoshal, G.; Gipson, B.; Hazarie, S.A.; Kautz, H.; et al. Hierarchical organization of urban mobility and its connection with city livability. Nat. Commun. 2019, 10, 4817. [Google Scholar] [CrossRef] [PubMed]
  18. Warren, W.H.; Falandays, J.B.; Yoshida, K.; Wirth, T.D.; Free, B.A. Human Crowds as Social Networks: Collective Dynamics of Consensus and Polarization. Perspect. Psychol. Sci. 2024, 19, 522–537. [Google Scholar] [CrossRef]
  19. Solmazer, G.; Azık, D.; Fındık, G.; Üzümcüoğlu, Y.; Ersan, Ö.; Kaçan, B.; Özkan, T.; Lajunen, T.; Öz, B.; Pashkevich, A.; et al. Cross-cultural differences in pedestrian behaviors in relation to values: A comparison of five countries. Accid. Anal. Prev. 2020, 138, 105459. [Google Scholar] [CrossRef]
  20. Homer, P.M.; Kahle, L.R. A structural equation test of the value-attitude-behavior hierarchy. J. Personal. Soc. Psychol. 1988, 54, 638. [Google Scholar] [CrossRef]
  21. Akoğul, E. The effects of cultural values and human values on food waste avoidance intention and behavior: A value, attitude, behavior perspective. Food Qual. Prefer. 2025, 138, 105838. [Google Scholar] [CrossRef]
  22. Herman, K.; Ciechanowski, L.; Przegalińska, A. Emotional well-being in urban wilderness: Assessing states of calmness and alertness in informal green spaces (IGSs) with muse—Portable EEG headband. Sustainability 2021, 13, 2212. [Google Scholar] [CrossRef]
  23. Lin, W.; Chen, Q.; Jiang, M.; Tao, J.; Liu, Z.; Zhang, X.; Wu, L.; Xu, S.; Kang, Y.; Zeng, Q. Sitting or walking? Analyzing the neural emotional indicators of urban green space behavior with mobile EEG. J. Urban Health 2020, 97, 191–203. [Google Scholar] [CrossRef]
  24. Ma, Y.; Su, N.; Tu, T. Urban public space quality evaluation methods and practices in China. Trans. Urban Data Sci. Technol. 2023, 2, 59–80. [Google Scholar] [CrossRef]
  25. Manohar, L.; Kurukkanari, C. Emotiv Cities: Understanding Human Perception of Urban Spaces—A Case from South India. In Euro-Mediterranean Conference for Environmental Integration; Springer Nature: Cham, Switzerland, 2022; pp. 1103–1105. [Google Scholar] [CrossRef]
  26. Wang, Z.; Zhao, W. Analysis of Complexity and Complex Issues in the Public Space System of Mountainous Cities in Southwest China. Chin. Landsc. Archit. 2011, 27, 58–61. (In Chinese) [Google Scholar]
  27. Jin, Y.; Gao, Y.; Shen, J. Refined Control of Green Space System Planning: A Study on the Layout of Daily Recreational Green Spaces for Residents. Chin. Landsc. Archit. 2018, 34, 112–115. (In Chinese) [Google Scholar]
  28. Shi, Y.; Zhou, L. Development and Reflection of POPS (Privately Owned Public Space) in New York City. In 2016 5th International Conference on Civil, Architectural and Hydraulic Engineering (ICCAHE 2016); Atlantis Press: Paris, France, 2016; pp. 613–616. [Google Scholar] [CrossRef]
  29. Cheng, L.; Chen, X.; Yang, S.; Cao, Z.; De Vos, J.; Witlox, F. Active travel for active ageing in China: The role of built environment. J. Transp. Geogr. 2019, 76, 142–152. [Google Scholar] [CrossRef]
  30. Elldér, E.; Haugen, K.; Vilhelmson, B. When local access matters: A detailed analysis of place, neighbourhood amenities and travel choice. Urban Stud. 2022, 59, 120–139. [Google Scholar] [CrossRef]
  31. Ewing, R.; Cervero, R. Travel and the built environment: A synthesis. Transp. Res. Rec. 2001, 1780, 87–114. [Google Scholar] [CrossRef]
  32. Ewing, R.; Cervero, R. Travel and the built environment: A meta-analysis. J. Am. Plan. Assoc. 2010, 76, 265–294. [Google Scholar] [CrossRef]
  33. Ewing, R.; Cervero, R. “Does compact development make people drive less?” The answer is yes. J. Am. Plan. Assoc. 2017, 83, 19–25. [Google Scholar] [CrossRef]
  34. Ferrer-Ortiz, C.; Marquet, O.; Mojica, L.; Vich, G. Barcelona under the 15-minute city lens: Mapping the accessibility and proximity potential based on pedestrian travel times. Smart Cities 2022, 5, 146–161. [Google Scholar] [CrossRef]
  35. Gehrke, S.R.; Wang, L. Operationalizing the neighborhood effects of the built environment on travel behavior. J. Transp. Geogr. 2020, 82, 102561. [Google Scholar] [CrossRef]
  36. Delclòs-Alió, X.; Miralles-Guasch, C. Looking at Barcelona through Jane Jacobs’s eyes: Mapping the basic conditions for urban vitality in a Mediterranean conurbation. Land Use Policy 2018, 75, 505–517. [Google Scholar] [CrossRef]
  37. Khavarian-Garmsir, A.R.; Sharifi, A.; Sadeghi, A. The 15-minute city: Urban planning and design efforts toward creating sustainable neighborhoods. Cities 2023, 132, 104101. [Google Scholar] [CrossRef]
  38. Mouratidis, K.; Yiannakou, A. COVID-19 and urban planning: Built environment, health, and well-being in Greek cities before and during the pandemic. Cities 2022, 121, 103491. [Google Scholar] [CrossRef] [PubMed]
  39. Zeng, C.; Song, Y.; He, Q.; Shen, F. Spatially explicit assessment on urban vitality: Case studies in Chicago and Wuhan. Sustain. Cities Soc. 2018, 40, 296–306. [Google Scholar] [CrossRef]
  40. Hillier, B.; Hanson, J. The Social Logic of Space; Cambridge University Press: Cambridge, UK, 1984. [Google Scholar]
  41. Hillier, B. Cities as movement economies. In Intelligent Environments; North-Holland: Amsterdam, The Netherlands, 1997; pp. 295–344. [Google Scholar] [CrossRef]
  42. Hillier, B.; Vaughan, L. The city as one thing. Prog. Plan. 2007, 67, 205–230. [Google Scholar] [CrossRef]
  43. Jacobs, J. Dark Age Ahead: Author of the Death and Life of Great American Cities; Vintage Canada: Richmond, BC, Canada, 2010. [Google Scholar]
  44. Jacobs, J. The Death and Life of Great American Cities; Random House: New York, NY, USA, 1961. [Google Scholar]
  45. Cervero, R.; Kockelman, K. Travel demand and the 3Ds: Density, diversity, and design. Transp. Res. Part D Transp. Environ. 1997, 2, 199–219. [Google Scholar] [CrossRef]
  46. Xu, H.; Jiang, Y.; Xue, T.; Wang, Z.; Fang, Y.; Huang, X. Exploring the impact of objective features and subjective perceptions of street environment on cycling preferences. Cities 2026, 168, 106434. [Google Scholar] [CrossRef]
  47. Dijst, M.; Rietveld, P.; Steg, L.; Veldstra, J.; Verhoef, E. Individual needs, opportunities and travel behaviour: A multi-disciplinary perspective based on psychology, economics and geography. In The Transport System and Transport Policy; Edward Elgar Publishing Ltd.: Cheltenham, UK, 2023; pp. 17–49. [Google Scholar]
  48. Lynch, K. The Image of the City; MIT Press: Cambridge, MA, USA, 1960. [Google Scholar]
  49. Oldenburg, R. The Great Good Place: Cafés, Coffee Shops, Community Centers, Beauty Parlors, General Stores, Bars, Hangouts, and How They Get You Through the Day; Marlowe & Company: Washington, DC, USA, 1989. [Google Scholar]
  50. Liu, Y.; Yuan, Z.; Luo, J.; Shen, Y.; Yao, X.; Xu, W. The impact of 3D urban landscapes on multidimensional human experience: An interpretable machine learning approach. Build. Environ. 2026, 293, 114320. [Google Scholar] [CrossRef]
  51. Rao, X.; Li, J.; Li, J. Multi-scale differences in landscape connectivity evaluation and protection strategies: A case study of Chongqing, China. Sci. Rep. 2025, 15, 4965. [Google Scholar] [CrossRef] [PubMed]
  52. Gachanja, J.; Yang, T. The built environment and multidimensional poverty: Exploring accessibility as a mediator of spatial opportunity. Habitat Int. 2025, 160, 103402. [Google Scholar] [CrossRef]
  53. Shan, L.; He, S. The role of peri-urban parks in enhancing urban green spaces accessibility in high-density contexts: An environmental justice perspective. Landsc. Urban Plan. 2025, 254, 105244. [Google Scholar] [CrossRef]
  54. Zhao, X.; Lu, Y.; Huang, W.; Lin, G. Assessing and interpreting perceived park accessibility, usability and attractiveness through texts and images from social media. Sustain. Cities Soc. 2024, 112, 105619. [Google Scholar] [CrossRef]
  55. Zhang, R.; Zhang, C.Q.; Lai, P.C.; Kwan, M.P. Park and neighbourhood environmental characteristics associated with park-based physical activity among children in a high-density city. Urban For. Urban Green. 2022, 68, 127479. [Google Scholar] [CrossRef]
  56. Næss, P. Built environment, causality and urban planning. Plan. Theory Pract. 2016, 17, 52–71. [Google Scholar] [CrossRef]
  57. Yang, T.; Zhang, Y. Urban systems science and cross-scale dynamics: A conceptual framework to advance integrated planning and governance. Trans. Plan. Urban Res. 2025, 4, 3–13. [Google Scholar] [CrossRef]
  58. Ospina, J.P.; Duque, J.C.; Botero-Fernández, V.; Brussel, M. Understanding the effect of sociodemographic, natural and built environment factors on cycling accessibility. J. Transp. Geogr. 2022, 102, 103386. [Google Scholar] [CrossRef]
  59. Iacono, M.; Krizek, K.J.; El-Geneidy, A. Measuring non-motorized accessibility: Issues, alternatives, and execution. J. Transp. Geogr. 2010, 18, 133–140. [Google Scholar] [CrossRef]
  60. Heinen, E.; Van Wee, B.; Maat, K. Commuting by bicycle: An overview of the literature. Transp. Rev. 2010, 30, 59–96. [Google Scholar] [CrossRef]
  61. Jiang, Z.; Wu, C.; Chung, H. The 15-minute community life circle for older people: Walkability measurement based on service accessibility and street-level built environment—A case study of suzhou, China. Cities 2025, 157, 105587. [Google Scholar] [CrossRef]
  62. Zhang, Y.; Wang, X.; Ye, Y.; Wang, L.; Zhang, Y.; Qin, W.; Chi, Y.; Liu, G.; Yao, S. Nonlinear relationships and interaction effects of urban built environment on urban vitality based on explainable machine learning. City Environ. Interact. 2025, 28, 100244. [Google Scholar] [CrossRef]
  63. Yu, P.; Chan, E.H.; Yung, E.H.; Wong, M.S.; Chen, Y. Open space fragmentation in Hong Kong’s built–up area: An integrated approach based on spatial horizontal and vertical equity lenses. Environ. Impact Assess. Rev. 2023, 102, 107174. [Google Scholar] [CrossRef]
  64. Chang, Z.; Chen, J.; Li, W.; Li, X. Public transportation and the spatial inequality of urban park accessibility: New evidence from Hong Kong. Transp. Res. Part D Transp. Environ. 2019, 76, 111–122. [Google Scholar] [CrossRef]
  65. Colbert, J.; Chuang, I.T.; Sila-Nowicka, K. Measuring spatial inequality of urban park accessibility and utilisation: A case study of public housing developments in Auckland, New Zealand. Landsc. Urban Plan. 2024, 247, 105070. [Google Scholar] [CrossRef]
  66. Zhang, R.; Sun, F.; Shen, Y.; Peng, S.; Che, Y. Accessibility of urban park benefits with different spatial coverage: Spatial and social inequity. Appl. Geogr. 2021, 135, 102555. [Google Scholar] [CrossRef]
  67. Li, Y.; Xie, Y.; Sun, S.; Hu, L. Evaluation of park accessibility based on improved gaussian two-step floating catchment area method: A case study of Xi’an city. Buildings 2022, 12, 871. [Google Scholar] [CrossRef]
  68. Liu, D.; Kwan, M.P.; Kan, Z. Analysis of urban green space accessibility and distribution inequity in the City of Chicago. Urban For. Urban Green. 2021, 59, 127029. [Google Scholar] [CrossRef]
  69. Lee, G.; Hong, I. Measuring spatial accessibility in the context of spatial disparity between demand and supply of urban park service. Landsc. Urban Plan. 2013, 119, 85–90. [Google Scholar] [CrossRef]
  70. Xie, Y.; Miao, Z.; Gu, X.; Zhang, W.; Zhen, Z.; Huang, Y. Evaluation of perceived value and behavioral intentions of citizens in chinese commercially open communities: A case study of liuyun community. Front. Archit. Res. 2024, 13, 1022–1038. [Google Scholar] [CrossRef]
  71. Mouratidis, K.; Delclòs-Alió, X. Urban vitality versus urban livability: Does vibrancy matter for neighborhood satisfaction and neighborhood happiness? Cities 2026, 168, 106473. [Google Scholar] [CrossRef]
  72. Ikotun, A.M.; Ezugwu, A.E.; Abualigah, L.; Abuhaija, B.; Heming, J. K-means clustering algorith73ms: A comprehensive review, variants analysis, and advances in the era of big data. Inf. Sci. 2023, 622, 178–210. [Google Scholar] [CrossRef]
  73. Chen, J.S.; Ching, R.K.; Lin, Y.S. An extended study of the K-means algorithm for data clustering and its applications. J. Oper. Res. Soc. 2004, 55, 976–987. [Google Scholar] [CrossRef]
  74. Ren, D.; Qiu, X.; An, Z. A Multi-Source Data-Driven Analysis of Building Functional Classification and Its Relationship with Population Distribution. Remote Sens. 2024, 16, 4492. [Google Scholar] [CrossRef]
  75. Yutian, L.U.; Running, C.H.E.N.; Bin, C.H.E.N.; Jiayu, W.U. Inclusive green environment for all? An investigation of spatial access equity of urban green space and associated socioeconomic drivers in China. Landsc. Urban Plan. 2024, 241, 104926. [Google Scholar] [CrossRef]
  76. Li, X.; Huang, Y.; Ma, X. Evaluation of the accessible urban public green space at the community scale with the consideration of temporal accessibility and quality. Ecol. Indic. 2021, 131, 108231. [Google Scholar] [CrossRef]
  77. Xue, F.; Gou, Z.; Lau, S.Y. Green open space in high-dense Asian cities: Site configurations, microclimates, and users’ perceptions. Sustain. Cities Soc. 2017, 34, 114–125. [Google Scholar] [CrossRef]
  78. Lang, W.; Chen, T.; Chan, E.H.; Yung, E.H.; Lee, T.C. Understanding livable dense urban form for shaping the landscape of community facilities in Hong Kong using fine-scale measurements. Cities 2019, 84, 34–45. [Google Scholar] [CrossRef]
  79. Wu, W.; Niu, X. Influence of built environment on urban vitality: Case study of Shanghai using mobile phone location data. J. Urban Plan. Dev. 2019, 145, 04019007. [Google Scholar] [CrossRef]
  80. Ta, N.; Zeng, Y.T.; Zhu, Q.Y.; Wu, J.Y. Analysis of the Relationship Between Built Environment and Urban Vitality in Shanghai’s Central Urban Area Based on Big Data. Geogr. Sci. 2020, 40, 60–68. (In Chinese) [Google Scholar] [CrossRef]
  81. Jiang, H.Y.; Liang, Z.C.; Xiao, X.; Wu, L.L. A Study on the Matching of Supply and Demand for Open Spaces in High-Density Urban Districts from a Three-Dimensional Perspective: The Case of Guangzhou’s Zhujiang New Town. Urban Plan. 2022, 46, 42–51. (In Chinese) [Google Scholar]
  82. Yang, J.; Zheng, S.; Wang, S.; Hao, R.; Fu, T.; He, K.; Yin, M.; Ma, W.; Xie, Q. Analysis of the impact of opening and sharing of affiliated green spaces on the accessibility and equal access of green spaces: A case study in Shanghai. Discov. Sustain. 2025, 6, 1162. [Google Scholar] [CrossRef]
  83. Choi, H.S.; Zhang, W. The way to measure and establish an emotional-based assessment of vertical urban complex. Cities 2025, 163, 106015. [Google Scholar] [CrossRef]
  84. Singapore Renewal Authority. Design Guidelines and Good Practice Guidelines for Privately Owned Public Spaces (POPS). 2017. Available online: https://www.ura.gov.sg/Corporate/Guidelines/Circulars/dc17-02 (accessed on 23 November 2025).
  85. Yu, Y. Urban Regime and POSPD Development in Hong Kong. Ph.D. Thesis, University of Illinois at Chicago, Chicago, IL, USA, 2013. Available online: https://hdl.handle.net/10027/10004 (accessed on 10 December 2025).
  86. Jansson, M.; Vogel, N.; Fors, H.; Randrup, T.B. The governance of landscape management: New approaches to urban open space development. Landsc. Res. 2019, 44, 952–965. [Google Scholar] [CrossRef]
  87. Dempsey, N.; Burton, M. Defining place-keeping: The long-term management of public spaces. Urban For. Urban Green. 2012, 11, 11–20. [Google Scholar] [CrossRef]
Figure 1. Conceptual model.
Buildings 16 01023 g001
Figure 2. Location analysis.
Buildings 16 01023 g002
Figure 3. Distribution map of AOS associated with four blocks: (a) Shahe Street; (b) Beijing Road; (c) Dongfeng Middle Road; (d) Liuyun Residential.
Buildings 16 01023 g003
Figure 4. Full-sample structural equation model diagram.
Buildings 16 01023 g004
Figure 5. Structural equation model diagram of three typical three-dimensional spatial types: (a) diagram of spatial type 1 (institutional residential compound); (b) diagram of spatial type 2 (high-rise urban housing complex); (c) diagram of spatial type 3 (commercial-residential mixed-use complex); (d) Dongfeng Middle Road nuclear density analysis map (institutional residential compound); (e) Liuyun Community nuclear density analysis map (high-rise urban housing complex); (f) Beijing Road District nuclear density analysis map (commercial-residential mixed-use complex).
Buildings 16 01023 g005
Figure 6. Accessibility Statistics of AOS in the Three Neighborhoods.
Buildings 16 01023 g006
Table 1. Statistical Summary of Social Attributes for Sample Individuals.
Socio-Economic VariablesAttributePercentage (%)Socio-Economic VariablesAttributePercentage (%)
GenderMale 43.6Education LevelHigh School or below45.9
Female56.4 Junior College20.8
Age(years)≤2929.5Bachelor’s degree28.0
30–4924.8Master’s Degree or above5.3
50–5913.8Household StructureSingle/Married (No children)30.4
≥6031.9 Married (Children 0–12)20.0
OccupationUnemployed/Retired48.3Married (Children 13–18)4.2
General Staff (Corporate)37.7Married (Children >18)45.4
Management (Corporate)5.3Housing Management TypeGated Community22.9
Public Sector/Civil Servant3.1Open-block Community71.5
Professional/Researcher1.3 Semi-open Community5.6
Other4.3Residential Floor LevelLow-rise (≤3 floors)26.2
Monthly Household Income (CNY)<500056.7Multi-story (4–10 floors)52.3
5000–10,00032.2 High-rise (10–30 floors) 20.0
>10,00011.1Super High-rise (>30 floors) 1.4
Table 2. Variable statistics table.
Variable TypeVariable NameVariable Description
Built EnvironmentBuilding function diversityBuilding function diversity (5-point scale)
floor levelBuilding floors and height (5-point scale)
Building densityThe ratio of total building floor area to total area (5-point scale)
AccessibilityProximity accessibilitySpatial distance between residents’ floor levels and adjacent AOS (5-point scale)
Spatial CoverageNumber of accessible areas within the service range of AOS from residents’ floor levels (5-point scale)
Satisfaction with Accessibility TimeResidents’ satisfaction with the time required to reach AOS (5-point scale)
Satisfaction with OpennessResidents’ satisfaction with the accessibility and ease of use of AOS (5-point scale)
Human BehaviorTime FrequencyFrequency of residents’ use of AOS (5-point scale)
Degree of Spatial StickinessResidents’ proactiveness in using AOS and intention to stay (5-point scale)
Social IntimacyResidents’ emotional connection and interaction frequency with AOS (5-point scale)
Activity DurationResidents’ activity duration in AOS (5-point scale)
Table 3. Overall open space quantity characteristics of four neighborhoods.
BlockTypeQuantity/PieceArea/m2Percentage of Block AreaBlockTypeQuantity/PieceArea/m2Percentage of Block Area
Shahe Streetrooftop gardens2814,540.841.22%Beijing Roadrooftop gardens314842.840.38%
platform gardens6736.480.06%platform gardens177298.310.57%
ancillary green spaces7062,390.485.24%sky bridges1100.020.01%
ground-level elevated spaces1605.450.05%ancillary green spaces5245,420.163.53%
Total10578,273.256.57%ground-level elevated spaces16415,826.571.23%
Shahe Streetrooftop gardens177162.670.43%Total26573,487.95.71%
platform gardens134809.590.29%Liuyun Residentialrooftop gardens8818,641.921.48%
sky bridges2747.840.04%platform gardens2314,063.661.12%
ancillary green spaces99118,758.027.10%ancillary green spaces79133,923.9510.62%
Total149133,698.468.00%Total190166,629.5313.22%
Table 4. Descriptive statistics of spatial variables across three neighborhood typologies.
Institutional Residential CompoundHigh-Rise Urban Housing ComplexCommercial-Residential Mixed-Use Complex
Sample Size254180188
Floor Level2.563.023.05
Building Density3.023.003.09
Building Functional Diversity3.003.023.07
Accessibility2.762.772.85
Table 5. Structural equation model fit tests.
Model NameCMIN/DFRMSEANFIGFICFIIFIOutcome Evaluation
Model 1 Full Sample Structural Equation Model Diagram4.7880.0780.9670.9510.9730.973Good
Model 2: Structural Equation Model Diagram of Spatial Type 1 (Institutional Residential Compound)3.2540.0830.8840.8400.9150.917Good
Model 3: Structural Equation Model Diagram of Spatial Type 2 (High-Rise Urban Housing Complex)3.0970.0910.8580.8590.8970.899Good
Model 4: Structural Equation Model Diagram of Spatial Type 3 (Commercial-Residential Mixed-Use Complex)2.5550.0840.9240.8950.9520.934Good
Note: CMIN/DF refers to the Minimum Discrepancy divided by Degrees of Freedom; RMSEA, Root Mean Square Error of Approximation; NFI, Normed Fit Index; GFI, Goodness-of-Fit Index; CFI, Comparative Fit Index; IFI, Incremental Fit Index. Model Evaluation Criteria: CMIN/DF < 3 Ideal, <5 Good; RMSEA < 0.05 Ideal, <0.10 Good; NFI > 0.9; GFI > 0.8; CFI > 0.9; IFI > 0.9.
Table 6. Characteristics of Five Typical User Groups.
User Group CodeActivity TimeActivity TypeUser TypeProportion
DSRDaytime high frequency (D)Sports and fitness activities in ancillary green spaces (S)Retired residents aged 50–59 (R)16.1%
MREMorning high frequency (M)Relaxation and recovery supported by ground-level elevated spaces (R)Elderly aged 60+ (E)25.5%
DAFDaytime medium frequency (D)Parent-child play oriented towards ancillary green spaces (A)Working parents aged 35–50 (F)14.5%
ABPAfternoon medium frequency (A)Business exchanges occurring on sky bridges (B)Full-time office workers aged 35–50 (P)8.9%
ESYEvening low frequency (E)Social leisure activities in rooftop gardens (S)Young professionals aged 25–35 (Y)35%
Disclaimer/Publisher’s Note: The statements, opinions and data contained in all publications are solely those of the individual author(s) and contributor(s) and not of MDPI and/or the editor(s). MDPI and/or the editor(s) disclaim responsibility for any injury to people or property resulting from any ideas, methods, instructions or products referred to in the content.