Article

Mechanical Strength and Toughness Performance of Seawater Sea Sand ECC with Variable Polyethylene Fiber Content and Length


1
School of Civil and Ocean Engineering, Jiangsu Ocean University, Lianyungang 222005, China
2
Lianyungang Transport Group Co., Ltd., Lianyungang 222000, China
*
Author to whom correspondence should be addressed.
Buildings 2026, 16(5), 1022; https://doi.org/10.3390/buildings16051022
Submission received: 5 February 2026 / Revised: 25 February 2026 / Accepted: 3 March 2026 / Published: 5 March 2026
(This article belongs to the Special Issue Low Carbon and Green Materials in Construction—3rd Edition)

Abstract

Seawater sea sand-engineered cementitious composites (SS-ECCs) provide a potential solution to the shortage of freshwater and sand resources for coastal and offshore construction. However, systematic studies on the combined effects of fiber parameters in SS-ECC systems remain limited. This study examines the effects of polyethylene (PE) fiber content (0%, 1%, 1.5%, and 2%) and length (12 mm, 18 mm, and 24 mm) on the mechanical properties of SS-ECC via compressive, tensile, and bending tests. The results indicate that increasing the volume fraction of PE fibers effectively enhances the tensile strength, flexural strength, and flexural toughness of SS-ECC. SS-ECC attained its highest tensile strength with a 24 mm PE fiber length, showing increases of 41.1% and 44.2% over specimens with 12 mm and 18 mm fibers, respectively. Furthermore, based on 28-day curing, the utilization of seawater and sea sand led to increases in tensile and flexural strengths by 12.3% and 17.2%, respectively, relative to ECC prepared with freshwater and river sand, though it resulted in a reduction in toughness. A predictive model for tensile strength is established considering the characteristic value of PE fiber with an R2 of 0.8461, indicating reasonable correlation within the tested range. Results from this paper can help to develop a favorable PE fiber-reinforced SS-ECC for ocean engineering.

1. Introduction

Engineered cementitious composites (ECCs) show superior tensile properties compared with ordinary concrete due to multi-crack characteristics and cracking control capability [1]. These characteristics make ECC attractive for repair and strengthening applications, particularly in marine and coastal structures where crack control and damage tolerance are essential [2].
The incorporation of fibers is the primary mechanism for imparting enhanced tensile strength, flexural strength, and ductility to ECC. Currently, polyethylene (PE), polyvinyl alcohol (PVA), and polypropylene (PP) fibers are commonly used in ECC [3]. Due to the presence of hydroxyl groups in the molecular chain, PVA fiber has hydrophilicity and forms a large bonding force with cement [4]. Therefore, when ECC cracks, PVA fibers on the fracture surface often rupture in tension, which consequently limits the material’s ductility. Both PE fiber and PP fiber belong to hydrophobic fibers. The chemical adhesion between the hydrophobic fiber and cement matrix is small, and the fiber and matrix are anchored by friction [5]. The tensile strength of PE fiber can reach three times that of PP fiber, and it is not easy to break in the ECC matrix [6]. When ECC fractures, PE fibers are primarily pulled out rather than ruptured. This behavior induces the wider cracks in PE-ECC under tensile loading, compared to PVA-ECC at the same fiber content, thereby exhibiting superior ductility [4]. Zhang et al. [7] studied the effects of fiber type (PVA and PE) and fiber content (0%, 1%, 1.5% and 2%) on the flexural properties of ECC. They found that under the same mix ratio, the flexural strength and peak deflection of ECC were 1.67–3.47 and 10.29–67.35 times that of the cement matrix, respectively. Şahmaran et al. [8] studied the effect of fly ash and PVA fiber on the frost resistance of ECC. It was found that the flexural strength of ECC was more than twice that of ECC matrix at 55% and 70% fly ash content, and ECC still showed high ductility after 300 freeze–thaw cycles. The superior mechanical properties of ECC have encouraged its exploration in various applications. Recent research has extended ECC from material-level characterization to structural-scale validation. For instance, Zhang et al. [9] demonstrated that incorporating ECC in the plastic hinge region of shear walls can significantly enhance seismic performance, including superior crack control, damage tolerance, and deformation capacity. This structural-scale evidence underscores the potential of advanced ECCs in improving structural resilience.
At present, the research on PE-ECC mainly focuses on mechanical properties [10], failure mechanism [11], and stress–strain relationship [12]. Yang et al. [13] studied the effects of PE fiber volume content (1.5%, 2%, and 2.5%) and fiber diameter (22 μm, 30 μm, 35 μm, and 40 μm) on the tensile properties of ECC. They concluded that increasing the fiber content and reducing the fiber diameter can improve the fiber-bridging effect, which helps to enhance the tensile strength and strain of ECC. Yu et al. [14] investigated the effect of PE fiber aspect ratios of 900 and 500 on the tensile properties of ECC and reported that the higher aspect ratio enhanced tensile ductility by 8% to 17%. Liu et al. [15] explored the effects of PE fiber volume content (1.75%, 2%, 2.25% and 2.5%) on the static and dynamic mechanical properties of ECC. Results showed that the volume content of PE fiber does not exceed 2%, and the static and dynamic mechanical properties of ECC improve as the fiber content increases. Excessive PE fiber content (above 2% by volume) tends to cause fiber agglomeration and uneven distribution in the ECC matrix, which in turn compromises the composite’s static and dynamic mechanical performance. Su et al. [16] studied the punching shear behavior and failure mode of ECC plates with PE fiber volume content (0%, 1%, and 2%) and span–depth ratio (1, 2, and 3). The increase in fiber volume content can effectively improve the bearing capacity and energy absorption capacity of the ECC plate. Yao et al. [12] studied the effects of fly ash/blast furnace slag weight ratio (0, 0.5, and 1), water–binder ratio (0.16, 0.18, 0.2, 0.25), and PE fiber volume content (1.6%, 1.8%, and 2%) on the mechanical properties of ECC. When the fly ash/blast furnace slag weight ratio is 0.5, it is beneficial to the compressive strength of ECC, and increasing the water–binder ratio can improve the ductility of ECC and the ability to control the crack width. When the volume content of PE fiber is 1.8%, the compressive strength, tensile strength, and strain energy of ECC reach their maximum.
Sand and gravel resources suitable for concrete construction in offshore and island areas are scarce. The research on seawater sea sand-engineered cementitious composite (SS-ECC) has great engineering prospects. Current studies have shown that seawater and sea sand can promote the hydration of cement and refine the internal structure of concrete [17,18]. Xie et al. [19] studied the strength of seawater and sea sand mortar (SSM) after high temperatures and found that the decrease in compressive strength of SSM was lower than that of flexural strength. Compared with SSM, SS-ECC has excellent energy absorption capability and toughness as a high ductility concrete [20]. Leveraging such superior tensile performance, the potential of SS-ECC to enhance the sustainability of marine and coastal infrastructure has drawn increasing attention, particularly through the use of locally available seawater and sea sand. Huang et al. [21] developed both normal-strength (compressive strength of 58 MPa, tensile strength of 5 MPa) and high-strength (compressive strength of 137 MPa, tensile strength of 8 MPa) SS-ECC, with tensile strain capacities exceeding 4%. Their results indicated that seawater and sea sand had only limited influence on the mechanical properties of ECC, further underscoring the viability of SS-ECC in marine environments. However, compared with these SS-ECC studies that mainly report on indicators of strength, tensile strain capacity, and durability, quantitative evaluations of compressive toughness together with flexural toughness under seawater–sea sand conditions remain limited. Recent investigations have provided quantitative insights into the performance of seawater and sea sand concrete. Regarding mechanical properties, Liu et al. [22] reported that seawater and sea sand concrete cured under standard conditions for 28 days exhibited compressive strength approximately 10% higher than that of ordinary concrete, although the long-term mechanical strength became comparable under extended accelerated carbonation. Lin et al. [23] found that SS-ECC reinforced with 12 mm polyethylene fibers achieved an ultimate tensile stress of 4.05 MPa and an ultimate tensile strain of 3.02%, demonstrating favorable strain-hardening behavior. In terms of durability and chloride-related performance, studies have shown that chloride-binding capacity in seawater-mixed systems can be enhanced by 40% to 70% through the incorporation of aluminum-rich supplementary cementitious materials, primarily due to the formation of Friedel’s salt and additional C-S-H adsorption [24]. Liu et al. [22] observed that the high chloride content introduced by seawater and sea sand reduced the total porosity of concrete by approximately 13% and improved pore size distribution, which may contribute to modified transport properties. Sun et al. [25] investigated the effects of carbonation on chloride-binding in mortars containing simulated marine sand and reported that bound chloride content and binding rates were initially low, then gradually increased with depth, while Friedel’s salt gradually decomposed under carbonation. The carbonation resistance of seawater and sea sand concrete has been found to be approximately twice that of ordinary concrete, though this property can be reduced by more than two-fold when fly ash or LC2 is added [22].
The toughness of concrete denotes its capacity to absorb energy and resist fracture failure prior to complete failure [7]. For marine structural members, compressive toughness is particularly relevant because it reflects resistance to brittle crushing and the ability to dissipate energy under overload, cyclic actions, and accidental impact, complementing strength-based assessment. It has been found that high-strength concrete does not always guarantee high structural strength, but high toughness is often associated with greater structural strength [26]. High-toughness materials play a crucial role in the design of structures for seismic resistance, impact resistance, and fatigue resistance [27]. Therefore, since strength and toughness are two primary mechanical properties of cement-based composites, achieving a rational balance between them and developing concrete with both high strength and high toughness represents a significant research direction [28,29,30]. While most studies on PE-fiber-reinforced SS-ECC have focused on strength [18,31], the influence on toughness has been primarily examined through flexural toughness [1]. The effect of seawater and sea sand on the compressive toughness of SS-ECC requires further investigation. Accordingly, this study places compressive toughness on the same level of emphasis as flexural toughness to provide a more complete energy absorption and damage tolerance assessment for SS-ECC.
Therefore, while the effectiveness of PE fibers in improving the mechanical properties of ECC is well-established, and the use of seawater and sea sand offers a sustainable solution for marine construction, the individual effects of key fiber parameters—specifically, fiber content and length—on the comprehensive performance of SS-ECC remain insufficiently understood. In particular, the influence of these parameters on material toughness and the potential trade-off between the enhanced strength attributed to seawater and sea sand and the resulting toughness performance require systematic investigation.
While previous studies on PE-reinforced ECC have emphasized compressive strength and flexural toughness, the coupled effects of fiber parameters on both compressive and flexural toughness of SS-ECC remain underexplored. This study systematically investigates how PE fiber volume fraction (0%, 1%, 1.5%, 2%) and length (12 mm, 18 mm, 24 mm) influence the flexural and compressive toughness of SS-ECC through qualitative analysis. Six SS-ECC mixtures were tested alongside reference groups using seawater sea sand mortar (SSM) and freshwater river sand mortar (MOR). Uniaxial compressive, uniaxial tensile, and four-point bending tests were conducted to assess mechanical performance. Additionally, a regression model incorporating the PE fiber characteristic value (volume fraction × aspect ratio) was developed to predict the tensile strength of SS-ECC. The findings provide qualitative insights into the toughness behavior of SS-ECC under varying fiber parameters, while the proposed tensile strength model offers a quantitative tool for material design. Together, these contributions support the potential application of SS-ECC in marine environments. The main novelty lies in the combined assessment framework that reports flexural toughness (toughness index/ratio and equivalent flexural toughness) together with compressive toughness (equivalent compressive toughness index) for PE-reinforced SS-ECC and clarifies the coupled roles of fiber content and length. Figure 1 illustrates the research workflow.

2. Specimen Preparation and Test Methods

2.1. Materials and Mix Proportion

The materials used in this test are as follows: P.O. 42.5 cement, limestone powder, silica fume, blast furnace slag, PE fiber, powder polycarboxylate superplasticizer, natural seawater, sea sand, and river sand. The seawater had chloride and sulfate ion concentrations of 14.0 g/L and 1.7 g/L, respectively. Meanwhile, the sea sand contained chloride and sulfate ions at levels of 0.13% and 0.03%, respectively. Detailed characterization data for the sea sand can be found in our previous work [17,19]. The water-to-binder ratio (w/b) of SS-ECC was maintained at 0.25. Prior to mixing, the PE fibers were manually disentangled to ensure their more uniform dispersion within the cementitious matrix of the SS-ECC. The PE fiber had a diameter of 25 μm, a density of 0.97 g/cm3, and a modulus of elasticity of no less than 122 GPa.
This experiment adopted PE fiber volume content of 0%, 1%, 1.5% and 2% and fiber length of 12 mm, 18 mm, and 24 mm. To compare the effect of using seawater sea sand instead of freshwater river sand on ECC, two control groups using freshwater and river sand were set up. A total of eight mix proportions were designed, as detailed in Table 1.
During ECC mixing, the cementitious materials were first dry-mixed for 3 min. Sea sand was then incorporated and mixed for another 3 min, followed by the addition of water and an additional 3 min of mixing. After a uniform mixture was obtained, the PE fibers were added gradually in small batches. Finally, mixing proceeded for a further 8 min to ensure the fibers were dispersed as evenly as possible throughout the matrix. After one day of film-covered curing in the mold, the specimens were demolded. They were then continuously cured under the same film-covering condition at room temperature for 28 days.

2.2. Specimen and Test Methods

For each mix ratio from Table 1, we poured three 70.7 mm cubes, three 100 mm × 100 mm × 300 mm prisms, three 40 mm × 40 mm × 160 mm prisms, and six 368 mm × 100 mm × 50 mm dog-bone specimens.
The cube compressive strength was determined using 70.7 mm cubic specimens, following the Chinese standard JGJ/T70-2009 [32]. The uniaxial compressive test was carried out on 100 mm × 100 mm × 300 mm prism specimens as per JC/T 2461-2018 [33], with a constant loading rate of 0.5 MPa/s.
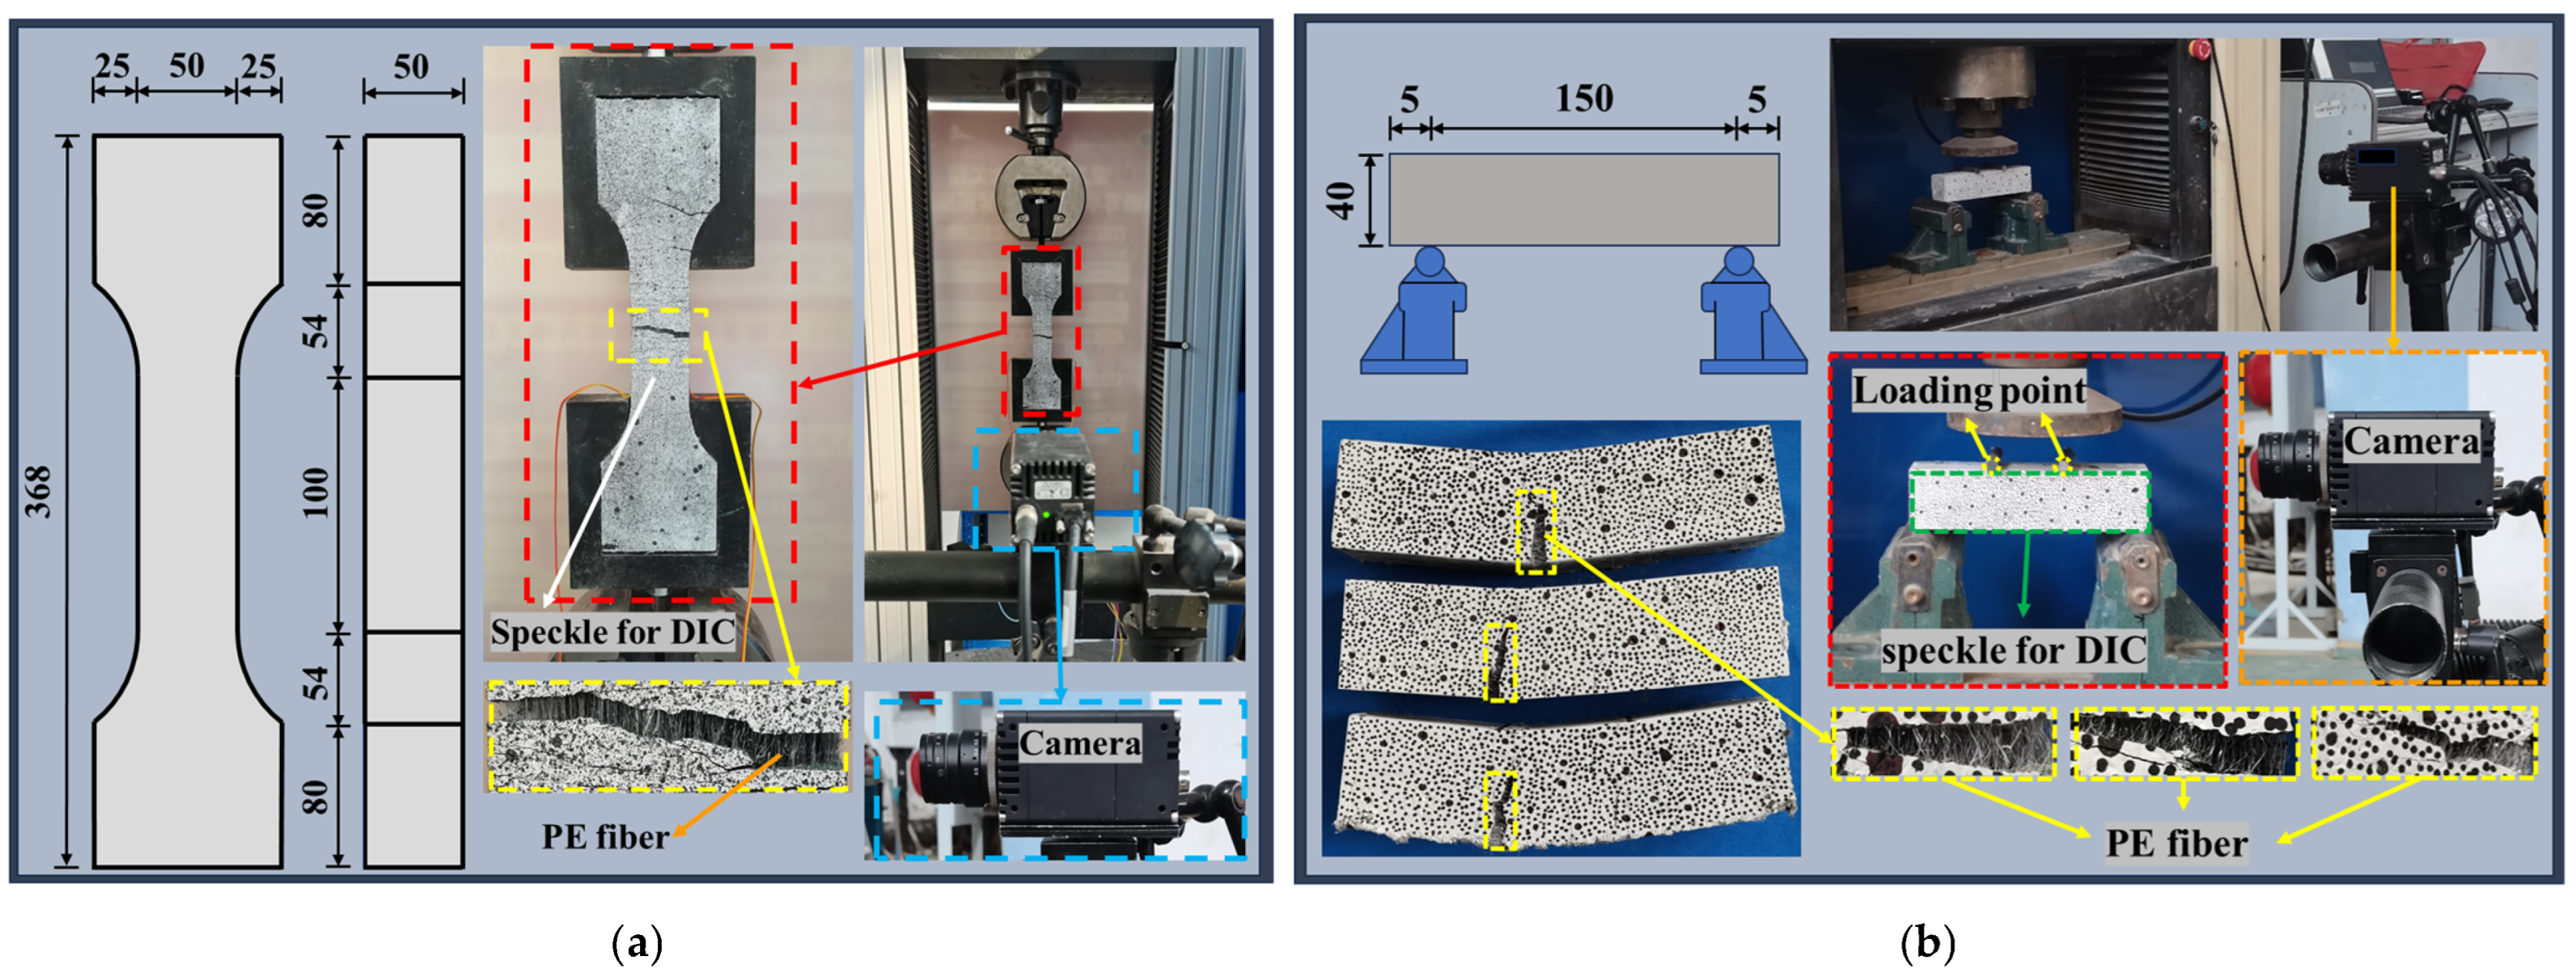
The uniaxial tensile test was conducted on 368 mm × 100 mm × 50 mm dog-bone specimens, the geometry of which is detailed in Figure 2a. The development of cracks during loading was monitored using the Digital Image Correlation (DIC) technique. According to the standard “T/CCPA 7-2018 [34]”, a displacement-controlled loading regime was employed, progressing through rates of 0.06 mm/min (pre-cracking), 0.2 mm/min (post-cracking to peak load), and 0.5 mm/min (post-peak to failure).
The four-point bending test (shown in Figure 2b) was carried out on 40 mm × 40 mm × 160 mm specimens with a 150 mm span and 50 mm shear span under displacement control at 2 mm/min. A DIC device was applied to capture specimen deflection and crack development.

3. Test Results

The mechanical properties of the SS-ECC and control group concrete are given in Table 2 with the mean and standard deviation values. As presented in Table 2, PE fibers led to varying degrees of reduction in the compressive strength and elastic modulus (Ec) of the concrete. This observation agrees with several existing studies [35].
To substantiate the observed trends, a statistical analysis was performed on the strength data. For each mixture, the number of specimens, mean, standard deviation, and coefficient of variation are reported in Table 2. Most CVs fell below 10%, indicating acceptable within-group variability. One-way ANOVA at fixed 12 mm fiber length revealed that fiber content significantly affected cube compressive strength (F2,7 = 18.23, p < 0.01), prism compressive strength (F2,6 = 18.14, p < 0.01), flexural strength (F2,6 = 165.7, p < 0.001), and tensile strength (F2,9 = 13.0, p < 0.01), while the effect on elastic modulus was not significant (p > 0.05). At fixed 1.5% fiber content, fiber length significantly influenced cube compressive strength (F2,7 = 5.71, p < 0.05), prism compressive strength (F2,7 = 9.27, p < 0.01), and tensile strength (F2,9 = 20.8, p < 0.001), but not elastic modulus or flexural strength (p > 0.05).
To strengthen the interpretation of Table 2, correlations among compressive, tensile, and flexural strengths were examined. Because the number of specimens differs across tests, the analysis was conducted using the mixture-level mean values for the five mixtures (Table 3). Pearson correlation coefficients indicate a strong positive association between tensile strength and flexural strength (r ≈ 0.90), and a moderate-to-strong association between compressive strength and flexural strength (r ≈ 0.74 using cube strength; r ≈ 0.70 using prism strength). In contrast, the correlation between compressive strength and tensile strength is weaker (r ≈ 0.37 using cube strength; r ≈ 0.29 using prism strength). These trends suggest that, within the studied SS-ECC mixtures, flexural performance is more closely aligned with tensile capacity than with compressive strength, consistent with the fiber-bridging contribution governing cracking-related responses. It should be noted that these correlations are based on five mixtures and, therefore, are intended as indicative relationships rather than universal predictive equations.
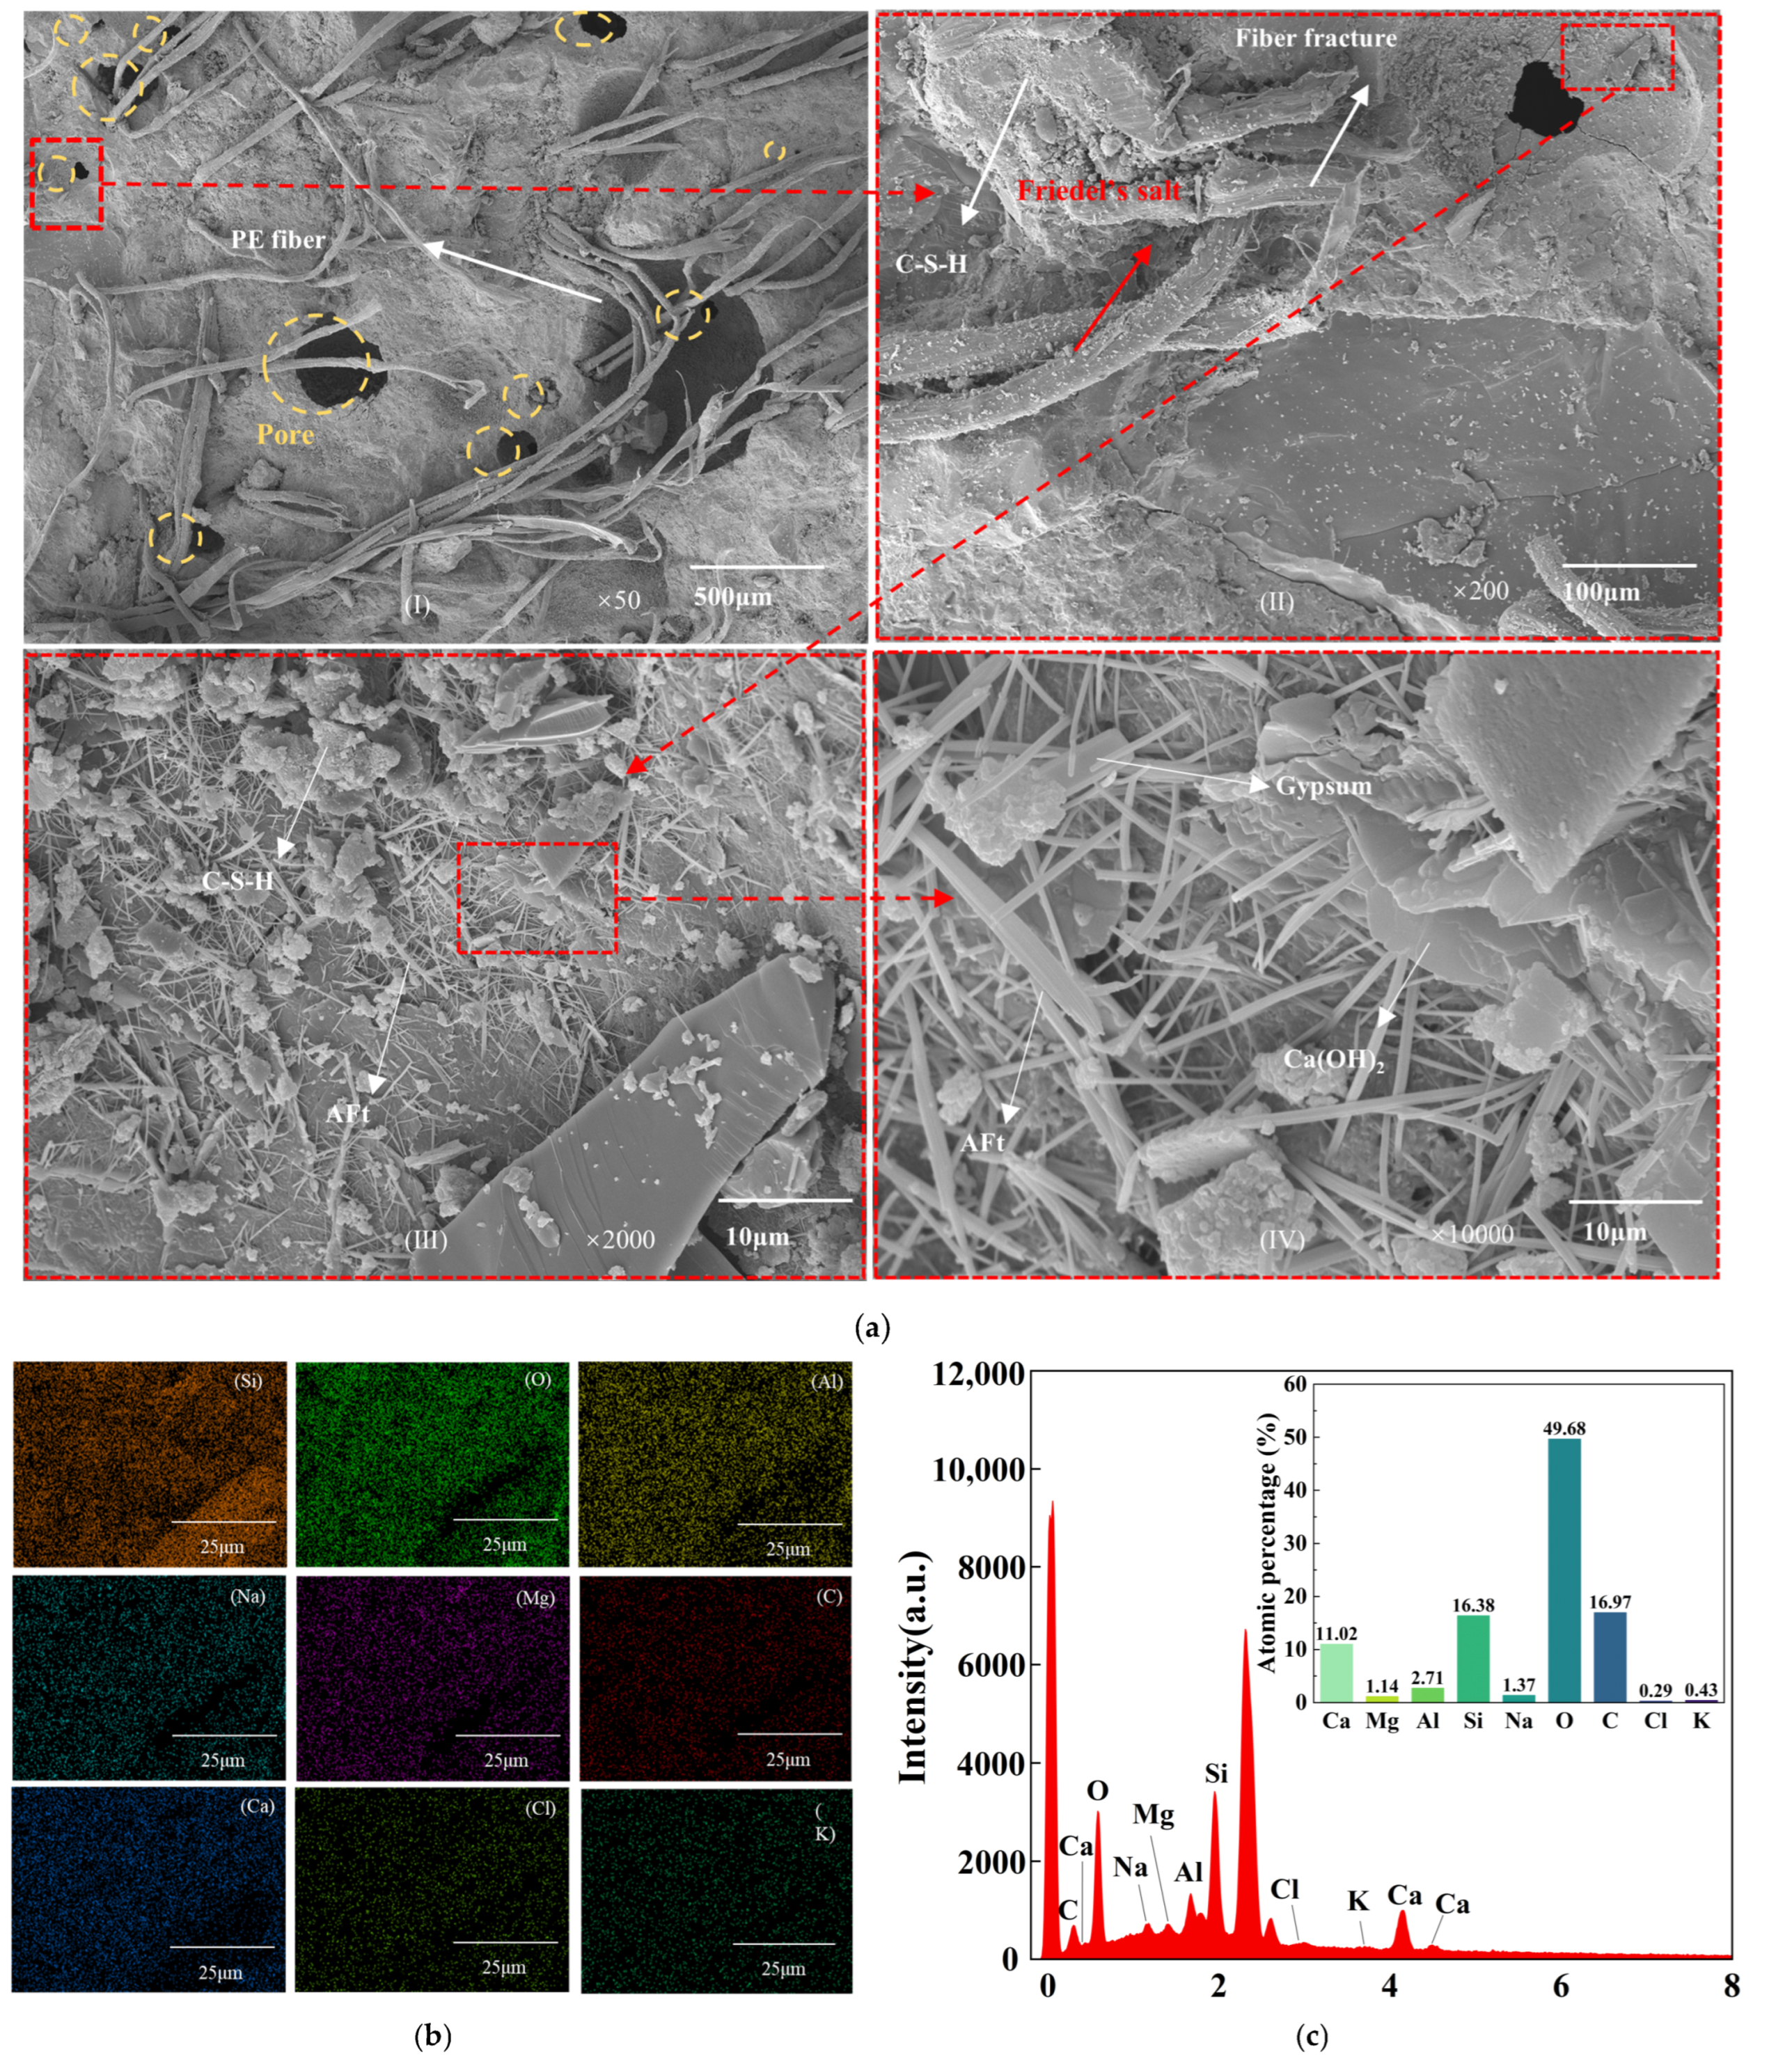
The microstructure of 1%-12-SSE is shown in Figure 3. The micrograph reveals pores of varying sizes within the SS-ECC matrix. These pores compromise the material’s compactness, thereby diminishing its compressive mechanical properties. In Figure 3, a substantial quantity of cement hydration products can be observed adhering to the surface of the PE fiber. This interfacial bonding enhances the frictional interaction between the fiber and the cementitious matrix, thereby promoting significant tensile deformation of the PE fiber under loading. Figure 3 reveals that the failure modes of PE fibers in SS-ECC are primarily fiber rupture and pull-out. This indicates that the PE fibers effectively fulfill their bridging function within the cementitious matrix, thereby enhancing the tensile and flexural strength of SS-ECC, which aligns with the results presented in Table 2. Compared to tensile rupture, the pull-out of PE fibers from the matrix enhances the ductility and crack resistance of SS-ECC to a greater extent [31].
Figure 3 reveals the presence of multiple distinct cement hydration products within the 1%-12-SSE sample. To further analyze its composition, a localized area scan of Figure 3c was conducted to determine the elemental distribution. This region exhibits elevated contents of C, O, Ca, Al, and Si, indicating the presence of substantial C-S-H gel and ettringite crystals. The concurrent detection of chloride ions suggests the possible formation of Friedel’s salt in this area. Ions from seawater and sea sand effectively promote the early hydration of cement. Furthermore, the chloride ions react with cement aluminates to form Friedel’s salt, which refines the pore structure and thereby improves the early strength of SS-ECC [18].
The microstructural observations presented herein are primarily qualitative. While SEM-EDS analysis provides valuable insight into hydration products and failure mechanisms, quantitative characterization—such as mercury intrusion porosimetry for pore structure and X-ray diffraction for phase quantification—is necessary to establish definitive correlations with mechanical performance. Accordingly, the current findings should be regarded as preliminary, meriting further quantitative investigation.

3.1. Compressive Performance of SS-ECC

3.1.1. Uniaxial Compressive Stress–Strain Response of ECC

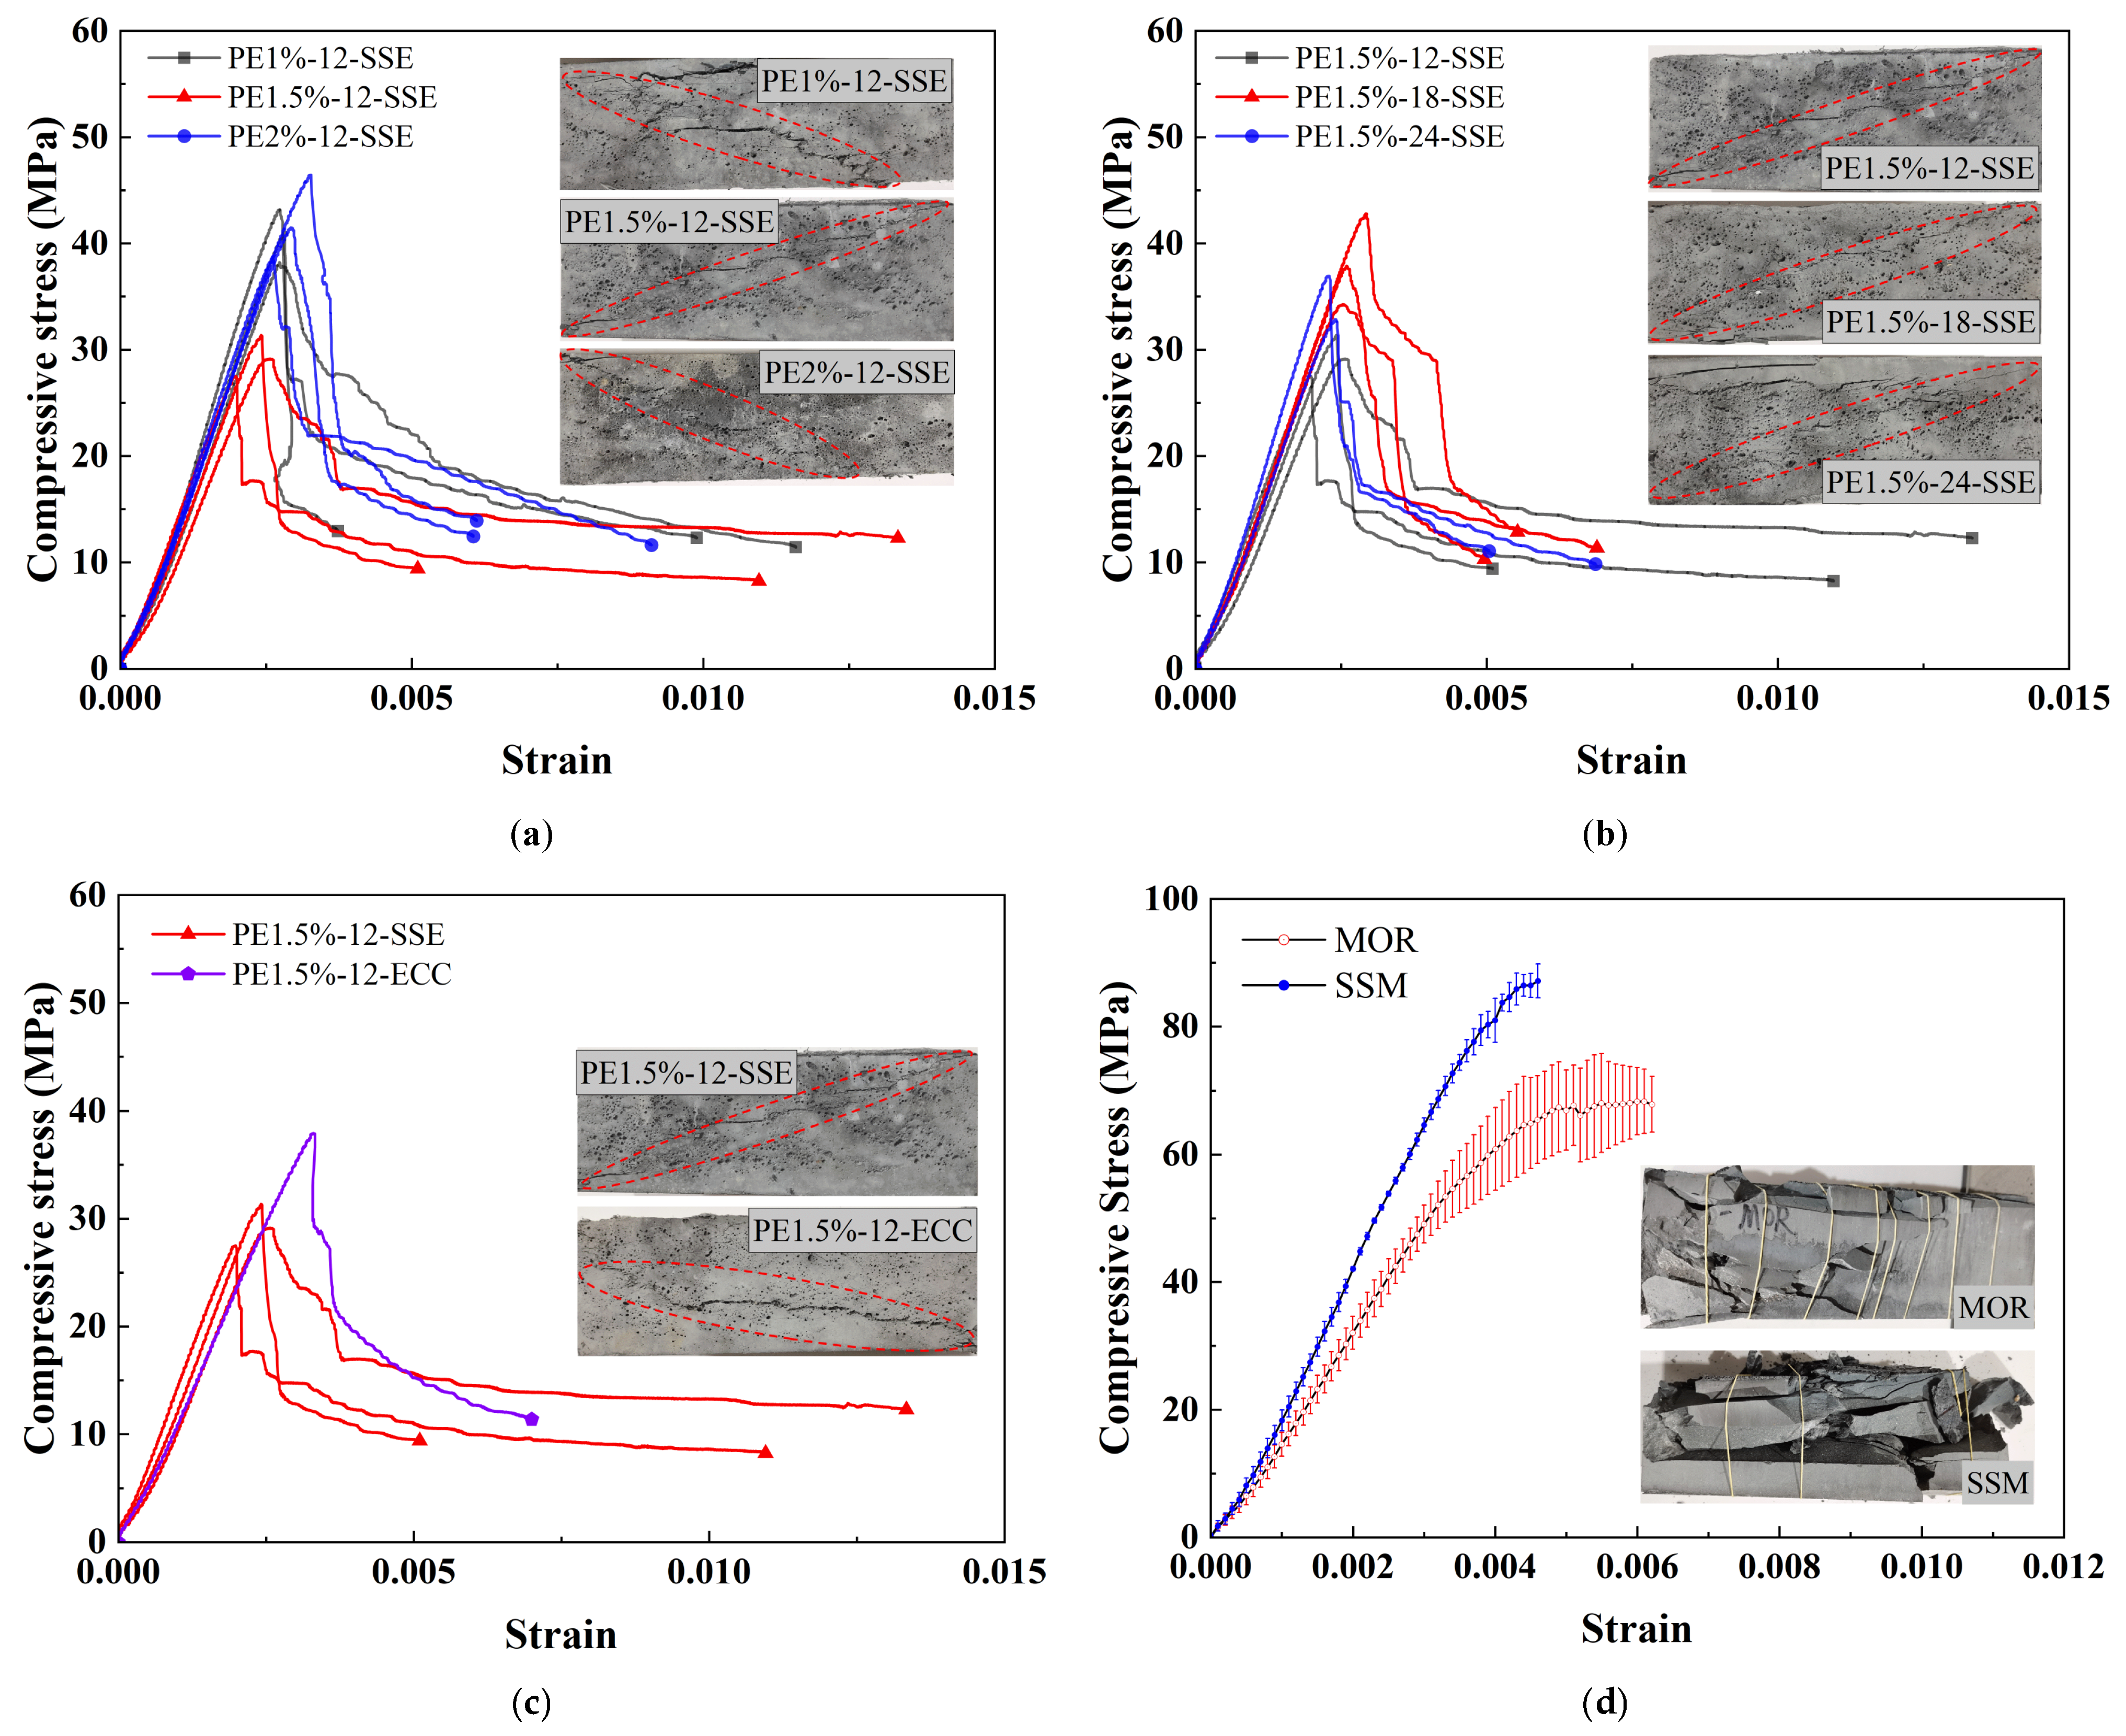
Under uniaxial compression, the SS-ECC prisms exhibited no signs of concrete spalling or crushing. After failure, the specimens experienced significant compressive deformation. The failure pattern was characterized by a distinct diagonal crack accompanied by multiple fine cracks, demonstrating a “cracked but not crushed” behavior. The failure mode of the SS-ECC prism is illustrated in Figure 4.
The stress–strain curves of ECC under uniaxial compression are shown in Figure 4. During the axial compression process of SSM and MOR concrete specimens, when cracks appear on the concrete surface, the bearing capacity of SSM and MOR decreases rapidly, and the specimens show obvious brittle failure characteristics. In the process of axial compression of ECC, when cracks appear on the surface of ECC, the bearing capacity of ECC decreases steadily after a steep drop. ECC exhibits good toughness during axial compression.
The influence of PE fiber volume fraction on the uniaxial compressive stress–strain curves of SS-ECC is shown in Figure 4a. With the increase in PE fiber volume fraction, the peak stress, peak strain, and slope of the ascending branch of the uniaxial compressive stress–strain curves of SS-ECC all exhibited a trend of initial increase followed by a decrease. The effect of PE fiber length on the uniaxial compressive stress–strain curves of SS-ECC is shown in Figure 4b. With increasing PE fiber length, both the peak stress and peak strain corresponding to the uniaxial compressive stress–strain curves of SS-ECC exhibited a trend of initial increase followed by a decrease. In contrast, the slope of the ascending branch in the uniaxial compressive stress–strain curve of SS-ECC showed a monotonic increasing trend with the increase in PE fiber length. The enhancing effect of seawater and sea sand on the uniaxial compressive stress–strain response of SS-ECC is depicted in Figure 4c, manifested by a steeper slope of the curve compared to the control mix.
For the purpose of modeling the ascending segment under varying PE fiber parameters, this paper presents a normalization of the uniaxial compressive stress–strain data obtained from tests. Three uniaxial compression stress–strain models were used to fit the uniaxial compression data. The results are shown in Table 4. The obtained R2 for each model is higher than 0.97, and the three stress–strain models can accurately fit the data in this paper. However, it should be noted that these models are primarily applicable to the ascending branch of the stress–strain curve. The post-peak descending branch, which is critical for understanding ductility and energy dissipation capacity, exhibits complex behavior that depends on fiber parameters, matrix composition, and loading conditions. Currently, no established constitutive model adequately captures the post-peak response of SS-ECC, and this remains an important direction for future research.

3.1.2. Compressive Strength and Elastic Modulus of ECC

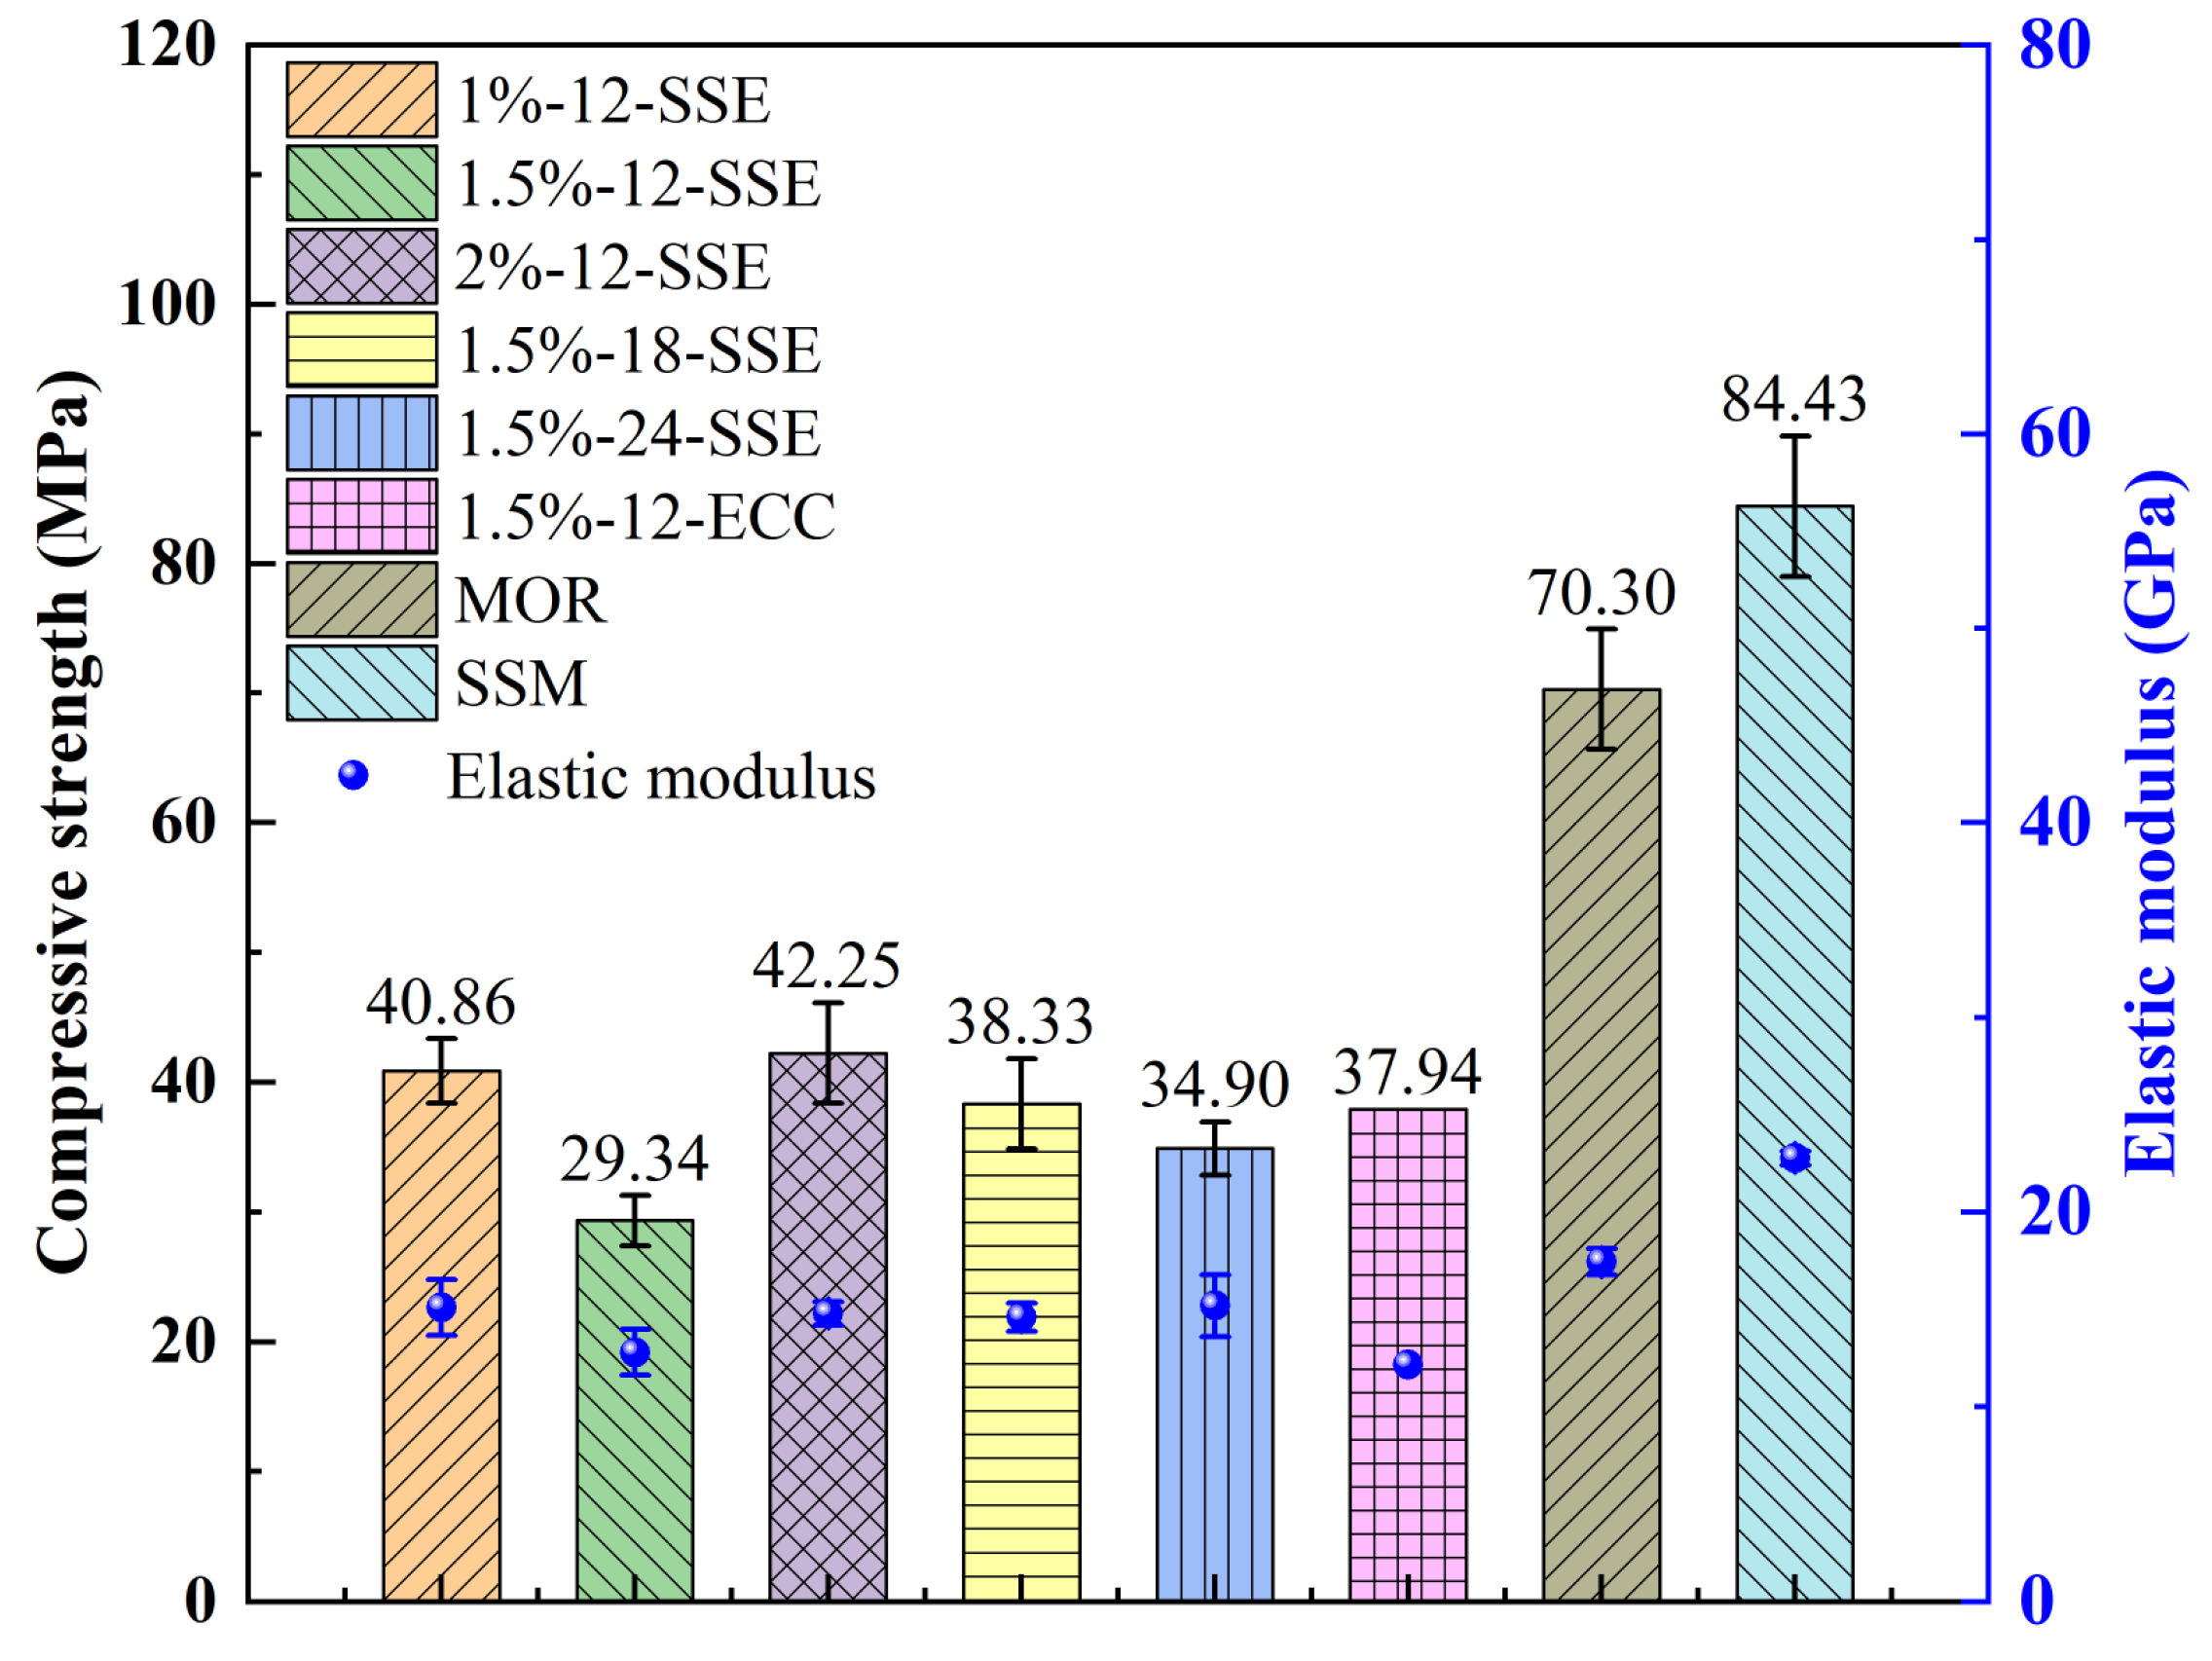
The compressive strength and elastic modulus of ECC are shown in Table 2 and Figure 5. The compressive strength and elastic modulus of ECC initially decrease and then increase with PE fiber content from 0% to 2%. At content below 1.5%, the detrimental effect of fiber-induced defects outweighed the benefits of fiber-bridging. When the PE fiber content was above 1.5%, the fiber-bridging effect outweighed the adverse effects of defects such as porosity, thus governing the axial compressive response of ECC. Understanding the compressive behavior involves balancing the trade-off between fiber-induced defects and fiber-bridging. Adding PE fibers often creates additional interfacial zones and may increase air entrainment during mixing, leading to higher porosity. These defects act as stress concentrators that can initiate micro-cracking under compression, while fibers simultaneously provide confining effects across crack faces and inhibit crack growth.
The effect of PE fiber length on the compressive strength and elastic modulus of ECC is shown in Table 2. The compressive strength showed a non-monotonic response, reaching its maximum at 18 mm as the length increased from 12 mm to 24 mm. In contrast, the elastic modulus gradually increased with fiber length. This length-dependent behavior can be attributed to the competing effects of fiber anchorage and fiber dispersion. Longer fibers provide better anchorage within the matrix, enhancing bridging efficiency, but may also lead to fiber bundling and non-uniform dispersion, creating weak zones that reduce compressive strength. The intermediate length of 18 mm appears to offer the optimal balance between these competing factors.
Data in Figure 5 reveal a 20.1% higher compressive strength for SSM over MOR, and a 30.6% higher elastic modulus. With the addition of PE fibers, the compressive strength of 1.5%-12-SSE was 22.7% lower than that of 1.5%-12-ECC. This decrease is potentially linked to PE fiber hydrophobicity [39]. Overall, PE fibers caused varying reductions in both compressive strength and elastic modulus. SS-ECC offers enhanced ductility and a “cracked but not crushed” failure mode, though at the cost of some compressive strength—a trade-off with key implications for marine structures. In elements such as coastal bridge piers, piles, and beam–column connections, improved deformation capacity and energy dissipation can enhance seismic resilience and impact resistance. Its ability to maintain post-cracking integrity also makes it attractive for protective jacketing of existing marine structures, providing corrosion resistance and confinement to conventional concrete. However, the reduction in compressive strength may limit its use as a primary load-bearing material in heavily compressed members. In such cases, SS-ECC can be strategically placed in plastic hinge regions or used in combination with conventional concrete to leverage its ductility where needed without compromising overall structural capacity. It is worth noting that the SS-ECC developed in this study still reaches an axial compressive strength of 29.34 MPa, indicating it retains a meaningful load-bearing capability.

3.2. Uniaxial Tension Test Results of SS-ECC

3.2.1. Uniaxial Tensile Stress–Strain Response of ECC

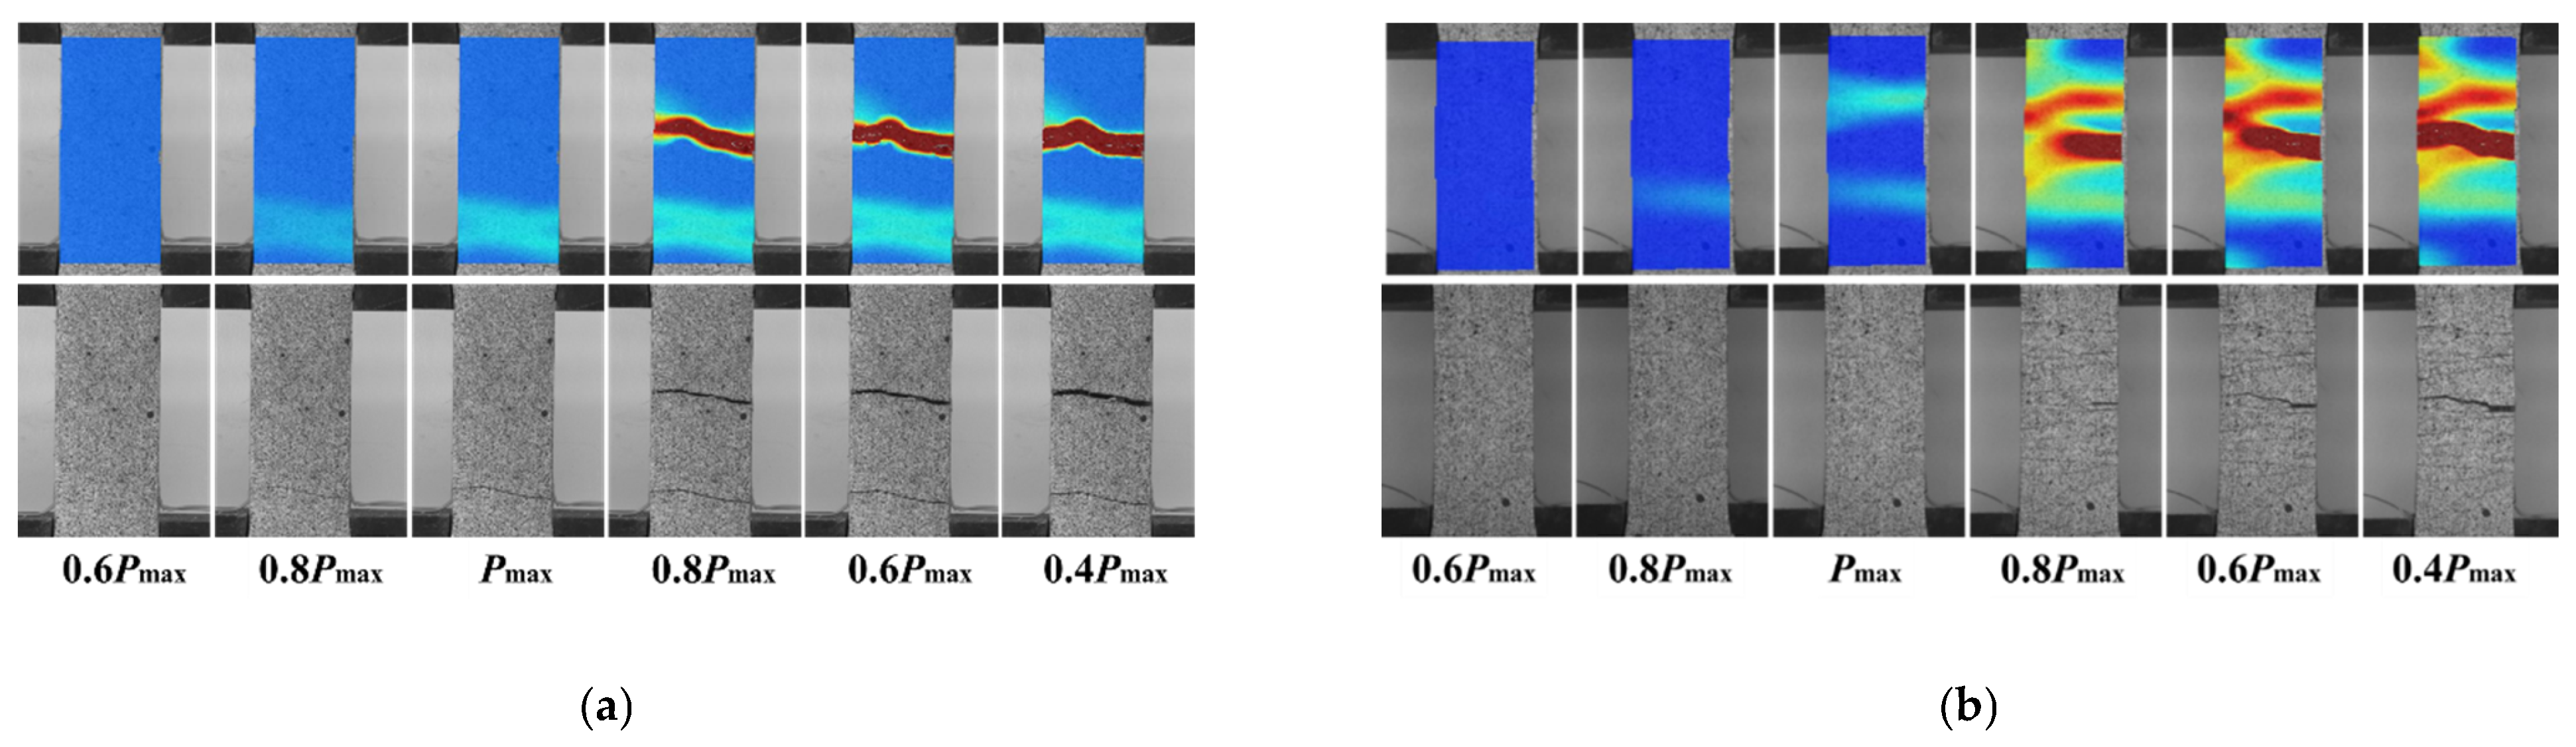
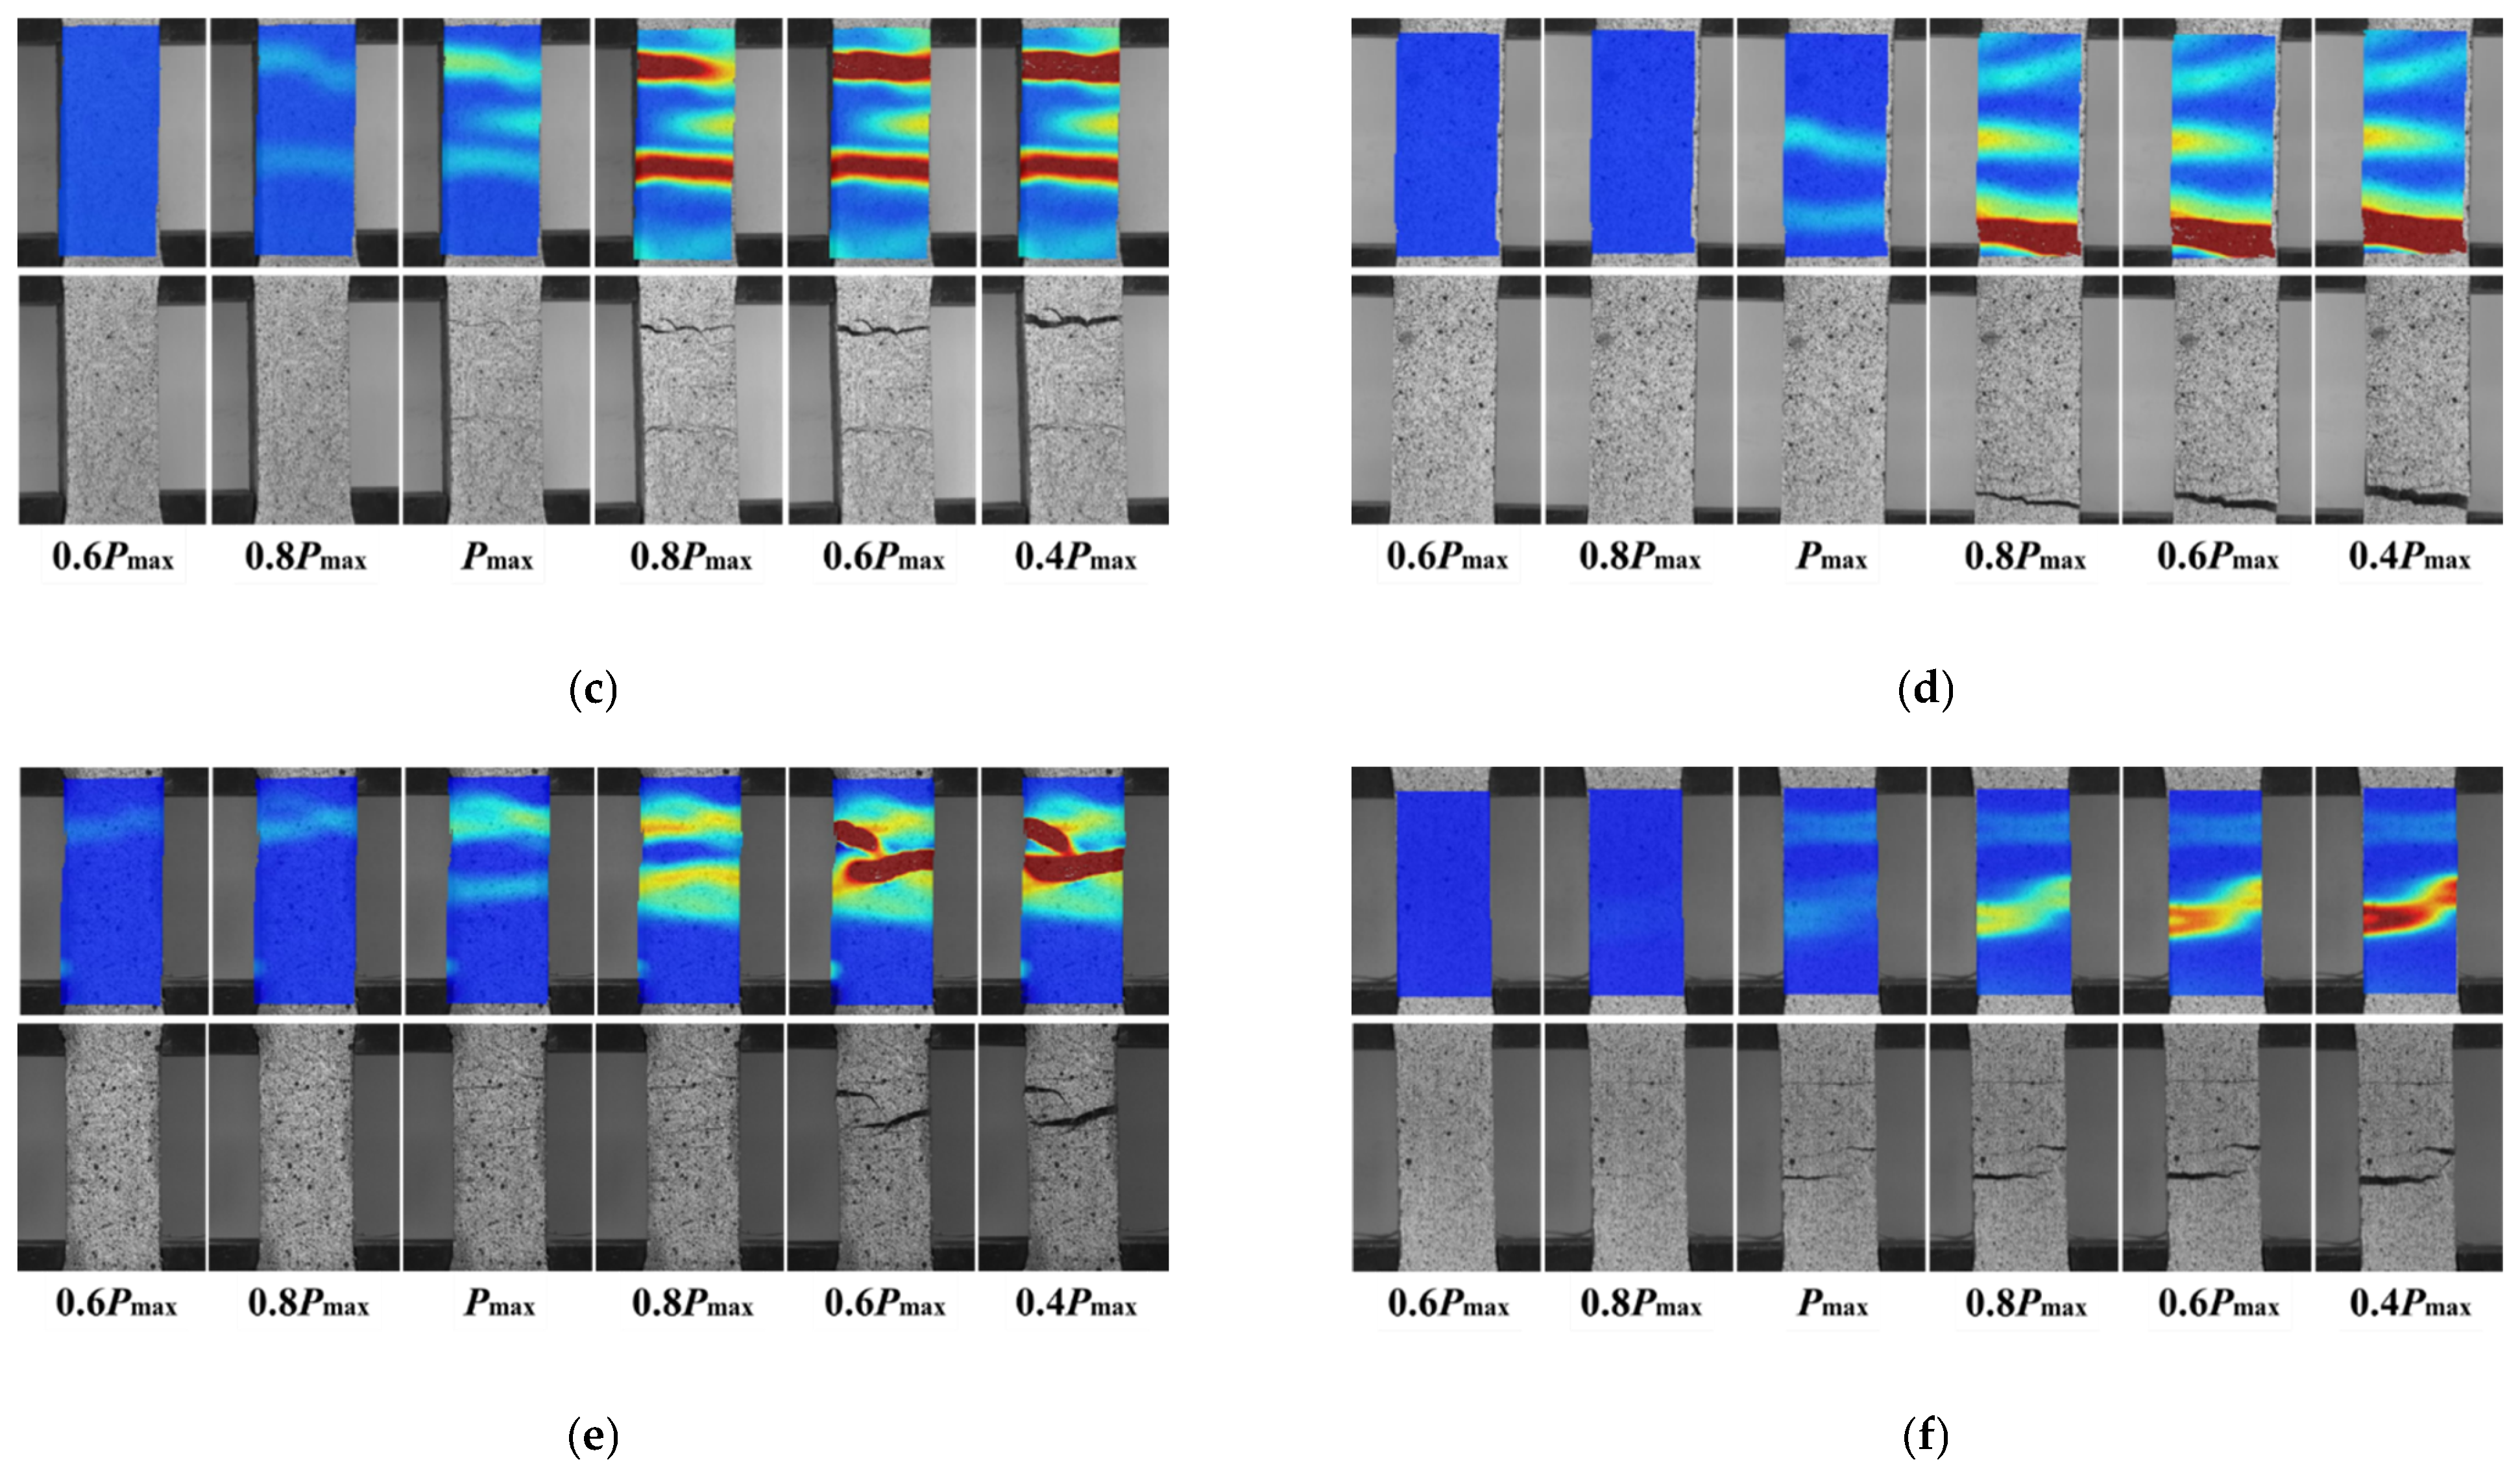
DIC exhibits a superior capability in capturing the evolution of ECC cracks. The cracking development of ECC specimens under different tensile levels is shown in Figure 6. The SS-ECC shows the characteristics of multiple cracking during uniaxial tension. The effect of PE fiber volume fraction on the crack development of SS-ECC is shown in Figure 6a–c. SS-ECC with PE fiber volume fractions of 1.5% and 2% showed a significantly greater number of surface cracks compared to those with lower fiber contents. Meanwhile, the crack surface of SS-ECC under uniaxial tension became rougher with the increase in PE fiber volume fraction [40]. This indicates that an increase in PE fiber volume fraction leads to enhanced fiber-bridging in SS-ECC under uniaxial tension. Meanwhile, the reduced spacing between PE fibers promoted the formation of additional matrix damage zones and fiber-bridging sites around the crack-tip, leading to the initiation of more microcracks. Therefore, the failed SS-ECC specimens were characterized by a rough fracture surface. The effect of PE fiber length on the crack development of SS-ECC is shown in Figure 6b,d,e. The number of cracks in SS-ECC exhibited no significant change when the PE fiber length was varied between 12 mm and 24 mm. The fracture surface of SS-ECC under uniaxial tension was rougher when the PE fiber length was 24 mm. This is attributed to the longer anchorage length provided by the increased PE fiber length within the cementitious matrix. During the uniaxial tension of SS-ECC, the longer PE fibers engaged with the matrix over a larger area, which in turn induced more extensive matrix damage. As the crack propagated through these weakened zones, it resulted in a rougher fracture surface.
Quantitative measurements of crack spacing and width were not obtained in the present study, as the DIC setup was intended for crack pattern visualization rather than high-resolution dimensional analysis. The absence of displacement transducers and the premature failure of strain gauges also limited post-peak strain recording. These aspects represent opportunities for more detailed investigation in future work.
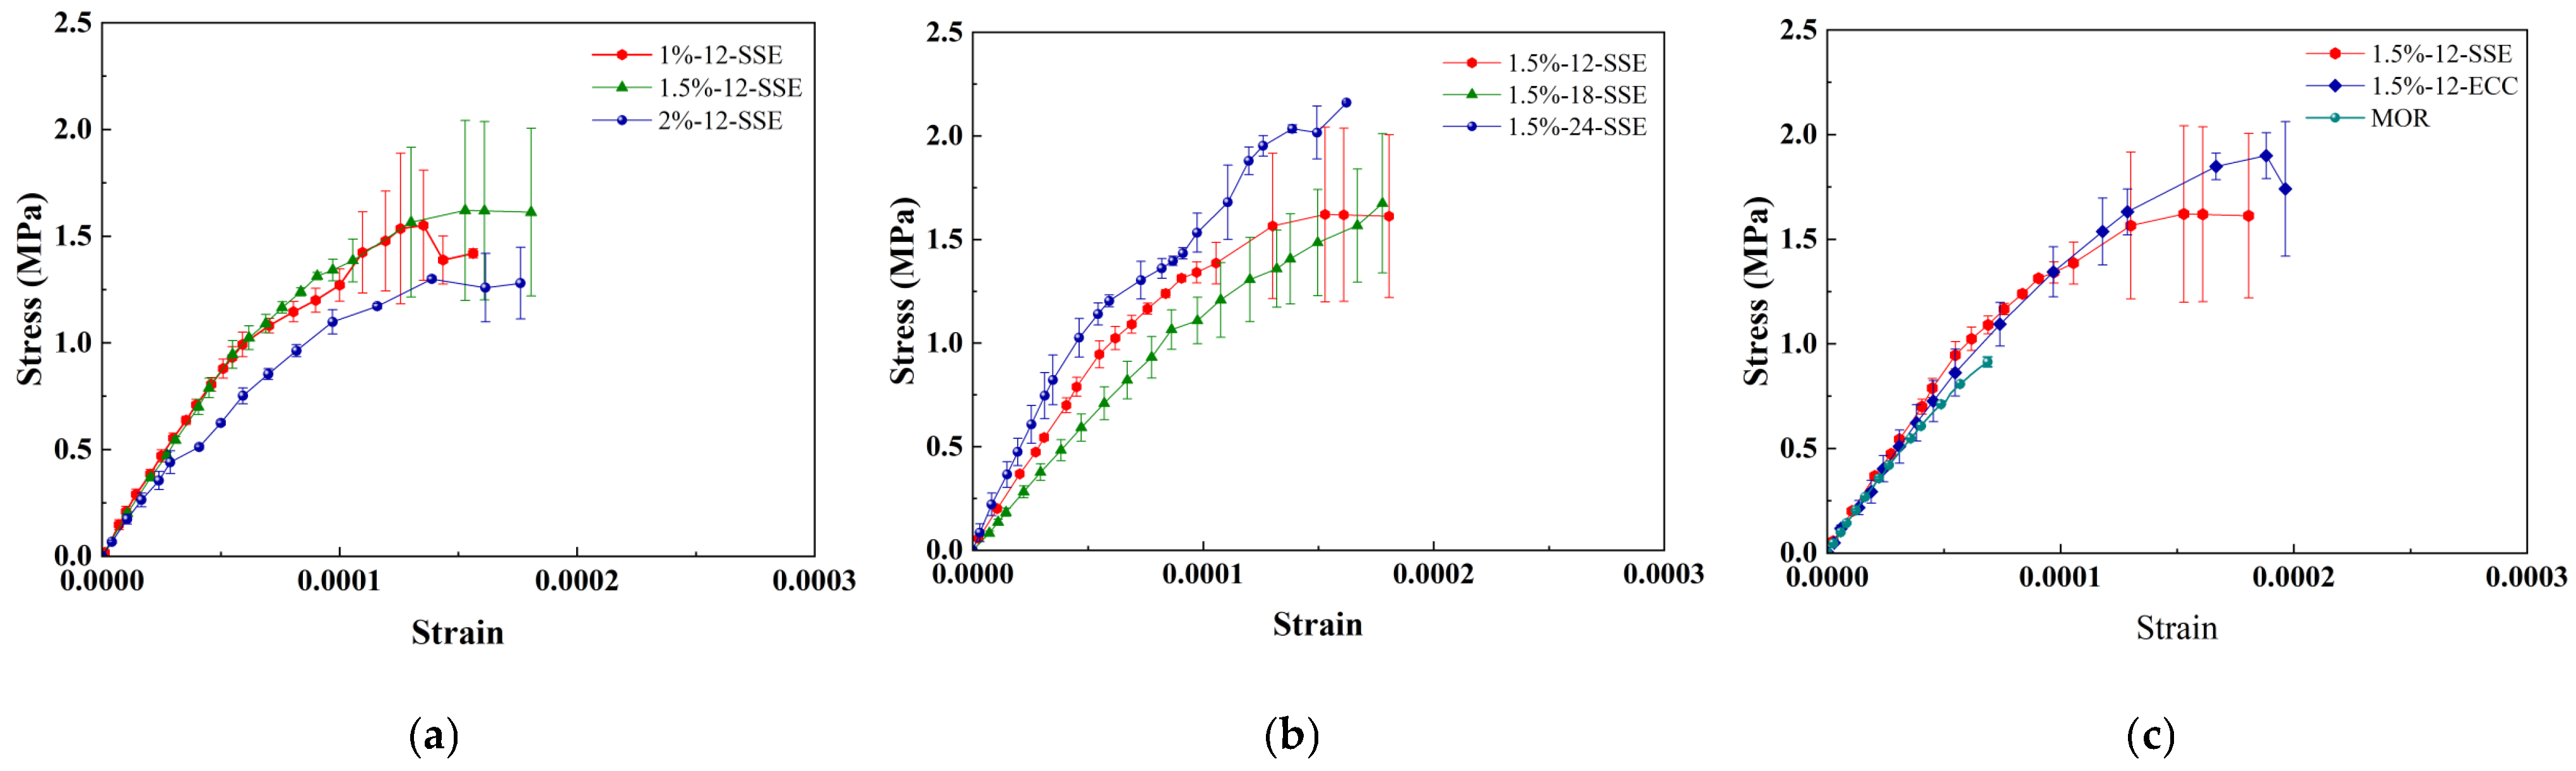
Figure 7 shows the uniaxial tensile stress–strain curve of ECC, where the strain values were measured with concrete strain gauges. These gauges, however, ceased data collection once excess cracking initiated. Consequently, the acquired data only captures the ascending segment of the curves. Figure 7a shows that the slope of the uniaxial tensile stress–strain curve exhibits a decreasing trend with increasing PE fiber content. Figure 7b reveals a non-monotonic dependence of the SS-ECC tensile stress–strain curve slope on PE fiber length; the slope initially decreases, then increases, peaking at a fiber length of 24 mm. This behavior is likely related to initial defects caused by the hydrophobic nature of PE fibers in the SS-ECC. The higher the PE fiber volume fraction in SS-ECC, the greater the number of initial defects, which in turn facilitates the development of a multiple cracking pattern under uniaxial tensile loading. Therefore, an increase in PE fiber volume fraction led to a reduction in the elastic modulus of SS-ECC under uniaxial tensile loading [41]. When the PE fiber length is no greater than 18 mm, the resulting insufficient anchorage length within the cementitious matrix leads to a weaker fiber–matrix bond under uniaxial tension in SS-ECC. As the PE fiber length increased from 12 mm to 18 mm, the expansion of the interfacial transition zone (ITZ), coupled with the insufficient stress transfer capability of shorter fibers, collectively contributed to a decrease in the elastic modulus of SS-ECC. The benefits of stronger interfacial bonding and a broader stress transfer zone, achieved with 24 mm PE fibers, outweigh the drawback of an enlarged ITZ. This net enhancement in load transfer efficiency accounts for the increased elastic modulus observed in SS-ECC under tensile loading. It can be concluded from the foregoing discussion that the influence of PE fibers on the tensile elastic modulus of SS-ECC is two-fold. Therefore, the fiber content and length must be carefully balanced to harness the full potential of the fibers and achieve superior mechanical properties.
Although full post-peak stress–strain curves were not captured, the multiple cracking patterns observed via digital image correlation (DIC) provide evidence of tensile deformation behavior comparable to that of conventional ECC mixtures. When assessed against established strain-hardening criteria, the developed SS-ECC formulations exhibit several defining characteristics: steady-state multiple cracking, rough fracture surfaces indicative of effective fiber-bridging, and a rising stress response following first cracking [42]. Although quantitative crack width data are not presented herein, these collective observations confirm that the investigated mixtures satisfy the basic requirements for classification as strain-hardening cementitious composites.

3.2.2. Uniaxial Tensile Strength of SS-ECC

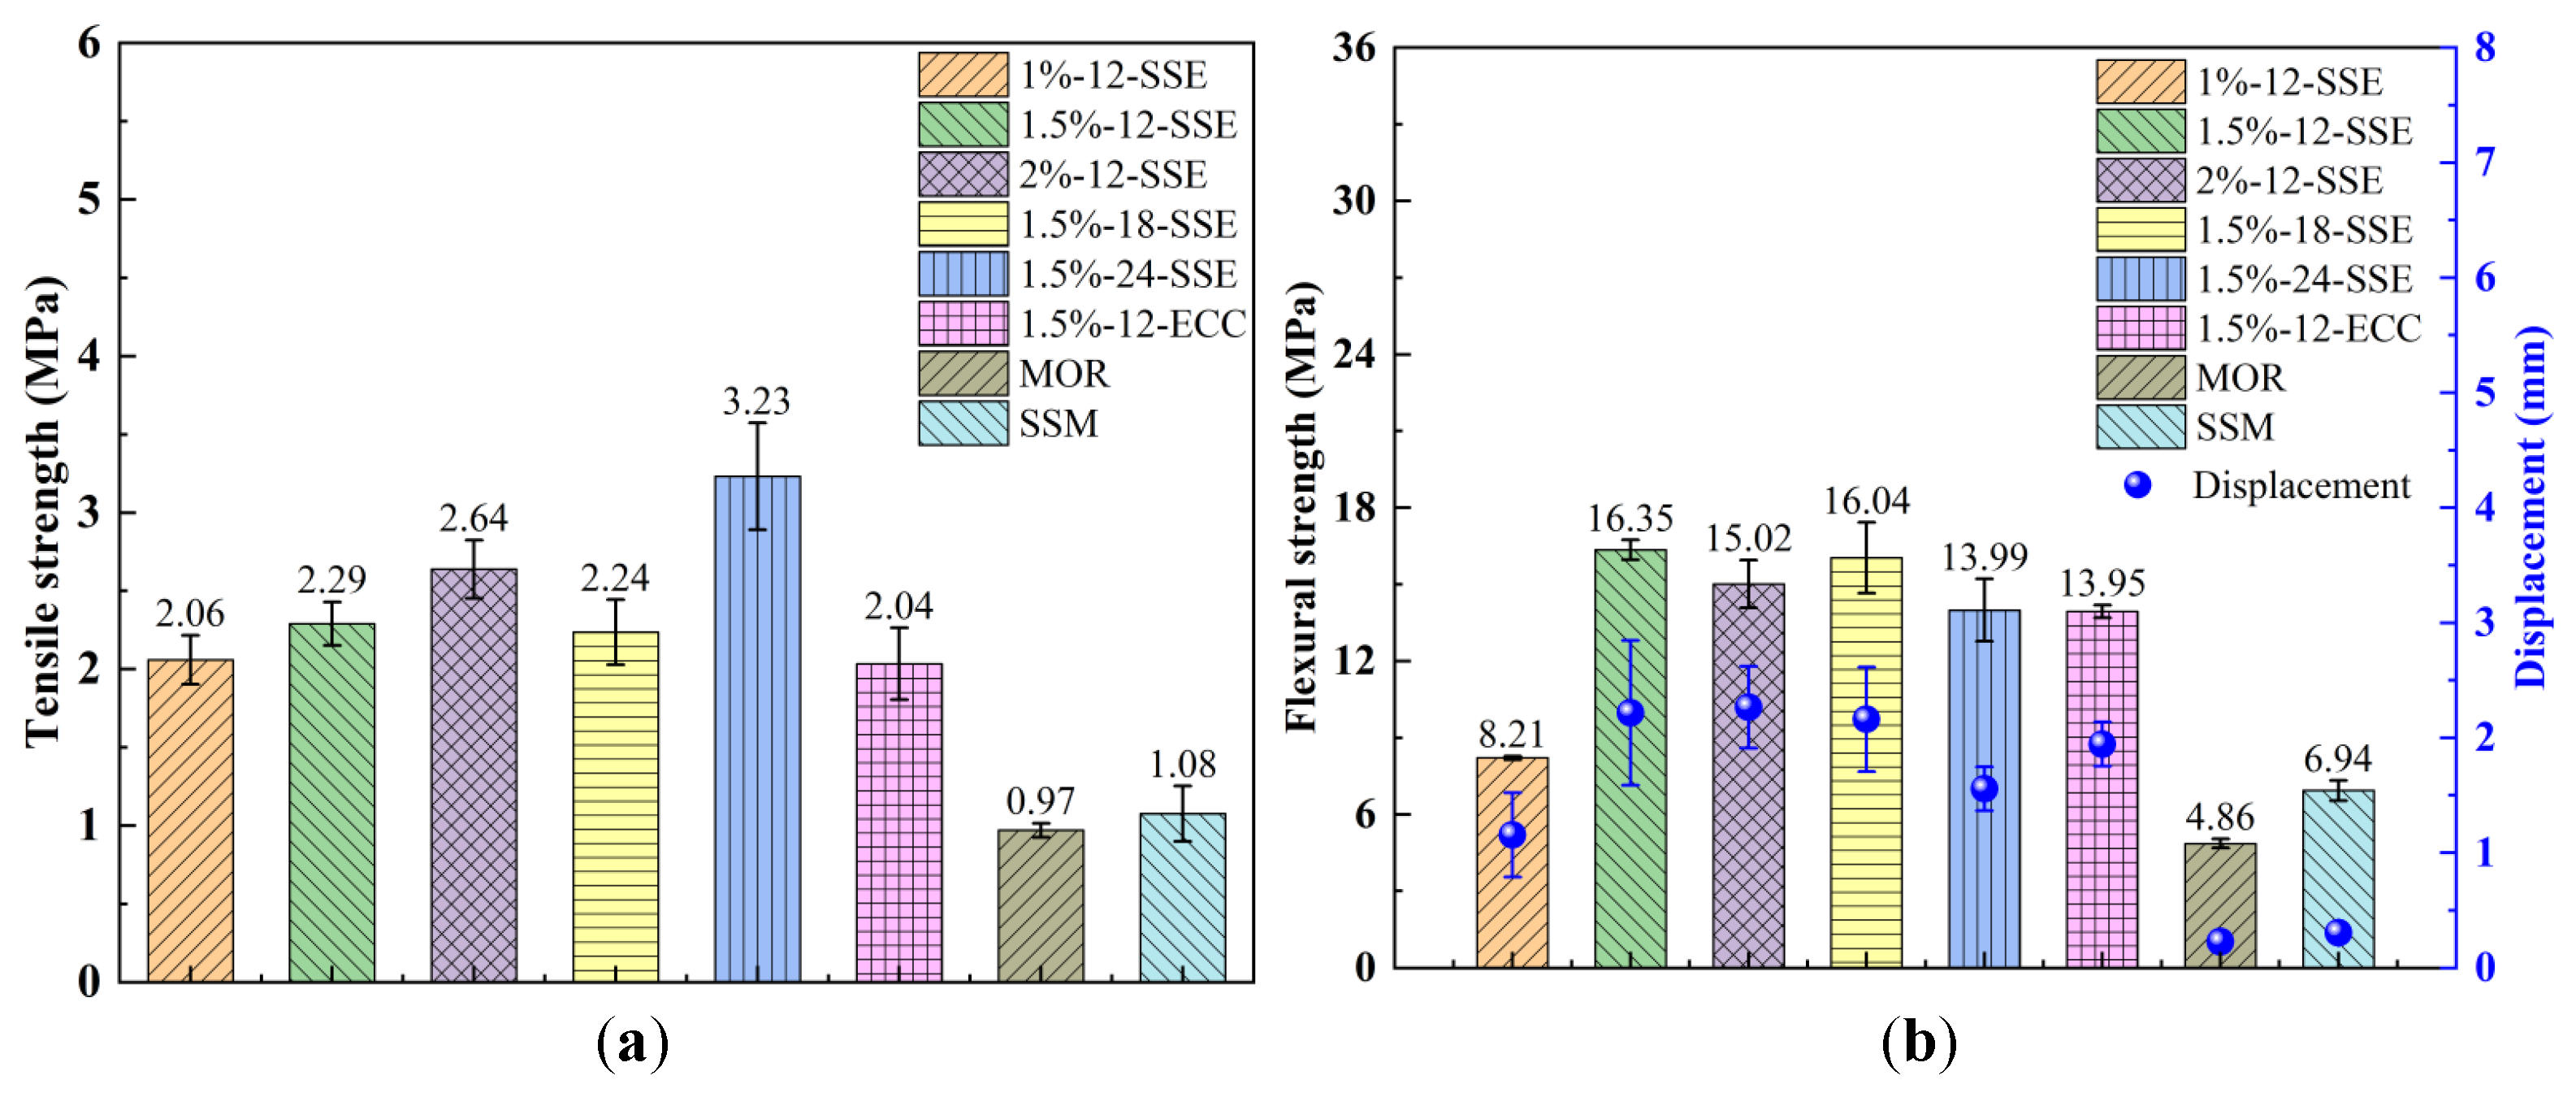
The effect of PE fiber content on the tensile strength of SS-ECC is shown in Figure 8a. With the increase in PE fiber content from 1% to 2%, the tensile strength of SS-ECC increases gradually. The tensile strength of 2%-12-SSE is 28.2% and 15.3% higher than that of 1%-12-SSE and 1.5%-12-SSE, respectively. Compared to the tensile strength of SSM, the tensile strength of 1%-12-SSE is 90.7% higher than that of SSM. The uniaxial tensile strength of SS-ECC is significantly improved by increasing the PE fiber volume fraction up to 2%. This is because a higher fiber content amplifies the bridging effect within the material, leading to greater resistance against tensile loads.
The effect of PE fiber length on the tensile strength of ECC is shown in Figure 8a. As the length of the PE fiber increases from 12 mm to 24 mm, the tensile strength of ECC decreases first and then increases. The tensile strength of 1.5%-24-SSE is 41% and 44.2% higher than that of 1.5%-12-SSE and 1.5%-18-SSE, respectively. Under the same volume content of PE fiber, the number of 12 mm PE fibers is more than that of 18mm PE fibers. Therefore, when the cracking of the SS-ECC specimen develops, 1.5%-12-SSE has more PE fibers than 1.5%-18-SSE to play a bridging role in concrete. Hence, the tensile strength of 1.5%-12-SSE is higher than that of 1.5%-18-SSE. When the length of PE fiber reaches 24 mm, although the number of fibers that play a bridging role in 1.5%-24-SSE is less than that in 1.5%-12-SSE, the bonding length between the 24 mm long PE fiber and cement matrix is longer. When the 1.5%-24-SSE specimen cracks, it needs a greater tensile force to pull the PE fiber out of the cement matrix. Then the tensile strength of 1.5%-24-SSE reaches the maximum. Therefore, under the same fiber volume content, the 24 mm PE fiber can improve the bonding between the fiber and the cement matrix under the condition that a certain number of fibers can play a bridging role, thereby improving the tensile strength of ECC. The increase in the length and diameter of the PE fiber expands the interface contact area between the fiber and the matrix, thereby enhancing the fiber-bridging effect and significantly improving the tensile properties of the ECC [43].
As shown in Figure 8, seawater and sea sand influence the tensile strength of ECC. The incorporation of PE fibers significantly improved the tensile strength, with 1.5%-12-SSE and 1.5%-12-ECC showing 112% and 110% increases over SSM and MOR, respectively. The higher tensile strength of SSM as compared to MOR can be attributed to chloride ions that enhance cement hydration and refine the pore structure [18].

3.3. Bending Behavior of SS-ECC

3.3.1. Flexural Stress–Displacement Curve of SS-ECC

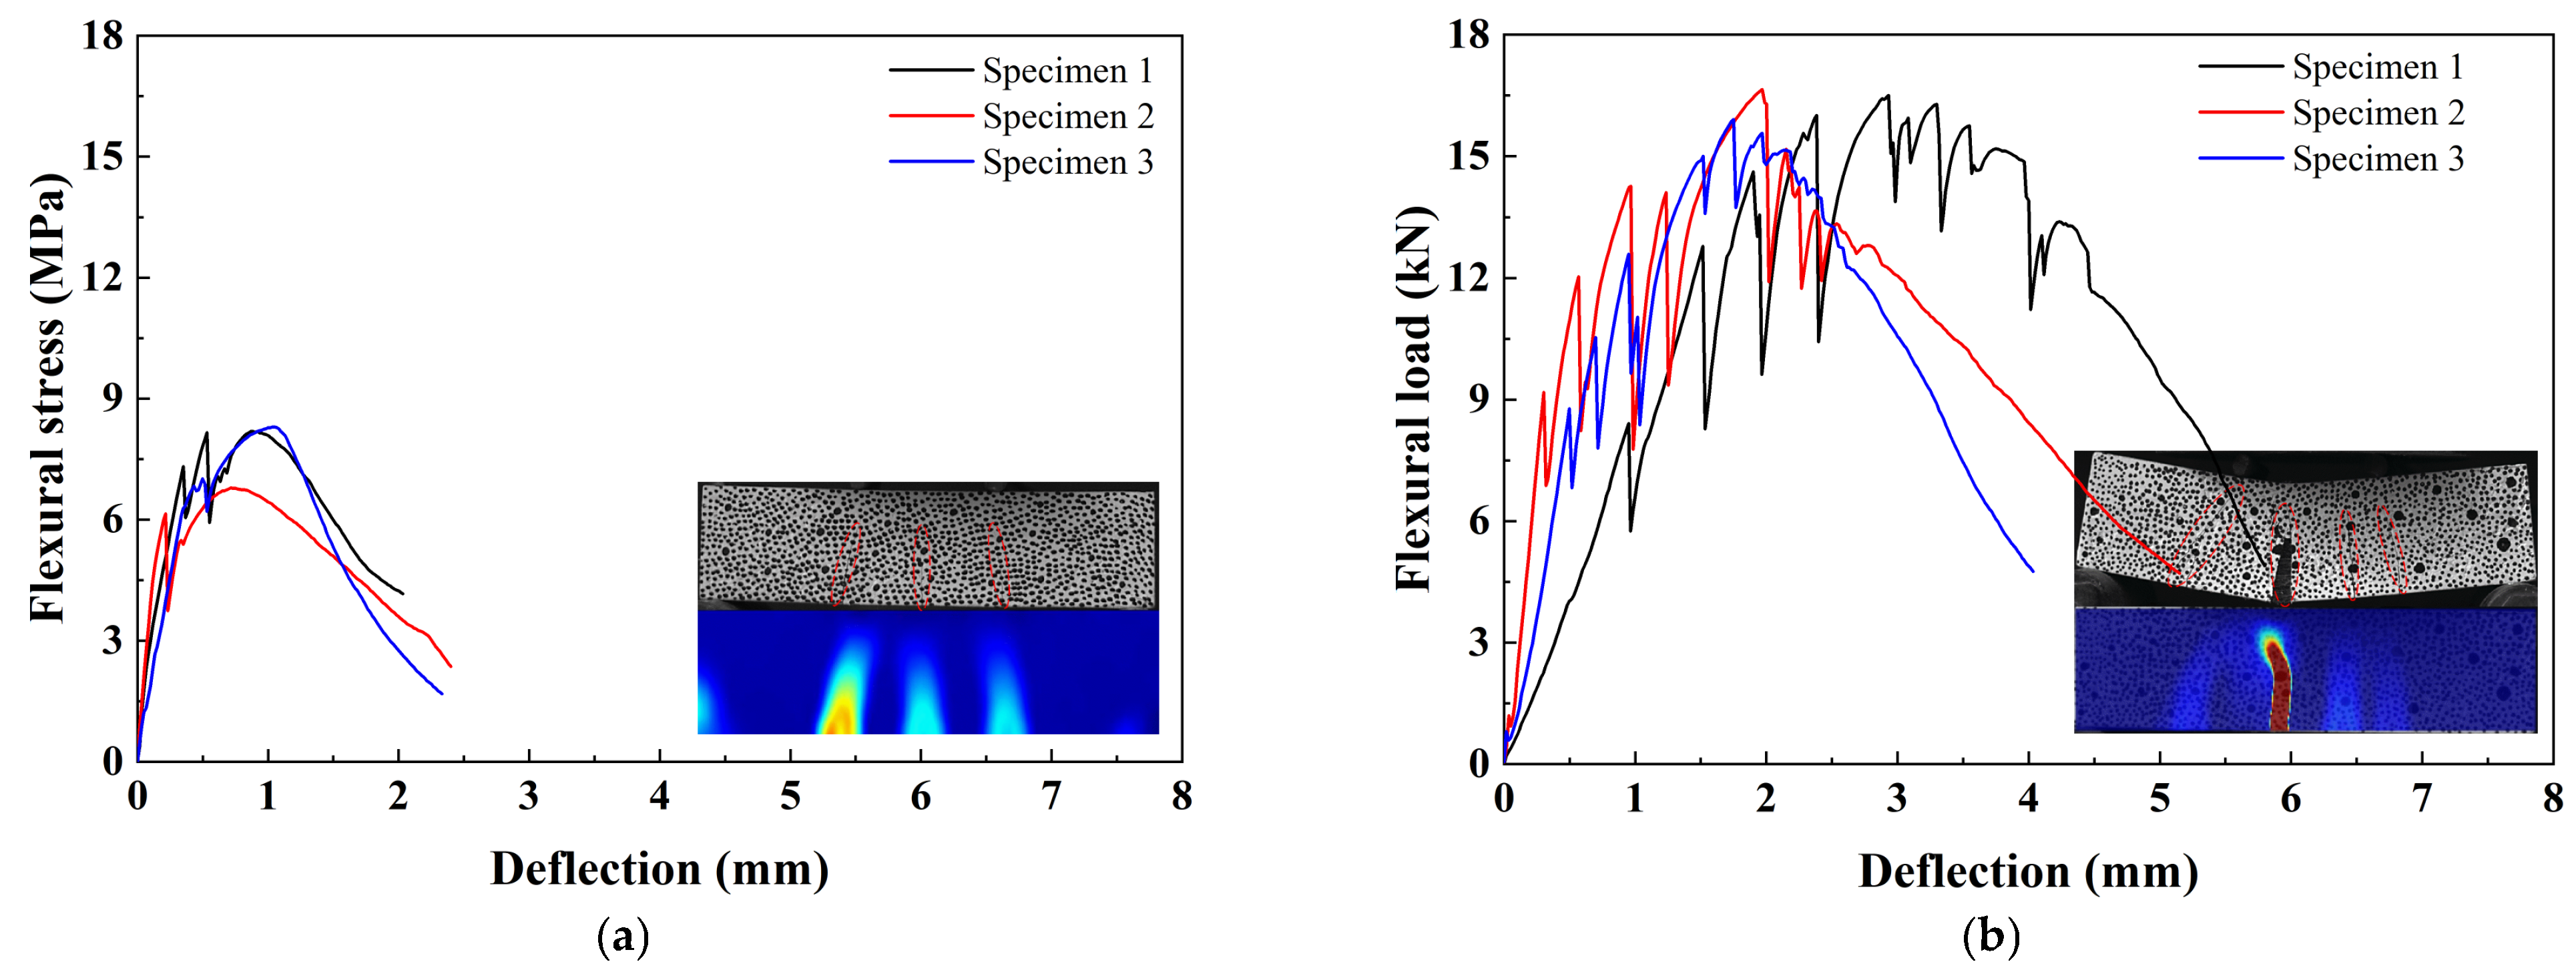
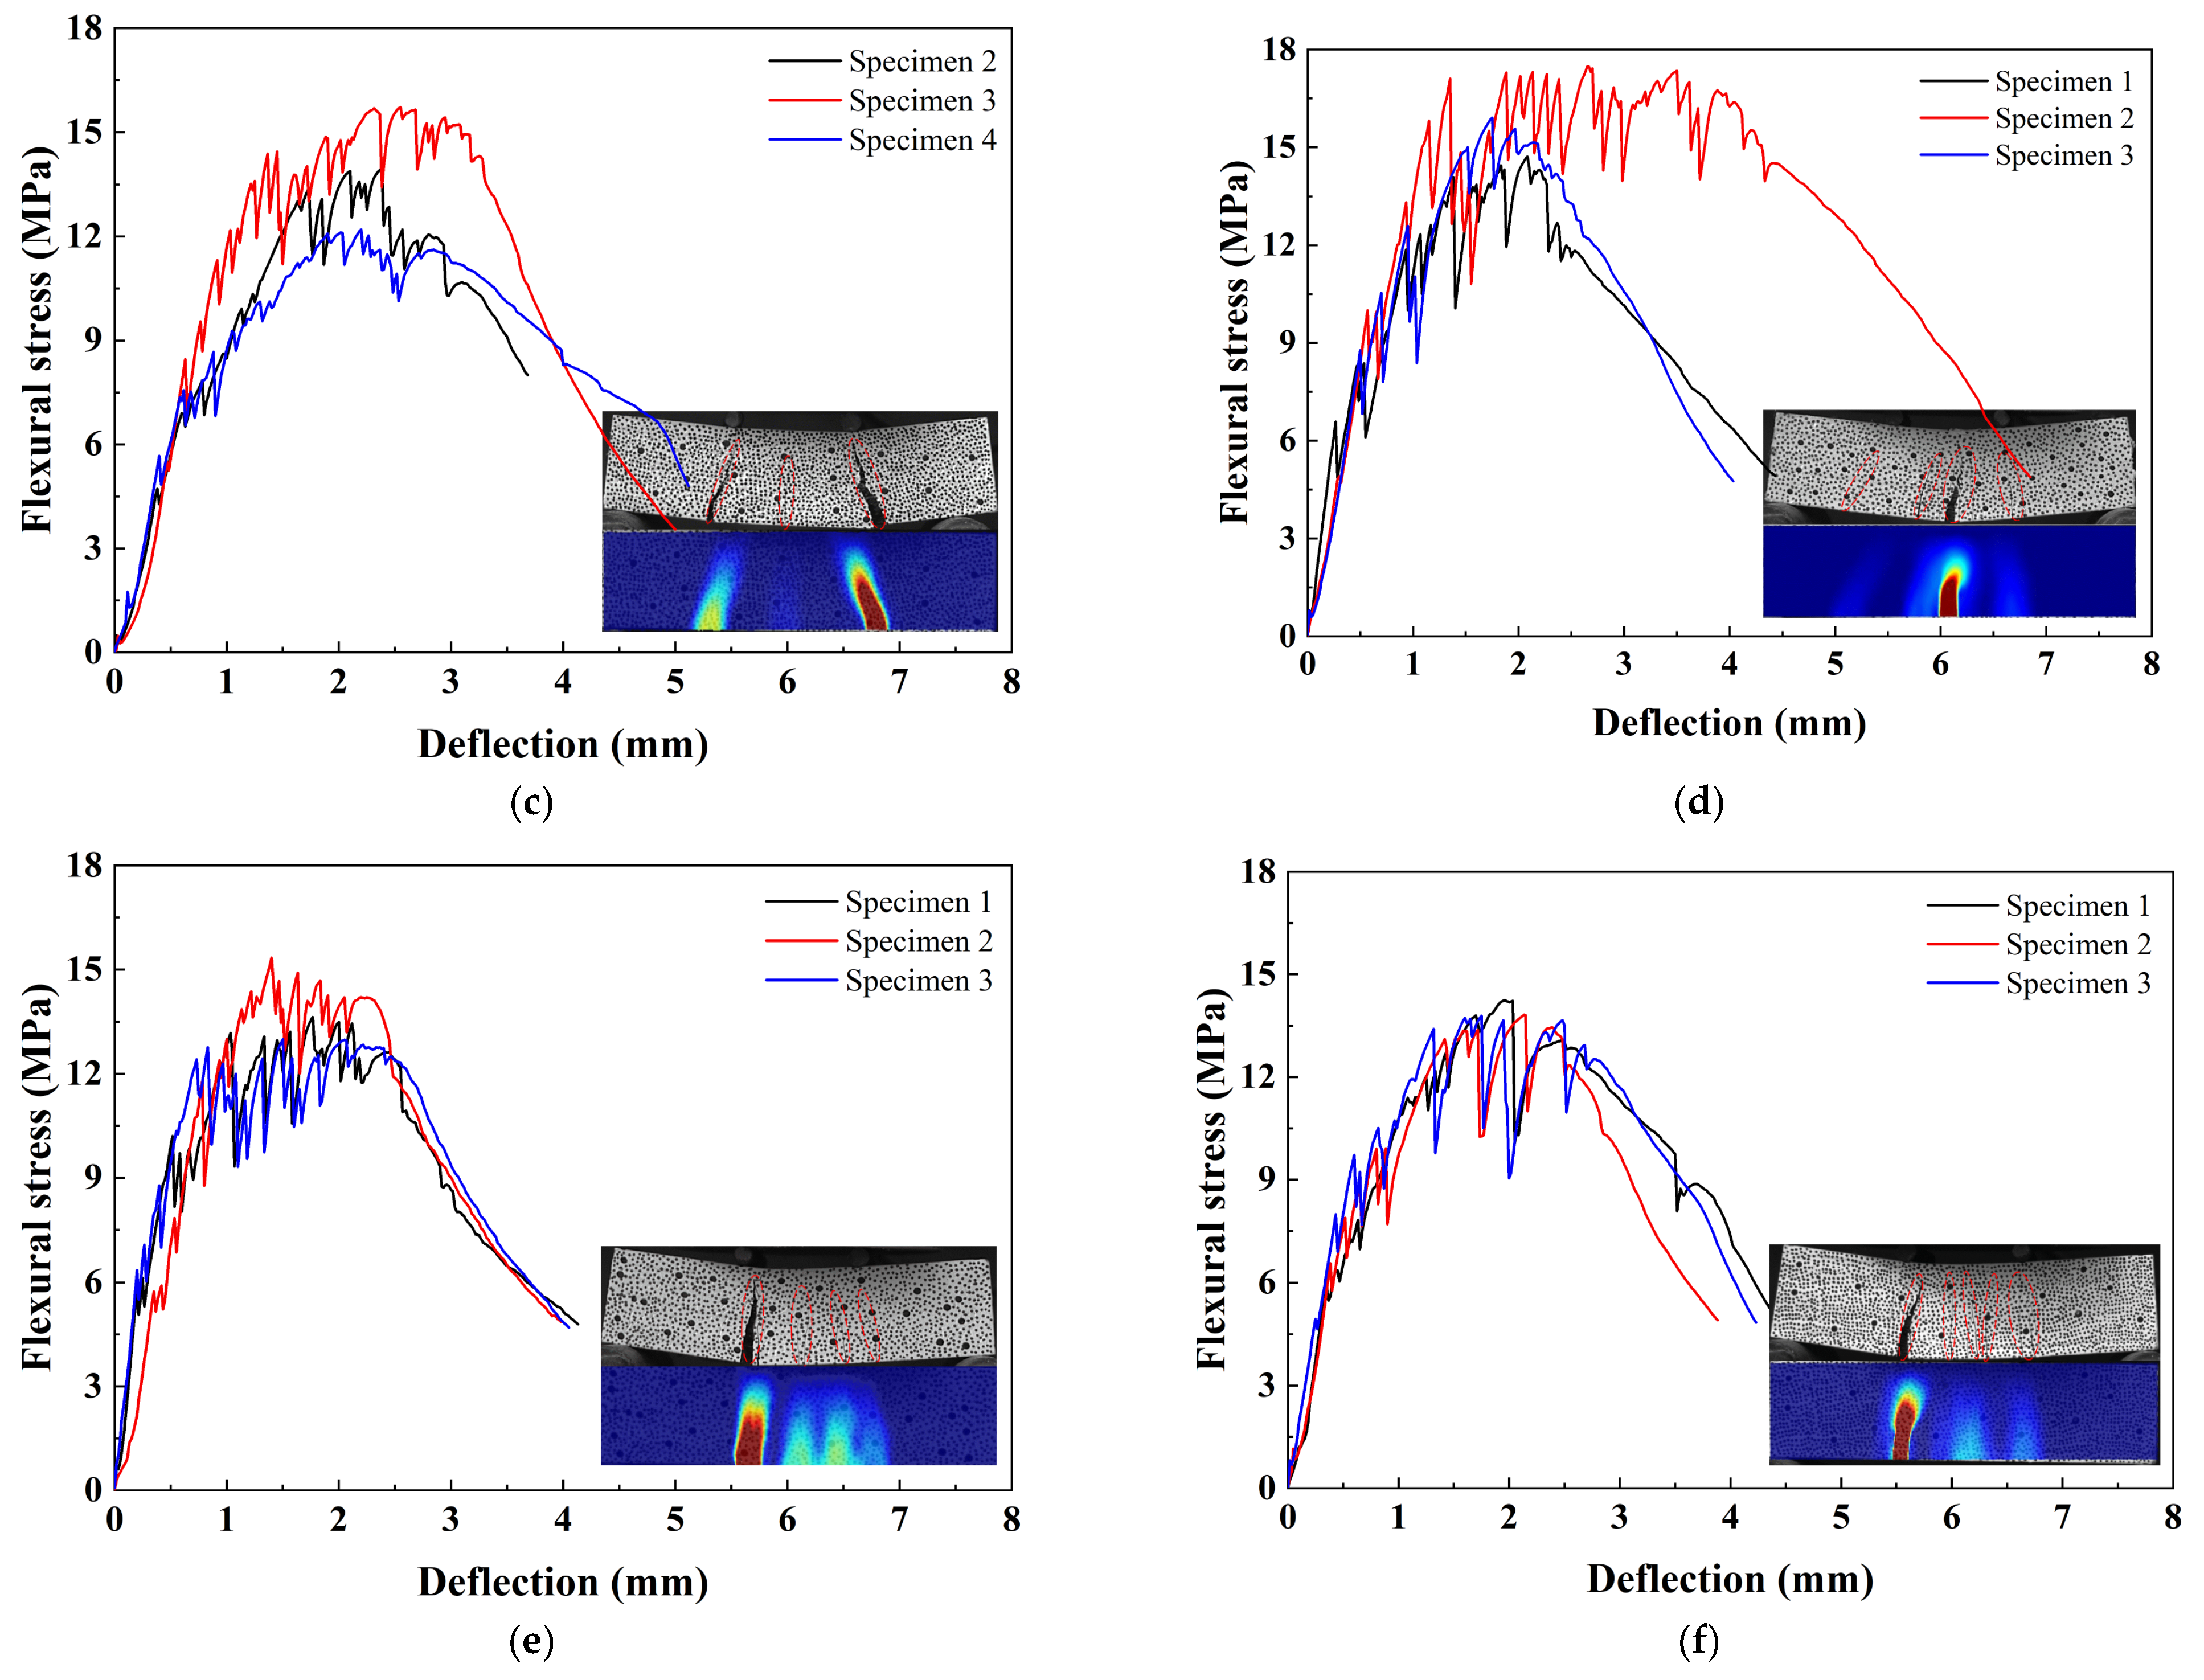
The flexural stress–displacement curves of SS-ECC are shown in Figure 9. Consistent with the findings from uniaxial compression and tension tests, the incorporation of PE fibers effectively enhances the ductility of the SS-ECC. After the cracking initiated, the specimens did not fail immediately but exhibited multiple cracking behaviors.

3.3.2. Flexural Strength of SS-ECC

According to ASTM C 1609 [44], the flexural strength of the specimen in the four-point bending test can be determined by Equation (1).
f u = F max L b h 2
where fu is the flexural strength of the specimen (MPa); Fmax is the failure load of specimen (N); L is the distance between the two supports (mm); b and h are the width and height of the specimen (mm), respectively.
Based on Equation (1), the flexural strengths for the eight mixes of SS-ECC are also summarized in Table 5. The relationship between PE fiber content and flexural strength (Figure 7b) exhibits an initial increase followed by a decrease. When the volume content of PE fiber is 1.5%, the flexural strength of SS-ECC reaches the maximum value. The bending strength of 1.5%-12-SSE is 99.2% and 8.9% higher than that of 1%-12-SSE and 2%-12-SSE, respectively. When the PE fiber volume fraction does not exceed 1.5%, a higher content provides more fibers for bridging cracks upon specimen cracking. In this range, the porosity induced by fibers is negligible compared to the bridging effect. However, when the fiber content exceeds 1.5%, the increasing porosity exerts a detrimental effect on the fiber-bridging efficiency, leading to a reduction in flexural strength [45].
The influence of PE fiber length on the flexural strength of SS-ECC is shown in Figure 8b. The flexural strength decreases with increasing fiber length, with the maximum value achieved at a length of 12 mm. Specifically, the flexural strength of 1.5%-12-SSE is 1.9% and 16.9% higher than that of 1.5%-18-SSE and 1.5%-24-SSE, respectively. The influence of seawater and sea sand on the flexural strength of SS-ECC is shown in Figure 8b, which aligns with their effect on tensile strength. Seawater and sea sand moderately enhance flexural strength, and this performance is further improved by the incorporation of PE fibers.

3.3.3. Hardening Index

As shown in Figure 9, the flexural load–displacement curves of all SS-ECC groups are presented. Due to the bridging and crack-resisting effects of PE fibers in the cementitious matrix, the SS-ECC specimens exhibit a serrated increase in flexural load after initial cracking and demonstrate distinct strain-hardening characteristics in their curves. The effect of fiber content and length on the strain-hardening behavior of SS-ECC was assessed via the hardening index Ih [46]. An increase in Ih signifies a more distinct strain-hardening response. The variable Ih is defined by Equation (2):
I h = f u / f c r
where Ih is the hardening index; fu is the peak flexural strength of the specimen (MPa); fcr is the initial cracking flexural strength of the specimen (MPa).
In this paper, the load value corresponding to the first load drop in the rising section of the flexural load–deflection curve is used as the cracking load of the specimen [47]. From Figure 9, the initial cracking flexural strength of each group of ECC specimens can be obtained as shown in Table 5. Corresponding hardening index values can be obtained using Equation (2) and are given in Table 5.
As evident from the hardening indices in Table 5, the strain-hardening characteristics of SS-ECC become more pronounced with higher PE fiber volume content. In contrast, the index first increases and then decreases with longer fiber length, with mix 1.5%-18-SSE exhibiting the most favorable strain-hardening behavior.

4. Toughness Characterization of SS-ECC

4.1. Flexural Toughness Analysis of SS-ECC

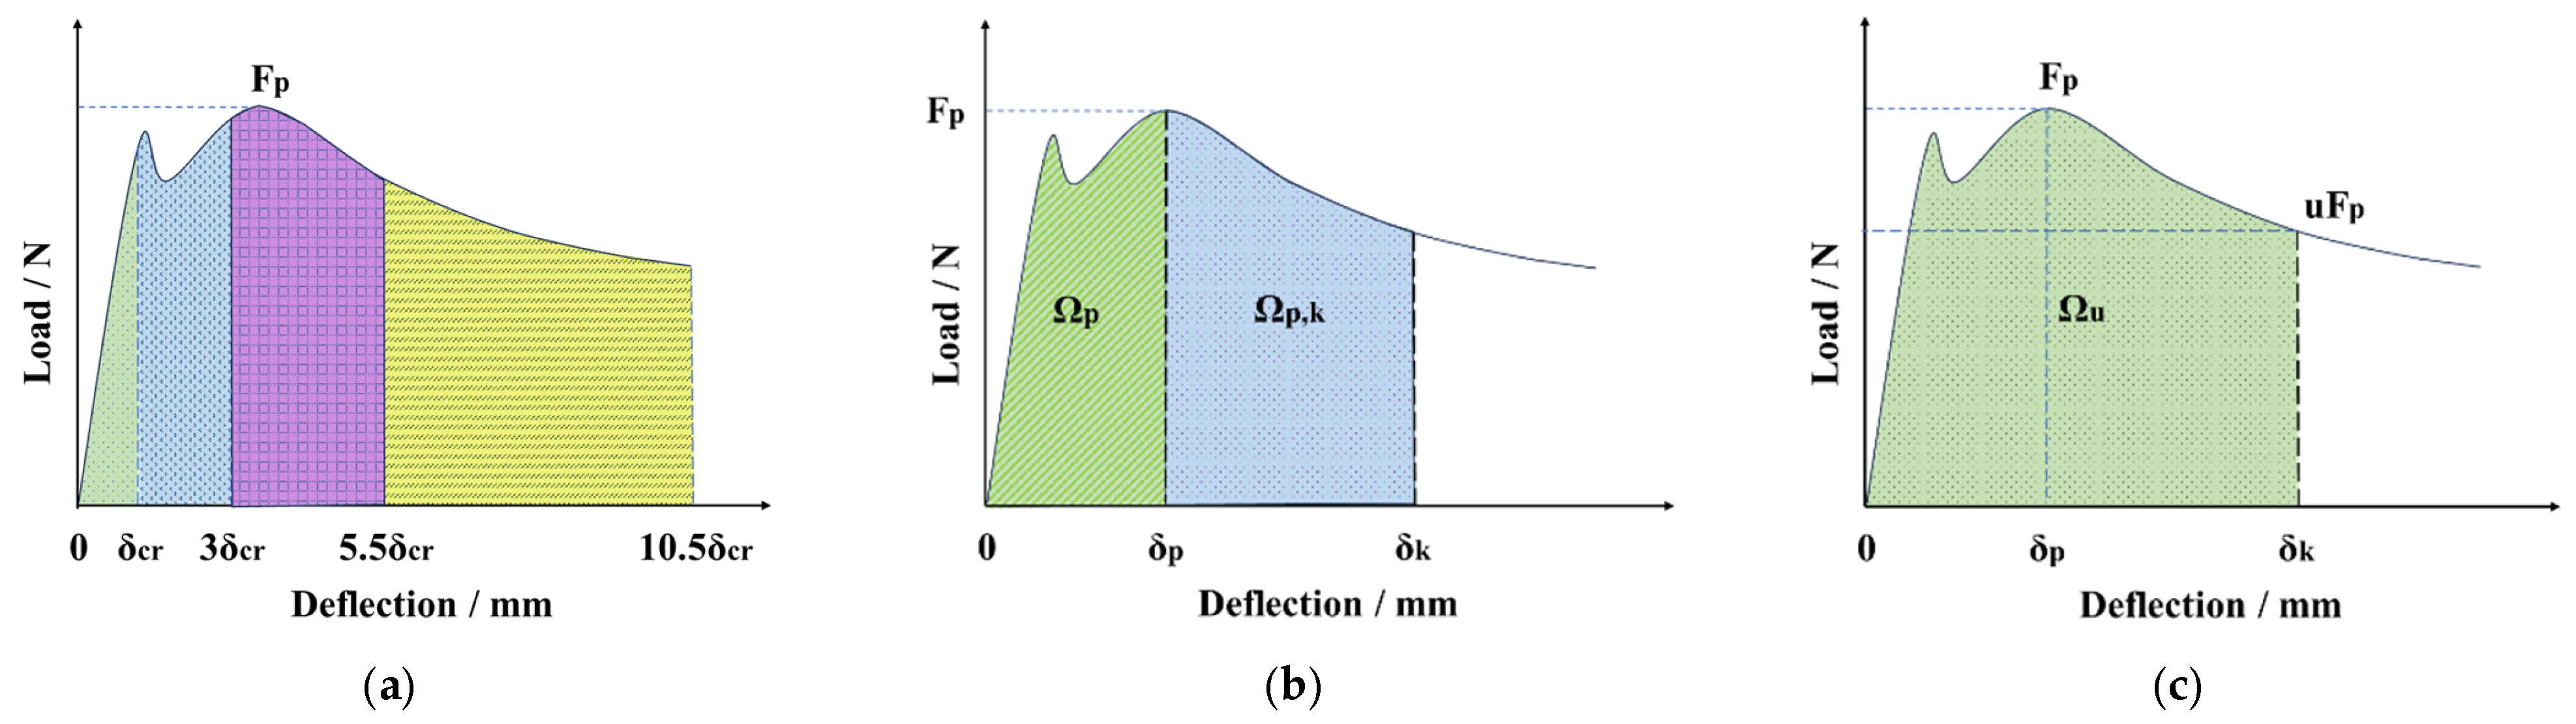
Methods for evaluating the flexural toughness of concrete can be classified into two categories: those that utilize the specimen’s initial cracking point and those that do not [48]. Representative methods based on the initial cracking point include CECS13-2009 [49], while methods independent of the initial cracking point include ASTM C1609 [44], JG/T 472-2015 [50], and JSCE SF-4 [51]. In practice, the first-crack point (or the corresponding deflection δcr) can be difficult to identify objectively because it may be affected by instrument resolution, local micro-cracking, and gradual stiffness changes, which may introduce uncertainty into toughness indices that use δcr directly [52]. In this study, multiple complementary toughness representations—toughness index, toughness ratio, and equivalent flexural toughness (DBJ 61/T112-2021 [53])—were adopted to capture both pre-peak energy absorption and post-peak/residual load-carrying capacity of SS-ECC, while maintaining comparability with standard deflection-based reporting. Specifically, the initial flexural toughness ratio Re, p is used to describe the pre-peak toughness, and the residual flexural toughness ratio Re, k is used to quantify post-peak toughness at different deformation stages. The corresponding calculations are provided in Equations (3)–(6), and the schematic definition is shown in Figure 10. The definitions of the parameters used in the calculation of toughness and equivalent strength are presented in Table 6.
The toughness indices were analyzed separately to evaluate energy absorption capacity. Descriptive statistics in Table 7 show that equivalent compressive toughness exhibited moderate variability, with CVs ranging from 0.65% to 20.3%. One-way ANOVA on the 12 mm length series showed a significant effect of fiber content (F2,5 = 18.82, p < 0.01), confirming a decrease at 1.5% followed by recovery at 2% fiber content. At fixed 1.5% content, fiber length also significantly affected compressive toughness (F2,5 = 5.02, p < 0.05), with the 18 mm length yielding the highest mean value. For flexural toughness, increasing fiber content from 1% to 2% at 12 mm length led to a substantial and statistically significant increase (F2,3 = 24.93, p < 0.05). However, at 1.5% fiber content, the effect of fiber length on flexural toughness was not significant (F2,5 = 0.98, p > 0.05). These findings suggest that fiber content plays a more dominant role than fiber length in enhancing flexural toughness within the tested ranges.

4.1.1. Analysis of Flexural Toughness Index of SS-ECC

The calculation for the flexural toughness index is given by Equation (3):
I 5 = T 3 / T 1 I 10 = T 5.5 / T 1 T 20 = T 10.5 / T 1
T1: Area under the flexural load–deflection curve from zero deflection to the deflection corresponding to cracking load, (kN·mm); T3: Area under the flexural load–deflection curve from zero deflection to three times the cracking deflection, (kN·mm); T5.5: Area under the flexural load–deflection curve from zero to 5.5 times the cracking deflection, (kN·mm); T10.5: Area under the flexural load–deflection curve from zero to 10.5 times the cracking deflection, (kN·mm); I5, I10 and I20 represent the flexural toughness indices at specific deflection points (3δcr, 5.5δcr, and 10.5δcr, respectively) on the load–deflection curve; δcr: Deflection at crack load.
In this study, the first-crack deflection (δcr) and corresponding load (fcr) were defined at the point where the load–deflection curve exhibited an initial drop, indicating the transition from linear elastic behavior to crack initiation. Although this criterion offers a consistent and physically identifiable reference, accurately determining the onset of cracking in fiber-reinforced composites remains subject to inherent subjectivity, particularly in specimens with gradual post-peak transitions. Real-time visual observation during testing was employed as a supplementary means of verification. More objective identification methods, such as automated detection algorithms or DIC-based strain localization analysis, are recommended in future studies to enhance both precision and reproducibility.
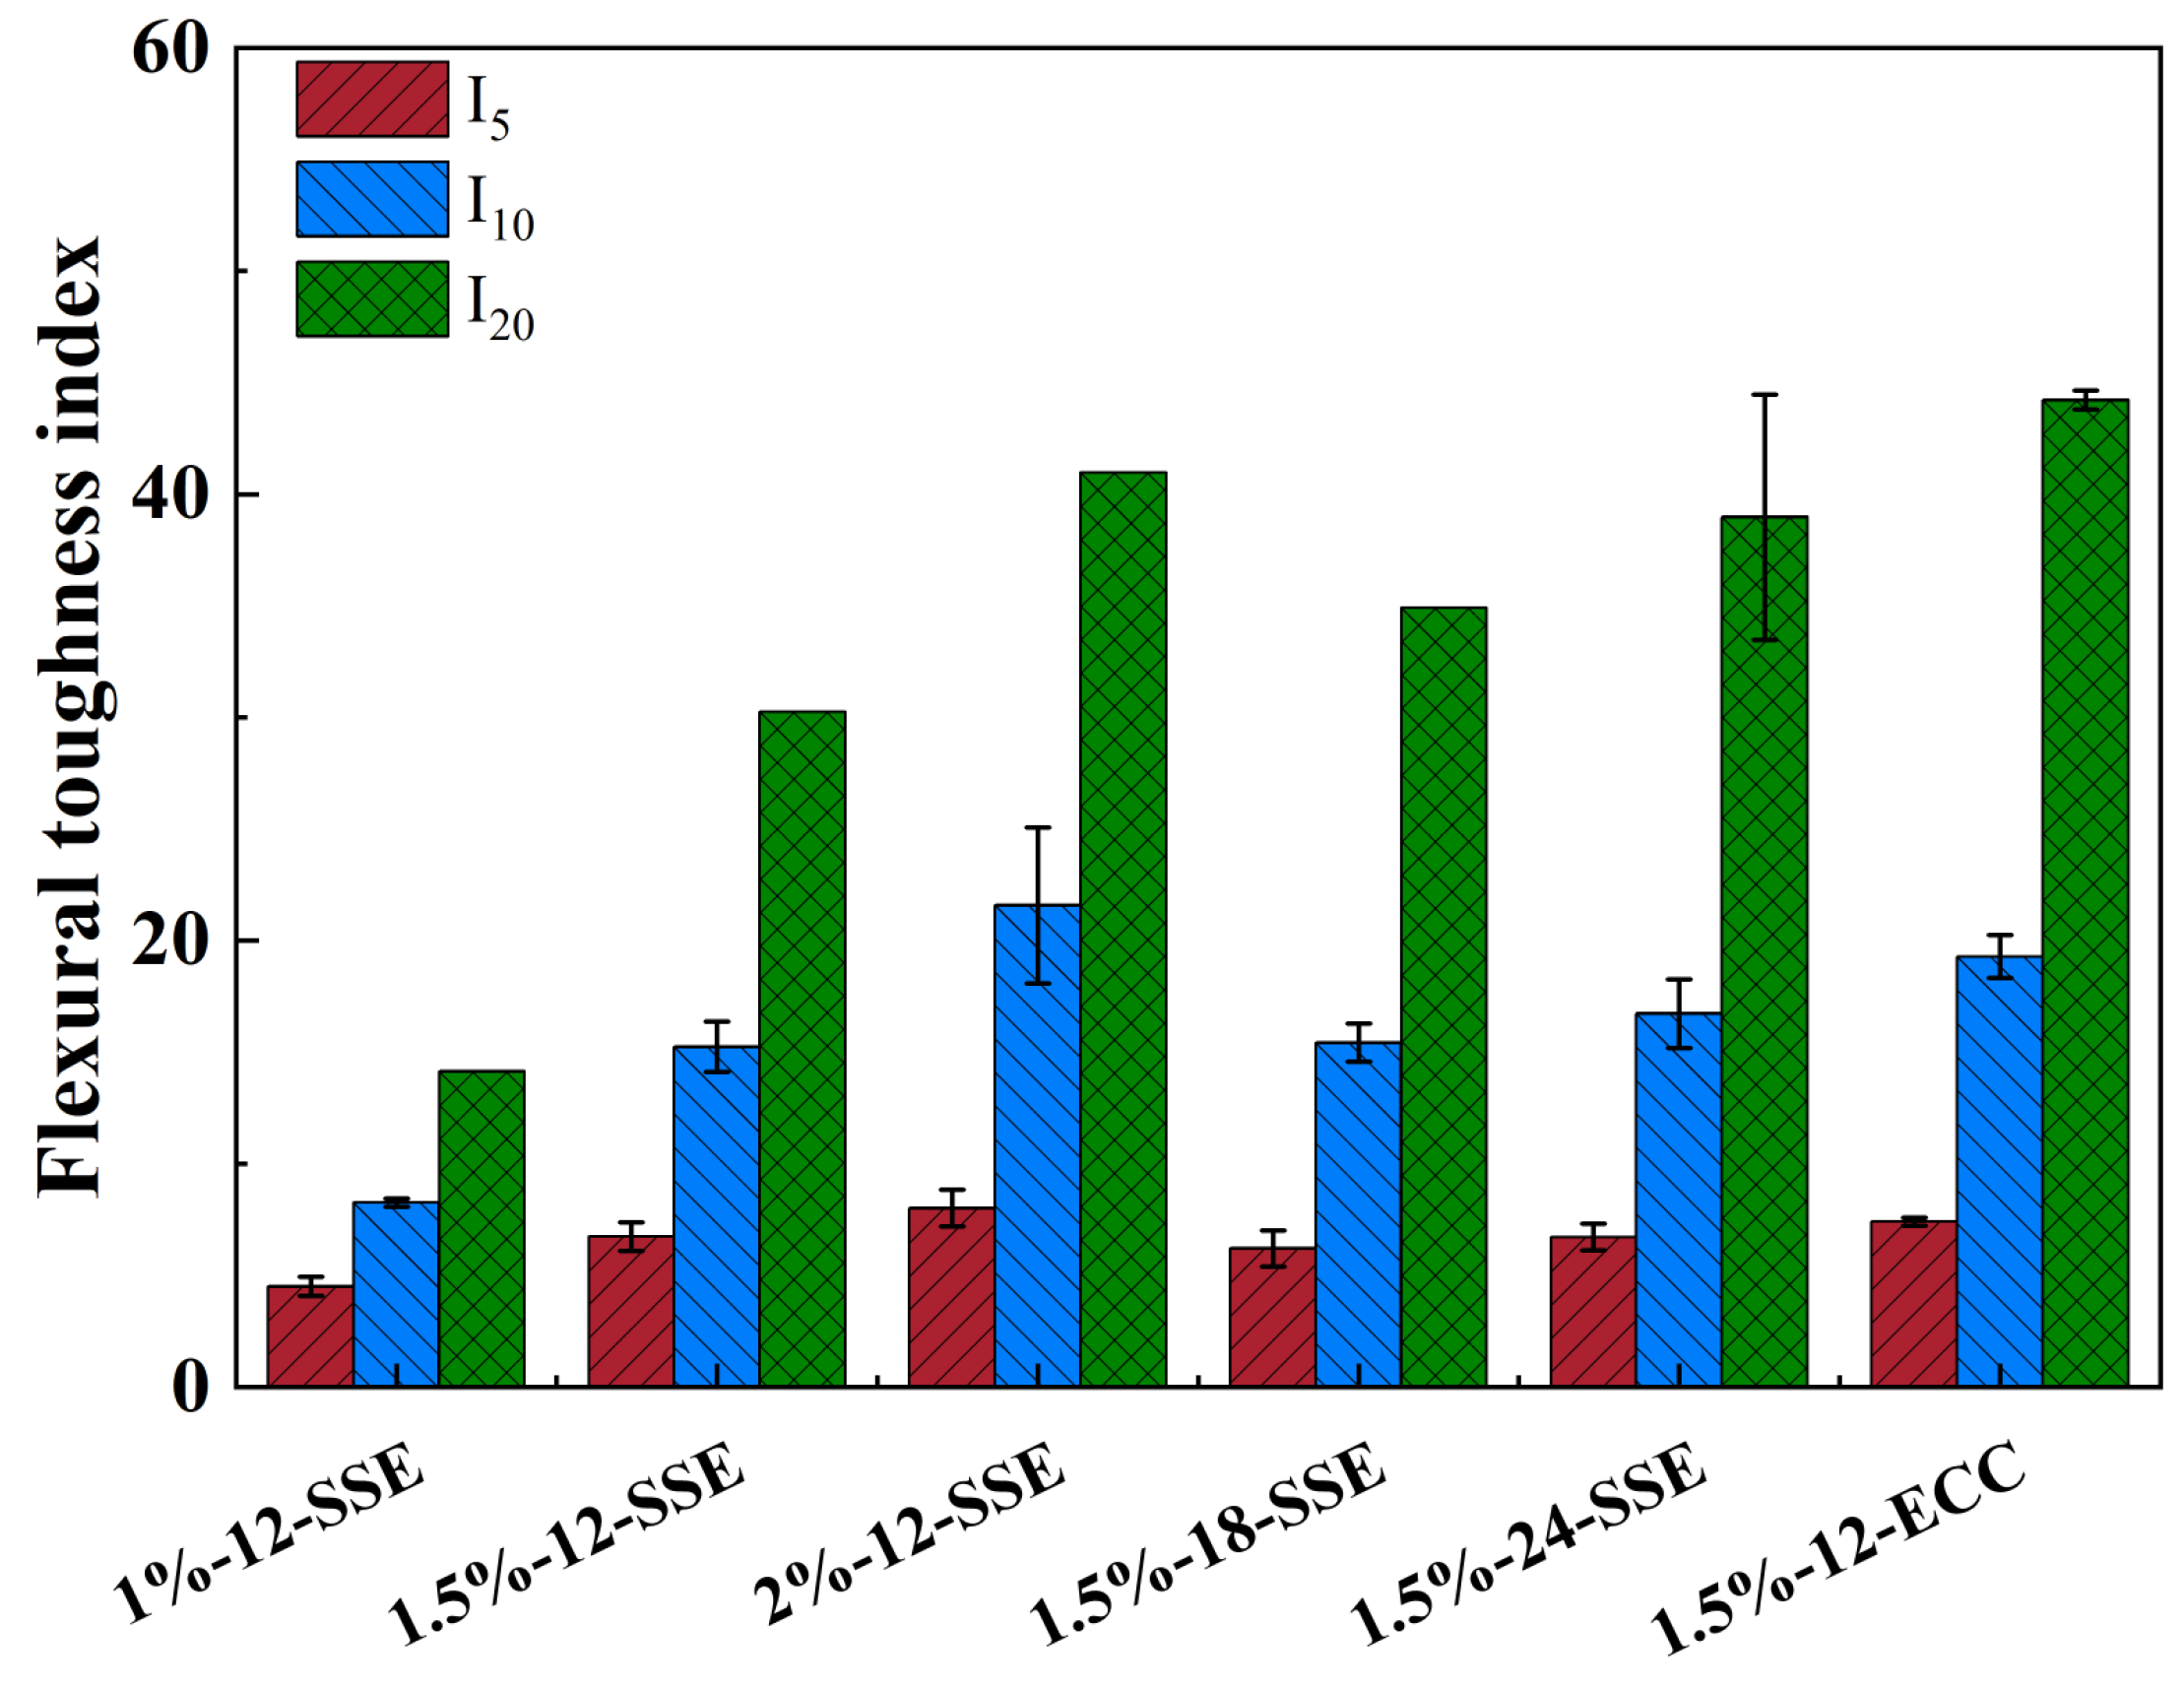
The flexural toughness index of SS-ECC is calculated using Equation (3), and the results are shown in Figure 11.
The effect of PE fiber content on the flexural toughness index of SS-ECC is shown in Figure 11. With increasing PE fiber content, the flexural toughness of SS-ECC showed an increasing trend at all specified deflection levels (3δcr, 5.5δcr, and 10.5δcr). An increase in PE fiber content led to a stronger fiber-bridging effect in SS-ECC. Moreover, a higher PE fiber content reduces the inter-fiber spacing in SS-ECC. This enables a more effective dispersion of crack-tip stresses into the surrounding uncracked matrix, which in turn effectively suppresses the unstable propagation of cracks.
The influence of PE fiber length on the flexural toughness index of SS-ECC is shown in Figure 11. At small deflection levels (3δcr), PE fiber length had no significant influence on the flexural toughness of SS-ECC. At higher deflection levels of 5.5δcr and 10.5δcr, the flexural toughness of SS-ECC showed an increasing trend with greater PE fiber length. At a small deflection (3δcr), the crack width in SS-ECC is limited, resulting in only a small pull-out displacement of PE fibers. Under these conditions, fibers of different lengths provide similar resistance to crack propagation, thus their length has a minimal effect on flexural toughness. Under large deflections (5.5δcr and 10.5δcr), wider cracks engage longer PE fibers more effectively due to their superior anchorage, preventing premature pull-out. Consequently, these fibers can develop higher stresses, carry sustained loads, and contribute to a superior flexural toughness.

4.1.2. Analysis of Flexural Toughness Ratio of SS-ECC

The calculation for the flexural toughness ratio is given by Equations (4) and (5), respectively:
R e , p = f e , p / f u f e , p = ( Ω p L ) / ( b h 2 δ p )
R e , k = f e , k / f u f e , k = ( Ω p , k L ) / ( b h 2 δ p , k ) δ p , k = δ k δ p
Re,p: Initial flexural toughness ratio; fe,p: Equivalent initial flexural strength, (MPa); fu: Flexural strength, (MPa); δp: Deflection at mid-span under peak load, (mm); Ωp: Area under the load–deflection curve from zero mid-span deflection to deflection δp, (N·mm); Re,k: Flexural toughness ratio at a mid-span deflection of δk; fe,k: Equivalent flexural strength at deflection δk, (MPa); Ωp,k: Area under the load–deflection curve over the deflection interval from δp to δk, (N·mm); δk: Deflection corresponding to a load magnitude equal to k (in this study, k takes the values of 0.85, 0.5, and 0.3.) times the peak load in the descending portion of the load–deflection curve (mm).
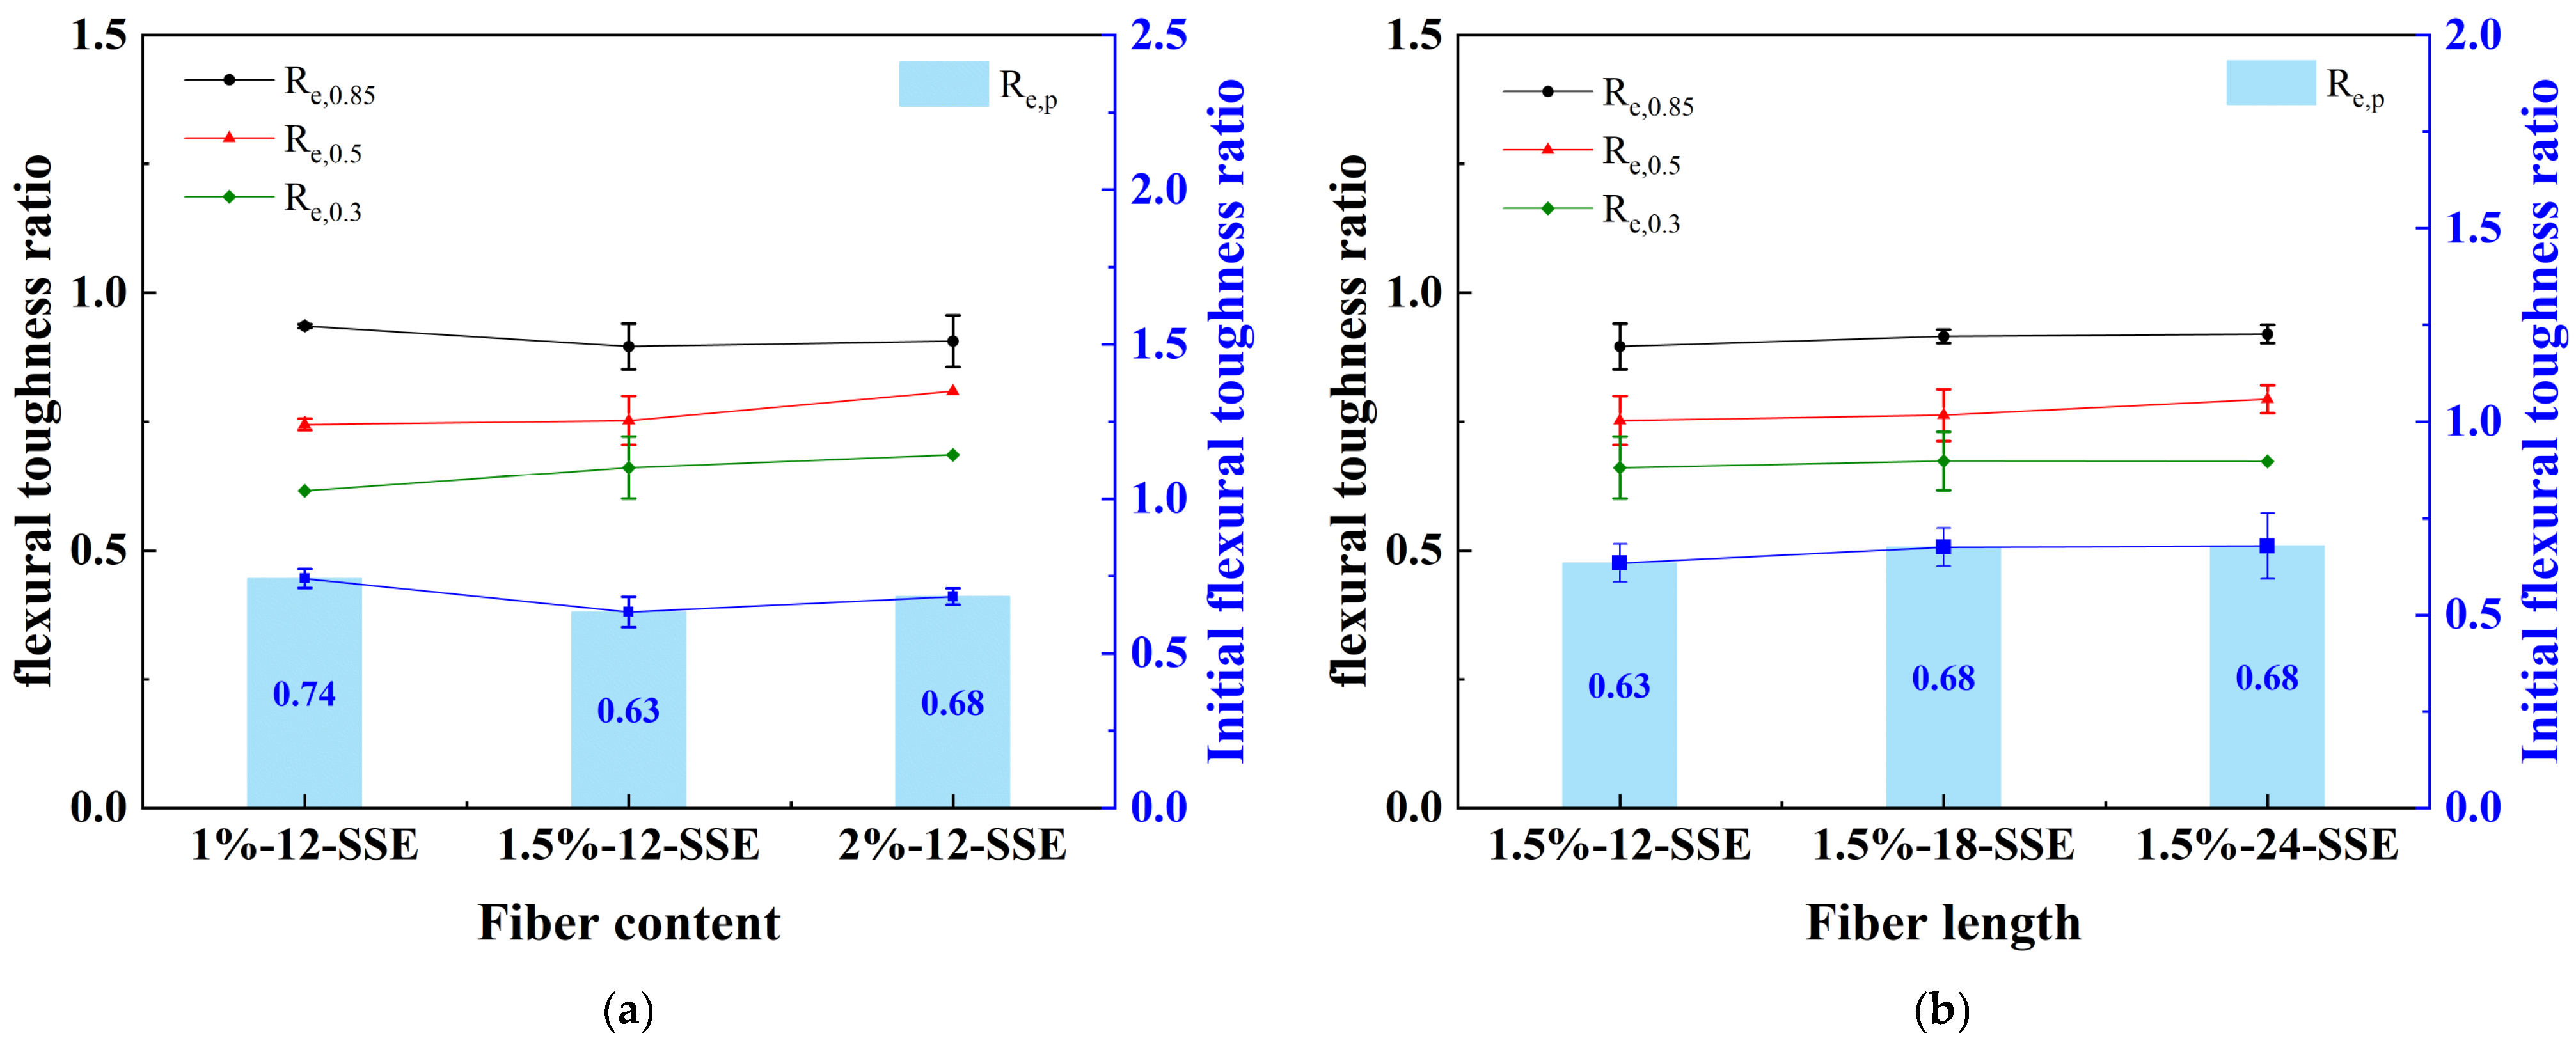
The flexural toughness ratios of ECC derived using Equations (4) and (5) are shown in Figure 12. The initial flexural toughness ratio Re,p, calculated using Equation (4) can be employed to represent the pre-peak flexural toughness of the SS-ECC. The residual flexural toughness ratio Re,k, calculated using Equation (5), is employed to represent the post-peak flexural toughness at various stages of the SS-ECC.
The influence of PE fiber volume content on the pre-peak flexural toughness of ECC is illustrated in Figure 12. As observed in Figure 12a, the initial flexural toughness ratio Re,p of ECC exhibits a non-monotonic trend, first decreasing and then increasing as the fiber content rises from 1% to 2%. The maximum value of Re,p is achieved at the PE fiber volume fraction of 1%. The increase in PE fiber volume content causes fluctuations in the pre-peak flexural toughness of ECC. This behavior may be attributed to the limited deformation of the specimen before reaching the peak load, which restricts the effective mobilization of the bridging action provided by the PE fibers within the ECC. Due to the hydrophobic nature of PE fibers, mixes 1.5%-12-SSE and 2%-12-SSE contain more initial internal defects than mix 1%-12-SSE. Furthermore, the fiber-bridging effect is insufficient to counteract the detrimental impact of these defects. Consequently, the initial flexural toughness ratio Re,p of 1.5%-12-SSE and 2%-12-SSE is lower than that of 1%-12-SSE. When the PE fiber volume fraction is increased to 2%, the restraint effect of the fibers on the development of microcracks in the concrete is enhanced, leading to a slightly higher initial flexural toughness ratio for 2%-12-SSE compared to 1.5%-12-SSE.
The effect of PE fiber volume fraction on the post-peak flexural toughness of ECC is shown in Figure 12. Prior to the bending load declining to 0.85 times the peak load, the bridging action of the PE fibers within the ECC increases compared to that at the peak load. Nevertheless, a portion of the PE fibers still does not fully contribute to the bridging effect at this stage. The variation trend of the residual flexural toughness ratio Re,0.85 with PE fiber content is consistent with that of Re,p, but the disparity among Re,0.85 values at different fiber contents gradually diminishes. After the bending load of ECC decreases to 0.85 times the peak load, the continuous propagation of internal cracks leads to a gradual increase in the number of PE fibers activated for bridging as the fiber volume content rises. Consequently, the residual flexural toughness ratio increases, indicating enhanced post-peak flexural toughness and subsequent load-bearing capacity with higher PE fiber content. This observation aligns with the pattern identified from the flexural toughness indices. A PE fiber volume fraction of 2% exhibits superior post-peak flexural toughness compared to fractions of 1% and 1.5%.
The effect of PE fiber length on the pre-peak flexural toughness of ECC is shown in Figure 12b. The initial flexural toughness ratio of ECC reaches its maximum at PE fiber lengths of 18 mm and 24 mm. For the same fiber volume fraction, the number of fibers in mix 1.5%-12-SSE is greater than in mixes 1.5%-18-SSE and 1.5%-24-SSE. Consequently, this higher fiber count in the shorter-length mix increases the number of internal defects, which results in the pre-peak flexural toughness of mixes 1.5%-18-SSE and 1.5%-24-SSE being higher than that of 1.5%-12-SSE before the bending load reaches its peak.
The effect of PE fiber length on the post-peak flexural toughness of ECC is shown in Figure 12b. Prior to the bending load dropping to 0.85 times the peak load, the PE fibers within the ECC mobilize their bridging effect, resulting in Re,0.85 being greater than Re,p. At the 0.85 peak load level, the fiber-bridging action is fully mobilized, thereby enabling the ECC specimen to exhibit superior flexural toughness. When the bending load of ECC descends to 0.5 times the peak load, the residual flexural toughness ratio Re,0.5 at this load level exhibits an increasing trend with greater fiber length. This indicates that mix 1.5%-24-SSE, compared to mixes 1.5%-12-SSE and 1.5%-18-SSE, demonstrates a superior subsequent load-bearing capacity when the load declines to 0.5 times the peak load. When the load decreases to 0.3 times the peak load, the residual flexural toughness ratios Re,0.3 of mixes 1.5%-18-SSE and 1.5%-24-SSE are marginally higher than that of 1.5%-12-SSE. Combined with the results in Figure 11, it can be concluded that at the same volume content, 24 mm PE fibers impart superior post-peak flexural toughness compared to 12 mm and 18 mm fibers.

4.1.3. Analysis of Equivalent Flexural Toughness of SS-ECC

The equivalent flexural toughness is calculated using Equation (6):
W e u = ( 10 3 Ω u ) / ( b h 2 )
W e u : Equivalent flexural toughness index (kJ/m3); Ωu: Area under the load–deflection curve corresponding to mid-span deflection δk, (N · mm); δk: Deflection corresponding to a load magnitude equal to k (in this study, k takes the values of 0.85, 0.5, and 0.3.) times the peak load in the descending portion of the load–deflection curve (mm).
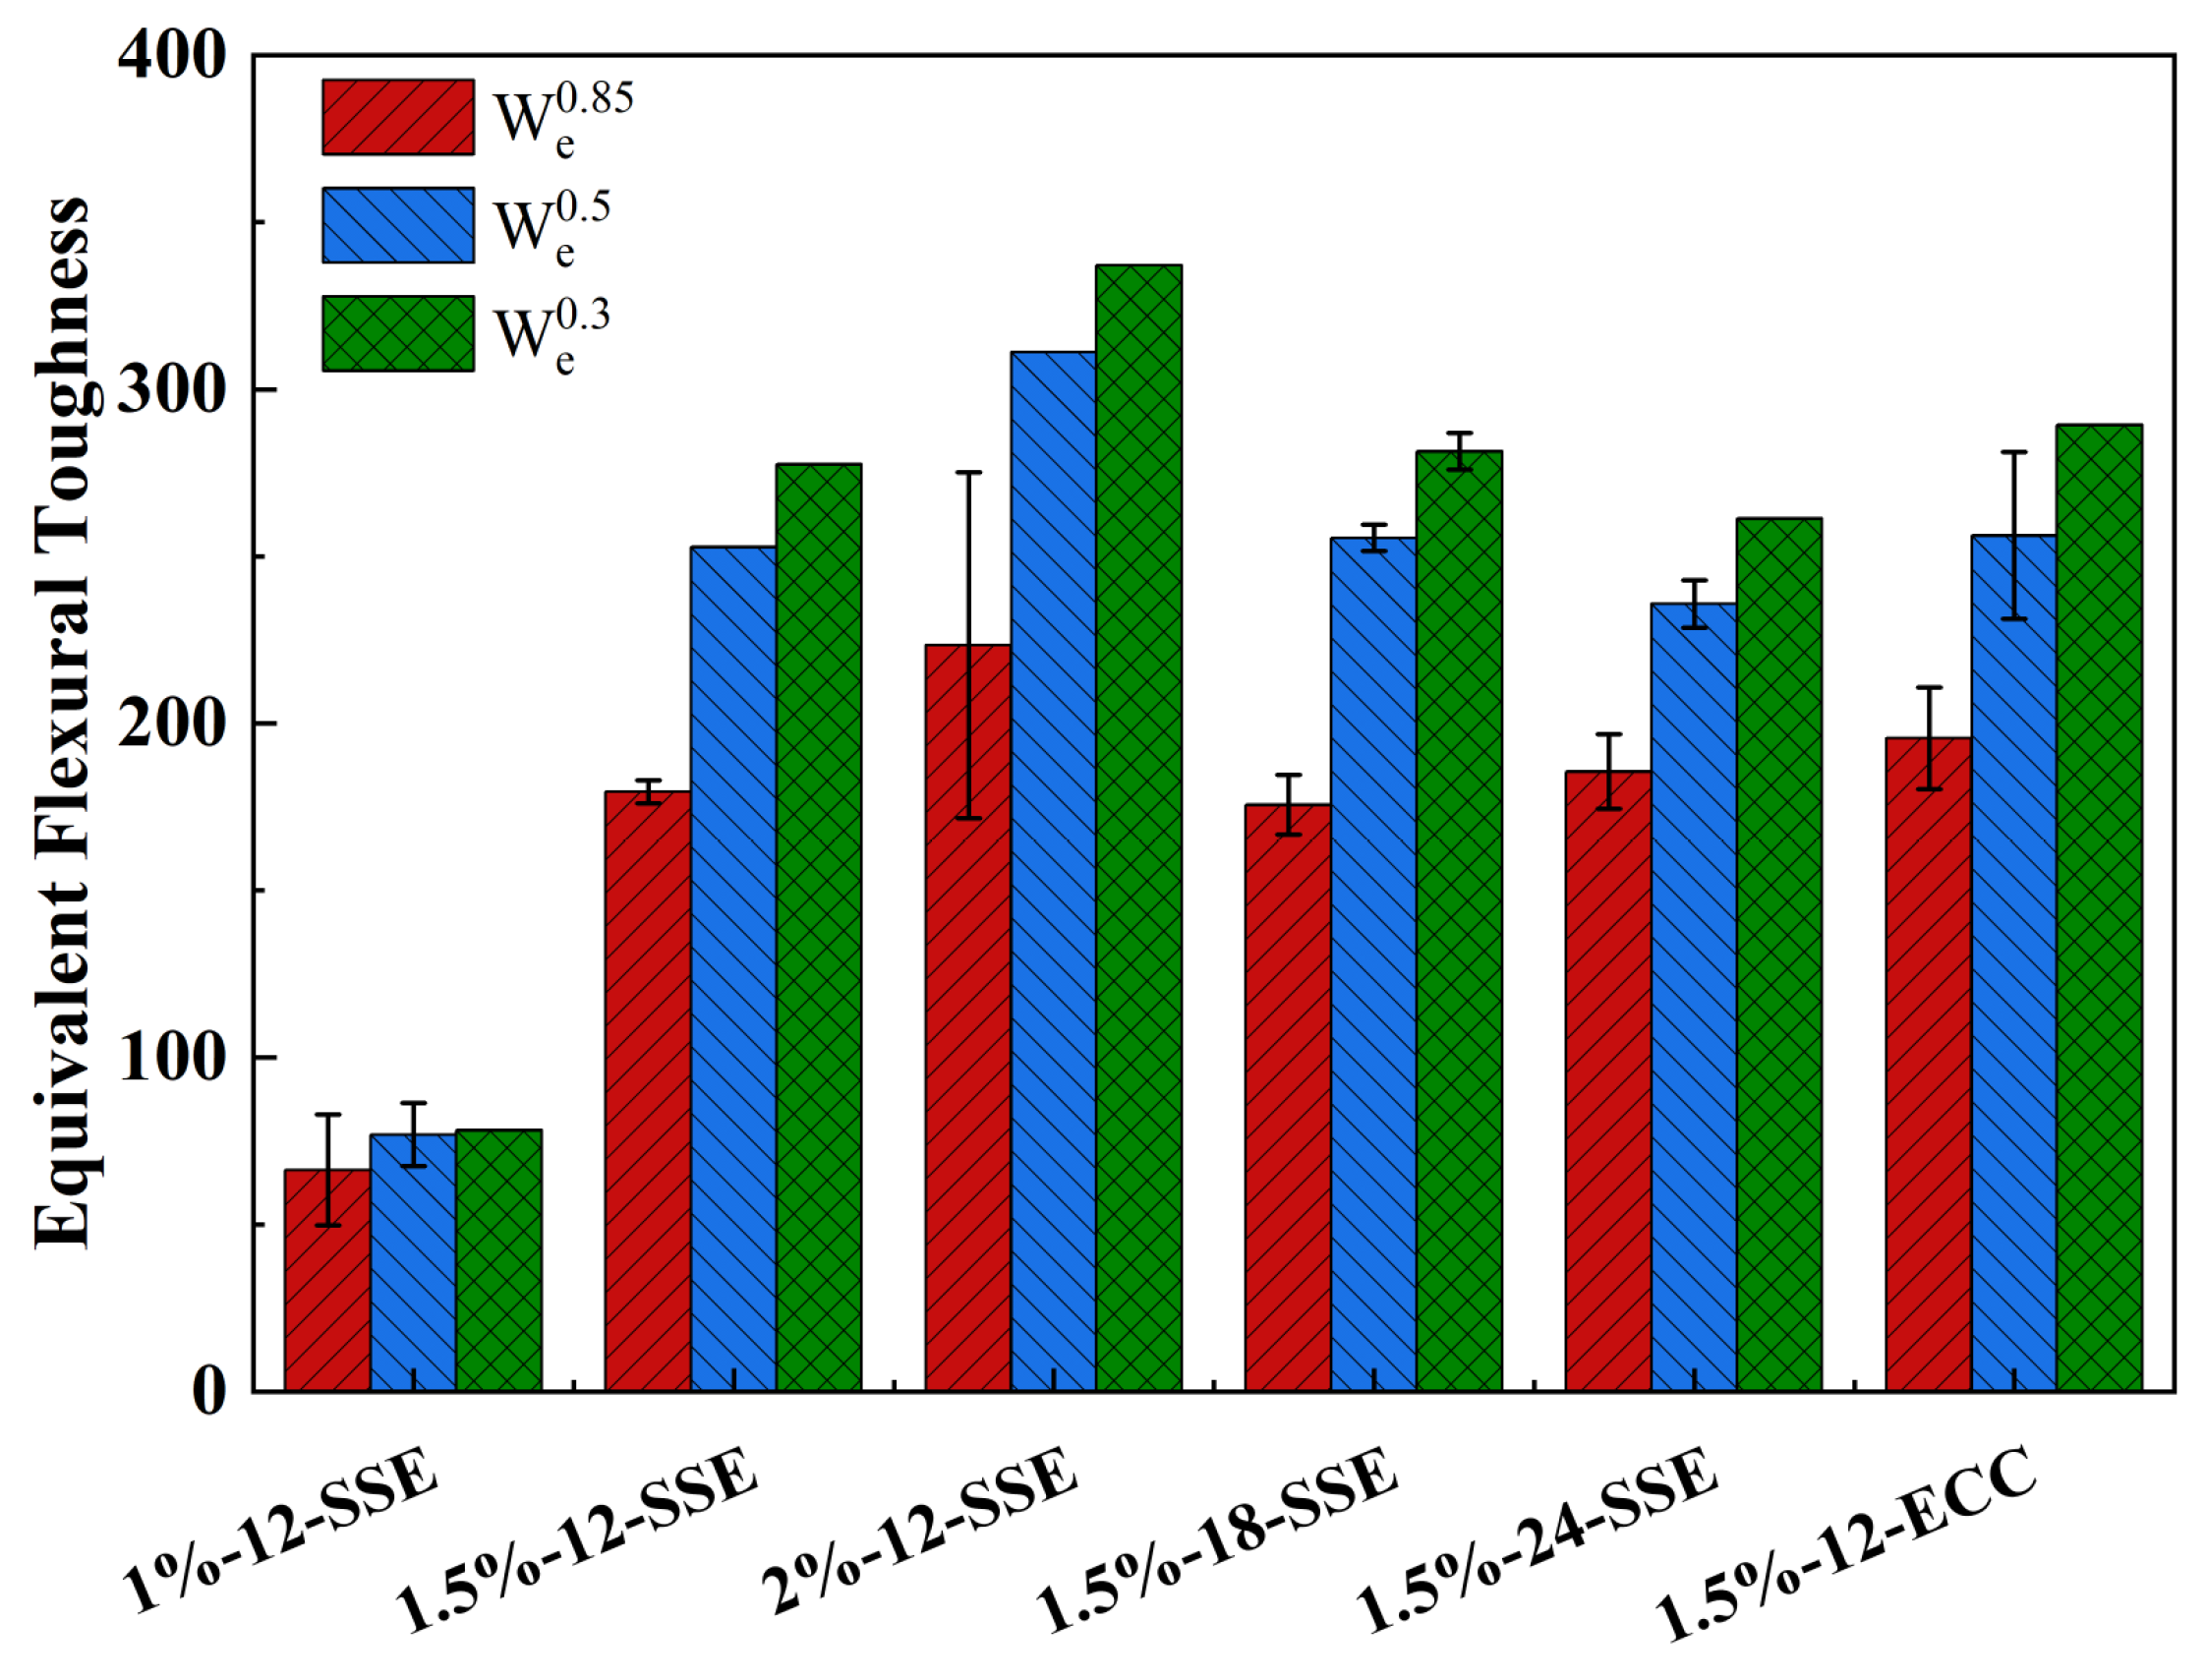
The equivalent flexural toughness of ECC obtained from Equation (6) is shown in Figure 13. The effect of volume fraction and length of PE fiber on the equivalent flexural toughness of SS-ECC is shown in Figure 13. As the PE fiber volume fraction increases from 1% to 2%, the equivalent flexural toughness of SS-ECC is enhanced. When the bending load drops to 85% of the peak load, the influence of the three PE fiber lengths on the equivalent flexural toughness is marginal, which aligns with the conclusions drawn from the previously discussed flexural toughness indices and flexural toughness ratios. As the load further decreases to between 50% and 30% of the peak load, the equivalent flexural toughness exhibits a non-monotonic trend, first increasing and then decreasing with greater fiber length.
Based on the three analytical methods described above, the calculation of the flexural toughness ratio avoids the issue associated with the identification of the first-crack point. Furthermore, it can characterize the flexural toughness of SS-ECC both before and after the peak load. As shown in Figure 11, Figure 12 and Figure 13, the flexural toughness of SS-ECC improves with an increase in PE fiber volume fraction, with the optimum performance observed at a content of 2%. While PE fiber length had a limited effect on the flexural toughness of SS-ECC at small deflections, it significantly enhanced the toughness at larger deflections, with the maximum performance achieved at a length of 24 mm.

4.2. Compressive Toughness of ECC

The methodology for evaluating ECC compressive toughness is evolving. While some studies use the area under the load–displacement curve, Cai et al. [26] referred to equivalent flexural strength and deformation energy to introduce equivalent compressive strength for toughness quantification. Deng et al. [54] refined the methodology by considering compressive deformation during failure, leading to the concept of an equivalent compressive toughness index.
In this paper, the equivalent compressive toughness index (Wcu) is used to judge the compressive toughness of SS-ECC. The calculation formula of the equivalent compressive toughness index (Wcu) is shown in Equation (7):
W cu = Ω u A L
Wcu is the equivalent compressive toughness index; Ωu is the area under the load–displacement curve corresponding to a vertical displacement δu; δu represents the displacement at which the load reduces to u times the peak value, and the parameter u is set to 0.85, 0.5, and 0.3 in this paper; A and L are the cross-sectional area and height of the uniaxial compression specimen, respectively, as shown in Figure 10c.
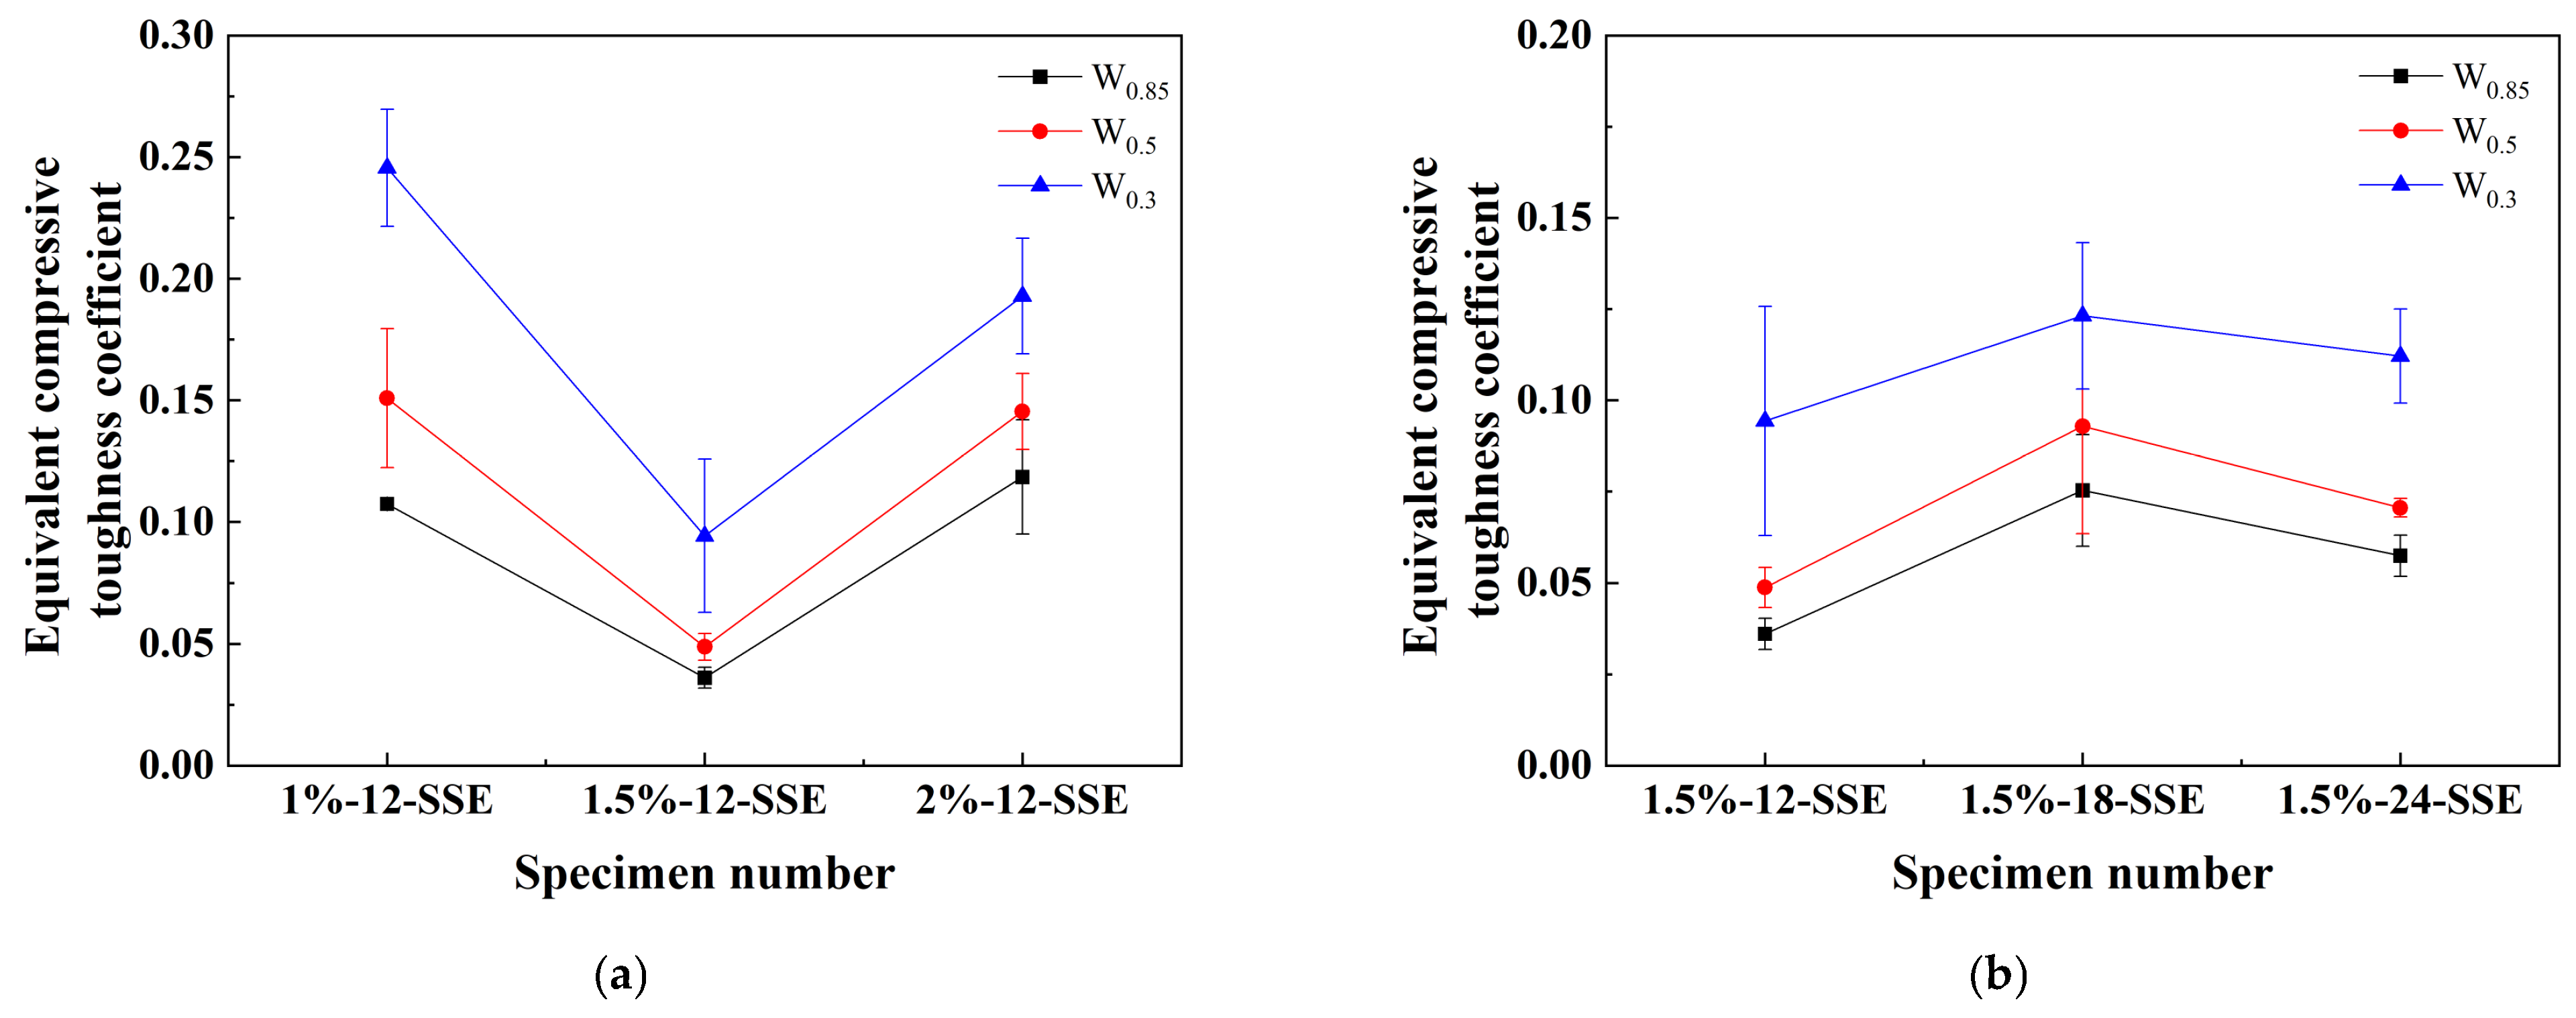
The equivalent compressive toughness of each group of ECC specimens calculated according to Equation (7) is shown in Figure 14:
Owing to the brittle failure nature of cement mortar specimens, the compressive toughness of these specimens has not been calculated in this study. The compressive toughness values of ECC with varying PE fiber contents and lengths are summarized in Figure 14. Figure 14a shows that with increase in fiber content, the equivalent compressive toughness index of ECC decreases first and then increases. Prior to the load descending to 0.5 times the peak load, the compressive toughness of ECC with 1% and 2% PE fiber volumes shows little difference. Subsequently, after the load drops below this level, the ECC with 1% PE fiber content demonstrates superior compressive toughness compared to the mix with 2% fiber content.
The influence of PE fiber length on the compressive toughness of ECC is shown in Figure 14b. As the fiber length increases from 12 mm to 24 mm, the compressive toughness exhibits a non-monotonic trend, first increasing and then decreasing, with the maximum value achieved at a fiber length of 18mm.

5. Prediction Model of Tensile Strength of SS-ECC

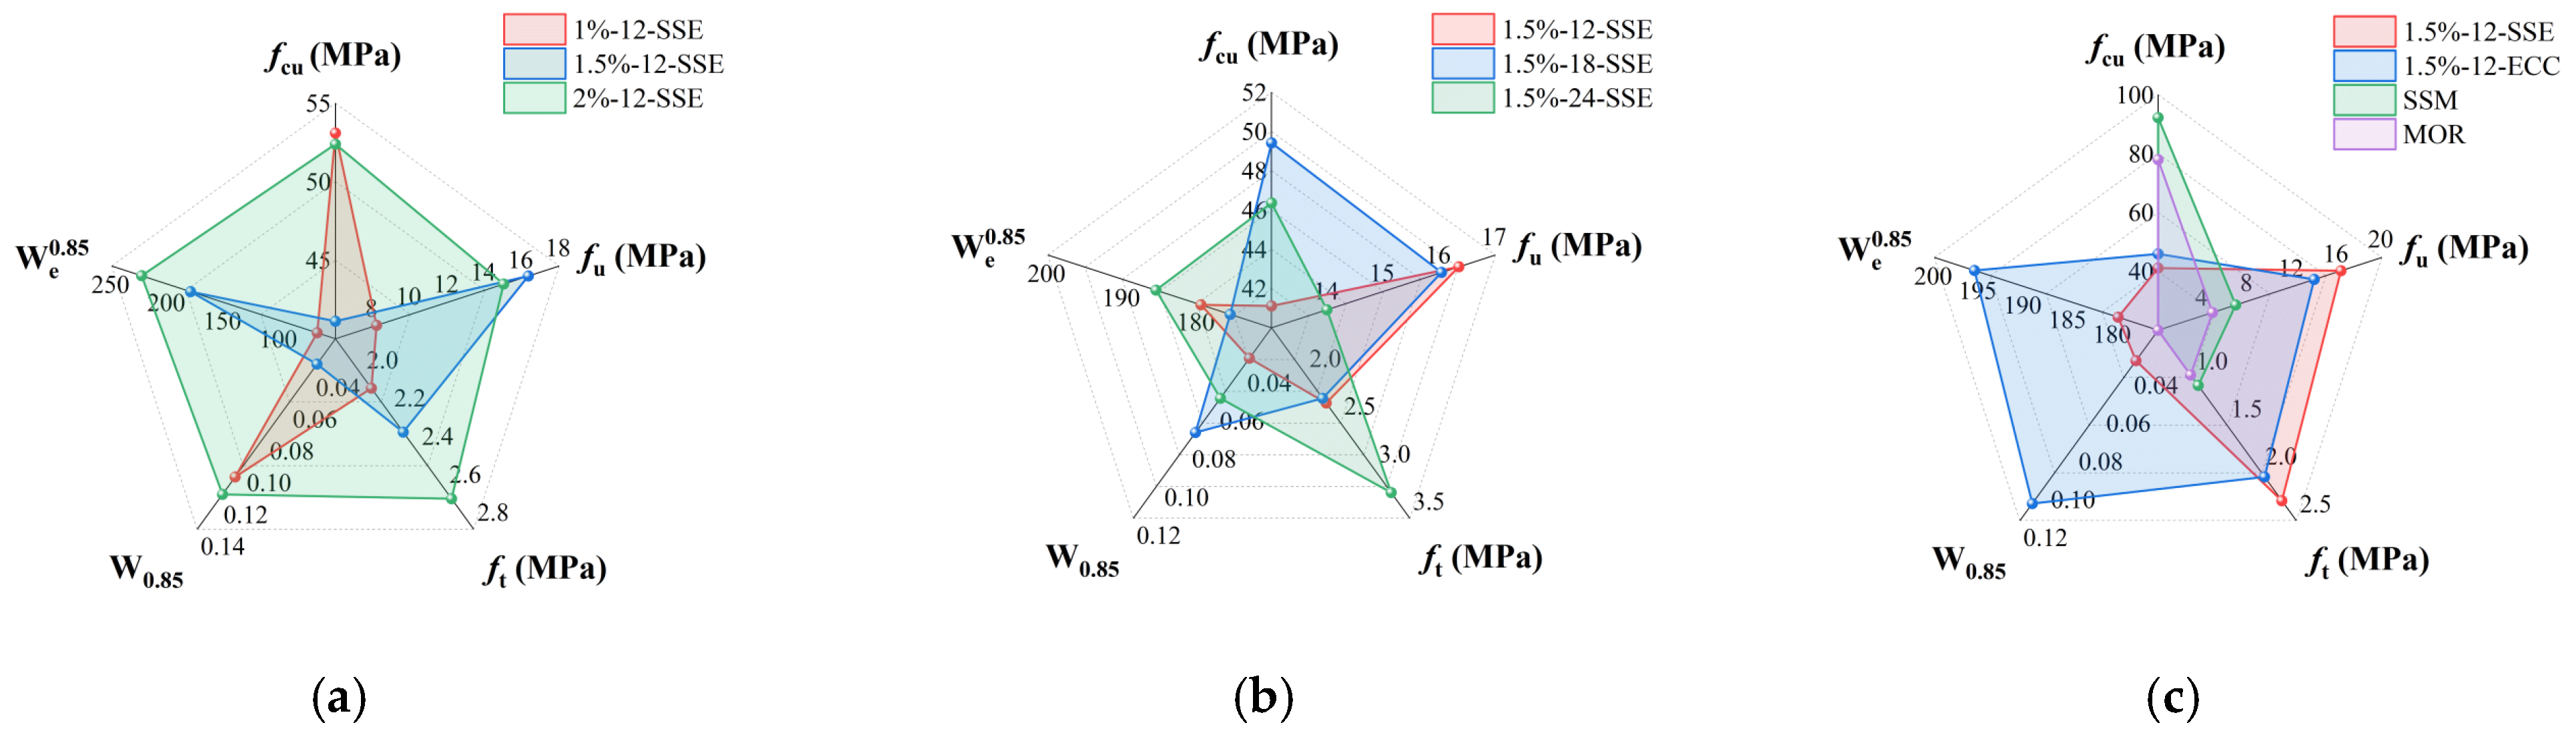
Before further analysis, a summary of the influence of PE fiber is presented in Figure 15.
The influence of PE fiber volume fraction on the mechanical properties of SS-ECC is shown in Figure 15a. As the fiber content increases from 1% to 2%, tensile, flexural strength, and flexural toughness are significantly enhanced. At 2% fiber volume fraction, the compressive strength and toughness are maintained without a significant reduction, with the latter even exhibiting some improvement.
The influence of PE fiber length on the mechanical properties of SS-ECC is shown in Figure 15b. When the fiber length increases from 12 mm to 18 mm, both the compressive strength and toughness of SS-ECC increase, while its tensile and flexural strength and flexural toughness exhibit a slight decrease. When the PE fiber length increases to 24 mm, the tensile strength and flexural toughness of SS-ECC reach their maximum, while the flexural strength reaches its minimum. However, the effect of fiber length on the flexural strength remains limited.
The effects of seawater and sea sand on the mechanical properties of ECC are shown in Figure 15c. Compared with ECC using freshwater and river sand, casting ECC with seawater and sea sand can increase tensile strength and flexural strength, but reduce the compressive strength, compressive toughness, and flexural toughness of ECC. Compared to the cement matrix, although the compressive strength of ECC is reduced, the use of PE fiber improves the tensile strength, flexural strength, uniaxial compression toughness, and flexural toughness of ECC.
The substantial improvements in tensile and flexural properties of SS-ECC can be attributed to effective fiber-bridging across microcracks—a fundamental micromechanical mechanism in ECC. As demonstrated by Zhu et al. [55], the tensile properties of PE-ECC are governed by a fiber–matrix interfacial bond, with tensile ductility dominated by interfacial frictional bond strength, followed by fiber orientation and diameter. This explains our observation that increasing fiber content enhances flexural toughness through progressive energy absorption, while the diminishing improvement rate at higher contents results from fiber agglomeration introducing defects—consistent with findings that excessive fiber content (>2%) negatively impacts mechanical properties due to inadequate dispersion [28].
The contrasting effects of fiber length on toughness under different loading conditions align with micromechanical principles. Our finding that 24 mm fibers enhance post-peak flexural toughness through improved anchorage corresponds to the established understanding that longer embedded length increases pull-out energy dissipation during post-peak deformation [55]. For compressive loading, the optimal performance of 18 mm fibers (108.3% and 31.6% higher toughness than 12 mm and 24 mm fibers) reflects the balance between defect introduction and fiber-bridging efficiency. Lin et al. [23] similarly reported that fiber length significantly influences SS-ECC mechanical performance, with 12 mm fibers yielding maximum compressive and flexural strengths in their study, while our extended range (12–24 mm) identifies 18 mm as optimal for compressive toughness. The reduced performance of longer fibers under compression stems from fiber entanglement and agglomeration, as documented by Lin et al. [23], who observed that longer fibers in ECC tend to form bundles that adversely affect matrix homogeneity, particularly under compressive loading, where uniform stress distribution is critical.

Prediction of Tensile Strength of SS-ECC Under PE Fiber

This study adopts the expression form of the relationship between concrete tensile strength and cube compressive strength from the Chinese code GB/T 50010-2010 [36] to analyze the relationship between the tensile strength and cube compressive strength of ECC. Furthermore, the influence of PE fibers on this relationship is characterized by introducing the fiber characteristic value (λ). The relationship between ECC tensile strength and cube compressive strength is shown in Equation (8):
f t = a ( λ f c u ) ( 2 / 3 )
λ = V f L f / d f
f t : Tensile strength of ECC (MPa); f c u : ECC cube compressive strength (MPa); λ : Fiber characteristic value; V f : PE Fiber Volume Fraction; L f : PE Fiber Length (mm); d f : PE fiber diameter (mm).
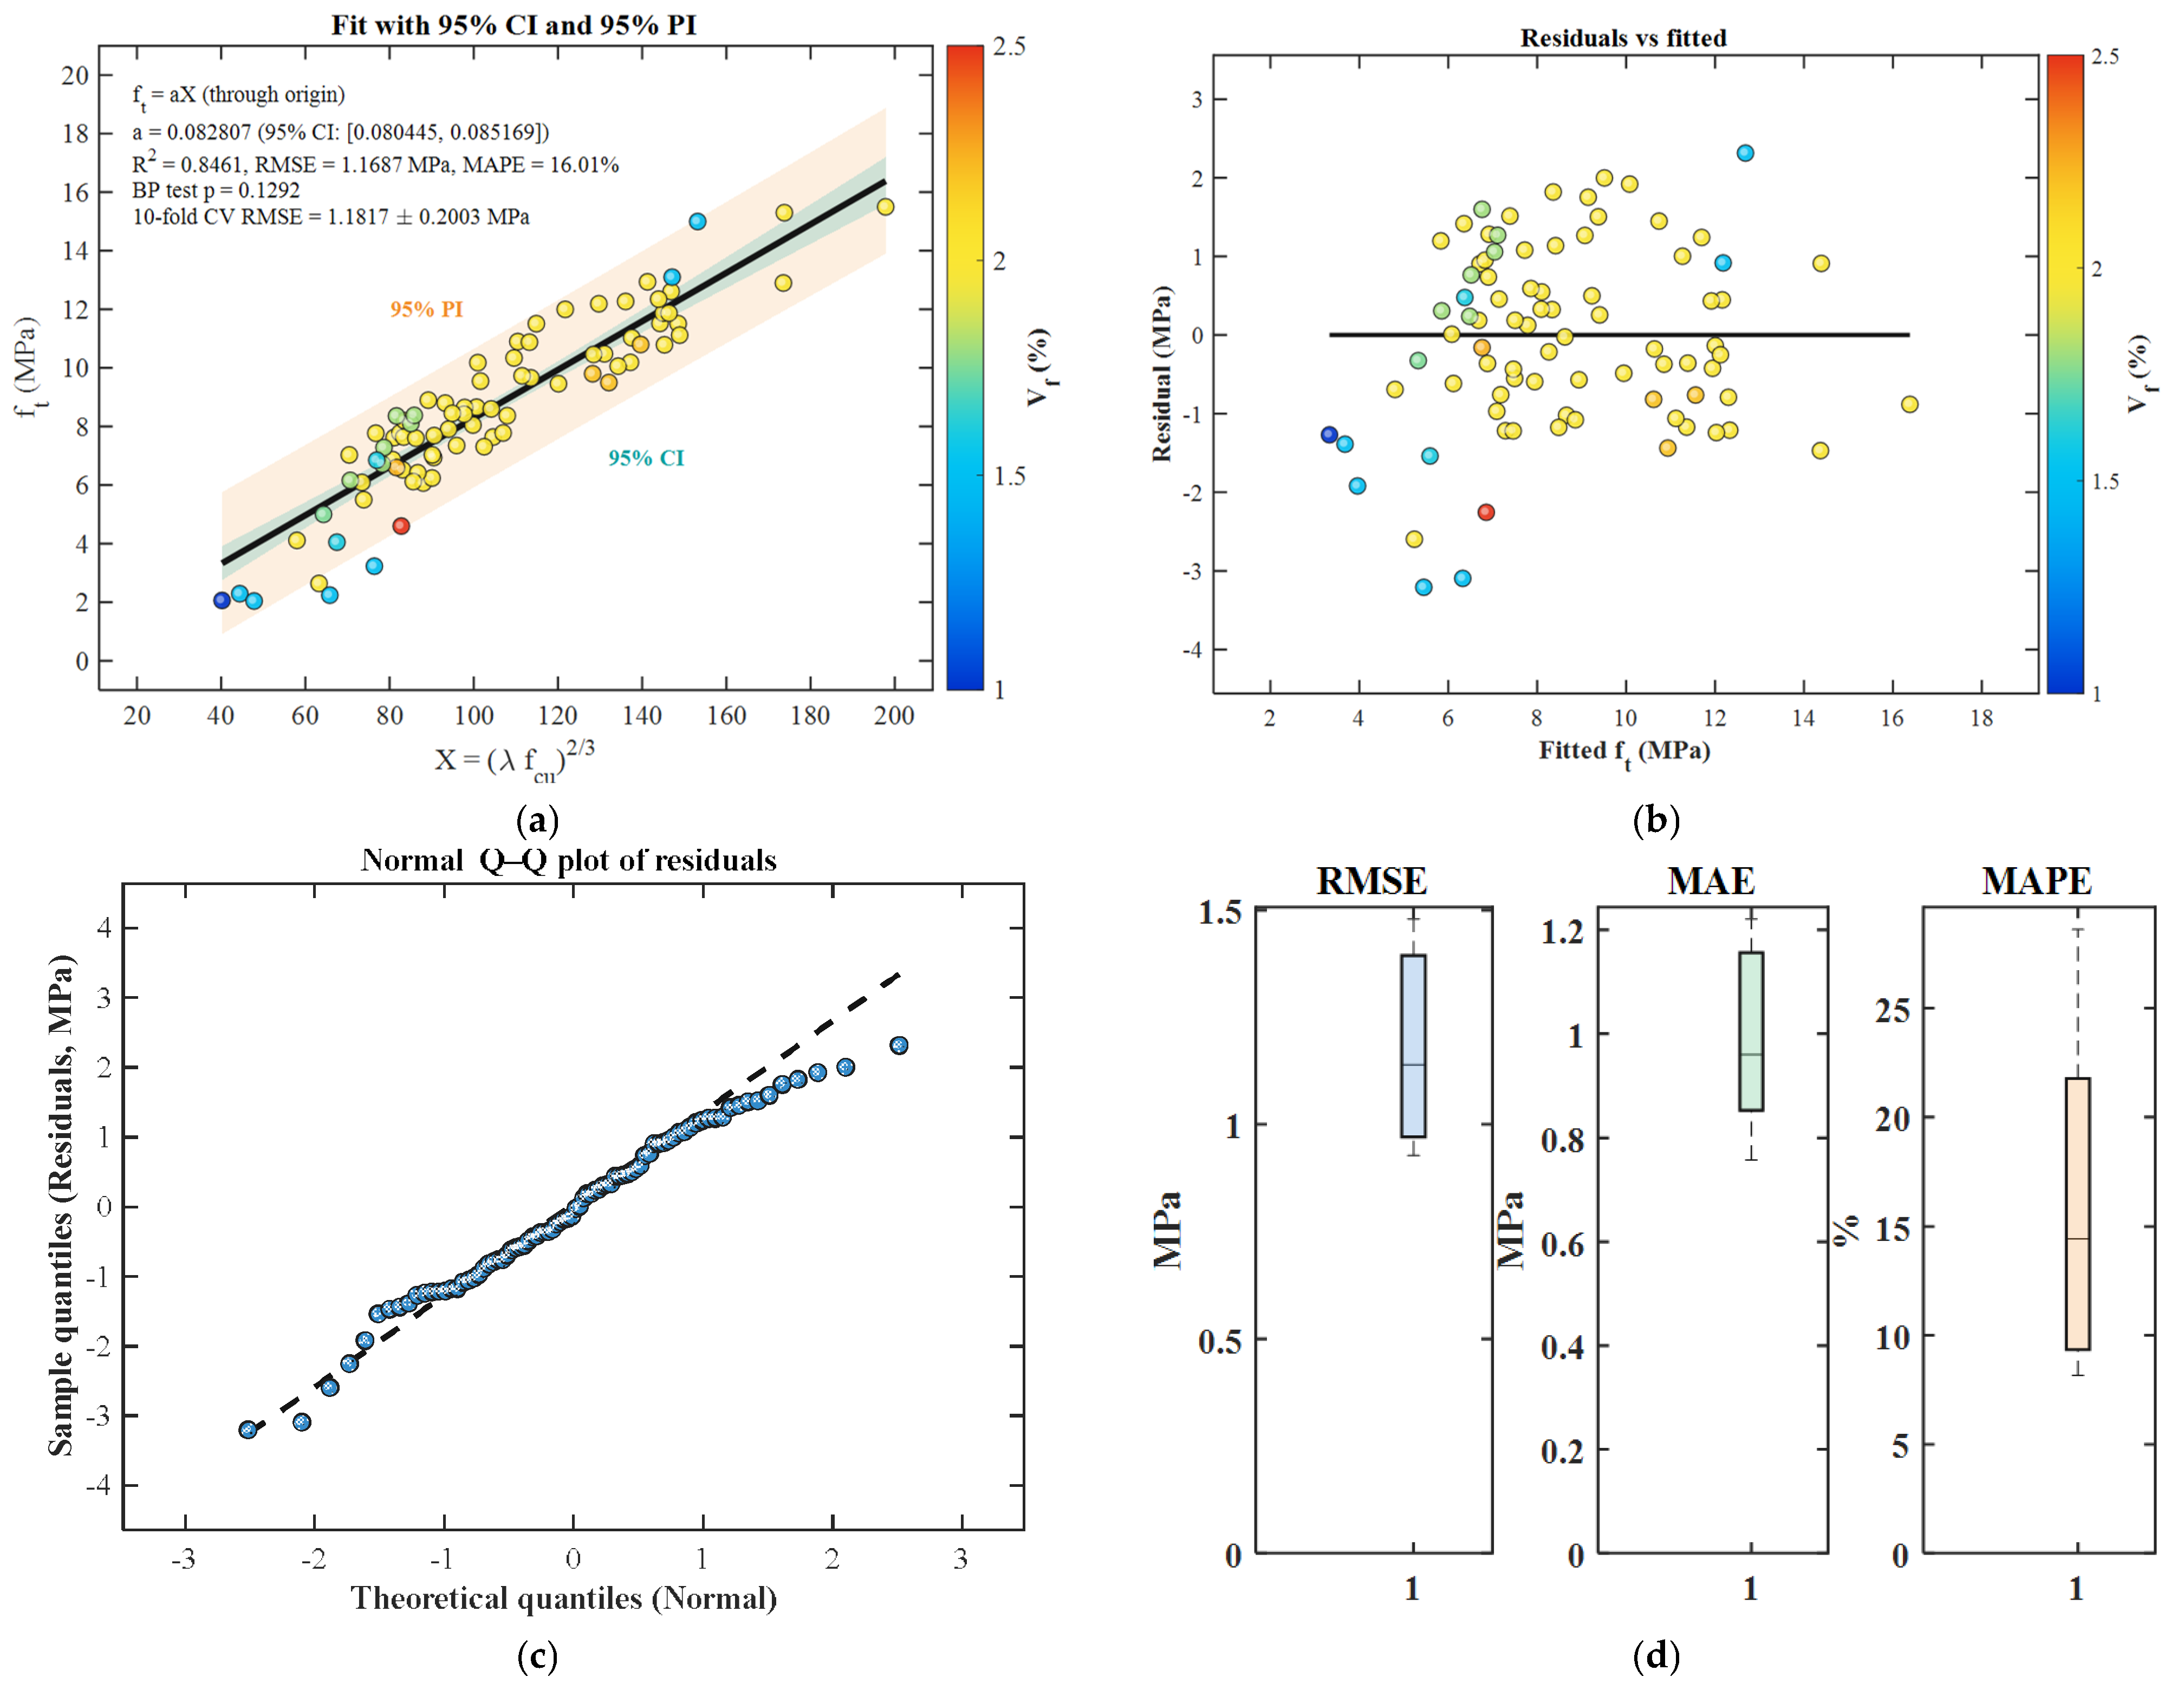
A combined dataset of 84 groups from this study and the literature (Table 8) was analyzed. Let X =(λfcu)2/3; parameter a was estimated by OLS regression through the origin, yielding a = 0.082807 (SE = 0.001180; 95% CI [0.080460, 0.085155]) with in-sample R2 = 0.8461. To avoid reliance on R2 alone, prediction errors are reported as RMSE = 1.1687 MPa, MAE = 0.9612 MPa, and MAPE = 16.01% (Table 9). Model diagnostics (residual-versus-fitted and Q–Q plots) are provided in Figure 16; heteroscedasticity was assessed by the Breusch–Pagan test (LM = 2.3022, p = 0.1292). In addition, 95% confidence and prediction intervals are shown in Figure 16. Model generalization was evaluated by 10-fold cross-validation, giving out-of-sample RMSE = 1.1817 ± 0.2003 MPa, MAE = 0.9900 ± 0.1541 MPa, MAPE = 16.34 ± 6.84%, and R2 = 0.7616 ± 0.1572 (Table 9 and Figure 16). Overall, Equation (8) should be interpreted as an empirical predictor within the investigated data range.
The compiled dataset (84 groups) was assembled from this study and the published literature (Table 8). All entries were harmonized to consistent units (MPa for strengths; mm for Lf and df; Vf as a decimal volume fraction). We acknowledge that literature sources may differ in binder systems, curing regimes, specimen geometry, and test standards, which can introduce systematic variability not explicitly modeled here. Therefore, the proposed relationship is presented as a cross-study empirical correlation and its applicability is limited to the parameter ranges covered by the dataset.
A combined dataset of 84 groups from this study and the literature (see Table 8) was analyzed. The linear fitting result, shown in Figure 16, gives a = 0.082807 ± 0.001180 with R2 = 0.8461. Overall, Equation (8) provides an empirical estimate of ECC tensile strength within the investigated data range, with prediction error, uncertainty bounds, diagnostic checks, and out-of-sample performance quantified via 10-fold cross-validation.

6. Conclusions

This study systematically investigated the effects of PE fiber volume fraction and length on the mechanical strength (including compressive strength, tensile strength, and flexural strength) and toughness (including flexural and compressive toughness) of SS-ECC. Based on 84 sets of tensile and cube compressive strength data, a predictive formula for SS-ECC tensile strength, which accounts for the PE fiber characteristic value, was established. The results provide valuable insights and quantitative guidelines for designing high-performance, durable marine concrete structures using locally available seawater and sea sand, thereby supporting the development of sustainable cementitious materials for ocean engineering. The main conclusions are as follows:
(1)
PE fiber reinforcement substantially improves the tensile and flexural properties of SS-ECC while maintaining reasonable compressive resistance. These improvements are attributed to effective fiber-bridging across microcracks, which delays localized cracking and enhances load-bearing capacity after matrix cracking. The tensile and flexural strength of SS-ECC show substantial improvements over SSM, increasing by 90.7% to 199.1%, and 18.3% to 135.6%, respectively, over SSM. Seawater and sea sand further enhance tensile and flexural performance compared to freshwater and river sand mixtures.
(2)
Fiber content exhibits contrasting effects on different toughness measures. As the PE fiber content rises from 0% to 2%, the flexural toughness of SS-ECC evaluated by all three calculation methods shows progressive enhancement. This trend aligns with previous findings that higher fiber volume increases energy absorption through multiple cracking, though the rate of improvement diminishes at higher contents due to fiber agglomeration. In contrast, compressive toughness follows a U-shaped response, reaching its lowest value at 1.5% fiber content—a pattern consistent with the trade-off between defect introduction and fiber-bridging efficiency.
(3)
The influence of fiber length on toughness depends on both the loading condition and the post-peak stage considered. At 85% of peak load, fiber length has little influence on flexural toughness. However, at later post-peak stages (50–30% peak load), longer fibers (24 mm) enhance toughness through improved anchorage and pull-out resistance. Longer fibers develop higher bridging stresses at larger crack openings due to greater embedment length, which increases pull-out energy dissipation during post-peak deformation. For compressive loading, intermediate fiber length (18 mm) proves most effective. When fiber length is 12 mm, the higher content of hydrophobic PE fibers introduces more defects into the SS-ECC matrix, reducing compressive toughness. When fiber length is 24 mm, PE fibers tend to entangle and agglomerate within the matrix, adversely affecting compressive performance. The 18 mm fiber length achieves an optimal balance between these two opposing effects. When fiber length is 18 mm, compressive toughness increases by 108.3% and 31.6% compared to 12 mm and 24 mm fibers.
(4)
A predictive model for the tensile strength of PE-fiber-reinforced ECC was developed based on the characteristic values of the fibers. Calibrated against 84 experimental datasets, the model yields a coefficient of determination (R2) of 0.8461, indicating reasonable correlation with the experimental results within the parameter range examined. This level of accuracy suggests its potential as a preliminary tool for estimating the tensile strength of SS-ECC formulations.
(5)
Based on the experimental results, the following design recommendations are proposed for SS-ECC formulations tailored to specific performance requirements: For maximizing tensile strength and flexural toughness, a PE fiber content of 2% and fiber length of 24 mm are recommended. For optimizing compressive toughness, a PE fiber length of 18 mm is preferable, with fiber content selected based on the trade-off between strength and ductility. For applications requiring balanced mechanical performance, intermediate parameters (1.5% fiber content combined with 18 mm fiber length) offer a reasonable compromise among tensile strength, flexural properties, and compressive toughness. These recommendations provide practical guidance for developing SS-ECC mixtures suited to various coastal and offshore engineering applications, though long-term durability considerations warrant further investigation.
In summary, this research clarifies the individual and distinct effects of PE fiber content and length on the strength–toughness relationship of SS-ECC. It quantitatively demonstrates the performance benefits of using seawater and sea sand and supplies a validated predictive tool for tensile strength. The outcomes advance the fundamental understanding of sustainable cementitious composites and deliver directly applicable insights for designing durable, high-performance marine concrete structures using locally available materials.

7. Limitations and Future Work

Due to the unavailability of DIC data, this study could not quantify the ultimate tensile strain, strain-hardening plateau, or crack characteristics (width, spacing) of SS-ECC—core parameters for strain-hardening cementitious composites. While tensile strength was reliably captured, the absence of these metrics limits the completeness of the tensile characterization. Future work will systematically investigate these omitted tensile parameters, prioritizing robust DIC acquisition and storage protocols to ensure complete analysis of strain-hardening response and crack development.
Given the absence of quantitative microstructural and durability characterization (e.g., XRD, MIP, chloride-binding/transport) in this study, the mechanisms related to chloride interaction—such as Friedel’s salt formation and potential pore structure refinement—remain plausible but unverified.
Future studies will quantify durability and microstructure to support marine-exposure applications, including XRD/Rietveld quantification of Friedel’s salt, MIP/quantitative pore analysis, chloride-binding isotherms and transport tests, and long-term seawater immersion and wetting–drying cycles coupled with mechanical retention.

Author Contributions

Conceptualization, Q.X.; methodology, Z.W. and Q.X.; formal analysis, Z.W. and Q.X.; investigation, Z.W., J.Z., H.D., and H.H.; data curation, Z.W., J.Z., and H.H.; writing—original draft preparation, Z.W. and Q.X.; writing—review and editing, Z.W. and Q.X.; visualization, Z.W., J.Z., H.D., and H.H.; supervision, Q.X.; funding acquisition, Z.W. and Q.X. All authors have read and agreed to the published version of the manuscript.

Funding

This research was funded by the grants from the National Natural Science Foundation of China (52408177, 52378179), the “Qing Lan Project” of the Jiangsu Higher Education Institutions of China, Postgraduate Research and Practice Innovation Program of Jiangsu Ocean University (KYCX2024-60), Science and Technology Project of Jiangsu Provincial Construction System (2024ZD019), and Lianyungang Key and Development Program (CG2402).

Data Availability Statement

The original contributions presented in this study are included in the article. Further inquiries can be directed to the corresponding author.

Conflicts of Interest

Author Heng Dai was employed by the company Lianyungang Transport Group Co., Ltd. The remaining authors declare that the research was conducted in the absence of any commercial or financial relationships that could be construed as a potential conflict of interest.

References

  1. Zhu, J.; Xu, L.; Huang, B.; Weng, K.; Dai, J. Recent developments in engineered/strain-hardening cementitious composites (ECC/SHCC) with high and ultra-high strength. Constr. Build. Mater. 2022, 342, 127956. [Google Scholar] [CrossRef]
  2. Zhang, Z.; Wu, X.; Sun, Q.; Tian, P.; Hu, G. Compressive behavior of corroded reinforced concrete columns strengthened with BFRP reinforced ECC in marine environment. Ocean Eng. 2023, 279, 114533. [Google Scholar] [CrossRef]
  3. Huang, W.; Deng, X.; Li, S.; Zhang, Z.; Lian, H.; Liu, F.; Zhang, C.; Zhang, H. Investigation on the effect of fiber on the constrained shrinkage performance of engineering cementitious composite (ECC). Constr. Build. Mater. 2025, 458, 139612. [Google Scholar] [CrossRef]
  4. Yu, K.; Li, L.; Yu, J.; Wang, Y.; Ye, J.; Xu, Q. Direct tensile properties of engineered cementitious composites: A review. Constr. Build. Mater. 2018, 165, 346–362. [Google Scholar] [CrossRef]
  5. Li, J.; Qiu, J.; Weng, J.; Yang, E. Micromechanics of engineered cementitious composites (ECC): A critical review and new insights. Constr. Build. Mater. 2023, 362, 129765. [Google Scholar] [CrossRef]
  6. Choi, J.; Park, S.; Kim, Y.; Yang, K.; Kim, Y.; Lee, B. Highly ductile behavior and sustainability of engineered cementitious composites reinforced by PE based selvage fibers. Cem. Concr. Compos. 2022, 134, 104729. [Google Scholar] [CrossRef]
  7. Zhang, Y.; Zhang, S.; Deng, M. Four-point bending tests of ECC: Mechanical response and toughness evaluation. Case Stud. Constr. Mater. 2022, 17, e01573. [Google Scholar] [CrossRef]
  8. Şahmaran, M.; Özbay, E.; Yücel, H.E.; Lachemi, M.; Li, V.C. Frost resistance and microstructure of engineered cementitious composites: Influence of fly ash and micro poly-vinyl-alcohol fiber. Cem. Concr. Compos. 2012, 34, 156–165. [Google Scholar] [CrossRef]
  9. Pinle, Z.; Wahab, A.G.; Xu, G.; Tao, Z.; Elias, S. Seismic performance of RC short-leg shear walls reinforced with HF-ECC: Experimental and numerical investigations. Structures 2025, 80, 110042. [Google Scholar] [CrossRef]
  10. Ye, J.; Cui, C.; Yu, J.; Yu, K.; Dong, F. Effect of polyethylene fiber content on workability and mechanical-anisotropic properties of 3D printed ultra-high ductile concrete. Constr. Build. Mater. 2021, 281, 122586. [Google Scholar] [CrossRef]
  11. Tang, R.; Chen, D.; Liu, F.; Fan, J.; Zou, Y. Mechanical property and frost resistance of phase–change/NanoSiO2 concrete in a low–temperature environment. Constr. Build. Mater. 2024, 439, 137387. [Google Scholar] [CrossRef]
  12. Yao, Q.; Li, Q.; Teng, X.; Luo, D. Development of low-carbon sea sand engineered cementitious composites (LSECCs): Performance, cracking behavior and trilinear tensile constitutive model. Constr. Build. Mater. 2024, 449, 138344. [Google Scholar] [CrossRef]
  13. Yang, J.; Deng, M.; Wang, Y.; Zhang, Y. Uniaxial tensile test of high-strength high-ductility concrete (HSHDC): Mechanical response and toughness evaluation. J. Build. Eng. 2024, 89, 109332. [Google Scholar] [CrossRef]
  14. Yu, H.; Yang, D.; Xiao, Y.; Luo, Q.; Qu, F.; Zhu, D.; Park, H.; Zhang, Y. Experimental study on the constitutive model and energy evolution law of PE-ECC under uniaxial tension. Constr. Build. Mater. 2025, 487, 142068. [Google Scholar] [CrossRef]
  15. Zhou, Y.; Xi, B.; Sui, L.; Zheng, S.; Xing, F.; Li, L. Development of high strain-hardening lightweight engineered cementitious composites: Design and performance. Cem. Concr. Compos. 2019, 104, 103370. [Google Scholar] [CrossRef]
  16. Su, Y.; Wang, X.; Wu, C.; Xu, M.; Jin, C. Experimental investigation of flexural and punching behavior for plain PE-ECC slabs with different fiber volume fractions and span-depth ratios. Constr. Build. Mater. 2024, 441, 137502. [Google Scholar] [CrossRef]
  17. Xie, Q.; Xiao, J.; Zhang, K.; Zong, Z. Compressive behavior and microstructure of concrete mixed with natural seawater and sea sand. Front. Struct. Civ. Eng. 2021, 15, 1347–1357. [Google Scholar] [CrossRef]
  18. Wei, J.; Ke, L.; Wang, P.; Li, W.; Leung, C.K.Y. Microstructure, mechanical properties and interaction mechanism of seawater sea-sand engineered cementitious composite (SS-ECC) with Glass Fiber Reinforced Polymer (GFRP) bar. Compos. Struct. 2024, 343, 118302. [Google Scholar] [CrossRef]
  19. Xie, Q.; Xiao, J.; Zong, Z. Strength and microstructure of seawater and sea sand mortar after exposure to elevated temperatures. Constr. Build. Mater. 2022, 322, 126451. [Google Scholar] [CrossRef]
  20. Yu, K.; Ding, Y.; Liu, J.; Bai, Y. Energy dissipation characteristics of all-grade polyethylene fiber-reinforced engineered cementitious composites (PE-ECC). Cem. Concr. Compos. 2020, 106, 103459. [Google Scholar] [CrossRef]
  21. Huang, B.; Yu, J.; Wu, J.; Dai, J.; Leung, C.K.Y. Seawater sea-sand Engineered Cementitious Composites (SS-ECC) for marine and coastal applications. Compos. Commun. 2020, 20, 100353. [Google Scholar] [CrossRef]
  22. Liu, J.; Fan, X.; Liu, J.; Jin, H.; Zhu, J.; Liu, W. Investigation on mechanical and micro properties of concrete incorporating seawater and sea sand in carbonized environment. Constr. Build. Mater. 2021, 307, 124986. [Google Scholar] [CrossRef]
  23. Lin, C.; Wang, S.; Chen, M.; Lu, Y. Experimental study on the mechanical properties of different fiber-reinforced seawater sea-sand engineered cementitious composites. Constr. Build. Mater. 2021, 304, 124562. [Google Scholar] [CrossRef]
  24. Liu, M.; Li, D. Chloride binding in low-carbon cementitious composites: Mechanisms, characteristics and performance. J. Build. Eng. 2025, 108, 112924. [Google Scholar] [CrossRef]
  25. Sun, M.; Sun, C.; Zhang, P.; Liu, N.; Li, Y.; Duan, J.; Hou, B. Influence of carbonation on chloride binding of mortars made with simulated marine sand. Constr. Build. Mater. 2021, 303, 124455. [Google Scholar] [CrossRef]
  26. Cai, X.; Xu, S. Experimental measurement and evaluation indexes of toughness properties for UHTCC under uniaxial compression. Eng. Mech. 2010, 27, 218–224. [Google Scholar]
  27. Ji, J.; Zhang, Z.; Lin, M.; Li, L.; Jiang, L.; Ding, Y.; Yu, K. Structural application of engineered cementitious composites (ECC): A state-of-the-art review. Constr. Build. Mater. 2023, 406, 133289. [Google Scholar] [CrossRef]
  28. Huang, B.; Wu, J.; Yu, J.; Dai, J.; Leung, C.K.Y. High-strength seawater sea-sand engineered cementitious composites (SS-ECC): Mechanical performance and probabilistic modeling. Cem. Concr. Compos. 2020, 114, 103740. [Google Scholar] [CrossRef]
  29. Huang, B.; Wu, J.; Yu, J.; Dai, J.; Leung, C.K.Y.; Li, V. Seawater sea-sand engineered/strain-hardening cementitious composites (ECC/SHCC): Assessment and modeling of crack characteristics. Cem. Concr. Res. 2021, 140, 106292. [Google Scholar] [CrossRef]
  30. Lao, J.; Huang, B.; Xu, L.; Khan, M.; Fang, Y.; Dai, J. Seawater sea-sand engineered geopolymer composites (EGC) with high strength and high ductility. Cem. Concr. Compos. 2023, 138, 104998. [Google Scholar] [CrossRef]
  31. Gao, X.; Li, W.; Ke, L.; Wang, P.; Wei, J.; Zhong, Y.; Wu, H.; Zhou, Y. Effects of saline contents on tensile behavior and fiber-matrix interaction in seawater sea-sand engineered cementitious composite (SS-ECC). Constr. Build. Mater. 2025, 467, 140306. [Google Scholar] [CrossRef]
  32. JGJ/T 70-2009; Standard for Test Method of Basic Properties of Construction Mortar. China Architecture & Building Press: Beijing, China, 2009.
  33. JC/T 2461-2018; Standard Test Method for the Mechanical Properties of Ductile Fiber Reinforced Cementitious Composites. China Building Materials Industry Press: Beijing, China, 2018.
  34. T/CCPA 7-2018; Fundamental Characteristics and Test Methods of Ultra-High Performance Concrete. China Construction Science and Technology Press: Beijing, China, 2018.
  35. Liao, Q.; Yu, J.; Dong, F.; Su, Y.; Yu, K. FRP bars reinforced seawater sea-sand engineered cementitious composites beams with various salinities: Shear behaviors and cost effectiveness. J. Build. Eng. 2024, 83, 108452. [Google Scholar] [CrossRef]
  36. GB/T50010-2010; Code for Design of Concrete Structures. China Architecture and Building Press: Beijing, China, 2024.
  37. Bi, Y.; Yang, C.; Zhou, T.; Zhan, X.; Guo, H.; Zhu, F.; Yao, Y. Theoretical and finite element analysis of engineered cementitious composite (ECC) link slab in hollow slab beam bridge base on different load conditions. Eng. Struct. 2024, 308, 118045. [Google Scholar] [CrossRef]
  38. Zhang, Y.; Li, L.; Hou, J.; Lv, Y.; Dong, Z.; Deng, B. Mechanism-based bond-slip and strength modeling for steel rebar in high-strength ECC. Constr. Build. Mater. 2025, 493, 143168. [Google Scholar] [CrossRef]
  39. Amieghemen, G.E.; Jeffrey Morris, J.; Sherif, M.M. Compressive response of bio-strengthened engineered cementitious composites (ECC) with self-healing characteristics. Compos. Struct. 2026, 375, 119802. [Google Scholar] [CrossRef]
  40. Li, J.; Li, V.C.; Zhang, D. Breaking strength-ductility trade-off dilemma for Engineered Cementitious Composites (ECC) through filler effect. Cem. Concr. Compos. 2025, 164, 106248. [Google Scholar] [CrossRef]
  41. Liang, L.; Lu, X.; Ding, Y.; Yu, J.; Li, V.; Yu, K. High-modulus engineered cementitious composites: Design mechanism and performance characterization. Cem. Concr. Compos. 2024, 154, 105782. [Google Scholar] [CrossRef]
  42. Ding, Y.; Yu, K.; Li, M. A review on high-strength engineered cementitious composites (HS-ECC): Design, mechanical property and structural application. Structures 2022, 35, 903–921. [Google Scholar] [CrossRef]
  43. Yu, K.; Yu, J.; Dai, J.; Lu, Z.; Shah, S. Development of ultra-high performance engineered cementitious composites using polyethylene (PE) fibers. Constr. Build. Mater. 2018, 158, 217–227. [Google Scholar] [CrossRef]
  44. ASTM C1609/C1609M-24; Standard Test Method for Flexural Performance of Fiber Reinforced Concrete (Using Beam with Third-Point Loading). ASTM International: West Conshohocken, PA, USA, 2024.
  45. Yang, D.; Xiao, Y.; Chen, R.; Zhu, G.; Luo, Q.; Li, Q.; Zhang, Y. Three-dimensional mesoscale analysis of the bending behavior of polyethylene fiber reinforced engineered cementitious composite. Constr. Build. Mater. 2025, 462, 140027. [Google Scholar] [CrossRef]
  46. Yu, G.; Deng, Z. Bending behaviors of two-way slab of UHPC with steel fiber and micro-nonmetallic fiber. J. Jilin Univ. (Eng. Technol. Ed.) 2024, 54, 3265–3273. [Google Scholar] [CrossRef]
  47. Wu, H.; Long, G.; Yang, K.; Zeng, X.; Tang, Z. Effects of PE fiber and fine rubber particles on flexural toughness of foam concrete. J. Build. Mater. 2024, 27, 206–214. [Google Scholar] [CrossRef]
  48. Wei, B.; He, X.; Zhang, S.; Tang, Z.; Wang, H.; Zhou, M. Experimental study on mechanical properties of hybrid fiber-reinforced high-strength concrete and flexural toughness of beams. J. Build. Eng. 2025, 112, 113905. [Google Scholar] [CrossRef]
  49. CECS 13-2009; Standard Test Methods for Fiber Reinforced Concrete. China Planning Publishing House: Beijing, China, 2010.
  50. JG/T 472-2015; Steel Fiber Reinforced Concrete. China Standards Press: Beijing, China, 2015.
  51. JSCE-SF4; Recommendations for Design and Construction of High Performance Fiber Reinforced Cement Composites with Multiple fine Cracks. Japan Society of Civil Engineers: Tokyo, Japan, 2005.
  52. Zhao, J.; Wang, J.; Li, X.; Shen, F. Mechanical properties and flexural toughness evaluation method of steel fiber reinforced concrete after exposure to elevated temperatures. Constr. Build. Mater. 2025, 469, 140504. [Google Scholar] [CrossRef]
  53. DBJ 61/T 112-2021; Technical Specification for Application of High Ductile Concrete. Northwestern Polytechnical University Press: Xi’an, China, 2021.
  54. Deng, M.; Liu, H.; Qin, M.; Liang, X. Experimental research on compressive toughness of the high ductile fiber reinforced concrete. J. Xi’an Univ. Archit. Technol. 2015, 47, 660–665, 677. [Google Scholar] [CrossRef]
  55. Zhu, B.; Pan, J.; Zhang, M.; Leung, C. Predicting the strain-hardening behaviour of polyethylene fibre reinforced engineered cementitious composites accounting for fibre-matrix interaction. Cem. Concr. Compos. 2022, 134, 104770. [Google Scholar] [CrossRef]
  56. Mahmoudi, F.; Abdalla, J.A.; Hawileh, R.A.; Zhang, Z. Tensile and compressive strength of polyethylene engineered cementitious composite (PE-ECC) at elevated temperature. Mater. Today Proc. 2022, 65, 2081–2085. [Google Scholar] [CrossRef]
  57. Xu, L.; Huang, B.; Lao, J.; Dai, J. Tailoring strain-hardening behavior of high-strength engineered cementitious composites (ECC) using hybrid silica sand and artificial geopolymer aggregates. Mater. Des. 2022, 220, 110876. [Google Scholar] [CrossRef]
  58. Yu, K.; Wang, Y.; Yu, J.; Xu, S. A strain-hardening cementitious composites with the tensile capacity up to 8%. Constr. Build. Mater. 2017, 137, 410–419. [Google Scholar] [CrossRef]
  59. Mahmoudi, F.; Abdalla, J.A.; Hawileh, R.A. Mechanical properties of GGBS-based polyethylene engineered cementitious composite (PE-ECC) at elevated temperature. Results Eng. 2025, 27, 106159. [Google Scholar] [CrossRef]
  60. Cai, M.; Zhu, H.; Rabczuk, T.; Zhuang, X. Investigation of mixing techniques for full-strength-grade engineered cementitious composites (ECCs): Mechanical properties and microstructure. J. Build. Eng. 2024, 95, 110136. [Google Scholar] [CrossRef]
  61. Shahin, E.; Abdalla, J.; Hawileh, R. Mechanical performance of sustainable PE-ECC using GGBS and dune sands. Procedia Struct. Integr. 2025, 68, 238–244. [Google Scholar] [CrossRef]
  62. Xu, L.; Huang, B.; Qian, L.; Dai, J. Enhancing long-term tensile performance of engineered cementitious composites (ECC) using sustainable artificial geopolymer aggregates. Cem. Concr. Compos. 2022, 133, 104676. [Google Scholar] [CrossRef]
  63. Zhang, Z.; Gao, Y.; Qin, F.; Sun, F.; Huang, Y. Mechanical properties of sustainable high strength ECC with substitution of cement by limestone powder. Case Stud. Constr. Mater. 2023, 19, e02434. [Google Scholar] [CrossRef] [PubMed]
  64. Yoo, D.; Oh, T.; Kang, M.; Kim, M.; Choi, H. Enhanced tensile ductility and sustainability of high-strength strain-hardening cementitious composites using waste cement kiln dust and oxidized polyethylene fibers. Cem. Concr. Compos. 2021, 120, 104030. [Google Scholar] [CrossRef]
  65. Liu, X.; Liang, C.; Zhang, Z.; Zhang, Y.; Xu, J.; Ma, Z. Mechanical performance of low-carbon ultra-high performance engineered cementitious composites (UHP-ECC) with high-volume recycled concrete powder. J. Build. Eng. 2024, 88, 109153. [Google Scholar] [CrossRef]
  66. Zhang, Z.; Yuvaraj, A.; Di, J.; Qian, S. Matrix design of light weight, high strength, high ductility ECC. Constr. Build. Mater. 2019, 210, 188–197. [Google Scholar] [CrossRef]
  67. Chen, Y.; Yu, J.; Leung, C.K.Y. Use of high strength strain-hardening cementitious composites for flexural repair of concrete structures with significant steel corrosion. Constr. Build. Mater. 2018, 167, 325–337. [Google Scholar] [CrossRef]
  68. He, S.; Qiu, J.; Li, J.; Yang, E. Strain hardening ultra-high performance concrete (SHUHPC) incorporating CNF-coated polyethylene fibers. Cem. Concr. Res. 2017, 98, 50–60. [Google Scholar] [CrossRef]
  69. Curosu, I.; Liebscher, M.; Mechtcherine, V.; Bellmann, C.; Michel, S. Tensile behavior of high-strength strain-hardening cement-based composites (HS-SHCC) made with high-performance polyethylene, aramid and PBO fibers. Cem. Concr. Res. 2017, 98, 71–81. [Google Scholar] [CrossRef]
  70. Ye, B.; Zhang, Y.; Han, J.; Pan, P. Effect of water to binder ratio and sand to binder ratio on shrinkage and mechanical properties of high-strength engineered cementitious composite. Constr. Build. Mater. 2019, 226, 899–909. [Google Scholar] [CrossRef]
  71. Liu, L.; Xiao, J.; Wu, Z. The effect of fiber content on the static and dynamic performance of PE-ECC. Case Stud. Constr. Mater. 2024, 20, e03041. [Google Scholar] [CrossRef]
  72. Wang, Y.; Hou, M.; Yu, J.; Xu, S.; Yu, K.; Zhang, Z. Experimental study on mechanical properties of ultra-high ductile cementitious composites. Mater. Rev. 2018, 32, 3535–3540. [Google Scholar] [CrossRef]
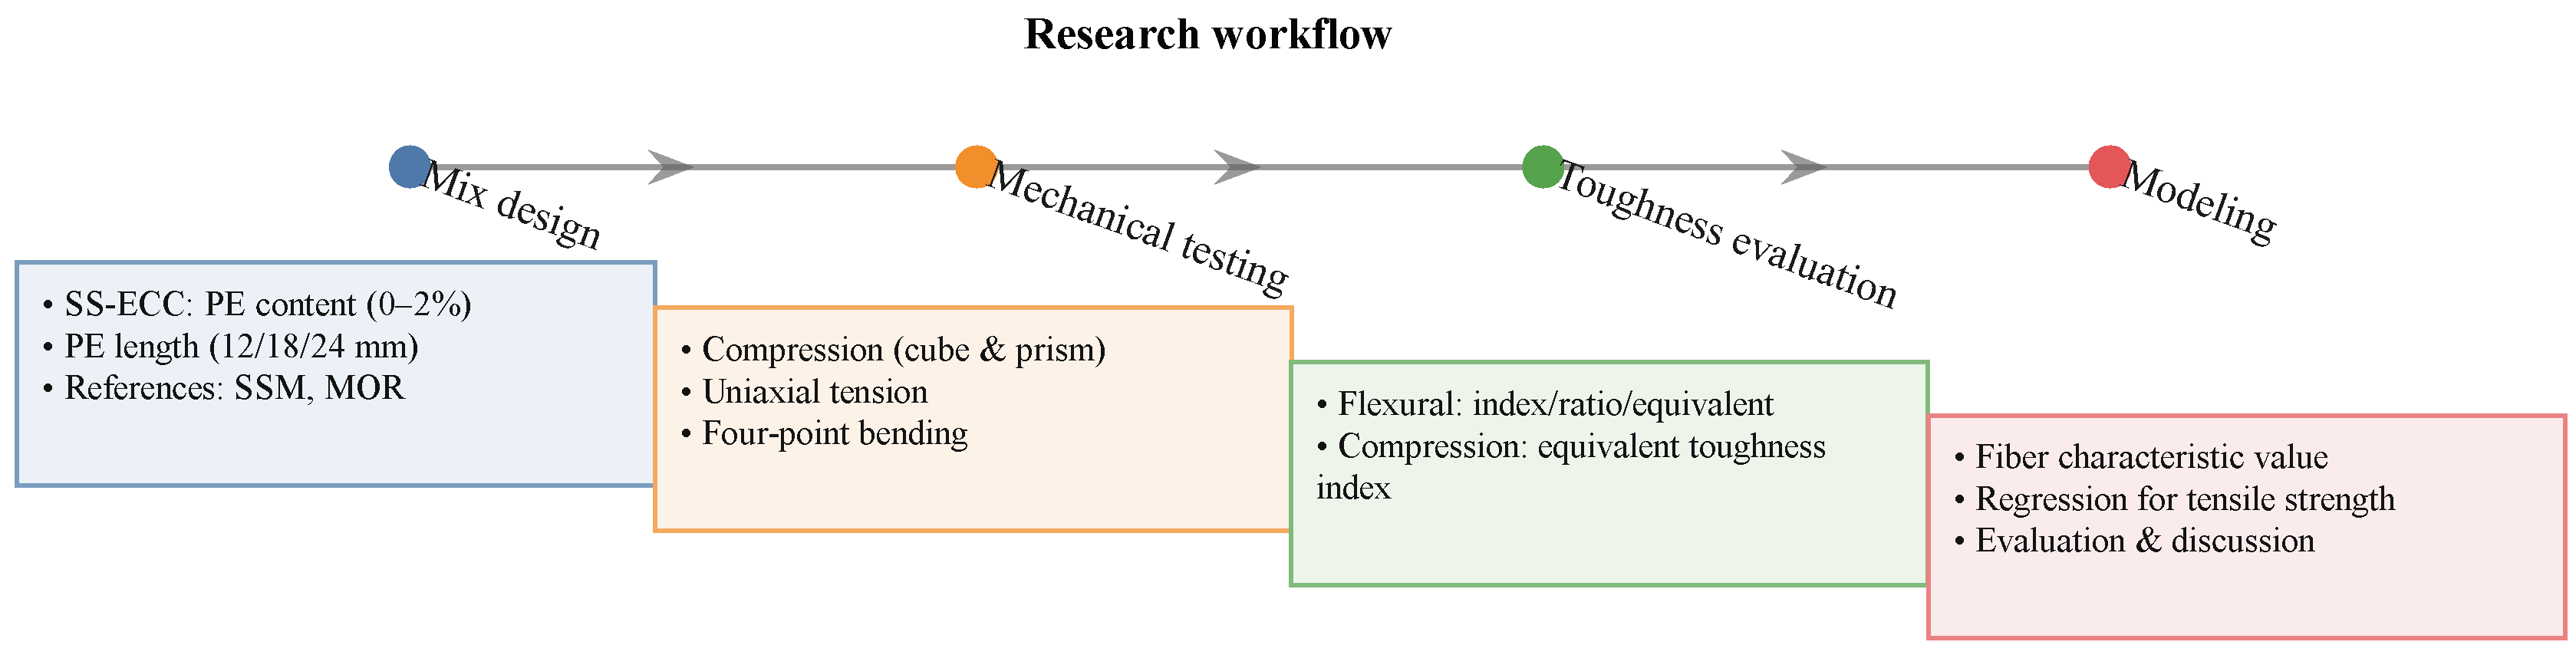
Figure 1. Research workflow of this study.
Buildings 16 01022 g001
Figure 2. Uniaxial tensile test and four-point flexural test setup. (a) Uniaxial tensile test. (b) Four-point flexural test.
Buildings 16 01022 g002
Figure 3. Microstructure of SS-ECC. (a) Microstructure of PE1%-12-SSE. (b) EDS elemental mapping of the SEM image (III). (c) Atomic percentages of elements from EDS analysis of SEM image (III).
Buildings 16 01022 g003
Figure 4. Uniaxial compression stress–strain curve of concrete. (a) PE fiber content. (b) PE fiber length. (c) Seawater and sea sand. (d) Cementitious matrix.
Buildings 16 01022 g004
Figure 5. Effects of fiber content and length on the compressive strength and elastic modulus of ECC.
Buildings 16 01022 g005
Figure 6. Cracking of ECC under varied tensile stress. (a) PE1%-12-SSE. (b) PE1.5%-12-SSE. (c) PE2%-12-SSE. (d) PE1.5%-18-SSE. (e) PE1.5%-24-SSE. (f) PE1.5%-12-ECC.
Buildings 16 01022 g006aBuildings 16 01022 g006b
Figure 7. Uniaxial tensile stress–strain curves of SS-ECC. (a) Influence of PE fiber volume fraction. (b) Influence of PE fiber length. (c) Effect of seawater and sea sand.
Buildings 16 01022 g007
Figure 8. Effects of PE fiber volume content and length on the tensile and flexural strength of SS-ECC. (a) Tensile strength of SS-ECC. (b) Flexural strength of SS-ECC.
Buildings 16 01022 g008
Figure 9. Flexural stress–displacement curves of SS-ECC. (a) 1%-12-SSE. (b) 1.5%-12-SSE. (c) 2%-12-SSE. (d) 1.5%-18-SSE. (e) 1.5%-24-SSE. (f) 1.5%-12-ECC.
Buildings 16 01022 g009aBuildings 16 01022 g009b
Figure 10. Schematic diagrams for calculation methods of flexural toughness. (a) Flexural toughness index. (b) Flexural toughness ratio. (c) Equivalent flexural toughness.
Buildings 16 01022 g010
Figure 11. Effect of PE fiber content and length on the flexural toughness index of SS-ECC.
Buildings 16 01022 g011
Figure 12. Flexural toughness ratio of SS-ECC. (a) Effect of fiber content. (b) Effect of fiber length.
Buildings 16 01022 g012
Figure 13. Effects of PE fiber volume fraction and length on the equivalent flexural toughness of SS-ECC.
Buildings 16 01022 g013
Figure 14. Equivalent compressive toughness of SS-ECC. (a) Effect of fiber content. (b) Effect of fiber length.
Buildings 16 01022 g014
Figure 15. Summary of basic mechanical properties of SS-ECC. (a) Influence of PE fiber content. (b) Influence of PE fiber length. (c) Influence of seawater and sea sand.
Buildings 16 01022 g015
Figure 16. Relationship between tensile and cube compressive strength of ECC. (a) Model fit with 95% confidence and prediction bands (The color of dots refer to Vf, as shown in the color bar on the right side.). (b) Residuals versus fitted values bands (The color of dots refer to Vf, as shown in the color bar on the right side.). (c) Normal Q–Q plot of residuals. (d) Ten-fold cross-validation error distributions (RMSE, MAE, and MAPE).
Buildings 16 01022 g016
Table 1. Concrete mix proportions.
Mix IDCement
Kg/m3
Limestone Powder
Kg/m3
Silica Fume
Kg/m3
Blast Furnace Slag
Kg/m3
Sand
Kg/m3
Water
Kg/m3
Polycarboxylate Superplasticizer
Kg/m3
Fiber Content
(vol%)
Fiber Length (mm)
1%-12-SSE 612.51
(sea sand)
353.37
(seawater)
112
1.5%-12-SSE 1.512
2%-12-SSE 212
1.5%-18-SSE588.9682.45123.68630.188.831.518
1.5%-24-SSE 1.524
SSM 00
1.5%-12-ECC 612.51
(river sand)
353.37
(tap water)
1.512
MOR 00
Note: The specimen nomenclature comprises three parts: fiber volume content, fiber length, and concrete type. For instance, “1%-12-SSE” specifies a seawater and sea sand-mixed ECC with 1% fiber content by volume and 12 mm fiber length.
Table 2. Descriptive statistics and one-way ANOVA results for strength and modulus.
PropertyFiber Content (%)Length (mm)nMeanSDCV (%)ANOVA (Fixed 12 mm Length)ANOVA (Fixed 1.5% Content)
Cube compressive strength (MPa)112353.12.444.6F2,7 = 18.23
p < 0.01
-
1.512441.13.007.3 F2,7 = 5.71
p < 0.05
212352.43.436.6 -
1.518349.43.477.0-
1.524346.43.547.6-
Prism compressive strength (MPa)112340.92.496.1F2,6 = 18.14
p < 0.01
-
1.512329.31.946.6 F2,7 = 9.27
p < 0.01
212342.23.879.2 -
1.518438.33.509.1-
1.524334.92.045.8-
Elastic modulus (GPa)112315.11.429.4F2,7 = 4.45
p > 0.05
-
1.512412.81.179.2 F2,6 = 3.78
p > 0.05
212314.80.614.1 -
1.518314.60.735.0-
1.524215.21.5910.5-
Flexural strength (MPa)11238.210.0750.92F2,6 = 165.7
p < 0.001
-
1.512316.40.392.4 F2,6 = 4.15
p > 0.05
212315.00.946.3 -
1.518316.01.398.7-
1.524314.01.228.7-
Tensile strength (MPa)11242.060.1577.6F2,9 = 13.0
p < 0.01
-
1.51242.290.1406.1 F2,9 = 20.8
p < 0.001
21242.640.1867.0 -
1.51852.240.2079.3-
1.52453.230.34010.5-
Table 3. Pearson correlation matrix for mixture-level mean mechanical properties.
PropertyCube Compressive StrengthPrism Compressive StrengthTensile StrengthFlexural Strength
Cube compressive strength1.000.990.370.74
Prism compressive strength0.991.000.290.70
Tensile strength0.370.291.000.90
Flexural strength0.740.700.901.00
Table 4. Three stress–strain models of concrete under uniaxial compression.
GroupFitting Equationa R2
GB/T50010-2010 [36]y = ax + (3 – 2a)x2 + (a – 2)x30.3434 ± 0.00070 ≤ x ≤ 10.973
Bi [37] y = ax + (6 – 5a)x5 + (4a – 5)x61.0004 ± 0.00020 ≤ x ≤ 10.982
Zhang [38] y = (axx2)/(1 + (a – 2)x)1.0621 ± 0.00020 ≤ x ≤ 10.98
Table 5. ECC hardening index of each group.
Concrete Type f c r (MPa) f u (MPa) I h
1%-12-SSE6.46 ± 0.358.21 ± 0.071.27
1.5%-12-SSE8.79 ± 0.3916.35 ± 0.391.86
2%-12-SSE5.48 ± 0.7715.02 ± 0.942.74
1.5%-18-SSE5.75 ± 1.1916.04 ± 1.392.79
1.5%-24-SSE5.97 ± 0.3413.99 ± 1.222.34
1.5%-12-ECC6.26 ± 0.4413.95 ± 0.252.23
Table 6. Definitions of parameters used in the toughness and equivalent strength calculations.
SymbolUnitDefinition
δmmMid-span deflection
Amm2Loaded area in compression
LmmGauge length/specimen height
bmmSpecimen width
hmmSpecimen depth (height)
δcrmmDeflection at first cracking
δpmmDeflection at peak load
δkmmSpecified target deflection level k
δummrepresents the displacement at which the load reduces to u times the peak value
δp,kmmδk-δp
T1kN·mmFirst-crack toughness
T3, T5.5, T10.5kN·mmToughness to prescribed deflections
I5, I10, I20-Flexural toughness indices
ΩpkN·mmEnergy up to δp
ΩkkN·mmPost-peak incremental energy from 0 to δk
ΩukN·mmthe area under the load–displacement curve corresponding to a vertical displacement δu
Ωp,kkN·mmPost-peak incremental energy from δp to δk
fuMPaPeak flexural strength
fe,pMPaEquivalent initial flexural strength
fe,kMPaEquivalent flexural strength (post-peak interval)
Re,p-Initial flexural toughness ratio
Re,k-Residual flexural toughness ratio
W e u kJ/m3Equivalent flexural toughness index
W cu MPaEquivalent compressive strength (energy density form)
Table 7. Descriptive statistics and one-way ANOVA results for toughness properties.
PropertyFiber Content (%)Length (mm)nMeanSDCV (%)ANOVA (Fixed 12 mm Length)ANOVA (Fixed 1.5% Content)
112366.316.725.2F2,3 = 24.93
p < 0.05
-
1.51221803.421.9 F2,5 = 0.98
p > 0.05
Equivalent flexural toughness212222351.823.2 -
1.51821768.995.1-
1.524318611.36.1-
11220.1070.00070.7F2,5 = 18.82
p < 0.01
-
1.51230.0360.004211.7 F2,5 = 5.02
p < 0.05
Equivalent compressive toughness21230.1180.023519.8 -
1.51830.07530.015320.3-
1.52420.05740.00569.8-
Table 8. Data on tensile and compressive strengths of ECC with PE fibers.
f c u (MPa) f t (MPa) V f L f (mm) d f (mm)
Data for this study53.12.061%120.025
41.112.291.5%120.025
52.392.642%120.025
49.422.241.5%180.025
46.363.231.5%240.025
45.922.041.5%120.025
Mahmoudi et al. [56]59.17.032%120.024
Lin et al. [23]41.874.051.6%120.0145
Xu et al. [57]152.715.32%180.024
Yu et al. [58]52.66.522%180.025
45.866.072%180.02
Mahmoudi et al. [59]71.37.642%180.024
576.242%180.024
Cai et al. [60]50.697.622%180.025
51.987.782%180.025
52.847.642%180.025
80.6110.92%180.025
110.2112.272%180.025
Shahin et al. [61]67.27.772%120.024
72.56.872%120.024
62.96.092%120.024
Xu et al. [62]152.412.92%180.024
185.515.52%180.024
Zhang et al. [63]87.49.662%180.026
79.97.782%180.026
58.36.422%180.026
74.97.312%180.026
88.911.512%180.026
Yoo et al. [64]70.28.92%180.03
Liu et al. [65]111.9811.032%180.025
104.1610.482%180.025
91.419.462%180.025
120.2811.522%180.025
123.6112.612%180.025
125.7311.512%180.025
126.1811.122%180.025
121.6110.792%180.025
121.2111.872%180.025
122.9711.872%180.025
119.8712.352%180.025
116.612.942%180.025
111.610.192%180.025
102.5812.192%180.025
108.0710.062%180.025
101.0910.462%180.025
Zhang et al. [66]859.732%180.026
8710.882%180.026
818.372%180.026
658.82%180.026
728.052%180.026
Chen et al. [67]1389.52.2%120.024
15010.82.2%120.024
1329.82.2%120.024
He et al. [68]14413.11.5%190.023
153151.5%190.023
Curosu et al. [69]133.57.62%60.02
Ye et al. [70]105.28.662%120.025
106.669.552%120.025
100.798.652%120.025
97.867.352%120.025
100.598.422%120.025
105.6610.182%120.025
94.977.912%120.025
82.526.122%120.025
89.646.942%120.025
96.298.452%120.025
89.827.692%120.025
119.4510.342%120.025
Zhou et al. [15]93.26122%180.025
73.88.62%180.025
53.038.22%180.025
Liu et al. [71]31.151.75%180.019
33.55.52%180.019
34.66.62.25%180.019
31.84.62.5%180.019
Yao et al. [12]77.537.281.8%120.024
87.138.11.8%120.024
81.968.361.8%120.024
88.48.381.8%120.024
76.946.721.8%120.024
66.016.161.8%120.024
85.597.032%120.024
84.386.851.6%120.024
Wang et al. [72]36.84.112%120.02
Table 9. Calibration, diagnostic checks, and external validation of the tensile–compressive strength model for PE-ECC (n = 84).
CategoryItemSymbol/MethodResultNotes
Model specificationResponse variableft-Tensile strength (MPa)
PredictorX = (λfcu)2/3-fcu: cube compressive strength (MPa)
PE fiber characteristic valueΛ = Vf(Lf/df)-λ: dimensionless; Lf, df in mm; Vf: entered as decimal
Regression formOLS through originft = aX
Parameter estimation (calibration)Fitted coefficienta0.082807
Standard errorSE(a)0.001180OLS standard error
95% confidence intervalCI95%(a)[0.080445, 0.085169]
Goodness-of-fit (in-sample)Coefficient of determinationR20.8461
Root mean square errorRMSE1.1687MPaIn-sample
Mean absolute errorMAE0.9612 MPaIn-sample
Mean absolute percentage errorMAPE16.01%In-sample
Diagnostic checksHeteroscedasticity testBreusch–PaganLM = 2.3022; p = 0.1292Not significant at α = 0.05
Residual diagnosticsResidual–fitted, Q–Q-Shown in Figure 16
Uncertainty quantificationPrediction uncertainty95%PI & 95%CI-Bands shown in Figure 16
External validationValidation protocol10-fold cross-validation-Randomized split; metrics computed on held-out folds
Out-of-sample RMSECV-RMSE1.1817 ± 0.2003 MPaMean ± SD across folds
Out-of-sample MAECV-MAE0.9900 ± 0.1541 MPaMean ± SD
Out-of-sample MAPECV-MAPE16.34 ± 6.84%Mean ± SD
Out-of-sample R2CV-R20.7616 ± 0.1572Mean ± SD
Notes: OLS = ordinary least squares; CI = confidence interval for the mean response; PI = prediction interval for individual predictions; CV = cross-validation. Vf is entered as a decimal volume fraction (e.g., 0.02 for 2%). Errors are reported on the original tensile strength scale (MPa).
Disclaimer/Publisher’s Note: The statements, opinions and data contained in all publications are solely those of the individual author(s) and contributor(s) and not of MDPI and/or the editor(s). MDPI and/or the editor(s) disclaim responsibility for any injury to people or property resulting from any ideas, methods, instructions or products referred to in the content.