


Abstract
To address force uniformity and corrosion issues in slope reinforcement, this paper presents a field implementation of pressure-uniformly-dispersed Carbon-Fiber-Reinforced Polymer (CFRP) anchor cables integrated with Fiber Bragg Grating (FBG) sensing technology. A tensioning trial was conducted on a dangerous rock project on Guangyang Island, Chongqing, utilizing a distributed FBG array (0.5 m spacing) for full-length strain monitoring. The results confirm that, under the specific conditions of this project, the anchorage segment exhibits the characteristic two-stage behavior of “delayed activation–uniform bearing” previously documented in bonded anchor systems, with a critical transition observed at approximately 120 kN. Beyond this threshold, the anchorage efficiency reached approximately 85%, validating the three-stage uniformly dispersed design for this specific geological context. While the load transfer mechanism aligns with established bonded anchor mechanics, this study demonstrates the practical feasibility of high-resolution distributed sensing in CFRP anchor systems, providing benchmark data for construction quality control and long-term health monitoring of similar slope reinforcement projects.
1. Introduction
With the rapid development of infrastructure construction in China, particularly under the Western Development Strategy, slope stability issues have become increasingly prominent. Under complex geological and climatic conditions, slope-instability-induced disasters such as landslides and collapses occur frequently, posing significant threats to people’s lives, property safety, and economic development. Slope stabilization engineering primarily employs two technical approaches: First, reducing the downward momentum of landslides or eliminating factors that trigger them. Second, enhancing the resistance to sliding or adding auxiliary anti-slide elements. To date, effective measures in slope stabilization engineering practice include: (1) reducing load pressure on the upper slope through slope clearance; (2) implementing counter-pressure loading to strengthen the anti-slide stability of the slope base; (3) constructing drainage systems to effectively divert groundwater and mitigate its adverse effects on slope stability; and (4) building retaining structures such as retaining walls and anti-slide piles to directly counteract sliding forces. The focus now shifts to carbon fiber anchor cables. Domestically and internationally, pressure-dispersed steel strand or FRP anchor cables are commonly used as support structures in geotechnical anchoring reinforcement technology. Load-bearing capacity can be enhanced by improving anchor cable tensioning processes, adjusting the spacing of bearing plates, and optimizing their structural forms. Yang Hufeng et al. investigated the surface failure of granular slopes under retaining wall constraints through indoor physical model tests [1]. Wang Yujia studied the method of combined reinforcement using buried piles and geogrid-reinforced retaining walls and its effect on slope stability under groundwater influence [2]. Lai Jie et al. conducted shaking table model tests to study the failure modes of high-steep slopes reinforced with anti-slide piles having different initial damages under seismic conditions [3]. Huang Jingyang used the finite element software Midas/GTS NX (2024) to analyze the effectiveness of slope support with anti-slide piles and the stability of slopes with different pile spacings, row distances, and pile positions [4]. Sakhno, I. propose and verify a new method for anchoring fixation based on non-bonding technology using a self-expanding mixture during hardening to generate quasi-static compressive force, achieving full-length fixation of the anchor and systematically studying the relationship between its mechanical parameters and geometric parameters [5]. They compared the finite element analysis results of lateral earth pressure and landslide thrust with earth pressure theory, standard methods, and field measurement data. Although existing slope reinforcement technologies have achieved fruitful results in terms of diversity and practicality [6,7,8,9], the application of CFRP plates as the tendon body in pressure-dispersed prestressed anchor cables is extremely rare. Therefore, this paper reports a field case study on the prototype pressure-uniformly-dispersed CFRP anchor cable deployed at Guangyang Island. While pressure-dispersed anchors and FBG sensing have been individually studied in laboratory settings, integrated field validation of CFRP systems with distributed optical fiber monitoring remains limited. Detailed monitoring during the tensioning process was performed to evaluate the practical implementation challenges and validate design assumptions under in-situ conditions. The results provide empirical data for construction quality control and demonstrate the technical feasibility of intelligent monitoring in real-world slope reinforcement projects, supplementing existing theoretical frameworks with field measurements from a specific geological context.
2. Force Analysis of Pressure-Uniformly-Dispersed Prestressed CFRP Anchor Cables
2.1. Basic Principles of Pressure-Uniformly-Dispersed Prestressed CFRP Anchor Cables and Force Distribution Characteristics in the Anchorage Segment
The pressure-dispersed CFRP slope anchor cable is a support technology applied in slope engineering, and its mechanism lies in effectively dispersing loads through the arrangement of anchor cables. Pressure-dispersed CFRP slope anchor cables achieve load dispersion through rational layout and represent a new support technology in slope engineering based on Carbon-Fiber-Reinforced Polymer composites. Firstly, the high strength of FRP materials allows the slope to effectively resist tension under external loads, preventing landslides and collapses caused by insufficient tensile capacity of the soil mass. CFRP materials, with their high tensile strength characteristics, can effectively compensate for the tensile deficiencies of the soil mass, preventing slope failure under external loads. Secondly, CFRP anchor cables can effectively disperse external loads deep into the soil mass through force transfer and dispersion mechanisms, reducing the pressure on the slope surface and helping to lower the risk of slope instability. This anchor cable system transfers surface loads to deeper soil layers through stress transfer mechanisms, significantly reducing the instability risk caused by stress concentration on the slope face. Finally, appropriately designed anchor cable layout and angle selection can optimize the tensile and compressive force distribution of the anchor cables, ensuring balanced force distribution across the entire slope and improving the overall tensile strength. Through scientifically designed spatial layout and installation angles of anchor cables, the stress field distribution can be optimized, achieving an overall enhancement of the slope’s mechanical performance [10]. Therefore, pressure-dispersed prestressed CFRP anchor cables establish a reliable technical system for slope support through the synergistic optimization of material mechanical properties and spatial layout. This structure can reduce the risk of local stress concentration by dispersing the load onto each anchorage segment, thereby improving the stability of the overall structure. This technology, through a multi-anchorage segment collaborative bearing mechanism, distributes the load evenly to different geological units, effectively mitigating local stress concentration phenomena and thus enhancing the overall stability of the slope system. As shown in Figure 1 [11], N1—CFRP anchor cable; N2—tension-end anchor; N3—anchor-end anchor; N4—tension device; N5—lagging; N6—bearing plate; N7—guide head; N8—thimble; N9—rubber pad; N10—positioning steel bar; N12—positioner; and N13—fixture.
Figure 1.
Schematic of a pressure-dispersive CFRP anchor cable system.
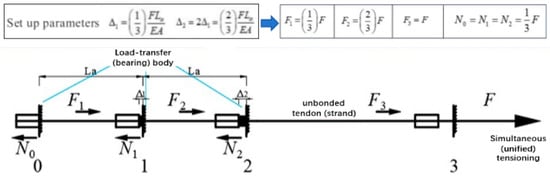
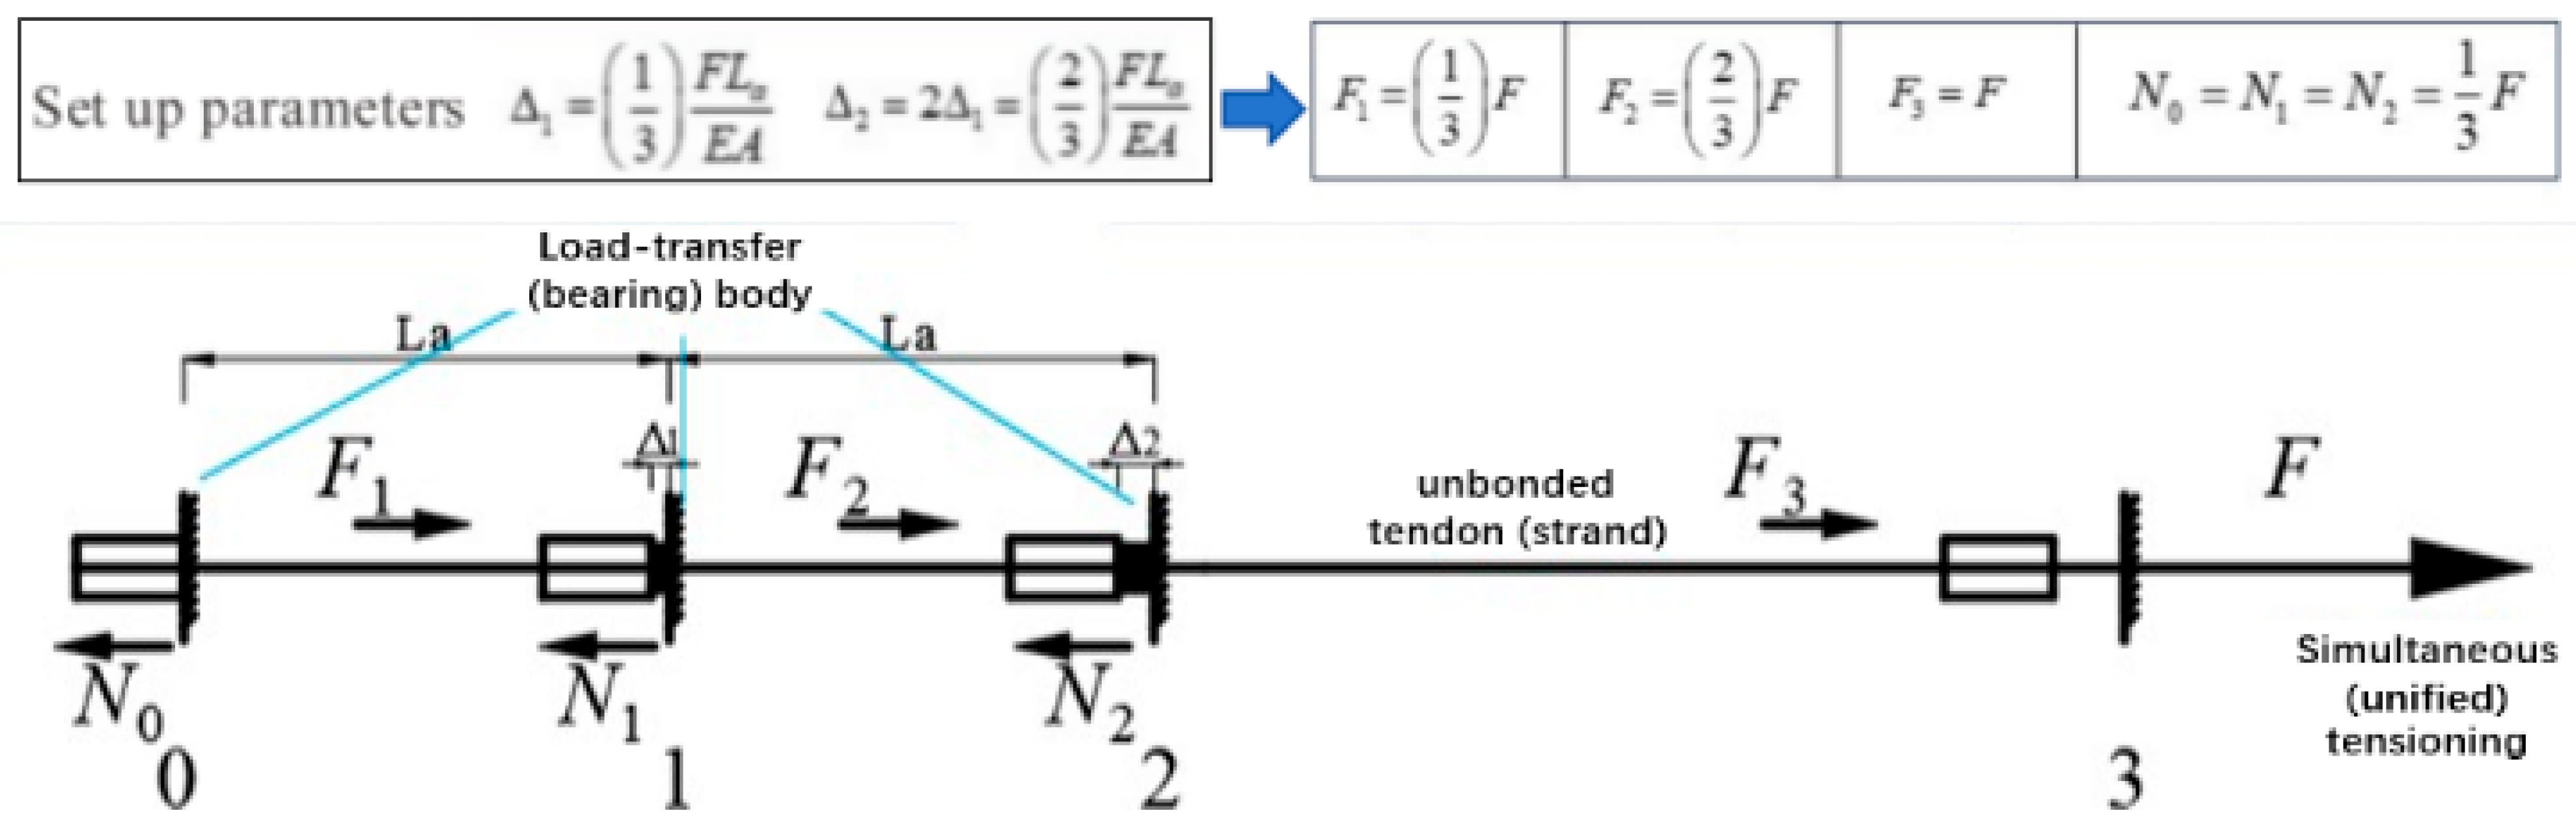
According to the exposition in the paper “Principle and Experimental Research of Pressure-Dispersed Prestressed CFRP Anchor Cable” by Sun Quanwei, a student of Professor Zhuo Jing (Chongqing University of Science and Technology) [11], the anchorage segment distributes multiple bearing plates. Each bearing plate is connected to the anchorage head via unbonded CFRP anchor cables, and a one-time full-hole grouting construction is adopted, effectively shortening the construction period. Rubber pads or reserved gaps are set between the bearing plates and the anchorage head. After the rubber pads are compressed under force, the anchorage head moves in the tensioning direction, pulling the tendon body of the rear anchorage segment. Similarly, after the anchorage head of the rear anchorage segment is pulled, it compresses the rubber pad and continues to move, pulling the subsequent tendon body. When the rubber pads in each anchorage segment are no longer compressed, the bearing plates are stably loaded and transfer the pressure to the grouting body. The tensioning force of the anchor cable is distributed proportionally according to the compression amount of the rubber pads, which is related to the stiffness coefficient k of the rubber pads. By selecting rubber pads with different stiffness coefficients or reserving compression gaps, uniform stress in the grouting body can be achieved, as shown in Figure 2 [11]. Through tensioning adjustment, balanced force distribution can be achieved, allowing uniform pressure distribution on the bearing plates of each anchorage segment, effectively reducing the risk of local stress concentration and improving project stability and reliability. Meanwhile, considering factors such as the tensile strength of the anchor cable, anchorage length, and prestress loss, by rationally designing the compression gaps in the anchorage segments, stable force transfer of the prestressed anchor cable on the bearing plates is ensured, and uniform pressure distribution in each anchorage segment can be achieved through unified tensioning, realizing force balance. The anchor cable is inserted into the drill hole, passing through the unstable rock mass and reaching a certain depth into the stable rock mass. After the cement mortar bonds with the internal anchorage head, the tensioning equipment applies prestress to the anchor cable. Through the anchorage head, stress is transferred to the deep stable rock mass, integrating the anchor cable with the surrounding rock mass, generating a uniform compression zone, preventing rock mass deformation and failure, altering the stress state, and improving the integrity and stability of the unstable part of the slope.
Figure 2.
Acting form of pressure-dispersing CFPR anchor cable.
The magnitude of the force F on each segment is [11]:
The reserved gap amount is, according to Hooke’s Law, under the condition of deformation compatibility [11]:
The compression gap amount for each can be calculated as [11]:
In summary, setting the compression gap amount according to the above relationship enables equal force on each bearing plate, achieving uniform pressure dispersion. The stiffness coefficient k of the rubber pad is related to the elastic modulus E, cross-sectional area A, and length L as: . According to Hooke’s Law, the deformation amount of the rubber pad is related to the force F as: . Since the force on each bearing plate is the same, the deformation amount of the rubber pads is also the same. In the formula: F—tensile force (kN); Δn—preset clearance (mm); E—elastic modulus (N/mm2); and A—cross-sectional area (mm2).
2.2. Force Distribution Characteristics of Pressure-Uniformly-Dispersed Prestressed CFRP Anchor Cable
2.2.1. Basic Assumptions
The following assumptions are made for simplified analysis:
- (1)
- The spacing between anchor cables is sufficiently large, and the mutual influence between adjacent anchor cables can be ignored;
- (2)
- The carbon fiber plate and the grouting body are in an unbonded state, which does not affect the mechanical properties of the tendon; the force applied by the carbon fiber plate is equivalent to a concentrated force P acting at the bottom of the unit anchor cable bearing body;
- (3)
- Both the grouting body and the rock/soil mass are ideal elastic bodies without self-weight, are continuous, uniform, and isotropic, and in an elastic state, and the interface between them satisfies the Coulomb condition;
- (4)
- The stress on the cross-section of the anchor solid is uniformly distributed;
- (5)
- The length of the anchor cable and the grouting body is sufficient, and the entire interface is within the elastic range. During the derivation process, it is necessary to equivalent the anchor cable and the grouting body as one medium in some parts.
2.2.2. Force Distribution Characteristics
Each bearing body of the pressure-uniformly-dispersed anchor cable, along with its corresponding carbon fiber anchor cable and grouting body, forms a relatively independent anchor cable unit. From Section 2.1, we know that the stress distribution of the anchor cable can be obtained by superimposing the stress distributions of each unit anchor cable. Here, the stress distribution law of a unit anchorage segment is analyzed. Prestressed anchor cable anchorage systems are continuously applied in geotechnical engineering. Currently, the pressure-dispersed anchor cable is a commonly used anchorage form domestically. The force of the anchor cable in the rock/soil mass can be simplified as a downward concentrated force acting at a point deep within an elastic semi-infinite body, which translates into the Mindlin problem in elastic theory. When a downward concentrated force F acts at a point deep within an elastic semi-infinite body, the displacement ω at point M (x, y, z) within the semi-infinite body is [12]:
In the equation, ω denotes Mindlin’s vertical displacement solution; F is the concentrated load; E is the elastic modulus of the rock–soil mass; μ is its Poisson’s ratio; and h is the depth at which the concentrated force acts. When the load is applied at the bearing plate (treated as the borehole mouth), i.e., x = y = z = 0, the displacement becomes
Taking the bond stress on a cylindrical micro-segment of the grouting body at point M (0, 0, Z) along the Z-axis direction as the concentrated force F:
Combining Equations (6) and (7), the displacement at the borehole collar caused by this force can be obtained as:
Integrating both sides simultaneously yields:
Analyzing the anchorage segment, the equilibrium equation in the Z-axis direction is obtained:
According to Hooke’s law, the axial strain of the anchor solid is:
The displacement of the anchor solid at the borehole collar is:
According to the assumption:
Solving Equation (13):
Taking the second derivative of Equation (14):
Substituting into Equation (15) yields:
Transforming Equation (16): , the distribution equation for the bond stress on the interface around the grouting body is solved as:
where P0 is the tensioning load at the tensioning end of the anchor cable (kN); R is the radius of the anchor hole; E3 is the elastic modulus of the surrounding rock mass; µ3 is the Poisson’s ratio of the surrounding rock mass; and C is the circumference of the anchor hole.
According to the static equilibrium condition, the axial force equation is obtained:
Solving:
3. Test Design
3.1. Engineering Background
This paper conducts field tests on Guangyang Island, based on the prototype of the pressure-uniformly-dispersed CFRP anchor cable used for reinforcing dangerous rock at pile numbers BK4+140–BK4+170 in the Guangyang Avenue Ecological Restoration and Quality Improvement Project of Guangyang Island Eco-City, Chongqing. Dangerous rock mass WY4 develops on the steep cliff on the south side of this road section, located on the bottom step of the steep cliff zone. The rock cavity is underdeveloped, and the fissures on both sides, the rear edge, and the bottom of the dangerous rock are completely penetrated. The failure mode is toppling, as shown in Table 1. Dangerous rock mass WY4 develops on the steep cliff on the south side of the road section from BK4+140 to BK4+170. The terrain in the steep cliff zone is relatively steep, with slope angles of 75–85°. This survey found that dangerous rock mass WY4 develops on the steep cliff in this section, located on the bottom step of the steep cliff zone. The step is 3–4 m wide and blocky, with underdeveloped rock cavities and well-developed penetrating fissures. The bottom of the dangerous rock is 5–6 m above the current road level.
Table 1.
WY4 hazardous rock mass scale statistics and failure mode.
Dangerous rock WY4 develops on a nearly horizontally bedded sandy mudstone steep cliff. The rock stratum occurrence is 300°∠8°, and the main collapse direction of the dangerous rock is 342°. The stability of the dangerous rock is directly controlled by the development of structural planes in the rock mass.
Dangerous rock WY4 mainly develops three sets of fissures:
- ①
- Hard structural plane: 10°∠70–80°, fracture surface straight and smooth, opening range 5–25 cm, extension length 1.9–8 m, filled with a small amount of rock debris, and development spacing 3–7.5 m;
- ②
- Hard structural plane: 270–280°∠70–80°, fracture surface straight and smooth, opening range 5–25 cm, extension length 1.5–7.0 m, filled with a small amount of rock debris, poor combination, and development spacing 0.5–6.5 m;
- ③
- 340°∠82°, is the unloading fissure of WY4, fissure surface straight, opening 5–15 cm, extension length about 20 m, filled with a small amount of rock debris, poor combination, development spacing 3–6.5 m, and is a hard structural plane.
The stratum composing the dangerous rock mass is the sandy mudstone of the Middle Jurassic Shaximiao Formation. Under the combined action of fissure cutting, vegetation destruction, and weathering denudation, the sandy mudstone forms penetrating fissures. Fissures are developed on both sides, the rear edge, and the bottom of dangerous rock WY4, completely penetrating, with fissure openings of 5–30 cm, locally filled with rock blocks. The volume of dangerous rock here is large, posing a significant threat, and instability may block the entire road.
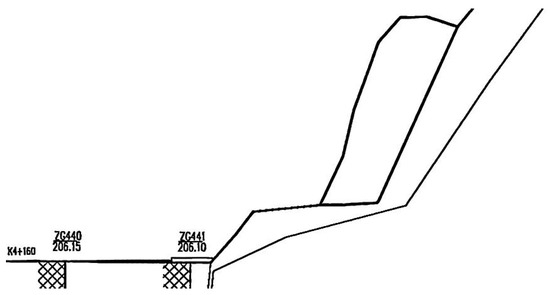
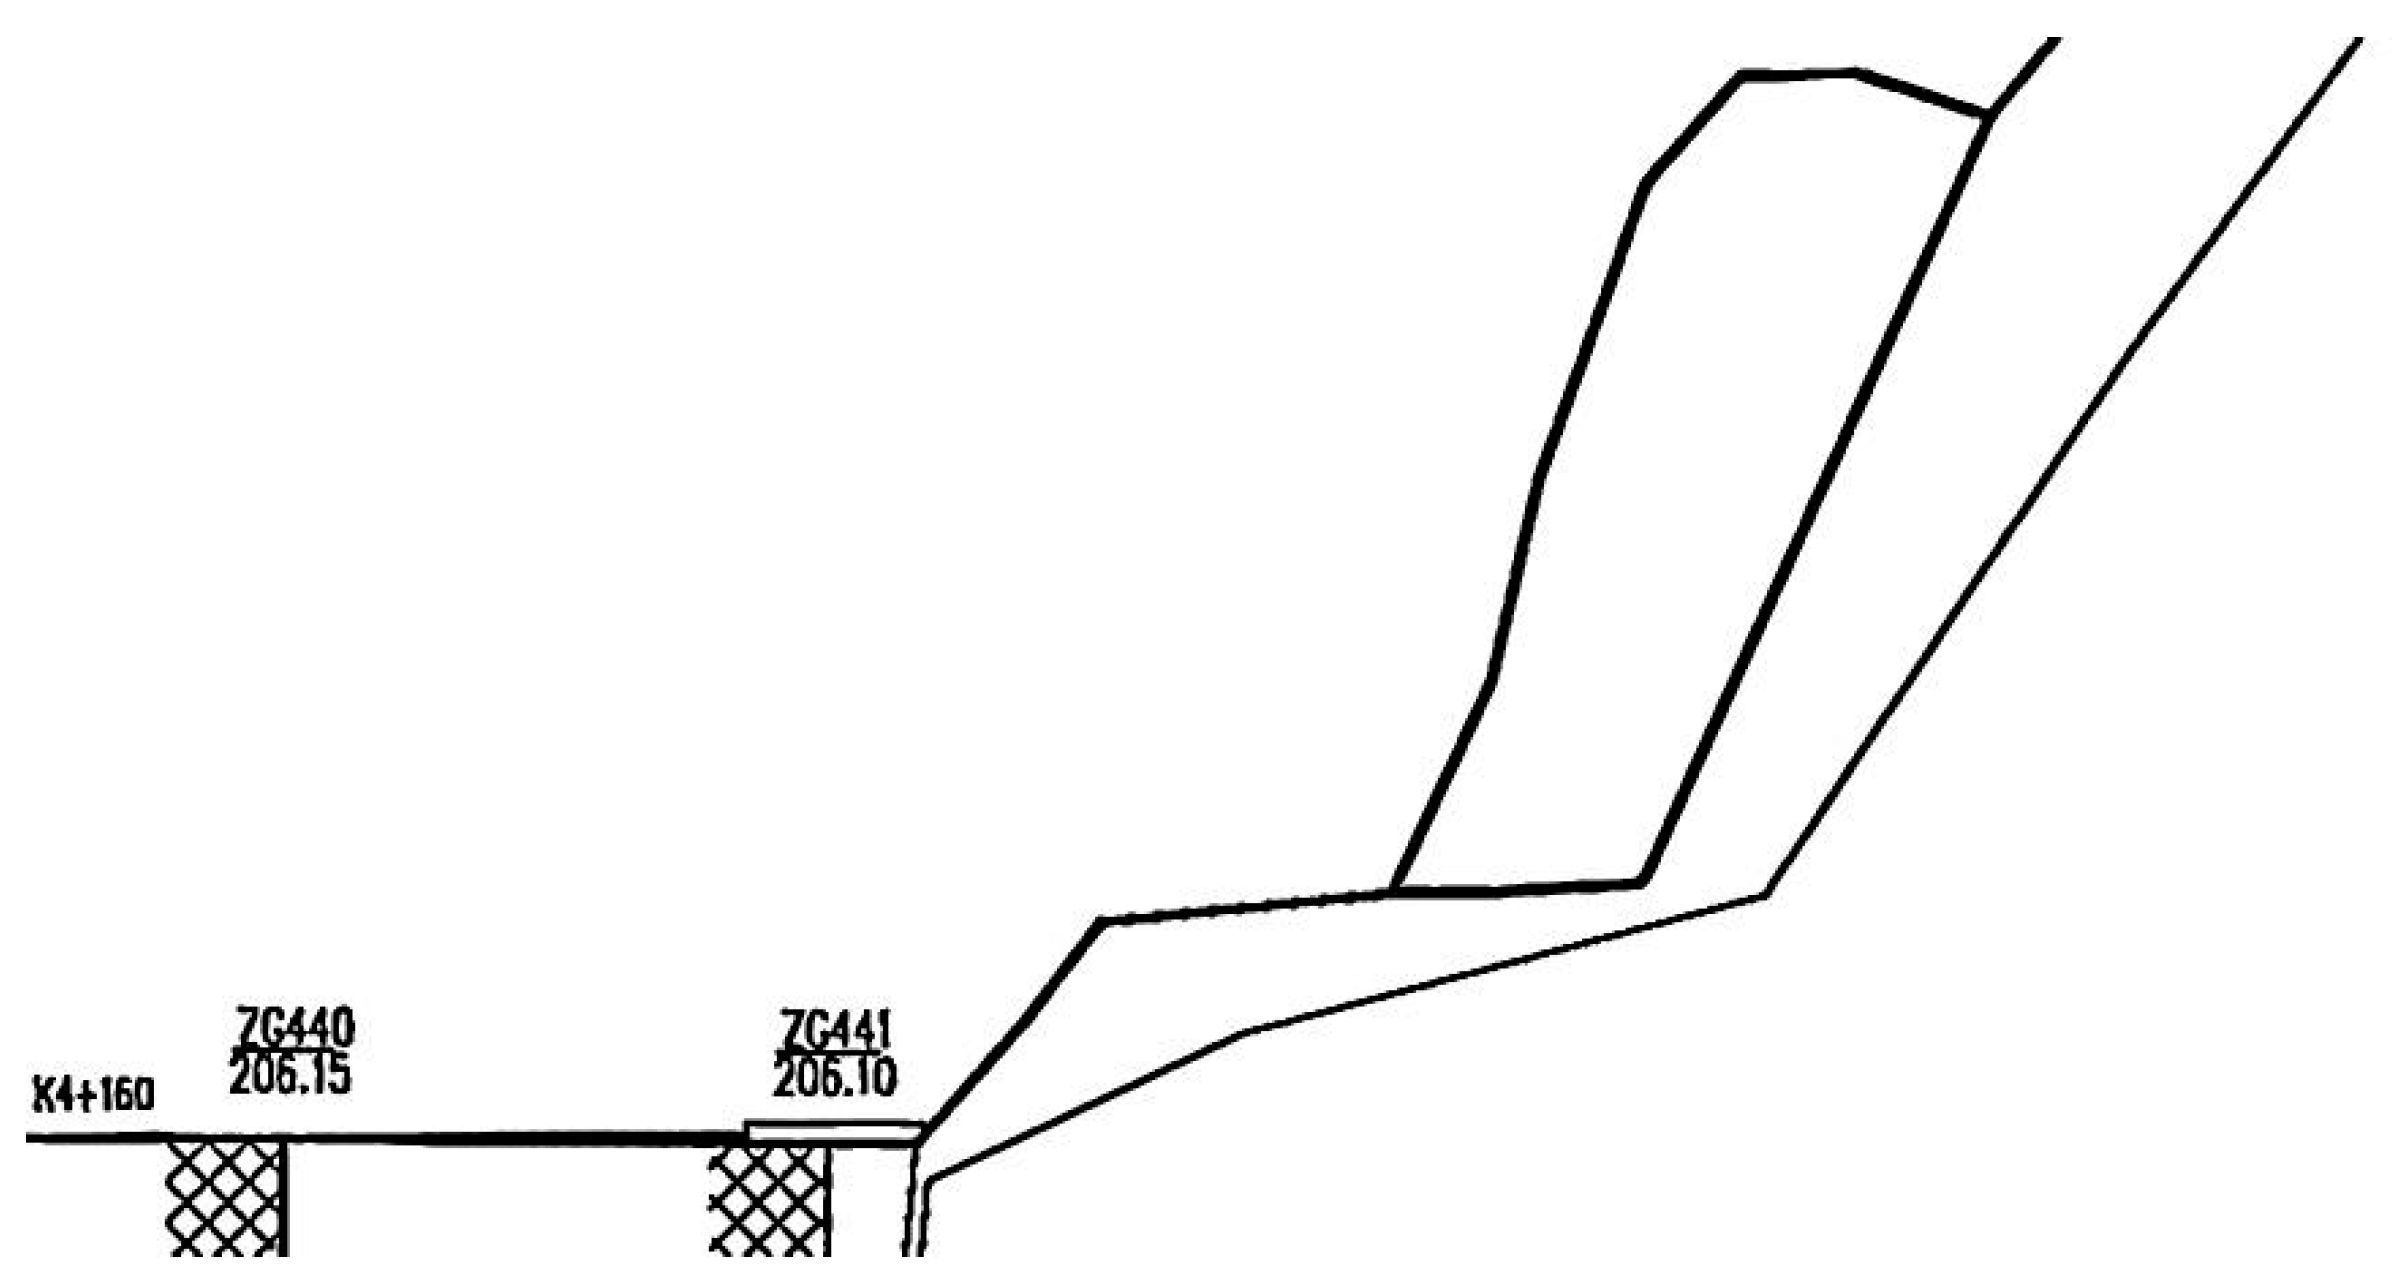
This dangerous rock is located in the steep cliff zone and is roughly block-shaped, with an irregular rectangular shape. Currently, there is a concave rock cavity below the dangerous rock mass formed by the fall of the original sandy mudstone mass. Due to the overhang above, the mechanical properties of the outward-dipping fissures at the rear of the dangerous rock mass continue to decrease, easily leading to toppling failure of the dangerous rock mass, as shown in Figure 3.
Figure 3.
Section view of dangerous rock 4.
3.2. Test Scheme
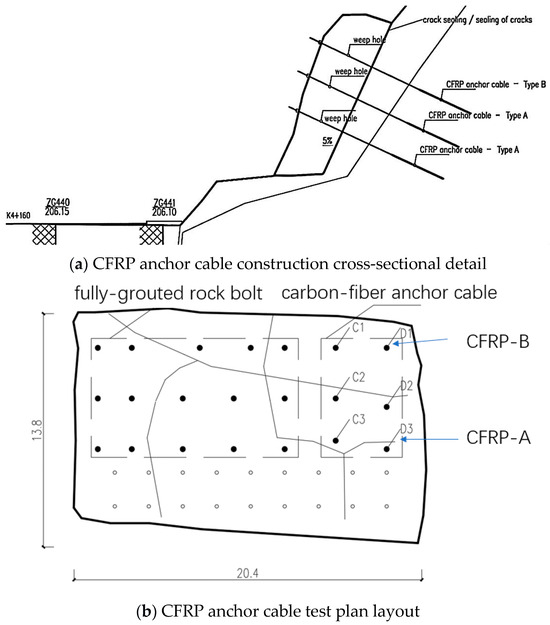
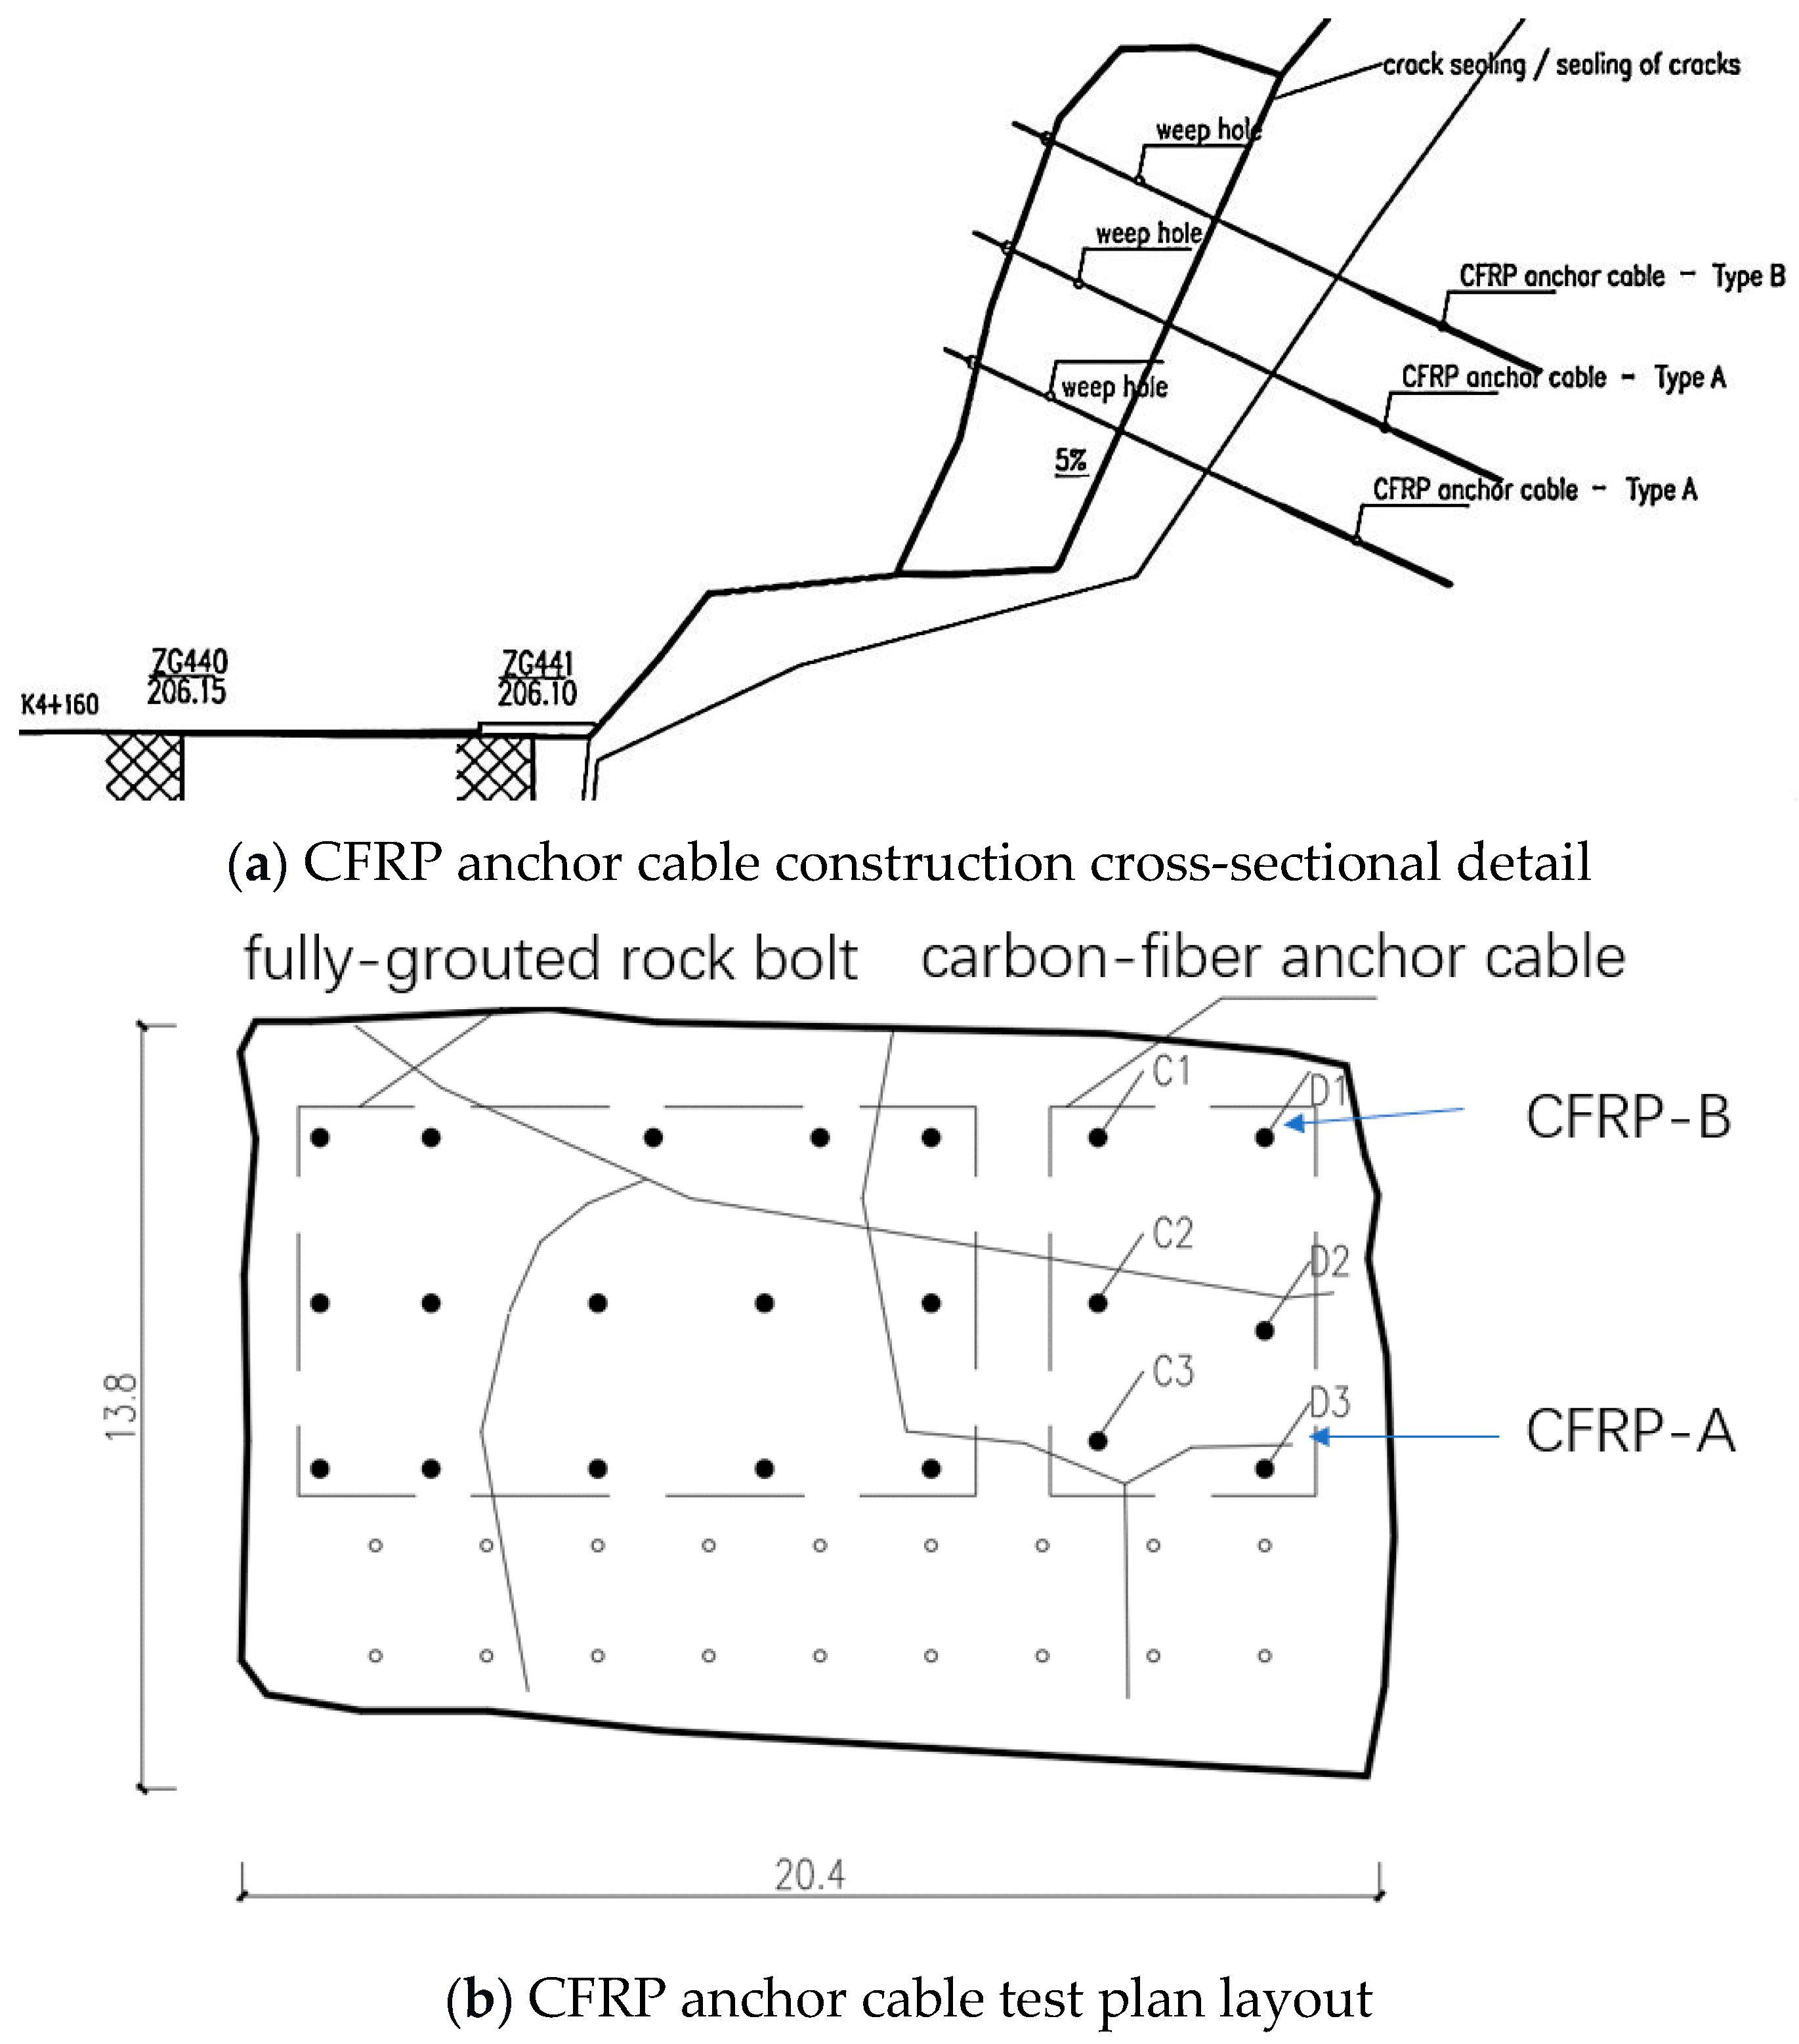
Based on the site engineering geological conditions and relying on the “Technical Code for Building Slope Engineering” and the “Technical Specification for Rock and Soil Anchors (Cables)” (CECS22-2018) [13,14], support for this dangerous rock is carried out using anchor cable anchoring + crack sealing + drainage treatment. The anchor cables are arranged in three rows, totaling 22 locations, with horizontal and vertical spacing of 3 m each, and an average length of 15 m. Crack sealing uses M30 cement mortar to seal the top unloading fissures. Drainage holes are arranged in two rows, with a length of 4 m. No drainage pipes are installed inside the drainage holes, allowing water from potential fissures to drain smoothly, as shown in Figure 4.
Figure 4.
Prestressed CFRP anchor cable reinforcement system.
3.3. Test Materials
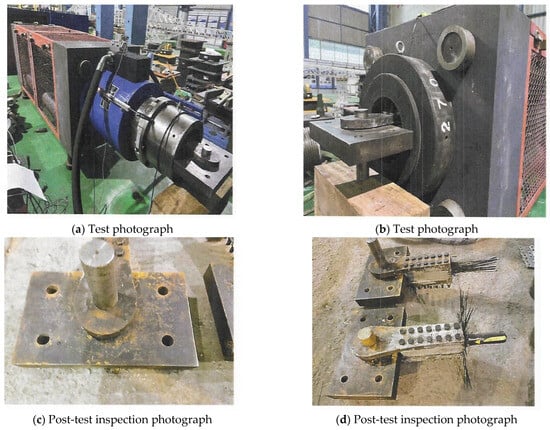
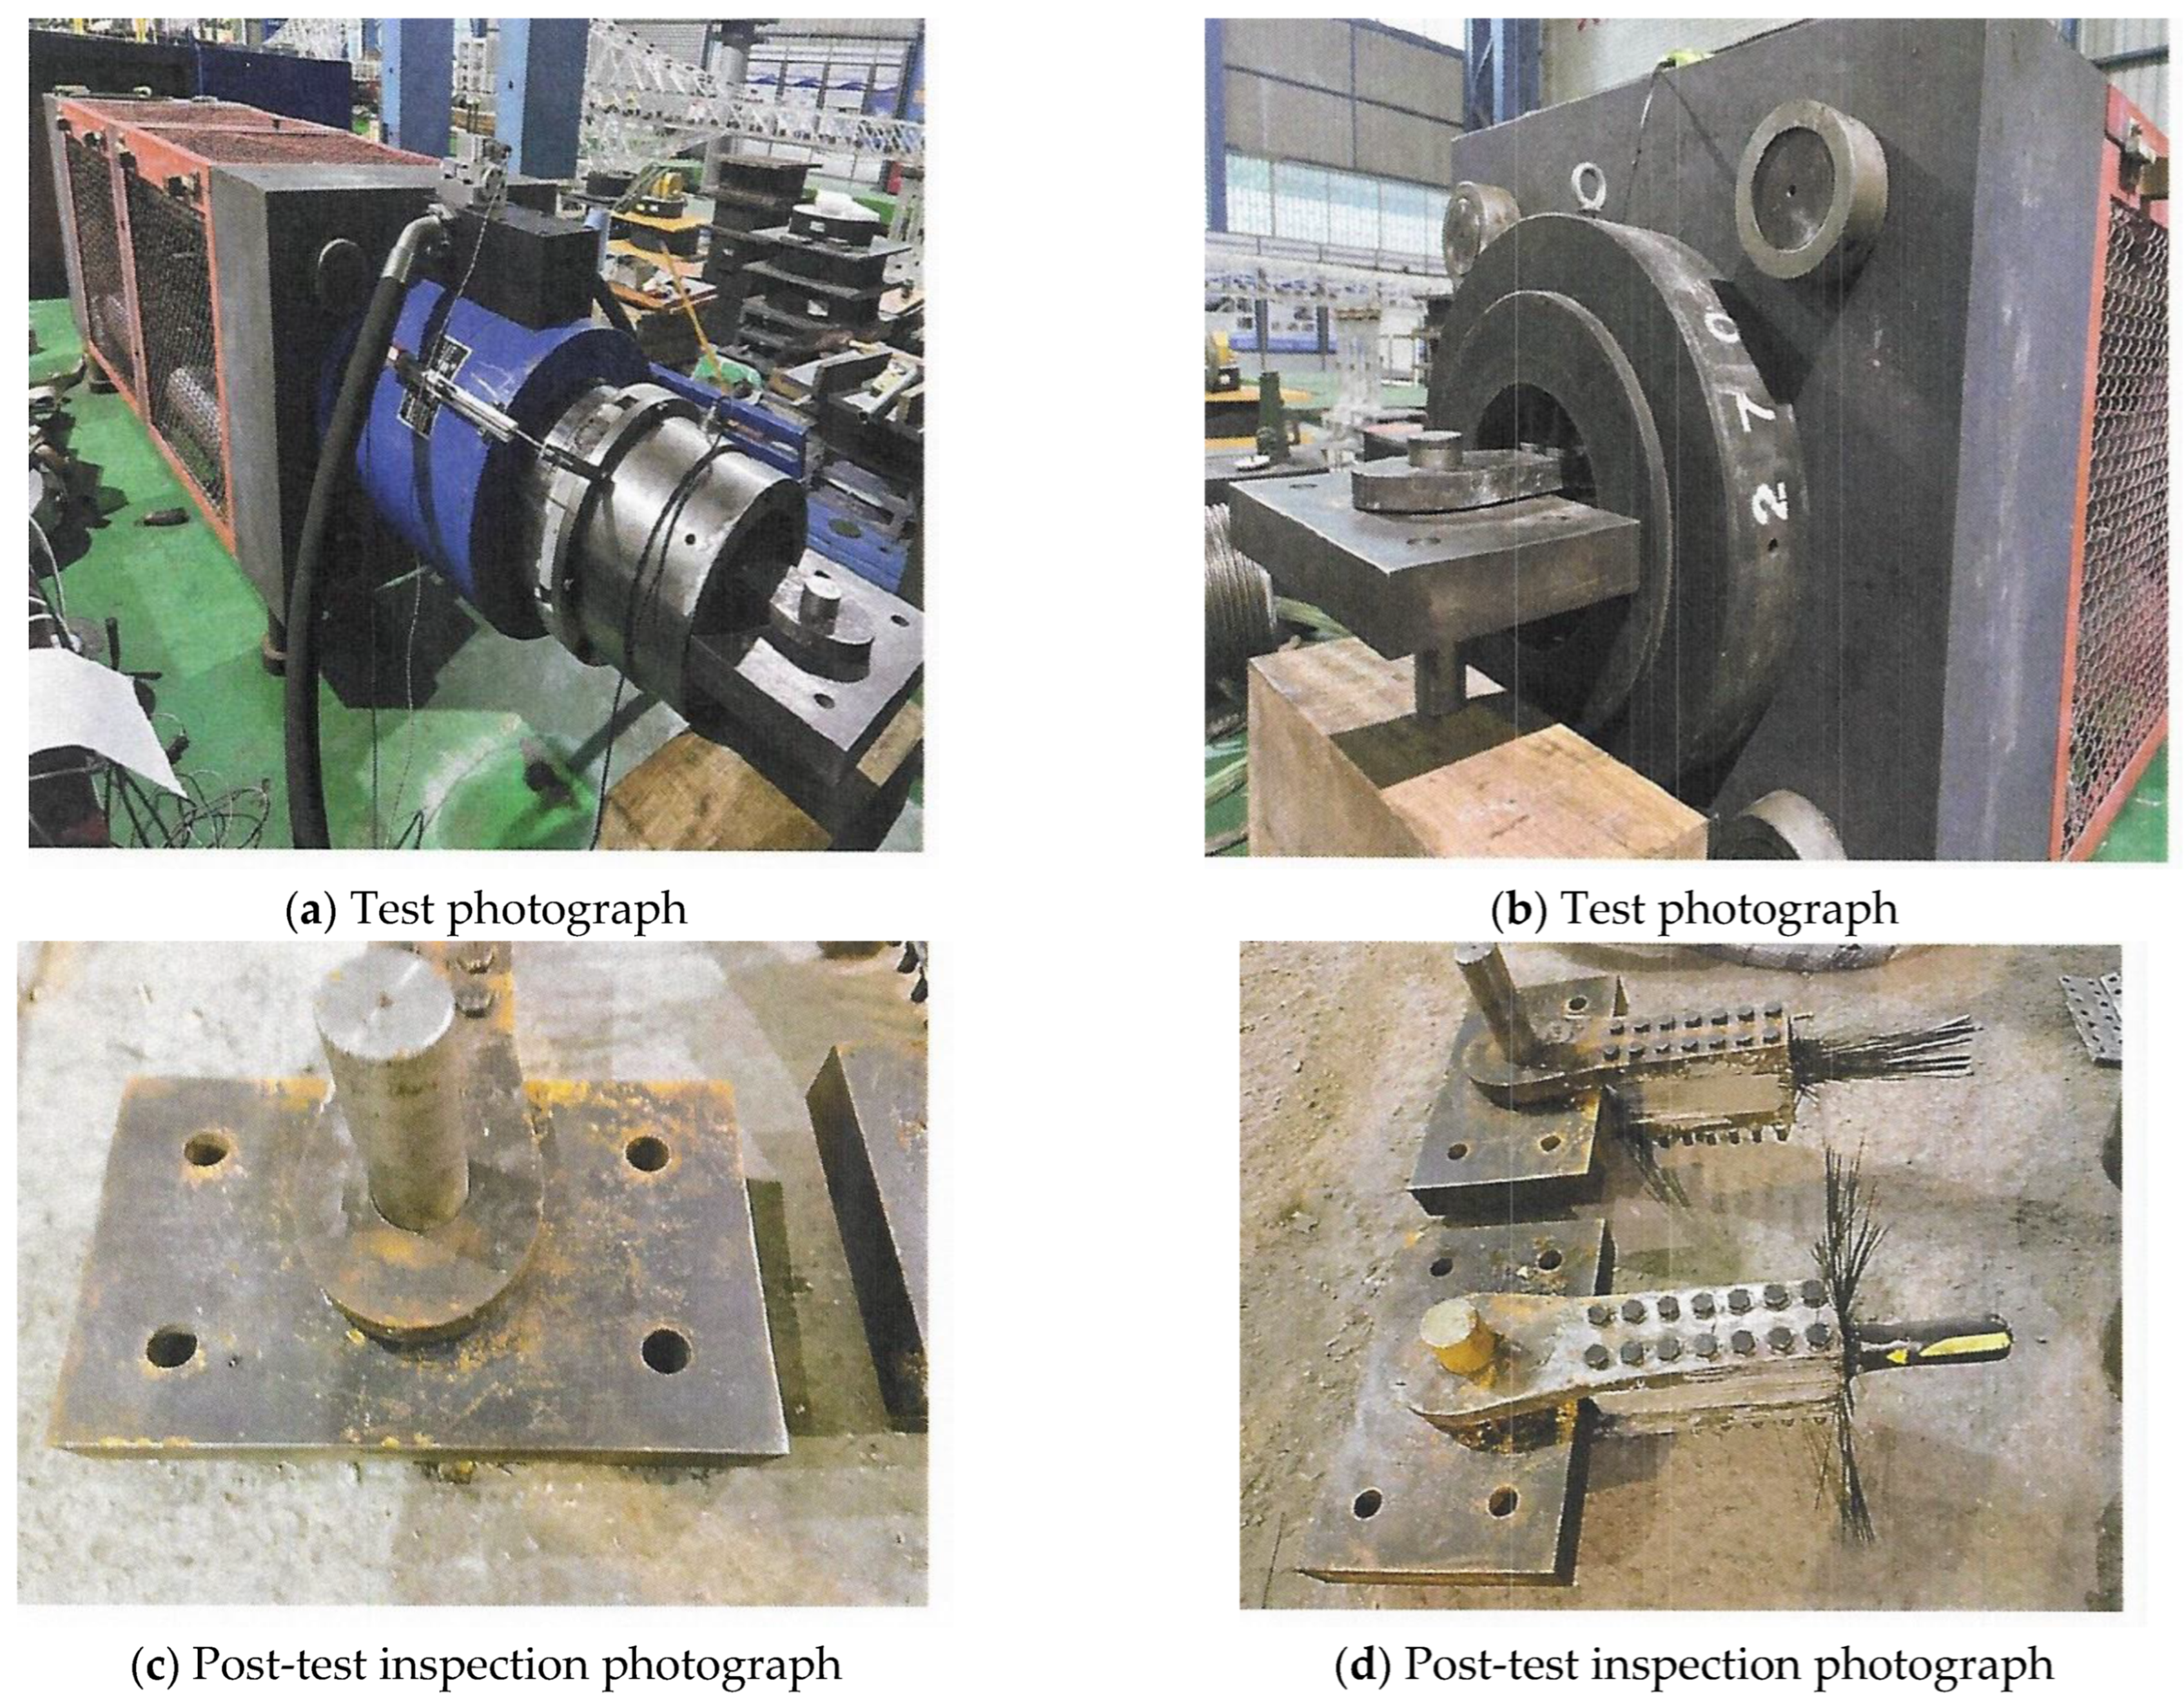
All CFRP materials used in this test were uniformly produced and supplied by Zhuoyue Qiangsen Co., Ltd. (Chongqing, China), and tested accordingly. The company’s research team has previously tested the overall tensioning effect of the graded pressure-dispersed CFRP anchor cables during tensioning, achieving the expected test results. The test material types include two specifications: 10-layer Type A and 15-layer Type B, both with geometric dimensions of length 15 m and rectangular cross-section 30 mm × 1.2 mm (width × thickness). Both types of anchor cables were sent to a third-party unit, China Merchants Chongqing Highway Engineering Testing Center Co., Ltd. (Chongqing, China), for testing. Static anchorage performance tests were conducted on them according to the following procedure: ① Install the test cable and preload the specimen. ② Formal loading: First load to 50 kN, then load to the design load (1296 kN). After observing no abnormalities in the specimen, continue loading until rupture, recording relevant data during the process. During the test, loading at all levels was stable with no abnormalities observed. After the test, the specimen was disassembled for inspection: the tendon body of the specimen broke, while the anchorage head and pin shaft showed no damage, meeting the design requirements. The test is shown in Figure 5.
Figure 5.
Test inspection images.
The anchor cables used in this test are high-strength, low-relaxation carbon fiber anchor cables. To achieve distributed monitoring throughout the entire tensioning process, a single-mode Fiber Bragg Grating (FBG) array is integrated into the tendon body, with a grating spacing of 0.5 m, forming a chain sensing network, as shown in Figure 6. The FBG operating wavelength range is 1525–1565 nm, with a resolution of ±1 pm, corresponding to a strain resolution of ≈1.2 µε. This intelligent CFRP anchor cable can acquire the axial strain distribution of the anchorage zone and free segment in real time without compromising the integrity of the tendon body, providing high spatiotemporal resolution data for differential elongation calculation and compensation tensioning. Considering the installation requirements for tensioning end anchorage heads, working anchors, and external sensors, a uniform process allowance Ladd of 0.5 m is added to the cutting length L0, i.e., L = L0 + 0.5 m, ensuring sufficient tensioning stroke and avoiding end stress concentration. All CFRP tendon bodies undergo fiber fusion splicing, sheath encapsulation, and vacuum pressure impregnation with epoxy resin in the factory. Random sampling is conducted for 0.6 fpk static load tests before leaving the factory to ensure batch consistency and long-term reliability.
Figure 6.
Smart carbon-fiber-anchor-cable system.
3.4. Test Instruments and Methods
The test primarily monitors its stress, tensioning load, and anchor head pressure to achieve the above monitoring objectives.
To achieve full-length distributed, high-precision strain monitoring of the CFRP prestressed anchor cable, this study uses a decimeter-level ultra-weak Fiber Bragg Grating (FBG) wavelength demodulation module. Parameter setting, calibration, current setting, threshold adjustment, grating position calculation, etc., for the decimeter-level ultra-weak grating wavelength demodulation module can monitor the “wavelength array diagram” of the entire FBG array and the “spectrum diagram” and “single grating wavelength diagram” of any specified grating (set via “sensor number”). The corresponding stress–strain data is then obtained through its conversion coefficient.
The digital display jack (also known as digital hydraulic jack or jack with pressure gauge) is a tensioning or lifting equipment that integrates a high-precision pressure sensor and an LED/LCD digital display unit on the basis of a traditional hydraulic jack. It converts the oil pressure of the piston–cylinder system in real-time into directly readable tonnage or pressure values and is widely used in prestressed tensioning, bridge bearing replacement, synchronous lifting of heavy components, and other scenarios.
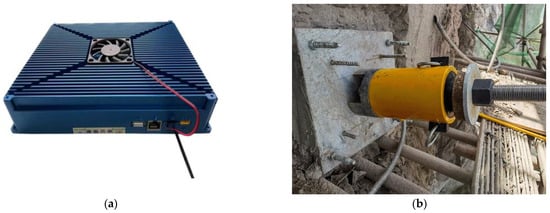
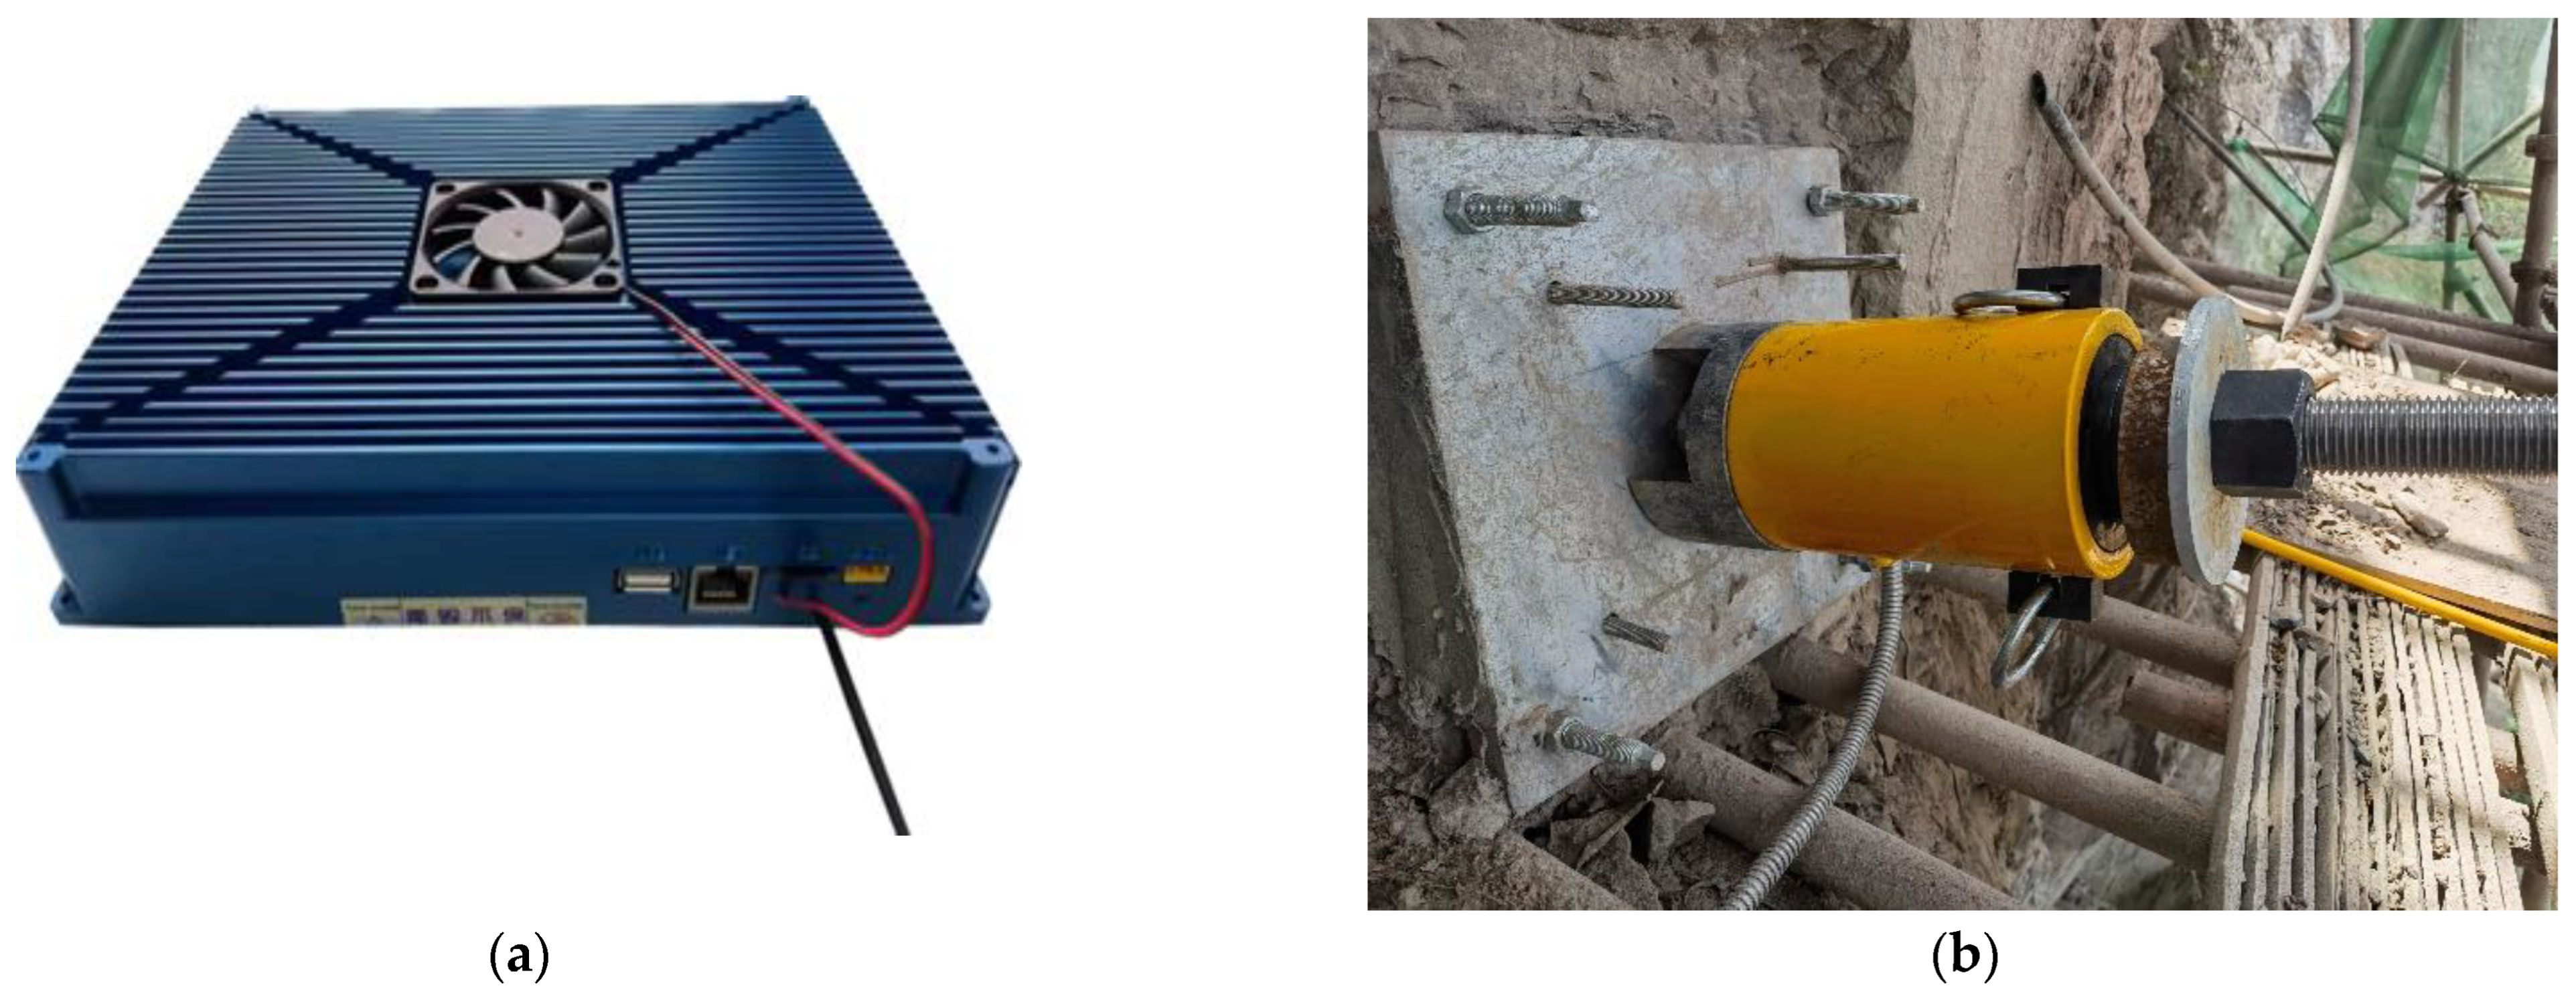
To obtain the real load of the prestressed CFRP anchor cable in real-time during tensioning and long-term service, a center-hole hydraulic pressure sensor with a center hole diameter of 40 mm is connected in series at the anchor head, allowing the CFRP tendon bundle to pass through entirely, avoiding eccentric loading. The physical images of the instruments and equipment used in the test are shown in Figure 7.
Figure 7.
Tensioning and monitoring equipment. (a) Decimeter-grade ultra-weak FBG wavelength-demodulation module. (b) Tensioning apparatus.
4. Intelligent Anchor Cable Tensioning Test
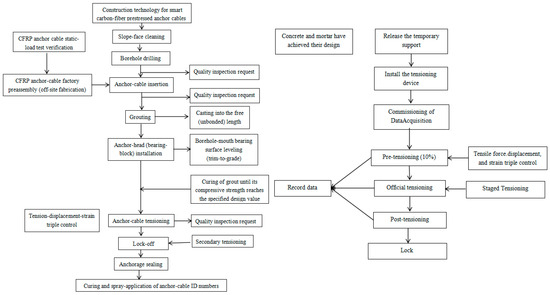
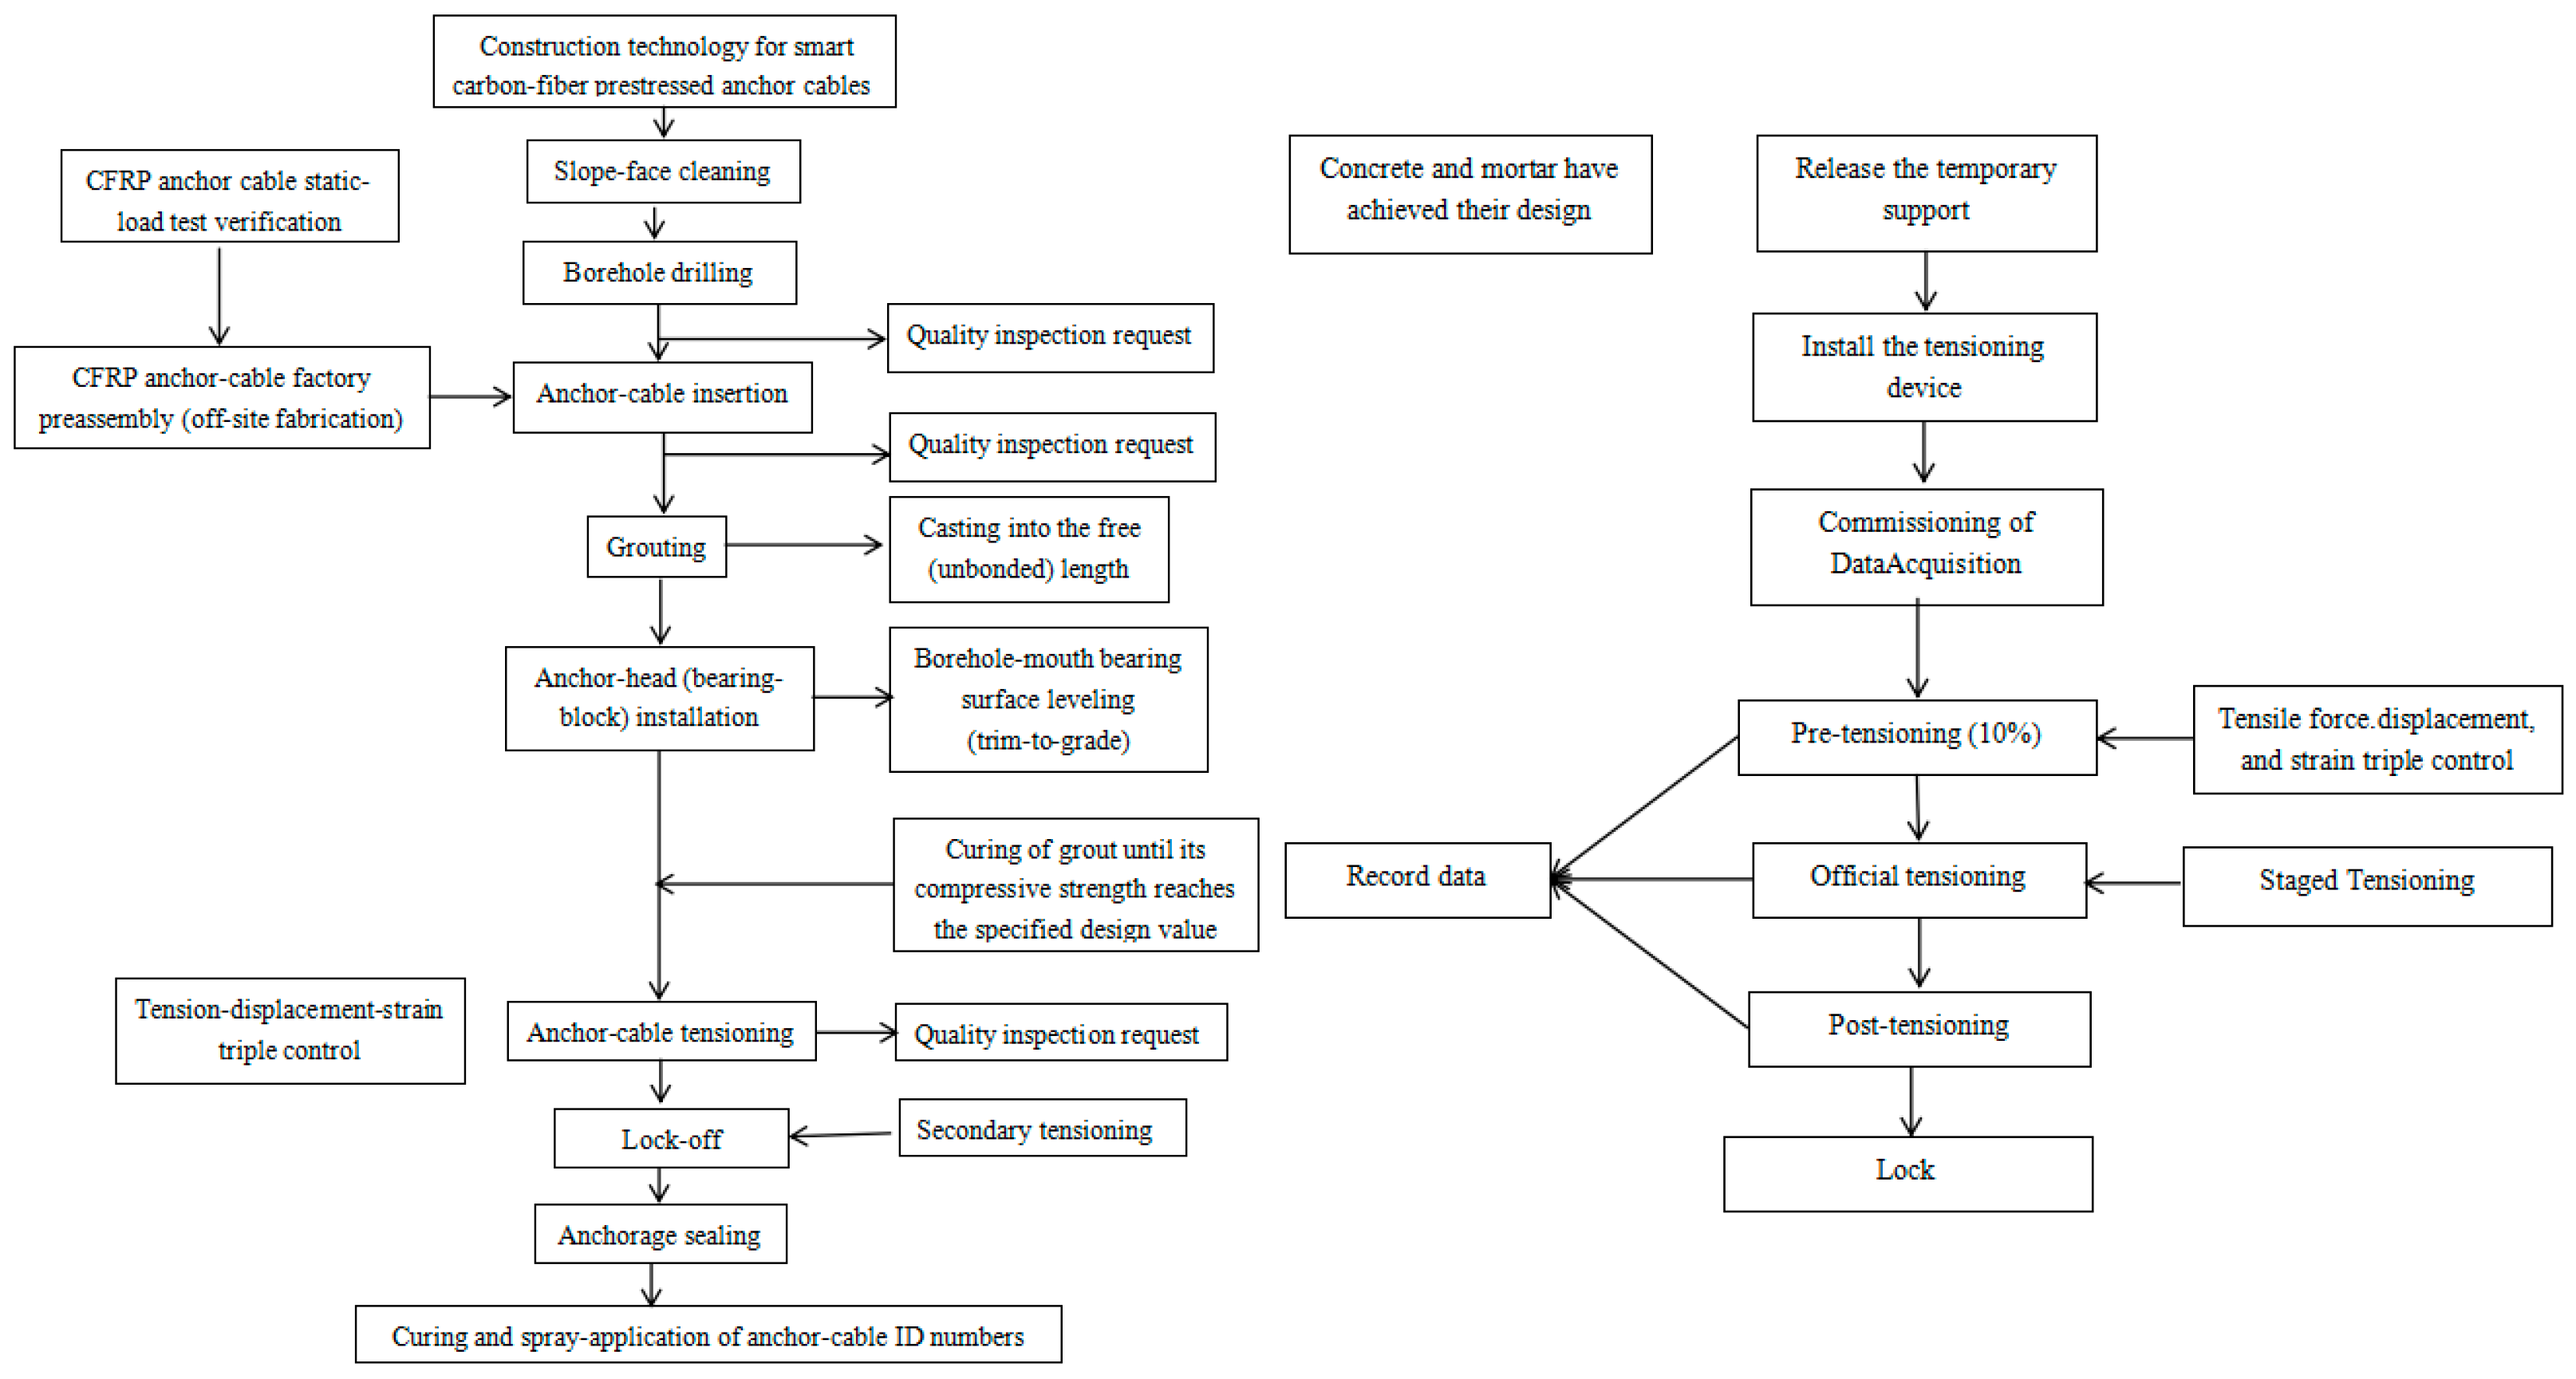
To verify the force study of the intelligent carbon fiber (CFRP) anchor cable in the Guangyang Avenue Ecological Restoration and Quality Improvement Project of Guangyang Island Eco-City, the field pull-out test was strictly controlled according to the “Intelligent Carbon Fiber Anchor Cable Construction/Tensioning Process Flow”, as shown in Figure 8.
Figure 8.
Construction sequence.
5. Test Result Analysis
After the anchor cable loading was completed according to the established pull-out test plan, the entire process of Fiber Bragg Grating (FBG) monitoring data was systematically organized to obtain the table “FBG Central Wavelength Monitoring Values and Wavelength Shift Amounts Corresponding to Various Tensioning Loads”. The actual force values monitored by the grating points under different loads can be calculated and listed in the table “Force Values Monitored by FBG Anchor Cable Sensors under Different Loads”. Fitting analysis was performed on the monitoring data from FBG sensors under different loading values and the force data at different monitoring positions under the same loading value. We selected one Type A and one Type B anchor cable for analysis.
5.1. Analysis of Force Monitoring Data from C1 Anchor Cable Pull-Out Test
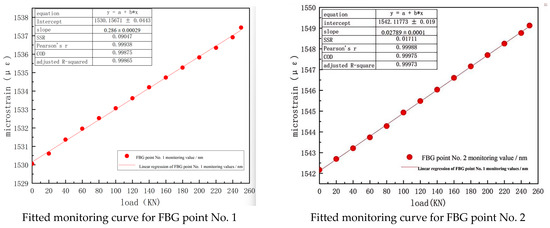
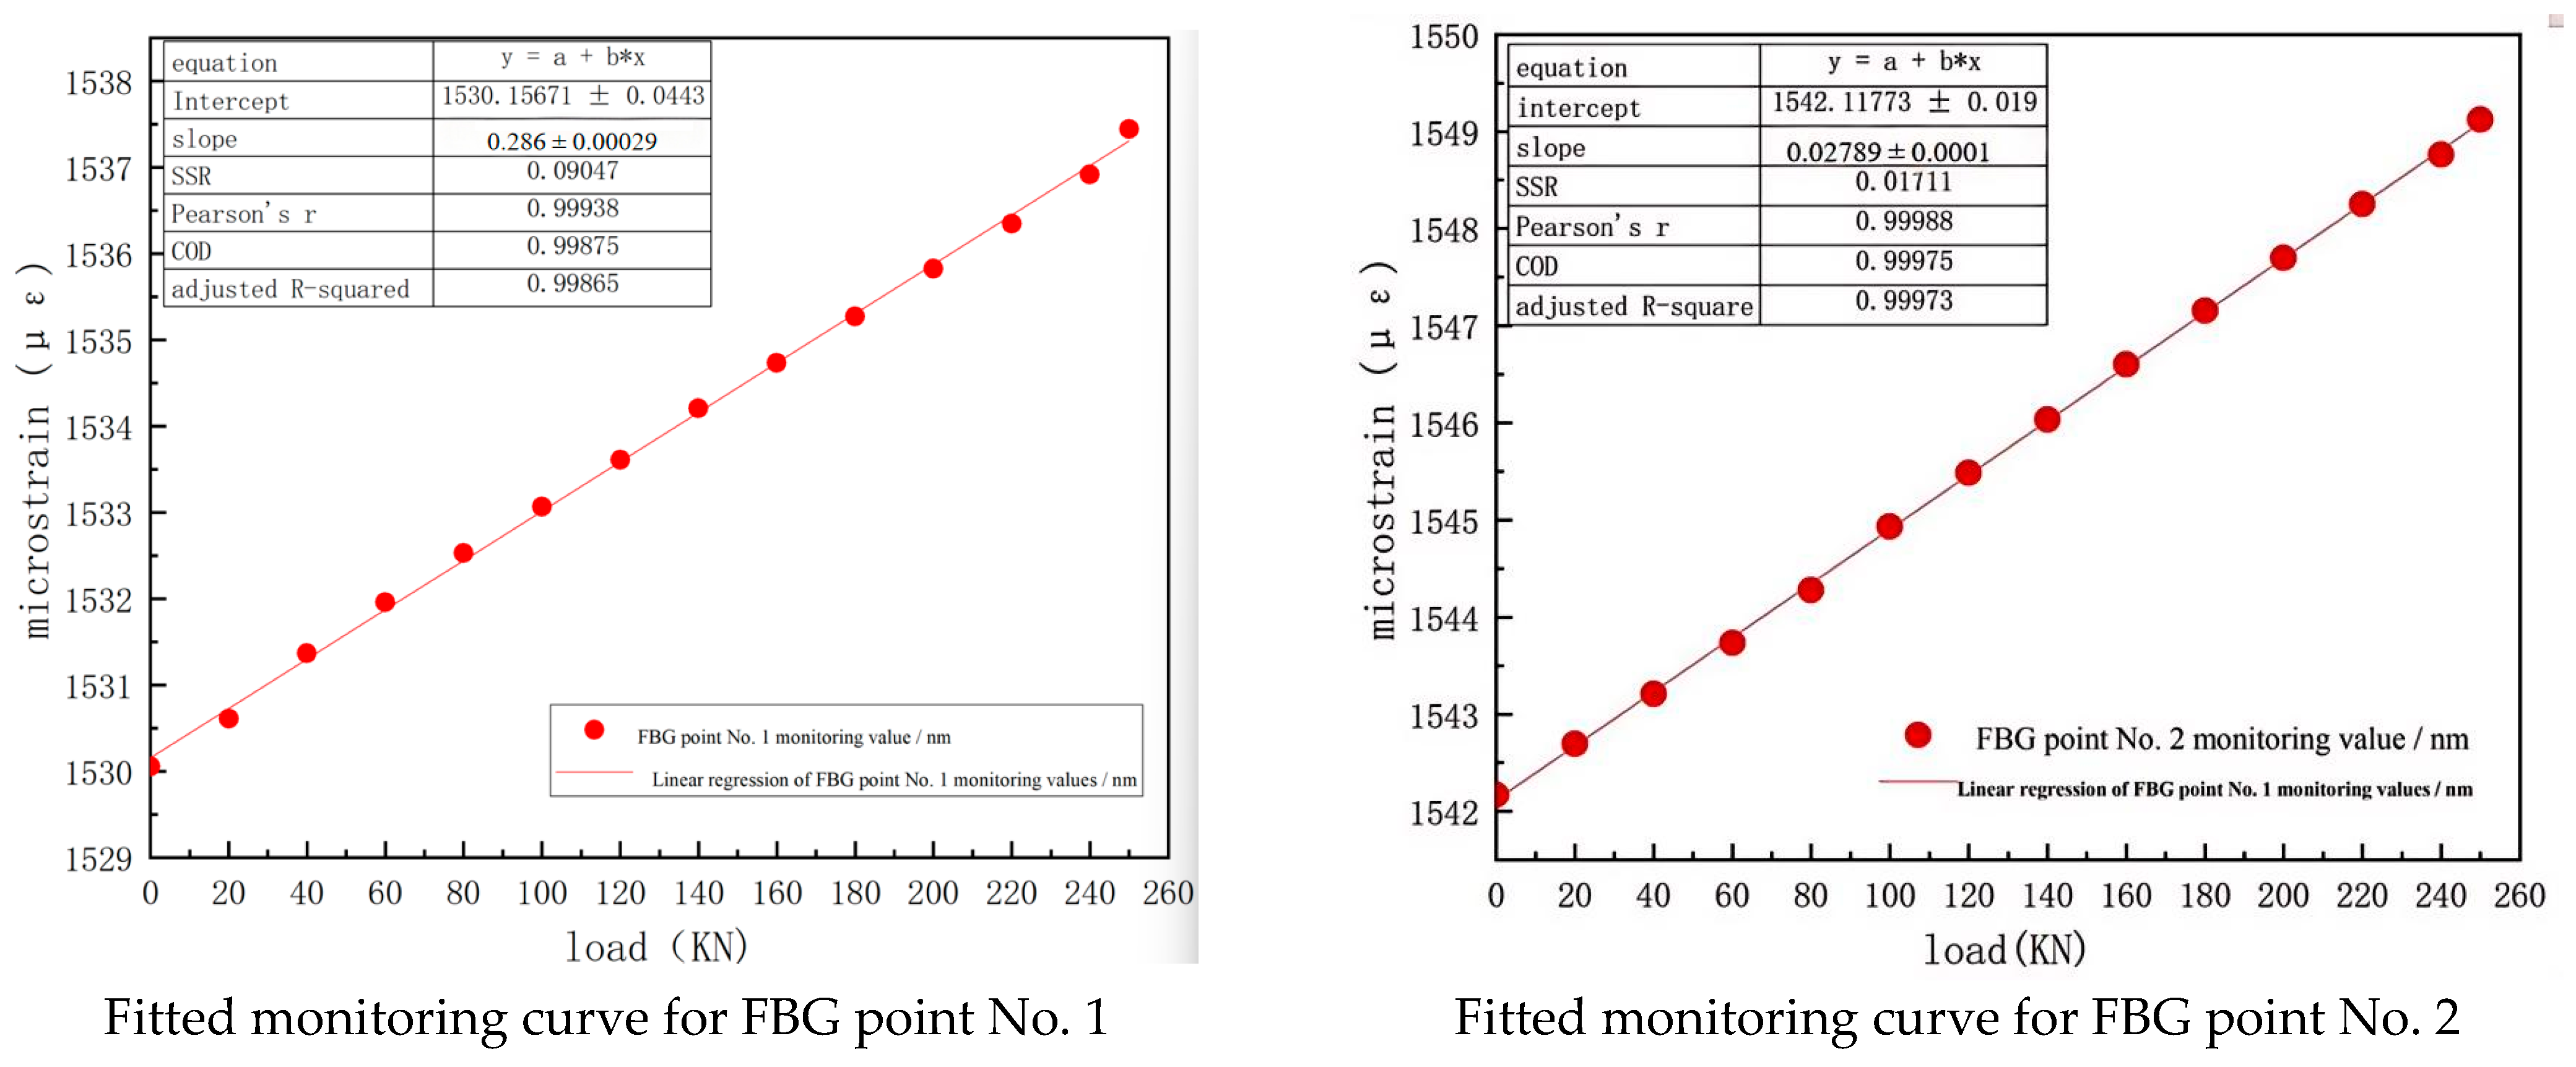
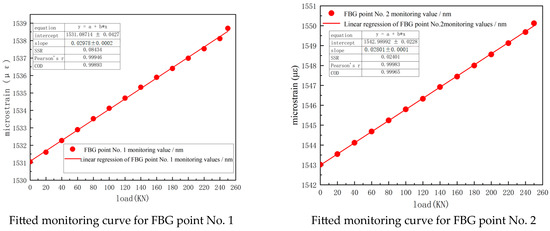
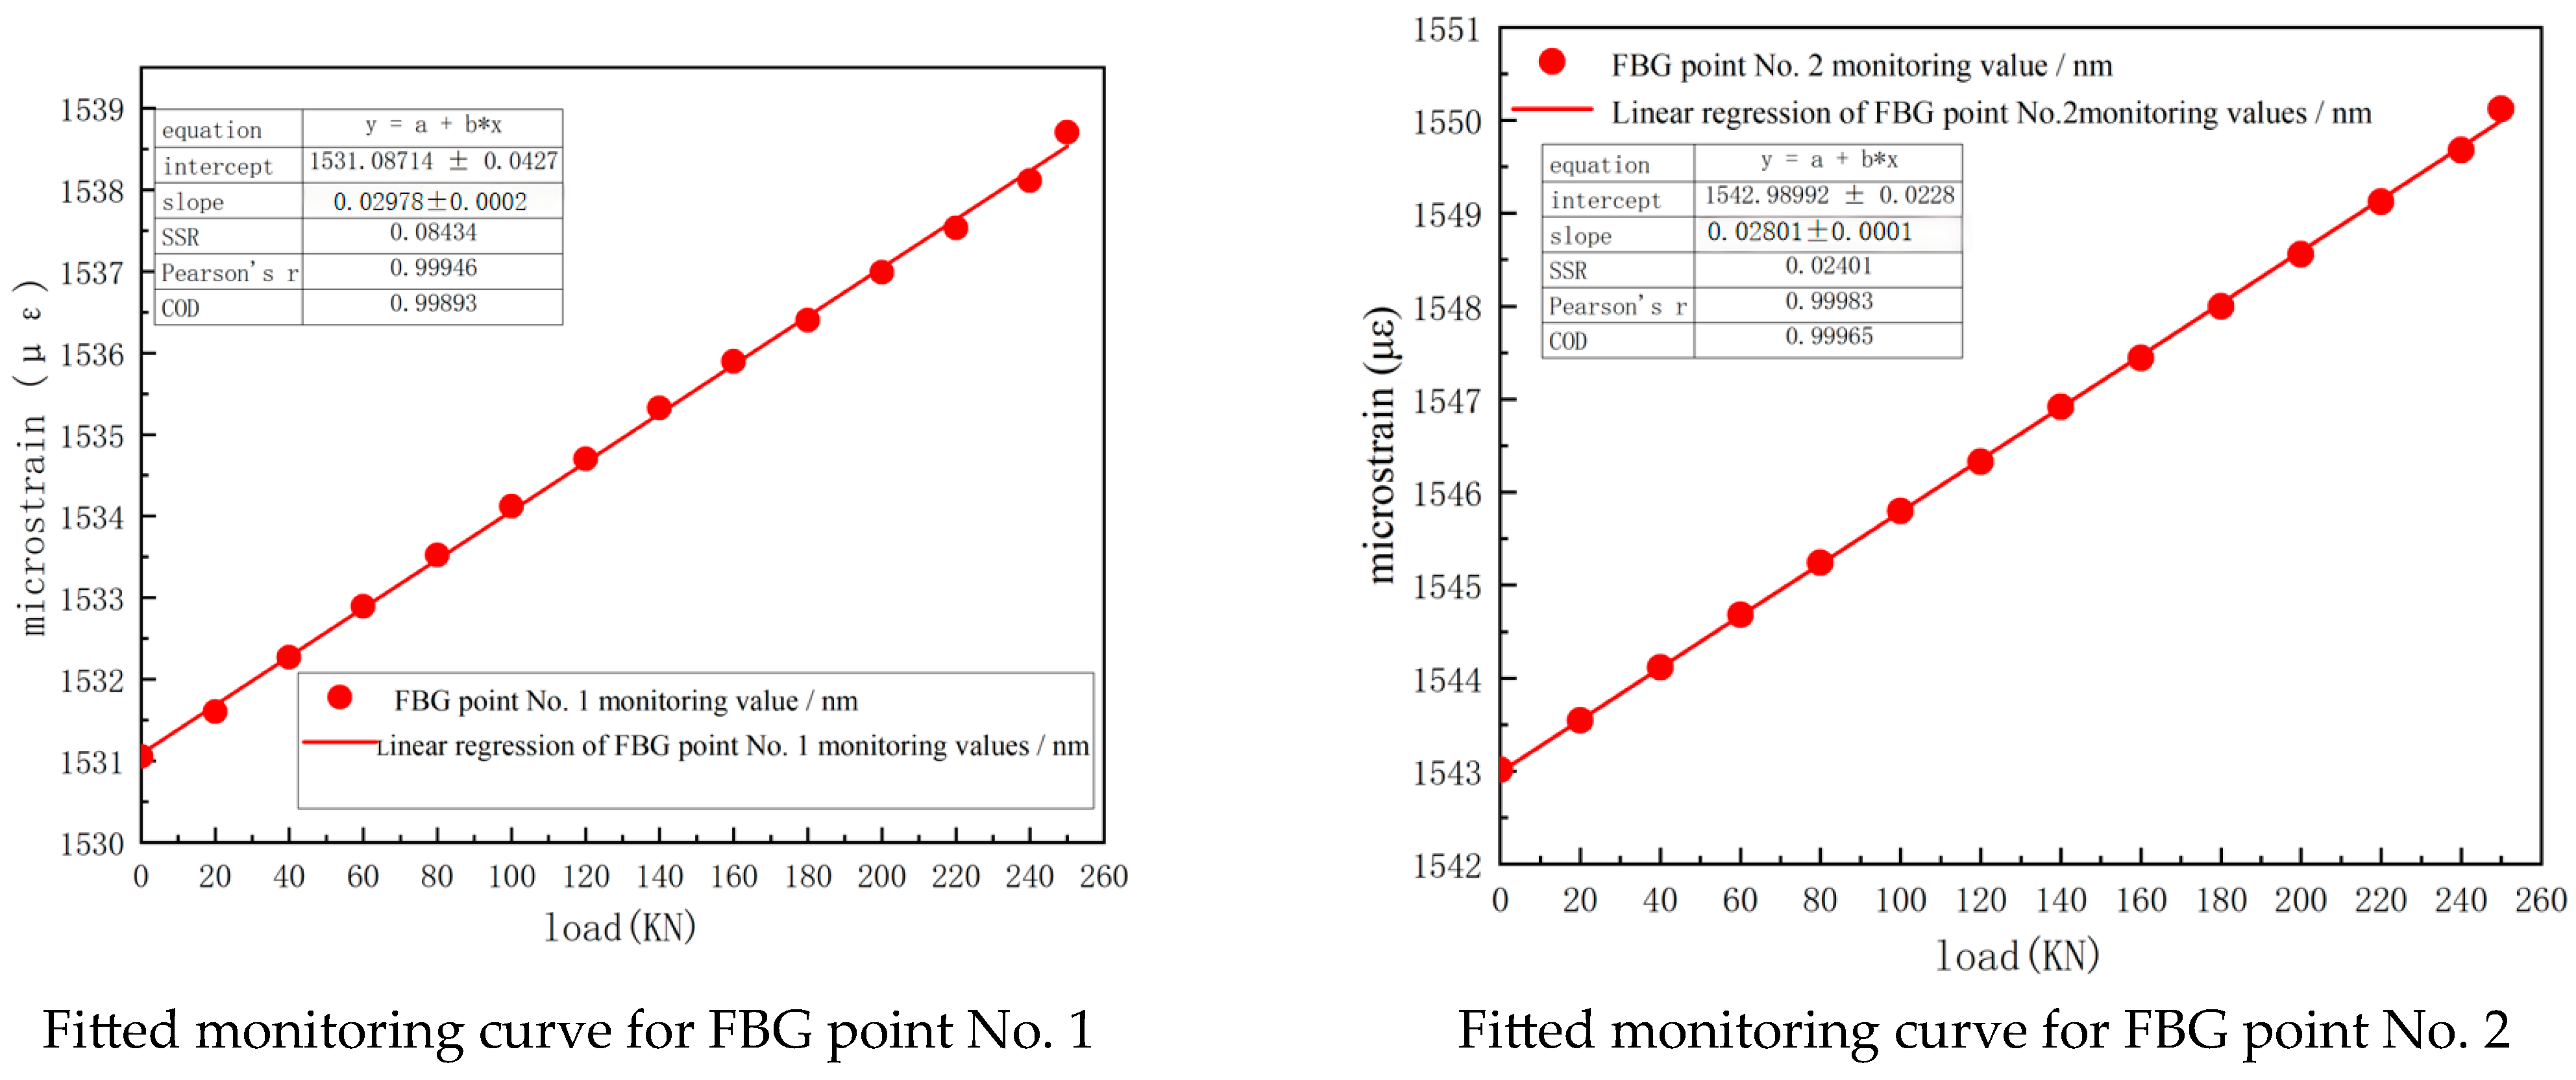
The total length of the C1 anchor cable is 15 m, with an anchorage segment length of 6 m and a free segment length of 9 m. Regarding sensor arrangement, grating measurement points are set along the cable axis at 0.5 m intervals to achieve refined monitoring of the anchor cable stress distribution. For the analysis of stress characteristics in the free segment, within the free segment range, measurement points at 0.5 m and 6 m from the borehole collar towards the anchorage segment are extracted and named Grating Point 1 and Grating Point 2, respectively. In the anchorage segment, data from points at 9.5 m, 11.5 m, and 14 m from the borehole collar are extracted and named Grating Point 3, Grating Point 4, and Grating Point 5, respectively, for analysis. Grating Point 3 is 0.5 m from the interface between the free segment and the anchorage segment. Table 2 and Table 3 record the grating monitoring data for this set of anchor cables tensioned according to the tensioning scheme. Figure 9 shows the fitting curve of the monitoring values for the grating points in the free segment.
Table 2.
Wavelength monitoring values and wavelength shifts of the FBG sensors for the C1 anchor cable under different loads.
Table 3.
Force values monitored by FBG sensors for the C1 anchor cable under different loads.
Figure 9.
Fitted monitoring curves for FBG points in the free length of anchor cable C1.
Both Grating Point 1 and Grating Point 2 are located in the unbonded free segment of the anchor cable, so their measurement results can be regarded as effective indicators directly reflecting the axial force of the anchor cable. Comparing the two tables, it can be seen that as the tensioning load gradually increases from 0 kN to 250 kN, the wavelength shift of Grating Point 1 increases from 0 nm to 7.388 nm, and that of Grating Point 2 increases from 0 nm to 6.953 nm. The shift amount shows an overall linear increasing trend with the load, and the shift increments remain basically constant at each load level, indicating a stable axial force transfer process in the free segment of the anchor cable, with no obvious local stress concentration or bond-slip phenomena. However, further comparison of the data from the two measurement points reveals that the wavelength shift of Grating Point 2 is always lower than that of Grating Point 1 at the same load level; when the load reaches 250 kN, the difference between the two shift amounts is 0.164 nm, with a relative difference of about 31.2%. This difference suggests a certain degree of attenuation when the load is transmitted to the end of the free segment. Combined with the existing literature, this attenuation may stem from the following two mechanisms: (1) energy dissipation caused by microscopic damping within the carbon fiber anchor cable and (2) interface friction between the free segment and the subsequent anchorage segment.
To further quantify the relationship between load and wavelength shift, linear regression analysis was performed on the grating monitoring data of the free segment, with the results shown in Figure 9. The coefficient of determination (R2) for the load-wavelength fitting curves of both Point 1 and Point 2 is as high as 0.999, indicating that the linear model has extremely high explanatory power for the measured data, and no mutations or abnormal shifts were observed during the entire loading process, verifying the stability and reliability of the monitoring system. The regression analysis also gives the sensitivity coefficients (k) for both measurement points, both concentrated around 0.028 nm·kN−1, further confirming that the anchor cable at different positions in the free segment has uniform material properties and consistent mechanical response in the elastic stage. This means they exhibit the same magnitude of change in wavelength monitoring values under the same change in loading value. This result is of great significance for engineering practice: on the one hand, it allows engineers to use a single sensitivity coefficient to predict the axial force at any position in the free segment, thus simplifying the monitoring scheme; on the other hand, it also provides a benchmark reference for assessing the performance degradation of the anchor cable in subsequent long-term health monitoring.
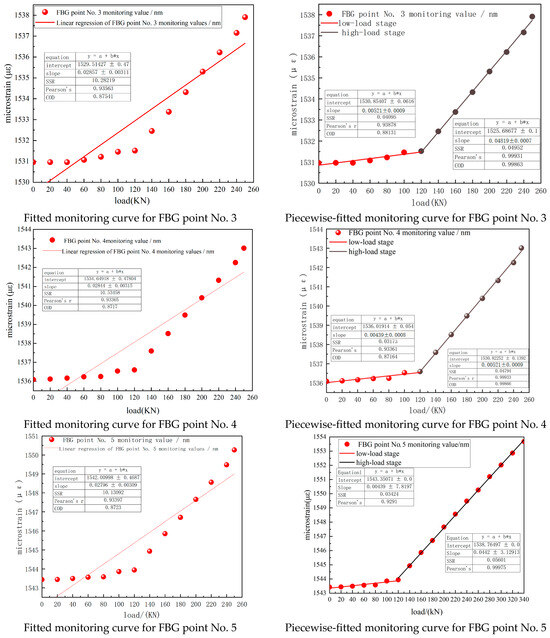
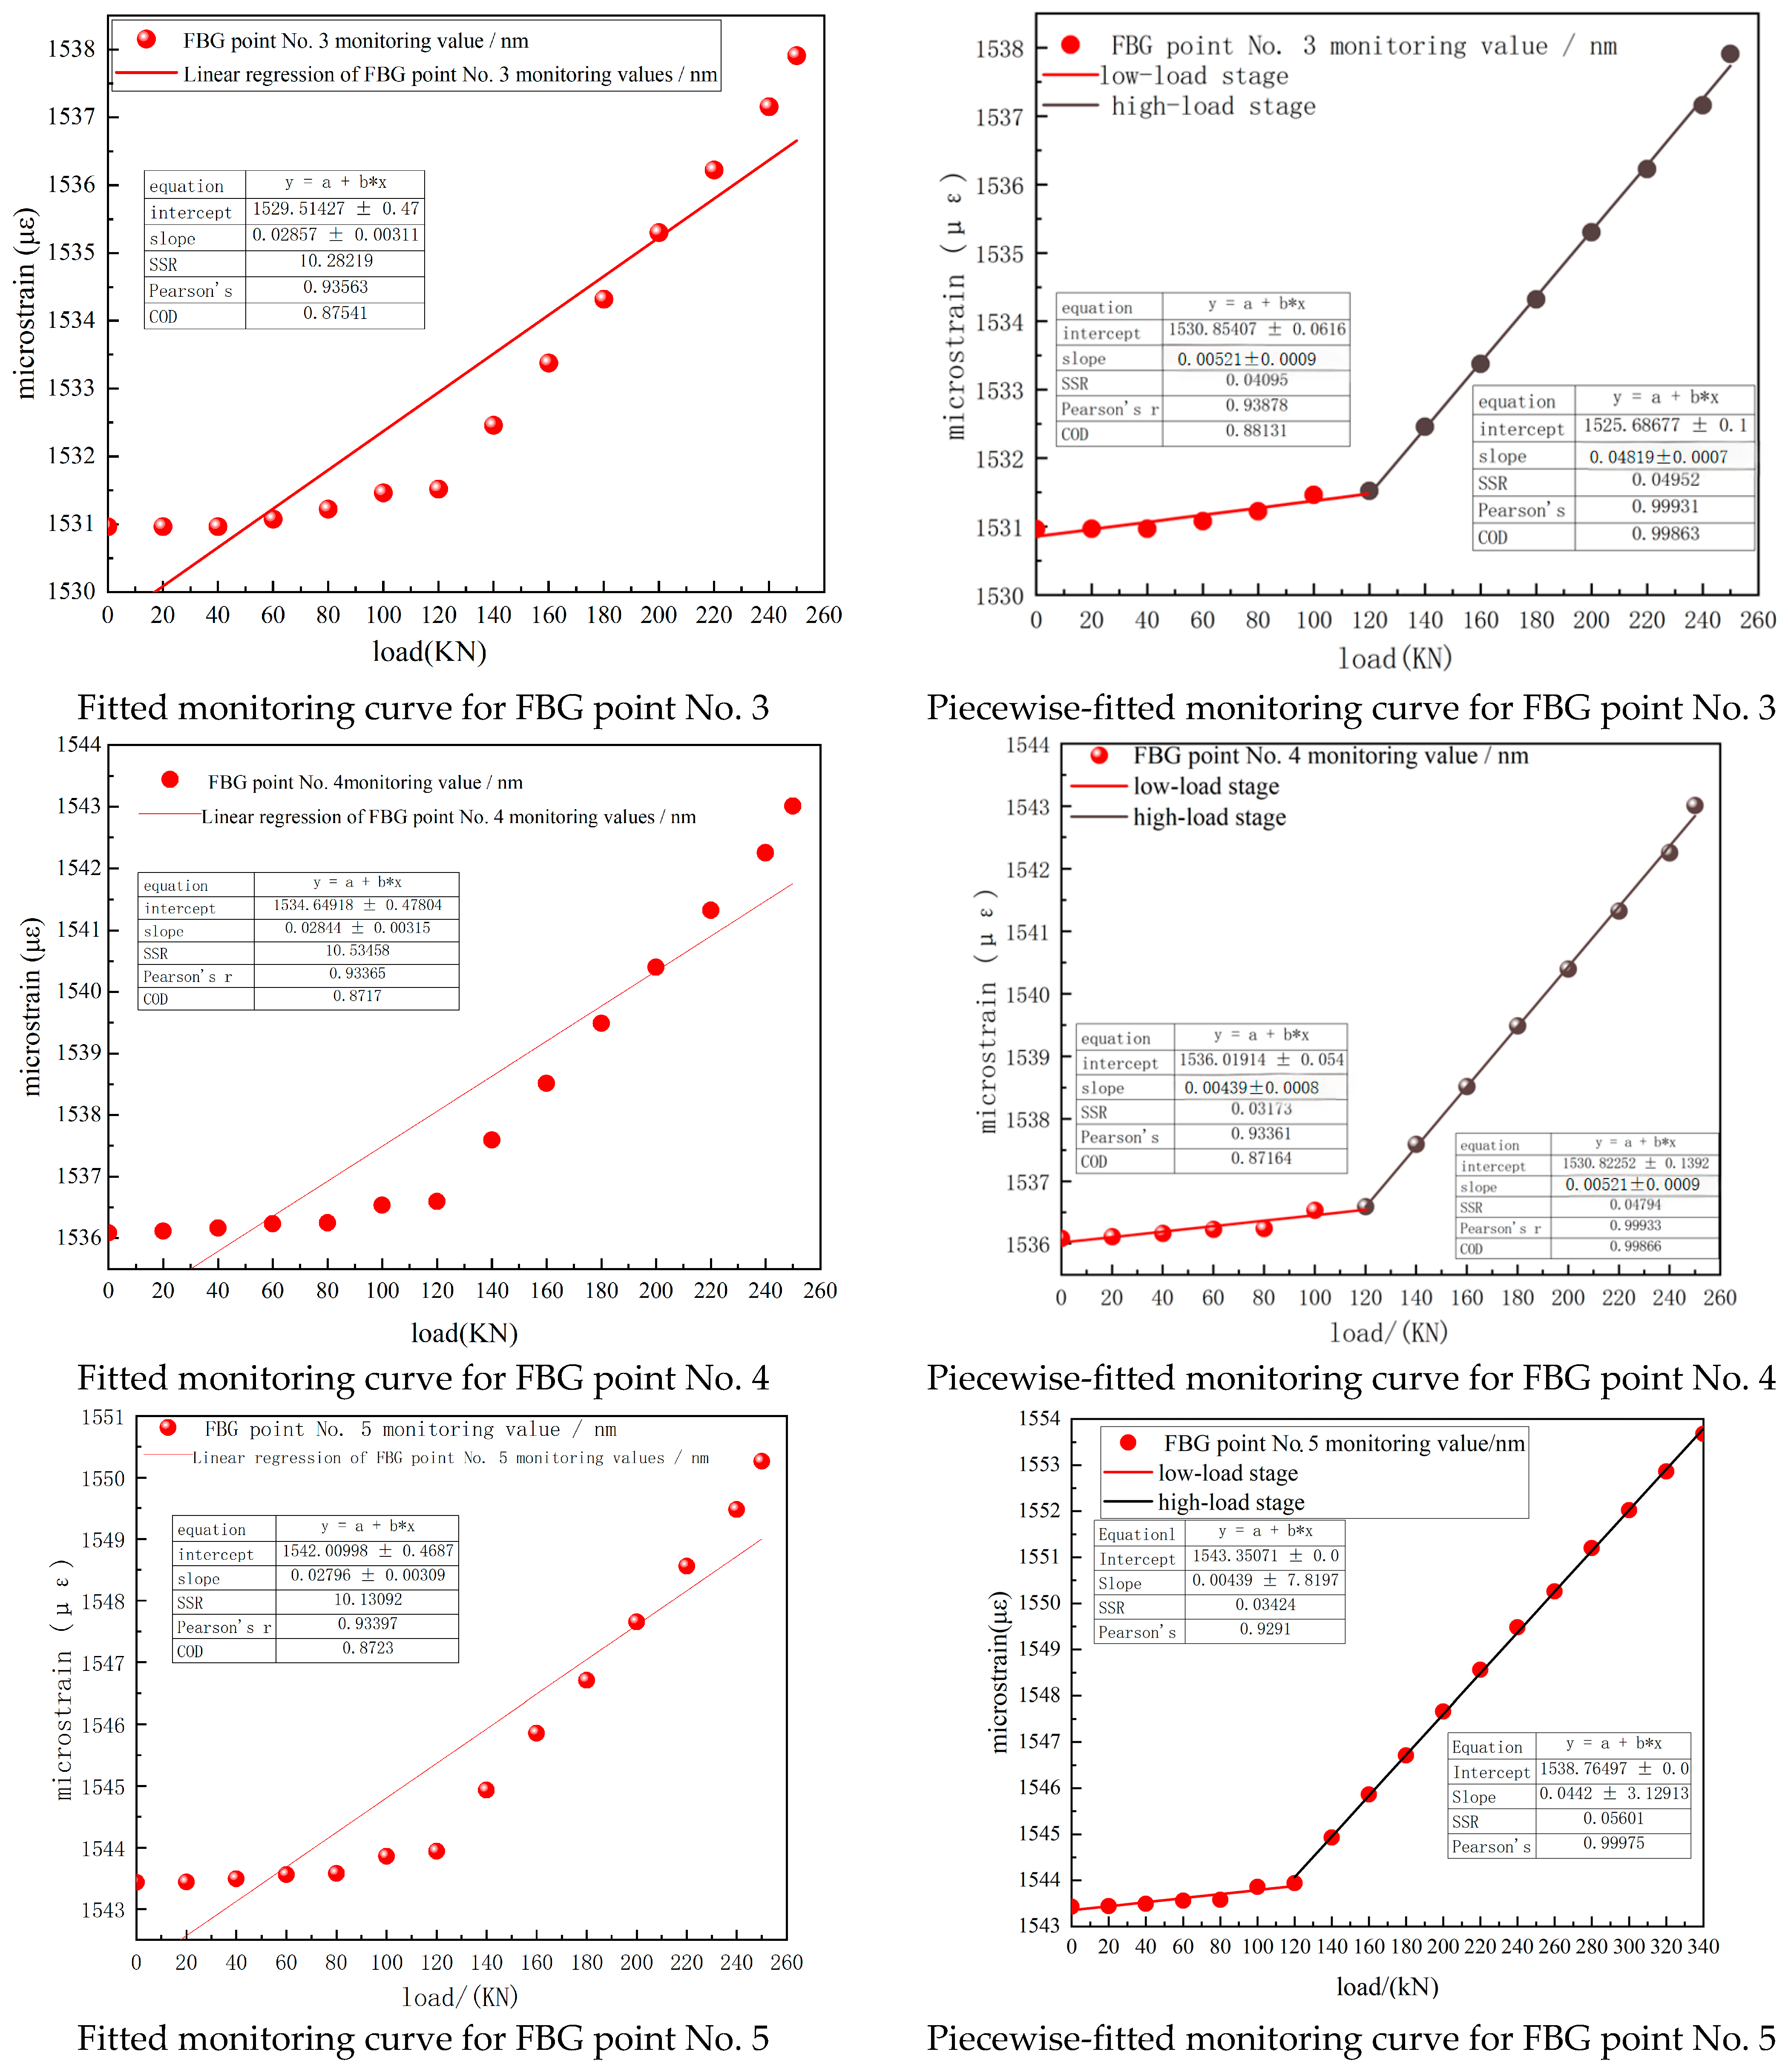
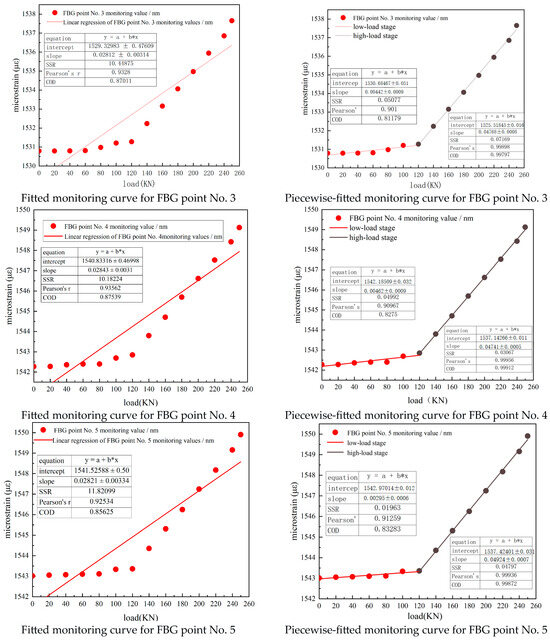
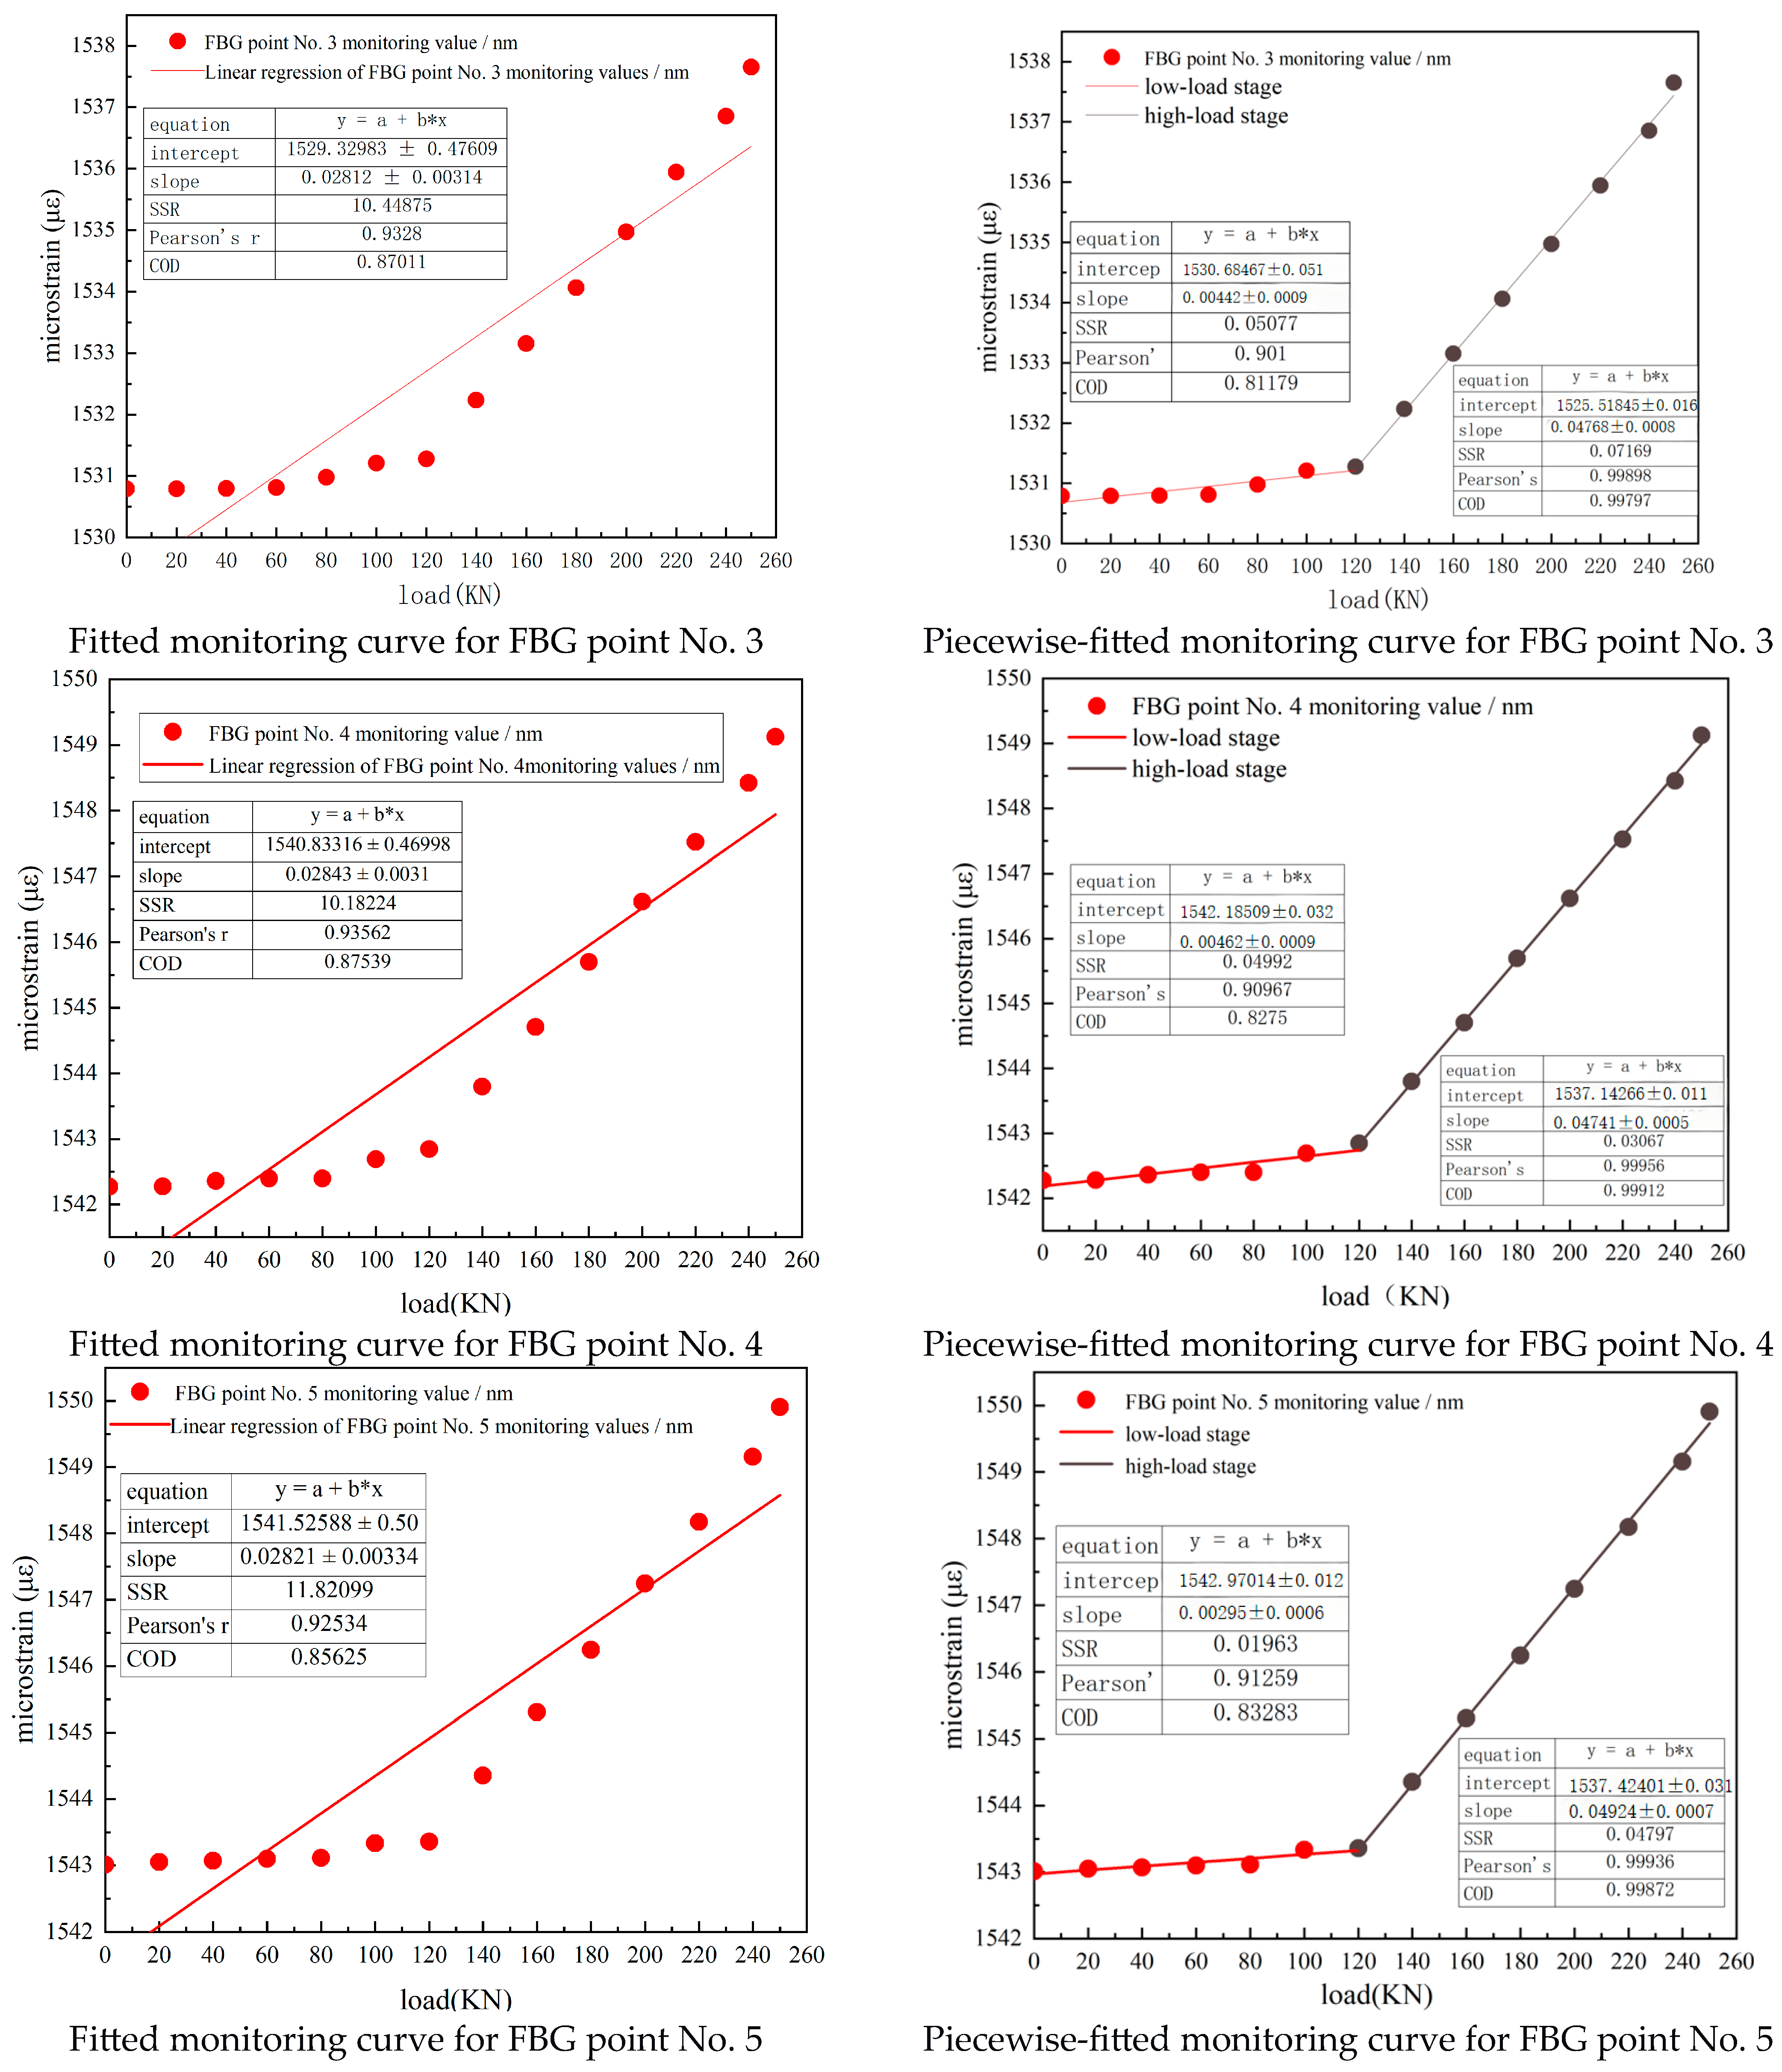
Meanwhile, Table 2 and Table 3 further provide the wavelength shift data of Fiber Bragg Grating (FBG) measurement points 3, 4, and 5 in the anchorage segment of the C1 anchor cable under step-by-step tensioning loads. Among them, Grating Point 3 is specifically installed 0.5 m outside the interface between the free segment and the anchorage segment, capable of sensitively capturing the initiation and evolution of stress transfer at the interface; Grating Points 4 and 5 extend successively inward into the anchorage segment and are used to evaluate the cooperative force characteristics at the grout-rock/soil interface and the distal anchorage zone, respectively. Significantly different from the linear response of the free segment, the wavelength increments of the three measurement points in the anchorage segment exhibit obvious nonlinear stage characteristics throughout the loading process. When the tensioning load increases from 0 kN to about 120 kN (low load stage), the total wavelength shifts of Grating Points 3, 4, and 5 are all less than 0.55 nm. In this stage, the anchorage segment has not significantly participated in bearing the load, which is mainly undertaken by the carbon-fiber anchor cable in the free segment. This response pattern with low amplitude and low slope is also consistent with the field-measured anchor head displacement curve, verifying the “delayed activation” characteristic of the anchorage segment at low stress levels.
When the load exceeds the 120 kN threshold, the anchorage segment enters the “activation stage”. At this time, the wavelength shift amounts of measurement points 3, 4, and 5 rapidly amplify, and the shift curves show an approximately synchronous linear rise, indicating that the shear stiffness of the grout-rock/soil interface tends to stabilize, and the anchorage segment begins to bear the main external load. Taking 140 kN as an example, the shift amounts of measurement points 3, 4, and 5 are 0.943 nm, 0.997 nm, and 0.991 nm, respectively, with differences less than 5%, showing that the force along the anchorage segment is basically uniform, meeting the engineering design requirement of “integral anchorage, uniform bearing”. Segmented linear fitting was performed on the wavelength-load data of the anchorage segment (Figure 10). The coefficient of determination (R2) for the full-stage (0–250 kN) fitting is only 0.885, suggesting that a single linear model is insufficient to describe the complex response of the anchorage segment throughout the process; however, when the data is segmented at 120 kN, the R2 for the low load segment (0–120 kN) increases to 0.86, while for the high load segment (120–250 kN) R2 is as high as 0.998, with a stable slope of 0.040–0.042 nm·kN−1, fully indicating that the anchorage segment enters a stable linear bearing state when >120 kN is applied.
Figure 10.
Fitted monitoring curves for FBG points in the bonded length of anchor cable C.
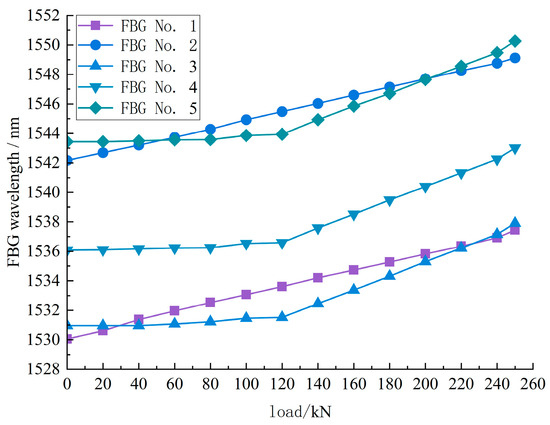
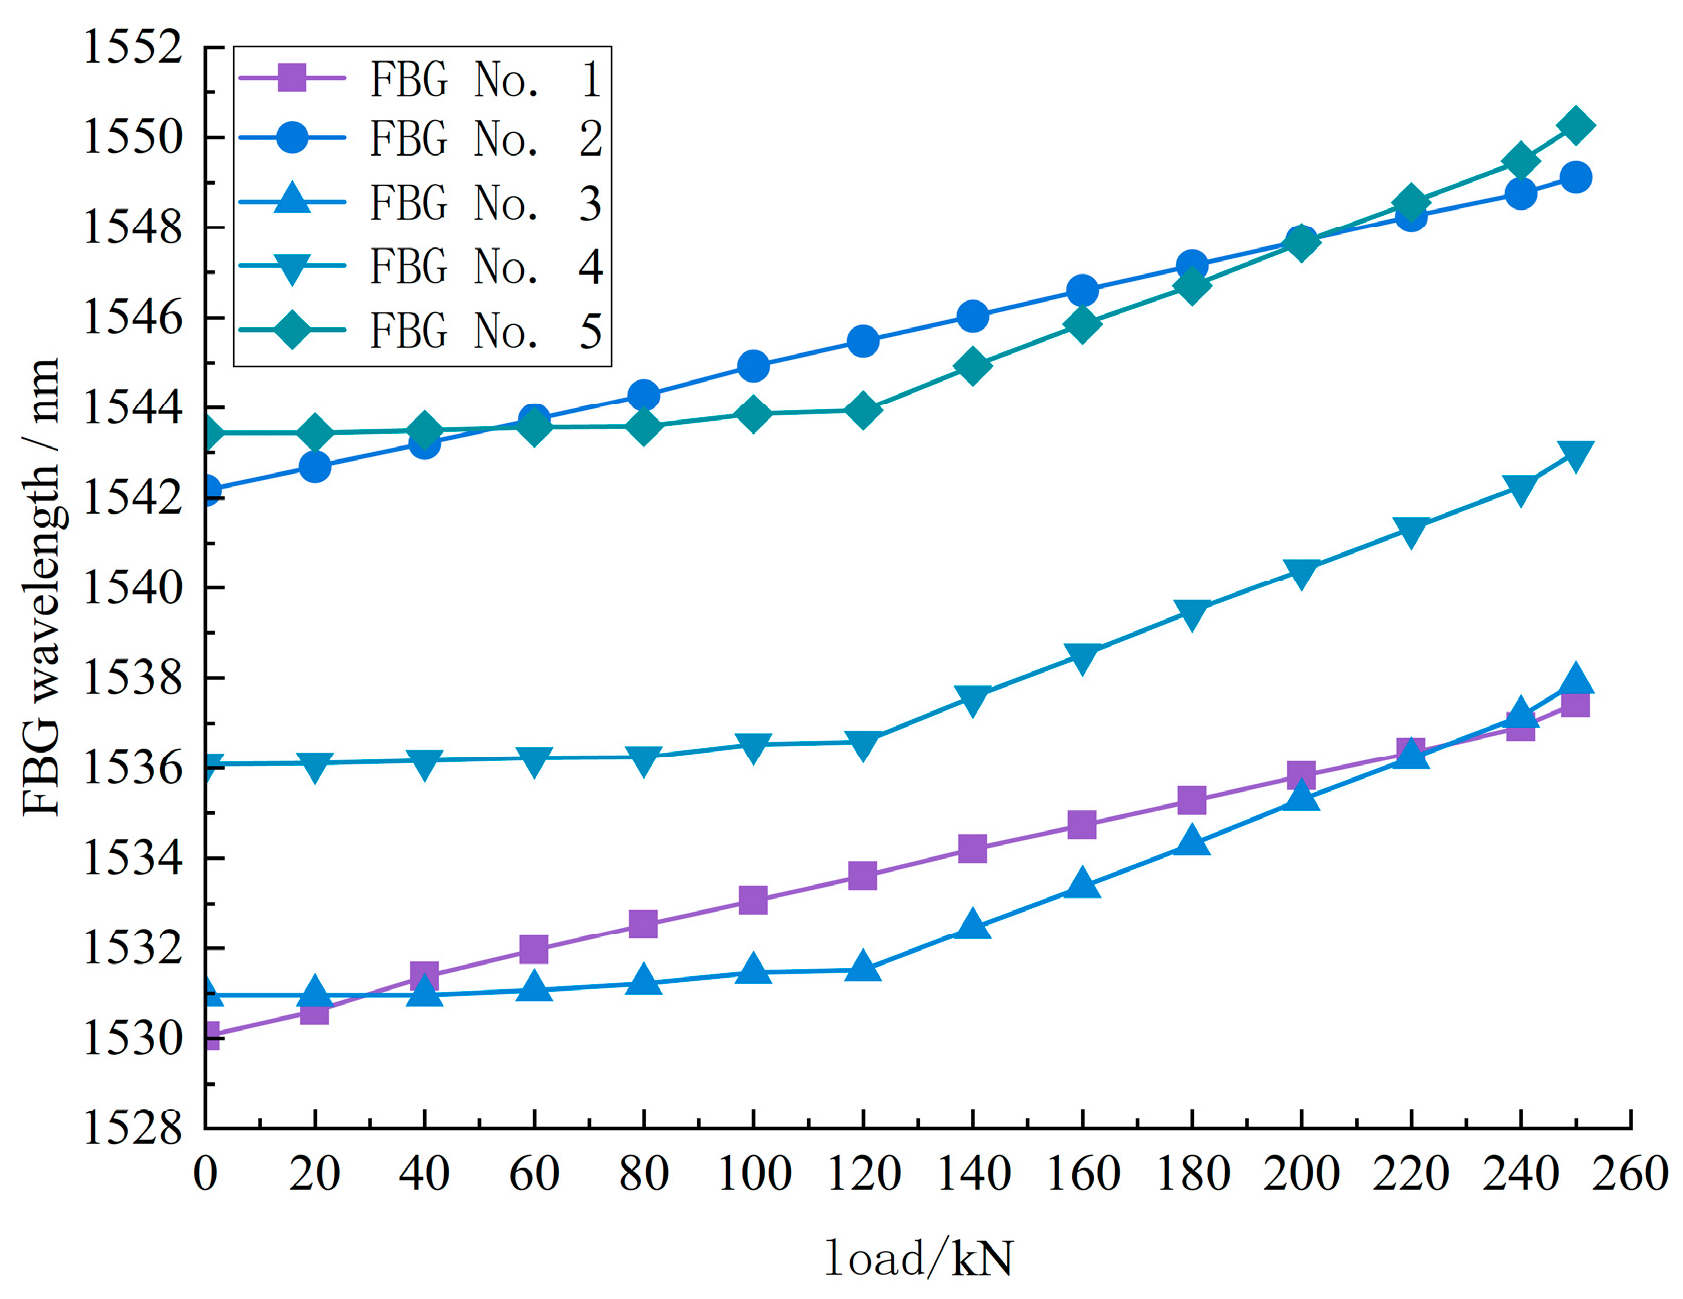
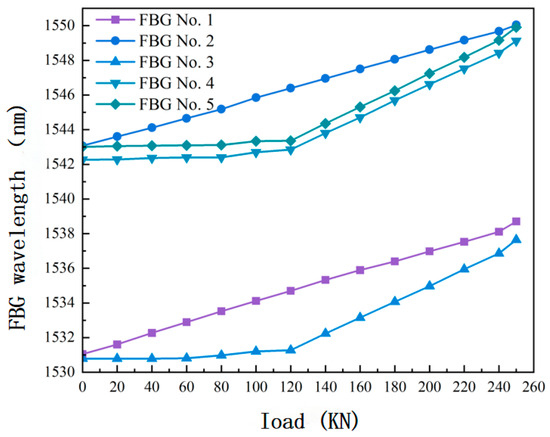
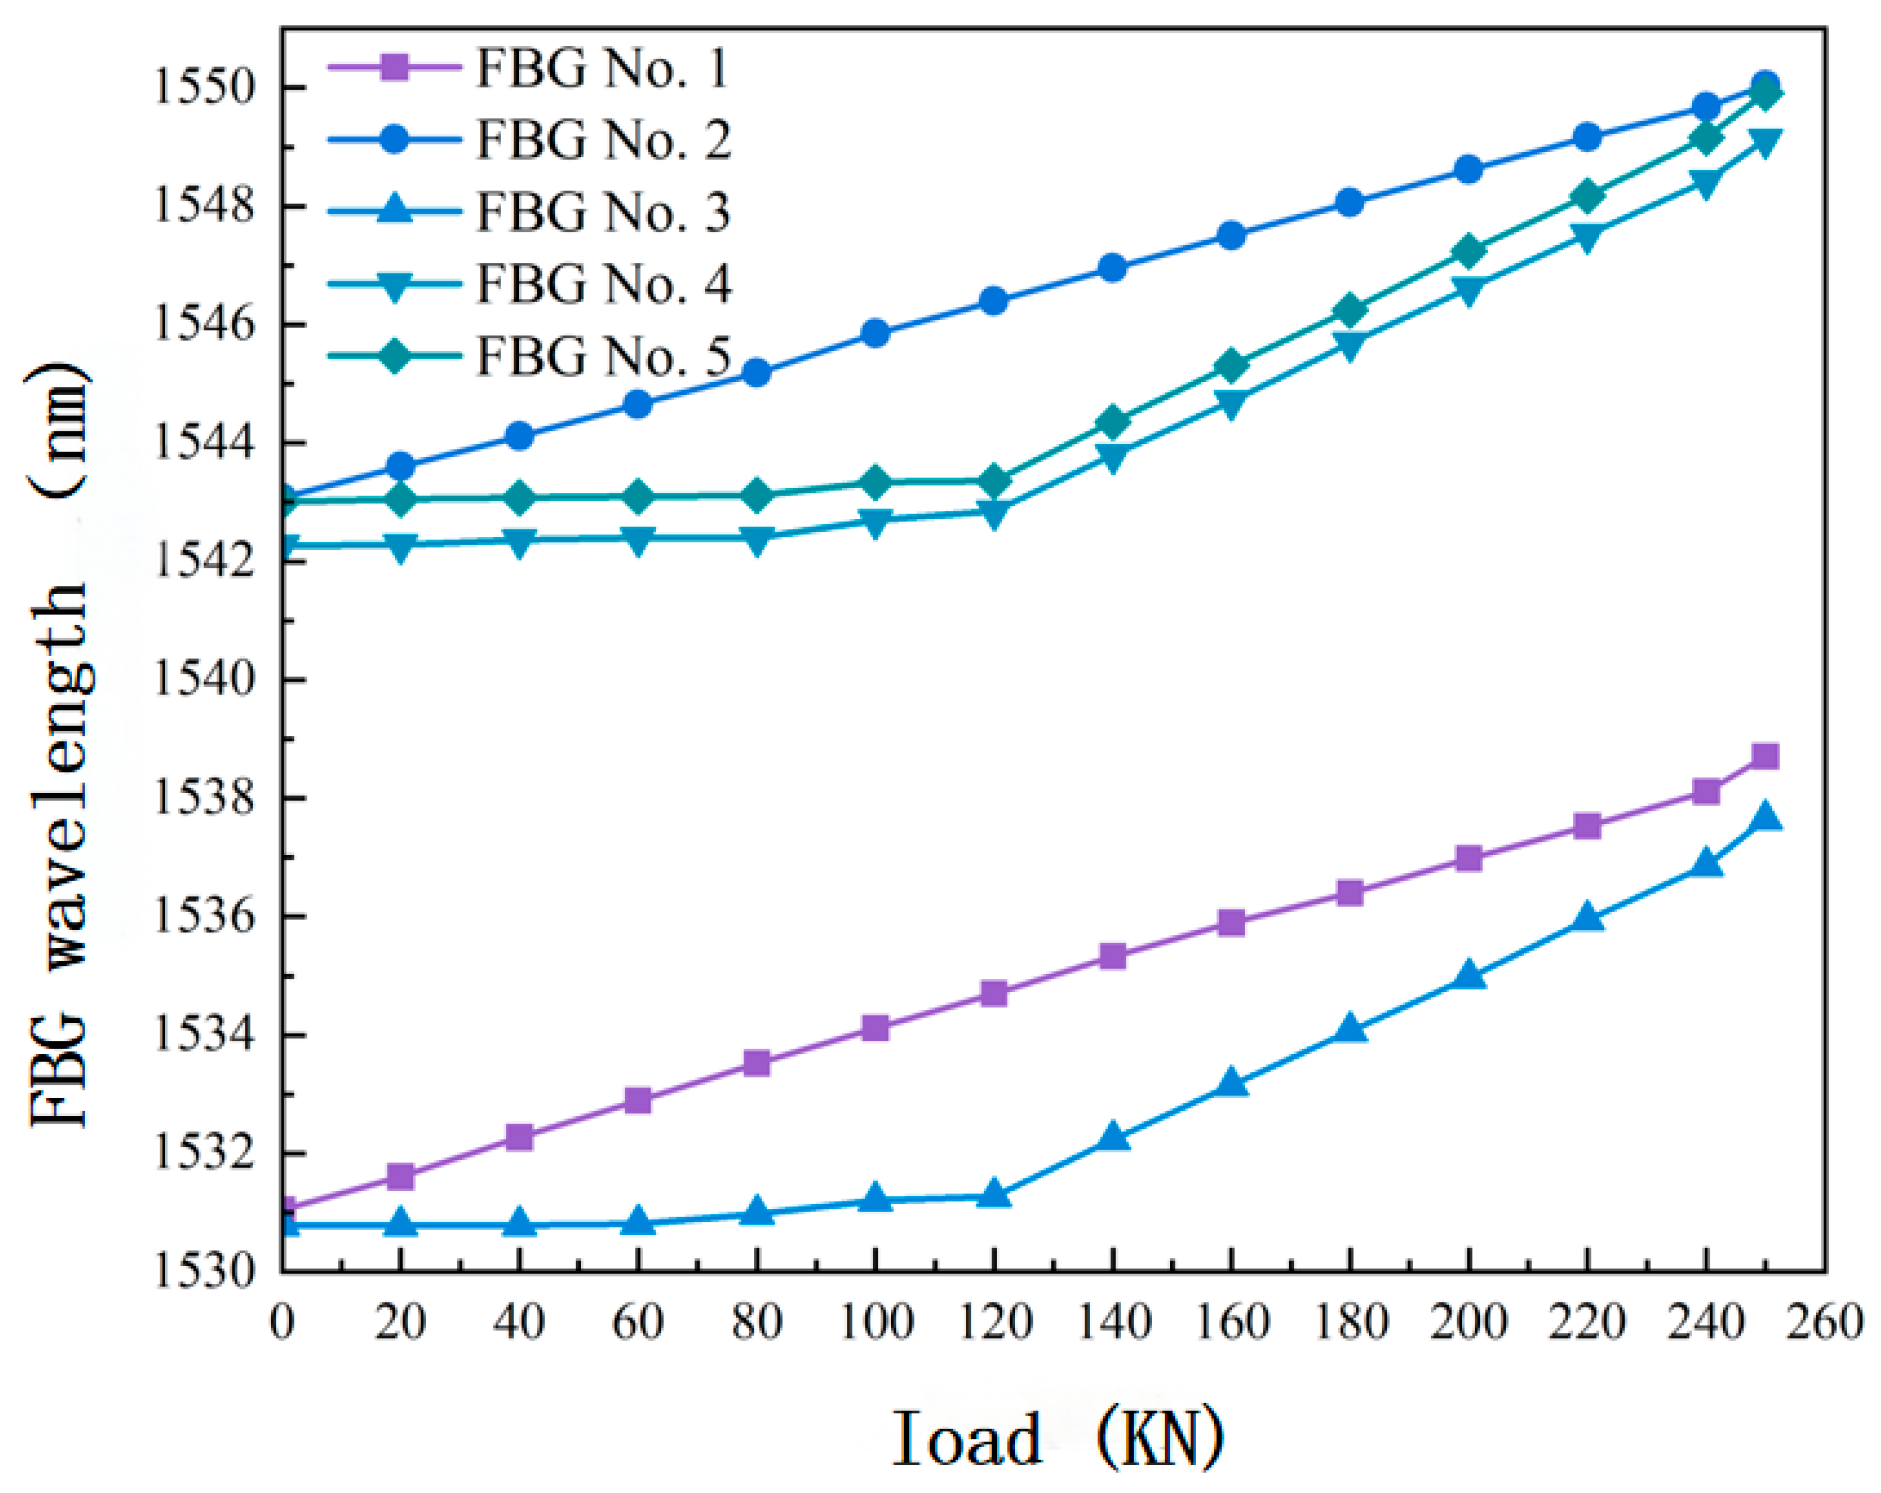
Figure 11 summarizes the wavelength–load response curves of Grating Points 1–5 within the load range of 0–260 kN. It can be seen that all measurement points increase monotonically with the load, without hysteresis or sudden jumps, indicating that the FBG sensing system has good repeatability and stability throughout the tensioning process. The slopes of the curves for free segment Grating Points 1 and 2 are basically the same, confirming again the uniform force in the free segment; while the curves for anchorage segment Grating Points 3, 4, and 5 only begin to rise significantly after the load reaches about 80 kN. Their synchronous upward trend indicates good bonding between the grouting body and the surrounding rock/soil mass, uniform shear stress distribution, and good overall integrity of the anchorage system.
Figure 11.
Load–wavelength shift diagram of the FBG anchor-cable sensor on cable C1.
In summary, the test results clearly reveal the two-stage mechanical evolution law of the anchorage segment of the C1 anchor cable from “delayed activation” to “uniform bearing”: in the low load stage, the anchorage segment hardly participates in bearing the force, and the load is mainly borne by the free segment; when the load exceeds 120 kN, the anchorage segment enters the linear bearing stage, with uniform load distribution along the path. Grating Point 3 shows slight stress concentration due to its proximity to the interface, but the magnitude of the difference is controllable and does not affect the overall anchorage performance.
“Field Validation of Established Mechanisms: The observed two-stage evolution—comprising an initial low-load phase (<120 kN) where the free segment dominates load transfer, followed by a high-load phase (>120 kN) where the anchorage segment achieves uniform bearing—confirms the progressive mobilization behavior well-documented in the bonded anchor mechanics literature [cite relevant steel/FRP anchor studies]. The novelty of the present observation lies not in the discovery of this mechanism, but in the quantitative verification that the three-stage CFRP system achieved >85% anchorage efficiency with a stress variation <5% among bearing plates under the specific stiffness conditions and rock mass properties of the Guangyang Island site. The critical load of 120 kN should be understood as site-specific, dependent on the particular combination of rubber pad stiffness (k = EA/L), rock mass modulus (E), and the 15 m anchor configuration used in this project.”
5.2. Analysis of Force Monitoring Data from C2 Anchor Cable Pull-Out Test
The total length of the C2 anchor cable is 17.5 m, with an anchorage segment length of 8.5 m and a free segment length of 9 m. Grating measurement points are set along the entire anchor cable at 0.5 m intervals. In the free segment, points at 0.5 m and 6 m from the borehole collar towards the anchorage segment are extracted and named Grating Point 1 and Grating Point 2, respectively, for analysis. In the anchorage segment, data from points at 9.5 m, 12 m, and 14.5 m from the borehole collar are extracted and named Grating Point 3, Grating Point 4, and Grating Point 5, respectively, for analysis. Grating Point 3 is 0.5 m from the interface between the free segment and the anchorage segment. Table 4 and Table 5 record the grating monitoring data for this set of anchor cables tensioned according to the tensioning scheme. Figure 12 is obtained by fitting the anchor cable test data.
Table 4.
Wavelength monitoring values and wavelength shifts of the FBG sensors for the C2 anchor cable under different loads.
Table 5.
Force values monitored by FBG sensors for the C2 anchor cable under different loads.
Figure 12.
Force–time history recorded by the FBG anchor-cable sensor on cable C1.
The test results show that the wavelength shift (Δλ) and the load value (F) at measurement points 1 and 2 located in the free segment exhibit a highly consistent monotonic increasing relationship with good repeatability. This phenomenon once again verifies the technical feasibility of using the wavelength shift characteristics of FBG sensors to inversely deduce the axial force of the anchor cable, providing solid experimental data support for the subsequent FBG-based health monitoring system for anchor cables. Within the loading range of 0–250 kN, the monitored force values at points 1 and 2 steadily increase with the load, without obvious hysteresis or sudden changes, indicating that the entire anchor cable system maintains a good integral response during loading. The Δλ–F curves of the two measurement points in the free segment have large and gently changing slopes, indicating that this segment mainly undertakes the function of tension transfer, and its axial strain significantly amplifies with increasing load, further highlighting the high sensitivity of the free segment to load changes.
To quantitatively characterize the above relationship, linear regression analysis was performed on measurement points 1 and 2, respectively, with the results shown in Figure 13. The sensitivity coefficient for Grating Point 1 is k1 = 0.029 nm·kN−1, with a coefficient of determination (R2) = 0.998; for Grating Point 2, k2 = 0.027 nm·kN−1 and R2 = 0.999. Both coefficients are positive, and R2 values are close to 1, indicating that within the test load range, the relationship between the load value and the wavelength shift follows a highly reliable linear constitutive relationship. The k value of Point 1 is slightly higher than that of Point 2, reflecting its closer proximity to the tensioning end, affected by boundary effects, resulting in a relatively higher local stress level and thus a more sensitive response to load changes.
Figure 13.
Fitted monitoring curves for FBG points in the free length of anchor cable C2.
Analysis of the data from the anchorage segment measurement points reveals that the wavelength response of each point in the anchorage segment exhibits significant nonlinear characteristics, especially for Point 3 adjacent to the interface. In the 0–120 kN low load range, the shift amplitude of FBG Grating Point 3 is extremely small (F3 < 15 kN), while Grating Points 4 and 5 show almost no response (F4, F5 < 20 kN). This phenomenon indicates that the initial load is mainly borne by the free segment, and the anchorage segment has not been fully activated. After entering the 120–250 kN high load stage, the shift amounts of FBG Points 3, 4, and 5 show strong linear growth with the load, with sensitivities of 0.85, 0.90, and 1.00 nm/ kN, respectively, indicating that the load has been effectively transmitted to the distal anchorage units. The anchorage segment transitions from “passive participation” to “active bearing”, and the shear action at the rock/soil-anchor solid interface is fully mobilized. To quantitatively describe the response law of the anchorage segment, overall and segmented linear fitting were performed on all wavelength-load data (Figure 14). The R2 for the overall fitting is only about 0.86, suggesting that a single model is difficult to describe the complex evolution of the entire process; while the R2 for segmented fitting is as high as 0.99, and the wavelength shift and force value in the high load stage show a strong linear relationship (R2 > 0.99). Based on the above test results, the anchorage efficiency-load curve for the C2 anchor cable was plotted. This curve exhibits typical two-stage characteristics: in the low load stage (0–120 kN), the anchorage efficiency is below 15%, and the curve slope is gentle; when the load exceeds 120 kN, the efficiency rapidly climbs and stabilizes above 85%, forming a platform. This threshold is highly consistent with the mutation point (120 kN) of the shift in Grating Point 3 FBG, indicating that the anchorage interface completes the critical transition from “partial bonding” to “full activation” around 120 kN. The segmented fitting results reveal the two-stage load transfer mechanism of the graded anchorage system: the low load stage is dominated by free segment bearing, while the high load stage involves efficient load transfer through the 7 m long three-stage anchorage units, ensuring the overall bearing performance of the system tends to stabilize.
Figure 14.
Fitted monitoring curves for FBG points in the bonded length of anchor cable C2.
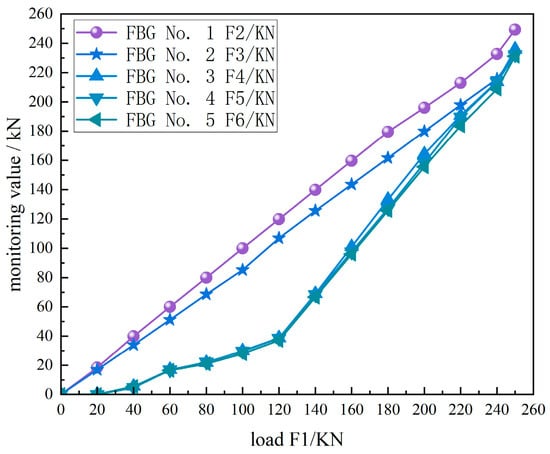
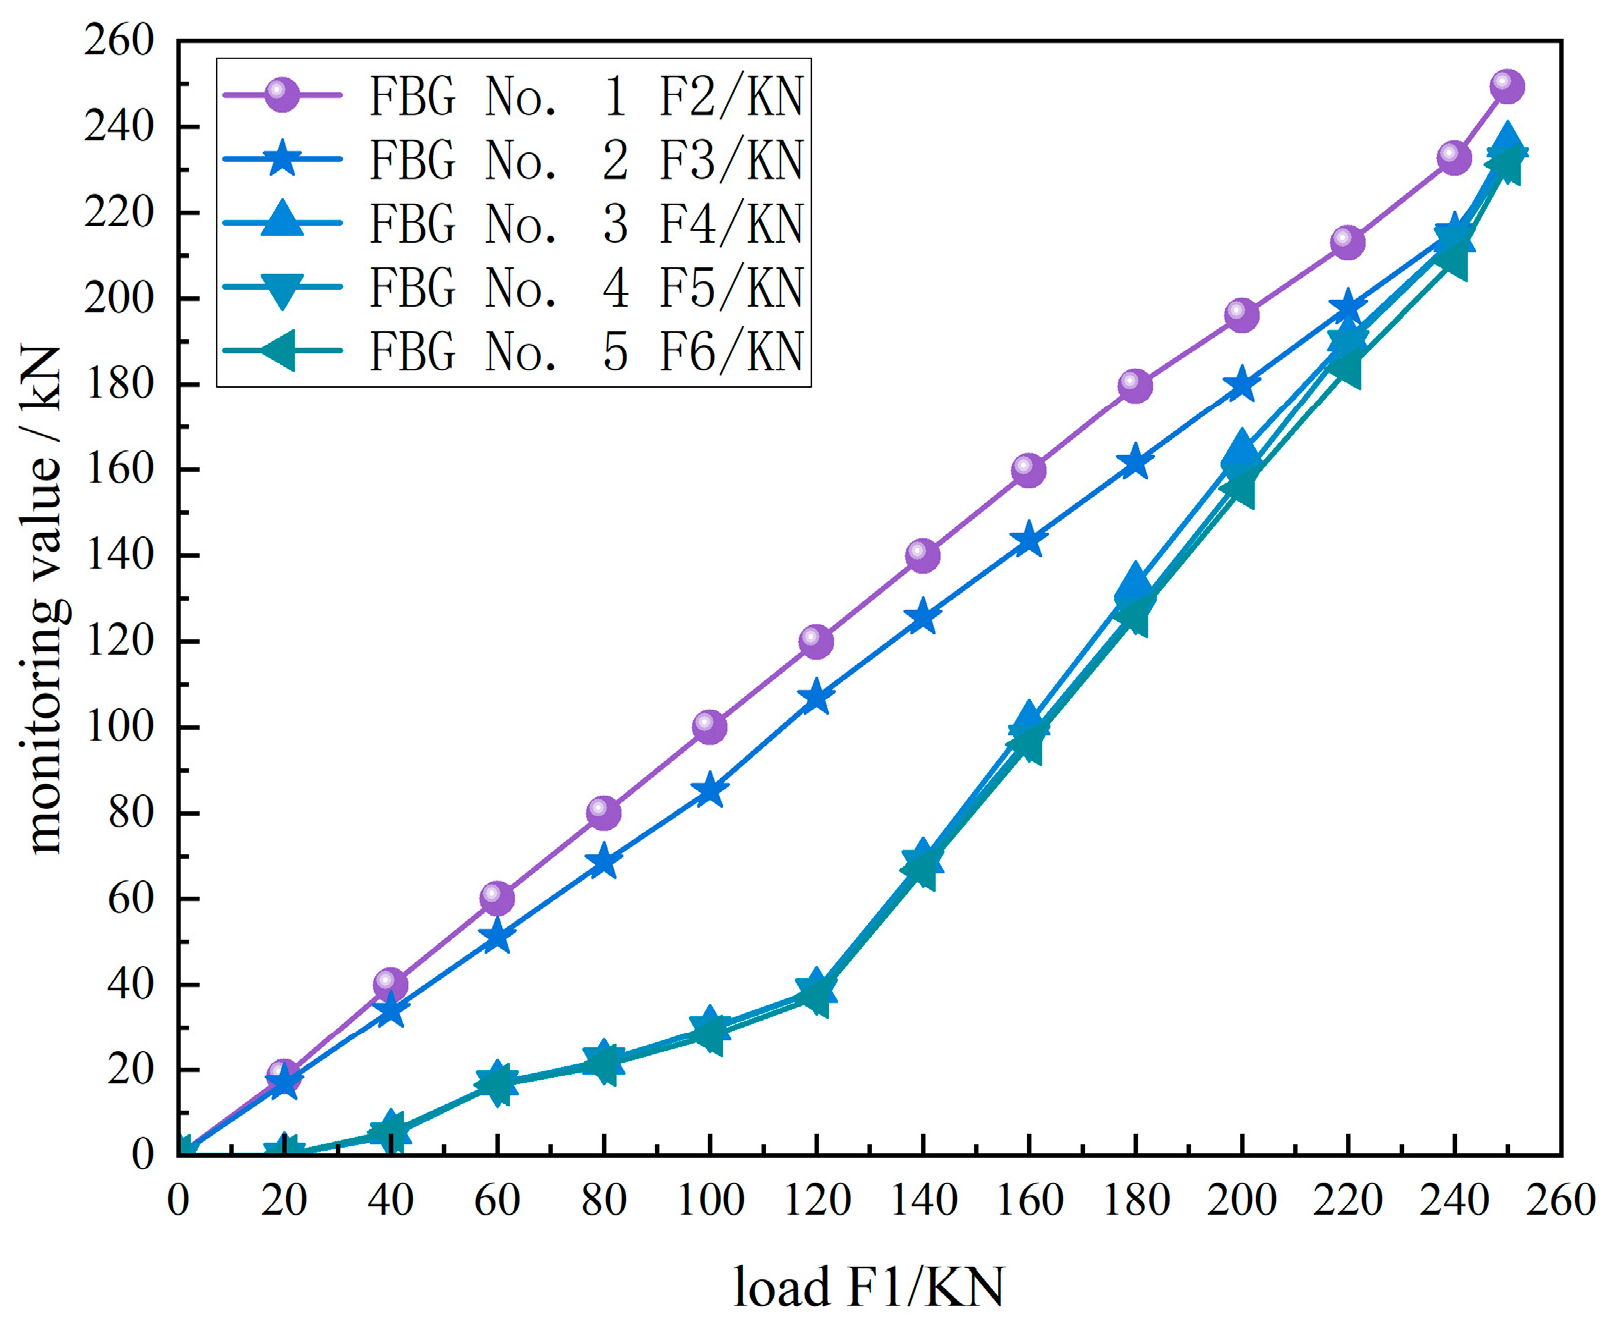
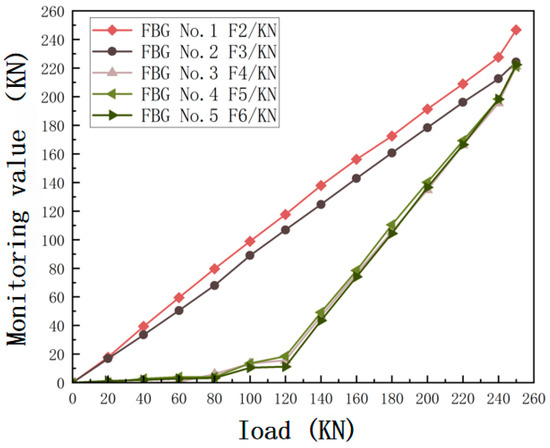
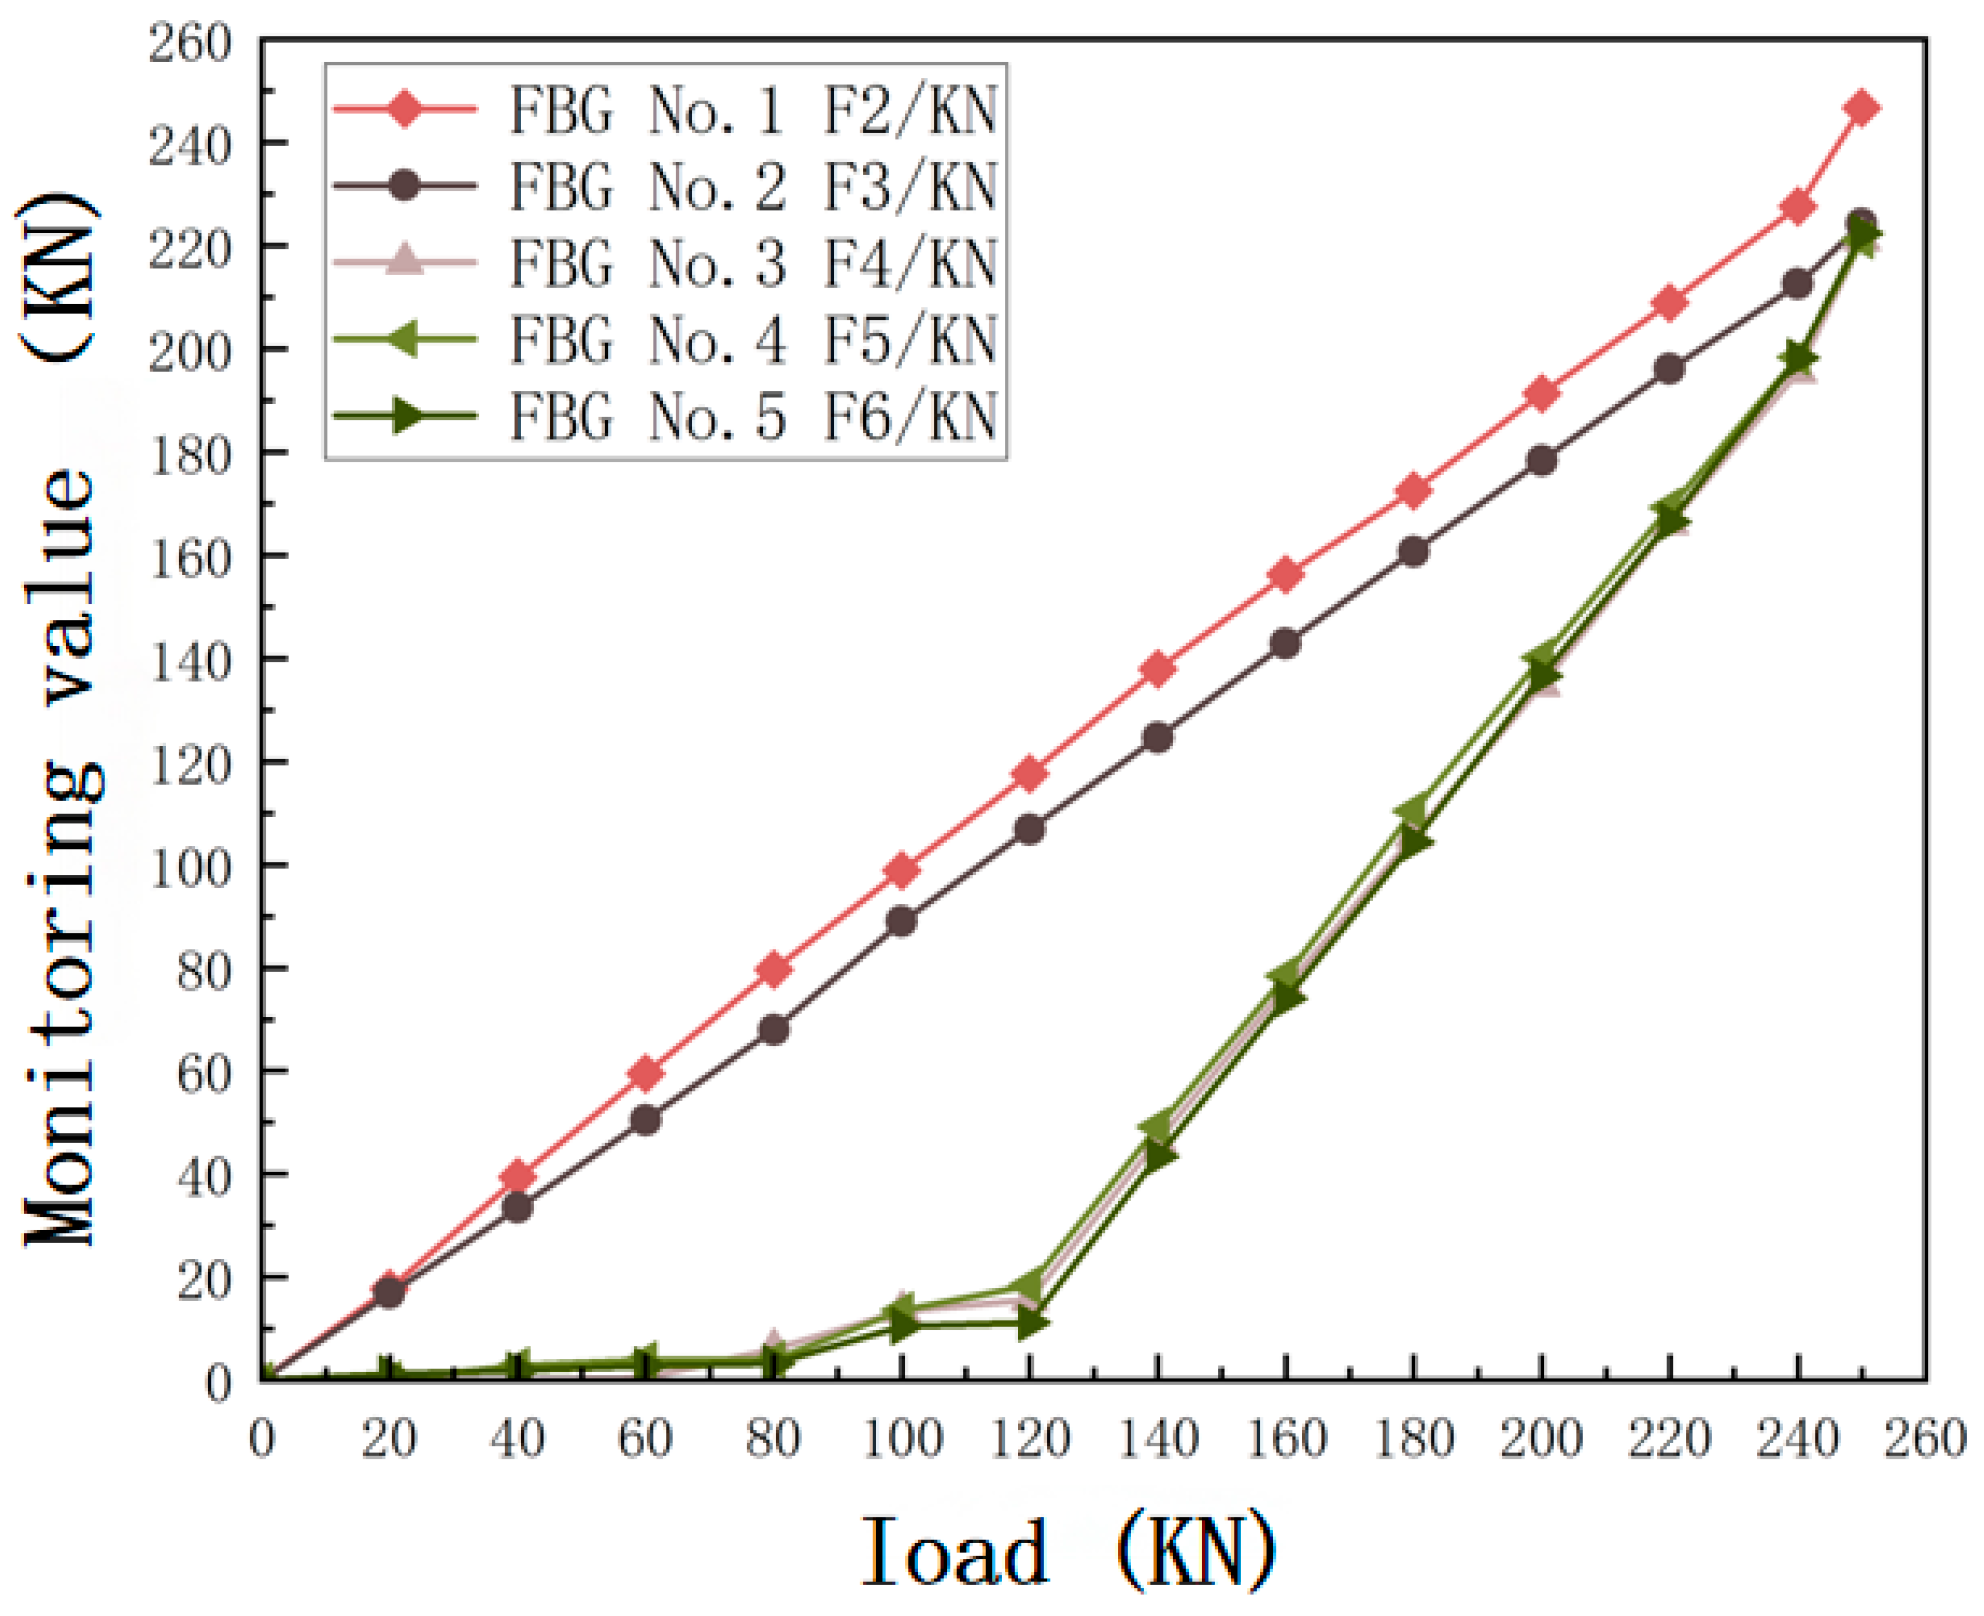
As shown in Figure 15 and Figure 16, the three-stage uniformly dispersed design demonstrates more uniform stress distribution characteristics compared to theoretical models of concentrated anchorage; at the high load stage (>120 kN), R2 > 0.99.
Figure 15.
Load–wavelength shift diagram of the FBG anchor-cable sensor on cable C2.
Figure 16.
Force–time history recorded by the FBG anchor-cable sensor on cable C2.
6. Discussion
Conclusions
This paper presents a detailed case study on the application of Fiber Bragg Grating (FBG) sensing technology to monitor pressure-uniformly-dispersed CFRP anchor cables during field tensioning on Guangyang Island. The following site-specific findings are reported:
- (1)
- Validation of Design Performance: Under the specific geological conditions of the Middle Jurassic sandy mudstone formation, the three-stage pressure-dispersed CFRP anchor achieved uniform load distribution (>85% efficiency, <5% variance among segments) once the tensioning load exceeded approximately 120 kN. This confirms that the theoretical design objective of uniform pressure dispersion was achieved for this specific installation.
- (2)
- Monitoring Methodology Demonstration: The distributed FBG array (0.5 m spacing) successfully captured the full-length strain distribution, confirming its suitability for high-resolution monitoring of CFRP anchors in field conditions. The linear response in the free segment (R2 > 0.999) and the quantifiable activation of the anchorage segment demonstrate the practical viability of intelligent anchor systems for construction control and long-term health monitoring.
- (3)
- Mechanistic Confirmation: The observed transition from “delayed activation” to “uniform bearing” in the anchorage segment aligns with established load transfer theory for bonded anchors, providing field validation for CFRP-specific applications.
It should be emphasized that the 120 kN threshold and efficiency values reported herein are specific to the anchor geometry, material properties, and rock mass conditions of this project. They should not be generalized to different geological contexts without site-specific validation. Nevertheless, the methodology and dataset provide a valuable reference for practitioners implementing smart monitoring systems in similar slope reinforcement projects involving CFRP anchors and pressure-dispersed configurations.
Author Contributions
Conceptualization, Q.W. and K.H.; methodology, Q.W., K.H., J.H. and S.T.; software, J.L. and W.L.; validation, K.H., Z.W. and G.H.; formal analysis, K.H. and Z.W.; resources, Z.W., G.H., W.L. and S.T.; data curation, G.H.; writing—original draft, J.L. and W.L.; writing—review and editing, J.L.; visualization, J.L. and S.T.; supervision, Q.W., J.H., Z.W. and S.T.; project administration, J.H.; and funding acquisition, Q.W., J.H. and W.L. All authors have read and agreed to the published version of the manuscript.
Funding
Guangyang Island Eco-City Guangyang Avenue Ecological Restoration and Quality Enhancement Project (Project Number: 20230258).
Data Availability Statement
The data presented in this study are available in the article.
Conflicts of Interest
Authors Qiang Wang, Kui Huang, Jinyu Hu, Gang He, Wenping Lan and Shuangqing Tang were employed by the company Chongqing International Construction Corporation. The remaining authors declare that the research was conducted in the absence of any commercial or financial relationships that could be construed as a potential conflict of interest.
References
- Yang, H.; Xing, B.; Jiang, H.; Cheng, Q. Experimental Study on the Accumulation Characteristics Model of Slope with Barrier-Type Granular Materials. Earth Sci. Available online: https://kns.cnki.net/kcms/detail/42.1874.p.20211009.1236.006.html (accessed on 11 October 2021).
- Wang, Y.; Nazem, M.; Smith, J.V. Effect of groundwater and associated drainage on a roadside stabilisation method integrating a gabion-faced geogrid-reinforced retaining wall and embedded laterally loaded piles. Arab. J. Geosci. 2022, 15, 1751. [Google Scholar] [CrossRef]
- Lai, J.; Zheng, Y.; Liu, Y.; Li, X.; Abi, E. Vibration test study on double-row anti-slide pile-supported slope under seismic action. Chin. J. Geotech. Eng. 2014, 36, 680–686. [Google Scholar]
- Huang, J. Analysis of Slope Stability Enhancement by Anti-slide Piles and Parameter Optimization. West. Transp. Sci. Technol. 2025, 4, 66–68+86. [Google Scholar] [CrossRef]
- Sakhno, I.; Sakhno, S.; Isaienkov, O.; Kurdiumow, D. Laboratory studies of a high-strength roof bolting by means of self-extending mixtures. Min. Miner. Depos. 2019, 13, 17–26. [Google Scholar] [CrossRef]
- Jia, J.; Hou, Z.; Wang, L.; Bai, S.; Zhang, L.; Lan, C.; Du, R. Development of Fiber Bragg Grating Sensors and Their Application Progress in Civil Engineering. J. Inst. Disaster Prev. 2024, 26, 9–21. [Google Scholar]
- Qu, W.; Ma, L.; Tian, X.; Shi, Z.; Xi, T. Stress Distribution and Influencing Parameter Analysis of Anchorage Segment of Pressure-Dispersed Anchor Cable. J. Water Resour. Archit. Eng. 2021, 19, 23–27. [Google Scholar]
- Zhou, P. Prestressed Construction Technology for Pressure-Dispersed Anchor Cables in High Slopes. Eng. Constr. 2024, 38, 1162–1164+1168. [Google Scholar]
- Yao, H. Tensioning Acceptance Test Study on Pressure-Dispersed Prestressed Anchor Cables for Dam Slope of Yangfanggou Hydropower Station. Express Water Resour. Hydropower Inf. 2023, 44, 47–50. [Google Scholar] [CrossRef]
- Yao, Y. Research on Mechanical Performance and Design Method of Composite Beams with Hollow Section and Partially Encased Concrete; Chang’an University: Xi’an, China, 2023. [Google Scholar]
- Sun, Q. Principle and Experimental Research of Pressure-Dispersed Prestressed CFRP Anchor Cable; Chongqing University of Science and Technology: Chongqing, China, 2024. [Google Scholar]
- Lei, J.; Yang, J.; Yang, X.; Wang, A. Stress Distribution Law and Anchorage Segment Design of Pressure-Type Anchor Cable. J. Railw. Sci. Eng. 2010, 7, 75–79. [Google Scholar]
- Ministry of Housing and Urban-Rural Development of the People’s Republic of China. GB 50086-2015; Technical Specification for Geotechnical Anchorage and Shotcrete Support Engineering. China Planning Press: Beijing, China, 2015.
- GB 50330-2013; Technical Code for Building Slope Engineering (with Clause Explanation). China Architecture & Building Press: Beijing, China, 2013.





Disclaimer/Publisher’s Note: The statements, opinions and data contained in all publications are solely those of the individual author(s) and contributor(s) and not of MDPI and/or the editor(s). MDPI and/or the editor(s) disclaim responsibility for any injury to people or property resulting from any ideas, methods, instructions or products referred to in the content. |
© 2026 by the authors. Licensee MDPI, Basel, Switzerland. This article is an open access article distributed under the terms and conditions of the Creative Commons Attribution (CC BY) license.