


Abstract
Quality management in construction projects is critical for ensuring client satisfaction, minimizing rework, and achieving cost efficiency in an industry characterized by a long history of cost overruns. Traditional quality assurance and control (QA/QC) processes, however, are resource-intensive and often implemented without a systematic evaluation of their cost-effectiveness. Absent a systematic evaluation of the costs and benefits associated with QA/QC, stakeholders—particularly clients and contractors—are unlikely to commit resources to the implementation of quality control practices within construction projects. This paper presents a quantitative optimization framework that integrates Monte Carlo simulation of activity-level rework costs with a constrained optimization model based on a novel project-level key performance indicator, the Total Assurance on Reworks (TAR) to support data-driven decision-making in project quality management. The model enables construction managers to evaluate trade-offs between the costs of preventive quality controls and the potential consequences of non-conformities. The methodology is demonstrated through a synthetic dataset comprising 50 construction activities. Results indicate that the framework can identify optimal allocations of quality control resources, achieving up to more than 19% cost savings compared to a full-control strategy and 18% reduction in economic resources when compared with the state of the art while maintaining target quality assurance levels. This contributes to the broader discourse on quality management by offering a computationally rigorous tool for balancing cost efficiency and quality performance in complex projects.
1. Introduction
The construction industry constitutes a fundamental component of the global economy [1,2], contributing approximately 13% to global economic activity. The sector’s output is projected to reach USD 13.9 trillion by 2037, underscoring its central role in sustaining economic stability and development [3]. The construction sector is, nevertheless, dealing with a multitude of obstacles that may impede the accomplishment of a project, such as issues related to quality assurance, public health and safety, sustainability [4].
The effectiveness and efficiency of construction projects are significantly influenced by the uncertainties associated with on-site labour [5,6]. A portion of these uncertainties arises from variations in labour quality, which, if left unsupervised, may result in work that fails to comply with project specifications. Such deviations often lead to a decline in overall construction quality [7]. Depending on the nature of the nonconformity, corrective measures may cause cost overruns and schedule delays, thereby reducing both project efficiency and the profitability of the investment. To address this issue, it is essential to anticipate these potential deviations during the planning phase and to develop strategies that minimize the financial resources allocated, while maximizing the assurance that the work will conform to project requirements. However, this is not a straightforward challenge, given the probabilistic nature of the verification of nonconformities.
The present study proposes a method to address this problem by quantifying the minimum financial resources that should be allocated in advance to manage such uncertainties, given a defined level of assurance. The proposed approach is based on the optimal distribution of resources across project activities, thereby supporting the decision of whether to directly monitor execution or to accept a certain level of risk.
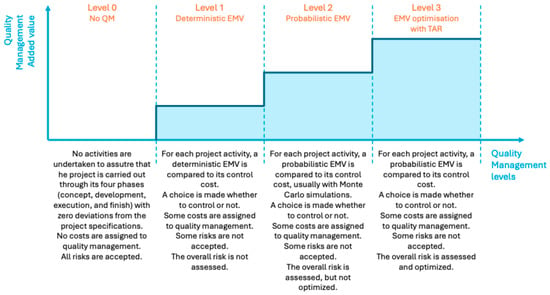
To operationalize the proposed quality management framework, a novel key performance indicator (KPI) called Total Assurance on Reworks (TAR) is introduced, designed to provide a rigorous and quantifiable measure of the assurance level attained within a given project. This KPI constitutes the central metric for translating abstract assurance objectives into measurable performance outcomes, thereby enabling evidence-based decision-making. Furthermore, project-specific and context-dependent threshold values of the KPI are defined to reflect the required assurance level relative to project complexity, risk profile, and resource constraints. Figure 1 schematically depicts how this enhanced methodology advances beyond prevailing quality management paradigms. Recent studies confirm the widespread use of Monte Carlo simulation and EMV-based quantitative risk analysis to estimate cost contingency and to support project decision-making in construction [8,9,10]. These conventional approaches, typically grounded in deterministic or probabilistic formulations of the Expected Monetary Value (EMV), permit basic risk characterization but lack the capacity to support optimal resource allocation across heterogeneous project activities [11]. By contrast, the introduction of the Total Assurance on Reworks (TAR) as an aggregate, project-level indicator constitutes a substantive methodological progression from non-optimized, EMV-based probabilistic assessments (Level 2) to an optimized decision-support framework (Level 3). This shift enables the explicit integration of assurance optimization into project planning, allowing for the prioritization of interventions according to their marginal contribution to assurance enhancement and cost efficiency. Consequently, the proposed approach facilitates a more precise alignment between quality control measures, resource expenditure, and residual risk, thereby improving overall project performance through reduced cost overruns, minimized rework, and enhanced resilience to uncertainty. While EMV combined with Monte Carlo simulation enables probabilistic estimation of activity-level risk exposure, it does not in itself prescribe how heterogeneous exceedance probabilities should be selected across multiple activities under a global budget constraint. The core novelty of the present study lies in formalizing this selection problem as a constrained optimization task governed by a monotone, impact-weighted project-level assurance index, TAR. In contrast to standard EMV-based budgeting, which typically applies a uniform confidence percentile or relies on heuristic adjustments, the proposed framework endogenously determines differentiated activity-specific non-exceedance probabilities that jointly satisfy a predefined project-level assurance target while minimizing total expenditure.
Figure 1.
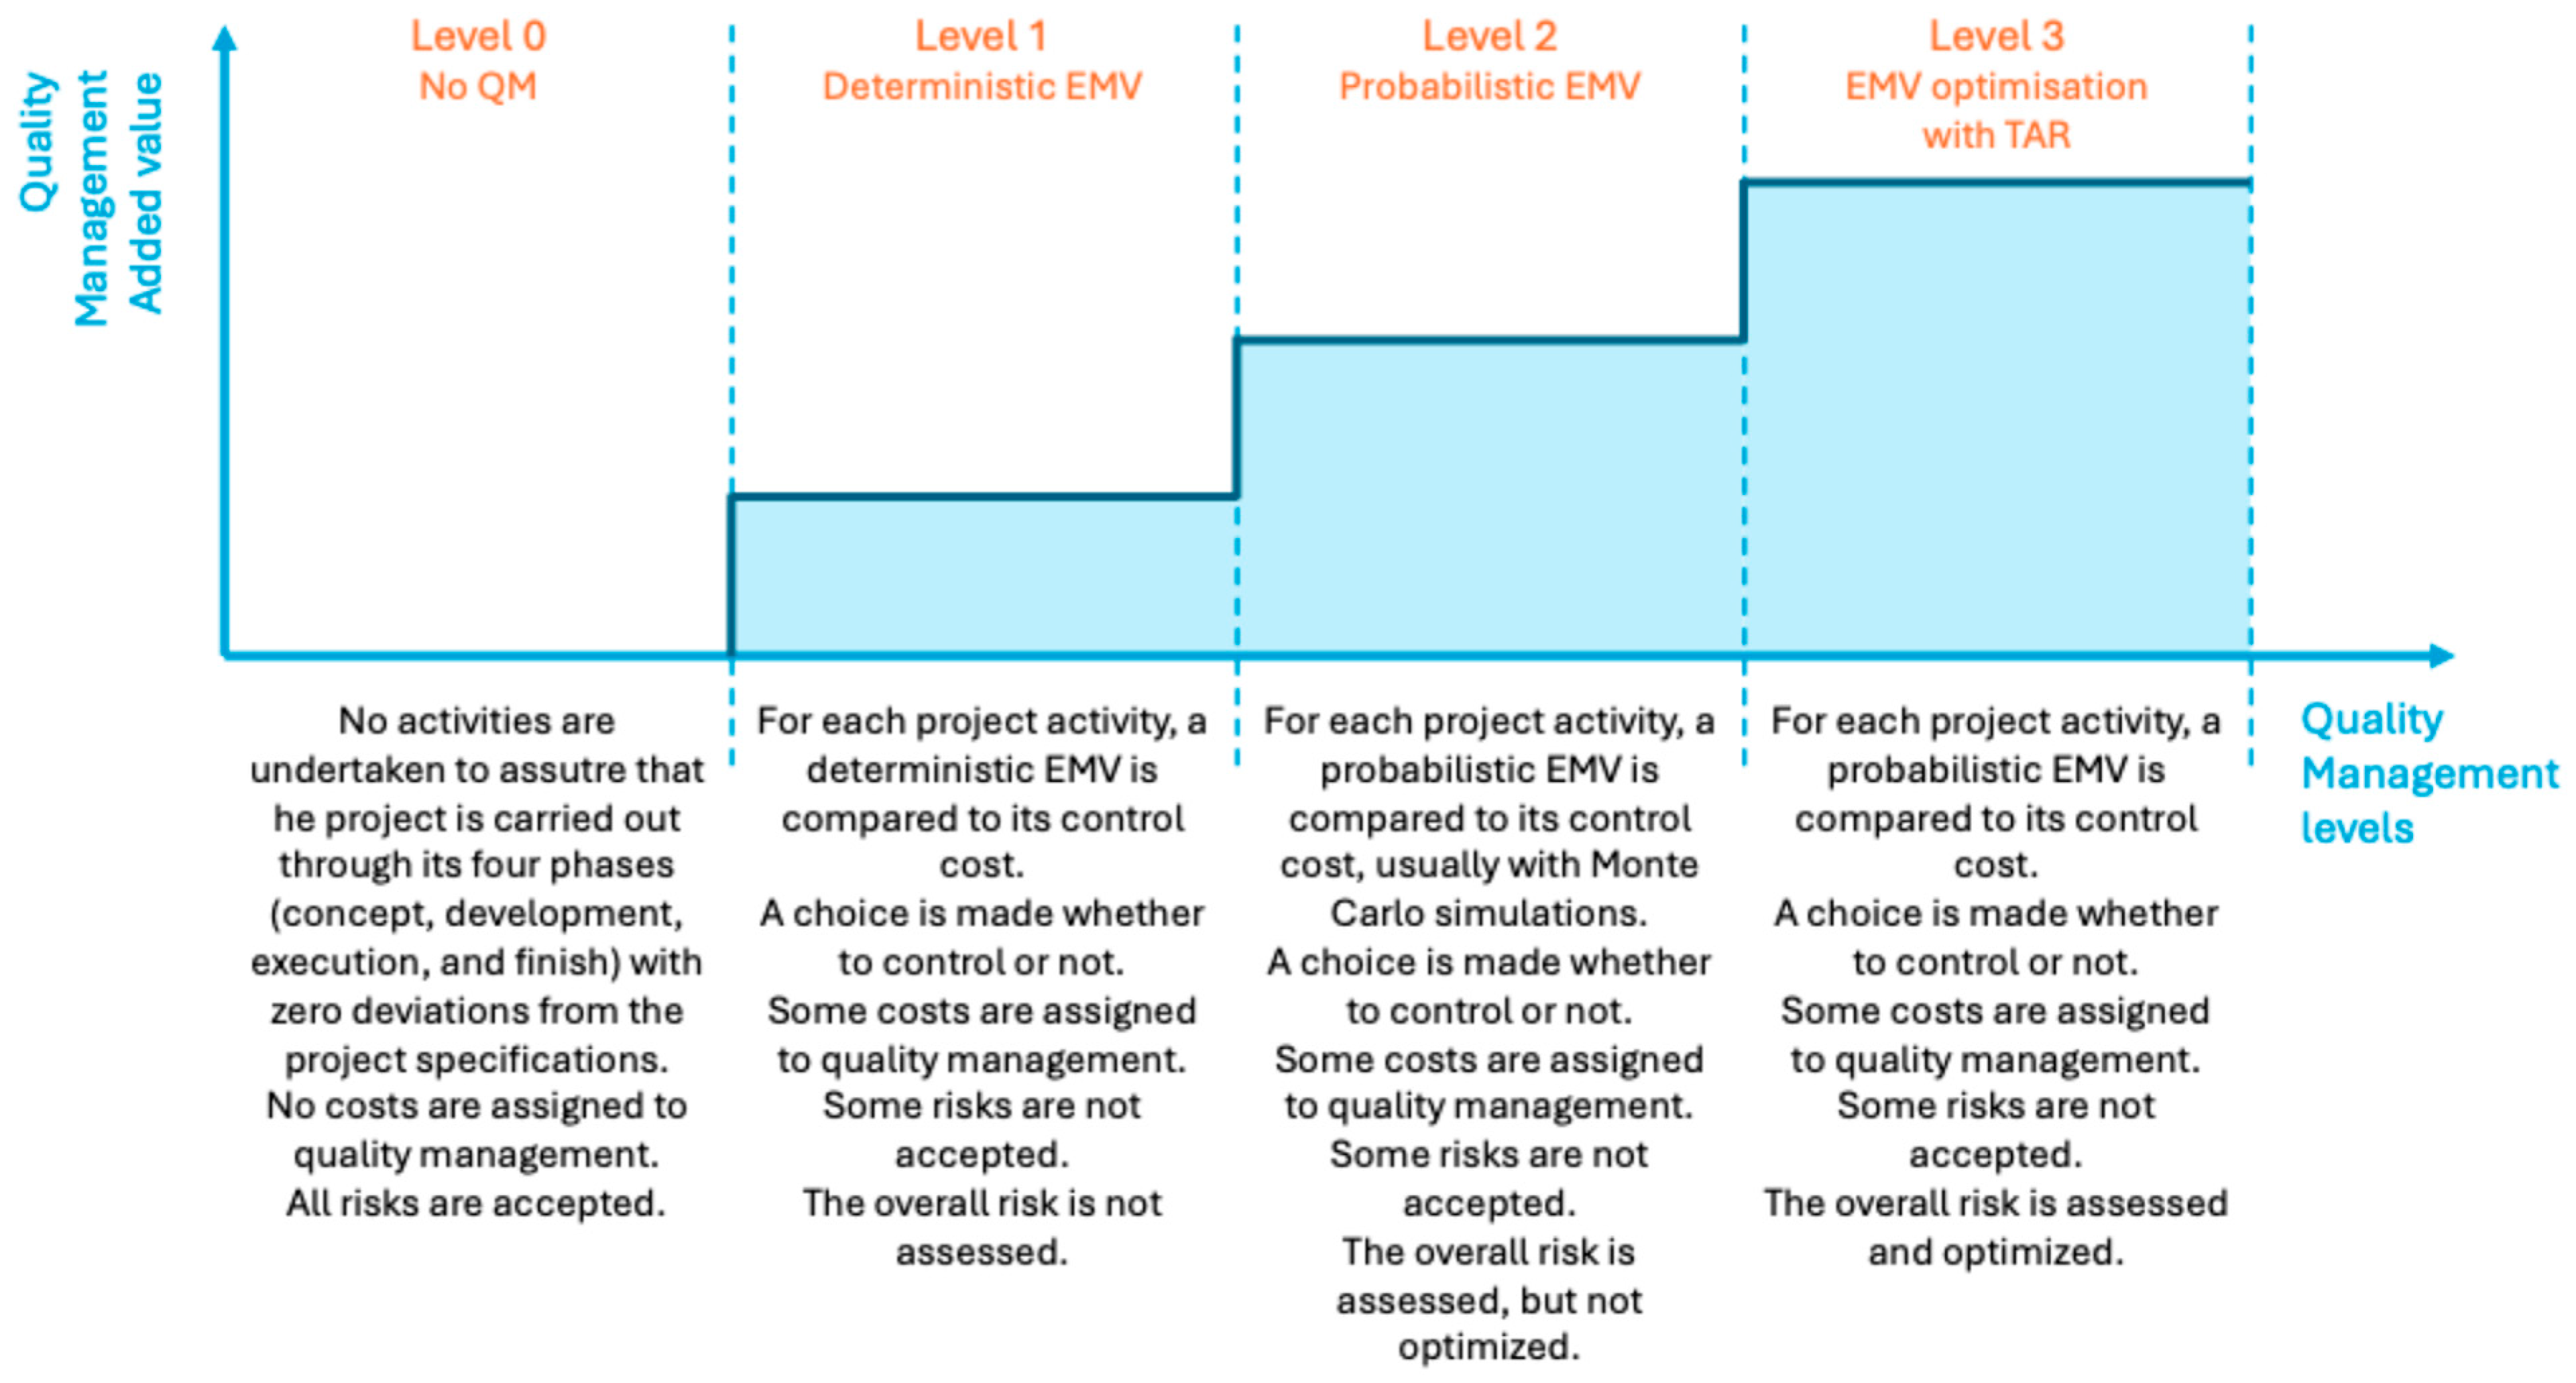
Evolution of quality management approaches in construction projects. Level 0 corresponds to the absence of quality management, while Levels 1 and 2 reflect deterministic and probabilistic EMV-based decision-making, respectively. The proposed method advances these practices by introducing EMV optimization with TAR (Level 3), which enables project-wide risk assessment and optimized resource allocation.
The proposed approach only assumes that each activity has an estimable error probability and a rework-cost distribution. If these inputs are misspecified, the output will reflect that misspecification, as in any EMV-based method, and the framework should be used with sensitivity analysis and updated inputs when new evidence becomes available [12].
The optimization framework, combined with the informative capacity of the proposed KPI, is expected to be of practical relevance to construction project managers, offering a structured means to enhance project efficiency. In doing so, this paper contributes to bridging the gap between theoretical discussions of quality-related risk management and the lack of systematic, data-driven tools for its practical implementation. Unlike traditional practices that rely on uniform contingency percentages or arbitrary safety margins, the proposed method integrates probabilistic modelling and optimization techniques to tailor resource allocation to the specific risk profile of each activity.
2. Current Practice
A project is considered successful when it fulfils its technical performance requirements, adheres to scheduled timelines, and remains within the allocated budget [13]. Nevertheless, the recurrent extension of deadlines and escalation of costs in public construction projects constitutes a global phenomenon that has persisted for more than seven decades [14]. One possible explanation lies in the fact that the construction industry has generally lagged behind other sectors in adopting Total Quality Management (TQM), a framework that fosters customer satisfaction through the continuous improvement of products, processes, and services [15]. According to [16], project success has traditionally been evaluated using three primary criteria: cost, time, and quality. Similarly, ref. [13] introduced the dimension of Project Management Success (PMS) in the context of evaluating project success, emphasizing the extent to which projects achieve their planned objectives with respect to schedule, cost, scope, and quality. While cost and time are relatively straightforward to assess, quality is more challenging to measure, as it is often only discernible well after project completion.
Within the quality management literature, the systematic quantification of quality-related costs is regarded as indispensable [17], consistent with the principle that what cannot be measured cannot be effectively controlled or improved [18]. Several researchers [19,20] have observed that, although many companies acknowledge the importance of implementing a quality cost system, such systems are often absent in practice. Consequently, organizations remain unable to quantify the losses incurred due to poor quality, thereby revealing a persistent gap between theoretical prescriptions and their practical application in quality management [15].
The estimation of quality-related costs presents additional complexities [21], and elaborated the concept of the cost of quality (CoQ), which was earlier defined as the “price of nonconformance” [22]. CoQ refers to the costs incurred when a product or service is not delivered correctly the first time, effectively representing the overrun costs associated with deficiencies in quality [17,23]. Cost of Quality Analysis (CoQA) provides a framework for linking quality improvement initiatives with both their financial implications and customer expectations. This perspective highlights how effective quality management can simultaneously reduce costs and enhance value creation. Accordingly, obtaining a realistic estimate of CoQ and the potential benefits of improvement—understood as the balance between conformance and non-conformance costs—should be regarded as a central component of any quality programme, and therefore a critical concern for managers seeking to optimize organizational performance [17]. The CoQ framework, which categorizes quality expenditures into prevention, appraisal, internal failure, and external failure costs [21,24], emphasizes the trade-off between proactive investment in quality assurance and the reactive costs of nonconformance. These costs are always part of the contingencies, defined as budgetary and schedule reserves set aside to address identified and unidentified risks [25]. From a theoretical perspective, contingencies align with the probabilistic nature of failure costs. They represent the expected monetary value (EMV) of risks that, if realized, manifest as additional quality costs [26]. Allocating contingency reserves toward preventive and appraisal activities can be conceptualized as an investment that reduces the likelihood and impact of internal and external failures, thereby lowering the overall CoQ [22]. Thus, the integration of contingency planning and CoQ analysis reflects a systemic approach to project governance, in which reserves are not merely buffers against uncertainty but instruments to optimize the balance between conformance costs and failure costs. This theoretical linkage underscores the importance of aligning risk management practices with quality management strategies to achieve both cost efficiency and stakeholder satisfaction [27,28].
In construction projects, contingency funds are commonly determined either through fixed percentage-based allocations or by employing risk-informed models [29]. The fixed approach predominantly draws upon past project performance and expert judgement [30] and has been historically criticized for its shortcomings. Researchers [31] contend that risk is frequently either neglected or addressed in an arbitrary manner, with the common practice being the addition of a flat 10% “contingency” to the estimated project cost. However, such an arbitrary allocation may not be suitable for the specific requirements of a given project [32], and it is often difficult for estimators to substantiate or defend this practice [33,34]. This approach lacks methodological rigour and has been identified as a contributing factor to frequent budget overruns [35]. Moreover, the assignment of a contingency percentage is inadequate unless it is explicitly linked to a confidence level—that is, the probability that the final project cost will fall within the estimate, inclusive of contingencies [36]. The weaknesses of the traditional percentage addition approach for calculating contingencies have led for a search for a more robust approach [30].
Risk-based and probabilistic methods have been increasingly advocated in scientific literature [37] and some of the most common approaches include:
- Risk analysis methodologies using influence diagrams [38,39,40,41] and linguistic quantification of uncertainty [42].
- Fuzzy-set theory and Bayesian belief networks for modelling uncertainty and risk interdependencies [43,44,45].
- Multiple linear regression models to predict contingency needs based on project characteristics and design metrics [46].
- Probabilistic models incorporating owner-specified confidence levels and the stochastic nature of change orders [47].
- Estimating using Risk Analysis (ERA), which reduces variability and exaggeration in contingency estimates [48].
Within risk-based and probabilistic frameworks, the Expected Monetary Value (EMV) has emerged as a widely accepted decision-analytic tool for quantifying and allocating quality-related contingencies [9,49,50]. The integration of EMV within a risk-based contingency estimation framework empowers project managers to embed a structured, transparent, and empirically grounded rationale into quality management planning. This approach strengthens stakeholder confidence and facilitates negotiations on risk allocation. Moreover, such a data-driven approach reduces disputes arising from unforeseen quality deficiencies. Ultimately, the adoption of EMV within probabilistic quality risk assessment underpins the overarching goal of achieving predictable project performance amidst the inherently complex and uncertain environment of construction [51].
Despite its wide application, EMV, even when applied together with Monte Carlo simulations [52] for a probabilistic approach, has been recognized to have certain limitations [10]. One of these limitations, already highlighted by several researchers [10,53,54], concerns the choice of the percentile to be used when comparing the probability distributions provided by MC simulations. This confidence percentile value, which is chosen after applying MCS, usually depends on risk appetite and the level of organizational maturity [53]. Percentiles P50, P70 and P80 are the most frequently used [55], while the P80 percentile is the most widespread [56,57]. Regardless of the chosen percentile value, it appears to be an oversimplification to apply the same percentile to all activities that constitute a project, and some researchers have begun to address this issue [9,58]. On a construction site, for example, the risks associated with different activities vary considerably, and therefore distinct percentiles should be used to compute the EMV.
Within construction risk budgeting, the most common quantitative approaches are based on deterministic EMV comparison, probabilistic EMV estimation via Monte Carlo simulation, and portfolio-type aggregation metrics such as VaR or CVaR [59]. These methods typically apply a uniform non-exceedance percentile across activities or rely on heuristic adjustments. The proposed framework builds directly upon probabilistic EMV models reported in the literature, but extends them by formulating the allocation of activity-specific exceedance probabilities as a constrained optimization problem governed by a project-level assurance index. Therefore, the contribution does not replace existing EMV models, but systematizes and generalizes their application within an optimization structure.
Building on this assumption, a new KPI is introduced to measure the level of confidence provided by the financial resources allocated in the budget. This KPI makes it possible to optimize the selection of the percentile associated with each individual project activity and, consequently, to improve the allocation of economic resources while minimizing risks. The remainder of the article presents this KPI and its application in Section 3, illustrates it through a synthetic-data-based project example in Section 4, and discusses the limitations of the proposed method in Section 6.
3. Methodology
The research problem addressed in this study concerns the formulation of a systematic framework for the optimal allocation of scarce resources aimed at controlling the risk of cost overruns associated with nonconformities in construction projects, while minimizing the necessary contingency budget. The underlying premise of this investigation is that effective risk management in this context can be achieved through two distinct strategic approaches. The first approach involves the implementation of direct mitigation measures, such as enhanced on-site supervision, stricter quality control procedures, or the deployment of specialized personnel, which as a hypothesis of this research are designed to eliminate the likelihood of rework by addressing potential sources of nonconformity before they materialize. This strategy represents a deterministic scenario in which the probability of rework is effectively reduced to zero; however, it requires a predetermined and fixed level of expenditure, independent of the actual occurrence of nonconformities.
The second approach is based on the acceptance and management of risk, whereby nonconformities are acknowledged as an inherent possibility within the construction process. In this case, a portion of the available budget must be allocated in proportion to the anticipated probability of rework, thereby functioning as a financial buffer against potential cost overruns. This strategy characterizes a probabilistic scenario, in which the relationship between allocated resources and risk is inversely proportional: as more resources are budgeted for potential rework, the probability of exceeding the allocated cost decreases. By comparing and integrating these two approaches within a unified optimization framework, the study seeks to provide decision-makers with a rational basis for selecting resource allocation strategies that balance cost efficiency with risk reduction in construction quality management.
In principle, decision-makers, in this context project managers or contractors, should adopt the risk management strategy that offers the greatest economic efficiency. However, the selection process is complicated by the inherently probabilistic nature of the second strategy, which makes it challenging to determine, on an activity-by-activity basis, which of the two approaches, deterministic mitigation or probabilistic risk acceptance, yields superior cost-effectiveness. This complexity is further exacerbated by conventional practices in construction risk management, which often hinder specifying an acceptable probability of cost overrun at the level of individual activities. Such localized assessments do not necessarily lead to an optimal use of available resources, as they fail to account for the cumulative nature of project-wide risk.
To address these limitations, it is necessary to shift from an activity-level perspective to a holistic, project-level framework that enables a more efficient and strategically balanced allocation of resources. Central to this approach is the definition of a global performance indicator capable of quantifying the degree of assurance provided by the financial resources allocated for risk management. Such an indicator would serve as a benchmark for evaluating and optimizing probabilistic strategies across the entire project, thereby facilitating more informed decision-making and enhancing the overall cost efficiency of risk control efforts in construction projects.
The proposed methodology is based on the EMV of errors’ cost and, in particular, is grounded on its probabilistic application using Monte Carlo Simulation. In current Quality Management practice (Level 2 of Figure 1), the decision regarding whether to incur an upfront cost to eliminate the risk of non-conformities or to accept the potential occurrence of a non-conformity is typically conducted at the level of individual activities. For each activity i, the Monte Carlo simulation generates a sample of N simulated rework costs, from which the empirical cumulative distribution function (CDF) is constructed. In traditional probabilistic EMV practice (Level 2), a single exceedance probability is exogenously fixed, typically corresponding to a chosen confidence percentile applied uniformly across activities. This process involves defining a single non-exceedance probability (e.g., 85%) for the EMV of the error cost applicable to all project activities and estimating the EMV probabilistically by extracting, from the CDF of the EMV, the quantile corresponding to the selected probability level. The resulting values, calculated for each activity, represent the expected monetary cost of rework associated with that activity, accompanied by a specified probabilistic assurance that the estimate will not be exceeded. These rework costs can then be compared with the corresponding prevention costs, thereby enabling the identification of the economically most advantageous strategy.
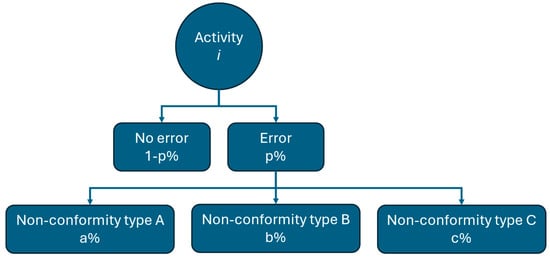
For the sake of simplicity, in the remainder of this article it is assumed, as is frequently done [60,61], that for a given construction site activity i, the probability that an error occurs follows a Bernoulli distribution, where p denotes the probability that the error occurs and (1 − p) denotes the probability that it does not occur. Moreover, it is assumed that, in the event of an error, it may take one of three forms: type A, B or C (Figure 2). Further details on the three types of error are given in the case study section. For the sake of simplicity again, the error type is assumed to follow a Bernoulli distribution with probabilities equal to a, b, and c, respectively, subject to the constraint that a + b + c = 1. Each of these three types of error is associated with a cost, which in turn has its own probability distribution. This modelling approach, adopted for its simplicity, does not reduce the generalizability of the proposed methodology. Under these assumptions regarding error probabilities, the expected monetary value, EMV, of the error cost exhibits a characteristic cumulative density function curve similar to that shown in Figure 3.
Figure 2.
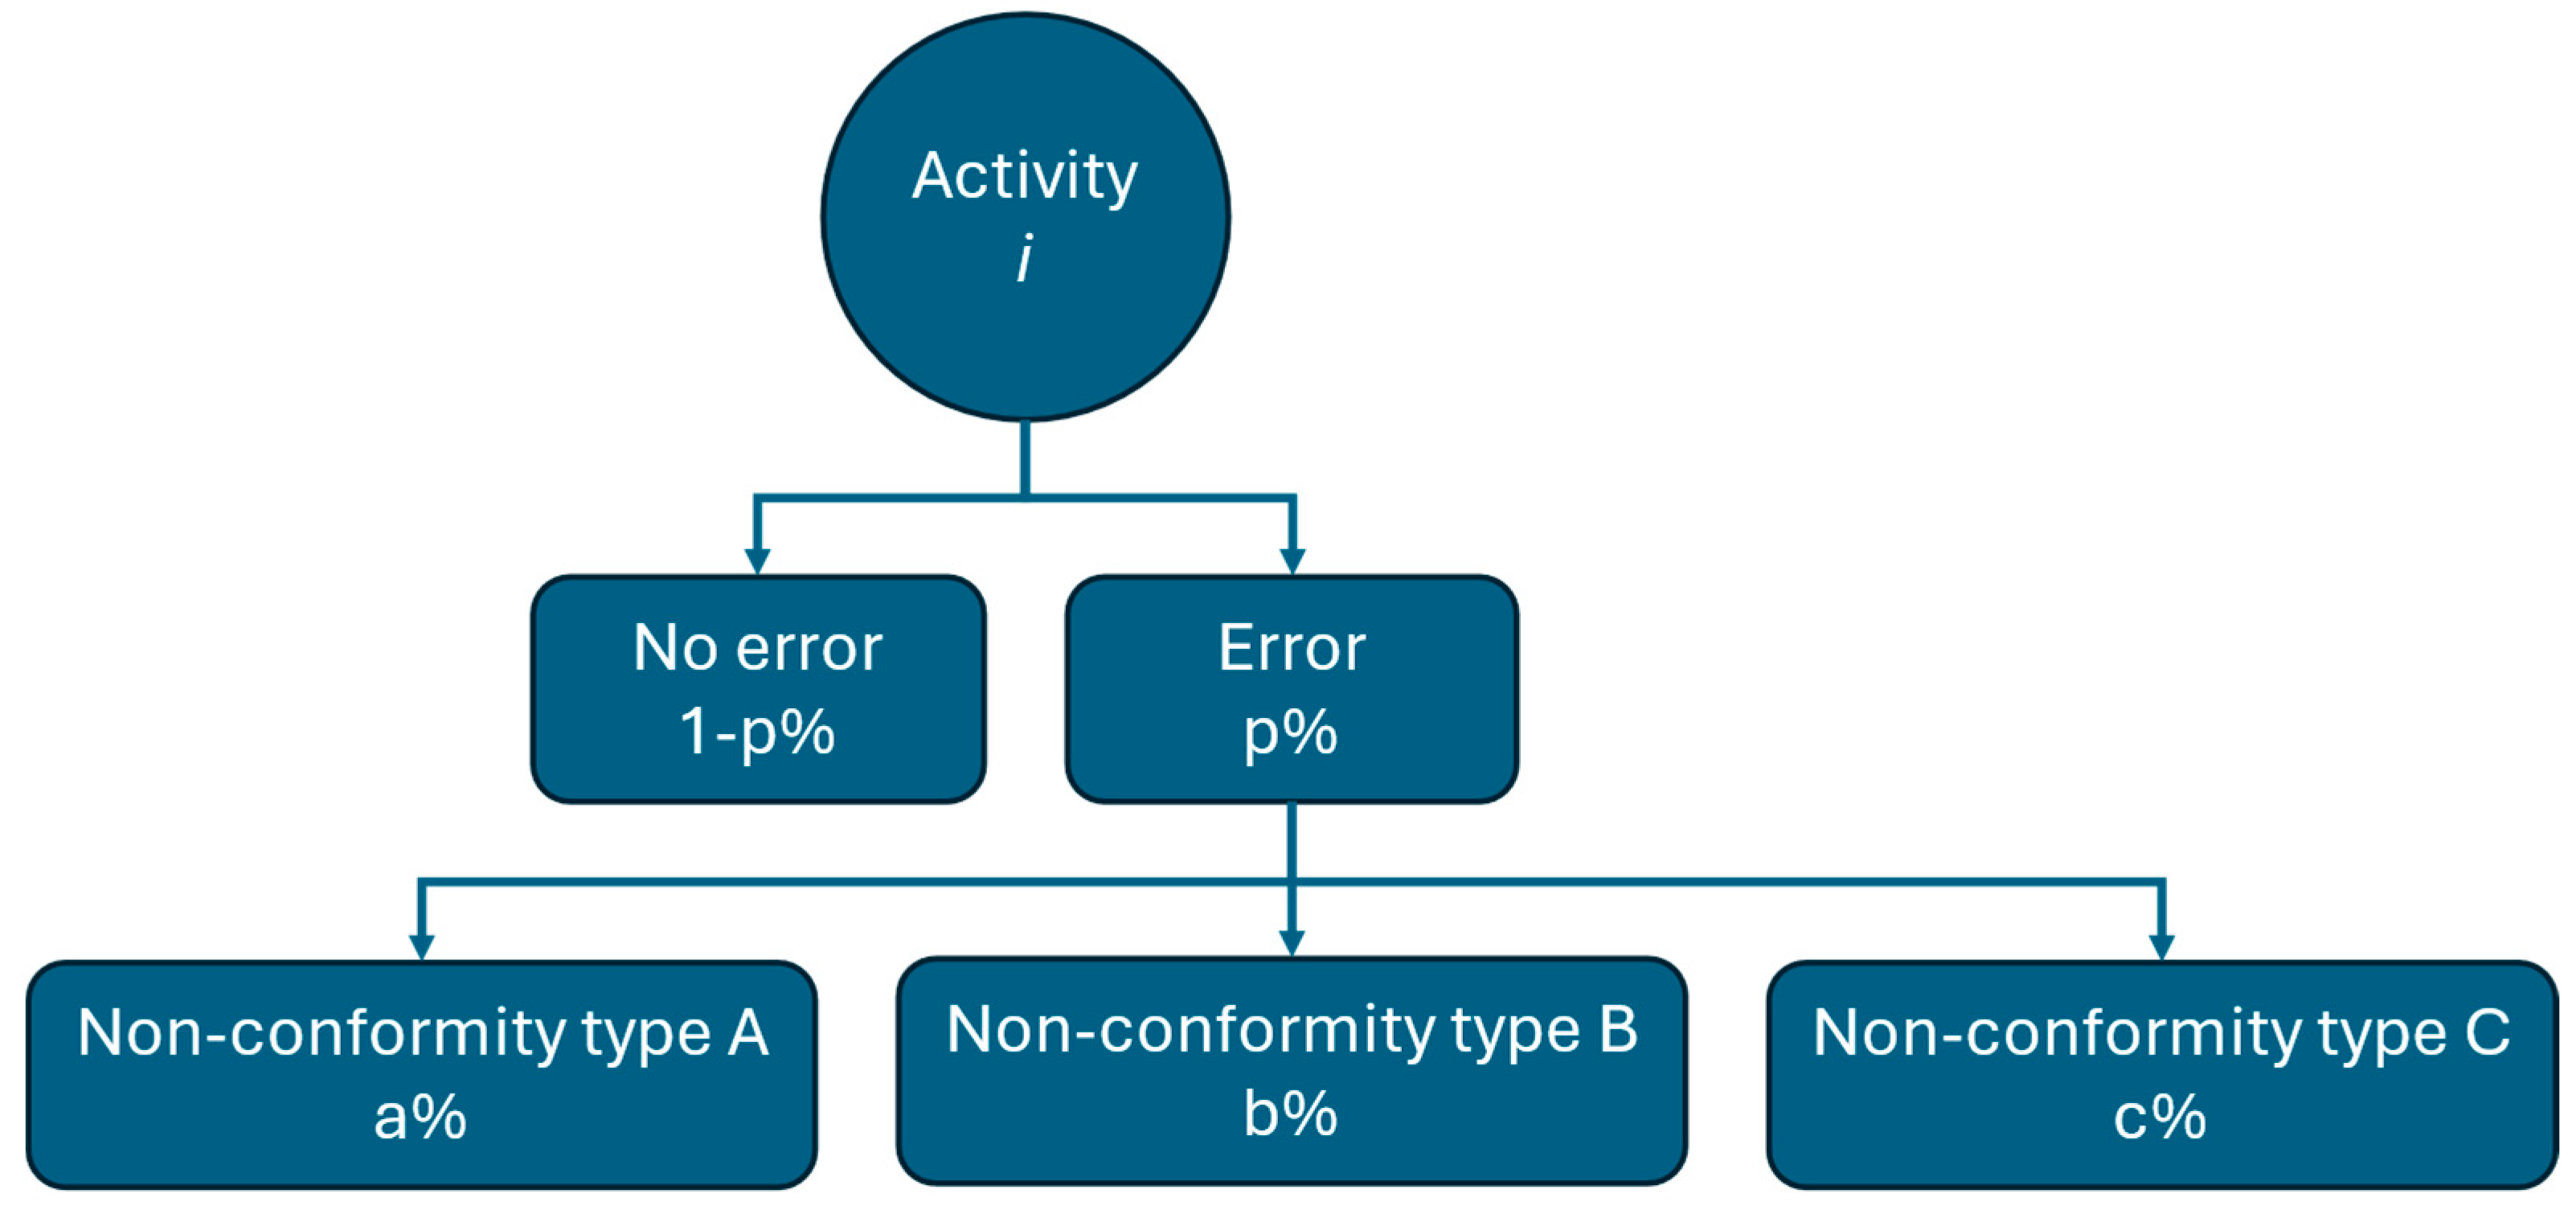
Mathematical definition of the probability of an error in an onsite activity using Bernulli’s distributions.
Figure 3.
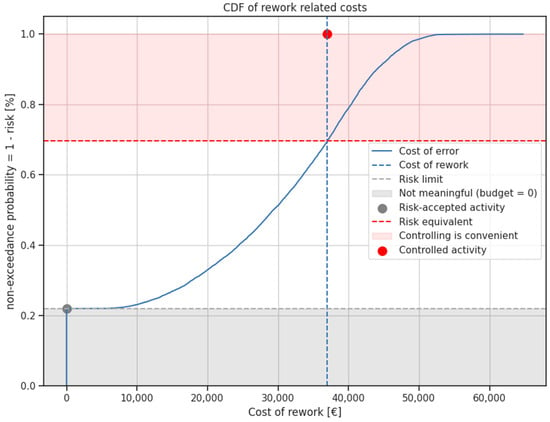
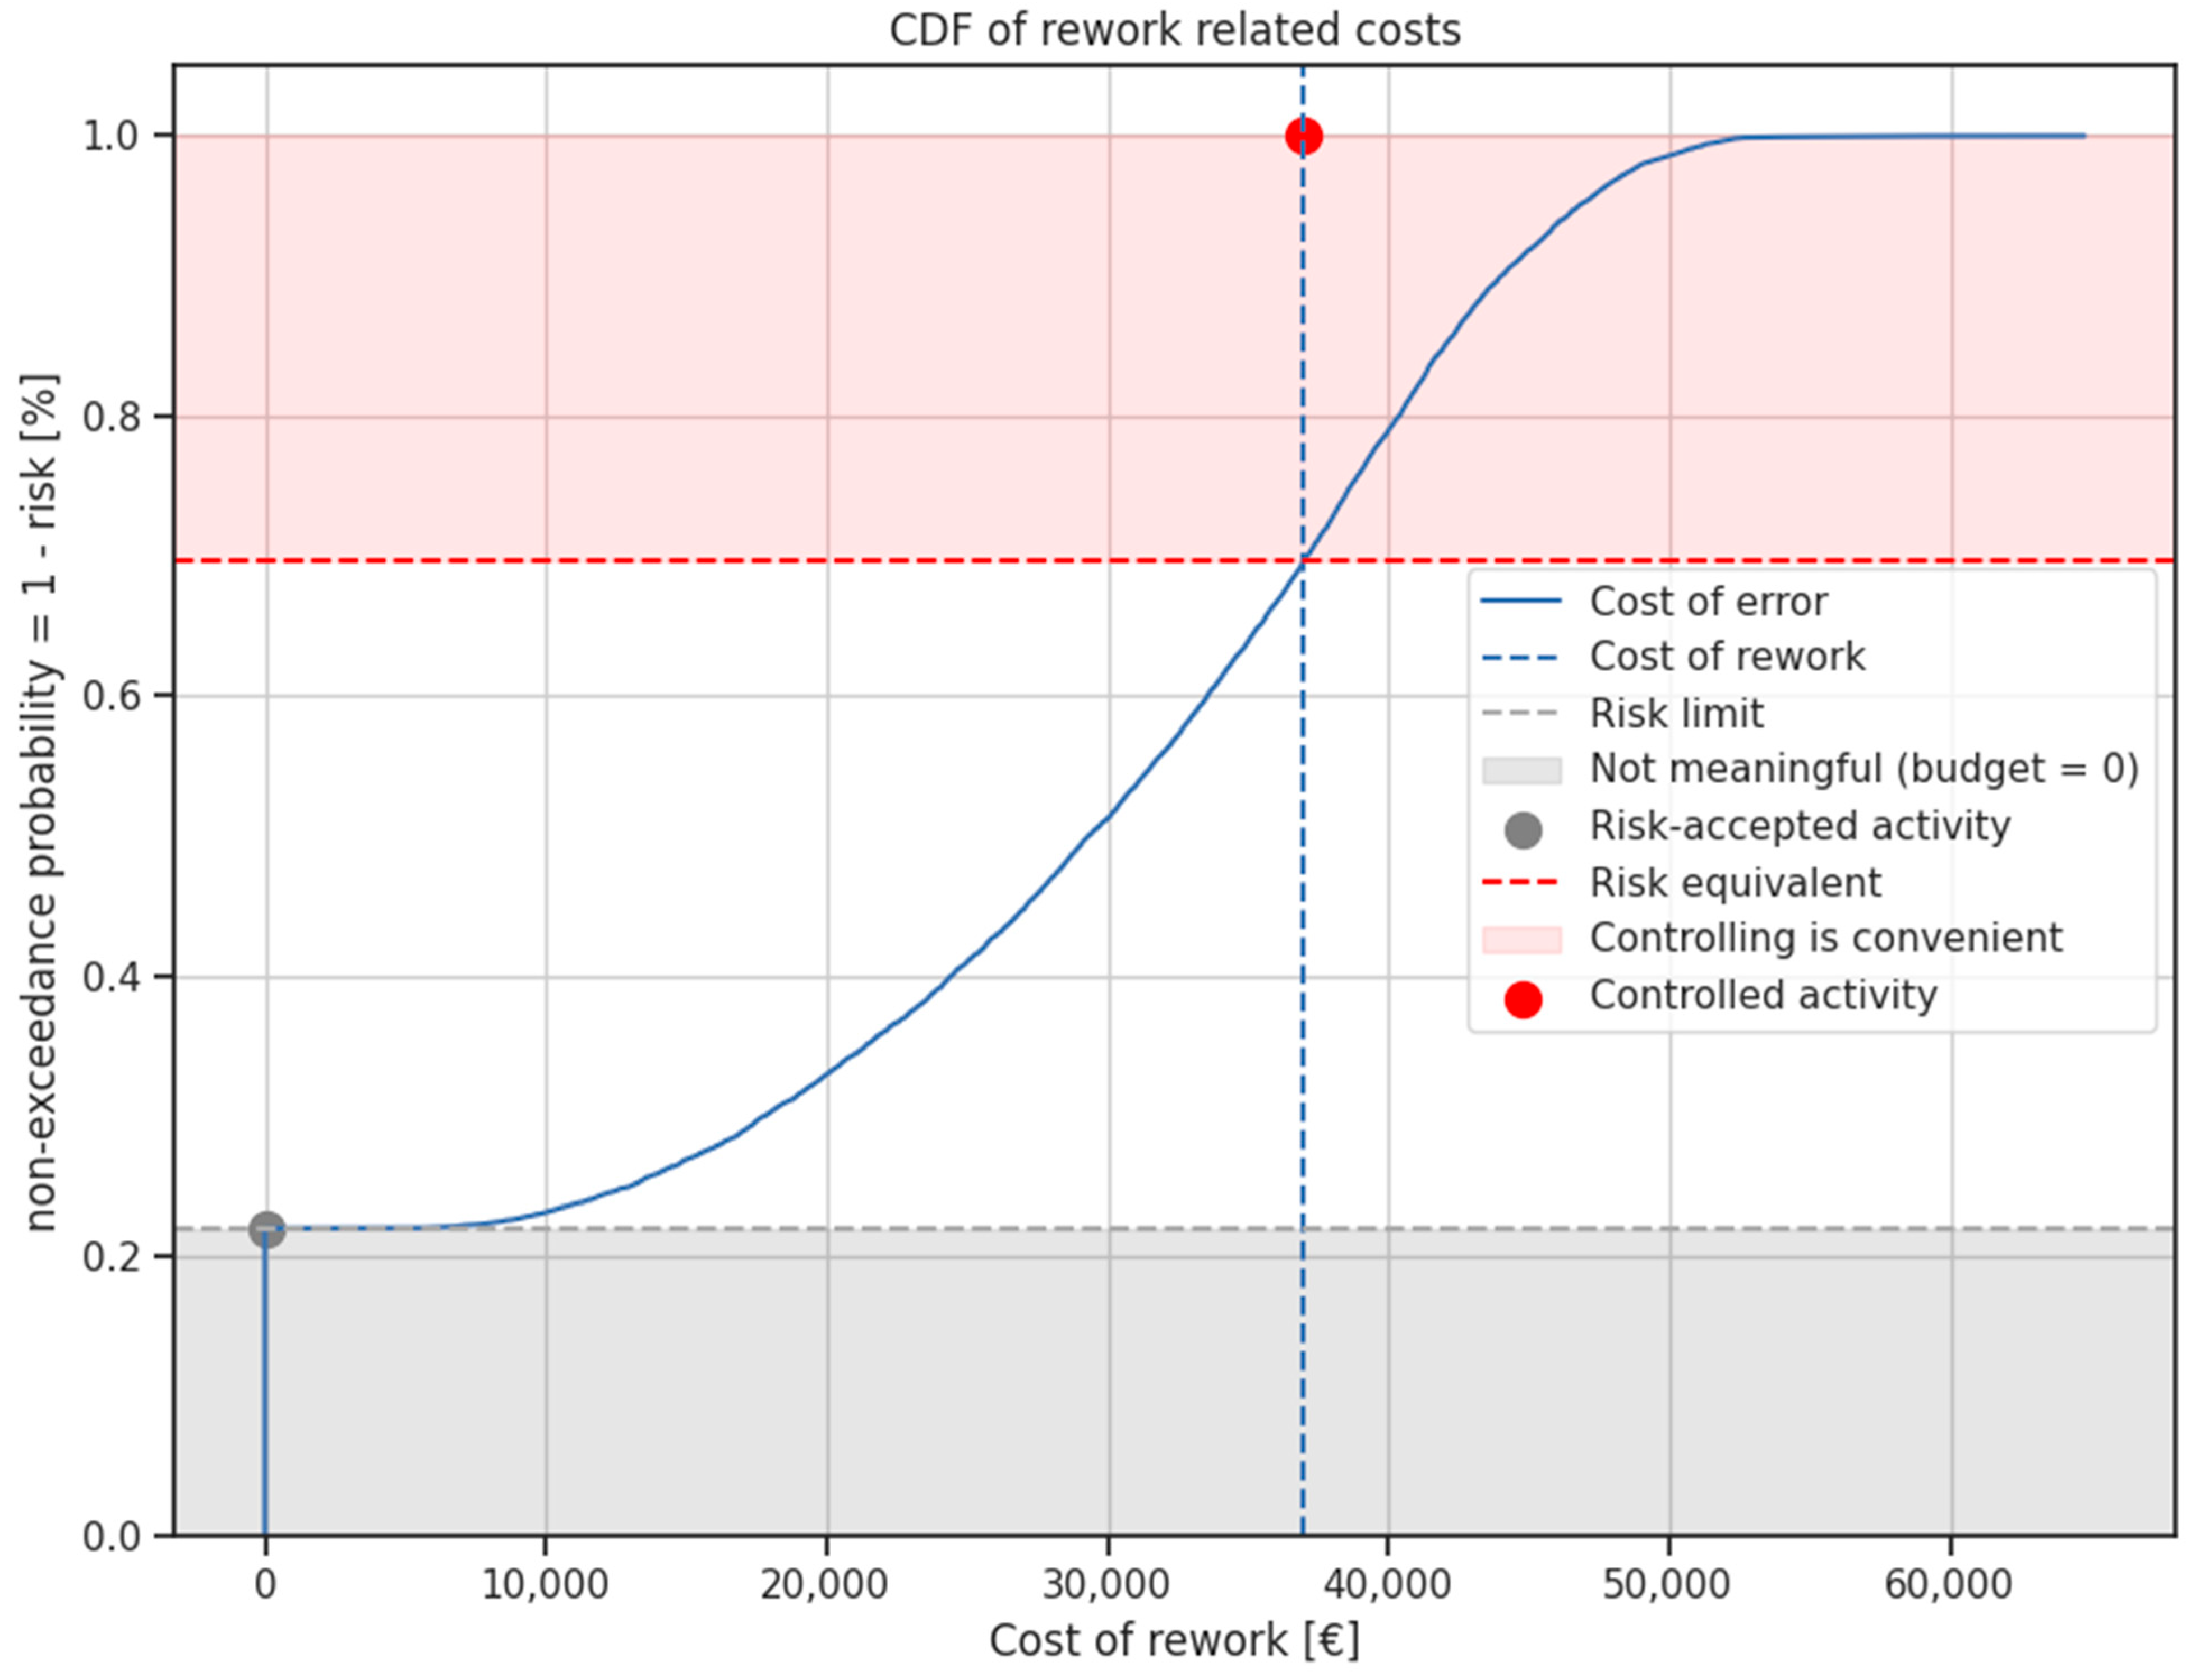
Cumulative distribution function (CDF) of rework costs (EMV). The blue curve represents the probability of not exceeding a given rework cost. The vertical dashed line indicates the control cost, while the crossing horizontal red dashed line marks the risk-equivalent level. Areas above this threshold represent controlled activities (red dot), where rework costs exceed control costs, making control convenient. The area below the horizontal grey dashed line corresponds to solutions with zero rework cost; hence, the convenient solution is the one with minimum risk, indicated by the grey dot.
To advance toward a more optimal allocation of resources within a probabilistic EMV framework, a new global performance indicator is here presented. This indicator is constructed by assigning distinct non-exceedance probabilities to the cumulative distribution functions of the error cost’s EMV for each project activity and then computing a weighted average of these values, where the weights correspond to the maximum error cost’s EMV of each activity. This KPI, referred to as the Total Assurance on Reworks (TAR), is formulated as:
where
- represents the probability of exceeding the budgeted error cost for activity i. The vector is the vector of values to be optimized.
- corresponds to the maximum monetary cost of rework under a worst-case scenario for activity i.
TAR is monotone nondecreasing in each activity’s assigned assurance, and 0 <= TAR <= 1. Monotonicity ensures that increasing the non-exceedance probability of any single activity cannot decrease the overall TAR, which supports gradient-free and constrained optimization strategies. Weighting risks according to facilitates aggregation across activities characterized by highly heterogeneous economic impacts. The definition of TAR not only enables the optimization of risk management strategies but also provides intrinsic project-level metrics that function as benchmarks for evaluating alternative budget–assurance trade-offs. Two specific reference values of the threshold value may be introduced for this purpose:
- Risk Limit (): the minimum exceedance probability associated with zero budget allocation for control activities. This value is strictly correlated to the probability of the not occurrence of an error (1 − p) as defined in Figure 2.
- Risk Equivalent (): the exceedance probability at which the expected cost of rework equals the cost of total direct control.
- Considering those two thresholds one activity at a time, and considering that generally the aim of a quality risk management process is to minimize the costs while maximizing the overall level of assurance, it can be stated that:
- Every exceedance probability () in between and 1 (the grey zone in Figure 3) is not meaningful since the error cost is always zero, as for ; this does not imply that the activity is risk-free. It only indicates that, under the selected assurance level, no positive contingency is required at activity level.
- Every exceedance probability () in between 0 and (the red zone in Figure 3) is associated with an error cost that is higher than the cost of control, thus making it more convenient to control the activity.
Figure 3 shows the cumulative distribution function (CDF) which associates each rework cost with its non-exceedance probability for an exemplary activity. In this graph it is possible to identify the two aforementioned conditions. The first corresponds to the grey area below the risk limit line, where the rework cost is always zero across different risk levels; here, the most convenient solution is at (grey dot). The second corresponds to the red area above the horizontal dashed line marking the risk-equivalent level, which by definition intersects the vertical line of the control cost. In this region, rework costs exceed control costs, making all solutions inconvenient; hence, the optimal choice is to control the activity and assume no risk (red dot). Any optimization of TAR for all the activities to be carried out in a project should be made modifying each activity’s .
A first project-related threshold of TAR, called , can be defined as:
This threshold represents a baseline level of assurance related to the project by budgeting no economical resources for quality controls. It can be correlated with the weighted average of the probability that no errors occur in each individual project activity.
Similarly, another threshold related to the project’s TAR is obtained by imposing that, for all project activities, equals . That is, for each activity, an exceeding probability is specified such that the EMV of the error cost is equal to the cost of control. This measure will be called and will be computed as:
where value can be interpreted as the boundary of the worst case assurance coverage corresponding to the maximum economically efficient allocation of financial resources. In this sense, represents an appropriate benchmark for assessing the efficiency of expenditures allocated to quality control activities. Given a predetermined budget for on site quality control, the TAR value cannot not fall below . Conversely, allocating additional resources to quality control is not economically justified if level already satisfies the Client’s expectations.
Existing project-level aggregation metrics typically rely on unweighted combinations of activity-level EMV, percentile-based EMV selection, or standard risk measures such as Value at Risk, (VaR), and Conditional VaR (CvaR), originally developed within financial portfolio risk management [59]. These approaches have practical value, but they share two important limitations for resource-allocation decisions in construction. First, they implicitly treat activities as homogeneous by applying a common non-exceedance percentile or by summing EMVs without scaling for impact, therefore failing to reflect the heterogeneous economic consequences of failures across activities. Second, they are descriptive rather than prescriptive, they quantify portfolio-level exposure but do not provide a direct, monotonic mapping between allocated preventive expenditure and a single, interpretable assurance target that can be used inside an optimization routine. The TAR addresses these gaps by aggregating activity-level non-exceedance probabilities using activity-specific weights proportional to each activity’s maximum EMV. Weighting by maximum EMV gives precedence to activities whose worst-case outcomes most strongly influence project-level exposure, thus aligning the aggregation with the practical objective of minimizing budgeted contingency while protecting against high-impact failures. TAR is a bounded, project-level assurance index, it is monotone in each activity’s assigned assurance, and it admits meaningful reference points, specifically and , which respectively represent the baseline assurance with zero control expenditure and the assurance at which preventive control is economically equivalent to expected rework costs. These properties make TAR directly usable as an optimization constraint or penalty term, converting a portfolio of heterogeneous probabilistic EMVs into a single decision-relevant KPI that prioritizes interventions where they have the largest marginal effect on project assurance. Accordingly, the methodological contribution is not limited to the introduction of a new KPI, but consists of embedding a theoretically defined, monotone, and impact-sensitive aggregation rule within a global optimization framework that transforms descriptive probabilistic risk metrics into prescriptive resource-allocation decisions.
4. Case Study
To evaluate the practical applicability of the proposed framework, a synthetic case study was carried out. The synthetic dataset was constructed assuming the development of a small office building located in the suburban area of Milano (Italy). The activity list reflects a simplified work breakdown structure representative of a mid-scale building project, including structural works, building envelope, MEP installations, finishing works, temporary works, logistics, and inspection activities. The scope of the assumptions is limited to the construction phase. The main difference between a synthetic and a real-world dataset concerns data calibration. However, the structure of the proposed framework does not depend on the specific numerical values adopted.
By simulating a project environment, the case study enables a structured assessment of the framework’s ability to optimize resource allocation, measure assurance levels, and demonstrate the advantages of the proposed approach compared with traditional practices.
Quality-Related Risks Optimization
A synthetic dataset was developed to test the methodology, given that detailed and reliable project data on error probabilities and costs are rarely available in the public domain due to their commercial sensitivity. The dataset consisted of 50 activities, each representing a task within a simplified work breakdown structure. For each activity, the following information was specified:
- Direct cost of the activity;
- Total probability of non-conformity during execution;
- Probability of a type A non-conformity;
- Probability of a type B non-conformity;
- Probability of a type C non-conformity;
- Triangular distribution of the cost of error for type A non-conformities;
- Triangular distribution of the cost of error for type B non-conformities;
- Triangular distribution of the cost of error for type C non-conformities;
- Cost of control of the activity.
Among the information gathered for each activity, the total probability of non-conformity was further divided into three classes (type A, B, and C), representing increasing levels of severity and cost impact. This classification follows common practice in quality management systems, where non-conformities are categorized as minor, major, or critical according to their effect on the fulfilment of project requirements and the potential cost of corrective actions [19].
- Type A non-conformities represent minor deviations that can be corrected with limited effort and negligible impact on project performance.
- Type B non-conformities refer to more significant deviations requiring partial rework or replacement of components, with a moderate effect on cost and schedule.
- Type C non-conformities correspond to severe failures leading to substantial rework, potential contract penalties, or reputational damage, and thus have the highest economic impact [62].
For each type, the cost of error was modelled using a triangular probability distribution, defined by its minimum, most likely, and maximum cost values. The triangular distribution is commonly used in construction risk modelling when detailed historical data are missing, as it offers a simple way to describe how costs are spread and to include expert judgement [37,48]. This approach highlights that most non-conformity costs are expected to fall near the most likely value, while still considering the possibility of less frequent but higher-cost events.
Together, this classification of non-conformities and their associated cost distributions provide the full set of probabilistic inputs required for the next stage of analysis, which uses Monte Carlo simulation to generate the error cost distributions for each activity. In fact, based on all the inputs previously mentioned, a Monte Carlo simulation with 10,000 iterations per activity was conducted.
For each iteration the occurrence of an error was checked and eventually its type. According to the type, a corresponding cost value was sampled from the related triangular distribution. This allowed the generation of a probability distribution function (PDF) of error related costs for each activity, which was then converted into a cumulative distribution function (CDF). In the generated case study, the CDFs generally present an initial flat section, corresponding to the probability that no error occurs at all (hence the relative contingency budget is zero). After this threshold, the curve rises more steeply as it accounts for the most frequent ranges of error costs, before gradually flattening towards the tail, which represents the less likely but more severe high-cost events. Those CDFs associate each potential error cost with the probability of not exceeding it, thus providing the Expected Monetary Value (EMV) of errors for each probability level. The normalized value of the maximum EMV provided by the CDF were then used as weights in the evaluation of the TAR index, as explained in Methodology.
The optimization phase aimed to minimize the total budget needed to face the risk of non-conformities, while ensuring that the Total Assurance of Reworks (TAR) stayed at or above the target threshold set by the user. The total budget was calculated as the sum of the minimum values for each activity between the cost of control and the cost of error, which is dependant on the associated exceedance probability.
Several algorithms were tested, and due to the non-linear and high-dimensional nature of the problem, the most effective strategy was to incorporate the TAR as an inequality-constrained penalty term within the cost function.
The process was conducted in two stages: a global search using the MultiCMA algorithm [63] to explore the solution space, followed by a local refinement with the CMA algorithm to sharpen the results.
5. Results
The optimization process enabled the automated definition of non-exceedance probabilities and, consequently, the identification of activities for which active preventive measures should be implemented. Based on this information, it becomes possible to calculate the contingency budget and to compare it with the budget estimated through conventional evaluation practices. In order to ensure a fair comparison, the baseline uses the same probabilistic inputs and the same Monte Carlo simulations adopted for the TAR-optimized approach. The baseline follows current practice in probabilistic EMV, where a single non-exceedance probability of 90% is selected and applied uniformly to all activities. Baseline activity-level budgeted costs are computed using the minimum between control cost and the selected EMV quantile.
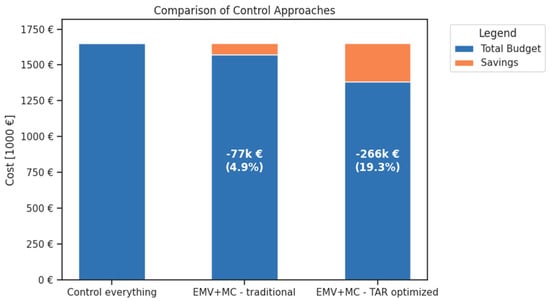
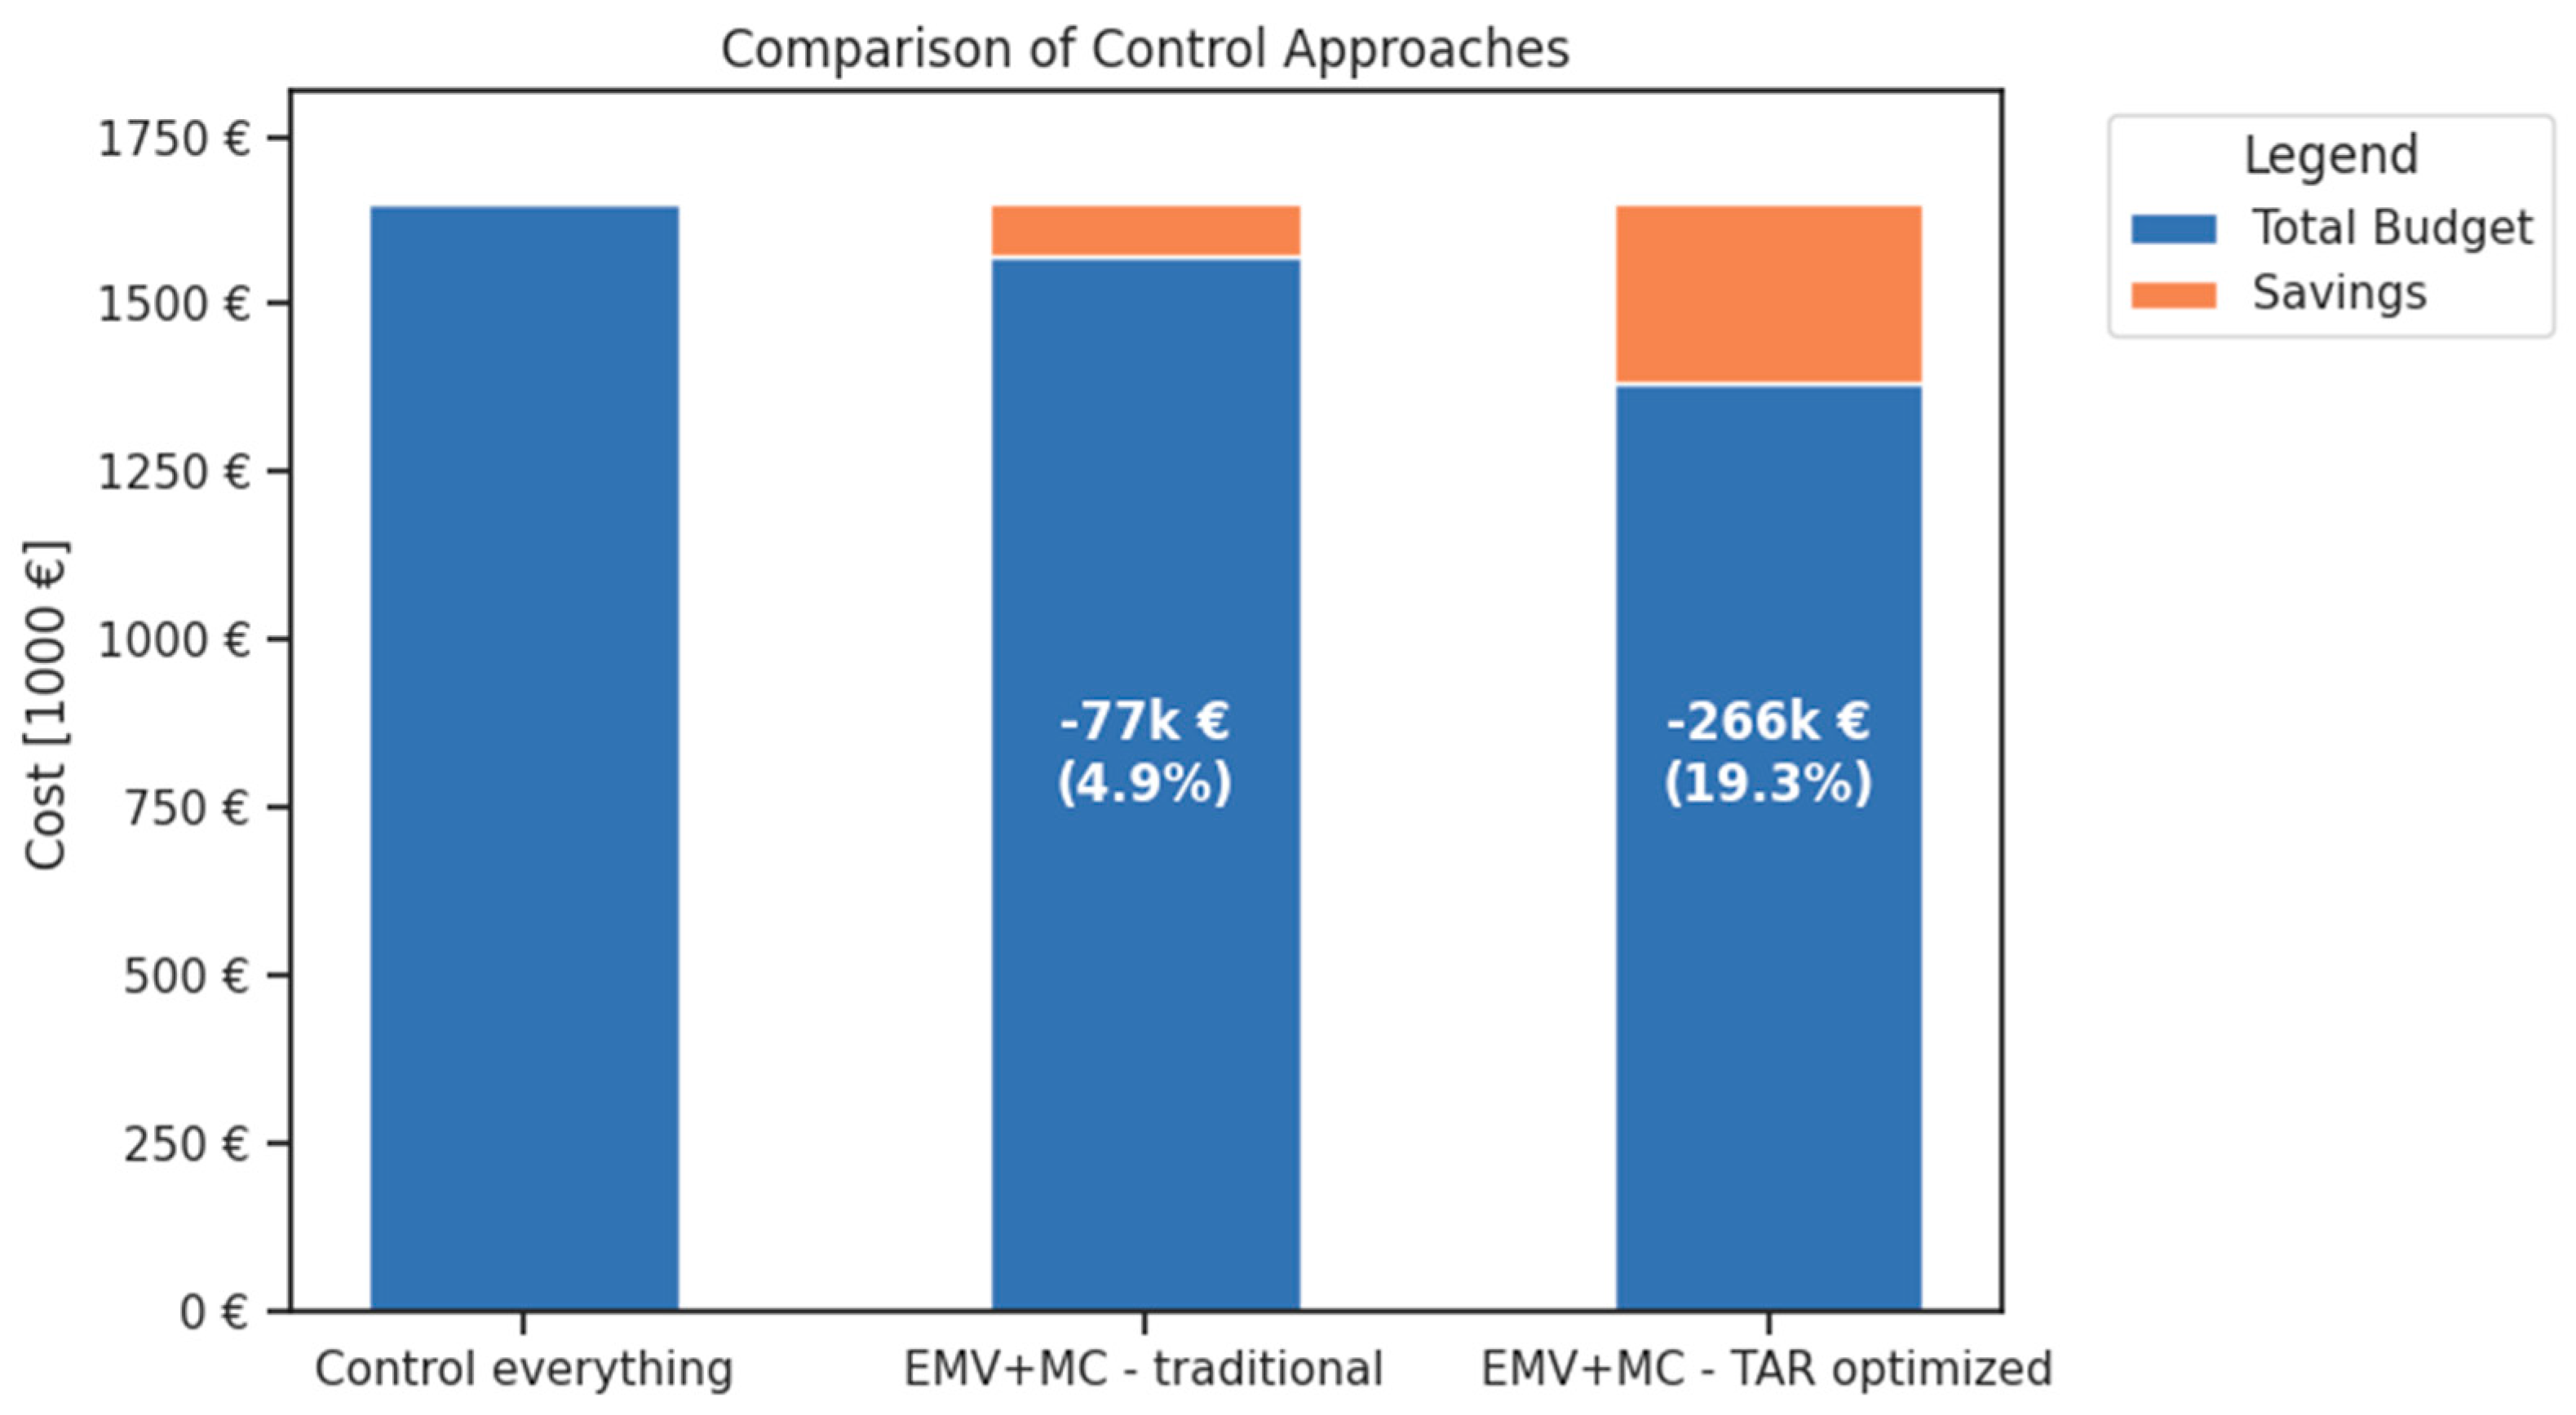
Figure 4 shows the comparison of the savings that can be achieved by the traditional EMV methodology and the TAR-optimized methodology in comparison to the situation in which all the activities are controlled. In the case study with the target assurance level (TAR) set at 90%, the traditional methodology achieved a cost saving of 4.9% compared to the scenario in which all activities are subjected to control. By contrast, the optimized methodology resulted in a saving of 19.3%, corresponding to an additional 18.4% reduction in economic resources when compared with the state of the art.
Figure 4.
Comparison of savings between the traditional and TAR-optimized methodologies in the case study. The y-axis represents total cost, defined as the sum of control cost and budgeted rework cost (blue). Savings (orange) are calculated relative to the baseline scenario, where all activities are controlled.
Since the purpose of the contingency fund is to address potential non-conformities, it may appear counterintuitive that a lower allocation of resources can enhance the prevention of cost overruns. These savings, however, are achieved through a differentiated allocation of financial resources across activities, with a more cautious approach adopted for those that may entail significant risks. Specifically, subsets of the most impactful activities are subjected to active control, while distinct contingency budgets are assigned to account for potential non-conformities of the other activities.
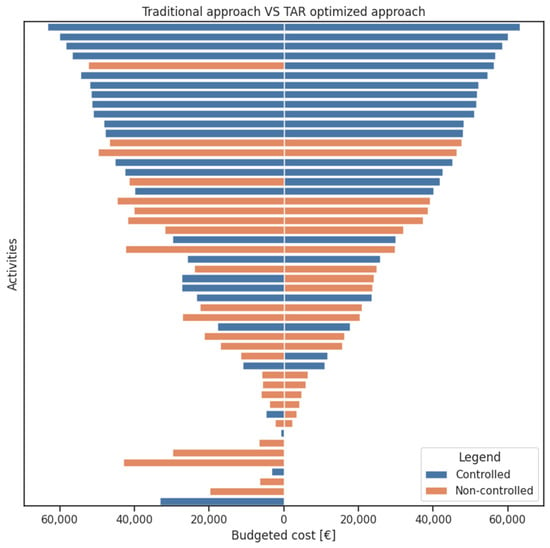
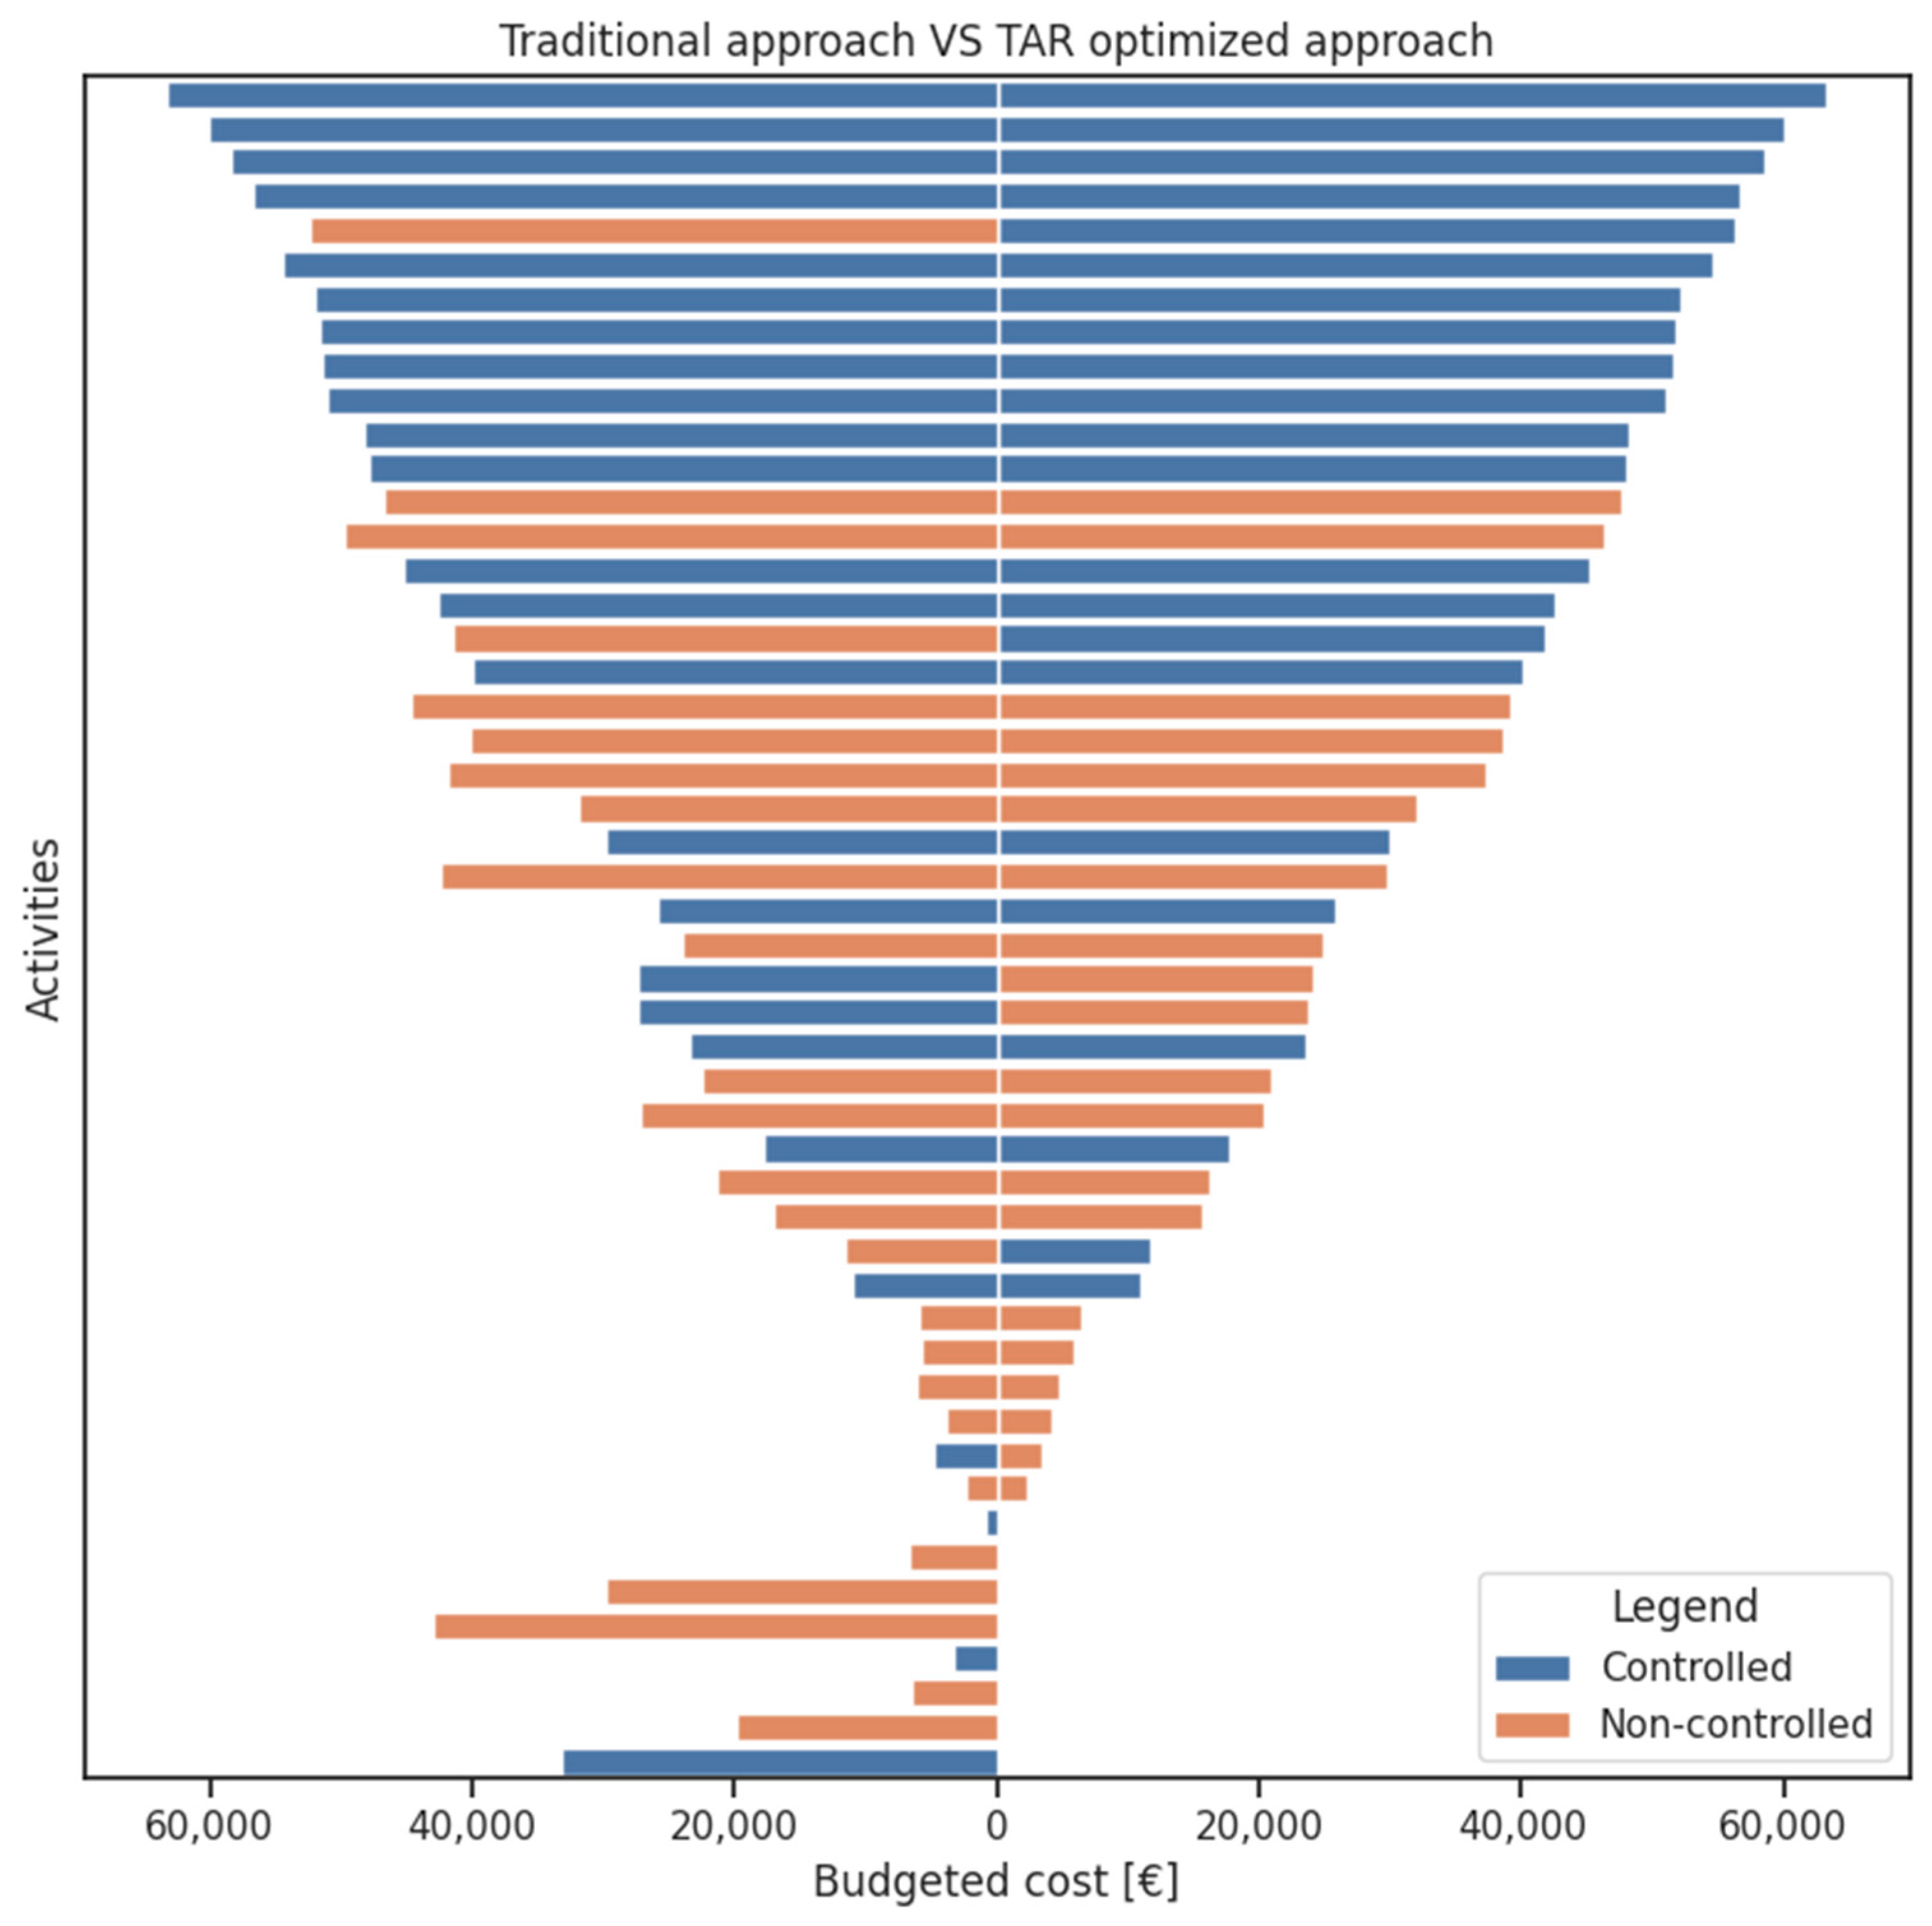
Figure 5 shows how for some activities the risk management approach changes passing from the traditional approach to the TAR-optimized approach. Specifically, the graph shows the budgeted cost for each activity according to the two possible control approaches, the traditional on the left half and the TAR-optimized on the right half. In blue are highlighted the activities that according to each methodology should have been controlled and vice versa in orange are the non-controlled activities, for which a risk is considered acceptable.
Figure 5.
Comparison between the traditional (left side) and the TAR-optimized (right side) methodology, where the budgeted cost for each activity is shown. In blue, the controlled activities (budgeted cost = cost of control), and in orange, the uncontrolled ones (budgeted cost = cost of rework).
As illustrated in Figure 5, some activities transitioned from being classified as controlled to non-controlled, and vice versa. This solution can be attributed to the weighting factors applied within the TAR formula. Specifically, activities that are no longer considered controlled under the optimized methodology are those for which the potential overall impact of a non-conformity is relatively limited. Conversely, activities that, according to the optimized approach, should be controlled are those associated with a more significant potential impact, as well as those representing the main sources of potential cost savings.
A more notable distinction between the two approaches is the presence of activities without any allocated contingency budget. Those correspond to activities for which the exceedance probability is higher than the risk limit, resulting in a cost associated with that exceeding probability equal to zero. Under the conventional methodology, this would imply that no specific resources are reserved to address potential cost overruns in such activities. However, since the proposed methodology evaluates risks on a global scale, the contingency fund identified should be interpreted as a collective reserve, available to cover unexpected costs across all activities.
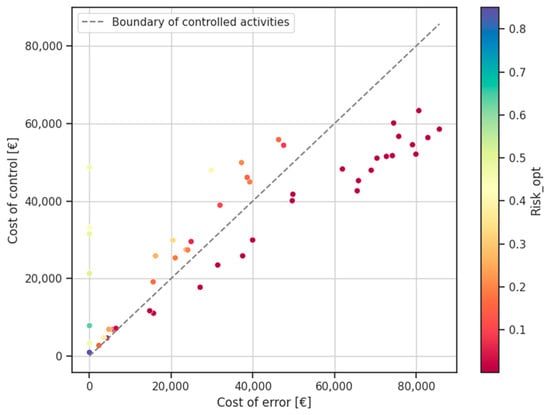
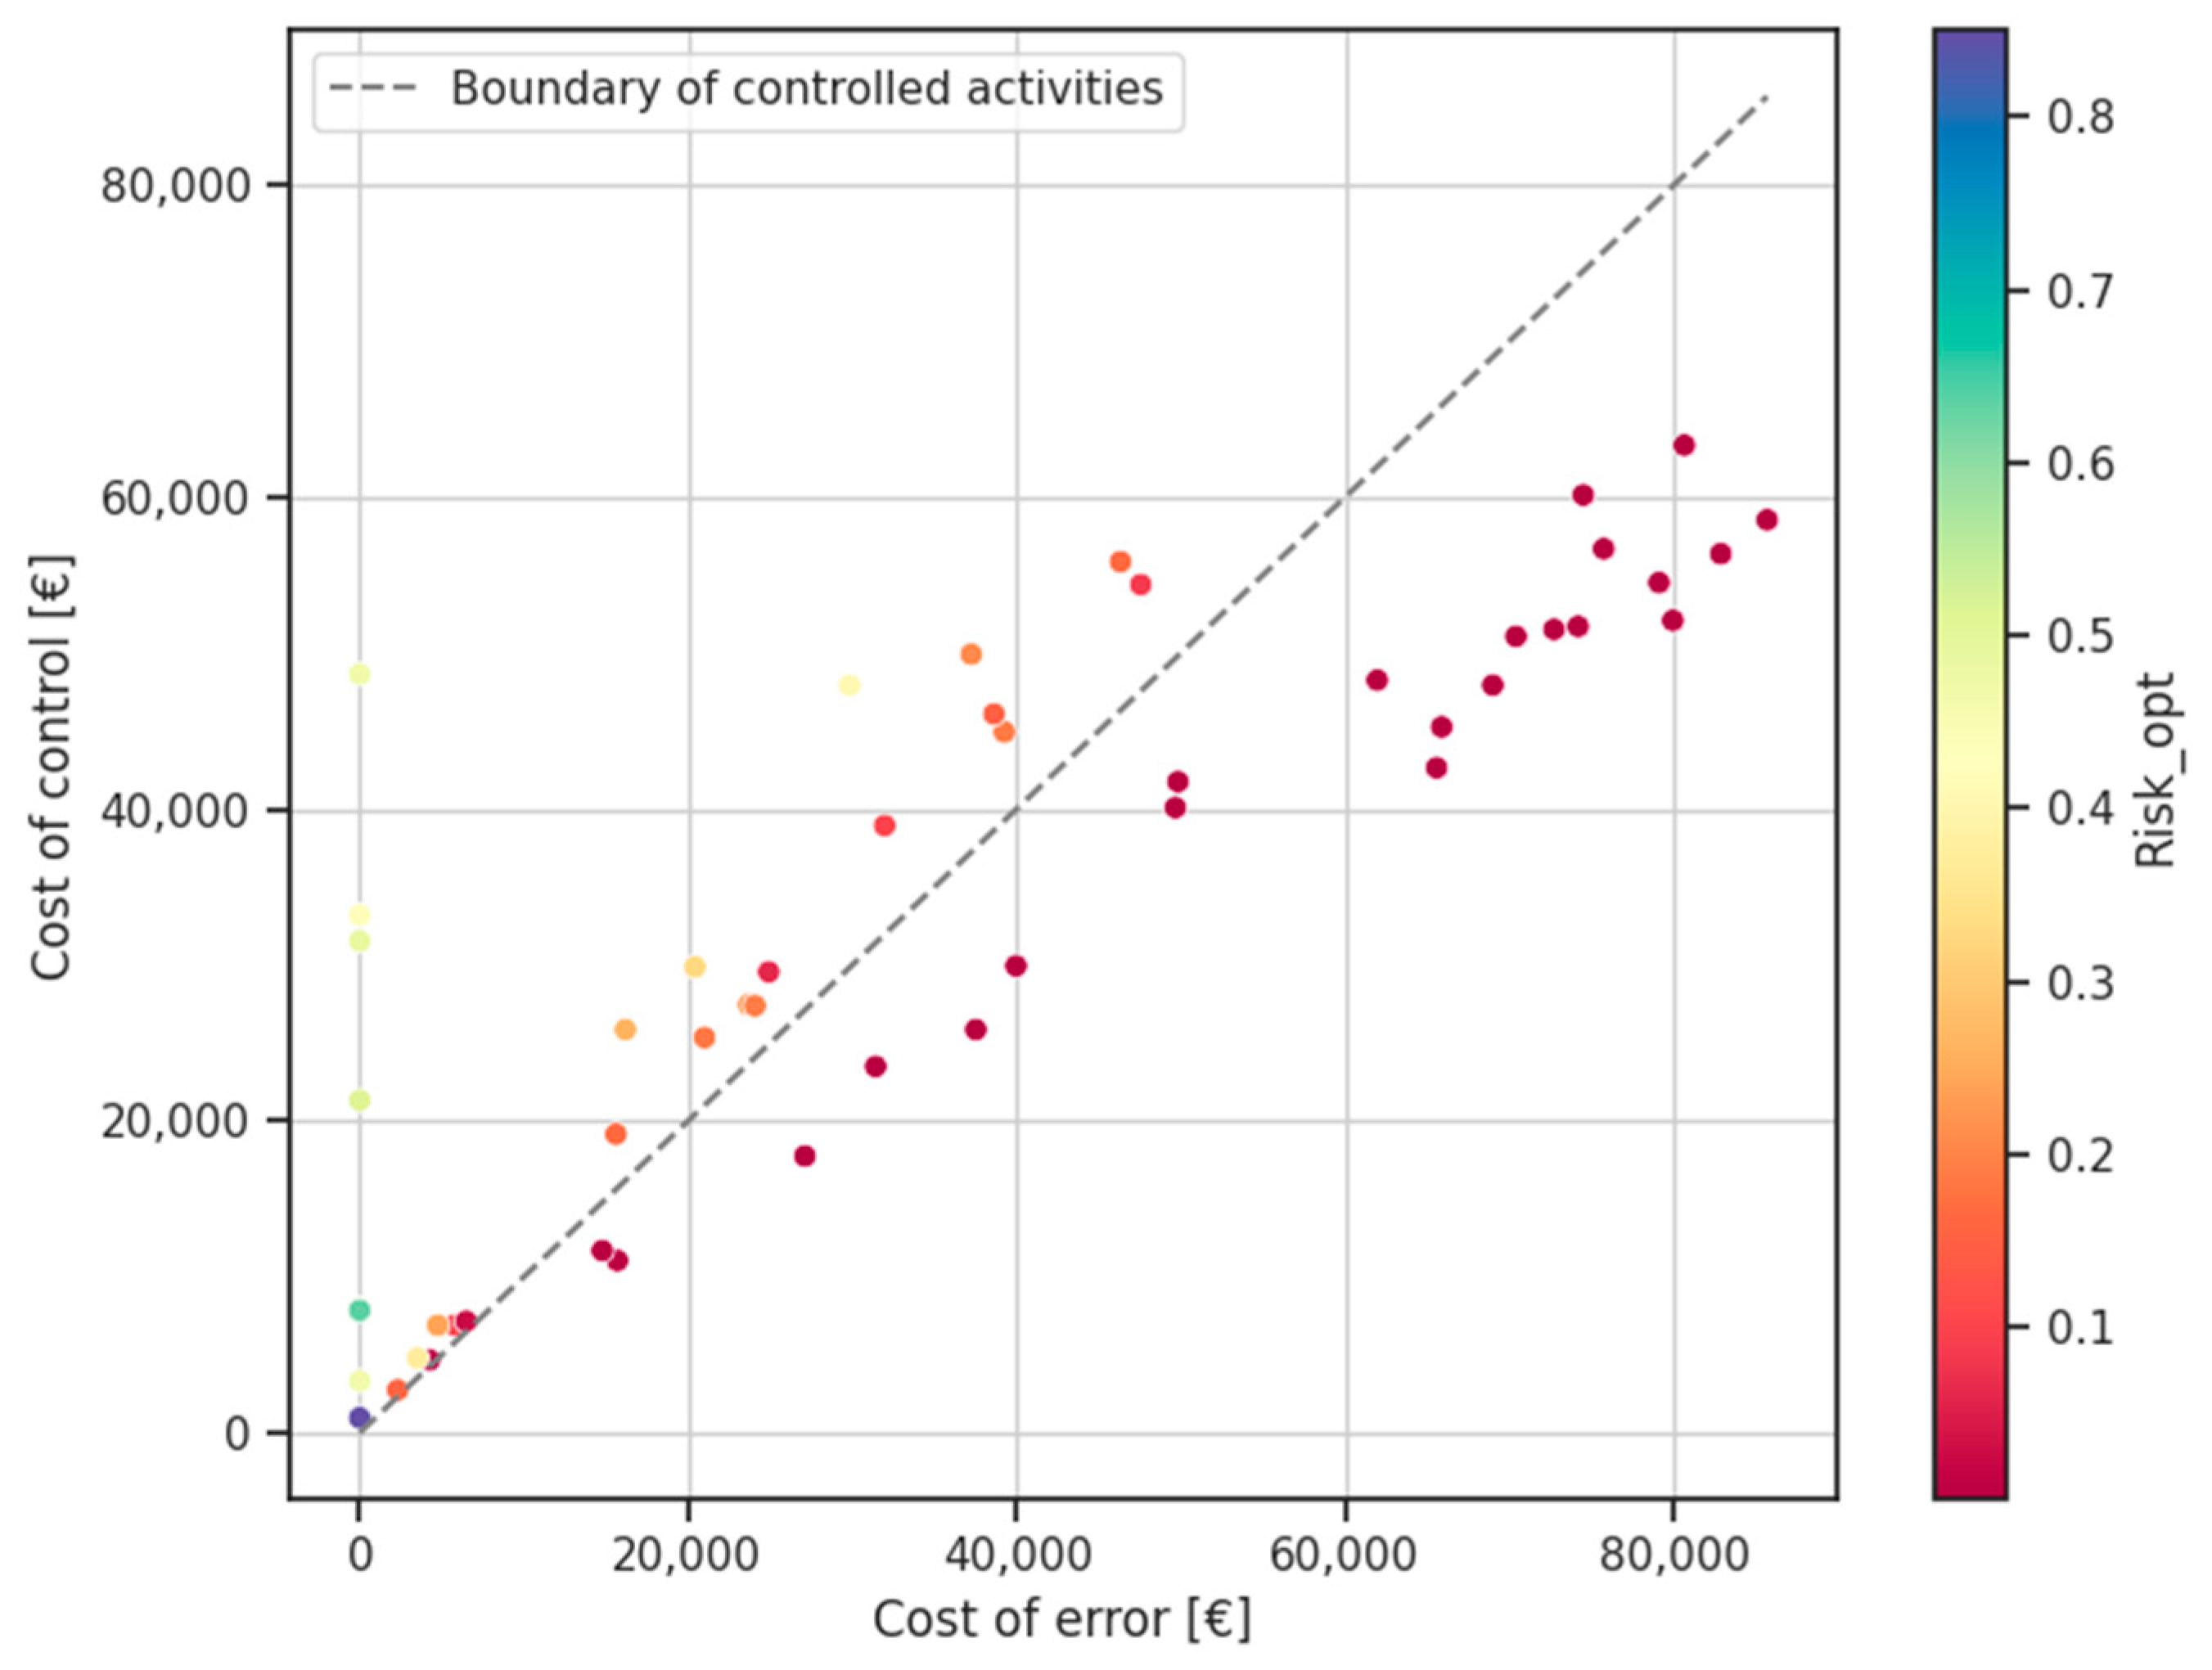
The consistency of the optimized results with the theoretical framework outlined in the Methodology chapter can be demonstrated by examining the distribution of activities in a two-dimensional graph, where the axes represent the cost of control and the cost of error (Figure 6).
Figure 6.
Each point in the graph represents an activity, with the x-axis indicating the cost of error, the y-axis indicating the cost of control, and the gradient representing the associated risk. The bisector separates activities for which control is applied (cost of control < cost of error) from those for which risk is accepted. Controlled activities are located in the top-left region, while activities with accepted risk are in the bottom-right region.
In this graph, each activity is represented by a dot, positioned according to its control cost and associated rework cost (EMV), and coloured by the level of risk determined through the optimization process. By introducing the bisector into this representation, it becomes possible to distinguish in a different way between activities subject to control (positioned below the bisector) and those for which a risk is accepted (positioned above the bisector). A subset of activities lies along the y-axis, corresponding to cases in which the accepted risk exceeds the risk limit. For these activities, the expected cost of error is budgeted as zero. This outcome should not be interpreted as a recommendation to disregard the activity. The residual risk remains present and is implicitly covered within the project-level contingency determined by the TAR constraint. The zero allocation reflects relative economic prioritization rather than the absence of uncertainty. The results can also be visualized in the following graphs, which compare the optimal risk with the risk limit and the risk equivalent. For each graph, the dots represent an activity of the case study, and the y-axis expresses the level of risk determined through the optimization process.
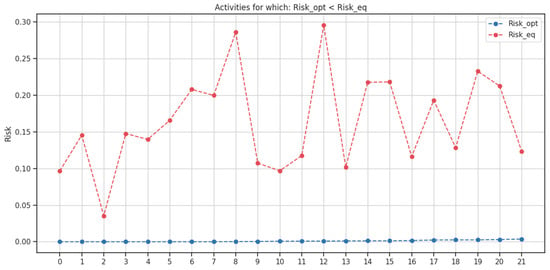
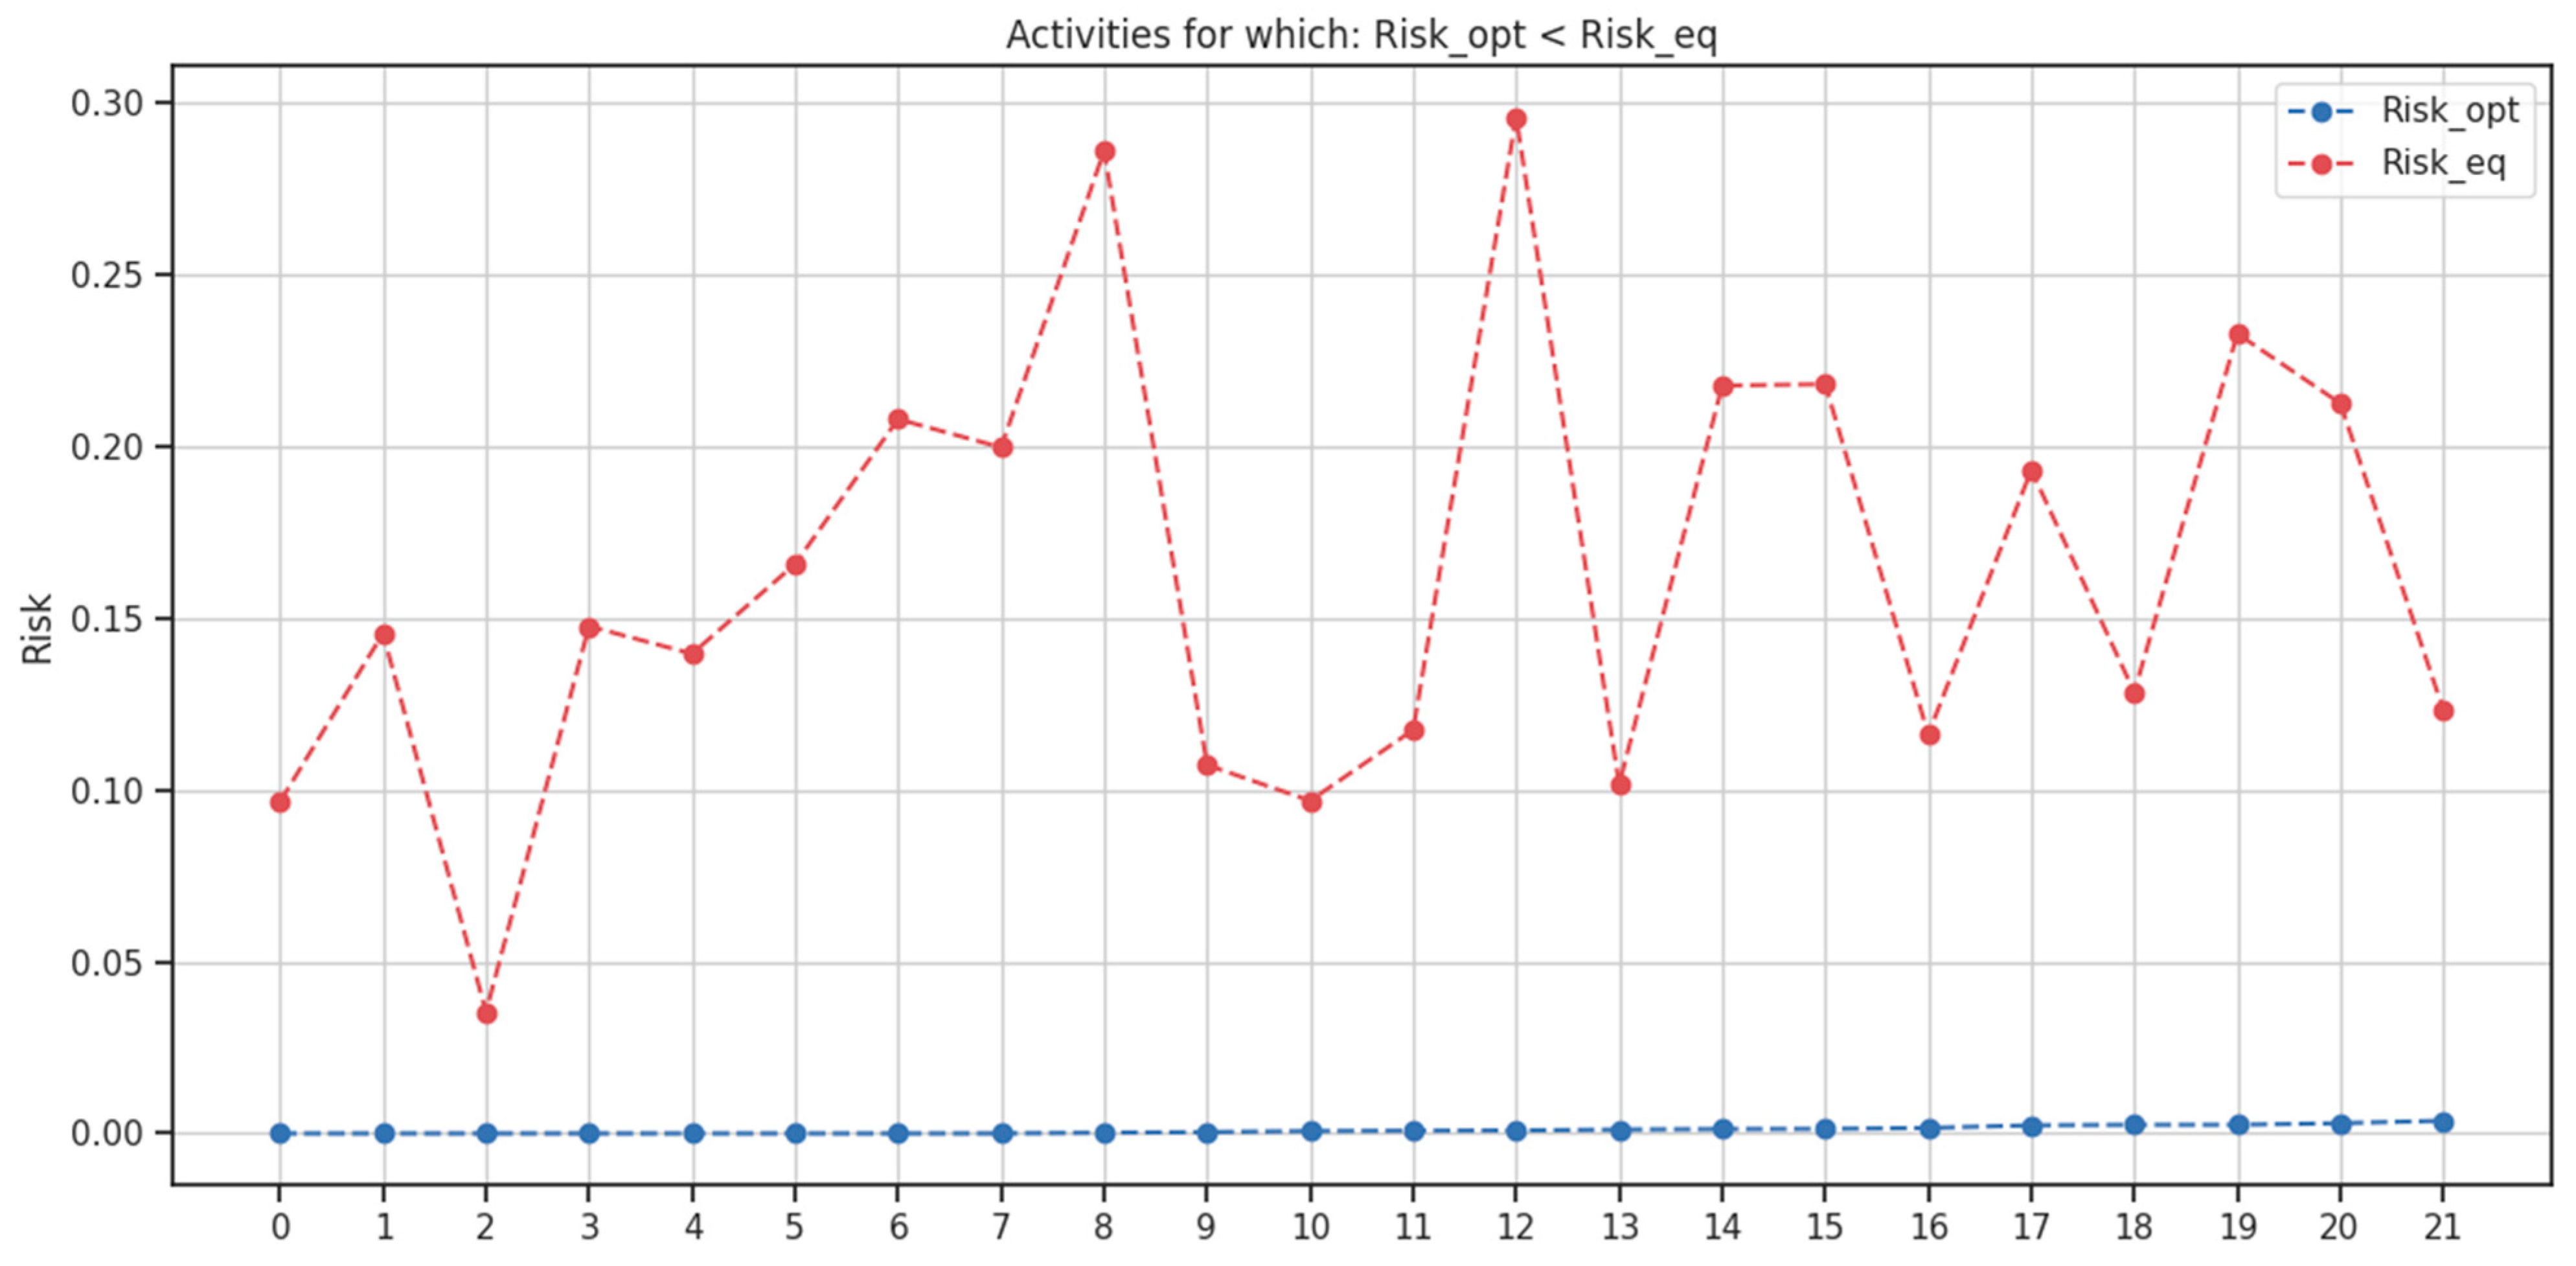
In Figure 7, activities with an associated optimal risk lower than the risk equivalent are those that will be controlled, as the risk equivalent represents the threshold above which control becomes cost-effective. For these cases, since the activities are controlled, the associated optimal risk is zero, as expected according to the theoretical considerations in the Methodology chapter.
Figure 7.
Only the activities for which the optimal risk is lower than the equivalent risk are considered and displayed as points. The y-axis represents the risk level, showing that the optimal risk for all displayed activities is zero, as theorized in Figure 3 (red dot).
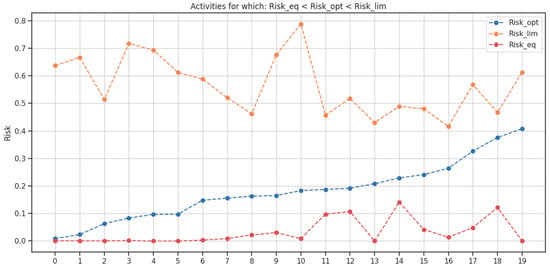
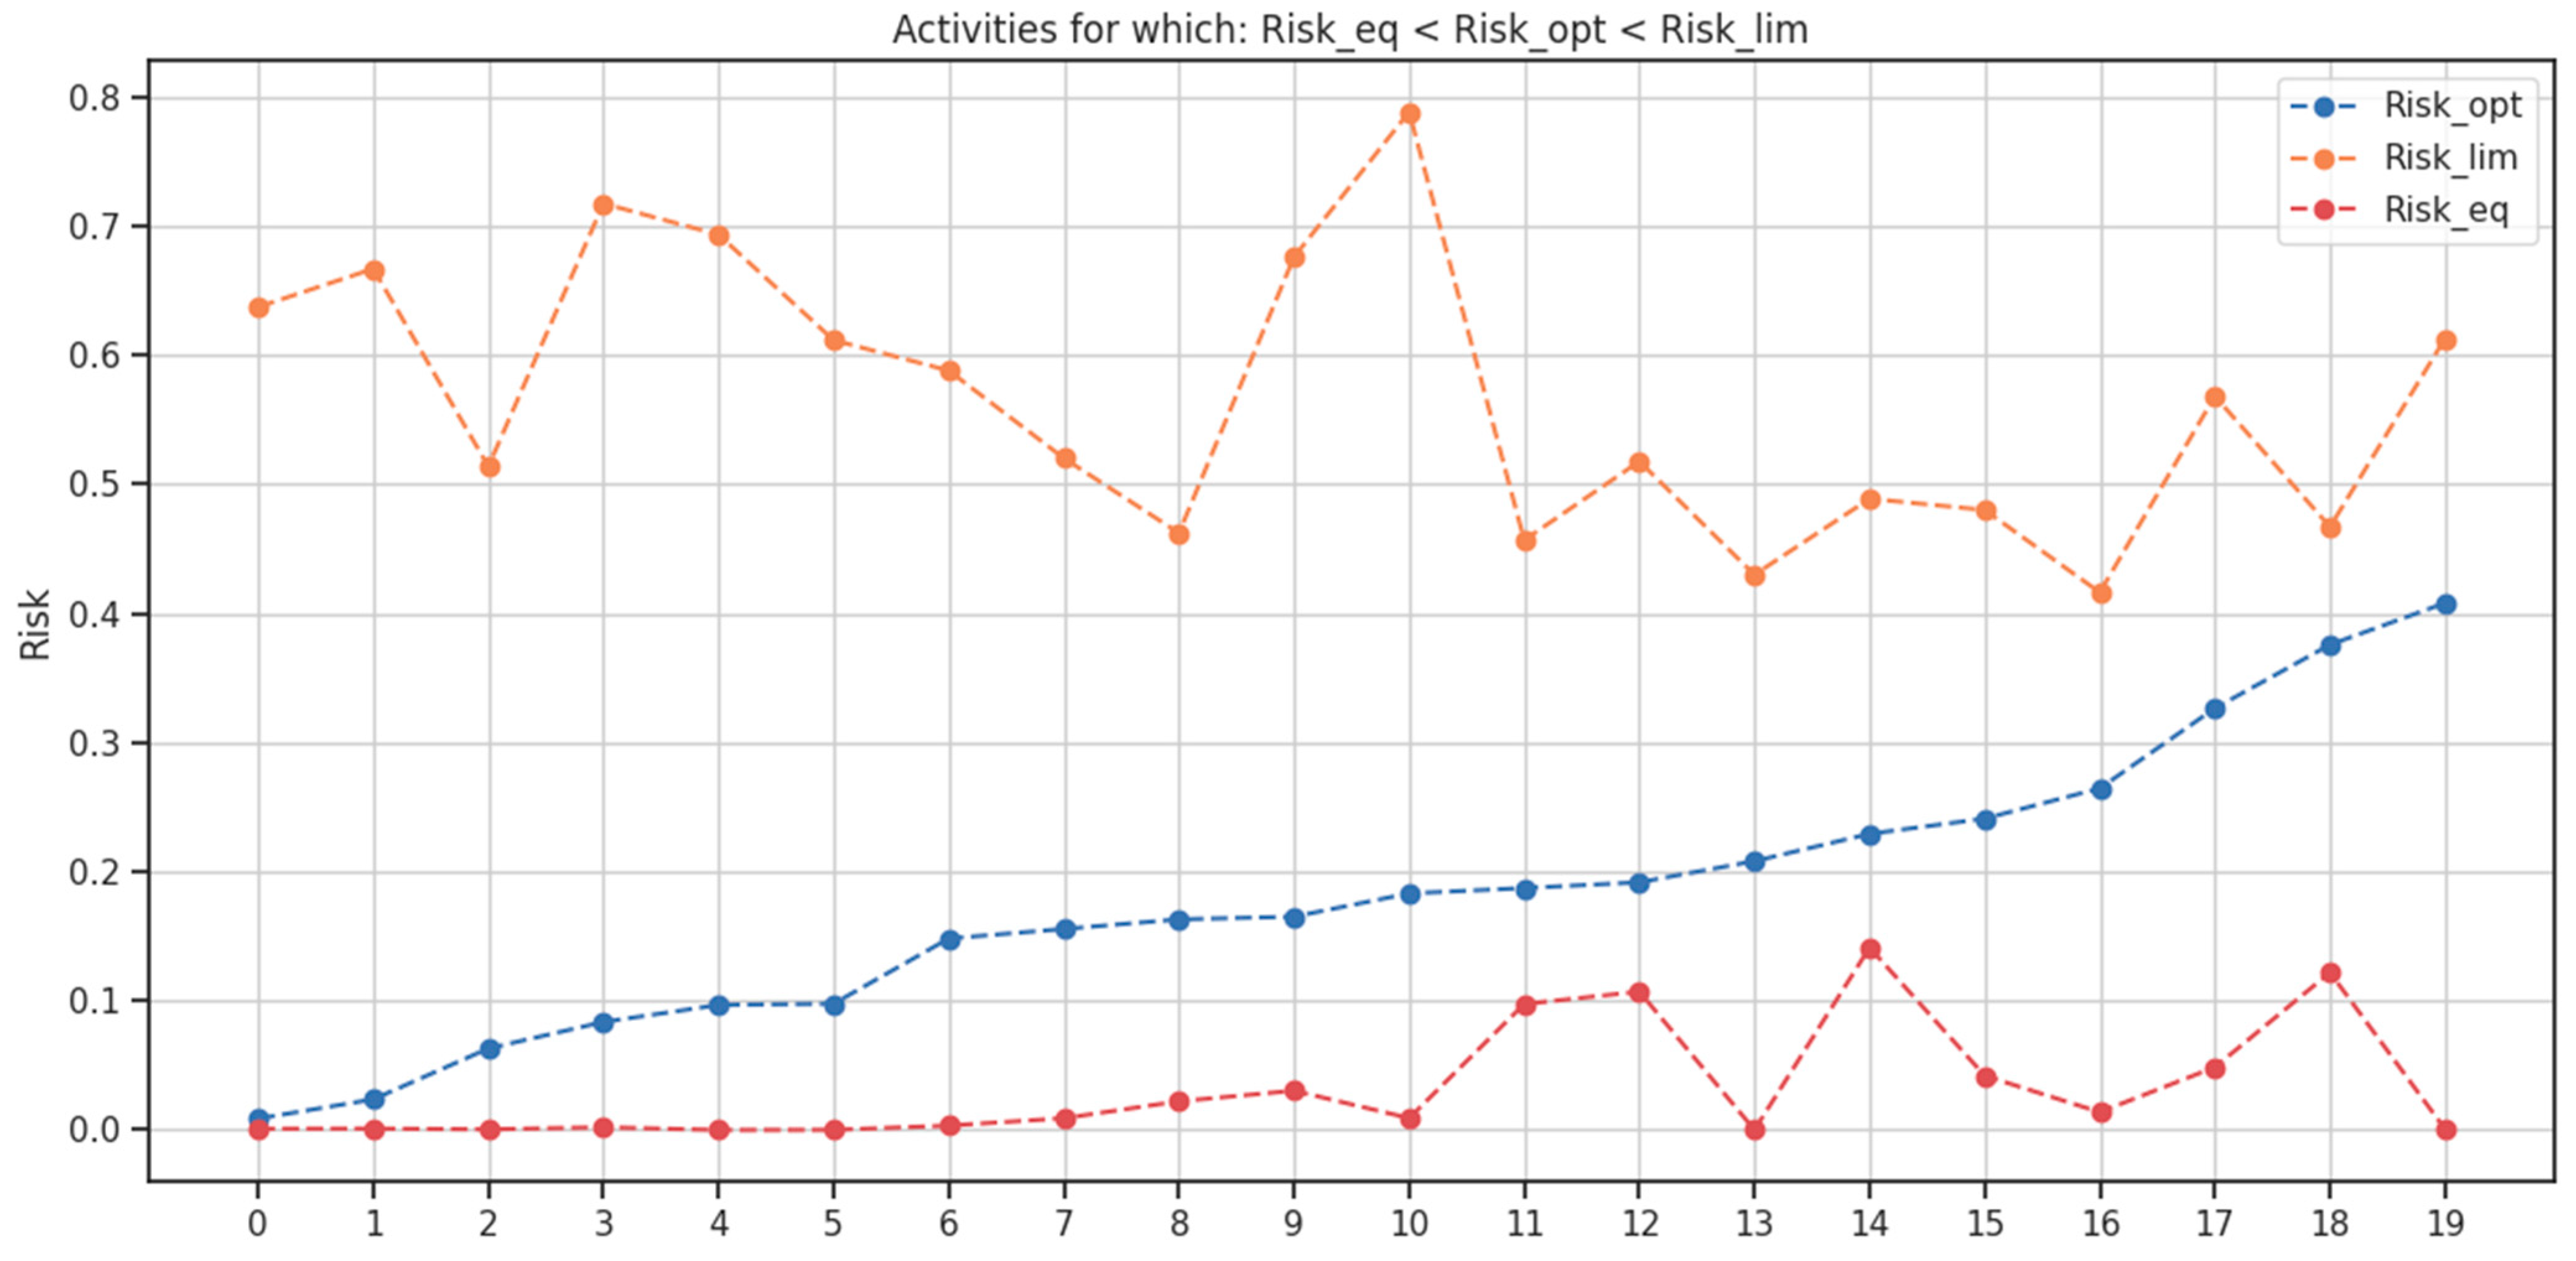
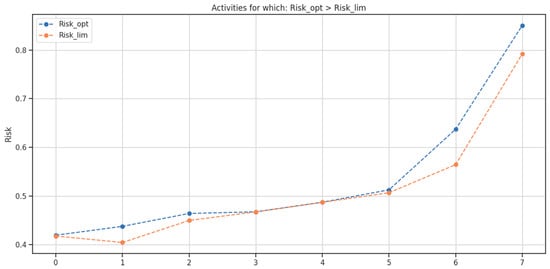
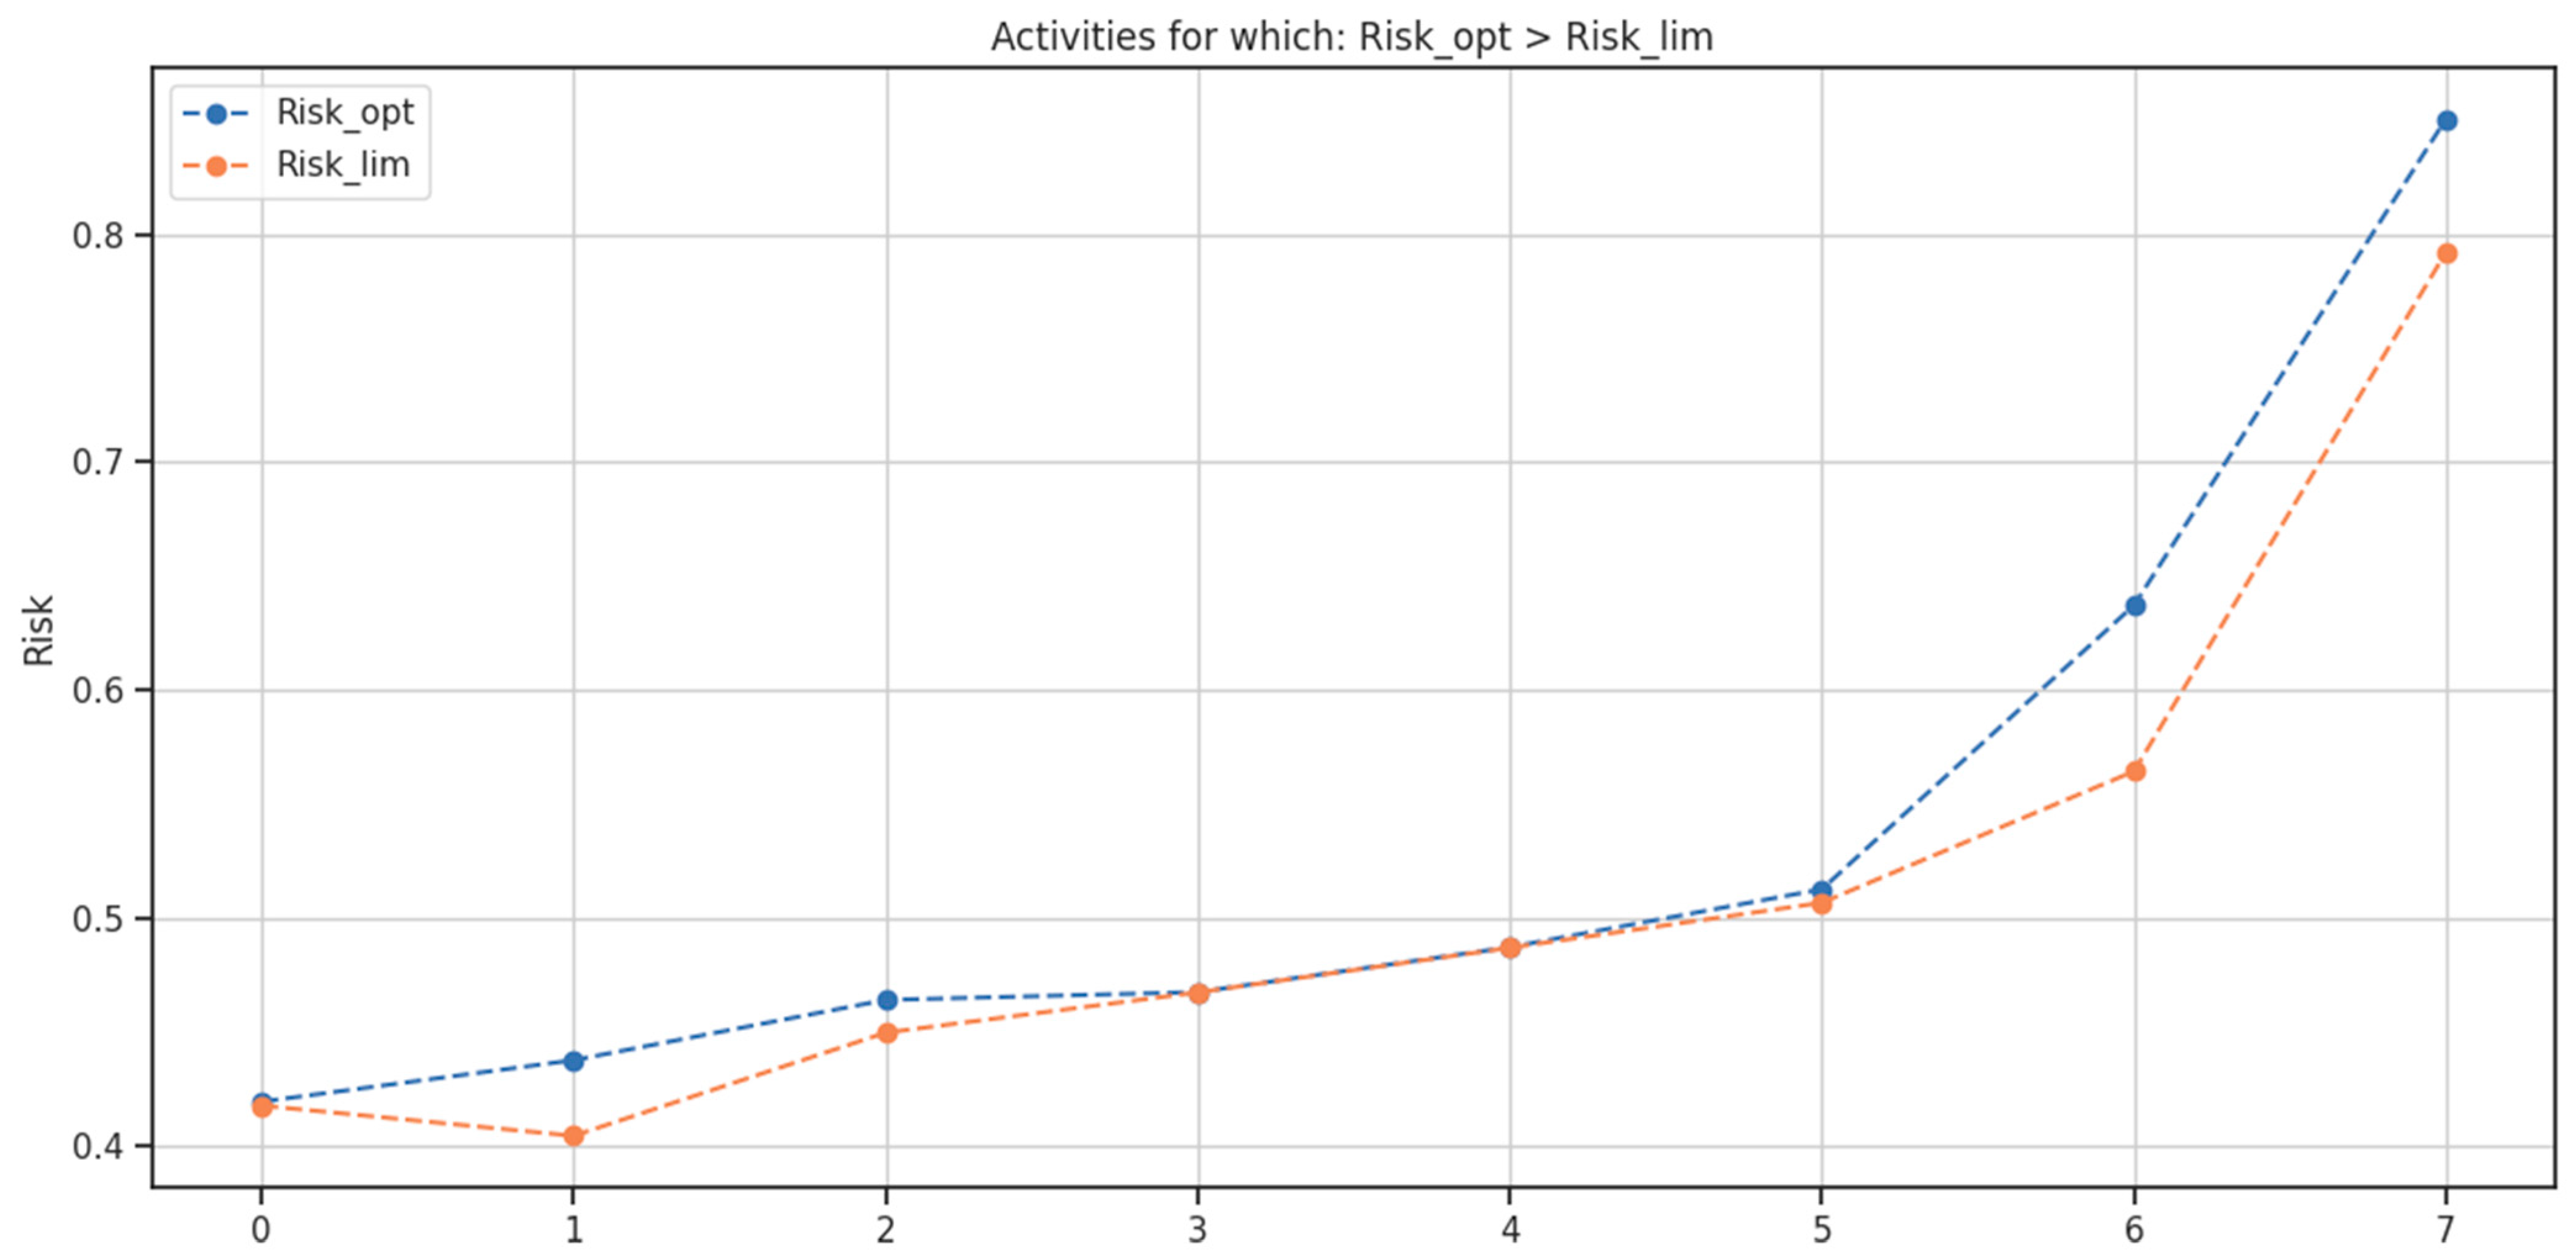
Figure 8 depicts cases where the optimal solution lies between the risk limit and the risk equivalent, while Figure 9 shows cases in which the optimal risk exceeds the risk limit. It is noteworthy that, in this latter scenario, the optimal risk remains very close to the risk limit. As theoretically explained, any risk exceeding the risk limit yields the same effect in terms of budgeted cost (which is always zero), making it unnecessary to assign a value of risk higher than the risk limit.
Figure 8.
Only the activities for which the optimal risk is in between the risk limit and the equivalent risk are considered and displayed as points. The optimal risk for each activity is determined based on the distribution that minimizes the total budgeted cost.
Figure 9.
Only the activities for which the optimal risk is higher than the risk limit are considered and displayed as points. The y-axis represents the risk level, showing that the optimal risk for all displayed activities is close to the risk limit, as theorized in Figure 3 (grey dot).
The results presented here were obtained by imposing only the optimization conditions described in Methodology; no additional constraints were introduced to steer the outcomes. Consequently, the resulting optimal risks are not exactly zero in the first case, nor exactly equal to the risk limit in the third case. These deviations arise from minor numerical imprecisions of the optimization solver, which are negligible and can be reduced to any desired degree of accuracy by adjusting the solver parameters, at the cost of increased computational time. Therefore, the results demonstrate the robustness of the approach and its consistency with the underlying theoretical framework.
Overall, the present case study illustrates that the applied optimization methodology provides a systematic means to prioritize the most cost-effective interventions, thereby enabling measurable savings without compromising the predefined assurance level.
6. Discussion and Conclusions
The present study introduced a methodology based on the EMV for automating and optimizing resource allocation in the budgeting of quality-related risks in construction projects. The findings of the present study are consistent with previous research advocating risk-based and probabilistic approaches to contingency estimation in construction projects [37,47,48]. In particular, while prior studies have demonstrated the advantages of Monte Carlo simulation and EMV-based methods for improving cost predictability [9,10], they generally adopt a uniform confidence percentile across activities. The results of this study extend that stream of research by showing that differentiating exceedance probabilities at activity level, and aggregating them through a weighted project-level indicator, can further enhance cost efficiency. Moreover, the observed savings align with the broader literature on Cost of Quality and preventive investment strategies [17,21], which emphasizes that a structured allocation of quality-related expenditures can reduce overall failure costs. In this sense, the proposed TAR-based optimization framework operationalises these theoretical principles within a project-wide, quantitative decision-support model.
The application of the proposed framework demonstrated its potential as an advancement over the traditional EMV methodology, even in the case of probabilistic assessment of the monetary value of risks. The incremental advance over standard probabilistic EMV lies in the formal integration of differentiated activity-level assurance levels into a single optimization problem, rather than the ex-post comparison of independently selected percentiles. In fact, traditional probabilistic EMV methodology assumes a single exceedance probability for activities that may, in reality, have markedly different impacts on quality and construction performance in the event of cost overruns. By automatically managing varying risk levels across different activities, the framework enables a more efficient allocation of financial resources, thereby preventing cost overruns and eventually, as demonstrated in the case study, minimizing the overall budget dedicated to risk mitigation. Furthermore, the results obtained were consistent with the theoretical premises, thus confirming the internal coherence and robustness of the proposed approach.
The proposed method represents an evolution of the classical probabilistic EMV approach, in which the inputs are treated as random variables and the result is computed using Monte Carlo simulations. As an extension of the probabilistic EMV framework, the proposed method inherits its fundamental limitation: it assumes that the uncertainty associated with all input variables is purely aleatory in nature. It is well established that the uncertainty associated with a phenomenon can be mathematically described either as aleatory uncertainty, when it arises from intrinsic variability in the phenomenon itself, or as epistemic uncertainty, when it results from a lack of knowledge about the phenomenon. In the proposed method, as in nearly all EMV applications employing MC simulations, both types of uncertainty are represented using random variables. However, it has been demonstrated that modelling epistemic uncertainty as a random variable is conceptually incorrect and can lead to a significant underestimation of the uncertainty in the calculated result [53], in this case the EMV of each individual project activity and, consequently, the EMV of the entire project. Overcoming this limitation, which the proposed method inherits from the traditional probabilistic EMV approach, represents one of the most desirable directions for future developments of the method.
The case study showed that the method could allow for a potential cost reduction of 18.4% in comparison with current practices. Nonetheless, the extent of these savings may vary depending on the probability of non-conformance and the associated error costs of the activities considered. Beyond the cost reduction, the proposed process has also demonstrated its added value as a novel more comprehensive tracking metric, enabling the evaluation of assurance levels on rework activities. It should be noted that the contingency budget identified by the model represents a financial reserve derived from the selected exceedance probabilities and is not assumed to be fully expended. Actual expenditure depends on the realized occurrence of non-conformities.
In practical applications, additional managerial constraints may be introduced to prevent unrealistic recommendations. For instance, minimum monitoring requirements may be imposed for safety-critical activities, or upper bounds may be set on admissible exceedance probabilities. The optimization framework can incorporate such constraints without altering its theoretical structure.
The estimated savings presented in this study were derived solely from the quantification of direct economic costs of rework. Intangible costs (such as the loss of trust, reputational damage, or reduced stakeholder confidence) were not directly incorporated into the analysis. These factors require separate evaluation; however, the methodology can be extended to account for them by assigning each rework activity an additional penalty cost reflecting the expected intangible impacts, so to favour the direct control risk management measure.
It is important to note that the simulations were conducted using synthetic data. In practical applications, collecting the necessary data to implement the methodology may pose significant challenges, particularly for organizations without established systems for tracking rework activities. Moreover, the assumption of triangular distributions to approximate rework costs, while simplifying calculations, may introduce inaccuracies compared to actual cost distributions. The use of real-world data would therefore enable the representation of more realistic cost probability distributions.
In conclusion, the proposed method constitutes an advancement of the classical EMV approach for assessing project risks associated with work quality. By introducing a novel key performance indicator (KPI), it enables a more effective optimization of risk distribution across different activities and, consequently, a more efficient allocation of resources within the risk budgeting process. Despite the limitations discussed above, the application of the method to a case study has demonstrated its potential to reduce the overall level of quality-related risk in a project and to generate cost savings in risk budgeting when compared with the traditional implementation of the EMV methodology.
Author Contributions
M.A. and C.T. were responsible for the conceptualization and development of the proposed method. F.R.C. provided critical discussion, supervision, and validation of the methodological framework. M.A. and C.T. designed and executed the case study. All authors contributed substantially to the preparation of the manuscript and participated in its critical revision and final editing. All authors have read and agreed to the published version of the manuscript.
Funding
This research received no external funding.
Data Availability Statement
The data presented in this study are available on request from the corresponding author.
Acknowledgments
The authors acknowledge the use of an AI-based language tool to improve the grammar and readability of the manuscript. The scientific content and conclusions remain the sole responsibility of the authors.
Conflicts of Interest
The authors declare no conflicts of interest.
Abbreviations
The following abbreviations are used in this manuscript:
| QA/QC | Quality Assurance and Quality Control |
| KPI | Key Performance Indicator |
| TAR | Total Assurance on Reworks |
| EMV | Expected Monetary Value |
| TQM | Total Quality Management |
| PMS | Project Management Success |
| CoQ | Cost of Quality |
| CoQA | Cost of Quality Analysis |
| ERA | Estimating using Risk Analysis |
| MCS | Monte Carlo Simulation |
| MC | Monte Carlo |
| CDF | Cumulative Distribution Function |
| Probability Distribution Function | |
| VaR | Value at Risk |
| CVaR | Conditional Value at Risk |
| MultiCMA | Multiple Covariance Matrix Adaptation algorithm |
| CMA | Covariance Matrix Adaptation algorithm |
References
- Ebid, A.M.; Ammar, T.; Mahdi, I.; Hegazy, H. Evaluating the Planning Efficiency for Repetitive Construction Projects Using Monte Carlo Simulation Technique. Sci. Rep. 2025, 15, 27520. [Google Scholar] [CrossRef] [Scilit]
- Garcés, G.; Forcael, E.; Osorio, C.; Castañeda, K.; Sánchez, O. Systematic Review of Lean Construction: An Approach to Sustainability and Efficiency in Construction Management. J. Infrastruct. Preserv. Resil. 2025, 6, 6. [Google Scholar] [CrossRef] [Scilit]
- Abdelalim, A.M.; Salem, M.; Salem, M.; Al-Adwani, M.; Tantawy, M. An Analysis of Factors Contributing to Cost Overruns in the Global Construction Industry. Buildings 2024, 15, 18. [Google Scholar] [CrossRef] [Scilit]
- Alsehaimi, A.; Waqar, A.; abd El Aal, A.; Hayat, S.; Ahmed Waris, F.; Benjeddou, O. Optimising Construction Sector Performance: A Study of the Rapidly Growing Global Drone Industry Using Smart PLS Approach. J. Eng. Res. 2025, 13, 2159–2170. [Google Scholar] [CrossRef] [Scilit]
- Dandago, A.A.; Yamusa, M.A.; Lawal, H.S.; Abubakar, M.; Abdullahi, M.; Zailani, B.M. Impact of Uncertainty Factors on the Performance of Building Renovation Projects. J. Eng. Des. Technol. 2025, 23, 1875–1897. [Google Scholar] [CrossRef] [Scilit]
- Jian, F.; Liu, Q.; Feng, C.; Hu, Q.; Yu, Q.; Guo, Q. Critical Factors Affecting Construction Labor Productivity: A Systematic Review and Meta-Analysis. Buildings 2025, 15, 2463. [Google Scholar] [CrossRef] [Scilit]
- Hampson, K. Effect of Quality Supervision on Rework in the Indonesian Context. Asia Pac. Build. Constr. Manag. J. 2001, 6, 2–6. [Google Scholar]
- Starczyk-Kołbyk, A.; Jędras, I. Integrated Risk Assessment in Construction Contracts: Comparative Evaluation of Risk Matrix and Monte Carlo Simulation on a High-Rise Office Building Project. Appl. Sci. 2025, 15, 9371. [Google Scholar] [CrossRef] [Scilit]
- Capone, C.; Narbaev, T. Estimation of Risk Contingency Budget in Projects Using Machine Learning. IFAC-PapersOnLine 2022, 55, 3238–3243. [Google Scholar] [CrossRef] [Scilit]
- Kwak, Y.H.; Ingall, L. Exploring Monte Carlo Simulation Applications for Project Management. Risk Manag. 2007, 9, 44–57. [Google Scholar] [CrossRef] [Scilit]
- Hadad, Y.; Keren, B. Risk–Response Budgeting: A Financial Optimization Approach to Project Risk Management. J. Risk Financ. Manag. 2025, 18, 160. [Google Scholar] [CrossRef] [Scilit]
- Love, P.E.D.; Matthews, J. Quality, Requisite Imagination and Resilience: Managing Risk and Uncertainty in Construction. Reliab. Eng. Syst. Saf. 2020, 204, 107172. [Google Scholar] [CrossRef] [Scilit]
- Meredith, J.; Zwikael, O. When Is a Project Successful? IEEE Eng. Manag. Rev. 2019, 47, 127–134. [Google Scholar] [CrossRef] [Scilit]
- Julca-Varas, C.; García-Segura, T.; Torres-Machi, C.; Montalbán-Domingo, L. Primary Risks for Delays and Cost Overruns in the Construction of Drinking Water Supply and Sanitation Projects in Peru. J. Manag. Eng. 2025, 41, 04025008. [Google Scholar] [CrossRef] [Scilit]
- Rashed, A.; Othman, M. Implementing Quality Management in Construction Projects. In Proceedings of the 2015 International Conference on Industrial Engineering and Operations Management (IEOM); IEEE: New York, NY, USA, 2015; pp. 1–5. [Google Scholar]
- Yu, A.G.; Flett, P.D.; Bowers, J.A. Developing a Value-Centred Proposal for Assessing Project Success. Int. J. Proj. Manag. 2005, 23, 428–436. [Google Scholar] [CrossRef] [Scilit]
- Abdelsalam, H.M.E.; Gad, M.M. Cost of Quality in Dubai: An Analytical Case Study of Residential Construction Projects. Int. J. Proj. Manag. 2009, 27, 501–511. [Google Scholar] [CrossRef] [Scilit]
- Feigenbaum, A.V. The Criticality of Quality and the Need to Measure It. Financier 1990, 14, 33–36. [Google Scholar]
- Cauchick Miguel, P.A.; Pontel, S. Assessing Quality Costs of External Failures (Warranty Claims). Int. J. Qual. Reliab. Manag. 2004, 21, 309–318. [Google Scholar] [CrossRef] [Scilit]
- Schiffauerova, A.; Thomson, V. Managing Cost of Quality: Insight into Industry Practice. TQM Mag. 2006, 18, 542–550. [Google Scholar] [CrossRef] [Scilit]
- Juran, J.; Godfrey, A.B. Juran’s Quality Handbook; McGraw-Hill: Columbus, OH, USA, 1999. [Google Scholar]
- Crosby, P.B. Quality Is Free-If You Understand It. Winter Park Public Libr. Hist. Arch. Collect. 1979, 4, 1–4. [Google Scholar]
- Eke, G.; Elgy, J.; Wedawatta, G. Establishing a Link between Contractor Selection Strategy and Project Outcomes: Simulation Study. J. Constr. Eng. Manag. 2019, 145, 04019062. [Google Scholar] [CrossRef] [Scilit]
- Feigenbaum, A.V. Total Quality Control. N. Y. 1991, 12. [Google Scholar]
- Project Management Institute. A Guide to the Project Management Body of Knowledge (PMBOK® Guide), 7th ed.; Project Management Institute: Newtown Square, PA, USA, 2021. [Google Scholar]
- Hillson, D. Managing Risk in Projects; Routledge: London, UK, 2024. [Google Scholar]
- Almarzooqi, S.; Alkamali, W.; El Khatib, M.; Talib, M.; Alteneiji, R. Project Quality and Project Risk Management: Correlations and Interdependencies. Int. J. Bus. Anal. Secur. 2023, 3, 137–153. [Google Scholar] [CrossRef] [Scilit]
- Can, H.; Bin Abdul Latiff, A.R. Strategic Alignment of Risk Management and Corporate Governance: Boosting Manufacturing Performance. J. Digit. Realism Mastery 2024, 3, 109–127. [Google Scholar] [CrossRef] [Scilit]
- Otali, M.; Odesola, I. Effectiveness Evaluation of Contingency Sum as a Risk Management Tool for Construction Projects in Niger Delta, Nigeria. Ethiop. J. Environ. Stud. Manag. 2014, 7, 588. [Google Scholar] [CrossRef] [Scilit]
- Baccarini, D. Estimating Project Cost Contingency—A Model and Exploration of Research Questions. In Proceedings of the 20th Annual ARCOM Conference, Scotland, UK, 1–3 September 2004; Volume 1. [Google Scholar]
- Thompson, P.A.; Perry, J.G. Engineering Construction Risks: A Guide to Project Risk Analysis and Assessment Implications for Project Clients and Project Managers; Thomas Telford: London, UK, 1992. [Google Scholar]
- Heinze, K. Cost Management of Capital Projects; Routledge: Oxfordshire, UK, 2017. [Google Scholar]
- Newton, S. Methods of Analysing Risk Exposure in the Cost Estimates of High Quality Offices. Constr. Manag. Econ. 1992, 10, 431–449. [Google Scholar] [CrossRef] [Scilit]
- Yeo, K.T. Risks, Classification of Estimates, and Contingency Management. J. Manag. Eng. 1990, 6, 458–470. [Google Scholar] [CrossRef] [Scilit]
- Hartman, F.T. Don’t Park Your Brain Outside (Book Review). Proj. Manag. J. 2000, 31. [Google Scholar]
- Moselhi, O. Risk Assessment and Contingency Estimating. In Proceedings of the AACE International Transactions of the Annual Meeting, Dallas, TX, USA, 13–16 July 1997. [Google Scholar]
- Raz, T.; Michael, E. Use and Benefits of Tools for Project Risk Management. Int. J. Proj. Manag. 2001, 19, 9–17. [Google Scholar] [CrossRef] [Scilit]
- Diekmann, J.; Featherman, D.; Moody, R.; Molenaar, K.; Rodriguez-Guy, M. Project Cost Risk Analysis Using Influence Diagrams. Proj. Manag. J. 1996, 27, 23–30. [Google Scholar]
- Janjić, A.; Stanković, M.; Velimirović, L. Multi-Criteria Influence Diagrams—A Tool for the Sequential Group Risk Assessment. In Studies in Big Data; Springer: Berlin/Heidelberg, Germany, 2015; Volume 10. [Google Scholar]
- Sedki, K.; Polet, P.; Vanderhaegen, F. Using the BCD Model for Risk Analysis: An Influence Diagram Based Approach. Eng. Appl. Artif. Intell. 2013, 26, 2172–2183. [Google Scholar] [CrossRef] [Scilit]
- Tamimi, S.; Dickman, J.; Bauman, R. Risk Analysis Using Influence Diagrams. In Proceedings of the First International Symposium on Uncertainty Modeling and Analysis; IEEE Computer Society Press: Washington, DC, USA, 1990; pp. 348–353. [Google Scholar]
- Boholm, M. Risk and Quantification: A Linguistic Study. Risk Anal. 2019, 39, 1243–1261. [Google Scholar] [CrossRef] [Scilit]
- Islam, M.S.; Nepal, M.P.; Skitmore, M.; Drogemuller, R. Risk Induced Contingency Cost Modeling for Power Plant Projects. Autom. Constr. 2021, 123, 103519. [Google Scholar] [CrossRef] [Scilit]
- Jezzini, Y.; Assaad, R.H.; El-adaway, I.H. Risk Allocation Model for Price Escalations in Construction Projects: Integrating Bargaining Game Theory and Probabilistic Bayesian Modeling. J. Constr. Eng. Manag. 2025, 151, 04025134. [Google Scholar] [CrossRef] [Scilit]
- Salah, A.; Moselhi, O. Contingency Modelling for Construction Projects Using Fuzzy-Set Theory. Eng. Constr. Archit. Manag. 2015, 22, 214–241. [Google Scholar] [CrossRef] [Scilit]
- Thal, A.E.; Cook, J.J.; White, E.D. Estimation of Cost Contingency for Air Force Construction Projects. J. Constr. Eng. Manag. 2010, 136, 1181–1188. [Google Scholar] [CrossRef] [Scilit]
- Touran, A. Calculation of Contingency in Construction Projects. IEEE Trans. Eng. Manag. 2003, 50, 135–140. [Google Scholar] [CrossRef] [Scilit]
- Mak, S.; Picken, D. Using Risk Analysis to Determine Construction Project Contingencies. J. Constr. Eng. Manag. 2000, 126, 130–136. [Google Scholar] [CrossRef] [Scilit]
- Perez Perez, J.E. Moresa: Confronting Risks in a Highly Uncertain Environment. Emerald Emerg. Mark. Case Stud. 2022, 12, 1–26. [Google Scholar] [CrossRef] [Scilit]
- Shrivastava, N.K. A Model to Develop and Use Risk Contingency Reserve; PMI® Global Congress 2014—North America; Project Management Institute: Phoenix, AZ, USA; Newtown Square, PA, USA, 2014. [Google Scholar]
- Taroun, A. Towards a Better Modelling and Assessment of Construction Risk: Insights from a Literature Review. Int. J. Proj. Manag. 2014, 32, 101–115. [Google Scholar] [CrossRef] [Scilit]
- Mooney, C. Monte Carlo Simulation; SAGE Publications, Inc.: Thousand Oaks, CA, USA, 1997. [Google Scholar]
- Curto, D.; Acebes, F.; González-Varona, J.M.; Poza, D. Impact of Aleatoric, Stochastic and Epistemic Uncertainties on Project Cost Contingency Reserves. Int. J. Prod. Econ. 2022, 253, 108626. [Google Scholar] [CrossRef] [Scilit]
- Graves, R. Open and Closed: The Monte Carlo Model. PM Netw. 2001, 15, 48–52. [Google Scholar]
- Eldosouky, I.A.; Ibrahim, A.H.; Mohammed, H.E.-D. Management of Construction Cost Contingency Covering Upside and Downside Risks. Alex. Eng. J. 2014, 53, 863–881. [Google Scholar] [CrossRef] [Scilit]
- Kwon, H.; Kang, C.W. Improving Project Budget Estimation Accuracy and Precision by Analyzing Reserves for Both Identified and Unidentified Risks. Proj. Manag. J. 2019, 50, 86–100. [Google Scholar] [CrossRef] [Scilit]
- Traynor, B.A.; Mahmoodian, M. Time and Cost Contingency Management Using Monte Carlo Simulation. Aust. J. Civ. Eng. 2019, 17, 11–18. [Google Scholar] [CrossRef] [Scilit]
- Shahtaheri, M.; Haas, C.T.; Rashedi, R. Applying Very Large Scale Integration Reliability Theory for Understanding the Impacts of Type II Risks on Megaprojects. J. Manag. Eng. 2017, 33, 04017003. [Google Scholar] [CrossRef] [Scilit]
- Rockafellar, R.T.; Uryasev, S. Optimization of Conditional Value-at-Risk. J. Risk 2000, 2, 21–41. [Google Scholar] [CrossRef] [Scilit]
- Kala, Z. Quantification of Model Uncertainty Based on Variance and Entropy of Bernoulli Distribution. Mathematics 2022, 10, 3980. [Google Scholar] [CrossRef] [Scilit]
- Yu, Y.; Yang, L.; Shen, Y. Bernoulli–Gaussian Model with Model Parameter Estimation. J. Surv. Eng. 2024, 150, 04024012. [Google Scholar] [CrossRef] [Scilit]
- Astana, N.Y.; Sudarsana, D.K.; Frederika, A.; Sanjaya, P.A. Development of a Quantitative Scale for the Impact of Quality Risk on Construction Projects. In International Conference on Rehabilitation and Maintenance in Civil Engineering; Springer Nature: Singapore, 2025; pp. 371–378. [Google Scholar]
- Välkki, I.A.; Lenk, K.; Mikkonen, J.E.; Kapucu, F.E.; Hyttinen, J.A.K. Network-Wide Adaptive Burst Detection Depicts Neuronal Activity with Improved Accuracy. Front. Comput. Neurosci. 2017, 11, 40. [Google Scholar] [CrossRef] [Scilit]
Disclaimer/Publisher’s Note: The statements, opinions and data contained in all publications are solely those of the individual author(s) and contributor(s) and not of MDPI and/or the editor(s). MDPI and/or the editor(s) disclaim responsibility for any injury to people or property resulting from any ideas, methods, instructions or products referred to in the content. |
© 2026 by the authors. Licensee MDPI, Basel, Switzerland. This article is an open access article distributed under the terms and conditions of the Creative Commons Attribution (CC BY) license.