


Abstract
This research examines high-rise hotel buildings located on the Mediterranean coast, focusing on the advantages, in terms of energy consumption and environmental benefits of installing domestic hot water (DHW) storage tanks on upper technical floors instead of in the basement. To this end, the Bali Hotel, the tallest hotel in Europe, is analyzed as a case study. The proposed system achieves a substantial reduction in energy consumption by decreasing heat losses in DHW recirculation pipes (61.3%). Annual energy costs are reduced by €8976.89, corresponding to overall DHW energy savings of 3.69%. In addition, installation costs are reduced by €15,462.18 due to the shorter recirculation pipe lengths required, which must withstand very high pressures exceeding 6 kp/cm2, reaching up to 18 kp/cm2. Although the initial installation cost is €15,462.18 lower, the elevated placement of the tanks increases maintenance and replacement costs. Therefore, after a 50-year service life, total construction and maintenance costs are €17,366.82 higher. This additional cost is recovered within 1.93 years, yielding cumulative savings of €527,106 over the building’s lifespan. Finally, the study quantifies the associated environmental benefits, demonstrating an annual reduction of 24,335.03 kg CO2eq in carbon emissions, a novel contribution to the existing literature on this topic.
1. Introduction
Projections by leading organizations and experts indicate that global primary energy consumption will increase by approximately 32% between 2017 and 2040 [1]. Within this context, the building sector represents a major share of energy demand: buildings account for up to 32% of total final energy consumption in certain countries, while in some developed nations the construction sector consumes as much as 40% of total energy use [2]. The construction sector also has a significant environmental impact, being responsible for approximately 30% of global greenhouse gas emissions [3] and 40% of global energy consumption [4].
Therefore, improving the energy efficiency of buildings has become a global priority, with particular emphasis on heating, ventilation, and air-conditioning (HVAC) systems, domestic hot water (DHW) production, lighting, and other auxiliary equipment as key pathways to reducing building energy consumption (BEC) [5]. Domestic hot water (DHW) production accounts for an average of 14% to 30% of residential energy consumption worldwide, and in some developed countries, nearly one-quarter of energy is spent on DHW production.
Due to the inherent complexity of buildings and their construction, operation, management, maintenance, etc., the field of Building Energy Conservation (BEC) integrates knowledge from multiple disciplines, such as materials science, computer science, management science, engineering technology, and environmental science. Some technicians have introduced numerous innovations, such as radiant systems based on capillary tube networks [6], the construction of green façades [7], the application of various technologies in façades [8] and phase change materials (PCM) [9,10], the replacement of windows and ventilation systems with heat recovery and insulation of exterior walls [11,12], and the improvement of control systems [13]. Undoubtedly, one of the most significant developments in the scientific field of DHW is the pursuit of smart buildings and digital twins through the monitoring of multiple parameters and the large-scale processing of building data [14,15,16]. These approaches are increasingly applied to energy management systems, including DHW distribution networks and recirculation pumps [17,18], as well as to advanced simulations using state-of-the-art tools and technologies such as TRNSYS [19] and photovoltaic (PV) systems [20]. Other authors focus their research on the development of innovative models such as MAT-Adapt, which combines a multi-agent transformer with a parallel adapter module to address the dynamic participation in the energy management of multi-energy, multi-building virtual power plants (MB-ME-VPPs). This approach enhances adaptability during the dynamically varying global building energy consumption phase and represents a promising direction for the aggregation and coordinated control of flexible resources distributed across multi-energy buildings [21].
In addition, rapid urban population growth over recent decades has intensified the demand for high-rise buildings (HRBs). C. Z. Li et al. conducted a comprehensive study of the technologies currently implemented to achieve energy savings in high-rise buildings [22]. Allouhi et al. comprehensively outlined the key factors influencing BEC, including architectural design, geographic location, climate conditions, demographic and socioeconomic characteristics, occupant behavior, the development of energy-saving measures, and advances in science and technology [23]. Du et al. quantified the influence of building physical characteristics, service systems, user behavior, income level, attitudes, and energy-related education on energy consumption in high-rise buildings in Hong Kong [24]. P. Steadman’s research indicates that high-rise buildings consume approximately 2.5 times more electricity and emit twice as much carbon as low-rise buildings due to higher natural gas and electricity use, with gas consumption increasing by around 40% [25]. Therefore, the implementation of energy-efficient design strategies in high-rise buildings is of great importance, particularly in the context of densification—a negative factor in terms of efficiency—which is growing rapidly on a global scale [26]. As an example, J. Ordóñez et al. designed a two-stage cascade TeHP analysis system (comprising an air-to-water and a water-to-water unit) for DHW production systems that meets Nearly Zero-Energy Building (nZEB) and PH standards [27]. Their system achieve a very low heating demand of 18.88 kWh/m2 per year and an average COP in January of 1.56 for the air–water unit and almost 4 for the water–water unit, with potential performance improvements of approximately 10% in warm climates.
In some locations, especially those oriented toward coastal tourism, high-rise hotels have often been developed. Energy consumption and environmental impacts are particularly relevant in this specific building typology. It should also be noted, as highlighted by E. Fuentes et al. [28], that the existing literature on DHW systems in non-residential buildings remains limited. Bohdanowicz and Martinac [29] employed a multiple regression analysis to investigate the factors influencing hotel energy consumption, demonstrating that, in addition to architectural design characteristics and building age, energy use is strongly associated with hotel operational characteristics, thereby increasing the complexity of energy analysis. Furthermore, J. Zhang et al. proposed a methodology for determining predictive models of energy consumption in high-rise hotels in Guangzhou using machine learning algorithms [30].
There are numerous fields in which research is being conducted to improve the energy efficiency of domestic hot water (DHW) production in buildings and to reduce associated environmental impacts. Among the most successful approaches are systems that produce thermal stratification in DHW tanks. In transcritical cycles, achieving optimal performance requires keeping the inlet temperature of the secondary fluid to the gas cooler as low as possible; in the case of DHW production, a large temperature increase can be achieved with a high COP, provided that the temperature of the water entering the gas cooler is low. The water tank must promote stratification, for example, by connecting multiple tanks in series or by installing cold water inlet diffusers at strategic points [31,32]. Pump speed is typically regulated to control the mass flow rate and maintain the outlet water temperature at the design temperature, thus preserving stratification. The cold water supply from the mains is usually introduced at the bottom of the storage tank. Initial results show that, in DHW mode, the unit’s efficiency is higher; field experience highlights the importance of properly designing the entire hydraulic system to promote stratification and convey cold water to the heat pump, such as in a CO2 geothermal heat pump system [33]. The use of passive systems [34] and renewable energies, such as photovoltaic panels (PV) [35], are also demonstrating excellent results. J. Liu et al. analyze the technical and economic feasibility of four typical renewable energy application scenarios for supplying electricity to a high-rise residential building in Hong Kong [36]. Their experiments are carried out with a PV battery system with energy management strategies aimed at maximizing self-consumption and operating hours, an energy management strategy using TRNSYS modeling. The results showed an average air-conditioning load of 43.99 kWh/m2 and an average DHW load of approximately 46.51 kWh/m2, indicating that hot water demand is comparable to cooling demand. These findings are consistent with those presented by Wan et al., according to which the average annual electricity consumption values for air conditioning and hot water in standard public rental housing blocks in Hong Kong are 40–45 kWh/m2 and 41–50 kWh/m2, respectively [37]. A.H. Shah et al. [38] and S. K. Pathak [39] combine photovoltaic panels with phase change materials (PCMs) for building energy supply and DHW production.
1.1. Insulation of DHW Pipes
Enhancing insulation standards in building envelopes can bring the hot water load to approximately 50% of total heat energy demand [40]. Thus, measures aimed at improving the efficiency of hot water use by minimizing heat loss can contribute significantly to reducing the energy consumption of buildings. Although natural gas boilers remain widely used in many countries, several governments are committed to reducing carbon emissions. Consequently, fossil-fuel-based heating and DHW installations [41] are being replaced by air-to-water heat pumps. Barquin shows that, across the EU, heat pumps must replace existing fossil fuel boilers at a rate of approximately 3 million installations per year, compared to the current 500,000 for new homes, if the 2050 targets are to be met [42].
Thermal insulation is also essential to minimize heat losses rates from hot water pipes [43]. The cooling rate is related to the amount of insulation used in the pipes [44]. The Energy Saving Trust reports that “during the summer months, the average efficiency of heat supplied to taps is only 38%, and much lower when little DHW is used (between 13% and 65%)” [45]. Haines [46] investigated the role of user satisfaction in terms of hot water supply, concluding that the rapid hot water availability is essential to prevent user dissatisfaction, especially in hotel settings. Gabrielaitiene [47] and van der Heijde [48] examined delays in hot water delivery following flow initiation, employing an enhanced model that includes the heat transfer coefficient from the water to the pipe. In hotel buildings, ensuring prompt delivery of DHW to taps is therefore essential, not only to maintain user comfort but also to meet sanitary requirements, such as the prevention of Legionella growth.
1.2. Importance of DHW Recirculation Systems
The main technique for avoiding delays in the arrival of DHW is the use of recirculation systems, which keep pipes hot at all times [49]. Benakopoulos [50] analyzes DHW recirculation systems in apartment buildings in Denmark and Poland, which reported circulation-related heat losses of up to 70%. Eatherton [51] described typical pumped recirculation systems in hotels and apartment complexes, noting that hydraulic erosion–corrosion can be a problem unless the system is carefully balanced to prevent excessive water velocities. Hamburg [52] quantified heat losses from DHW circulation pipes in multi-occupant apartment buildings and correlated his data with pipe length and floor area. Marini et al. [53] developed a MATLAB-based model to calculate hot water heat losses in the UK, finding that 80% of heat losses occurred during no-flow periods, as pipes cooled down after water use. Their analysis indicated that pipe insulation would reduce heat losses by 45%.
Recirculation systems are highly effective in combating the risk of Legionella in hotels. Preheating systems provide the necessary resilience of DHW systems for buildings that operate 24 h a day, such as hotels. In doing so, the electrical system can support the entire installation while maintaining the solar thermal system. Such system segregation also facilitates Legionella control strategies. The solution of periodically increasing the storage tank temperatures will minimize the risk of Legionella in the DHW system [54]. Bower [55] mentions the advantages of continuous water flow in preventing bacterial accumulation, as well as keeping temperatures high enough to inactivate Legionella. Bédard studied the adaptation of Legionella pneumophila to copper and temperature in a hospital, identifying strains capable of surviving at temperatures as high as 55 °C [56]. Periodic pasteurization is necessary, as are cooling towers (CTs) used to dissipate excess heat from water through evaporation, with significant energy savings. They are commonly used in large facilities such as hospitals, commercial buildings, and hotels, requiring special cleaning and maintenance techniques [57].
Recirculation systems designed without detailed modeling tend to use oversized pumps [58,59,60], leading to excessive electrical energy consumption and increasing the dissipation of heat energy from the water. Simulation tools are needed to accurately calculate heat transfer between supply and return flows required in order to determine the optimal recirculation flow rate. Conventional 2D and 3D CFD codes, such as Fluent and StarCCM+, would require large meshes to accurately model the flow and heat transfer within long, small-diameter pipes. However, as pointed out by R.W. Moss and R.E. Critoph, heat transfer within pipes can be reliably modeled using simple Nusselt number correlations; instead of a detailed Navier–Stokes solution, such as that used in CFD codes, unnecessary in the context of domestic heating system design [61]. Steady-state simulations for 15 mm pipes with 75 mm diameter insulation subjected to a 1 h draw-off cycle show that heat losses from a recirculation system would be approximately 27% greater than those from an equivalent single-pipe configuration [61]. Calculations based on a 2 h cycle for a 15 m long pipe show that a local heat storage solution would require a daily average of 48 W, whereas the recirculation alternative would incur heat losses of 53 W, yet these losses be efficiently recovered using a heat pump, requiring only an additional 18 W of electrical input, i.e., 30 W less than that required for the local storage system.
2. Objectives
Despite the extensive body of literature, limited attention has been given to quantifying the energy savings that return networks entail, the resulting reductions in carbon footprint and environmental impacts, and the payback periods for investments made through these return networks [62]. Nor has this been done specifically in high-rise hotels, where the arrangement of elevated DHW tanks a priori improves the performance of return networks by reducing pipe heat losses. This study aims to quantify these heat losses while simultaneously reducing the waiting time for hot water delivery at hotel taps by analyzing two project and management models: the location of DHW storage tanks on the ground floor or in the basement versus their location in elevated technical rooms. This quantification, in addition to those that will be carried out for environmental impacts, will enable reliable determination of the payback periods for investments and demonstrate the benefits of DHW tank layout, thereby addressing a significant gap in the literature on high-rise hotels.
The adoption of systems with elevated DHW storage tanks located in technical rooms in high-rise buildings appears, a priori, to be a more efficient solution, mainly due to the reduction in the length of the DHW return networks. However, this configuration requires a minimum DHW consumption that necessitates the adoption of storage systems and is therefore typically suitable for buildings with specific usage patterns, such as hotels. In the case, e.g., of tourist and residential buildings, which are commonly found along the Levante coast, this condition is generally not met, as DHW production systems would be based on individual, instantaneous electric water heaters rather than centralized DHW storage systems. Moreover, it should be noted that the installation of elevated storage tanks in technical rooms necessitates the placement of boilers on the ground floor and intermediate or upper levels, along with vertical primary circuits rising to the technical rooms, as well as plate heat exchangers, circulation pumps, etc., which entail an additional installation cost.
Another relevant aspect is the effect on the structural design, calculation, and construction solutions to resolve the impact of the loads transmitted by the DHW storage tanks. These loads imply, a priori, the need for additional structural reinforcements, leading to increased material costs and technical modifications that may affect the rest of the building.
Within this framework, the research focuses on comparing two possible DHW system configurations for a high-rise hotel building:
HIT-1. DHW storage tanks located in the basement. Primary circuits from the boilers with short runs and a height difference of between 1 and 4 m maximum.
HIT-2. DHW storage tank arrangement system on elevated technical floors. Primary circuits from the boilers with long pipe runs and significant height differences. This configuration corresponds to the actual installation or type implemented in the hotel since its construction.
The objectives of the research focus on the following aspects and parameters:
- Quantification of energy consumption due to DHW in both systems over a full year.
- Quantification in both systems of energy consumption derived from DHW recirculation and the resulting environmental impacts.
- Estimation of the implementation costs of the DHW installations for both systems.
- Assessment of the structural cost overrun due to the placement of the DHW storage tanks on elevated technical floors.
- Comparison of the energy efficiency of both systems, including the resulting environmental impacts, and the payback periods for the required investments.
Given the difficulty of defining mathematical models capable of accurately determining the magnitude of energy savings and reduction in environmental impacts associated with DHW storage tank systems located in elevated technical rooms, the first step of this study is to quantify these parameters through a case study. Accordingly, the most relevant parameters will be determined through comparative analysis, and general rules can be presented to support decision-making during the project phase.
3. Description of the Case Study
The Gran Bali Hotel is a 186 m tall, 53-story skyscraper hotel located in Benidorm, in the province of Alicante (Spain) (Figure 1). Opened on 17 May 2002, it became and remains the tallest hotel in Europe. At the same time, it was the tallest building in Spain after surpassing Torre Picasso in Madrid, a distinction it held until November 2006, when it was surpassed by Torre Emperador in Madrid. The hotel is a four-star establishment comprising a total of 53 floors (51 above ground and two basements levels); of these, four floors are technical floors and elevator machine rooms, one floor is a duplex floor that accommodates two superior suites, one serves as a viewing floor, and the remaining floors are used for guest rooms and mezzanines, with a total of 440 rooms (Table 1). The material cost of the project was nearly €90 million. Construction began in June 1988, with a budget of approximately 2 billion pesetas (€12 million). The structural works were completed ten years later, while interior fit-out and decoration of the rooms were carried out until 2002. The current hotel complex is divided into two buildings:
- -
- The original 19-story Bali Hotel, which has been in existence since 1973, containing 378 rooms.
- -
- A 53-story skyscraper built between 1988 and 2002, located 20 m from the old building, with a large lobby connecting the two (Figure 1), containing 440 rooms.
Figure 1.
View of the Bali Hotel from the southeast.
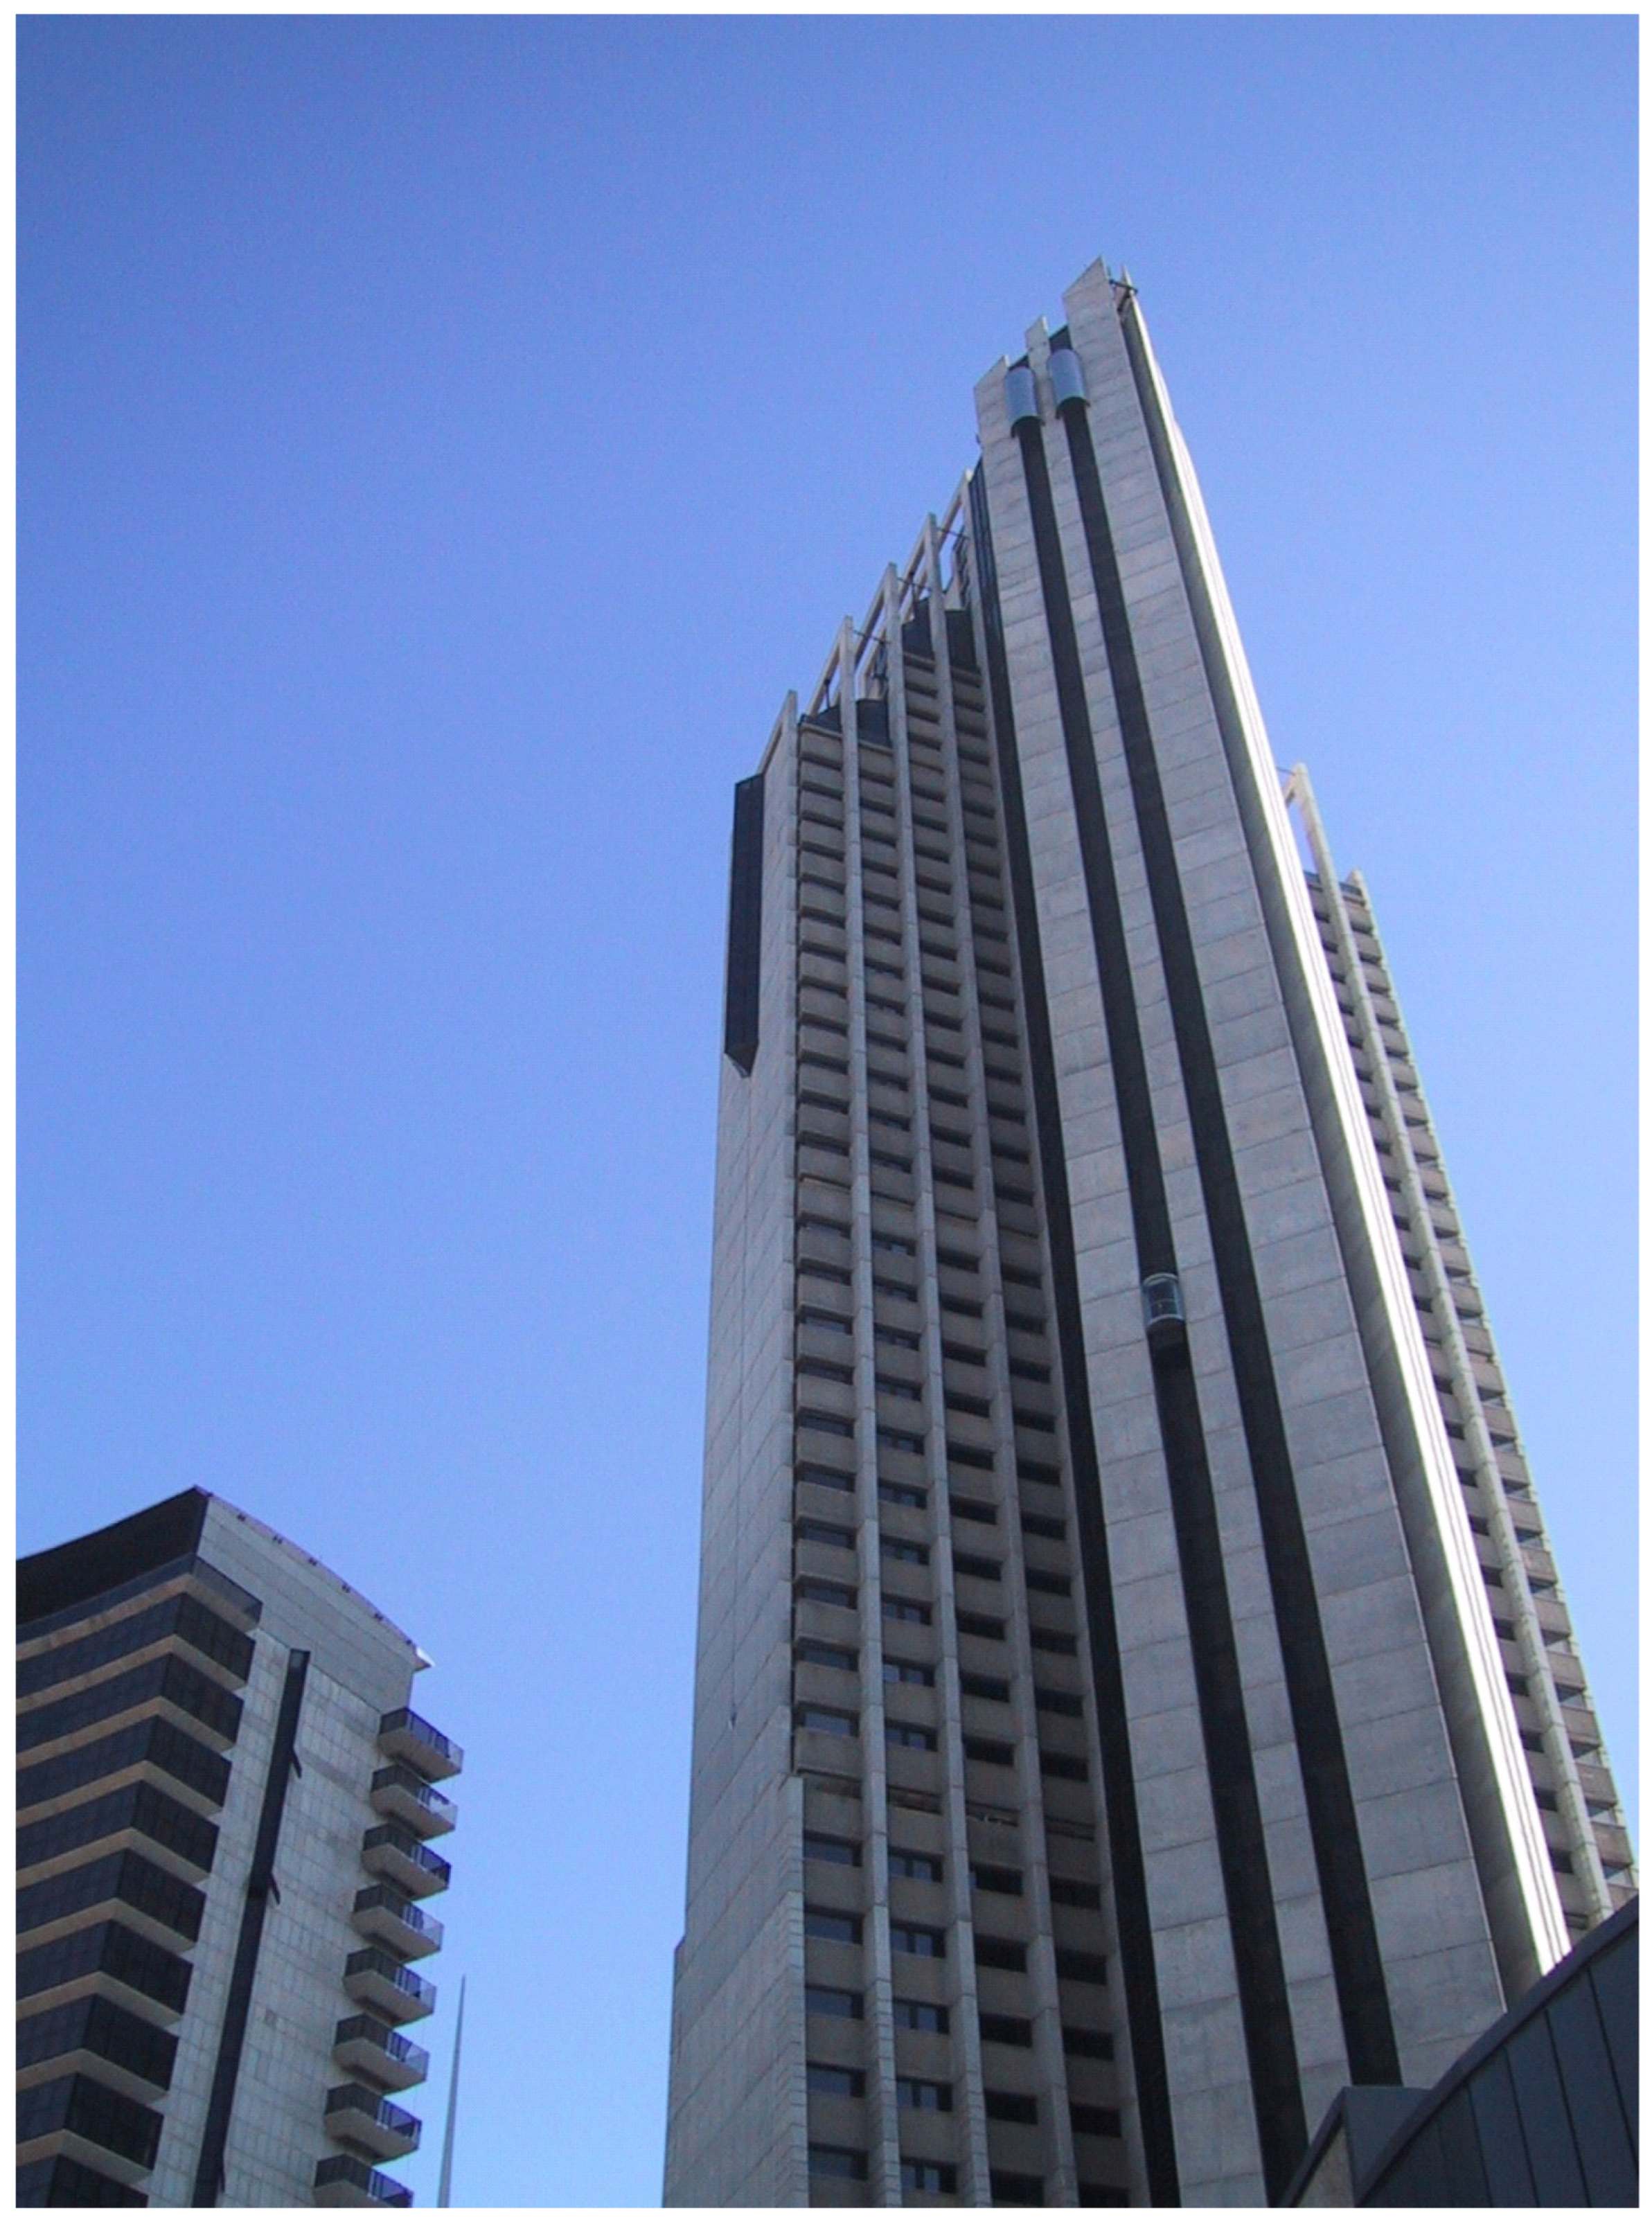
Table 1.
Building information.
Between the two buildings, the hotel complex comprises a total of 818 guest rooms. The complex’s DHW facilities are currently located in the first basement of the skyscraper, from which DHW is distributed to both the new and the existing buildings. The system includes 14 tanks, each with a capacity of 5000 L at 60 °C, making a total storage volume of 70,000 L. DHW is produced by four natural gas boilers located on the first basement floor and storage tanks located on the first basement floor and three elevated technical floors: 13th, 26th, and 39th (highlighted in red in Figure 2). This is the actual installation adopted in the hotel since its construction. The hotel is equipped with advanced safety and monitoring systems designed to prevent and mitigate emergencies: fire-resistant construction materials, automatically opening windows for smoke extraction, fire doors that close automatically to limit fire spread, and a centralized computerized device capable of alerting technicians without human intervention. In addition, the top two floors (52nd and 53rd) house two elevated water tanks dedicated to fire protection.
Figure 2.
3D view of the Bali Hotel from the southeast.
3.1. Description of the System with All DHW Accumulators in the Basement (HIT-1)
The HIT-1 system is designed, following standard practice for similar building types, with all the DHW storage tanks located on the first basement floor level (Figure 3). The system comprises four natural gas boilers, each with a capacity of 450 kW, also installed on the first basement floor. Their primary circuits are connected in pairs, feeding a common supply manifold and a general return manifold. From these manifolds, four closed supply circuits, each equipped with its respective circulation pumps, are distributed to plate heat exchangers. These closed circuits, which are short in length and also located on the first basement floor, contain a three-way valve prior to connection to the exchanger, allowing the boiler outlet water at 90 °C to be directed either to the exchanger or to the general return manifold.
Figure 3.
Schematic diagram of the HIT-1 installation. All DHW tanks in the basement.
This solution, proposed as an alternative to the existing system or HIT-2, has been chosen with the following design guidelines:
- DHW storage capacity. The number of DHW storage tanks remains unchanged throughout the building, i.e., 14 tanks of 500 L of DHW each.
- Service conditions. The criteria used to determine the required DHW storage volume remain unchanged, as the same level of service is provided to the hotel’s 818 rooms, regardless of the system implemented.
- Primary and secondary circuits. The system contains primary circuits connecting the boilers to two common supply and return manifolds, from which four closed primary circuits branch off to four plate heat exchangers, and from these, secondary circuits supply heat for the 5000 L of stored water at 60 °C. All this equipment is located in the first basement level.
- DHW distribution risers. Four DHW distribution risers ascend to the distribution floors, serving groups of floors similar to those in the existing HIT-2 system, thus maintaining the same simultaneous calculation flow rates. The pressures are 6 kp/cm2, 8 kp/cm2, 12 kp/cm2, and 18 kp/cm2.
- DHW return circuits. The DHW return circuits originate at storage tanks and ascend to the upper floors following the same zoning and design approach adopted for the HIT-2 case. There are four circuits, which initially ascend to floors 12, 13, 26, and 39. On the latter three floors, these circuits branch into a set of six vertical risers that ascend to floors 25, 38, and 52. This configuration is similar to HIT-1.
Beyond the many conceptual differences between the HIT-1 and HIT-2 systems, it is important to note that the HIT-1 contains an additional closed circuit for each of the three riser pipes (RP) (HIT RP-2, RP-3, and RP-4), including dedicated circulation pumps, plate heat exchangers, expansion vessels, required valves, etc. This entails additional installation costs, as well as the resulting maintenance costs and energy consumption of the added circulation pumps.
In the HIT-2, three of the four DHW risers extend over the full height of the building to the technical floors at levels 13, 26, and 39. These risers are sized with large pipe diameters due to the simultaneous flow rates required to guarantee at least 65% simultaneous consumption in bathtubs, resulting in significant additional costs. In the case of three of the risers, the PPR pipes are substantially longer than those in HIT-1. In addition, at the beginning of these pipes, the thickness of the PPR pipe must be much greater due to the high water pressures they must withstand, which further contributes to higher costs. In particular, riser pipe RP-4 operates at a pressure of 18 kp/cm2 at the start of its route, requiring PPR piping with a minimum SDR 6 classification, corresponding to the pipe thickness of approximately 15 mm along the entire length.
3.2. Description of the DHW Production System with Tanks in Elevated Technical Plants (HIT-2)
The layout of the DHW installation equipment currently in place at the hotel is shown in Figure 4. As in the HIT-1, it consists of a set of four natural gas boilers, each with a capacity of 450 kW, located on the first basement floor. The boilers’ primary circuits are connected in pairs and supply the plate heat exchangers in the same manner as described in HIT-1.
Figure 4.
Schematic diagram of the HIT-2 installation. DHW tanks in elevated technical floors.
From these heat exchangers, a number of secondary closed circuits extend from the basement to each technical floors, where eight of the 14 DHW storage tanks are installed. The distribution of DHW storage tanks throughout the skyscraper is as follows:
- Six DHW storage tanks, each with a capacity of 5000 L on the first basement floor (Figure 5); total: 30,000 L.
- Three DHW storage tanks of 5000 L each on the 13th floor; total: 15,000 L.
- Three DHW storage tanks of 5000 L each on the 26th floor (Figure 6); total: 15,000 L.
- Two DHW storage tanks of 5000 L each on the 39th floor; total: 10,000 L.
Figure 5.
Appearance of the DHW storage tanks in the basement.
Figure 6.
Appearance of the DHW storage tanks in technical plant no. 26.
Through these closed ascending circuits, heat is transferred to a second heat plate exchanger located in each technical plant, from which the DHW in the elevated storage tanks is heated via a secondary circuit (Figure 6). In accordance with the legionella prevention standard [63], the storage temperature is maintained at 60 °C, with a temperature above 50 °C at the furthest point of the DHW return or recirculation network. This hot water recirculation circuit allows the water to be delivered to the taps at the required temperature. The recirculation pump is activated only during specific periods of the day, based on the experience of the hotel manager [33].
From these DHW storage tanks, DHW is distributed at 60 °C to blocks, each serving approximately 12 floors: basement floor 12; floors 14–25; floors 27–38; and floors 40–52. At the sanitary fixtures, cold water is mixed with the domestic hot water to deliver a comfortable outlet temperature of approximately 45 °C. A return or recirculation network runs in parallel to the DHW distribution block system described above, each equipped with six riser pipes, ensuring the water does not present a risk of Legionella contamination. This configuration guarantees that the service temperature remains above 50 °C at the furthest point of the network. Figure 7 and Figure 8 illustrate the significant differences between the return networks of the two systems.
Figure 7.
Detail of HIT-2: elevated tanks, intermediate circuit exchanger, and return network.
Figure 8.
Detail of HIT-1: basement tanks, primary circuit heat exchangers, and return networks.
All components of the installation are well organized and adequately spaced within the technical rooms: plate heat exchangers, recirculation circuits, expansion tanks, intermediate-circuit circulation pumps, water recirculation pumps, etc. (Figure 9).
Figure 9.
Appearance of the plate heat exchangers, expansion tank, and return network in technical floor no 26.
4. Methodology
In this article, in order to achieve the objectives described above, a methodology is applied that combines the energy losses in DHW pipes, covering both distribution and return networks, as well as the energy consumption associated with pumps operating in domestic hot water (DHW) recirculation networks, with an evaluation of the costs of carrying out the capital and maintenance costs over a 50-year period. This approach enables the evaluation of the payback periods for the economic investments associated with the two scenarios, HIT-1 and HIT-2.
4.1. Heat Losses in DHW Pipes
The following section outlines the methodology used to calculate heat losses in water pipes. This methodology is also applied to estimate the DHW recirculation flow rate required to maintain the DHW circuit at the appropriate temperature and to ensure compliance with Royal Decree 487/2022, of June 21, which establishes the health requirements for the prevention and control of Legionellosis [63].
Two hypotheses are to be considered for the calculation. First, the pipes are modeled as cylindrical elements consisting of two layers: the pipe wall itself and the thermal insulation shell. Second, the outer surface of the insulation is in contact with the interior air, or the exterior air in the case of pipes passing through technical plants. Figure 10 illustrates a typical pipe cross-section:
Figure 10.
Typical PPR pipe cross-section, with thermal insulation and aluminum sheet finish.
The calculation begins by determining the thermal resistance of each section using the following expression:
where
r1 is the inner radius of the pipe (m).
r2 is the outer radius of the pipe, which coincides with the inner radius of the insulation (m).
r3 represents the outer radius of the insulation (m).
hint is the convection-radiation coefficient of the internal wall (inner surface in contact with water), with a value of 300 W/m2·K.
hext is the convection-radiation at the external wall surface (outer surface exposed to air), with a value of 25 W/m2·K.
et is the thickness of the pipe wall (m).
ea is the thickness of the insulation (m).
λt is the thermal conductivity of the pipe material (W/m·K).
λa is the thermal conductivity of the insulation (W/m·K).
For the thermal resistance calculations in Equation (1), the convection coefficients at the internal water wall () and at the external air wall () have been estimated based on engineering experience, as their analytical calculation involves significant complexity. Experimental studies enable numerical values of these parameters to be obtained for specific operating conditions, after which empirical correlations can be selected to represent the results obtained [64]. In addition, variable flow regimes and transient conditions arising from demand fluctuations have not been considered. Although recent studies indicate that geometric and flow parameters can substantially influence heat transfer performance [65], in the present case, characterized by low-velocity water flow and predominantly linear, water-filled sections, the calculation of the internal thermal resistance has been appropriately simplified.
Once the thermal resistance of each section has been determined, the total heat loss q or heat exchanged between the insulated pipe and the surrounding air per unit time can be calculated as follows:
where q is expressed in W, and
θm is the average temperature of the fluid inside the pipe (°C).
θamb is the average temperature of the air surrounding the pipe (°C).
Ri is the thermal resistance of the ith section of pipe (m·K/W).
Li is the length of the ith pipe section (m).
Considering that the average temperature of the fluid does not vary and that the ambient temperature is uniform throughout the entire length of the pipe, the temperature difference can be subtracted from the sum.
4.2. Calculation of DHW Recirculation Flow Rate
The heat lost by the pipe is transferred by the water circulating inside it. To determine the DHW recirculation flow rate required to compensate for a given heat loss, the heat lost by the pipe, calculated as described in the previous section, is equated to the heat exchanged by a given liquid flow rate Q (m3/s), depending on its density ρ (kg/m3), specific heat Ce (kJ/kg·K), and temperature difference Δθ (ºC).
The thermal power absorbed or transferred by a water flow undergoing a temperature change is expressed as
Solving for the water flow rate in the pipe results in
When the International System of Units is used, the flow rate is obtained in m3/s. If the density is expressed in kg/dm3, the resulting flow rate is given in L/s.
Energy Consumption of Circulating Pumps
Circulating pumps must overcome the pressure losses experienced by the water as it circulates through the various closed circuits, as well as giving the water a speed of approximately 1.6–2 m/s. Without a doubt, the most accurate formula for hydraulic calculations is that of Darcy–Weisbach, which is also the most suitable for thermal fluid installations. This is the formula that will be used in this study:
The thermal power absorbed or transferred by a water flow undergoing a temperature change is expressed as
Depending on the water flow rate in the closed circuits, the resulting expression is
h is the head loss or energy loss (m)
f is the friction coefficient (dimensionless)
L is the pipe length (m)
D is the internal diameter of the pipe (m)
v is the average velocity (m/s)
g is the acceleration due to gravity (m/)
Q is the flow rate (/s)
The material characteristics of the conduit and its condition are key factors governing the resistance encountered by the fluid and, consequently, the resulting pressure losses. In addition to surface roughness, the Darcy friction factor f plays a critical role in the Darcy–Weisbach equation, which has motivated the development of numerous empirical correlations and graphical methods for its determination. In the present study, friction factor values were adopted from the Pressman database [66].
Based on the calculated head loss, the pump power requirement is obtained from the following expression:
P is the pump power (W)
Q is the water flow rate (L/s)
H is the head loss or manometric height due to friction (mca)
ρ is the density of water (kg/m3)
g is the acceleration due to gravity (m/s2) or gravitational force N/kg
ƞ is the pump efficiency (between 0.85 and 0.90)
Finally, the annual energy consumption of the pumps was estimated based on experimental data obtained from three daily recirculation cycles.
4.3. Calculation of the Costs of Structural Reinforcement
Subsequently, the structural reinforcements required in the technical floors for the installation of the storage tanks in scenario HIT-2 are quantified, together with their structural sizing based on structural calculations and the corresponding execution costs.
4.3.1. Basis of Structural Design
The structure was designed for a nominal service life of 50 years, in accordance with CTE DB-SE (structural safety) [67], CE-21 (Spanish Structural Code) [68], and Eurocode EN 1990 [69]. The structural system of the Gran Hotel Bali consists primarily of reinforced concrete vertical structural walls and floor slabs, forming a high-rise load-bearing system suitable for tall buildings.
The structural concrete is classified as HA-30, in accordance with the Spanish Structural Code (Código Estructural), and is designed for exposure classes XC3 and XS1, corresponding to interior conditions with moderate humidity in a marine environment affected by airborne chlorides. The concrete exhibits the following mechanical properties:
- Characteristic compressive strength fck = 30 MPa,
- Secant modulus of elasticity Ecm ≈ 31,700 MPa [70],
- Poisson’s ratio ν = 0.20,
- Coefficient of thermal expansion, α = 1.0 × 10⁻⁵ °C−1,
- The passive reinforcement used is B-500S steel,
- Characteristic yield strength, fyk = 500 MPa [70].
The actions applied to the structure have been determined in accordance with Eurocode 1: EN1991-1-1 (actions) [71], EN 1991-1-3 (snow) [72] and EN 1991-1-4 (wind) [73], and are classified as permanent and variable actions.
4.3.2. Method for Calculating Structural Reinforcements
The structural analysis was performed using matrix-based methods, applying the principles of linear elasticity and material resistance. The structural analysis was conducted using Autodesk Robot Structural Analysis Professional software (version 2026) [74], employing bar-type finite elements.
Structural safety verifications were performed for the Ultimate Limit States (ULS) and Serviceability Limit States (SLS), in accordance with the criteria of the Eurocodes. The dimensioning of all elements ensured overall stability, adequate mechanical strength, and satisfactory service behavior under the load combinations considered.
4.4. Calculation of the Costs of Executing the Works and Installations
The flow rates of the water distribution and recirculation within the return network are to be determined to subsequently define the required diameters of the PPR pipes for proper operation based on water velocity values of 1.5–2 m/s, and the required equipment (circulating pumps, expansion tanks, plate heat exchangers, 3-way valves, etc.). Thereafter, the execution costs of these installations along their entire length are to be determined for the two analyzed options, HIT-1 and HIT-2. For this purpose, the four riser pipes RP-1 to RP-4 are technically defined in their construction process, and the execution cost of each is quantified.
The amendments of all construction and structural elements are extracted from BIM models developed for both scenarios. Unit prices are reviewed and processed using TCQ software (version 6.2.221) [75], based on the ITeC database [76], and are additionally cross-checked against the official CYPE price database [77]. The original budgets corresponding to the HIT-1 case study, carried out in 2002, are used as a reference for the budget and accordingly updated in line with the evolution of construction costs in the country under study (Spain).
4.5. Investments Amortization Approach
The methodology for estimating the investment amortization period is based on the model shown in Figure 11.
Figure 11.
Methodology for energy assessment and investment amortization in the four scenarios analyzed.
The investment, recurring, and maintenance costs over a 50-year period is obtained from the results derived from Section 4.3. and 4.4., and various databases from companies operating in the sector in Barcelona. Once the costs associated with facilities, equipment, and structural reinforcements are determined, the maintenance costs over the 50-year service life can be calculated. These estimates will be based on sector-specific databases and on the experience acquired by the technicians responsible for hotel maintenance. Finally, the Life Cycle Cost (LCC) is applied to the two possible types of hotel facilities analyzed. To this end, this analysis is conducted in accordance with the UNE-EN 15459-1:2018 [78] standard, referring to the LCC, and applied in the two scenarios designed. The Overall Cost is calculated using expressions (8), (9), and (10):
where
Cg: Overall cost
Cl: Initial investment costs
Ca: Recurring costs
Rdisc: Discount rate
i: Years
Val: Residual value (€)
RR: Real interest rate
Ri: Inflation rate
Rint: Interest rate
The costs associated with energy consumption for DHW production over a 50-year period are calculated according to expressions (1), (2), (3), (4), (5), (6), and (7), adjusted based on ambient temperature estimates obtained from simulations conducted with DesignBuilder (version V7), and assuming a natural gas cost of €0.156/kWh and an electricity price of €0.2178 per kWh [79]. Given the volatility of energy prices and the continuous development of technologies such as aerothermal systems, a range of potential energy savings was defined instead of attempting a precise quantification. This range was established in relation to the investment costs associated with the different phases of the building’s life cycle assessment (LCA). Quantifying the overall costs of implementing structural reinforcements, energy consumption, and savings resulting from reduced PPR pipe lengths enables a comparative analysis of investment amortization under both scenarios.
4.6. Carbon Footprint and Other Environmental Impacts
The environmental impact assessment focuses on the operational phase of DHW systems, which represents the most relevant stage in terms of energy consumption and associated emissions for the configurations analyzed. Given the overall complexity of the system and in order to ensure a clear and robust comparison, the analysis is limited to selected operational-phase emissions, specifically carbon dioxide (CO2), sulfur dioxide (SO2), and nitrous oxide (N2O) [80]. The analysis is conducted considering the hotel’s nominal service life, estimated at 50 years, and is based on the current electricity mix. Emissions are exclusively associated with the energy required to compensate for thermal losses in the DHW systems, including losses in the primary, secondary, and intermediate heat transfer circuits (IHTCs), in the case of scenario HIT-2, as well as in the DHW recirculation return networks in both scenarios. Emission data are obtained from the LCDN database [81], which provides emission factors per unit of energy produced. Once the final energy consumption of scenarios HIT-1 and HIT-2 is determined, the corresponding annual emissions of CO2, SO2, and N2O during the use phase are calculated. In addition, primary energy consumption and aggregated emissions expressed in CO2 equivalent are estimated using the official IDAE conversion factors for the reference year considered [79]. The detailed values and resulting indicators are presented and discussed in the corresponding results section.
Regarding the environmental impact of the piping system and the structural reinforcement, the Global Warming Potential (GWP-total), expressed in kg CO2e, was calculated. The assessment was performed using One Click LCA software (version 2026) [82], based on Environmental Product Declarations (EPDs) from the International EPD System, Environdec [83], for construction products, using plant-specific manufacturing data, and third-party-verified according to ISO 14025 [84], with background processes modeled using the ecoinvent upstream database [85]. The results are reported by stage following the modular structure defined in EN 15804+A2 [86]. The mass of the PPR piping system was derived from the installed pipe lengths using the linear conversion factors (kg/m) provided in the Environmental Product Declaration of the REPOLEN multilayer piping system [87].
5. Results
5.1. Heat Losses in Pipes
The PPR pipe solution for DHW distribution, incorporating fiberglass insulation and an external aluminum sheet cladding as described above, leads to continuous heat energy losses over time—24 h a day, 365 days a year—along its entire length. Heat resistance is calculated according to expression (1), while the total heat loss is determined using expression (2). Therefore, the thermal conductivity values k listed below were adopted for this purpose; these values were obtained under controlled laboratory conditions at a temperature of 25 °C.
| PPR pipe | 0.233 W/m·K |
| Fiberglass thermal insulation | 0.035 W/m·K |
| 0.3 mm aluminum sheet | 209.3 W/m·K |
The values obtained for RT, depending on the diameter of these pipes and the thickness of the thermal insulation, range from 2.39 to 5.82 m°C/W. Correspondingly, the heat lost Q per linear meter of pipe ranges from 17.53 to 6.87 W/m. Table 2 presents the heat losses in each of the four DHW distribution risers for scenario HIT-1, i.e., with all storage tanks located on the ground floor. An initial clarification must be made regarding the calculation process presented below. According to several authors, the complexity of the parameters affecting the production, distribution, and recirculation of DHW in large-scale hotels can result in a standard deviation ranging from approximately 10% to 25%. These influencing factors include the uniqueness of the building and its operational characteristics, variations in DHW flow rates, recirculation schedules, discontinuities in pipe insulation and associated heat losses, occupancy rates, seasonal fluctuations (high and low seasons), and the usage habits of guests from different nationalities. In the present case, and in accordance with Kitzberger’s research, a standard deviation value of 13.64% has been adopted [49].
Table 2.
Calculation of heat transfer resistances, heat losses per linear meter of pipe, annual losses per riser, and system totals for HIT1.
This layout requires extensive DHW recirculation networks, with pipe lengths ranging from 48.9 to 190.8 m. As a result, significant heat losses occur along the distribution routes; for the four risers combined, the total pipe length reaches 520.9 m. These recirculation networks have a diameter of 26.2/30 mm and are insulated with 20 mm of thermal insulation thickness. Under these conditions, heat losses amount to 4555.89 W, representing an annual energy consumption of 39,909.60 kWh/year (calculated over a 24 h period for 365 days per year) and an annual operating cost of €6225.90, based on a natural gas energy cost of €0.156/kWh. The cost of distribution companies operating in the sector in the Valencian Community (Spain) [79] has been applied for this calculation. In addition, heat losses from the DHW distribution pipes reach 6338.17 W. Consequently, the total energy losses for the four DHW risers in scenario HIT-1 and their corresponding return networks amount to 10,894.06 W; this results in an annual energy consumption of 95,431.97 kWh/year and an estimated annual operating cost of €14,887.38.
Notably, the heat losses associated with the four return networks account for 41.82% of the total heat losses, a relatively high value attributable to the considerable distances of these networks, which are required to maintain DHW temperatures above 50 °C along their entire route for Legionella prevention [63].
We now analyze the results obtained for scenario HIT-2, with DHW storage tanks located in elevated technical plants. Under the same water distribution temperatures and simultaneous flow rates as in scenario HIT-1, the calculated thermal resistances and heat losses per linear meter remain similar. A minor difference arises from the absence of the 64/90 and 60/90 pipe sections at the beginning of the RP-3 and RP-4 risers, as the tanks are located in the elevated technical rooms. The heat loss Q per linear meter of pipe ranges from 13.05 to 6.57 W/m, which is lower than in scenario HIT-1. Moreover, the lengths of the distribution pipes are significantly reduced, resulting in significant savings in construction costs, as well as notable reductions in energy consumption and associated environmental impacts, as discussed in subsequent sections. Intermediate circuit networks are between primary and secondary circuits.
Table 3 shows the measurement results. The lengths of the DHW supply and distribution sections are reduced, ranging from 54.3 to 40.4 m for each RP-1 to RP-4. The return networks are drastically shortened, with lengths between 38.4 and 47.3 m, significantly lower than those observed in scenario HIT-1. In contrast, this layout introduces relatively long intermediate heat transfer circuits (IHTC), with a diameter of 26.2/30 mm, which are additional to those in scenario HIT-1 and result in new sources of heat loss. However, it should be noted that these losses are expected to be considerably lower than those associated with the HIT-1 return networks, since these circuits only operate after peak DHW demand periods, as they are limited to reheating the water in the storage tanks from the cold water inlet temperature of 15 °C to the storage set point temperature of 60 °C.
Table 3.
Calculation of heat transfer resistances, heat losses per meter of pipe, annual losses per riser and intermediate primary circuits, and total losses for the HIT-2 system.
The results are revealing. The intermediate primary circuits have limited impact on overall energy losses, as only three daily heating cycles of the DHW storage tanks are required. The associated heat losses amount to 864.27 W, corresponding to an annual energy consumption of 4677.31 kWh/y, which represents 12.66% of total heat losses. Heat losses along the four RP risers and their return networks are reduced to 4215.66 W, compared with 10,894.06 W in scenario HIT-1, corresponding to an annual energy consumption of 36,929.14 kWh/year and an annual cost of €5760.94. This leads to significant annual energy savings of 58,502.78 kWh/year and operating cost savings of €9126.43/year. Therefore, we conclude that scenario HIT-2 leads to significant energy savings of 61.30% in heat losses from the network ((95,431.97 kWh/year–36,929.14 kWh/year)/95,431.97 = 61.30%). This result is significant and strongly aligned with the European Energy Performance of Buildings Directive (EPBD) [88].
Certainly, when considered against the overall operating costs of the Bali Hotel, this may appear to be a relatively minor investment item. However, over the 50-year LCC period, the resulting savings would amount to €456,321.5, equivalent to approximately 0.5% of the total building costs, a remarkable figure and clearly indicates that, a priori, the selection of scenario HIT-2 is well justified. Nevertheless, the costs associated with the facility installations, required structural reinforcements, and long-term maintenance of the DHW networks still need to be assessed.
5.2. Energy Consumption of Recirculation Circuit Pumps
As shown in Figure 3 and Figure 4, the two DHW recirculation systems differ significantly in their configuration. In the case of HIT-1, the recirculation circuits are considerably longer, and the pipe diameter varies from PPR 65.4/90 to PPR 26.2/30 across the four risers. The design volumetric flow rate is 0.82 L/s, with water velocities ranging from 1.6 m/s to 0.36 m/s. The lowest velocity occurs in the initial section of the vertical risers, where the larger-diameter pipes extend between the lower floors, resulting in reduced flow velocity during recirculation.
Table 4 shows the calculated pressure losses for each section, based on expressions (5) and (6), together with the power ratings of the four circulating pumps in each circuit according to expression (7). The annual energy consumption has been estimated assuming three daily operating cycles—two at night and one during the day—lasting 3.5 h for networks 2, 3, and 4, and 6 h for network 1. The longer operating time of network 1 is due to its cumulative volume of 30,000 L, which is double that of the other circuits. Under these conditions, the total annual energy consumption amounts to 882.41 kWh/y. In the case of HIT-2, two important differences must be considered. First, the recirculation networks are considerably shorter, as the tanks are located in elevated technical plants. Second, three of the four networks require intermediate circuits for DHW production, each with its own circulating pump, unlike HIT-1, which does not require such circuits. Table 5 presents the corresponding results for HIT-2, including the additional energy consumption associated with DHW recirculation and the three intermediate circuits, which operate for six hours per day to carry out three DHW heating cycles. The annual energy consumption amounts to 1568.38 kWh/year, representing a 77.73% increase compared to the HIT-1 system. However, the difference of 685.97 kWh/y in favor of HIT-1 represents only 1.17% of the 58,502.78 kWh/y saved by HIT-2 in terms of heat losses (Table 3).
Table 4.
Calculation of Hydraulic Resistance, Pressure Losses, Pump Power, and Energy Consumption in the HIT-1 Recirculation Pumps.
Table 5.
Calculation of Hydraulic Resistance, Pressure Losses, Pump Power, and Energy Consumption in the HIT-2 Recirculation Pumps.
5.3. Installation Cost Analysis
This study provides a critical analysis of the investment costs associated with both scenarios, HIT-1 and HIT-2. While many sectors of both facilities are similar in terms of design, dimensions, and material execution specifications, other sectors involve significant modifications. The following similarities between the two scenarios are particularly noteworthy:
- PPR pipe diameters. These vertical sections serve the four risers (RP-1–RP-4), extending from the upper levels of the four building blocks into which the hotel is divided (RP-1, floors PB-13; RP-2, floors 13–25; RP-3, floors 26–38; RP-4, floors 39–52).
- DHW storage tanks. Both scenarios incorporate 14 storage tanks with a capacity of 5000 L each.
- Primary circuits. Boilers, flow and return manifolds, circulation pumps, expansion tanks, etc., and primary DHW distribution circuits operate at 90 °C, which feed four plate heat exchangers, one per RP.
And the following modifications were made to scenarios HIT-1 and HIT-2:
- Addition of PPR pipe lengths in RP-2–RP-4 (HIT-1) required from the basement to the floors housing the DHW storage tanks (floors 13, 26, and 39). These pipes have diameters greater than 51.4/63 to enhance water distribution and circulation and reduce pressure losses within the risers.
- Extension of PPR recirculation networks in RP-2–RP-4 (HIT-1). Also entails substantial increases in the lengths of the PPR recirculation networks, ranging from 89.4 m in RP-2 to 221.5 m in RP-4, with a diameter of 26.2/30 mm.
- Incorporation of intermediate closed circuits in RP-2–RP-4 (HIT-2), including circulation pumps, expansion vessels, and specific valves. These circuits extend from the basement to technical floors 13, 26, and 39, where the DHW storage tanks and secondary circuits are located. The pipe diameter for these circuits is 26.2/30 mm.
- Structural reinforcements (HIT-2). On floors 13, 26, and 39, structural reinforcements are required to support the installation of the DHW storage tanks.
This study does not evaluate equipment that is similar in both scenarios, such as boilers, primary circuits, general collectors, or DHW storage tanks, since the objective is to determine the cost differences between HIT-1 and HIT-2. The measurement results and associated cost estimates obtained using the CYPE tool [77] are shown in Table 6 and Table 7. The installation costs of the four RPs in the HIT-2 scenario are substantially lower than those in the HIT-1 scenario, €55,195.61 compared to €27,323.43, representing a saving of 50.5%. This reduction is mainly attributed to savings in RP-2–RP-4, from the basement to the technical floors (€32,174.8 − €9200.2 = €22,974.6), and the reduction in the length of the recirculation networks (€23,020.81 − €6453.95 = €16,566.86). The potential cost savings could have been even greater, but it is reduced due to the implementation of the intermediate primary circuits in HIT-2, which entail an additional cost of €11,669.28.
Table 6.
Costs of installing PPR pipes with fiberglass thermal insulation and aluminum sheet finish. HIT-1 scenario.
Table 7.
Costs of installing PPR pipes with fiberglass thermal insulation and aluminum sheet finish. HIT-2 scenario. Includes the three intermediate primary circuits that reach the 13th, 26th, and 39th floors.
5.4. Maintenance Costs
Assessing maintenance costs is inherently complex. For this reason, several companies operating in Barcelona were consulted. The aim of this research is not to provide a detailed cost breakdown for each scenario but rather to identify the substantial differences expected between the two types of DHW installations. Table 8 lists the specific equipment present in the scenario HIT-2 and not in HIT-1, as mentioned above. This primarily relates to the three intermediate primary circuits, connecting from the basement to the technical floors, namely:
- Three circulation pumps, two of them with a flow rate of 0.35 L/s and a manometric height of 2 kp/cm2 and one with a flow rate of 0.25 L/s and a manometric height of 3 kp/cm2. Equivalent commercial models include the Grundfos ALPHA1 L 20-40N 1/230V 150 pump or the Baxi SB-10YA for the first two pumps, and the Grundfos ALPHA3 32-80 -1/230V 180mm pump or Baxi SB-100XL for the third. The corresponding market prices are €276 and €384, respectively.
- Three steel plate heat exchangers, corresponding to EPDM-PRX SUICALSA IP3600 models with 53 Plates and EPDM-PRX SUICALSA IP3600 model with 65 Plates, with a two-year warranty. The market costs are €1200 and €1050, respectively.
- Three expansion vessels: two of them are 100 L IBAIONDO CMF 1” 6 BAR expansion tanks and one 140 L IBAIONDO CMF 1” 6 BAR expansion tank. The market cost is €230 and €280, respectively.
Table 8.
Additional costs for maintenance and replacement of equipment at the end of its useful life in scenario HIT-2.
However, the most decisive factor is the replacement of DHW storage tanks at the end of their service life, which for 5000 L vitrified enamel steel tanks is approximately 15 years. When the tanks are installed in the basement, replacement is considerably simpler due to the presence of a dedicated equipment descent shaft already provided for in the project than in the case of the technical plants. An additional cost of €630 per tank has been estimated for HIT-1, accounting for crane operation and subsequent handling within the technical plant.
5.5. Analysis of Structural Reinforcements Costs
The DHW storage tanks located in the technical floors require additional structural reinforcements to ensure their adequate stability in contact with the ground (foundations) and to prevent further deformation and deflection in the reticular slabs. From a foundation standpoint, the combined load of 40 m3 of water and the tank self-weight signifies only 0.33% of the building’s self-weight, or 0.21%, considering usage live loads of 500 kp/m2. Therefore, the focus must be placed on the deformations of the slabs. To address this issue, reinforced concrete footings with a thickness of 10 cm, together with the upper structural concrete beams, were designed using HA-25 concrete. The system is supported on the slabs through a 3 cm expanded polystyrene layer. A total of eight footings are required, each with a surface area of 9 m2. The corresponding material execution cost amounts to €7240, as shown in Table 9, representing only 0.023% of the total structural cost.
Table 9.
Calculation of structural reinforcement costs for scenario HIT-2 and comparison with the total costs of the hotel structure.
At this point, the material execution costs for both scenarios can be summarized, as shown in Table 10, facilitating a better understanding of the comparative analysis before evaluating maintenance cost overruns in HIT-2 and determining the investment amortization periods.
Table 10.
Comparative results of cost overruns for the installation of DHW facilities: pipes, intermediate primary circuits, and structural reinforcements. Cost savings for the HIT-2 system.
5.6. Financial Investments and Amortization
Based on the results shown in Table 2, Table 3, Table 4, Table 5, Table 6, Table 7 and Table 8, referencing the energy consumption of the DHW installations under the two scenarios, HIT-1 and HIT-2, and their implementation costs, as well as their maintenance, the significance of the required financial investments and the corresponding amortization periods can be assessed using expressions (8), (9), and (10). As indicated above, the cost of kWh produced by natural gas is €0.156/kWh. The average cost of kWh of electricity, which is subject to continuous variations throughout the day, was obtained from IDAE and taken as €0.218/kWh [79]. The total construction costs of scenario HIT-1 are €15,462.18 lower than those of scenario HIT-2. Moreover, given that scenario HIT-2 exhibits lower energy consumption, an amortization analysis is not required, as this configuration outperforms HIT-1 in both economic and energy performance.
However, the installation of DHW storage tanks in technical plans increases maintenance costs by €656.58 per year compared with scenario HIT-2. Assuming a building service life of 50 years, the costs of scenario HIT-1 would therefore exceed those of HIT-2, as shown in Table 11. Over a period of 8.2 years, the savings achieved during the construction phase would be converted into additional costs as a result of maintenance during the building’s operational and use phases. Nevertheless, given the annual energy savings produced by scenario HIT-1, amounting to €8976.89/year—calculated as €9126.43/year in energy savings minus the additional circulation pump consumption of €149.54/year—the overall balance of the building’s operational phase is more favorable under this scenario, resulting in annual savings of €7126.34. When considering both material execution and maintenance costs over a 50-year period, scenario HIT-2 has additional costs of approximately €17,366.82 (expressed in 2025 monetary values). However, this additional investment is amortized within 1.90 years as a result of the annual energy cost savings (according to expressions (8), (9), and (10). Over the full 50-year service life of the building, the total cost savings would amount to €509.739 across both the construction and operational phases of the building under the HIT-2 scenario.
Table 11.
Comparison of material execution costs, energy savings over a 50-year period of use, maintenance surcharges, and investment amortization periods between HIT-1 and HIT-2.
5.7. Environmental Impacts
Given the complexity of this research and in order to focus on the most relevant aspects, the comparative analysis of environmental impacts is limited to selected operational-phase emissions, specifically CO2, SO2, and N2O, and focuses on the carbon footprint, specifically CO2, SO2, and N2O emissions, derived exclusively from the factors that represent the principal differences between the HIT-1 and HIT-2 scenarios:
- Embodied energy of the pipe networks (PPR, fiberglass thermal insulation, and aluminum sheet).
- Environmental impacts associated with the structural reinforcements required in HIT-2.
- Environmental impacts arising from the energy consumption of the circulating pumps in the DHW recirculation circuits and, in the case of HIT-2, the intermediate circuits.
- Additional impacts arising from the operational phase of the DHW installations [73], quantified over the hotel’s 50-year service life based on the current electricity mix.
These emissions are quantified over the hotel’s 50-year service life, based on the current electricity mix. Accordingly, an estimation is carried out for the emissions associated with the use of natural gas boilers and the electrical energy of the circulating pumps required to compensate for heat losses in the primary, secondary, and intermediate circuits, in the case of HIT-2, and in the DHW recirculation return networks. For this purpose, the LCDN database [81] is used. The following assumptions are made: for each kWh of energy produced, 0.41 kg of CO2, 0.0000092 kg of SO2, and 0.00000465 kg of N2O are released, including the emissions associated with the production and transport of natural gas (upstream).
Regarding the environmental impact of the piping system and the structural reinforcement, the Global Warming Potential (GWP-total) was calculated. The impacts from manufacturing, transportation, and construction were considered. As shown in Table 12, HIT-1 generates 2680 kg of CO2e, while Table 13 shows that HIT-2 accounts for 2159 kg of CO2e, representing a reduction of 19.4%.
Table 12.
Calculation of the environmental impact (Global Warming Potential) of the piping system for HIT 1.
Table 13.
Calculation of the environmental impact (Global Warming Potential) of the piping system and the structural reinforcement for HIT 2.
After quantifying the final energy consumption for the two scenarios, HIT-1 and HIT-2 (Table 2, Table 3, Table 4 and Table 5), the annual emissions of CO2, SO2, and N2O during the use phase are calculated. In addition, the primary energy consumption of the system and the resulting CO2-equivalent emissions are estimated using the IDAE factors for 2024 [79], namely 1.195 MWhp/MWhf and 0.252 tCO2eq/MWh (Table 14 and Figure 12).
Table 14.
Comparison of annual emissions of environmentally harmful gases between HIT-1 and HIT-2.
Figure 12.
Comparison of energy consumption and carbon footprint derived from the operation of DHW return networks for the two scenarios, HIT-1 and HIT-2. Standard deviation of 13.64%.
6. Discussion
The decision to adopt the HIT-2 scenario appears to be clearly justified in light of the results shown above. The resulting energy savings demonstrate the suitability of these DHW storage tank systems located in elevated technical plants. Over an extended period of use, operating cost savings of nearly €500,000 could be achieved, while the carbon footprint and other environmental impacts derived from DHW operation could be reduced by more than 3.69% of the overall DHW-related impacts. Nevertheless, when adhering strictly to the adopted methodology and the selected parameters of analysis, additional issues remain open for consideration and debate. Firstly, the inclusion of technical floors in high-rise buildings is primarily driven by the need to integrate air conditioning systems, fire protection infrastructure, and other essential building installations. If these installations could be integrated differently, mainly by relocating them to the roof, ground floor, or basement, the justification for intermediate technical floors would be weakened due to their high construction costs and the resulting reduction in buildable area. In the specific case of the Bali Hotel, the presence of three technical floors represents an additional cost of €2350,000 and a loss of usable hotel space of 1240 m2, equivalent to 36 additional guest rooms.
Secondly, ongoing technological research in the DHW production sector may lead to the development of systems that do not require return or recirculation networks. In such a scenario, the subject of this research would become irrelevant, as costly continuous heat losses would no longer occur. Moreover, if new methods for disinfecting and eliminating Legionella bacteria were discovered in the future, using alternative technical and operational approaches, installation and maintenance operations could be significantly simplified, while also extending the service life of equipment and storage tanks, which are currently expensive. Finally, changes in the energy sector could lead to storage tanks being located on the ground floor or in basement areas rather than in elevated technical rooms, thereby facilitating installation and reducing both initial implementation and long-term maintenance costs.
However, regardless of these considerations, the most critical issue remains the reduction in the carbon footprint and other environmental impacts. This objective should be the focus of the debate, serving the collective good of society rather than the pursuit of individual commercial interests. From this perspective, the HIT-2 system offers clear benefits in this regard, and any other alternative systems proposed to replace it should, at least, guarantee greater reductions in environmental impacts.
7. Conclusions
Domestic hot water (DHW) installations in high-rise hotel buildings require specific, well-studied designs that account for equipment cost, energy consumption, and environmental impacts throughout their entire life cycle (LCA). The Bali Hotel (Benidorm, Spain) is currently the tallest hotel in Europe, with 53 floors above ground, designed with three elevated technical floors (floors 13, 26, and 39) to accommodate, among other systems, air conditioning and DHW installations, especially DHW storage tanks. The building services were organized into four vertical blocks of floors, each served by a dedicated riser, and supplied with cold water at different pressure levels (6 kp/cm2, 9 kp/cm2, 12 kp/cm2, and 18 kp/cm2). This research has shown that this design decision was the optimal one in terms of the location of the DHW storage tanks in elevated technical floors, when compared with placing the tanks in the basement (HIT-1 scenario).
Heat losses in the DHW riser pipes and return networks amount to 95,431.97 kWh/year in the HIT-1 scenario, whereas in the HIT-2 scenario, they amount to 36,929.14 kWh/year, representing a decrease of 61.3%. This results in energy savings of 58,502.78 kWh/year by locating the storage tanks on elevated technical floors, which represents 3.69% of the energy demand for DHW production. These savings are primarily attributable to the following factors:
- The considerable length of the DHW riser pipes, which in HIT-1 exceed 306 m when accounting for PPR pipes with diameters of 60/90 mm, 51.4/63 mm, and 48/50 mm.
- The substantially greater length of the DHW recirculation networks, which in HIT-1 are 667.1 m compared to 171.1 m in HIT-2, i.e., 390% longer.
This significant difference is mitigated in the HIT-2 scenario by the presence of intermediate primary circuits with a total length of 490.6 m. As a result, the overall pipe length in HIT-1 reaches 1149 m compared with 848.5 m in HIT-2.
With regard to material execution costs, these differences indicate that HIT-1 is slightly more expensive than the HIT-2 installation by €15,462.18. However, this represents only 2.01% of the total DHW system cost when all components, such as natural gas boilers, storage tanks, and associated equipment, are considered. This cost difference arises because, despite the significant reduction in overall pipe lengths, the HIT-2 intermediate primary circuits, including pumps, plate heat exchangers, expansion vessels, and related components, must still extend vertically from the basement to the technical floors 13, 26, and 39. Nevertheless, when periodic maintenance requirements are taken into account, assuming an average service life of approximately 20 years for storage tanks and other major equipment, the HIT-2 scenario entails an increase of €32,829 over the 50-year operational lifespan of the building. As a result, when both material execution and maintenance costs are considered together, the HIT-2 configuration becomes slightly more expensive, with a total additional cost of €17,366.82.
On one hand, these additional costs associated with HIT-2 would be amortized within 1.93 years due to the energy savings of the system’s energy savings of 58,502.78 kWh/year; that, at a natural gas price of €0.156/kWh, represent an annual cost saving of €9126.43. On the other hand, the energy consumption of the DHW recirculation pumps in HIT-2 is 685.97 kWh/year higher than in HIT-1, resulting in an additional annual cost of €149.54/year. Over a 50-year service life, as considered in the life cycle cost (LCC) analysis, the cumulative energy savings of the HIT-2 model would amount to 509,739€, representing a substantial economic benefit. The arrangement of DHW storage tanks in technical plants results in a significant reduction in annual environmental impacts, approximately 60%, due to lower natural gas consumption in the DHW recirculation process. Specifically, the annual reductions amount to 24,335.03 kgCO2eq, 0.54636 kg S2, and0.27594 kg N2O. Over a 50-year operational period, these savings would accumulate to 1216.75 tCO2eq, 27,318 kg SO2 and 13,797 kg N2O.
This research demonstrates the significant energy efficiency benefits provided by DHW distribution systems incorporating storage tanks located in elevated technical rooms in high-rise hotel buildings. It also addresses the challenge of quantifying the associated energy savings and reductions in environmental impact, as recommended by the EPBD. Future research will aim to extrapolate these findings to hotel buildings of varying heights, climatic zones, and occupancy patterns. A sensitivity analysis will be conducted to evaluate how key outcomes (such as payback period, percentage of energy savings, and the energy consumption of recirculation pumps and intermediate circuits) vary according to the building height, domestic hot water demand intensity in hotel operation, and thermal stratification within storage tanks.
Author Contributions
Conceptualization, V.E.-I.; methodology, V.E.-I.; validation, V.E.-I., R.L.-Z. and C.F.-S.; formal analysis, V.E.-I.; investigation, V.E.-I., C.F.-S. and R.L.-Z.; resources, V.E.-I., C.F.-S. and R.L.-Z.; data curation, V.E.-I.; writing—original draft preparation, V.E.-I., R.L.-Z. and C.F.-S.; writing—review and editing, V.E.-I., C.F.-S. and R.L.-Z.; visualization, V.E.-I., R.L.-Z. and C.F.-S. All authors have read and agreed to the published version of the manuscript.
Funding
This research was funded by UIC Barcelona (Universitat Internacional de Catalunya), grant number UIC-Aid 2025.
Data Availability Statement
The original contributions presented in this study are included in the article. Further inquiries can be directed to the corresponding author.
Acknowledgments
We would like to acknowledge the generouse support provided by Joaquín Pérez Crespo, architectural technologist, builder and owner of the “Gran Hotel Bali”. We would also like to express our gratitude to Antonio Escario (R.I.P.), Ramón Luelmo and Francisco Sanchis, architects, and Florentino Regalado (R.I.P.), Pedro Hernández, José Cuenca, and José Vicente Martí, engineers at the “Gran Hotel Bali”. The authors have reviewed and edited the output and take full responsibility for the content of this publication.
Conflicts of Interest
The funders had no role in the design of the study; in the collection, analyses, or interpretation of data; in the writing of the manuscript; or in the decision to publish the results.
Abbreviations
The following abbreviations are used in this manuscript:
| DHW | Domestic Hot Water |
| HIT | Hotel Installation Typology |
| RP | Riser Pipe |
| IHTC | Intermediate Heat Transfer Circuit |
| HRB | High-Rise Building |
| BEM | Building Energy Management |
| BEC | Building Energy Conservation |
| nZEB | Nearly Zero-Energy Building |
| COP | Coefficient of Performance |
| PCM | Phase Change Materials |
| MB-ME-VPP | Multi- energy Multi-building Power plant |
References
- U.S. Energy Information Administration. International Energy Outlook 2019; U.S. Energy Information Administration: Washington, DC, USA, 2019. Available online: https://www.eia.gov/outlooks/ieo/pdf/ieo2019.PDF (accessed on 2 June 2024).
- González-Torres, M.; Pérez-Lombard, L.; Coronel, J.F.; Maestre, I.R.; Yan, D. A Review on Buildings Energy Information: Trends, End-Uses, Fuels and Drivers. Energy Rep. 2022, 8, 626–637. [Google Scholar] [CrossRef] [Scilit]
- Berardi, U. A Cross-Country Comparison of the Building Energy Consumptions and Their Trends. Resour. Conserv. Recycl. 2017, 123, 230–241. [Google Scholar] [CrossRef] [Scilit]
- Gan, V.J.L.; Wong, C.L.; Tse, K.T.; Cheng, J.C.P.; Lo, I.M.C.; Chan, C.M. Parametric Modelling and Evolutionary Optimization for Cost-Optimal and Low-Carbon Design of High-Rise Reinforced Concrete Buildings. Adv. Eng. Inform. 2019, 42, 100962. [Google Scholar] [CrossRef] [Scilit]
- Huan, S.; Zhe, Z.; Haoyu, G.; Fangyuan, Z.; Chunwen, X.; Guoqiang, D.; Xiaohua, L.; Liping, Z. Enhancing domestic hot water energy efficiency in High-Rise residential buildings through interconnected and sharing mode. Energy Build. 2024, 310, 114113. [Google Scholar] [CrossRef] [Scilit]
- Echarri-Iribarren, V. Conditioning Using Ceramic Floor Panels with Capillary Tube Mats and Solar Thermal Panels on the Mediterranean Coast: Energy Savings and Investment Amortisation. Energy Build. 2019, 202, 109334. [Google Scholar] [CrossRef] [Scilit]
- Susorova, I.; Angulo, M.; Bahrami, P.; Stephens, B. A Model of Vegetated Exterior Facades for Evaluation of Wall Thermal Performance. Build. Environ. 2013, 67, 1–13. [Google Scholar] [CrossRef] [Scilit]
- Riantini, L.S.; Machfudiyanto, R.A.; Rachmawati, T.S.N.; Rachman, M.D.A.; Fachrizal, R.; Shadram, F. Energy Efficiency Analysis of Building Envelope Renovation and Photovoltaic System in a High-Rise Hotel Building in Indonesia. Buildings 2024, 14, 1646. [Google Scholar] [CrossRef] [Scilit]
- Hadded, M.H.; Dardouri, S.; Yüksel, A.; Sghaier, J.; Arıcı, M. Enhancing Energy Efficiency and Thermal Comfort Through Integration of PCMs in Passive Design: An Energetic, Environmental, and Economic (3E) Analysis. Buildings 2025, 15, 3319. [Google Scholar] [CrossRef] [Scilit]
- Esen, M.; Ayhan, T. Development of a model compatible with solar assisted cylindrical energy storage tank and variation of stored energy with time for different phase change materials. Energy Convers. Manag. 1996, 37, 1775–1785. [Google Scholar] [CrossRef] [Scilit]
- Kuusk, K.; Kalamees, T.; Maivel, M. Cost Effectiveness of Energy Performance Improvements in Estonian Brick Apartment Buildings. Energy Build. 2014, 77, 313–322. [Google Scholar] [CrossRef] [Scilit]
- Echarri-Iribarren, V.; Roviras-Miñana, J.; Gómez-Val, R. Heat Recovery Units in Passivhaus Housing on the Spanish Mediterranean Coast: Energy Efficiency and Return on Investment. Buildings 2024, 14, 3975. [Google Scholar] [CrossRef] [Scilit]
- Shaikh, P.; Bin, N.; Nor, N.; Nallagownden, P.; Elamvazuthi, I.; Ibrahim, T. Intelligent Multi-Objective Control and Management for Smart Energy Efficient Buildings. Int. J. Electr. Power Energy Syst. 2016, 74, 403–409. [Google Scholar] [CrossRef] [Scilit]
- Parvin, K.; Hossain, M.J.; Arsad, A.Z.; Ker, P.J.; Hannan, M.A. Building energy technologies towards achieving net-zero pathway: A comprehensive review, challenges and future directions. J. Build. Eng. 2025, 100, 111795. [Google Scholar] [CrossRef] [Scilit]
- Iliuţă, M.-E.; Moisescu, M.-A.; Pop, E.; Ionita, A.-D.; Caramihai, S.-I.; Mitulescu, T.-C. Digital Twin—A Review of the Evolution from Concept to Technology and Its Analytical Perspectives on Applications in Various Fields. Appl. Sci. 2024, 14, 5454. [Google Scholar] [CrossRef] [Scilit]
- Ba, L.; Tangour, F.; El Abbassi, I.; Absi, R. Analysis of Digital Twin Applications in Energy Efficiency: A Systematic Review. Sustainability 2025, 17, 3560. [Google Scholar] [CrossRef] [Scilit]
- Jørgensen, B.N.; Ma, Z.G. Impact of EU Laws on the Adoption of AI and IoT in Advanced Building Energy Management Systems: A Review of Regulatory Barriers, Technological Challenges, and Economic Opportunities. Buildings 2025, 15, 2160. [Google Scholar] [CrossRef] [Scilit]
- Okonta, E.D.; Okeke, F.O.; Mgbemena, E.E.; Nnaemeka-Okeke, R.C.; Guo, S.; Awe, F.C.; Eke, C. An Intelligent Natural Language Processing (NLP) Workflow for Automated Smart Building Design. Buildings 2025, 15, 2413. [Google Scholar] [CrossRef] [Scilit]
- Liu, C.; Wang, B.; Li, F.; Wei, L.; Hao, W.; Wang, L. A comparative life cycle assessment of photovoltaic/thermal, flat plate collector and electric domestic hot water systems based on TRNSYS simulation. Appl. Therm. Eng. 2025, 279, 127641. [Google Scholar] [CrossRef] [Scilit]
- Jahanbin, A.; Berardi, U. A hybrid machine learning framework for optimizing heat pump-driven domestic hot water systems based on user behaviour and control strategies. Appl. Therm. Eng. 2025, 279, 127664. [Google Scholar] [CrossRef] [Scilit]
- Wu, H.; Qiu, D.; Zhang, L.; Sun, M. Adaptive multi-agent reinforcement learning for flexible resource management in a virtual power plant with dynamic participating multi-energy buildings. Appl. Energy 2024, 374, 123998. [Google Scholar] [CrossRef] [Scilit]
- Li, C.Z.; Zhang, L.; Liang, X.; Xiao, B.; Tam, V.W.Y.; Lai, X.; Chen, Z. Advances in the Research of Building Energy Saving. Energy Build. 2022, 254, 111556. [Google Scholar] [CrossRef] [Scilit]
- Allouhi, A.; El Fouih, Y.; Kousksou, T.; Jamil, A.; Zeraouli, Y.; Mourad, Y. Energy Consumption and Efficiency in Buildings: Current Status and Future Trends. J. Clean. Prod. 2015, 109, 118–130. [Google Scholar] [CrossRef] [Scilit]
- Du, J.; Yu, C.; Pan, W. Multiple Influencing Factors Analysis of Household Energy Consumption in High-Rise Residential Buildings: Evidence from Hong Kong. Build. Simul. 2020, 13, 753–769. [Google Scholar] [CrossRef] [Scilit]
- UCL. High-Rise Buildings Much More Energy-Intensive than Low-Rise. Available online: https://www.ucl.ac.uk/news/2017/jun/high-rise-buildings-much-more-energy-intensive-low-rise (accessed on 9 January 2026).
- Lima, I.; Scalco, V.; Lamberts, R. Estimating the Impact of Urban Densification on High-Rise Office Building Cooling Loads in a Hot and Humid Climate. Energy Build. 2019, 182, 30–44. [Google Scholar] [CrossRef] [Scilit]
- Ordóñez, J.; Díaz de Garayo, S.; Martínez, Á.; Algarra, F.; Astrain, D. Design and Analysis of a Two-Stage Cascade System for Heating and Hot Water Production in Nearly Zero-Energy Buildings Using Thermoelectric Technology. Buildings 2024, 14, 3988. [Google Scholar] [CrossRef] [Scilit]
- Fuentes, E.; Arce, L.; Salom, J. A review of domestic hot water consumption profiles for application in systems and buildings energy performance analysis. Renew. Sustain. Energy Rev. 2018, 81, 1530–1547. [Google Scholar] [CrossRef] [Scilit]
- Bohdanowicz, P.; Martinac, I. Determinants and Benchmarking of Resource Consumption in Hotels—Case Study of Hilton International and Scandic in Europe. Energy Build. 2007, 39, 82–95. [Google Scholar] [CrossRef] [Scilit]
- Zhang, J.; Yuan, C.; Yang, J.; Zhao, L. Research on Energy Consumption Prediction Models for High-Rise Hotels in Guangzhou, Based on Different Machine Learning Algorithms. Buildings 2024, 14, 356. [Google Scholar] [CrossRef] [Scilit]
- De la Cruz-Loredo, I.; Zinsmeister, D.; Licklederer, T.; Ugalde-Loo, C.E.; Morales, D.A.; Bastida, H.; Perić, V.S.; Saleem, A. Experimental Validation of a Hybrid 1-D Multi-Node Model of a Hot Water Thermal Energy Storage Tank. Appl. Energy 2023, 332, 120556. [Google Scholar] [CrossRef] [Scilit]
- Al-Mamun, R.; Roy, H.; Islam, S.; Ali, R.; Hossain, I.; Saad Aly, M.A.; Hossain Khan, Z.; Marwani, H.M.; Islam, A. State-of-the-Art in Solar Water Heating (SWH) Systems for Sustainable Solar Energy Utilization: A Comprehensive Review. Sol. Energy 2023, 264, 111998. [Google Scholar] [CrossRef] [Scilit]
- Tosato, G.; Girotto, S.; Minetto, S.; Rossetti, A.; Marinetti, S. An Integrated CO2 Unit for Heating, Cooling and DHW Installed in a Hotel. Data from the Field. J. Phys. Conf. Ser. 2020, 1599, 012058. [Google Scholar] [CrossRef] [Scilit]
- Chen, X.; Yang, H. Integrated Energy Performance Optimization of a Passively Designed High-Rise Residential Building in Different Climatic Zones of China. Appl. Energy 2018, 215, 145–158. [Google Scholar] [CrossRef] [Scilit]
- Chen, X.; Yang, H.; Peng, J. Energy Optimization of High-Rise Commercial Buildings Integrated with Photovoltaic Facades in Urban Context. Energy 2019, 172, 1–17. [Google Scholar] [CrossRef] [Scilit]
- Liu, J.; Wang, M.; Peng, J.; Chen, X.; Cao, S.; Yang, H. Techno-Economic Design Optimization of Hybrid Renewable Energy Applications for High-Rise Residential Buildings. Energy Convers. Manag. 2020, 213, 112868. [Google Scholar] [CrossRef] [Scilit]
- Wan, K.S.Y.; Yik, F.W.H. Building Design and Energy End-Use Characteristics of High-Rise Residential Buildings in Hong Kong. Appl. Energy 2004, 78, 19–36. [Google Scholar] [CrossRef] [Scilit]
- Shah, A.H.; Hassan, A.; Abdelbaqi, S.; Alnoman, H.; Fardoun, A.; Haggag, M.; Noor, M.; Laghari, M.S. Parametric Optimization of Concentrated Photovoltaic-Phase Change Material as a Thermal Energy Source for Buildings. Buildings 2025, 15, 327. [Google Scholar] [CrossRef] [Scilit]
- Pathak, S.K.; Tyagi, V.V.; Chopra, K.; Pandey, A.K.; Sari, A. Hot Water Generation for Domestic Use in Residential Buildings via PCM Integrated U-Tube Based Solar Thermal Collector: A 4-E Analysis. Buildings 2023, 13, 1212. [Google Scholar] [CrossRef] [Scilit]
- Pomianowski, M.Z.; Johra, H.; Marszal-Pomianowska, A.; Zhang, C. Sustainable and energy-efficient domestic hot water systems: A review. Renew. Sustain. Energy Rev. 2020, 128, 109900. [Google Scholar] [CrossRef] [Scilit]
- Bertrand, A.; Mastrucci, A.; Schüler, N.; Aggoune, R.; Maréchal, F. Characterisation of Domestic Hot Water End-Uses for Integrated Urban Thermal Energy Assessment and Optimisation. Appl. Energy 2017, 186, 152–166. [Google Scholar] [CrossRef] [Scilit]
- Barquin, T. Delta EE’s View on the European Heat Pump. Report, Reviewed by Sugden, L. November 2021. Available online: https://spark.lcp.com/research/document/14FE66 (accessed on 8 December 2025).
- Wendt, R.; Baskin, E.; Durfee, D. Evaluation of Residential Hot Water Distribution Systems by Numeric Simulation; Oak Ridge National Laboratory: Oak Ridge, TN, USA, 2004. Available online: https://info.ornl.gov/sites/publications/Files/Pub57810.pdf (accessed on 4 January 2026).
- Kaynakli, O. Economic Thermal Insulation Thickness for Pipes and Ducts: A Review Study. Renew. Sustain. Energy Rev. 2014, 30, 184–194. [Google Scholar] [CrossRef] [Scilit]
- GASTEC. Final Report: In-Situ Monitoring of Efficiencies of Condensing Boilers and Use of Secondary Heating, 2009. Available online: https://www.gov.uk/government/publications/in-situ-monitoring-of-efficiencies-of-condensing-boilers-and-use-of-secondary-heating-trial-final-report-2009 (accessed on 4 January 2026).
- Haines, V.; Kyriakopoulou, K.; Lawton, C. End User Engagement with Domestic Hot Water Heating Systems: Design Implications for Future Thermal Storage Technologies. Energy Res. Soc. Sci. 2019, 49, 74–81. [Google Scholar] [CrossRef] [Scilit]
- Gabrielaitiene, I.; Bøhm, B.; Sunden, B. Evaluation of Approaches for Modeling Temperature Wave Propagation in District Heating Pipelines. Heat Transf. Eng. 2008, 29, 45–56. [Google Scholar] [CrossRef] [Scilit]
- van der Heijde, B.; Fuchs, M.; Ribas Tugores, C.; Schweiger, G.; Sartor, K.; Basciotti, D.; Müller, D.; Nytsch-Geusen, C.; Wetter, M.; Helsen, L. Dynamic Equation-Based Thermo-Hydraulic Pipe Model for District Heating and Cooling Systems. Energy Convers. Manag. 2017, 151, 158–169. [Google Scholar] [CrossRef] [Scilit]
- Kitzberger, T.; Kilian, D.; Kotik, J.; Pröll, T. Comprehensive Analysis of the Performance and Intrinsic Energy Losses of Centralized Domestic Hot Water (DHW) Systems in Commercial (Educational) Buildings. Energy Build. 2019, 195, 126–138. [Google Scholar] [CrossRef] [Scilit]
- Benakopoulos, T.; Vergo, W.; Tunzi, M.; Salenbien, R.; Svendsen, S. Overview of Solutions for the Low-Temperature Operation of Domestic Hot-Water Systems with a Circulation Loop. Energies 2021, 14, 3350. [Google Scholar] [CrossRef] [Scilit]
- Eatherton, M. Challenges in DHW Distribution—Part 1. Available online: https://www.contractormag.com/management/eatherton/article/20883672/challenges-in-dhw-distribution-part-1 (accessed on 16 January 2026).
- Hamburg, A.; Mikola, A.; Parts, T.-M.; Kalamees, T. Heat Loss Due to Domestic Hot Water Pipes. Energies 2021, 14, 6446. [Google Scholar] [CrossRef] [Scilit]
- Marini, D.; Buswell, R.A.; Hopfe, C.J. Development of a Dynamic Analytical Model for Estimating Waste Heat from Domestic Hot Water Systems. Energy Build. 2021, 247, 111119. [Google Scholar] [CrossRef] [Scilit]
- Colmenar-Santos, A.; Vale-Vale, J.; Borge-Diez, D.; Requena-Pérez, R. Solar Thermal Systems for High Rise Buildings with High Consumption Demand: Case Study for a 5 Star Hotel in Sao Paulo, Brazil. Energy Build. 2014, 69, 481–489. [Google Scholar] [CrossRef] [Scilit]
- Bower, D. Keep It Moving: Design Strategies for Maintaining Water Flow. Plumb. Mech. Eng. 2015, 21, 9–10. Available online: https://www.pmengineer.com/publications/3/editions/1288 (accessed on 2 June 2024).
- Bédard, E.; Paranjape, K.; Lalancette, C.; Villion, M.; Quach, C.; Laferrière, C.; Faucher, S.P.; Prévost, M. Legionella pneumophila Levels and Sequence-Type Distribution in Hospital Hot Water Samples from Faucets to Connecting Pipes. Water Res. 2019, 156, 277–286. [Google Scholar] [CrossRef] [Scilit]
- Girolamini, L.; Brattich, E.; Marino, F.; Pascale, M.R.; Mazzotta, M.; Spiteri, S.; Derelitto, C.; Tositti, L.; Cristino, S. Cooling Towers Influence in an Urban Environment: A Predictive Model to Control and Prevent Legionella Risk and Legionellosis Events. Build. Environ. 2023, 228, 109891. [Google Scholar] [CrossRef] [Scilit]
- Eatherton, M. Challenges in DHW Distribution—Part 3. Available online: https://www.contractormag.com/management/eatherton/article/20883765/challenges-in-dhw-distribution-part-3 (accessed on 16 January 2026).
- Averfalk, H.; Ottermo, F.; Werner, S. Pipe Sizing for Novel Heat Distribution Technology. Energies 2019, 12, 1276. [Google Scholar] [CrossRef] [Scilit]
- Benefits of Hot Water Recirculation—21 May 2014—Plumbing and Mechanical. Available online: https://www.pmmag.com/articles/96425-benefits-of-hot-water-recirculation (accessed on 16 January 2026).
- Moss, R.W.; Critoph, R.E. Optimisation of a Recirculating Domestic Hot Water System to Minimise Wait Time and Heat Loss. Energy Build. 2022, 260, 111850. [Google Scholar] [CrossRef] [Scilit]
- Akgüç, A.; Yasar, D. An Assessment of the Energy Performance and Initial Investment Cost of SDHW Systems: A Case Study of University Dormitory in Northern Cyprus. Buildings 2025, 15, 3042. [Google Scholar] [CrossRef] [Scilit]
- Real Decreto 487/2022, de 21 de Junio, Por El Que Se Establecen Los Requisitos Sanitarios Para La Prevención y El Control de La Legionelosis. Available online: https://www.boe.es/buscar/act.php?id=BOE-A-2022-10297 (accessed on 16 January 2026).
- Domingo, A.M. Apuntes de Transmisión del Calor; ES de Arquitectura, Universidad Politécnica de Madrid: Madrid, Spain, 2012; Available online: https://oa.upm.es/13287/1/amd-apuntes-transmision-calor.pdf#:~:text=la%20resistencia%20t%C3%A9rmica%20total%20del%20sistema%20al,del%20calor%20por%20conducci%C3%B3n%20dentro%20del%20muro (accessed on 30 January 2026).
- Wang, T.-H.; Wu, H.-C.; Meng, J.-H.; Yan, W.-M. Optimization of a double-layered microchannel heat sink with semi-porous-ribs by multi-objective genetic algorithm. Int. J. Heat Mass Transf. 2020, 149, 119217. [Google Scholar] [CrossRef] [Scilit]
- Pressman. Pérdidas de Carga en Tuberías. Available online: https://www.eepm.es/wp-content/uploads/2018/04/PRESSMAN-Pe%CC%81rdida-de-Carga-en-Tuberi%CC%81as.pdf (accessed on 30 January 2026).
- DB-SE. Basic Document on Structural Safety (CTE). Available online: https://www.codigotecnico.org/pdf/Documentos/SE/DBSE.pdf (accessed on 1 October 2025).
- Código Estructural (CE-21). Regulation Establishing the Technical Requirements for Concrete, Steel, and Composite Structures. Ministry of Transport, Mobility and Urban Agenda, Spain. Available online: https://www.transportes.gob.es/ministerio/normativa-y-estudios-tecnicos/reglamentacion-vigente-sobre-seguridad-estructural/codigo-estructural (accessed on 1 December 2025).
- UNE-EN 1992-1-1:2013/A1:2015; Eurocode 2: Design of Concrete Structures—Part 1-1: General Rules and Rules for Buildings. Spanish Association for Standardization, UNE: Madrid, Spain, 2015. Available online: https://www.une.org/encuentra-tu-norma/busca-tu-norma/norma/?c=N0055436 (accessed on 1 December 2025).
- UNE-EN 10080:2006; Steel for the Reinforcement of Concrete—Weldable Reinforcing Steel—General. Spanish Association for Standardization, UNE: Madrid, Spain, 2006. Available online: https://www.une.org/encuentra-tu-norma/busca-tu-norma/norma?c=N0036048 (accessed on 1 December 2025).
- UNE-EN 1991-1-1:2019; Eurocode 1: Actions on Structures—Part 1-1: General Actions. Spanish Association for Standardization, UNE: Madrid, Spain, 2019. Available online: https://www.une.org/encuentra-tu-norma/busca-tu-norma/norma?c=N0061575 (accessed on 1 December 2025).
- UNE-EN 1991-1-3:2004; Eurocode 1: Actions on Structures—Part 1-3: Snow Loads. Spanish Association for Standardization, UNE: Madrid, Spain, 2004. Available online: https://www.une.org/encuentra-tu-norma/busca-tu-norma/norma/?c=norma-une-en-1991-1-3-2018-n0059759 (accessed on 4 February 2019).
- UNE-EN 1991-1-4:2018; Eurocode 1: Actions on Structures—Part 1-4: Wind Actions. Spanish Association for Standardization, UNE: Madrid, Spain, 2018. Available online: https://www.une.org/encuentra-tu-norma/busca-tu-norma/norma?c=N0060257 (accessed on 1 October 2025).
- Robot Structural Analysis Professional. Available online: https://www.autodesk.com/products/robot-structural-analysis/overview (accessed on 15 October 2025).
- TCQ/TCQi—ITeC (Institute of Construction Technology). Available online: https://itec.es/soporte/soporte-tcq/ (accessed on 15 October 2025).
- ITeC—Institute of Construction Technology. Available online: https://itec.es/ (accessed on 15 October 2025).
- Construction Price Generator. Spain. CYPE Ingenieros, S.A. Available online: https://generadordeprecios.info/ (accessed on 15 October 2025).
- UNE-EN 15459-1:2018; Energy Performance of Buildings—Economic Evaluation Procedure for Energy Systems in Buildings—Part 1: Calculation Procedures (Module M1-14). European Committee for Standardization (CEN): Brussels, Belgium, 2018. Available online: https://www.une.org/encuentra-tu-norma/busca-tu-norma/norma?c=N0061216 (accessed on 4 February 2019).
- IDAE. Informe de Precios Energéticos Regulados. Enero 2026. Available online: https://www.idae.es/sites/default/files/estudios_informes_y_estadisticas/Tarifas_Reguladas_ene_2026.pdf (accessed on 4 February 2019).
- Henkel, J.; Kunde, R.; Gaderer, M.; Erdmann, G. Assessment of Global Emissions, Local Emissions and Immissions of Different Heating Systems. Sustainability 2009, 1, 494–515. [Google Scholar] [CrossRef] [Scilit]
- European Commission. LCDN—The Life Cycle Data Network. Available online: https://eplca.jrc.ec.europa.eu/LCDN/ (accessed on 9 March 2019).
- One Click LCA. Life Cycle Assessment and Environmental Product Declarations for Construction. Available online: https://oneclicklca.com/ (accessed on 9 February 2026).
- EPD International AB. The International EPD® System. Available online: https://www.environdec.com/home (accessed on 9 February 2026).
- ISO 14025:2006; Environmental Labels and Declarations—Type III Environmental Declarations—Principles and Procedures. International Organization for Standardization (ISO): Geneva, Switzerland, 2006. Available online: https://www.iso.org/obp/ui/#iso:std:iso:14025:ed-1:v1:es (accessed on 9 February 2026).
- UNE-EN 15804:2012+A2:2020; Sustainability of Construction Works—Environmental Product Declarations—Core Rules for the Product Category of Construction Products. Asociación Española de Normalización (UNE): Madrid, Spain, 2020. Available online: https://tienda.aenor.com/norma-une-en-15804-2012-a2-2020-n0063508 (accessed on 9 February 2026).
- EPD International AB. Environmental Product Declaration EPD5868. Available online: https://www.environdec.com/library/epd5868 (accessed on 9 February 2026).
- Ecoinvent Association. Ecoinvent Database. Available online: https://ecoinvent.org/ (accessed on 9 February 2026).
- EU/2024/1275; EPBD. Energy Performance of Buildings Directive 2024. European Commission: Brussels, Belgium, 2024. Available online: https://eur-lex.europa.eu/legal-content/EN/TXT/?uri=OJ:L_202401275&pk_keyword=Energy&pk_content=Directive (accessed on 18 September 2024).
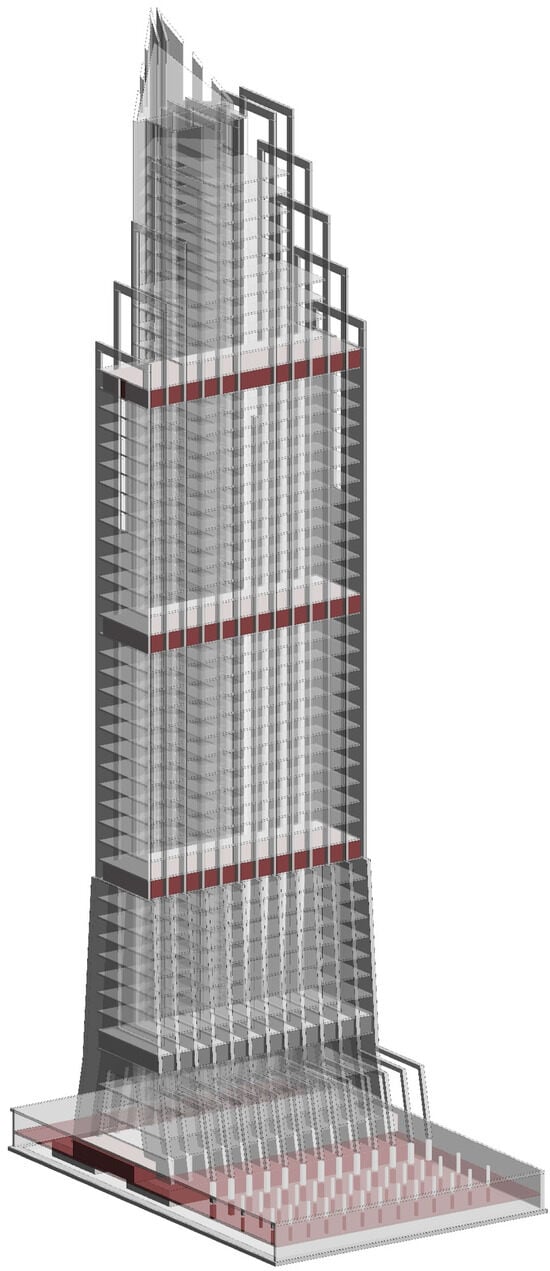
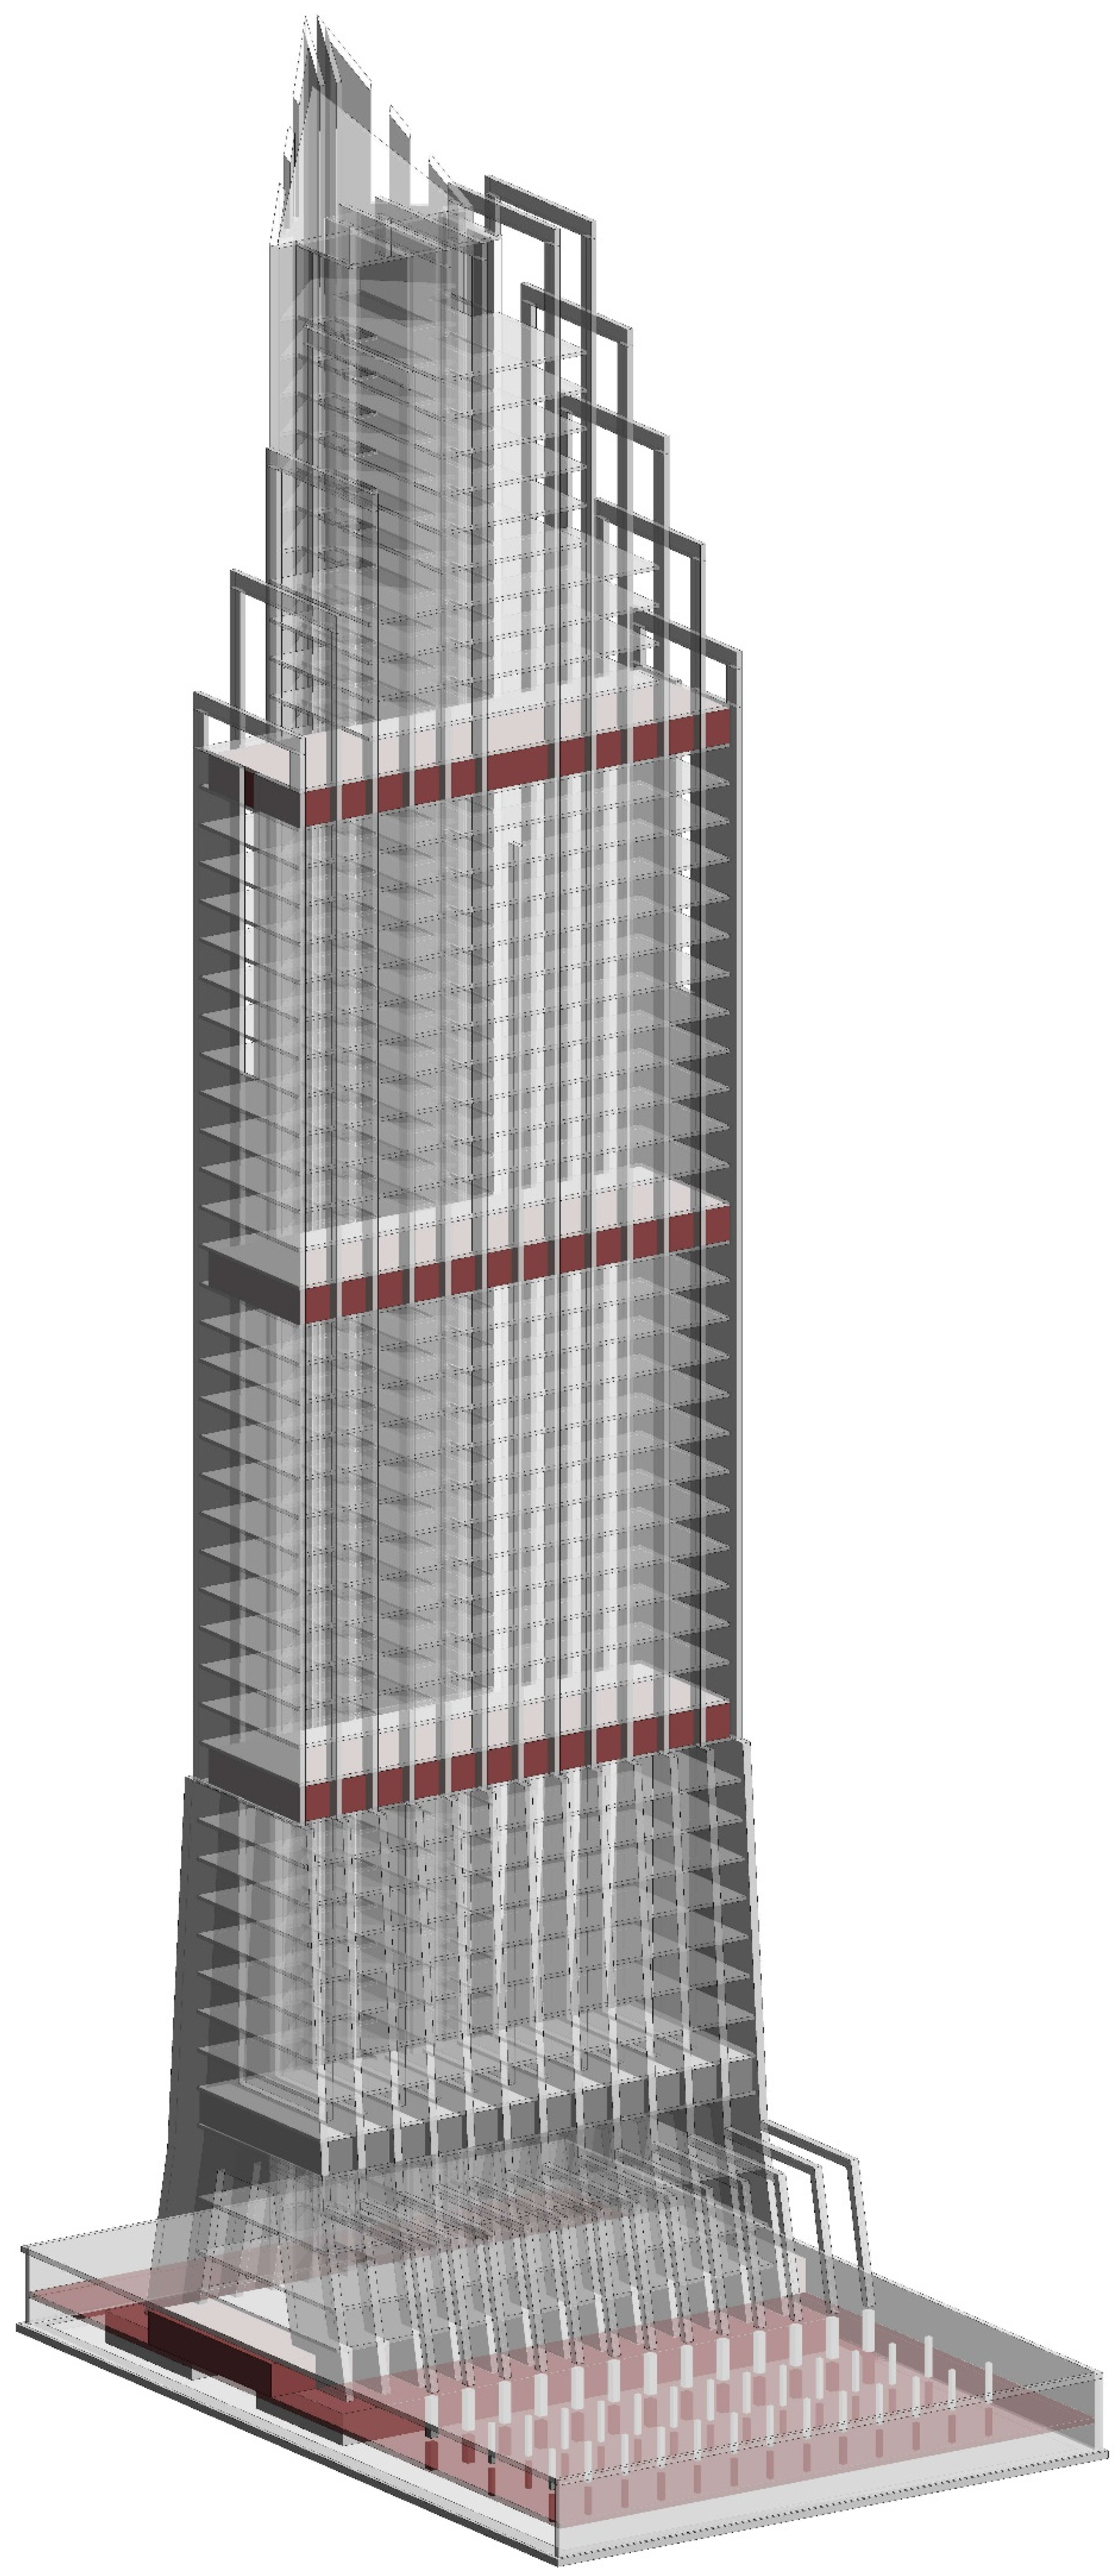
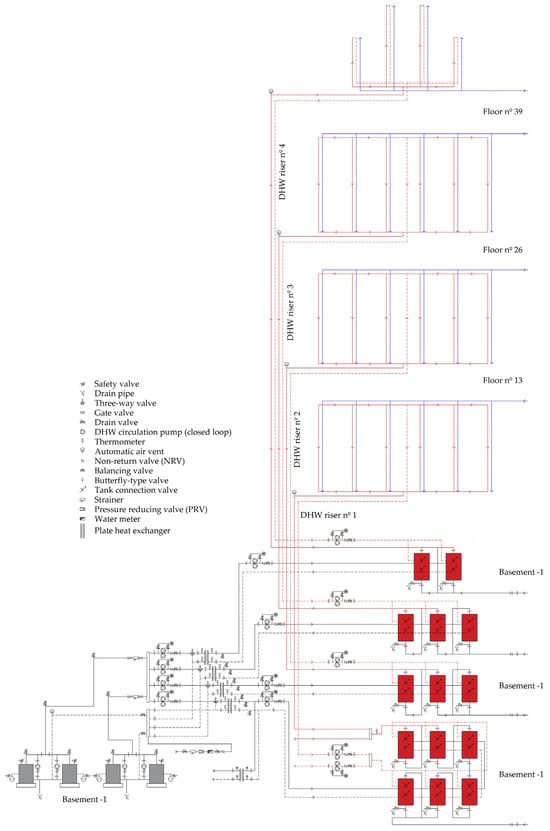
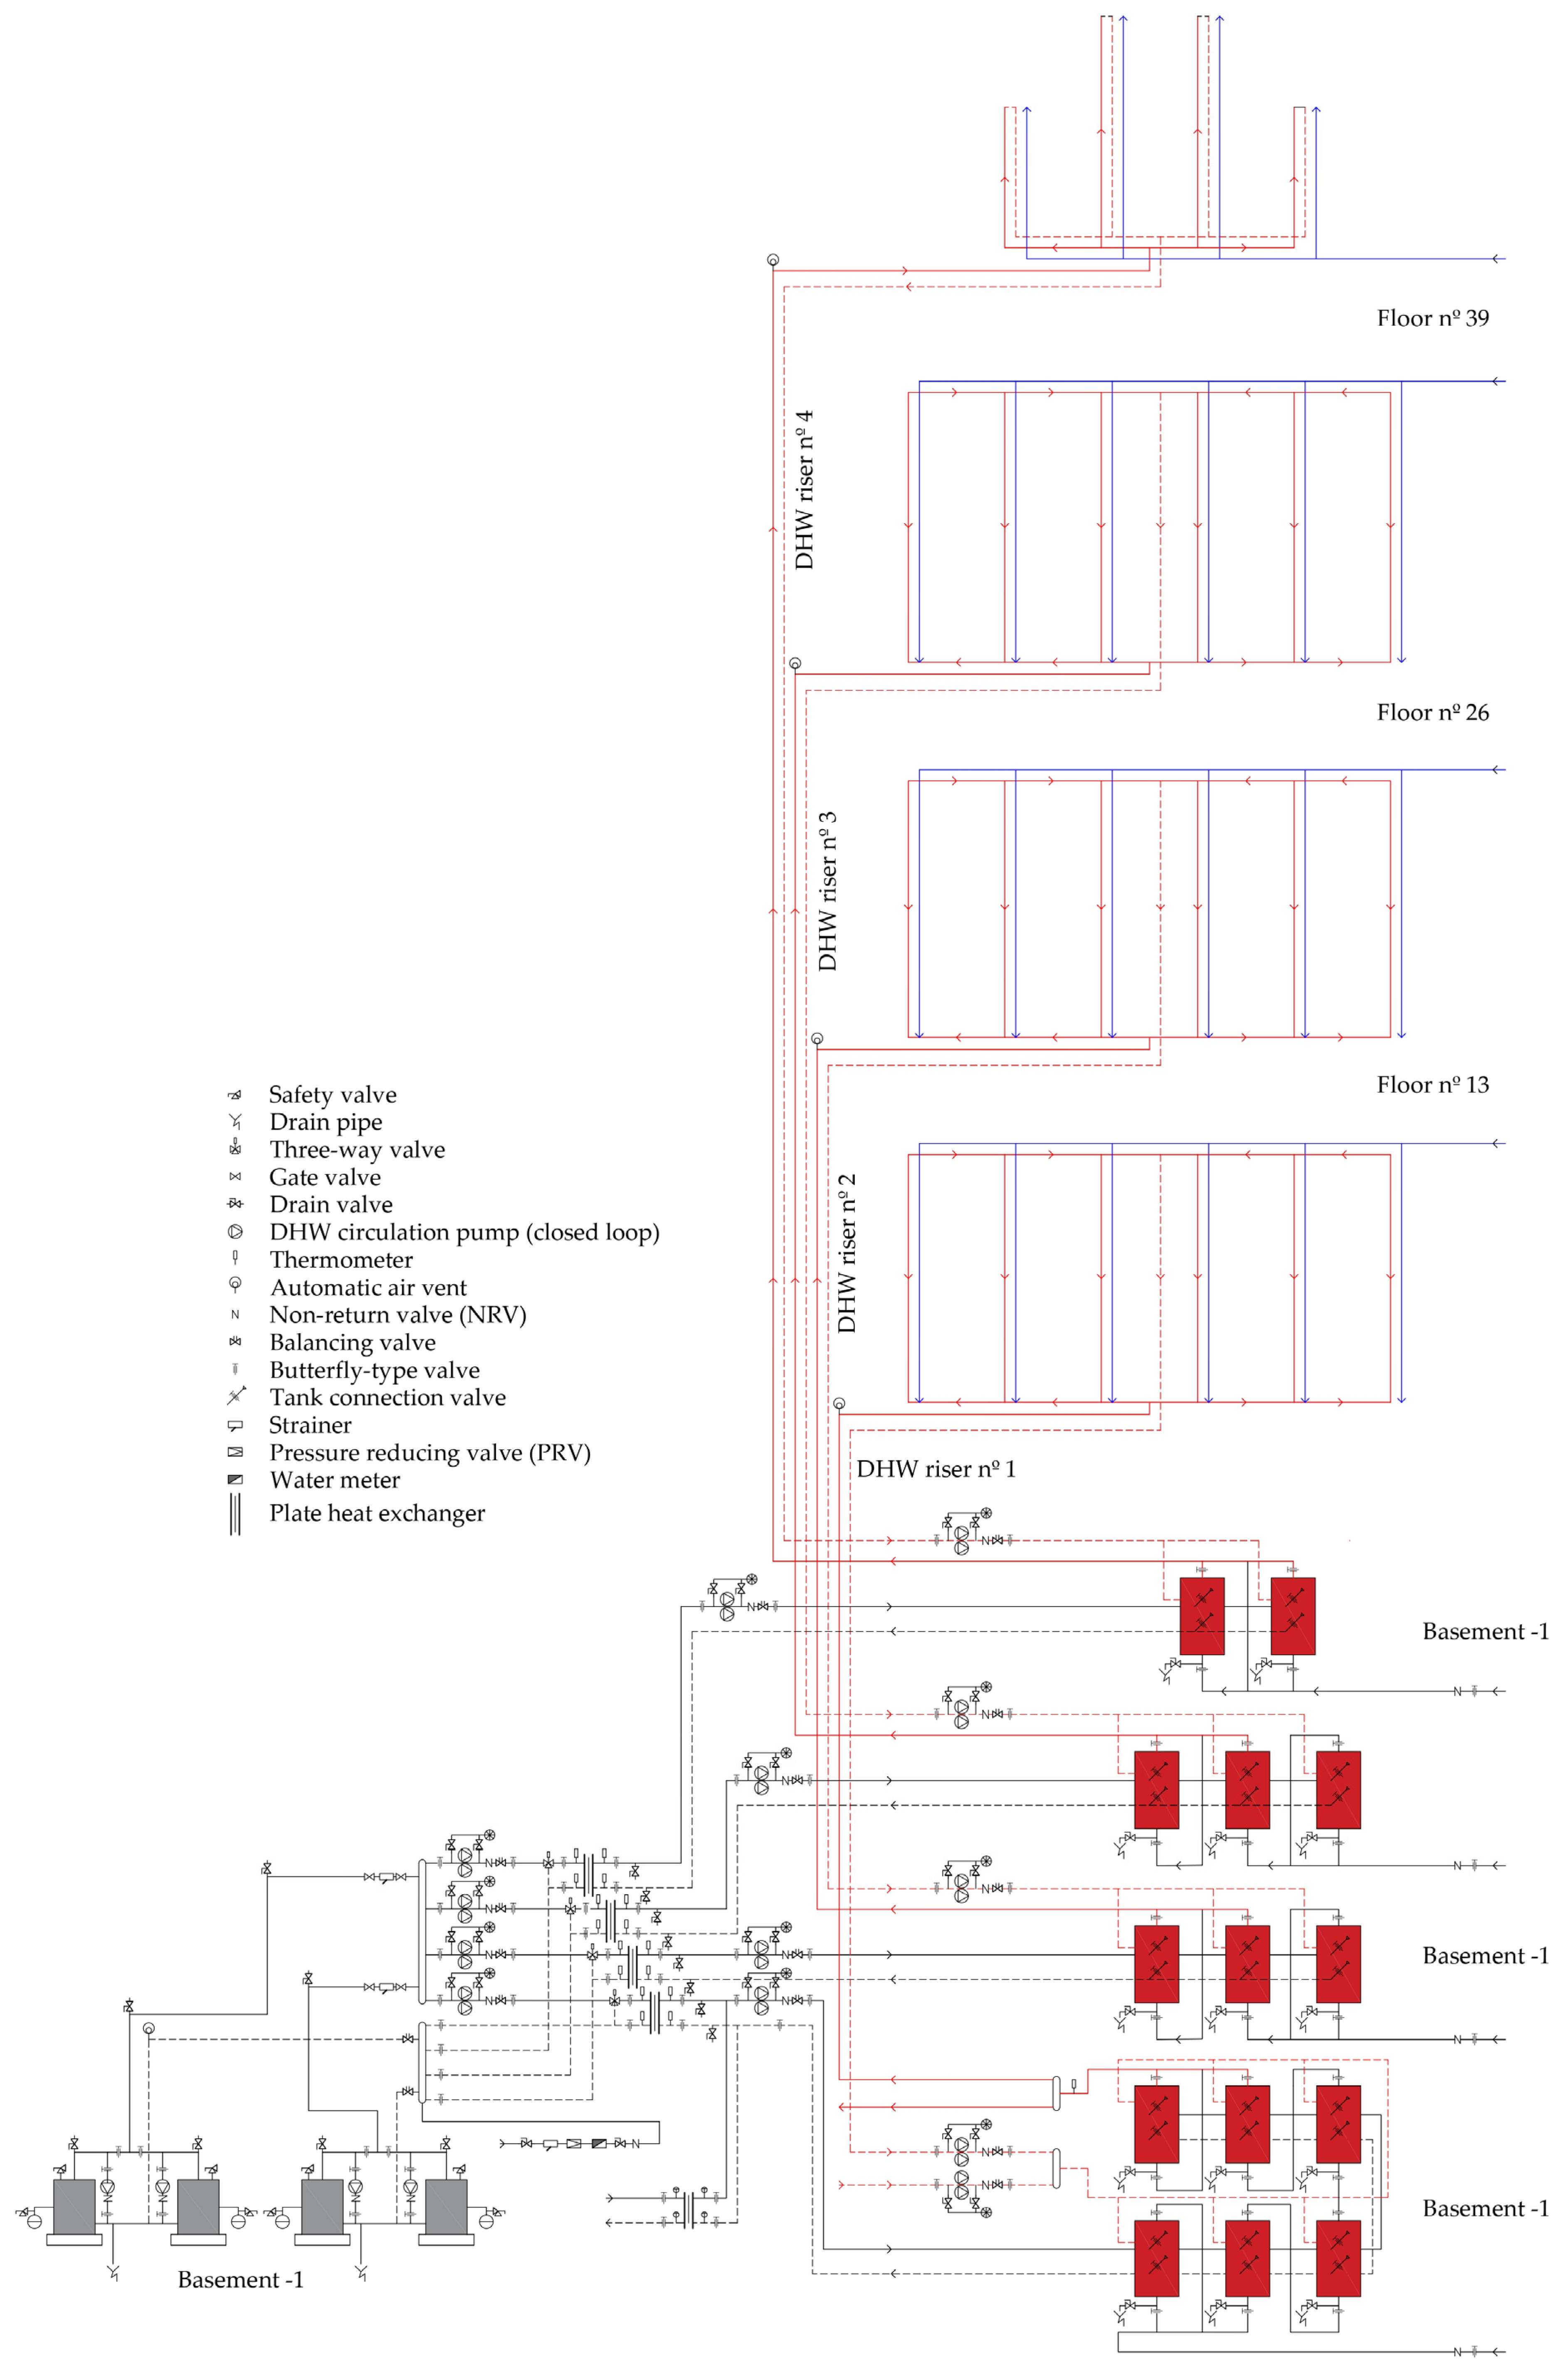
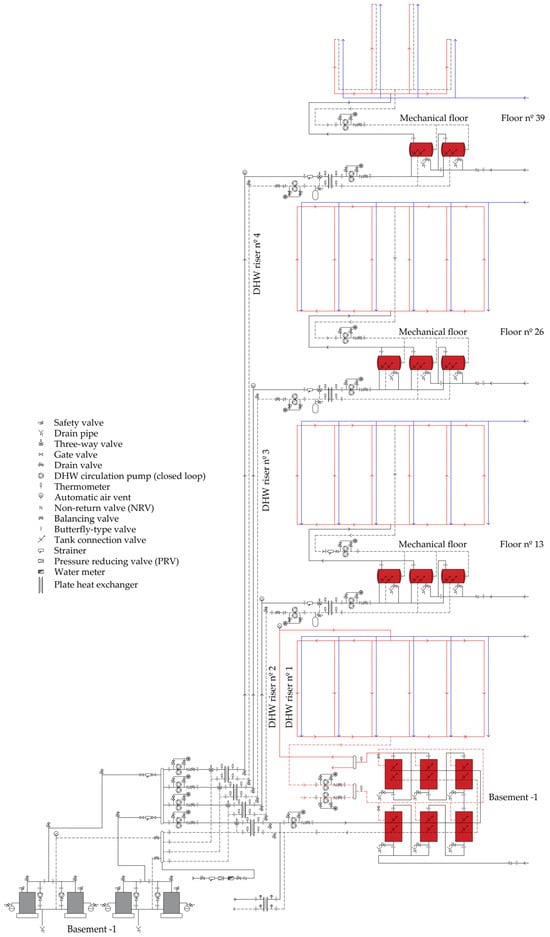
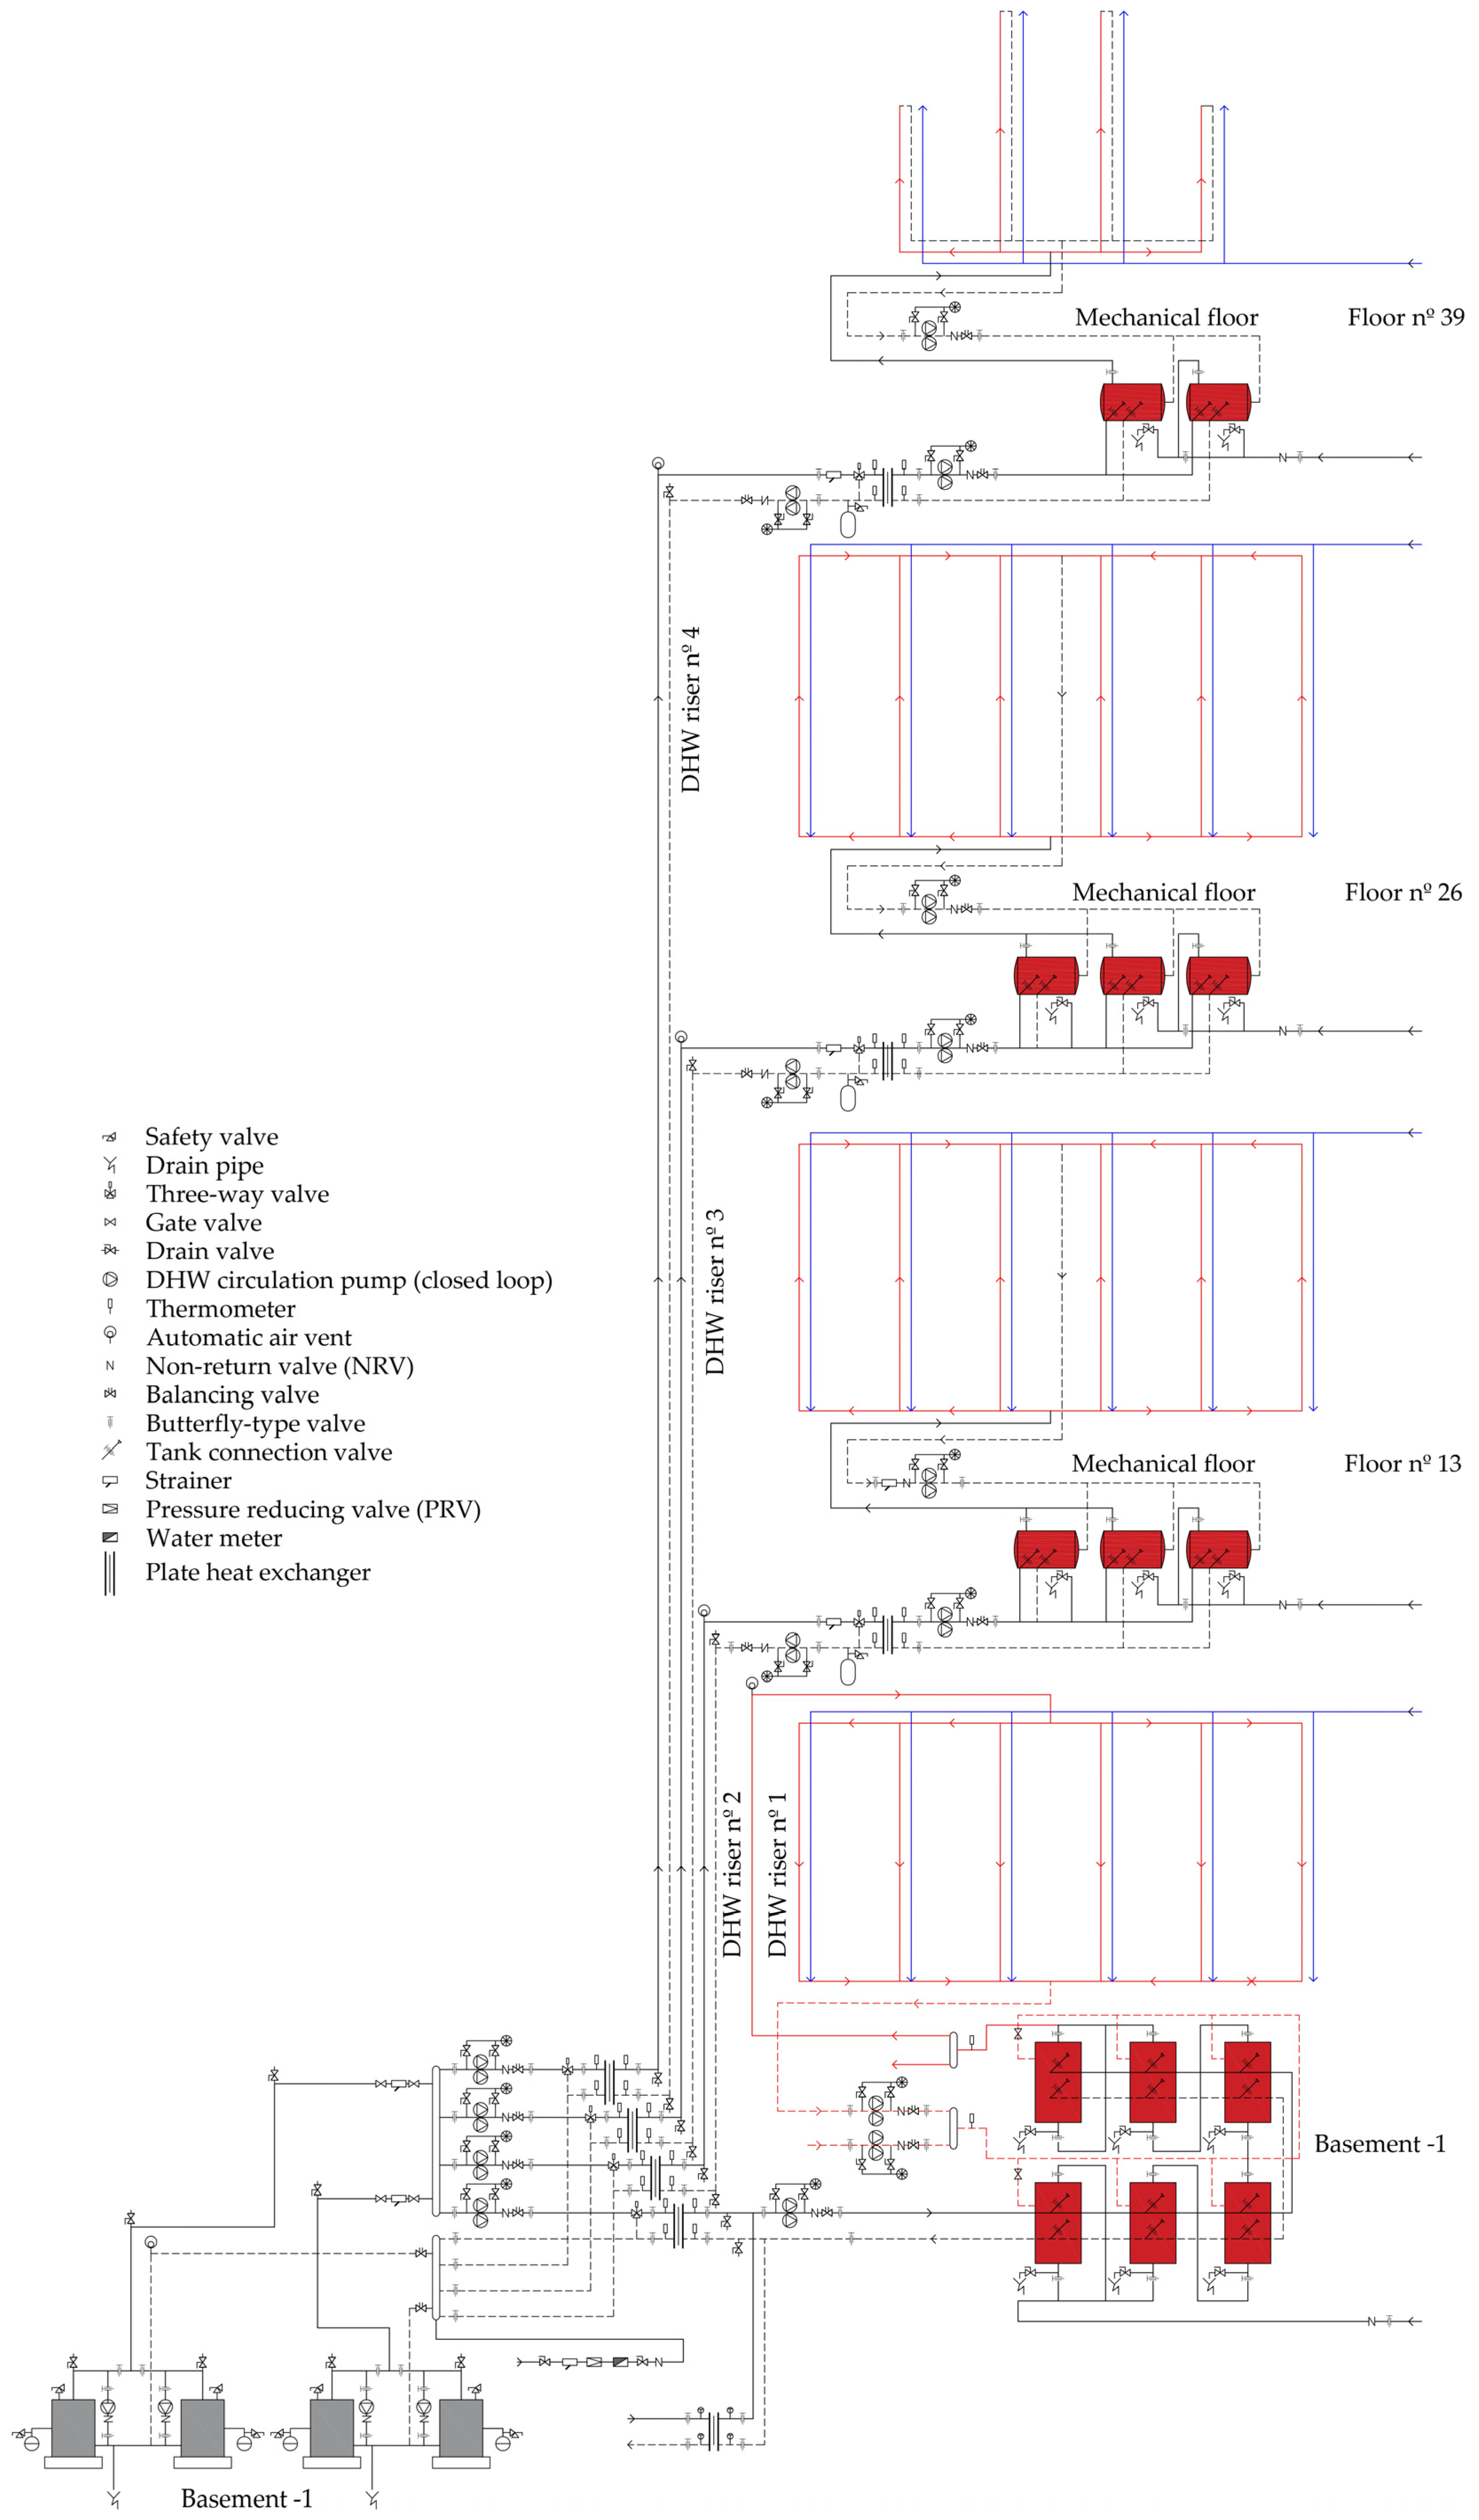
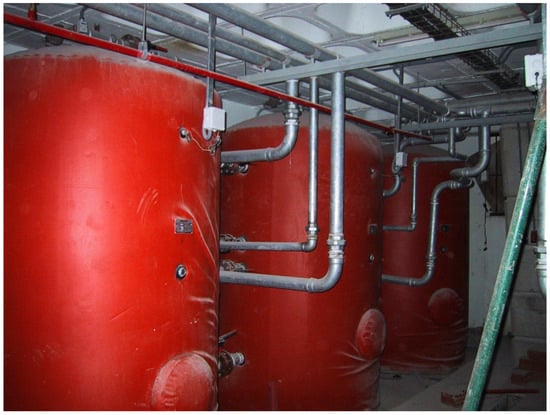
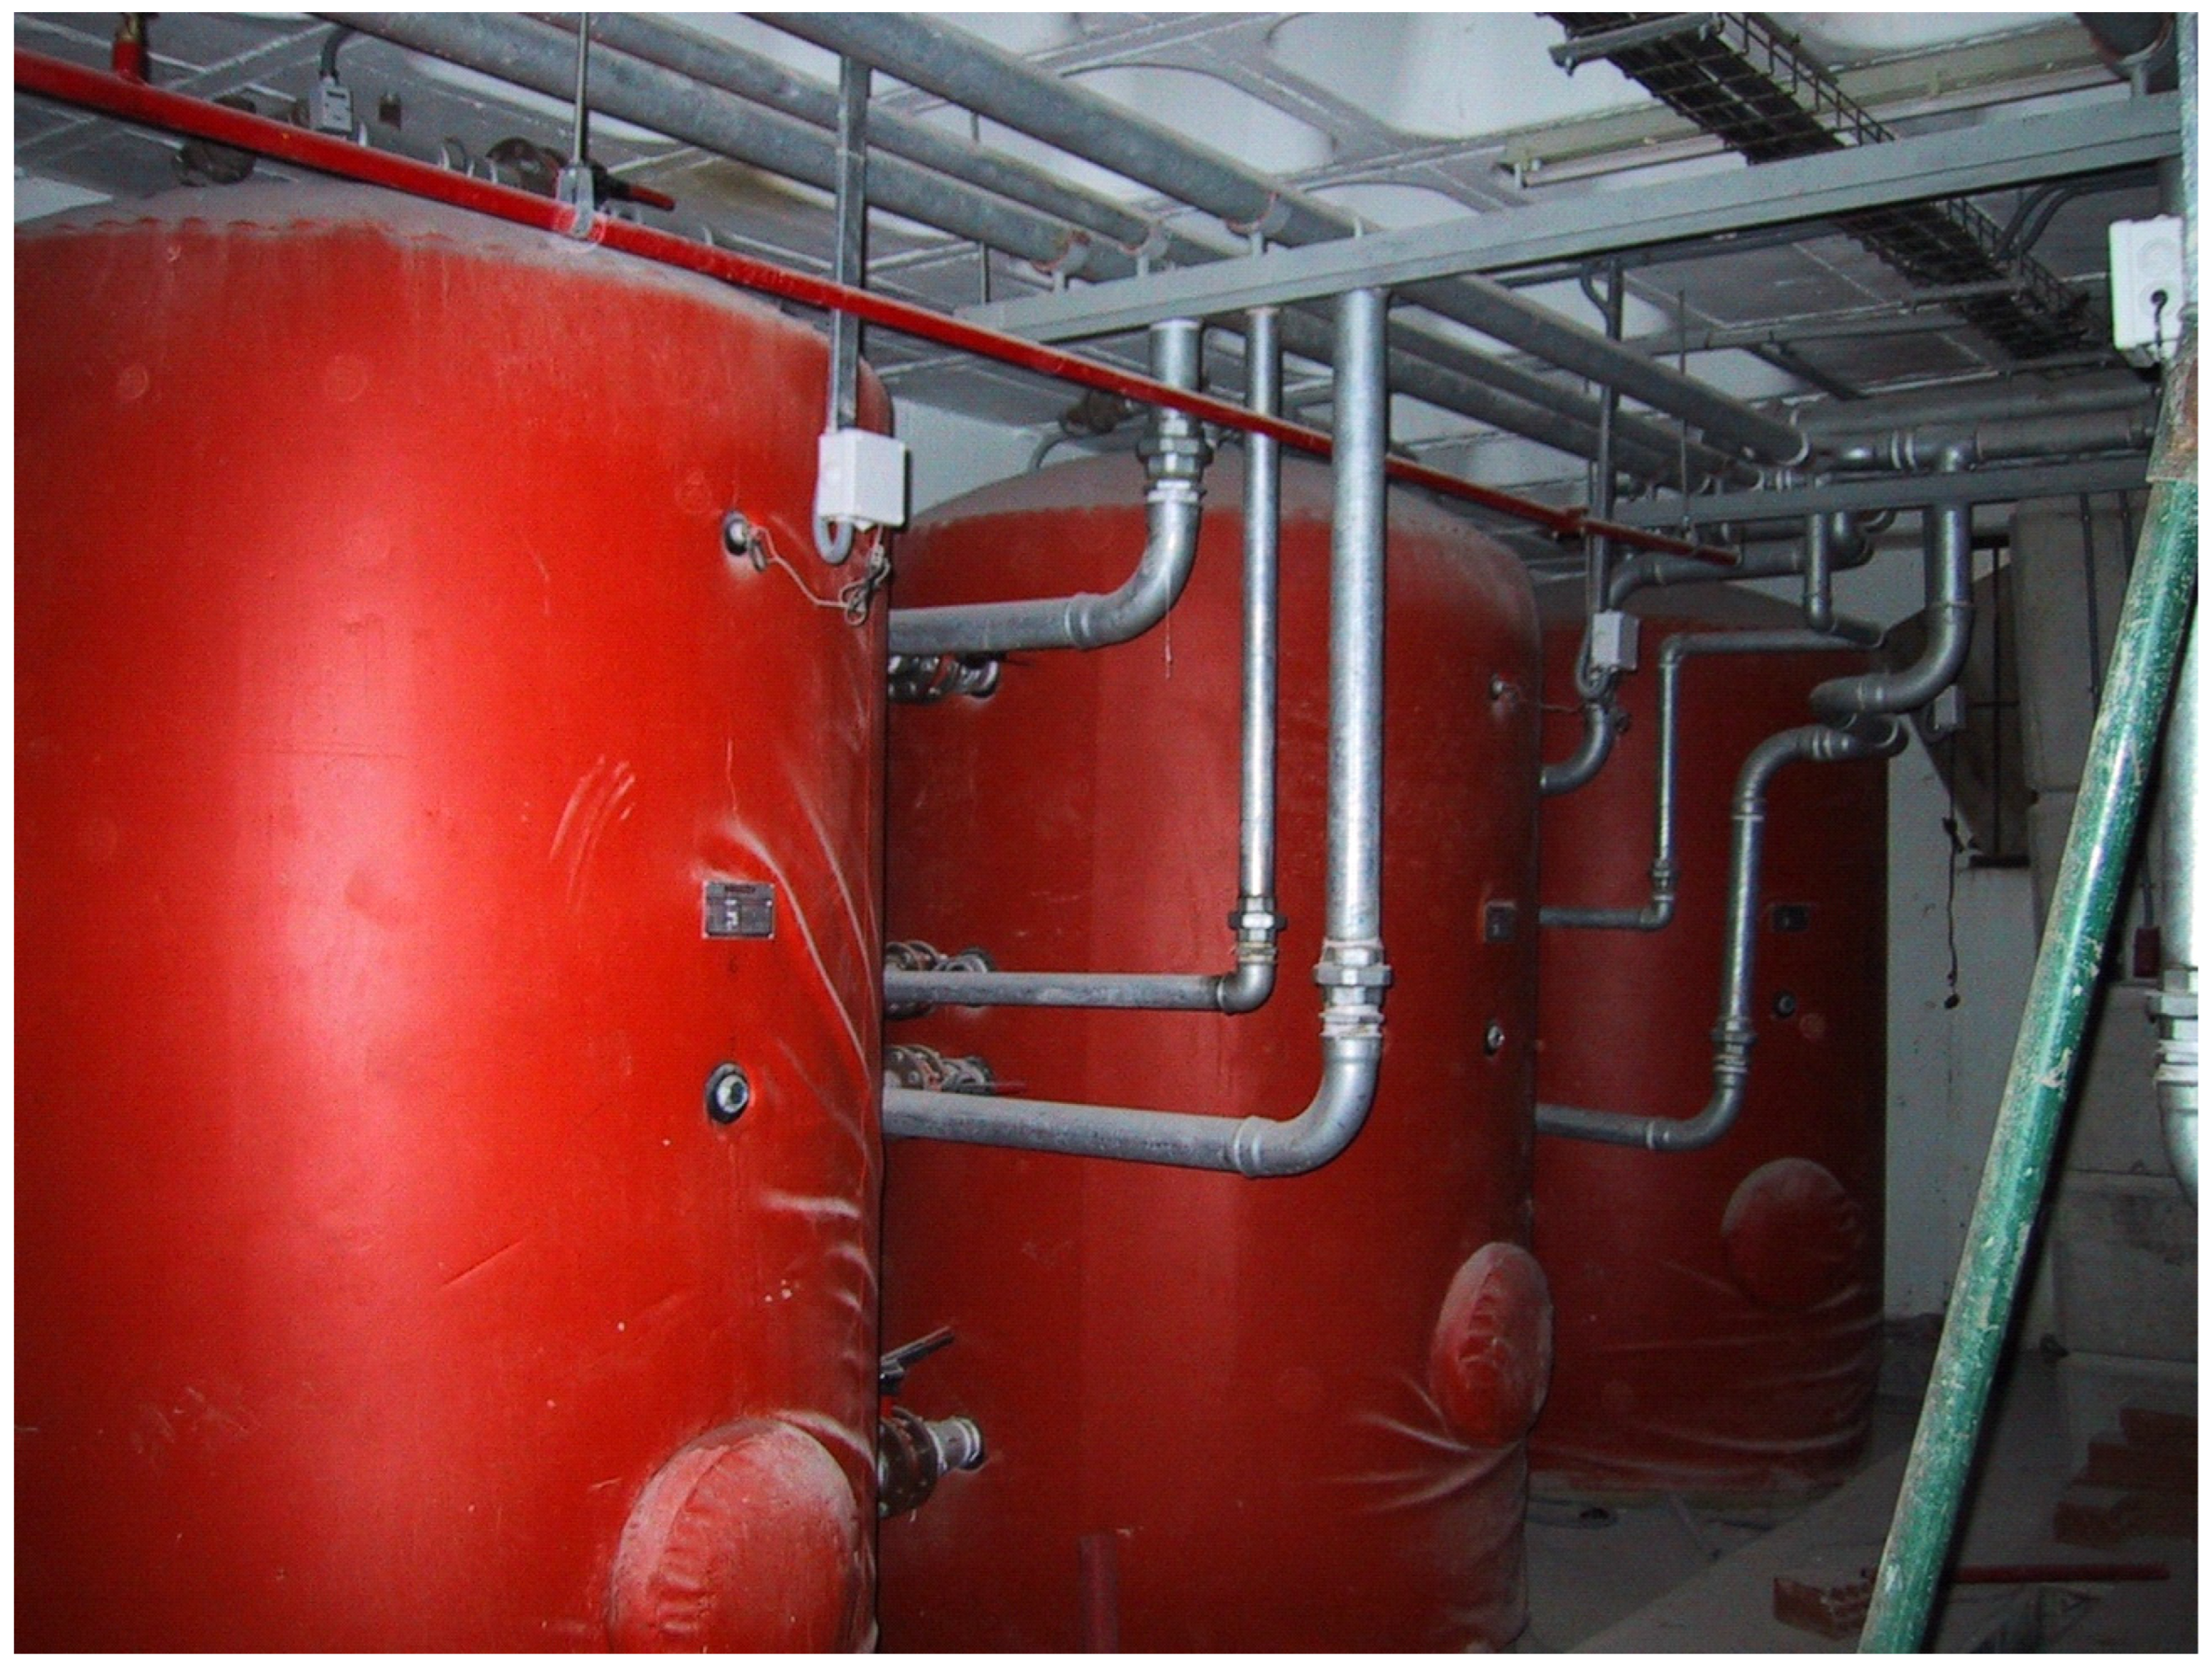
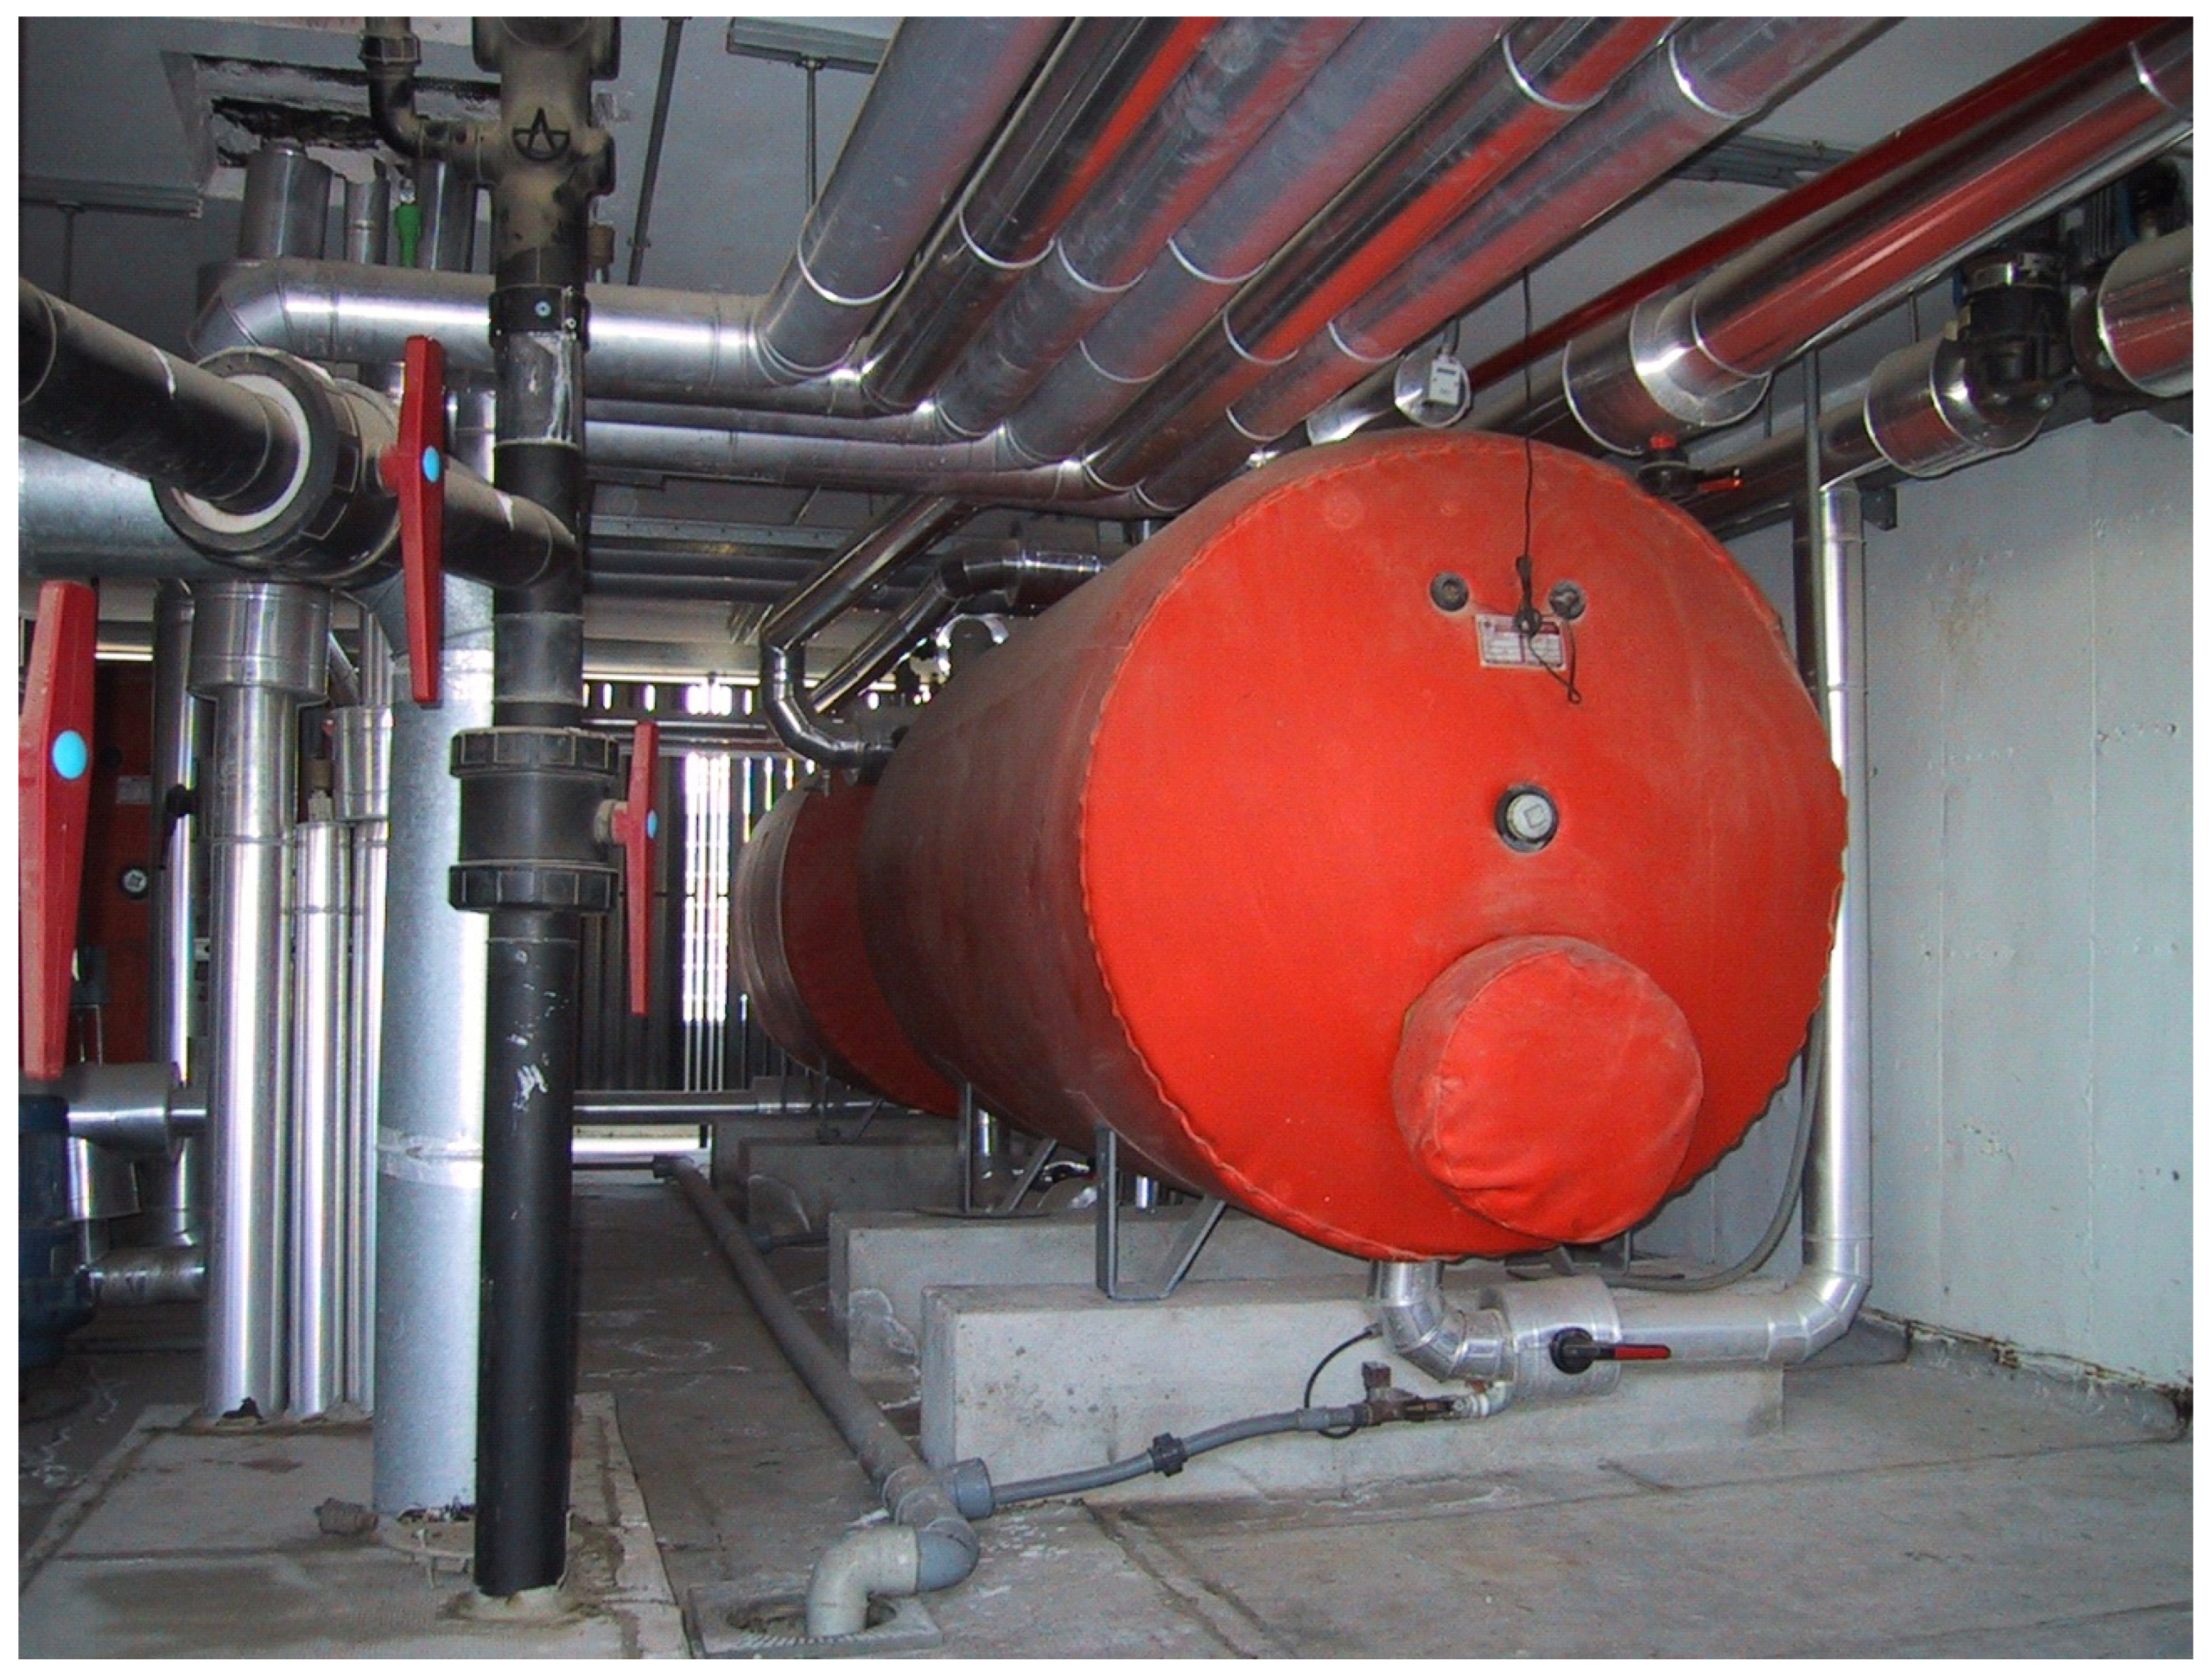
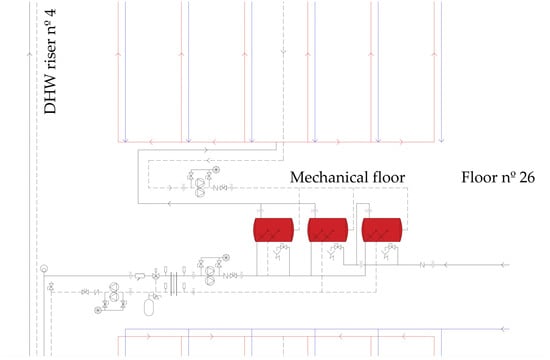
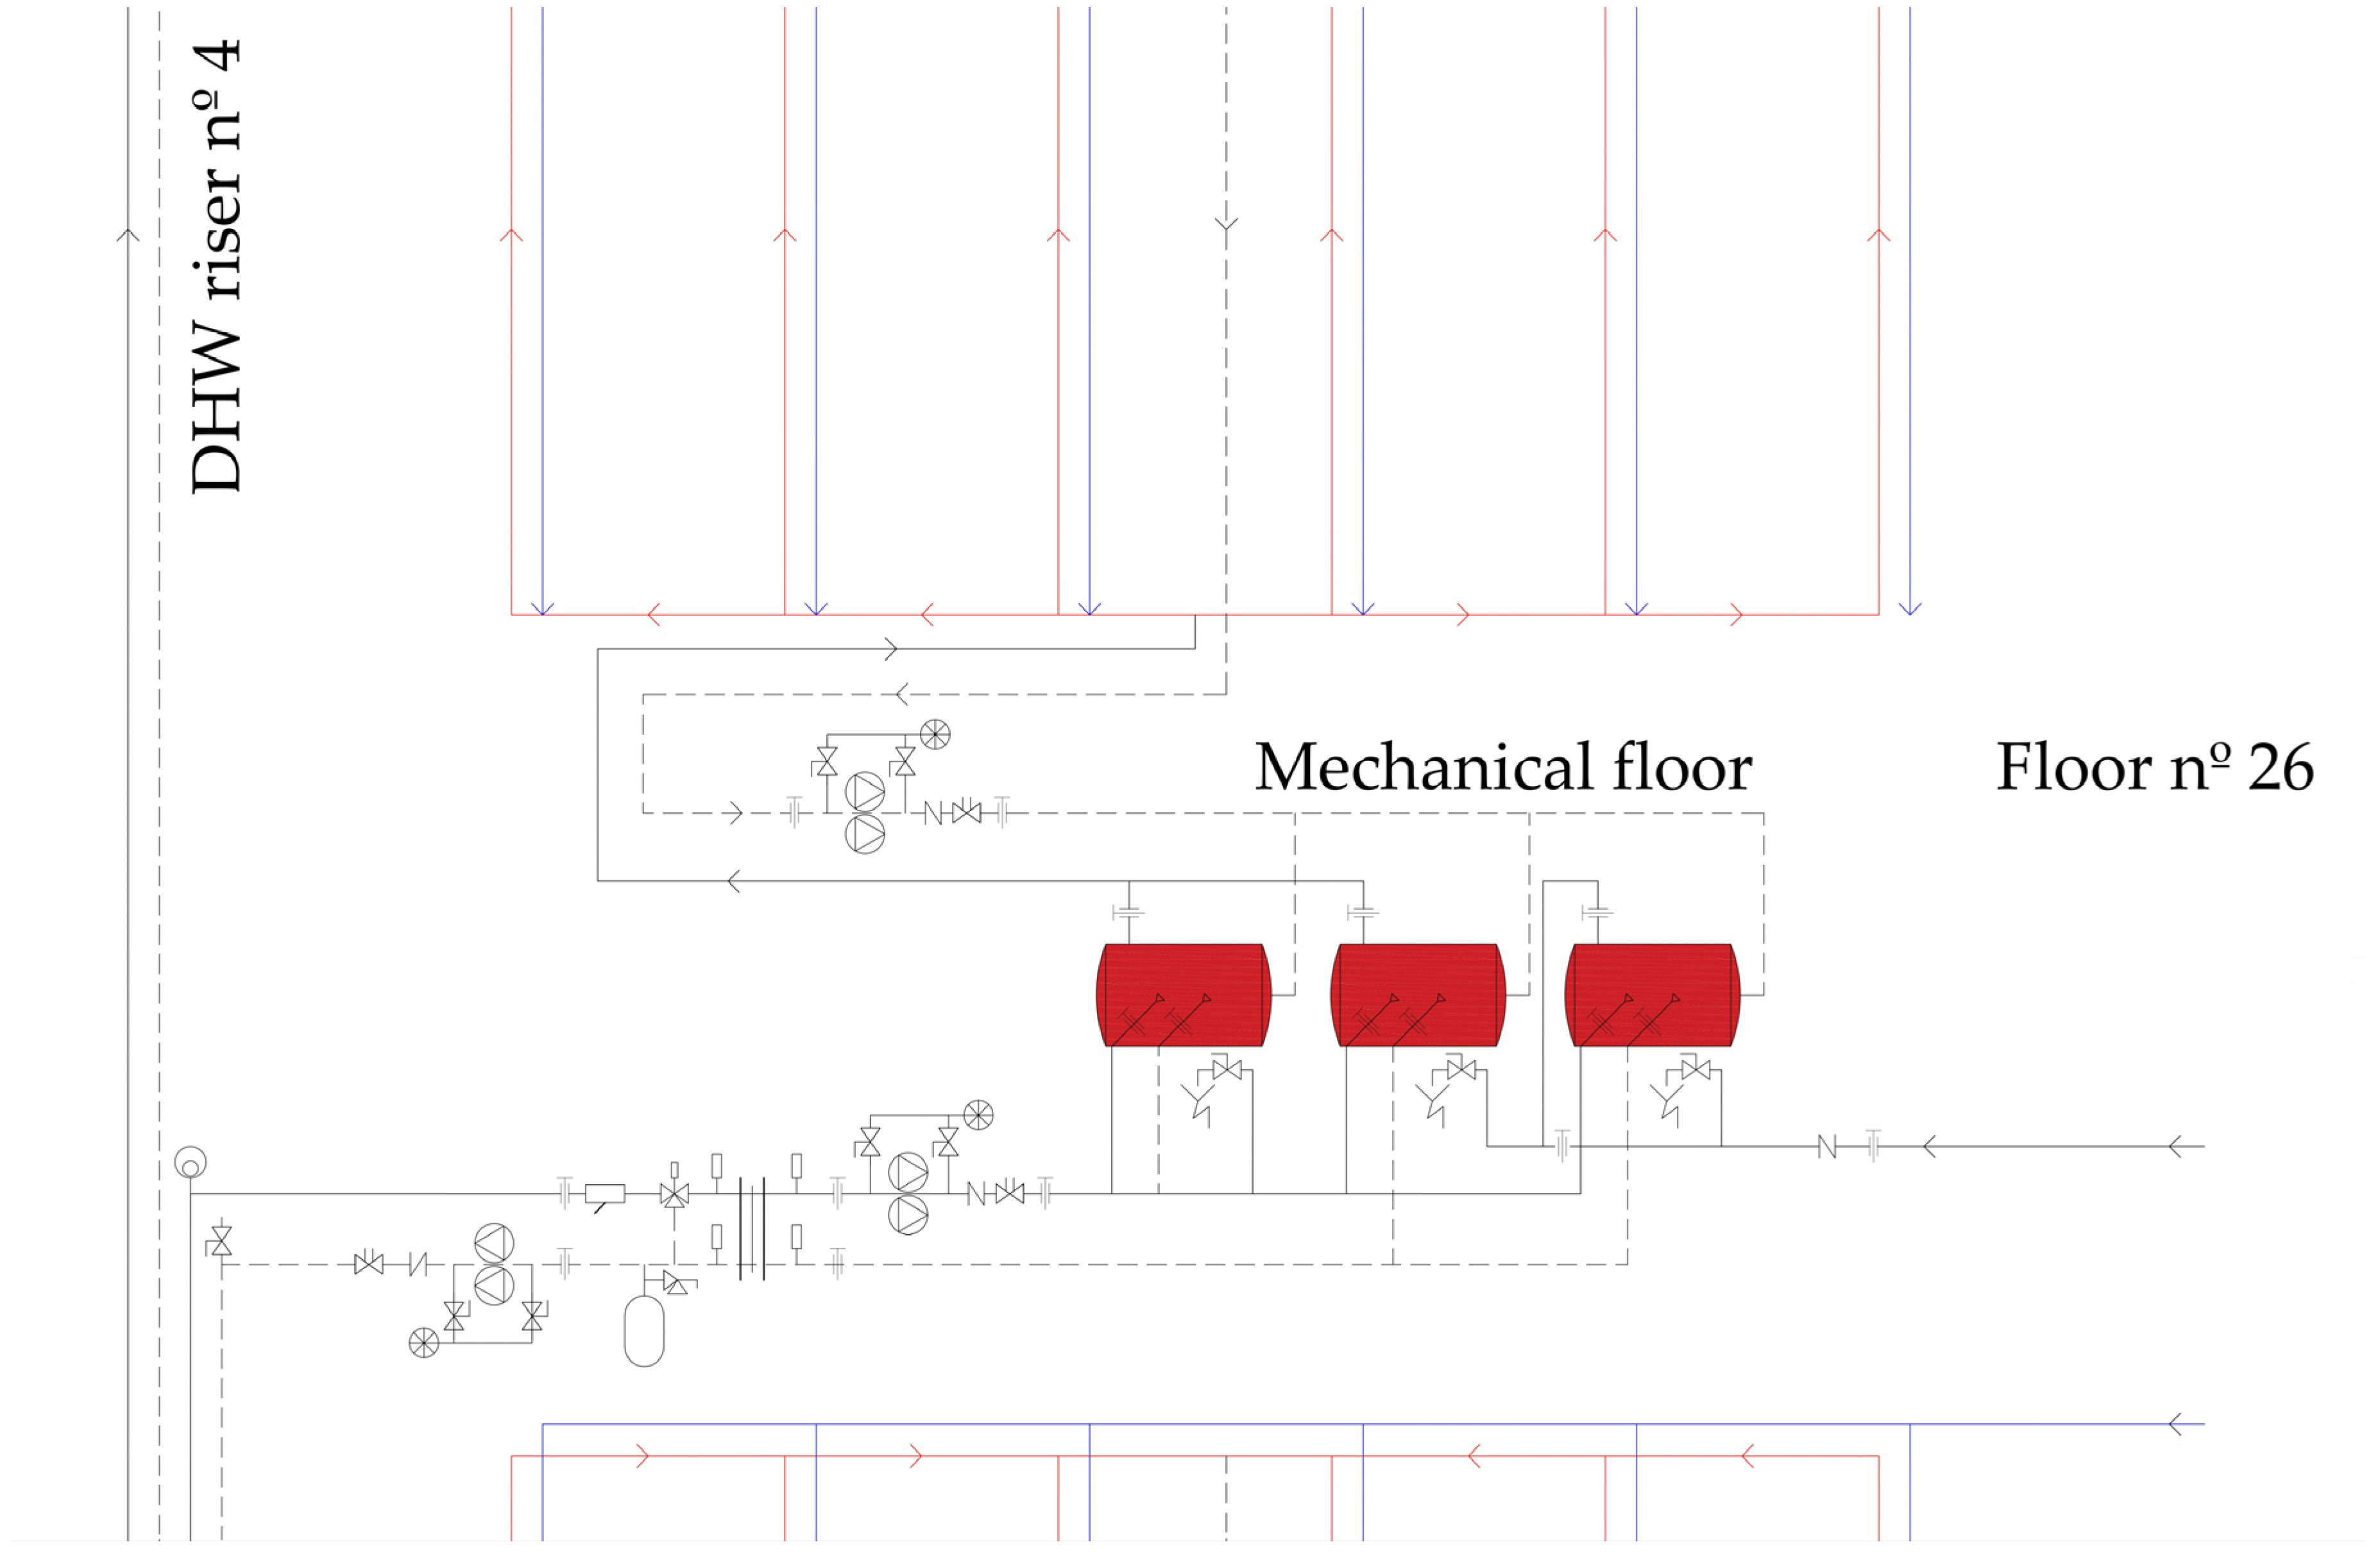
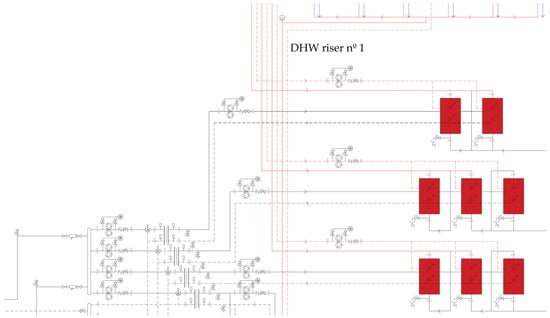
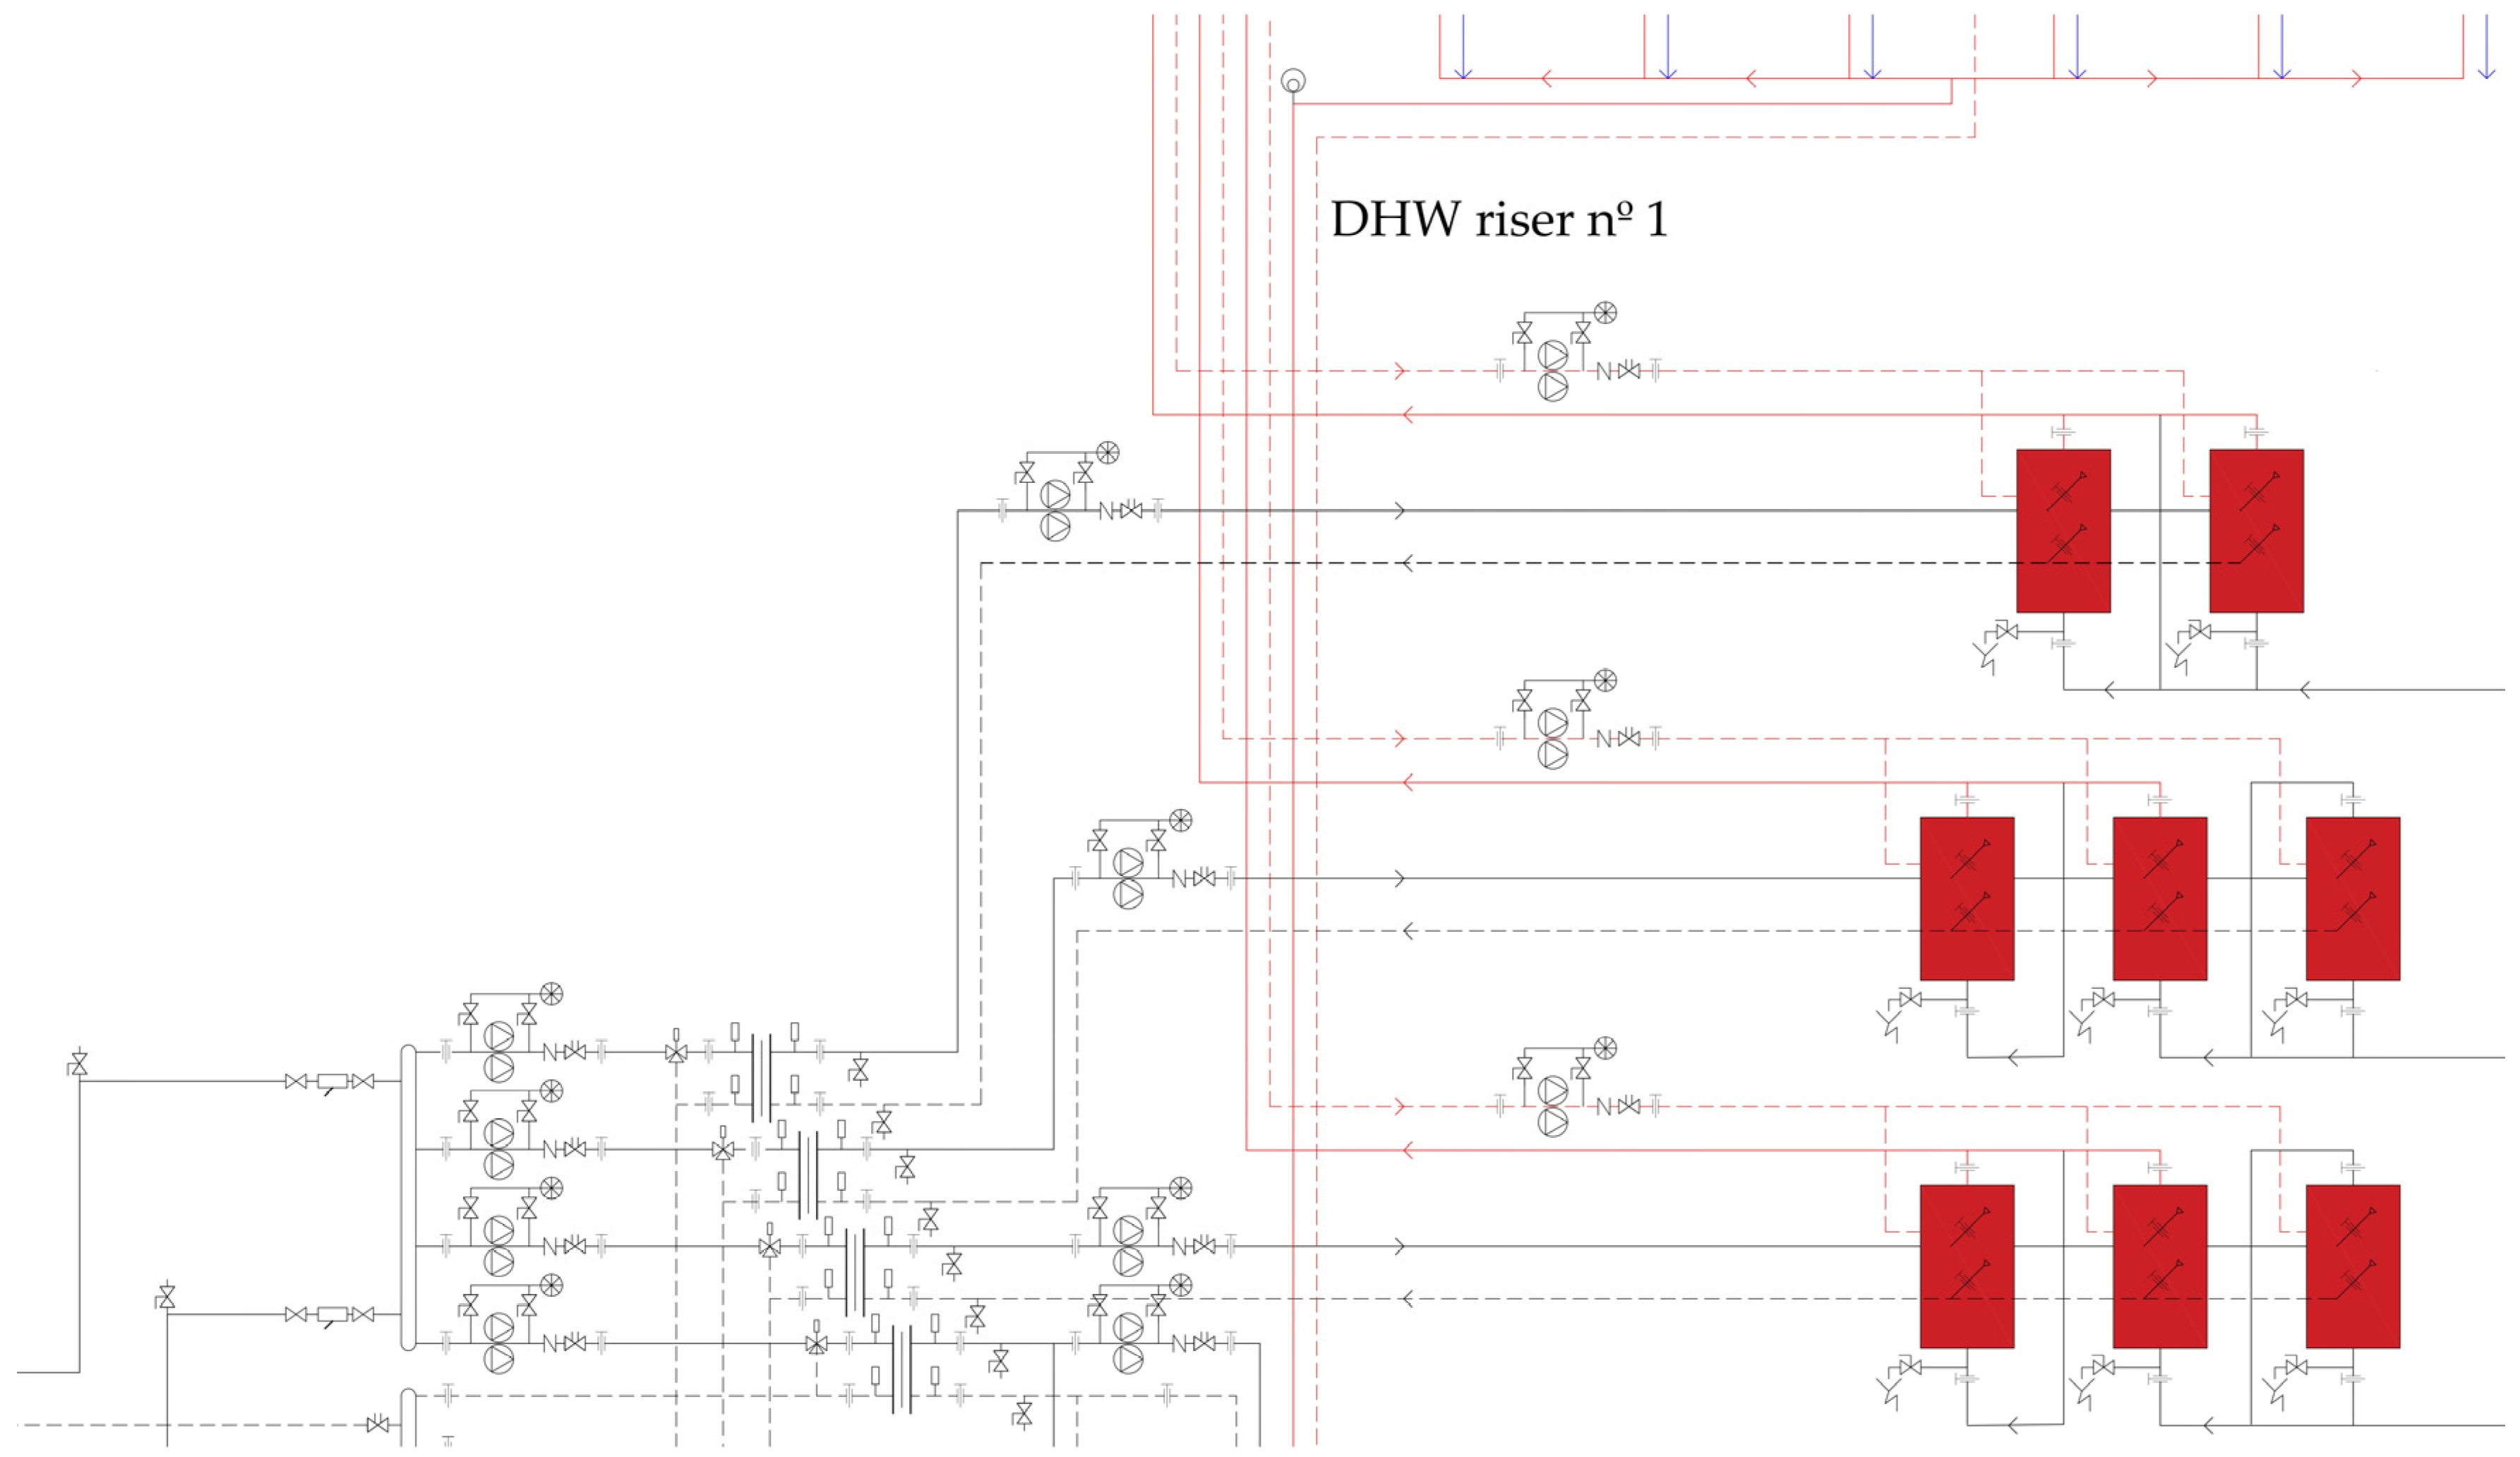
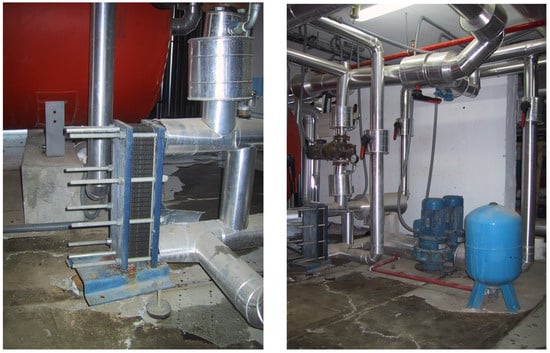
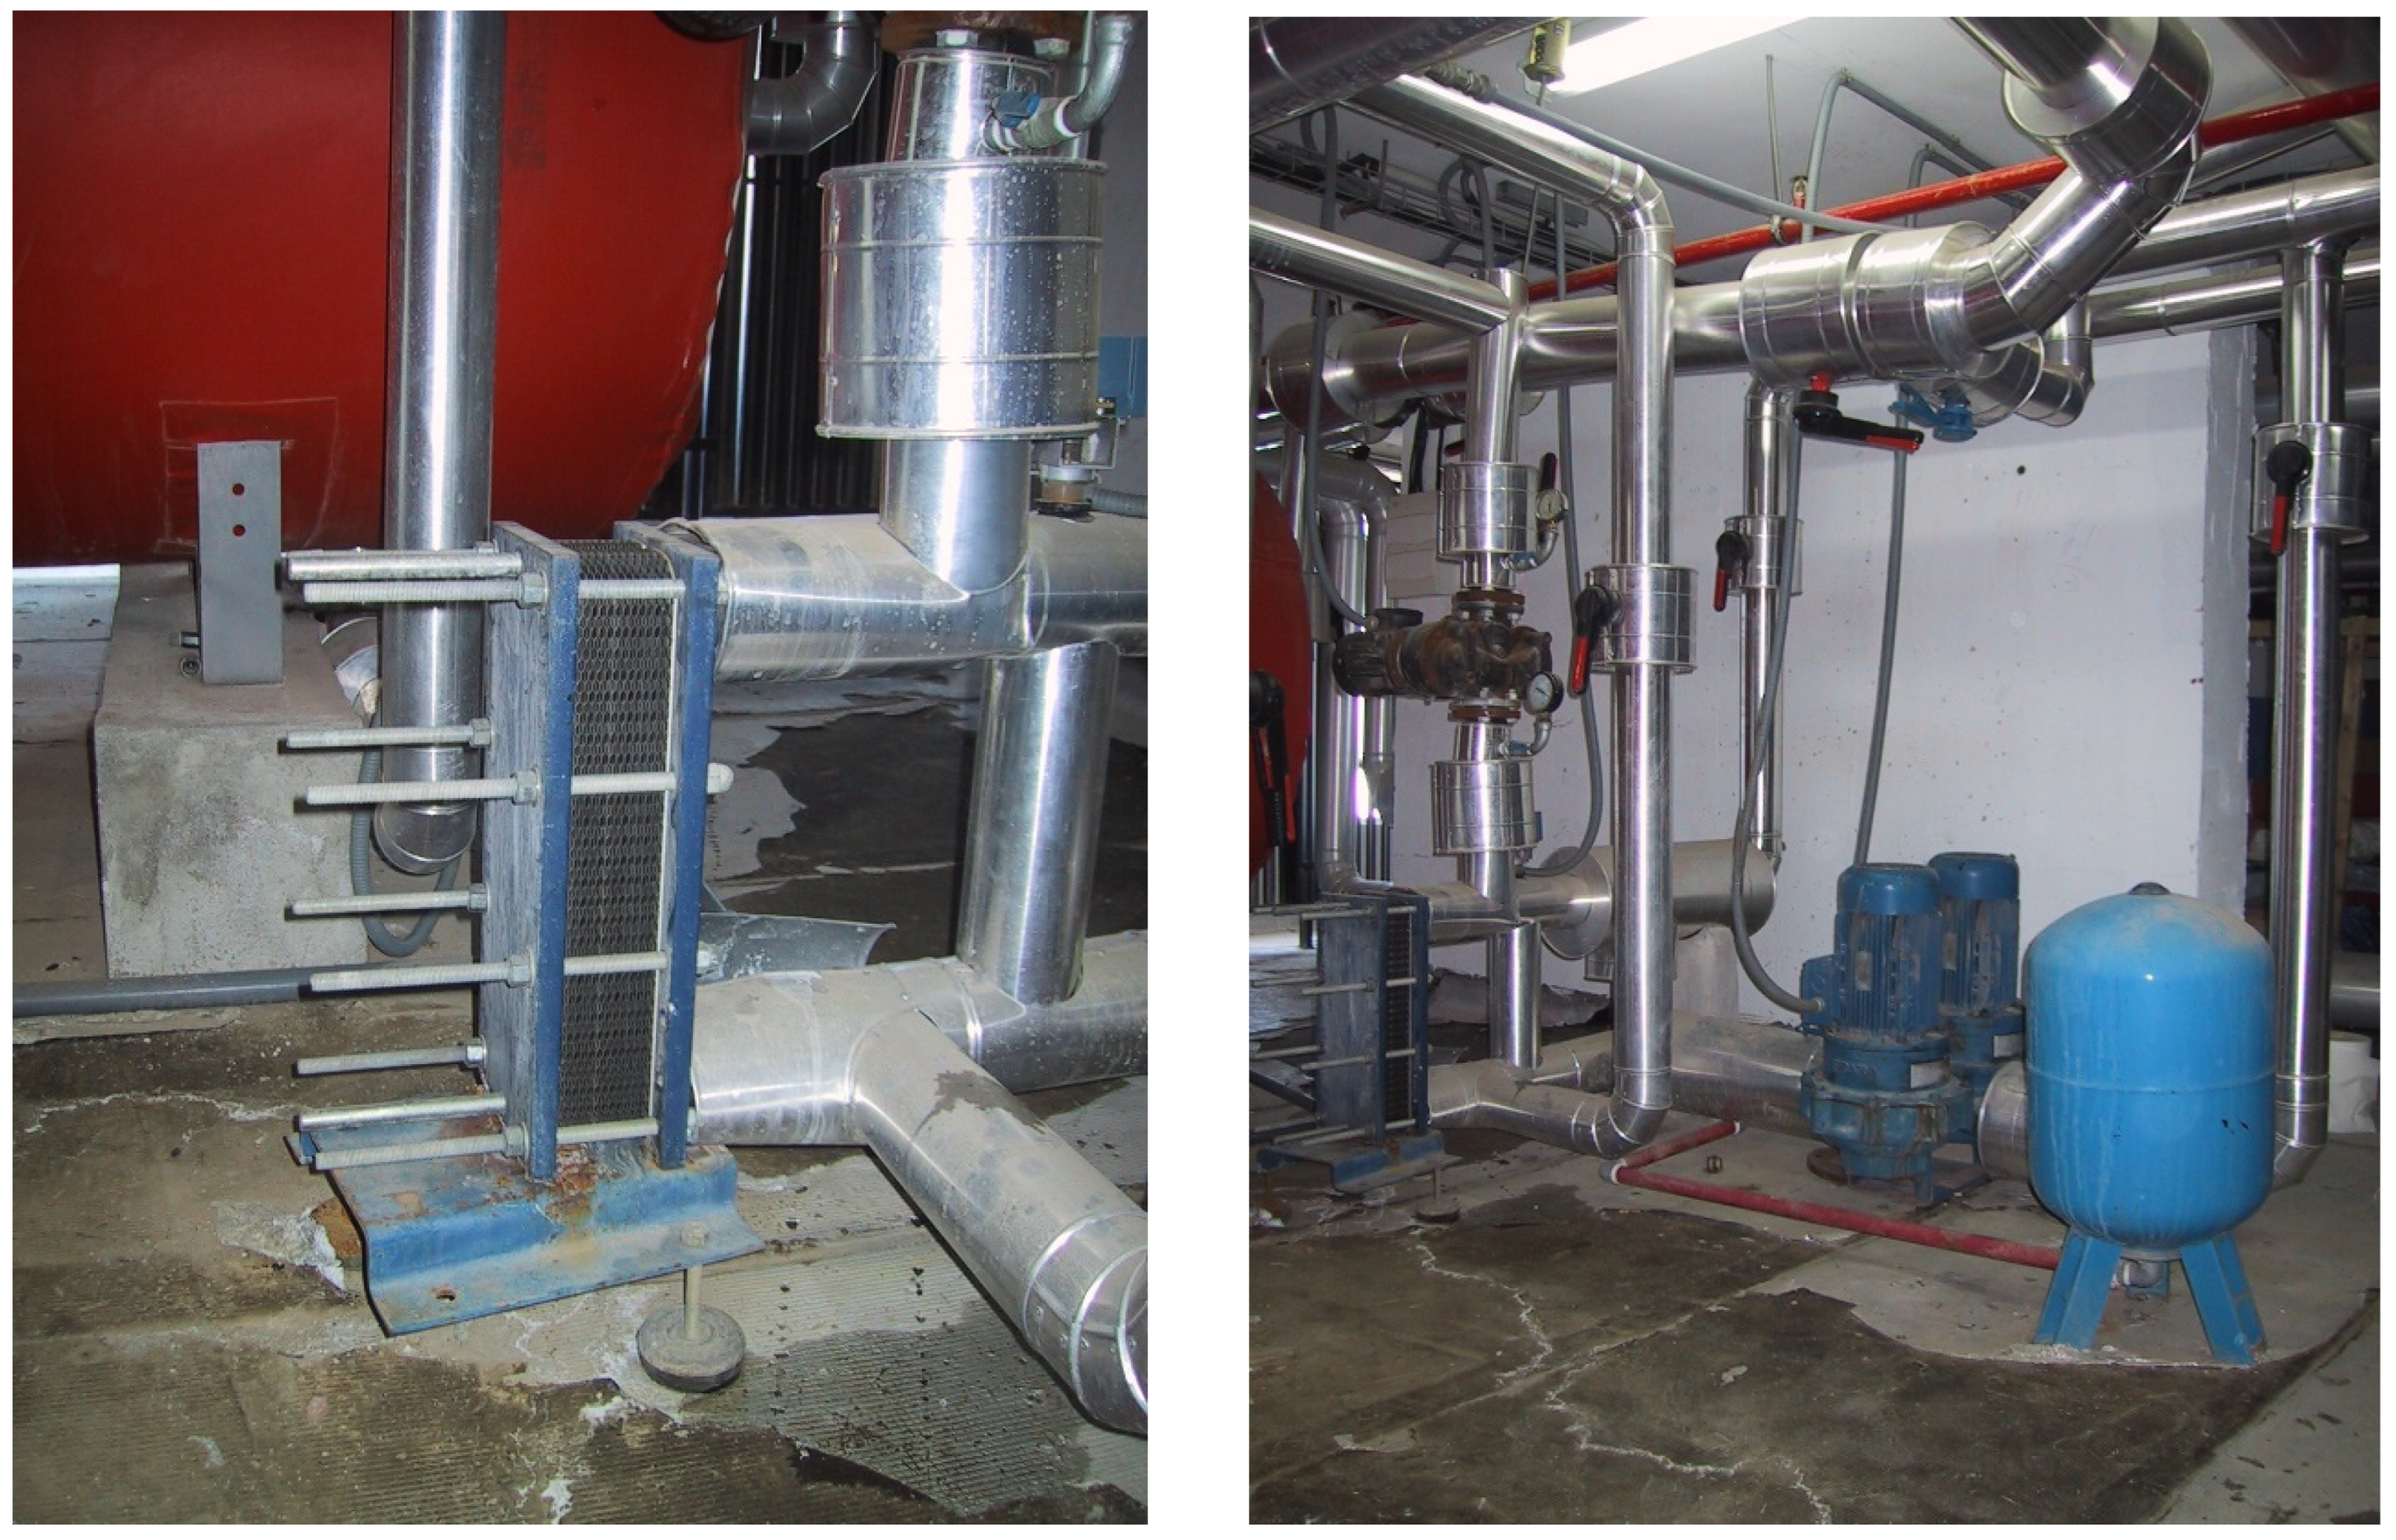
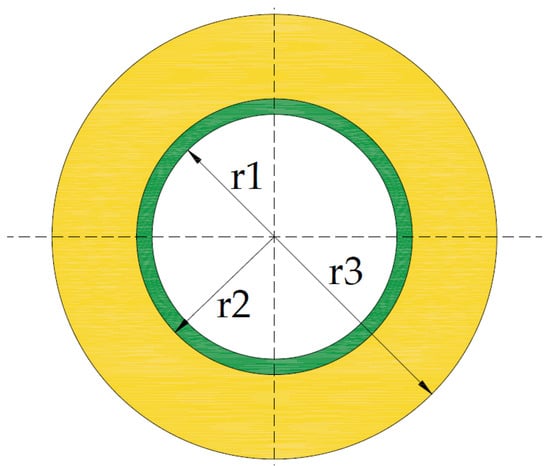
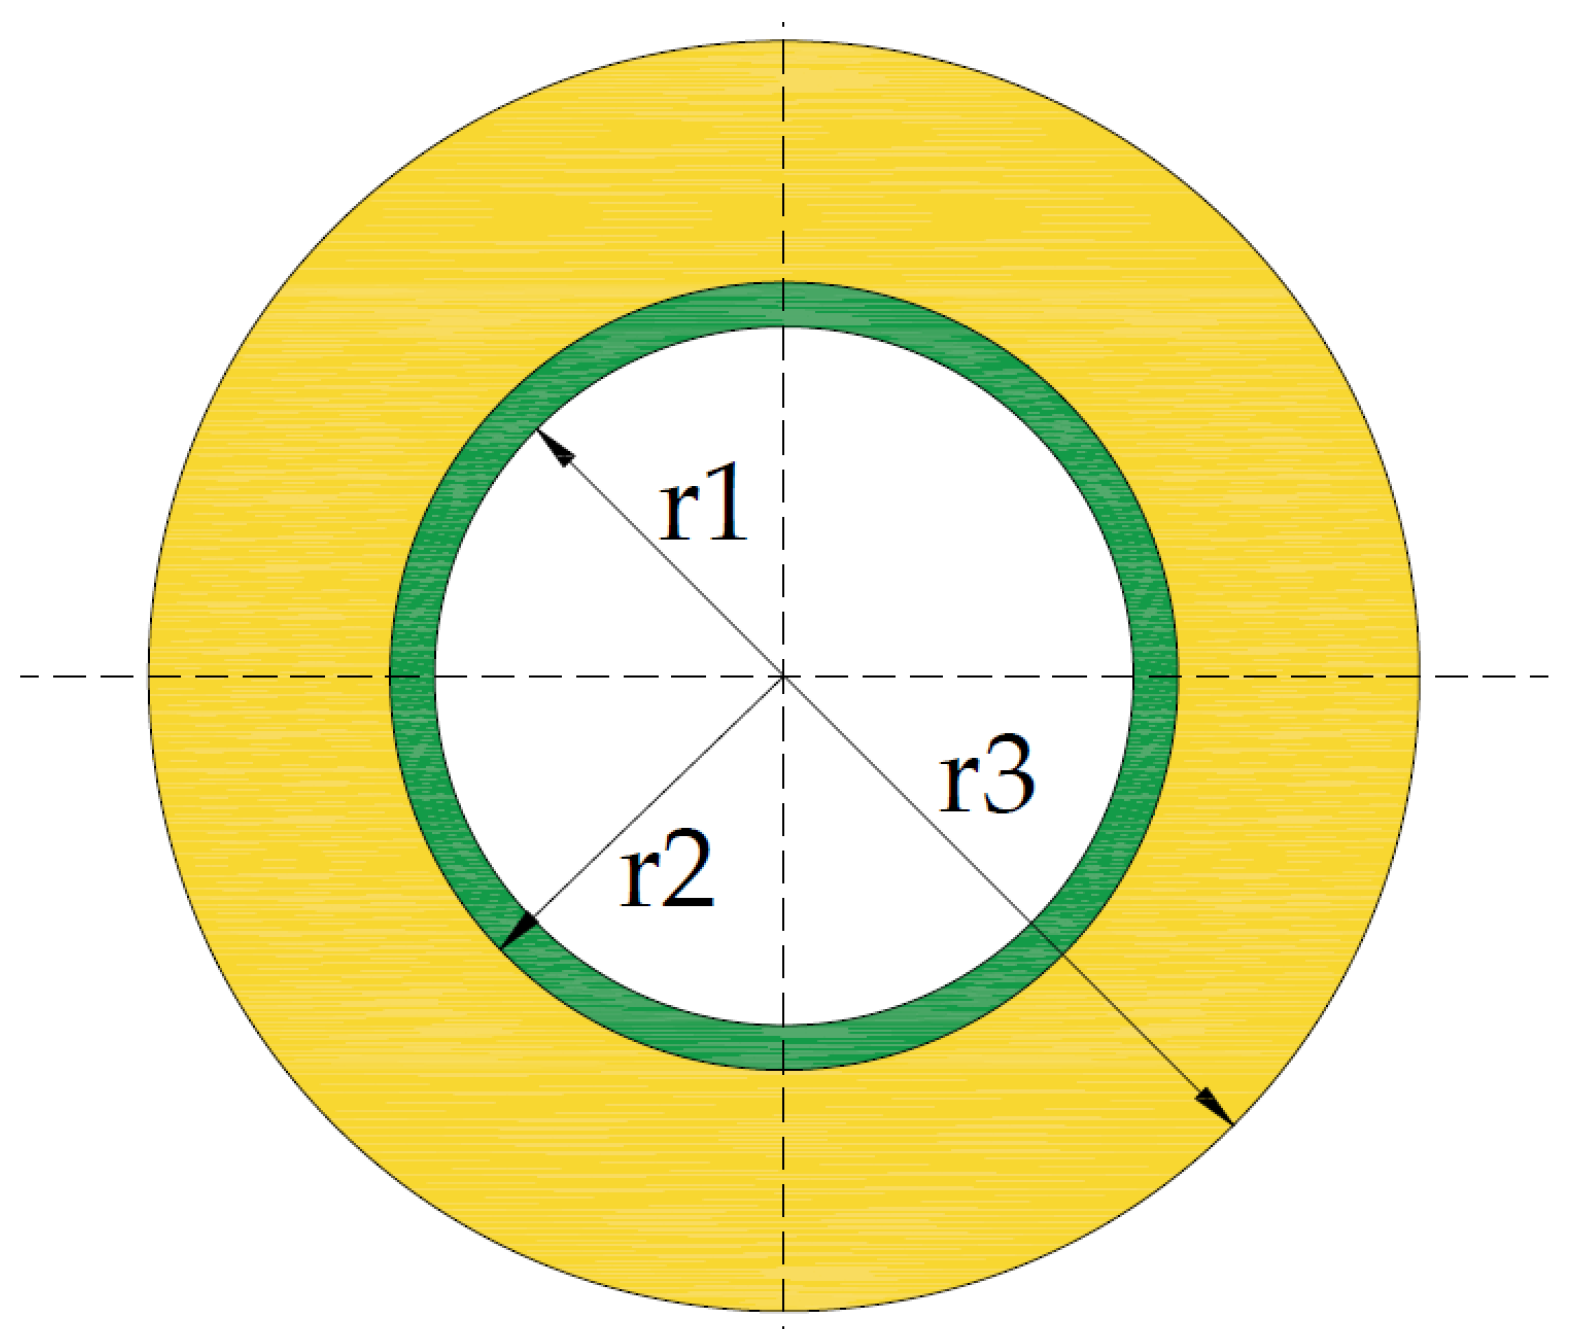
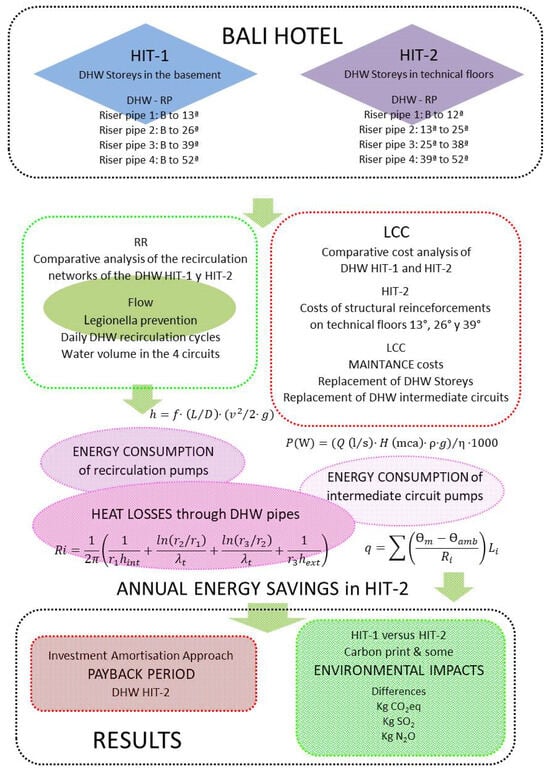
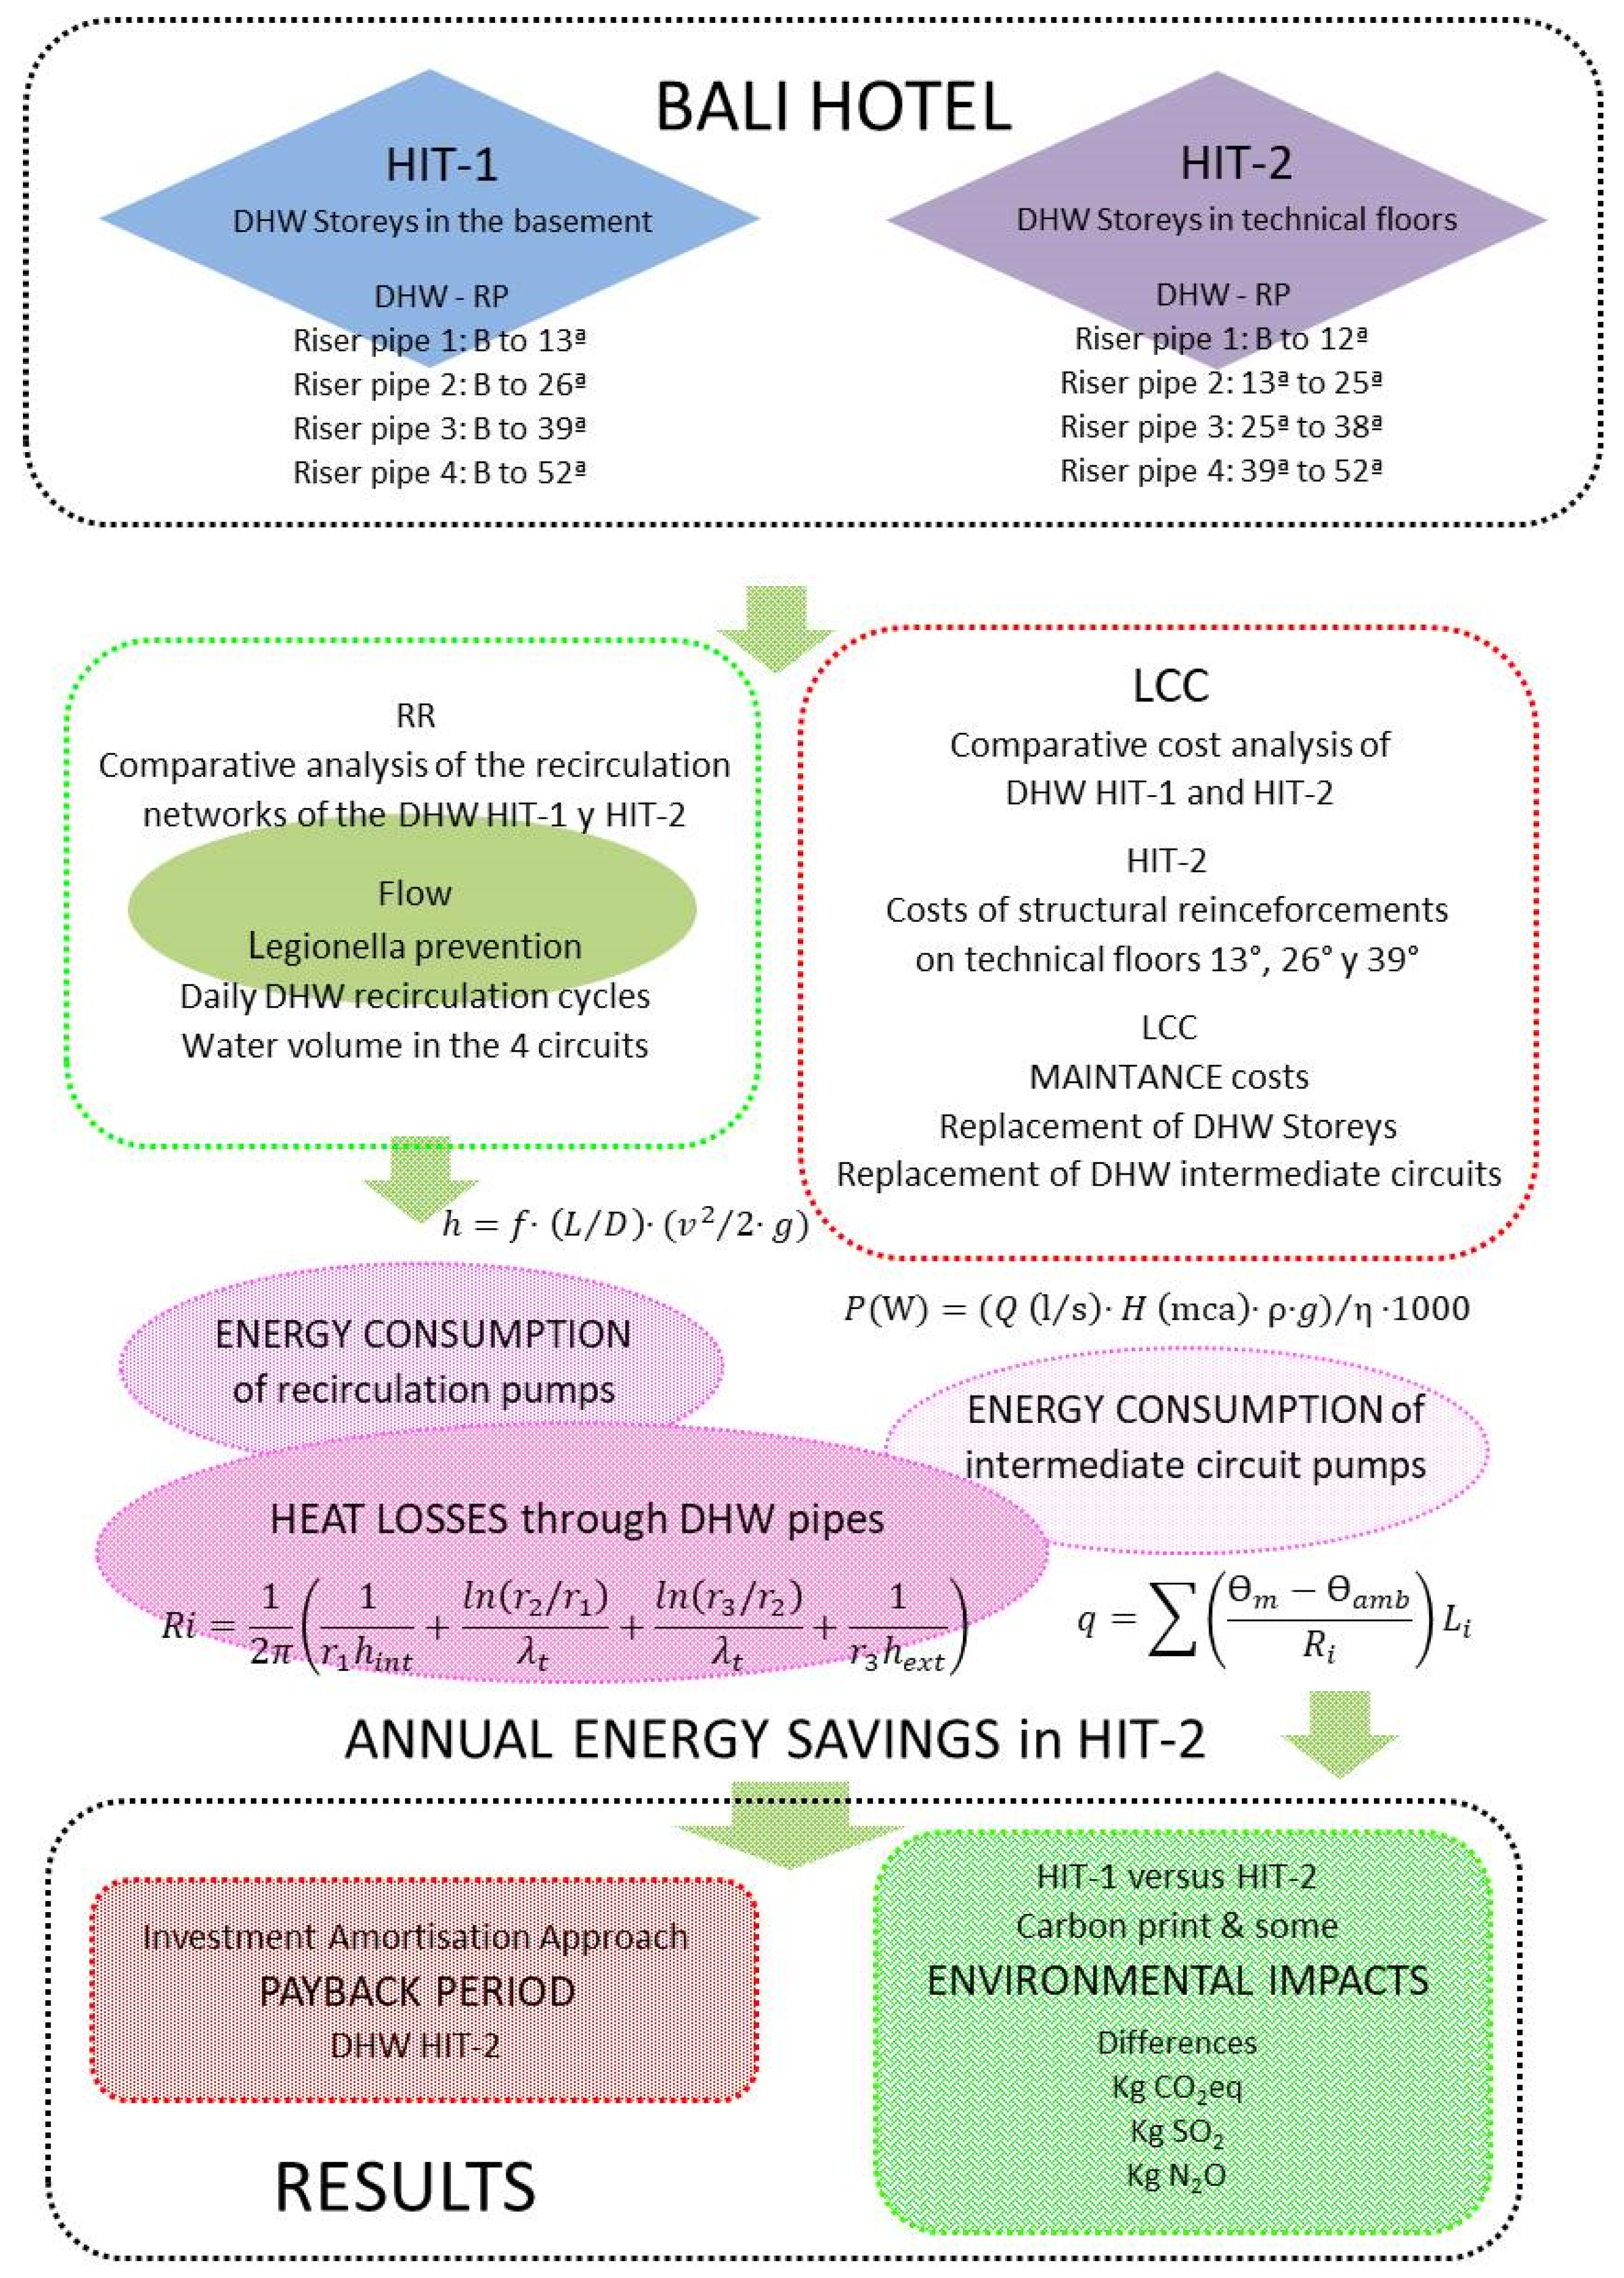
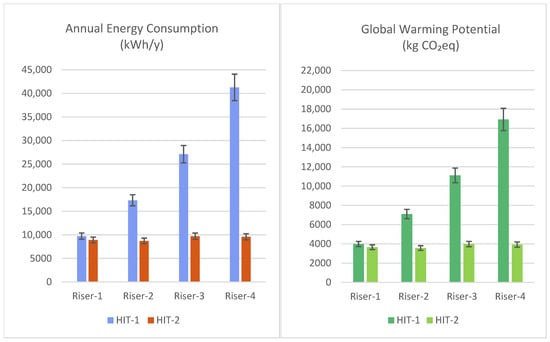
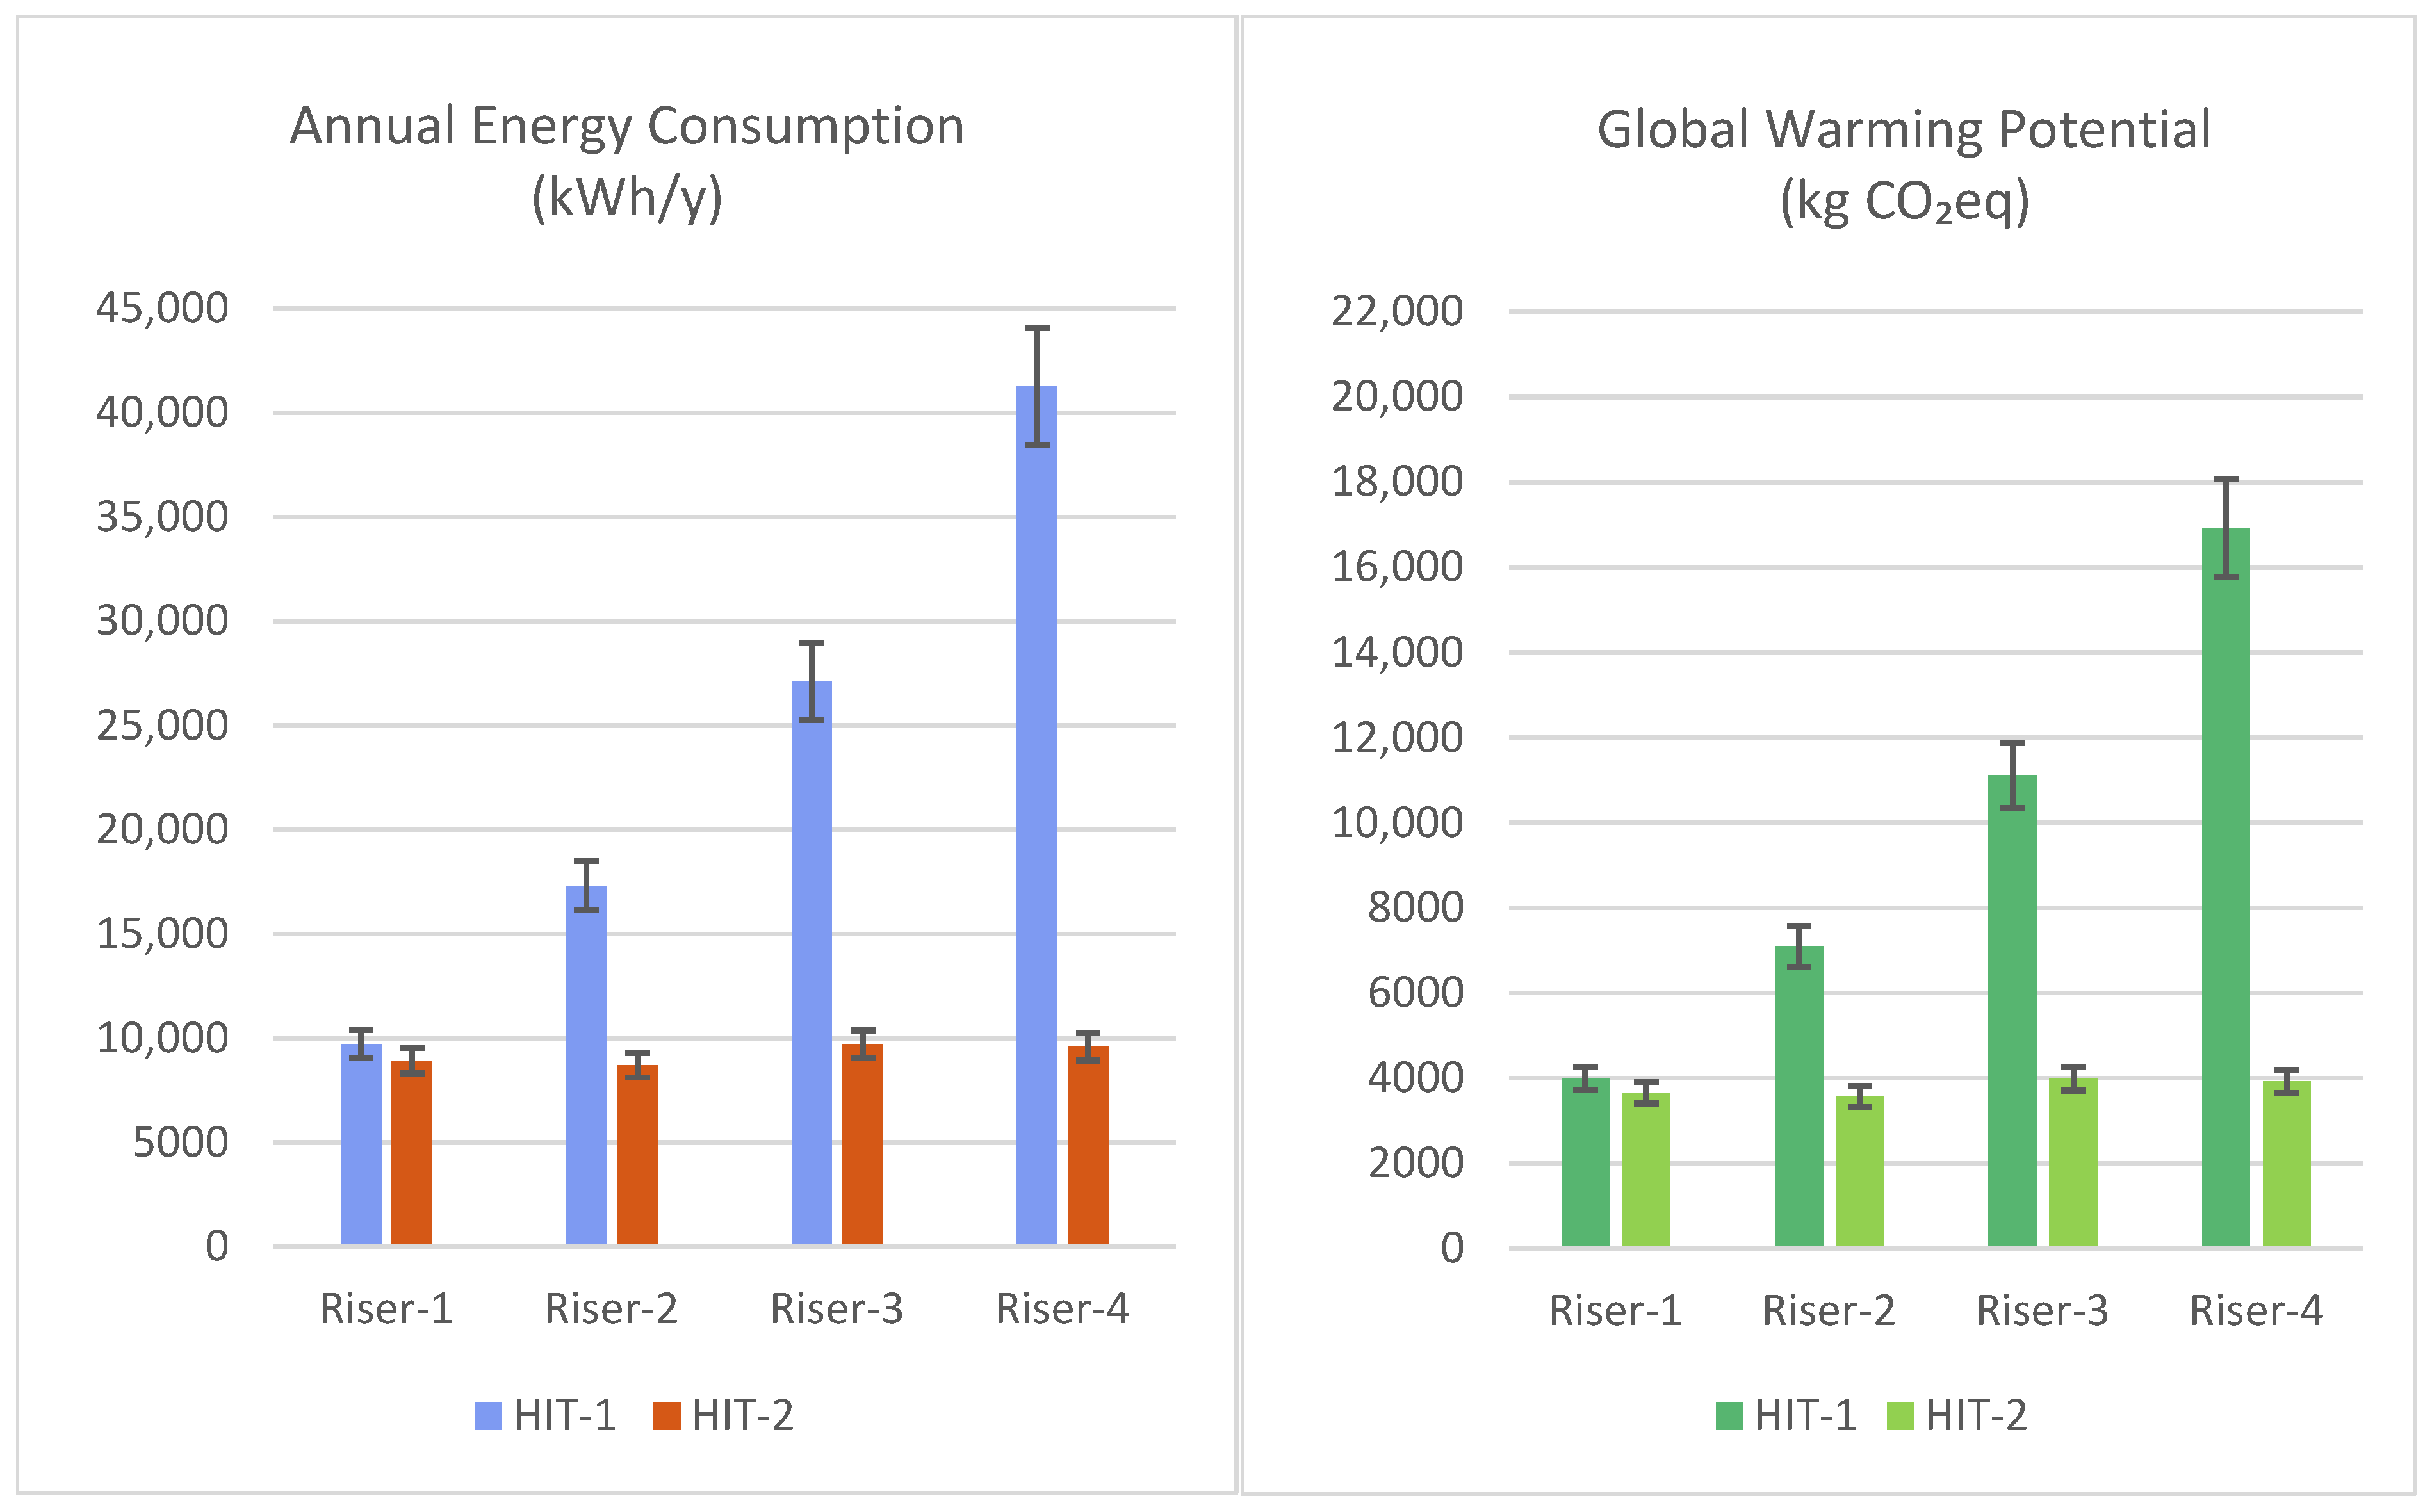

Disclaimer/Publisher’s Note: The statements, opinions and data contained in all publications are solely those of the individual author(s) and contributor(s) and not of MDPI and/or the editor(s). MDPI and/or the editor(s) disclaim responsibility for any injury to people or property resulting from any ideas, methods, instructions or products referred to in the content. |
© 2026 by the authors. Licensee MDPI, Basel, Switzerland. This article is an open access article distributed under the terms and conditions of the Creative Commons Attribution (CC BY) license.