


Abstract
Spatial function is critical to sustainable development in modern metropolises. Traditional spatial function patterns are mainly shaped by market forces, policies and zoning regulations. The role of human perceptual experience remains understudied. Taking Beijing as the study area, this study examines the relationship between public perception and spatial function. It focuses on how consistency or inconsistency between the two environments influences spatial function service value. A two-step method is adopted in this research. First, the Weighted Average Cluster Index (WACI) works to analyze the spatial clustering of points of interest (POIs). This provides a quantitative basis for identifying spatial functions from integrated multi-source data. Second, a CatBoost binary classification model is applied to evaluate consistency and interpret the driving mechanisms. Key findings are obtained: (1) Perceptual underestimation of agricultural and cultural POI is significant in urban–rural transition zones. (2) Global analysis identifies education, commercial and sports POIs as the strongest contributors to function recognition. Local analysis reveals heterogeneous effects of POI categories across spatial scales. (3) Positive synergies occur between education–commercial and leisure–scenic areas. Industrial zones show functional competition with leisure and scenic areas. Shapley Additive Explanations (SHAP) clarifies the causes of perceptual discrepancies. It emphasizes the impacts of diverse urban morphological features and their interactive effects on public perception. Accordingly, strategies are provided for urban planners and policymakers such as promoting functionally mixed layouts with high consistency. This study offers an alternative approach to improving spatial function efficiency towards a sustainable development of modern metropolises.
1. Introduction
Contemporary metropolitan areas include diverse functional zones with dynamic interactions. Spatial function mixing forms the basis of urban environmental complexity [1,2]. Urban expansion leads to increasingly intricate spatial function structures [3]. Market forces exert a strong influence on spatial functions. These forces drive profit-oriented location choices. Such choices may create synergies or lead to spatial segregation [4,5]. The externalities of spatial functions and demands for public goods encourage government intervention. The authorities shape spatial functions through urban planning, zoning policies and regulatory frameworks [6]. Policies, laws and corporate investments are key determinants of spatial resource allocation and economic benefit distribution [7].
In addition to this, spatial function is also affected by public perception. Service value of spatial function can be defined as the utility of urban space in satisfying public needs. It is calculated by the consistency between spatial function and public perception. Higher spatial function service value indicates more efficient use of resources and vice versa. In this research, spatial function is reflected by the geographic distribution of points of interest (POIs). Public perception is represented by social media comments.
Consistency describes the matching degree between spatial functions and public perceptions across different areas. It measures how the public recognize spatial functions based on daily experience rather than formal planning schemes. Individuals interact continuously with urban spaces. These interactions drive changes in spatial function patterns [8,9]. Many urban spaces evolve beyond their original design purposes. For instance, an open square initially designed for leisure may gradually evolve into an informal marketplace, shifting from a recreational space to a commercial one in public perception. Similarly, a university entrance originally intended as a transportation node may develop into a hub for campus activities. Such changes increase the divergence between planned and actual spatial functions. This trend is particularly obvious in complex built environments [6]. Divergence between plans and perceptions can improve spatial flexibility. It may also lead to negative outcomes. These outcomes include traffic congestion, reduced spatial performance, noise pollution and weaker management. These problems eventually lower the overall urban living experience [10,11].
Spatial function has become increasingly complex. It has moved beyond simple separation of industrial and residential areas. Different functions now mix frequently [12,13]. A key question concerns which functions should be integrated or separated to maximize public benefits. Answering this question is critical for improving spatial function service value, as well as balancing economic growth and resident well-being.
The integration of multi-source data helps address this question. POI works to record locations of human activities [14]. Such data has become widely used to identify spatial functions [15]. Previous studies mainly use POI frequency to estimate spatial function or evaluate real estate values [16]. POI supports the analysis of dynamic urban functional complexity according to its availability and granularity [17,18,19]. Social media data, especially user-generated content, is another data source for urban studies. Quantitative analysis of location-based data reveals activity structures [20]. It also supports the exploration of how spatial function shapes public perceptions [21]. The use of check-in data improves understanding of polycentric city structures as well as explains human interactions with urban centers [22]. Non-location-based data supports the understand of subjective public perceptions. Social media contributes to a more comprehensive knowledge of the built environment [23] and urban dynamics [24].
Growing urban complexity and diverse data sources support the use of machine learning. Machine learning provides tools to extract insights from large volumes of structured and unstructured data [25]. It is applied to predict spatial features, assess spatial quality [26] and analyze spatial dynamics [27]. Studies have integrated street greenery imagery [28], mobile data reflecting human dynamics [29] and remote sensing data for green space mapping [30]. Machine learning has the capability to analyze the spatial function and its relationship with public perception [31]. However, many machine learning models are viewed as black boxes due to limited transparency [32]. Explainable artificial intelligence (XAI) is developed to improve model interpretability.
Current XAI methods fall into two categories. These categories are intrinsically interpretable models and post hoc interpretation models. Intrinsically interpretable models such as decision trees show how each feature affects predictions [33], while lacking sufficient predictive ability for complex scenarios. Post hoc interpretation models explain complex models after training. Methods such as Locally Interpretable Model-agnostic Explanations (LIME) generate explanations by approximating model processes [34]. Some of these methods lack a robust framework for fair feature importance assignment [35].
Shapley Additive Explanations (SHAP) offer an alternative approach based on cooperative game theory. It is believed that SHAP analysis helps explain the influence of each feature, making the model predictions more interpretable [36]. The ability to quantify individual feature contributions makes SHAP suitable for complex urban systems. It has been applied to multi-level urban space analysis [37], climate change studies [38] and spatial resource allocation [25]. The method has the potential to explain discrepancies between the built environment and the perceived environment. It explains how factors such as accessibility and amenities shape urban experiences, and why individual perceptions differ from objective built environment characteristics.
Thus, the research purpose is to explore the relationship between public perception and spatial function in Beijing, focusing on how their consistency or inconsistency influences the service value of spatial functions. It introduces the Weighted Average Cluster Index (WACI) to improve spatial function service value. Existing spatial clustering indices, such as the Average Cluster Index (ACI) and Kernel Density Estimation (KDE), focus mainly on dense POI types. These indices may neglect differences between identified and actual spatial function. WACI includes several improvements. It introduces the distance decay hypothesis to quantify spatial clustering. Clustering indices are weighted by global and local functional prevalence to identify dominant spatial functions while retaining rare but important categories. Accordingly, this study attempts to build an integrated pathway using POI, social media data and explainable machine learning. The pathway identifies spatial functions from both physical and perceptual dimensions rather than some existing methods concerning a single dimension. In order to achieve this, the CatBoost model works to quantify consistency between spatial functions and public perception. The model could perform well in handling categorical features and capturing nonlinear relationships [39]. The CatBoost-SHAP approach helps to reveal the synergistic patterns such as mixed commercial, residential and educational function, as well as segregation between industrial and recreational functions. The findings are expected to provide evidence for urban planners and policymakers to align public perception with spatial functions and move towards an efficient use of land resources.
2. Methods
2.1. Research Site and Data Collection
2.1.1. Research Site
Beijing is the capital city of China. It is located in the northern part of the country. Beijing serves as the core city within the rapidly developing Beijing–Tianjin–Hebei metropolitan area. Since the 21st century, Beijing has undergone substantial urban expansion. The city now supports a population of more than 20 million people. It presents a complex built environment with diverse urban spatial functions that respond to the evolving needs of residents. Figure 1 presents the official Beijing Municipal Land Use Plan Map [40] from the Beijing Urban Master Plan (2016–2035). Generally, the northern and western mountains are wild parks to safeguard ecological integrity, meanwhile the southeastern plain hosts the main built-up areas, including the central city and Beijing sub-center to relieve non-capital functions from the central city. Due to the large scale of the entire city, the classification of land use in the official master plan is relatively rough with residential, commercial and business, utility, scenery, wild park, and city park sections. Natural components, such as mountains and water, and artificial infrastructure, such as roads, are also included in the official planning.
Figure 1.
Beijing Municipal Land Use Plan Map. Source: Beijing Municipal Government.
This study conducts spatial function analysis at the sub-district street (Jiedao) level. Compared to the whole urban scale, the street scale is conducive to establishing a connection with public perception, avoiding rough calculation results. The communities and neighborhoods below the street scale are too small to understand statistical trends. Therefore, the research focuses on the street scale. This scale supports detailed analyzing of spatial functions without excessive granularity and ensures practical value for functional analysis in urban planning.
2.1.2. POI Data Collection
A total of 517,208 geotagged POIs were collected through application programming interfaces from Baidu Map Services V3.0. Baidu Maps geocoding service has been widely used in geospatial research. Its accuracy has been supported in previous studies [41]. Baidu Map Services provides a sufficient data source for spatial function analysis in this study. The volume of POI data meets the research objectives while supporting cost-effective data acquisition. In real practice, it is found that geocoding errors mainly appear in rural peripheral areas with vague physical boundaries. These errors are limited to small villages and can be neglected at the sub-district street level. Future improvements in data quality, if there are any alternatives, may further improve analytical accuracy.
WACI and an integrated CatBoost-SHAP method works for combining multi-source data. Although Place2Vec and Word2Vec are common POI embedding methods, they more focus on the semantic merging of POI rather than spatial geometric characteristics and public perception analysis. To address these limitations, WACI works to quantify the spatial clustering of POI and social media data into CatBoost-SHAP. This approach is suitable for advancing the research target towards the identification of spatial function.
The initial POI dataset includes 10 top-level categories and 247 detailed labels. After systematic data cleaning and reclassification, the dataset was refined into 16 functional labels for function identification (Table 1).
Table 1.
POI categories. Source: Authors.
2.1.3. Social Media Data Collection
Web scraping techniques were used to collect approximately 800,000 comments from Xiaohongshu and Dianping platforms. These two platforms are major service-oriented social media applications in China. Comments were collected using the 16 POI categories as keywords. Collected information includes posting comments and content labels.
Data cleaning and filtering were applied to remove invalid records. Invalid records include duplicated content from the same account and comments without clear geographical information. The final dataset contains 37,015 valid comments from 22,265 users after preprocessing. Among these records, 33,018 comments were successfully converted into geospatial information after geographical noun filtering and geocoding. This volume accounts for 89.2% of all valid comments. The final 33,018 valid comments provide sufficient support for street-level public perception research. Data preprocessing steps, including the removal of low-value noise and duplicate records, reduced the risk of overfitting caused by irrelevant information. Each comment is attached with clear perception information and geographical relevance. The raw dataset contains a large proportion of low-value data. Such data includes meaningless emoticons, non-spatial subjective remarks and duplicate postings by the same user. Before formal analyzing, personal identifiable information was completely removed to avoid linking comments to specific individuals. Geographical information was generalized to the sub-district level with no fine-grained location data retained. The original data will not be used for non-academic purposes.
Certain function types are underrepresented on Xiaohongshu and Dianping. These types include industrial-, government- and agriculture-related functions. Such underrepresentation is an inherent feature of these social media platforms. The platforms focus on daily life, consumption and leisure perceptions. They lack sufficient discussion related to non-living-oriented functions. Thus this research did not artificially supplement data for these types. The research aims to objectively reflect real public perceptual conditions on mainstream social media platforms. It does not pursue forced balance across all functions. Natural underrepresentation truly reflects weak public attention. Artificial adjustment would be inconsistent with the goal of exploring real public perception.
Social media data in this study also carries inherent bias from platform user characteristics. Statistical analysis of anonymized user data shows that data contributors are mainly young and middle-aged groups. Users are dominated by urban residents with daily consumption, leisure and travel demands. The proportion of users engaged in industrial production, agricultural operation and government administration is relatively low. However, the user structure leads perceptual data to mainly reflect the spatial perception of mainstream urban consumer groups. Perceptual expression from elderly groups, rural residents in urban fringe areas and non-service industry professionals is relatively insufficient. This bias still truly reflects mainstream public perceptual characteristics of urban space in Beijing. Young and middle-aged consumer groups represent the main users of urban space and the primary sources of perceptual expression. Their perception represents the overall public perceptual trend of the city. Therefore, this study does not apply weighted correction for user group bias. The objective is to explore actual perceptual experience during daily space use. Fully balanced coverage of all social groups is not pursued exhaustively. It is the truth that perceptual expression from minority groups is limited on mainstream social media platforms. Artificial weighting would distort the actual perceptual situation.
Social media comments used in this study were collected over six months from January to June 2025. The period covers seasonal, monthly and weekly variations in public perception. Collected comments reflect relatively long-term and stable perceptions of spatial functions. They are not affected by short-term transient changes driven by holidays or festivals.
2.2. Research Stages and Tools
The research framework includes four primary components. These components are data collection and variable calculation, spatial function identification, model training, and detailed interpretation of experimental results.
Figure 2 presents the research framework. In data collection and variable calculation, POI and social media data work to reflect the relations between spatial function and public perception. In spatial function identification, WACI is employed to process the identification task. In model training, CatBoost-SHAP is adopted to ensure transparency and interpretability of model outputs. In the detailed interpretation of experimental results, interpretation analysis explores feature importance, nonlinear relationships and interaction effects. These analyses provide deeper insights into the model decision-making process.
Figure 2.
Research framework. Source: Authors.
Spatial function identification starts by reading the Shapefile containing POI data. The gpd.read_file() function from the GeoPandas library in Python 3.10 is used for this purpose. All geographical data are converted to the same Coordinate Reference System (CRS) using the to_crs() function. This step ensures consistency in spatial analysis and prevents errors from coordinate system discrepancies. A spatial join operation is performed using gpd.sjoin() to assign each POI to its corresponding area. This process creates a new GeoDataFrame with geographical locations. It lays the foundation for recognizing spatial function types.
This study calculates the Clustering Index (CI) for all POIs based on the distance decay hypothesis. The CI represents the average of the inverse distances of all POIs within the same function category within a 3 km range. The 3 km threshold is selected based on the average spatial scale of street-level administrative units in Beijing. Current local regulation, The Standards for Street-level Administration, in Beijing shows that the average radius of street-level administrative units in Beijing ranges from 2 to 4 km [42]. This study uses the median value of 3 km to identify spatial clustering considering the multi-ring structure of the city and the scale of street-level units. For each near , the inverse distance is computed using the cKDtree function from scipy.spatial to improve computational service value. The maximum value is capped at 1 to avoid excessively high clustering indices for dense categories. Capping the Clustering Index at 1 supports truncated normalization. This method is combined with min–max normalization to ensure comparability among different POI types. The calculation formula is outlined as follows:
For each POI , is defined as the number of nearby POIs that belong to the same category within the 3 km range. An of 0 is assigned if no nearby POIs belong to that category. The Clustering Index (CI) for each POI is calculated as follows:
To calculate the Average Cluster Index (ACI) for each spatial function category within each area, the GeoDataFrame is grouped by area and category . For each group (), this research computes CI() for the associated POIs. The ACI is calculated using Equation (3), where is the number of POIs in area that belong to category, and CI() is the Clustering Index for the k-th POI:
In the context of urban environments, some spatial function categories, such as government and cultural sites, are comparatively rare and limited in number. To appropriately reflect the importance of these categories despite their smaller counts in identifying spatial function, a weighting scheme is introduced. This scheme enhances their influence in the analysis by calculating both global and local ratios of spatial function types, described as follows: the global ratio (GR) is determined by the relative frequency of all spatial function types across the entire dataset. This ratio is defined as the number of POIs that belong to a certain type of spatial function t, denoted as , divided by the total number of POIs in the dataset, denoted as . The equation for the global ratio is
The local ratio (LR) is used to analyze the distribution of POIs of a certain spatial function type within a specific area. The LR for spatial function type t in area is calculated by dividing the number of POIs of type t in area , denoted as , by the total number of POIs in , denoted as . This relationship is calculated using the formula as follows:
To ensure the influence of these rare POI categories is properly considered, a weighting factor is defined, which can be specified as follows:
where represents the maximum value of the ratio of local ratio to global ratio for all spatial function types in the study area, which is used for the min–max normalization of to ensure the comparability of weighting factors among different POI types, and the normalized is distributed in the range of (0,1]. The core logic of this calculation is that the global scarcity of a POI type is negatively correlated with its : rare POI types have a smaller , and the ratio can amplify the weight of such types, thus enhancing their contribution in the identification of urban spatial functions. Meanwhile, the integration of makes the weighting factor adapt to the local spatial distribution characteristics of POIs, avoiding the one-sidedness of a single global index, and ensuring that the weight of the same POI type in different areas can match its actual local importance. Finally, by multiplying the introduced weight factor by the ACI() for the corresponding area and category, the WACI is calculated as follows:
According to the calculation outcomes, the most dominant spatial function category can be identified in each area. This approach accounts for the importance of each spatial function type and provides a balanced and effective means to determine the primary functional characteristics of urban areas.
The identification of urban spatial function based on social media data parallels the approach used with POI, but with a key distinction: it requires processing user comments using spatial function categories as search keywords. The HanLP.segment() function from the HanLP library is used in the data processing stage. This function conducts word segmentation and Part Of Speech (POS) tagging for user comments to extract potential geographical nouns. A three-step screening procedure is applied to obtain valid geographical nouns. First is POS filtering. Words recognized as geographical nouns, administrative region nouns and landmark nouns are preserved. Second is spatial scope filtering. The screened nouns are matched with an administrative division dictionary of Beijing. This dictionary is built based on public information from the Beijing Municipal Land Use Plan. It includes districts, sub-districts, major roads and landmarks. Nouns located outside the Beijing municipality boundary are excluded. Third is semantic validity filtering. Ambiguous or meaningless pseudo geographical nouns are deleted. This process combines the context of comments with the 16 POI categories. Geographical details obtained from the screening process are converted into latitude and longitude coordinates. Appropriate coordinates are assigned to each relevant record. The forward geocoding service from the Baidu Maps API is used with a self-built request pool to avoid access limits. Comments that cannot be successfully geocoded are excluded from the dataset. This step ensures the spatial accuracy of the final geospatial information.
This conversion translates unstructured text into geospatial information suitable for spatial analysis. The information is then exported as Shapefile format files. These files are perception anchors. They capture a dimension of public perception and reflect how people perceive specific experience in their living spaces. WACI is calculated for each perception anchor. This helps delineate the spatial function as experienced by residents.
For data processing, NumPy V1.26 and Pandas V2.1 are used for dataset splitting, with 80% allocated for training and 20% for testing. Ensemble learning methods and hyperparameter tuning via the Hyperopt V 0.2.7 package are employed to enhance model performance. Bayesian optimization iteratively refines parameters. It provides higher accuracy and efficiency than traditional grid search methods [43]. K-fold cross-validation was implemented using scikit-learn to confirm the model’s generalization performance across different data splits.
The CatBoost model acts to analyze discrepancies between spatial function and social media data for spatial function identification.
CatBoost’s ordered boosting framework and ranking target statistics effectively capture the nuances of categorical features. No complex manual feature engineering is required. This improves prediction accuracy and reduces overfitting bias compared to traditional gradient boosting algorithms [44]. Accordingly, CatBoost is not chosen to demonstrate algorithmic superiority over all of other models, but to work as an alternative tool because of its capability that highly compatible with the analysis objectives. It can process the categorical features of 16 POI types. Information loss could be avoided caused by artificial encoding. Also, it accurately captures the nonlinear and interactive relationships between spatial function and public perception. This meets the demand for evaluating the consistency of built and perceived environments. The ordered boosting mechanism alleviates the overfitting problem of small-sample data in partial fringes. This ensures the stability of model prediction. CatBoost has shown suitable performance in processing data across diverse geospatial datasets comparing with XGBoost and LightGBM [44]. It has also been applied in geospatial vulnerability mapping for natural disasters including wildfires and flood risks [45,46]. This further verifies its reliability for urban spatial analysis tasks. The ordered boosting mechanism of CatBoost inherently alleviates overfitting, especially for small-sample data in urban fringe areas, and when combined with Bayesian hyperparameter tuning via Hyperopt, the model’s generalization ability is further enhanced. In this research, the CatBoost model quantifies consistency with the support of SHAP. The rationality of model selection depends on compatibility with data features. CatBoost achieves prediction performance and stable cross-validation results. It provides support for the following analysis of spatial function service value and public perception mechanisms.
Criteria are defined to distinguish consistency between POI-based and social media -based classifications. The functional category with the highest WACI value is recognized as the dominant spatial function for each street-level unit. This rule applies to classifications derived from both POI data and social media data. Areas are labeled as consistent if the cosine similarity between WACI value vectors of all 16 functional categories should reach 70% or higher. Cosine similarity measures the overall alignment of functional structures between the built environment and public perception. The 70% threshold is chosen according to common standards in matching research [47]. Areas are labeled as inconsistent if the dominant functional types from POI data and social media data differ from each other, or the cosine similarity between the two WACI value vectors is lower than 70%. Class 0 in this binary classification model represents regions with inconsistent classifications. Class 1 represents regions with consistent classifications. The model performance is evaluated with four key indicators. These indicators include precision, recall, F1 score and accuracy. Precision measures the accuracy of positive predictions. Recall reflects the ability to identify actual positive cases. The F1 score provides a balanced index between precision and recall. Accuracy represents the percentage of all correctly classified samples as the raw dataset includes a large share of low-value records.
The dataset shows mild class imbalance. Class 1 accounts for 62% and Class 0 for 38%. The imbalance is not severe enough to distort the model’s core output of consistency. This research relies on the relative difference in spatial function service value between consistent and inconsistent areas. Confusion matrices and ROC-AUC curves are mainly used to evaluate the predictive discriminative capacity of models. This evaluation is the focus of methodological studies rather than spatial function analyzing. In this research, the model serves as an alternative means to an end. It needs to distinguish between consistent and inconsistent areas. The reported precision, recall, F1 score and accuracy are sufficient to confirm this reliability. The model uses standard 5-fold cross-validation. The mean variance of performance metrics is less than 5%. The consistent performance across training/test sets and cross-validation folds confirms that the model avoids significant overfitting.
Figure 3 indicates the consistency identification using CatBoost and SHAP. CatBoost helps to predict consistency; however, the underlying causes of this consistency still need to be inherently revealed. SHAP addresses this limitation. It interprets the impact of spatial function on outputs. Using SHAP allows quantification of each feature’s contribution to predictions. It provides insights into feature importance and gives detailed explanations of individual contributions. CatBoost-SHAP helps identify significant spatial effects [25]. Data processing is performed using Pandas V2.1 and NumPy V1.26. Matplotlib V2.8 and Seaborn V0.13 work for result visualization. This comprehensive framework provides interpretation into the contributions of different data sources.
Figure 3.
Evaluating identification consistency by CatBoost and SHAP. Source: Authors.
3. Results
3.1. Spatial Function Classification
This section analyzes the spatial function classification in the research site, Beijing, with reference to Figure 4. It presents the spatial function distribution of the 16 categories. Figure 4a covers the Beijing metropolitan area. It marks key nodes to reflect the overall functional pattern, include Badaling Great Wall, Tsinghua University, etc. Figure 4b focuses on the area within the major dense urban area inside the Sixth Ring Road. It highlights the mixed characteristics of spatial functions. Solid colors represent variable spatial functions. The figure shows that spatial functions concentrate in urban centers and distribute from the center to the periphery.
Figure 4.
Spatial function distribution of Beijing: (a) whole metropolitan area; (b) area within the Sixth Ring Road. Source: Authors.
Figure 4a shows the spatial function status based on POI. Beijing has diverse spatial function types, such as residential, commercial, cultural, industrial, agricultural, etc. The automated classification matches the current spatial function patterns. The Beijing Municipal Land Use Plan in the Beijing Urban Master Plan (2016–2035) can, to some extent, confirm the reliability of the automatic classification by POI data. However, since the spatial function in the official plan scheme has not been detailed at the urban level, it is hard to conduct one-to-one verification. The matching verification of spatial function is obtained from the typical functional points and map comparison. Manual comparison was adopted to cross-verify the POI-based results. For instance, in the northwest part of the central urban area, the automatically identified spatial functions are commercial, industrial and educational. In the Beijing Urban Master Plan (2016–2035), this area is also a concentrated area for commercial, high-tech industrial and educational. The two complement each other.
A clear boundary between artificial and natural areas emerges when mapping the spatial function. This boundary is marked by prominent agricultural function and some related small-scale functions. It resembles the delicate edge of a bird’s feather. This boundary is particularly noticeable around Beijing’s Sixth Ring Road, also known as Liuhuan Road. Different spatial functions coexist here, including residential, greenery, commercial and agricultural zones. Figure 4b presents the spatial function within the Sixth Ring Road. Such overlap indicates mixed spatial functions in the transition area between artificial and natural areas.
Figure 5 shows the spatial distribution of WACI values. The definitions and abbreviations of these categories are consistent in Table 1. The WACI integrates the spatial clustering intensity of POI. Spatial clustering intensity is calculated based on the distance decay hypothesis. The weight of rare functional types is determined by global and local ratios. Higher WACI values indicate stronger clustering characteristics and greater functional importance and vice versa. Figure 5a–p illustrate spatial agglomeration differences across functions.
Figure 5.
Spatial distribution of WACI for 16 spatial function categories. Source: Authors.
Interactions among different spatial functions support urban synergy and vitality. For instance, business and government functions are spatially close to each other as Figure 5a,b present. This pattern may reflect public trust in government-supported business institutions and collaborative governance within business clusters. Commercial, residential and transportation functions show spatial connections in Figure 5c–e. Commercial facilities are located near transportation nodes to improve accessibility. This arrangement supports the development of commercial and residential areas by reducing commuting times. Educational function is frequently adjacent to commercial function in Figure 5c,f. Educational institutions attract families with school-age children. This increases the attractiveness and economic activity of nearby commercial areas. Enterprises also prefer locations close to universities and research institutes to gain technical support. Such proximity promotes collaboration between academia and industry. As Figure 5d,g show, residential function is closely associated with local service functions. Grocery stores, clinics and community centers satisfy daily needs and support the development of residential areas [48,49]. Sports function interacts with cultural and business functions in Figure 5a,h,i. Sports complexes can promote the development of nearby cultural facilities and attract business investment [50]. Cultural and scenic functions often cluster in historical areas as Figure 5i,j indicate. This pattern supports heritage preservation and optimizes resource utilization. In Figure 5d,k, leisure zones located near residential areas improve urban livability and resident quality of life.
Some spatial functions show spatial segregation. Residential and industrial functions form a diagonal pattern across the Sixth Ring Road of Beijing as in Figure 5d,l. Residential function concentrates in the northwest, especially near internet enterprise clusters. Industrial function is mainly located in the southeast close to transportation hubs. This diagonal pattern is influenced by spatial prices, housing demand and transportation costs [51,52,53]. In addition, industrial function is usually separated from recreational areas to reduce negative impacts such as noise and pollution, as Figure 5k,l show. Educational function tend to gather in urban core areas and decrease toward the urban periphery. Population distribution contributes to this spatial layout. Greenery function is more widely distributed in areas distant from educational functions in Figure 5f,m. Large-scale infrastructure including power plants and wastewater treatment facilities is generally placed far from residential functions in Figure 5d,n. This arrangement helps to reduce potential adverse effects [54,55].
The distribution of WACI values in Figure 5 reflects the spatial function characteristics of Beijing. Scenery- and leisure-related functions mainly locate along mountainous regions or the edges of administrative boundaries. This distribution indicates the greater presence of basic utilities and green buffers in fringe areas. Educational functions show high concentration in central urban areas and lower density in peripherals. High population density in urban central increases demand for educational resources and supports more educational institutions. Agricultural distribution shows an opposite spatial trend. Local service, industry and residential functions display an outward distribution pattern along the Sixth Ring Road. This road acts as an urban boundary. Local services scatter along this ring road. Industrial function concentrates in the eastern part. Most lie on the plains with high clustering levels. Residential function beyond the Sixth Ring Road shows high values in the northwest. This pattern relates to the intensive internet enterprise distribution in Haidian and Changping districts. Many commuters choose to live in areas with lower rent and relatively short commuting times.
3.2. Public Perception and Spatial Function Correlation
The WACI visualization results show a clear relationship between spatial function and public perception. The relative importance of different spatial functions in shaping public perception is quantified with mean absolute SHAP values. These values are ranked in descending order in Figure 6a. Higher feature values are generally linked to positive SHAP values. This indicates an increasing trend and vice versa.
Figure 6.
Relative importance by SHAP values for each spatial function. Source: Authors.
Ranking the public perception of different spatial functions shows that education-, sports- and culture-related functions have the highest ratings. This likely reflects the public’s greater awareness of these functions. They are often regarded as valuable and limited resources [56,57]. Education-, sports- and culture-related areas typically show positive SHAP values. High feature values of these areas exert a positive impact on public perception. In contrast, transportation and industrial functions generally have negative SHAP values. This indicates lower public perception priority. Residential function have SHAP values close to zero across various datasets. They are integral to daily lives while often perceived as background elements.
From the perspective of urban sociology and environmental psychology, the above perceptual differentiation is not random. It is driven by the inherent spatial attributes, social symbolic meanings and human–environment interaction characteristics of different functional types. Its underlying mechanisms can be further elaborated.
Urban sociology draws on symbolic place theory [58]. Environmental psychology focuses on positive environmental cognition. Accordingly, the high perceptibility of education, sports and cultural functions stems from their positive social symbolic value and high-quality human–environment interaction experience. In urban sociology, educational facilities such as universities are typical symbolic carriers of high-quality public services. Their distributions are closely linked to social resource allocation. This helps the public form a focused cognitive impression in daily social practice [57]. Sports and cultural facilities are the carriers of social identity. Sports function links to positive emotional experiences such as leisure, exercise and social interaction. Cultural function is tied to urban space memory and local history. Both functions trigger immersive public spatial participation. From the perspective of environmental psychology, this positive and purposeful human–environment interaction strengthens the neural encoding of spatial information in the public perception. This phenomenon is reflected in the high positive SHAP values in the model.
The low perceptibility of industrial and transportation functions mainly result from their environmental negative externalities and the passivity of public spatial practice. For industrial function, environmental psychology states that industrial production activities are often accompanied by negative environmental externalities, such as noise, air pollution and visual clutter [56]. This environmental stimulus makes the public form a vague and negative perceptual impression. It even reduces active contact with the space surrounding industrial functions, which may lead to low perceptual accuracy. For transportation functions, urban sociology defines them as flow spaces. The public’s contact with the transportation function is mostly instrumental and passive. Examples include passing through stations and driving on roads. There is no in-depth immersive interaction or emotional connection with the space itself. This passive spatial practice prevents the public from forming a clear perceptive mapping [59]. Frequent spatial flow also blurs the perceptual boundary between transportation and adjacent functional areas. This is manifested in the negative SHAP values in the model.
The near-zero SHAP values of residential function result from their characteristic of perceptual habituation in environmental psychology. Residential function is the most basic daily living space. The public maintains long-term and repeated contact with these areas. Such continuous, low-stimulus spatial contact leads to perceptual habituation. The public takes the spatial attributes of residential function as the background perception of urban space. They no longer form focused perceptual judgments. This weakens the influence of residential function on the overall public perceptions. Figure 6b presents the SHAP value distribution, where positive effects correspond to higher feature values, and vice versa.
The accuracy of public perception is also affected by geographical location. Figure 7 shows changes in public perception from the urban center to peripheral areas. In central areas, spatial function is often perceived more clearly. This applies even to blocks with complex spatial forms. In contrast, peripheral areas contain fewer spatial function categories. Despite this, individuals in these areas often hold ambiguous perceptions of spatial function. This ambiguity can persist without clearly defined services. For instance, zones designated for natural recreation are typically located in mountainous areas or on the outskirts. Improved accessibility to basic tourism services in these areas enhances public perception of recreational zones [60]. Clearly defined services help improve public perception. This is particularly true in less-central areas.
Figure 7.
Overlay of built (solid colors) and perceived (diagonal stripes) functions. Source: Authors.
The perceived relevance of different spatial functions in a given area works as another influence factor of public perception. For example, commercial function in Beijing has been increasingly developed in former industrial heritage sites. Representative areas include Jiuxianqiao 798 Art District and Shougang Industrial Park. This trend is driven by large-scale industrial restructuring processes. Thus, social media data was specifically analyzed to explore the perceptual lag. Considering the 2156 valid comments related to these areas, a total of 67.8% of the comments still use industrial-related keywords to describe the spaces. Common keywords include factory, manufacturing and industrial. The dominant function has been commercial, cultural or creative based on POI. It reflects that public perception remains anchored to original functions. Some local residents still mainly associate these areas with industrial functions. This delayed response reflects the influence of urban spatial memory and cognitive formation. Many traditional industrial zones are undergoing transformation as part of Beijing’s urban downsizing plan [61,62]. Such functional diversity may blur public perception and further intensify perceptual lag. Public perception becomes more complex than in other areas.
3.3. Relationships Between WACI and SHAP Performance
The relationships between the WACI of each spatial function category and SHAP values are shown in Figure 8. This figure illustrates how public perception impacts the WACI index across different zones. Trends for spatial function categories including business, sports and education show a consistent pattern. Public perception accuracy improves as the WACI index increases. This is shown in Figure 8a–f. In contrast, SHAP values of scenic and industrial zones decrease as the WACI value increases. This is shown in Figure 8g,h. Public perception deviates for spatial functions in urban fringes.
Figure 8.
Nonlinear influence and SHAP interaction values affecting the public perception. Source: Authors.
In Figure 8, each blue scatter point corresponds to an individual study sample. The x-axis value represents the score of a specific dimension of WACI, and the y-axis SHAP value quantifies the marginal contribution of that WACI dimension. The orange curve is a scatterplot smoothing fitted line, which characterizes the nonlinear changing trend of the marginal contribution of the corresponding WACI dimension as the dimension’s score increases. Local service and residential functions are typically treated as background variables in public perception. Frequent interactions with these functions may enhance people’s awareness. However, local service function may be misidentified as part of a residential function when population density is improved. This leads to a decline in SHAP values as shown in Figure 8l,j. Some spatial functions show synergistic relationships. For instance, the scenic function is occasionally conflated with the leisure function in public perception. This is shown in Figure 8g,k. Both business and government functions initially show decreasing SHAP values before rising. This is shown in Figure 8l,m. It reflects dynamic changes in public perception. Public perception of their functional roles strengthens with increasing interaction frequency. The subsequent rise in SHAP values confirms this outcome.
SHAP interaction values for various spatial functions are shown in Figure 9. These values quantify the interactive effects between spatial function categories. Higher values indicate positive influences and lower values denote negative ones. They typically range from −0.5 to 0.5. Each row and column corresponds to a specific spatial function. Blue indicates lower SHAP values. Red denotes higher SHAP values. A gradual hue transition reflects an increase in values. Dispersed point distributions imply consistent synergistic or segregate effects between categories. More concentrated distributions indicate weaker or unstable interactions [36].
Figure 9.
SHAP interaction values affecting the public perception. Source: Authors.
In Figure 9, the point color denotes the magnitude of the interactive effect between paired spatial function categories. Blue corresponds to lower (negative) SHAP interaction values, red corresponds to higher (positive) SHAP interaction values, and the gradual hue transition from blue to red reflects the continuous rise of interaction values within the range of −0.5 to 0.5. SHAP values quantify the marginal contribution of each spatial function category to the model’s prediction of perceptual–spatial consistency, but they do not establish causal links between spatial functions and public perception. The observed associations could be interpreted as correlational patterns shaped by urban morphology and human–environment interaction dynamics, rather than one-way causal effects. This aligns with the fundamental principle of SHAP analysis as a post hoc interpretability tool, which aids in unpacking model logic without inferring real-world causality.
To verify the reliability of nonlinear relationships between WACI indices and SHAP values, Spearman’s rank correlation analysis and testing for key spatial function categories were processed. Spearman’s rank correlation coefficients (ρ) and two-tailed t-tests were conducted to validate nonlinear patterns. For example, for education POIs, the correlation between WACI values and SHAP values is ρ = 0.892 (p < 0.001), indicating a significant positive nonlinear association. For scenic POIs, the value of ρ is 0.125 (p < 0.01). All p-values are below 0.05. It demonstrates that nonlinear patterns are statistically robust. These statistical results validate the SHAP interaction value analysis (Figure 9), which further confirmed the stability of the effects between spatial function categories.
3.4. Sample Areas and Public Perception
Six representative functional areas in Beijing were selected based on four multi-dimensional criteria. This selection supports the analysis of public perception toward spatial functions (Figure 10). It also ensures the typicality, representativeness and comprehensiveness of case investigation. The first criterion focuses on the wholeness of geographic spatial distribution. Selected areas cover the urban core, inner suburbs and outer suburbs of Beijing. They include typical spatial units such as central functional zones, urban–rural transition zones and suburban functional zones. This arrangement reflects spatial heterogeneity of public perception in different geographic contexts. The second criterion emphasizes the diversity of dominant functional types. The selected areas involve six major functions. These functions include tourism and recreation, historical and cultural protection, cultural and creative industry, high-tech industrial development, science education and research, and sports and leisure. These types cover the main subgroups of the 16 POI categories used in this study. They can fully reveal perceptual differences among various spatial functions. The third criterion considers the differentiation of WACI characteristics. Areas are chosen based on clear differences in WACI values, functional mixing levels and consistency between perceived and built environments. This supports targeted analysis of perceptual bias across different WACI profiles. The fourth criterion highlights the typicality of urban development practice. Priority is given to areas with important roles in Beijing’s spatial planning and development. These areas include high profile urban renewal projects, characteristic industrial clusters and influential landmark functional zones.
Figure 10.
Public perception and the representative functional areas. Source: Authors.
In Figure 10, red blocks represent spatial function categories with positive marginal contributions, while blue blocks represent categories with negligible contributions. The length of each colored block corresponds to the magnitude of the contribution value of the corresponding spatial function, with the exact value marked below each block. Badaling Town is a prominent tourist destination in the northern suburbs of Beijing. It is adjacent to the Badaling Great Wall, a national cultural landmark. Simulation results show agricultural, transportation and scenic functions are highly perceptible. This high perceptibility relates to its unique spatial characteristics and landmark-driven activities. Perceptibility of agricultural function is from concentrated fruit forest and grain crop planting around the Great Wall. These crops form an agriculture landscape. They become part of the tourist experience. The perception of transportation functions is supported by dedicated Great Wall tourist highways and high-speed rail access. These transportation facilities are transportation corridors. They connect the urban core to the scenic area. This ensures spatial accessibility and perceptual clarity. Annual tourism activities, like hiking events, supplement this attribute. However, public perception of the educational function is less distinct. This area is far from the educational landmarks and related public activities. It is indicated that core functions linked to iconic landmarks are highly perceived and non-landmark-associated functions are marginalized.
Shichahai Area is located in central Beijing. It is renowned for its historical, cultural, and natural relics. These relics include Shichahai Lakes, traditional hutongs and courtyard houses. In this area, scenic and leisure functions are highly perceptible. The perception is shaped by the iconic lake landscape and traditional architecture. These form a distinctive urban cultural landmark. They are widely disseminated through social media. Related activities include hutong photography and lake boating experiences. The clear perception of leisure function benefits from concentrated leisure activities and a synergy between function and spatial context. Industrial function tends to be less accurately perceived. They are interspersed among these spatial functions. Examples include small-scale former industries hidden in hutongs. These industrial functions lack iconic architectural forms and association with public activities. The functional attributes conflict with the historical leisure landmark image of Shichahai. Leisure and scenic functions with contextual relevance reinforce each other. Conflicting industrial functions are perceptually suppressed.
Jiuxianqiao Area hosts the iconic 798 Art District. It represents a model of industrial heritage renovation in Beijing. The cultural function is strongly perceived. It is closely related to unique industrial heritage transformation and cultural landmark attributes. Architectural form supports strong public perception. The area preserves many Soviet-style buildings as red-brick workshops, tall chimneys and large-span factories. They have been renovated into art galleries, exhibition halls and design studios. This distinctive industrial heritage make cultural functions highly recognizable. Event activities further strengthen public perception. The 798 Art District holds annual art exhibitions and cultural salons. These events attract large numbers of visitors. They also promote wide social media dissemination. Such activities continuously consolidate the image of artistic and cultural functions.
Perception of the local service function remains relatively vague. Service facilities are scattered in non-landmark areas of the district. They lack architectural and functional integration with the landmark image of the art district. Their spatial scale and visibility are much lower than those of cultural facilities. This pattern corresponds to the strategy of incorporating landmark functions. Unique architectural forms and continuous cultural activities together shape the dominant perception of cultural functions. Targeted interventions may improve perceptual relevance. Local services can be integrated into industrial heritage buildings to help avoid barriers to further development.
Xibeiwang Town is a hub for aerospace research and high-tech industries. It includes institutions such as China Aerospace Science and Technology Corporation and key aerospace research institutes. It forms a high-tech industrial cluster. The perceptibility of industrial and commercial functions is relatively high. It is driven by the area’s industrial agglomeration characteristics and functional matching. High-tech industrial landmarks drive public perception. The area’s core industrial functions are anchored by national-level aerospace research institutions. The public perceives these institutions as high-tech landmarks. Their large-scale research campuses and distinctive industrial parks form clear spatial identifiers. Functional mixing creates synergy. Commercial function in the area is mainly supporting facilities for high-tech industries. These include technology exhibition centers, high-end office-supporting commerce and industry–university–research cooperation platforms. It forms a high-tech industrial and specialized commercial mixing pattern. This pattern aligns with the public perception of industrial agglomeration areas. This reflects the functional mixing with high perceptual correlation strategy. Industrial and commercial functions with strong industrial relevance form a mutually reinforcing perceptual effect. This enhances the overall functional clarity of the area.
Tsinghuayuan Area houses prestigious educational and research institutions. This area is characterized by high perceptibility of educational and sports functions. The high perceptibility is attributed to its iconic educational space and functional integration. Educational landmarks shape public perception. Together they form a strong perceptual image of educational function. The sports function creates synergy with the educational function. The area’s sports facilities include Tsinghua Stadium, swimming pools and gymnasiums. These are high-standard sports facilities that host sports events. This forms an educational and sports functional mixing pattern. This pattern aligns with the public’s perception of comprehensive university campuses. People can clearly perceive the prominence of academic and athletic functions in this area. This fully reflects the functional mixing with high perceptual correlation and incorporating landmark function strategies. Educational landmarks enhance the overall perceptual clarity of the area. Synergistic sports functions further strengthen public engagement with the area.
Yayuncun Area, or say Asian Games Village Area, includes the Olympic Forest Park and other iconic sports venues, such as the National Stadium, National Aquatics Center and former Asian Games Stadium. The perceptibility of the sports function is particularly high. It is closely related to its unique sports landmark cluster and activity attributes. Sports landmarks dominate public perception. As world-renowned architectural landmarks, the stadiums form the perception and image of the area. This makes sports the dominant perceptual function and commercial and business functions are less perceptible. Commercial venues in the area are mainly supporting facilities. They serve sports events and fitness activities. These facilities include shopping malls and catering services. But they lack independent and characteristic business formats. Their functional positioning is subordinate to the sports landmark function. This leads to weak perceptual prominence.
These analyses highlight the complex interplay between spatial function and public perception. Certain functions are relatively fully perceived by the public, including education, culture and sports. While others are less readily identified, such as traditional industrial function.
4. Discussion
Improving the service value of urban spatial functions is a major challenge for contemporary metropolitan development [63]. Public perception is particularly important in this process and is often overlooked. It plays an essential role in determining the effectiveness of urban space resource utilization [64]. This study explores the link between public perception and spatial function to improve the service value. Areas with clear perception tend to have higher spatial function service value as individuals are more likely to accept and use the functions in terms of perception and psychology. In contrast, areas with vague perceptions are less efficiently utilized. People are less likely to engage with these functions. Incorporating public perception into zoning and decision-making is therefore crucial [65,66,67]. Three key strategies can facilitate public perception of diverse functional zones. These strategies include leveraging geographic centrality, mixing spatial functions with high perceptual correlation and incorporating landmark functions.
4.1. Geographic Center Leverage in Perception Accuracy
A metropolitan area consists of a central urban core with a dense population, along with surrounding communities that are economically and socially integrated. Taking Beijing as an example, the spatial expansion of the city exhibits distinct axial and circular expansion characteristics. The expansion of urban and rural construction space in Beijing is influenced by different factors across various periods. A comprehensive analysis reveals that population surges have intensified the demand for space, industrial development has shaped the spatial form, the persistence of spatial strategies has sustained the evolution of this form, and the launch of major events and projects has driven changes to the urban–rural spatial structure.
Geographic centers in a metropolitan area tend to have more accurate public perceptions of spatial function. In contrast, urban–rural transition zones, which often feature mixed spatial function types, tend to suffer from less accurate perceptions. This mismatch between public perception and actual spatial function leads to the underutilization of space resources in these areas [68,69,70]. Public perception is closely linked to the spatial function service value of large cities and to the practical effectiveness of indicative and strategic planning. This relationship involves subtle mutual influences: on the one hand, public perception is shaped by spatial function planning, which regulates the public’s use and understanding of space to a certain extent; on the other hand, public perceptions of space functions evolve with real-life experiences and are inherently uncertain—diverse social behaviors, group activities, or urban events may alter public perceptions of existing spatial function zoning.
To address this issue, zoning planning can focus on increasing the degree of spatial function mixing in the city’s geographic center. This conclusion aligns with the New Urbanism perspective of enhancing spatial function mixing in urban cores. The renewal and regeneration of city centers require the diversification of space functions rather than an unregulated sprawl to the periphery. Mixed spatial functions involve both the selection of spatial function types and the manner of their integration. This study provides a basis for addressing such specific issues, such as mixing educational and commercial space, or residential and local service space. In addition, the intensity of spatial function mixing should be reduced in transition zones to clarify the distinction between urban and agricultural spaces, thereby minimizing space resource waste in these edge areas.
4.2. Perception and Spatial Function Correlation
This study also identifies a positive correlation between certain spatial functions and public perception. Different spatial function types exert distinct effects on public perception. The preceding analysis shows that areas integrating education, commerce, sports and culture could be better perceived by the public. They also support higher spatial function service value. Strategic combination of these functions helps people engage with urban spaces.
Mixing specific functions facilitates public understanding of urban spatial function. Examples include business–government functions, commercial–residential–transportation functions, commercial–educational functions, local service–residential functions, sports–cultural–business functions, culture–scenic–historical functions and leisure–residential functions. It promotes more efficient utilization of urban space resources.
As stated in the former analysis, positive SHAP values indicate perceptual synergy and negative indicate perceptual repulsion. Thus specific functional combination for high consistency could be proposed. Highly recommended combinations have a SHAP value close to 0.5. They include education–commerce, culture–scenery, scenery–leisure, sports–culture and local service–residential. Their integration significantly enhances public perceptual clarity. Strictly avoided combinations have a SHAP interaction value close to −0.5. They are industry–leisure, industry–scenery, industry–sports and transportation–scenery. Their mixing causes perceptual conflict. Cautiously mixed combinations have a SHAP interaction value between −0.5 and 0.5. Examples include government–commercial and agriculture–park. These combinations require targeted optimization based on geographic centrality and landmark functions. Intensive mixing is suitable for core areas, and simplification is more appropriate for peripheral areas. These outcomes help realize the optimal integration of urban spatial functions.
Using interpretable machine learning can objectively quantify public perception in spatial function analysis. Four distinct scenarios of public perception toward spatial function changes are identified. Consistent perception means cognition of spatial function aligns with the actual spatial function situation. In this case, spatial function service value is high. Partially consistent perception refers to partial matching between public cognition and actual spatial function. Individuals can only recognize landmark functions in mixed spatial function areas. Here, the spatial function service value is compromised. Alternatively, this may lead people to focus on highly identifiable spatial functions while other functions become weakened or even obsolete. Inconsistent perception occurs when public cognition conflicts with actual spatial function. The public’s judgment of spatial function is irrelevant or even contradictory to reality, resulting in misunderstandings of the space’s actual functions. No perception means the public lacks awareness of spatial function and completely ignores its functions. Individuals neither regard the area as a destination nor hold any impression or memory of it. In this scenario, the space’s practical functional value is lost, which undermines efficient resource utilization.
To realize the application of the four scenarios, this research defines classification criteria. These criteria are based on the output indicators of the CatBoost-SHAP model. The classification process follows a clear priority assessment approach. It first judges perception intensity based on the global mean absolute SHAP value and then judges consistency probability based on the CatBoost consistency prediction. The core indicators, threshold values, operational criteria and their corresponding scenarios are specified below.
The global mean absolute SHAP value is denoted as M. It is the mean value of the absolute SHAP values of all 16 spatial function categories, ranging from 0 to 0.175. M quantifies the overall intensity of public perception of spatial function. A higher M value means the public has a clearer perception. A lower M value indicates weak or even absent perceptual attention. The CatBoost consistency prediction is denoted as p. It is the output of the CatBoost model, ranging from 0 to 1. p quantifies the consistency degree between the built environment and the perceived environment. A higher p value indicates higher consistency and vice versa. This is consistent with the cosine similarity of WACI vectors and the model’s classification logic.
All thresholds are determined based on the model’s output distribution. They also align with the 70% cosine similarity standard for spatial function consistency. The critical value of M equals 0.0875. It is the median of the global mean absolute SHAP values. It also serves as the natural dividing line between obvious perceptual attention and weak perceptual attention in the model output. The critical value of p equals 0.7. It is aligned with the 70% cosine similarity threshold for WACI vector consistency. This alignment ensures the unification of the model’s probability output and the original spatial function consistency judgment. The critical value of p equals 0.3. It is the lower quartile of the CatBoost consistency prediction probability p of all street-level units with M greater than or equal to 0.0875. It is the natural dividing line between partial cognitive matching and complete cognitive contradiction in the model’s output distribution.
The specific correspondence between the four scenarios and the critical values is as follows. No perception corresponds to M less than 0.0875. Consistent perception corresponds to M greater than or equal to 0.0875 and p greater than or equal to 0.7. Partially consistent perception corresponds to M greater than or equal to 0.0875, p greater than or equal to 0.3 and p less than 0.7. Inconsistent perception corresponds to M greater than or equal to 0.0875 and p less than 0.3.
4.3. Incorporating Landmark Features
Similar to the shaping of the urban physical environment, landmark buildings serve as key urban identifiers. Thus, incorporating landmark spatial functions into zoning or urban planning is another effective strategy to deepen public perception of specific areas. For example, Beijing’s urban landmark spatial system forms a grid centered on Tiananmen Square, with Chang’an Avenue, the Second Ring Road, Third Ring Road, Fourth Ring Road, and Qianmen Street as the road framework. This grid system is divided into inner and outer urban areas, with the Second Ring Road as the boundary: in the inner urban area, based on the road network, urban landmark spaces comprise architectural landmarks, nodes, and functional zones; in the outer urban area, only certain landmark elements play a leading role, and administrative districts often present a vague image to residents across the city. In summary, the primary elements shaping Beijing’s urban landmark spaces are roads, landmarks, and nodes.
Distinctive landmark spatial functions, such as key service facilities or iconic functions, can enhance the cognitive accessibility of underutilized areas, even when overall spatial function is complex or mixed [70]. This is particularly critical for zones like industrial–commercial areas, which may otherwise be perceived as irrelevant. By introducing landmark features, these areas can become more recognizable and better utilized, thereby improving overall spatial organization.
These findings provide support for decisions regarding spatial function service value and urban resource allocation. By prioritizing spatial functions that align with public perception, cities can optimize spatial function planning and create spaces that are more efficiently utilized and accessible to residents. As emphasized in recent machine learning research for structural engineering [71], the combination of predictive performance and interpretability is the key to promoting urban planning, and the CatBoost-SHAP framework in this study attempts to achieve this balance.
4.4. Limitations and Future Directions
Data-related limitations exist. POI data carry two inherent limitations. POI data are presented as discrete points. Real urban elements often span multiple spatial units. The suitability of Area of Interest data versus POI data under different scenarios requires further exploration. POI data are usually static or updated at low frequencies. Frequent updates are not available for most POI sources. Static data conflict with the dynamic nature of urban spatial functions. Urban functions often experience short-term or temporary changes. These changes include pop up markets, temporary cultural exhibitions and seasonal recreational activities. Such changes are not recorded in static POI datasets. This may lead to potential underestimation of the service value of dynamic functional spaces.
Limitations also exist in social media data collection. Data have been collected from local service-oriented social media platforms. The user base of these platforms does not fully represent the entire public in the study area. Obvious biases related to age and social class can be observed. Most active users belong to young and middle aged groups. Perceptual voices from other groups may be underrepresented. People in these groups may show distinct daily activity ranges and spatial perception preferences. The lack of representation may lead to an incomplete understanding of overall public perception toward urban spatial functions. The social media data used in this research are cross sectional. Data were captured within a specific time window. Public perception of urban spatial functions represents a dynamic evolutionary process. It is affected by the gradual transformation of the built environment, timing of urban planning adjustments, etc. Cross sectional data could not fully reveal the long temporal evolution of public perception.
Future research can address the above data-related limitations. Real-time data sources could be integrated to fit the dynamic data features. These sources include mobile phone signaling data or short-term event registration data. A dynamic update mechanism can be established for function identification. Multi-channel data collection methods can reduce representativeness biases of social media users. These methods include on-site questionnaire surveys for all of the groups, community interview records and government public opinion data. Although these methods may take an amount of time and labor, they cover perceptions from diverse populace.
At the algorithmic level, WACI works to explore the consistency between human perception and spatial function. It is regarded as an alternative tool for identifying spatial functions according to its capability matching this research target. The superiority of WACI over all of other methods like ACI, KDE, DBSCAN need further exploration in future studies specifically focusing on technical optimization. In addition, a dynamic framework could also be developed based on the existing CatBoost-SHAP model. The data collection period can be extended to one to three years. Time can act as a variable to generate time-series CatBoost and LSTM-SHAP hybrid models. Researchers may examine consistency over time.
5. Conclusions
This study develops an explainable machine learning framework for analyzing the consistency between planned urban spatial functions and actual public perceptions. Taking Beijing as the study area, it integrates POI data and social media data to map urban functional regions and quantify the correlation between spatial function characteristics and public perceptual experiences. The findings confirm that geographic centrality, targeted functional mixing and landmark incorporation effectively enhance public perceptions of urban spatial functions, and these factors further optimize the service value of urban spatial functions. For architects and urban planners, enhancing public perceptions of spatial functions is an effective approach for the rational utilization of urban land and space resources. This goal can be achieved by integrating spatial functions with high perceptual potential in planning and design, and this approach delivers notable practical value particularly for mixed-use areas and rapidly urbanizing regions.
The research results indicate that urban morphological features and their interactions drive perceptual discrepancies, and spatial scales lead to heterogeneous effects of POI categories on function recognition. Leveraging geographic centrality, promoting functionally mixed layouts with high perceptual correlation, and incorporating landmark functions can enhance the consistency between public perception and spatial function, thereby optimizing the service value of urban spatial functions.
The CatBoost-SHAP model refines the identification of different POI categories and clarifies the spatial distribution characteristics of urban functions. Its results provide insights for on-site urban planning practice. Urban–rural transition areas in Beijing exhibit a high degree of functional mixing, yet agricultural and cultural POIs in these areas are significantly underestimated in public perceptions. Planners can enhance public awareness of these functions by adding visible spatial markers for agricultural and cultural spaces in such transition zones, and they can also integrate small-scale cultural exhibition areas and agricultural experience spots into the local spatial layout. These measures effectively highlight the value of agricultural and cultural functions in urban–rural transition areas and mitigate the underutilization of related spatial resources.
Global analysis identifies education, commercial and sports POIs as the primary contributors to public perceptions of urban spatial functions, while nonlinear effects further reveal the complex influence of different functional categories on perceptual identification of urban space. Planners can prioritize the layout of these functional types in urban functional zoning, allocate more visible spatial areas and integrate landmark design elements within them. This reinforcement effectively strengthens public perceptions and elevates the service value of related spatial functions. Furthermore, local analysis demonstrates that the influence of POI categories on functional zones varies across spatial and temporal scales. Positive synergies exist between education and commercial zones as well as between leisure and scenic zones, and planners and architects can leverage these synergistic effects in the spatial layout. They can integrate commercial facilities around educational areas to form mixed education–commercial functional districts, a design that boosts public perceptions and the utilization efficiency of both functional types. Leisure and scenic functions can also be combined to create integrated leisure–scenic spaces, which enhance the overall perceptual experience and service value of the area. In contrast, industrial functions exhibit clear functional competition with leisure and scenic zones. Planners should therefore set up functional buffer zones between these conflicting functional types to reduce perceptual conflicts and mitigate negative environmental externalities.
This study also defines quantitative classification criteria based on the global mean absolute SHAP value and CatBoost consistency prediction probability, and it identifies four distinct public perception scenarios regarding changes in spatial functions. The critical value thresholds provide a quantifiable basis judge the perceptual status of spatial functions. Planners can apply these criteria to evaluate the consistency between the built environment and public perceptions in different urban areas. This approach enhances the operability of the research findings and provides a clear decision-making basis for urban spatial function planning.
Collectively, this study provides targeted insights to bridge the gap between public perceptions and actual urban spatial functions. It supports the design of efficient, balanced and livable urban space and improves the overall service value of spatial functions. The findings of this study provide practical support for the sustainable development of modern cities through a human-oriented lens.
Author Contributions
Conceptualization, Y.Z. and Q.S.; methodology, Q.S. and J.G.; software, Q.S.; validation, Y.Z.; formal analysis, Y.Z. and Q.S.; investigation, Q.S.; resources, Y.Z.; data curation, Q.S. and J.G.; writing—original draft preparation, Y.Z., Q.S. and J.G.; writing—review and editing, Y.Z.; visualization, Q.S.; supervision, Y.Z.; project administration, Y.Z.; funding acquisition, Y.Z. All authors have read and agreed to the published version of the manuscript.
Funding
This research was funded by National Key Research and Development Program of China: “Key Technologies and Equipment for Urban Sustainable Development”, grant number 2023YFC3807404.
Data Availability Statement
Data are contained within the article.
Conflicts of Interest
The authors declare no conflicts of interest.
References
- Batty, M. The size, scale, and shape of cities. Science 2008, 319, 769–771. [Google Scholar] [CrossRef] [Scilit]
- Healey, P. Urban Complexity and Spatial Strategies: Towards a Relational Planning for Our Times; Routledge: London, UK, 2006. [Google Scholar] [CrossRef] [Scilit]
- Hall, P. Cities of Tomorrow: An Intellectual History of Urban Planning and Design Since 1880; Wiley-Blackwell: Hoboken, NJ, USA, 2014. [Google Scholar]
- Fujita, M. Urban land use theory. In Regional and Urban Economics Parts 1 & 2; Routledge: London, UK, 2013; pp. 111–187. [Google Scholar] [CrossRef] [Scilit]
- Wu, F.; Webster, C.J. Simulation of natural land use zoning under freemarket and incremental development control regimes. Comput. Environ. Urban Syst. 1998, 22, 241–256. [Google Scholar] [CrossRef] [Scilit]
- Han, W.; Zhang, X.; Zheng, X. Land use regulation and urban land value: Evidence from China. Land Use Policy 2020, 92, 104432. [Google Scholar] [CrossRef] [Scilit]
- Koroso, N.H.; Zevenbergen, J.A.; Lengoiboni, M. Urban land use efficiency in Ethiopia: An assessment of urban land use sustainability in Addis Ababa. Land Use Policy 2020, 99, 105081. [Google Scholar] [CrossRef] [Scilit]
- Carmona, M. Public Places Urban Spaces: The Dimensions of Urban Design; Routledge: London, UK, 2021. [Google Scholar] [CrossRef] [Scilit]
- Gohain, K.J.; Mohammad, P.; Goswami, A. Assessing the impact of land use land cover changes on land surface temperature over Pune city, India. Quat. Int. 2021, 575, 259–269. [Google Scholar] [CrossRef] [Scilit]
- Kim, M. Upzoning and value capture: How US local governments use land use regulation power to create and capture value from real estate developments. Land Use Policy 2020, 95, 104624. [Google Scholar] [CrossRef] [Scilit]
- Bidandi, F.; Williams, J.J. Understanding urban land, politics, and planning: A critical appraisal of Kampala’s urban sprawl. Cities 2020, 106, 102858. [Google Scholar] [CrossRef] [Scilit]
- Di Marino, M.; Tabrizi, H.A.; Chavoshi, S.H.; Sinitsyna, A. Hybrid cities and new working spaces—The case of Oslo. Prog. Plan. 2023, 170, 100712. [Google Scholar] [CrossRef] [Scilit]
- Domingo, D.; Palka, G.; Hersperger, A.M. Effect of zoning plans on urban land-use change: A multi-scenario simulation for supporting sustainable urban growth. Sustain. Cities Soc. 2021, 69, 102833. [Google Scholar] [CrossRef] [Scilit]
- Gao, S.; Janowicz, K.; Couclelis, H. Extracting urban functional regions from points of interest and human activities on location-based social networks. Trans. GIS 2017, 21, 446–467. [Google Scholar] [CrossRef] [Scilit]
- Huang, W.; Zhang, D.; Mai, G.; Guo, X.; Cui, L. Learning urban region representations with POIs and hierarchical graph infomax. ISPRS J. Photogramm. Remote Sens. 2023, 196, 134–145. [Google Scholar] [CrossRef] [Scilit]
- Fu, Y.; Xiong, H.; Ge, Y.; Yao, Z.; Zheng, Y.; Zhou, Z.-H. Exploiting geographic dependencies for real estate appraisal: A mutual perspective of ranking and clustering. In Proceedings of the 20th ACM SIGKDD International Conference on Knowledge Discovery and Data Mining; ACM: New York, NY, USA, 2014; pp. 1047–1056. [Google Scholar] [CrossRef] [Scilit]
- Jiang, S.; Alves, A.; Rodrigues, F.; Ferreira, J., Jr.; Pereira, F.C. Mining point-of-interest data from social networks for urban land use classification and disaggregation. Comput. Environ. Urban Syst. 2015, 53, 36–46. [Google Scholar] [CrossRef] [Scilit]
- Döker, M.F.; Gül, A.; Kırlangıçoğlu, C.; Ocak, F.; Minaei, M. Identification of Urban Functional Areas Based on Point of Interest data and Thiessen Polygons for a Sustainable Urban Management. Soc. Indic. Res. 2025, 176, 1071–1092. [Google Scholar] [CrossRef] [Scilit]
- Zhai, W.; Bai, X.; Shi, Y.; Han, Y.; Peng, Z.-R.; Gu, C. Beyond word2vec: An approach for urban functional region extraction and identification by combining place2vec and POIs. Comput. Environ. Urban Syst. 2019, 74, 1–12. [Google Scholar] [CrossRef] [Scilit]
- Zhi, Y.; Li, H.; Wang, D.; Deng, M.; Wang, S.; Gao, J.; Duan, Z.; Liu, Y. Latent spatio-temporal activity structures: A new approach to inferring intra-urban functional regions via social media check-in data. Geo-Spat. Inf. Sci. 2016, 19, 94–105. [Google Scholar] [CrossRef] [Scilit]
- Poorthuis, A.; Shelton, T.; Zook, M. Changing neighborhoods, shifting connections: Mapping relational geographies of gentrification using social media data. Urban Geogr. 2022, 43, 960–983. [Google Scholar] [CrossRef] [Scilit]
- Cai, J.; Huang, B.; Song, Y. Using multi-source geospatial big data to identify the structure of polycentric cities. Remote Sens. Environ. 2017, 202, 210–221. [Google Scholar] [CrossRef] [Scilit]
- Song, Y.; Wang, R.; Fernandez, J.; Li, D. Investigating sense of place of the Las Vegas Strip using online reviews and machine learning approaches. Landsc. Urban Plan. 2021, 205, 103956. [Google Scholar] [CrossRef] [Scilit]
- Abdul-Rahman, M.; Chan, E.H.; Wong, M.S.; Irekponor, V.E.; Abdul-Rahman, M.O. A framework to simplify pre-processing location-based social media big data for sustainable urban planning and management. Cities 2021, 109, 102986. [Google Scholar] [CrossRef] [Scilit]
- Li, Z. Extracting spatial effects from machine learning model using local interpretation method: An example of SHAP and XGBoost. Comput. Environ. Urban Syst. 2022, 96, 101845. [Google Scholar] [CrossRef] [Scilit]
- Wang, J.; Biljecki, F. Unsupervised machine learning in urban studies: A systematic review of applications. Cities 2022, 129, 103925. [Google Scholar] [CrossRef] [Scilit]
- Wu, J.; Lu, Y.; Gao, H.; Wang, M. Cultivating historical heritage area vitality using urban morphology approach based on big data and machine learning. Comput. Environ. Urban Syst. 2022, 91, 101716. [Google Scholar] [CrossRef] [Scilit]
- Ye, Y.; Richards, D.; Lu, Y.; Song, X.; Zhuang, Y.; Zeng, W.; Zhong, T. Measuring daily accessed street greenery: A human-scale approach for informing better urban planning practices. Landsc. Urban Plan. 2019, 191, 103434. [Google Scholar] [CrossRef] [Scilit]
- Kang, Y.; Zhang, F.; Gao, S.; Peng, W.; Ratti, C. Human settlement value assessment from a place perspective: Considering human dynamics and perceptions in house price modeling. Cities 2021, 118, 103333. [Google Scholar] [CrossRef] [Scilit]
- Chen, W.; Huang, H.; Dong, J.; Zhang, Y.; Tian, Y.; Yang, Z. Social functional mapping of urban green space using remote sensing and social sensing data. ISPRS J. Photogramm. Remote Sens. 2018, 146, 436–452. [Google Scholar] [CrossRef] [Scilit]
- Rossetti, T.; Lobel, H.; Rocco, V.; Hurtubia, R. Explaining subjective perceptions of public spaces as a function of the built environment: A massive data approach. Landsc. Urban Plan. 2019, 181, 169–178. [Google Scholar] [CrossRef] [Scilit]
- Apicella, A.; Isgrò, F.; Prevete, R.; Tamburrini, G. Middle-level features for the explanation of classification systems by sparse dictionary methods. Int. J. Neural Syst. 2020, 30, 2050040. [Google Scholar] [CrossRef] [Scilit]
- Nelder, J.A.; Wedderburn, R.W. Generalized linear models. J. R. Stat. Soc. Ser. A 1972, 135, 370–384. [Google Scholar] [CrossRef] [Scilit]
- Ribeiro, M.T.; Singh, S.; Guestrin, C. “Why should I trust you?” explaining the predictions of any classifier. In Proceedings of the 22nd ACM SIGKDD International Conference on Knowledge Discovery and Data Mining; ACM: New York, NY, USA, 2016; pp. 1135–1144. [Google Scholar] [CrossRef] [Scilit]
- Alvarez-Melis, D.; Jaakkola, T.S. On the robustness of interpretability methods. arXiv 2018, arXiv:1806.08049. [Google Scholar] [CrossRef] [Scilit]
- Lundberg, S. A unified approach to interpreting model predictions. arXiv 2017, arXiv:1705.07874. [Google Scholar] [CrossRef] [Scilit]
- Yang, W.; Fei, J.; Li, Y.; Chen, H.; Liu, Y. Unraveling nonlinear and interaction effects of multilevel built environment features on outdoor jogging with explainable machine learning. Cities 2024, 147, 104813. [Google Scholar] [CrossRef] [Scilit]
- Wang, S.; Zeng, X.; Huang, Y.; Li, X. Analysing urban local cold air dynamics and climate functional zones using interpretable machine learning: A case study of Tianhe district, Guangzhou. Sustain. Cities Soc. 2024, 114, 105731. [Google Scholar] [CrossRef] [Scilit]
- Hancock, J.T.; Khoshgoftaar, T.M. CatBoost for big data: An interdisciplinary review. J. Big Data 2020, 7, 94. [Google Scholar] [CrossRef] [Scilit]
- Beijing Municipal Government. Beijing Municipal Land Use Plan Map (Beijing Urban Master Plan). 2026. Available online: https://www.beijing.gov.cn/gongkai/guihua/wngh/cqgh/201907/t20190701_100008.html (accessed on 3 January 2026).
- Xue, Y.; Li, C. Extracting Chinese geographic data from Baidu map API. Stata J. 2020, 20, 805–811. [Google Scholar] [CrossRef] [Scilit]
- Beijing Municipal Government. The Standards for Street-Level Administration in Beijing. 2021. Available online: https://www.beijing.gov.cn/zhengce/zhengcefagui/202101/t20210106_2200641.html (accessed on 25 December 2025).
- Bergstra, J.; Yamins, D.; Cox, D. Making a science of model search: Hyperparameter optimization in hundreds of dimensions for vision architectures. PMLR 2013, 28, 115–123. [Google Scholar]
- Prokhorenkova, L.; Gusev, G.; Vorobev, A.; Dorogush, A.V.; Gulin, A. CatBoost: Unbiased boosting with categorical features. In Advances in Neural Information Processing Systems 31 (NeurIPS 2018); Curran Associates, Inc.: Red Hook, NY, USA, 2018. [Google Scholar]
- Shen, S.-L.; Zhang, N.; Zhou, A.; Yin, Z.-Y. Enhancement of neural networks with an alternative activation function tanhlu. Expert Syst. Appl. 2022, 199, 117181. [Google Scholar] [CrossRef] [Scilit]
- Elbaz, K.; Yan, T.; Zhou, A.; Shen, S.-L. Deep learning analysis for energy consumption of shield tunneling machine drive system. Tunn. Undergr. Space Technol. 2022, 123, 104405. [Google Scholar] [CrossRef] [Scilit]
- Thakur, R.; Jayasinghe, J.P.K.; Mehta, P. Interpretable and robust multimodal fake news detection with evidence fusion and reliable reasoning. Int. J. Data Sci. Anal. 2026, 22, 4. [Google Scholar] [CrossRef] [Scilit]
- McDonald, J.F.; McMillen, D.P. Urban Economics and Real Estate: Theory and Policy; John Wiley & Sons: Hoboken, NJ, USA, 2010. [Google Scholar]
- Gaubatz, P.; Hanink, D. Learning from Taiyuan: Chinese cities as urban sustainability laboratories. Geogr. Sustain. 2020, 1, 118–126. [Google Scholar] [CrossRef] [Scilit]
- Bradbury, J.C.; Coates, D.; Humphreys, B.R. Public policy toward professional sports stadiums: A review. J. Policy Anal. Manag. 2024, 43, 899–937. [Google Scholar] [CrossRef] [Scilit]
- Fujita, M. Urban Economic Theory; Cambridge University Press: Cambridge, UK, 1989. [Google Scholar]
- Fleischmann, M.; Arribas-Bel, D. Geographical characterization of British urban form and function using the spatial signatures framework. Sci. Data 2022, 9, 546. [Google Scholar] [CrossRef] [Scilit]
- Zhu, J.; Pawson, H.; Han, H.; Li, B. How can spatial planning influence housing market dynamics in a pro-growth planning regime? a case study of Shanghai. Land Use Policy 2022, 116, 106066. [Google Scholar] [CrossRef] [Scilit]
- Wang, J.; Ren, Y.; Shu, T.; Shen, L.; Liao, X.; Yang, N.; He, H. Economic perspective-based analysis on urban infrastructures carrying capacity—A China study. Environ. Impact Assess. Rev. 2020, 83, 106381. [Google Scholar] [CrossRef] [Scilit]
- Pollalis, S. Planning Sustainable Cities: An Infrastructure-Based Approach; Routledge: London, UK, 2016. [Google Scholar] [CrossRef] [Scilit]
- Chu, E.W.; Karr, J.R. Environmental impact: Concept, consequences, measurement. Ref. Modul. Life Sci. 2016, B978. [Google Scholar] [CrossRef] [Scilit]
- Heffernan, M.; Suarsana, L.; Meusburger, P. Geographies of the university: An introduction. In Geographies of the University; Springer: Cham, Switzerland, 2018; pp. 1–20. [Google Scholar] [CrossRef] [Scilit]
- Oliveira, V. Urban Morphology: An Introduction to the Study of the Physical Form of Cities; Springer: Cham, Switzerland, 2016. [Google Scholar] [CrossRef] [Scilit]
- Lynch, K. The Image of the City; MIT Press: Cambridge, MA, USA, 1964. [Google Scholar]
- Bielska, A.; Borkowski, A.S.; Czarnecka, A.; Delnicki, M.; Kwiatkowska-Malina, J.; Piotrkowska, M. Evaluating the potential of suburban and rural areas for tourism and recreation, including individual short-term tourism under pandemic conditions. Sci. Rep. 2022, 12, 20369. [Google Scholar] [CrossRef] [Scilit]
- Ye, Y.; Qin, Y.; Yu, R.; Wu, Q. Optimization of Chinese land spatial pattern in the transformation process of resource-based cities: A case study in Tongling city, China. Sci. Rep. 2024, 14, 6092. [Google Scholar] [CrossRef] [Scilit]
- Zhang, P.; Cai, W.; Yao, M.; Wang, Z.; Yang, L.; Wei, W. Urban carbon emissions associated with electricity consumption in Beijing and the driving factors. Appl. Energy 2020, 275, 115425. [Google Scholar] [CrossRef] [Scilit]
- Glaeser, E.L.; Gyourko, J. The impact of zoning on housing affordability. Econ. Policy Rev. 2002, 9, 21–39. [Google Scholar] [CrossRef] [Scilit]
- Koroso, N.H.; Lengoiboni, M.; Zevenbergen, J.A. Urbanization and urban land use efficiency: Evidence from regional and Addis Ababa satellite cities, Ethiopia. Habitat. Int. 2021, 117, 102437. [Google Scholar] [CrossRef] [Scilit]
- Lemar, A.S. Overparticipation: Designing effective land use public processes. Fordham L. Rev. 2021, 90, 1083. [Google Scholar] [CrossRef] [Scilit]
- Ioannidis, R.; Koutsoyiannis, D. A review of land use, visibility and public perception of renewable energy in the context of landscape impact. Appl. Energy 2020, 276, 115367. [Google Scholar] [CrossRef] [Scilit]
- Zhang, Y. Evaluating parametric form-based code for sustainable development of urban communities and neighborhoods. Int. J. Environ. Res. Public Health 2022, 19, 7389. [Google Scholar] [CrossRef] [Scilit]
- Egidi, G.; Cividino, S.; Quaranta, G.; Alhuseen, A.; Salvati, L. Land mismatches, urban growth and spatial planning: A contribution to metropolitan sustainability. Environ. Impact Assess. Rev. 2020, 84, 106439. [Google Scholar] [CrossRef] [Scilit]
- Bai, X.; McAllister, R.R.; Beaty, R.M.; Taylor, B. Urban policy and governance in a global environment: Complex systems, scale mismatches and public participation. Curr. Opin. Environ. Sustain. 2010, 2, 129–135. [Google Scholar] [CrossRef] [Scilit]
- Dodge, M.; McDerby, M.; Turner, M. Geographic Visualization: Concepts, Tools and Applications; John Wiley & Sons: Hoboken, NJ, USA, 2011. [Google Scholar]
- Çiftçioğlu, A.Ö.; Delikanlı, A.; Shafighfard, T.; Bagherzadeh, F. Machine learning based shear strength prediction in reinforced concrete beams using Levy flight enhanced decision trees. Sci. Rep. 2025, 15, 27488. [Google Scholar] [CrossRef] [Scilit] [PubMed]
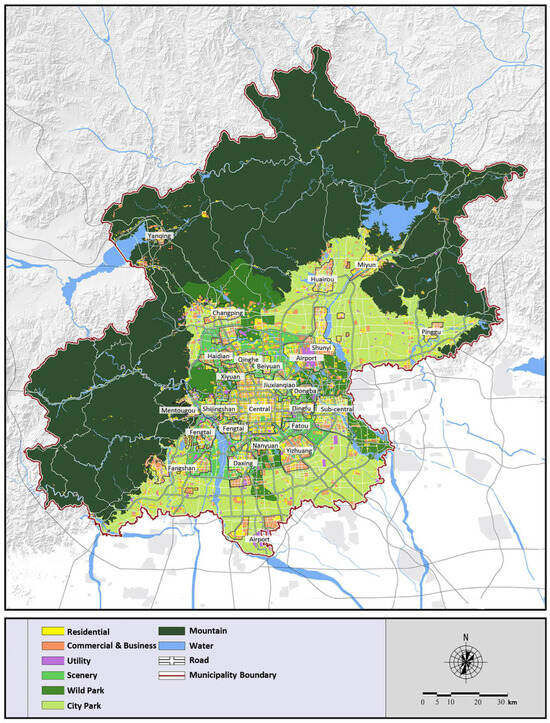
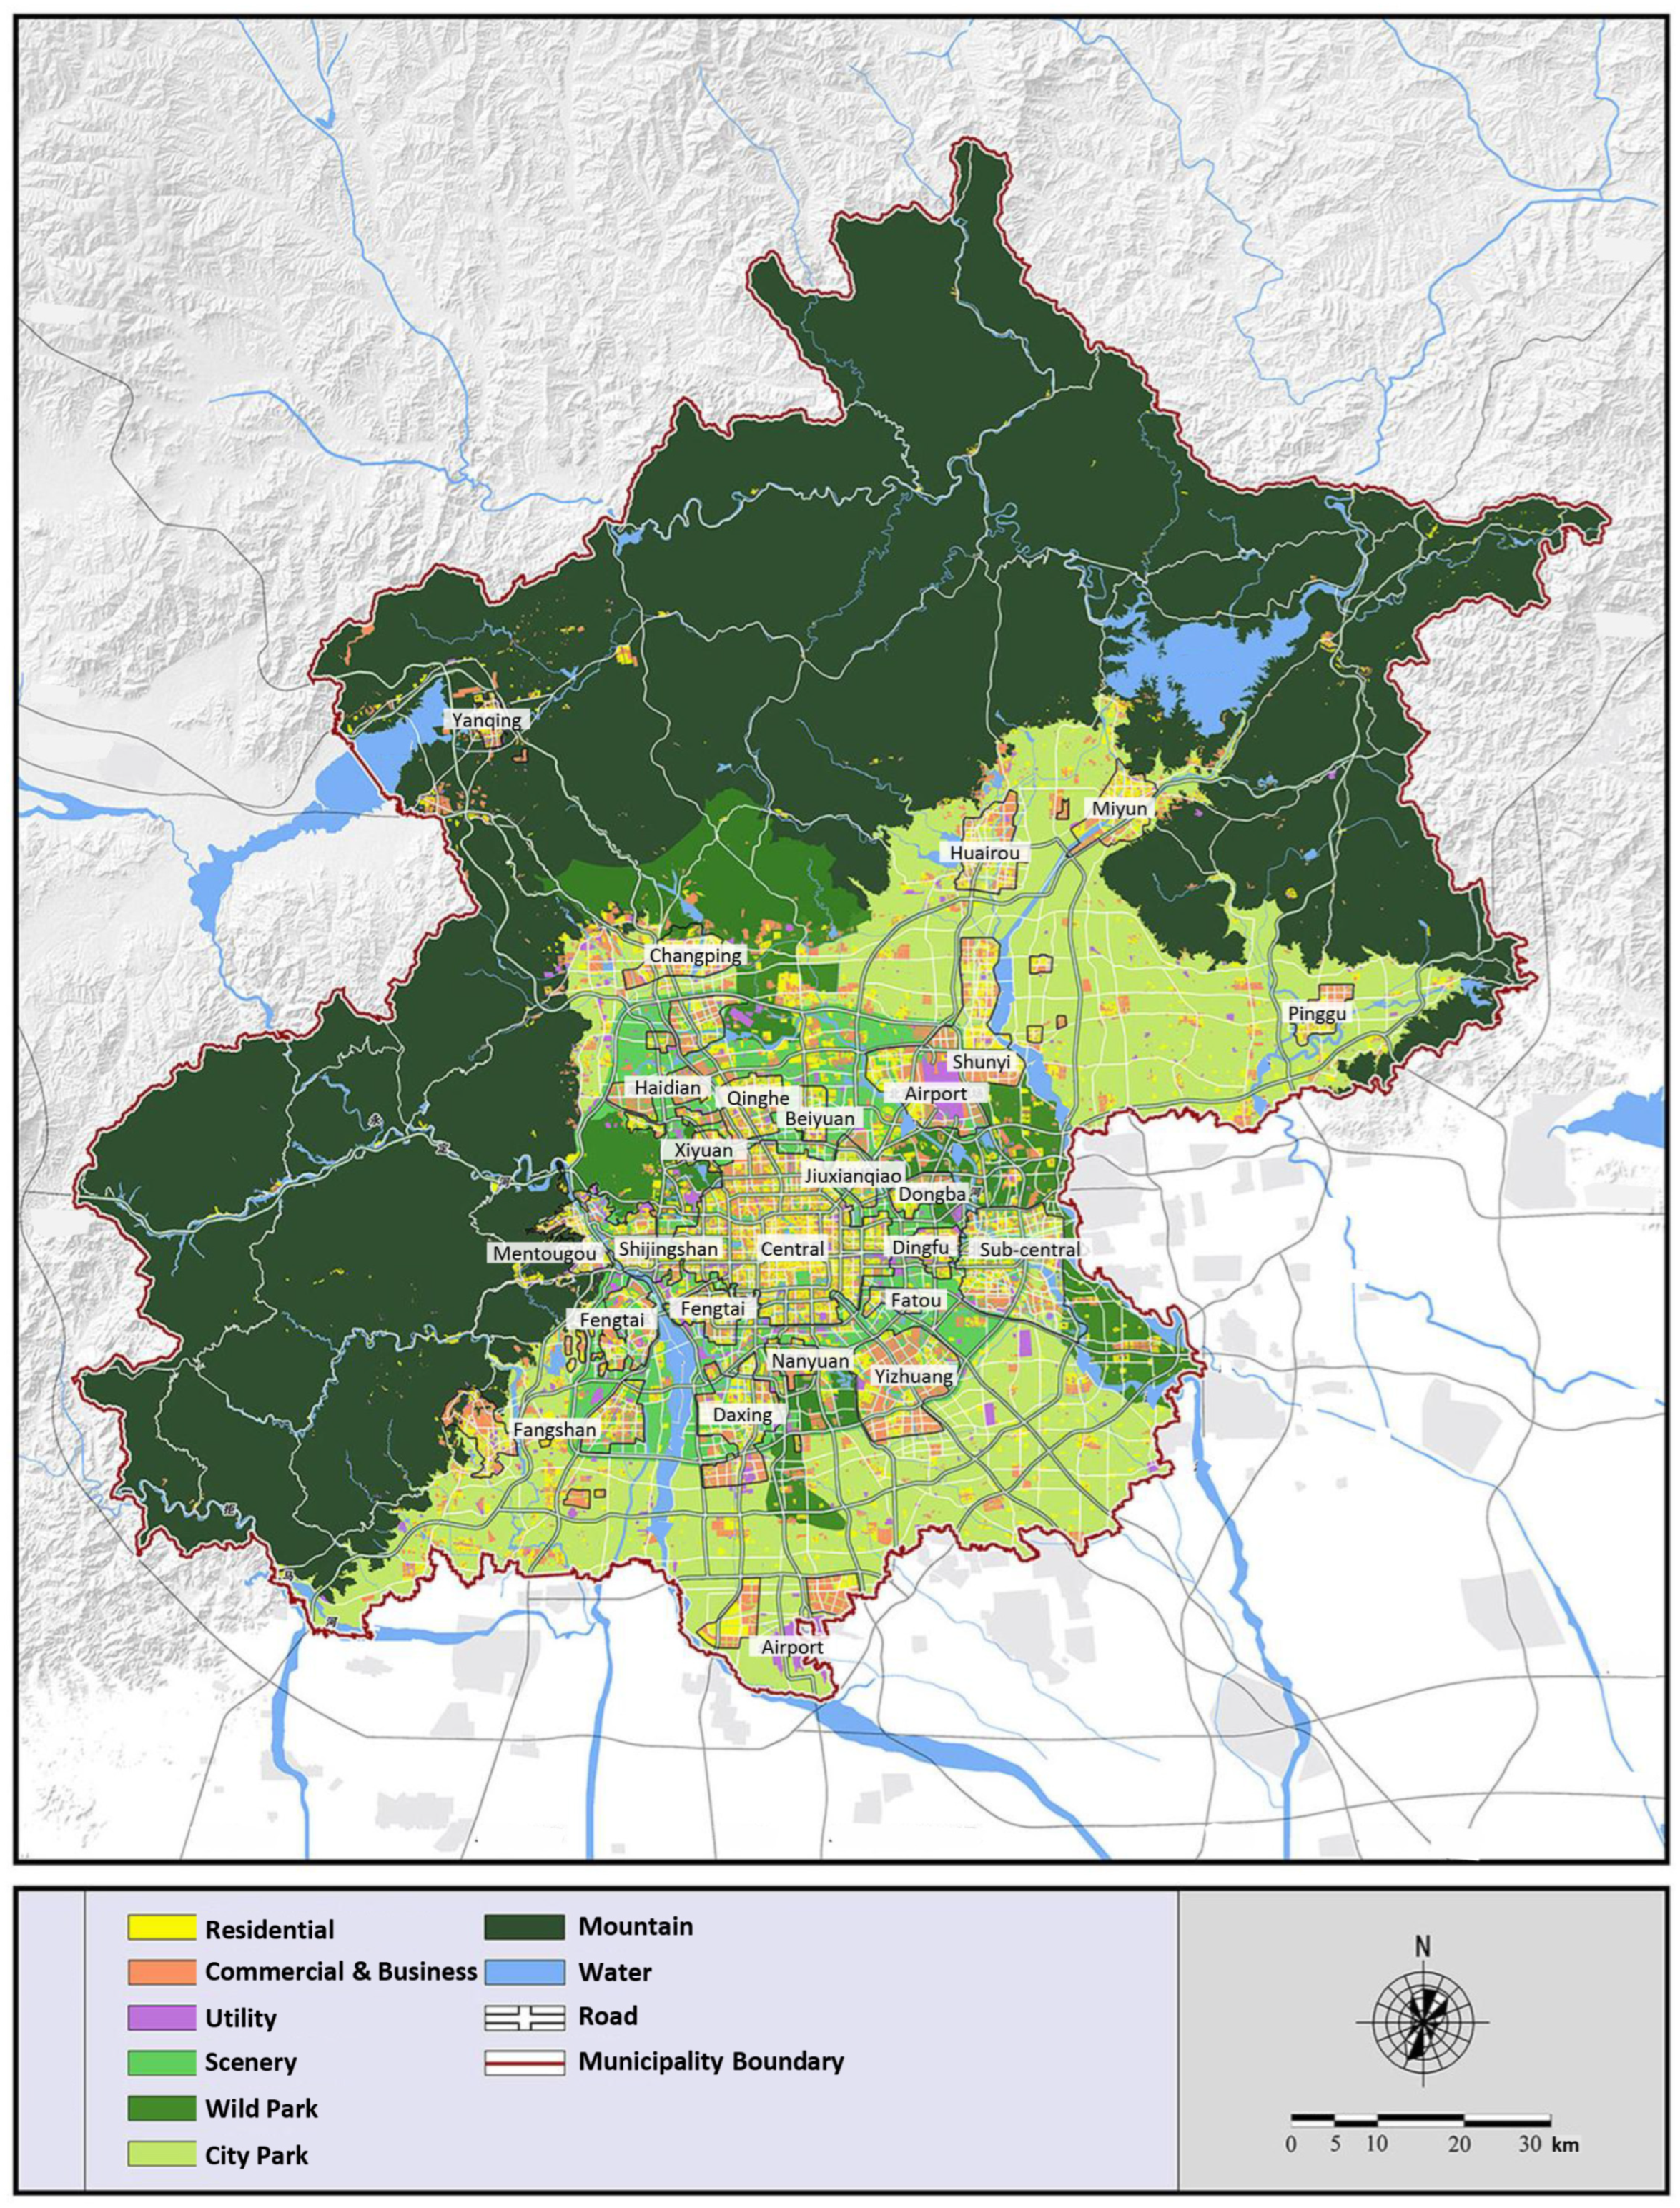
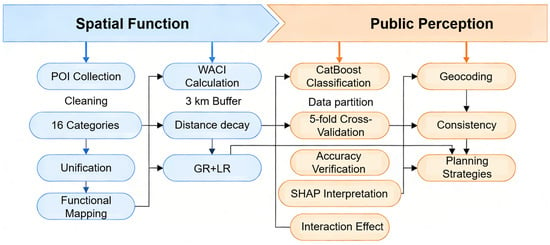
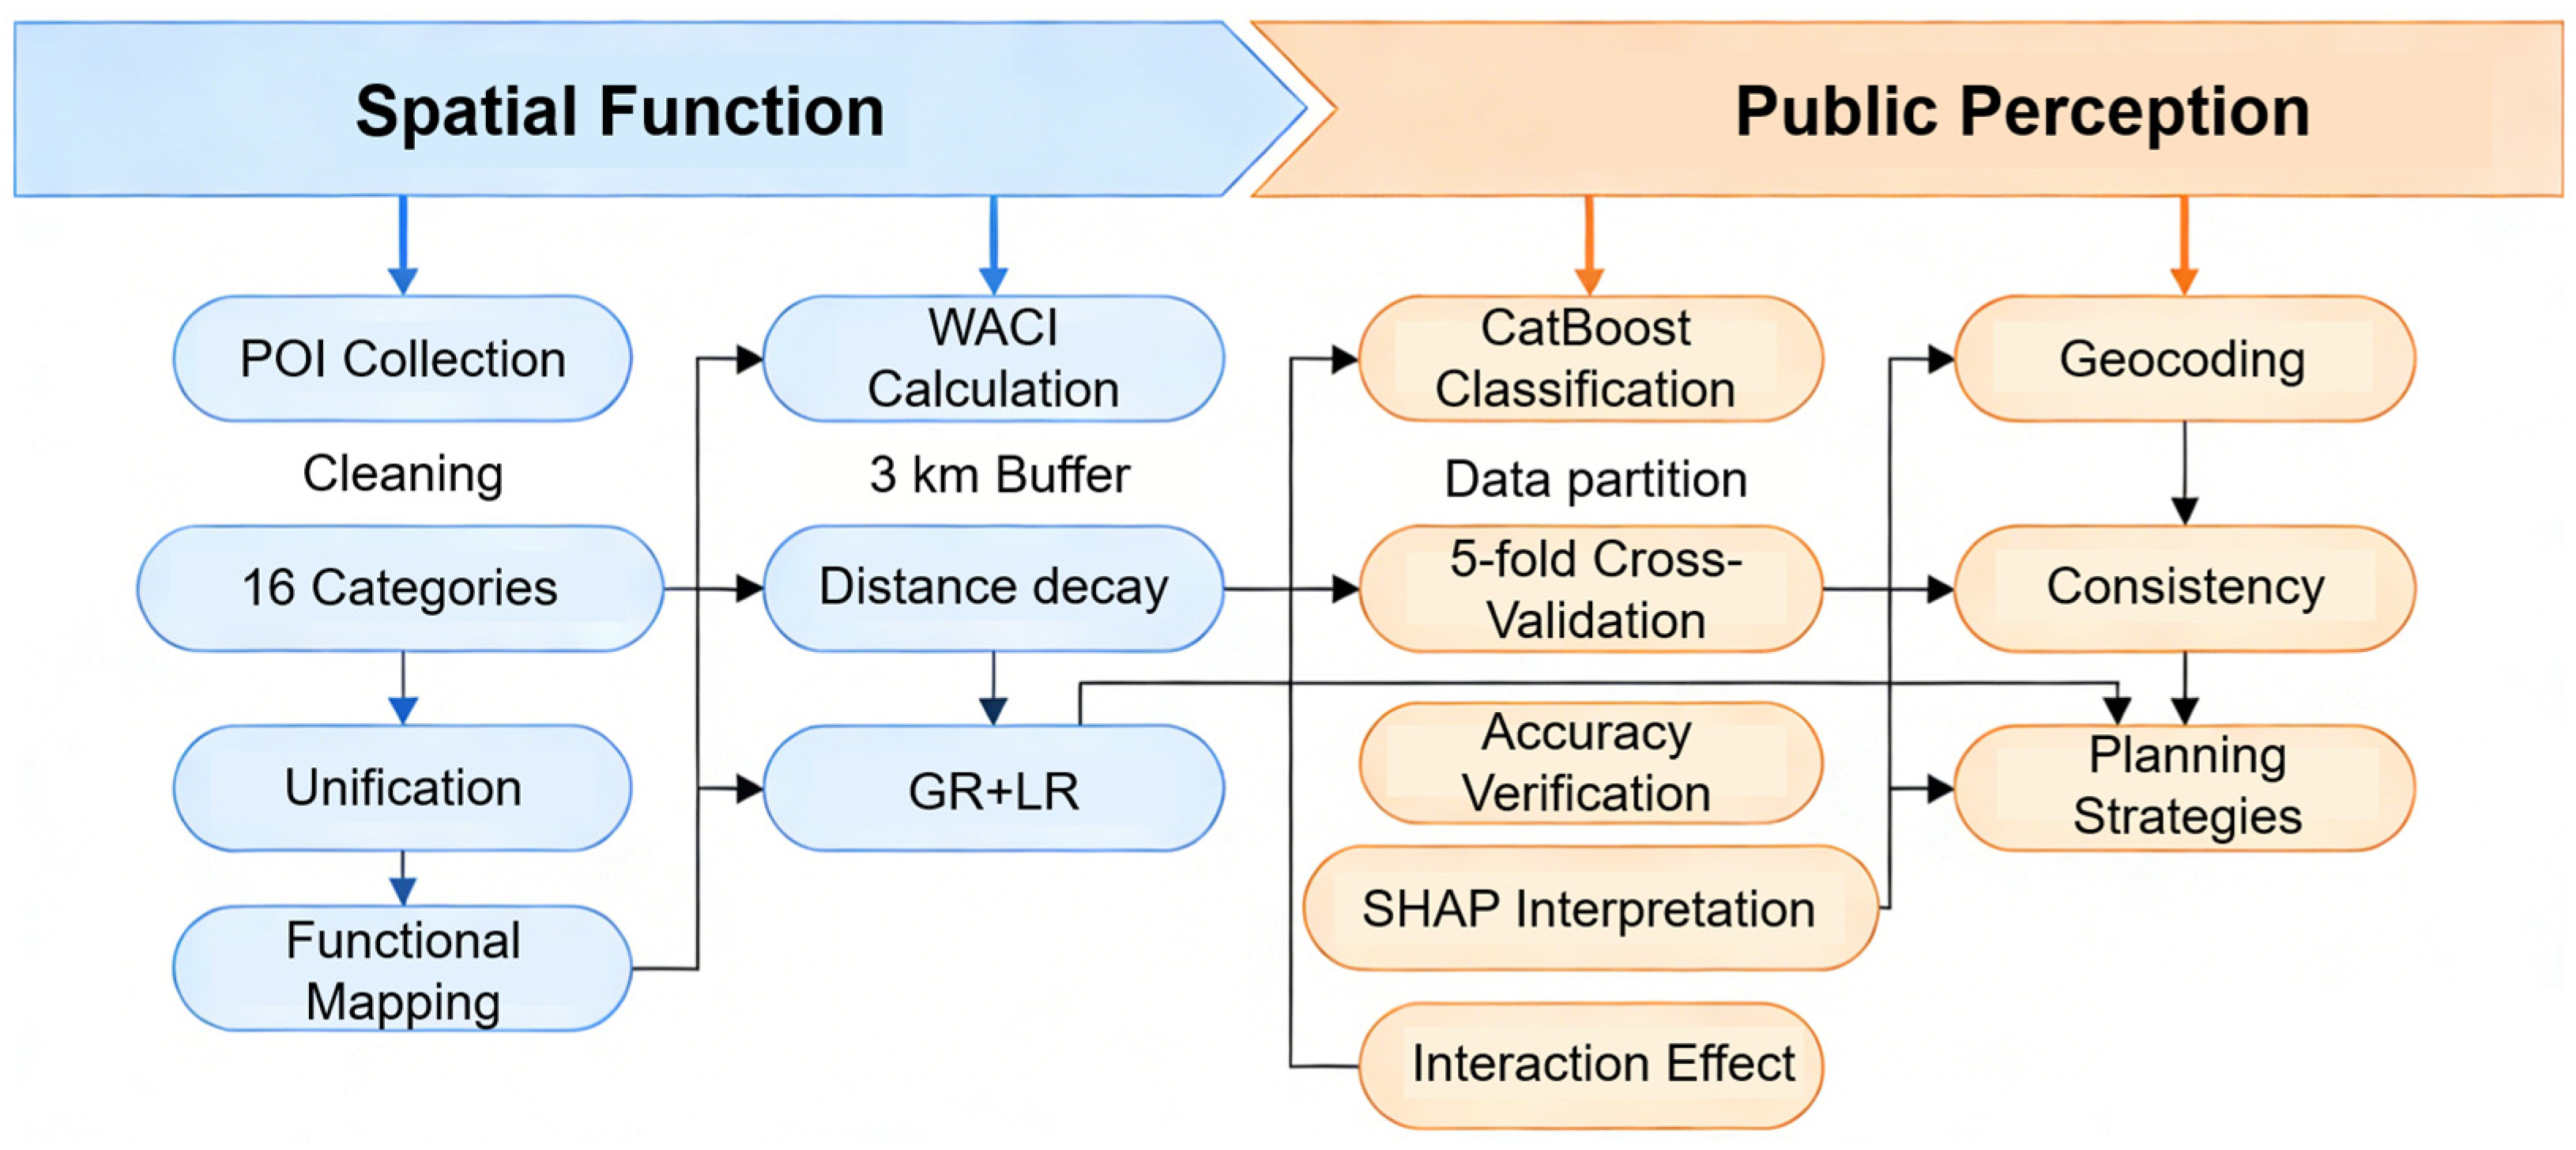
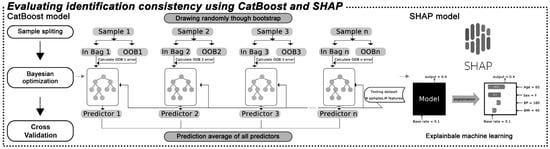
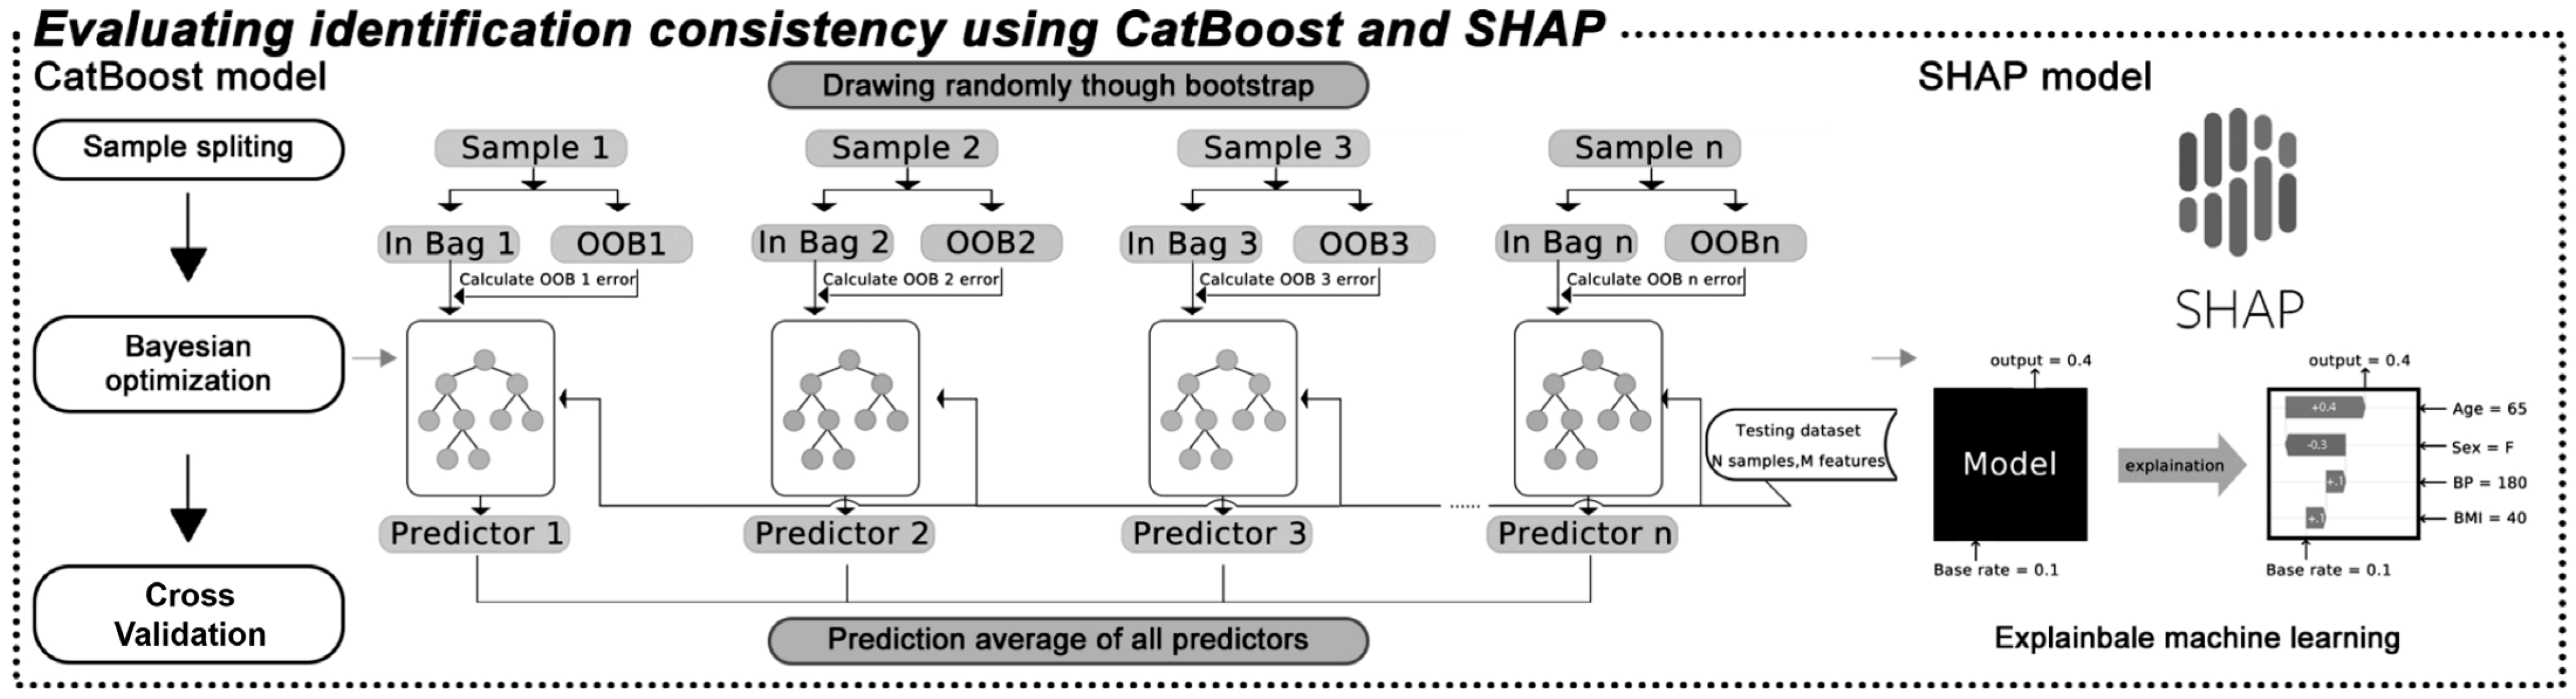
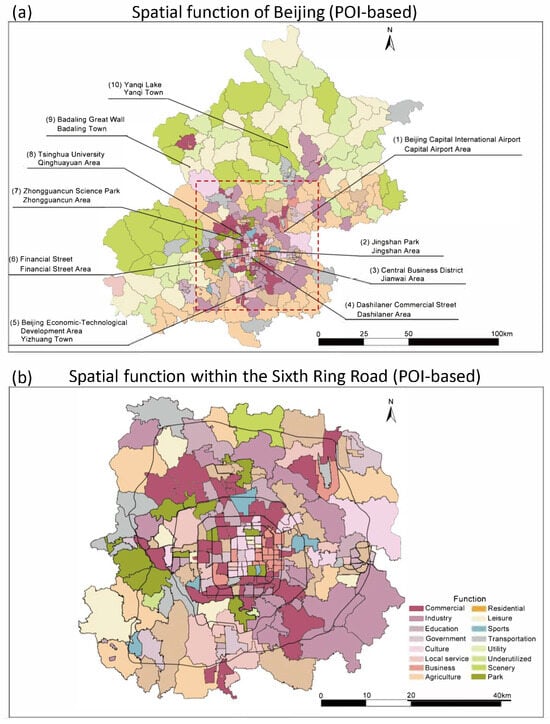
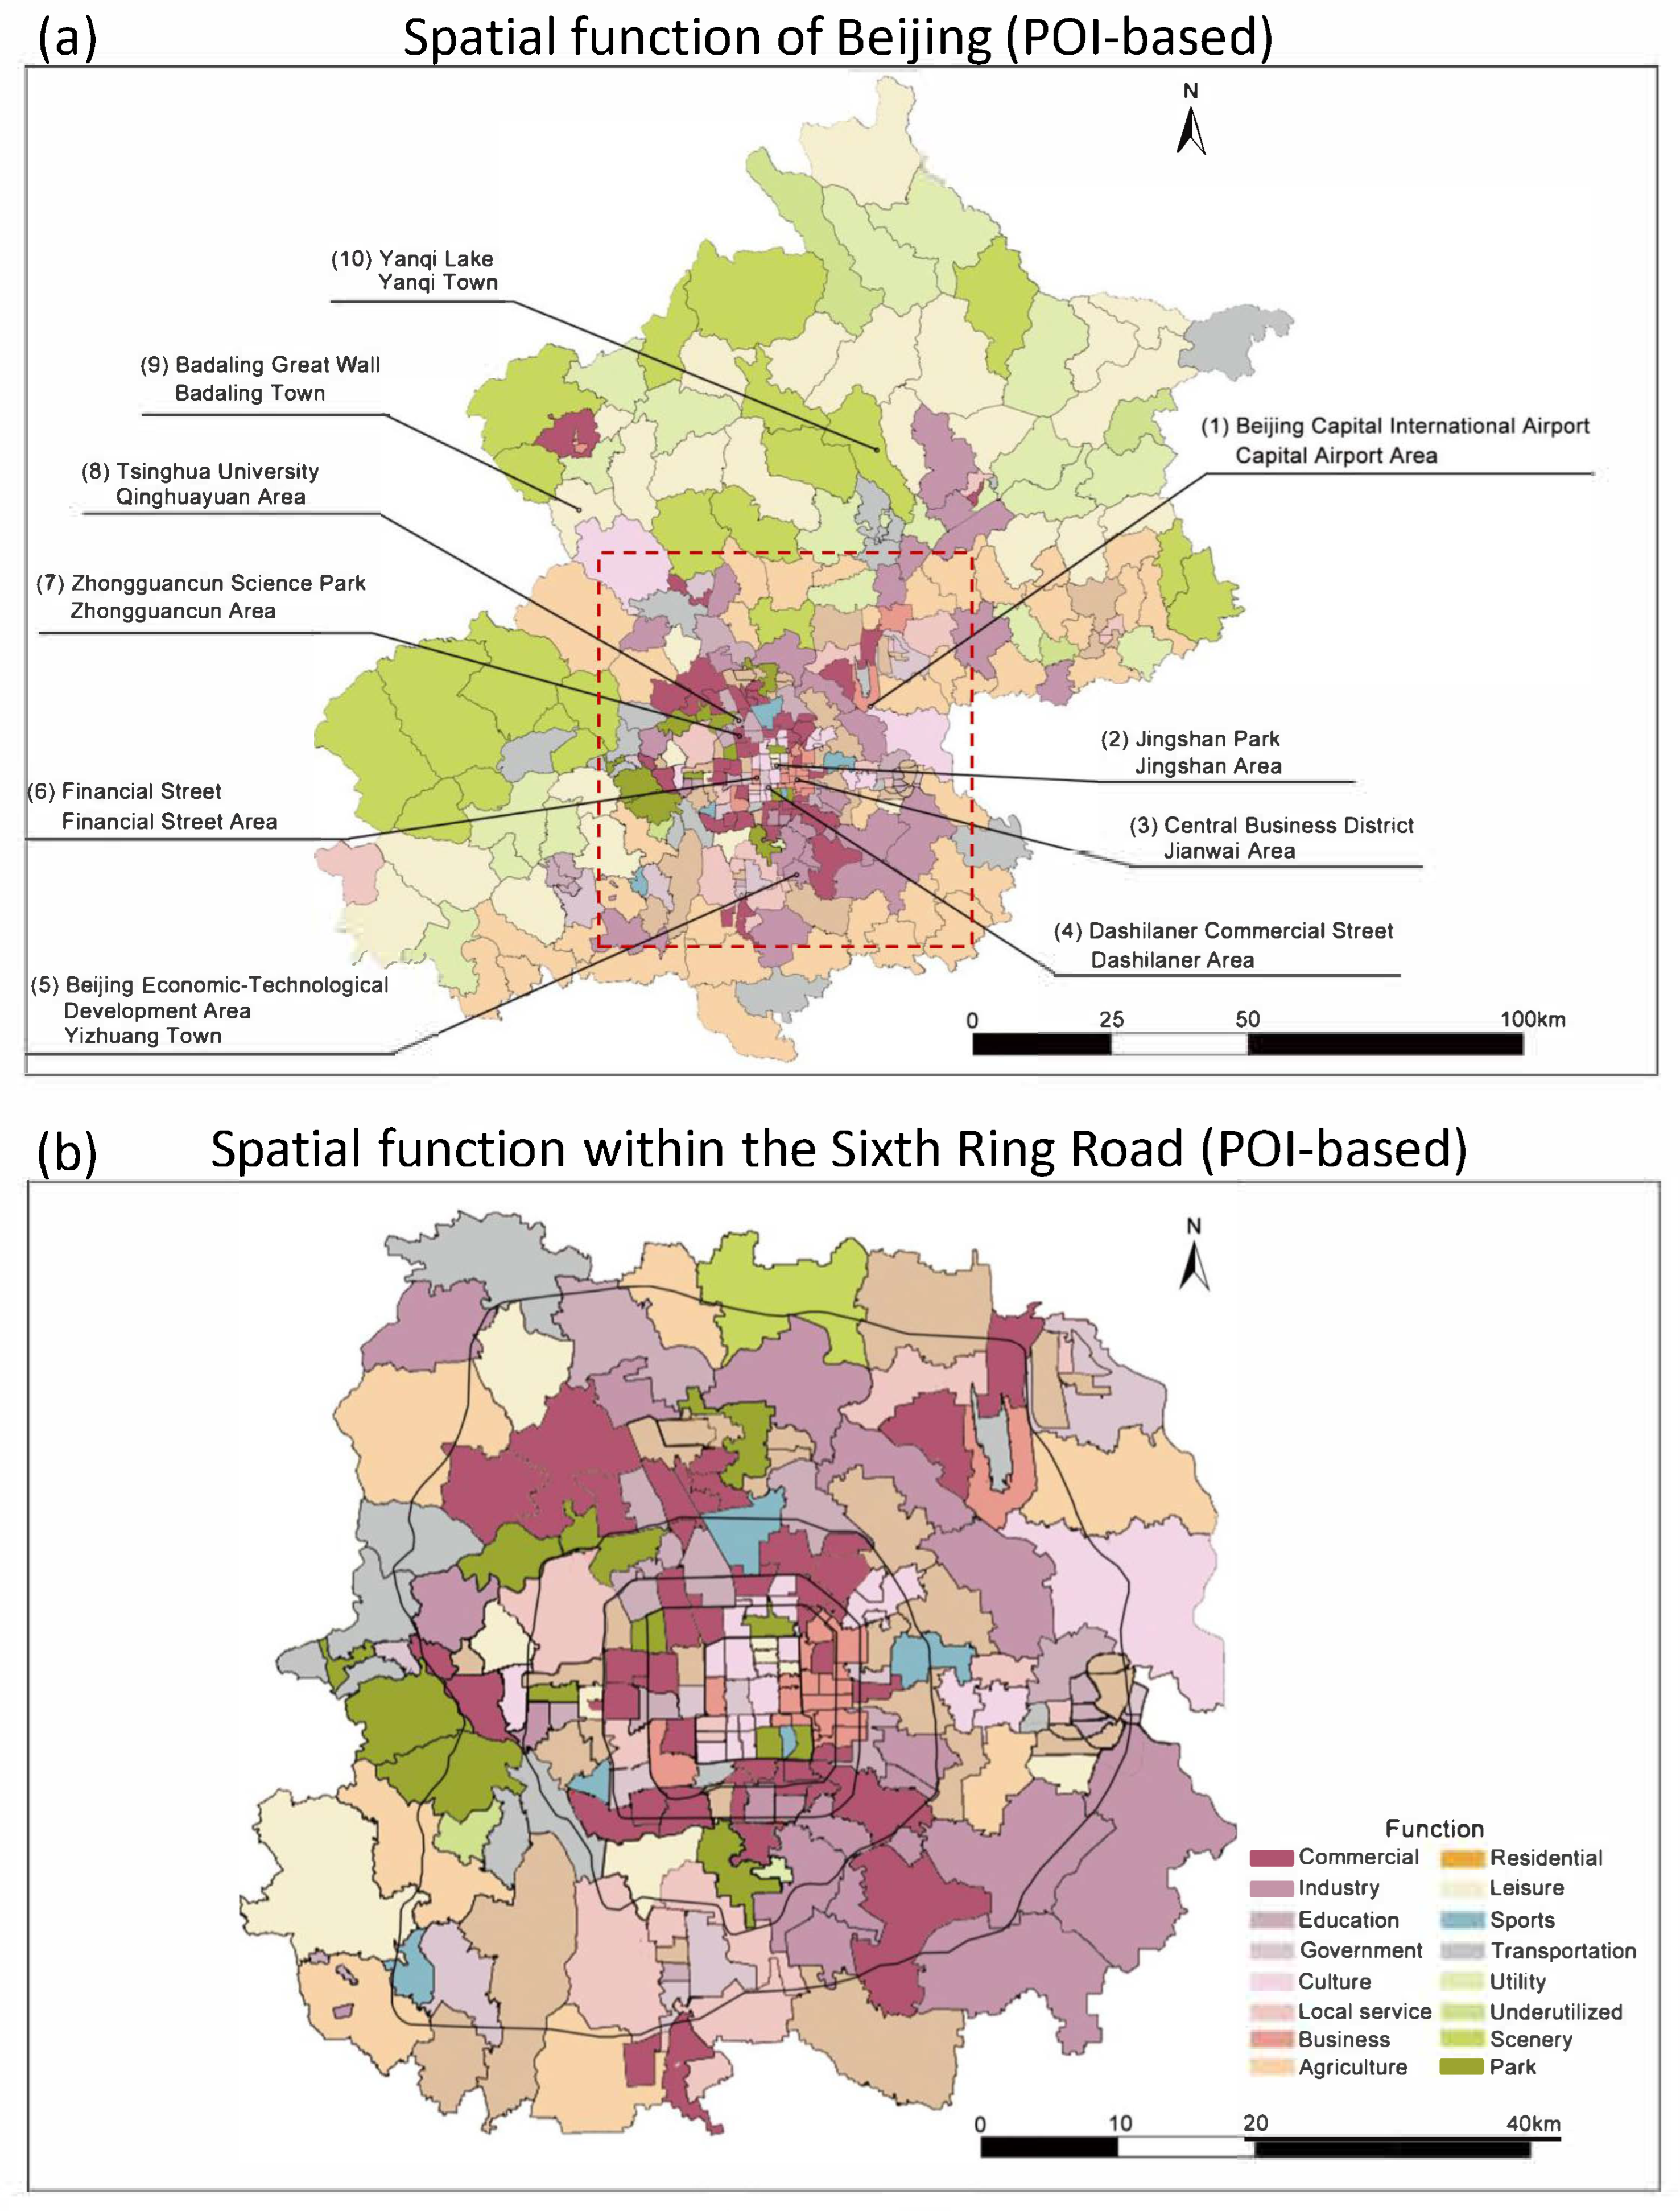
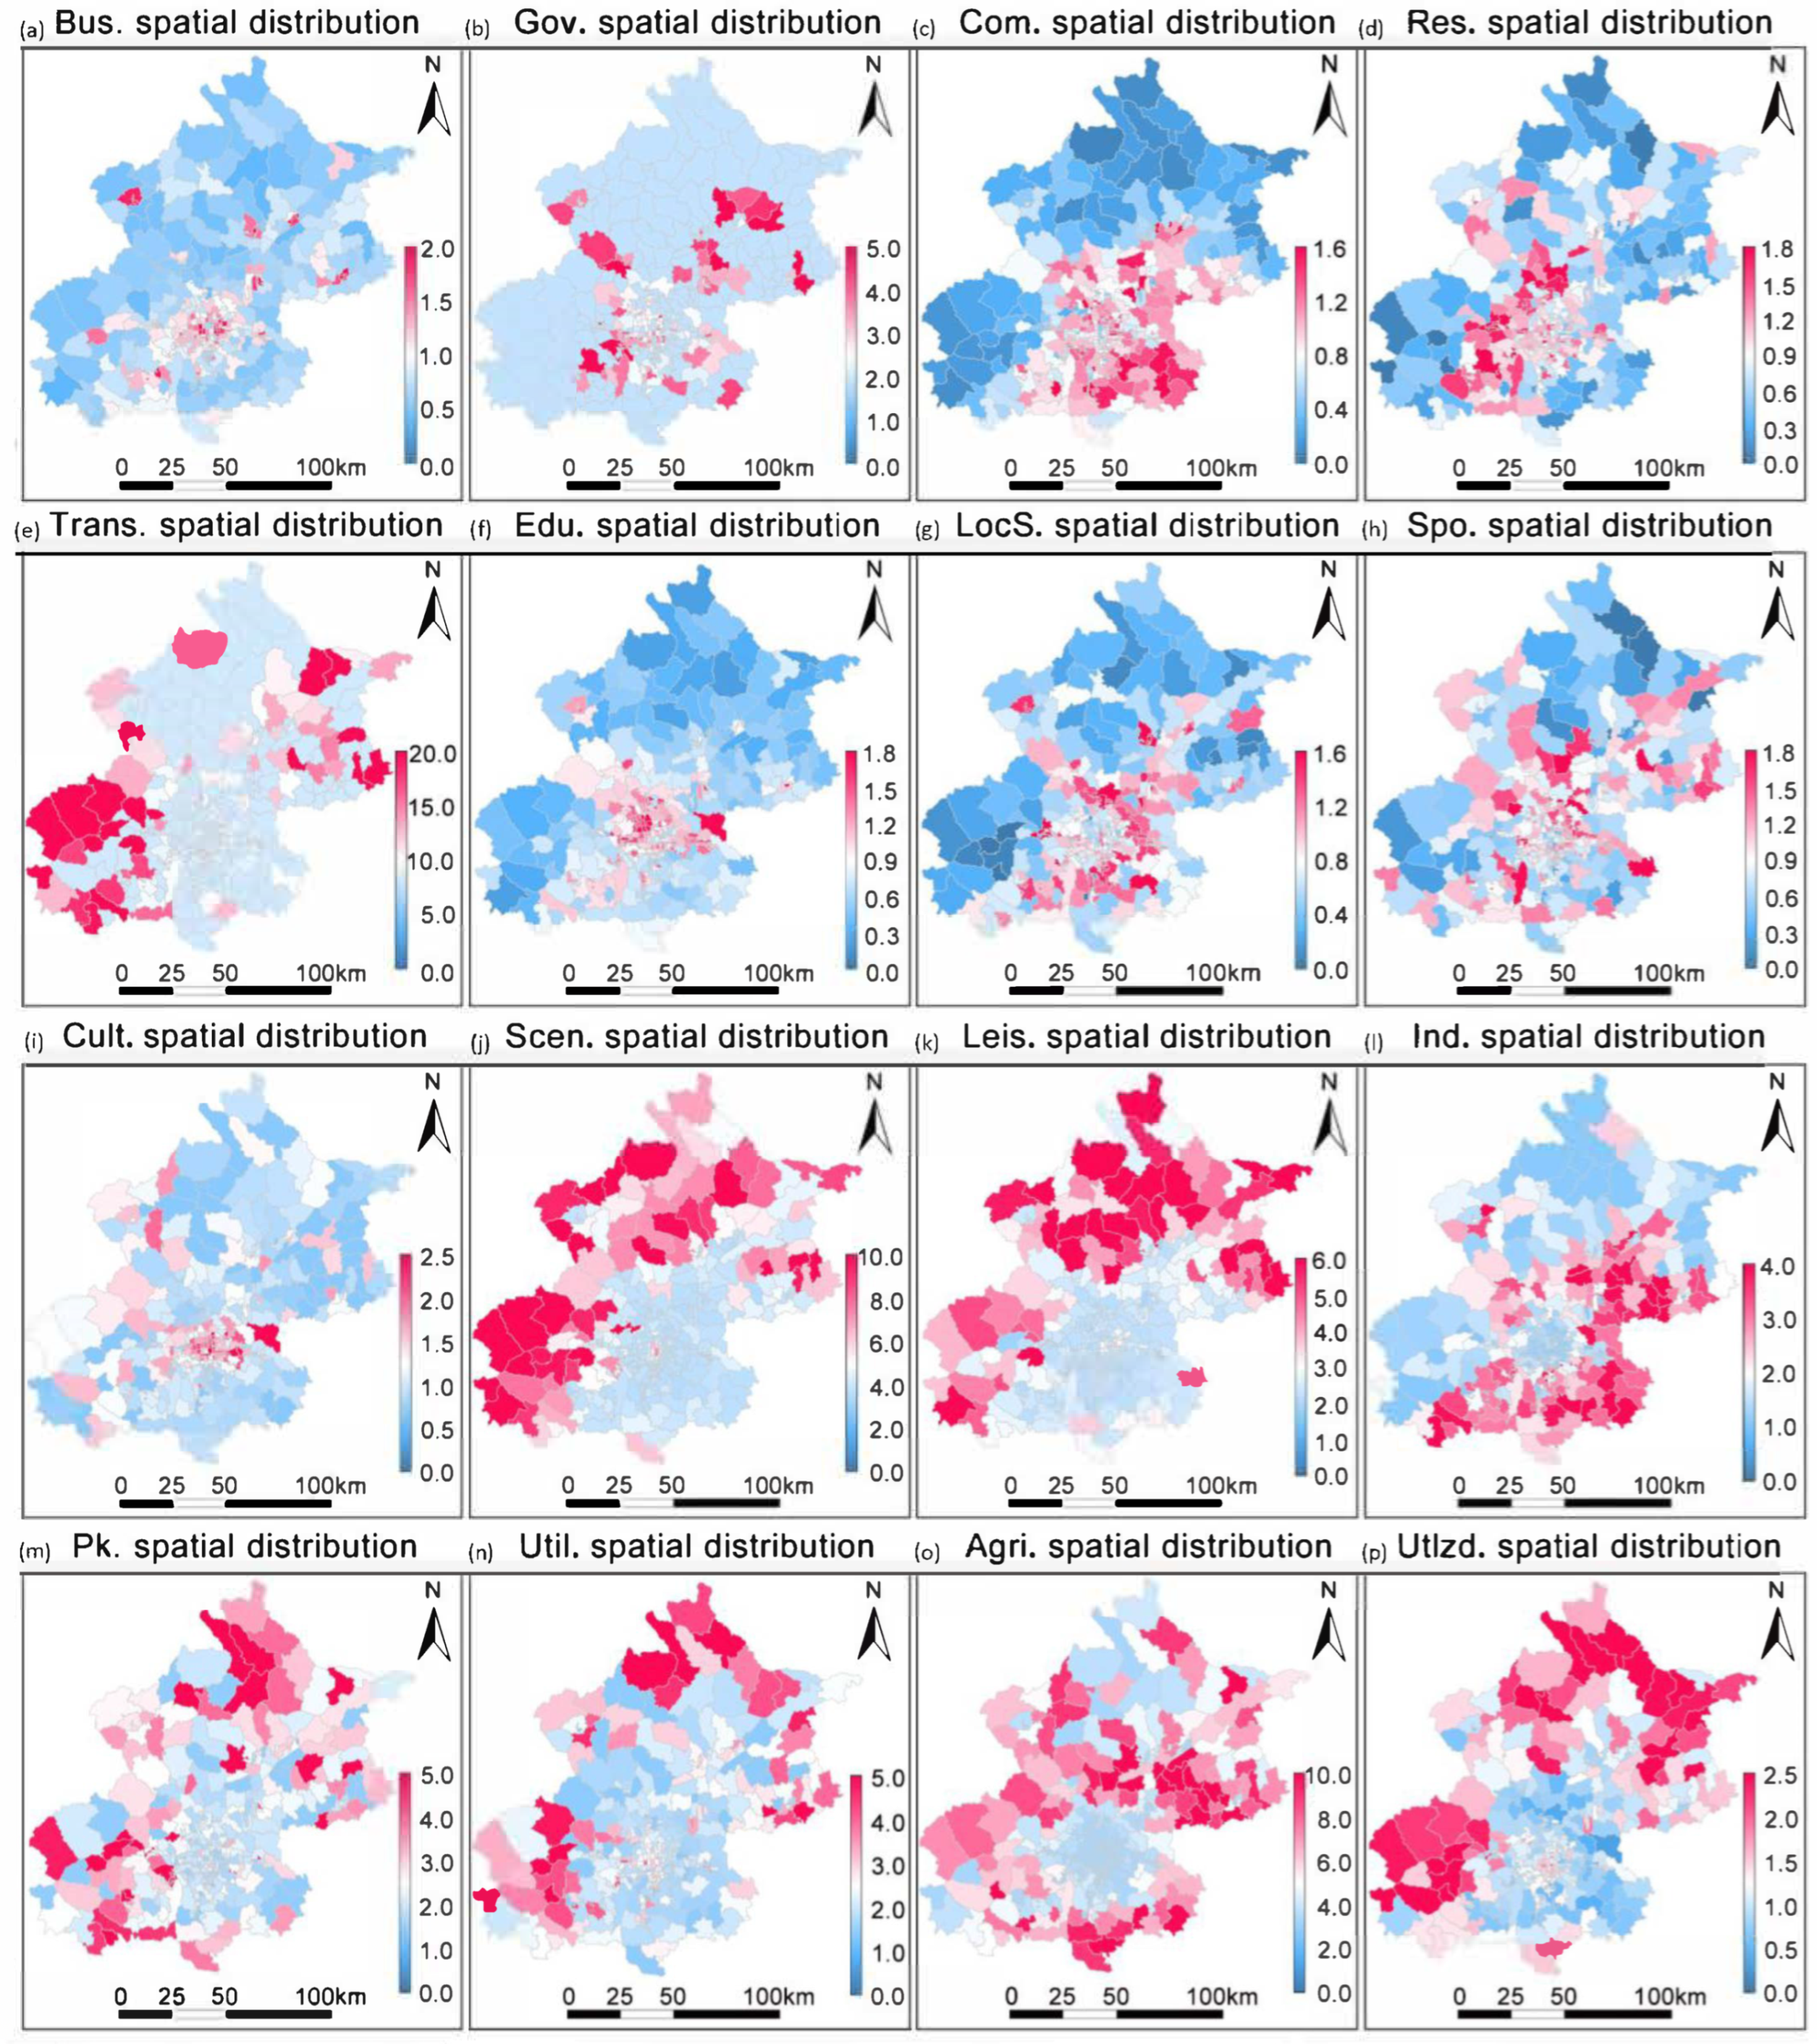
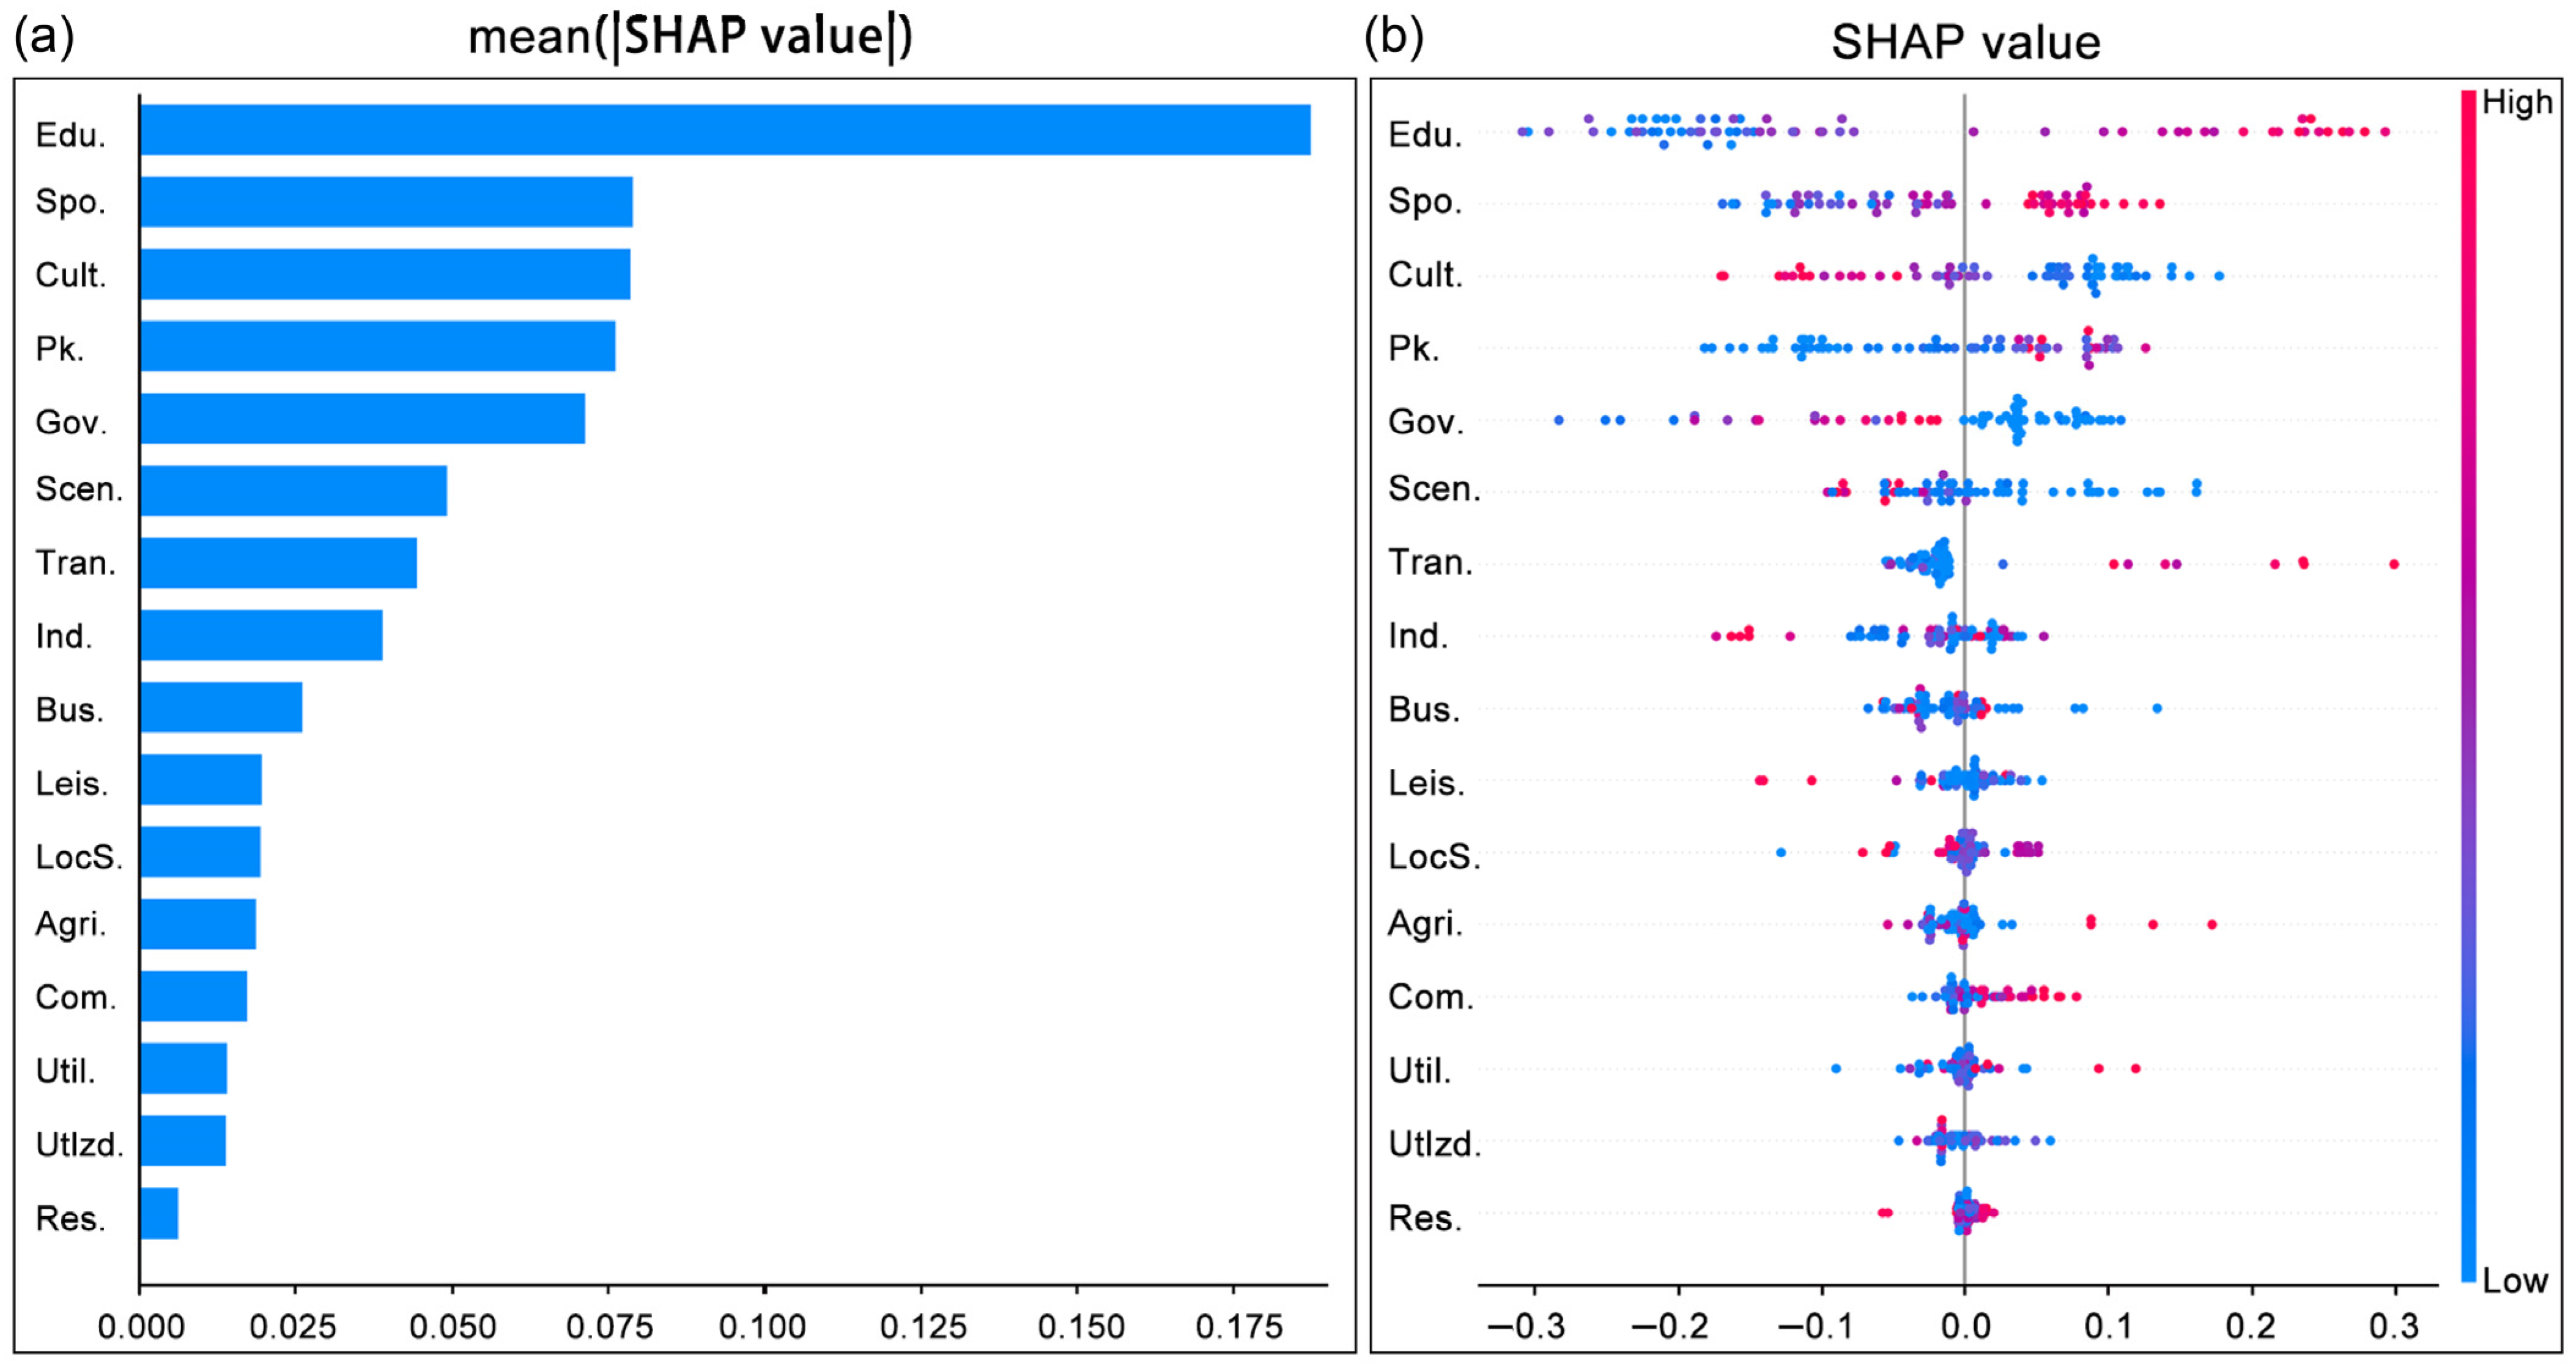
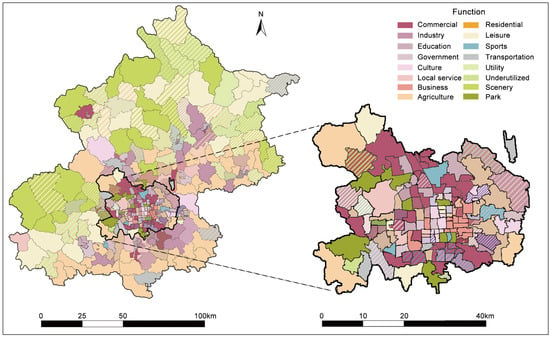
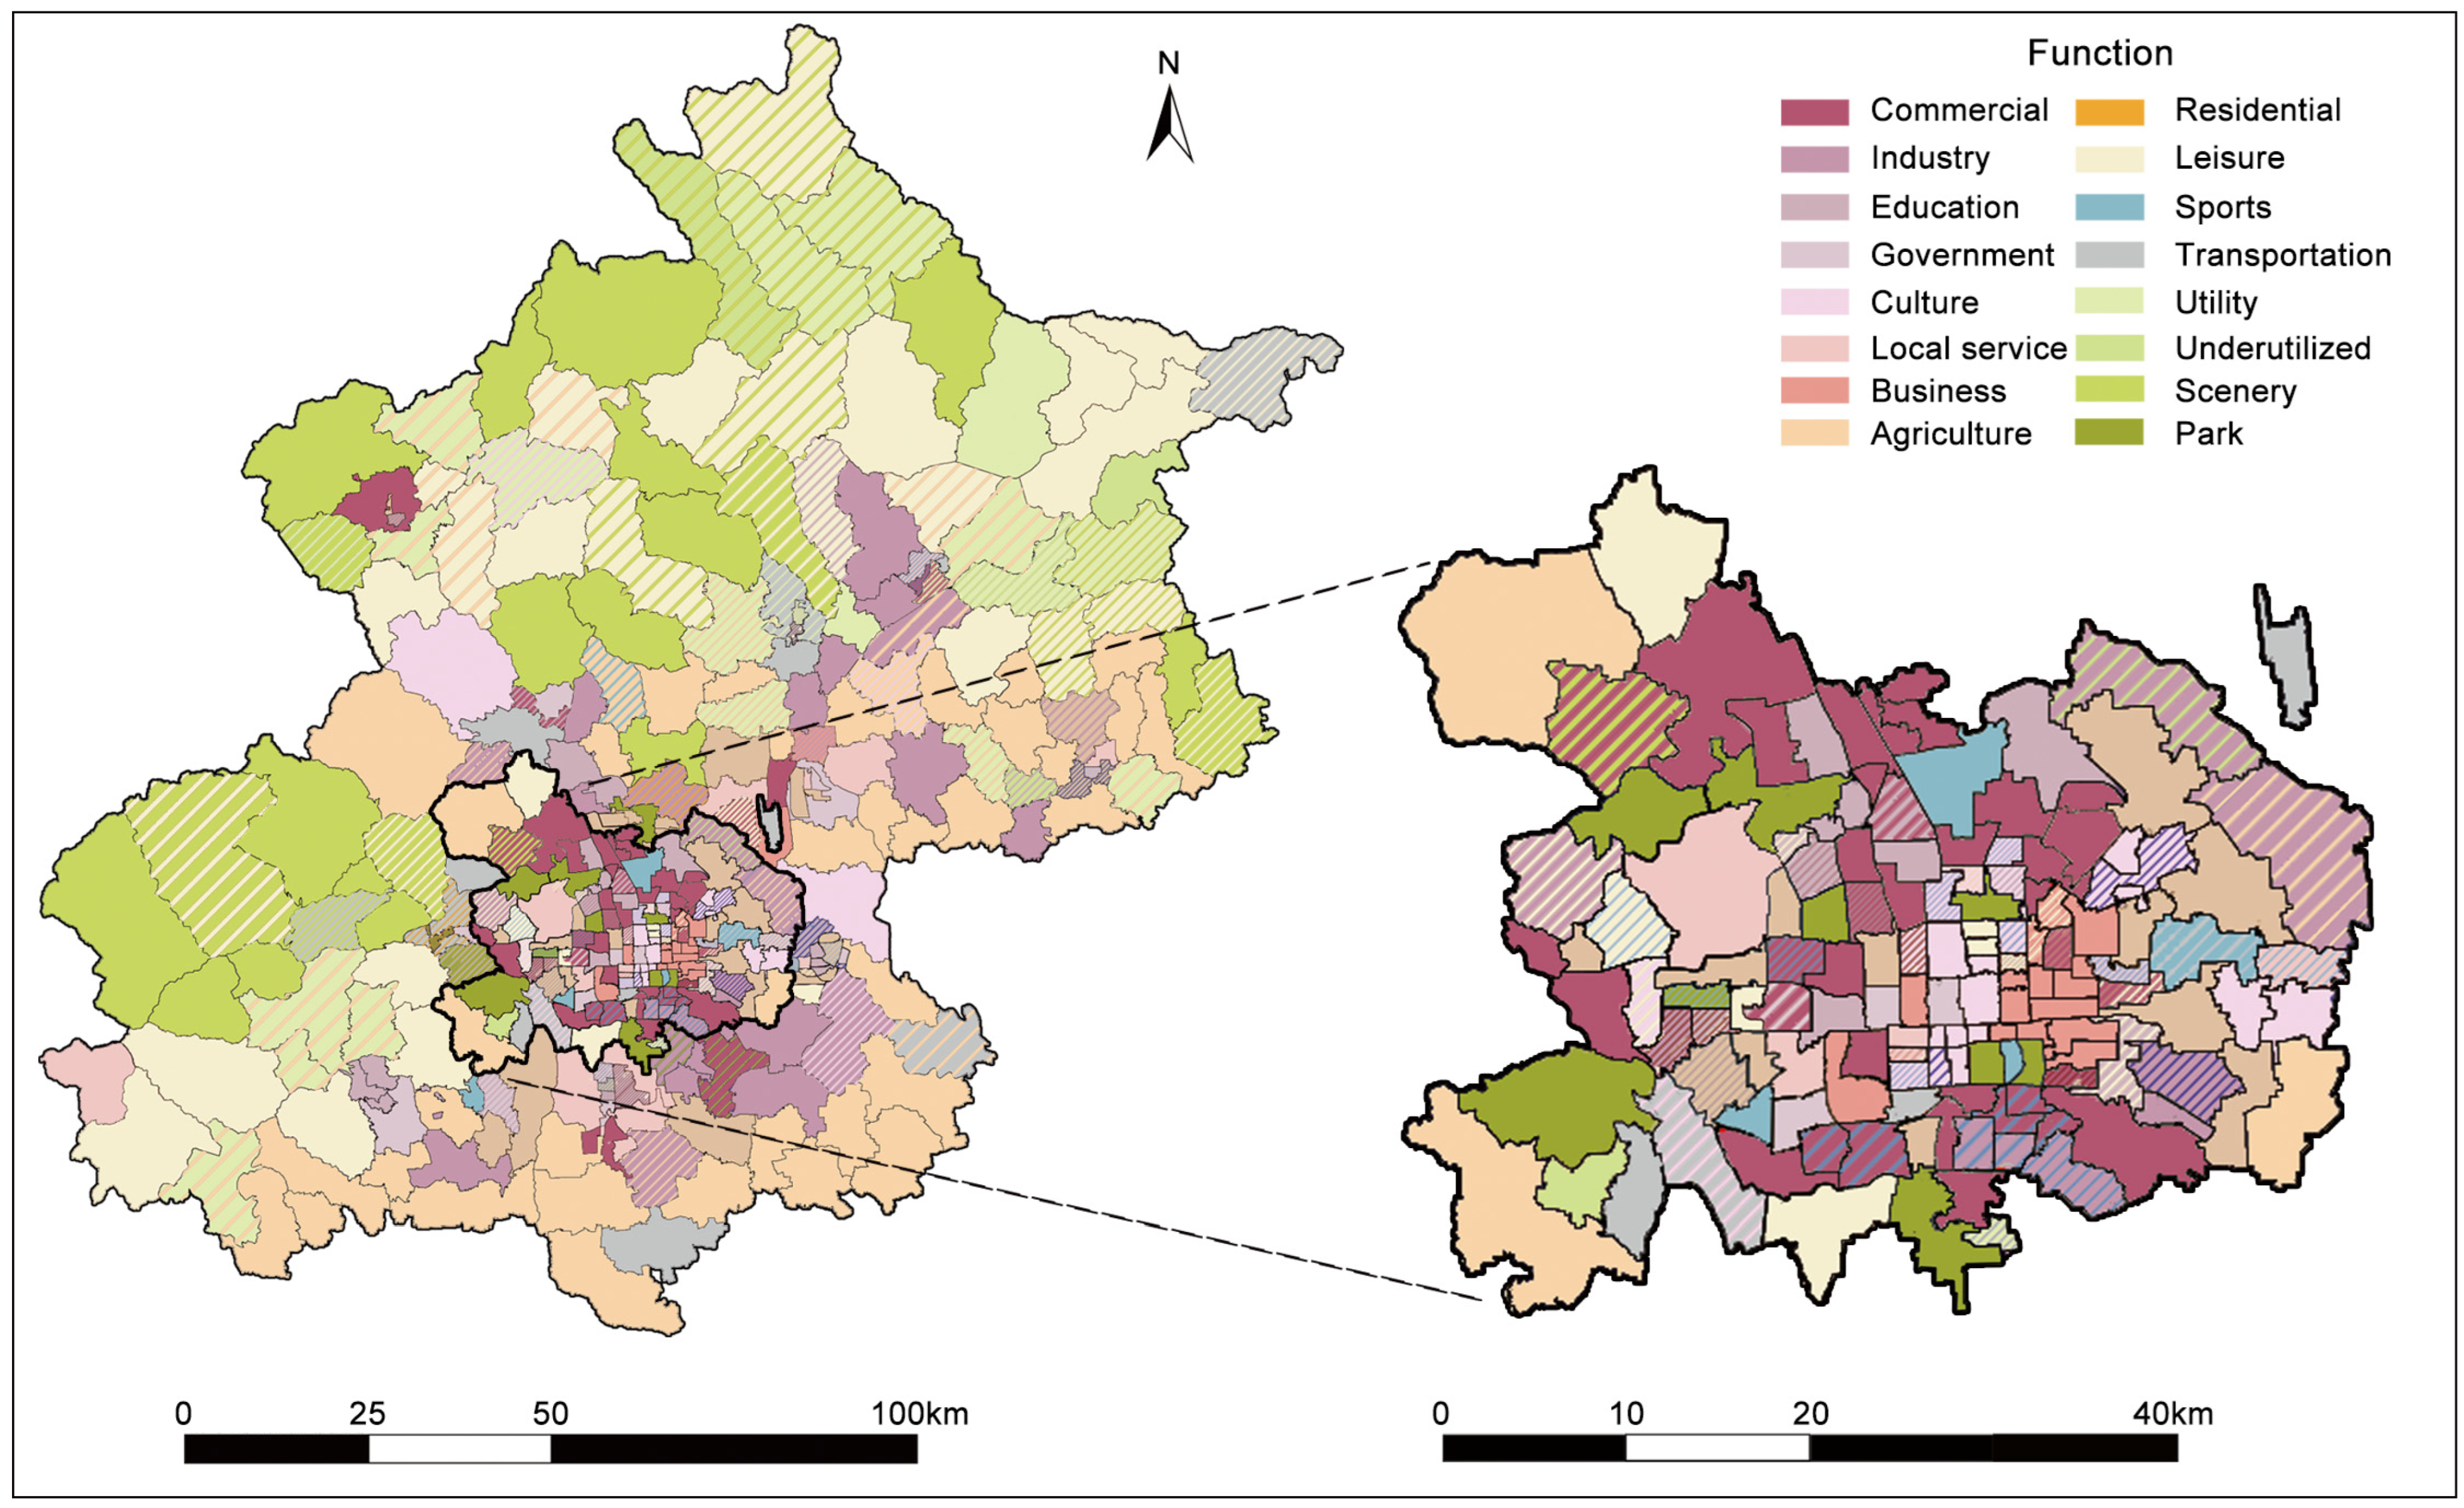
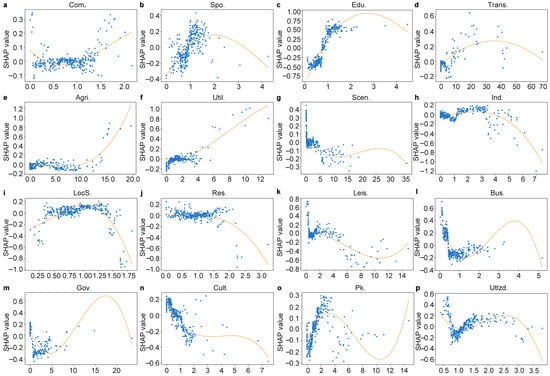
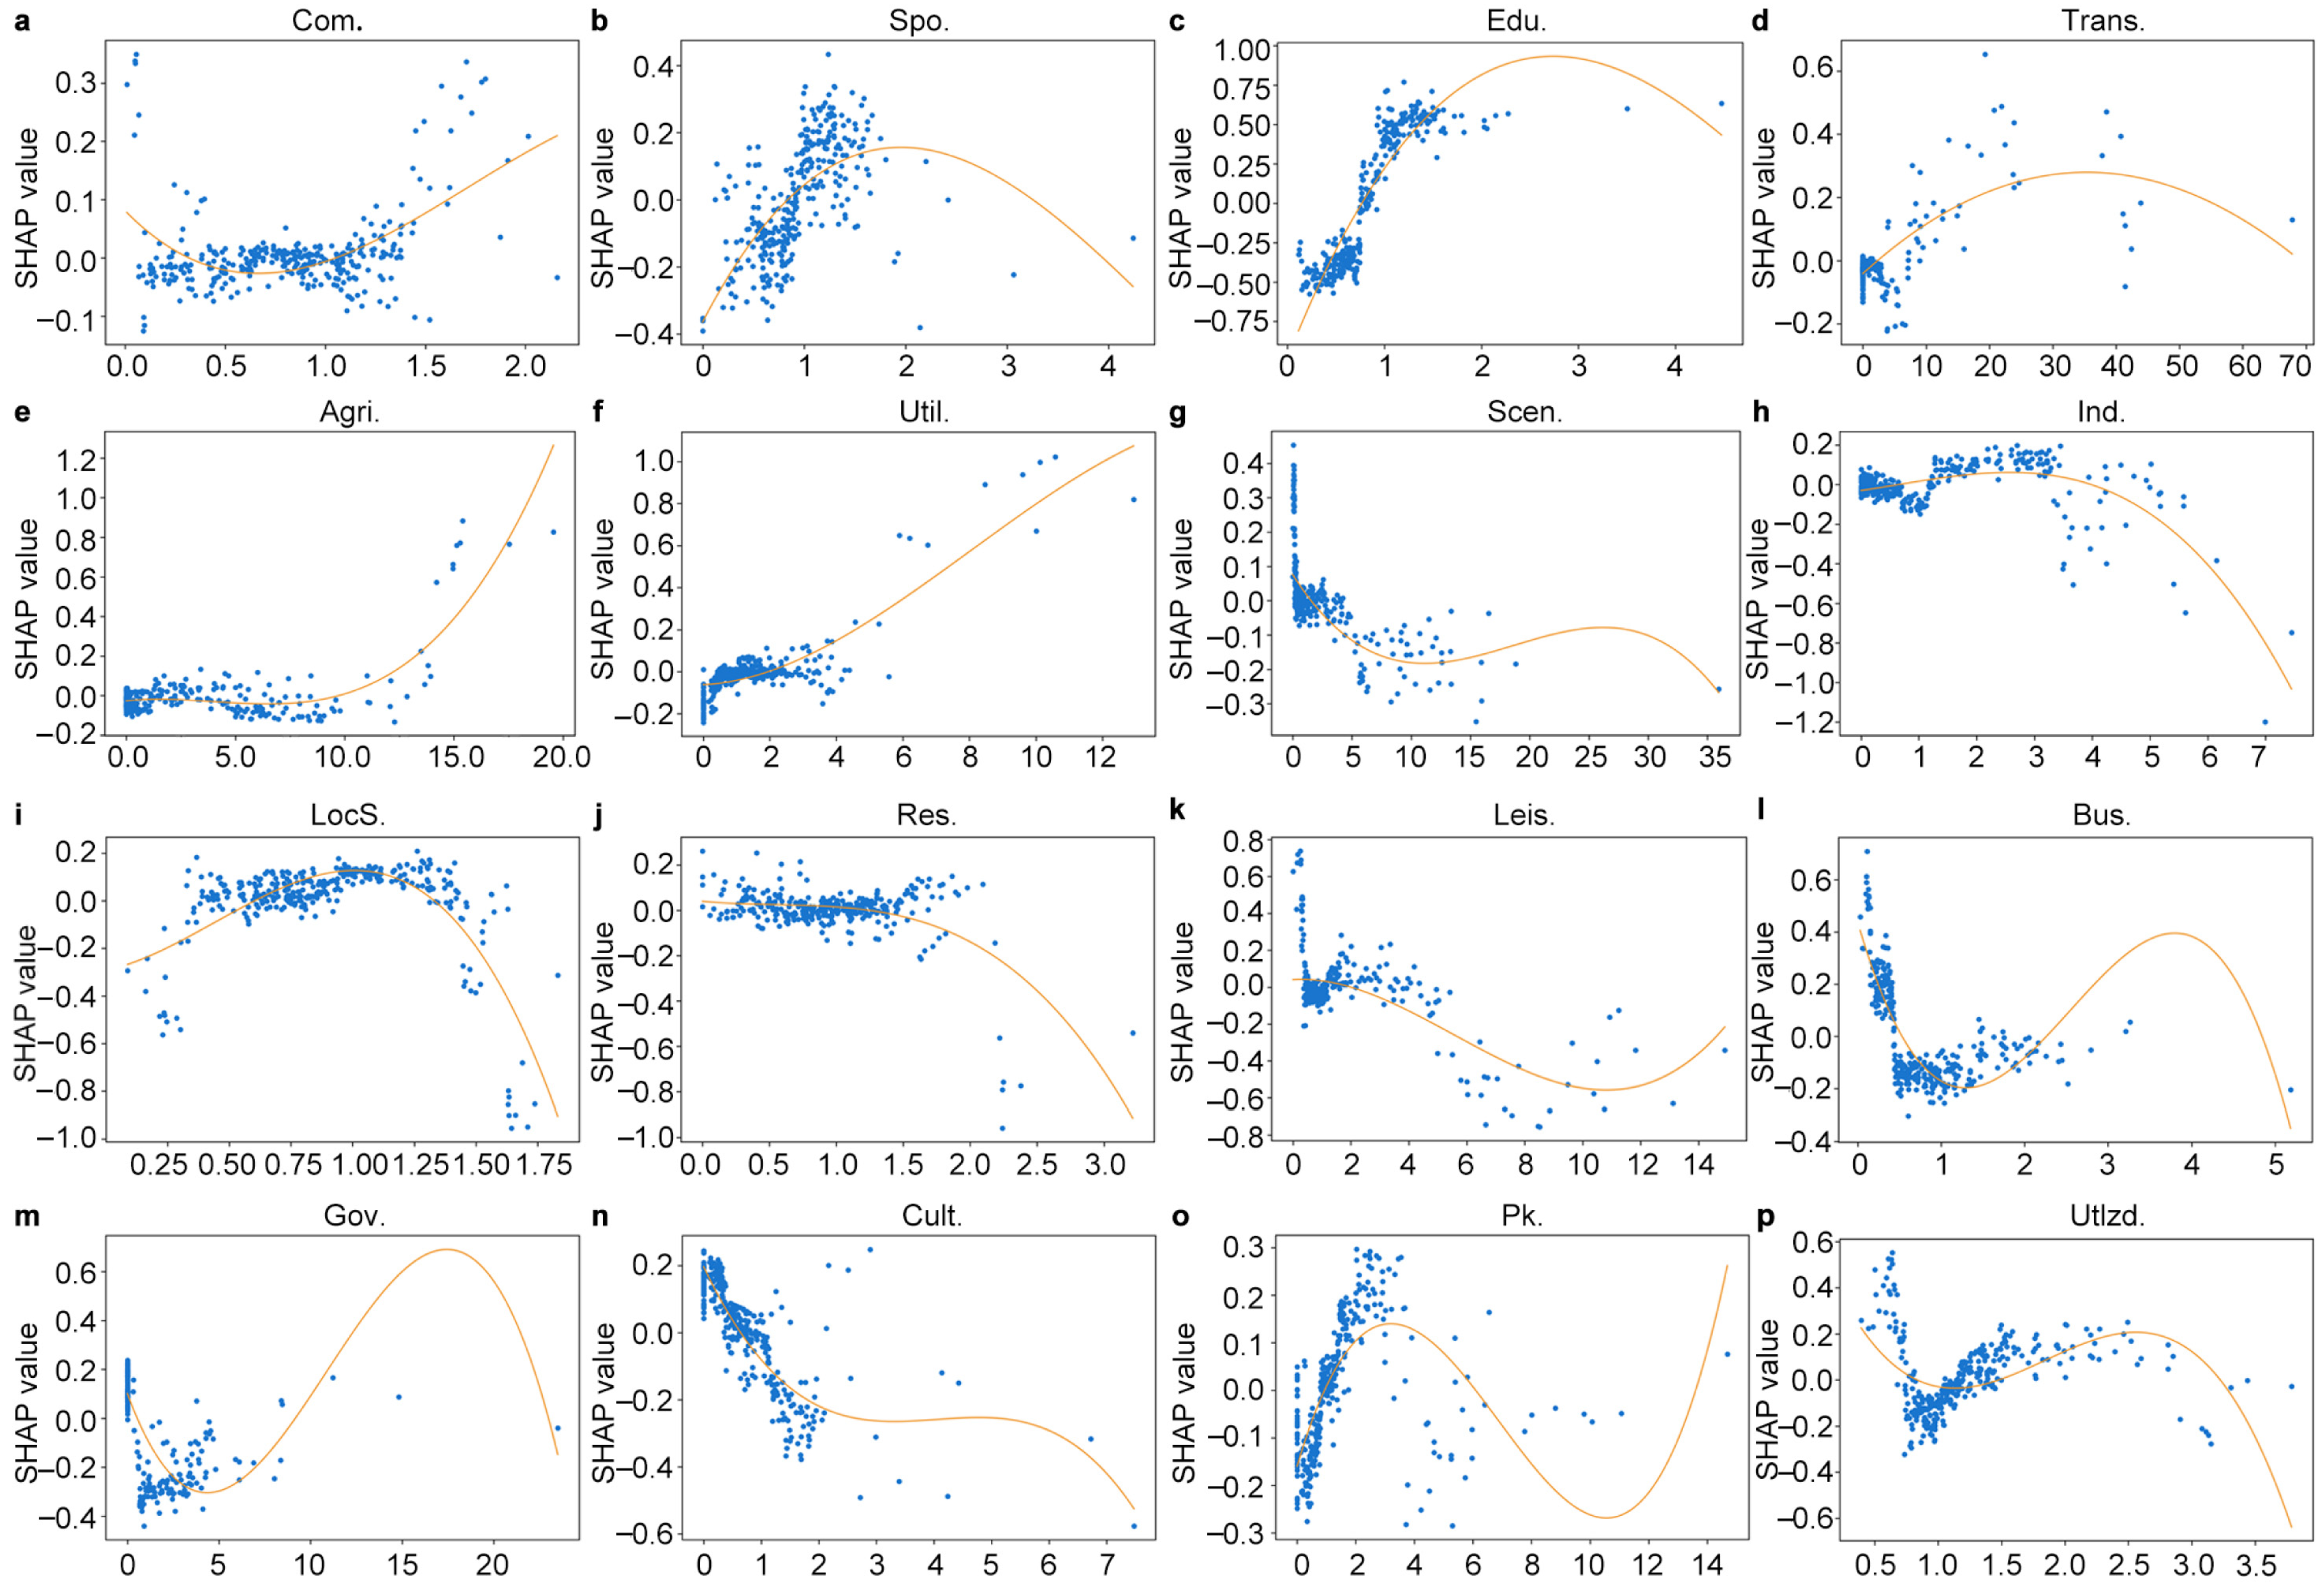
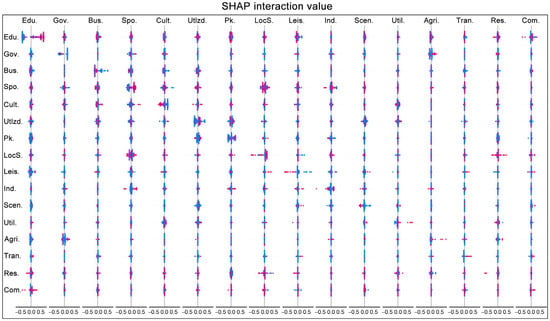
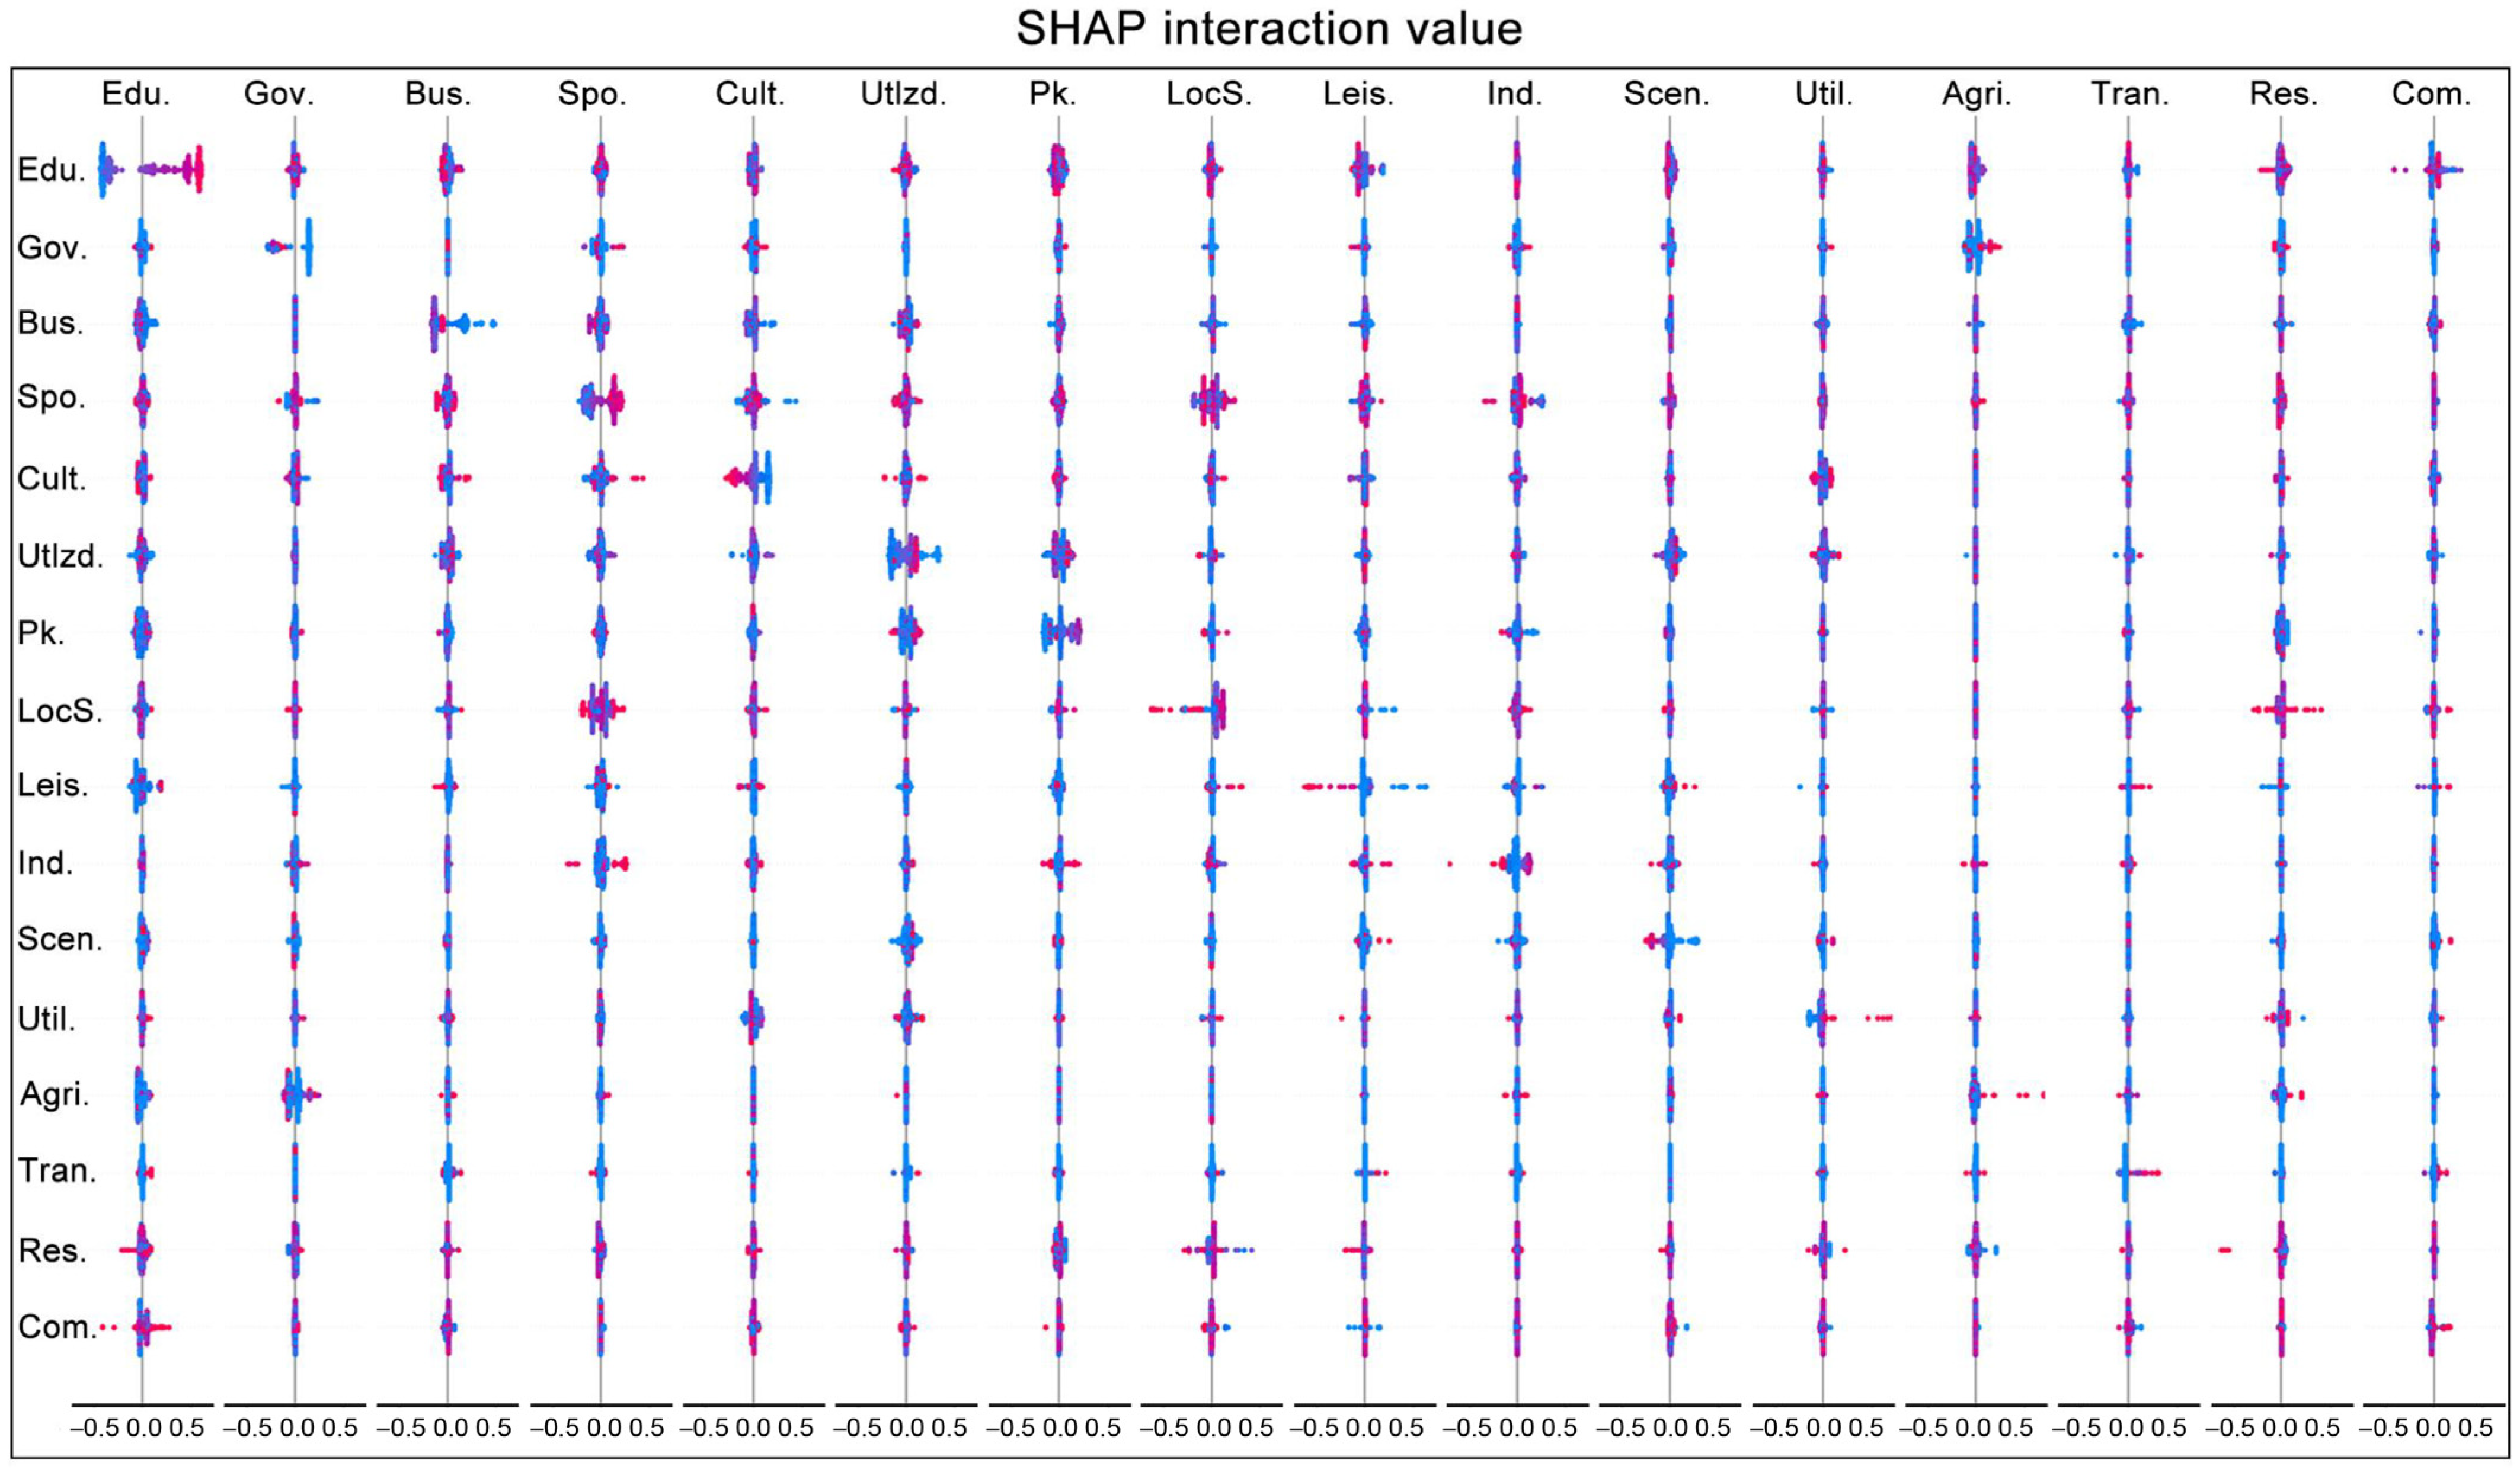
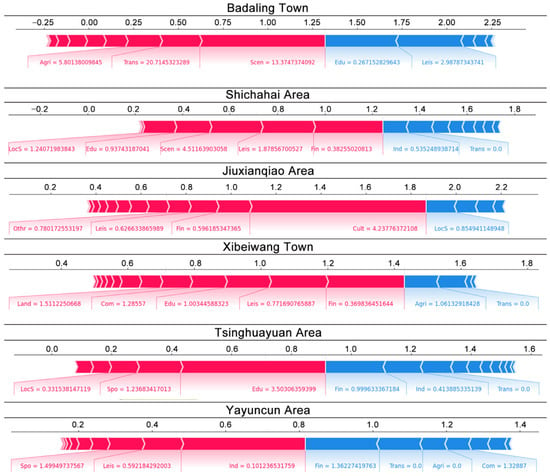
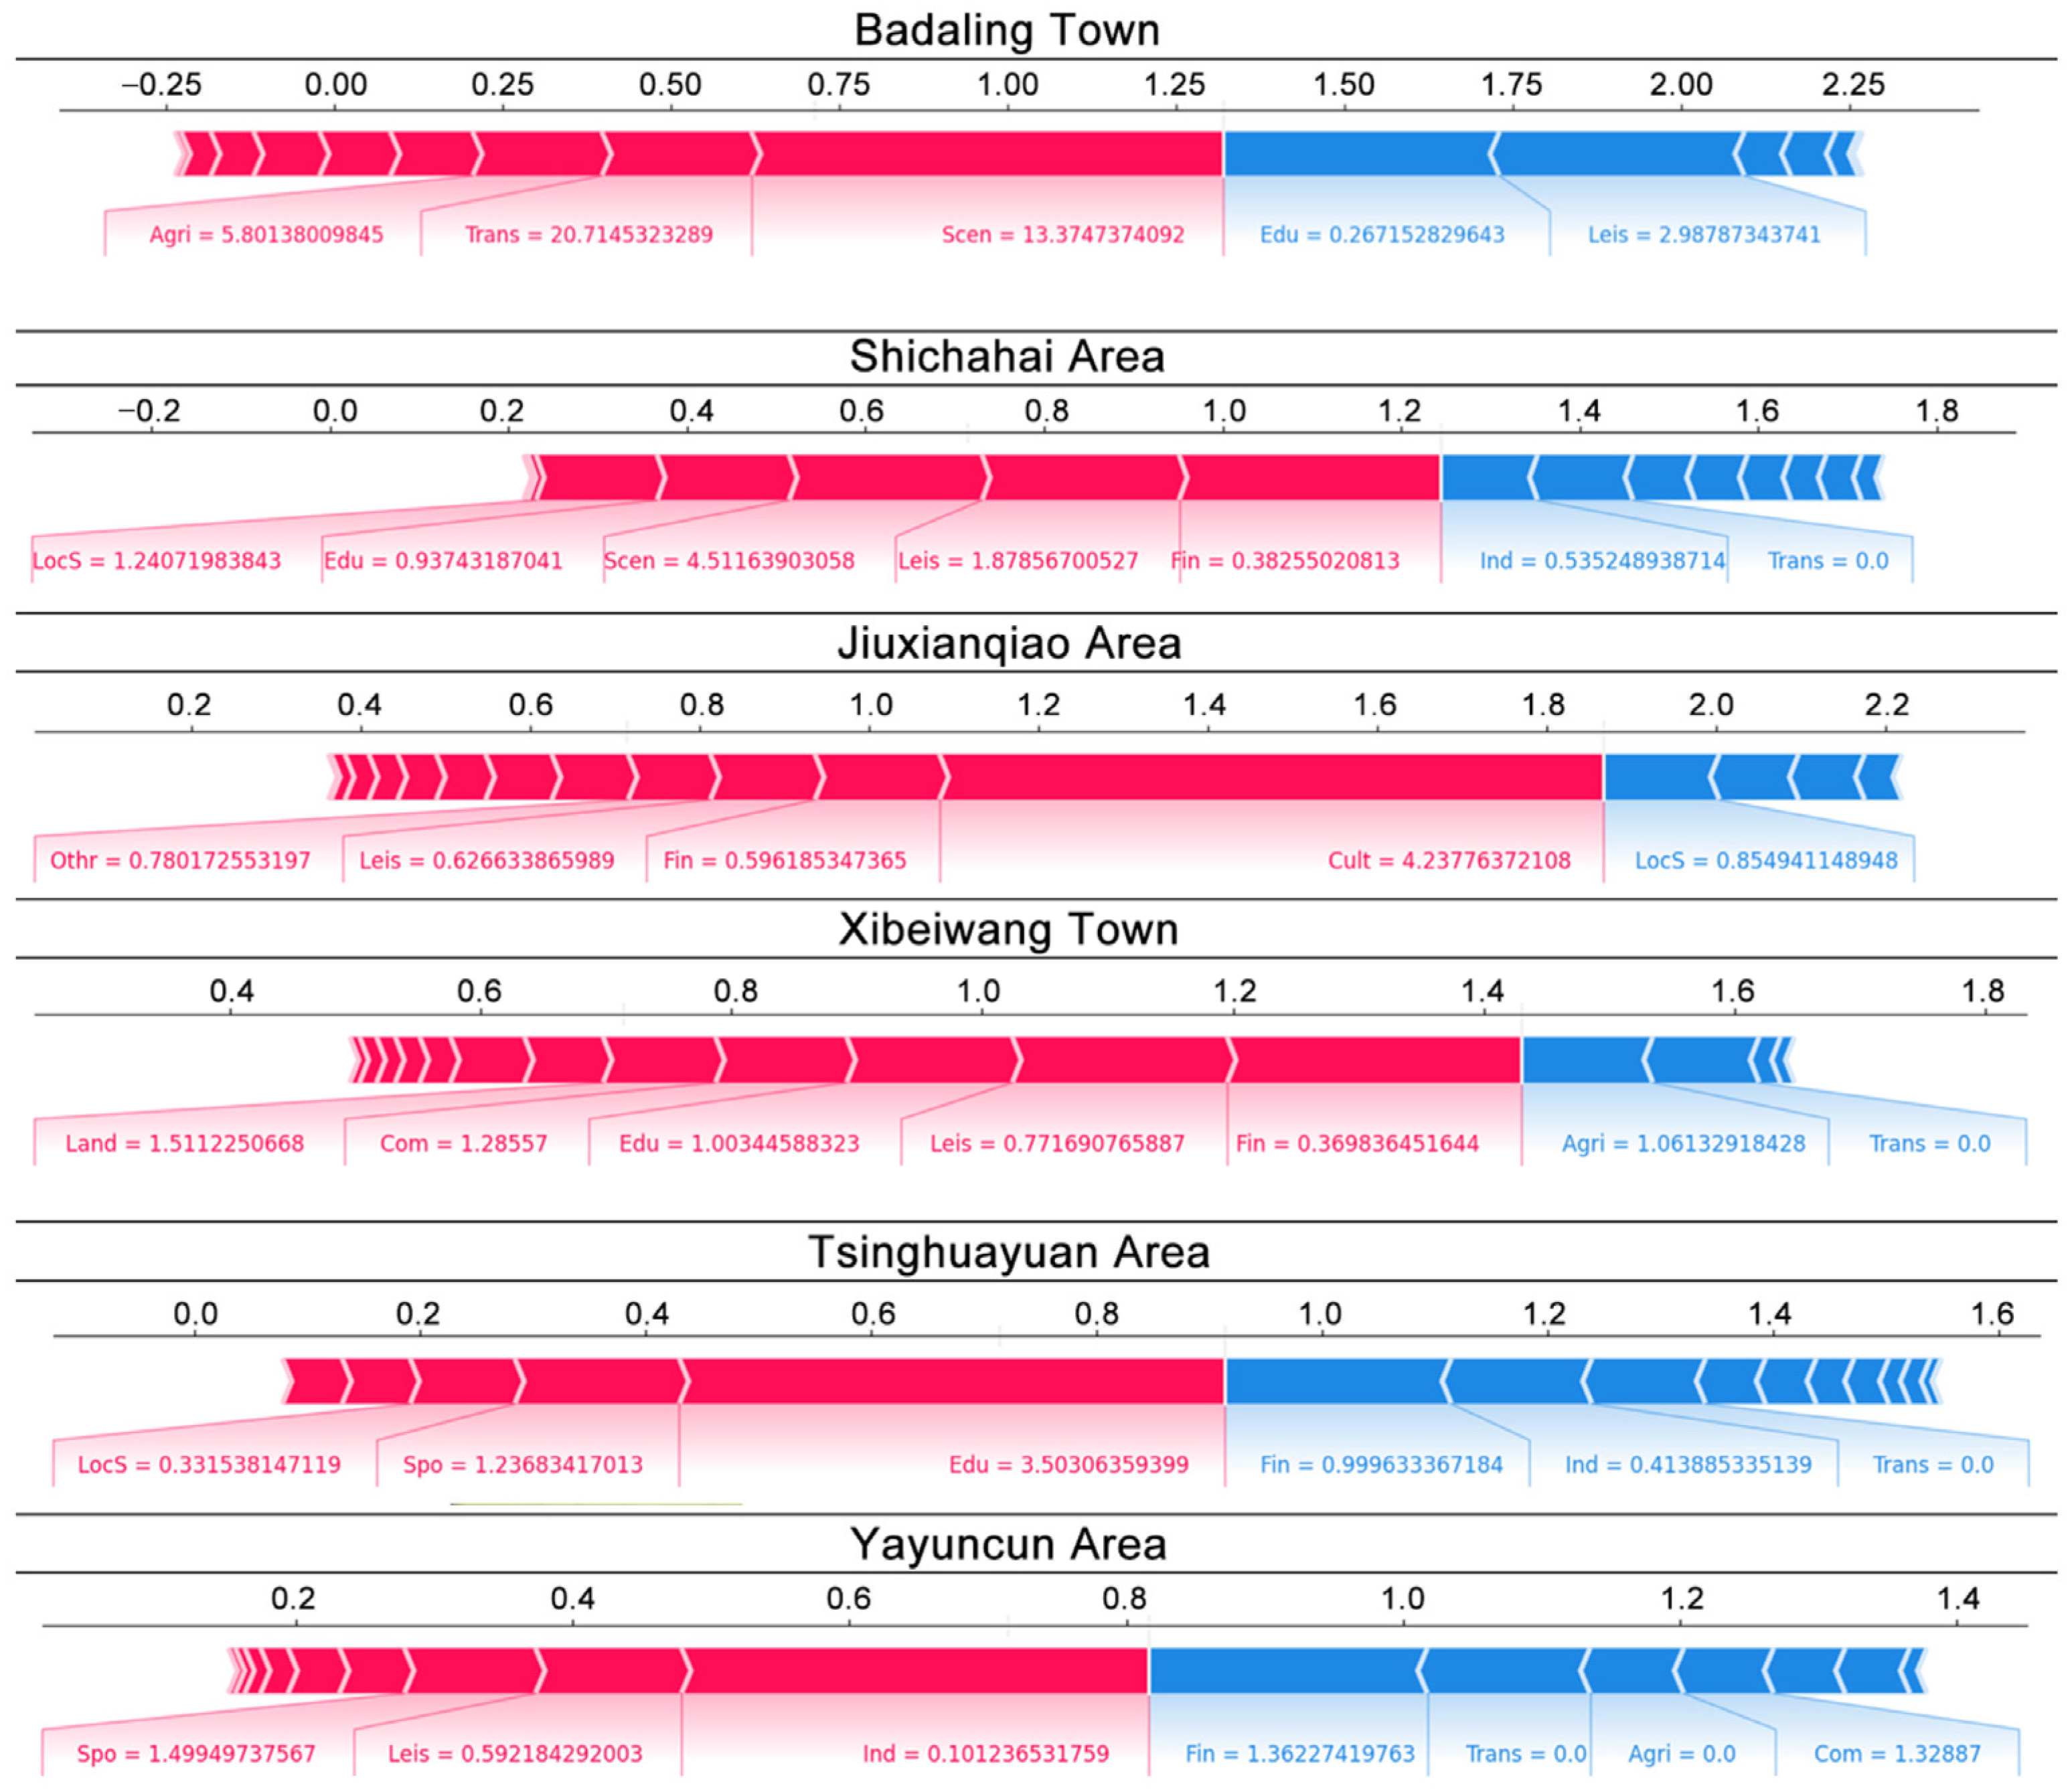

Disclaimer/Publisher’s Note: The statements, opinions and data contained in all publications are solely those of the individual author(s) and contributor(s) and not of MDPI and/or the editor(s). MDPI and/or the editor(s) disclaim responsibility for any injury to people or property resulting from any ideas, methods, instructions or products referred to in the content. |
© 2026 by the authors. Licensee MDPI, Basel, Switzerland. This article is an open access article distributed under the terms and conditions of the Creative Commons Attribution (CC BY) license.