


Abstract
This study examines the structural performance of enhanced panel zone (PZ) configurations for flanged cruciform columns (FCCs) utilizing advanced finite element analysis in ABAQUS (v2022). A new bent panel zone (BPZ) connection—incorporating curved steel plates—is introduced and assessed in comparison to the previously established corrugated panel zone (CPZ) and a traditional web plate-only connection (WPZ). The BPZ consists of the column web plate and two additional load transfer paths formed by the column flanges and the bent plates connected to the edges of the flanges. Accordingly, three distinct shear force transfer mechanisms are established within the PZ. WPZ, although traditionally used in I-shaped columns and still permitted for cruciform columns, suffers from limited shear resistance due to the lack of participation of the orthogonal flanges and the occurrence of stress concentrations caused by excessive welding in this region. CPZ, while engaging the orthogonal flanges, also exhibits deficiencies because of the short straight load path and sharp corners at the junction with the column flanges, which lead to stress concentrations and an unfavorable distribution of shear forces. These shortcomings adversely influence the cyclic behavior and the shear capacity of the PZ. All three models underwent monotonic and cyclic loading, and their performance was evaluated based on key criteria: shear capacity, ductility ratio, energy dissipation, initial stiffness, and the ratio of post-yield to initial stiffness. The findings indicate that the BPZ connection significantly surpasses both CPZ and WPZ in all parameters, providing enhanced energy absorption, increased strength, and superior stiffness characteristics. Additionally, within the BPZ configuration, two geometric paths—bent path (BP) and accordion path (AP)—were analyzed separately, with the BP demonstrating better performance across all assessed metrics. Evaluations of stress contours based on von Mises and Tresca criteria, along with plastic strain distributions, validated the more advantageous stress pattern and reduced concentration levels in the BPZ model. The results indicated that at a 6% story drift, the shear capacity and energy dissipation of the BPZ were 12% and 20% higher than those of the CPZ, respectively. Its initial elastic stiffness was also 5% greater than that of the CPZ. In comparison with the WPZ, the BPZ exhibited substantially superior performance, with shear capacity and energy dissipation equal to 4.3 and 4.28 times those of the WPZ, respectively. These findings demonstrate the enhanced effectiveness of the BPZ as a PZ for cruciform sections.
1. Introduction
The Steel Moment Resisting Frame (MRF) System is one of the most widely used lateral load-resisting systems in steel structures. In the design of these systems, ensuring adequate ductility and strength is essential. In addition to providing the required stiffness and strength in steel structures, MRFs occupy minimal space and cause little interference with the usable area of the building. However, following two relatively strong earthquakes—Northridge in 1994 in the United States and Kobe in 1995 in Japan—many connections in steel frames experienced failures, and they could not provide the required ductility. As a result, in 1996, the Federal Emergency Management Agency (FEMA) [1] presented its research on moment frame connections, examining the factors that contributed to connection failures. Subsequently, Nakashima et al., followed by Engelhardt et al. [2,3], in 1998, conducted experiments on connections and evaluated their seismic performance. Later, Kim et al. [4] extended these experiments with greater detail, calculating the rotational capacity of moment connections. Their findings indicated that the connections could withstand rotations in the range of 2% to 4% without failure. In this way, extensive research was conducted in the years following these earthquakes to investigate the causes of these failures and develop solutions to solve these problems. In several of these studies, the performance of moment frame connections, particularly after the Northridge earthquake, was investigated, and the failure points of these connections were determined. In some studies, a comparison was made between the seismic performance of connections before and after the Northridge earthquake. Additionally, another group of studies examined structures damaged during the Northridge earthquake, while yet another set focused on the modeling and assessment of structures designed before and after this earthquake. In several of these studies, the performance of moment frame connections, particularly after the Northridge earthquake, was investigated, and the failure points of these connections were determined [5,6,7]. In some studies, a comparison was made between the seismic performance of connections before and after the Northridge earthquake [8,9,10]. Additionally, another group of studies examined structures damaged during the Northridge earthquake [11,12,13], while yet another set focused on the modeling and assessment of structures designed before and after this earthquake [14,15,16].
The methods for analyzing structures, particularly moment frame structures, vary. In different studies, depending on the computational demand and required accuracy, various methods are employed. Finite element methods, performance-based methods, and machine learning-based methods are among the approaches that have been increasingly utilized in recent research [17,18,19].
Flanged cruciform columns (FCCs) are a type of column that has recently gained popularity and is increasingly being used in steel structures. As referenced in the AISC358 [20], these columns are fabricated from rolled or built-up I-shaped sections. In rolled sections, one I-shaped section is split in half, creating two T-shaped sections, which are then joined to another I-shaped section at its center using full welding (Figure 1). As a result, this configuration provides adequate stiffness and strength in both principal directions of the structure. To achieve sufficient structural deformation, it is necessary to ensure adequate shear deformation in the panel zone (PZ) [21,22,23]. This requires the proper implementation of connection details [24]. Due to their open cross-sectional shape, FCCs facilitate the detailing and construction of connections, particularly in the PZ, which significantly contributes to the ductility of the structure. In the past, box-shaped or H-shaped section columns were more commonly used in moment-resisting frames, and they are mentioned in standards [24,25]; however, the closed geometry of these sections poses challenges in detailing and fabrication, particularly in the PZ.
Figure 1.
Flanged cruciform section.
Wang et al. [26] examined the overall buckling behavior of FCCs under axial compressive loading. Their research indicated that these columns experience flexural buckling rather than global torsional buckling. By comparing their results with the GB50017-2017 [27] standard, they found that GB50017 overestimates the buckling strength of cruciform columns. Consequently, the buckling strength curves were revised accordingly. Also, Dai et al. [28] investigated the mechanical behavior of FCCs and analyzed them under axial compressive loading. They concluded that the strength of cruciform columns depends not only on their overall slenderness but also on the ratio of elastic torsional buckling load to flexural buckling load. Furthermore, by comparing their results with the existing relationships in Eurocode 3 [29], they demonstrated the high conservatism of these standards. Based on these results, they proposed a new design approach for cruciform columns. In addition, Kiani et al. [30] investigated the stability of cruciform columns under seismic loading. By analyzing various flange and web slenderness ratios, they refined the existing equation used for previous column sections and proposed a new ratio. Other studies have also been conducted on the buckling behavior of cruciform columns, aiming to refine the existing relationships in design standards [31,32,33,34]. The behavior of FCCs has also been investigated in other studies, in which parameters such as torsional instabilities were considered, and based on these, their strength was determined [35,36,37].
Recently, studies have been conducted on FCCs, in which the capacity and ductility of these sections have been investigated. Tahir et al. [38] have determined the capacity of FCCs according to the British Standard 5950 [39] and have validated the obtained results through experimental tests. In this research, it has been noted that due to the symmetry of these columns, the moment of inertia and stiffness are equal in both directions. Additionally, because of the increased radius of gyration of the cross-shaped section compared to its equivalent I-section, the slenderness of these sections has been reduced, resulting in a higher axial capacity of the column. Saffari et al. [40] have developed a mathematical model to determine the shear capacity of the PZ in FCCs. In this research, the contributions of the flange and web of the FCCs to shear resistance have been separately calculated. Sarfarazi et al. [41] have investigated the effect of axial force on the shear capacity of the PZ in FCCs. In this study, a mathematical model has been proposed to calculate the shear contributions of the flange and web of the FCCs under axial loading. In another study, a comparison has been made between the PZs of cross-shaped, box-shaped, and I-shaped columns, in which the superior performance of the flanged cruciform section has been demonstrated [42]. In addition, Mirghaderi et al. [43], in their 2011 research, investigated the effect of PZ details on the behavior of FCCs. Using nonlinear analysis, they demonstrated that connection details have a significant impact on the column’s behavior. Additionally, they proposed a new load transfer path for shear force transmission.
In the field of PZ and its details in MRF, especially special moment-resisting frames (SMF), several studies have been conducted. Khandelwal and El-Tawil [44] used simulations to investigate the effect of steel moment frame connection details on progressive collapse. They considered the impact of large tensile forces on the behavior of these connections and concluded that the designed connections exhibit ductility under such conditions. Additionally, they found that the details of the web connection between the beam and the column have a significant influence on this ductility. In a prior study, Jahanbakhti et al. [45] conducted full-scale experiments on three moment beams to box-shaped column connections to investigate the effect of removing continuity plates (CPs) and compensating for their absence by increasing the column thickness. The tested connections were of the WUF-W type. The results showed that none of the connections experienced failure, and a relative rotation of 0.06 radians was observed in all specimens. Figure 2 depicts the internal forces and moments within the PZ, including shear forces from beams and columns, bending moments, and applied gravity loads.
Figure 2.
Internal forces of the PZ.
In this figure, and represent the shear forces in the left and right beams, respectively. Similarly, and denote the bending moments of these two beams. Both beams are subjected to gravity loads, and their effects on the PZ must be considered within the distance between the plastic hinge formation and the column face. Moreover, and are the bending moments at the top and bottom of the column, and and are the corresponding shear forces.
Rezaian et al. [46] investigated the effect of removing CPs in box-shaped columns due to the difficulties and high costs associated with their installation. Their study showed that connections without CPs were able to withstand a story drift angle of 0.06 radians before reaching strength degradation. As a result, these connections met the requirements of the AISC 341-10 [47] standard. Furthermore, Tuna and Topkaya [48] analyzed the deformation and energy dissipation of the PZ in I-shaped column connections using numerical methods. They designed the connections based on FEMA 355D [1], AISC 360-10 [49], and Eurocode 3 [50] and compared the performance of these standards. The results showed that AISC 360-10 and Eurocode 3 allow for significant yielding in the PZ, whereas connections designed according to FEMA 355D experience less deformation. Finally, they developed an equation to estimate the deformation of this region. Sazmand and Aghakouchak [51] proposed an analytical model for the PZ in SMRF with built-up columns. The model considers a central CP as the primary panel and side panels as secondary elements, incorporating both shear and flexural deformations. It extends previous models with modifications to improve accuracy for non-coplanar beam and column webs. Additionally, several studies have been conducted on the PZ in SMRF following the Northridge earthquake, focusing on axial load effect and strength capacity [52,53,54]. Furthermore, some other studies have investigated the performance of PZs under various conditions using experimental methods [55,56,57]. In other research, numerical analyses and the details of this region were investigated to evaluate and ensure its ductility [58,59,60,61]. Moreover, in other structural systems, members exhibiting shear-dominated behavior play a critical role in overall structural performance; shear links in braced frame systems represent one such example [62,63].
Design standards require the use of doubler plates to ensure ductility in the PZ. Although moment frame connections have good ductility, the thin web in the PZ makes these plates necessary [20,24,25]. It should be noted that the design equations provided in current standards and design codes may not accurately predict the behavior of high-strength and stainless steels. Consequently, several studies have been conducted to investigate the structural behavior of these steel grades and to evaluate the applicability and limitations of existing design provisions when applied to such materials [64,65]. It is noteworthy that these design codes provide guidelines and equations for the PZ design of box and I-shaped columns. However, they do not specify dedicated equations for cruciform columns and instead allow the use of existing relationships. If the doubler plates of FCCs are installed in accordance with the connection execution guidelines specified for I-shaped columns in design codes, they will be segmented. This segmentation creates regions with the possibility of stress concentration, as it disrupts the load transfer path and requires multiple welding points. The extensive welding increases the risk of stress concentration and raises the potential for weld-induced failure in the connection (Figure 3). With the increasing use of FCCs, further investigation and optimization of their details are necessary. One critical aspect in this regard is the PZ of these columns. In I-shaped and box columns, doubler plates are installed as a single piece and attached to the PZ web using welds. However, due to the geometry of FCCs, these plates must be cut into segments and require additional welding. This excessive welding not only increases fabrication complexity and the likelihood of human error but also leads to stress concentration [66,67]. And this causes localized failures in the PZ. Since this area is crucial for ensuring ductility, any damage to it can result in structural failure and progressive collapse [68,69,70]. Furthermore, recent studies have contributed to a broader understanding of the seismic and nonlinear responses of structural systems, as well as numerical modeling approaches related to energy-based analyses. These investigations emphasize the importance of nonlinear modeling and energy-based assessment methods, both of which can be effectively evaluated through cyclic analyses that capture the hysteretic response and energy dissipation characteristics of structural systems [71,72].
Figure 3.
Different types of doubler plates in FCCs. (a) Extending one plate to the back of another. (b) Trimming both plates at the intersection.
Nasrabadi et al. [73] addressed the mentioned challenges by introducing a new arrangement for the PZ called the corrugated panel zone (CPZ) and presenting a new load transfer path. In another study, the shear capacity of the FCC PZ was determined using various analytical approaches. Comparison of these capacities with the numerical results indicated that the method based on the maximum shear stress criterion provided higher accuracy [74].
The geometry of the CPZ resolved the issue of doubler plates welded to the column web; however, due to the presence of sharp edges, it increased the likelihood of stress concentrations and the improper transfer of forces to the orthogonal column in cruciform sections. Also, while the shear capacity of the PZ was obtained for the proposed model, the ductility, cyclic behavior, and energy dissipation of the PZ were not investigated. Furthermore, due to the placement of inclined plates along the perimeter of the cruciform section, it is not necessary to implement them in a straight and short configuration. Instead, these plates can be designed with greater length and varied geometries, leading to further enhancement of the shear capacity of the PZ.
In the present study, the model of this connection is first analyzed under both monotonic and cyclic loading conditions, and the capacity and energy dissipation of the model are calculated. Then, a new PZ configuration is proposed, and after analyzing and calculating its capacity and energy dissipation, it is compared with previous models.
The PZ proposed in this study, referred to as the bent panel zone (BPZ), consists of bent plates connected to the column flanges. These plates, together with the column flange plate, create two new load transfer paths referred to as bent paths (BP). These two paths, along with the WPZ, transfer the shear force within the PZ. The use of bent plates in the PZ minimizes stress concentration in this region and results in a more stable response of the PZ compared with previously proposed models, including the CPZ. The presence of stress concentration can lead to premature yielding and, consequently, a reduction in both the shear capacity and the energy dissipation of the PZ. This phenomenon may ultimately cause failure within the PZ and, as a result, poor performance of the MRF. In addition, the use of bent plates increases the force-transfer path and, consequently, enhances the shear capacity of the PZ. Since the geometry of the flanged cruciform section permits the use of these plates, their incorporation can improve the behavior of the PZ. In addition to providing greater shear capacity than CPZ and other models used for the PZ of cruciform sections, BPZ also increases the energy dissipation capacity of this region due to the use of curved plates, thereby leading to improved seismic performance of the frame and increased ductility. Because sufficient information regarding the energy dissipation capacity of CPZ is not available, this study investigates not only the cyclic behavior of BPZ but also that of CPZ and WPZ, which are previously proposed PZ models for cruciform sections. Ductility, energy dissipation, and shear capacity are the main parameters evaluated in this study, and the performance of WPZ, CPZ, and BPZ is assessed on the basis of these parameters. Given that the use of BPZ can improve the behavior of the connection panel zone, such improvement can directly enhance the performance of the moment-resisting frame and, consequently, the overall structural system. Accordingly, this research first investigates the cyclic and monotonic behavior of WPZ and CPZ models and evaluates the previously mentioned key parameters. Subsequently, the newly proposed BPZ model is developed, and its performance is compared with the other models to highlight the improvements achieved for FCCs. It is noteworthy that the use of curved or corrugated plates has become increasingly widespread in various mechanical and structural systems, and consequently, researchers have investigated the behavior of these plates and sections [75,76,77]. Also, Tong et al. [78] demonstrated through experimental investigations that the geometric characteristics of particles, including their curvature, play a significant role in the overall behavior of a system and its damage threshold. Their study was conducted on a granular packing system.
2. Derivation of Analytical Expressions for Shear Strength
As previously mentioned, Nasrabadi et al. [73] proposed a novel configuration for the PZ in their study. Instead of using doubler plates, they introduced inclined plates on all four faces of the cruciform column’s PZ. This modification allows both faces of the cruciform column to participate in load transfer under lateral loading, thereby reducing stress concentration caused by welding doubler plates. Figure 4 illustrates details of the PZ proposed by them. The analytical formulations in this section, which investigate the behavior of this type of PZ, are derived from their study.
Figure 4.
PZ model proposed by Nasrabadi et al. [73]: (a) 3D view, (b) plan view, (c) connection details.
In this model, the column subjected to bending about its strong axis is referred to as the strong column, while the other column, which bends about its weak axis, is termed the weak column. The PZ consists of the web plate of the strong column within the PZ, which is called the web PZ (WPZ); inclined plates (IP); and the flanges of the weak column. The combination of the inclined plate and the flange plate of the weak column (Figure 5a) is called the accordion path (AP). The load path consists of the WPZ and the APs. During loading, the forces generated in the beams first enter the WPZ and then transfer through the CPs into the APs. The CPs not only enhance the shear strength of the PZ but also prevent local buckling of the flange of the strong column [79,80]. Additionally, since the weak column bends about its weak axis, the CP provides uniform stiffness to both the strong and weak columns. Additionally, the combination of CPs and APs is referred to as the CPZ. Figure 5b illustrates the stress distribution in the PZ elements, which is generated by the shear force transferred from the beams into this region.
Figure 5.
(a) Load transfer path includes APs and WPZ, (b) stress distribution in PZ elements.
As mentioned before, CPs play a crucial role in force transfer, and their stiffness directly influences the contribution of different PZ components in the load path. In the analytical model proposed by Nasrabadi et al. [73], the stiffness of three regions—WPZ, AP, and CPs—was calculated separately. These components were then combined to determine the shear capacity and stiffness of the PZ. To estimate the stiffness of the PZ components, nonlinear springs were used in the modeling process. The WPZ and AP springs were connected in parallel, while the CPs were modeled as series springs with the AP springs. Finally, by combining the CP springs and AP springs, the stiffness of the CPZ was obtained. Due to the geometry of flanged cruciform sections, shallow columns are not used because two I-shaped sections cannot be welded together, and attachment of CPs is also difficult. As a result, in the analytical model by Nasrabadi et al. [73], bending deformation of the PZ is neglected, and its behavior is represented using a tri-linear shear model. This section briefly reviews the equations proposed by Nasrabadi et al. [73] for their suggested PZ connection.
2.1. Analytical Modeling of the WPZ
A tri-linear behavior model is considered for the WPZ, including an elastic region, an inelastic region, and a strain-hardening region. The stiffness of the inelastic region is about 6–8% of the elastic stiffness, while the strain-hardening stiffness is around 2–3% of the elastic stiffness. The following equations are proposed for calculating the elastic and inelastic stiffness:
In the above equations, represents the elastic stiffness of the WPZ, is the average shear force in the WPZ, denotes the average shear strain in the WPZ, G is the shear modulus, refers to the effective cross-sectional area of the WPZ, is the width of the PZ, represents the thickness of the column web, is the column depth, refers to the column flange thickness, is the plastic stiffens of WPZ and is the PZ depth, calculated as the difference between the beam depth () and the beam flange thickness () so the relationship is (). The equations for calculating the shear strength of the WPZ are as follows:
In these equations, is the yield shear strength of WPZ, represents the shear yield stress, is the yield strength of steel, is the yield shear strain of the WPZ, and is equal to . P denotes the axial force in the column, is the axial yield capacity of the column and is the plastic shear strength of WPZ, which corresponds to the equivalent force at a shear distortion of 4. The stiffness of the strain-hardening region, as mentioned before, is equal to 2% of the elastic stiffness of WPZ. Finally, the WPZ behavior is represented in Figure 6.
Figure 6.
WPZ shear behavior [73].
2.2. Analytical Modeling of the AP and Bent Path (BP)
The AP is considered a trapezoidal corrugated plate, also functioning as a shear diaphragm in the girders. These plates generally have lower stiffness compared to their equivalent flat plates. Using the energy method, the corrugated plate is approximated as an equivalent flat orthotropic plate, and a new shear modulus is proposed for calculating its stiffness:
In this equation, represents the shear modulus of the equivalent flat plate corresponding to the trapezoidal plate. Additionally, c is half of the projected length of the plate, and s is half of its actual length. E denotes the elastic modulus of steel, while is Poisson’s ratio. is the shear stiffness ratio of the corrugated plate to the flat plate, referred to as the shear coefficient. The shear coefficient for the AP can be expressed as follows:
where is the width of the inclined plate, is the angle of the inclined plates with the column flange, and is the width of the PZ, calculated as . The geometric parameters used in the above equations are illustrated in Figure 7.
Figure 7.
AP and BP configuration: (a) AP parameters, (b) BP parameters.
Figure 7b illustrates the details of the PZ with curved inclined plates, referred to in this study as the BPZ. This type of PZ will be investigated in detail in the following sections. BPZ includes two curved inclined plates welded to the flanges of the cruciform column and column flange. These plates form two distinct load transfer paths—referred to as BP—that complete the load transfer path. Together with the previously discussed WPZ, these paths contribute to the shear resistance capacity of the PZ. In Figure 7b, denotes the length of the curved plates and represents their radius. Considering that the curved plates used in this study have an arc angle of 90 degrees, their length is determined based on the distance between the edges of the orthogonal column flanges and this 90-degree arc. The remaining parameters are illustrated accordingly in Figure 7a. To account for the stiffness contribution of these curved plates, in Equation (7), the arc length is used instead of the width of the incline plate ( to change the to coefficient and accurately calculate the shear modulus (). Furthermore, in calculating the stiffness of this load transfer path—which will be explained later—the geometric parameters of the arc are used so that the effect of the curved plates is properly included in the model. For the curved plates, Equations (7) and (8) are modified as follows:
In this equation, for simplification, the curved plate can be approximated as a chord, and the angle θ can be assumed to be 45 degrees. The remaining parameters are determined based on the geometry shown in Figure 7b. Since the inelastic behavior of the PZ (second range of WPZ shear behavior) is already accounted for in the WPZ model, the nonlinear behavior of the AP is considered bilinear. The second range of the bilinear model results from material hardening, with a stiffness of 3% of the elastic stiffness (). Finally, the stiffness and shear yield strength of the AP are calculated as follows:
In these equations, represents the elastic stiffness of the AP, and denotes its yield strength. Additionally, is the shear yield strain, is the effective cross-sectional area of the AP and is its thickness that is equal to the column flanged thickness. The AP behavior is represented in Figure 8.
Figure 8.
AP shear behavior [73].
It should be noted that the relationships presented for BPZ in this section are simplified and are applicable to the case in which 90-degree curved plates are used. Therefore, the application of these relationships to cases involving plates with smaller curvature requires appropriate modification of the equations. Nevertheless, since the use of 90-degree curvature provides the longest load transfer path, this configuration is considered more optimal than plates with smaller curvature.
2.3. Analytical Modeling of the CP
The CPs are confined by the flange and web of the column, as well as the inclined plates, resulting in high flexural stiffness. Since their behavior is assumed to remain elastic in design, it is considered that these plates do not yield. To calculate their shear stiffness based on their geometry, they are modeled as two shear beams in series, as shown in Figure 9. are the stiffness of each of these beams is calculated using the following equations.
Figure 9.
Details of Modeling CPs as shear beams.
Since the shear beams representing the CPs are connected in series, their equivalent stiffness is determined using the following equation:
2.4. Analytical Modeling of the CPZ
As mentioned before, the CPZ consists of CPs and the AP, which are modeled as a series of springs. Therefore, the elastic stiffness of this region is determined using the series spring model (Figure 10). Additionally, given the bilinear behavior of the AP, the second region of its response has a stiffness equal to 3% of its elastic stiffness. It is noteworthy that the behavior of CPs seemed to be elastic. is calculated as follows:
Figure 10.
Simplified behavior of the panel cone using series and parallel springs.
in the above equations is a coefficient calculated as follows:
The elastic stiffness of the CPZ can also be expressed in terms of force–shear distortion as follows:
In the above equations, represents the shear coefficient of the CPZ.
The yield strength of the CPZ is equal to the yield strength of the AP . Since the CPs are assumed to remain elastic. Additionally, the shear strain of CPZ is calculated as follows:
The behavior of the CPZ is depicted in Figure 11.
Figure 11.
CPZ shear behavior [73].
The stress generated in the WPZ and CPZ regions is calculated as follows:
In the above equations, and are the elastic shear stiffnesses of WPZ and CPZ, respectively. Also and are the shear strain of these regions. By comparing these stresses, it is concluded that the yield strain of the CPZ is greater than that of the WPZ.
3. Comparative Analysis of CPZ and WPZ Shear Strength
Due to the delayed yielding of the CPZ compared to the WPZ, to prevent excessive shear deformations, the maximum total shear strain in the PZ is limited to . The PZ behavior is analyzed under the following two conditions.
3.1.
The governing equations for the PZ in this condition are as follows:
In the above equations, represents the shear strength of the PZ at strain , corresponds to the shear strength at strain , and denotes the shear strength at strain . The shear behavior of the PZ when is illustrated in Figure 12.
Figure 12.
PZ model () [73].
3.2.
in this condition remains unchanged from the previous case. Another shear strength under these conditions is as follows:
The shear behavior of the PZ when is illustrated in Figure 13.
Figure 13.
PZ model () [73].
4. Design Parameters
Based on the unbalanced moment on both sides of the PZ, which generates a force couple within the PZ, the shear force in the PZ can be determined as follows:
is the shear force developed in the PZ, and are represents the moments developed at the left and right ends of the beam, respectively, and is difference between them. is the column shear force is depth of the PZ and is a coefficient in which, is column height. Finally, the shear strength of the PZ, without considering strain hardening, is obtained using the following equation in both conditions (Figure 12 and Figure 13).
When ,
When ,
To achieve the design goals, should be less than .
5. Verification of Analytical and Numerical Models
Before presenting the new PZ model and evaluating its strength and energy dissipation using the finite element method, model verification is necessary. Since the modeling is performed using the ABAQUS (v2022) finite element software, the verification process is also conducted within this software. Since this study includes both cyclic and monotonic loading analyses, the verification process must also evaluate both types of analyses. Therefore, two previous research studies conducted by other researchers were selected for verification. Finite element modeling of these studies was performed, and the results were compared with the results in the previous research. To ensure the reliability of the finite element framework adopted in this study, both monotonic and cyclic validations were conducted using previously validated benchmark studies. The monotonic (pushover) validation was performed using Model 1-1 proposed by Nasrabadi et al. [73] for FCC panel zones with inclined plates, while the cyclic validation employed the experimentally tested C2 specimen reported by Ricles et al. [81]. The validation procedure included detailed consideration of geometry, material constitutive behavior, boundary conditions, loading protocol, mesh discretization, and hardening assumptions. In all models, S4 shell elements available in ABAQUS were used for structural discretization. Material nonlinearity was incorporated using true stress–strain relationships and nonlinear hardening models. Boundary conditions and displacement-controlled loading protocols were defined according to the reference studies to ensure consistency with the benchmark responses. In addition, mesh sensitivity analyses were performed to ensure convergence and stability of the numerical results.
5.1. Validation of Nonlinear Static (Pushover) Analysis
In the previous section, the analytical approach proposed by Nasrabadi et al. [73] for predicting the PZ strength in cruciform columns was presented. In this section, for the verification of the cruciform column model and analysis under monotonic loading (pushover analysis), Model 1-1 from this study is used. This model utilizes a W21 × 182 section for the column and a W12 × 106 section for the beam. The two-column sections are fully welded together to form a cruciform section. Therefore, in Abaqus, the Merge function was used to connect the two I-sections, resulting in the final cruciform configuration. The column height is considered to be 4 m, with two I-shaped beams directly connected to the column at its mid-height. The connection between beams and the FCC is modeled using the tie constraint. The beam length is 3.25 m. At the beam-to-column connection, CPs with a thickness equal to 0.038 m are placed. Additionally, according to the details provided in the study by Nasrabadi et al. [73], inclined plates with a thickness of 0.038 m are also modeled to complete the AP. These connections are all connected to the surrounding elements using the tie constraint. The materials used for the modeled elements are steel with an elastic modulus (E) of 200,000 MPa and a Poisson’s ratio () of 0.3. The yield stress (fy) is 250 MPa, and the ultimate stress (fu) is 400 MPa. Additionally, the tangent modulus (Esh) is considered to be 0.01 of E. The stress and strain used in the analysis are the true stress and strain, which are calculated using the following equations:
The stress–strain curve of the material is introduced into the software as a tri-linear model, where the slope of the first segment is equal to E, the second segment is Esh, and the third segment is zero. It is noteworthy that, in order to calculate the shear strength of the PZ, the PZ must yield in shear before the beams. Therefore, in this model, the beams are considered to remain elastic. For the hardening behavior of other elements, the combined method is utilized. The bottom of the column is supported by a pinned support, while the two ends of the beam are equipped with roller supports that allow longitudinal displacement of the beams. The top end of the column is free, and displacement is applied at this point. Additionally, to prevent lateral displacement of the beam and column, lateral supports are provided as shown in Figure 14. To create a pinned support at the bottom of the column, it is necessary to constrain the displacement of all points of the bottom section of the column to a single node with a couple constraints in Abaqus.
Figure 14.
Verification 1 FEM model.
The loading is applied as a displacement-controlled load at the top of the column. This displacement is defined to induce a drift of 0.06 radians in the story. To apply the displacement, a couple of constraints are used at the top section of the column. Furthermore, a general static analysis was employed for the model. The model is meshed using S4 elements, which are four-node shell membrane elements. A mesh sensitivity analysis was performed to verify the accuracy and stability of the finite element results. The mesh was progressively refined, and the natural frequencies were monitored until further refinement caused negligible variations. This ensured that the selected mesh density provided converged and reliable results. Finally, based on their expected behavioral characteristics, a mesh size of 0.04 m was assigned to the beams, 0.03 m to the CP, and 0.035 m to the FCC and its inclined plates located within the PZ. The induced stress in the PZ can be evaluated using the Von Mises and Tresca stress criteria. The results are presented in Figure 15. As observed, the new load path leads to stress distribution in the WPZ and the AP, which contributes to enhancing the strength of the PZ. Additionally, the shear strain distribution is illustrated in Figure 16.
Figure 15.
Stress distribution results of Verification 1 (CPZ model) for the FCC and its PZ at a displacement corresponding to 6% story drift. (a) Based on the von Mises criterion. (b) Based on the Tresca criterion.
Figure 16.
Inelastic shear strain of the PZ in Verification 1 (CPZ model) at a displacement corresponding to 6% story drift.
In addition to the previously reported verification based on natural frequency stabilization, a detailed mesh convergence study was conducted to ensure the accuracy and reliability of the nonlinear finite element results, particularly in regions with high stress gradients such as the panel zone (PZ), curved plates, and weld vicinity. Four mesh densities were considered, ranging from coarse to refined discretization for the PZ components, while maintaining consistent meshing for beams and global frame members. The mesh sizes were progressively reduced until convergence was achieved. The response parameters used for evaluation include the following:
- Shear capacity of the panel zone;
- Initial elastic stiffness;
- Energy dissipation under cyclic loading;
- Maximum von Mises stress concentration in curved plate-to-flange weld regions.
The results indicate that global response quantities (shear capacity and initial stiffness) exhibit convergence with mesh refinement, with variations becoming negligible beyond the adopted mesh size. However, local stress concentrations in the weld-adjacent regions show higher sensitivity to mesh refinement, particularly in the curved plate geometry, where stress gradients are steep. Based on the convergence trends, the mesh sizes adopted in the final model (0.04 m for beams, 0.03 m for CPs, and 0.035 m for FCC and curved plates in the PZ region) provide a satisfactory balance between computational efficiency and numerical accuracy. At this mesh density, variations in shear capacity and initial stiffness remain within an acceptable range (typically less than 5%), while energy dissipation results show stable hysteretic response without numerical oscillations. These findings confirm that the selected mesh density is sufficient to capture both global and local behavior of the connection, including stress redistribution in curved load paths and weld-adjacent regions. To verify the accuracy of the modeling, history output results from Abaqus are utilized to precisely determine the capacity of the PZ and compare it with previous research findings. To calculate the PZ capacity, the Nodal Force (NFORC) outputs are used to determine the shear force in the WPZ and the AP. These outputs are extracted from the top edge of the PZ. As shown in Figure 17, two rows of elements above the PZ are selected for WPZ and AP. By summing the forces in these elements, the capacities of these regions can be obtained. Additionally, to plot the shear force–strain curve, strain output is required. The shear strain values are extracted from the central elements of the PZ using Abaqus strain output (Figure 18).
Figure 17.
(a) AP elements for NFORC output from verification 1. (b) WPZ elements for NFORC output from verification 1.
Figure 18.
(a) AP elements for LE12 output. (b) WPZ elements for LE12 output.
The total shear capacity of the PZ in FCCs is obtained by summing the shear forces generated in the WPZ and the two AP regions. To present these curves in a unified system, the shear strain is normalized with respect to , where it is the yield shear strain of the PZ. As described in the analytical formulations section, is equal to . By comparing the shear capacity obtained from the finite element modeling of the connection in Abaqus with the results from Nasrabadi et al.’s research [73], the accuracy of the model is confirmed (Figure 19). As observed, the AP yields later than the WPZ and has a higher shear capacity. This observation aligns with the analytical relationships presented in the previous section. As illustrated in this figure, the initial stiffness of the current model differs from the validated model by 8%, while the ultimate strength differs by 2%, which is considered acceptable.
Figure 19.
Capacity curves of the verification 1 model.
Furthermore, a comparison of the graphical results (Figure 15a and Figure 16) with prior research findings confirms the accuracy of the stress and strain distributions in the PZ at a 6% story drift. These results indicate the delayed yielding of the AP and highlight its positive effect. Consequently, the developed finite element model for the FCC connection exhibits sufficient accuracy in predicting shear capacity. As previously mentioned, the maximum shear strain of the central strip elements was used to develop the capacity curves. To verify the accuracy of this method, the stress–strain distribution curves for each PZ were plotted (Figure 20). In this figure, the vertical axis represents the shear stress of the top strip elements of the PZ, while the horizontal axis shows the shear strain of the central strip elements. As illustrated, there is no significant discrepancy between the stress values corresponding to the strain in each element, confirming that using the maximum shear strain instead of the average is a valid and reliable approach. For the monotonic validation model, the finite element results were quantitatively compared with the analytical and numerical results reported by Nasrabadi et al. [73]. The comparison demonstrated that the difference in initial stiffness was approximately 8%, while the difference in ultimate shear capacity was approximately 2%. Furthermore, the stress contours, yielding sequence, and shear strain distributions obtained from the present FE model were consistent with those reported in the reference study, confirming the adequacy of the adopted modeling strategy for predicting the shear behavior of FCC panel zones.
Figure 20.
Stress–strain distribution of PZ elements.
5.2. Model Validation Through Hysteretic Behavior Comparison
Due to the lack of sufficient information regarding the cyclic loading analysis of cruciform column connections, validation is conducted using a study that examined the cyclic behavior of the PZ in I-shaped column connections. For validating the model under cyclic loading, which determines energy dissipation, the research conducted by Ricles et al. [81] is utilized. In their study, they constructed several full-scale connections and subjected them to cyclic loading. By comparing these tested connections with those designed according to pre-Northridge earthquake guidelines, they investigated the causes of failure in these connections. Additionally, they proposed solutions to enhance the ductility of the connections. The selected connection from the study by Ricles et al. [81] is specimen C2, which is an interior connection. In this specimen, two beams are directly attached to the column along its strong axis, and the connection is reinforced using a shear tab. The column cross-section for this specimen is W14 × 398, while the beams on both sides of the column have a W36 × 150 section. The lengths of the column and beams are 3.96 m and 4 m, respectively. The CPs and doubler plates have a thickness of 0.025 m and 0.019 m, respectively, and doubler plates with a thickness of 0.019 m are placed on both sides of the column web. Additionally, the shear tab has dimensions of 0.775 × 0.127 m with a thickness of 0.016 m and is welded to the beam web (Figure 21). In the finite element modeling using Abaqus, all connections are simulated using the tie constraint. The materials used for the beams and columns in this specimen are A572 Gr50 steel. The yield stress and ultimate stress of the beams, columns, and other connection components were determined through a coupon test. These values are provided in Table 1. Additionally, for modeling, true stress and strain were used according to Equations (34) and (35). The boundary conditions are similar to the previous model and have been shown in Figure 21. This model is applied in the same way as in the previous model.
Figure 21.
Verification 2 FEM model.
Table 1.
Material properties of the model [66].
The loading is applied cyclically following the AISC loading protocol [24], up to a drift of 0.1 radians at the top of the column. Additionally, the model uses the same S4 mesh as the previous model, and the structural analysis is conducted using the quasi-static analysis method in Abaqus. For the analysis, two hardening methods are used: one is the combined hardening model, and the other is the kinematic hardening model. As mentioned in the previous section, the connection has been analyzed twice: once using combined hardening, which includes both kinematic and isotropic hardening, and once using only kinematic hardening. For the output, the column’s support reaction (base shear) in the displacement direction is used, which is plotted against the displacement of the column’s top end. The results of these two analyses have been compared with the experimental results for the C2 specimen. Figure 22 presents these comparisons for the combined and kinematic hardening cases, respectively.
Figure 22.
Hysteretic curve comparison. (a) Model with kinematic hardening, (b) model with combined hardening [81].
For cyclic validation, the hysteretic response predicted by the FE model was compared with the experimental response of specimen C2 reported by Ricles et al. [81]. The comparison showed that the proposed numerical model successfully reproduced the stiffness degradation, hysteretic shape, and peak strength observed experimentally. The difference in cyclic stiffness between the FE and experimental results remained below 10%, while the maximum resistance differed by approximately 4%. These results demonstrate that the adopted numerical framework is capable of accurately capturing the nonlinear cyclic behavior and energy dissipation characteristics of steel moment connections. As is evident, both models exhibit sufficient accuracy and effectively capture the cyclic behavior of the connection. The model with kinematic hardening demonstrates better cyclic behavior compared to the combined hardening model, as the force-displacement curve’s slope, representing the connection stiffness, is closer to the experimental results. The difference in the slopes of the cyclic diagrams between the two models is less than 10%. On the other hand, the combined hardening model provides a more accurate prediction of the connection’s capacity. The maximum force developed in the current model differs from that of the experimentally tested model by previous researchers by 4%, which is considered an acceptable value. With the appropriate accuracy of the outputs, the software and model are reliable for cyclic loading analysis to calculate the energy dissipation of the connection. It should be emphasized that the proposed BPZ model was developed using the same finite element framework validated in Section 5.1 and Section 5.2. The modeling assumptions, including shell element formulation (S4), material constitutive relationships, hardening model, mesh discretization strategy, loading procedure, and boundary conditions, remain unchanged. The only modification introduced in the BPZ model is the replacement of straight inclined plates with curved plates to alter the load transfer path and reduce stress concentration. Therefore, the reliability of the numerical framework established through comparison with the validated CPZ model and the experimentally verified cyclic specimen remains applicable to the BPZ model. In addition, stress contours and plastic strain distributions of the BPZ exhibited physically consistent force-transfer patterns, further supporting the adequacy of the FE model in representing the structural behavior of the proposed connection.
6. Development of the Novel FCC PZ Configuration
In the verification of pushover analysis section, the numerical investigation of the FCC PZ using inclined plates was conducted. One of the potential damages that may occur in this type of connection is stress concentration due to sharp corners in the connection zone of inclined plates to the column, which can lead to weld failure or the separation of the inclined plates from the load transfer path. When such failure occurs, the load transfer path changes, and the force previously carried by the AP must now be entirely carried by the WPZ. Since the WPZ has a relatively small thickness due to the absence of doubler plates, it may experience yielding, failure, or local buckling when subjected to the full force. Consequently, the proper load transfer from the beam to the column is disrupted. For these reasons, ensuring the proper performance of this load transfer path is crucial. As shown in Figure 15, significant stress values are observed at the connection points of the inclined plates to the column flange. Using curved plates instead of straight plates for the inclined plates is a practical solution to significantly reduce the likelihood of stress concentration. The curvature of these plates increases the load path length, enhancing energy dissipation in this region and potentially influencing the ultimate capacity of the PZ. Given these advantages, curved plates are adopted for the PZ. These plates are connected to the cruciform column flanges in both orthogonal directions using full-penetration welds, which are executed by creating a groove on the plate surface. Curved plates can be fabricated with various curvature radii. In this study, a 90-degree arc, representing a quarter of a circle, is used due to its simpler fabrication and implementation. Furthermore, when the bends of the flanges become sharper (smaller radius), the load changes direction more abruptly, leading to a more severe stress concentration at the bend tip and causing the load required to initiate the yielding zone to decrease. Figure 23 illustrates the PZ of a flanged cruciform column utilizing curved plates with a 90-degree arc. In this paper, this PZ is called the BPZ, while the PZ analyzed in the study by Nasrabadi et al. [73], which utilized straight, inclined plates, is called the CPZ. Based on this definition, it can be concluded that the new PZ transfers loads through three distinct paths: WPZ (similar to the previous case) and two BPs comprising curved plates and the column flange. The effect of CPs is considered in BPs. In contrast, the load transfer mechanism in the study by Nasrabadi et al. [73] consisted of WPZ and two CPZs.
Figure 23.
Curved PZ model: (a) 3D view, (b) plan view, (c) connection details.
To model this PZ, the same specifications used in the validation of Model 1-1 from the research by Nasrabadi et al. [73] are applied to ensure an accurate comparison between these PZs. The detailed specifications of this connection are described in the following sections. It is noteworthy stress distribution in this PZ model is similar to CPZ, and it has been shown in Figure 5b.
6.1. Connection Configuration and Parameterization
The beam and column sections are W12 × 106 and W21 × 182, respectively. The beam length is 3.25 m, while the column length is 4 m. The column consists of two I-shaped profiles of the specified section, where the I-section along its weak axis is split into two T-shaped sections, which are then merged with another I-section. The merging process in Abaqus was used to connect these components. The beams are attached to both sides of the column PZ at its mid-height using the tie constraint. No stiffening plates were used in this connection, and the connection was made directly.
CPs with a thickness of 0.038 m—equal to the flange thickness of the column and curved plates—were welded and connected to the flange and web of the FCC using the tie constraint. The geometry of these plates is identical to the CPZ CPs examined in the first verification. The inclined plates are modeled using a 90-degree arc with a thickness of 0.038 m and are connected to the column flange. These plates extend 0.15 m above and below the PZ. Figure 24 illustrates the geometry of these plates. Table 2 presents the geometric properties of the BPZ numerical model.
Figure 24.
Curved inclined plates’ details.
Table 2.
Geometric properties of the BPZ model.
The steel used for this connection has an elastic modulus () of 200,000 MPa and a Poisson’s ratio (ν) of 0.3. The yield strength () is 250 MPa, and the ultimate strength () is 400 MPa. The material properties are defined using true stress–strain relationships, which can be calculated using Equations (34) and (35). It is important to note that the beams are modeled elastically to ensure yielding occurs in the PZ, allowing for the determination of its ultimate capacity. The stress–strain curve for the BPZ model, similar to the CPZ model, follows a tri-linear behavior. The third segment of the curve has a zero slope, representing the fully plastic stage. The second segment, which corresponds to the nonlinear (inelastic) region, has a tangential modulus () equal to 0.01 times the elastic modulus (). A combined isotropic–kinematic hardening elastic–plastic material model was employed for the column, PZ, and CPs. Based on the results of Section 5.2, this material model demonstrated satisfactory accuracy in capturing the cyclic behavior of the system. It should also be noted that no damage evolution or failure criterion was incorporated into the finite element model. Accordingly, the PZ was assumed to remain stable throughout the entire loading history without experiencing fracture or failure, and the reported cyclic response was obtained under this assumption. Furthermore, welds were not explicitly modeled in the finite element analyses. All welded connections were assumed to behave as perfectly rigid, and the possibility of weld fracture or failure was not considered. Consequently, the structural response obtained from the simulations reflects the assumption of fully intact welded connections throughout the loading history.
The bottom section of the column is constrained using a pinned support. At the ends of the beams, roller supports are applied to allow movement in the beam’s longitudinal direction. Additionally, lateral supports are placed at specified intervals (as shown in Figure 25) to restrain lateral movement of the column and beams, ensuring that the structure can only move in the beam’s longitudinal direction, which is also the loading direction. The top of the column remains free to allow the application of the displacement. As previously mentioned, two constraints are used to define the boundary conditions at the ends of the beams and the column base, ensuring the proper simulation of pinned supports.
Figure 25.
BPZ FEM model.
For loading, two separate models are used:
- Pushover Analysis:
For pushover analysis, a monotonic displacement is applied to the top of the column, and the connection is subjected to pushover analysis to determine the shear capacity and ductility of the PZ. The final displacement is applied until the story drift reaches 0.06 radians.
- Hysteresis Analysis:
For hysteresis analysis, cyclic loading is applied by imposing cyclic displacement at the top of the column. This analysis follows the AISC loading protocol [24], similar to the second verification model, and continues until the drift reaches 0.06 radians.
For meshing, the connection is modeled using S4 elements, which are four-node shell elements. The mesh sizes were determined based on a mesh sensitivity analysis, which had also been performed for the CPZ model. Accordingly, and consistent with the CPZ model, the beams were meshed with 0.04 m elements, the CP with 0.03 m elements, and the column, along with its bent plates, with 0.035 m elements. Furthermore, to ensure high accuracy at the curvature regions of the bent plates, a maximum deviation factor of 0.03 was adopted.
For pushover analysis, a quasi-static analysis method is used, while for cyclic analysis, a general static analysis is applied.
It is noteworthy that, in pervious studies, the PZ with inclined straight plates (CPZ model) was not subjected to cyclic analysis and was only analyzed under monotonic loading (pushover analysis); it will now be analyzed cyclically using the same methodology applied to the BPZ model (hysteresis analysis). This will allow for a comprehensive study of its cyclic behavior.
6.2. Results and Discussion
In both analyses, the shear force of the PZ is extracted using the Nodal Forces Due to Element Stresses (NFORC) output in Abaqus. Additionally, for strain output, the maximum shear strain in the region is obtained from the Total Strain Component (E12). In the following section, the details of these outputs will be examined, along with graphical results for both models, which correspond to the pushover analysis and hysteresis analysis, respectively. As mentioned before, the pushover analysis under monotonic loading is performed, and the stress distribution in the PZ at a drift of 0.06 radians is shown in Figure 26. The von Mises and Tresca criterion for stress is used to visualize and quantify these stresses. Additionally, Figure 27 presents the shear stress distribution in the PZ at the same drift level. The stresses in both figures are presented in Pa. The shear strain distribution of the PZ at 0.06 radians of drift is also illustrated in Figure 28.
Figure 26.
Stress distribution results of the BPZ model for the FCC and its PZ at a displacement corresponding to 6% story drift. (a) Based on the von Mises criterion. (b) Based on the Tresca criterion.
Figure 27.
Shear stress (S12) distribution of the BPZ model at a displacement corresponding to 6% story drift. (a) The outer face of the PZ consists of the weak column flange and the bent plates. (b) The inner face of the PZ consists of the WPZ and the CPs. (c) Stress distribution shown with greater resolution exclusively in the critical region of the PZ.
Figure 28.
Inelastic shear strain distribution of the BPZ model at a displacement corresponding to 6% story drift.
In Figure 27c, the shear stress in the critical region of the PZ is shown in greater detail. According to this figure, the maximum stress in the BP occurs at the column’s orthogonal plate and the welds of the curved plates to the column flange. Accordingly, the critical region along this load path comprises the welds and the flange of the intersecting column. Although the stress concentration factor (Kt) was not explicitly calculated in this study, it should be noted that classical Kt definitions are based on linear elastic behavior. Since the present analysis involves nonlinear material behavior and stress redistribution after yielding, peak stress comparison and plastic strain distribution provide a more representative measure of stress concentration. In the CPZ model, shear force transfer is concentrated within a limited region near the weld location of the inclined plates to the column (Figure 16). Consequently, the load transfer path is short, and the peak shear stress is high. In contrast, in the BPZ model, the bent plates act as an intermediate load-transferring member, allowing the force to be transmitted over a longer path. The presence of curvature along this path facilitates gradual force transfer and reduces the stress gradient (Figure 28). In the CPZ model, plastic strain is concentrated at the connection region between the inclined plates and the column flange. According to Figure 16, its magnitude is approximately 0.05 rad. In contrast, as shown in Figure 28, no significant stress concentration is observed at the connection between the bent plates and the column flange in the BPZ model. Based on this figure, the plastic strain in the connection region is approximately 0.039 rad, which is lower than that of the CPZ model. Moreover, the maximum strain is not concentrated in this region. Accordingly, the BPZ model exhibits a more stable structural response.
As mentioned before, the shear force in the PZ is calculated using the NFORC output. This output is extracted from the top two rows of elements in the PZ, as shown in Figure 29. The shear force of each element is summed at the nodes forming the upper boundary of the PZ. The same method is applied for both the BPZ and WPZ.
Figure 29.
(a) AP elements for NFORC output from the BPZ model. (b) WPZ elements for NFORC output from BPZ model.
Since the objective is to extract the shear force, the NFORC1 output, which represents the element shear force, is utilized. This output is calculated and reported by Abaqus software at the nodes of each element. As four-node shell elements were employed in the finite element model, four NFORC1 values are reported for each element. The PZ shear force is calculated separately for each load transfer path, and the resultant shear force is subsequently obtained by combining the contributions from all paths. To this end, a strip is defined along the boundary of the PZ for each path, as illustrated in Figure 29. The nodal forces of the elements surrounding these strips are extracted and summed to obtain the resultant force. In this procedure, only the forces associated with the nodes located on the selected strip are considered. Accordingly, each interior node possesses four force components originating from the four adjacent shell elements, which must be combined to determine the resultant nodal force. Furthermore, since the NFORC1 output is reported in the local coordinate system of each element, transformation to the global coordinate system is required before performing the force summation. The shear force is evaluated along the longitudinal direction of the beam. Therefore, no coordinate transformation is required for the WPZ configuration. However, for the BP configurations, the projected components of the nodal forces in the beam longitudinal direction must be determined and used in the shear force calculation. Given that each element on the arc has a unique angle relative to the horizontal axis, for simplification, a 45-degree angle (as a chord approximation) is used for all these elements instead of employing the exact circular equation. Since the arc is 90 degrees, this 45-degree approximation does not introduce a significant difference in the final results. For shear strain extraction, the E12 output is used, as previously stated. According to Figure 28, the maximum shear strain occurs along the midline of WPZ and BPZ. Thus, strain output is taken from this midline (Figure 30), selecting the elements with the maximum shear strain. The strain values for both WPZ and BPZ are extracted.
Figure 30.
(a) AP elements for E12 output from the BPZ model. (b) WPZ elements for E12 output from BPZ model.
It is noteworthy that in the modeling of the PZ, the effects of bending deformations in this region and initial imperfections in the FCC are not considered, and it is assumed that the column is ideal and free from initial imperfections. Furthermore, due to the geometry of the cross-sectional shape, the use of very shallow sections is not feasible, and therefore, by neglecting the effects of bending deformations, a significant error is not introduced compared to reality. In the present study, the following apply:
- A 90° arc geometry was used;
- The radius was selected proportionally to the PZ geometry;
- The arc length meaningfully increases shear transfer path without inducing shallow curvature behavior.
It is obvious that for extreme curvature ratios (very large R relative to PZ depth), bending contribution could become more significant and would require additional parametric investigation.
In this study, conventional laboratory conditions have been considered for modeling, and environmental factors such as welding temperature or humidity have not been specifically examined. In real-world conditions, high temperatures can create significant residual stresses in the welded areas and subject the heat-affected zone to mechanical properties that differ, such as lower strength or toughness. Additionally, variations in temperature and humidity could lead to corrosion or alter the material’s stress–strain curve. It is assumed that the welds in the connections are of a special type based on design codes [24] and will not experience a reduction in strength or failure due to the cyclic process. A thorough examination of these effects is beyond the scope of this paper; however, in future studies, these environmental factors can be considered in laboratory samples for more accurate modeling.
In the following section, these results will be presented alongside the finite element model results of CPZ and the standard PZ of I-shaped columns. A detailed comparison and evaluation of their performance will be conducted.
6.3. Comparison Study of FEM Results
In this section, the results obtained from the finite element analysis of the three models are presented and compared. These three models include the following:
- The BPZ model, which incorporates a curved path (BP) in the load transfer mechanism.
- The CPZ model, which features an AP in the load transfer mechanism.
- The conventional PZ model, which only uses the column web plate to transfer loads.
The graphical outputs showing the stress and strain distribution were presented in previous sections. These outputs were provided for the model with straight inclined plates in the first verification section and for the model with curved inclined plates in the BPZ model section. To calculate other parameters, the specified outputs are used as stated. In this section, the capacity curves of the models are presented, which determine the ultimate capacity (Fu) and ductility (μ) of each connection. Additionally, hysteresis curves from cyclic analysis outputs are provided to evaluate the energy dissipation of each connection. Figure 31 presents the capacity curve of the BPZ model, along with its corresponding bilinear approximation. In this figure, besides the total BPZ capacity curve, which includes two BPs (including two curved plates and one column flange) and one WPZ path, the individual capacity curves of BP and WPZ are also displayed separately. It is important to note that the WPZ capacity curve represents the conventional PZ capacity. Table 3 presents the shear capacity of all three models at the moment when the ratio of the shear strain in the PZ to the yield strain of the WPZ () reaches 10.
Figure 31.
Capacity curves of the BPZ model with their bilinear behavior.
Table 3.
Comparison between PZ types.
The observed stress redistribution in the proposed BPZ may also be interpreted from a geometry-controlled load transfer perspective. Although the present system involves continuum steel plates rather than particulate media, the role of geometry in governing force-transfer mechanisms exhibits conceptual similarities to geometry-induced force-chain evolution reported in granular systems. Previous studies have shown that particle geometry can substantially alter localized deformation patterns and stress transmission pathways through rearrangement of internal force chains. By analogy, the curved geometry adopted in the BPZ appears to facilitate a smoother redistribution of stresses and a more continuous force-transfer mechanism compared with the sharper transitions present in the CPZ configuration. This effect is reflected in the reduced stress concentration near welded regions and the more distributed plastic strain observed in the finite element results. Nevertheless, this comparison should be regarded as a qualitative interpretation intended to provide physical insight into the influence of geometry on stress redistribution rather than a direct mechanical equivalence.
The bilinearization of the capacity curves follows the method outlined in FEMA 356 [82], which is based on two conditions:
- Equal area under the original capacity curve and the bilinear curve.
- The first segment of the bilinear curve intersects the capacity curve at 0.6Vy, where Vy is the yield shear force.
Additionally, Figure 32 compares the bilinear capacity curves of the BPZ and CPZ models. In this figure, besides comparing the total PZ capacity, the capacities of the BP and APs are also compared. The WPZ capacity remains the same in both models.
Figure 32.
Comparison between the capacity curves of PZs with curved inclined plates and straight inclined plates.
To calculate the ductility factor (μ) of the PZ, Equation (37) is used based on the bilinear capacity curve. In this equation, Δu represents the ultimate displacement of the connection, which is considered as the displacement corresponding to a 380 MPa stress that is calculated based on the Tresca criterion in the PZ. Additionally, Δy is the yield displacement of the PZ, determined from the bilinear curve.
Table 3 presents the ductility factor (μ) for the three connection models: BPZ, CPZ, and WPZ. It is important to note that this parameter is provided solely for analyzing and comparing the ductility behavior of the three connection types. The cyclic behavior of the BP from BPZ is illustrated in Figure 33a. As mentioned earlier, the cyclic response curves are derived from the NFORC output in the hysteretic analysis. The horizontal axis of these curves represents the maximum shear strain in percentage. This figure presents the overall cyclic behavior of the PZ, including the curved plates.
Figure 33.
Hysteresis behavior of models. (a) BP, (b) AP, (c) WPZ.
Additionally, Figure 33b,c show the cyclic behavior of AP from CPZ and the connection that relies solely on the column web plate for shear force transfer (WPZ), respectively. It should be reiterated that the cyclic response curve of WPZ represents the cyclic behavior of a conventional PZ, as specified in design codes. To compare the cyclic behavior of the models, the energy dissipation criterion is used. The dissipated energy, which results from the inelastic deformations of the model, is equal to the enclosed area within the hysteresis loops. Various methods can be used to calculate this area, and in this study, the trapezoidal method is applied. In this method, two consecutive values from the vertical axis are considered as the bases of the trapezoid, while the distance between them, which is the difference between two consecutive values on the horizontal axis, is taken as the height of the trapezoid. The area of each trapezoid is then computed. Since the hysteresis loops were plotted using shear strain percentage, which is a dimensionless parameter, it is necessary to multiply the shear strain by the PZ height before calculating the dissipated energy. It is important to note that this energy represents only the dissipated energy of the PZ. The energy dissipated in each model is measured up to the point where the shear strain in the PZ reaches 4%, and it is presented in Table 3. The 4% strain corresponds to the strain reached by the BP and AP at a 6% story drift; therefore, this strain was used as the basis for calculating the dissipated energy. In Table 3, in addition to the parameters of shear capacity, ductility, and energy dissipation, the elastic stiffness () of each connection specimen and the ratio of post-yield stiffness to initial stiffness () are also presented. The initial stiffness of the connection reflects the deformation behavior before yielding, which is particularly important in minor earthquakes, as limited deformations help prevent or minimize damage to non-structural components. Moreover, the post-to-initial stiffness ratio indicates the connection’s ability to maintain load-bearing capacity after yielding, which is critical under strong seismic events. To calculate the initial and post-yield stiffness of the models, the capacity curves are utilized. Since the curves are presented in terms of , the displacement corresponding to the normalized shear strain is first obtained, and then the stiffness is calculated accordingly.
To compare the performance of the BP and AP load transfer mechanisms, the same parameters previously used for evaluating PZ behavior are extracted for these two paths. The results are presented in Table 4. These parameters, similar to those in Table 3, include shear capacity, energy dissipation, initial stiffness, and the ratio of post-yield stiffness to initial stiffness. It is worth noting that ductility is defined for the entire connection, and it is not appropriate to be defined for individual components of the connection.
Table 4.
Comparison between load path types.
As previously stated, the shear capacity of the PZs was calculated up to . Since all three model—BPZ, CPZ, and WP—reached a stress of 380 MPa, the ductility factor (μ) was calculated at the point where they reached this stress based on the Tresca yield criterion in order to provide a proper comparison of the ductility among the three models. The Tresca yield criterion was employed in this section because the PZ is predominantly subjected to shear stresses; the use of this criterion, which is based on the maximum shear stress, can provide a conservative and accurate estimation of the onset of yielding in this region. Furthermore, the energy dissipation was calculated up to 4% shear strain in the PZs. It should be noted that this calculation is performed to compare the ductility of the different PZ specimens at the moment when a plastic strain of 0.04 rad is reached in each PZ. It is worth noting that with increasing loading and larger deformations, the difference in energy dissipation between the CPZ and BPZ PZs becomes more significant.
Considering Figure 27c, since the critical points of the BPZ are the column’s orthogonal flange and the weld of the curved plate to the column flange, reinforcing these areas can be effective. Therefore, to improve the execution details, the column flange may be strengthened, and the weld capacity increased. This study focused on the investigation of the FCC PZ irrespective of economic considerations. However, due to the superior performance and higher capacity of the BPZ compared to other PZ configurations, a reduction in economic costs in this design is highly plausible. Nevertheless, a thorough assessment of the economic aspects would require dedicated cost analyses and evaluation of material and fabrication expenses. Moreover, as previously noted, the BPZ compensates for the weaknesses of the conventional PZ in cruciform sections, reducing the risk of construction errors and minimizing additional welding, thereby enhancing practical efficiency and productivity in the use of these sections.
From a constructability perspective, the proposed BPZ offers several practical advantages compared with conventional segmented doubler plates and the CPZ configuration. In traditional FCC panel zones, doubler plates must be segmented because of the intersecting cruciform geometry, resulting in multiple weld lines, complex detailing, and a greater likelihood of fabrication inaccuracies and stress concentration at plate intersections. Similarly, the CPZ requires straight inclined plates connected through sharp geometric transitions, which may increase welding difficulty at corners and introduce localized stress concentration regions. In contrast, the BPZ employs continuous curved plates with a 90° geometry, which can be fabricated using standard plate bending techniques routinely used in steel construction. Although plate bending introduces an additional fabrication step, the proposed configuration reduces weld discontinuities and provides a smoother load transfer path. This continuity may reduce local welding defects and simplify fit-up during assembly. Therefore, the BPZ presents a practical compromise between fabrication effort and structural performance enhancement.
7. Conclusions
In this study, the behavior of the PZ in cruciform columns was investigated. Three different PZ configurations were compared: one with straight inclined plates, one with curved inclined plates, and a conventional PZ without inclined plates. Numerical modeling in Abaqus was used for this comparison. The motivation for introducing new PZ configurations was to enhance shear capacity and ductility by mitigating stress concentration and altering the load transfer path. These models were subjected to nonlinear analysis under both monotonic and cyclic loading, and their shear capacity, cyclic behavior, ductility, and energy dissipation were evaluated and compared. The results of the pushover and cyclic analyses were validated prior to extraction. The pushover analysis showed good agreement in terms of initial stiffness and shear capacity of the PZ with the validation model. Similarly, for the cyclic model, the slopes of the hysteresis curves differed by less than 10%, and the ultimate capacity showed only a 4% discrepancy compared to the validation model, indicating that the cyclic models also exhibited satisfactory accuracy. The results obtained from this study are as follows:
- The PZ with inclined plates alters the load transfer path compared to the conventional PZ without inclined plates in FCCs, engaging the weak-axis flanges of the column in force transmission.
- The use of curved inclined plates in the PZ (BPZ model), compared to both straight inclined plates (CPZ model) and the conventional configuration (WPZ model), extends the load transfer path and reduces stress concentration at sharp corners.
- The BPZ model enhances both the shear capacity and ductility of the PZ.
- Due to the extended load transfer path, the energy dissipation in the BPZ model is higher than in the CPZ model, making the connection more effective in dissipating energy within the overall structural system.
- The initial stiffness and the ratio of secondary to primary stiffness of the BPZ model were higher than those of the other models. This advantage ensures that, firstly, the connection does not undergo excessive displacements before yielding, thus minimizing the potential damage to non-structural components. Secondly, after yielding, the connection experiences a smaller reduction in stiffness, allowing it to carry more load.
- Bent plates exhibit a shear capacity increase of approximately 15% and a stiffness enhancement of about 17% compared to straight inclined plates. Additionally, they show a 28% improvement in energy dissipation capabilities.
- The key parameters used for comparing the models in this study were shear capacity, energy dissipation, elastic stiffness, and ductility, in all of which BPZ outperformed both CPZ and WPZ. Compared with CPZ, BPZ exhibited 12% greater shear capacity, 20% higher energy dissipation, 5% greater elastic stiffness, and 15% greater ductility. This model also showed substantial improvement compared with WPZ. The shear capacity of BPZ was 4.3 times that of WPZ, its energy dissipation was 4.28 times greater, its elastic stiffness was 2.9 times higher, and its ductility was 1.05 times greater. These values indicate a significant improvement in the performance of the PZ when the BPZ model is employed, which consequently leads to enhanced performance of the cruciform column in the MRF.
- As the force transfer path becomes longer, a larger area of the plates and column is involved in shear deformation. As a result, a greater portion of the steel reaches the yield range, and the total energy dissipation capacity of the structure increases. Also, the gradual deformation along the longer path causes the plastic zone to spread and prevents the sudden concentration of stress at a single point. This leads to higher energy consumption before failure occurs and enhances the ductility.
Alongside the positive features that the bent plates provide in the PZ of FCCs, and the better behavior of the BPZ compared to other PZs used so far in steel moment frames, the implementation of this type of PZ requires high precision and quality of execution. To ensure that the load transfer path is properly established, the bent plates must be accurately formed, and the welding between the bent plates and the column flange plate must be executed with appropriate quality.
Accordingly, based on the conditions and assumptions governing this study, as described in the text, BPZ demonstrates superior performance relative to the other PZ models with respect to the parameters considered. Its more favorable performance also leads to improved behavior of the cruciform column PZ. It should be noted that investigating the behavior of BPZ under different conditions and geometries and also conducting laboratory and full-scale experimental studies could further expand this line of research. The explicit modeling of welds and the consideration of potential weld failure are factors that may influence the structural response and the obtained results. However, these aspects were beyond the scope and objectives of the present study. Therefore, all welded connections were idealized as rigid, and weld failure was not considered in the numerical analyses. Accordingly, several recommendations for advancing this research path are presented in the following.
8. Future Development
Considering the superior performance of the proposed PZ configuration compared to other FCC PZ models, additional parameters can be investigated in future studies to further optimize and enhance the efficiency of this configuration. As discussed, the current study focused specifically on evaluating the effect of inclined plates in the PZ, while other parameters were kept constant to ensure a more accurate comparison. The following recommendations are proposed for future research in this direction:
- Since the geometry of the CPs was kept constant in this study, investigating alternative configurations—such as introducing curvature to these plates or connecting them to the inclined plates—could affect load transfer mechanisms and the ductility of the PZ.
- The thickness of the CPs and inclined plates was not varied in this study. The CPs were modeled based on the standard thickness specified for conventional connections in design codes, while the inclined plates were assumed to have the same thickness as the column flanges. Future studies could explore the impact of varying these thicknesses and propose a new approach for determining optimal plate thicknesses to enhance structural performance.
- Investigating the performance of this PZ configuration with various beam and column sizes, and testing it through experimental research, could contribute to the advancement and wider adoption of this connection type in future structural applications.
- Incorporating the effects of welding-induced residual stresses and temperature variations on the behavior of the cruciform column PZ, as well as considering the type of beam-to-column connection, could enhance the practical applicability of this research direction. Accordingly, further numerical and experimental investigations in these areas are recommended.
The aforementioned recommendations can facilitate the advancement of the objectives of this study and promote the broader practical implementation of cruciform columns in MRFs. In this regard, examining a wide range of beam and column cross-sections for the proposed PZ, as well as developing more optimized design alternatives, could be of even greater significance. Furthermore, experimental investigation of the BPZ at full scale, under realistic conditions, is necessary to facilitate the practical implementation of this design and its use as a PZ specifically tailored and optimized for FCCs. Such studies could constitute a focus for future research in this area.
Author Contributions
Conceptualization, A.R.M.; Methodology, A.K.; Software, A.K.; Validation, A.K.; Formal analysis, A.K. and A.R.M.; Investigation, A.R.M.; Resources, A.R.M.; Data curation, A.K.; Writing—original draft, A.K. and A.R.M.; Writing—review & editing, A.R.M.; Visualization, A.K.; Supervision, A.R.M. All authors have read and agreed to the published version of the manuscript.
Funding
This research received no external funding.
Data Availability Statement
All data generated or analyzed during this study are included in this published article. The raw data is also available from the corresponding author on reasonable request.
Conflicts of Interest
The authors declare that they have no known competing financial interests or personal relationships that could have appeared to influence the work reported in this paper.
References
- Federal Emergency Management Agency (FEMA). State of the art report on connection performance. In Constructional Steel Research; FEMA: Washington, DC, USA, 2000; pp. 1–305. [Google Scholar]
- Nakashima, B.M.; Suita, K.; Morisako, K.; Maruoka, Y. Tests of welded beam-column subassemblies. I: Global behavior. J. Struct. Eng. 1998, 124, 1236–1244. [Google Scholar] [CrossRef] [Scilit]
- Engelhardt, M.D.; Sabol, T.A. Reinforcing of steel moment connections with cover plates: Benefits and limitations. Eng. Struct. 1998, 20, 510–520. [Google Scholar] [CrossRef] [Scilit]
- Kim, T.; Whittaker, A.S.; Gilani, A.S.J.; Bertero, V.V.; Takhirov, S.M. Experimental Evaluation of Plate-Reinforced Steel Moment-Resisting Connections. J. Struct. Eng. 2002, 128, 483–491. [Google Scholar] [CrossRef] [Scilit]
- Barsom, J.M.; Pellegrino, J.V. Failure Analysis of Welded Steel Moment-Resisting Frame Connections. J. Mater. Civ. Eng. 2002, 14, 24–34. [Google Scholar] [CrossRef] [Scilit]
- Righiniotis, T.D.; Imam, B. Fracture reliability of a typical Northridge steel moment resisting connection. Eng. Struct. 2004, 26, 381–390. [Google Scholar] [CrossRef] [Scilit]
- Ojdrovic, R.P.; Zarghamee, M.S. Fracture of steel moment connections in the Northridge earthquake. Proc. Inst. Civ. Eng. Struct. Build. 1997, 122, 209–217. [Google Scholar] [CrossRef] [Scilit]
- Kim, T.; Stojadinović, B.; Whittaker, A.S. Seismic performance of pre-Northridge welded steel moment connections to built-up box columns. J. Struct. Eng. 2008, 134, 289–299. [Google Scholar] [CrossRef] [Scilit]
- Popov, E.P.; Yang, T.S.; Chang, S.P. Design of steel MRF connections before and after 1994 Northridge earthquake. Eng. Struct. 1998, 20, 1030–1038. [Google Scholar] [CrossRef] [Scilit]
- Engelhardt, M.D.; Sabol, T.A. Seismic-resistant steel moment connections: Developments since the 1994 Northridge earthquake. Prog. Struct. Eng. Mater. 1997, 1, 68–77. [Google Scholar] [CrossRef] [Scilit]
- Chi, W.M.; El-Tawil, S.; Deierlein, G.G.; Abel, J.F. Inelastic analyses of a 17-story steel framed building damaged during Northridge. Eng. Struct. 1998, 20, 481–495. [Google Scholar] [CrossRef] [Scilit]
- Lau, D.L.; Tang, A.; Pierre, J.R. Performance of lifelines during the 1994 Northridge earthquake. Can. J. Civ. Eng. 1995, 22, 438–451. [Google Scholar] [CrossRef] [Scilit]
- Mahin, S.A. Lessons from damage to steel buildings during the Northridge earthquake. Eng. Struct. 1998, 20, 261–270. [Google Scholar] [CrossRef] [Scilit]
- Wang, C.-H.; Wen, Y.-K. Evaluation of pre-Northridge low-rise steel buildings. I: Modeling. J. Struct. Eng. 2000, 126, 1160–1168. [Google Scholar] [CrossRef] [Scilit]
- Wang, C.-H.; Wen, Y.-K. Evaluation of pre-northridge low-rise steel buildings. II: Reliability. J. Struct. Eng. 2000, 126, 1169–1176. [Google Scholar] [CrossRef] [Scilit]
- Housner, G.W.; Masri, S.F. Structural control research issues arising out of the Northridge and Kobe earthquakes. In Eleventh World Conference on Earthquake Engineering; Art. No. 2009; Elsevier Science: Amsterdam, The Netherlands, 1996. [Google Scholar]
- Yao, S.; Chen, Y.; Sun, C.; Zhao, N.; Wang, Z.; Zhang, D. Dynamic response mechanism of thin-walled plate under confined and unconfined blast loads. J. Mar. Sci. Eng. 2024, 12, 224. [Google Scholar] [CrossRef] [Scilit]
- Zhai, Z.; Shu, Q.; Chen, H.; Liu, Y. CCQC-based multi-seismic level optimum design of supplemental dampers in steel moment resisting frame. J. Build. Eng. 2025, 108, 112922. [Google Scholar] [CrossRef] [Scilit]
- Long, X.; Li, H.; Iyela, P.M.; Kang, S.B. Predicting the bond stress–slip behavior of steel reinforcement in concrete under static and dynamic loadings by finite element, deep learning and analytical methods. Eng. Fail. Anal. 2024, 161, 108312. [Google Scholar] [CrossRef] [Scilit]
- ANSI/AISC 358-22; Prequalified Connections for Special and Intermediate Steel Moment Frames for Seismic Applications. American Institute of Steel Construction (AISC): Chicago, IL, USA, 2014.
- Hsieh, S.; Kong, S.; Lin, K.; Tsai, K. Effects of Panel Zone Deformations on Cyclic Performance of Welded Moment Connections. In Proceedings of the 12th World Conference on Earthquake Engineering, Auckland, New Zealand, 30 January–4 February 2000. [Google Scholar]
- Krawinkler, H.; Mohasseb, S. Effects of panel zone deformations on seismic response. J. Constr. Steel Res. 1987, 8, 233–250. [Google Scholar] [CrossRef] [Scilit]
- Hedayat, A.A.; Celikag, M. Enhancement of Panel Zone (PZ) contribution to the ductility of post-northridge welded connections. WSEAS Trans. Appl. Theor. Mech. 2008, 3, 165–174. [Google Scholar]
- ANSI/AISC 341-22; Seismic Provisions for Structural Steel Buildings. American Institute of Steel Construction (AISC): Chicago, IL, USA, 2022.
- ANSI/AISC 360-22; Specification for Structural Steel Buildings. American Institute of Steel Construction (AISC): Chicago, IL, USA, 2022.
- Lu, L.; Wang, D.; Dai, Z.; Luo, T.; Ding, S.; Hao, H. Global buckling investigation of the flanged cruciform h-shapes columns (FCHCs). Appl. Sci. 2021, 11, 11458. [Google Scholar] [CrossRef] [Scilit]
- GB50017-2017; Standard for Design of Steel Structures. China Architecture & Building Press: Beijing, China, 2017.
- Dai, R.; Behzadi-Sofiani, B.; Buhagiar, S.; Wadee, M.A.; Gardner, L. Behaviour, finite element modelling and design of flanged cruciform section steel columns. Thin-Walled Struct. 2024, 204, 112268. [Google Scholar] [CrossRef] [Scilit]
- EN 1993-1-5:2006; Eurocode 3: Design of Steel Structures—Part 1-5: Plated Structural Elements. European Committee for Standardisation (CEN): Brussels, Belgium, 2006.
- Keykhosro Kiani, B.; Torabian, S.; Mirghaderi, S.R. Local seismic stability of flanged cruciform sections (FCSs). Eng. Struct. 2015, 96, 126–138. [Google Scholar] [CrossRef] [Scilit]
- Nie, W.; Lu, L.; Li, R.; Hao, H.; Luo, T. Global buckling investigation of T-shaped built-up columns composed of two hot-rolled H-shapes. Structures 2023, 58, 105485. [Google Scholar] [CrossRef] [Scilit]
- Dobrić, J.; Gluhović, N.; Fric, N.; Ruan, X.; Bock, M.; Rossi, B. Buckling strengths of cold-formed built-up cruciform section columns under axial compression. Thin-Walled Struct. 2024, 200, 111879. [Google Scholar] [CrossRef] [Scilit]
- Dinis, P.B.; Camotim, D. Buckling, post-buckling and strength of cruciform columns. In Proceedings of the Structural Stability Research Council Annual Stability Conference 2011, ASC, Pittsburgh, PA, USA, 10–14 May 2011; pp. 271–283. [Google Scholar]
- Xu, F.; Wang, J.; Yuan, X.; Peng, Y.; Sun, Z.; Peng, Y. Torsional buckling capacity of welded steel column with cruciform cross-section under axial compression. Structures 2025, 82, 110470. [Google Scholar] [CrossRef] [Scilit]
- Kumar, P.A.; Anupriya, B. Performance assessment of Cruciform steel column: FEM simulation. Mater. Today Proc. 2022, 64, 1043–1047. [Google Scholar] [CrossRef] [Scilit]
- Guarracino, F.; Simonelli, M.G. The torsional instability of a cruciform column in the plastic range: Analysis of an old conundrum. Thin-Walled Struct. 2016, 113, 273–286. [Google Scholar]
- Trahair, N.S. Strength design of cruciform steel columns. Eng. Struct. 2012, 35, 307–313. [Google Scholar] [CrossRef] [Scilit]
- Tahir, M.M.; Shek, P.N.; Sulaiman, A.; Tan, C.S. Experimental investigation of short cruciform columns using universal beam sections. Constr. Build. Mater. 2009, 23, 1354–1364. [Google Scholar] [CrossRef] [Scilit]
- SCI. Steelwork Design Guide to BS 5950: Part 1: 2000 Volume 1 Section Properties Member Capacities Incorporating Amendment 1; Steel Construction Institute: Ascot, UK, 2002. [Google Scholar]
- Saffari, H.; Sarfarazi, S.; Fakhraddini, A. A mathematical steel panel zone model for flanged cruciform columns. Steel Compos. Struct. 2016, 20, 851–867. [Google Scholar] [CrossRef] [Scilit]
- Sarfarazi, S.; Saffari, H.; Fakhraddini, A. Shear behavior of panel zone considering axial force for flanged cruciform columns. Civ. Eng. Infrastruct. J. 2020, 53, 359–377. [Google Scholar] [CrossRef] [Scilit]
- Sarfarazi, S.; Fakhraddini, A.; Modaresahmadi, K. Evaluation of panel zone shear strength in cruciform columns, box-columns and double- web columns. Int. J. Struct. Civ. Eng. Res. 2016, 5, 52–56. [Google Scholar]
- Mirghaderi, R.; Motallebi, M. New method for providing favorable seismic performance in panel zone regions of moment resisting connections of beams to flanged cruciform column section. In Proceedings of the ECCOMAS Thematic Conference—COMPDYN 2011: 3rd International Conference on Computational Methods in Structural Dynamics and Earthquake Engineering: An IACM Special Interest Conference, Programme, Corfu, Greece, 25–28 May 2011. [Google Scholar]
- Khandelwal, K.; El-Tawil, S. Collapse Behavior of Steel Special Moment Resisting Frame Connections. J. Struct. Eng. 2007, 133, 646–655. [Google Scholar] [CrossRef] [Scilit]
- Jahanbakhti, E.; Fanaie, N.; Rezaeian, A. Experimental investigation of panel zone in rigid beam to box column connection. J. Constr. Steel Res. 2017, 137, 180–191. [Google Scholar] [CrossRef] [Scilit]
- Rezaeian, A.; Jahanbakhti, E.; Fanaie, N. Numerical Study of Panel Zone in a Moment Connection without CPs. J. Earthq. Eng. 2022, 26, 930–948. [Google Scholar]
- AISC 341-10; Seismic Provisions for Structural Steel Buildings. American Institute of Steel Construction (AISC): Chicago, IL, USA, 2010.
- Tuna, M.; Topkaya, C. Panel zone deformation demands in steel moment resisting frames. J. Constr. Steel Res. 2015, 110, 65–75. [Google Scholar] [CrossRef] [Scilit]
- Campbell, H.H. Specifications for Structural Steel. Trans. Am. Soc. Civ. Eng. 1895, 33, 297–343. [Google Scholar] [CrossRef] [Scilit]
- Arya, C. Eurocode 3: Design of steel structures. In Design of Structural Elements, 3rd ed.; CRC Press: London, UK, 2015; pp. 395–453. [Google Scholar]
- Sazmand, E.; Aghakouchak, A.A. Modeling the panel zone in steel MR frames composed of built-up columns. J. Constr. Steel Res. 2012, 77, 54–68. [Google Scholar] [CrossRef] [Scilit]
- Kosarieh, A.H.; Danesh, F.; Shiri, R. Column axial load effects on performance of panel zone in welded-flange-plate connections. Adv. Struct. Eng. 2015, 18, 775–789. [Google Scholar] [CrossRef] [Scilit]
- Lee, C.-H.; Asce, M.; Jeon, S.-W.; Kim, J.-H.; Uang, C.-M. Effects of panel zone strength and beam web connection method on seismic performance of reduced beam section steel moment connections. Struct. Eng. 2005, 2005, 1854–1865. [Google Scholar] [CrossRef] [Scilit]
- Castro, J.M.; Dávila-Arbona, F.J.; Elghazouli, A.Y. Seismic design approaches for panel zones in steel moment frames. J. Earthq. Eng. 2008, 12, 34–51. [Google Scholar] [CrossRef] [Scilit]
- Jiang, S.; Shi, G.; Zhang, N.; Zhao, H.; Sun, T. Experimental study on seismic behavior of cover-plate connections between steel beams and high strength steel box columns. Thin-Walled Struct. 2023, 193, 111208. [Google Scholar] [CrossRef] [Scilit]
- Pan, L.; Chen, Y.; Chuan, G.; Jiao, W.; Xu, T. Experimental evaluation of the effect of vertical connecting plates on panel zone shear stability. Thin-Walled Struct. 2016, 99, 119–131. [Google Scholar] [CrossRef] [Scilit]
- Roeder, C.W.; Foutch, D.A. Experimental Results for Seismic Resistant Steel Moment Frame Connections. J. Struct. Eng. 1996, 122, 581–588. [Google Scholar] [CrossRef] [Scilit]
- Liew, J.Y.R.; Chen, W.F. Analysis and Design of Steel Frames Considering Panel Joint Deformations. J. Struct. Eng. 1995, 121, 1531–1540. [Google Scholar] [CrossRef] [Scilit]
- Fisher, J.W.; Ricles, J.M.; Lu, L.-W.; Mao, C.; Kaufmann, E.J. Steel moment frame connections that achieve ductile performance. Adv. Build. Technol. 2002, 1, 415–422. [Google Scholar] [CrossRef] [Scilit]
- Jazany, R.A.; Hashemi, B.H. Effects of detailing on panel zone seismic behaviour in special moment resisting frames with unequal beam depths. Can. J. Civ. Eng. 2012, 39, 388–401. [Google Scholar] [CrossRef] [Scilit]
- Whittaker, A.; Gilani, A.; Bertero, V. Evaluation of pre-northridge steel moment-resisting frame joints. Struct. Des. Tall Build. 1998, 7, 263–283. [Google Scholar] [CrossRef] [Scilit]
- Liu, S.; Chen, O.; Liao, Y.; Zeng, S.; Hu, S. Prediction of the overstrength for ordinary shear links in eccentrically braced frames. Structures 2026, 84, 110958. [Google Scholar] [CrossRef] [Scilit]
- Hu, S.; Liu, S.; Zeng, S.; Zhang, B.; Xu, Z. Investigating seismic performance of a novel self-centering shear link in EBF utilizing experimental and numerical simulation. J. Constr. Steel Res. 2025, 224, 109129. [Google Scholar] [CrossRef] [Scilit]
- Wang, Y.; Chen, B.; Dai, P.; Wang, Y.; Song, Y.; Jiang, K. Experimental and numerical study on lateral-torsional buckling of welded QN1803 high-strength stainless steel I-girders. Thin-Walled Struct. 2025, 212, 113190. [Google Scholar] [CrossRef] [Scilit]
- Dai, Y.; Chen, B.; Wang, Y.; Ye, Q.; Luo, L.; Li, B. Parametric study and new design recommendations for high-strength stainless steel plate girders under patch loading. Structures 2025, 71, 108064. [Google Scholar] [CrossRef] [Scilit]
- Kuang, J.H.; Liu, A.H. A Study of the Stress Concentration Factor on Spot Welds. Weld. J. 1990, 69, 468S–474S. [Google Scholar]
- Molski, K.L.; Tarasiuk, P. Stress concentration factors for butt-welded plates subjected to tensile, bending and shearing loads. Materials 2020, 13, 1798. [Google Scholar] [CrossRef] [Scilit] [PubMed]
- Kordbagh, B.; Mohammadi, M. Influence of Panel Zone on Progressive Collapse Resistance of Steel Structures. J. Perform. Constr. Facil. 2018, 32, 04018014. [Google Scholar] [CrossRef] [Scilit]
- Abdelwahed, B. A review on building progressive collapse, survey and discussion. Case Stud. Constr. Mater. 2019, 11, e00264. [Google Scholar] [CrossRef] [Scilit]
- Possidente, L.; Freddi, F.; Tondini, N. Dynamic increase factors for progressive collapse analysis of steel structures considering column buckling. Eng. Fail. Anal. 2024, 160, 108209. [Google Scholar] [CrossRef] [Scilit]
- Li, J.; Liu, Y.; Li, H.; Cui, N.; Yu, K. A Unified Family of High-Order Energy-Conserving Time Integrators for Nonlinear Dynamical Problems. Int. J. Numer. Methods Eng. 2026, 127, e70253. [Google Scholar] [CrossRef] [Scilit]
- Ding, H.; Yu, Y.; Xu, C.; Pu, X.; Guo, W.; Tong, L. Analytical modeling for nonlinear seismic metasurfaces of saturated porous media. Int. J. Mech. Sci. 2025, 303, 110666. [Google Scholar] [CrossRef] [Scilit]
- Motallebi Nasrabadi, M.; Torabian, S.; Mirghaderi, S.R. Panel zone modelling of Flanged Cruciform Columns: An analytical and numerical approach. Eng. Struct. 2013, 49, 491–507. [Google Scholar] [CrossRef] [Scilit]
- Asghari, A.; Pavir, A. Evaluation of the shear strength of flanged cruciform steel columns in the panel zone of moment-resisting frames. Structures 2025, 73, 108283. [Google Scholar] [CrossRef] [Scilit]
- Wang, Z.; Wang, L.; Zhang, S.; Liu, X.; Xiang, Y.; Tan, J. Analytical springback modelling for thermal-mechanical bending of TA18 tube under non-isothermal loading. Appl. Math. Model. 2025, 143, 115964. [Google Scholar] [CrossRef] [Scilit]
- Wang, Z.; Li, J.; Liu, X.; Zhang, S.; Lin, Y.; Tan, J. Diameter-adjustable mandrel for thin-wall tube bending and its domain knowledge-integrated optimization design framework. Eng. Appl. Artif. Intell. 2025, 139, 109634. [Google Scholar] [CrossRef] [Scilit]
- Liu, Y.; Su, J.; He, D.; Hao, P.; Liu, Y.; Wang, Z.; Wang, T. Analytical model for corrugated rolling of composite plates considering the shear effect. J. Manuf. Process. 2025, 134, 1069–1081. [Google Scholar] [CrossRef] [Scilit]
- Tong, L.; Fu, L.; Wu, B.; Xu, C.; Lim, C.W.; Ding, H. Particle shape effect on creep and fluidity of granular packing. J. Eng. Mech. 2025, 151, 04025067. [Google Scholar] [CrossRef] [Scilit]
- FEMA-355F; State of the Art Report on Performance Prediction and Evaluation of Steel Moment-Frame Buildings. Federal Emergency Management Agency (FEMA): Washington, DC, USA, 2000.
- Lee, D.; Cotton, S.C.; Dexter, R.J.; Hajjar, J.F.; Ye, Y.; Ojard, S.D. Column Stiffener Detailing and Panel Zone Behavior of Steel Moment Frame Connections; Structural Engineering Report. No. ST-01-3.2; Department of Civil Engineering, University of Minnesota: Minneapolis, MN, USA, 2002. [Google Scholar]
- Ricles, J.M.; Fisher, J.W.; Lu, L.W.; Kaufmann, E.J. Development of improved welded moment connections for earthquake-resistant design. J. Constr. Steel Res. 2002, 58, 565–604. [Google Scholar] [CrossRef] [Scilit]
- FEMA 356; Prestandard and Commentary for the Seismic Rehabilitation of Building. Federal Emergency Management Agency: Washington, DC, USA, 2000; pp. 1–518.
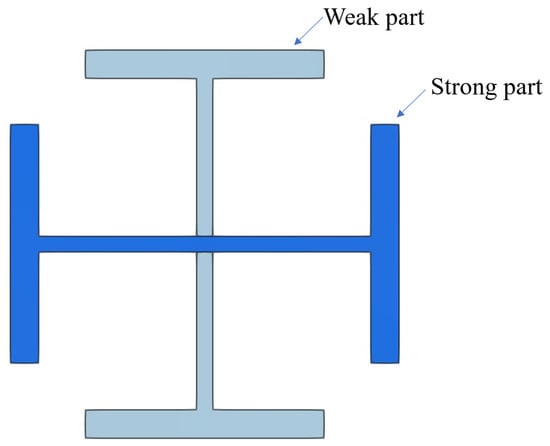
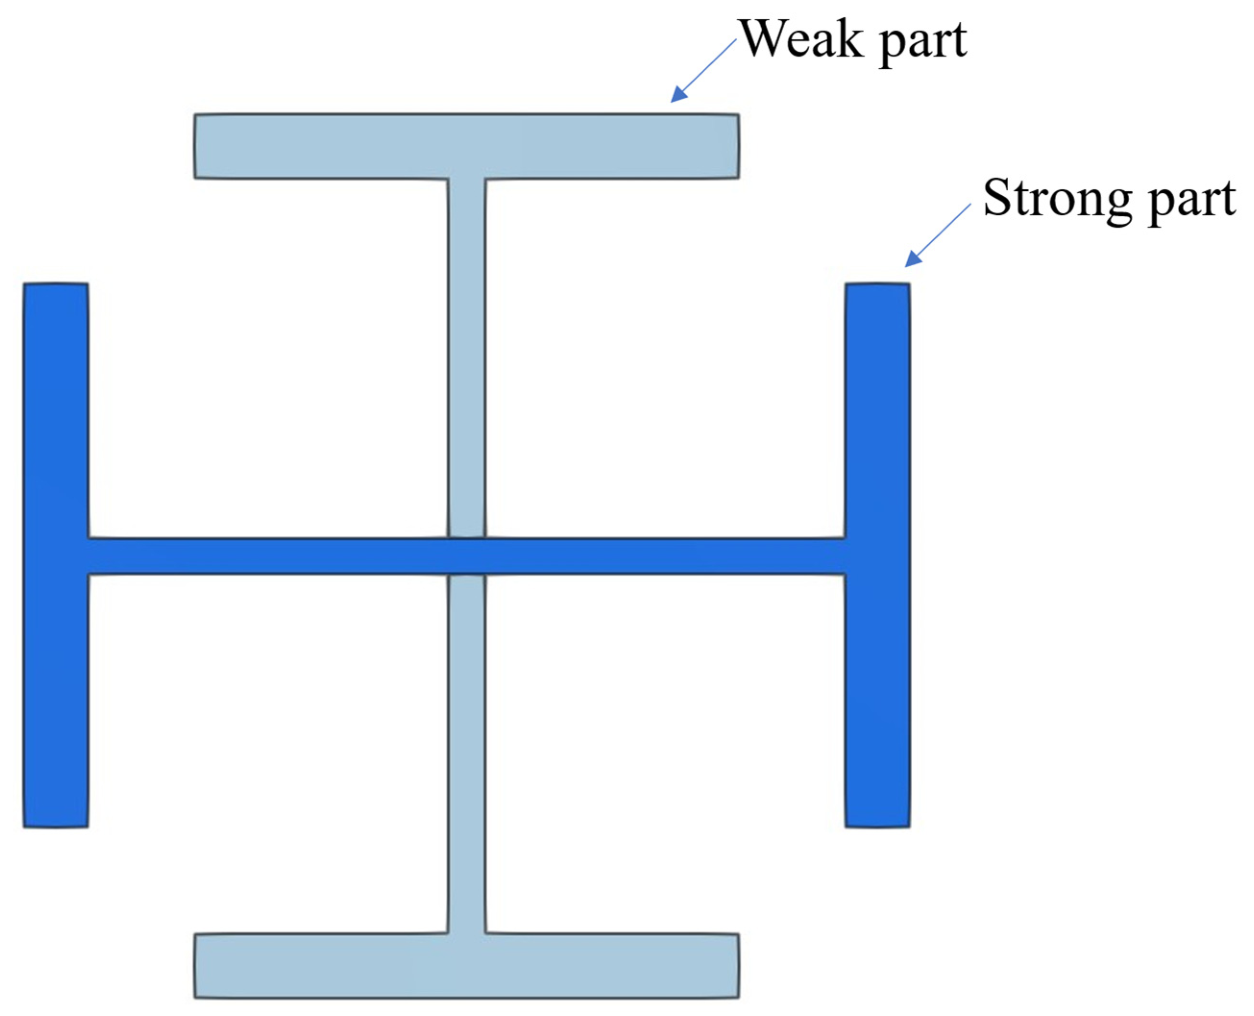
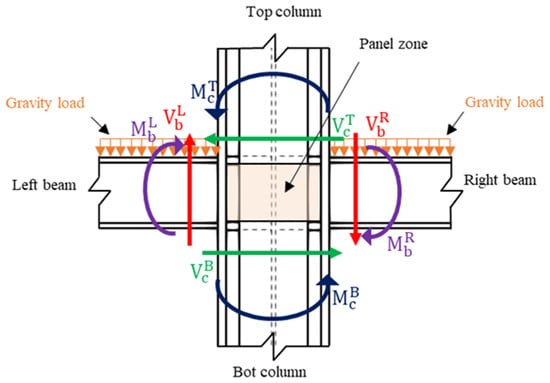
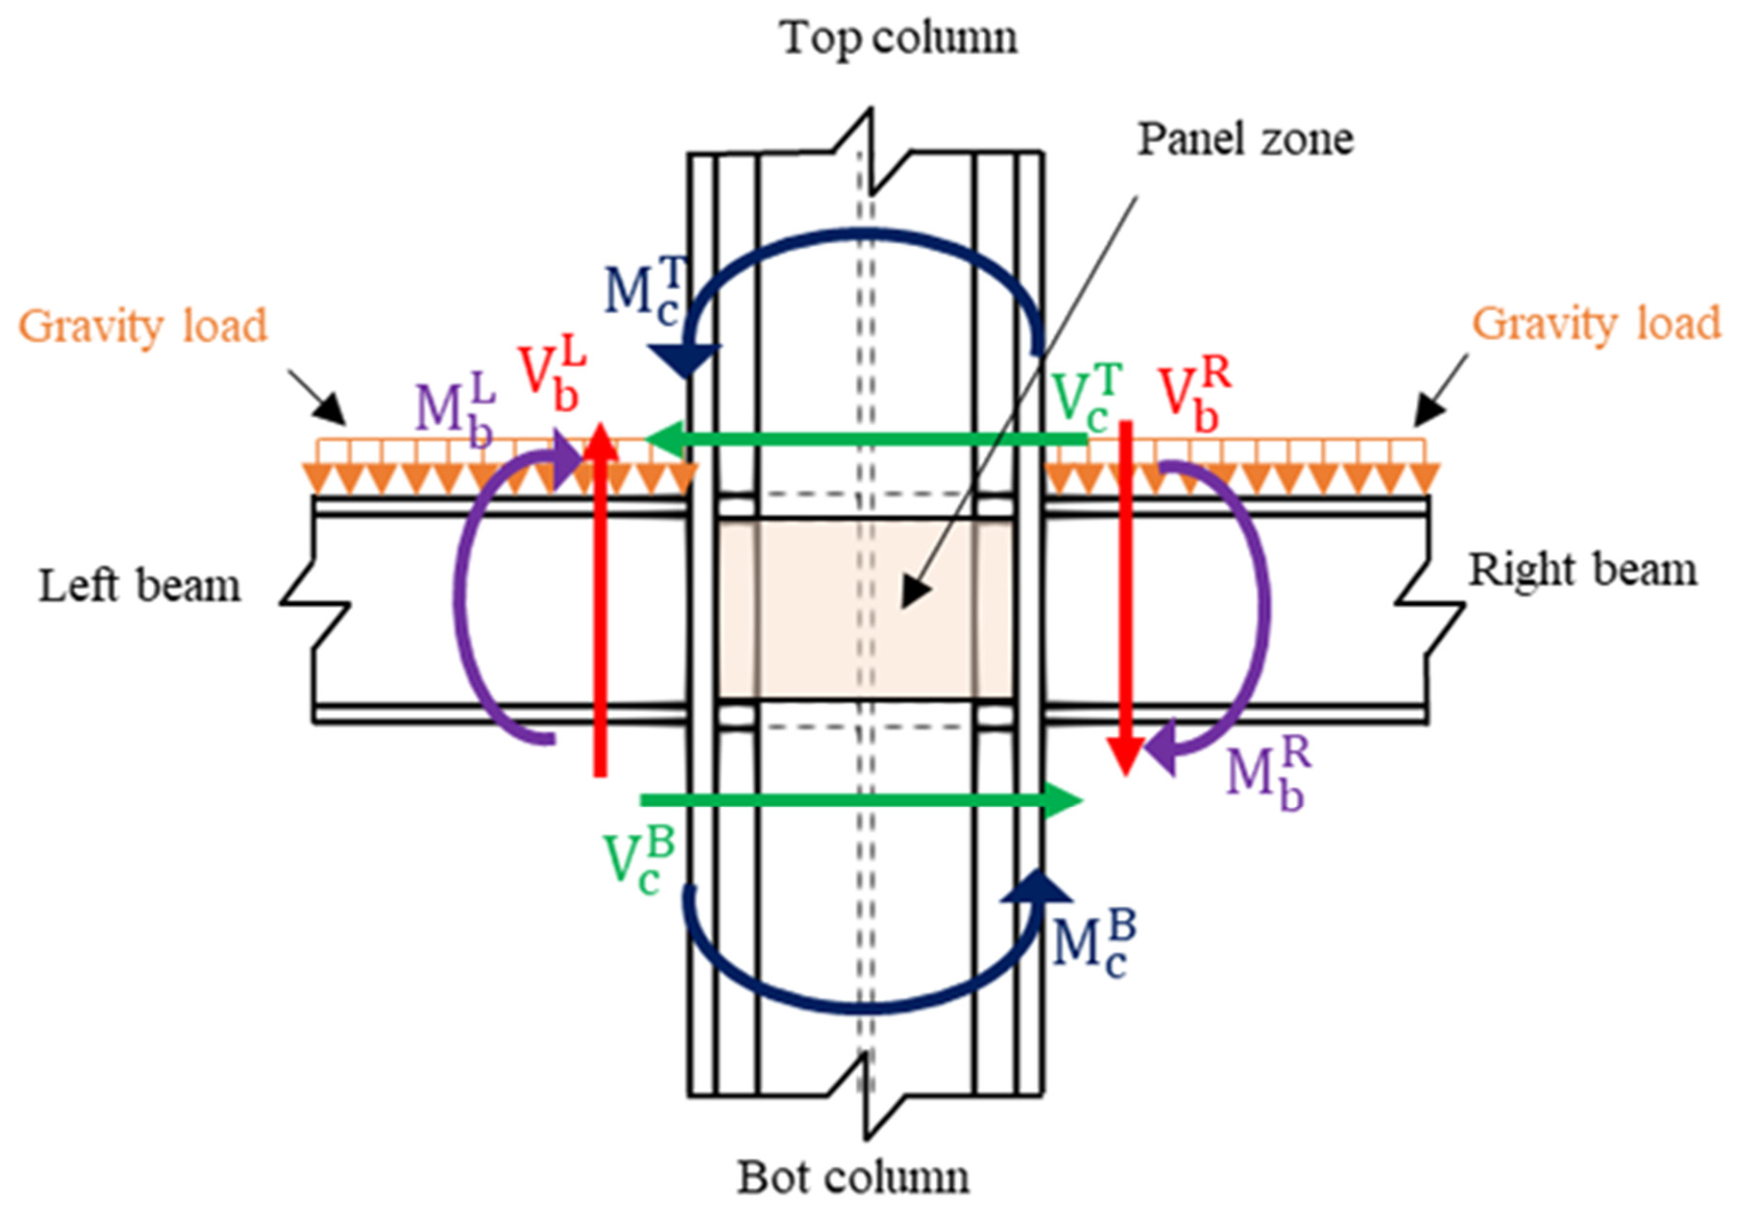
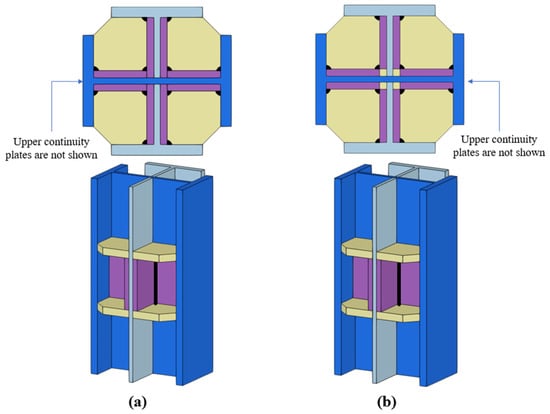
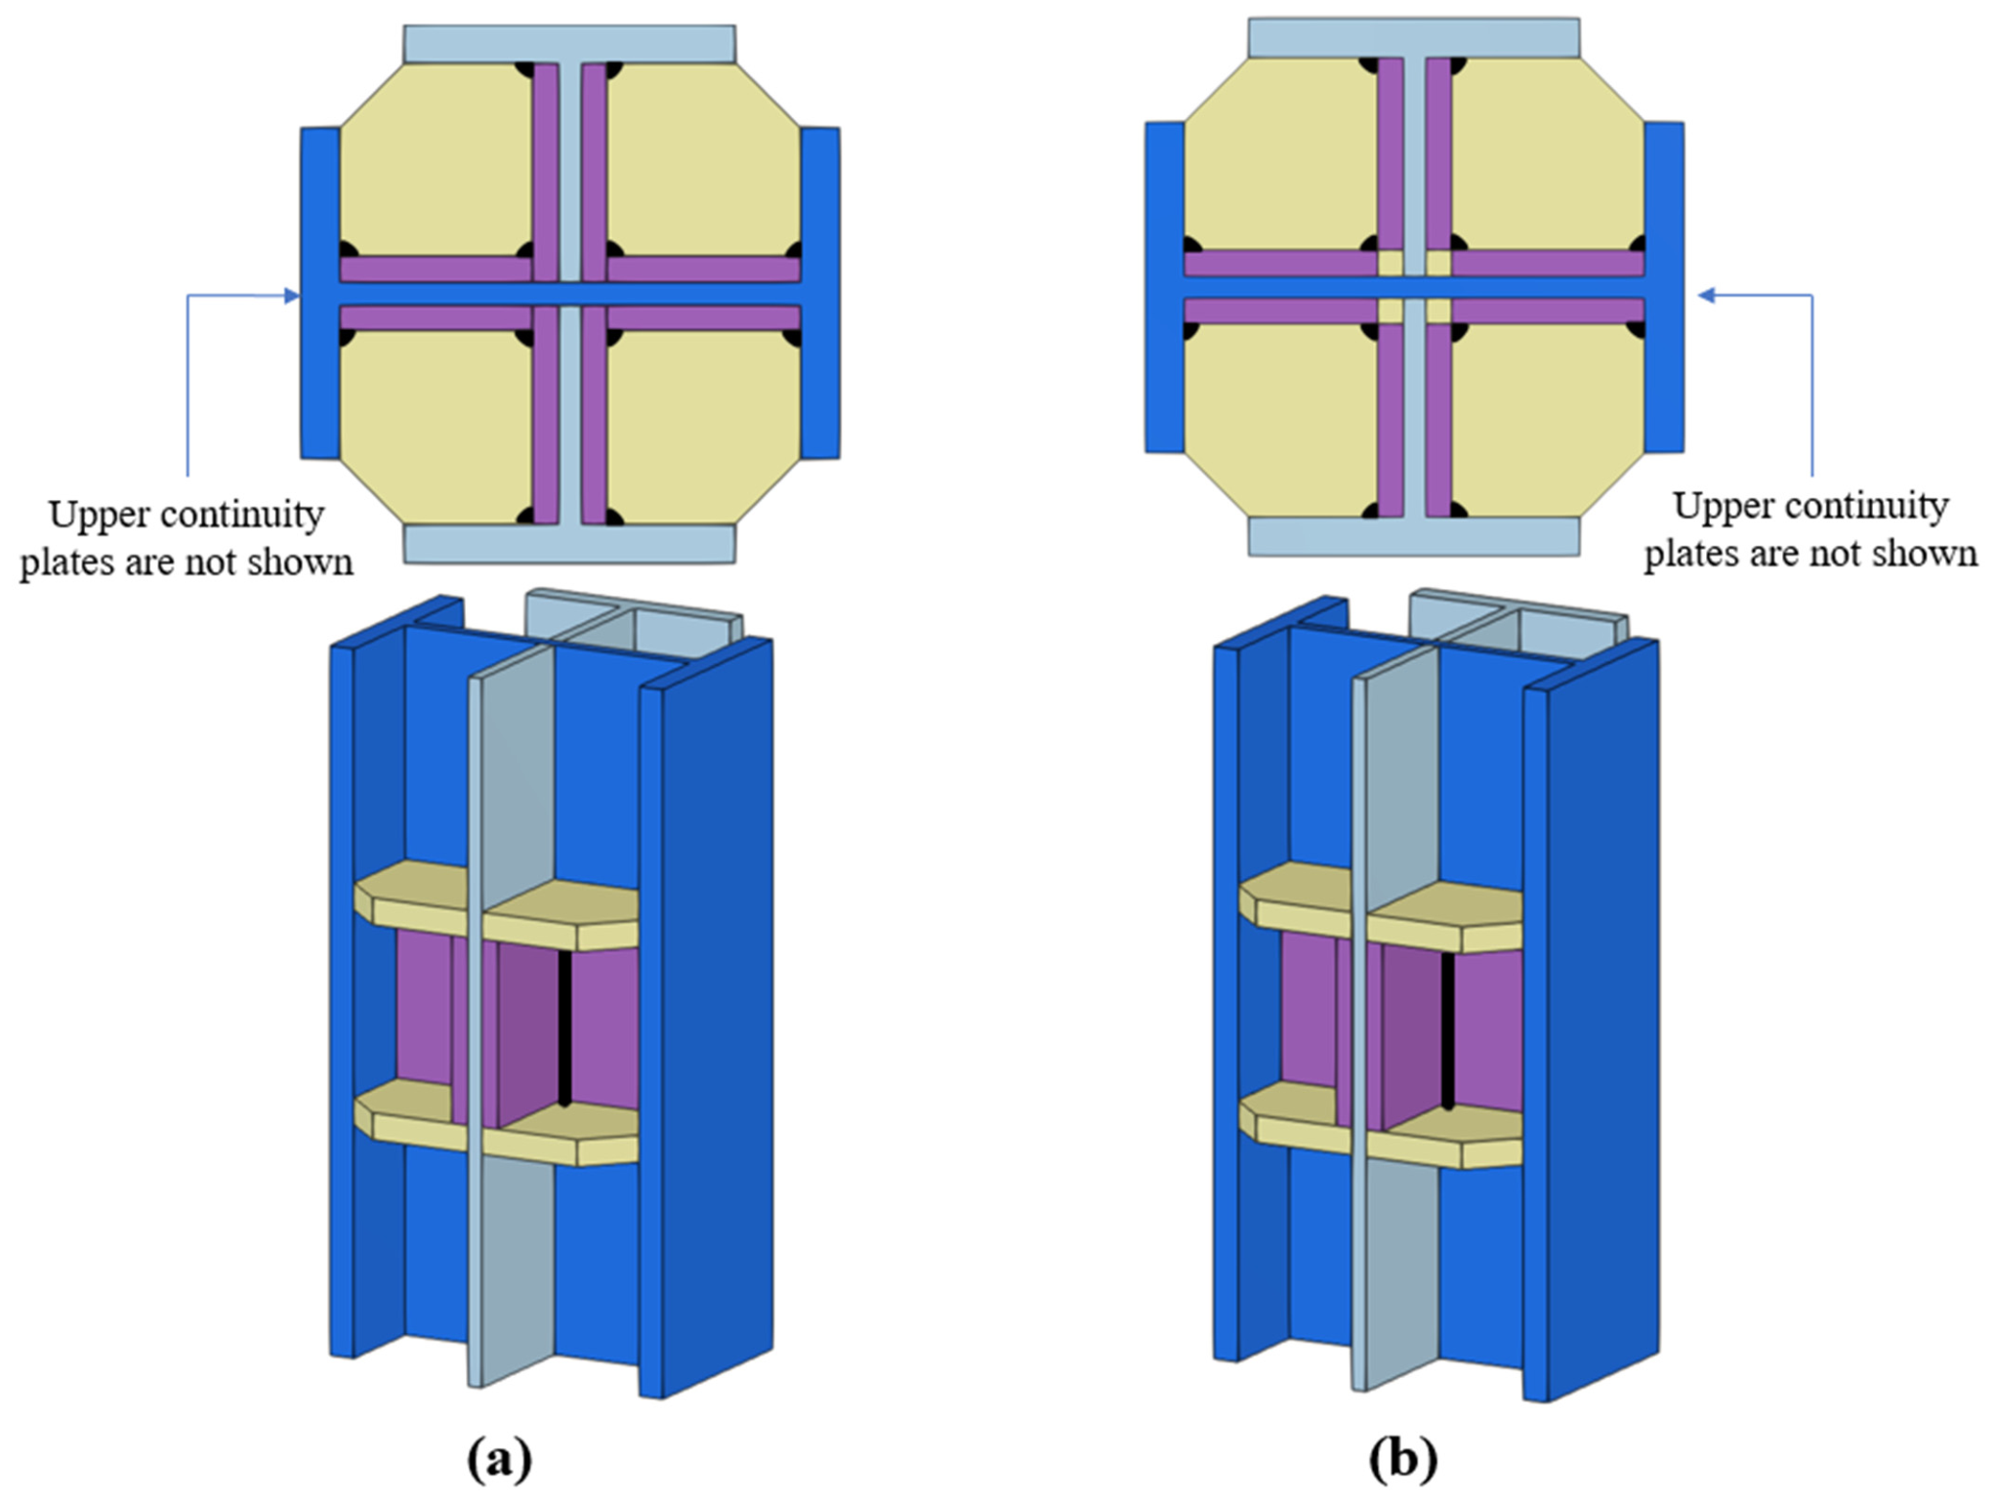
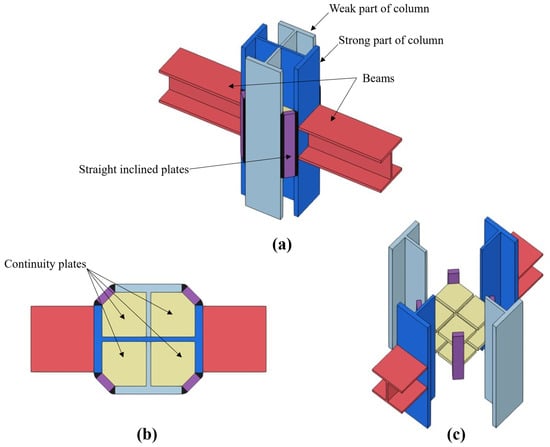
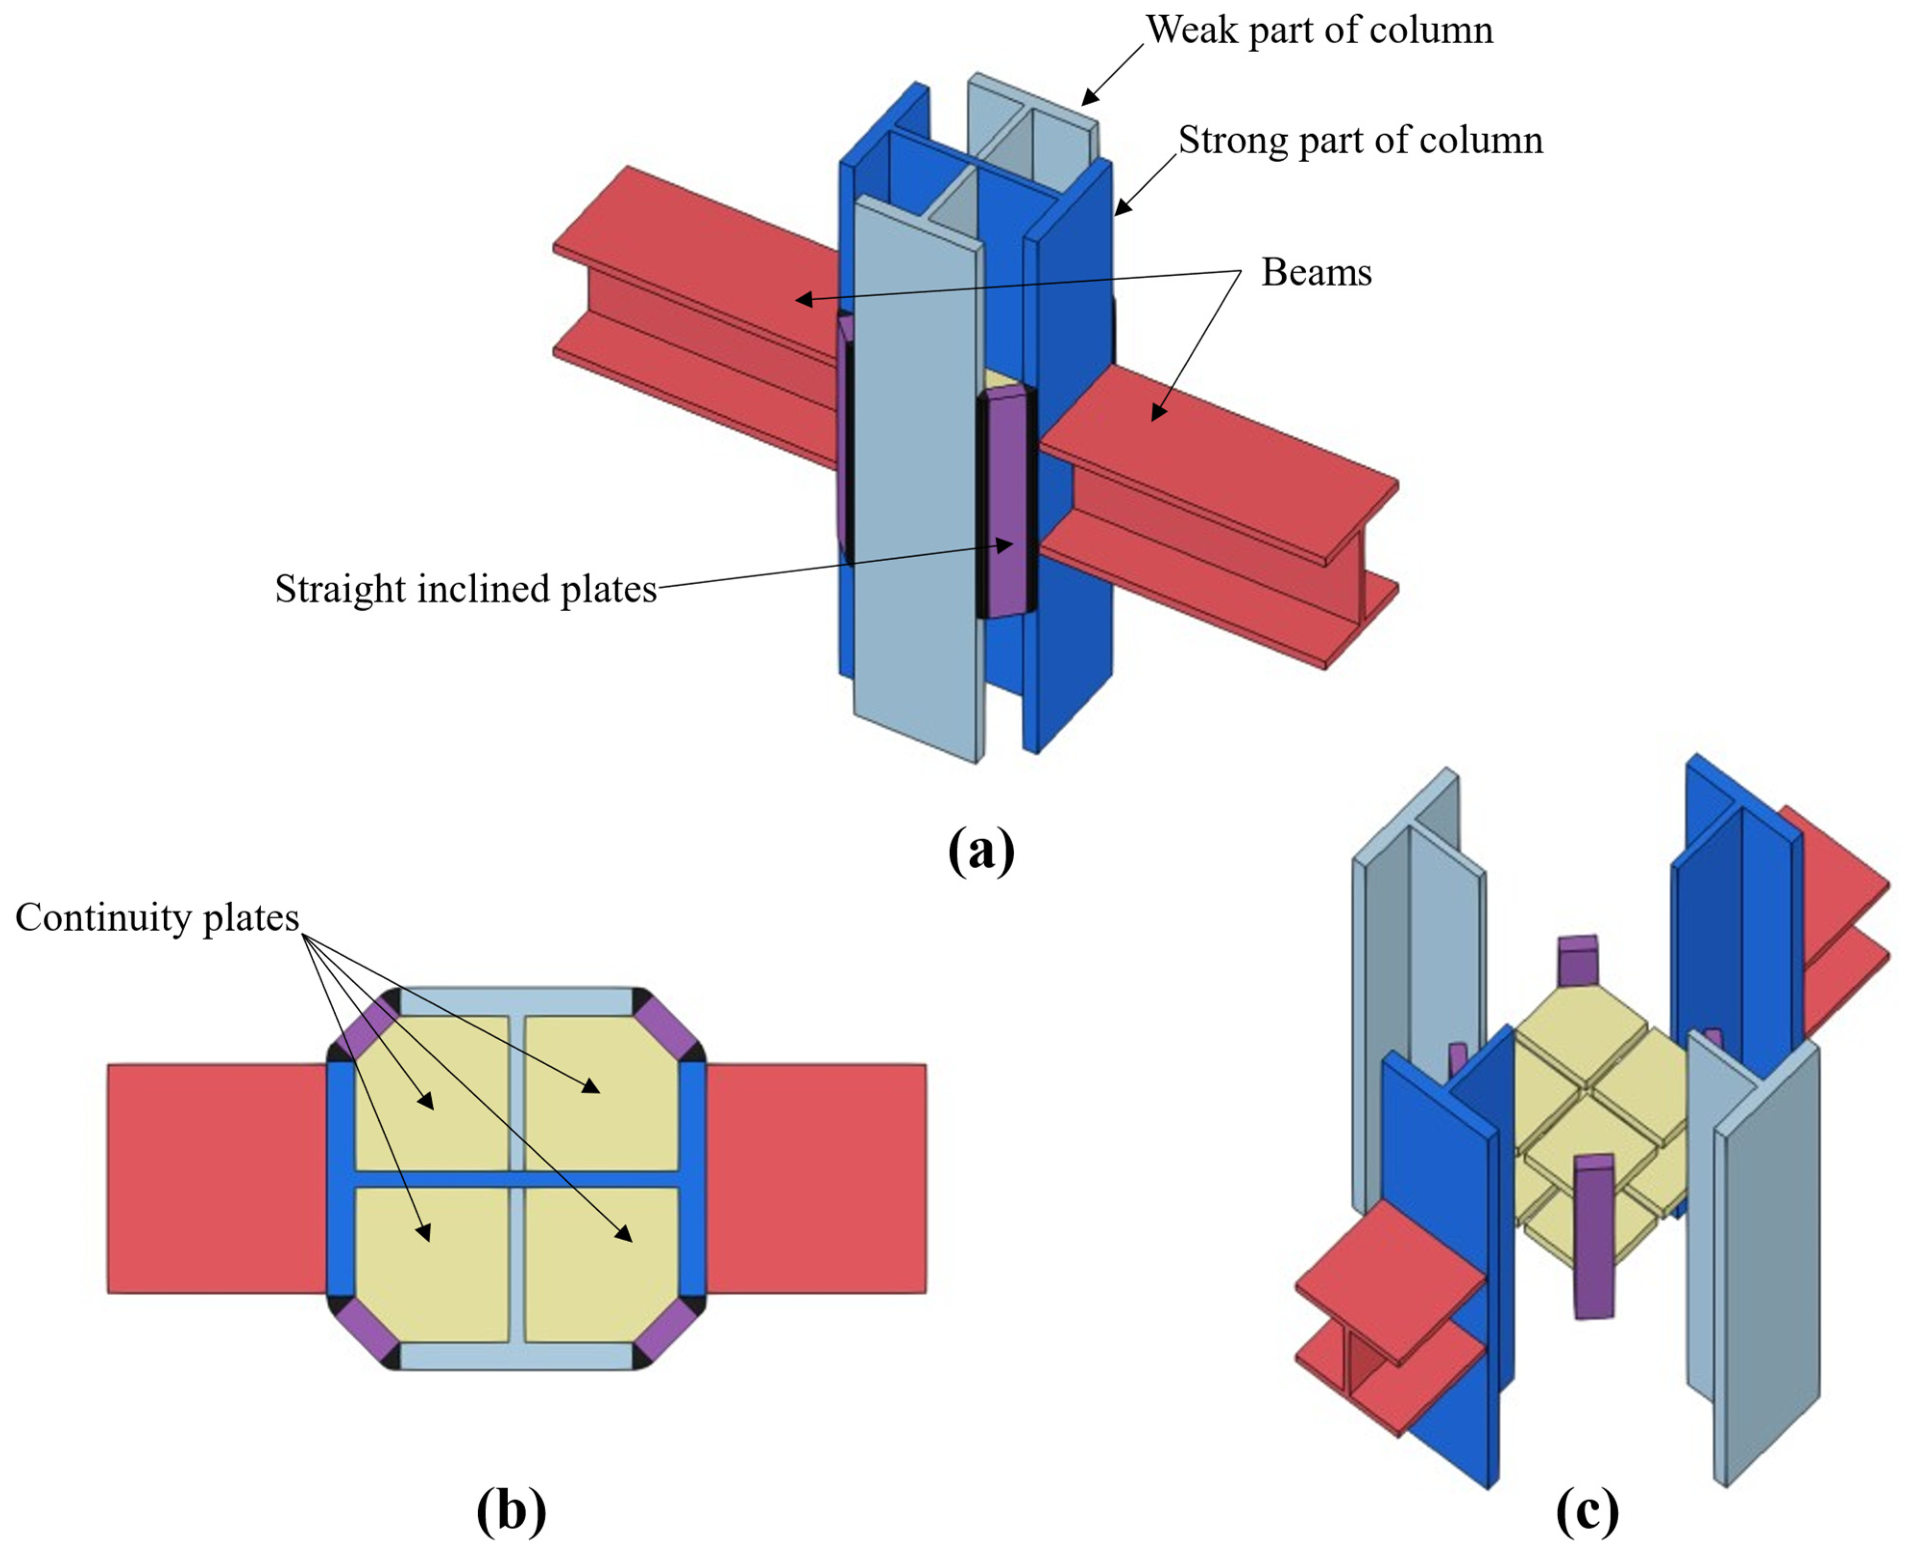
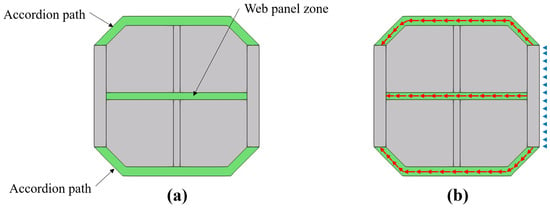
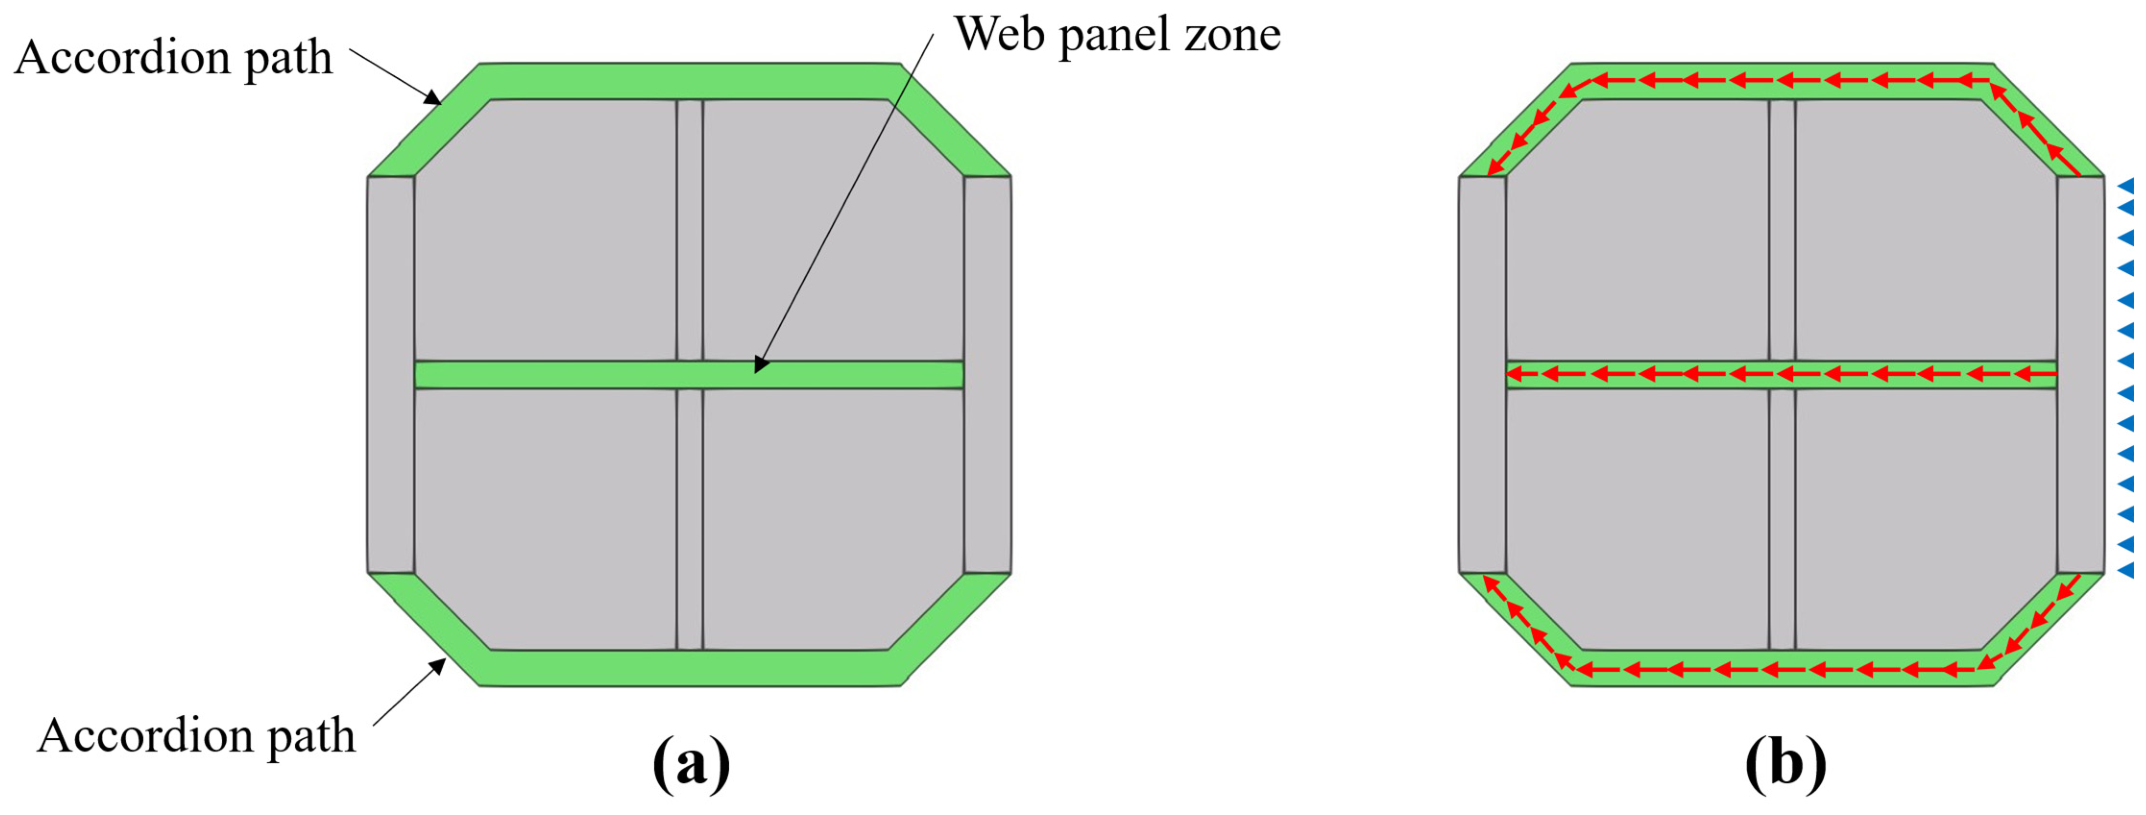
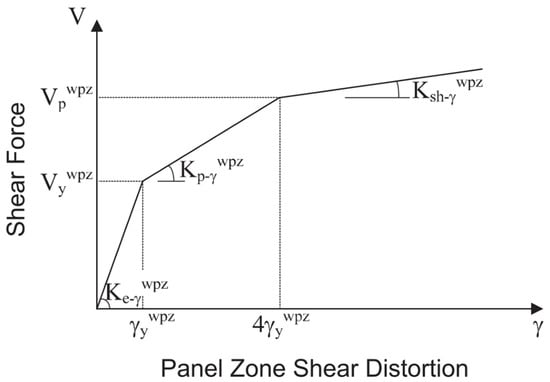
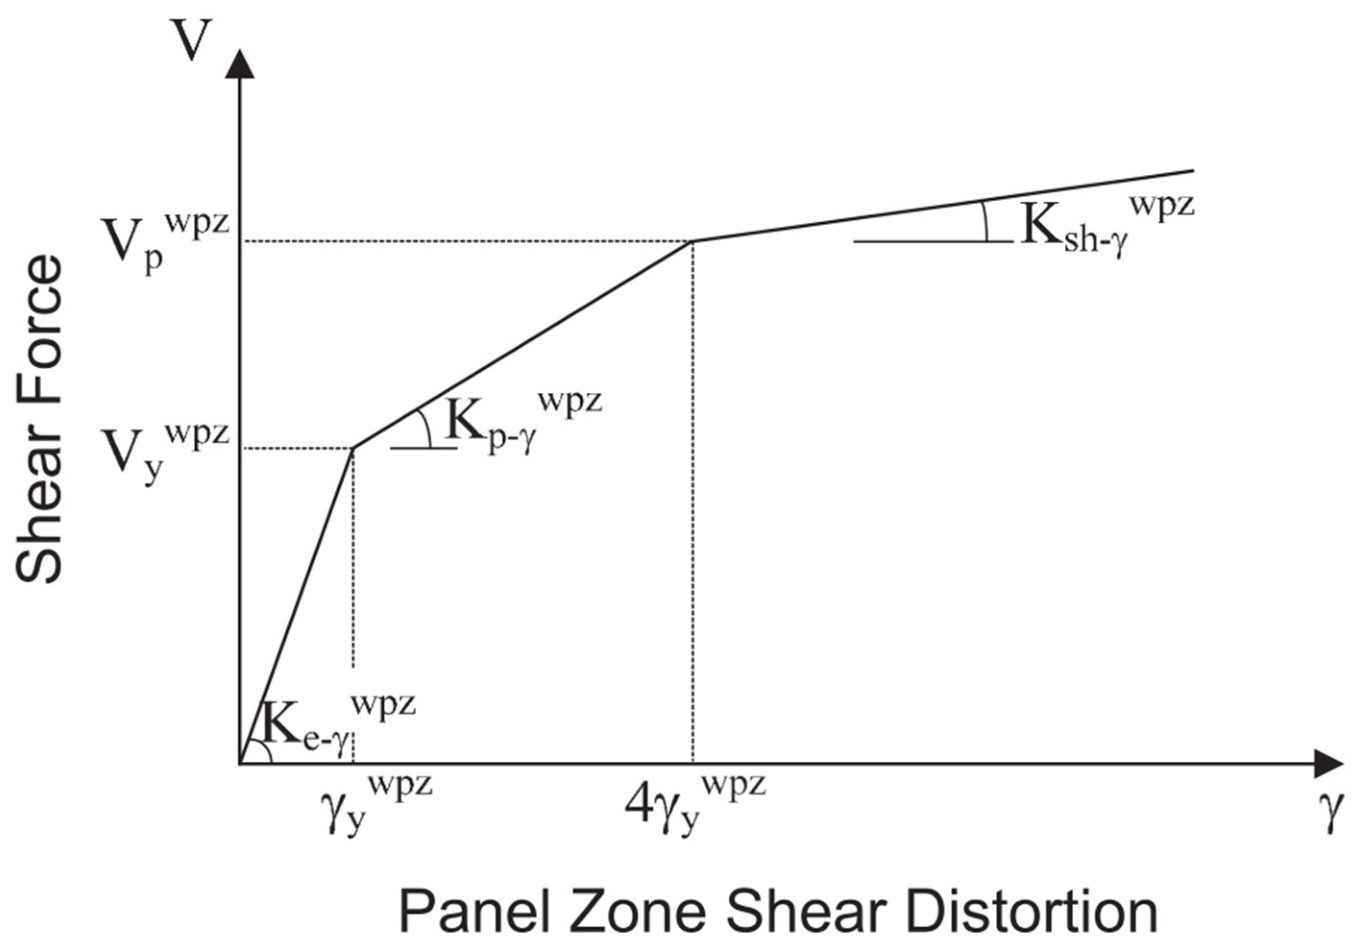
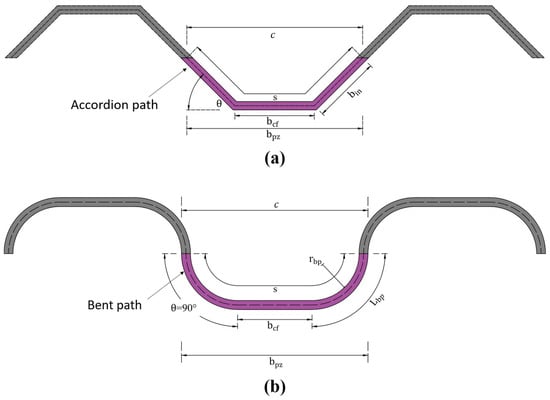
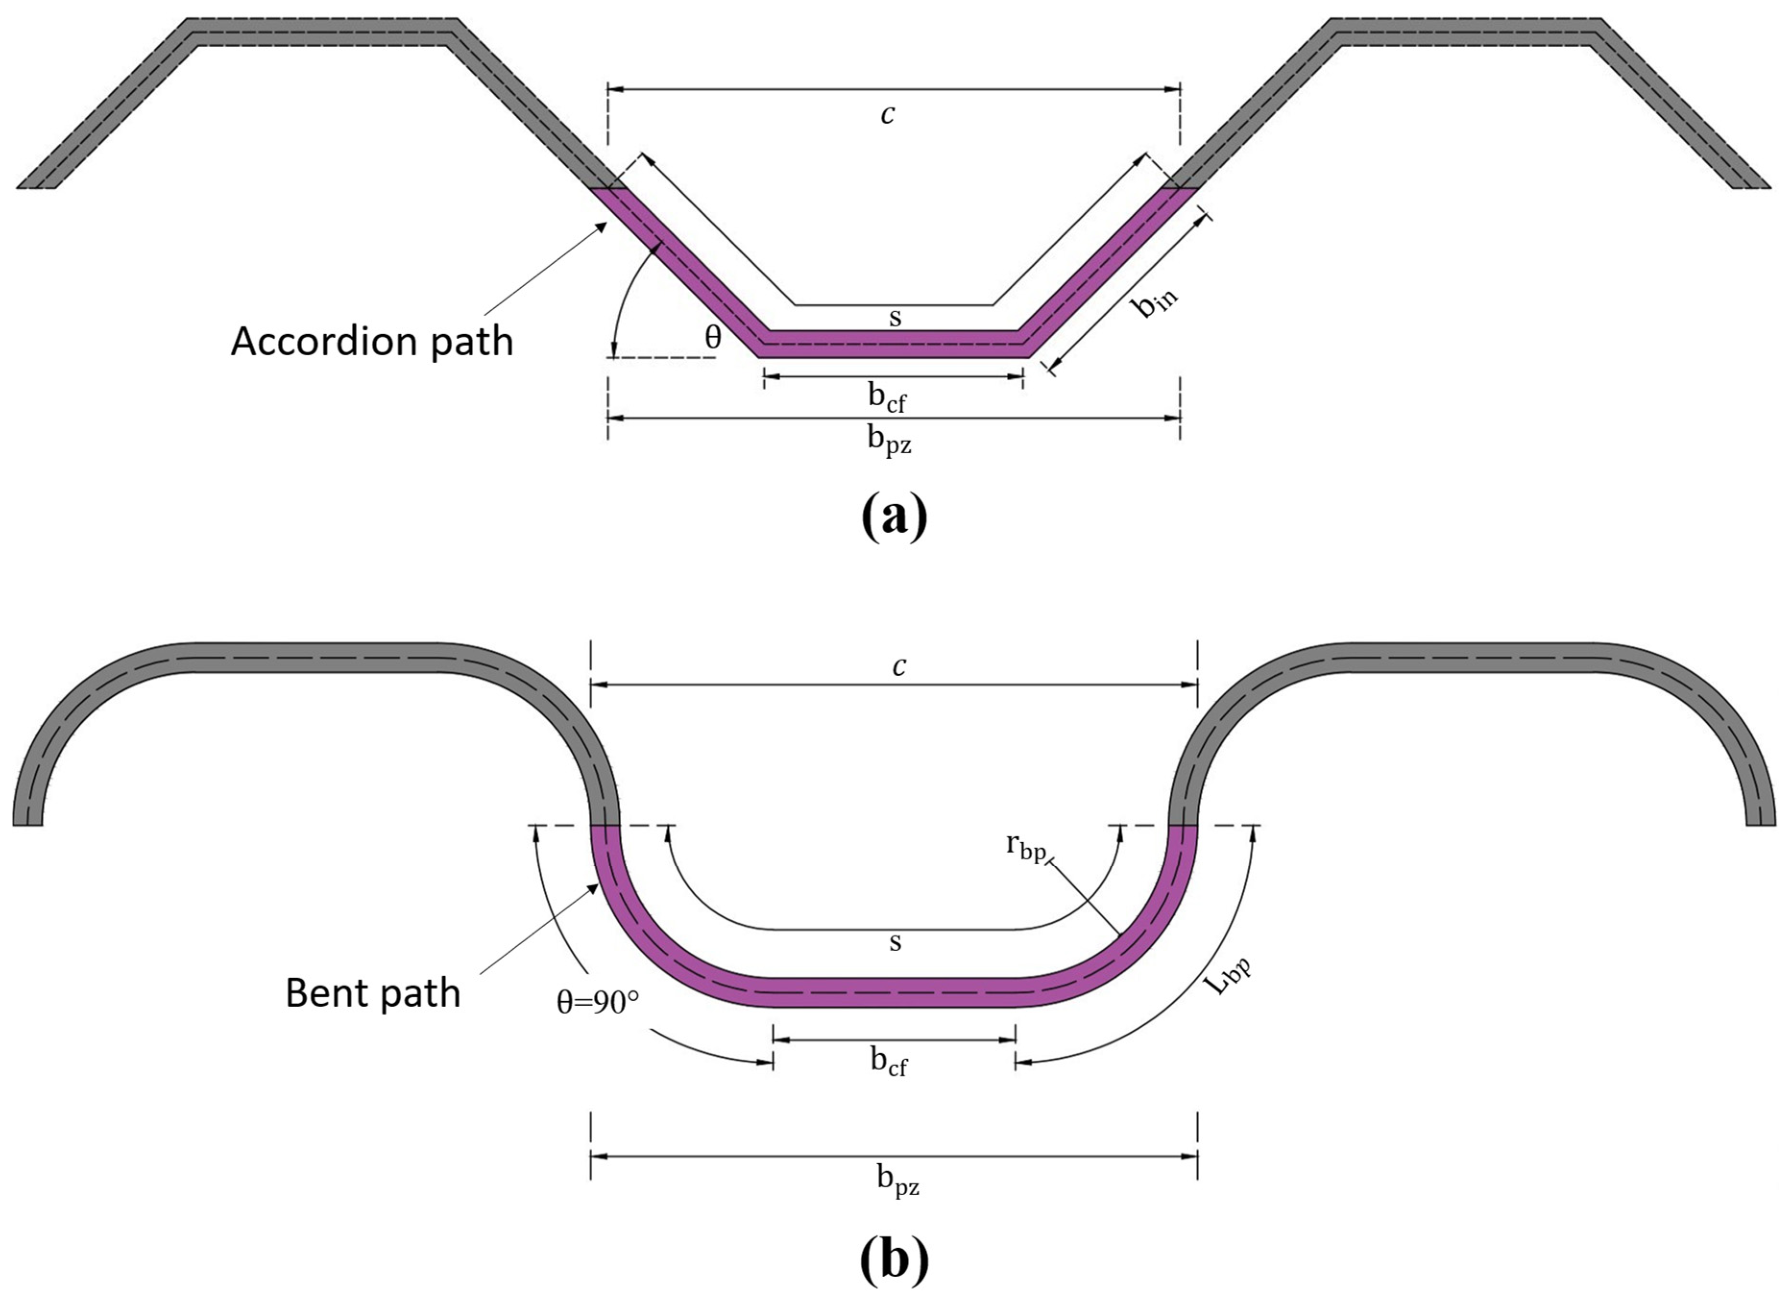
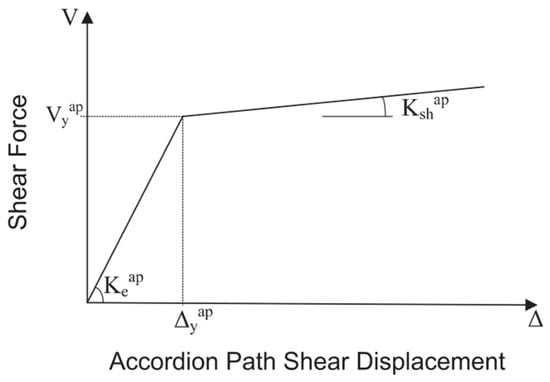
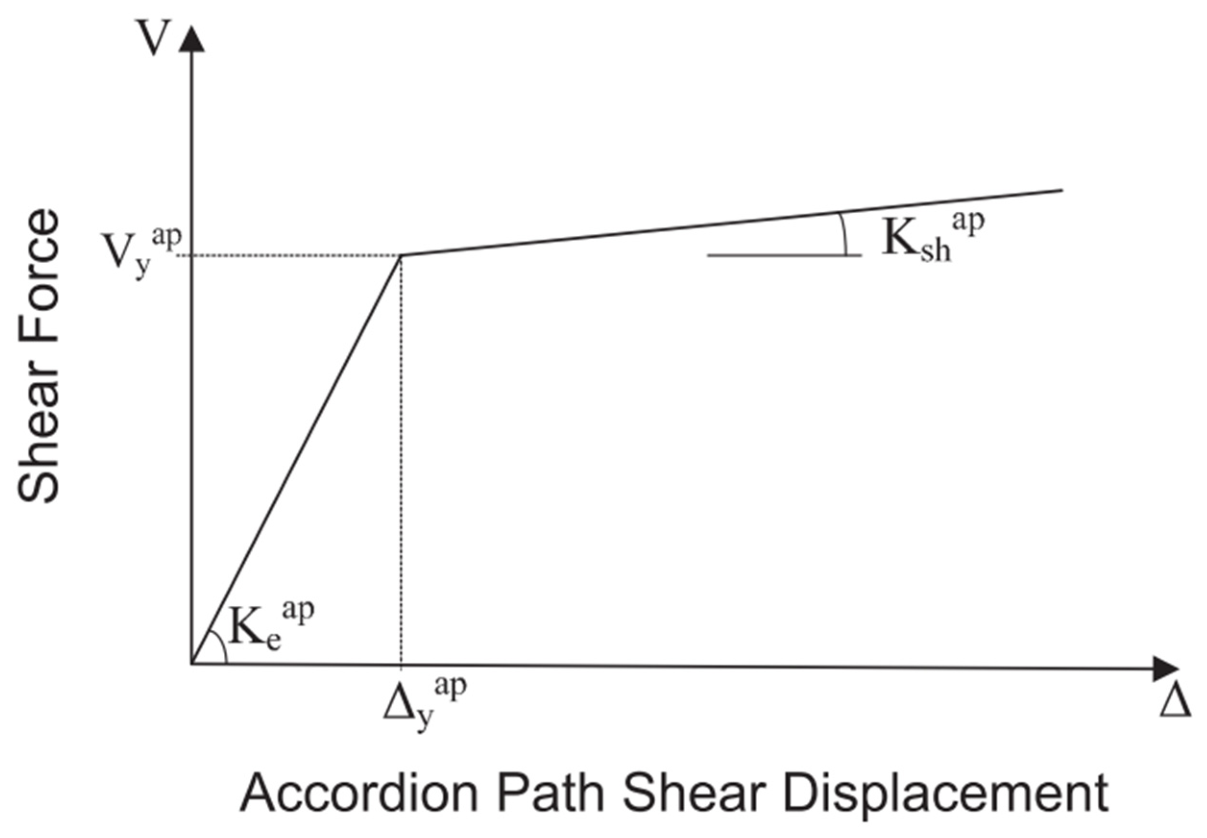
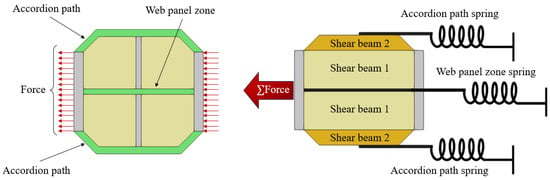
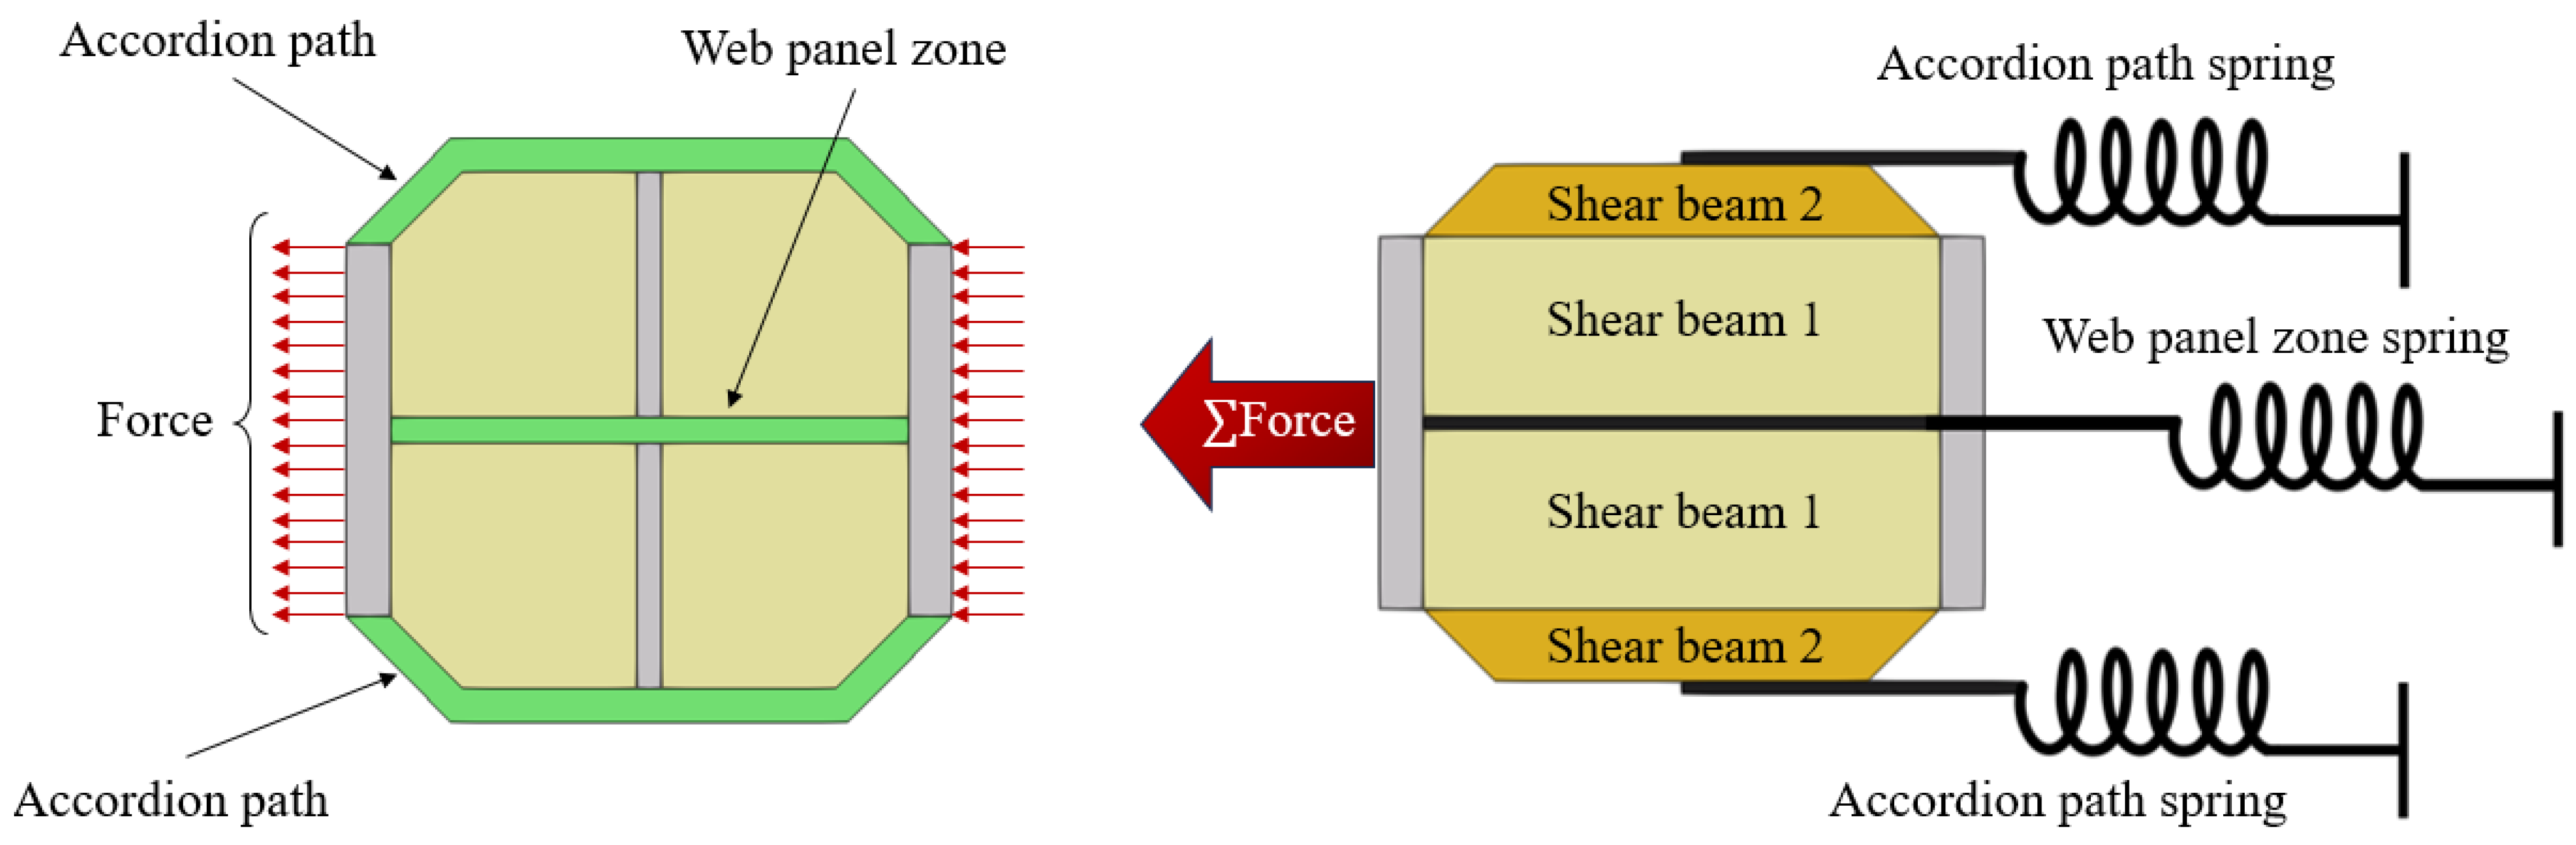
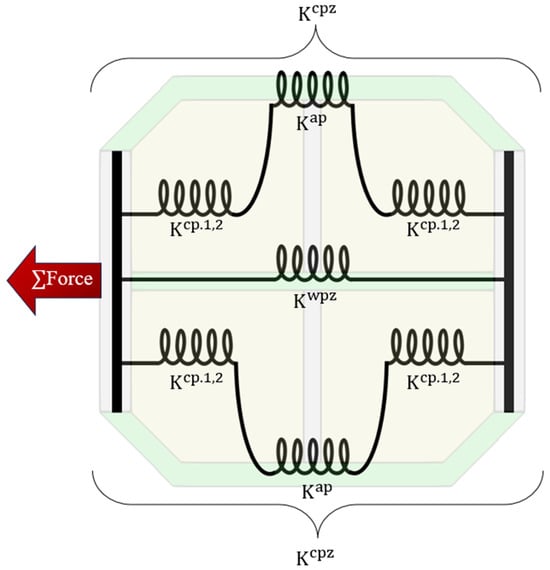
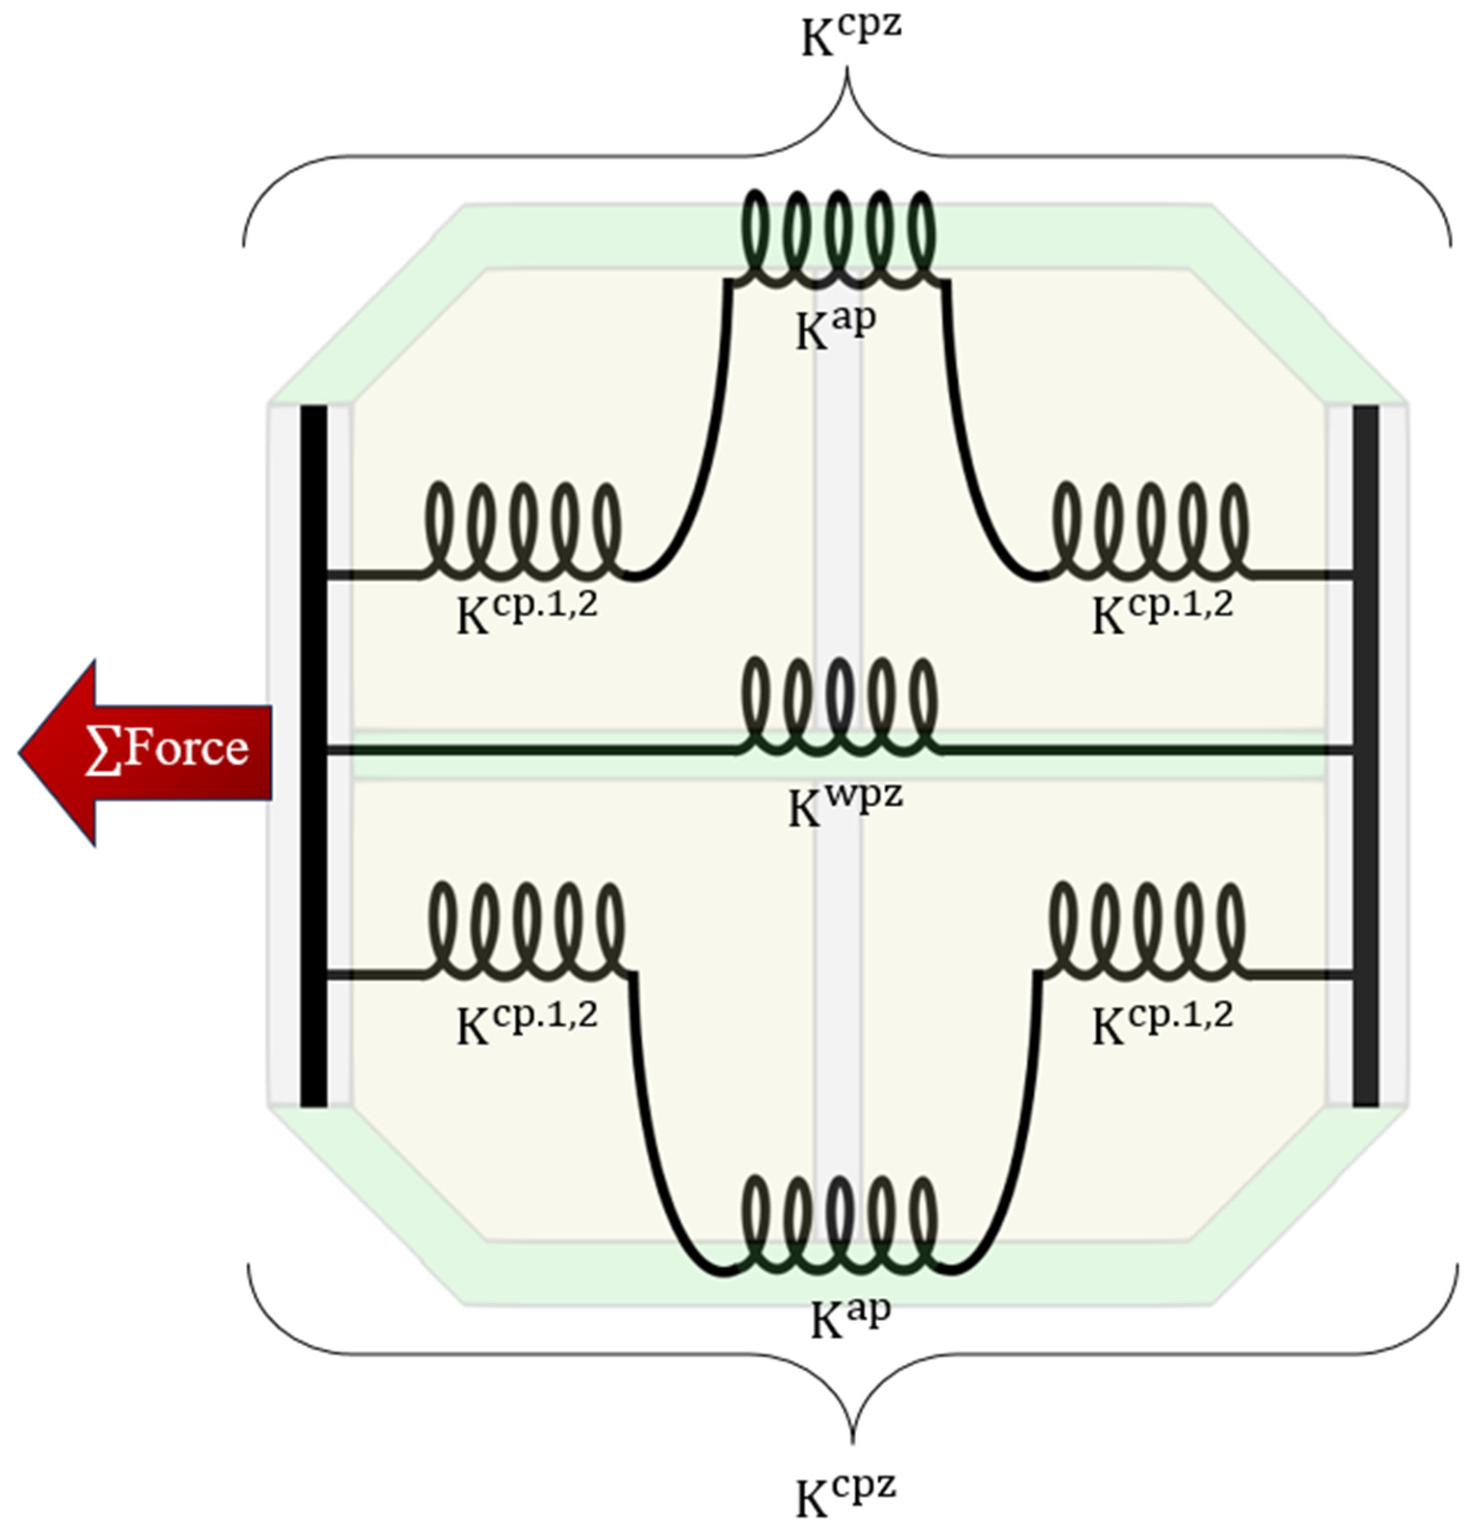
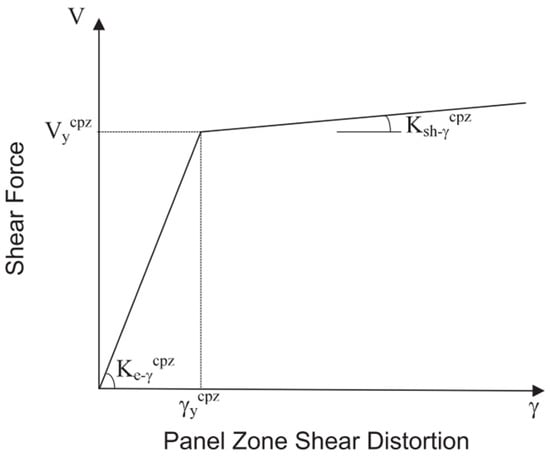
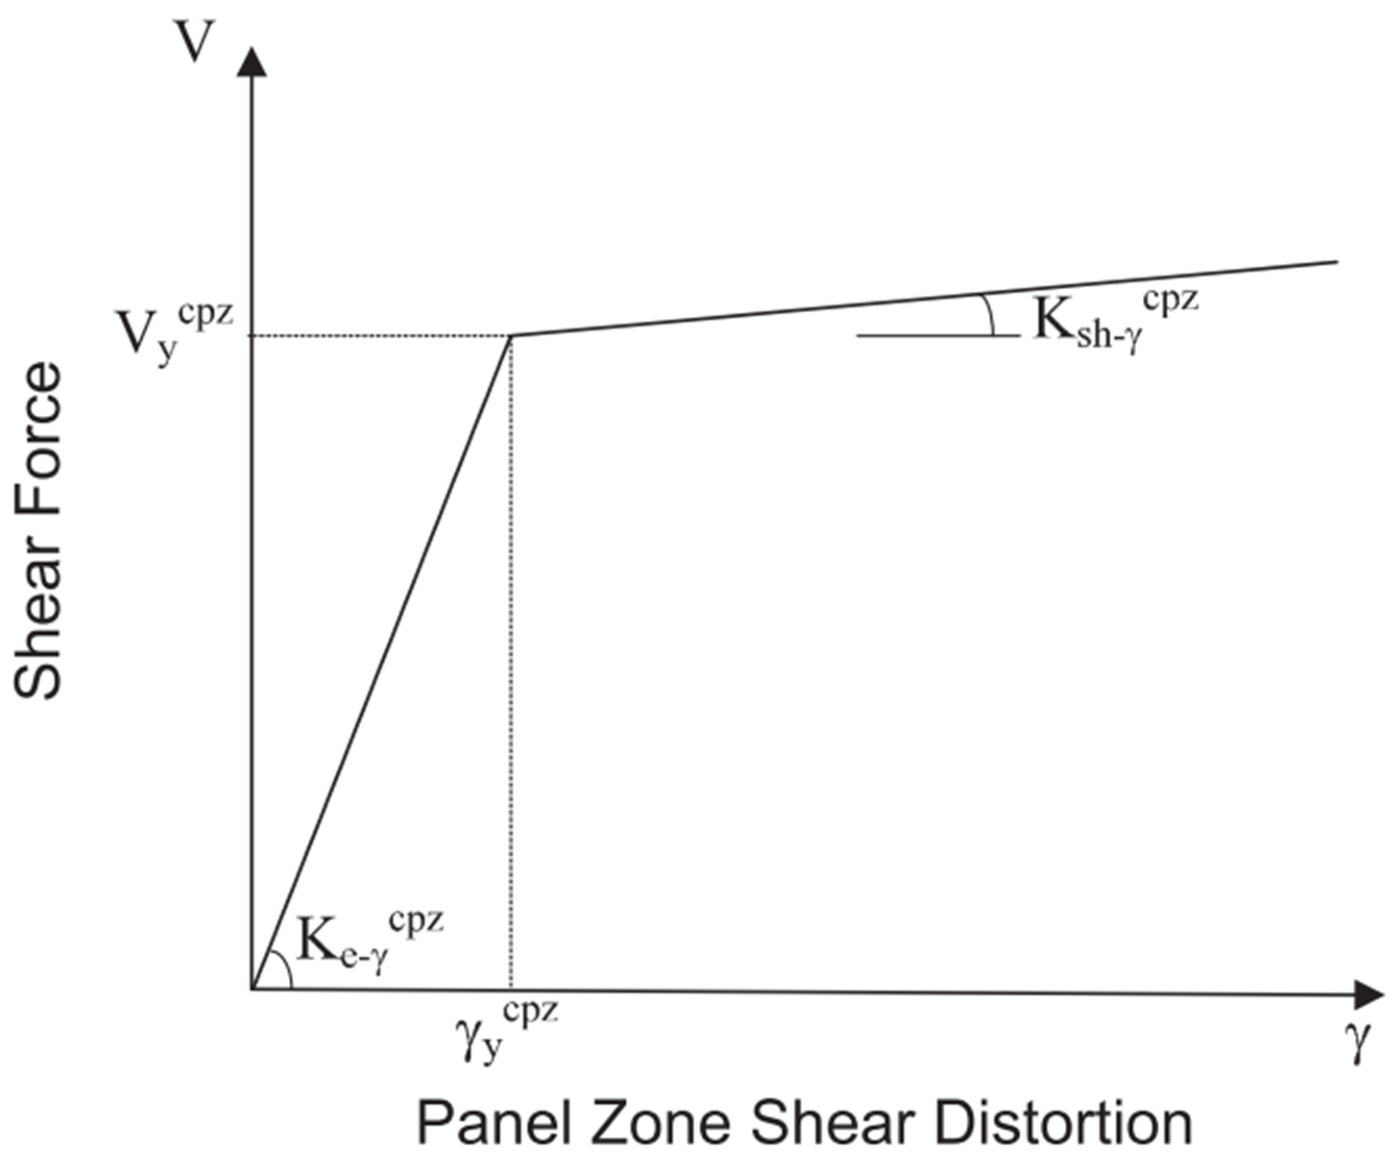
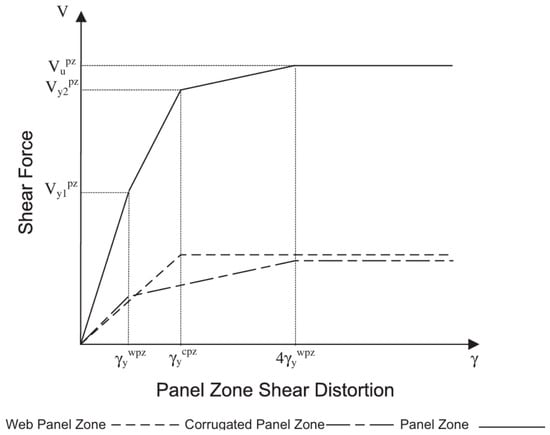
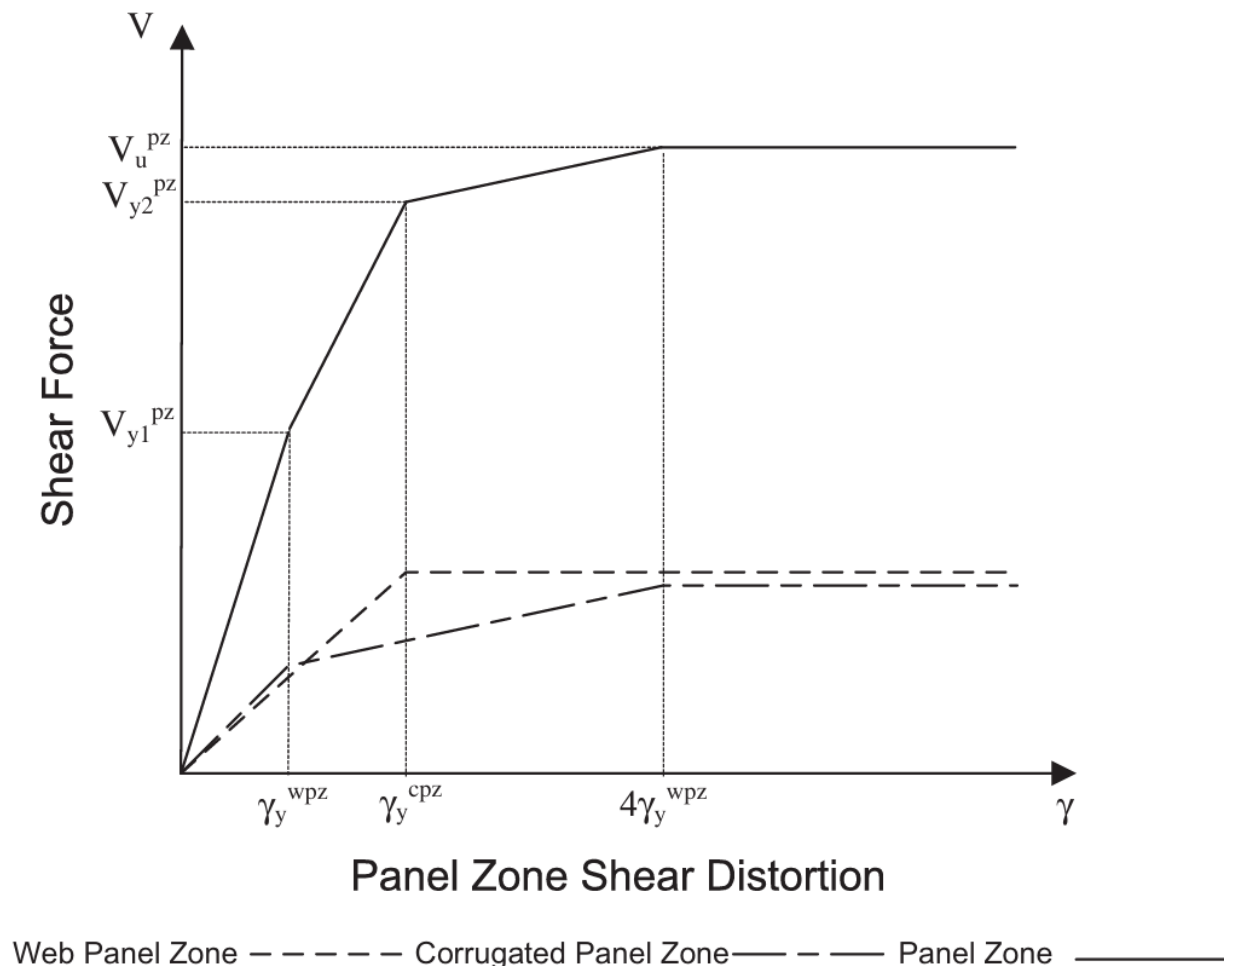
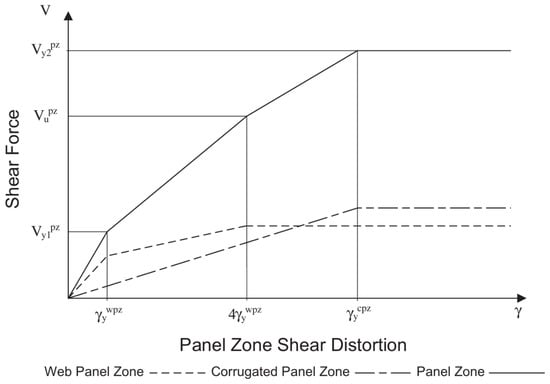
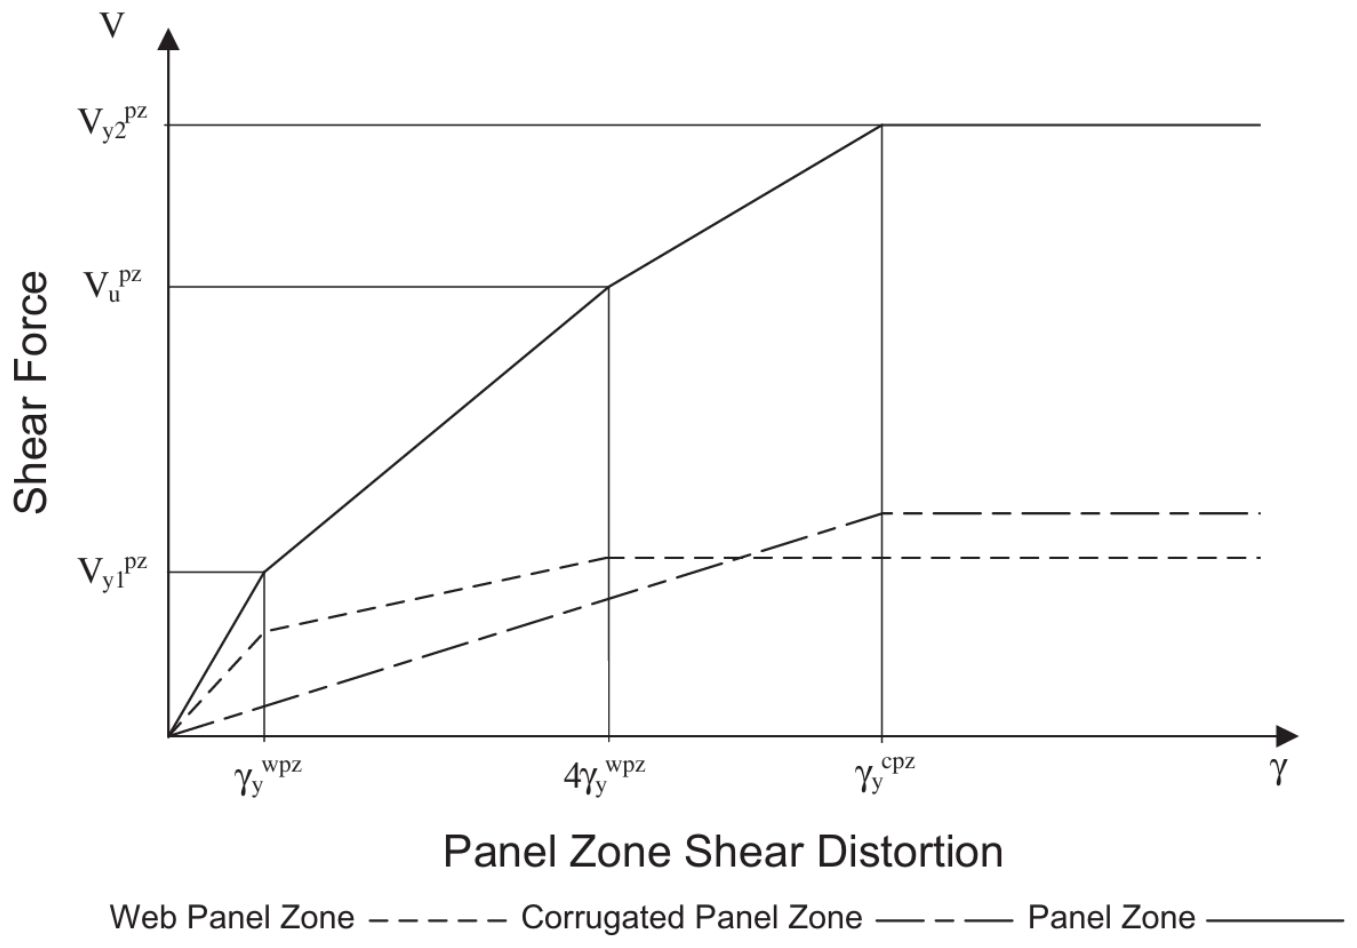
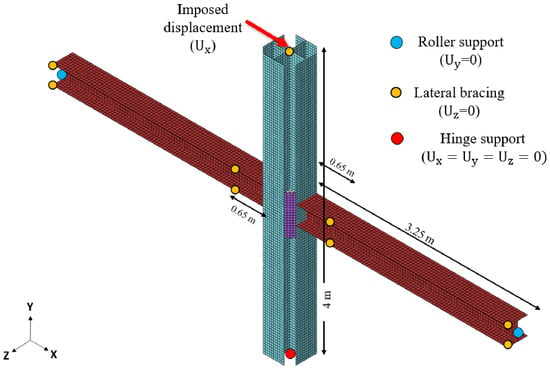
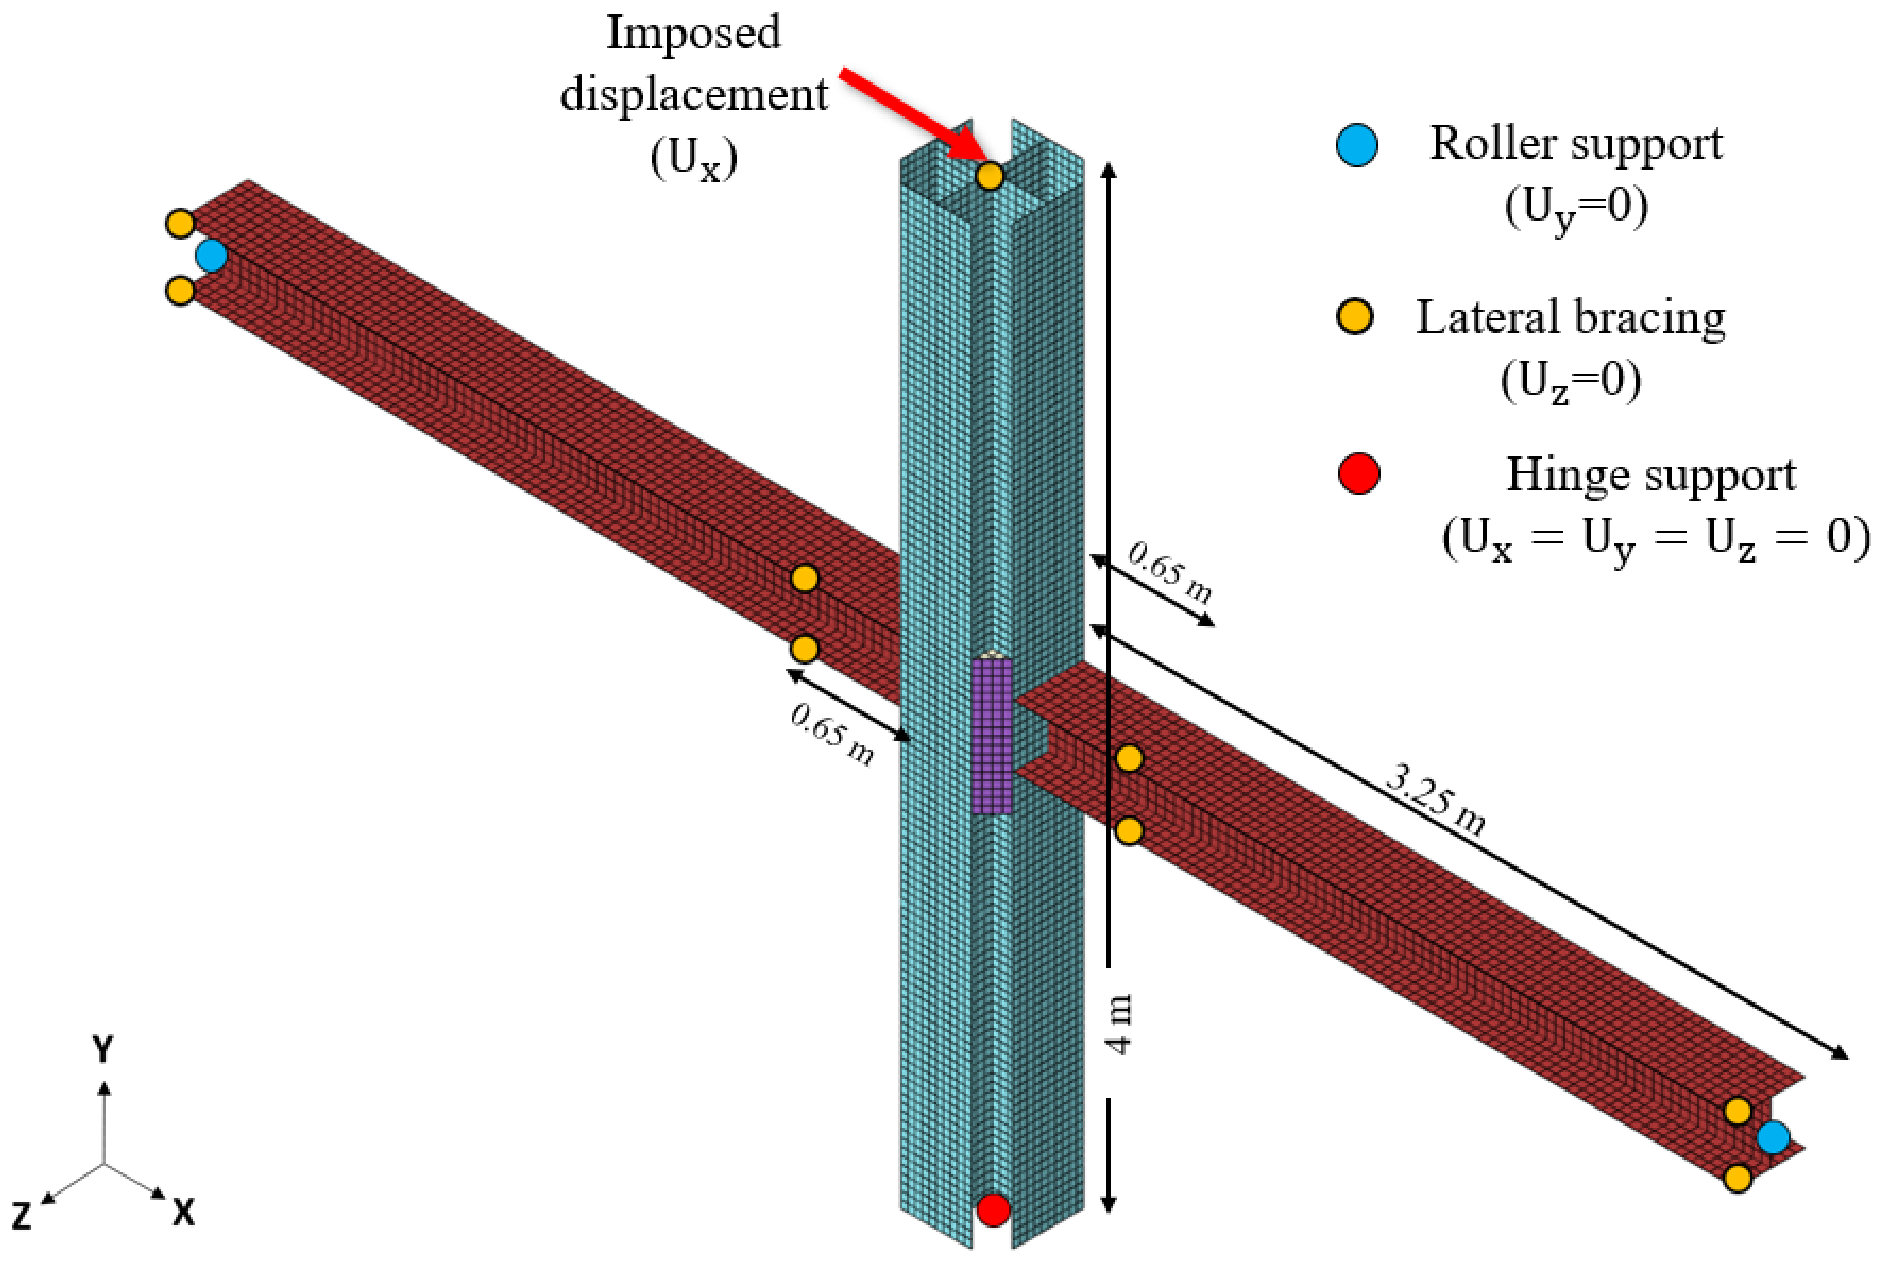
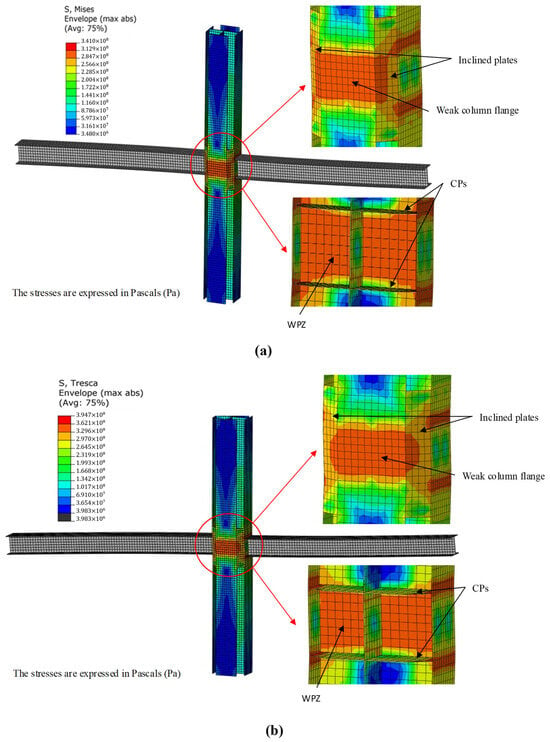
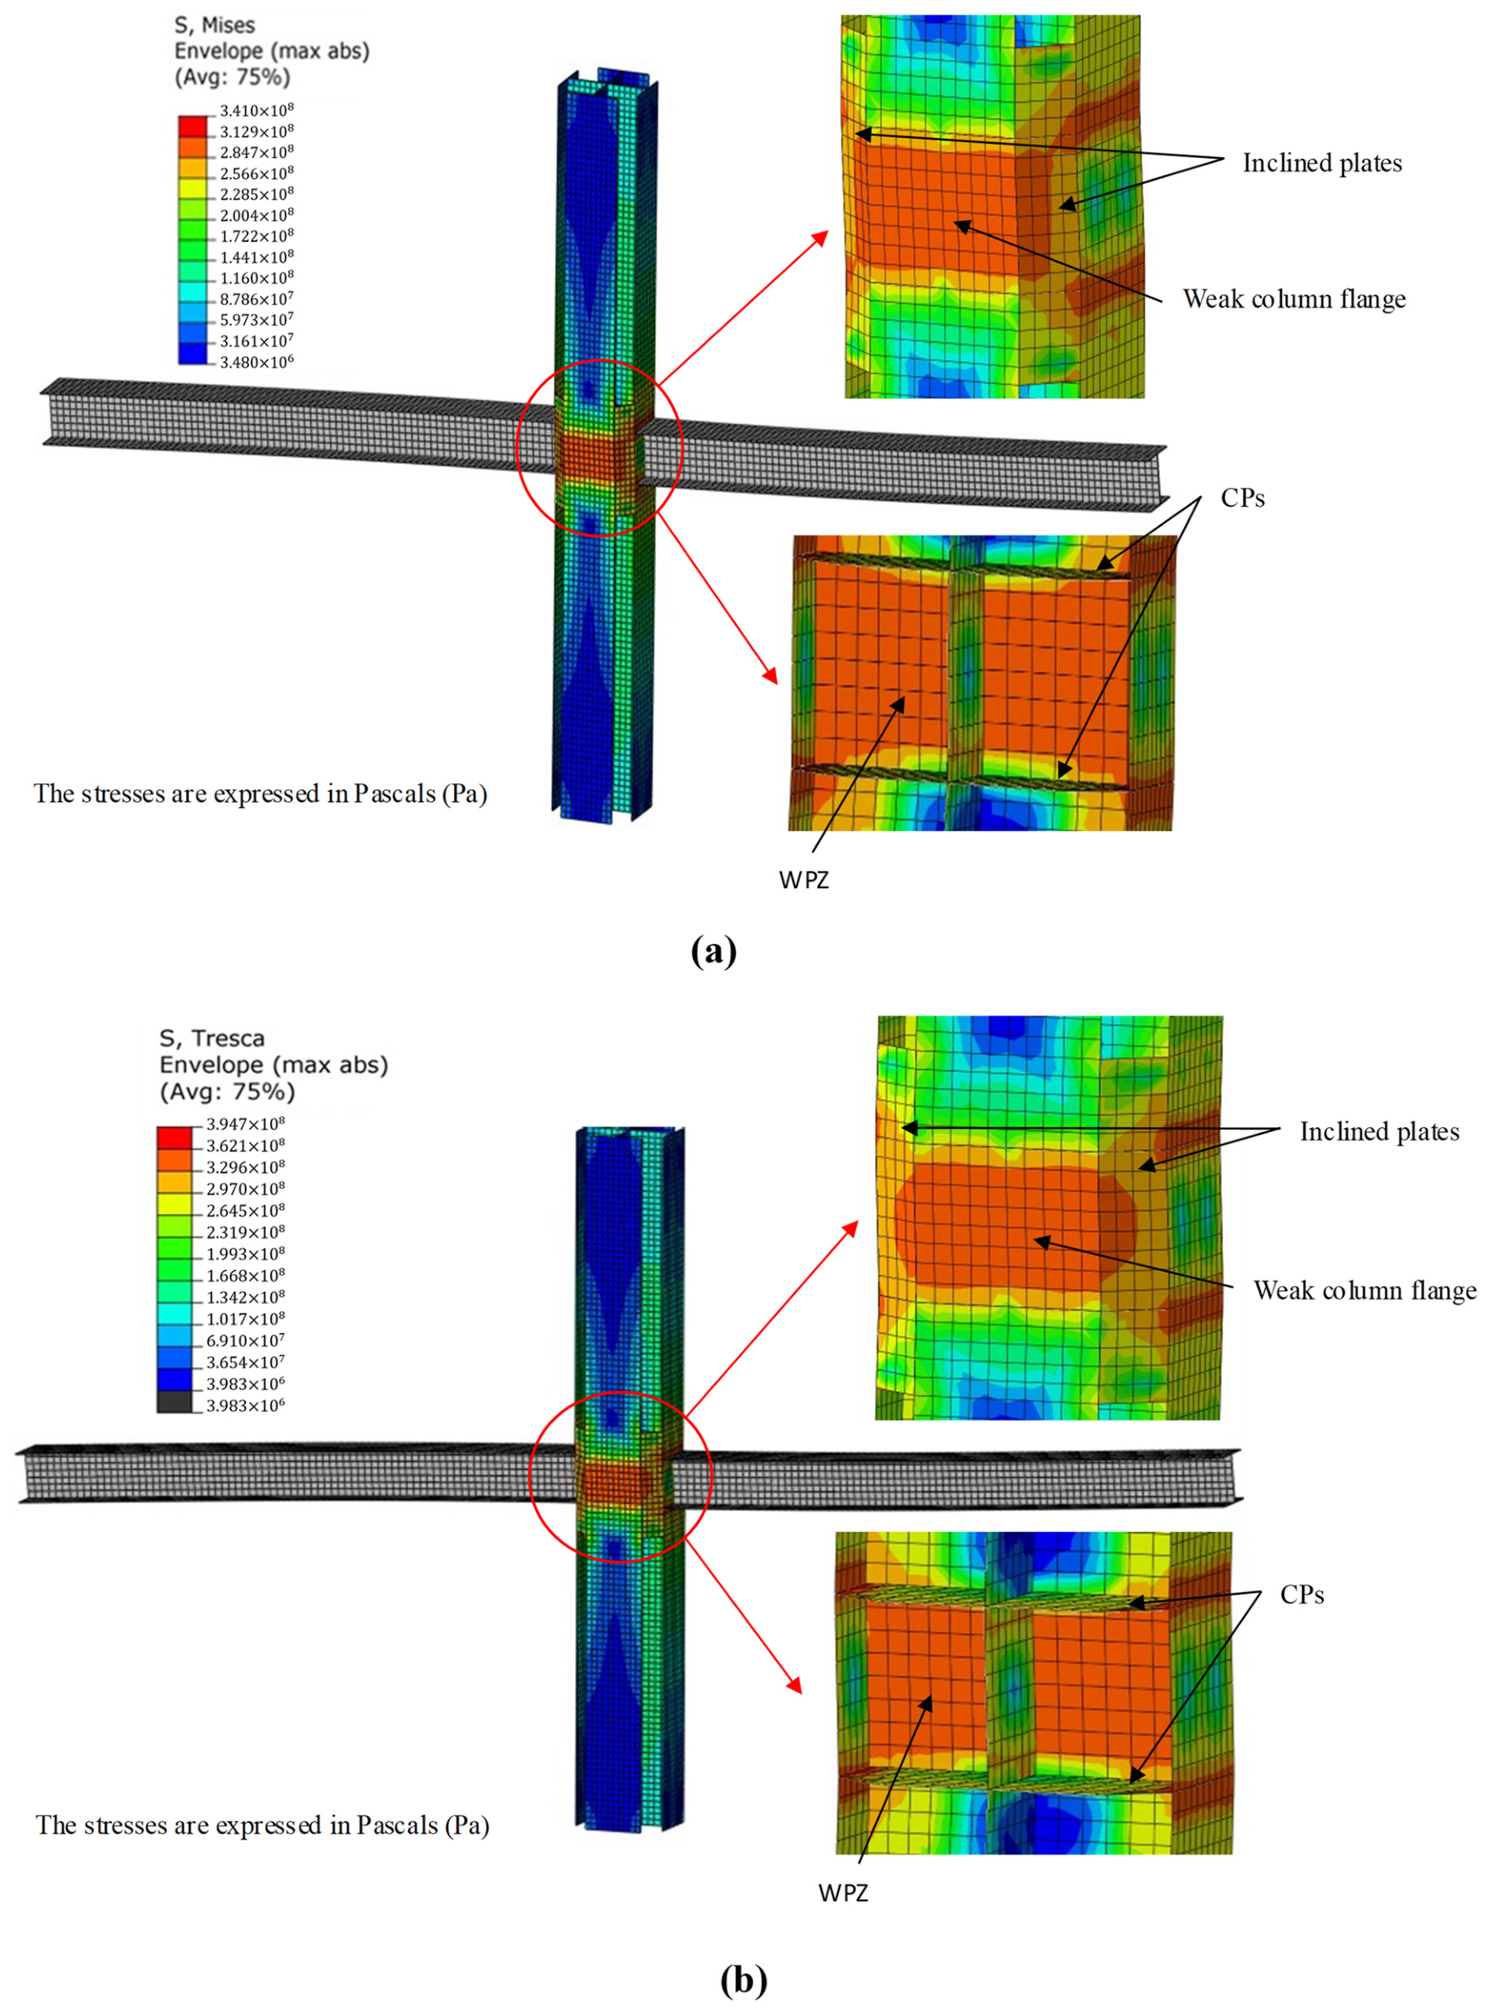
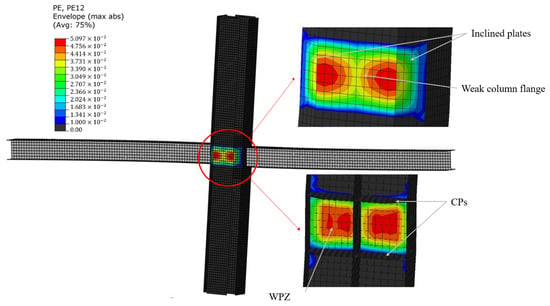
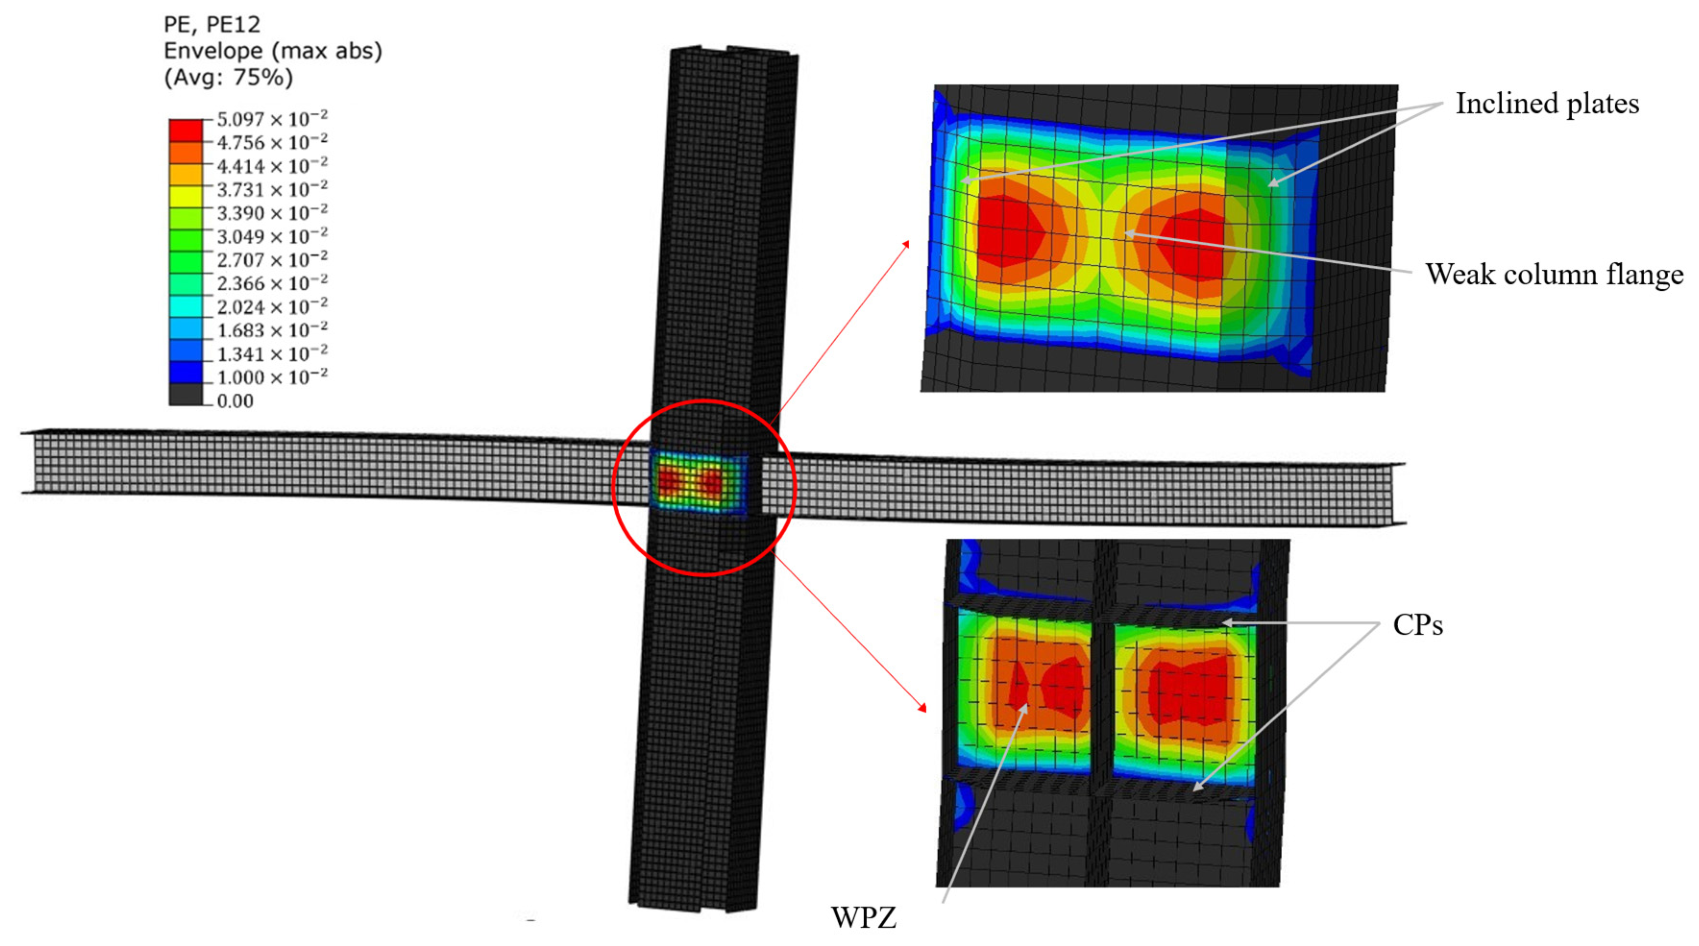
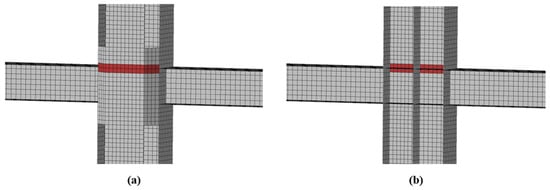
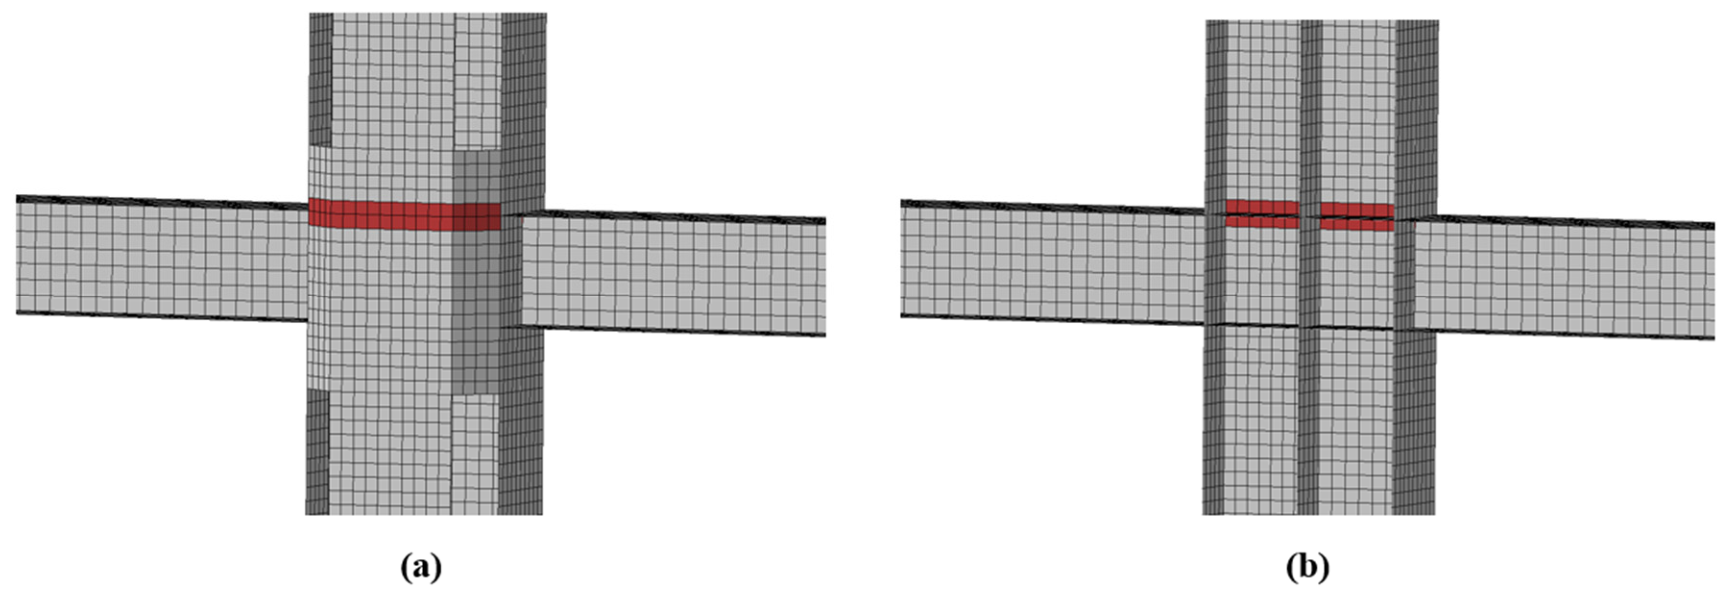
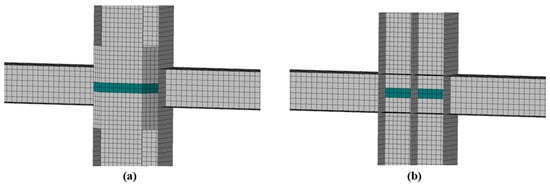
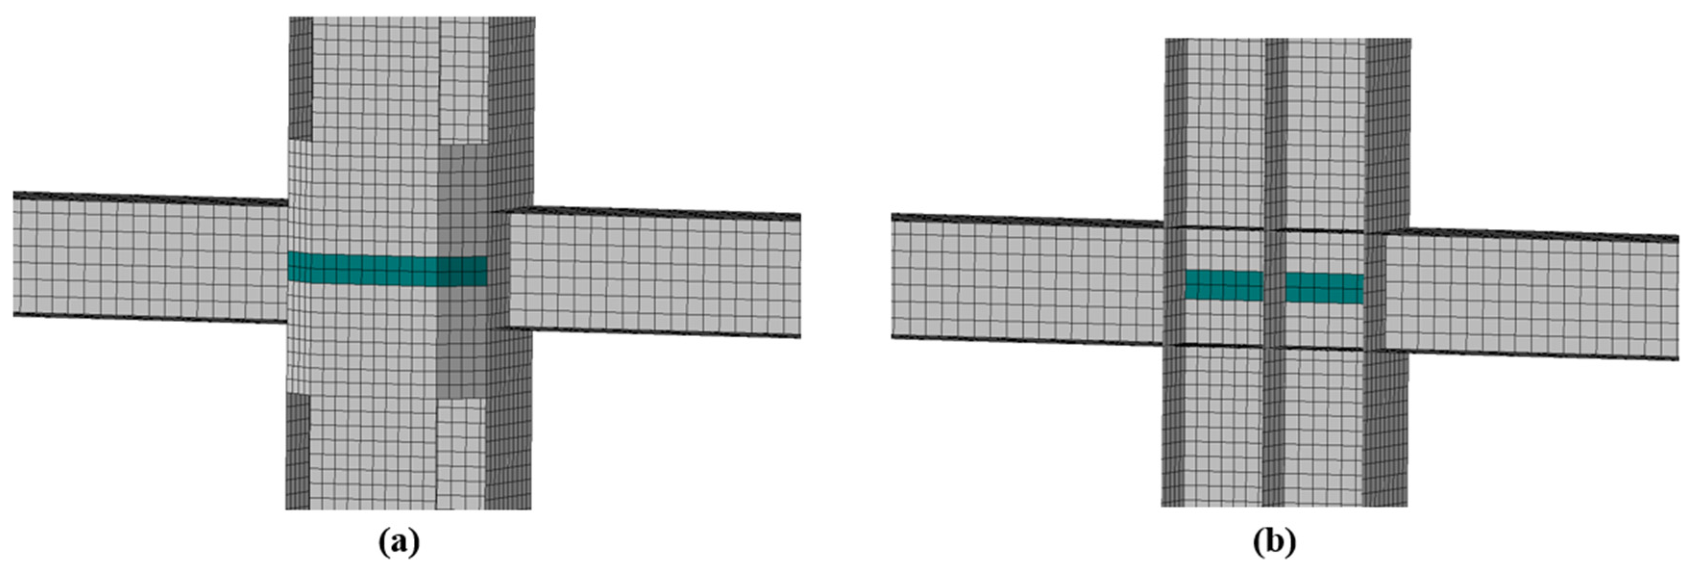
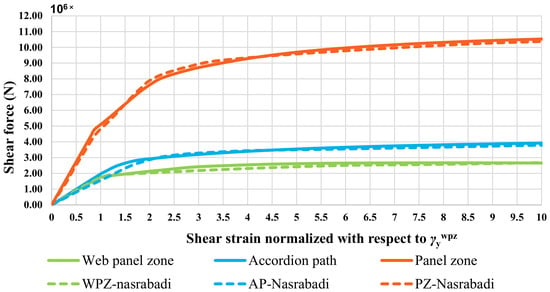
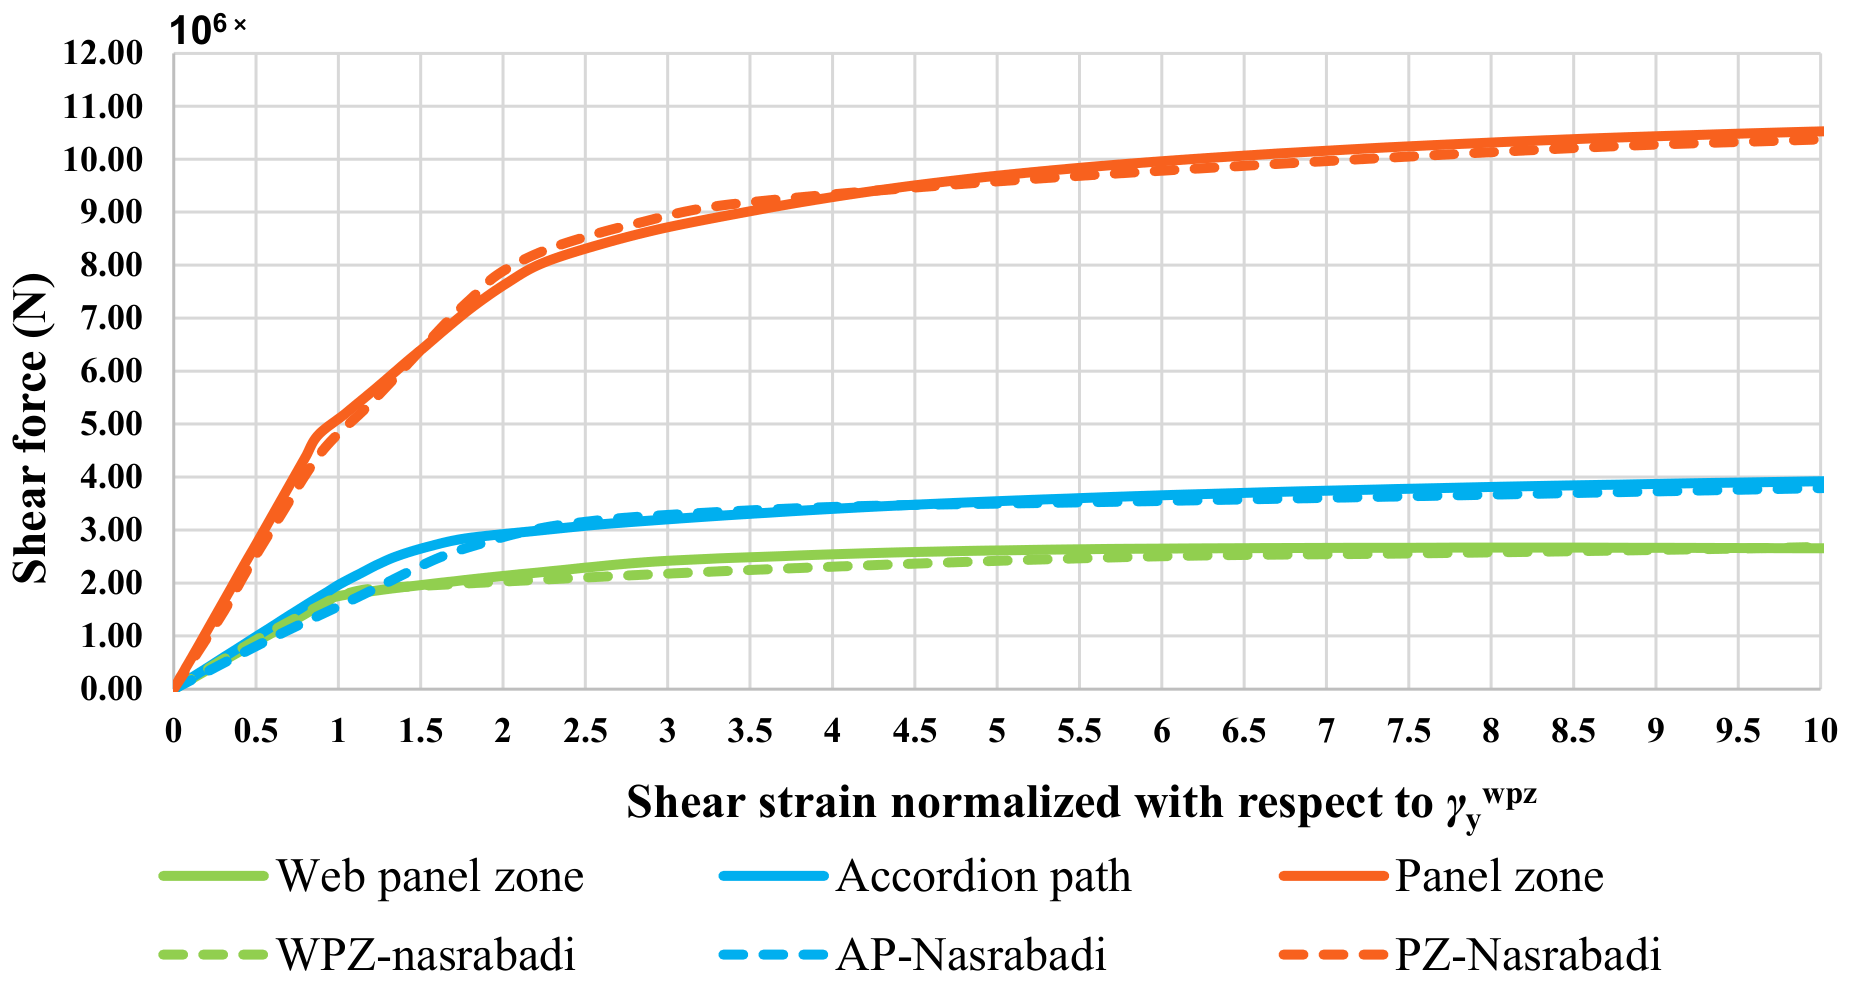
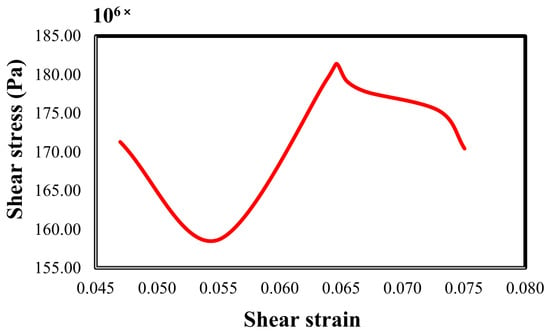
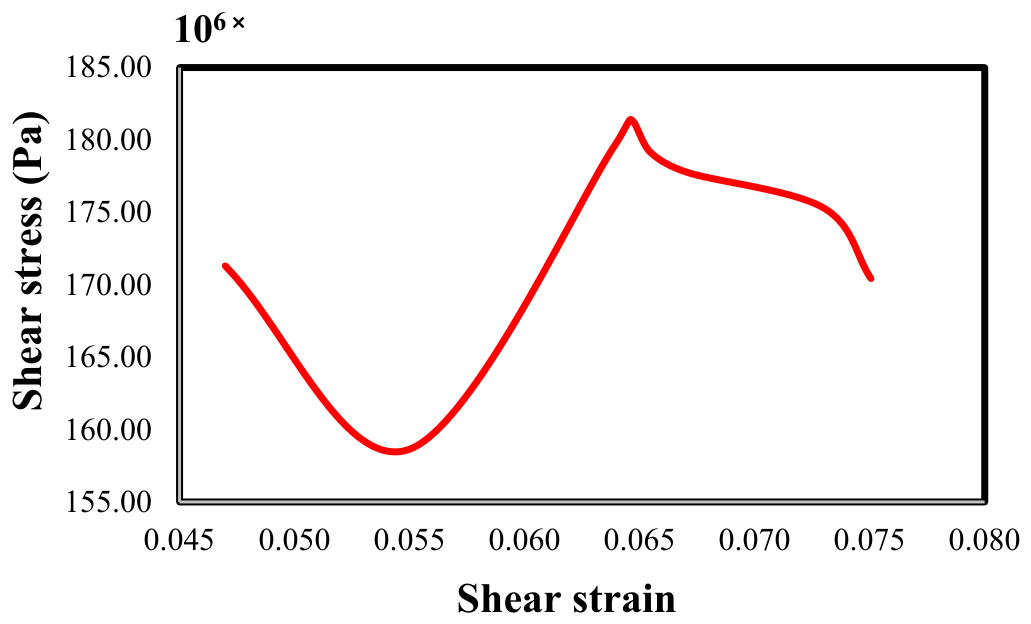
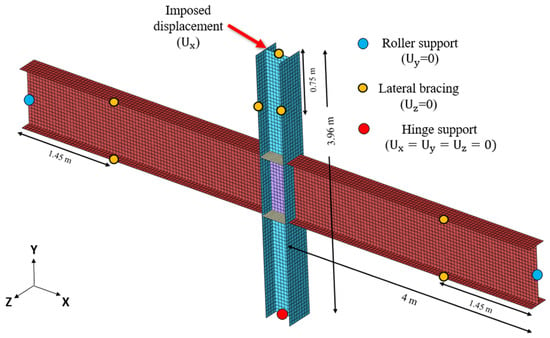
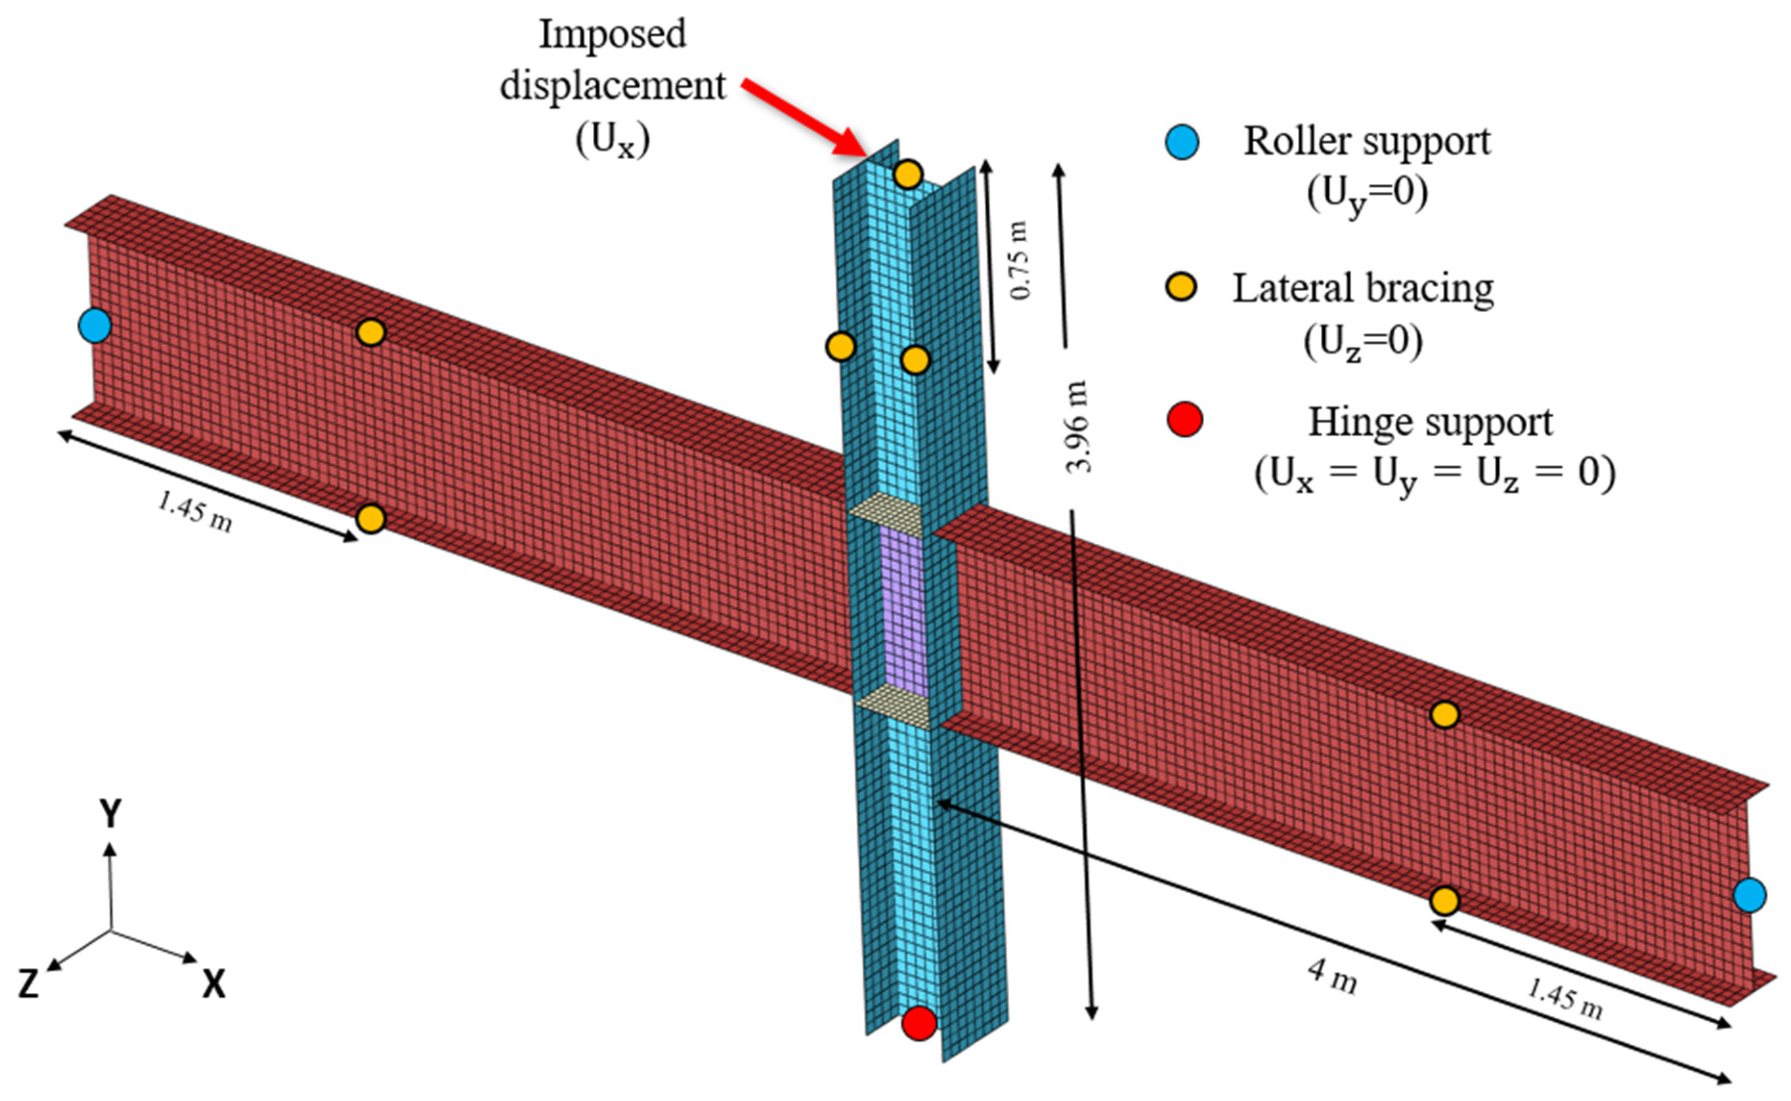
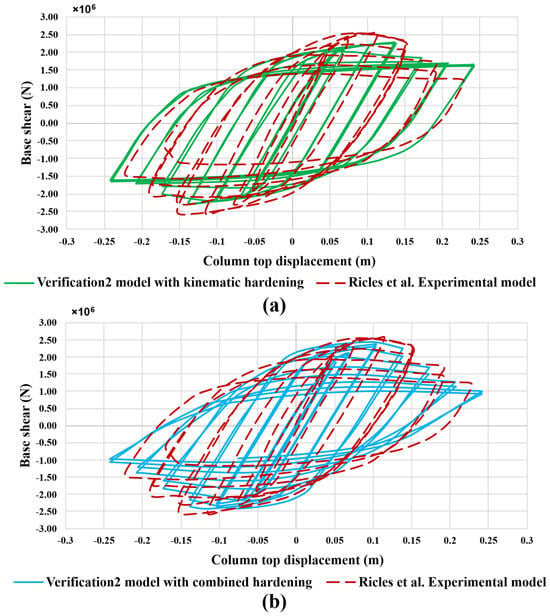
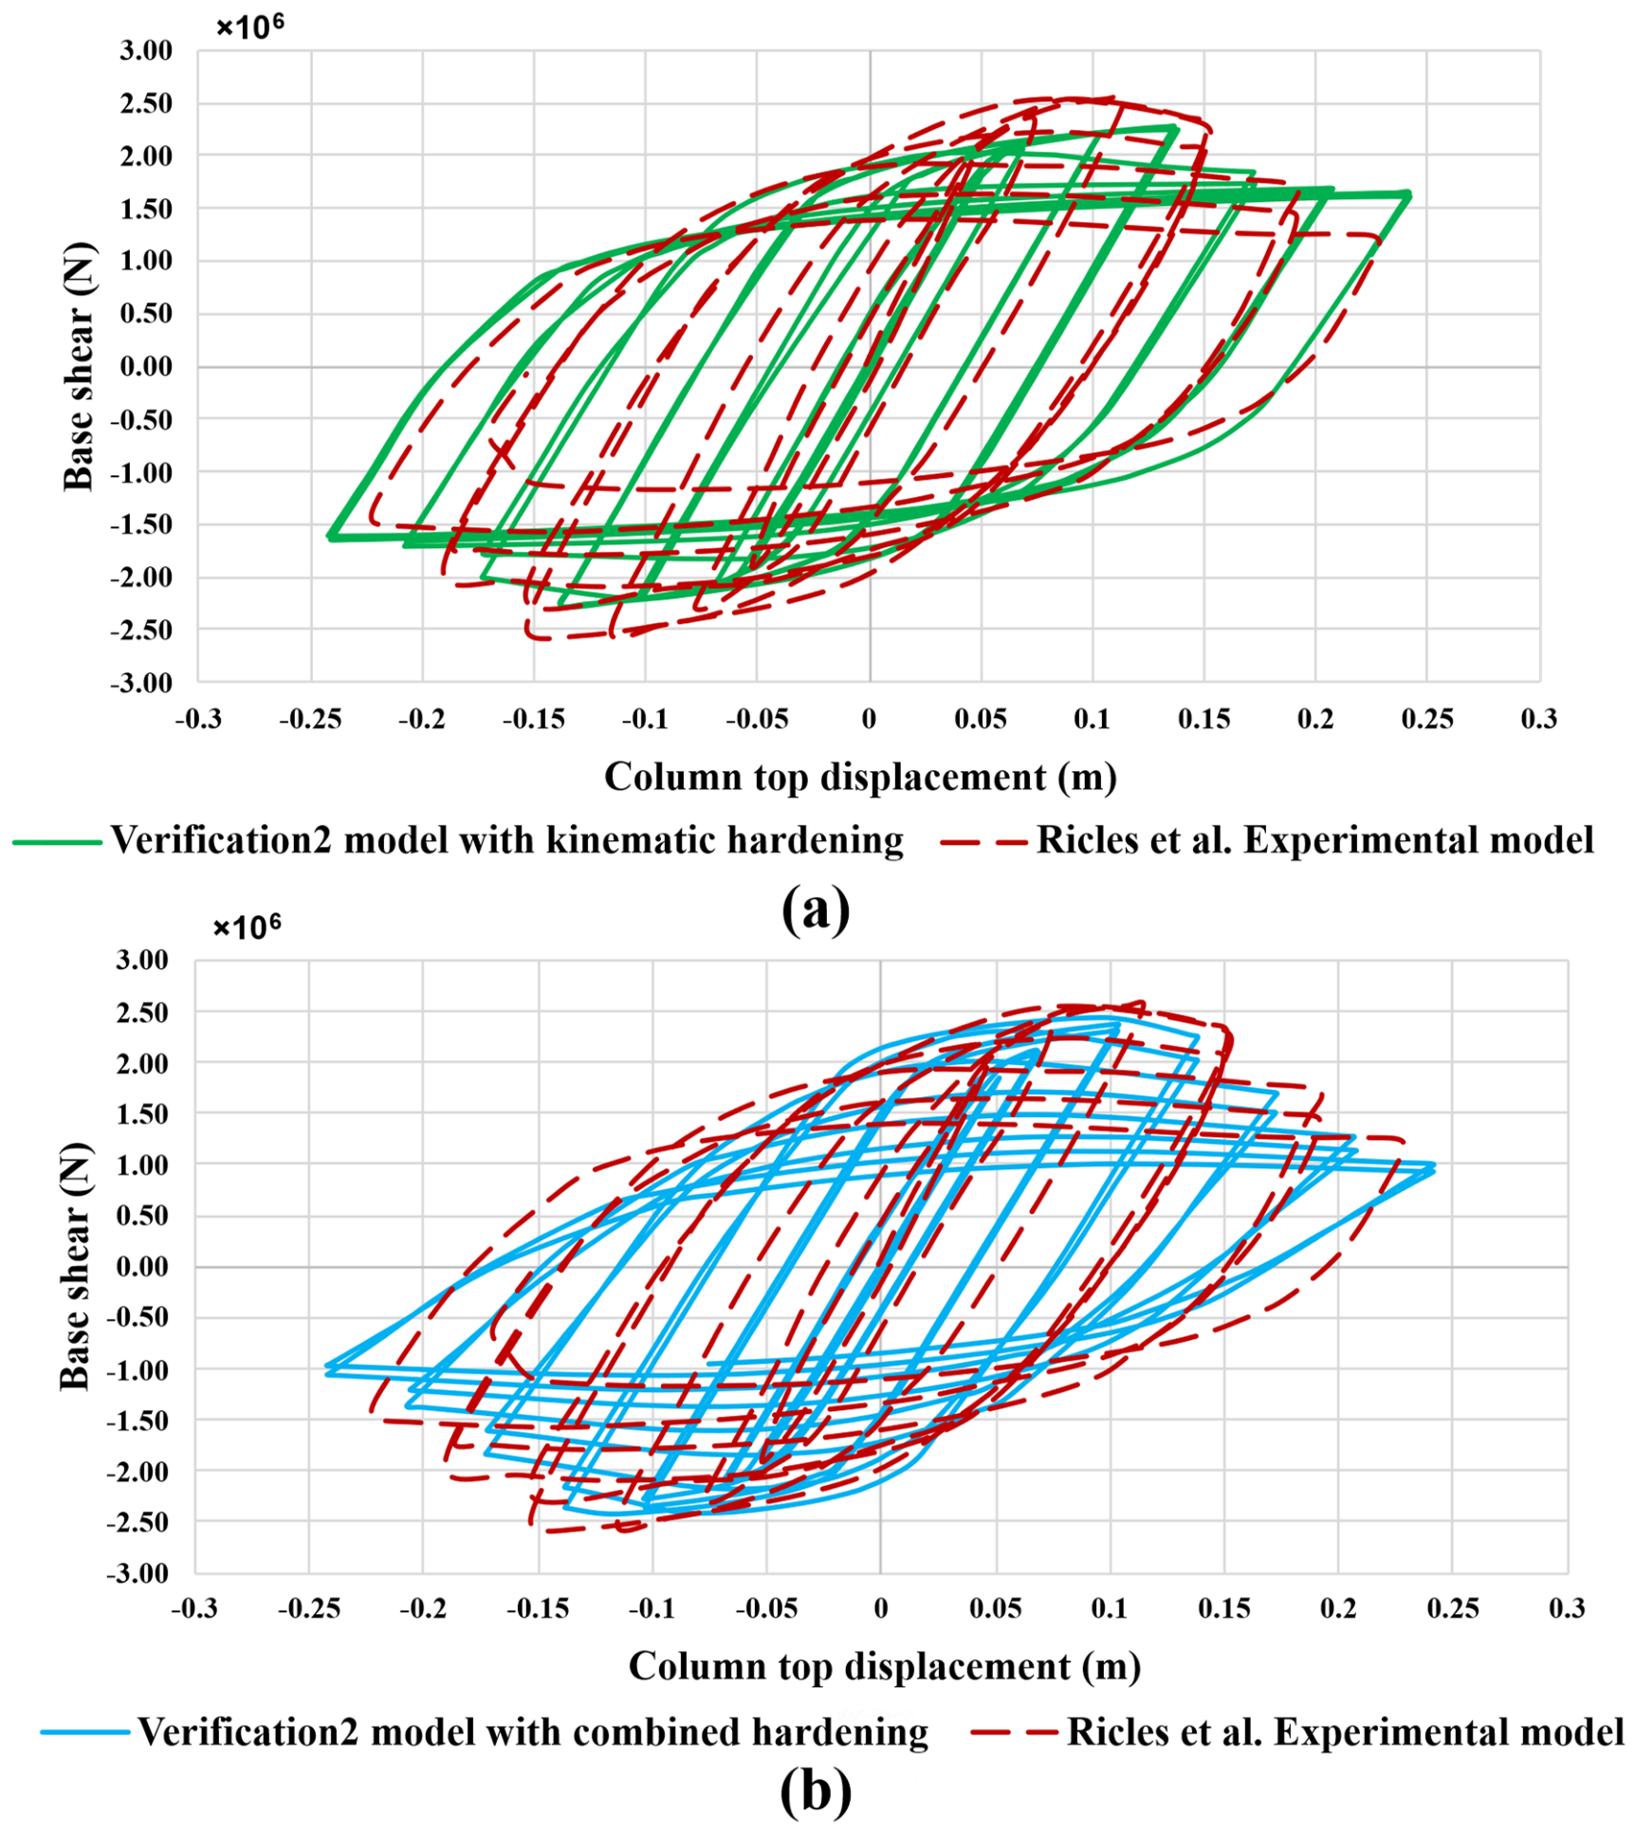
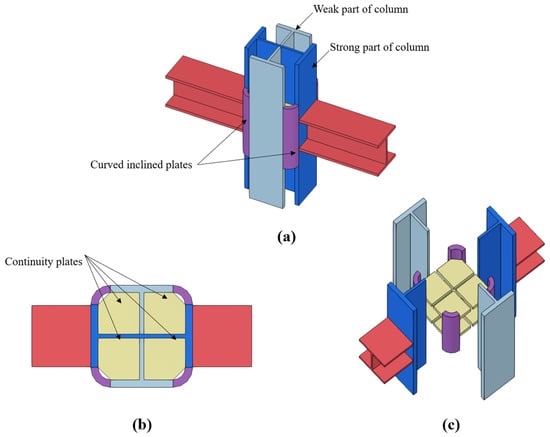
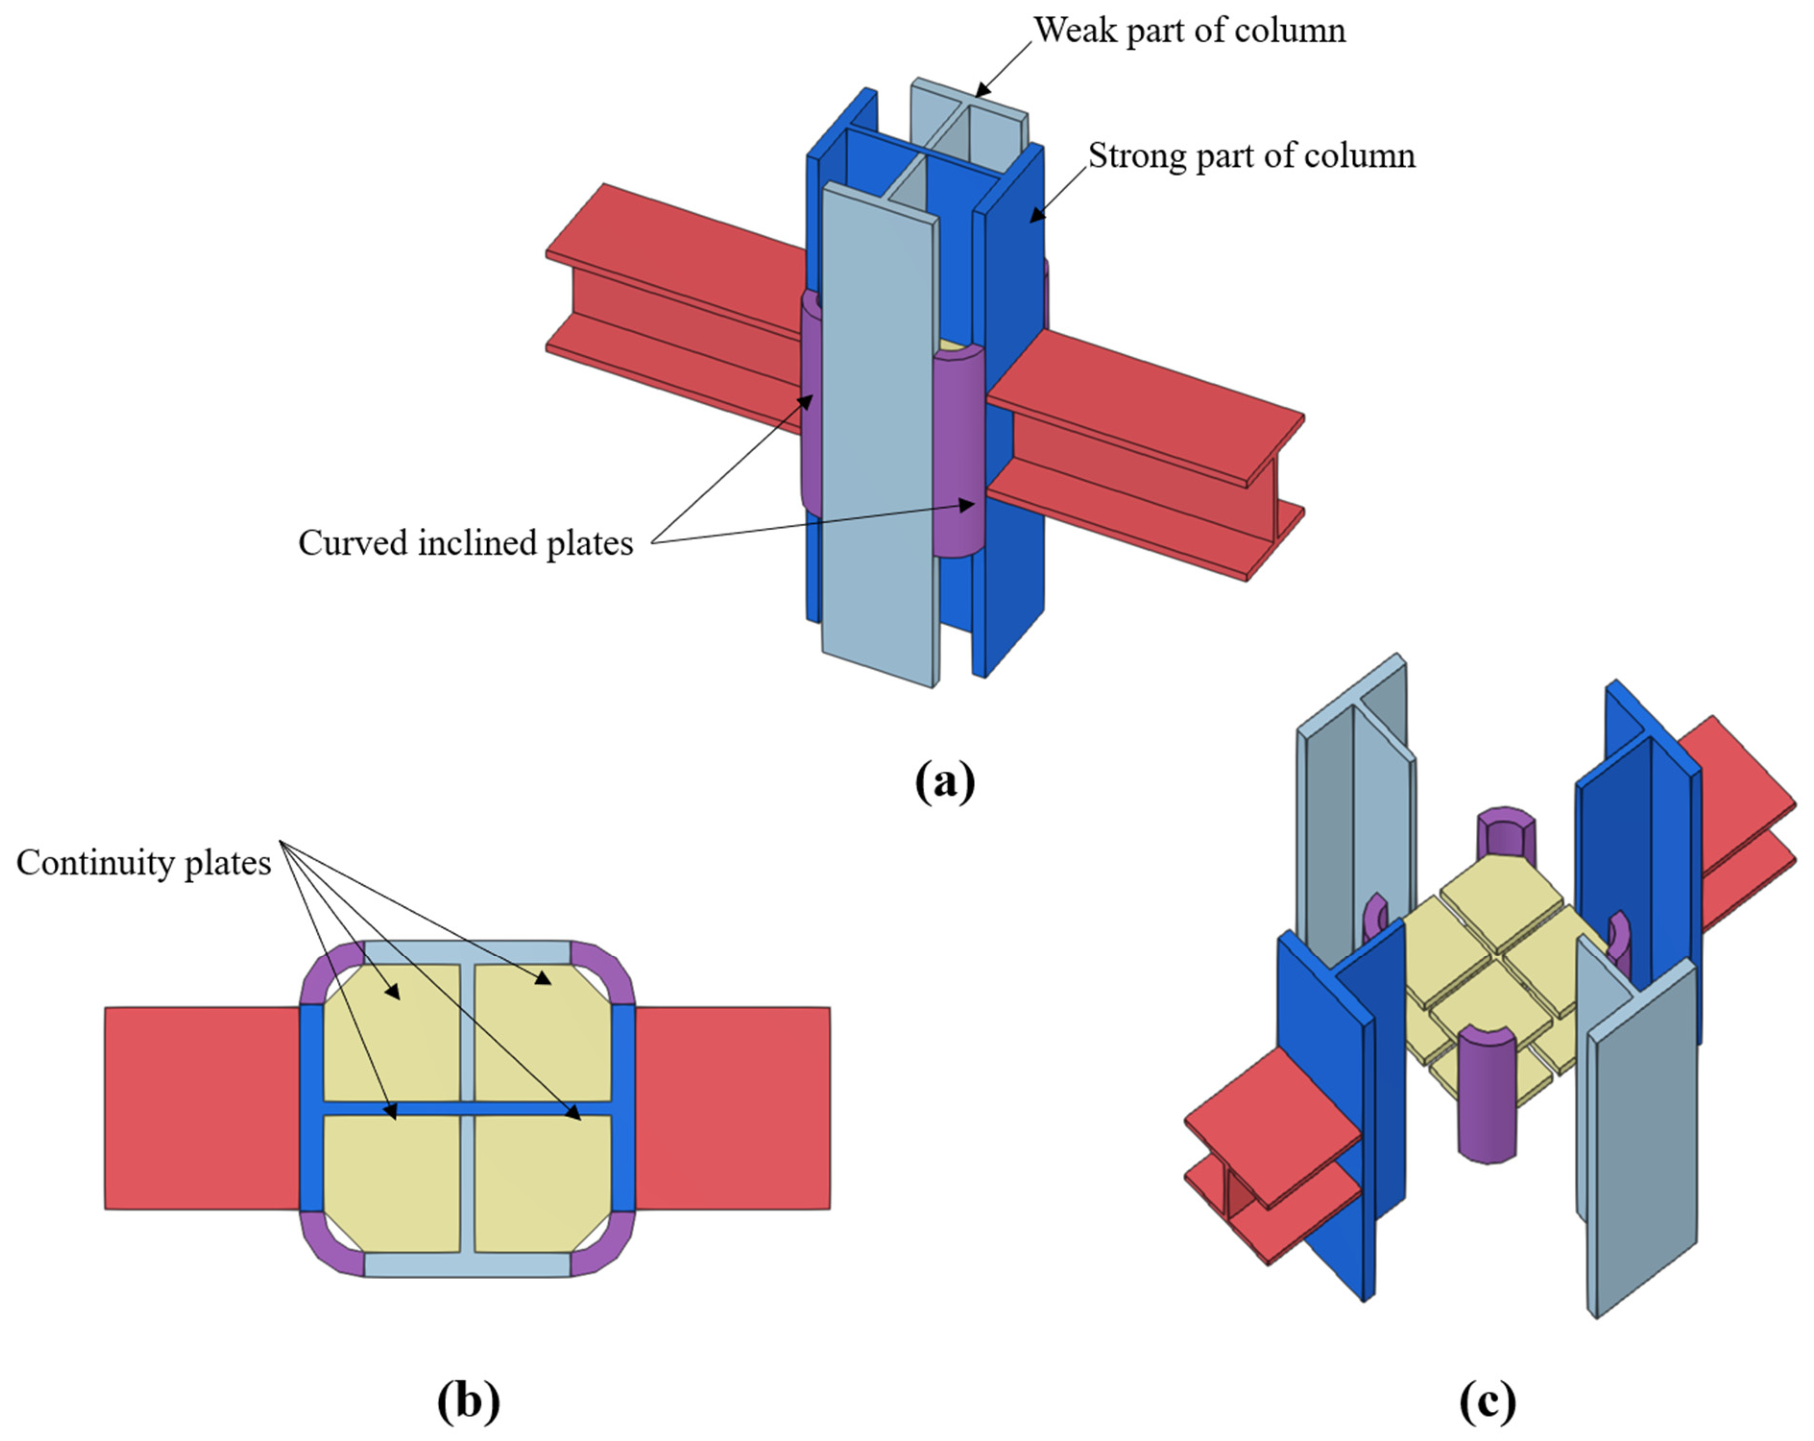
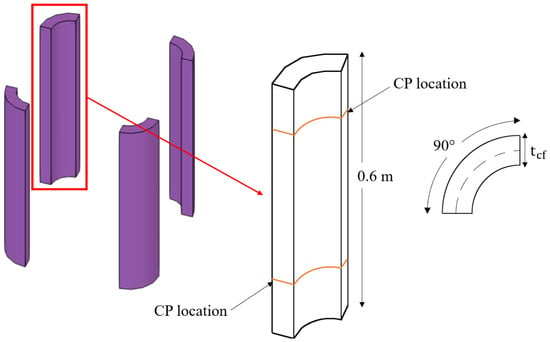
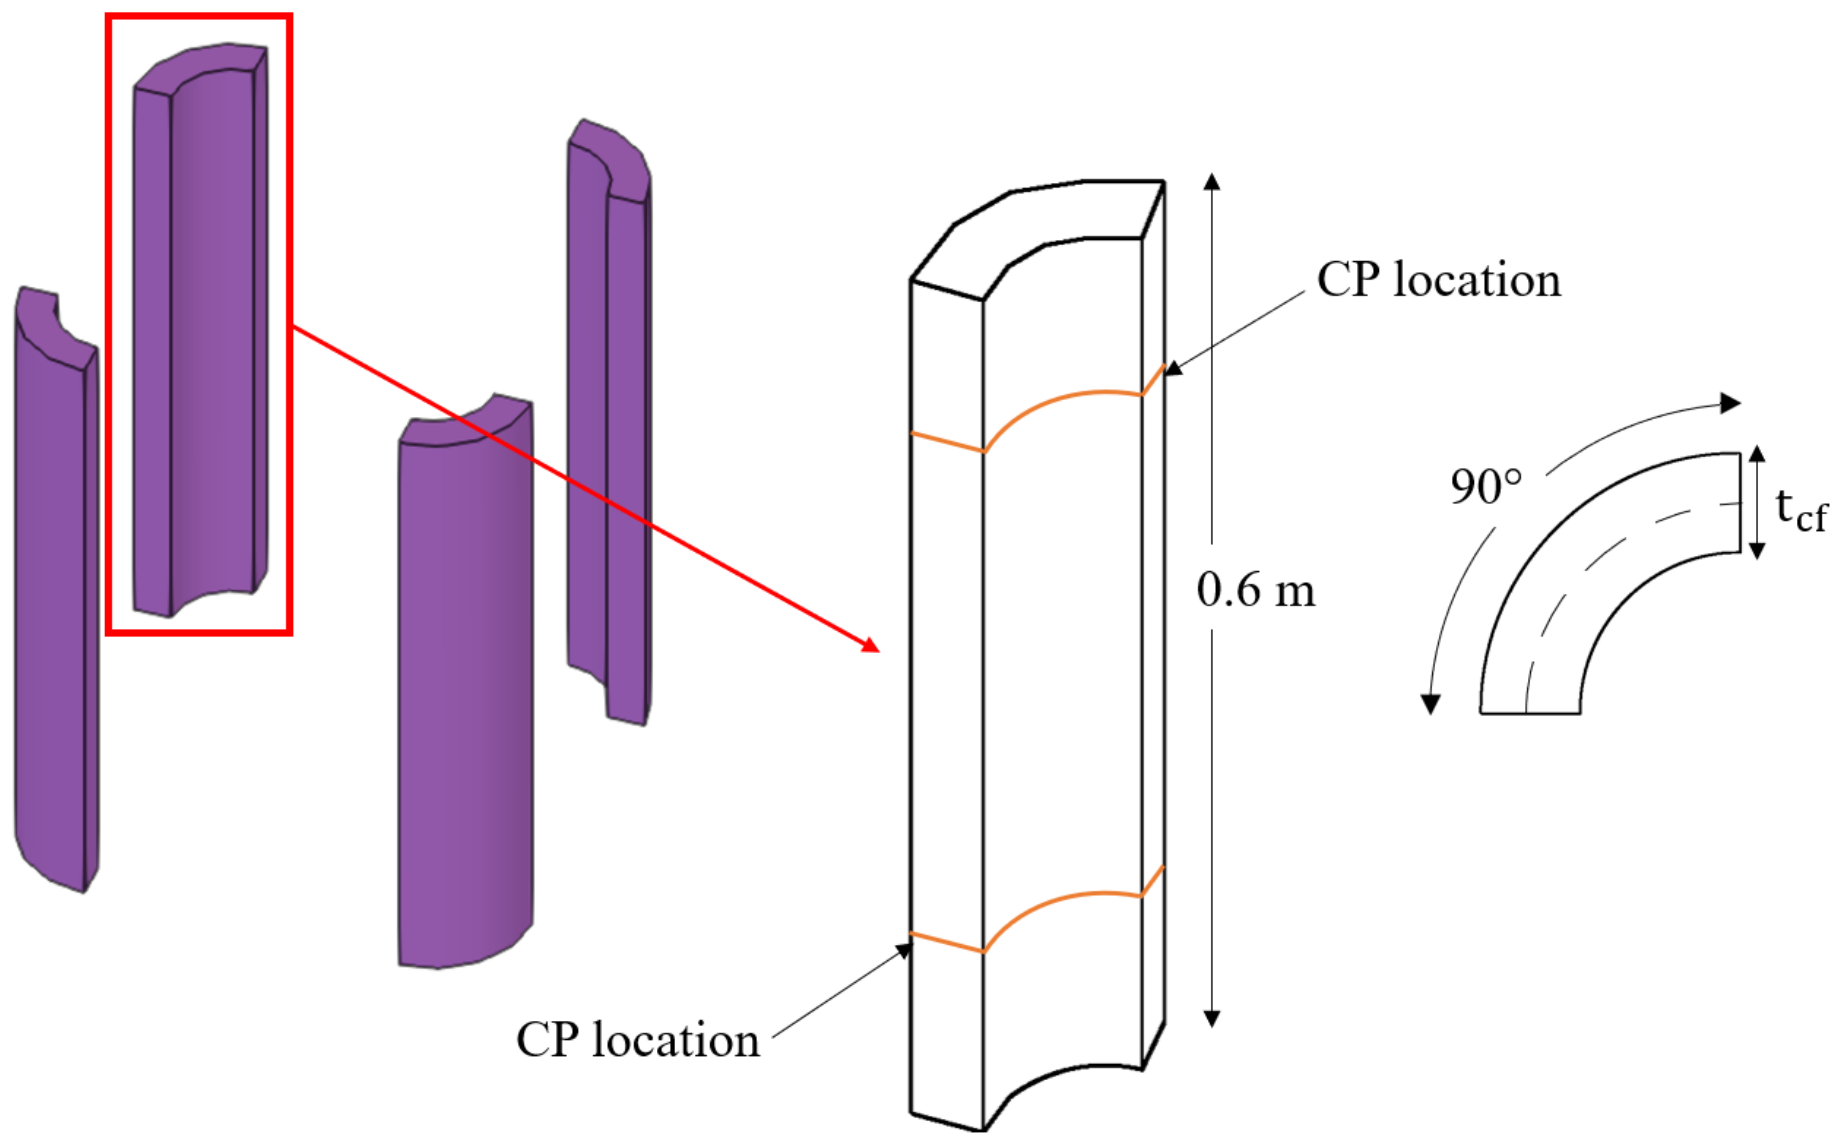
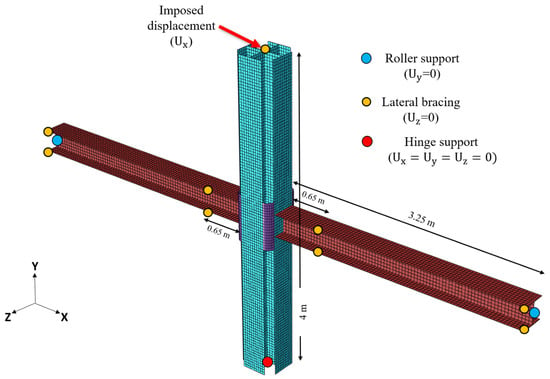
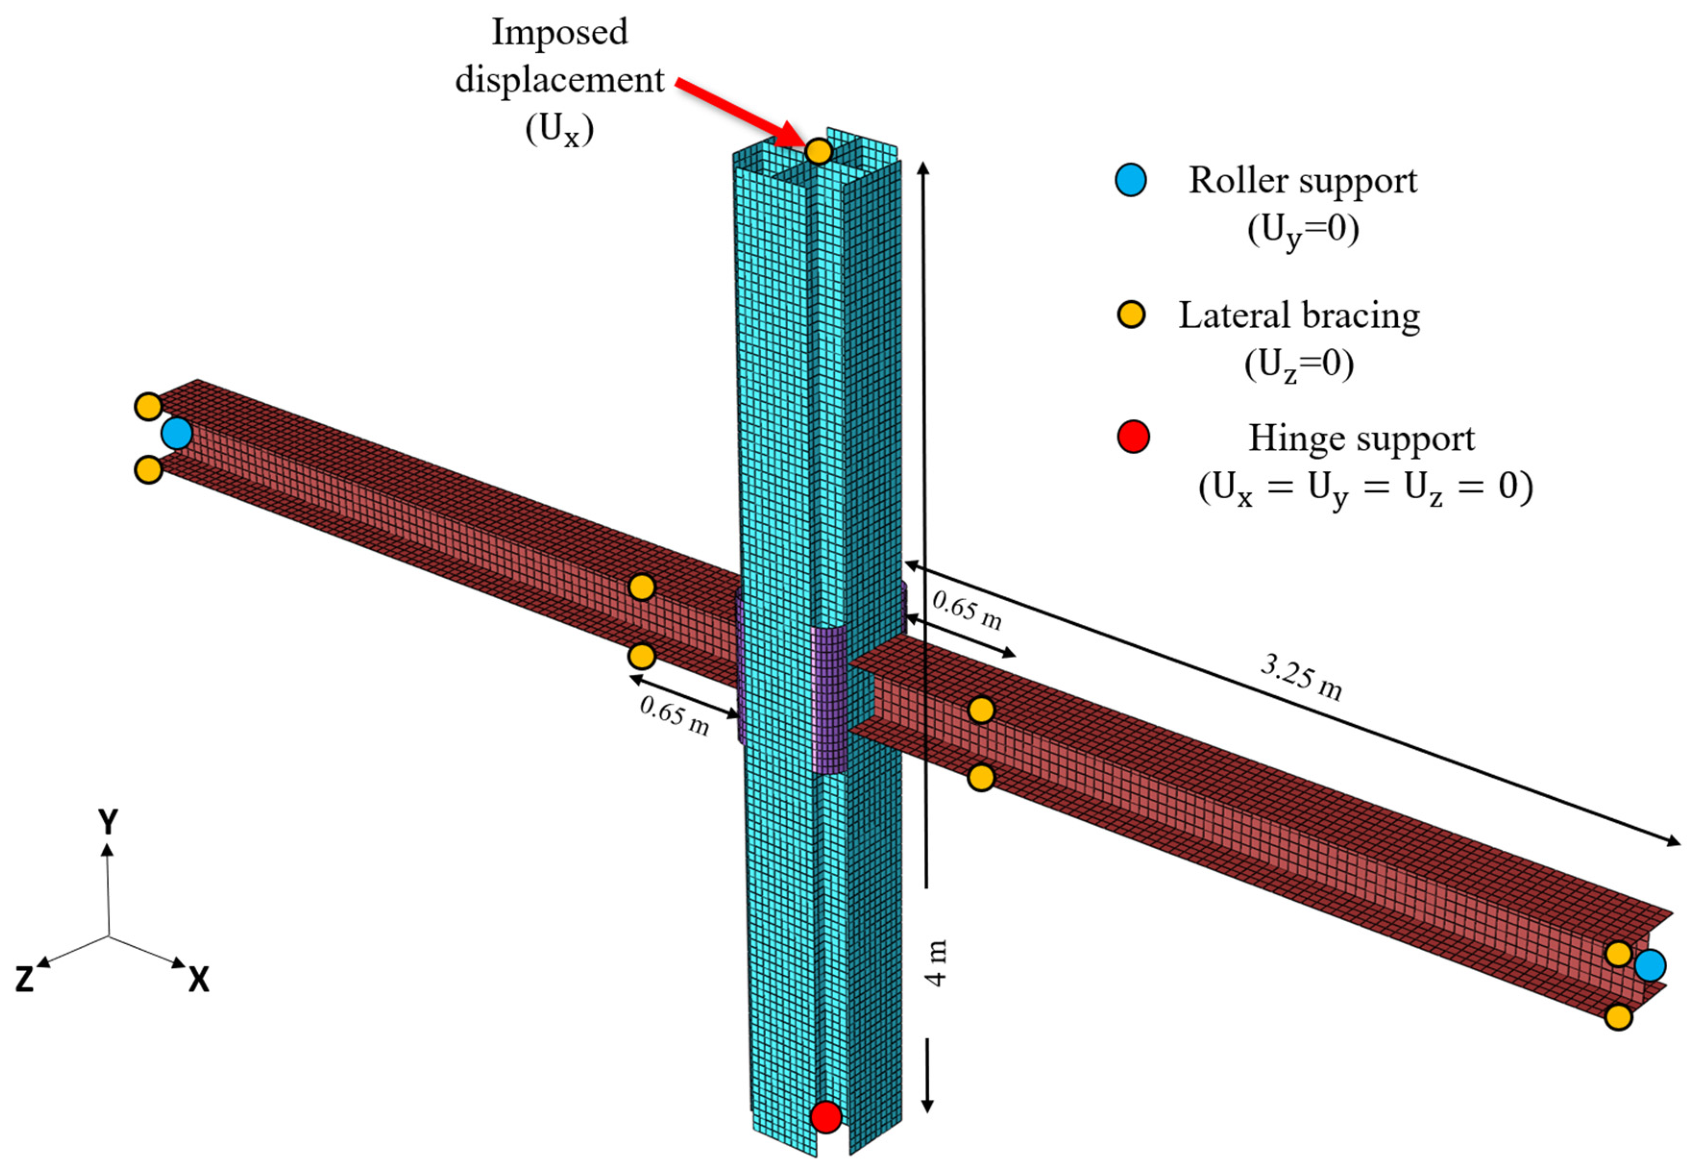
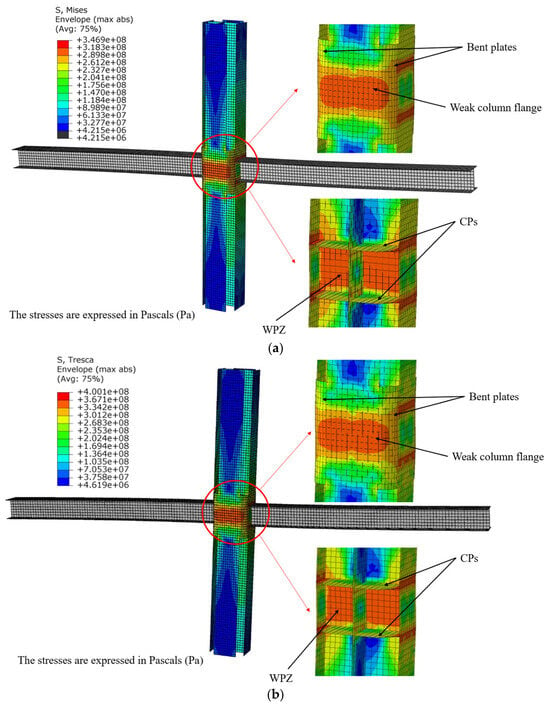
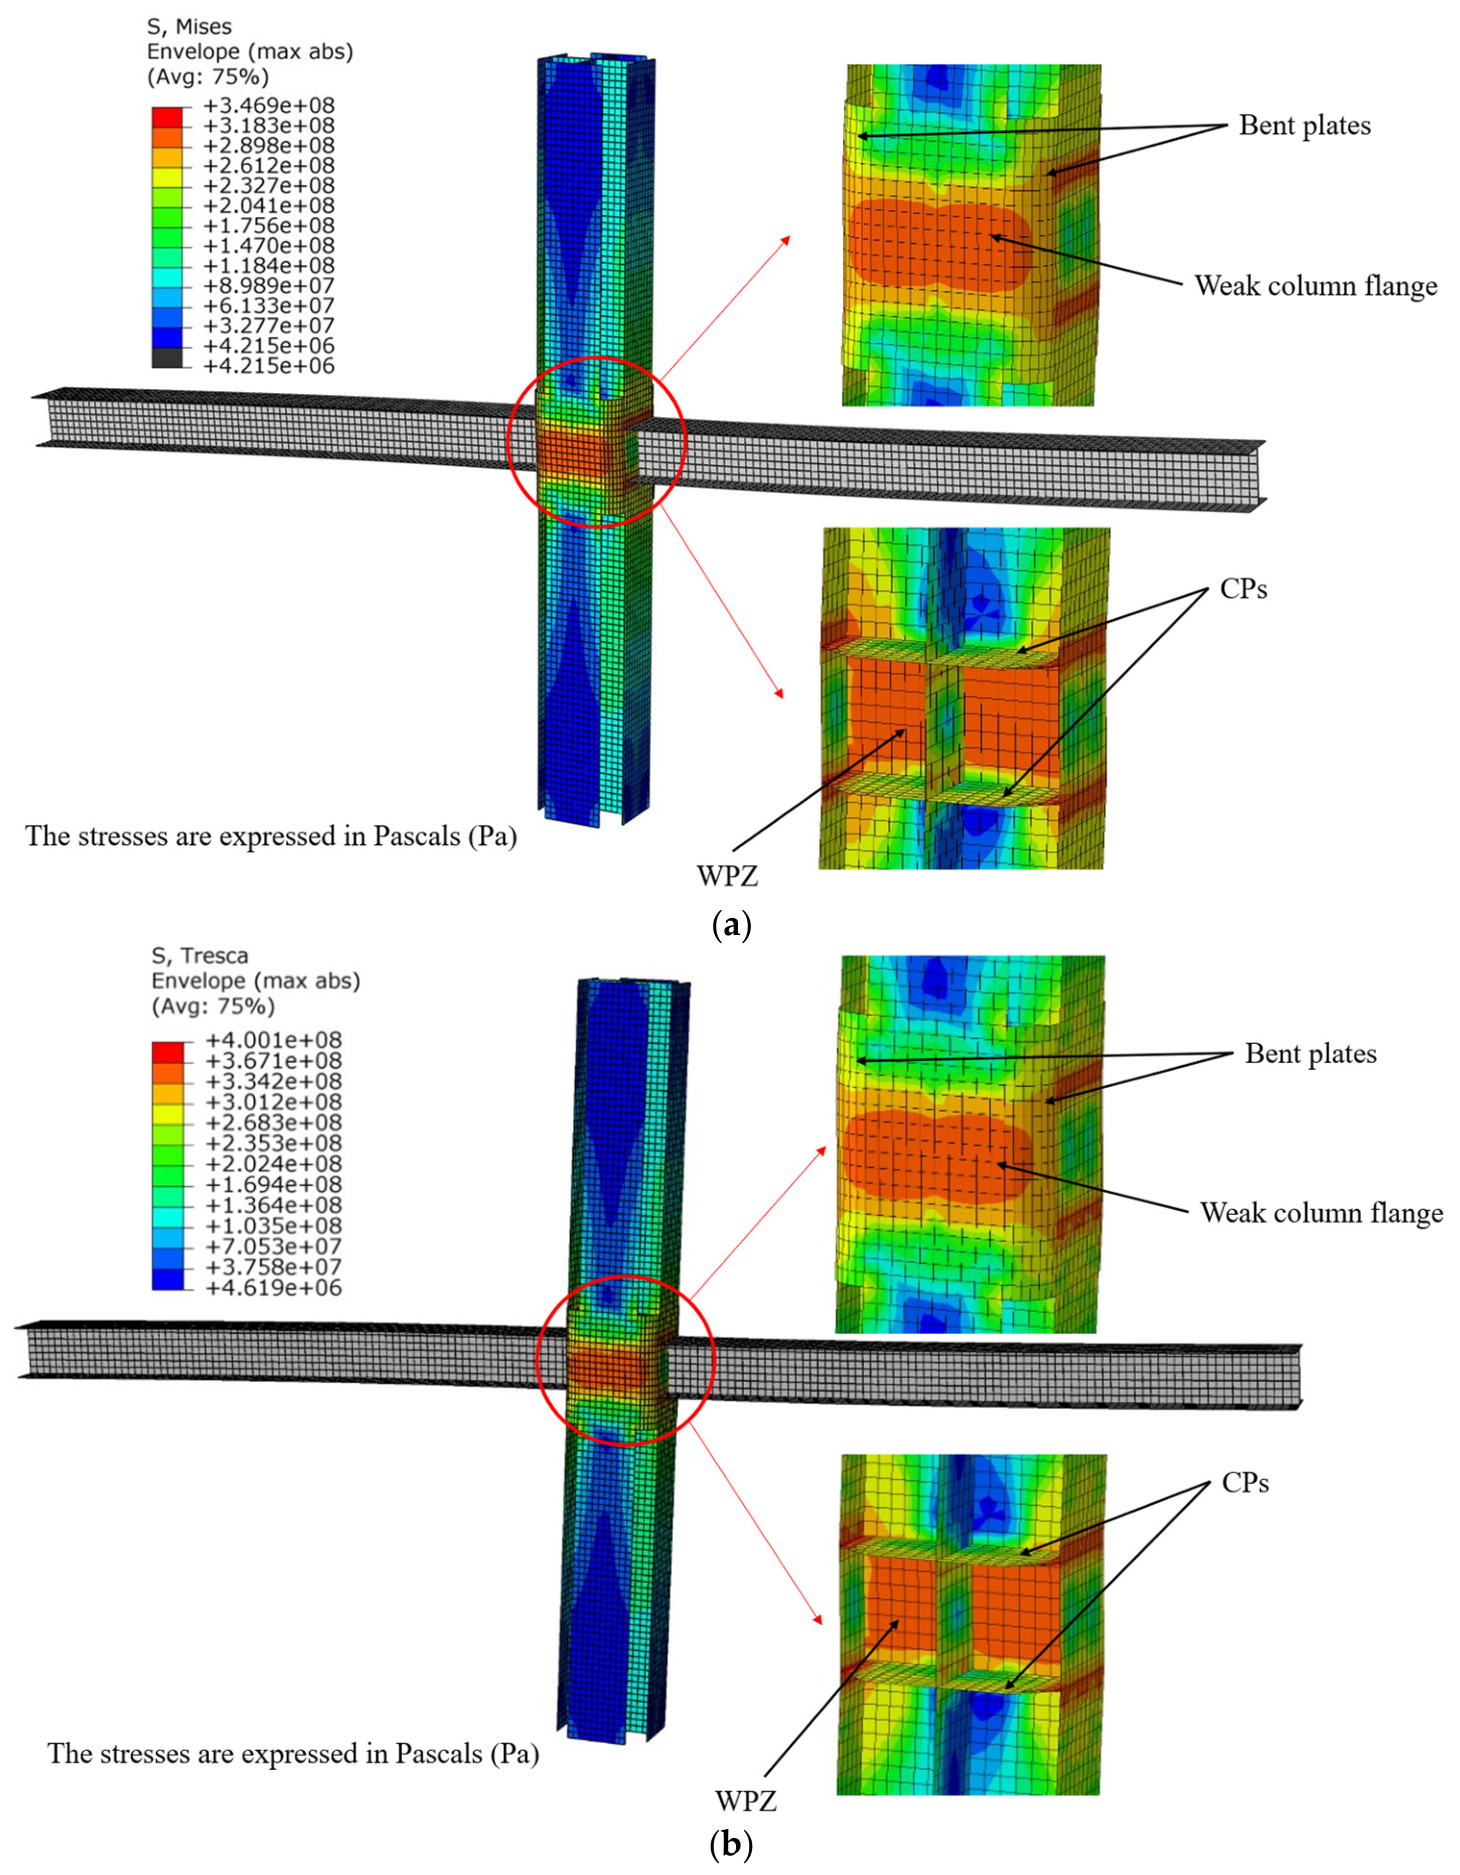
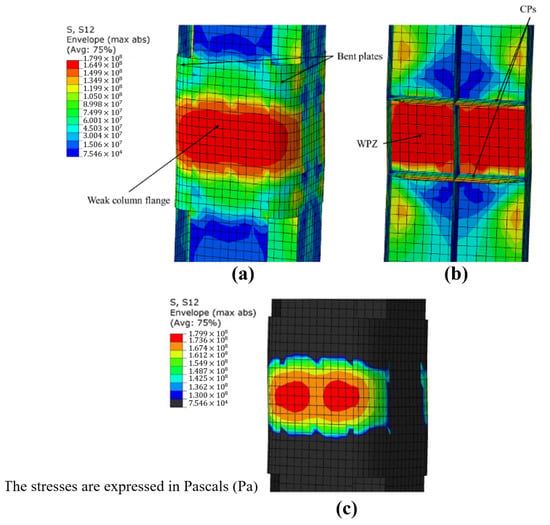
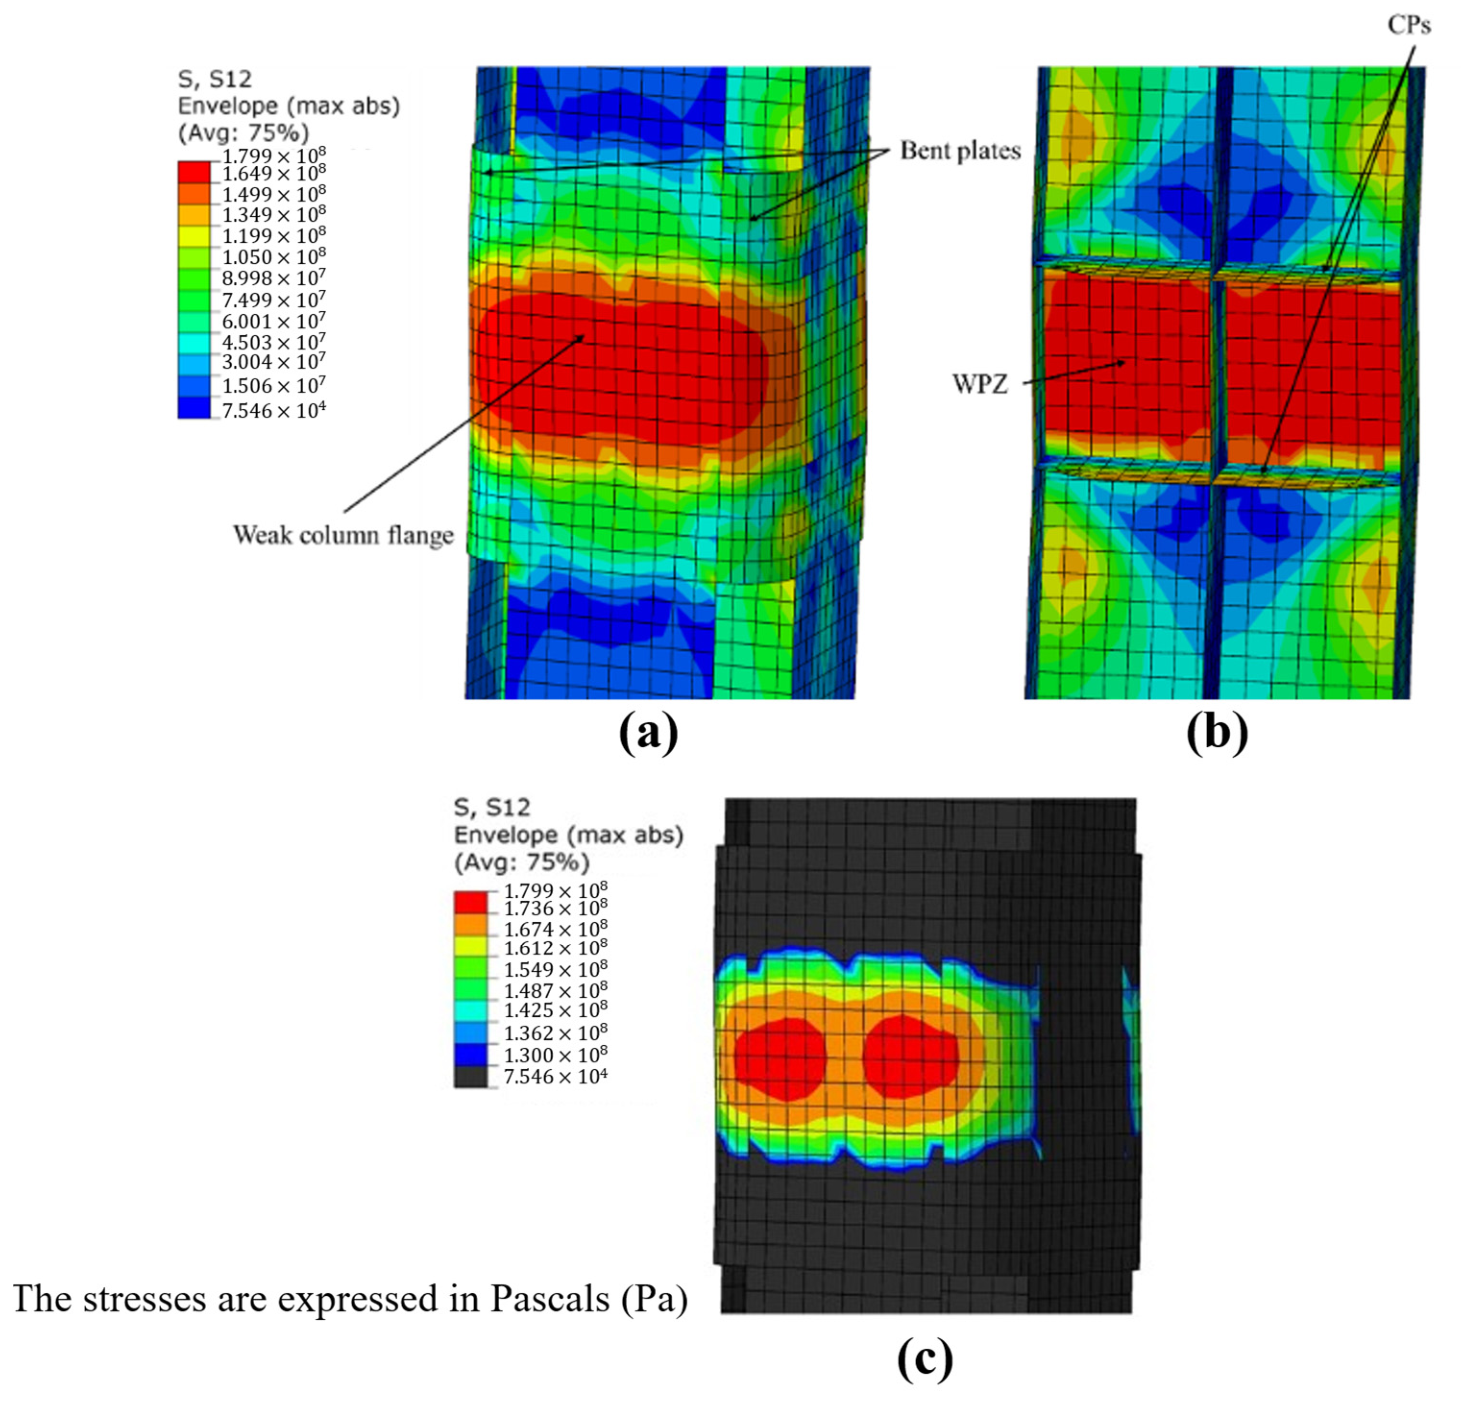
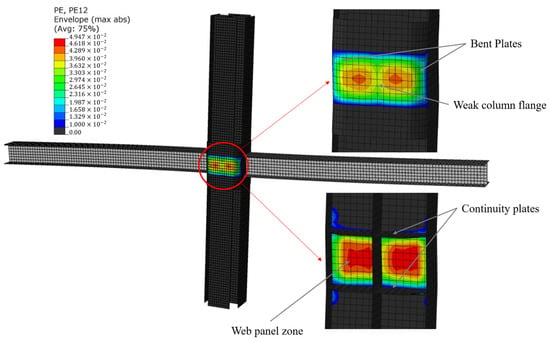
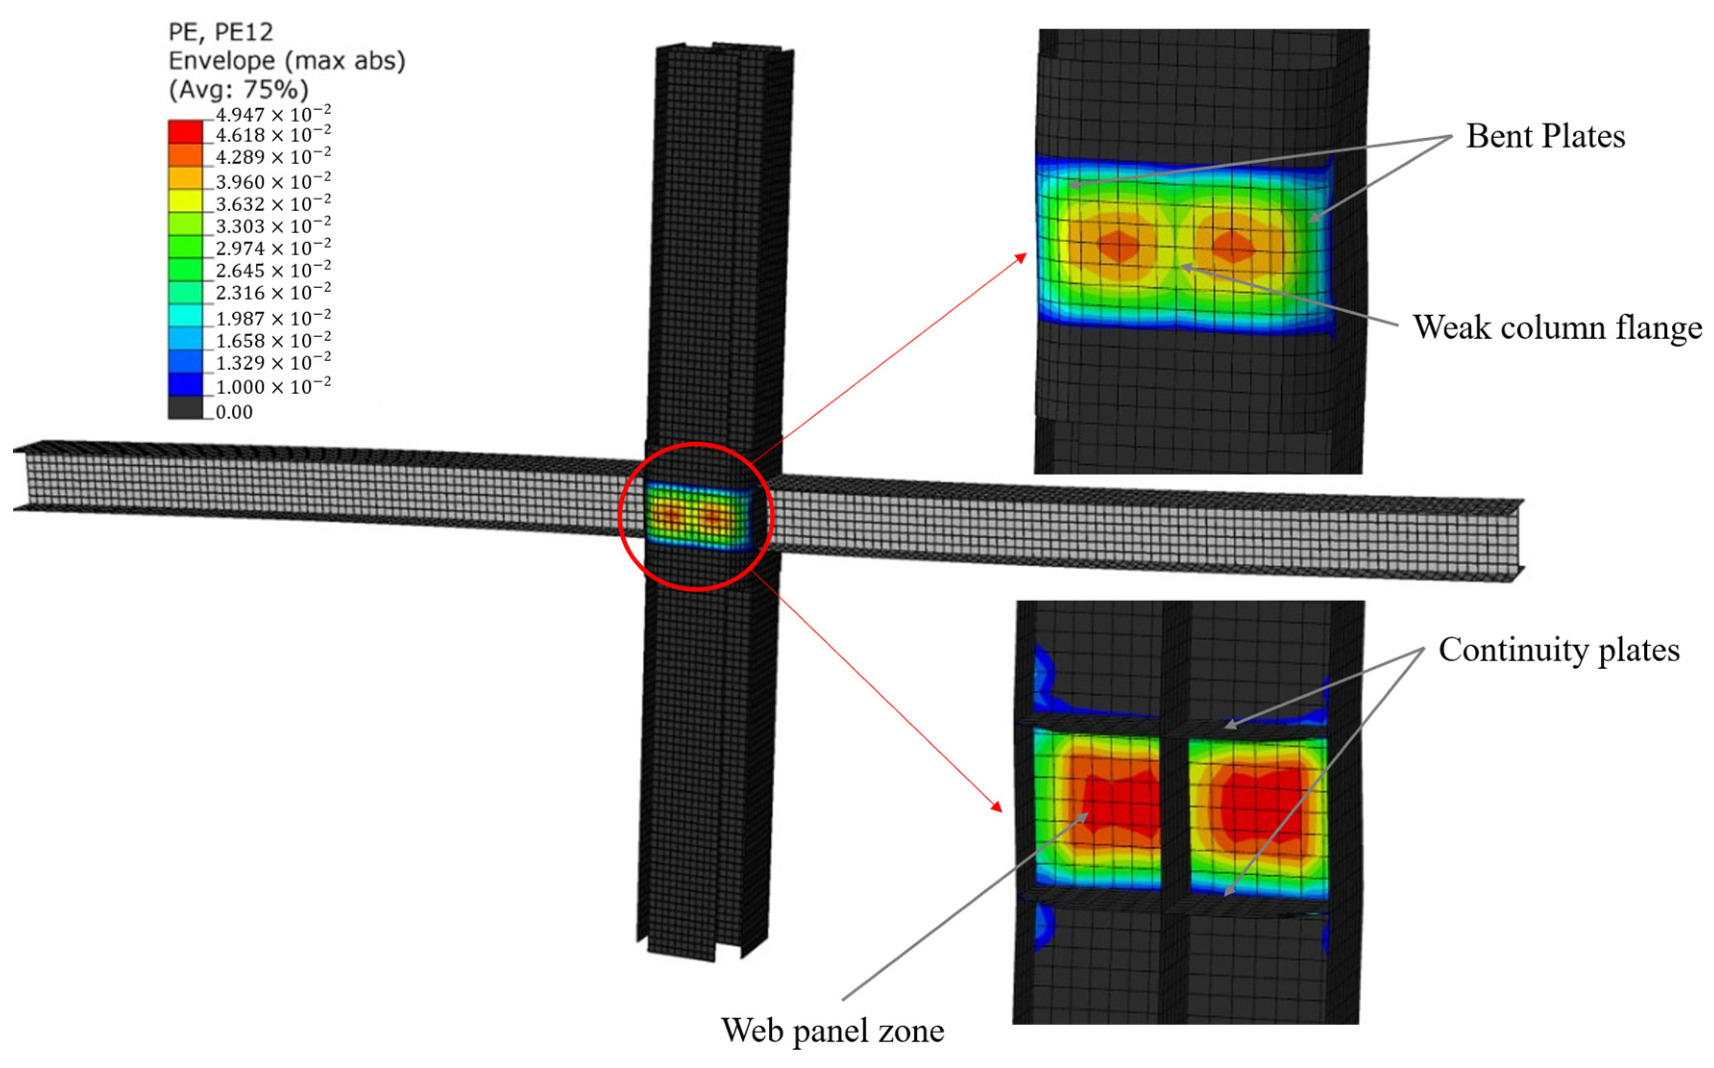
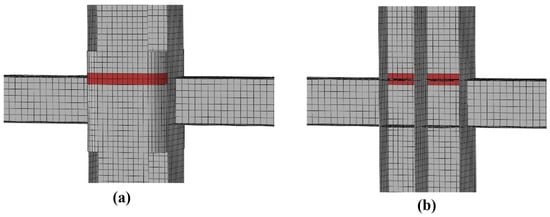
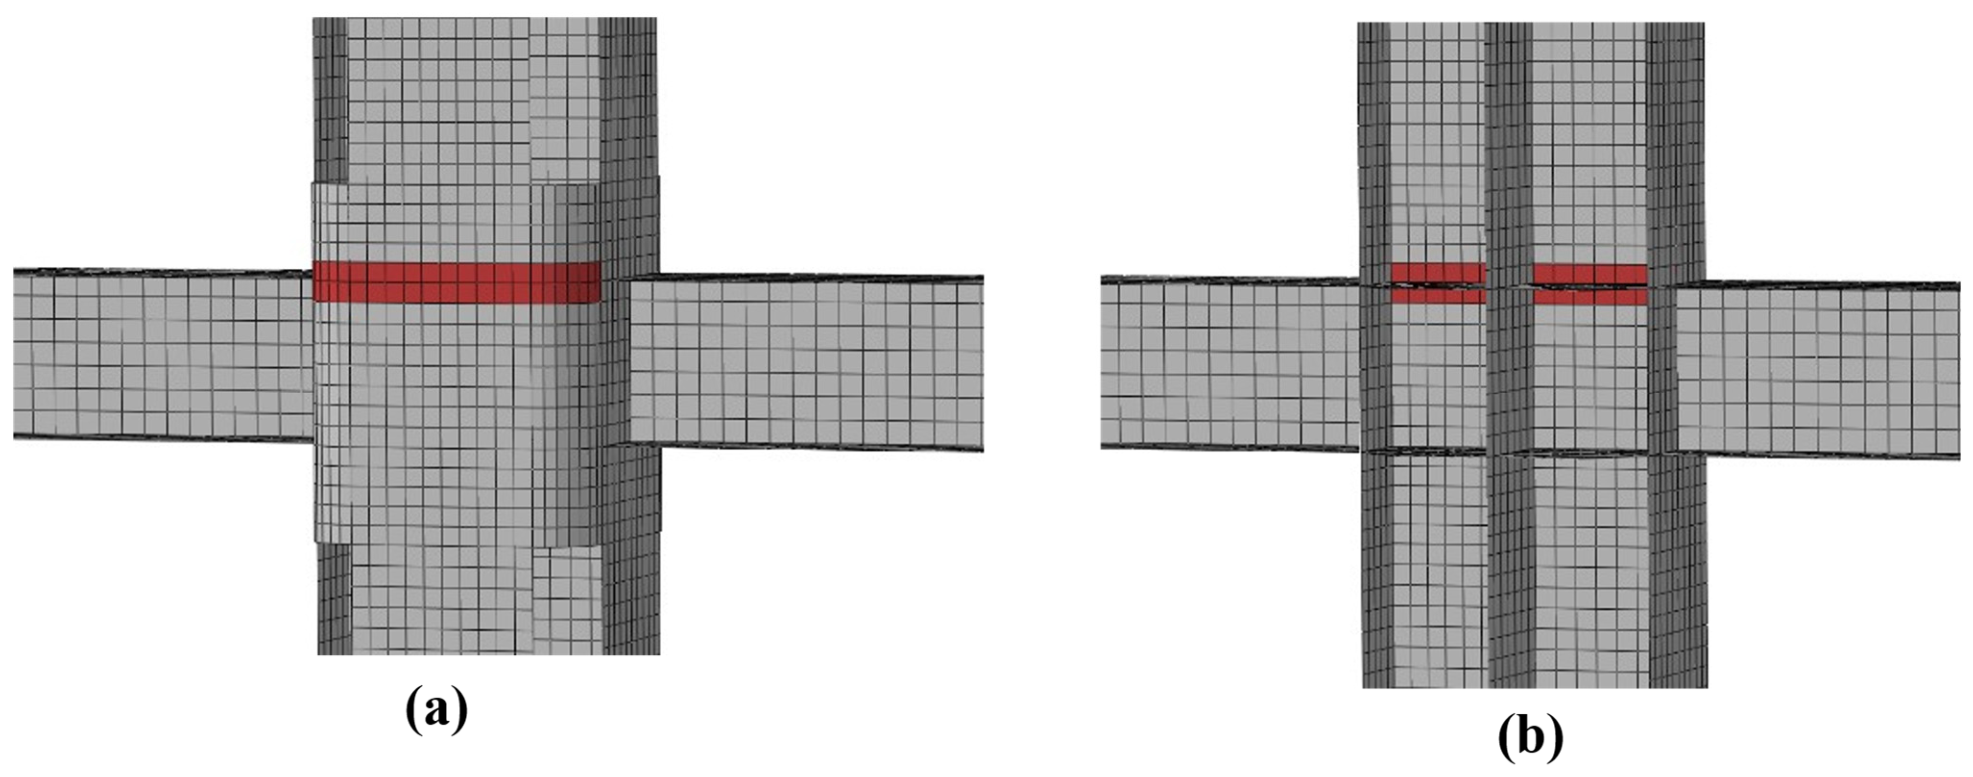
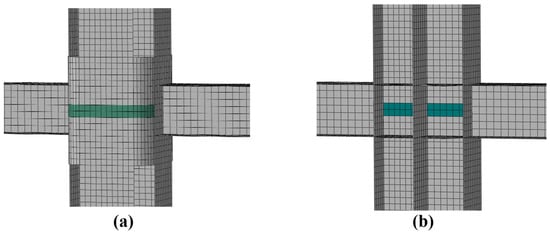
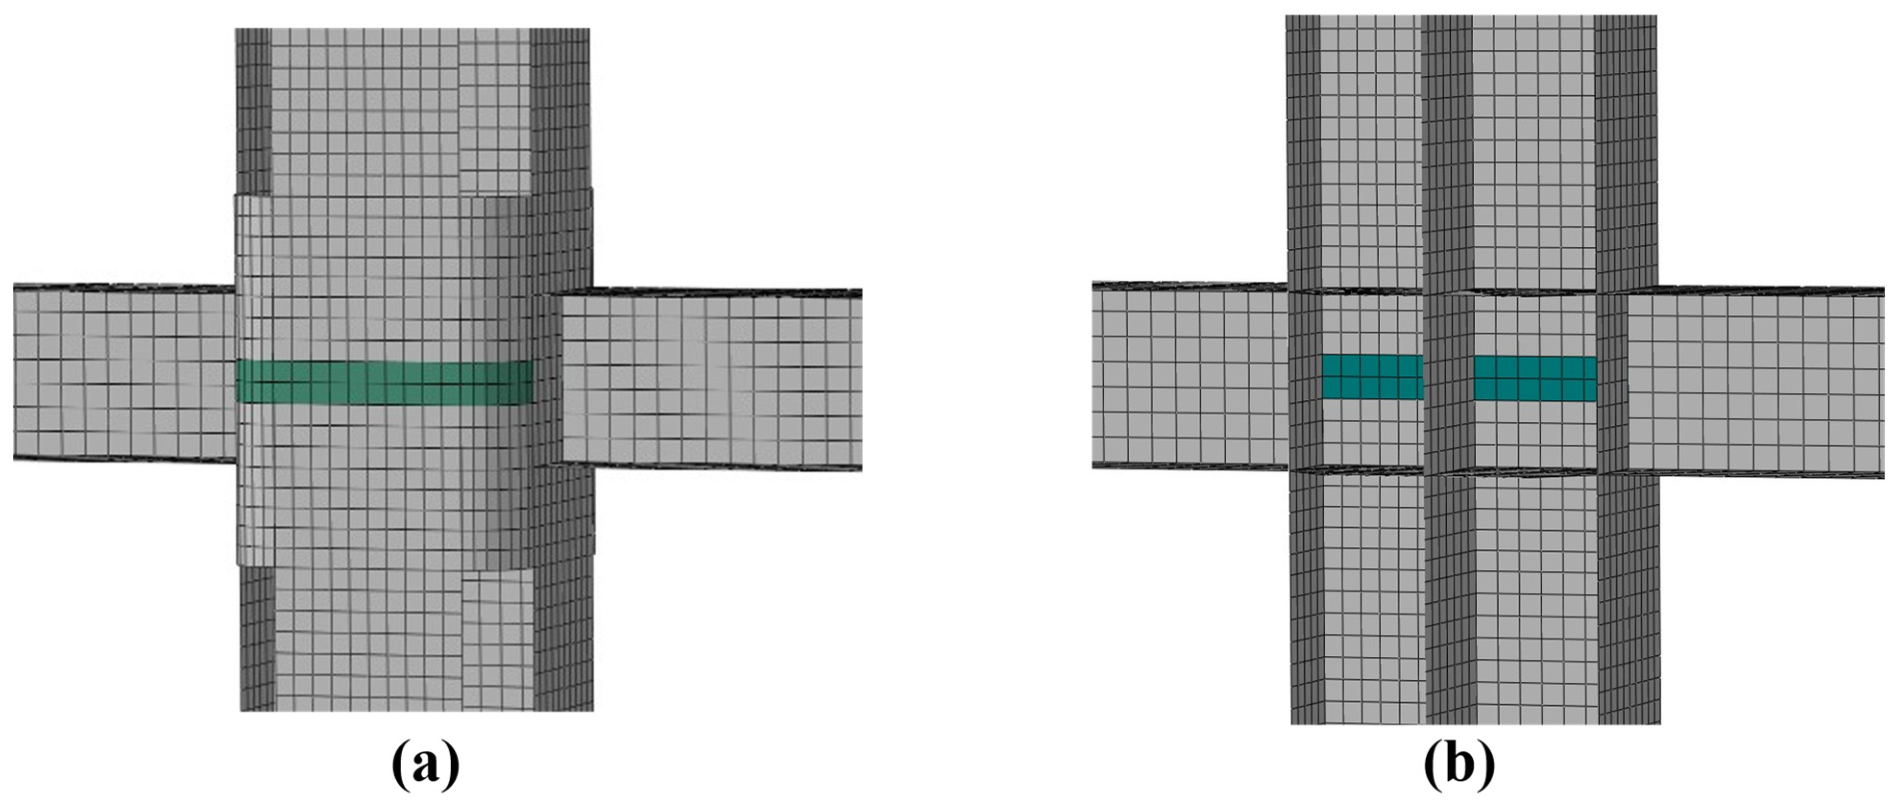
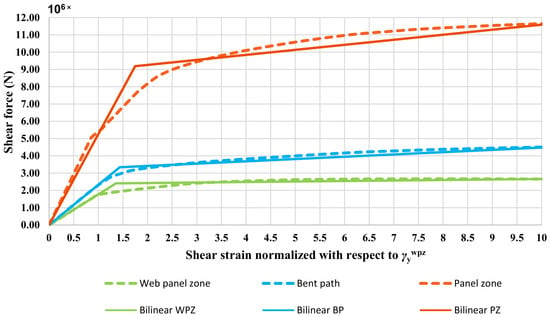
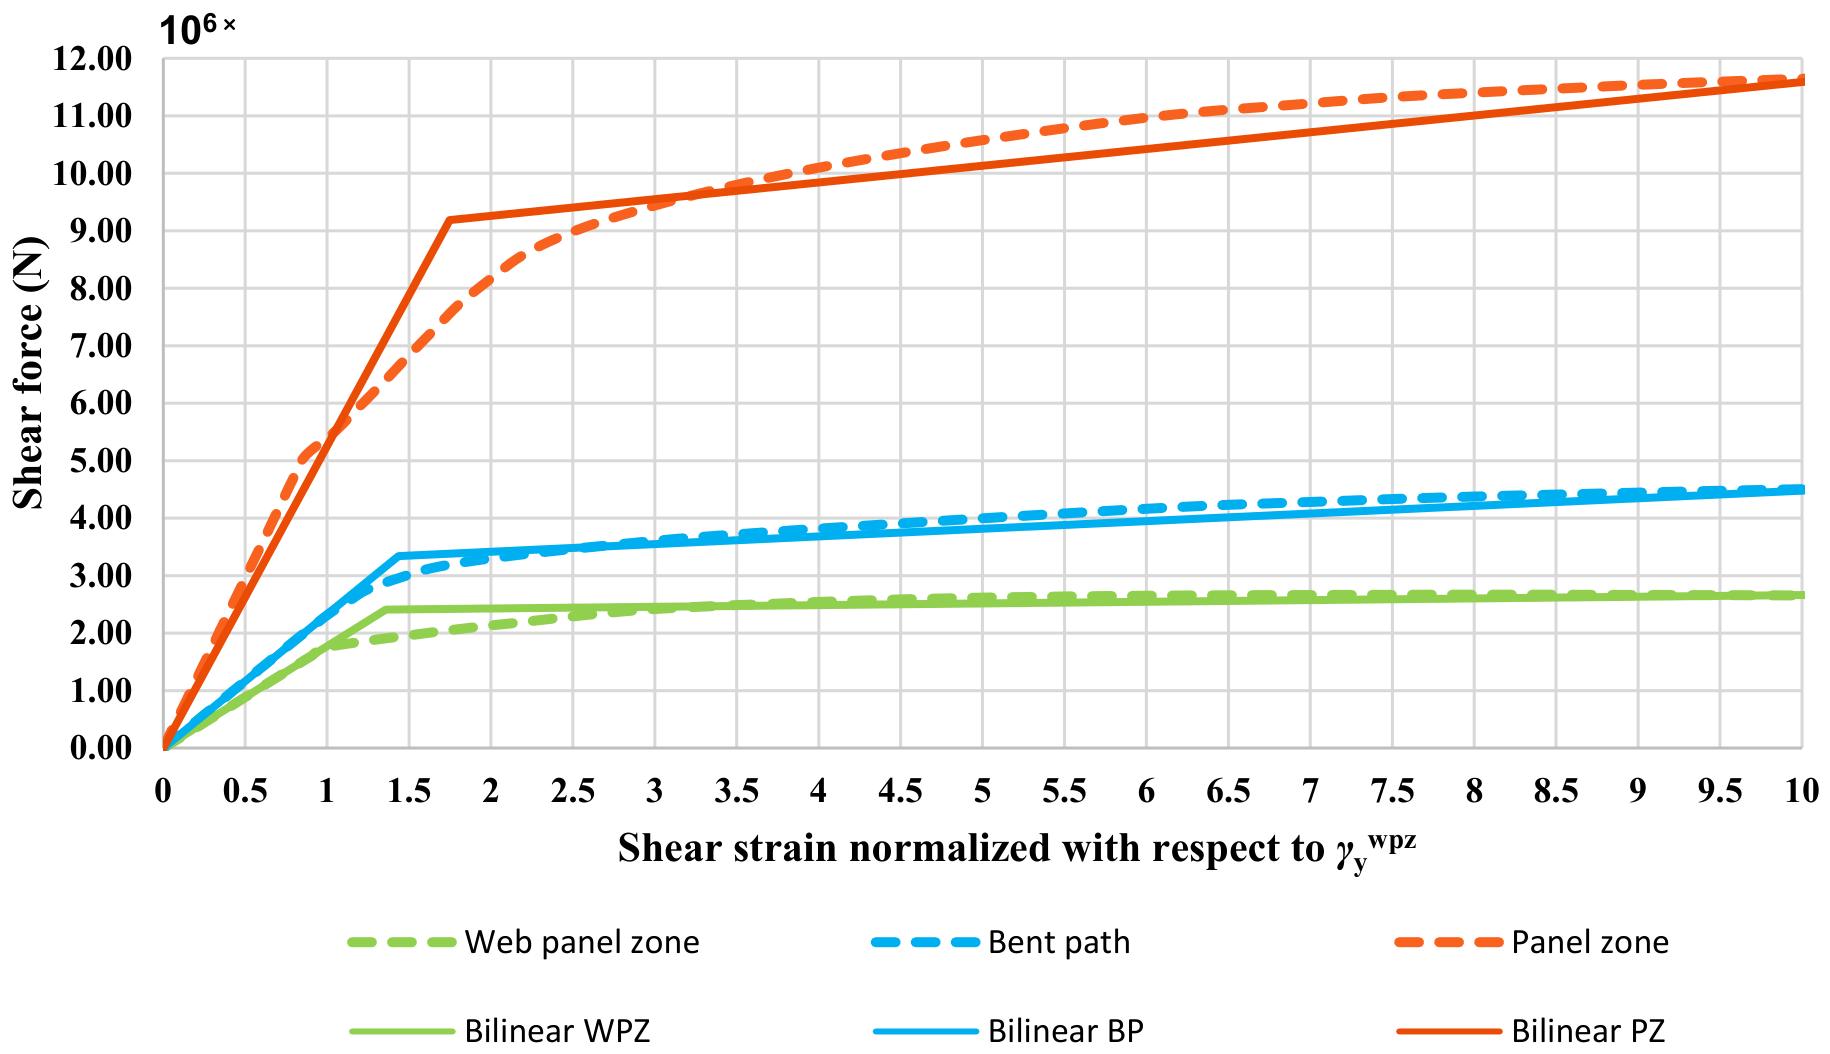
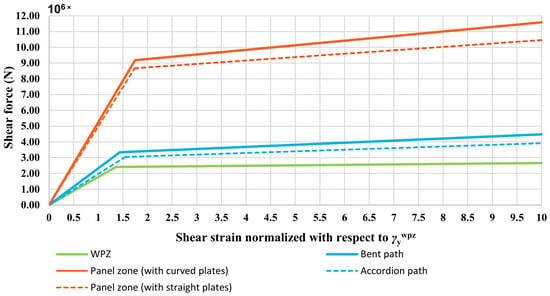
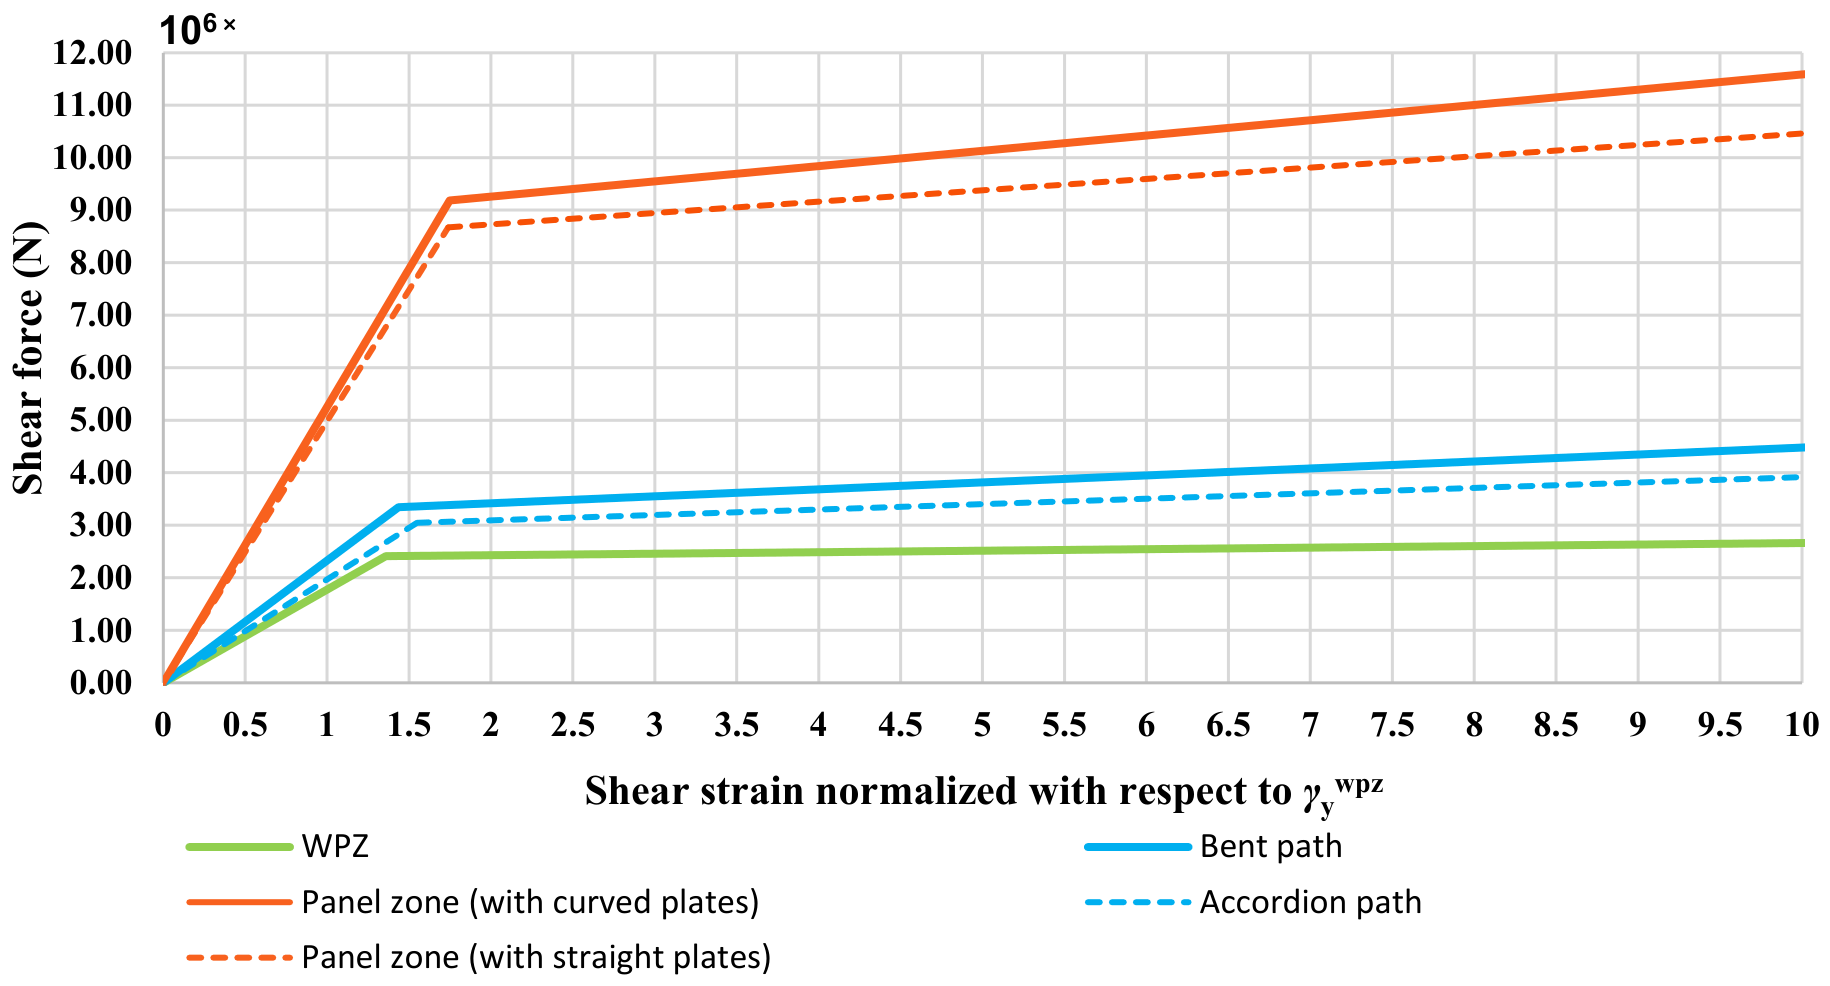
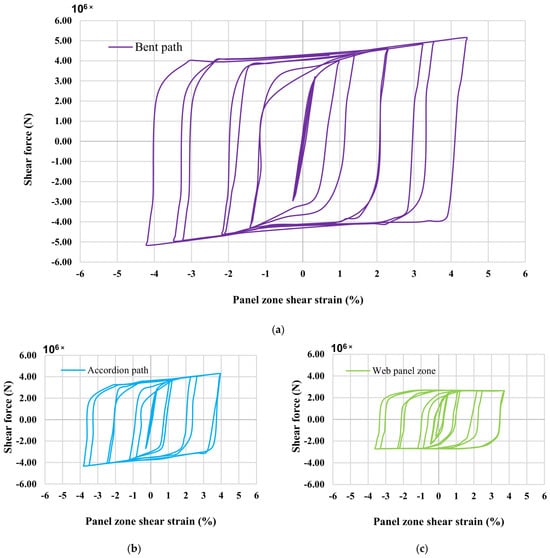
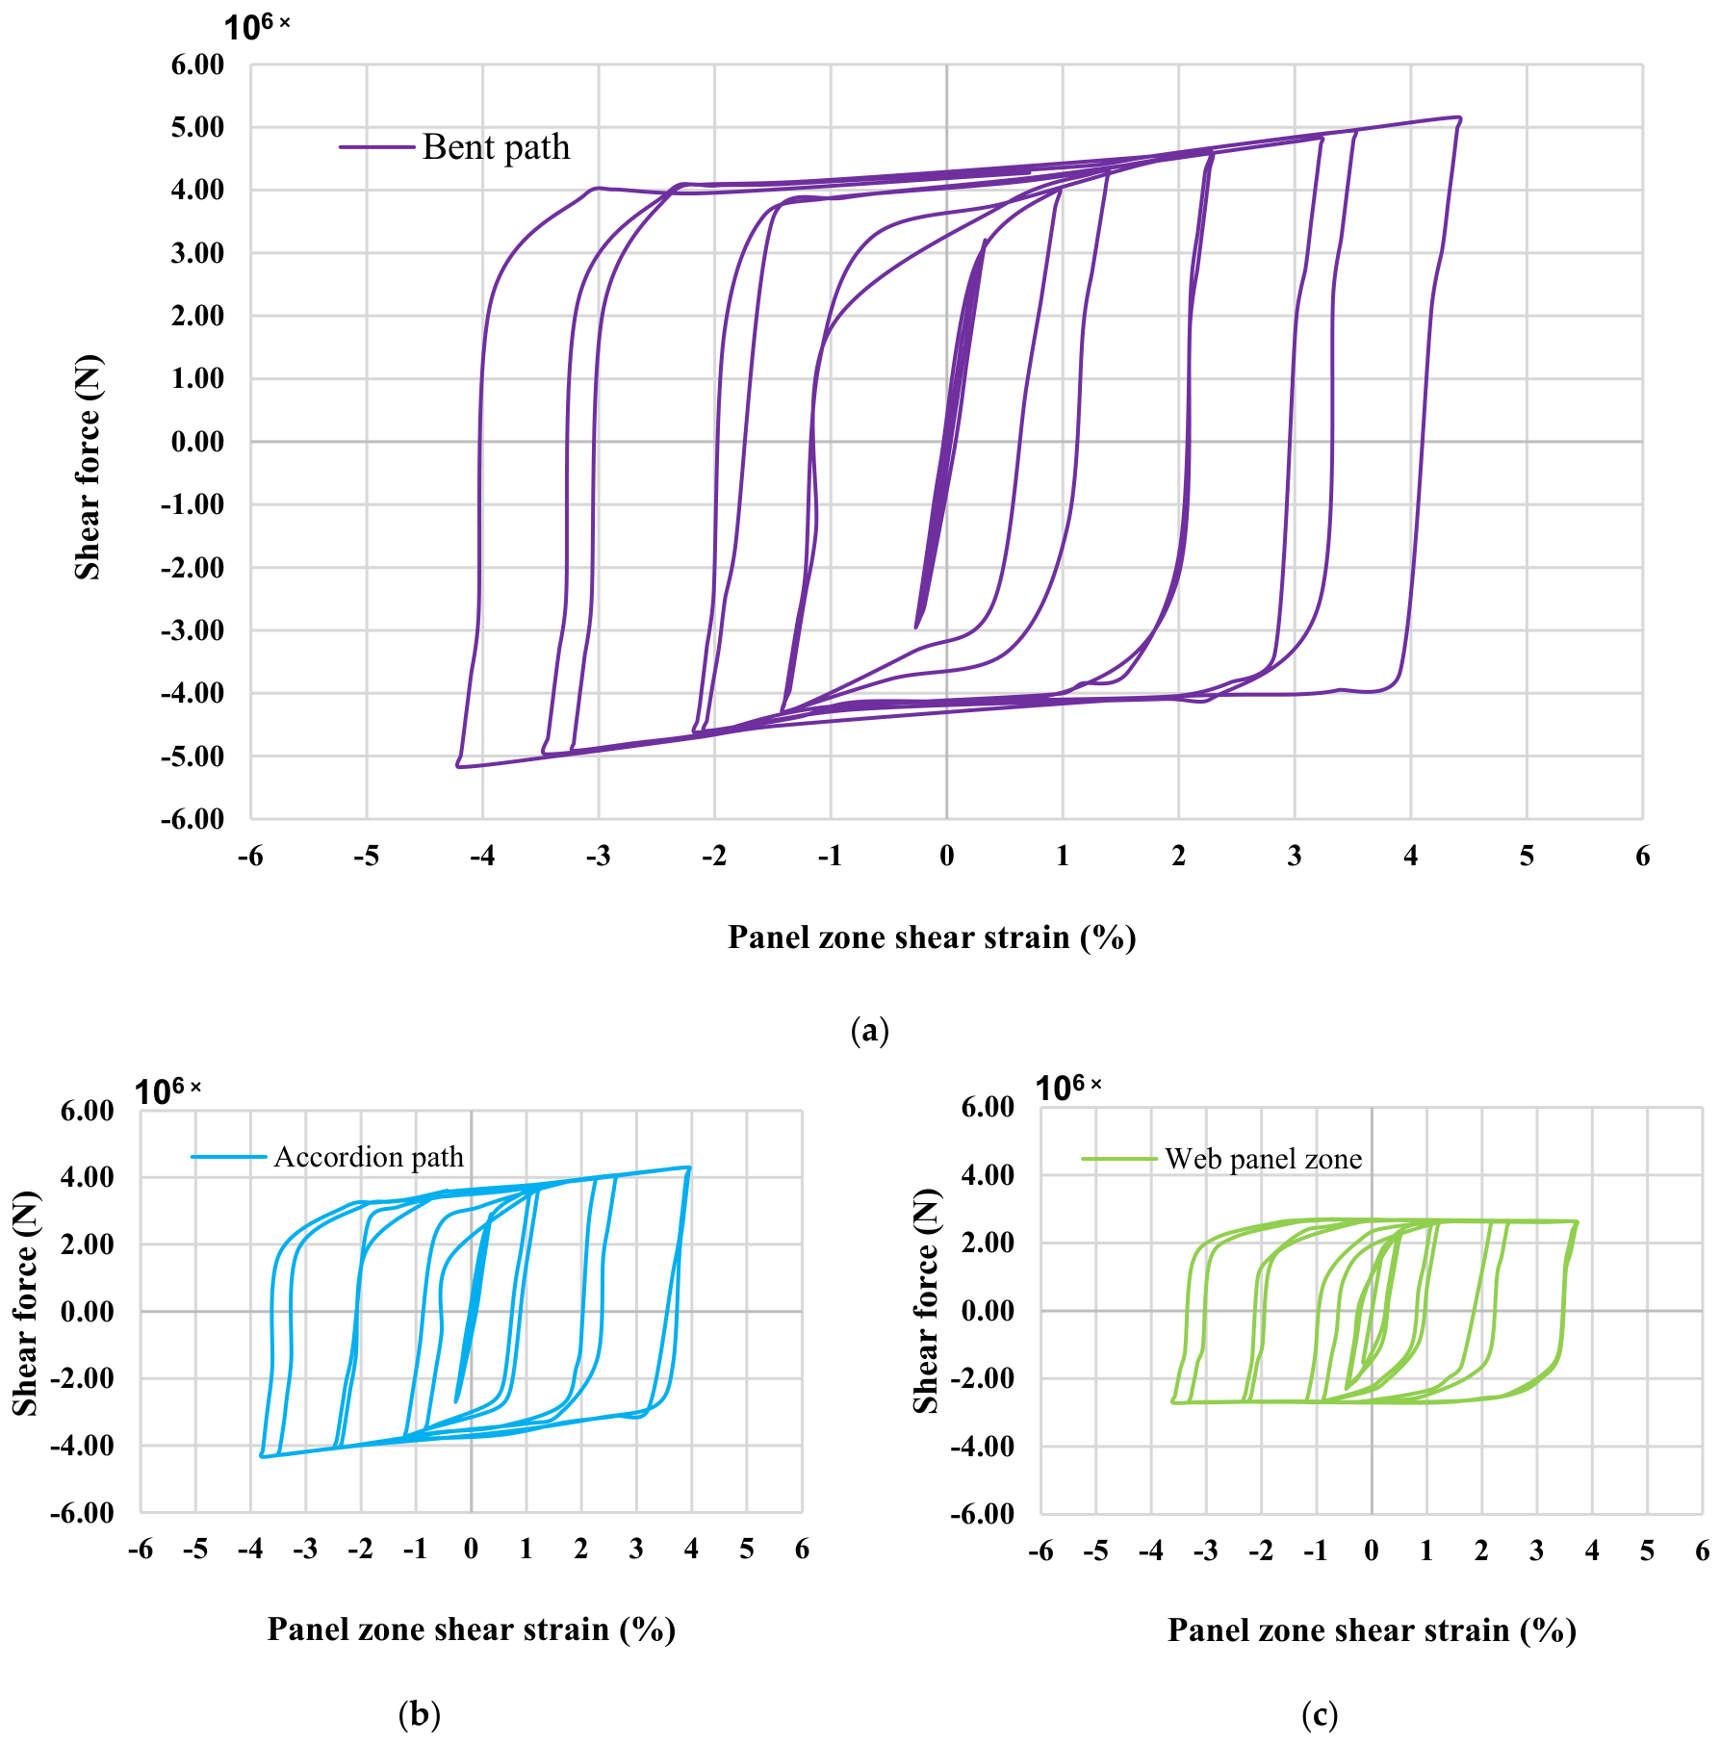

Disclaimer/Publisher’s Note: The statements, opinions and data contained in all publications are solely those of the individual author(s) and contributor(s) and not of MDPI and/or the editor(s). MDPI and/or the editor(s) disclaim responsibility for any injury to people or property resulting from any ideas, methods, instructions or products referred to in the content. |
© 2026 by the authors. Licensee MDPI, Basel, Switzerland. This article is an open access article distributed under the terms and conditions of the Creative Commons Attribution (CC BY) license.