


Abstract
Wind loading couples translation and torsion in eccentric structures, producing unequal accelerations at opposite edges. Optimizing the response at a single location or under a single generalized input does not ensure balanced acceleration control at both structural edges. We develop a frequency-domain minimax method for two tuned mass dampers (TMDs) forming a dual-TMD system. It minimizes the largest of four normalized edge-acceleration frequency-response peaks under separate unit generalized horizontal-force and torque inputs. With total TMD mass fixed, mass allocation, tuning frequencies, and damping ratios are optimized for each candidate placement. Under matched design and numerical settings, the maximum normalized peak is 0.346, below those from horizontal-force-only objectives targeting the center of mass, flexible edge, or both edges. Across 25 structural-parameter combinations, optimized tuning frequencies deviate from coupled modal frequencies by 2.2% on average. Relative to unchanged TMD parameters, layout-specific retuning across 32 cases reduces the objective by 24.2% on average. ETABS time-history analyses evaluate the proposed design under six realizations of spatially correlated fluctuating wind loading. Relative to the uncontrolled structure, the mean reductions in the maximum root-mean-square (RMS) and maximum absolute peak accelerations across both edges are 30.62% and 25.61%, respectively. These results provide a basis for the joint design of dual-TMD parameters and placement in eccentric structures.
1. Introduction
When the centers of mass and rigidity of a building do not coincide, lateral wind loading excites coupled translational and torsional motion, and the flexible and stiff edges of a rigid diaphragm develop different acceleration responses. For wind-induced vibration control, an objective defined only at the center of mass or at one edge does not directly constrain the larger acceleration at the other edge. Tuned mass dampers (TMDs) are widely used for building vibration control [1]. Jafari and Alipour [2] reviewed damping systems and aerodynamic approaches for mitigating wind-induced vibration in tall buildings. In eccentric structures, changing the TMD location changes the device contribution to translational and torsional response and therefore changes control performance. Previous studies show that torsional coupling influences the optimum plan location and that damper placement materially affects wind-response mitigation [3,4,5]. Accordingly, a dual-TMD (DTMD) design for an eccentric structure should target acceleration at both edges and determine mass allocation, tuning frequencies, and damping ratios for each candidate placement.
Research on translational–torsional vibration control has addressed TMD parameters, device location, and edge-response measures. Under wind-induced harmonic loading, Pansare and Jangid [5] compared single-, two-, and four-TMD configurations and jointly optimized the mass, frequency, damping, and position of two independent TMDs. Related seismic studies have investigated multiple-TMD designs and edge-based displacement or interstory-drift objectives for torsionally coupled buildings [6,7,8,9]. More recent work extends joint parameter–location optimization to multistory asymmetric buildings and double-tuned mass damper inerter systems [3,10]. These studies establish that damper parameters and placement must be designed in relation to the translational–torsional dynamics of the host structure.
For wind-excited eccentric structures, prior studies have also addressed correlated wind loading and frequency-domain parameter design. Pozos-Estrada and Hong [11] used spatially correlated fluctuating wind loads to examine how TMD number, location, and damping mechanism affect peak translational and torsional responses. Yu et al. [4] quantified the effects of eccentricity and in-plane location through an eccentric high-rise building–tuned liquid damper model. Transfer-function-based design can jointly determine TMD mass, stiffness, and damping [12], whereas multimodal H∞ optimization coordinates multiple resonance peaks [13]. Liu et al. [14] developed a frequency-domain genetic optimization method with a TMD stroke constraint and verified the design through shaking-table tests. Other studies have investigated inerter-based double TMDs [15], robust optimization of MTMD systems [16], and wind-induced vibration control and structural reliability of high-rise buildings [17,18,19,20,21]. In eccentric structures, device parameters and installation locations should be considered together because both affect translational and torsional responses.
The response measure used for optimization directly influences the selected DTMD design. Altering damper parameters or placement changes their contributions to the two coupled modes and, consequently, the relative magnitudes of the acceleration frequency-response peaks at the flexible and stiff edges under different generalized inputs. If the objective covers only one edge or one generalized input, the remaining edge–input combinations are not directly constrained by that objective; reducing a selected peak therefore does not establish control of the largest normalized frequency-response peak across both edges and input types. Pansare and Jangid [5] optimized TMD configurations for torsionally coupled structures under a wind-induced harmonic horizontal force applied at the center of mass, using the maximum lateral displacement normalized by the static displacement of the corresponding torsionally uncoupled structure. The present study considers acceleration responses at both edges under separately applied unit generalized horizontal-force and generalized-torque inputs. The resulting four frequency-response peaks are normalized by their respective uncontrolled peaks, and their maximum defines the minimax objective. This same objective is used to reoptimize mass allocation, tuning frequencies, and damping ratios for each candidate discrete layout under a fixed total TMD mass and to rank the layouts by their optimized objective values.
This study develops a frequency-domain minimax method for DTMD edge-acceleration control in eccentric structures. The objective minimizes the largest of four normalized acceleration frequency-response peaks at the flexible and stiff edges under separately applied unit generalized horizontal-force and generalized-torque inputs. Under a fixed total damper mass, mass allocation, tuning frequencies, and damping ratios are optimized separately for each discrete layout, enabling comparison on the basis of attainable tuned performance. The proposed objective is first compared, under identical constraints, with horizontal-force-only objectives targeting the center of mass, the flexible edge, and both edges. Then, 25 structural-parameter combinations and 32 layout cases are used to examine the effects of eccentricity, torsional-to-translational frequency ratio, and layout-specific retuning. Finally, the four optimized designs are implemented in the ETABS model and compared with the uncontrolled structure under the same six realizations of spatially correlated fluctuating wind loading, using RMS and absolute peak accelerations at both edges.
2. Theoretical Model and Methods
2.1. Analysis Framework and Modeling Assumptions
The model assumes a rigid floor diaphragm and linear elastic behavior. The primary structure is represented by translation in the control direction and torsional rotation about the vertical axis. The two TMDs move only in the control direction and are not directly connected to each other. Rayleigh damping is adopted for the primary structure, and linear viscous damping is used for the TMDs. Symmetric dimensionless coordinates are used for the structural edges and candidate TMD locations in the parametric study, whereas the actual geometry, mass distribution, and load distribution are retained in the ETABS case study.
2.2. Dynamic Model of the Eccentric Structure–Dual-TMD System
2.2.1. Uncontrolled Structure and Edge Responses
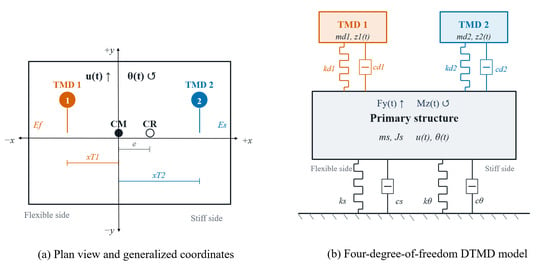
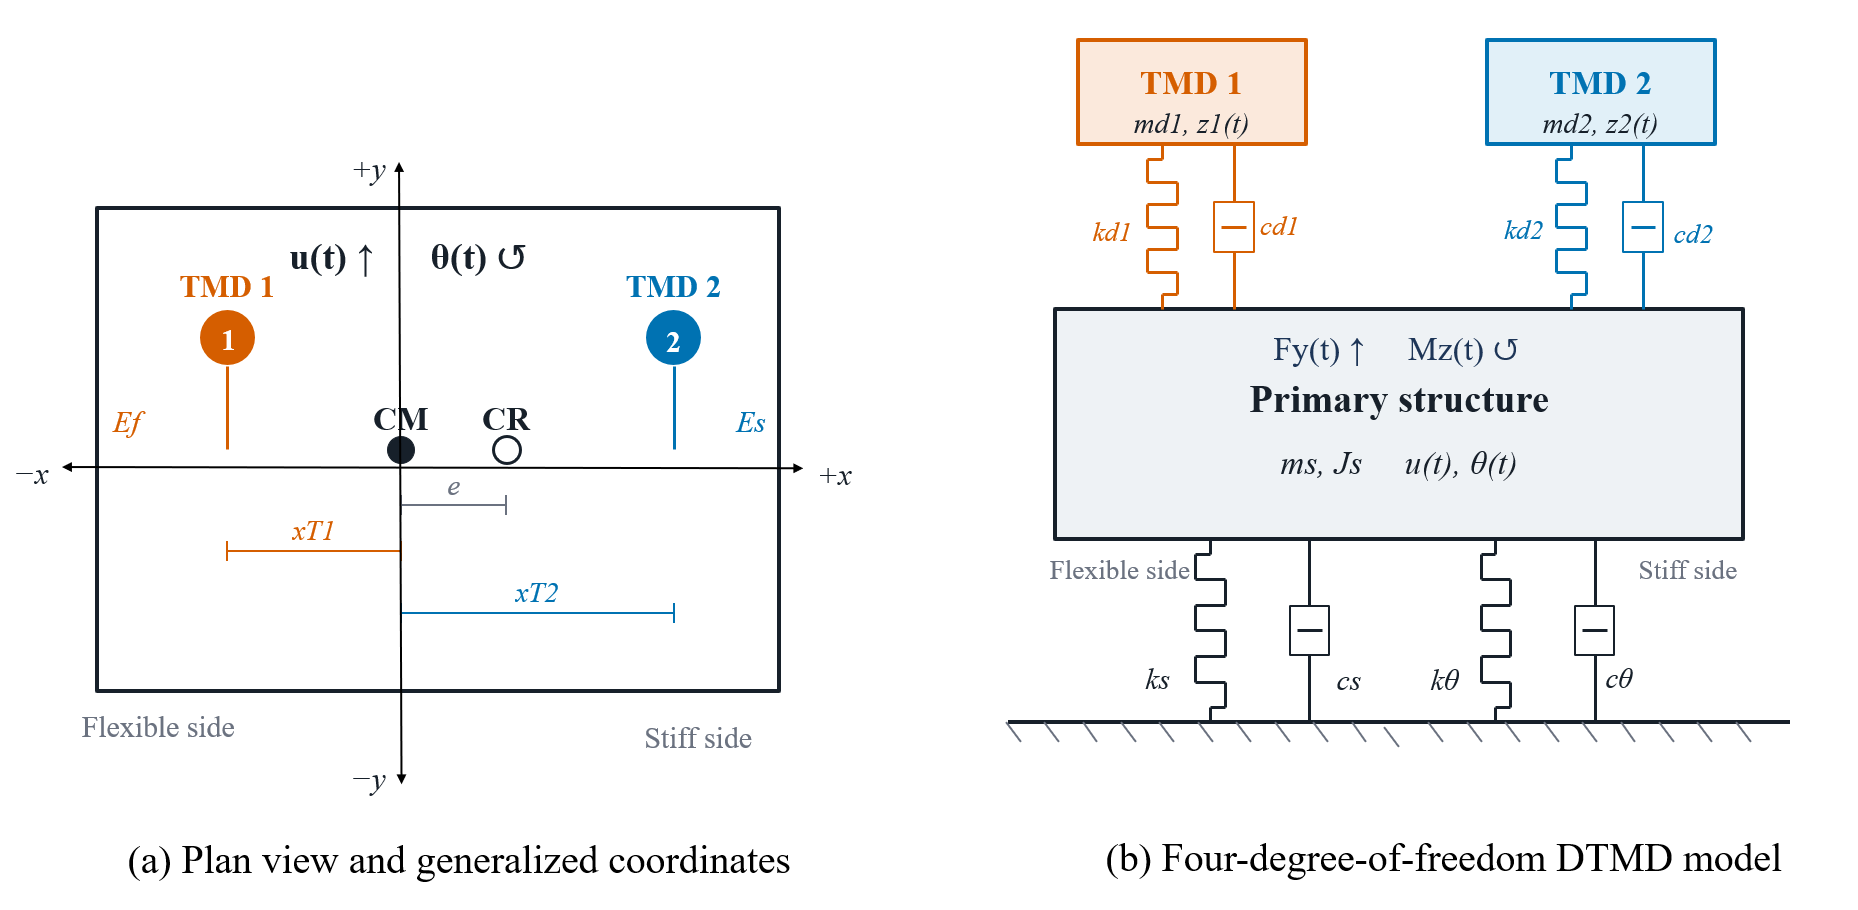
Figure 1 illustrates the structural model and the dual-TMD system. With the origin at the center of mass, the generalized coordinate vector of the primary structure is defined in Equation (1).
Figure 1.
Dynamic model of the eccentric structure–dual-TMD system with translational–torsional coupling. TMD, tuned mass damper.
Here u is the translational displacement in the control direction and θ is the torsional rotation about the center of mass. The equations of motion of the uncontrolled structure are given in Equation (2).
The mass and stiffness matrices are
Here, ms and Js are the equivalent structural mass and the mass moment of inertia about the center of mass, respectively; ks is the translational stiffness; e is the stiffness eccentricity; and kθ is the torsional stiffness about the center of mass. The structural damping matrix is defined by the Rayleigh damping model in Equation (4).
For a response location with transverse coordinate xi relative to the center of mass, the displacement and acceleration in the control direction are given in Equation (5).
For e > 0, the negative-coordinate side is the flexible side and the positive-coordinate side is the stiff side; the designations reverse when the eccentricity changes sign. For e = 0, the structure is symmetric, and the two sides are identified by their negative and positive coordinates. Evaluation at both edges captures the maximum acceleration produced by the combined translational and torsional response.
The case study considers a single-story reinforced concrete frame with plan dimensions of 40 m × 24 m and a story height of 5 m. The parameters of the two-degree-of-freedom (2-DOF) model are extracted from ETABS and calibrated against the first two coupled translational–torsional modal frequencies. The model parameters are listed in Table 1. The relative frequency errors are 8.09 × 10⁻³% and 1.14 × 10⁻¹%, respectively (Table 2), showing close agreement with the first two coupled modal frequencies of the ETABS model.
Table 1.
Parameters of the two-degree-of-freedom model for the case study.
Table 2.
Comparison of coupled modal frequencies between the 2-DOF model and ETABS.
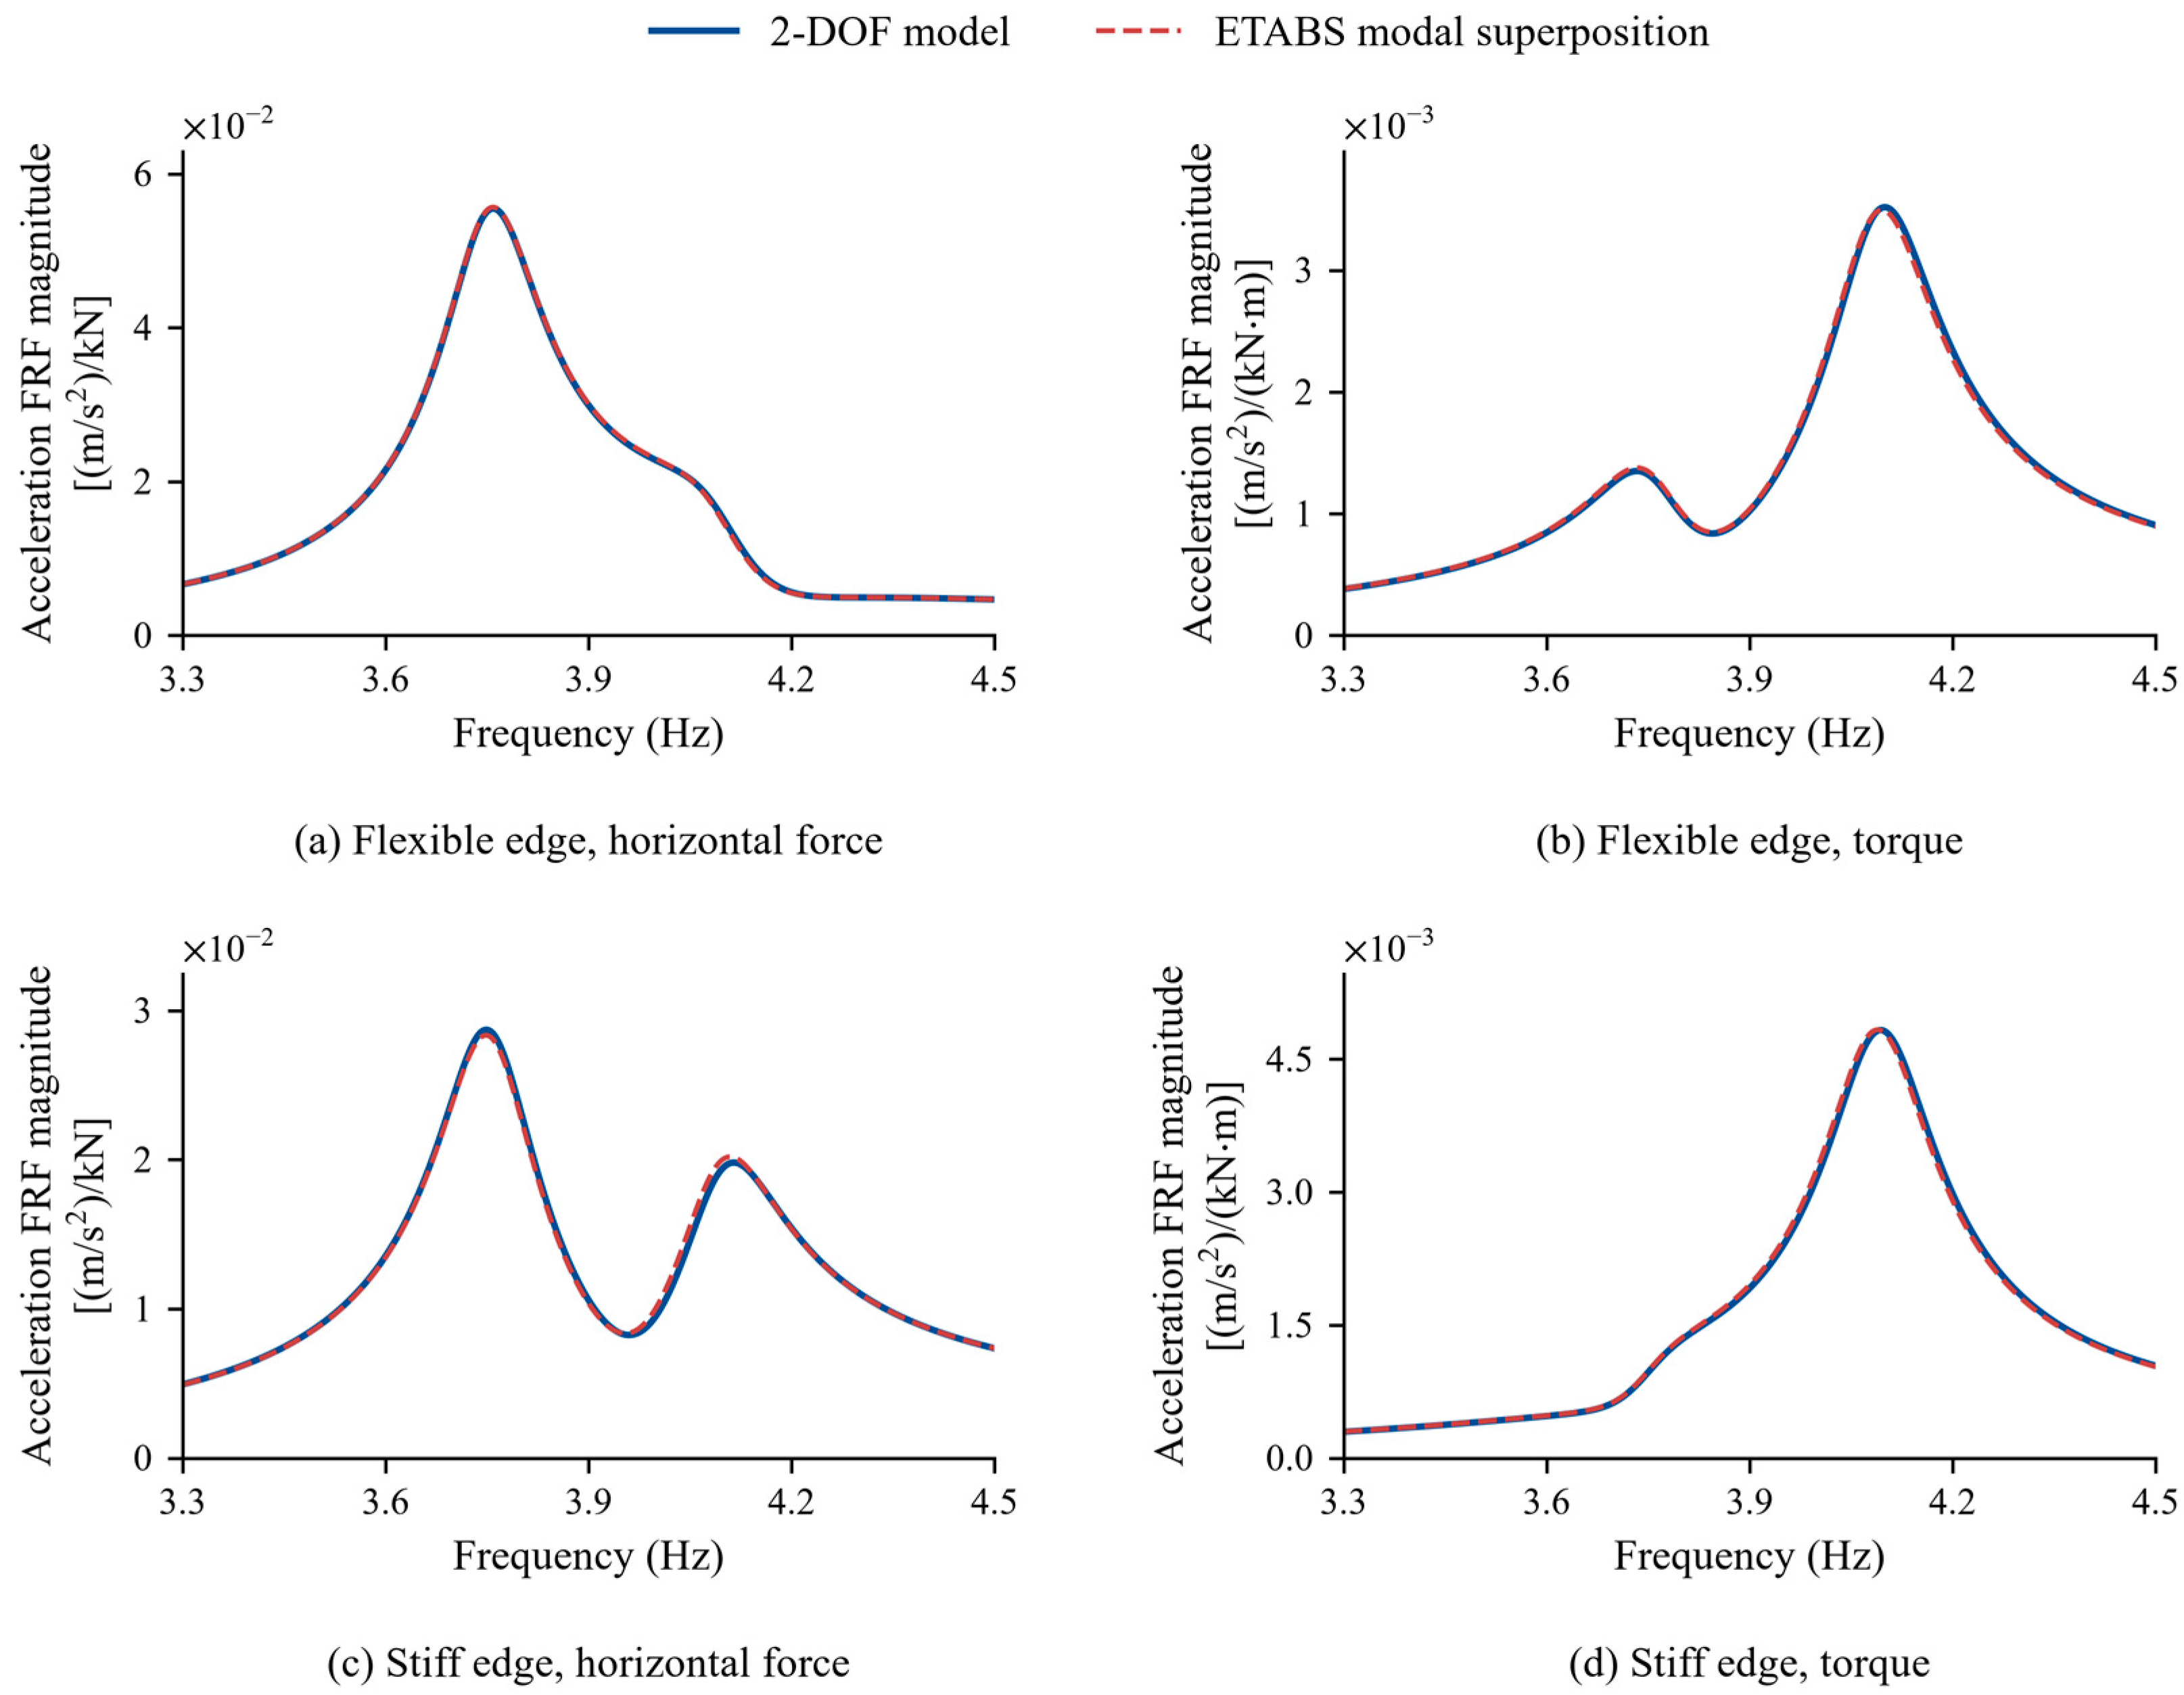
The uncontrolled edge-acceleration frequency responses are also evaluated by modal superposition using the natural frequencies, diaphragm center-of-mass mode shapes and modal masses exported from ETABS. The mode shapes are mass-normalized to calculate the modal forces and edge responses. ETABS global Modes 2 and 3 describe the coupled translation in global Y and rotation about Z; global Mode 1 makes a negligible contribution to these components. A horizontal force of 1 kN and a torque of 1 kN·m are applied separately at the center of mass. Both models use the Rayleigh damping coefficients in Table 1 and the same edge-response locations. The responses are evaluated at 32,001 frequency points over 0–6.55 Hz, with further refinement around the resonance peaks.
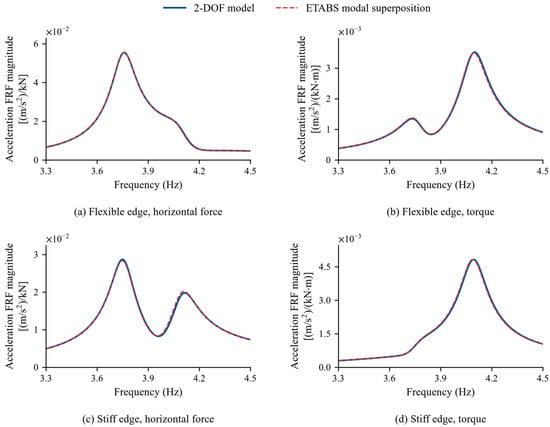
Figure 2 compares the frequency-response magnitudes in the resonance region. For each model, the four curves contain six resonance peaks in total. The maximum absolute relative differences in the frequencies and amplitudes of corresponding peaks are 0.13% and 1.95%, respectively. This agreement supports the use of the 2-DOF model to represent the edge-acceleration resonance characteristics used in the optimization.
Figure 2.
Uncontrolled edge-acceleration frequency responses of the 2-DOF model and modal superposition using ETABS results under common Rayleigh damping: (a) flexible edge, horizontal-force input; (b) flexible edge, torque input; (c) stiff edge, horizontal-force input; (d) stiff edge, torque input.
2.2.2. Four-Degree-of-Freedom Equations of the Dual-TMD System
Let z1 and z2 denote the absolute displacements of the two TMDs, and let xT1 and xT2 denote their transverse installation coordinates relative to the center of mass. The generalized coordinate vector of the system is defined in Equation (6).
The relative displacement across the connection of the jth TMD and the corresponding connection vectors are given in Equations (7) and (8), respectively.
The equations of motion of the dual-TMD system are given in Equation (9).
The mass, stiffness, and damping matrices are defined in Equations (10)–(12), respectively, and the input matrix is given in Equation (13).
The matrices Ks4 and Cs4 are obtained by expanding the stiffness and damping matrices of the primary structure to the four-degree-of-freedom system. This outer-product formulation follows directly from the relative displacements across the TMD connections and preserves the symmetry of the mass, stiffness, and damping matrices.
2.2.3. Dimensionless Parameters and Conversion to Dimensional TMD Properties
The radius of gyration r, reference translational angular frequency ωs, and dimensionless time τ are defined in Equation (14).
For the jth TMD, the mass ratio μj, tuning frequency ratio νj, damping ratio ζj, and dimensionless installation coordinate are defined in Equation (15).
The dimensionless structural eccentricity and torsional-to-translational frequency ratio λθ are defined in Equation (16).
Here, kθ0 is the torsional stiffness obtained after eliminating the static translational–torsional coupling, and λθ expresses the ratio of the uncoupled torsional and translational characteristic frequencies. The dimensionless stiffness matrix of the primary structure is given in Equation (17).
Using the radius of gyration r as the displacement scale, the dimensionless generalized coordinate vector is defined as
The torsional rotation θ is dimensionless. Primes denote differentiation with respect to the dimensionless time τ = ωst defined in Equation (14). With S = diag(r,1,r,r), the dimensional and dimensionless coordinates are related by
The physical generalized-force vector comprises a generalized horizontal force and a generalized torque, which are nondimensionalized by ksr and ksr2, respectively:
Substituting these relations into Equation (9) and premultiplying by yields
The input matrix Bp is unchanged from Equation (13). The dimensionless mass, stiffness, and damping matrices are given in Equations (22)–(24), respectively.
The dimensionless connection vectors in Equations (23) and (24) are
Consistent with the relative displacement defined in Equation (7),
The matrices and are formed by placing the corresponding dimensionless stiffness and damping matrices of the primary structure in the upper-left 2 × 2 blocks of otherwise zero 4 × 4 matrices. The dimensionless structural damping matrix is
where αR and βR are the Rayleigh damping coefficients in Equation (4).
After optimization, the dimensionless parameters are converted to dimensional TMD masses, natural frequencies, stiffnesses, and damping coefficients using
2.3. Frequency Response Functions and Optimization Objective
Let denote the dimensionless excitation frequency. The dimensionless dynamic stiffness matrix of the dual-TMD system is defined in Equation (30), and the acceleration frequency response matrix for the two structural edges is given in Equation (31). The two rows of Ha(Ω) correspond to the two edge response locations, while its two columns correspond to separately applied unit generalized horizontal-force and generalized-torque inputs defined in Section 2.2.3. The matrix thus maps dimensionless inputs to dimensionless edge accelerations.
For edge p and input type c, the normalized peak frequency response is defined in Equation (32), with the norm specified in Equation (33). Both the numerator and denominator are the maximum absolute values of the respective frequency response functions over the prescribed frequency range. The superscript (0) denotes the uncontrolled structure with the same structural parameters, response location, input type, and frequency range. Normalization by the corresponding uncontrolled response removes the influence of differences in input units and absolute response scales on the optimization objective.
With the total TMD mass ratio fixed at μT = 0.02, the design variables and mass allocation are defined in Equation (34).
The objective function Jedge is given in Equation (35).
It is the largest of the four normalized peak acceleration frequency responses obtained at the two edges under separately applied unit generalized horizontal-force and generalized-torque inputs. The two input cases are and , corresponding to the generalized horizontal-force and generalized-torque inputs, respectively. Dual-TMD frequency-domain optimization minimizes Jedge over the bounds 0.05 ≤ η1 ≤ 0.95, 0.3 ≤ ν1,ν2 ≤ 2.4, and 0.001 ≤ ζ1,ζ2 ≤ 0.5. The TMDs are indexed by their installation locations; therefore, no frequency-ordering constraint of the form ν1 ≤ ν2 is imposed.
Under wind loading, the force- and torque-induced responses combine according to their amplitudes and relative phase. The time-history analysis in Section 2.6 evaluates this combined response using generalized force and torque histories derived from the same spatially correlated nodal wind loads.
2.4. Structural Parameters and Discrete Damper Layouts
2.4.1. Dimensionless Structural Parameter Combinations
The parametric study uses the 5 × 5 combinations of dimensionless eccentricity and torsional-to-translational frequency ratio specified in Equation (36).
The damping ratios of the first two structural modes are both set to 2%, and the total mass ratio of the dual-TMD system is fixed at 0.02 in all cases. The allocation coefficient is bounded between 0.05 and 0.95 so that each TMD retains at least 5% of the total damper mass, preserving the dual-TMD configuration. The structural edges and baseline TMD locations are assigned symmetric dimensionless coordinates of ±ρ, with ρ = 1.41. The common distance from the origin is obtained by averaging the dimensionless distances from the center of mass to the two edges of the building model. The reduced-order frequency-response evaluation uses these symmetrized coordinates, whereas the ETABS time-history analysis retains the actual coordinates. The structural parameters and design-variable bounds are summarized in Table 3.
Table 3.
Structural parameters and dual-TMD design variables.
The mass allocation, tuning frequencies, and damping ratios are reoptimized for each structural parameter combination. For a symmetric structure, exchanging the two TMDs yields equivalent solutions; a consistent indexing convention is used when summarizing the results.
2.4.2. Comparison of Discrete Installation Locations
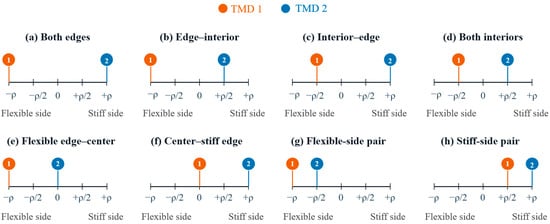
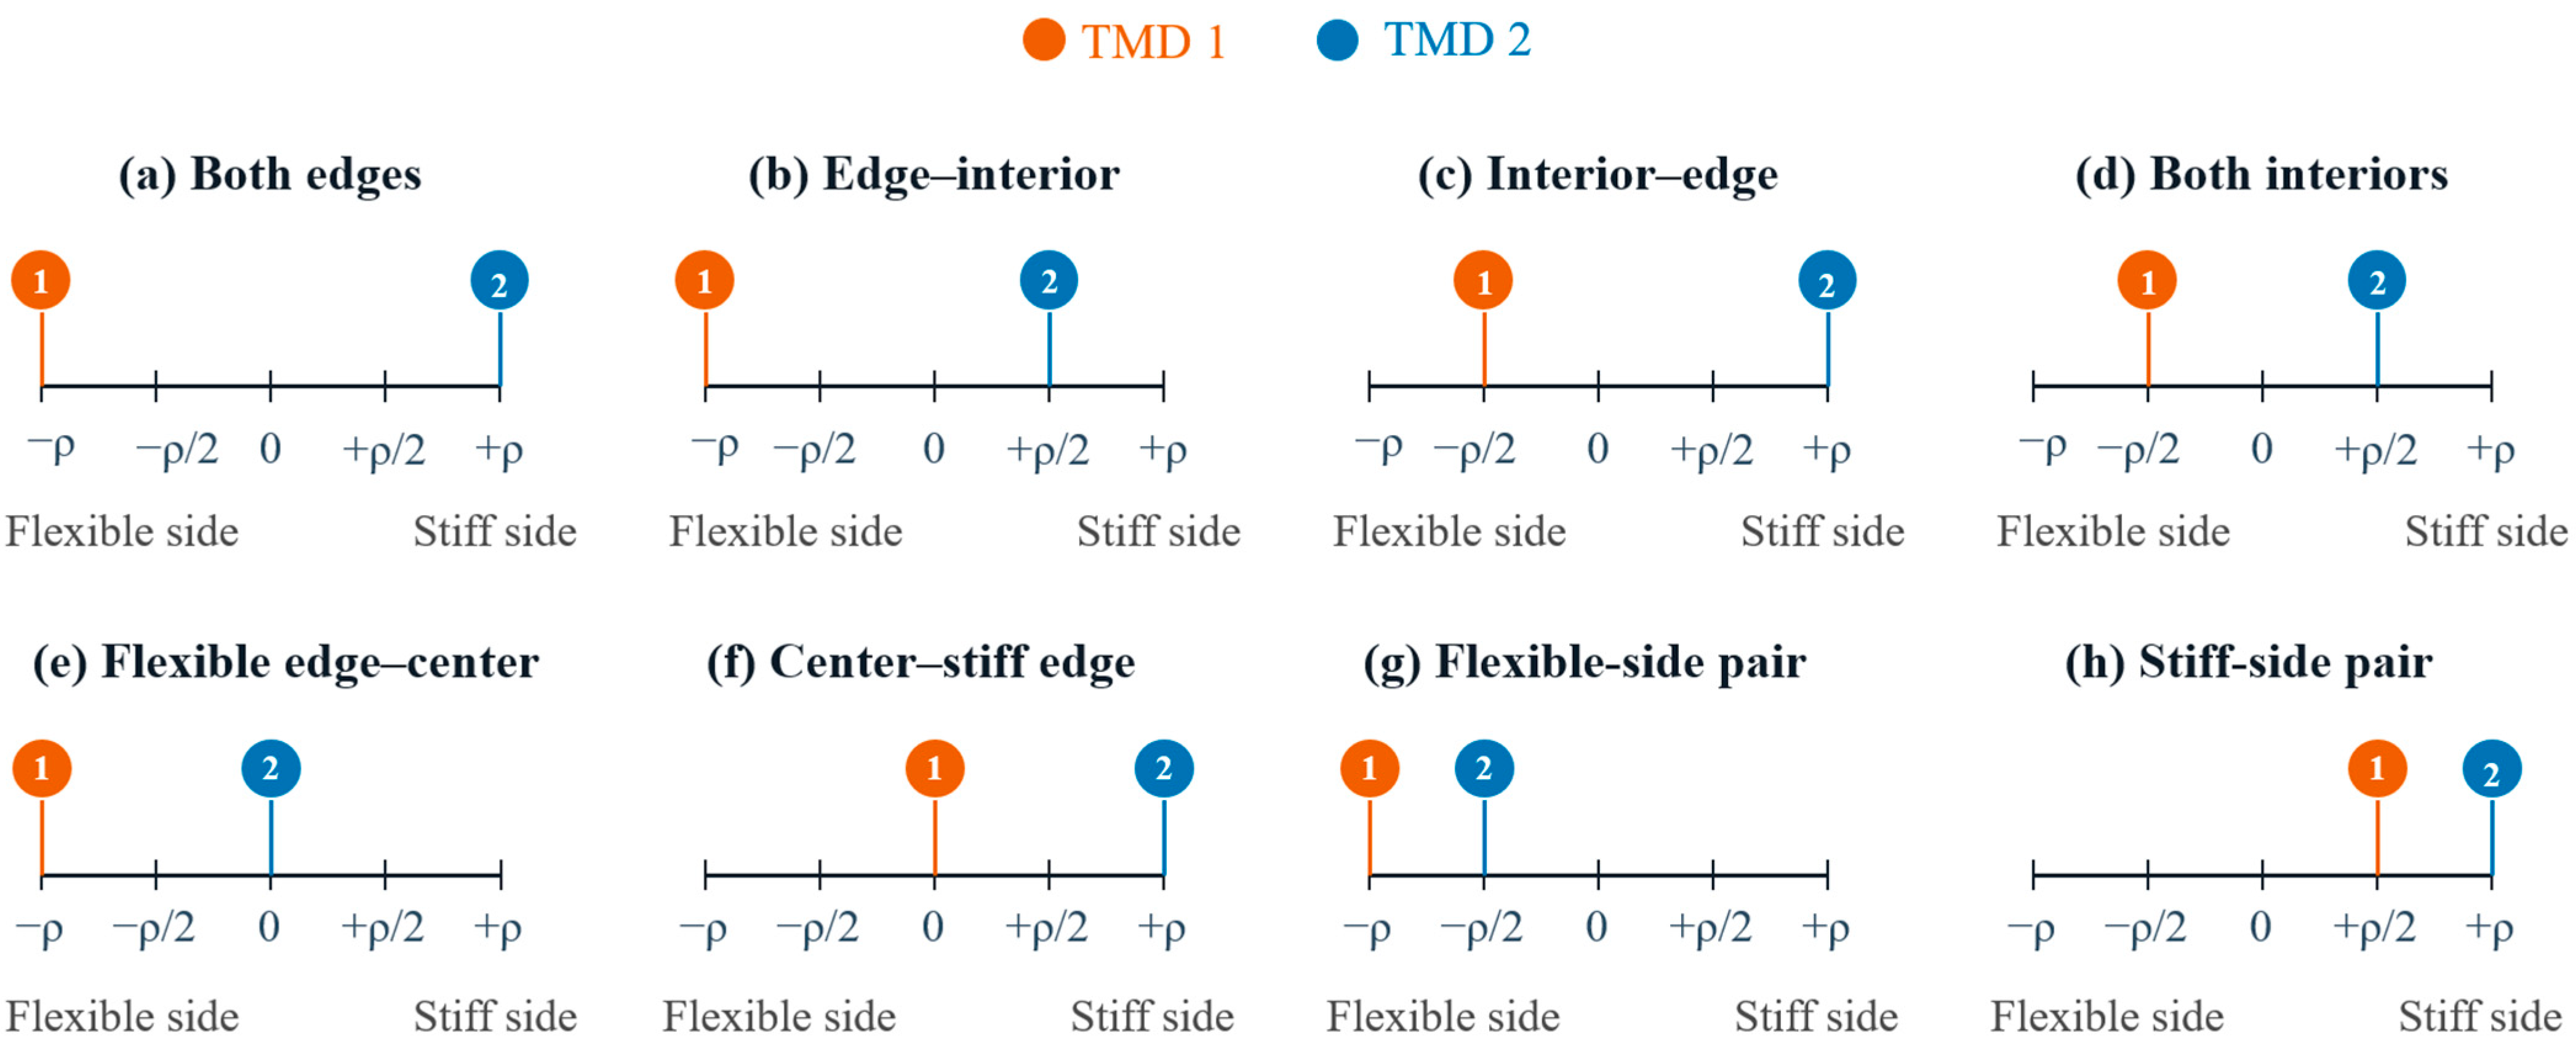
Four representative combinations, = (0, 1), (0.05, 1.2), (0.3, 1), and (0.3, 2), are selected from the 25 structural cases. They cover zero to relatively large eccentricity and both closely spaced and well-separated coupled modal frequencies. Eight discrete layouts with noncoincident TMD locations are constructed using the two edges, interior locations, and the center of mass, as shown in Figure 3 and Table 4.
Figure 3.
Candidate discrete layouts of the dual-TMD system.
Table 4.
Discrete dual-TMD layouts.
Two analyses are performed for each layout. In the first, only the installation locations are changed, while the masses, tuning frequencies, and damping ratios optimized for the two-edge baseline layout remain unchanged. In the second, the mass allocation, tuning frequencies, and damping ratios are reoptimized at the new locations. This comparison distinguishes the direct effect of relocation from the compensating effect of retuning. Placement is selected by comparing the discrete layouts, with continuous parameter optimization performed separately for each layout.
2.5. Optimization Algorithm and Independent Numerical Verification
The numerical optimization was implemented in MATLAB R2024b using Halton sequence sampling, multistart sequential quadratic programming (SQP), and refinement of candidate solutions. The structural parameter study uses 1024 samples and 16 starting points, whereas the layout study uses 768 samples and 12 starting points. Screening, local SQP, and refinement use uniformly spaced frequency grids of 601, 1601, and 8001 points, respectively; Table 5 summarizes these two studies. For the comparison in Section 3.2, all four objectives use identical tuning-ratio bounds of 0.6–1.4, the same 1536-point Halton sample and common reference seeds, exactly 24 starting points per objective, and six refinement candidates. The SQP iteration limits, function-evaluation limits, and convergence tolerances are also identical across the four objectives. Search sufficiency is checked by increasing the budget to 3072 Halton samples, 48 starting points, and eight refinement candidates, followed by independent verification on a 32,001-point grid with the upper frequency limit increased by 20%.
Table 5.
Settings for optimization and independent numerical verification.
The upper limit of the optimization frequency range is defined in Equation (37).
where Ωh,2 is the second dimensionless natural frequency of the primary structure and ν1,u and ν2,u are the upper bounds on the TMD tuning frequency ratios.
The final parameter sets are reevaluated on an independent grid of 32,001 frequency points, with the upper frequency limit extended by 20%. Verification includes checks of the design-variable bounds, total mass constraint, frequency-domain equation residuals, condition number of the dynamic stiffness matrix, and whether response peaks occur at the frequency-range boundaries. The reported solutions are optimized within the prescribed variable bounds and checked through this independent procedure.
2.6. ETABS Model and Time-History Analysis Under Fluctuating Wind Loads
2.6.1. Building Model and Implementation of the Optimized Parameters
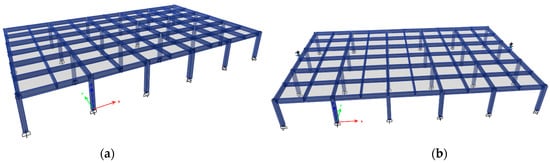
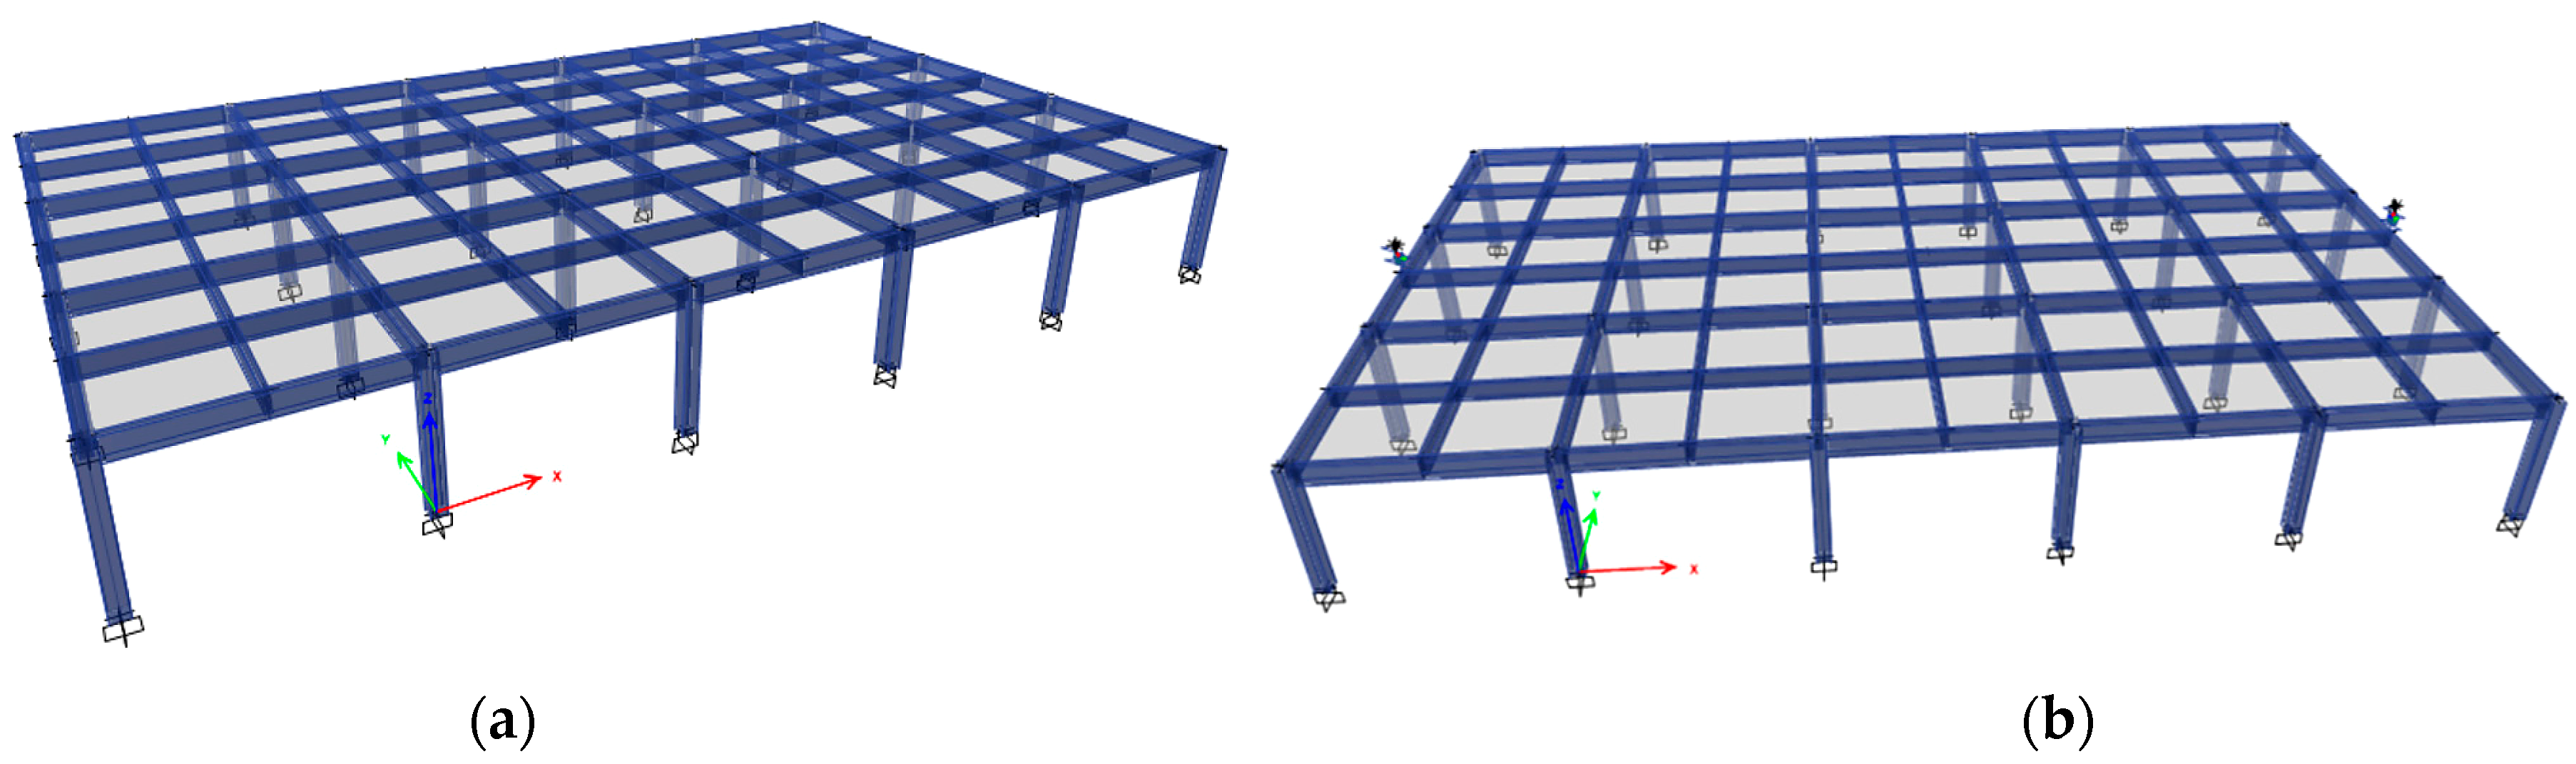
The ETABS 22 model represents a single-story reinforced concrete frame with plan dimensions of 40 m × 24 m and a story height of 5 m. A rigid diaphragm is assigned to the floor, and the column bases are fixed. The mass source comprises the dead load, 50% of the live load, and additional joint masses, with only lateral mass included. The uncontrolled and dual-TMD-controlled models are shown in Figure 4. The member properties and modeling settings are summarized in Table 6.
Figure 4.
ETABS models used in the case study: (a) uncontrolled structure; (b) dual-TMD-controlled structure.
Table 6.
Main specifications of the ETABS building model.
The optimized dimensionless parameters are converted to TMD masses, stiffnesses, and damping coefficients using the relations in Section 2.2.3. The controlled and uncontrolled models are otherwise identical. Only the global Y-direction translational degree of freedom is retained at each TMD mass node.
2.6.2. Fluctuating Wind Load Time Histories and Response Measures
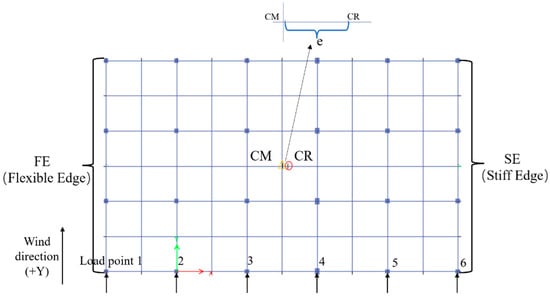
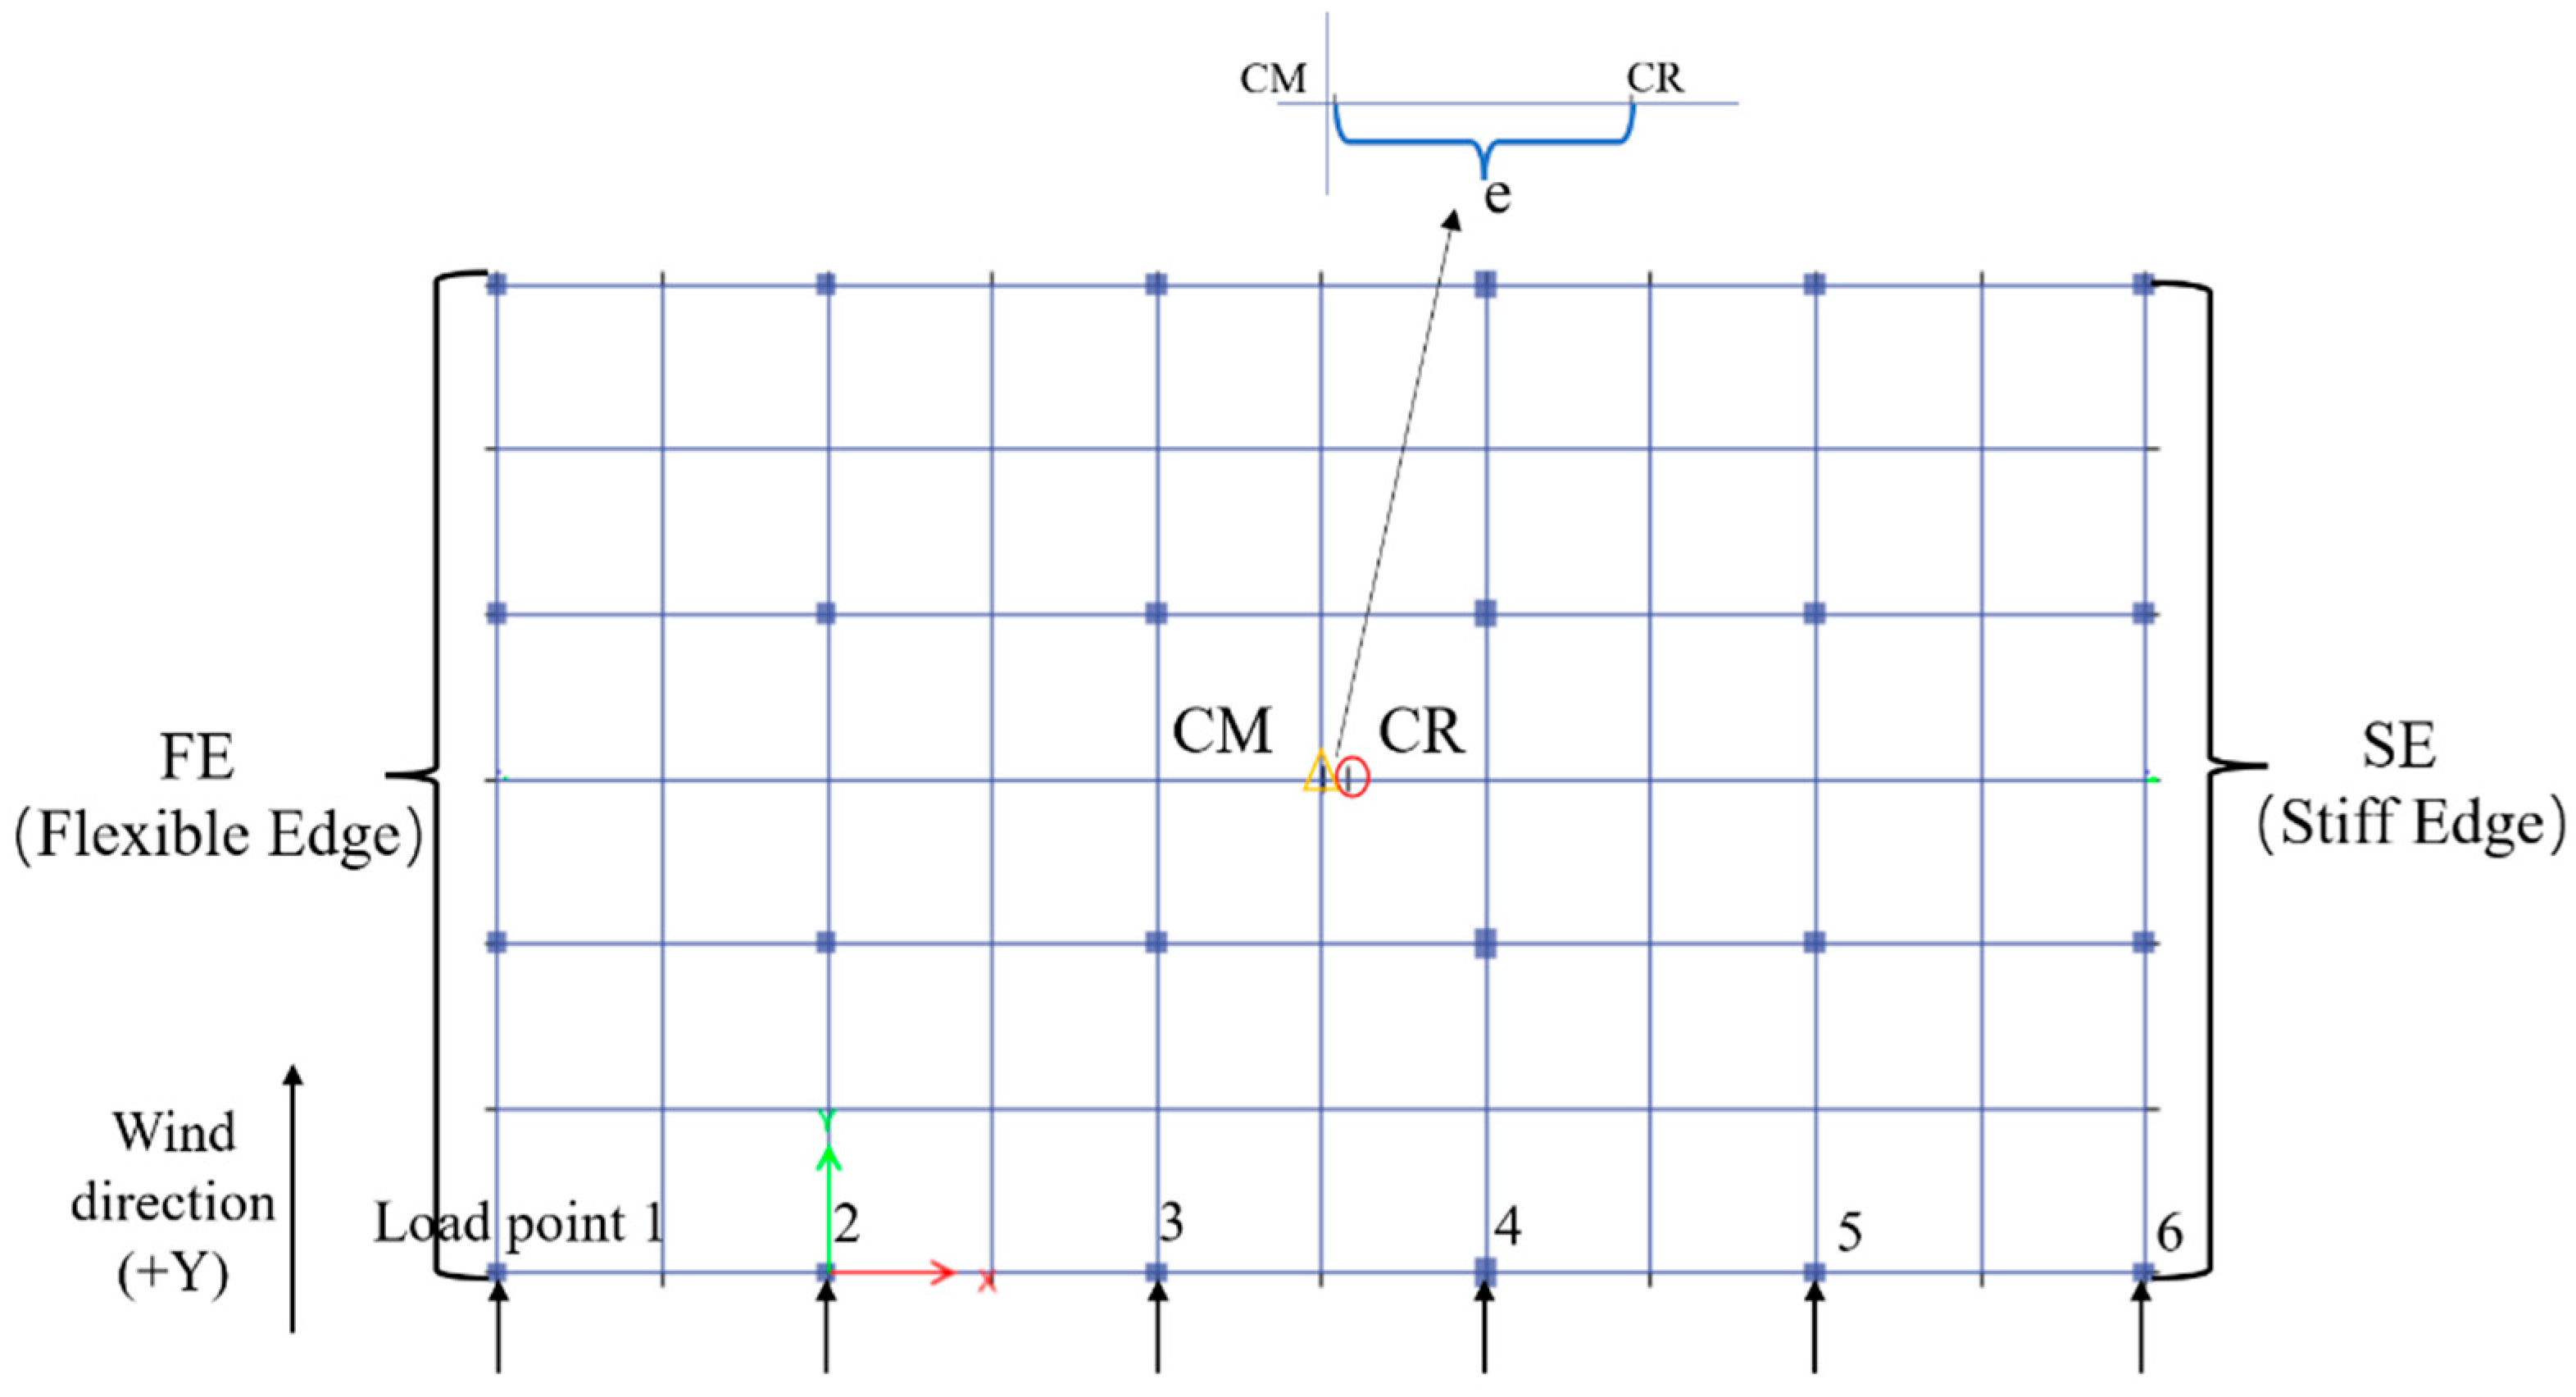
Six wind-load realizations, each comprising six spatially correlated fluctuating wind-load time histories, were generated using WindHist Producer (Version V20140319; developed by Dr. Dino Chen) based on the Davenport wind-speed spectrum. A horizontal wind-direction parameter of 90° was specified in WindHist Producer. Spatial correlation was specified using the program parameters Cx = Cy = 16 and Cz = 10. The sampling interval was 0.02 s, and each retained record contained 6000 data points, corresponding to a duration of 120 s. Before being imported into ETABS, the mean component of each record was removed, and a gradual ramp was applied at the beginning of the record. The processed histories were applied at the six loading points shown in Figure 5 in the global +Y direction. The corresponding dimensional nodal loads were obtained using Equation (38), and the complete time-history generation settings are provided in the Supplementary Materials. The six processed input sets are provided in Data S1.
Figure 5.
Plan view of the building model showing the centers of mass and rigidity and the application points of the fluctuating wind loads.
The transverse coordinates of the six load application points in the coordinate system shown in Figure 5 are xj = (−8, 0, 8, 16, 24, 32) m. The fluctuating wind load applied at the jth loading point is expressed as
Here, gj(t) is the dimensionless time-history function associated with loading point j, F0 is the reference wind-load amplitude at the interior loading points, and sj is the corresponding spatial scaling coefficient. In the present case study, the reference amplitude was F0 = 52 kN at each of the four interior loading points. Because the tributary width of each end loading point was half that of an interior point, the two end points used sj = 0.5, corresponding to 0.5F0 = 26 kN. The four interior points used sj = 1. These amplitudes scale the corresponding time-history functions and do not represent the instantaneous peak wind loads. The controlled and uncontrolled models use the same time histories and scaling coefficients.
The corresponding generalized horizontal force Fy(t) and generalized torque Mz(t) of the 2-DOF generalized-force vector are obtained using Equation (39) by summing the point loads and their moments about the center of mass, respectively. The coordinate xCM is 12.0157 m in the same coordinate system as the loading points. The flexible and stiff edges are at global coordinates −8 and 32 m, respectively, giving signed moment arms of −20.0157 and 19.9843 m. With point loads expressed in kN and coordinates in m, the factor 103 in Equation (39) gives the generalized horizontal force in N and the generalized torque in N·m. Both generalized load components act simultaneously in the time-history analysis, retaining the relative amplitudes and timing prescribed by the spatially correlated nodal histories.
Each input time history contains 6000 equally spaced data points with a sampling interval of 0.02 s. The input ordinates specified at intervals of 0.02 s were linearly interpolated to match the analysis and output time step of 0.01 s. Linear direct-integration time-history analysis is performed in ETABS using the Hilber–Hughes–Taylor (HHT) method with α = 0, β = 0.25, and γ = 0.5. With these parameters, the method is equivalent to the Newmark average acceleration method. The time step for both analysis and output is 0.01 s, and the total duration is 120 s. Responses are evaluated over 20–100 s to exclude the initial transient response. For each wind realization, all comparison models use the same input functions, primary-structure damping and integration settings, as summarized in Table 7. The same load-case Rayleigh damping coefficients are used for all four ETABS designs. The Link stiffness-proportional damping modification factor is 1, and the assigned TMD viscous damping is included additionally.
Table 7.
Settings for time-history analysis under fluctuating wind loads.
Both the root-mean-square (RMS) acceleration and the absolute peak acceleration are evaluated at each edge. The RMS acceleration ratio JRMS is defined in Equation (40) as the larger of the two edge RMS accelerations in the controlled structure divided by the corresponding larger value in the uncontrolled structure under the same wind load realization.
For each realization, the maximum absolute peak acceleration is the larger of the maximum absolute accelerations at the two edges over 20–100 s. Each reduction percentage is calculated as the uncontrolled minus controlled response, divided by the uncontrolled response under the same realization. The mean, sample standard deviation and range of the six reduction percentages are reported. Each of the four designs retains its optimized TMD parameters throughout.
3. Results
3.1. Numerical Optimization and Independent Verification
The independent checks establish the numerical consistency of the solutions used in the following design comparisons. All 25 structural parameter cases and 32 layout cases satisfy the design-variable bounds and total mass constraint. The maximum relative change in the objective under frequency-grid refinement is 4.93 × 10⁻⁵, and the normalized frequency-domain equilibrium residuals remain below 2.26 × 10⁻¹⁵ (Table 8).
Table 8.
Results of independent numerical verification.
3.2. Comparison of Objective Functions Under Common Physical and Numerical Settings
The case-study structure has a dimensionless eccentricity of and a torsional-to-translational frequency ratio of λθ = 1.0793. The total TMD mass ratio is μT = 0.02, and the two TMDs are fixed at the two edges of the symmetrized reduced-order model. Let Rp,c denote the normalized peak acceleration frequency response at location p under generalized input c, where p ∈ {CM,f,s} and c ∈ {F,M}. The subscripts CM, f, and s denote the center of mass, flexible edge, and stiff edge, respectively; F and M denote the generalized horizontal-force and generalized-torque inputs.
The objectives for Designs 1–4 are, respectively: the normalized peak center-of-mass response under the generalized horizontal-force input (Design 1), JCM,F = RCM,F; the normalized peak flexible-edge response under the generalized horizontal-force input (Design 2), Jf,F = Rf,F; the larger of the two normalized peak edge responses under the generalized horizontal-force input (Design 3), Jedge,F = max{Rf,F,Rs,F}; and the proposed objective (Design 4), Jedge = max{Rf,F,Rf,M,Rs,F,Rs,M}.
The choice of response objective changes the controlling edge–input combination even when the total mass, installation locations, and design-variable bounds are fixed. The first three objectives yield designs with Jedge values of 0.5683, 0.8774, and 0.3702, compared with 0.3458 when Jedge is minimized directly (Table 9), corresponding to reductions of 39.2%, 60.6% and 6.6%, respectively, for Design 4. Minimizing the flexible-edge response under the generalized horizontal-force input gives a normalized peak of 0.1886 for that response, while the stiff-edge peak under the same input remains 0.8774. Including both edges under the generalized horizontal-force input reduces this imbalance, but the flexible-edge response under the generalized-torque input then governs the maximum. The objective based on Jedge includes all four response combinations and produces three approximately equal normalized peaks. The comparison shows why the response used to select a dual-TMD design should cover both edges and both generalized input types. All four target values remain unchanged to four decimal places when the search budget is increased; Table 9 reports the intensified-search results verified on the extended 32,001-point grid.
Table 9.
Comparison of objective functions for the case-study structure under common physical and numerical settings.
3.3. Effects of Structural Parameters on Frequency-Domain Optimization
3.3.1. Objective Function Values
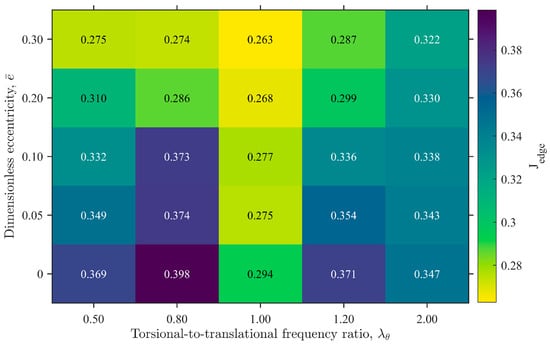
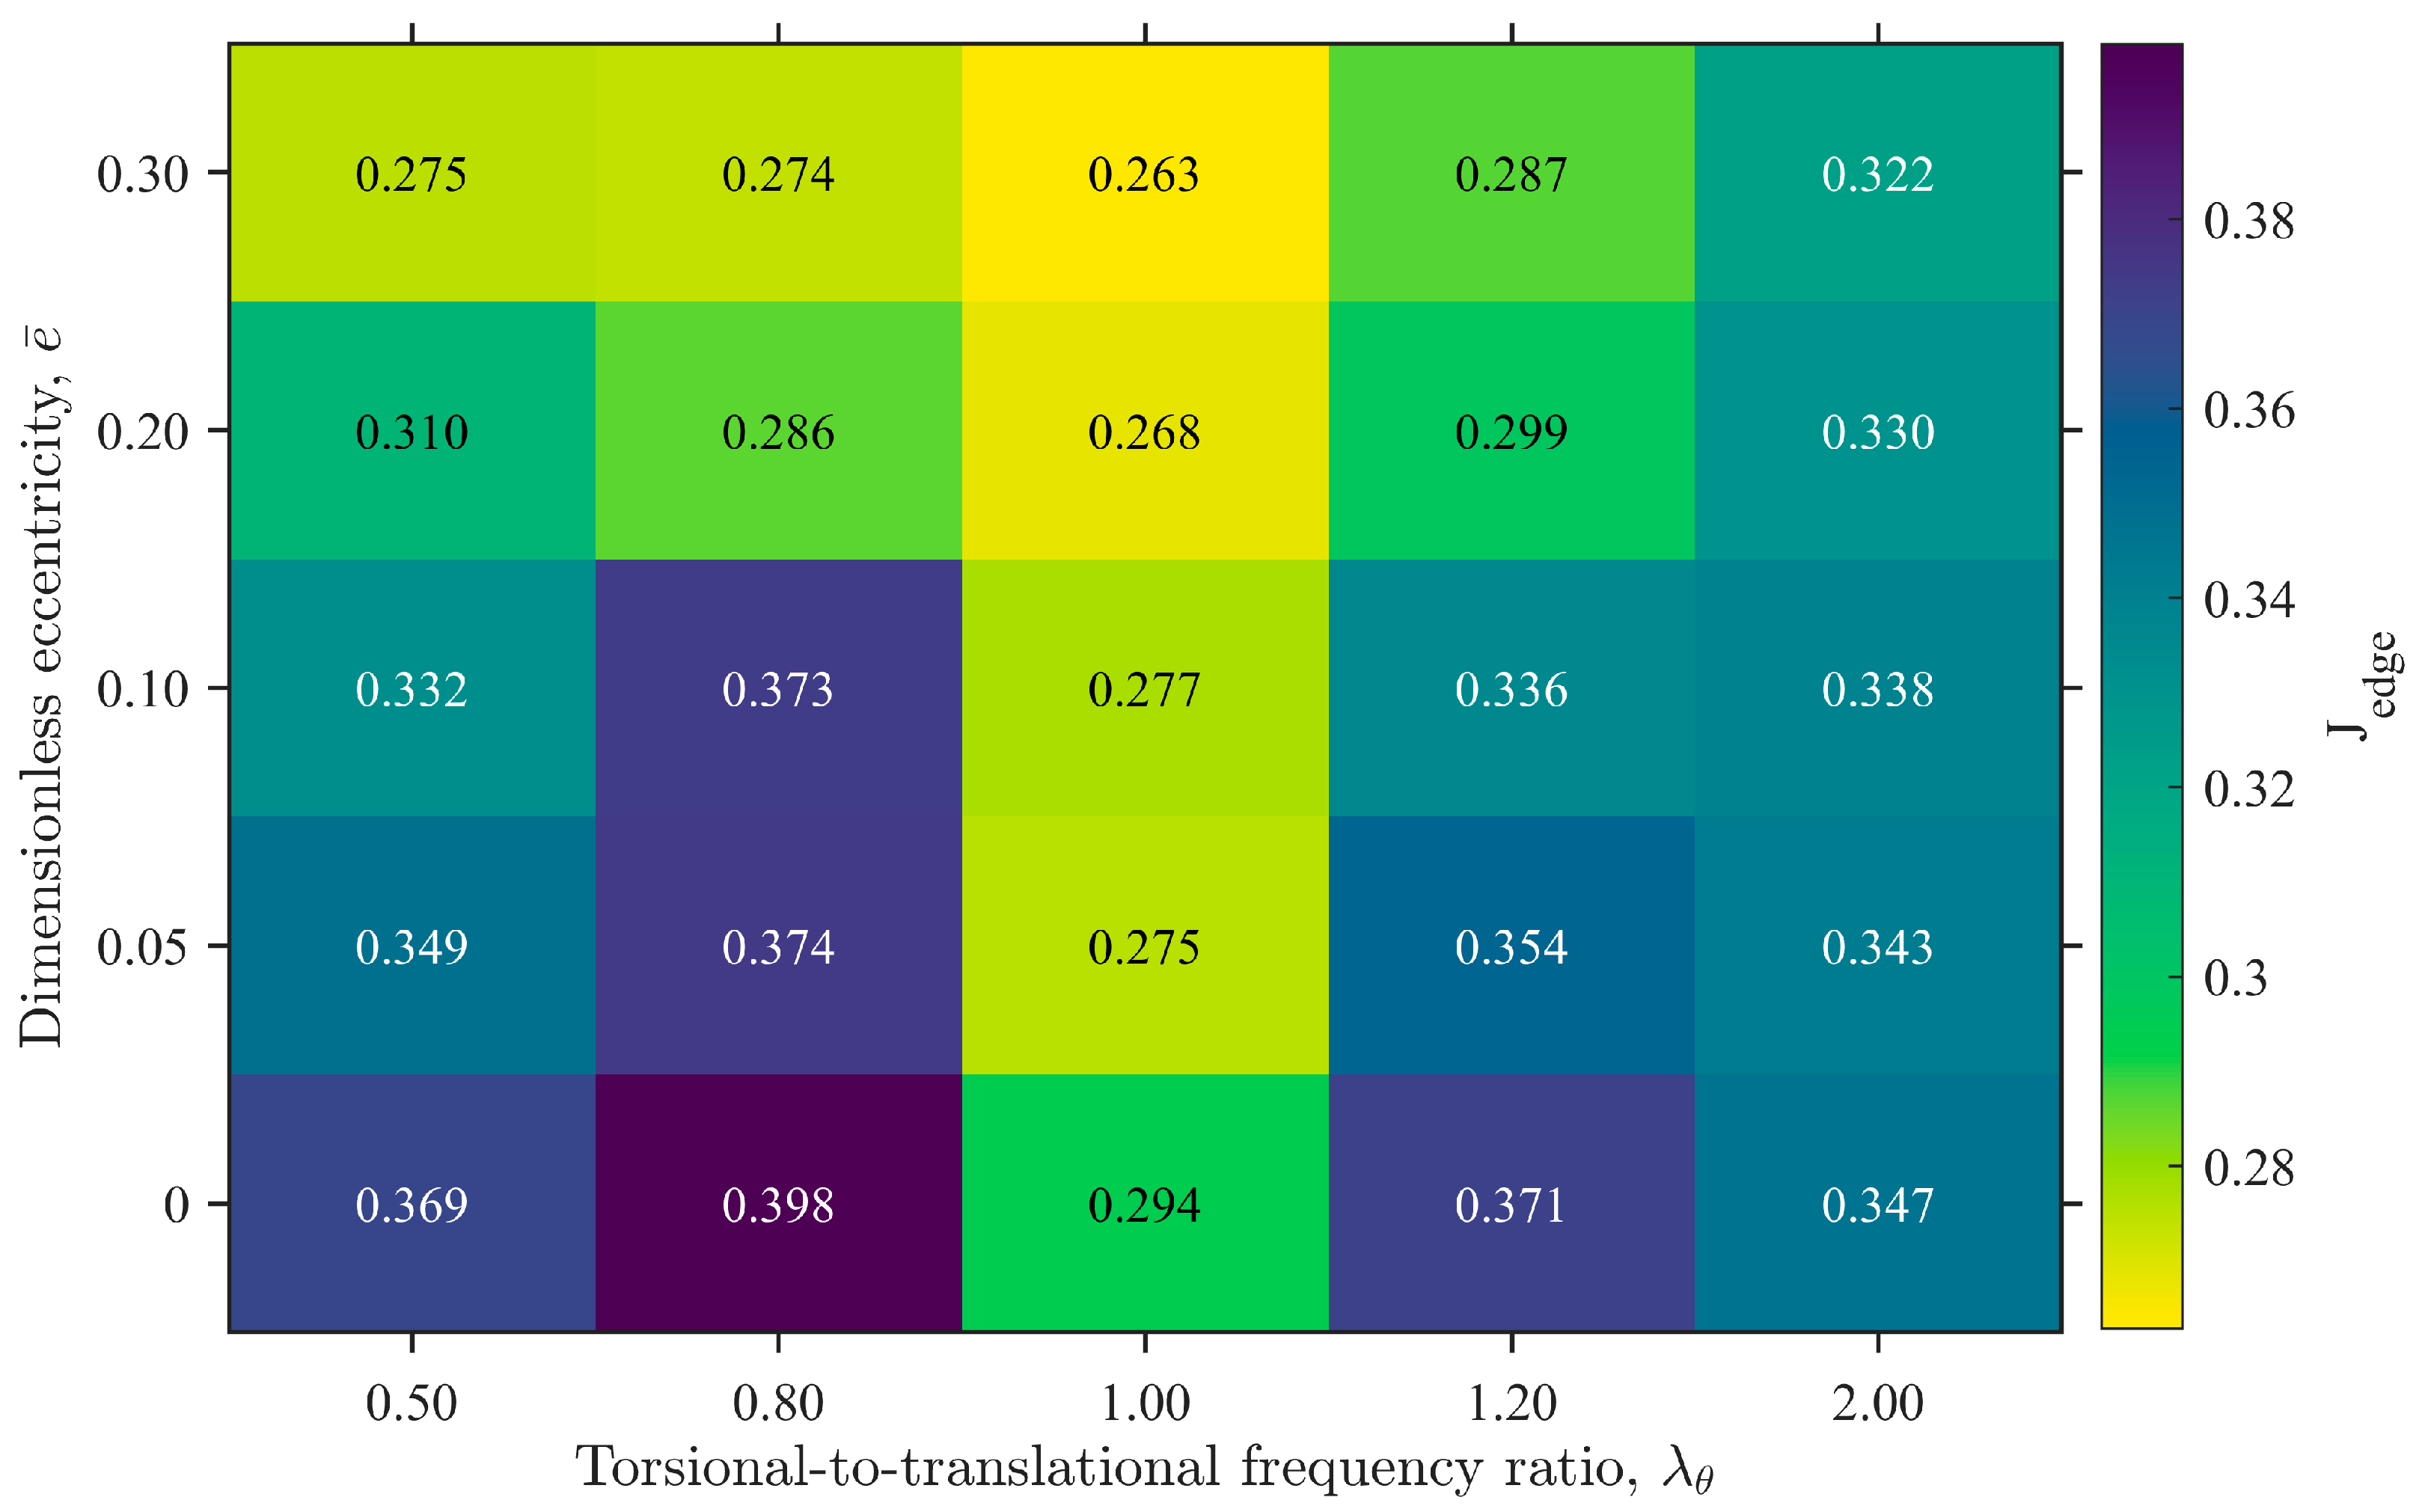
Across the 25 structural parameter combinations, Jedge ranges from 0.2628 to 0.3985, so all four normalized peaks are below those of the corresponding uncontrolled structures. The mean Jedge over the five eccentricities is 0.2756 at a torsional-to-translational frequency ratio of 1, compared with 0.3271–0.3412 for the other frequency-ratio groups (Figure 6). The strongest relative attenuation is therefore obtained near equal uncoupled translational and torsional characteristic frequencies within the parameter set examined.
Figure 6.
Effects of structural parameters on the objective function Jedge.
At a fixed frequency ratio, Jedge generally decreases as eccentricity increases. Because the objective is normalized by the corresponding uncontrolled response, this trend describes relative attenuation within each structural case. Taken together, the results show that eccentricity and the torsional-to-translational frequency ratio both influence the control performance achievable with a fixed total damper mass.
3.3.2. Tuning Frequencies and Coupled Modal Frequencies
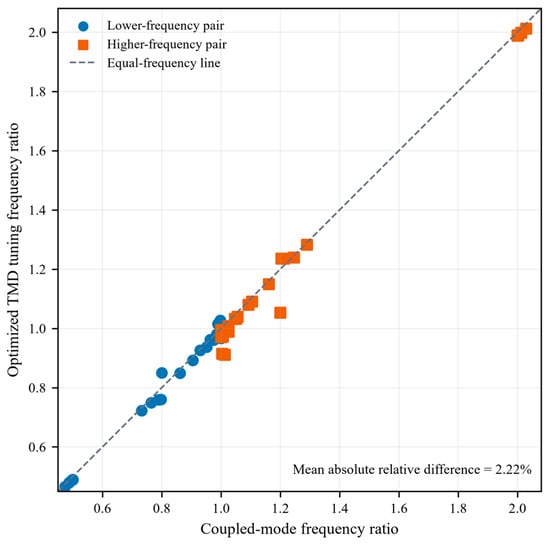
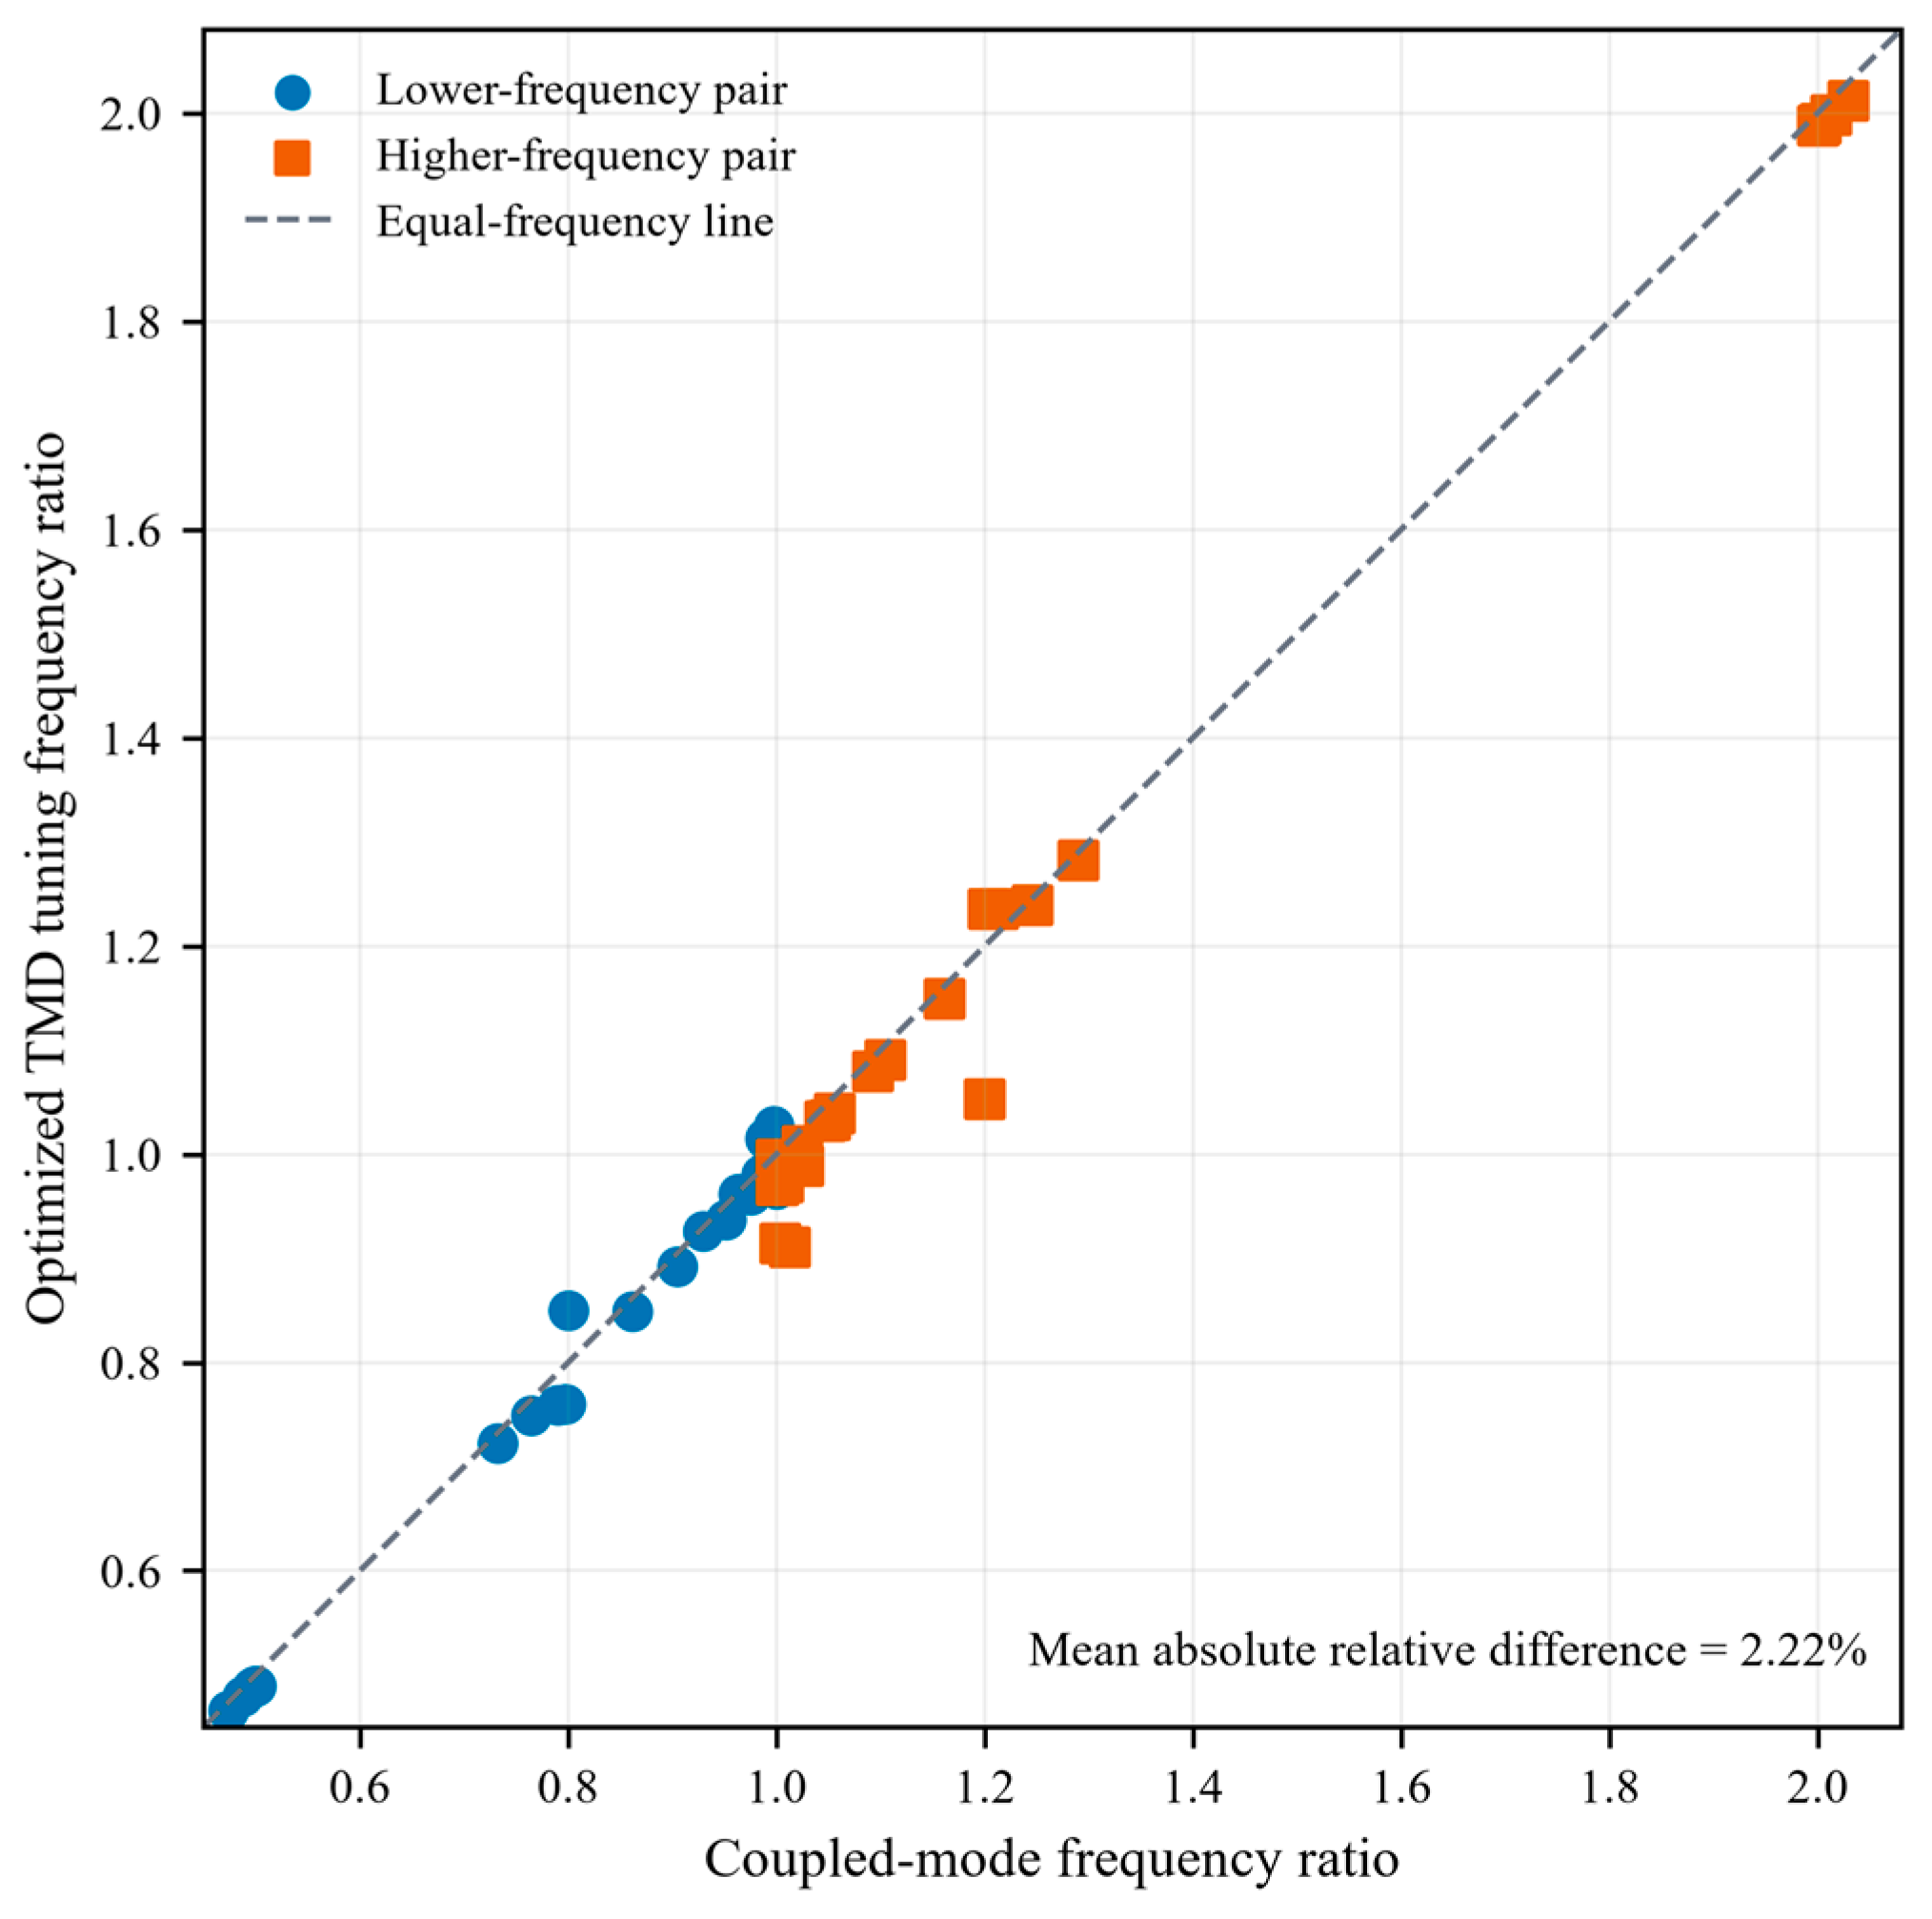
The 50 optimized tuning frequencies are compared with the two coupled modal frequencies in ascending frequency order. Their absolute relative deviations have a mean of 2.22% and a median of 1.48%, with most points close to the line of equality (Figure 7). This correspondence supports using the coupled modal frequencies as initial tuning estimates. The final frequencies are selected by minimizing Jedge together with the mass allocation and damping ratios for the specified installation locations.
Figure 7.
Relationship between optimized TMD tuning frequency ratios and coupled modal frequency ratios. Both are normalized by the reference translational angular frequency.
3.3.3. Mass Allocation and Damping Parameters
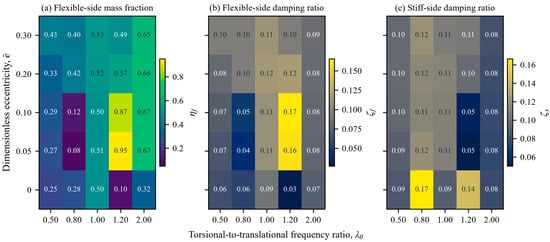
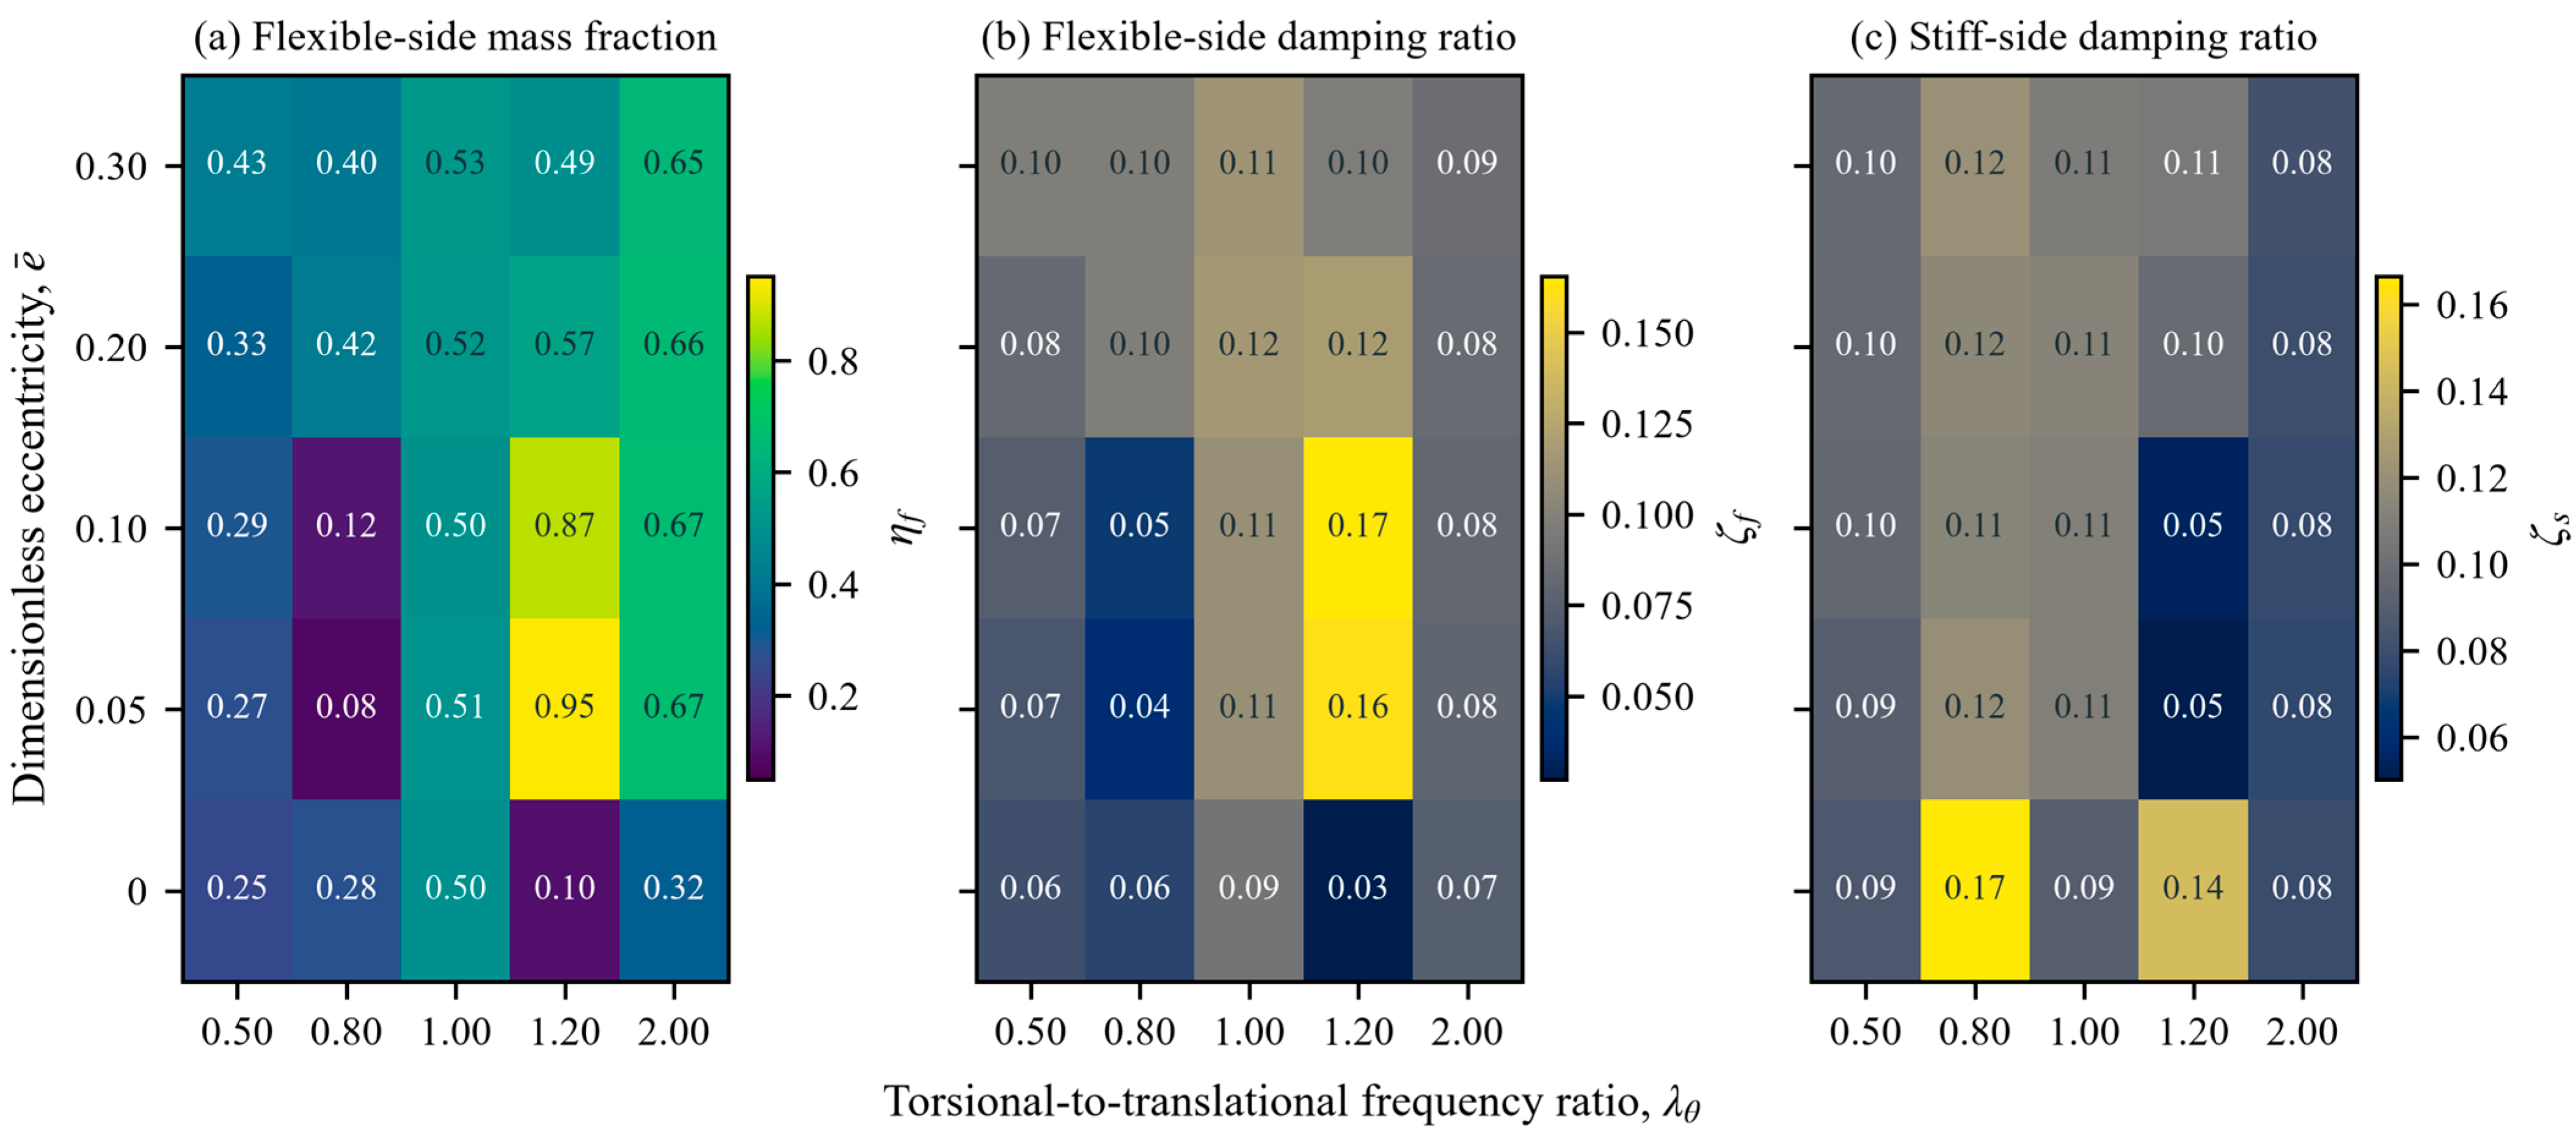
The optimized mass split varies with both eccentricity and the torsional-to-translational frequency ratio, rather than following a consistent monotonic rule based on eccentricity alone. Across the cases examined, the flexible-side TMD mass fraction ranges from 0.082 to 0.950, while the flexible-side and stiff-side damping ratios range from 0.027 to 0.165 and from 0.050 to 0.166, respectively (Figure 8). For the zero-eccentricity cases, mass allocation still varies with λθ; only the λθ = 1 case yields an approximately equal split. These results support selecting mass allocation together with the tuning frequencies and damping ratios under the fixed total mass constraint.
Figure 8.
Optimized mass allocation and damping ratios: (a) flexible-side TMD mass fraction; (b) flexible-side TMD damping ratio; (c) stiff-side TMD damping ratio. For the baseline two-edge layout, the plotted symbols ηf, ζf, and ζs correspond to η1, ζ1, and ζ2, respectively.
3.4. Effects of Installation Locations and Parameter Reoptimization
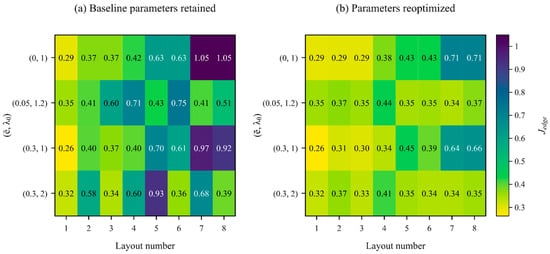
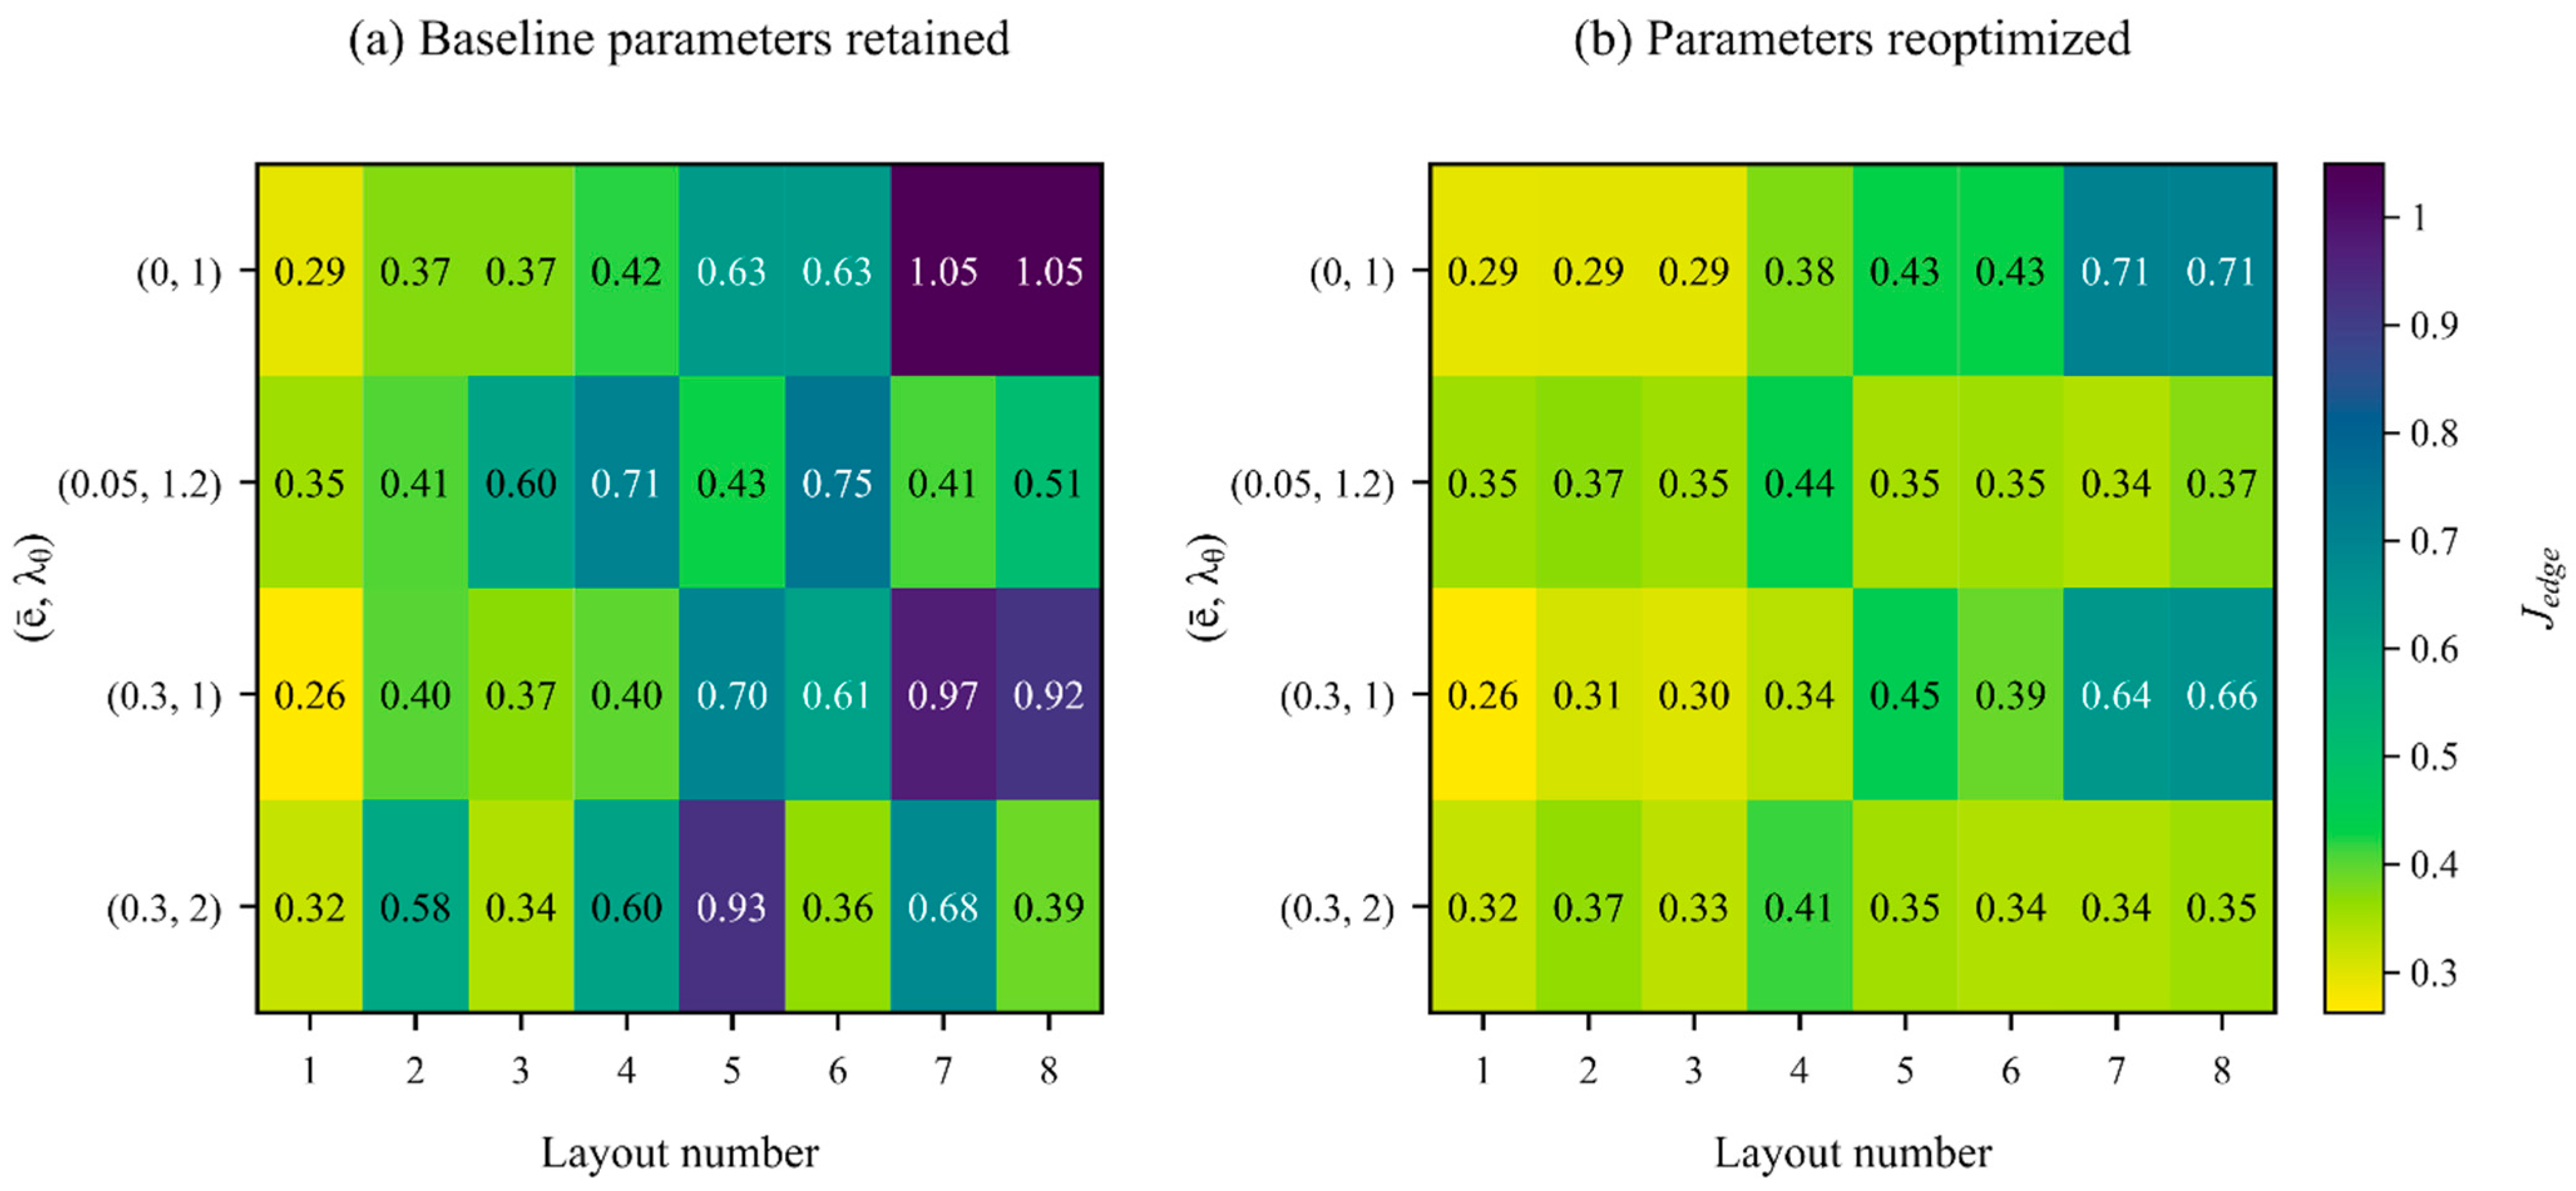
The 32 layout cases separate the effect of changing installation locations from the benefit of retuning at those locations (Figure 9). With the baseline two-edge parameters retained, relocation gives Jedge > 1 in two same-side cases. After reoptimization at each candidate layout, all 32 cases satisfy Jedge < 1. Relative to the corresponding cases with unchanged parameters, reoptimization reduces Jedge by 24.19% on average and by up to 62.14%. Thus, the performance associated with a new layout depends on adapting the device parameters to that layout.
Figure 9.
Effects of discrete installation locations and parameter reoptimization on Jedge: (a) dual-TMD parameters optimized for the baseline two-edge layout and retained after relocation; (b) dual-TMD parameters reoptimized for each candidate layout. Layout numbers 1–8 correspond to the candidate layouts defined in Table 4.
As shown in Table 10, after parameter reoptimization, the two-edge layout gives the lowest Jedge among the eight candidates in three of the four representative structures. For (0.05, 1.2), the layout with both TMDs on the flexible side has an objective value approximately 3.8% lower than that of the two-edge layout. At (0.3, 1), the second-best candidate has a Jedge value 14.41% higher than that of the two-edge layout. These differences make the two-edge arrangement a useful starting configuration while supporting comparison of feasible alternatives using parameters reoptimized for each layout. For the two-edge layout, increasing the dimensionless eccentricity from 0 to 0.3 reduces the objective by 7.22–31.26% across the five frequency ratios in Figure 6. This variation, together with the comparison of the best and second-best layouts in Table 10, supports considering structural parameters and installation positions jointly.
Table 10.
Comparison of discrete dual-TMD layouts for the representative structures.
3.5. Results of the ETABS Case Study
The parameters obtained by dual-TMD frequency-domain optimization for the case-study structure with TMDs at the two edges are converted to the properties of the ETABS link elements. The total TMD mass is 11,325.17 kg, corresponding to 2% of the primary structural mass. The flexible-side and stiff-side TMDs account for 23.35% and 76.65% of the total TMD mass, respectively. The dimensional parameters are listed in Table 11. These are the parameters of Design 4 in Table 9.
Table 11.
Dual-TMD parameters of Design 4 for the case study.
This unequal mass allocation results from minimizing Jedge rather than from prescribing the masses according to the relative magnitudes of the uncontrolled edge responses. Both TMDs contribute to control of the translational and torsional motions, and their mass allocation depends jointly on the installation locations, coupled modes, tuning frequencies, and damping ratios.
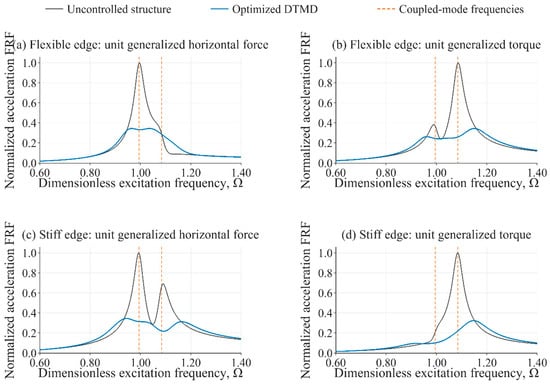
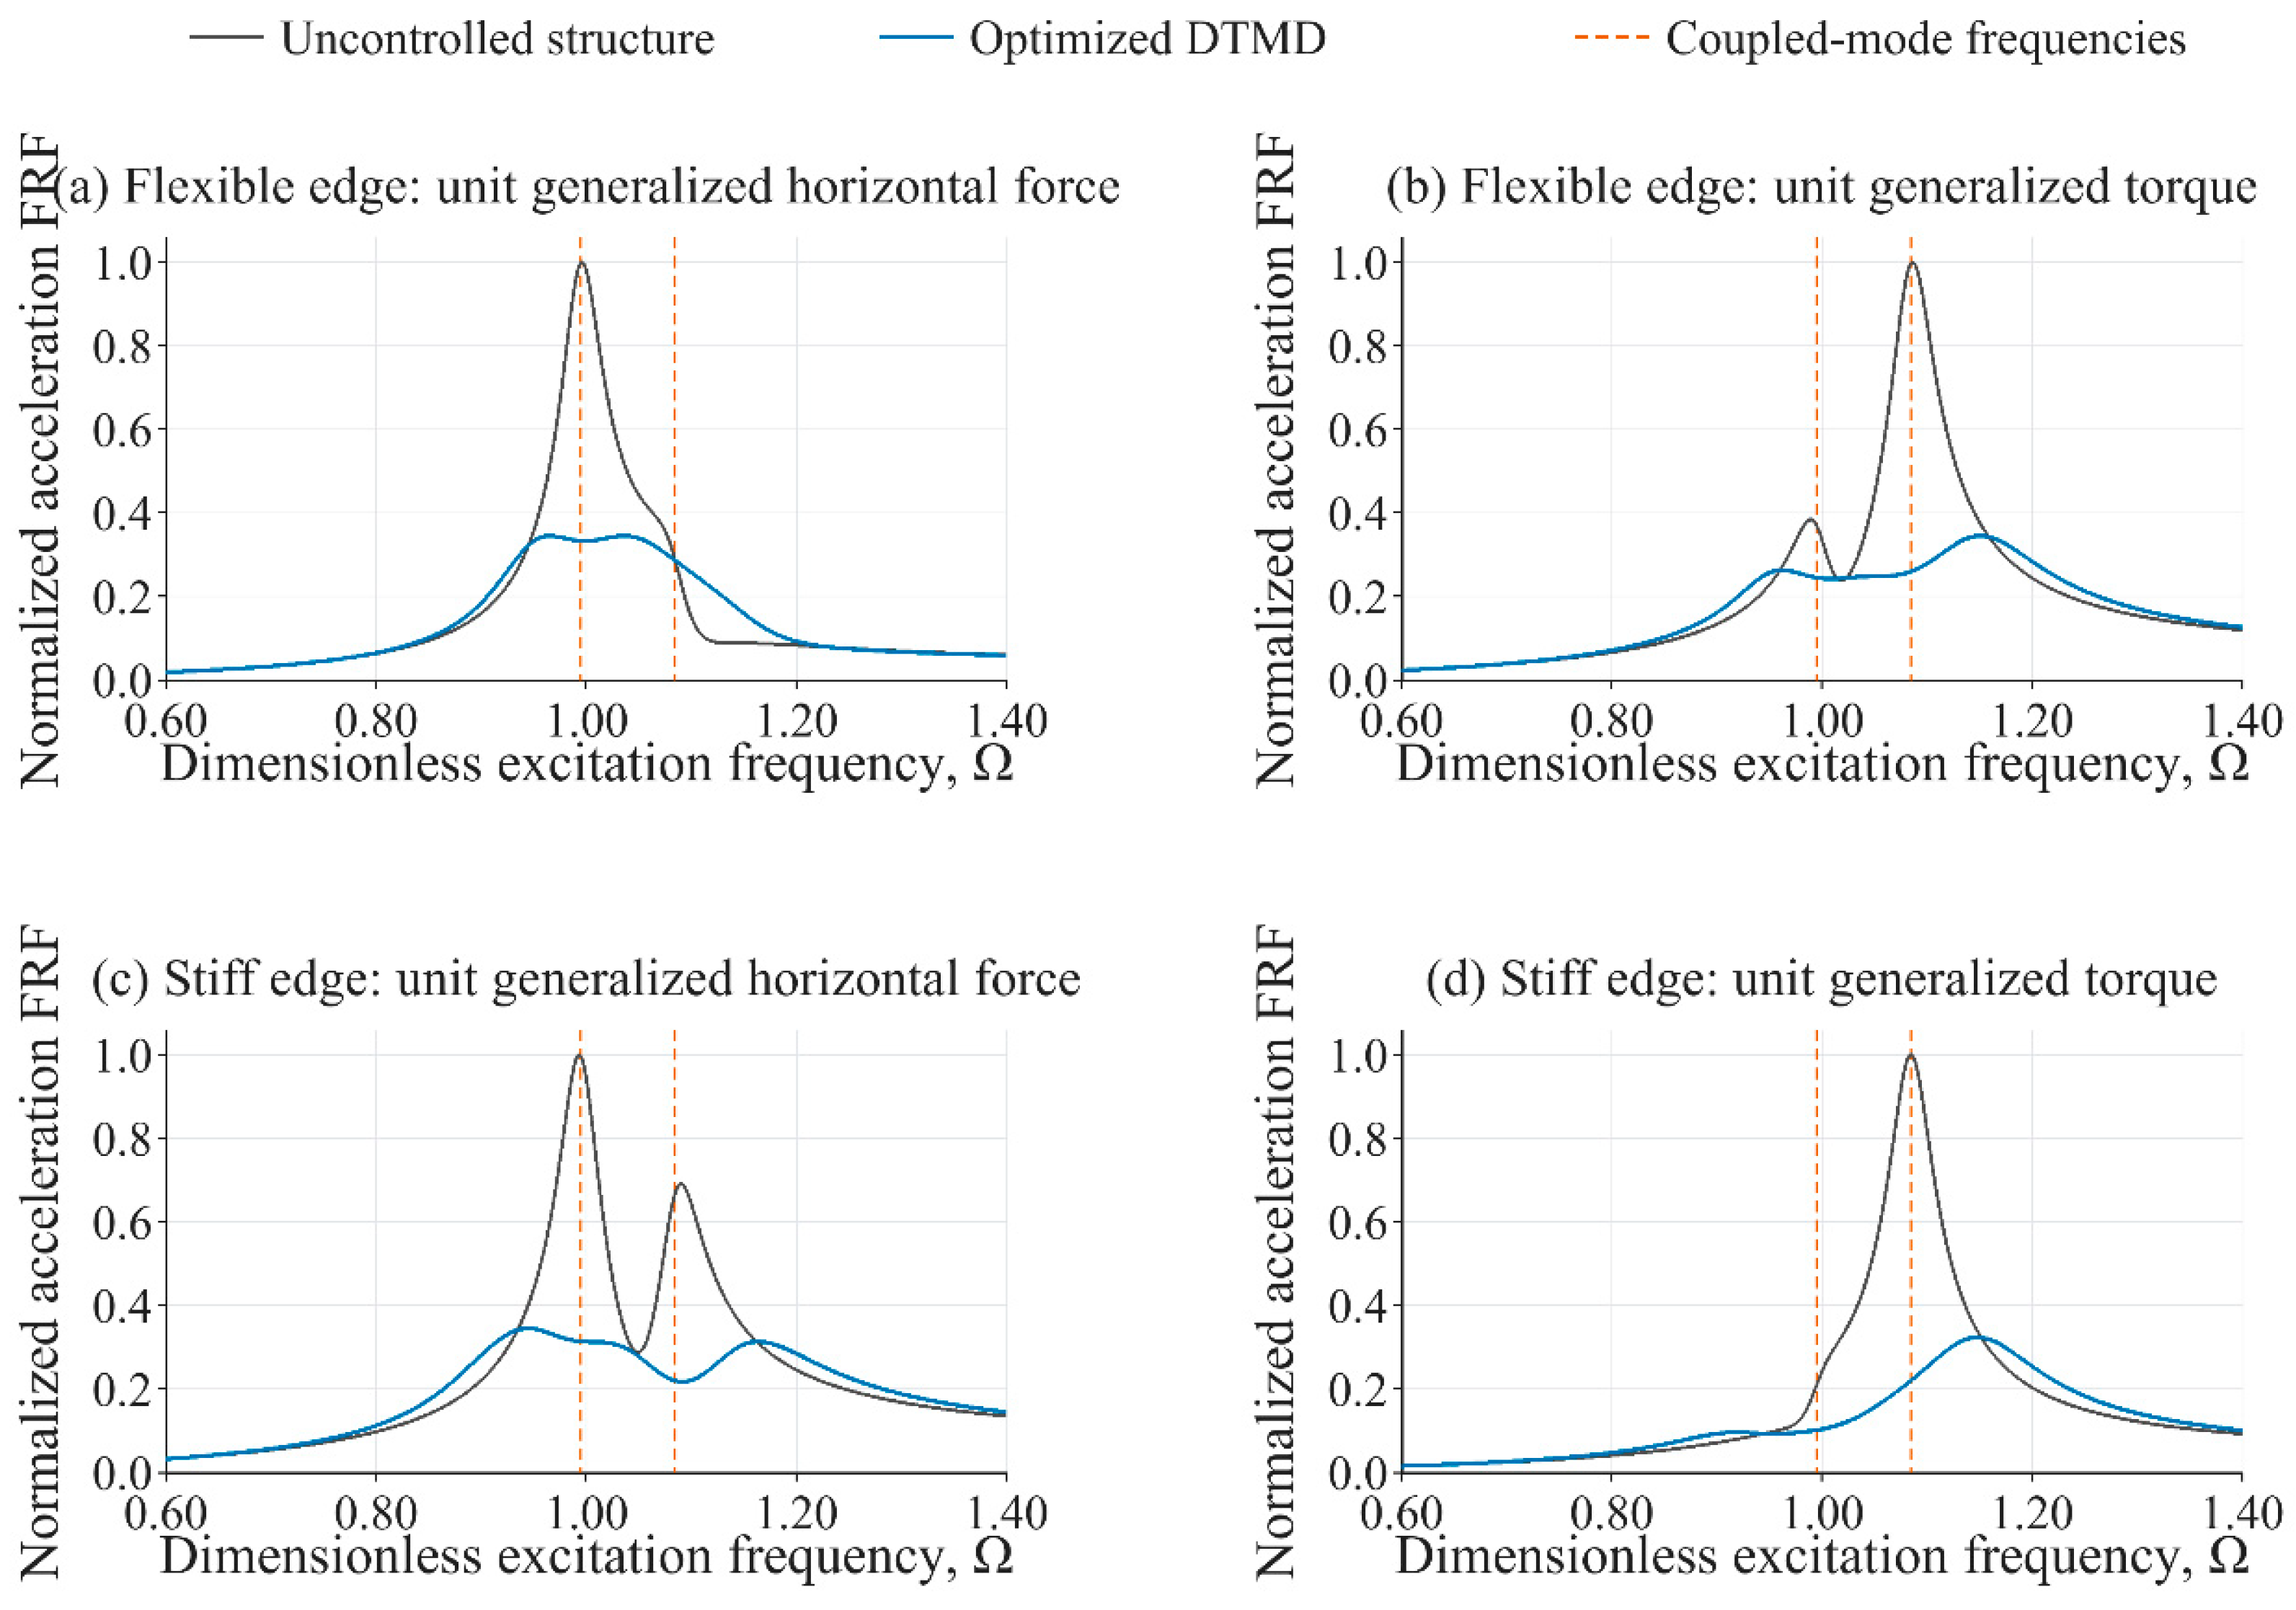
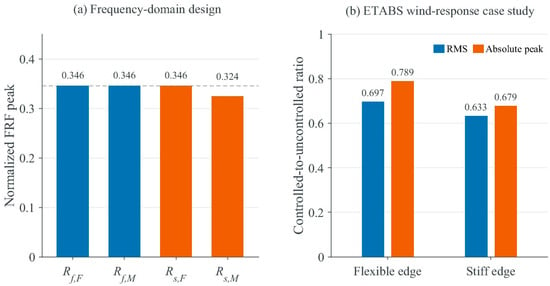
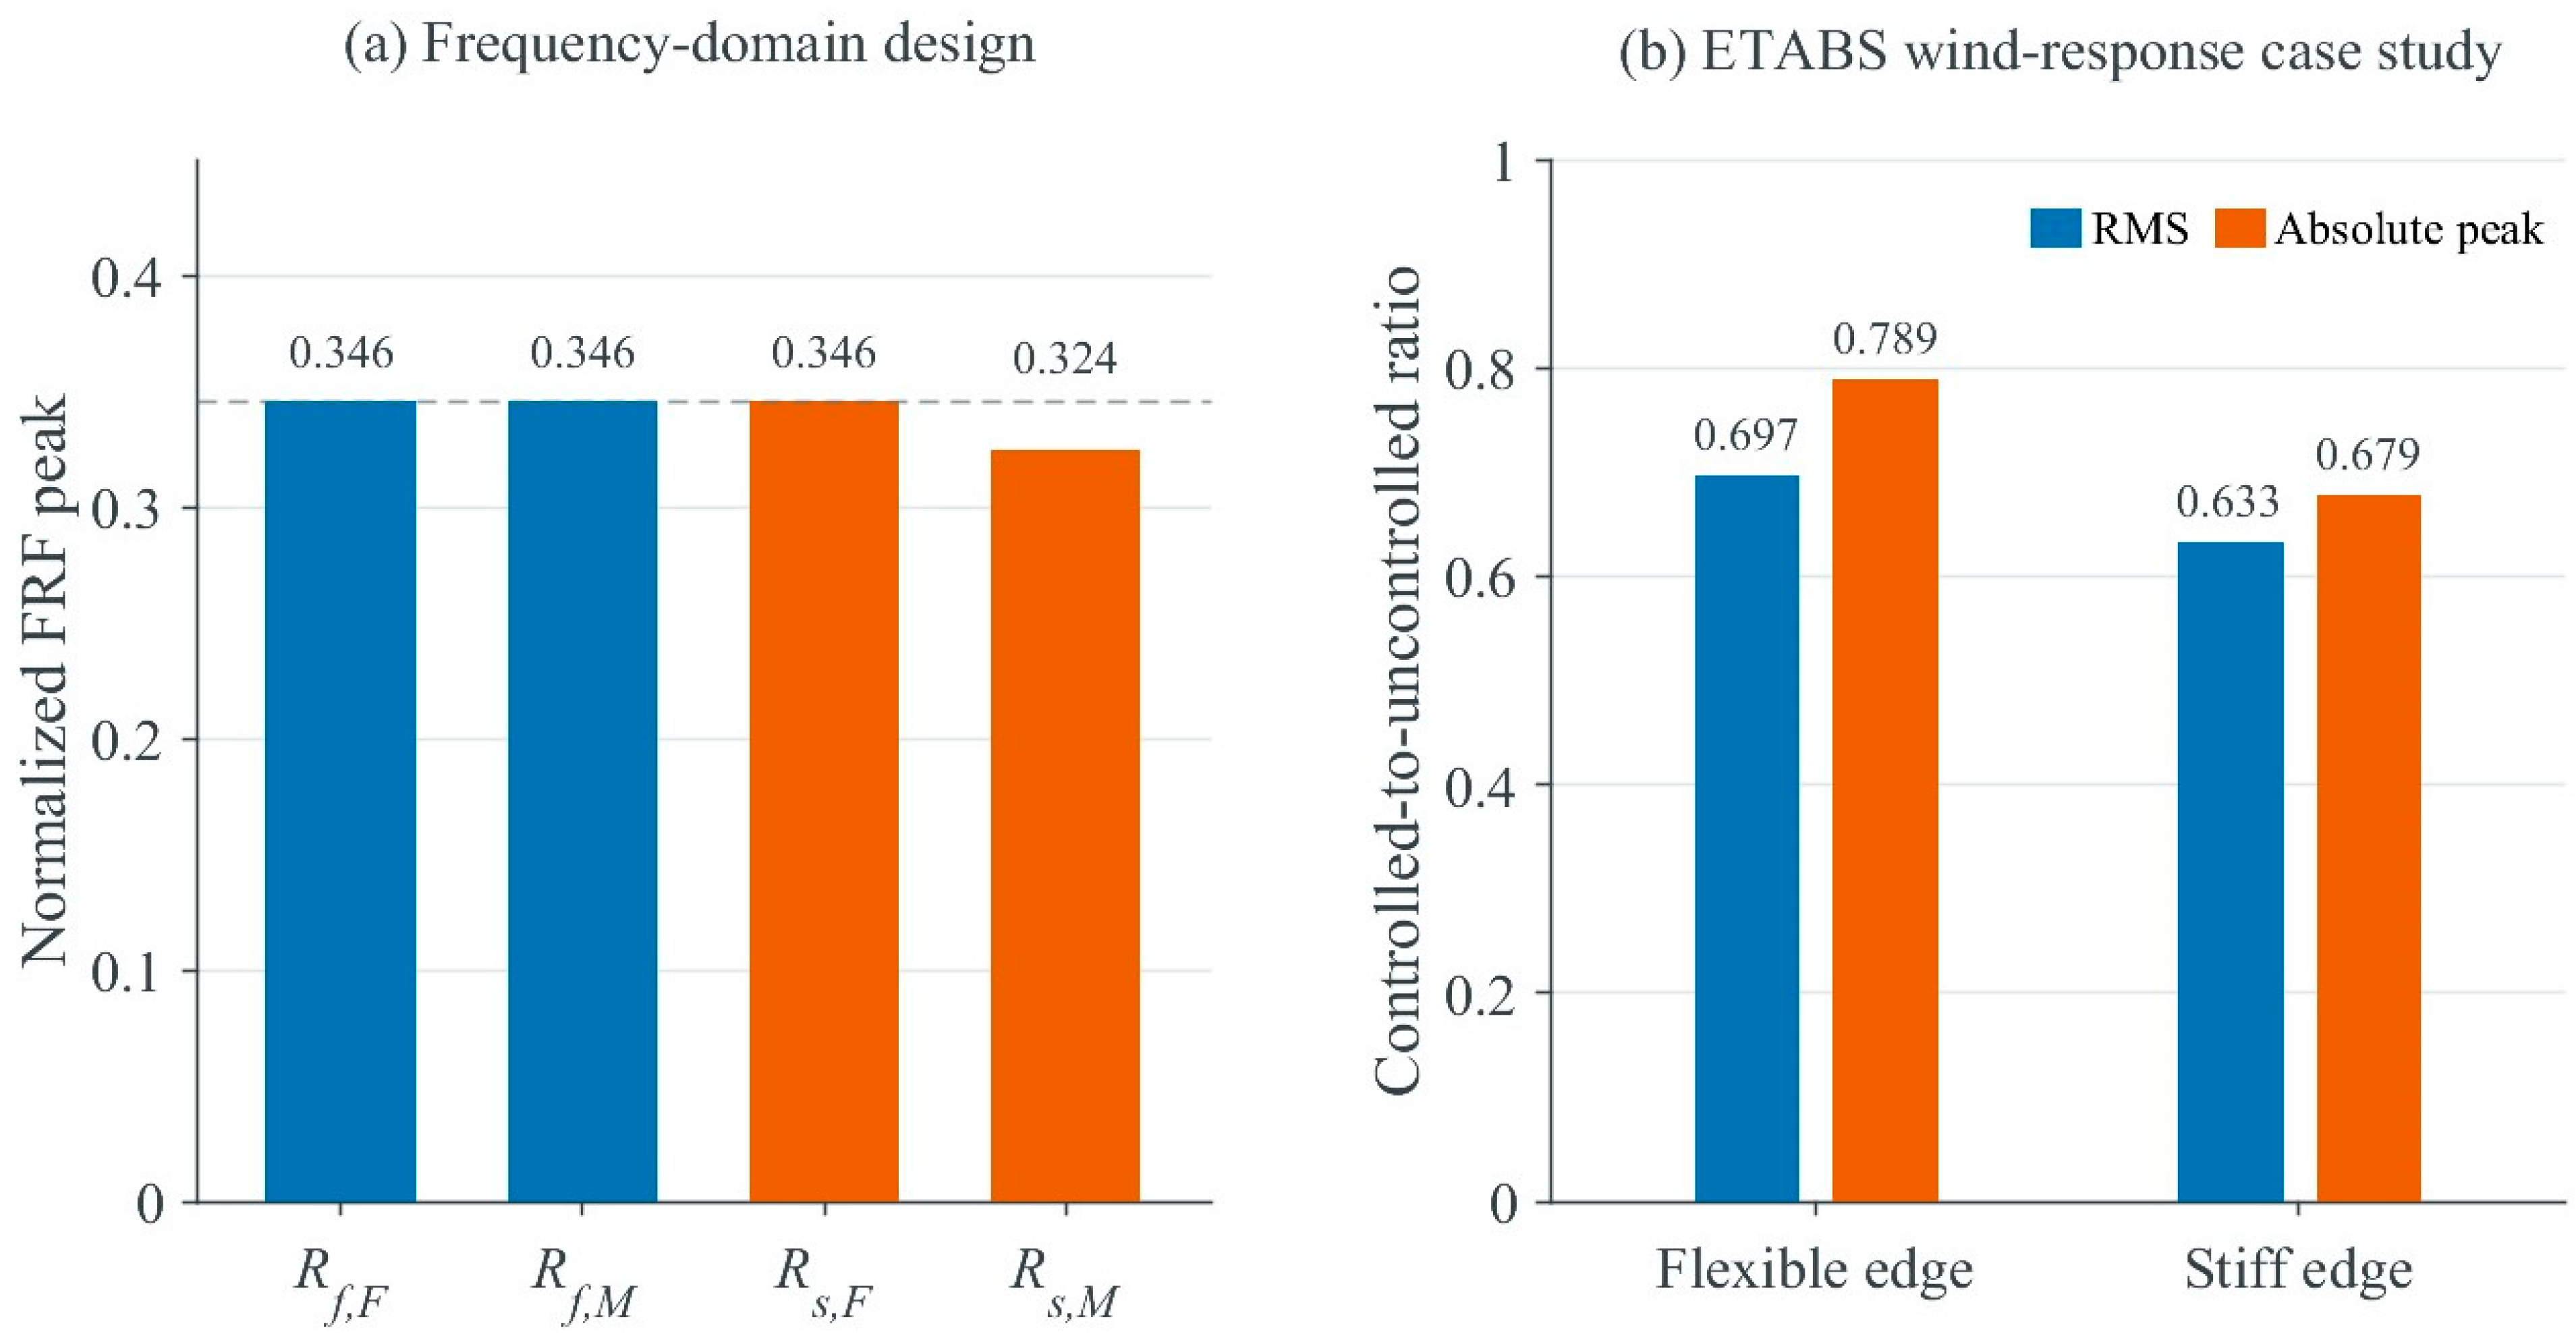
Verification on a 32,001-point frequency grid gives normalized peak acceleration frequency responses of 0.3458 and 0.3458 at the flexible edge under the unit generalized horizontal-force and generalized-torque inputs, respectively. The corresponding values at the stiff edge are 0.3458 and 0.3243, giving Jedge = 0.3458. Three of the four normalized peaks are approximately equal, showing that Design 4 balances the normalized frequency-response peaks at both edges under the separately applied inputs (Figure 10).
Figure 10.
Edge acceleration frequency responses of the uncontrolled and dual-TMD-controlled structures: (a) flexible edge, unit generalized horizontal-force input; (b) flexible edge, unit generalized-torque input; (c) stiff edge, unit generalized horizontal-force input; (d) stiff edge, unit generalized-torque input. The two dimensionless generalized inputs are applied separately with unit magnitude.
Table 12 reports the acceleration reductions at both edges for Design 4 under all six wind-load realizations. Both the RMS and absolute peak accelerations decrease at each edge in every realization. Figure 11 compares the normalized frequency-response peaks with the edge acceleration ratios obtained under these six realizations.
Table 12.
Edge acceleration reductions for Design 4 under six fluctuating-wind realizations (%).
Figure 11.
Results for Design 4: (a) normalized acceleration frequency-response peaks; (b) mean controlled-to-uncontrolled edge acceleration ratios over six wind-load realizations.
Table 13 and Table 14 compare the four designs under the same six wind-load realizations. Each design retains its optimized TMD parameters. Table 13 summarizes the edge acceleration responses, and Table 14 reports the reductions in the maximum RMS and maximum absolute peak accelerations across both edges.
Table 13.
Edge-acceleration responses over six wind-load realizations (mm/s2).
Table 14.
Reductions in maximum edge accelerations over six wind-load realizations.
All four designs reduce the RMS and absolute peak accelerations at both edges in every wind realization. For Design 4, the mean reductions in the maximum RMS and maximum absolute peak accelerations across both edges are 30.62% and 25.61%, respectively (Table 14). Design 4 also gives the lowest mean stiff-edge RMS and absolute peak accelerations among the four designs (Table 13). In the frequency-domain comparison, Design 4 gives the lowest maximum normalized acceleration frequency-response peak among the four designs (Table 9).
4. Discussion
4.1. Structural Parameters and Dual-TMD Tuning
Across the 25 structural-parameter combinations, the 50 optimized tuning frequencies differ from the corresponding coupled modal frequencies by 2.22% on average. This statistical correspondence supports using the coupled modal frequencies as initial tuning estimates for the investigated parameter range, rather than imposing a one-to-one modal tuning rule. In the case study, the two TMD tuning frequencies (3.7569 and 3.6937 Hz) both lie near the lower coupled-mode frequency (3.7545 Hz). The final mass allocation, tuning frequencies, and damping ratios are determined jointly by minimizing Jedge for the specified layout.
Within the investigated range, the smallest normalized peaks occur when the torsional-to-translational frequency ratio is near 1, consistent with the two TMDs acting across neighboring coupled resonance regions. Because each objective value is normalized by the matching uncontrolled response, this trend describes relative control efficiency for the examined structural cases.
Eccentricity alone does not provide a mass-allocation rule because the frequency ratio and the resulting modal contributions also change the control effect of each device. The wide range of optimized mass fractions therefore has a direct design implication: a prescribed equal split or a split based only on geometric eccentricity can exclude the allocation preferred by the edge-response objective. The total mass constraint should be imposed on the pair while allowing the individual masses to adjust with the other tuning parameters.
4.2. Interaction Between Installation Locations and Device Parameters
Damper placement affects both translational and torsional control through the signed moment arms, consistent with earlier placement and torsional-balance studies [3,6,8]. For a given TMD force, moving a device toward the center of mass reduces its torque contribution. Same-side and opposite-side layouts also change how the device forces combine at the two edges. The present layout comparison evaluates these effects with the same normalized response criterion and distinguishes relocation with fixed parameters from relocation followed by parameter reoptimization.
The reduction in the objective after reoptimization demonstrates that a layout cannot be evaluated independently of its associated device parameters. All 32 retuned layouts satisfy Jedge < 1, including the same-side cases with amplified normalized peaks when the original parameters are retained. This improvement arises because relocation changes the signed moment arms and hence the contribution of each device to translational and torsional control; the mass allocation, tuning frequencies, and damping ratios must therefore be reoptimized for the new installation coordinates.
The two-edge layout combines large moment arms with the lowest objective value in three of the four representative structures and is therefore a practical initial candidate. The preferred tested layout still varies with the structural parameters. Feasible locations should provide sufficient installation space, adequate floor load capacity, and access for installation and maintenance. The required stroke and clearance should be assessed from the peak displacement of each TMD relative to its attachment point [Equation (7)]. Supports and connections should have adequate strength and stiffness to carry the installed weight and transfer the spring and damping forces to the primary structure. The tuning frequencies and damping ratios should be checked during commissioning.
4.3. Engineering Implications of Dual-TMD Frequency-Domain Optimization
Table 9 compares all four designs. The center-of-mass objective (Design 1) does not directly constrain either edge response. Optimizing only the flexible-edge response (Design 2) under the generalized horizontal-force input strongly attenuates the selected response but leaves the stiff-edge response governing Jedge. Including both edges under that input (Design 3) shifts the governing term to the flexible edge under the generalized-torque input. Design 4 minimizes Jedge to account for all four response combinations. The near-equal peaks in the case-study design are consistent with balancing the four normalized frequency-response peaks under separately applied inputs.
Table 13 and Table 14 compare all four designs under the same six spatially correlated wind-load realizations. For Design 4, the mean reductions in the maximum RMS and maximum absolute peak accelerations across both edges are 30.62% and 25.61%, respectively. The response to simultaneous force and torque histories depends on their relative amplitudes and phase. The frequency-domain criterion balances normalized peaks; the time-history measures quantify the combined response.
For design application, the coupled modal frequencies provide initial tuning estimates. The mass allocation, tuning frequencies, and damping ratios are then optimized for each feasible layout under the fixed total mass constraint. Dense frequency-grid verification checks the resulting peak responses, and time-history analysis evaluates both edges under the project-specific wind input. This procedure compares layouts on the basis of their attainable tuned performance, rather than the performance of parameters transferred from a different arrangement.
4.4. Scope of Applicability
The quantitative results were obtained for linear models with rigid floor diaphragms, dimensionless eccentricities ranging from 0 to 0.3, torsional-to-translational frequency ratios ranging from 0.5 to 2, a total TMD mass ratio of 0.02, primary-structure modal damping ratios of 2%, and the eight discrete layouts examined in this study. The parametric equations can be applied to eccentric structures with the same form of translational–torsional dynamics using the corresponding mass, mass moment of inertia, stiffness, and damping. Other total TMD mass ratios and primary-structure damping levels can be considered by updating the model parameters and repeating the optimization. For multistory buildings, the edge-acceleration frequency responses can be evaluated using the full structural model or modal superposition. A modal formulation should retain the modes contributing appreciably to the selected floor-edge responses and account for the mode-shape ordinates at the TMD attachment points and the generalized wind loads. The reference structural mass used to define the total TMD mass ratio should be specified consistently.
The single-story ETABS case study demonstrates implementation of the optimized parameters in the engineering model by comparing controlled and uncontrolled responses under the same six spatially correlated wind-load realizations over the 20–100 s evaluation interval.
5. Conclusions
This study developed a frequency-domain minimax optimization method for DTMD control of edge accelerations in eccentric structures. Objective comparisons, structural-parameter analyses, discrete-layout evaluations, and ETABS time-history analyses lead to the following conclusions.
- Direct minimization of Jedge (Design 4) gives a maximum normalized acceleration frequency-response peak of 0.3458 for the case-study structure, 39.2%, 60.6%, and 6.6% lower than the values obtained with Designs 1–3, respectively; three of the four peaks are nearly equal. This result supports including both edge locations and both input types in the frequency-domain design objective.
- Across the 25 structural-parameter combinations, the optimized tuning frequencies differ from the corresponding coupled modal frequencies by 2.2% on average, supporting the use of modal frequencies as initial tuning estimates. Mass allocation does not vary monotonically with eccentricity and also depends on the torsional-to-translational frequency ratio; it should therefore be determined jointly with the tuning frequencies, damping ratios, and installation locations.
- Installation location and device parameters should be optimized together. After layout-specific retuning, all 32 cases satisfy Jedge < 1; relative to direct use of the baseline parameters, Jedge decreases by 24.2% on average and by up to 62.1%. One TMD at each edge gives the lowest Jedge in three of the four representative structures and is therefore a practical initial candidate.
- Under the same six spatially correlated fluctuating wind-load realizations, all four designs reduce the RMS and absolute peak accelerations at both edges of the ETABS model. For Design 4, the mean reductions in the maximum RMS and maximum absolute peak accelerations across the two edges are 30.62% and 25.61%, respectively, relative to the uncontrolled model. These results confirm the effectiveness of the implemented design and show that both edges should be assessed in DTMD design and response evaluation.
Supplementary Materials
The following supporting information can be downloaded at: https://www.mdpi.com/article/10.3390/buildings16224582/s1, Table S1, Locations and scaling coefficients for the six fluctuating wind-load inputs; Data S1, Processed dimensionless fluctuating wind-load time histories used in the ETABS analysis.
Author Contributions
Z.L.: conceptualization, supervision, and writing—review and editing; H.W.: writing—original draft preparation; W.J.: methodology; C.C.: validation; B.Q.: data curation; C.L.: formal analysis; Y.W.: visualization; L.W.: investigation; G.X.: data curation. All authors have read and agreed to the published version of the manuscript.
Funding
This research was funded by the Foshan Science and Technology Bureau (Guangdong Province, China) through the project “Research on the Mechanical Performance of a Quasi-Zero-Stiffness (QZS) Vertical Vibration Isolation System for Metro Over-Track Structures Considering Under-Loading and Over-Loading Effects” (Project No. 2520001002804).
Data Availability Statement
The data supporting the findings of this study are available within the article and its Supplementary Materials. The processed dimensionless fluctuating wind-load time histories used in the ETABS analysis are provided as Data S1.
Conflicts of Interest
Authors Wenjun Ji, Changyuan Chen, Bo Qu, Chenguang Li, and Yantao Wang are employed by The Second Construction Co., Ltd. of China Construction First Group. The remaining authors declare that the research was conducted in the absence of any commercial or financial relationships that could be construed as a potential conflict of interest.
References
- Yang, F.; Sedaghati, R.; Esmailzadeh, E. Vibration suppression of structures using tuned mass damper technology: A state-of-the-art review. J. Vib. Control 2022, 28, 812–836. [Google Scholar] [CrossRef] [Scilit]
- Jafari, M.; Alipour, A. Methodologies to mitigate wind-induced vibration of tall buildings: A state-of-the-art review. J. Build. Eng. 2021, 33, 101582. [Google Scholar] [CrossRef] [Scilit]
- Wang, J.-F.; Lin, G.-L.; Lin, C.-C.; Jian, J.-Y. Optimum placement and design of multiple tuned mass dampers for vibration control of asymmetric buildings. J. Vib. Control 2022, 28, 3875–3889. [Google Scholar] [CrossRef] [Scilit]
- Yu, X.; Li, J.; Zhang, N.; Zhou, Z.; Xie, Z. Wind-induced vibration mitigation on eccentric tall buildings based on tuned liquid dampers. Eng. Struct. 2026, 358, 122643. [Google Scholar] [CrossRef] [Scilit]
- Pansare, A.P.; Jangid, R.S. Tuned mass dampers for torsionally coupled systems. Wind Struct. 2003, 6, 23–40. [Google Scholar] [CrossRef] [Scilit]
- Almazán, J.L.; Espinoza, G.; Aguirre, J.J. Torsional balance of asymmetric structures by means of tuned mass dampers. Eng. Struct. 2012, 42, 308–328. [Google Scholar] [CrossRef] [Scilit]
- Petti, L.; De Iuliis, M. Robust design of a single tuned mass damper for controlling torsional response of asymmetric-plan systems. J. Earthq. Eng. 2009, 13, 108–128. [Google Scholar] [CrossRef] [Scilit]
- Li, C.; Qu, W. Optimum properties of multiple tuned mass dampers for reduction of translational and torsional response of structures subject to ground acceleration. Eng. Struct. 2006, 28, 472–494. [Google Scholar] [CrossRef] [Scilit]
- Ueng, J.-M.; Lin, C.-C.; Wang, J.-F. Practical design issues of tuned mass dampers for torsionally coupled buildings under earthquake loadings. Struct. Des. Tall Spec. Build. 2008, 17, 133–165. [Google Scholar] [CrossRef] [Scilit]
- Ghaderi, P.; Farsijani, D. Torsional behavior enhancement of asymmetric-plan building structures using optimum tuned mass damper inerter. J. Earthq. Eng. 2025, 29, 669–690. [Google Scholar] [CrossRef] [Scilit]
- Pozos-Estrada, A.; Hong, H.P. Sensitivity analysis of the effectiveness of tuned mass dampers to reduce the wind-induced torsional responses. Lat. Am. J. Solids Struct. 2015, 12, 2520–2538. [Google Scholar] [CrossRef] [Scilit]
- Çetin, H.; Aydın, E. A new tuned mass damper design method based on transfer functions. KSCE J. Civ. Eng. 2019, 23, 4463–4480. [Google Scholar] [CrossRef] [Scilit]
- Raze, G.; Kerschen, G. H∞ optimization of multiple tuned mass dampers for multimodal vibration control. Comput. Struct. 2021, 248, 106485. [Google Scholar] [CrossRef] [Scilit]
- Liu, Y.; Wang, K.; Mercan, O.; Chen, H.; Tan, P. Experimental and numerical studies on the optimal design of tuned mass dampers for vibration control of high-rise structures. Eng. Struct. 2020, 211, 110486. [Google Scholar] [CrossRef] [Scilit]
- Su, N.; Peng, S.; Hong, N.; Xia, Y. Wind-induced vibration absorption using inerter-based double tuned mass dampers on slender structures. J. Build. Eng. 2022, 58, 104993. [Google Scholar] [CrossRef] [Scilit]
- Pellizzari, F.; Marano, G.C.; Palmeri, A.; Greco, R.; Domaneschi, M. Robust optimization of MTMD systems for the control of vibrations. Probab. Eng. Mech. 2022, 70, 103347. [Google Scholar] [CrossRef] [Scilit]
- Rossato, B.B.; Miguel, L.F.F. Robust optimum design of tuned mass dampers for high-rise buildings subject to wind-induced vibration. Numer. Algebra Control Optim. 2023, 13, 154–168. [Google Scholar] [CrossRef] [Scilit]
- Quan, Y.; Zhao, W.; Qiao, H. Improved model for parametric optimization of tuned mass damper-inerter for wind-induced vibration control of high-rise building. Structures 2023, 56, 104862. [Google Scholar] [CrossRef] [Scilit]
- Huang, P.; Tang, Y.; Wang, Q.; Qiao, H. Optimal design of a simplified tuned tandem mass damper for wind-induced vibration control of tall buildings. Structures 2025, 71, 108015. [Google Scholar] [CrossRef] [Scilit]
- Yang, X.; Ma, R.; Bi, K.; Li, H.; Du, X. Effectiveness and robustness of using nonlinear pendulum tuned mass damper inerters for wind-induced vibration mitigation of high-rise buildings. Structures 2025, 73, 108356. [Google Scholar] [CrossRef] [Scilit]
- McEvoy, C.; Fitzgerald, B. Structural reliability of tall buildings under wind loads with tuned mass damper fluid inerters. Buildings 2025, 15, 1736. [Google Scholar] [CrossRef] [Scilit]

Disclaimer/Publisher’s Note: The statements, opinions and data contained in all publications are solely those of the individual author(s) and contributor(s) and not of MDPI and/or the editor(s). MDPI and/or the editor(s) disclaim responsibility for any injury to people or property resulting from any ideas, methods, instructions or products referred to in the content. |
© 2026 by the authors. Licensee MDPI, Basel, Switzerland. This article is an open access article distributed under the terms and conditions of the Creative Commons Attribution (CC BY) license.