


Abstract
Waterway construction increasingly depends on digital management platforms, but these are typically assembled from independently procured systems with different standards and coding rules. The resulting silos, inconsistent definitions, and unreliable measurements limit what such platforms can deliver. This study developed a data-governance chain for harmonizing heterogeneous engineering data, implemented in a waterway platform in three stages: tandem data cleaning, combining rule-based screening with Isolation Forest; semantic integration of equivalent fields through three-level coding and a knowledge graph; and lakehouse-integrated tiered storage, supported by a Chief Data Officer role. The chain was evaluated in a single case, the Lianshen Waterway project, Jiangsu Province, China, through measured before-and-after indicators, an assessment by seven experts, and an ablation experiment. Retrieval time fell from 4 h to 1.4 h per batch; the tandem cleaning module reached an F1-score of 0.91 on the 500 labeled groups, against 0.74 for rule-based screening and 0.85 for Isolation Forest alone; and the field alignment reached a precision of 93.24% and a recall of 87.34% on 240 hand-labeled field pairs. The expert panel estimated a 60% reduction in data-management workload and a 25% gain in overall management efficiency, based on perceptions rather than measurements.
1. Introduction
With the deep integration of new-generation information technologies such as building information modeling (BIM), the Internet of Things, and artificial intelligence with infrastructure engineering construction [1,2,3], waterway engineering management has accelerated its transformation from the traditional model based on manual experience to a digital and intelligent model. The digital management platform has attracted considerable attention in the infrastructure sector as the core component of digital and intelligent management in waterway engineering. In recent years, various information systems have been widely deployed in waterway engineering construction [3], and data-driven methods have been applied to problems such as waterlogging risk prediction and drainage optimization [4]. However, these information systems were usually developed independently by different vendors, and their data standards and interface specifications lacked universality, which made cross-system data interoperability difficult and caused prominent data silos [5]. For example, in the case project examined in this study, the BIM collaborative platform, the smart construction site system, and the intelligent concrete cloud factory each held records of the same concrete pouring operation under a different identifier, and compiling the quality records of a single month across the three systems required an engineer to export, convert, and match the data by hand.
Meanwhile, because the working environment of waterway engineering is complex, the deployed acquisition sensors were susceptible to interference from multiple factors such as hydrology and meteorology. As a result, missing and anomalous values were common in the measured data, which seriously affected data quality [6]. In addition, there was still a lack of unified management methods for these diverse types of data, and systems differed in the naming methods and coding rules for the same engineering object, so that equivalent data fields carried different labels while different objects could carry the same label. Existing platforms could display the data of many systems on a single screen, but they could not answer a cross-system question without an engineer acting as the interface between the systems. This further limited the ability to analyze engineering data and use the results to support project decisions.
To address prominent data silos and low data quality in building digital management platforms for waterway engineering, scholars conducted research from multiple perspectives. Some scholars improved digital and intelligent platforms for waterway engineering by relying on technologies such as BIM and artificial intelligence [1,7]. Through visualized interaction, they enhanced the work efficiency of management personnel and enabled refined and convenient control of waterway engineering construction. Other scholars approached the data problem from the application side, building forecasting and monitoring systems that depend on reliable data [8,9]. These studies provided a more reliable data foundation for waterway engineering construction management, enhanced the collaboration and communication efficiency of participating parties, and improved the management level of waterway engineering.
The fragmentation described above is not unique to waterway engineering. Project management information systems (PMIS) have been studied since the 1990s as a means of integrating schedule, cost, document, and communication data among the parties in a construction project [10]. Nitithamyong and Skibniewski examined web-based PMIS and found that their success depends as much on the organizational and contractual arrangements around them as on the system itself. That body of work established both the problem of fragmented systems and the need for coordination between project parties, and it showed that a platform is effective only when the responsibilities around it are defined. It did not, however, address the engineering measurement data produced by sensors and automated plants, because PMIS research is organized around management processes and documents rather than around the semantic integration of heterogeneous measurement records. It therefore offers little guidance on cleaning rules, coding schemes, or the alignment of field names across systems.
Although these studies have improved the digital and intelligent management level of waterway engineering, three requirements remain unmet. The first concerns cleaning: project data arrive with both explicit errors, which rules can catch, and hidden anomalies such as trend drift and correlated deviations, which rules miss. The second concerns integration: current practice stops at format conversion and manual field matching, so that the same object is still recorded differently in each system. The third concerns storage: the volume and variety of project data exceed what centralized storage can carry at acceptable cost and query speed. Existing studies are also difficult to adapt to the complex working scenarios of waterway engineering, which can seriously affect the reliability of digital and intelligent analysis and decision-making.
To address the above problems, this study proposed a method for constructing a digital management platform for waterway engineering so as to improve the effectiveness of digital and intelligent management. This method integrated the Isolation Forest algorithm with knowledge graph technology and improved engineering data quality control through tandem data cleaning. Meanwhile, combined with knowledge-graph-based semantic integration and lakehouse-integrated storage, it enabled the systematic management of heterogeneous data from multiple sources. The three components below address, in turn, the quality problem, the silo problem, and the storage bottleneck that prevents both from being handled at project scale:
(1) A tandem data cleaning procedure using “rule-based preliminary screening + Isolation Forest” was designed. A two-stage processing strategy, from coarse screening to fine detection, was adopted to improve the efficiency and accuracy of data cleaning.
(2) A semantic data integration method integrating three-level coding and knowledge graphs was constructed. A unified classification coding system was established using three element types: construction process, data type, and time series. The knowledge graph was then used to achieve semantic alignment, addressing semantic inconsistencies in which equivalent data fields carry different labels.
(3) A data storage framework coordinating lakehouse integration with hot-cold tiering was established, which lowered the unit cost of storage without loss of query response performance.
The main contribution of this study is a data-governance chain for construction data: tandem cleaning that separates explicit errors from hidden anomalies, alignment of the fields that different systems use for the same thing, and tiered storage that keeps the resulting records available for management. Of the three stages, the cleaning and the alignment stages are evaluated quantitatively, and the storage stage is reported through two operational measures. Waterway projects involve numerous participating parties, and cross-system data coordination is difficult. A dedicated digital role in the top management team is associated with greater attention to digital innovation [11], and the project therefore introduced a Chief Data Officer (CDO) as an organizational arrangement that assigns responsibility for data quality and for resolving conflicts between systems.
The objectives follow from this: to design a tandem cleaning procedure that separates explicit errors from hidden anomalies, to construct a semantic integration method that harmonizes equivalent data fields carrying different labels across systems, to embed both in a tiered storage architecture supported by a defined organizational role, and then to evaluate the resulting platform in a full-scale waterway project.
2. Related Research
2.1. Digital Management Platform for Waterway Engineering
Digital management platforms are an important support for the digital and intelligent management of waterway engineering. By integrating multi-dimensional data such as project schedule, cost, and quality, they support collaborative project control and have achieved certain effects in single business scenarios [8,12]. In recent years, as construction scales have expanded and waterway engineering has grown more complex, massive heterogeneous data have created severe data management challenges, affecting project management efficiency and the level of data sharing. Therefore, in terms of platform architecture, hierarchical digital management platforms based on technologies such as BIM and artificial intelligence have become the mainstream direction. Related studies performed the preprocessing and classification of engineering data and improved the management efficiency of engineering construction [2,7,13]. These studies basically adopted a hierarchical collaborative architecture as the basic framework of digital management platforms, and they evaluated the architecture by the applications it enabled rather than by the data it governs.
The data demands that such platforms have to serve are illustrated by three representative application studies. Li et al. [4] coupled the Storm Water Management Model (SWMM) with the two-dimensional Hydrologic Engineering Center-River Analysis System (HEC-RAS) model to support real-time waterlogging risk prediction and drainage optimization during waterway engineering construction. Zeng et al. [8] designed an end-to-end, data-driven forecasting framework for waterway engineering to support sediment management and dredging decisions. Hartman et al. [12] analyzed sedimentation and dredging records to support maintenance decisions. All three show what engineers want to do with waterway data, and all three depend on inputs assembled from several sources, yet none examines how those inputs are cleaned, aligned, and delivered: interoperability is assumed rather than demonstrated.
In waterway engineering data management, existing studies mostly focused on analyzing and applying engineering data. Still, they lacked systematic methods for cleaning anomalous data when sensors were susceptible to interference during data acquisition. In particular, there were obvious shortcomings in the identification of hidden data anomalies, which affected the reliability of subsequent data analysis and decision-making in engineering.
Meanwhile, deficiencies also existed in the integration of multi-source data for waterway engineering. At present, waterway engineering data lacks a unified coding and identification system, and the mapping of data from different systems still relies on manual experience, making automatic interfacing difficult to achieve. Existing work addresses isolated parts of this problem. Weber and Schenk [5] stitched fragmented construction plans automatically; Sun et al. [6] detected anomalies across heterogeneous sensor channels with a hierarchical Bayesian model; and Wardach et al. [13] combined point clouds with BIM for condition diagnostics. Each contributes a technique for one data type or one stage of the process, but none of them establishes how records that describe the same engineering object are reconciled across systems that were specified independently. Cross-system interoperability therefore remains at the level of format conversion and manual field matching, and the data silos persist.
In terms of data storage, traditional centralized storage could hardly cope with the growing demand for massive heterogeneous data in waterway engineering. The current mainstream data warehouse solutions were standardized but insufficiently flexible, whereas data lake solutions were flexible but weak in governance capability [14,15]. Neither of them could simultaneously satisfy the multiple requirements of waterway engineering for storage cost, query performance, and data invocation. In recent years, lakehouse-integrated data storage architectures, by combining the strong data governance of data warehouses with the flexible scalability and cost-effectiveness of data lakes [16], have gradually been adopted by many data management platforms [17,18,19], including vessel monitoring [17], clinical research data infrastructure [18], and large-scale data streaming [19]. This provided a new approach for the storage of massive heterogeneous data in waterway engineering.
In summary, existing studies have built an important foundation in architecture design and data storage organization for digital management platforms in waterway engineering. However, obvious deficiencies still existed in three core dimensions: data quality control, depth of semantic integration, and efficiency of storage architecture. In response to the above three limitations, this study introduced the Isolation Forest algorithm, knowledge graph technology, and the lakehouse-integrated architecture, respectively, and constructed three core modules: tandem data cleaning, semantic data integration, and lakehouse-integrated storage. An engineering digital management platform covering the whole process of data governance for waterway engineering was thereby formed.
2.2. Isolation Forest Algorithm
The Isolation Forest algorithm is an unsupervised anomaly detection algorithm that builds an ensemble of randomized isolation trees [20]. Its core idea is to exploit the stronger isolability of anomalous samples: when a feature and a split value are chosen at random, anomalous samples are isolated after fewer splits, and the average path length over the ensemble quantifies the degree of anomaly. It does not depend on assumptions about the data distribution, and it identifies anomalies that rule-based screening misses, although it produces more false positives than threshold rules do. It has been widely applied in many fields, such as water quality monitoring, mineral exploration, and wind farm anomaly detection [21,22,23]. In the engineering field, in response to the problem that the detection performance of the Isolation Forest algorithm decreased as the data dimension increased, related scholars improved the algorithm from different directions. Kim et al. [24] proposed a data anomaly detection method integrating clustering and the Isolation Forest algorithm, which used the membership degree after clustering to calculate anomaly scores and improved the detection capability of Isolation Forest on high-dimensional nonlinear data. Lu et al. [25] combined Isolation Forest with SMOTE oversampling and a feature selection algorithm, which improved the accuracy of data anomaly detection in multiple dimensions. Deng et al. [26] proposed a data anomaly detection method based on thresholds and Isolation Forest, which established a preliminary linkage mechanism between threshold pre-screening and Isolation Forest.
The above studies improved the anomaly detection capability in specific scenarios. However, waterway engineering data had multiple sources, high noise, and mixed anomaly types, and a single Isolation Forest method had a relatively high computational cost, which was not conducive to engineering applications. Meanwhile, the Isolation Forest algorithm showed relatively high recall but made numerous misjudgments. Therefore, referring to the idea of combining thresholds with Isolation Forest [26], this study proposed a tandem data cleaning method of “rule-based preliminary screening + Isolation Forest.” Rule-based methods were used to quickly filter explicit anomalies so as to reduce the computational load of Isolation Forest. Isolation Forest was then used to finely detect hidden anomalies so as to make up for the shortcomings of rule-based methods in missed detection, thereby improving the efficiency and accuracy of data cleaning together. Compared with Deng et al. [26], which also places a screening step before Isolation Forest, the present method differs in three respects: the pre-screening is rule-based rather than threshold-only, the forest is fitted only after explicit errors have been removed, and the second stage returns a candidate list for engineering review rather than a final decision.
2.3. Knowledge Graph Technology
Knowledge graphs represent knowledge as relational triples (entity1, relation, entity2) or attribute triples (entity, attribute, value), capturing the relationships and semantic connections among things and concepts in the real world; graph-based models of this kind have been used to represent dam-safety knowledge [27]. They have powerful capabilities of knowledge representation and semantic reasoning and have been widely applied in fields such as semantic search and intelligent question answering. In recent years, research on applying knowledge graphs in engineering has deepened. In terms of engineering management, Zhu et al. [28] constructed an identification module for the unsafe behavior of workers based on a knowledge graph of engineering safety management, and the identification accuracy reached 97.6%. Zhang et al. [29] adopted knowledge graph technology to build an engineering maintenance knowledge base, which improved the level of engineering quality management. Meanwhile, Lee and Kim [30] used pragmatic causal relationships to support latent knowledge reasoning in the civil engineering domain, and Parisi et al. [31] applied graph neural networks within mechanics-informed models for structural analysis; both extended graph-structured representations beyond retrieval towards reasoning and decision support. In addition, Ramonell et al. [32] developed a digital twin data integration system based on the knowledge graph, offering new ideas for fusing multi-source data in waterway engineering. In most of these studies, the graph is organized around a domain ontology defined in advance and is used to store, retrieve, or reason over engineering knowledge. Where the graph served integration [32], the integration was organized around assets and their information requirements. None of them addresses the case in which the same object is recorded under different labels by systems that were specified independently, which is the alignment problem addressed here.
The above studies verified the value of knowledge graphs in engineering knowledge management. However, an effective alignment mechanism was lacking for data fields that denote the same object under different labels, which made it difficult to support deep association and collaborative analysis of cross-system data. Therefore, based on knowledge graph technology and combined with a unified classification coding system constructed from three types of elements, namely construction process, data type, and time series, this study achieved semantic alignment of waterway engineering data.
2.4. Organizational Arrangements for Data Governance
Digital transformation outcomes depend on dedicated executive attention and on socio-technical arrangements, not on technology alone: a dedicated digital role in the top management team is associated with greater attention to digital innovation [11], and work on knowledge management and on top-management teams points the same way [33,34]. The Chief Data Officer extends this logic to data assets, but in construction projects, the role has rarely been studied, and it is not clear which procedures it changes. This study therefore introduced the CDO to address two problems observed in the case: data work that concentrated on collection, processing, and storage with little analysis, so that data could not support decision-making and engineering control; and numerous participating parties with functionally different systems, which makes data interfacing and business integration across organizations difficult.
3. Methodology
Waterway digital management platforms have to reconcile data produced by systems that were procured independently, and in current practice, data silos, inconsistent definitions, and unreliable measurements remain unresolved. The question addressed here is how such data can be governed in practice, and a case-study design was adopted to answer it. The case is the Lianshen Waterway regulation project in Jiangsu Province, China, which already operated five independently procured information systems; the unit of analysis is the project’s data-governance arrangement, that is, the rules, codes, storage tiers, and responsibilities through which data from the five systems are cleaned, aligned, and made available for management decisions. The platform was developed by a contractor for the project owner. The owner commissioned and operated the platform, and it went live in September 2025. The authors designed the platform’s data-governance methods. They also designed and carried out the evaluation reported here. The evaluation used the project’s operating records. The authors had access to these records under an agreement with the owner.
This study therefore focused on data cleaning, data integration, and data storage, using a hierarchical collaborative architecture as the basic framework. Technologies such as Isolation Forest, knowledge graphs, and lakehouse integration were applied to construct a four-layer digital management platform for waterway engineering.
3.1. Overall Architecture
Figure 1 shows the overall platform structure developed in this study, which uses a hierarchical collaborative architecture as its basic framework. The digital management platform for waterway engineering was constructed by adopting a four-layer collaborative architecture model consisting of the perception and acquisition layer, the data resource layer, the service support layer, and the business application layer. The raw multi-source heterogeneous data underwent unified access and transmission in the perception and acquisition layer, generating standardized data streams. They were then transmitted to the data resource layer for cleaning, integration, and storage. Finally, data service results were output to upper-layer applications in the form of APIs through the service support layer. On this basis, this study introduced three core modules, namely tandem data cleaning, semantic data integration, and lakehouse-integrated storage, into the data resource layer to enhance the governance capability of multi-source heterogeneous data.
Figure 1.
Architecture of the digital management platform for waterway engineering.
Among them, the perception and acquisition layer served as the data input port of the digital management platform for waterway engineering. Through unified real-time and near-real-time data interfaces, it comprehensively connected various systems, achieved unified collection of engineering reports, on-site sensor data, and mobile terminal input data, and transmitted them to the data resource layer for processing. The data resource layer, as the core foundation of the entire platform, undertook the functions of standardized governance, integration, and storage of multi-source heterogeneous data. The service support layer was the core hub of cross-system business collaboration. Through a microservice architecture, the capabilities of the data resource layer were encapsulated in a service-oriented manner, providing data services to upper-layer applications in the form of standardized APIs. With the support of the unified data foundation and the service support capability, the business application layer constructed a business application system covering all scenarios of the project and enabled integrated collaborative control of various businesses.
The platform was implemented as a Java 17/Spring Cloud 2024.0 microservice system with a Vue 3.5 front end; relational records are held in PostgreSQL 17 and time-series measurements in InfluxDB 2.7.0. The five legacy systems are connected through the interface each of them already provides rather than being replaced: the smart construction site system publishes measurements over MQTT, the BIM collaborative platform exposes RESTful endpoints and exchanges IFC models, and the intelligent concrete cloud factory is connected to its database directly, with the same principle applied to the remaining two systems. Records are exchanged in JSON and CSV. Synchronization uses a full baseline followed by incremental updates: a nightly full reconciliation verifies the baseline, and a five-minute incremental process keeps the data resource layer current, producing about 5000 new records per day and a cumulative volume of about 1 TB. That volume is dominated by BIM model files, on-site imagery and documents rather than by the tabular records: the records themselves occupy a small fraction of it, which is why the tiering separates them from the model and image files.
Meanwhile, in view of the characteristics of waterway engineering, such as numerous participating parties and great difficulty in data coordination, the Chief Data Officer (CDO) system was introduced. With the CDO as the core, an organizational support model adapted to the digital management platform for waterway engineering was constructed. In this organizational model, the CDO was fully responsible for data management, data coordination, and decision support for waterway engineering. The core responsibilities included formulating the project data governance rules, coordinating the data interfacing and sharing of all participating parties, organizing data quality control, and promoting the iterative optimization of algorithm models. From the perspective of the interaction among different participating parties, this study elaborated the main responsibilities of the CDO and related entities, as shown in Table 1. Through the overall coordination of the CDO, barriers between the participating parties and between systems were reduced, and three procedures were introduced with the following roles: a weekly data meeting at which cross-system discrepancies are resolved, a field-definition review sheet that any change to a shared field must pass, and an anomaly review and sign-off record through which flagged measurements are released or rejected.
Table 1.
Responsibilities of the Chief Data Officer and related entities in the digital management platform for waterway engineering.
3.2. Tandem Data Cleaning Module
In view of the characteristics of raw data in waterway engineering, such as multi-source, heterogeneous, and high-noise attributes, a tandem cleaning module of “rule-based preliminary screening + Isolation Forest” was constructed. Suspicious records and missing values were identified, reviewed, and repaired, thereby improving the quality of the engineering dataset.
For rule-based preliminary screening, the collected data were checked against three types of conditions: value ranges, format regular expressions, and primary key uniqueness. In the concrete quality data of the project, for example, 28-day compressive strength was restricted to 30–60 MPa, pouring dates later than the date of screening were rejected, and duplicate record identifiers were removed. These conditions removed more than 80% of the explicit anomalies before the forest was fitted, although they removed a much smaller share of the records: in the labeled test set, the rules flagged 25 of 500. The justification for the tandem module is therefore the precision gained at the review stage, not a saving in computation. The cleaning parameters were tuned and evaluated on a sample of 500 groups of records with 12 variables each, not on 500 individual records; the resulting rules were then applied to the full data stream.
Missing values were handled with Multiple Imputation by Chained Equations (MICE) [35]. Eight of the twelve variables contained missing values, at an overall missing rate of 6.2%. Five imputations were generated with a maximum of 10 iterations each, and the imputed datasets were analyzed together, so that the uncertainty of the imputation was carried into the subsequent estimates instead of being removed by a single fill.
After rule-based preliminary screening, some data might still contain hidden problems such as trend drift, multi-parameter correlated deviations, and small-magnitude anomalies. In this study, the Isolation Forest algorithm was adopted for fine detection, using the scikit-learn implementation with 100 isolation trees (n_estimators = 100), a subsample size of 256 (max_samples = 256), and a contamination rate of 0.08 used in a pilot run, with the remaining parameters at their default values. The threshold was not recomputed for each sample: the pilot run, carried out on the first three months of records, produced a score threshold that was then held fixed, and every later run, standalone or in tandem, treated a record as anomalous when its score exceeded that fixed threshold. The algorithm is an unsupervised ensemble of randomized isolation trees and requires no assumptions about the data distribution. The forest was fitted on the records that survived the screening; the same fitted forest and threshold were used in the standalone and tandem comparisons. The detection steps were as follows.
Step 1: Isolation trees and the Isolation Forest were constructed. For each data subset, a feature was randomly selected, and a split value was randomly chosen for that feature. The data were split according to the split value, and each subset was recursively partitioned until every data point was located in a separate leaf node or the tree reached its maximum depth. Isolation trees were finally generated, and the n isolation trees were combined into an Isolation Forest.
Step 2: The average path length was calculated. Each data point xi was substituted into each isolation tree of the Isolation Forest, and the average path length E(h(xi)) of each data point from the root node to its leaf node in the Isolation Forest was calculated. Shorter paths indicate easier isolation and a higher probability that the data point is an outlier.
In Equation (1), n is the number of isolation trees and ht(xi) is the path length of the sample xi in tree t, that is, the number of edges traversed from the root node to the leaf that contains xi.
Step 3: The anomaly score was calculated. According to the average path length E(h(x)) of the test data x in the entire Isolation Forest, the anomaly score s(x, m) was calculated.
s(x, m) = 2−E(h(x))/c(m)
In Equation (2), m is the number of samples and c(m) is the normalization term, that is, the average path length of an unsuccessful search in a binary search tree built from m samples [20]. c(m) is given by Equation (3).
c(m) = 2 ln(m − 1) + 2γ − 2(m − 1)/m, m > 2
In Equation (3), γ ≈ 0.5772 is the Euler–Mascheroni constant; the expression is defined for m > 2.
Step 4: The anomaly score was computed. The score s(x, m) was mapped to the unit interval, with values closer to 1 indicating a higher probability of being anomalous.
Step 5: The anomaly threshold was determined once. In the pilot run, it was set at the quantile implied by the preset anomaly proportion and was then frozen, so later records were judged against that value rather than against a quantile recomputed from their own score distribution.
Step 6: The flagged records were reviewed rather than deleted. Samples whose anomaly score exceeded the threshold were recorded as candidates, and each candidate was checked against the rule ranges of the first stage and against the construction records. Three outcomes were distinguished (Figure 2d). A candidate that contradicted a hard rule or the sequence of the construction records was classed as a transmission error and removed. A candidate that was confirmed by an independent record, such as a matching laboratory report or a second sensor, was classed as a corroborated extreme and retained with a flag. A candidate that conflicted with the supervision records and could not be resolved was referred to the supervision unit and retained until the conflict was closed. In the pilot period, about 15% of the records were flagged and entered the review, and about 60% of the reviewed records were retained, either as corroborated extremes or as pending referrals, so that unusual but genuine events were not lost to the detector. These figures are estimates rather than full operating statistics, and the 500-group labeled sample used for the ablation is a different population, in which the tandem module flags 37 records.
Figure 2.
The cleaning process: (a) isolation trees built on sub-samples; (b) recursive binary partitioning of the attribute space; (c) the same partitioning expressed as a tree; (d) review of the flagged records, the step added in this study. Panels (a–c) are redrawn from [20].
Three quantities are distinguished in what follows. A statistical outlier is a record whose anomaly score exceeds the fixed threshold; it is what the detector produces. A data error is a record that contradicts a rule, the construction sequence or an independent record; it is what the labeling in Section 4.4 marks. A genuine extreme is an unusual measurement that the review confirms, such as a batch that really did reach a high strength; it is retained with a flag. The detector is trained to find outliers, and the review then separates the second and third kinds, so a high share of retained records is not a false-positive rate.
3.3. Semantic Data Integration Module
To address inconsistent data standards, semantic incompatibility, and difficulties in collaborative sharing among multi-source heterogeneous systems, this study developed a data integration module featuring unified coding, semantic enhancement, and standard conversion so that data from the different systems could be governed as a single body. First, based on the characteristics of waterway engineering, a three-level composite coding specification of “construction process coding, data type coding, and time-series coding” was constructed. Among them, construction process coding was generated based on the Work Breakdown Structure (WBS) and adopted a three-level coding structure of “divisional works, subdivisional works, and construction processes,” corresponding to the BIM component ID, and clarifying the engineering part and construction process node to which the data belonged. Data type coding was divided according to business domains and data structures, distinguishing business categories such as engineering management, equipment monitoring, and plant production. Time-series coding was generated according to the time of data collection, ensuring the traceability of time-series data. The three elements appear in that order. The construction-process code occupies the first three levels, so 01.01.03 in 01.01.03-HD07-20260512 gives the divisional work, the subdivisional work and the construction process; the data-type code follows as HD07, where HD denotes the data type (concrete quality) and 07 the business object within it; and the time-series code closes the string as a date version, 20260512 for 12 May 2026. The three-level code is deliberately narrower than a building information model: IFC GlobalId and the ISO 19650 [36] common data environment identify components of the works, whereas the records that had to be joined here also come from the concrete plant and the sensing systems, which carry no IFC identity. The code therefore acts as the key that the IFC identifier and the non-BIM records can both be mapped onto, and the mapping is maintained in the graph rather than in a separate table. The code identifies the class of record rather than an individual record: two pours of the same process and data type on the same day share it. Record-level uniqueness is preserved by the source-system identifier and the full timestamp, and the alignment joins on the code together with those fields rather than on the code alone; the date segment is a version marker, and the full timestamp of each measurement is retained with the record.
Meanwhile, the knowledge graph technology was introduced to establish connection relationships among entities such as data tables and data fields through semantic similarity, which achieved close alignment of heterogeneous data and addressed semantic inconsistencies, including different labels for equivalent data fields and identical labels for fields with different meanings. However, because the types of entity relationships in waterway engineering were numerous, the top-down method relying only on domain knowledge and expert experience could not cover their complexity and variability. Therefore, this study adopted a bottom-up approach to construct the knowledge graph of waterway engineering, and the construction process is shown in Figure 3. Starting from specific data and instances, this method first collected data in the form of triples. It then extracted a data model based on the data content and, after domain experts reviewed it, added it to the knowledge base, completing the knowledge graph construction. The graph built for this project holds 1320 entities of 23 relation types and 3680 triples. Once the graph was in place, field alignment was carried out in four steps: every field was typed by the three-level code, so that only comparable fields were compared; candidate pairs were generated from label similarity, value-domain overlap, and co-occurrence in the same business record; the pairs were ranked on a combined similarity score and compared with two values fixed with the domain experts: pairs below 0.60 were rejected, pairs above 0.85 were accepted without further confirmation, and pairs between the two were accepted subject to confirmation by the experts before they were written back to the graph. The evaluation in Section 4.3 measures the matcher on its own, with the acceptance threshold set to 0.60, so that its figures are comparable with the two automatic baselines; the confirmation band is an operational safeguard, and its effect is not included in those figures. Both confirmations and rejections were written back to the graph as positive and negative alignments, so that later comparisons started from accumulated decisions rather than from labels alone. For example, the work-location code used by the smart construction site system and the component identifier used by the BIM collaborative platform denote the same part of the works; once the former was mapped to the construction-process code that the latter already carried, records from the two systems could be joined on a single key. The alignment was evaluated on 240 field pairs drawn from the five systems and labeled by hand: of the pairs the procedure accepted, 93.24% were correct, and of the pairs labeled as equivalent, 87.34% were found. The three signals are combined into a single score; the similarity functions and their weights are part of the platform implementation and are not reproduced here, and the actual field names and values of the two systems are not reproduced because they belong to the owner’s configuration. What is reported is the operating point, the sensitivity of precision and recall to the acceptance threshold between 0.60 and 0.90, and the evaluation on 240 hand-labeled pairs.
Figure 3.
Flowchart of knowledge graph construction for waterway engineering.
3.4. Lakehouse-Integrated Data Storage Module
In response to the collected structured, semi-structured, and unstructured data, the digital management platform for waterway engineering introduced a lakehouse-integrated storage module to optimize the storage cost and query performance. The architecture of the lakehouse-integrated data storage module is shown in Figure 4. This module was inserted after the semantic integration module to carry out hierarchical storage management of the governed data. Through the “one-time entry into the lakehouse and reuse across the whole domain” model, it eliminated redundant storage of the same data in different systems and avoided the formation of data swamps. It consolidated the records of the five systems, retained the business meaning of each record, and made the data reusable across applications. This module consisted of three substructures, namely the data lake foundation, the data warehouse layer, and hot-cold tiered management. The data lake foundation stored all raw data and retained complete information. The data warehouse layer stored the standardized data after cleaning and integration and optimized performance for high-frequency queries.
Figure 4.
Architecture of the data lakehouse module for waterway engineering.
Meanwhile, a heat score computed from three dimensions, namely access frequency, data timeliness, and business importance, was used to divide the data into two tiers, hot and cold. Cold data, such as low-frequency full-volume raw data and historical archival materials, were stored in the data lake to preserve the original appearance and complete information of the data, and the distributed storage architecture was relied upon to reduce storage costs. Hot data, such as high-frequency standardized data and business indicator sets, were stored in the data warehouse, and performance optimization was carried out for query and analysis scenarios to ensure a rapid response. Moreover, collaborative invocation between the data lake and the data warehouse was implemented through the computing flow mechanism, which avoided the performance loss caused by massive data migration while preserving data consistency. In addition, to ensure the collaborative work of the new processing engine with the existing storage system, the data lakehouse also optimized the storage interfaces. It adapted to the dynamic switching of multiple data access protocols and supported real-time data invocation and information feedback.
At present, information systems have been generally deployed in waterway engineering. When applying this digital and intelligent management platform, the problem of data migration needed to be considered. To this end, this study adopted an incremental synchronization and verification mechanism. That is, an initial baseline was established through full data migration, and then data consistency was maintained through real-time incremental synchronization. Meanwhile, a distributed data migration tool was introduced to improve the migration efficiency. Multithreaded parallel processing technology was used to shorten the migration time. Differentiated access and operation permissions were set for the different participating parties and positions, so that access rights and responsibilities remained traceable.
4. Experimental Results
4.1. Case Overview
Taking the waterway regulation project on the Guanhe River to the Huangxiang River section of the Lianshen Waterway as the basis, this study experimentally verified the proposed method. The project was located in Yancheng City, Jiangsu Province, China, with a total length of 3.031 km. The total budget investment of the project reached 1.138 billion yuan, and the planned construction period was 60 months. The project started from the mouth of the Guanhe River and extended along the Lianshen Waterway to the Tongyu River. It was comprehensively regulated according to the Class II waterway standard. The construction area was arranged along the east bank of the Tongyu River, with a narrow and elongated terrain, bordering the Tongyu River on the west and residential areas on the east, so that the site layout and traffic were restricted. The project was characterized by a complex structural form, great construction difficulty, and high requirements for digital and intelligent management. The overall layout of the project and the on-site operation conditions are shown in Figure 5 and Figure 6.
Figure 5.
Aerial view rendering of the waterway engineering project.
Figure 6.
On-site operation of the waterway engineering project.
The project was delivered under a construction general contract, with design and construction procured separately and no party responsible across both phases; the platform was commissioned separately by the owner, which owned and operated it. The platform therefore served the construction stage: the systems and the indicators evaluated in this paper concerned construction management, and operation and maintenance were outside their scope. The project parties comprised one owner, one design institute, two construction contractors, two supervision units, and two research institutions.
The project deployed five independent information systems: the BIM collaborative management platform, the smart construction site sensing system, the intelligent concrete cloud factory system, the intelligent rebar cloud factory system, and the foundation pit structural construction monitoring system. These systems covered several business scenarios, including construction management and on-site sensing, and gave the project a strong digital foundation. However, typical problems such as multi-system heterogeneity, prominent data silos, and insufficient cross-system collaboration also existed.
Based on the constructed architecture of the digital management platform for waterway engineering and in combination with the current situation of multiple coexisting systems in this project, this study adopted the technical route of “integration and reconstruction + function upgrading” to carry out the practical application. On the basis of retaining the business capabilities of the original systems, the system barriers were broken down through a unified data foundation. An intelligent algorithm engine was also embedded to enable smooth integration and capability upgrades across heterogeneous systems. The existing five heterogeneous systems completed data interfacing through standardized interface adaptation. Meanwhile, according to the data formats and protocols of different systems, customized extraction and adaptation components were developed to aggregate data from all scenarios, including the construction site, back-end plant production, and business management. In addition, the project established a Chief Data Officer system to interface with all participating parties on specific matters of data management and to keep the platform in continuous operation. The interfaces of the digital management platform for waterway engineering are shown in Figure 7 and Figure 8.
Figure 7.
Overall interface of the digital management platform for waterway engineering.
Figure 8.
Quality management business interface of the digital management platform for waterway engineering.
Meanwhile, in order to comprehensively evaluate the application effect of the digital management platform for waterway engineering, this study carried out a comparative experiment and constructed an evaluation index system from three dimensions, namely data governance, collaboration efficiency, and management benefits, which contained nine specific indicators in total. The platform went live on 1 September 2025, and the records used here were extracted on 31 August 2026. The comparison therefore used the six months from 1 March to 31 August 2025 and the twelve months from 1 September 2025 to 31 August 2026; both periods fell in the main structural construction stage of the project, and the volumes of work were comparable, although a quality campaign organized by the owner ran during the second period. The measured indicators were computed over 120 cross-system retrieval tasks and over 4800 quality acceptance records. According to the degree of quantifiability of the indicators, different evaluation methods were adopted:
- (1)
- Directly quantified indicators: a direct comparison was conducted based on the measured data before and after the launch of the platform. They included three indicators: the time for cross-system data retrieval, the anomaly detection rate, and the number of quality problems. Among them, the time for cross-system data retrieval was measured by the average time of typical cross-system query tasks. The anomaly detection rate was calculated as the share of the anomalies established for the evaluation period, namely those flagged by the platform together with those identified later during inspection or rectification, that the platform had flagged. It was therefore a recall measured against an independent audit, not an accuracy; the pre-platform value of 50% was a reconstructed figure, the share that manual inspection of the same kind identified before the platform was introduced, so it was labeled reconstructed rather than measured in Table 2. The number of quality problems was based on the statistical data in the monthly quality acceptance reports.Table 2. Comparison of the application effects of the digital management platform for waterway engineering, with the evidence behind each indicator.
- (2)
- Expert-assessed indicators: they included four indicators, namely the workload of data management personnel, the plant production speed, the collaboration and communication efficiency among participating parties, and the overall project management efficiency. Because engineering management has multi-factor coupling characteristics, these indicators could not be obtained from a single data source. They were therefore assessed by a structured expert assessment: seven experts with more than 10 years of experience in waterway engineering management (2 from the owner unit, 2 from the construction unit, 1 from the supervision unit, 1 from the design unit, and 1 from a university) scored the improvement range of each indicator independently in a single round, taking the pre-platform state as the baseline (100%) and the project’s operational data as reference. The seven scores were combined into a mean. Agreement across the panel was moderate (Kendall’s W = 0.58, χ2(3) = 12.18, p = 0.007), so the rankings were more consistent than chance would produce; the panel’s score matrix was used to compute the agreement index, and for the workload indicator, the seven scores had a mean of 60%, a standard deviation of 7.1 percentage points, and an interquartile range of 55 to 65%, so the panel differed in degree rather than in direction. The individual values for the other three indicators were not reproduced here because the panel was assured that only aggregate statistics would be reported, so their dispersion was not given. The values were treated as expert estimates rather than as measured outcomes.
- (3)
- Project benefit indicators: statistics were compiled based on the actual progress data and financial data of the project. They included two indicators, namely the duration of critical processes and the project cost. Among them, the duration of critical processes was calculated by comparing the construction schedule plan with the actual progress, and the project cost was calculated by comparing the actual expenditure with the budget.
In addition, with respect to the algorithm performance of the data cleaning module, this study carried out an ablation experiment. Three indicators, namely Precision, Recall, and F1-score, were adopted as the evaluation indicators of data cleaning.
4.2. Results of the Comparative Experiment
Following platform implementation, improvements were observed in data governance, collaboration efficiency, and project management indicators; the results are summarized in Table 2, which also states the evidence behind each indicator. In terms of data governance, the platform broke down the barriers between heterogeneous systems and enabled the unified management of full-scale engineering data. The average time for cross-system data retrieval decreased from 4 h/batch to 1.4 h/batch, a reduction of 65%. The share of expert-confirmed anomalies that the platform identified correctly changed from 50% to 92% after the tandem cleaning was introduced, and the expert panel estimated that the manual workload of data operations and maintenance fell by about 60%. In terms of collaboration efficiency, real-time data linkage was implemented through the unified data foundation; the plant production speed was estimated to improve by 40% and the collaboration and communication efficiency among participating parties by 30%. In terms of management benefits, the integrated platform replaced the traditional mode in which multiple systems operated independently. The duration of critical processes was 80 days shorter than the approved baseline schedule, and the project cost was 4 million yuan below the approved budget; the quality problems recorded in the monthly acceptance reports fell by 65 per month on average, and the overall project management efficiency was estimated to improve by about 25%. The two periods also differed in factors outside the platform, including a quality campaign run by the owner and changes in the construction sequence, so these results describe the improvement observed after implementation rather than an isolated effect of the platform. The six ratio-scale indicators are plotted in Figure 9 relative to the baseline.
Figure 9.
Application effects of the platform on six of the nine evaluation indicators, expressed relative to the pre-platform baseline (set to 1.0); the remaining three are absolute quantities reported in Table 2. Time for cross-system data retrieval and the manual workload of data operation and maintenance improve as the value falls; the other four improve as the value rises.
For data storage, the unit cost of keeping a terabyte fell from about CNY 120 to about CNY 75 per month, a reduction of 37.5%, and the 95th percentile of query latency fell from 280 ms to 90 ms over the same period. The quantity that matters for interpretation is the absolute one: the platform holds about 1 TB, so the saving is roughly CNY 45 per month, or a few hundred yuan a year, which is negligible against a project of this budget. The result should therefore be read as a reduction in unit cost and as evidence that tiering did not cost query performance, rather than as a material saving to the project.
The unit of the quality indicator is the individual non-conformity raised in the monthly acceptance report, not the acceptance record that carries it; a single acceptance record may raise several. The 4800 acceptance records cover the twelve post-implementation months, about 400 per month; the 140 and 75 figures count non-conformities raised in those records, and a single record may raise several, so the two should not be divided into one another.
4.3. Results of the Field Alignment
The alignment procedure was evaluated on 240 field pairs drawn from the five systems and labeled independently by two engineers, one from the design institute and one from the supervision unit. Against those labels, the procedure reached a precision of 93.24% and a recall of 87.34%; precision is computed over the pairs the procedure accepted, and recall over the pairs labeled as equivalent, so the two percentages do not share the same denominator of 240: roughly one accepted alignment in fifteen is wrong, and about one equivalent pair in eight is left to the expert band rather than accepted automatically. The 0.60 to 0.85 band exists for fields of the kind that produce most of the remaining errors: short, generic labels such as “temperature” or “time”, where the value domain alone does not separate the measurement context. Each expert decision is written back to the graph, so the share of pairs that need manual confirmation falls as the project proceeds. Table 3 sets the result against two baselines, edit-distance matching and SimHash alignment, and gives the confusion matrix of each. Across thresholds from 0.60 to 0.90, the method trades recall for precision: at 0.60 it returns 0.932 precision and 0.873 recall; at 0.85 it returns 0.983 and 0.74; at 0.90 it returns 0.991 and 0.690. The acceptance threshold of 0.60 was chosen for the evaluation because a missed alignment has to be resolved by hand later, whereas a confirmed one costs an expert a few seconds. The precision and recall in Table 3 are computed on the automatic decision at the 0.60 floor, before any expert confirmation, so that they are comparable with the two fully automatic baselines; the confirmation band reduces false alignments further in operation, but that effect is not quantified here. The two engineers resolved disagreements by discussion; no agreement statistic was retained.
Table 3.
Field alignment on the 240 hand-labeled pairs: the two baselines and the method proposed here at the acceptance threshold used in the evaluation (similarity 0.60, five candidates retained per field).
4.4. Results of the Ablation Experiment
To verify the effectiveness of the tandem module design, this study compared the cleaning performance of the single-rule screening module, the single Isolation Forest module, and the tandem module. The experiment took the concrete quality data of the project as the test set: 500 groups of records with 12 variables each, of which 40 were labeled as anomalous. The labels were assigned by two technicians from the project, independently of the modeling work, and their agreement was Cohen’s kappa = 0.83. The stage counts and the metrics derived from them are given in Table 4. The metrics are computed on this labeled set, which contains 40 anomalies, many of them hidden, and therefore describe a harder task than the operating records behind the 92% in Table 2. The rules flagged 25 records, and the same forest, with the threshold fixed in the pilot run, flagged 12 of the 475 that survived screening, so the tandem output is 37 records rather than the total a freshly recomputed quantile would give at each stage. The threshold was derived from a pilot period that overlaps the evaluation records and a single seed was used, so the figures remain optimistic in that limited sense. With 40 anomalies, the 95% Wilson interval for precision is [0.82, 0.99] for the tandem module and [0.66, 0.89] for the forest alone, and for recall [0.74, 0.95] against [0.77, 0.96]. The two precision intervals overlap between 0.82 and 0.89, a span of seven percentage points, and the recall intervals almost coincide; the recall difference is one record, and the F1 difference rests on seven. The comparison is therefore indicative: the point estimates separate the methods most clearly on precision, but the intervals do not exclude equal performance on any metric.
Table 4.
Stage counts and cleaning metrics: records entering and leaving each stage of the tandem procedure and the three methods compared on the 500 labeled groups.
For the Precision dimension, the single-rule screening module performed best (0.96), the tandem module came next (0.95), and the single Isolation Forest module had the lowest precision (0.80). For the Recall dimension, the single Isolation Forest module performed best (0.90), the tandem module came second (0.88), and the single-rule screening module had the lowest recall (0.60). For the F1-score dimension, the tandem module reached 0.91, against 0.74 for the single-rule screening module and 0.85 for the single Isolation Forest module.
To check that this ordering does not depend on a single split or on one random seed, the same 500 labeled groups were split five ways, and each split was evaluated with three random seeds for the forest, giving fifteen runs. Over the fifteen runs, the mean F1 was 0.738 ± 0.049 for the rules, 0.847 ± 0.036 for the forest and 0.908 ± 0.042 for the tandem module; the ordering is unchanged, and the tandem value is consistent with the 0.909 obtained on the single held-out partition. The standard deviations are large relative to the gaps between the methods, however, because each fold contains only eight anomalies.
5. Analysis
5.1. Analysis of the Comparative Experiment Results
The comparative experiment evaluated the platform along three dimensions. Table 2 reports what changed; the discussion below considers what the changes mean.
For data cleaning, the gain lies less in the value of any single indicator than in where the gain comes from. Rule-based screening is precise but blind to hidden anomalies, and the Isolation Forest finds them at the cost of many false positives. The tandem arrangement lets each stage do what it does better: the confusion matrices in Table 4 show that the tandem module gives up two percentage points of recall relative to the forest alone and removes seven of its nine false positives. In a project where every flagged record has to be checked by an engineer, that is the trade that matters.
The support for the cleaning comes from the engineering review rather than from the distribution of the retained records: most of the flagged records were confirmed and kept. That step also settles the balance between the two kinds of error. Compared with the forest alone, the tandem module gives up one true anomaly (35 against 36) and removes seven false alarms (2 against 9), so it trades a marginal loss of recall for a substantial gain in precision; the review list becomes short enough to check thoroughly, which is what makes the trade acceptable.
For data integration, the retrieval time fell from about 4 h per batch to about 1.4 h. The change is qualitative as well as quantitative: under the previous arrangement, an engineer acted as the interface between systems, exporting, converting, and matching data, whereas the coding scheme and the graph perform that matching once and reuse it. This helped address inconsistencies in data definitions across participating organizations and improved coordination between production planning and project management.
For data storage, the important result is that the cost of keeping the full record fell while query response improved, which is what allows raw data to be retained instead of discarded after cleaning. Storage and cleaning therefore depend on each other: keeping the raw records is affordable only because cold data can be stored cheaply, and the tiering in turn relies on the coding that makes each record identifiable. The three improvements are therefore linked rather than additive.
5.2. Analysis of the Ablation Experiment
The three methods differ in their observable information, and the corresponding performance metrics reflect such distinctions. Rule-based screening makes decisions based on predefined explicit constraints; it incurs few misclassifications yet fails to capture patterns outside the scope of these constraints. By contrast, the Isolation Forest evaluates each record using path lengths: anomalies are isolated after fewer splits and therefore have short paths, whereas normal records require longer paths. Records near the boundary may have paths short enough to be flagged, which is why the forest alone accumulates false positives. The proposed tandem module first eliminates overt errors via rule-based preliminary screening, after which the Isolation Forest operates on a cleaner dataset. This design preserves most of the precision inherent to rule-based methods while reducing the error rate of the forest.
Recall exhibits an opposite trend: the Isolation Forest can identify hidden anomalies undetectable by rule sets, and the tandem module maintains nearly the same recall (0.88 vs. 0.90) while cutting the forest’s false positives (2 vs. 9). The two stages are thus complementary rather than redundant. The tandem module achieves an F1-score of 0.91, compared with 0.74 for the standalone rule-based approach and 0.85 for the standalone Isolation Forest (Figure 10). This two-stage configuration does not optimize any single metric in isolation; instead, it yields a different error profile, one that matches the project’s manual review capacity.
Figure 10.
Cleaning performance of the three methods on the labeled test set: (a) precision, (b) recall, (c) F1-score. Every value is computed from the confusion matrices in Table 4.
5.3. Research Limitations
The design of the study sets three limits on how the results should be read. It is a single case, and the figures show what the arrangement achieved in this project rather than what it would achieve elsewhere. The anomaly sample is small, at 40 labeled records; the comparison is before-and-after rather than controlled, because no comparable project without the platform was available, and the two periods differed in the owner’s quality campaign, the construction sequence and material prices; and the three modules were introduced together with the Chief Data Officer arrangement, so the effects of the knowledge graph, of the lakehouse and of the organizational arrangements are observed through the chain as a whole rather than separately.
Four aspects of the evidence deserve consideration. First, the evaluation was designed and carried out by the authors themselves, and the indicators and the assessment instrument were chosen by them, so a degree of self-assessment cannot be excluded; what limits it is that the anomaly labels were assigned by two project technicians who took no part in the modeling, that every metric in Table 3 and Table 4 is computed from those labels rather than from the authors’ judgement, and that each indicator in Table 2 is tied to a record held by the owner. Second, indicators not recorded by any single system were scored by seven experts in a single round; agreement was moderate (Kendall’s W = 0.58), but seven judgements remain, and the individual scores are not reproduced, so the estimates should be read as perceived changes rather than as measurements. Third, the deployment configuration of the lakehouse and the thresholds of the heat score are not reported: the contract with the project owner restricts disclosure of the platform configuration and of the contents of the graph, which remain the owner’s property. What can be checked in their place is the design of the two modules, given in Section 3.3 and Section 3.4, and the operational outcomes in Section 4.2; the data themselves are available from the corresponding author on reasonable request and with the owner’s permission. The method itself also has two inherent limitations: the knowledge graph relies on manual verification when it is built, and the hot-cold thresholds are empirically defined rather than adaptively tuned, so both would need refinement before the platform is deployed at a larger scale. Fourth, both labeled sets are enriched in positives: 40 of the 500 records are anomalies, and 158 of the 240 field pairs are equivalences. At the prevalence of the operating stream, the precision of both detectors would be lower, and the figures in Table 3 and Table 4 should be read with that in mind.
6. Conclusions
This study investigated whether a data-governance framework can render records from independently procured systems usable for construction management, and the results support its feasibility. After implementation, the verification load on the engineering staff was lighter, no confirmed event was discarded, cross-system retrieval time fell from approximately 4 h to 1.4 h per batch, and tiered storage lowered the unit cost of retention while query responses became faster. These are measured outcomes, observed after the platform went live rather than isolated by a controlled comparison. Project-level outcomes were more modest and subject to greater uncertainty: the expert panel estimated a perceived improvement of about 25% in overall management efficiency, while the schedule, cost, and quality results reflect both the platform and the period in which the project ran.
Three lines of work follow. First, knowledge-graph construction should be automated: a domain large language model could propose entity relations and candidate field alignments from project documents and records, with the engineer confirming or rejecting each proposal, which would reduce the manual verification effort that currently limits the size of the graph. Second, the hot-cold thresholds should be learned from observed access patterns rather than fixed from experience, so that the tiering follows the project through its stages. Third, the arrangement should be tested in projects of different scales and phases, whose system portfolios and data volumes differ.
Author Contributions
Conceptualization, Y.W. and P.C.; methodology, Y.W. and P.C.; software, Y.W.; validation, Y.W. and P.C.; formal analysis, Y.W. and P.C.; investigation, Y.W., P.C. and C.Z.; resources, P.C. and C.Z.; data curation, Y.W. and P.C.; writing—original draft preparation, Y.W. and P.C.; writing—review and editing, Y.W., P.C., C.Z. and Z.X.; visualization, Y.W., C.Z. and Z.X.; supervision, P.C.; project administration, P.C.; funding acquisition, Z.X. All authors have read and agreed to the published version of the manuscript.
Funding
This research was funded by the Key Research and Development Project of Hainan Province (ZDYF2023GXJS150).
Data Availability Statement
The data presented in this study are available on request from the corresponding author.
Conflicts of Interest
The authors declare no conflict of interest.
References
- Lee, J.H.; Ostwald, M.J. AI-Enabled Building Design Collaboration: Insights from Australian Adoption and Implementation. Buildings 2026, 16, 1126. [Google Scholar] [CrossRef] [Scilit]
- Akkermann, J.; Müller, S. Digitalization of Waterway Infrastructure—From Maintenance of Existing Structures to Ideas of New Constructions. Bautechnik 2023, 100, 264–271. [Google Scholar] [CrossRef] [Scilit]
- You, J.; Ding, X.; Liu, P.; Xiahou, X. Research on the Benefits of Intelligent Construction Site Applications—A Case Study in Nanjing City. Buildings 2026, 16, 550. [Google Scholar] [CrossRef] [Scilit]
- Li, J.; Feng, J.; Wang, Q.; Zhang, Y. Construction-Induced Waterlogging Simulation in Pinglu Canal Using a Coupled SWMM-HEC-RAS Model: Implications for Inland Waterway Engineering. Water 2025, 17, 2415. [Google Scholar] [CrossRef] [Scilit]
- Weber, L.A.; Schenk, D. Automatic Stitching of Fragmented Construction Plans of Hydraulic Structures. Bautechnik 2022, 99, 330–340. [Google Scholar] [CrossRef] [Scilit]
- Sun, L.; Reed, J.; Huang, X.; Barnett, D.; Todd, M.D.; Eick, B.; Ortiz, C.N. Multi-Channel, Heterogeneous Data Source Detection of Anomalies in Tainter Valve Machinery Systems Using a Hierarchical Bayesian Approach. Struct. Health Monit. 2025, 24, 14759217251364289. [Google Scholar] [CrossRef] [Scilit]
- Zhou, W.; Zhang, Y.; Chen, J.; Jiang, H.; You, W.; Nie, L.; Fang, M. An Approach of BIM-Based Dynamic Adaptive Zoning for Group Piles Construction Multi-Work Areas. Buildings 2024, 14, 2071. [Google Scholar] [CrossRef] [Scilit]
- Zeng, Y.; Chadha, M.; Ammar, D.; Wang, D.; Asborno, M.; Miele, S.; McKnight, C.J.; Memarsadeghi, N.P.; Hartman, M.A.; Mitchell, K.N.; et al. A Data-Driven Channel Infilling Rate Forecasting Framework with Quantified Uncertainty for Southwest Pass and Houston Ship Channel. Appl. Ocean Res. 2026, 175, 105233. [Google Scholar] [CrossRef] [Scilit]
- Huang, J.; Duric, Z. AI in Infrastructure Management of Inland Waterway Engineering. Bautechnik 2026, 103, 420–426. [Google Scholar] [CrossRef] [Scilit]
- Nitithamyong, P.; Skibniewski, M.J. Web-Based Construction Project Management Systems: How to Make Them Successful? Autom. Constr. 2004, 13, 491–506. [Google Scholar] [CrossRef]
- Bendig, D.; Wagner, R.; Piening, E.P.; Foege, J.N. Attention to Digital Innovation: Exploring the Impact of a Chief Information Officer in the Top Management Team. MIS Q. 2023, 47, 1487–1516. [Google Scholar] [CrossRef] [Scilit]
- Hartman, M.A.; Mitchell, K.N.; Dunkin, L.M.; Lewis, J.; Emery, B.; Lenssen, N.F.; Copeland, R. Southwest Pass Sedimentation and Dredging Data Analysis. J. Waterw. Port Coast. Ocean Eng. 2022, 148, 05021017. [Google Scholar] [CrossRef] [Scilit]
- Wardach, M.; Pawłowicz, J.A.; Kosior-Kazberuk, M.; Krentowski, J.R. The Diagnostics of the Condition and Management of Large-Panel Buildings Using Point Clouds and Building Information Modelling (BIM). Buildings 2023, 13, 2089. [Google Scholar] [CrossRef] [Scilit]
- Xue, M.; Bu, Y.; Somani, A.; Fan, W.; Liu, Z.; Chen, S.; van Hovell, H.; Samwel, B.; Mokhtar, M.; Korlapati, R.; et al. Adaptive and Robust Query Execution for Lakehouses at Scale. Proc. VLDB Endow. 2024, 17, 3947–3959. [Google Scholar] [CrossRef] [Scilit]
- Harby, A.A.; Zulkernine, F. Data Lakehouse: A Survey and Experimental Study. Inf. Syst. 2025, 127, 102460. [Google Scholar] [CrossRef] [Scilit]
- Okolnychyi, A.; Sun, C.; Tanimura, K.; Spitzer, R.; Blue, R.; Ho, S.; Gu, Y.; Lakkundi, V.; Tsai, D. Petabyte-Scale Row-Level Operations in Data Lakehouses. Proc. VLDB Endow. 2024, 17, 4159–4172. [Google Scholar] [CrossRef] [Scilit]
- Park, S.; Yang, C.-S.; Kim, J. Design of Vessel Data Lakehouse with Big Data and AI Analysis Technology for Vessel Monitoring System. Electronics 2023, 12, 1943. [Google Scholar] [CrossRef] [Scilit]
- Gebler, R.; Reinecke, I.; Sedlmayr, M.; Goldammer, M. Enhancing Clinical Data Infrastructure for AI Research: Comparative Evaluation of Data Management Architectures. J. Med. Internet Res. 2025, 27, e74976. [Google Scholar] [CrossRef] [Scilit] [PubMed]
- Merli, M.; Guo, S.; Li, P.; Chen, H.; Lu, N. Ursa: A Lakehouse-Native Data Streaming Engine for Kafka. Proc. VLDB Endow. 2025, 18, 5184–5196. [Google Scholar] [CrossRef] [Scilit]
- Liu, F.T.; Ting, K.M.; Zhou, Z.-H. Isolation Forest. In Proceedings of the 2008 Eighth IEEE International Conference on Data Mining (ICDM), Pisa, Italy, 15–19 December 2008; pp. 413–422. [Google Scholar] [CrossRef] [Scilit]
- Ghaemi, E.; Tabesh, M.; Krampe, J.; Nazif, S. Choosing the Best Data Mining Algorithm in Two Different Aquatic Systems Data Mining in Aquatic Systems. Int. J. Environ. Sci. Technol. 2022, 19, 8783–8796. [Google Scholar] [CrossRef] [Scilit]
- Saremi, M.; Bagheri, M.; Agha Seyyed Mirzabozorg, S.A.; Hassan, N.E.; Hoseinzade, Z.; Maghsoudi, A.; Rezania, S.; Ranjbar, H.; Zoheir, B.; Beiranvand Pour, A. Evaluation of Deep Isolation Forest (DIF) Algorithm for Mineral Prospectivity Mapping of Polymetallic Deposits. Minerals 2024, 14, 1015. [Google Scholar] [CrossRef] [Scilit]
- Mehmood, Z.; Wang, Z. Hybrid iForest-DBSCAN for Anomaly Detection and Wind Power Curve Modelling. Expert Syst. Appl. 2025, 289, 128381. [Google Scholar] [CrossRef] [Scilit]
- Kim, J.; Naganathan, H.; Moon, S.-Y.; Chong, W.K.O.; Ariaratnam, S.T. Applications of Clustering and Isolation Forest Techniques in Real-Time Building Energy-Consumption Data: Application to LEED Certified Buildings. J. Energy Eng. 2017, 143, 04017052. [Google Scholar] [CrossRef] [Scilit]
- Lu, G.; Zeng, L.; Liu, G.; Chen, X.; Ostadhassan, M.; Du, X.; Chen, Y. Subsurface Natural Fracture Identification Using an Integrated Ensemble Learning Method. IEEE Trans. Geosci. Remote Sens. 2025, 63, 1–16. [Google Scholar] [CrossRef] [Scilit]
- Deng, Z.; Wu, Q.; Huang, M. Two-Stage Dam Displacement Analysis Framework Based on Improved Isolation Forest and Metaheuristic-Optimized Random Forest. Buildings 2025, 15, 4467. [Google Scholar] [CrossRef] [Scilit]
- Baudrit, C.; Taillandier, F.; Curt, C.; Hoang, Q.A.; Sbartaï, Z.-M.; Breysse, D. Graph Based Knowledge Models for Capitalizing, Predicting and Learning: A Proof of Concept Applied to the Dam Systems. Adv. Eng. Inform. 2022, 52, 101551. [Google Scholar] [CrossRef] [Scilit]
- Zhu, Y.; Ouyang, Y.; Pan, R.; Sun, Z.; Zhou, Y.; Ma, R.; Cheng, B.; Wang, W. An Integrated Framework for Automated Identification of Workers’ Safety Violation Based on Knowledge Graph. Buildings 2026, 16, 1037. [Google Scholar] [CrossRef] [Scilit]
- Zhang, Y.; Liu, J.; Hou, K. Building a Knowledge Base of Bridge Maintenance Using Knowledge Graph. Adv. Civ. Eng. 2023, 2023, 6047489. [Google Scholar] [CrossRef] [Scilit]
- Lee, S.; Kim, R.E. Hypothesis Generation from Pragmatic Causal Relationships for Latent Knowledge Reasoning in the Civil Engineering Domain. Comput.-Aided Civ. Infrastruct. Eng. 2025, 40, 5447–5473. [Google Scholar] [CrossRef] [Scilit]
- Parisi, F.; Ruggieri, S.; Lovreglio, R.; Fanti, M.P.; Uva, G. On the Use of Mechanics-Informed Models to Structural Engineering Systems: Application of Graph Neural Networks for Structural Analysis. Structures 2024, 59, 105712. [Google Scholar] [CrossRef] [Scilit]
- Ramonell, C.; Chacón, R.; Posada, H. Knowledge Graph-Based Data Integration System for Digital Twins of Built Assets. Autom. Constr. 2023, 156, 105109. [Google Scholar] [CrossRef] [Scilit]
- Thomas, A. Digitally Transforming the Organization through Knowledge Management: A Socio-Technical System (STS) Perspective. Eur. J. Innov. Manag. 2024, 27, 437–460. [Google Scholar] [CrossRef] [Scilit]
- Firk, S.; Gehrke, Y.; Hanelt, A.; Wolff, M. Top Management Team Characteristics and Digital Innovation: Exploring Digital Knowledge and TMT Interfaces. Long Range Plan. 2022, 55, 102166. [Google Scholar] [CrossRef] [Scilit]
- Van Buuren, S.; Groothuis-Oudshoorn, K. mice: Multivariate Imputation by Chained Equations in R. J. Stat. Softw. 2011, 45, 1–67. [Google Scholar] [CrossRef] [Scilit]
- ISO 19650-1:2018; Organization and Digitization of Information About Buildings and Civil Engineering Works, Including Building Information Modelling (BIM)-Information Management Using Building Information Modelling-Part 1: Concepts and Principles. International Organization for Standardization: Geneva, Switzerland, 2018.
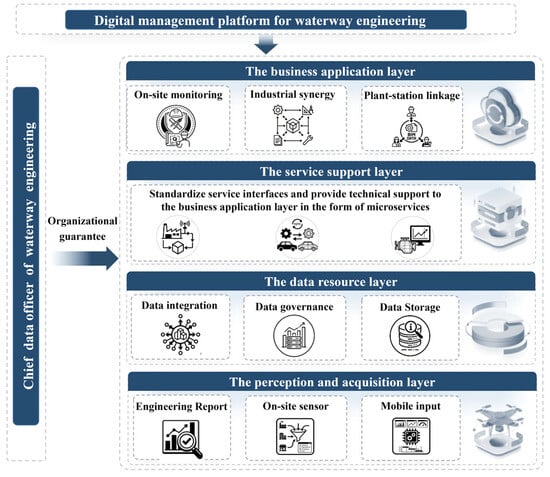
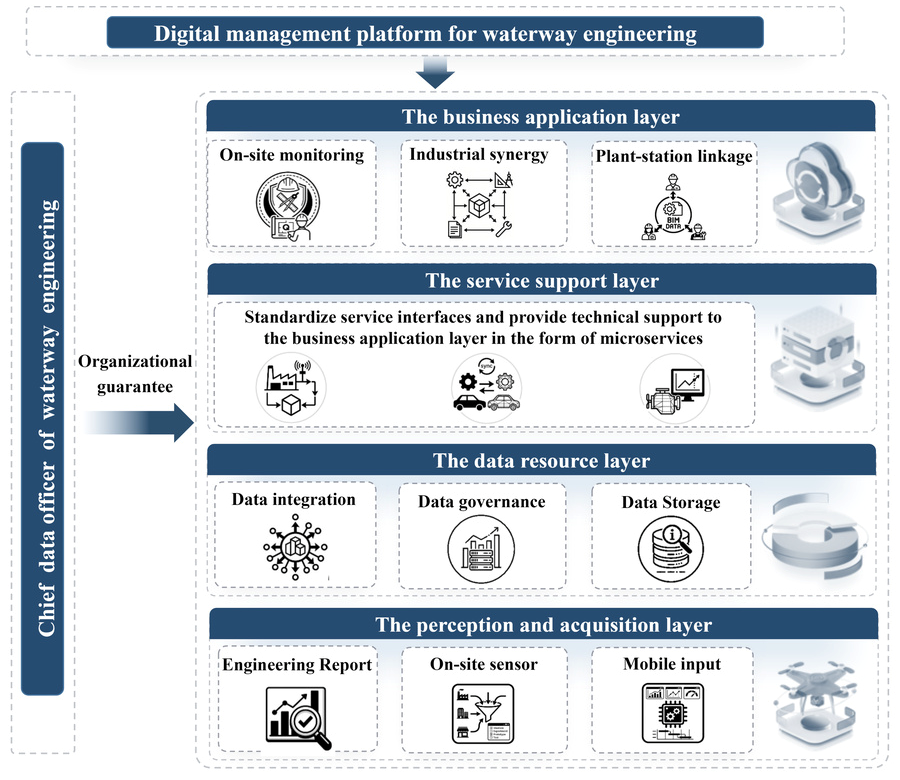
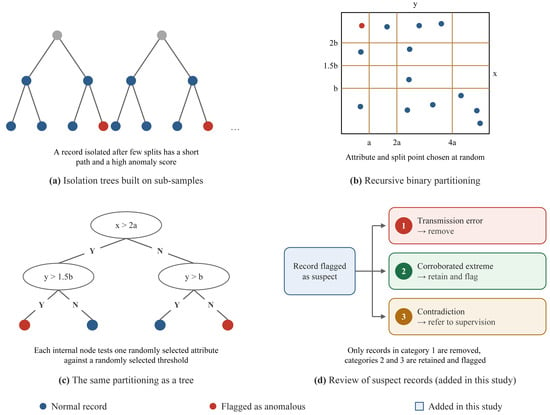
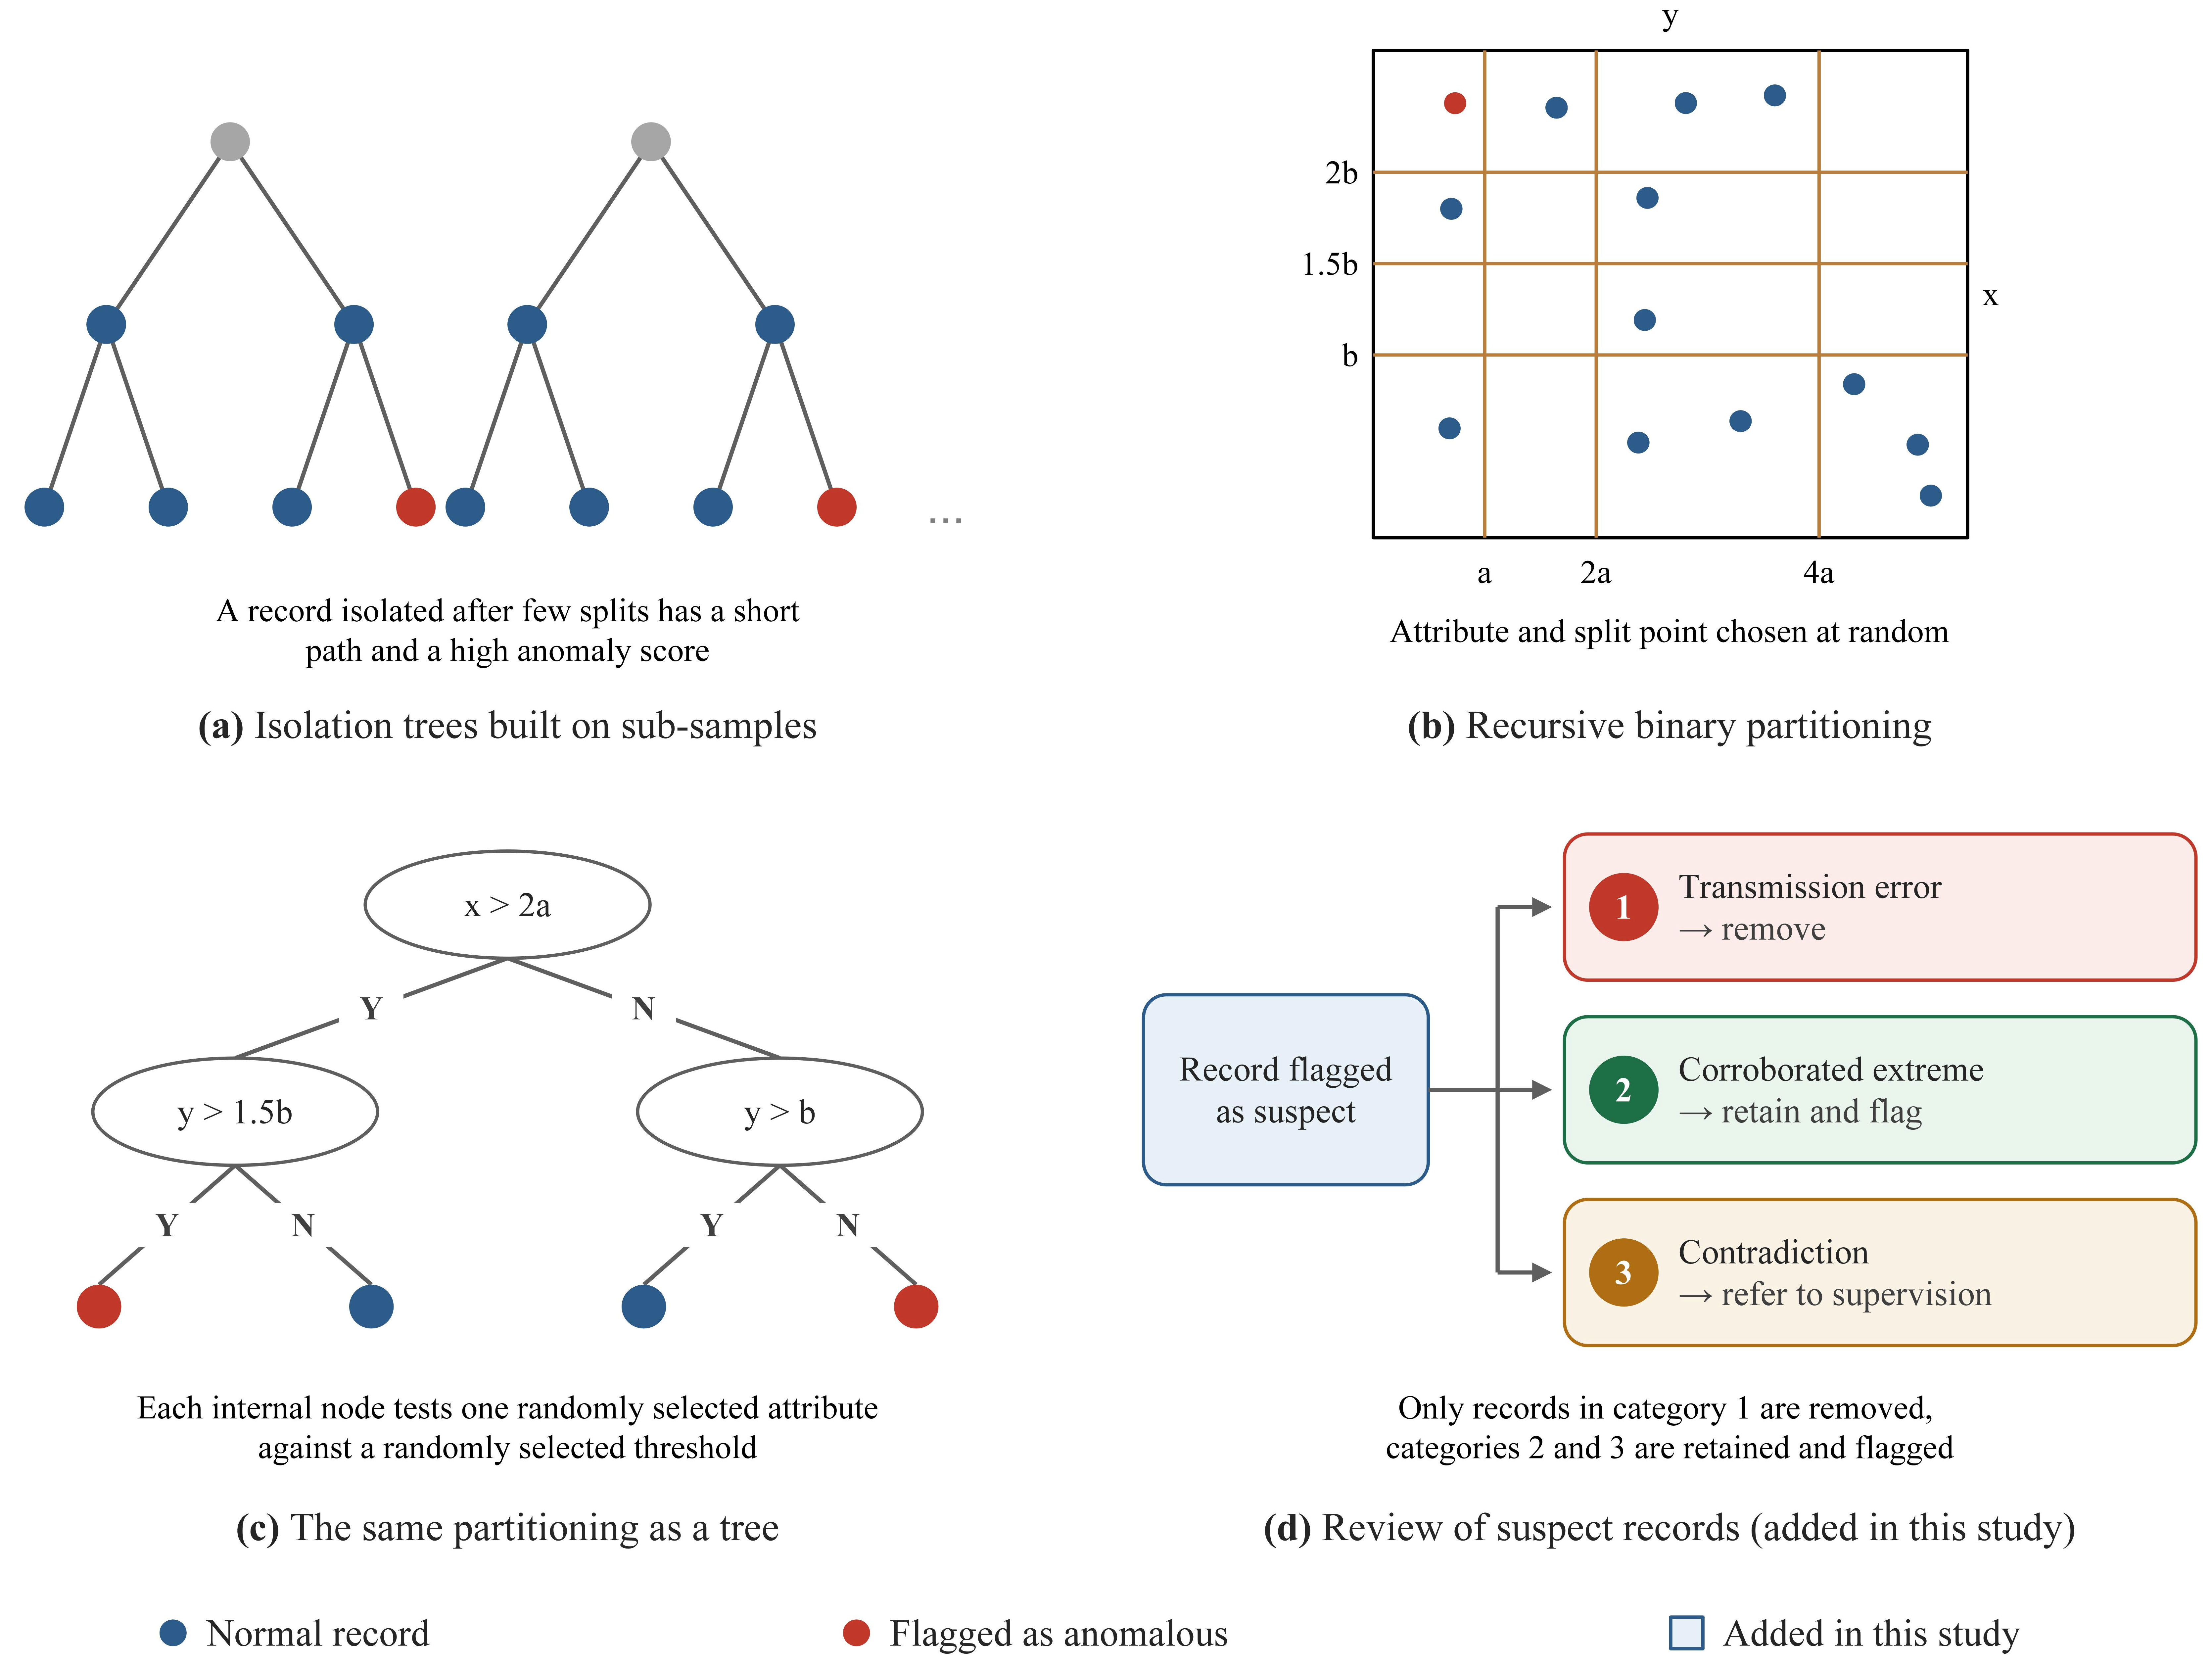
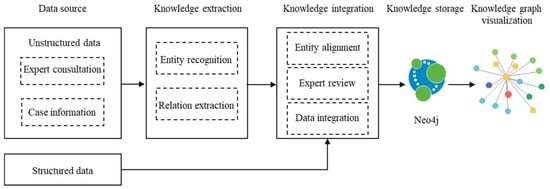
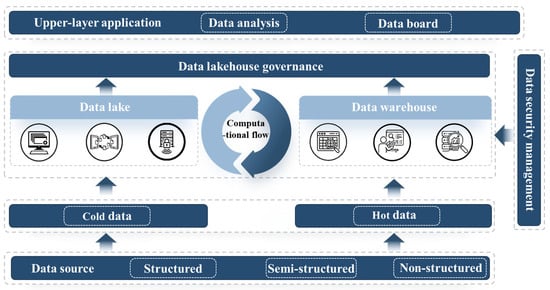
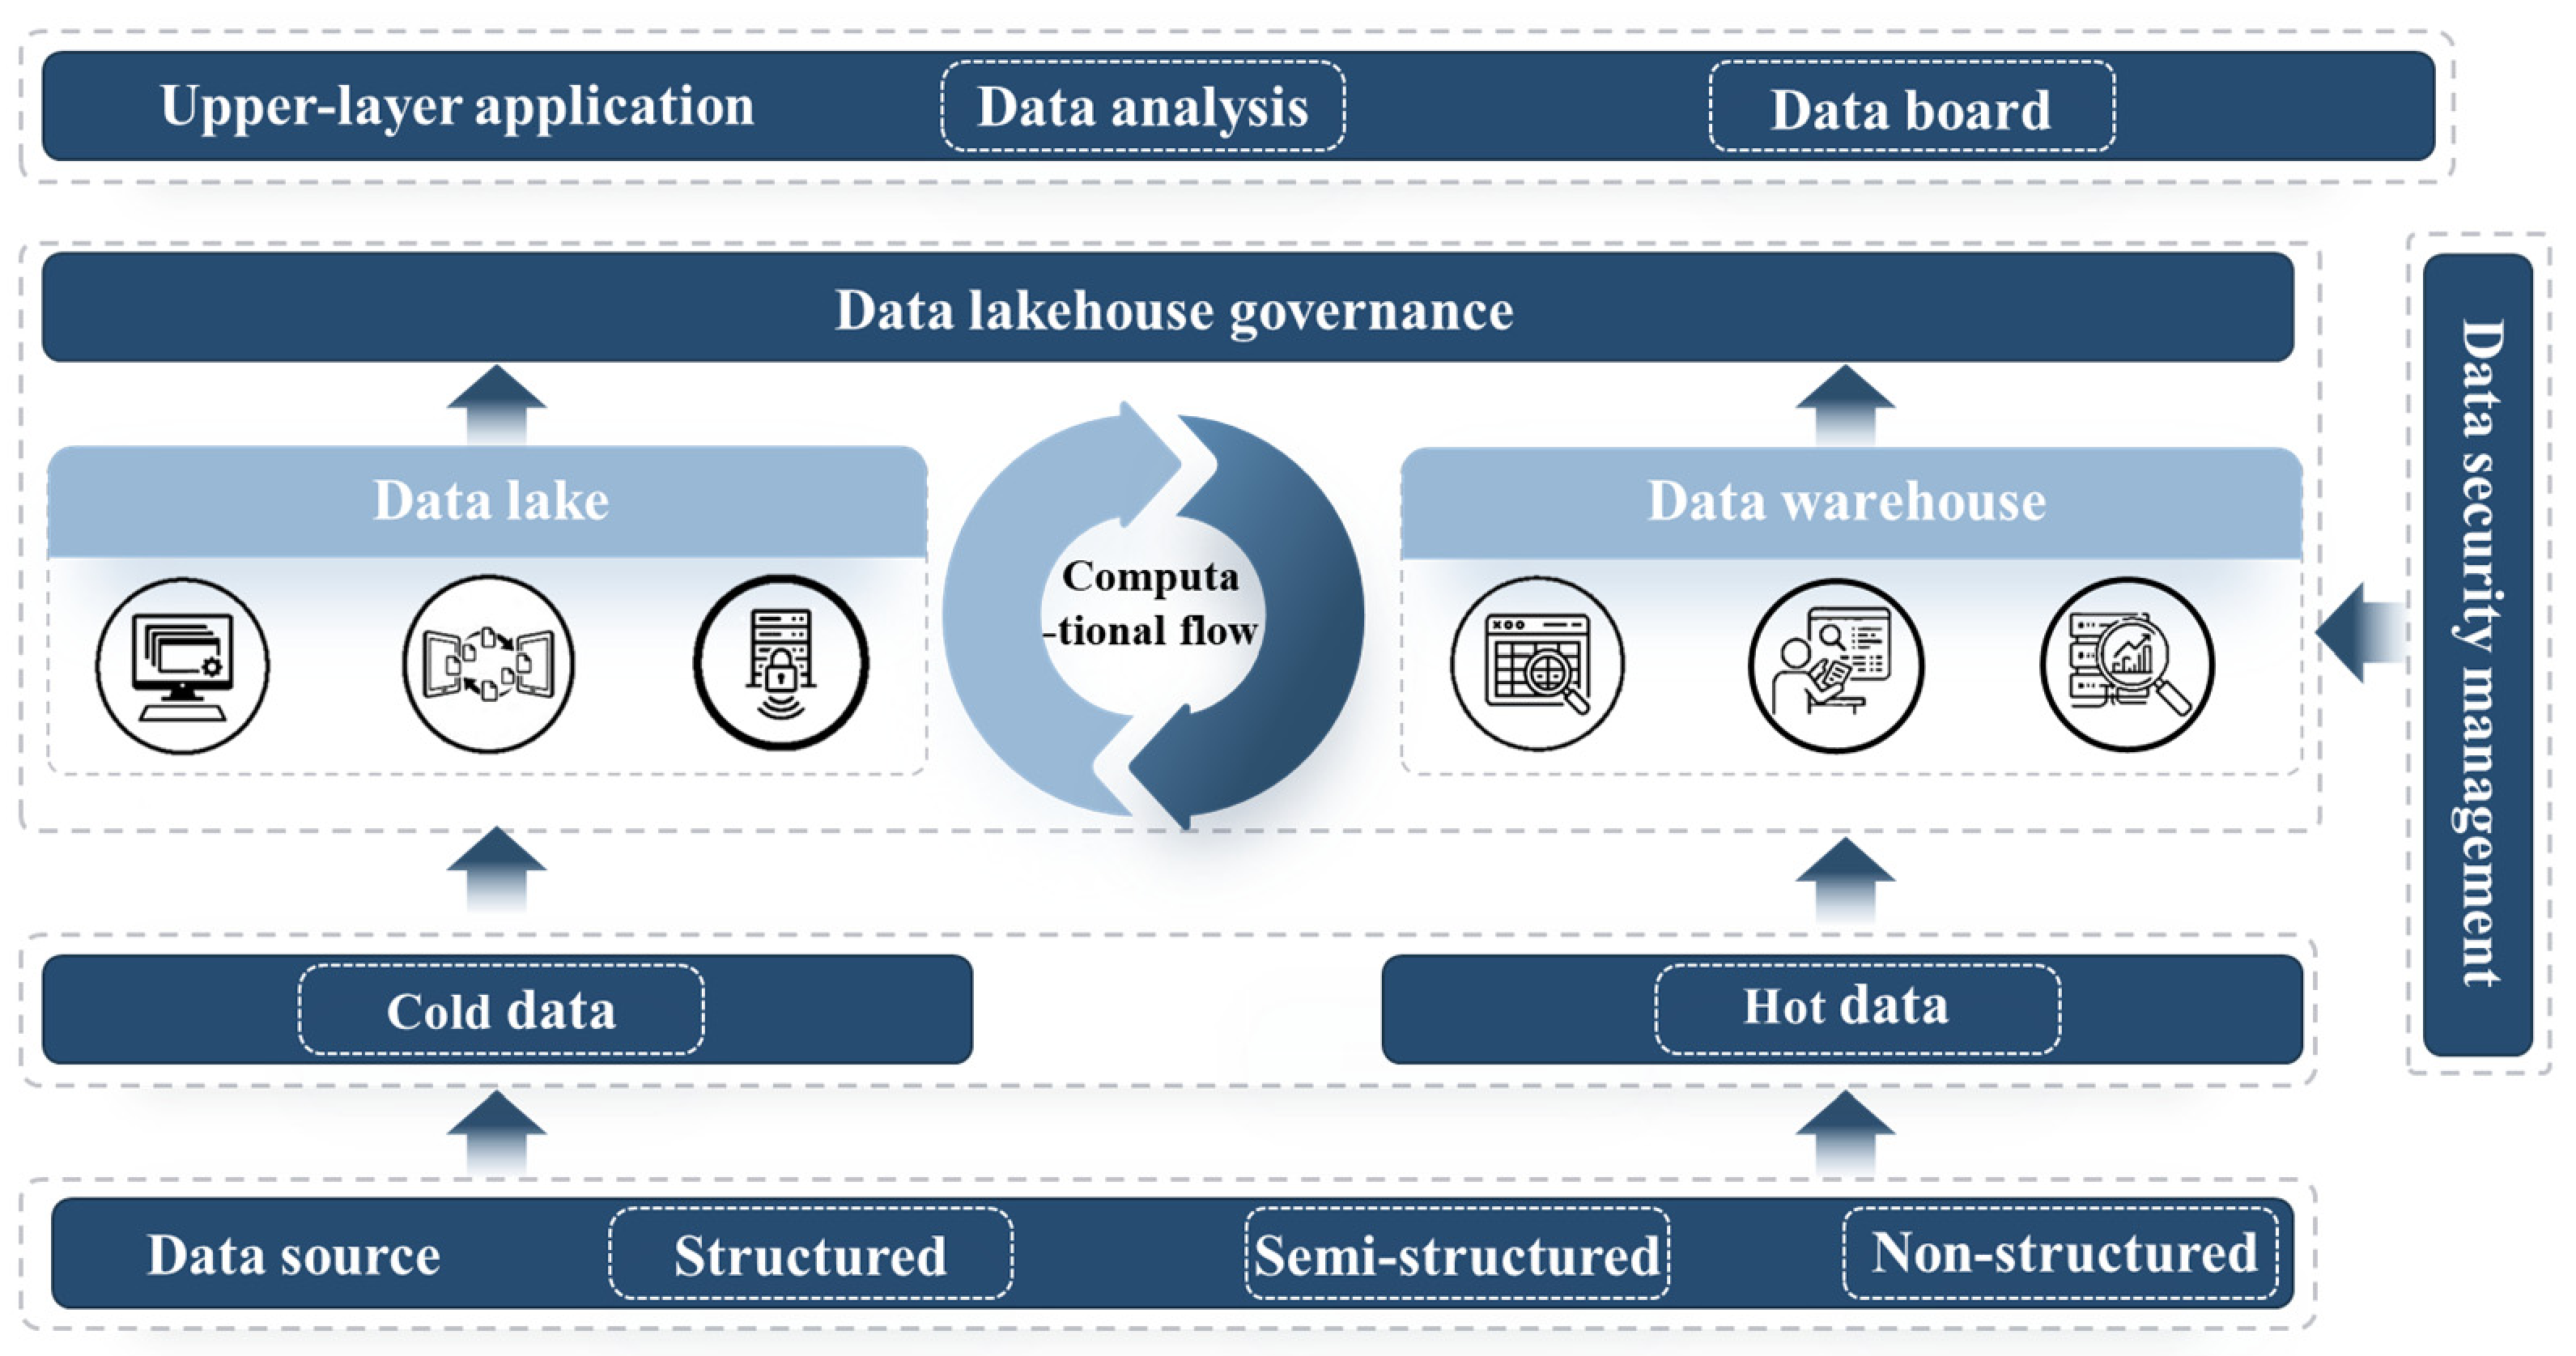
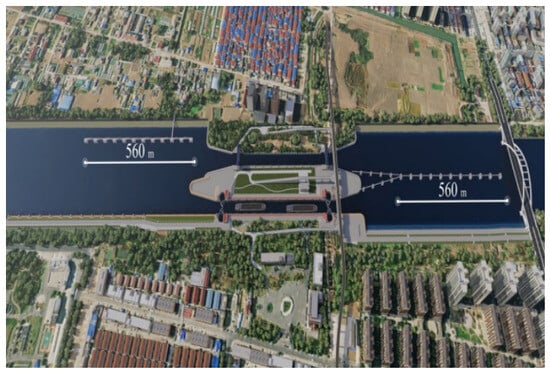
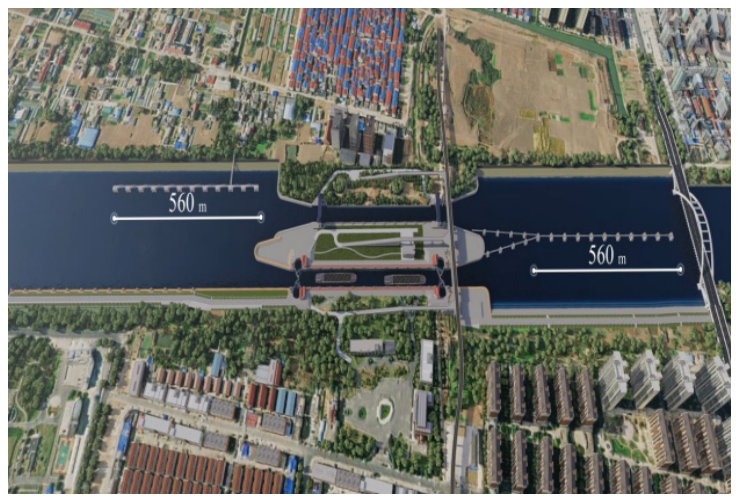
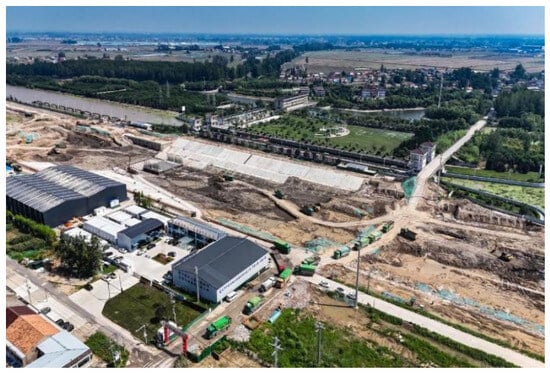
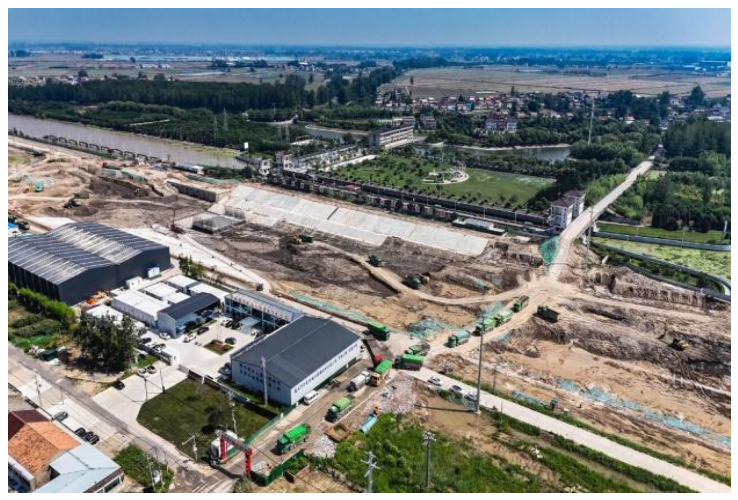
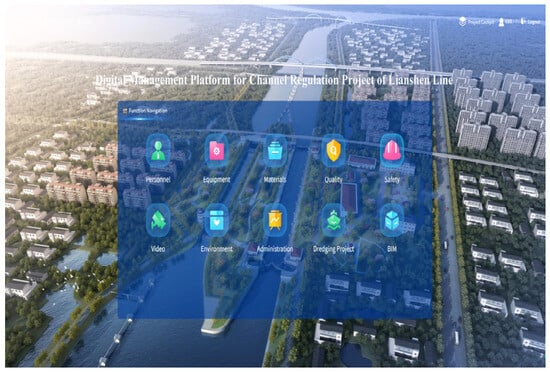
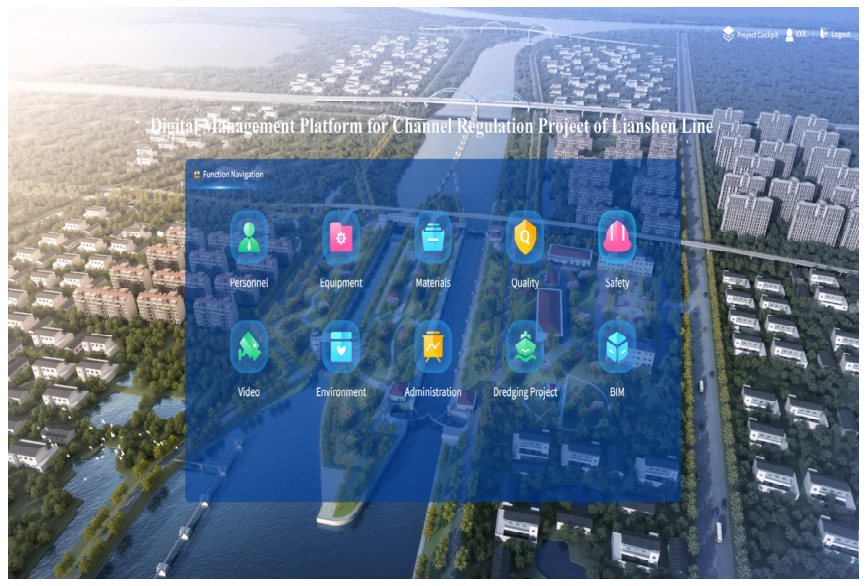
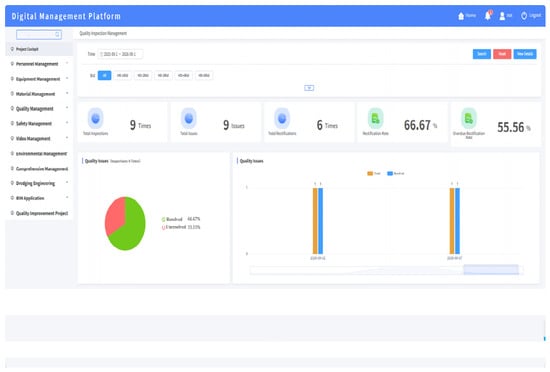
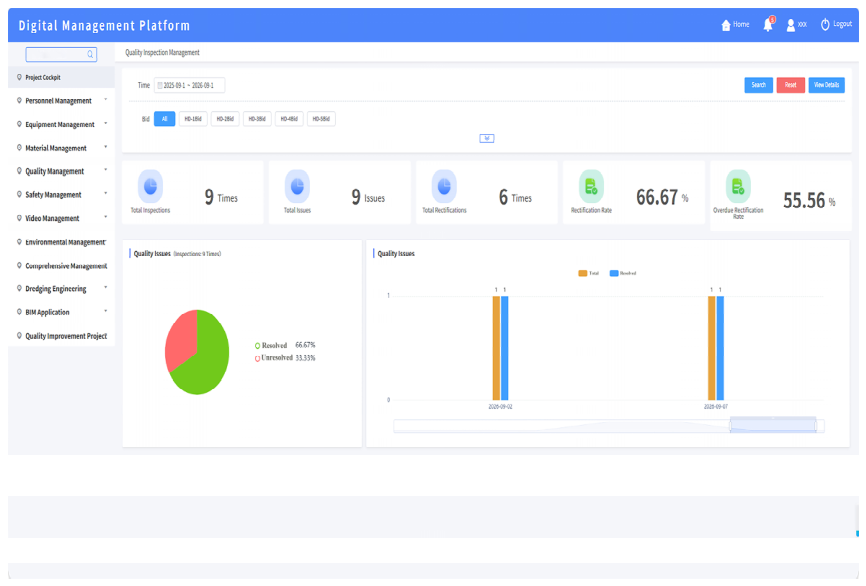
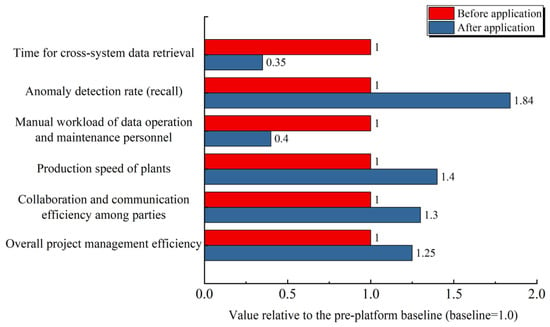
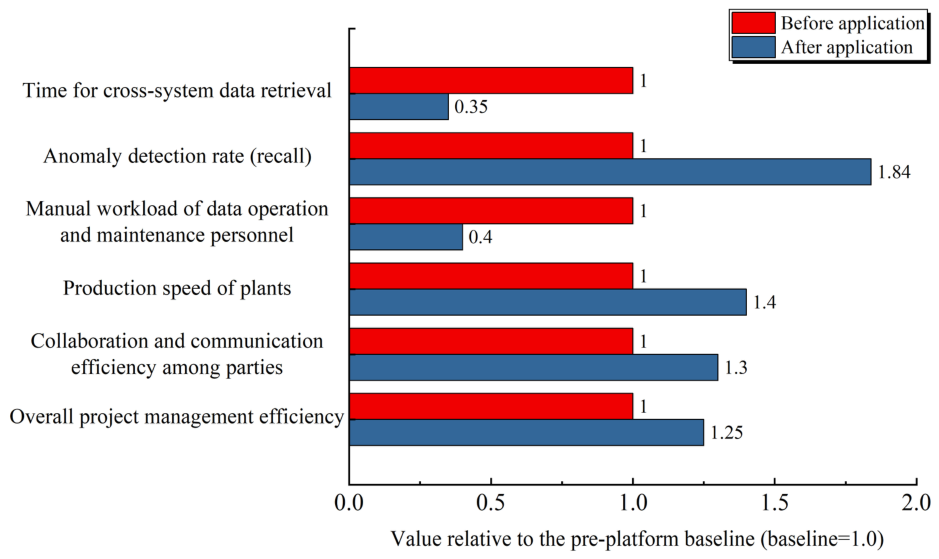
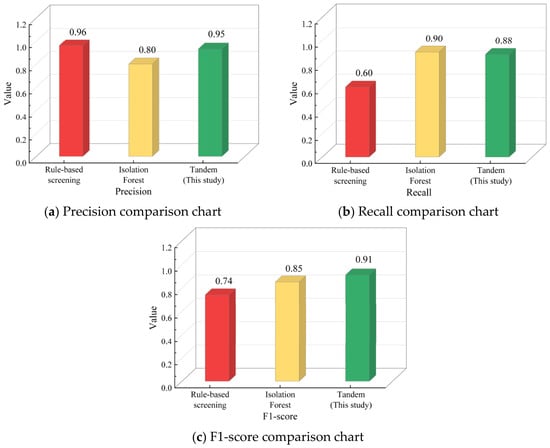
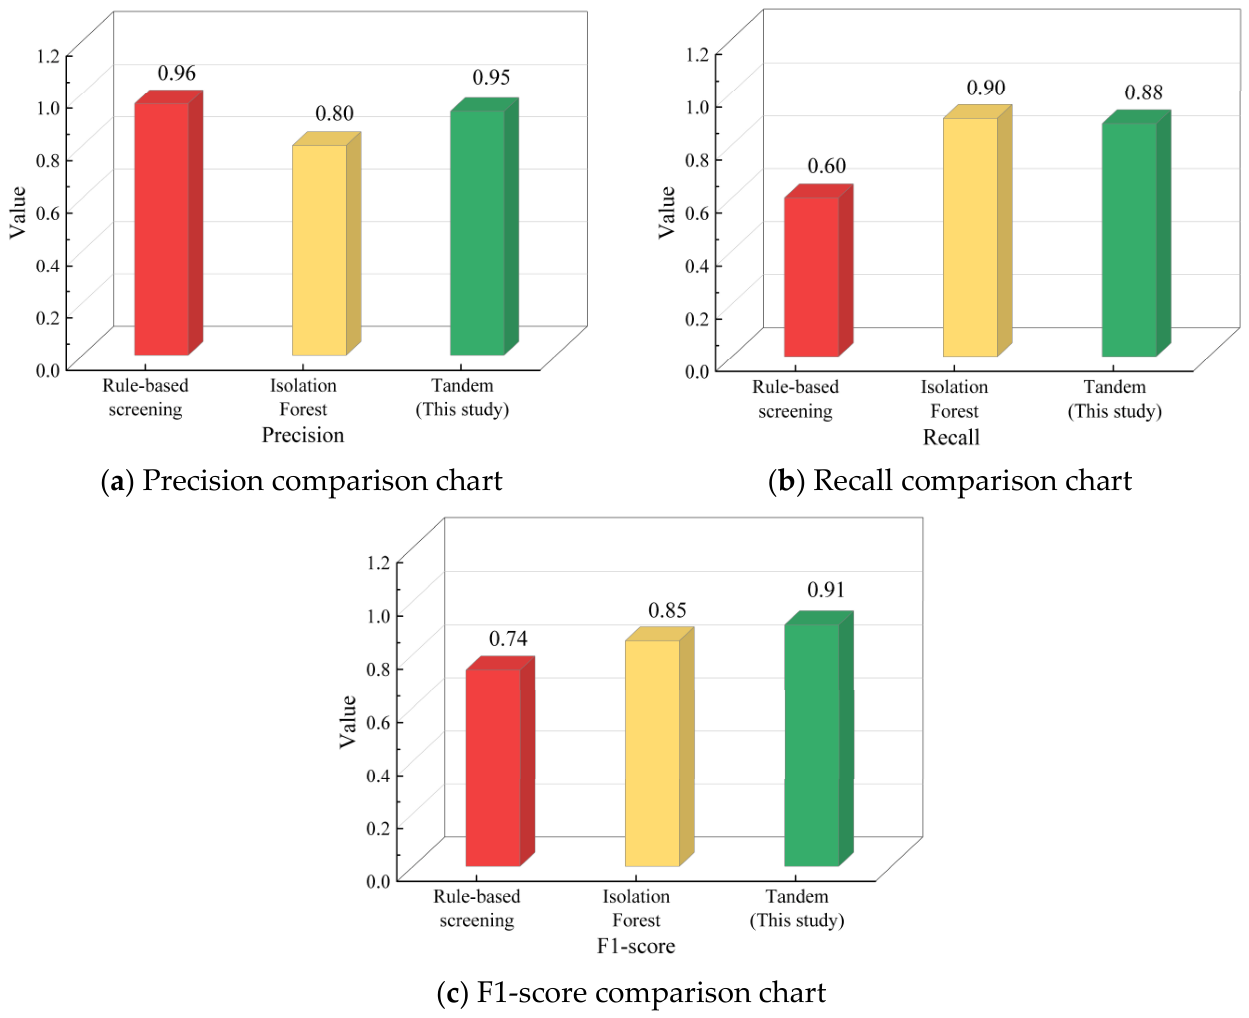

Disclaimer/Publisher’s Note: The statements, opinions and data contained in all publications are solely those of the individual author(s) and contributor(s) and not of MDPI and/or the editor(s). MDPI and/or the editor(s) disclaim responsibility for any injury to people or property resulting from any ideas, methods, instructions or products referred to in the content. |
© 2026 by the authors. Licensee MDPI, Basel, Switzerland. This article is an open access article distributed under the terms and conditions of the Creative Commons Attribution (CC BY) license.