


Abstract
Urban renewal decisions require evidence on both absolute emergency medical services (EMS) access and relative differences between residential communities. We compared 13,266 residential communities across 190 Beijing subdistricts using a modified two-leg two-step floating catchment area (2SFCA) measure of potential opportunity and two-leg EMS vehicle travel time. Floor area ratio (FAR) was used as a proxy for development intensity: communities with FAR ≥ 2.0 were classified as higher-intensity and those with FAR < 2.0 as lower-intensity. A percentile-based Fairness index compared within-subdistrict distributions for both accessibility dimensions, and the classification was repeated at FAR = 3.0 as a threshold-sensitivity check. A paired screening identified subdistricts where lower-intensity communities had relative advantages on both measures; these locations may warrant follow-up review of higher-intensity communities, while low-access communities in either group require attention regardless of index direction. Under FAR = 2.0, the mean Fairness indices were −0.023 for potential opportunity and 0.004 for vehicle travel time; they were positively correlated (Pearson r = 0.805). Seventy-one subdistricts were high-rise-friendly and 65 low-rise-friendly, while 17 and 16 entered Tier I and Tier II double-disadvantage screening. With FAR = 3.0, 147 subdistricts were estimable, friendly-type agreement fell to 51.02%, and Tier I/Tier II Jaccard indices were 0.130 and 0.087. The results indicate that relative equity patterns are jointly associated with opportunity and travel-time accessibility but are sensitive to the operational FAR threshold. The proposed workflow translates the findings into a transparent, reproducible screening sequence for urban-renewal review. The framework can support transparent, subdistrict-level prioritization for field verification in urban-renewal review.
1. Introduction
1.1. Background
Emergency medical services (EMS) form a core part of urban life-safety infrastructure. Fair access advances the health objective in Sustainable Development Goal (SDG) 3 and the inequality-reduction objective in SDG 10. Under Target 3.8, access to prompt emergency care is part of universal health coverage; narrowing geographic gaps in EMS provision also serves the inequality-reduction aim of SDG 10. EMS performance is not captured by mean response speed alone: it also depends on whether different residential environments receive reasonably balanced service opportunities and travel-time conditions. Potential opportunity accessibility represents opportunities available under supply–demand competition and travel impedance, whereas vehicle travel time represents the road time required from an ambulance station to a residential community and then to an in-hospital emergency facility. These indicators answer different questions and should not be substituted for one another. Citywide averages or a single indicator may therefore hide systematic differences between high- and lower-intensity communities located in the same subdistrict.
Floor area ratio (FAR) measures development intensity, not building height itself. Higher FAR can co-occur with crowding, taller buildings, and less outdoor space, potentially complicating emergency access; these mechanisms were not measured here. We compare higher- and lower-intensity groups using explicit FAR thresholds and interpret results as relative screening evidence.
1.2. International and Domestic Research
EMS accessibility research has progressed from facility coverage and static distance to network travel time, two-leg prehospital service chains, and equity-sensitive spatial analysis.
Early studies examined ambulance-station layout, population distribution, and arrival time using distance, service radii, and regional comparisons [1,2,3]. With road-network data, global positioning system (GPS) trajectories, and time-dependent routing, later work incorporated scene-arrival time, patient-transport time, and traffic variation into a single service chain [4,5,6,7]. Recent studies increasingly ask who receives which level of service, incorporating older adults, vulnerable groups, observed emergency calls, and ambulance-desert patterns [8,9,10,11,12].
EMS research combines network routing, two-step floating catchment area models, dynamic impedance functions, and facility-location optimization. Thresholds, decay functions, supply definitions, and time windows affect estimates [13,14,15,16]. This study adds a within-subdistrict comparison of FAR-defined intensity groups using potential opportunity and vehicle time.
1.3. Research Gaps and Questions
This study asks how potential opportunity and vehicle-time accessibility compare between FAR-defined intensity groups within the same subdistrict, and whether the pattern is consistent when the FAR cut-off changes from 2.0 to 3.0. These questions support a transparent screening exercise; they do not rank subdistricts for investment.
1.4. Objective, Significance and Analytical Structure
The objective is to compare EMS accessibility between higher-intensity (FAR ≥ threshold) and lower-intensity (FAR < threshold) residential communities within each subdistrict. We combine a modified two-leg, two-step floating catchment area (2SFCA) opportunity measure, two-leg EMS vehicle travel time, directionally consistent normalization, and a percentile-based Fairness index. FAR is an operational proxy for development intensity, not a direct measure of building height or access conditions.
1.5. Innovation and Article Structure
The contribution is a paired within-subdistrict comparison of opportunity and vehicle-time access, a distribution-sensitive relative Fairness index, and a transparent screening exercise that reports group counts and flags non-estimable comparisons.
2. Literature Review
2.1. Research Themes and Temporal Development
Research themes have shifted from measuring whether a facility can be reached to evaluating who receives which combination of service opportunity and time performance. Earlier work emphasized facility location, distance, and coverage [1,2,3]; subsequent studies incorporated road networks, dynamic traffic, and two-leg prehospital chains [4,5,6,7]. Recent work has added social vulnerability, older adults, ambulance deserts, and built-environment constraints [8,9,10,11,12,17,18,19,20,21,22,23,24,25,26]. This temporal development suggests that an equity assessment should retain both supply–demand competition and the actual vehicle-time component.
2.2. Methods and Evidence Chains
The main methodological families are network routing and isochrones [5,27]; 2SFCA and its age-stratified, improved, and dynamic variants [9,13,14,15,16]; facility-location and capacity-allocation optimization; and spatial statistics or regression [11,28,29]. Together they form an evidence chain from impedance measurement to supply–demand competition, spatial pattern detection, and planning intervention [30,31,32,33]. Yet individual studies commonly use only one part of the chain. The present study links a modified two-leg 2SFCA measure, two-leg travel time, percentile fairness, and spatial statistics at a common subdistrict scale.
2.3. Research Perspectives and Comparison Units
The literature addresses facility and ambulance supply, population demand, and built-environment conditions [1,9,12,23,24]. A recent Wuhan study examined building height and EMS accessibility equity using a dual-trip framework and building-level height data [23]. Our Beijing analysis complements it by using FAR as a community-level intensity proxy and comparing opportunity and vehicle-time distributions within subdistricts; the measures and spatial units differ.
Fairness metrics also reflect different normative perspectives. Gini, Lorenz, and Atkinson measures describe aggregate dispersion or welfare loss; means, coverage rates, and threshold shares are easy to interpret but may not reveal where in a distribution the difference occurs. A percentile-based Fairness index compares target-group upper-tail probabilities with the reference distribution at multiple percentile thresholds [12]. It therefore retains group identity, comparison direction, and distribution position, while not replacing global inequality measures or resolving small-sample instability.
2.4. Research Basis for FAR and Residential Development Intensity
FAR is the ratio of total floor area to site area and describes development intensity rather than building height. The same FAR can represent different combinations of stories, density, and layout. Chinese residential-land evidence reports an increase in mean FAR from 1.99 to 2.42 between 2007 and 2016, but this does not establish a universal boundary [34]. Other work has also examined the use of FAR in residential community planning and design in China [35].
2.5. Synthesis and Study Entry Point
The literature provides mature tools for EMS accessibility, dynamic routing, supply–demand competition, and spatial analysis, but the relationship between opportunity and vehicle-time equity within a subdistrict remains underexamined. Group definitions based on building intensity can alter the apparent equity signal, and a spatial cluster does not by itself establish fair allocation. The present study addresses this gap by comparing complete distributions between FAR-defined high- and lower-intensity communities, testing spatial association of standardized scores, and reporting threshold-dependent screening boundaries. We compare FAR-defined groups using FAR thresholds of 2.0 and 3.0. The screening shortlist retains the original double-disadvantage rule and reports the corresponding group sizes; it is an aid to further review rather than an intervention ranking.
3. Study Area, Data, and Methods
3.1. Study Setting, Data, and Analytical Units
We selected the area within Beijing’s Sixth Ring Road, comprising 190 township-level administrative units. Data sources are listed in Supplementary Materials Table S1, and the study area is shown in Supplementary Materials Figure S1. Across 13,266 residential-community records with usable FAR, FAR ≥ 2.0 classified 6717 communities as higher-intensity and FAR < 2.0 classified 6549 as lower-intensity. FAR = 3.0 was used as a threshold-sensitivity check.
3.2. Accessibility Calculation and Normalization
EMS vehicle travel-time accessibility consists of two road legs: ambulance station to residential community and residential community to an in-hospital emergency facility. Shorter time indicates higher accessibility. Potential opportunity accessibility was calculated with a modified two-leg 2SFCA framework combining facility supply, population demand, and travel impedance. The two accessibility measures are scaled to a range of 0–100 using the min–max normalization method. A detailed description of the calculation method is provided in the Supplementary Materials S2.
3.3. Subdistrict Fairness Index
We adapted the percentile-based Fairness index of Han et al. [12] to compare communities above and below each FAR threshold within each subdistrict. Communities at or above the threshold form the target group; those below form the reference group. For each of nine reference-group percentiles (10th to 90th), the index compares target and reference survival proportions, then averages the nine differences. Midrank handling of ties ensures identical empirical distributions yield zero. Both outcomes are oriented so larger scores indicate better access. The index ranges from −1 to 1 and measures relative distributional advantage, not absolute access. A positive Fairness index indicates relative advantage for higher-intensity communities; a negative value indicates relative advantage for lower-intensity communities.
3.4. Friendly Types and Double-Disadvantage Screening
The sign pair determined four categories: positive-positive for higher-intensity-friendly, negative-negative for lower-intensity-friendly, opposing signs for the two mixed types, and any zero value for a neutral boundary. Only subdistricts classified as lower-intensity-friendly received a double-disadvantage score.
In this expression, denotes fairness in vehicle travel-time accessibility, while denotes fairness in potential-opportunity accessibility for subdistrict i.
Screening thresholds were derived from the score distribution among lower-intensity-friendly subdistricts. Tier I comprised values in the upper quartile; Tier II covered values from the median up to, but not including, the upper quartile; lower values were retained for observation. The entire sequence of grouping, Fairness-index estimation, type assignment, and screening was rerun at FAR = 3.0.
4. Results
4.1. Coverage of the Analytical Sample and Index Distributions
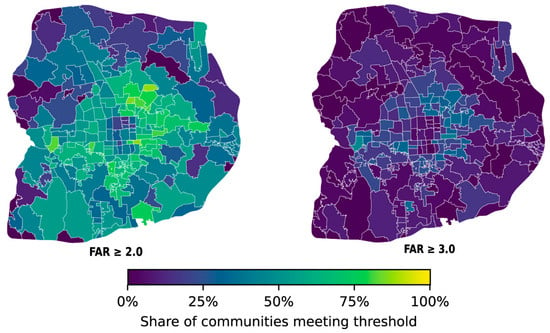
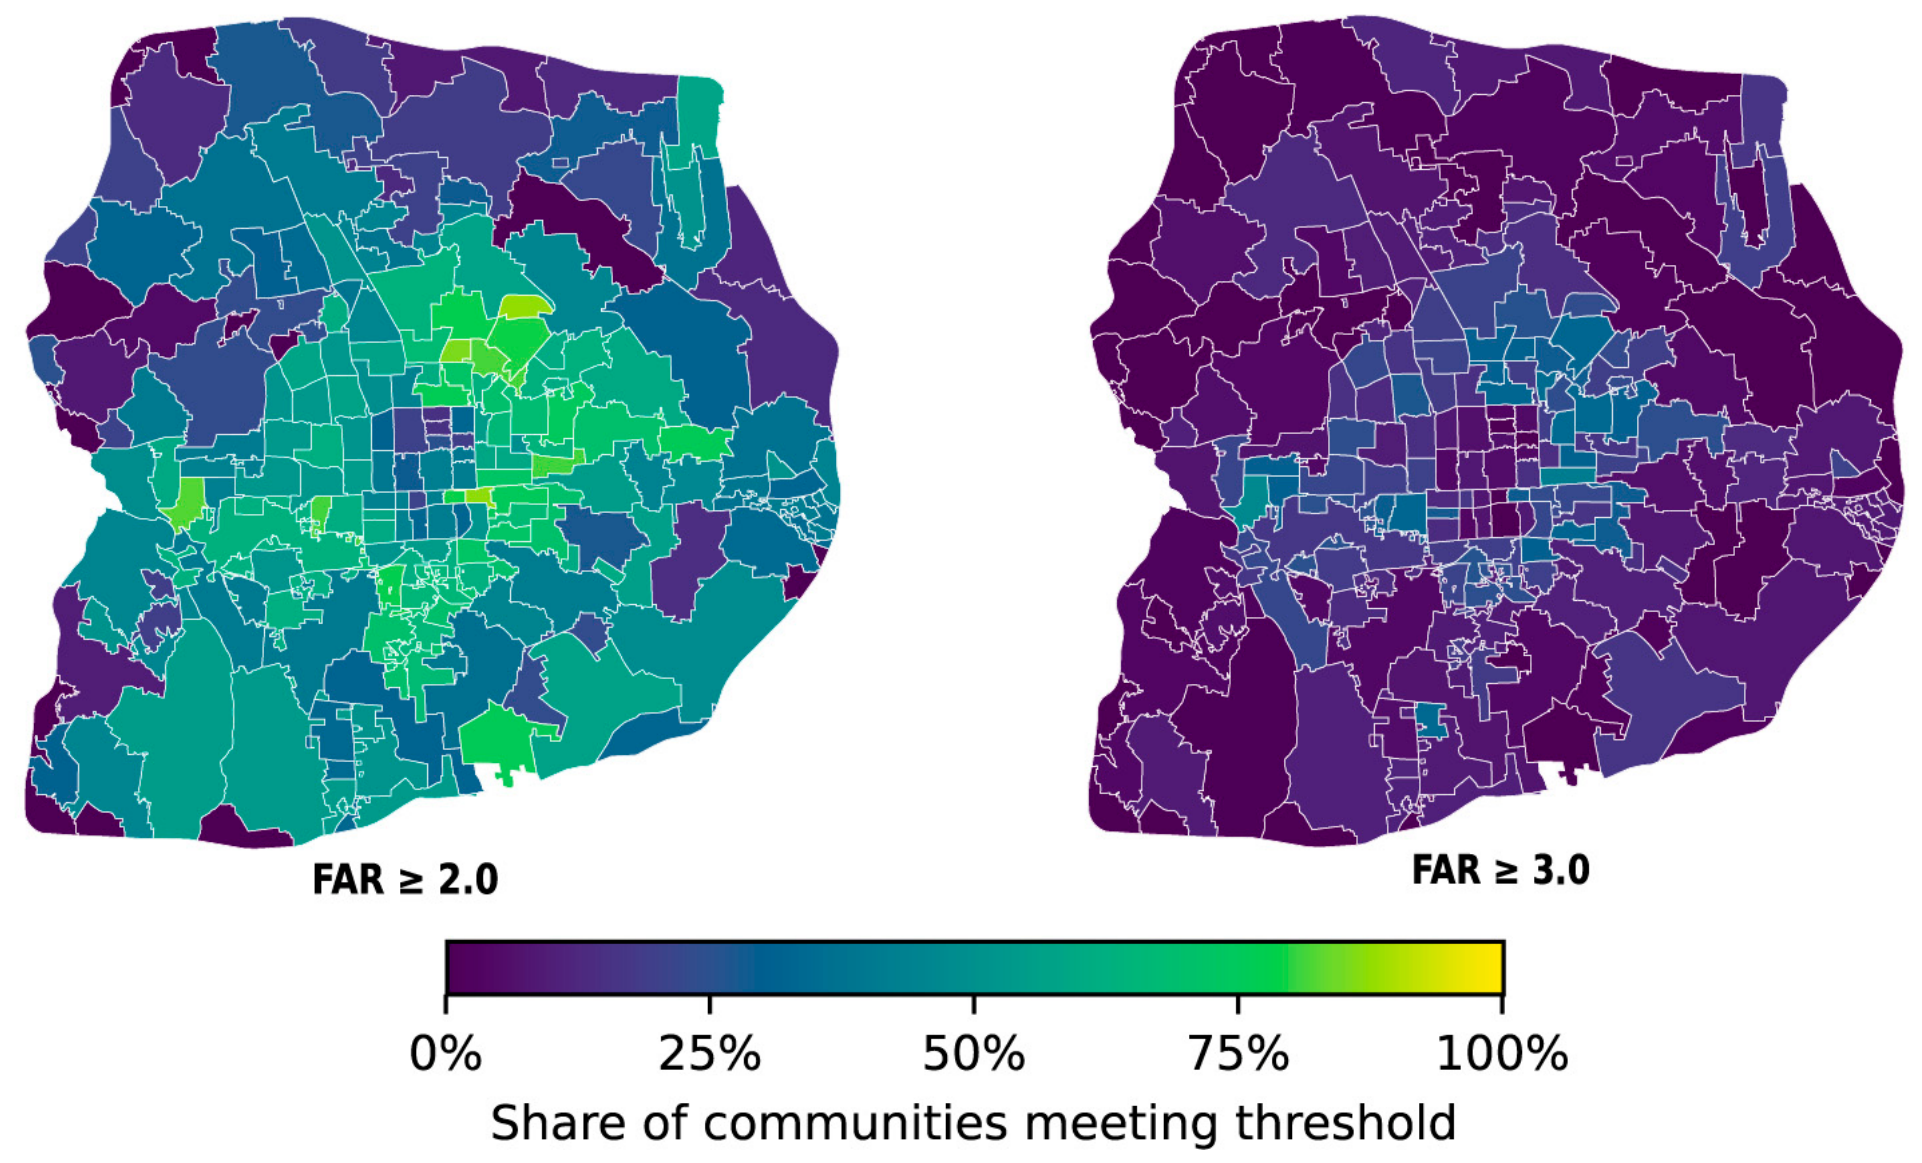
Figure 1 shows marked spatial variation in the share of communities above each FAR threshold; six subdistricts without residential-community records are shown in grey. Fairness indices were estimable for 172 subdistricts under FAR = 2.0 and 147 under FAR = 3.0.
Figure 1.
Share of residential-community records classified as higher-intensity at FAR = 2.0 and FAR = 3.0.
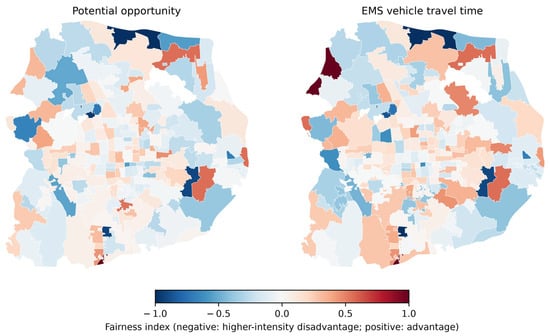
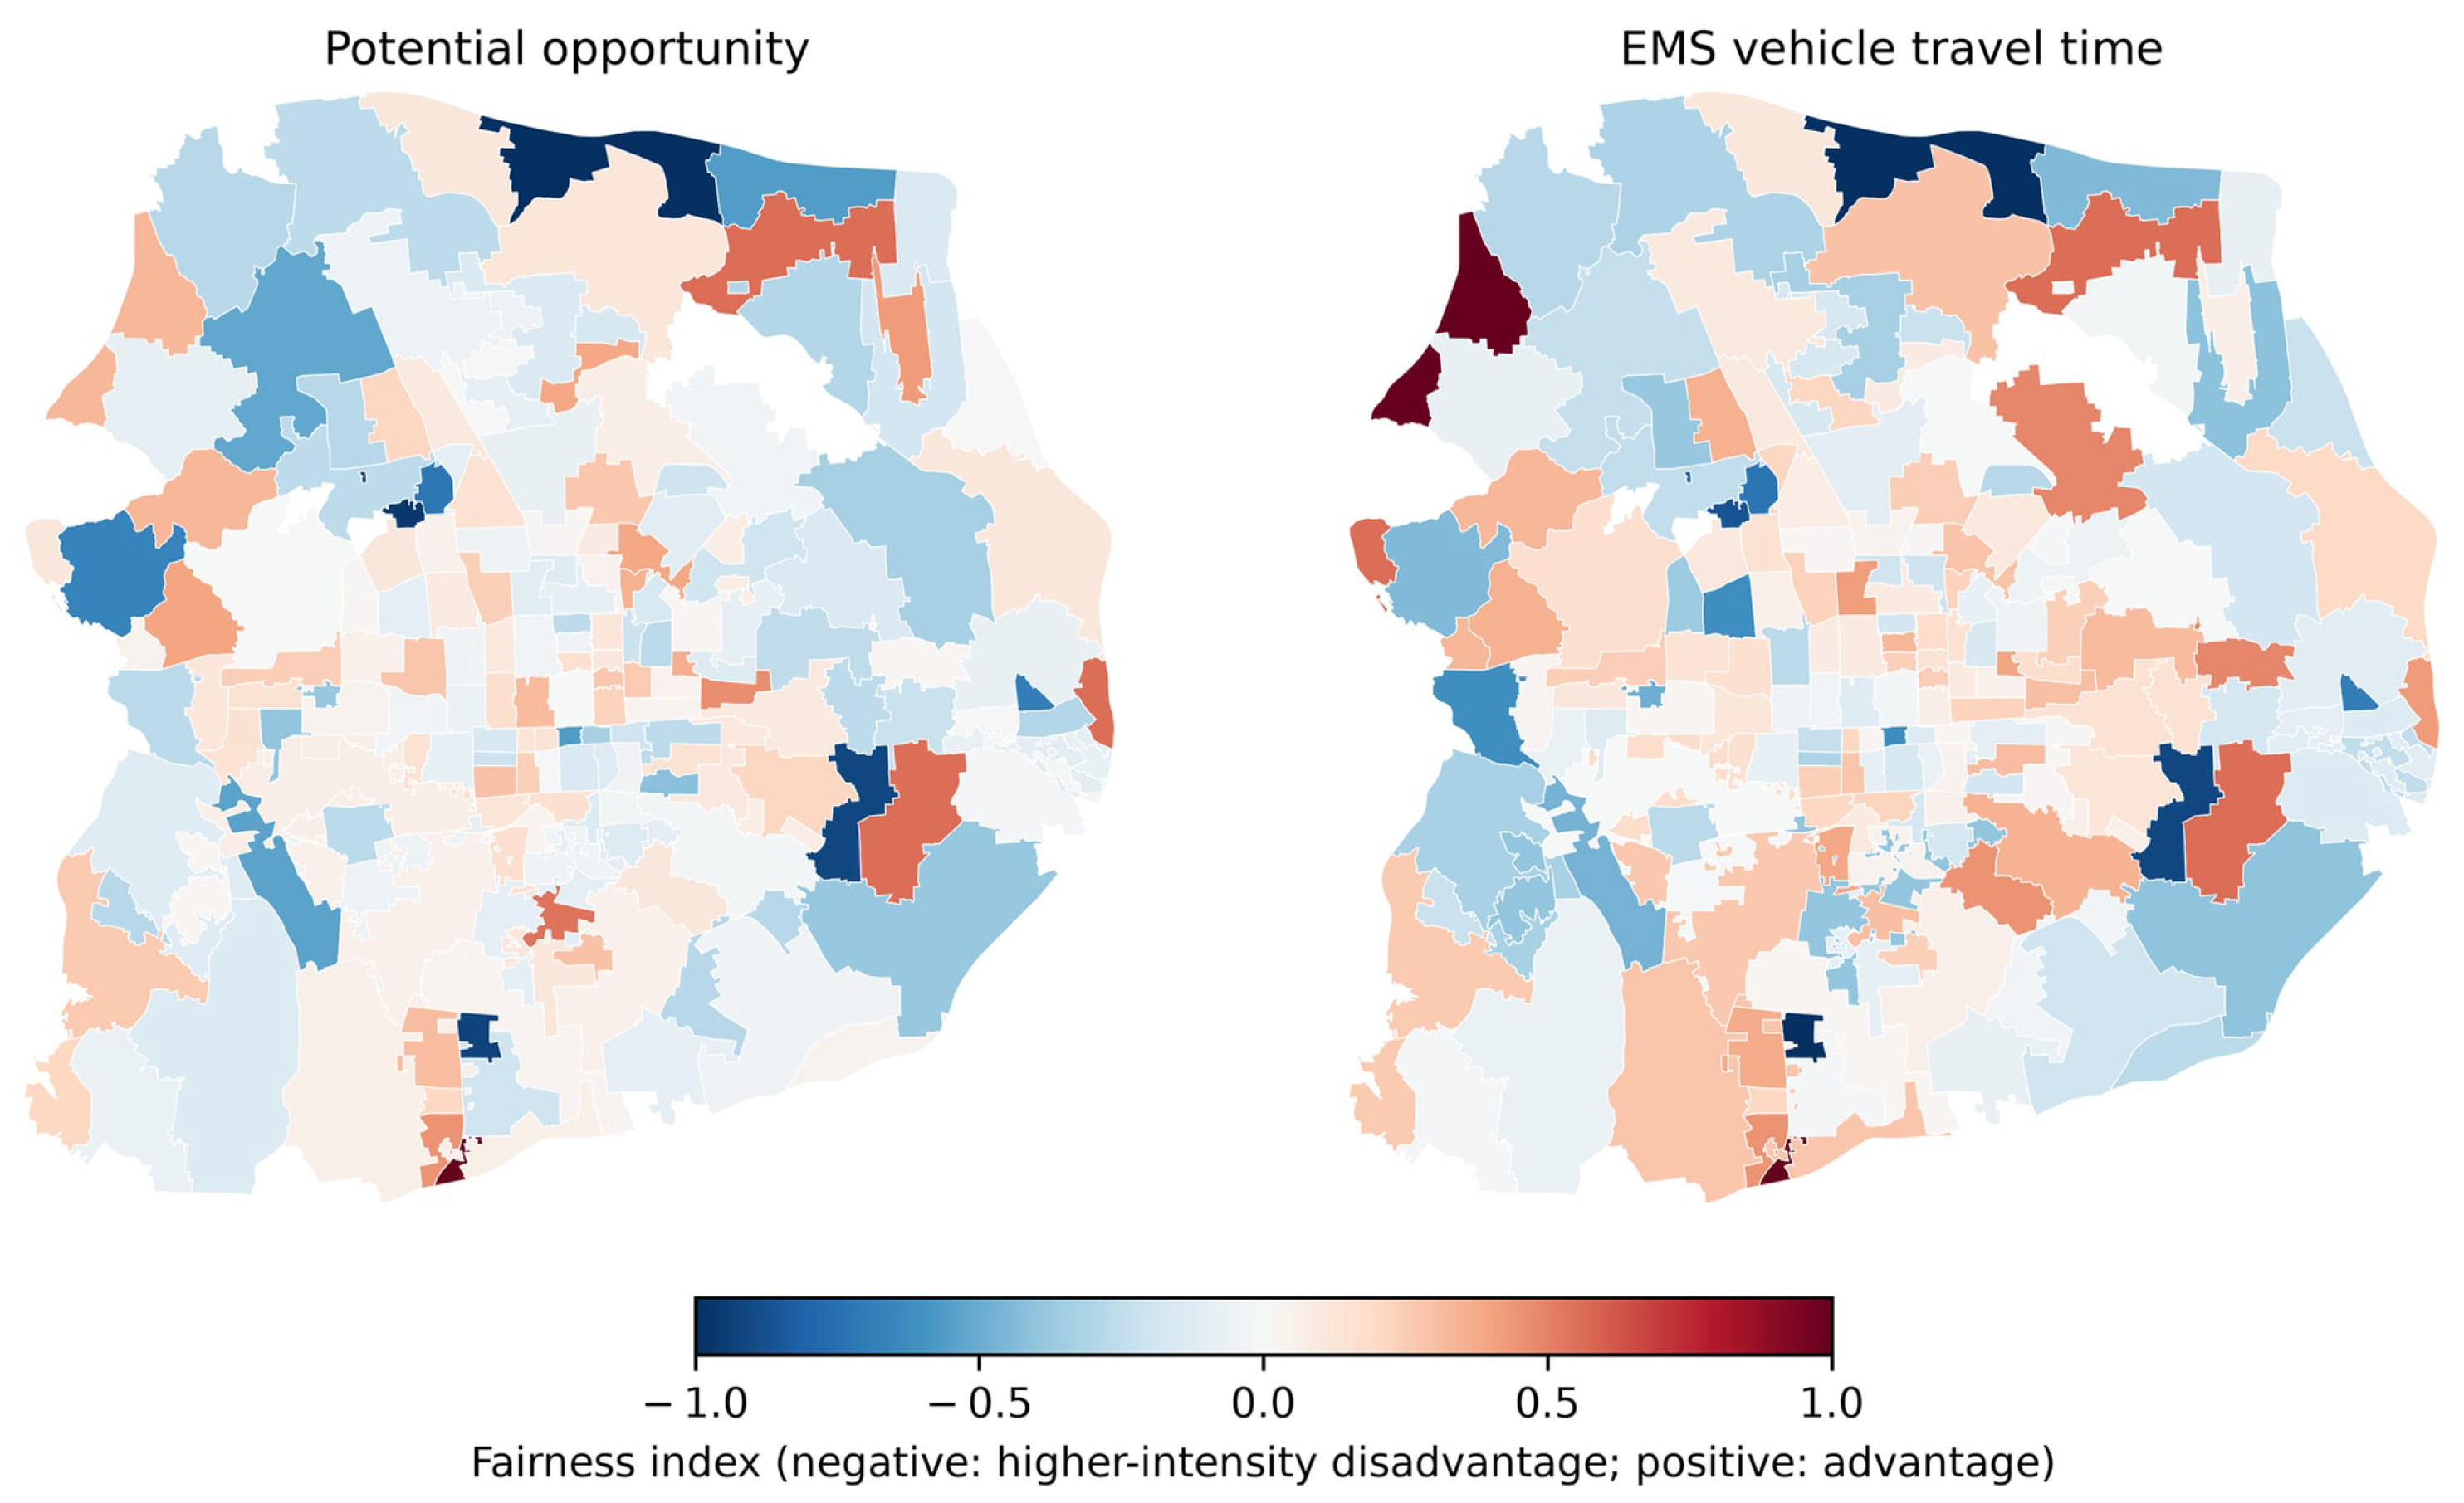
At FAR = 2.0, the index sign summarizes relative advantage between intensity groups, not absolute access. Figure 2 maps the opportunity and EMS vehicle-time Fairness indices; Supplementary Materials Table S2 reports group counts and both indices by subdistrict.
Figure 2.
Spatial distribution of opportunity and EMS vehicle-time Fairness indices at FAR = 2.0.
4.2. Relative Group-Advantage Patterns
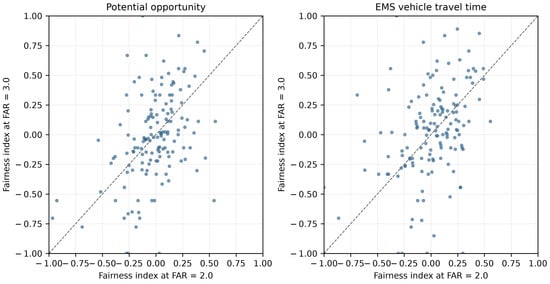
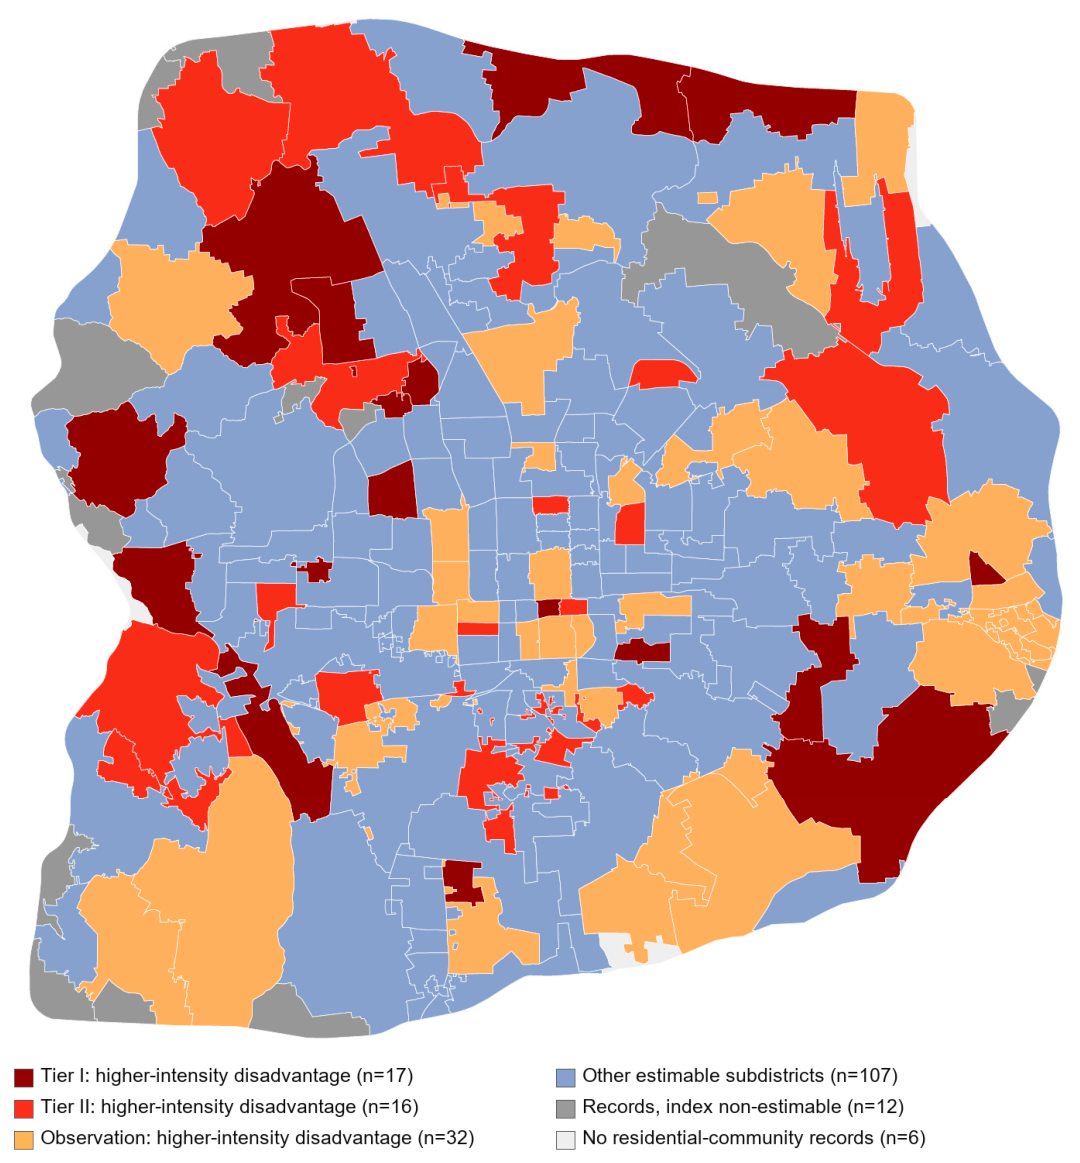
At FAR = 2.0, the two Fairness indices showed a positive correlation (Pearson r = 0.805, p = 2.28 × 10−40). The classifications comprised 71 higher-intensity-friendly and 65 lower-intensity-friendly subdistricts. Of the remaining cases, 14 paired an opportunity advantage with a time disadvantage, 21 showed the reverse pattern, and one sat on the neutral boundary. Within the lower-intensity-friendly class, the double-disadvantage score had a median of 0.218 and an upper quartile of 0.301; 17 cases entered Tier I and 16 entered Tier II. Xiaotangshan Town, National New Media Industrial Base, Yan Yuan Subdistrict, and Dougezhuang Area Office recorded the largest D values. Their ordering identifies candidates for verification and does not imply a causal ranking.
4.3. FAR-Threshold Sensitivity and Screening Stability
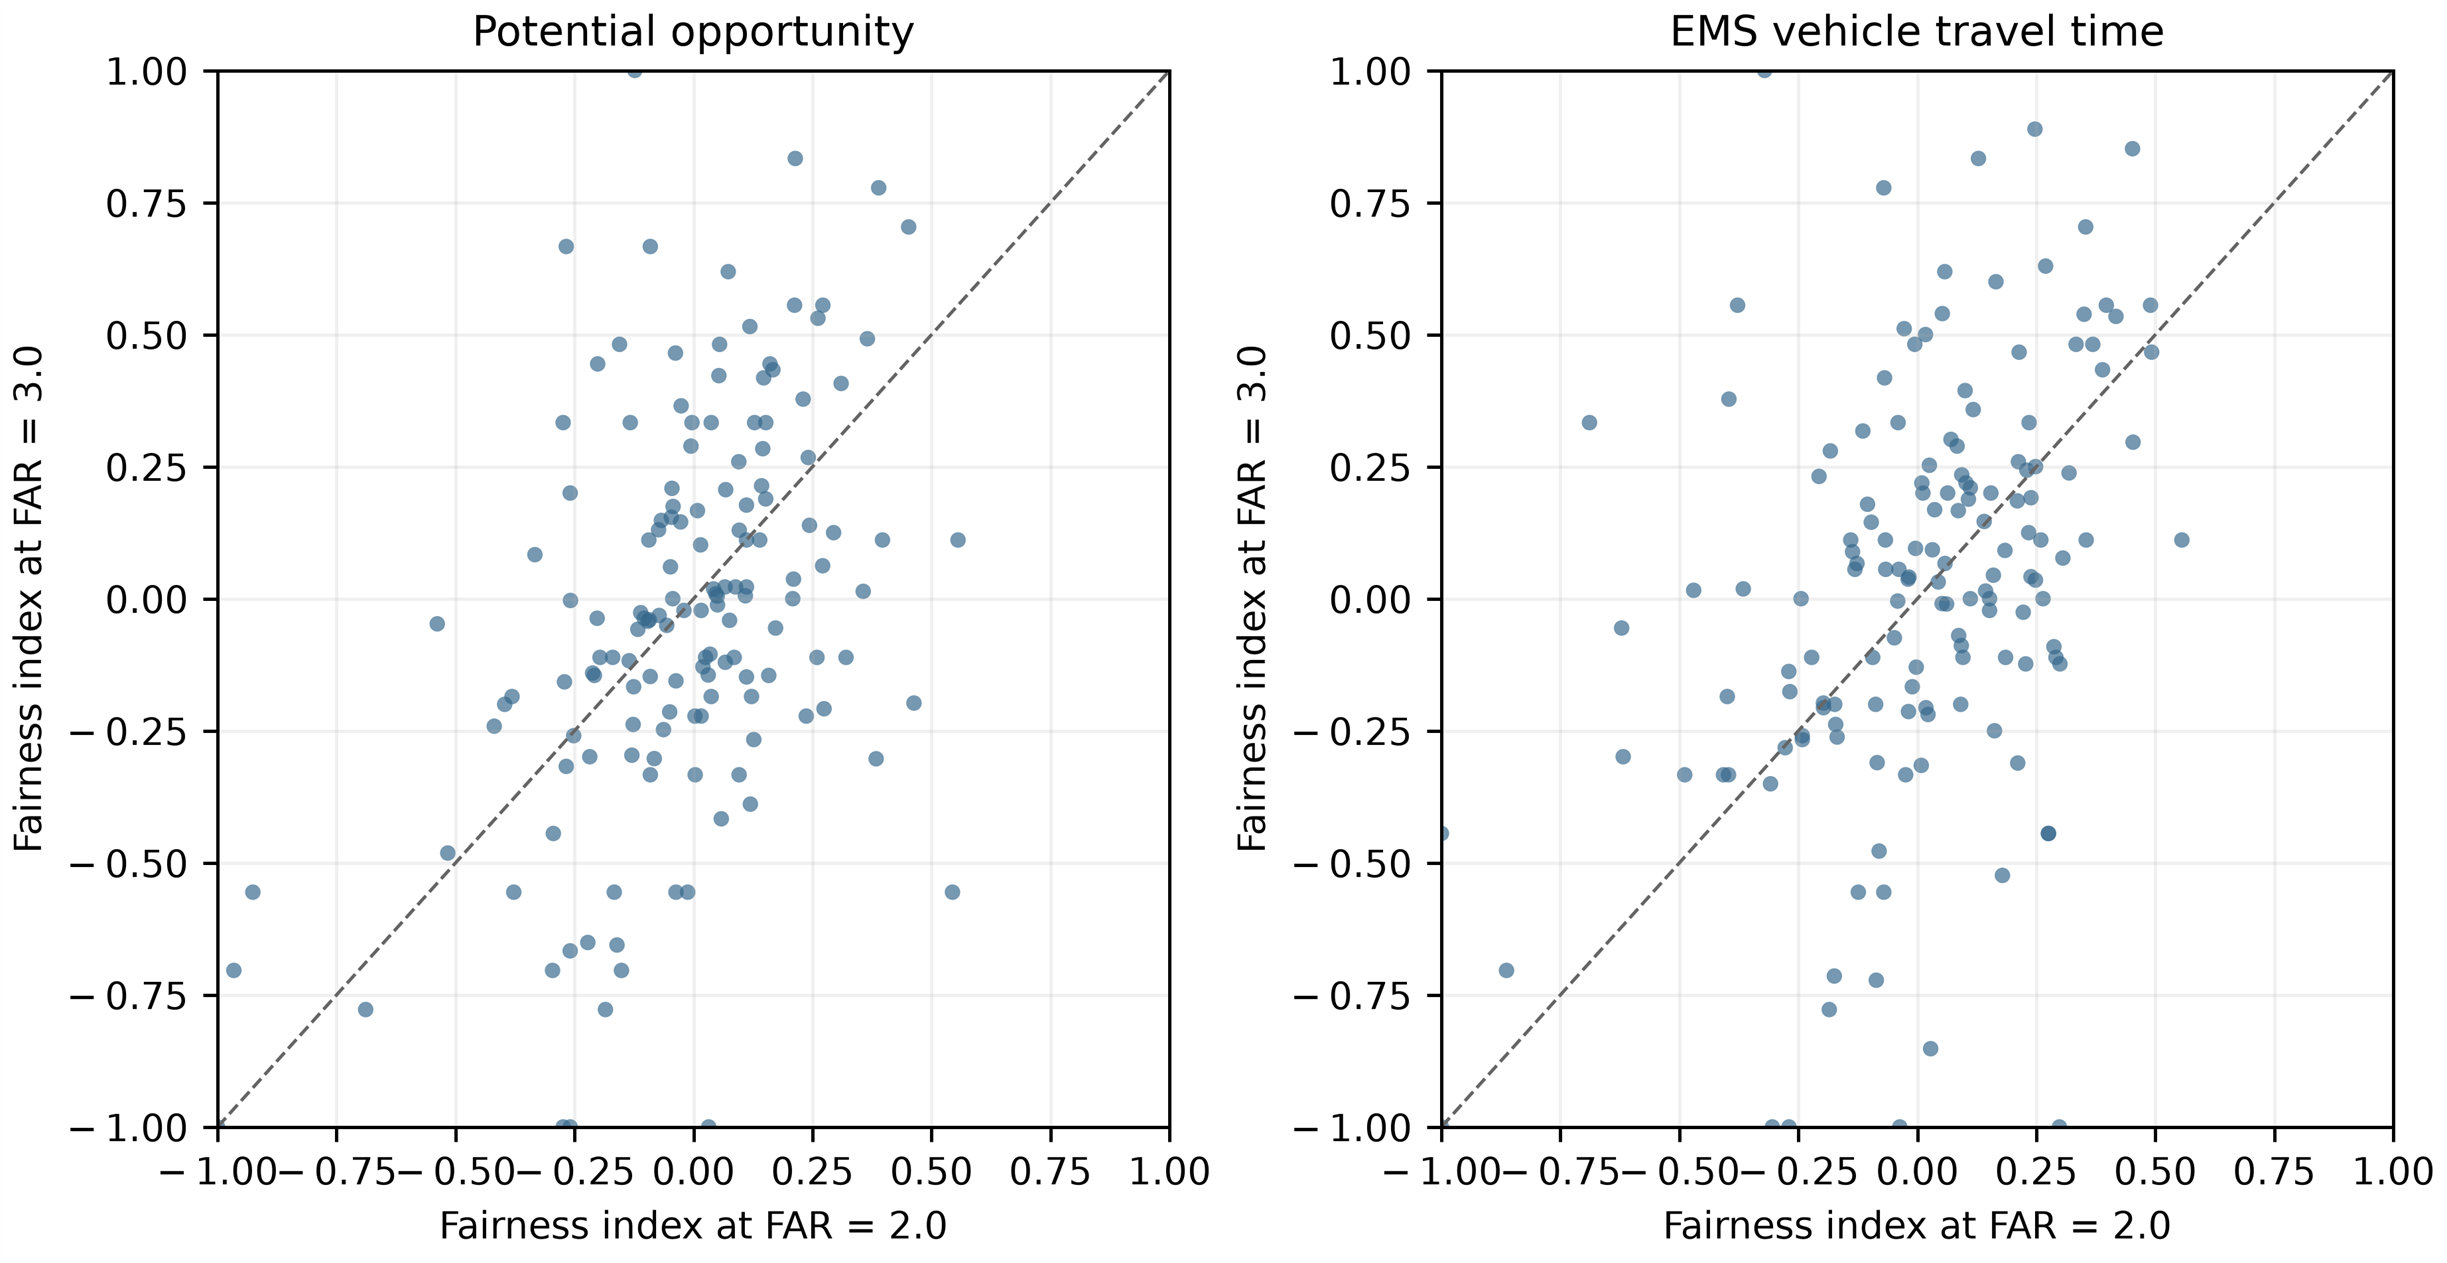
Table 1 shows the main results under FAR = 3.0. 147 subdistricts were estimable: 57 were higher-intensity-friendly, 56 lower-intensity-friendly, and 34 mixed or neutral. Tier I and Tier II screening included 14 subdistricts each. Among the 147 subdistricts estimable under both thresholds, potential-opportunity Fairness had Pearson r = 0.453, and EMS vehicle-time Fairness had Pearson r = 0.404 (Figure 3). Friendly-type agreement was 51.02%. The Jaccard coefficient (Jaccard similarity coefficient) is used to measure the similarity between two sets. Tier I and Tier II Jaccard indices were 0.130 and 0.087, and Tier I/Tier II level agreement was 75.51%. FAR = 2.0 and FAR = 3.0 are therefore not equivalent: 2.0 is an interpretable main-analysis node, but screening candidates should be reported with threshold sensitivity and verified using continuous FAR or multiple thresholds where decisions are consequential. For candidate sets A and B, the Jaccard index is |A ∩ B|/|A ∪ B|. Its denominator, |A ∪ B|, is the number of distinct subdistricts included in either candidate set; it is not the total number of study subdistricts.
Table 1.
FAR = 2.0 versus FAR = 3.0 threshold sensitivity.
Figure 3.
Comparison of subdistrict Fairness indices at FAR = 2.0 and FAR = 3.0.
For the FAR = 2.0 and FAR = 3.0 comparisons, the Jaccard index is |A ∩ B|/|A ∪ B|. The denominator is the total number of distinct subdistricts in the union of the two candidate sets; it is not the number of all study units. The screening counts and selected units are listed in Supplementary Materials Table S3.
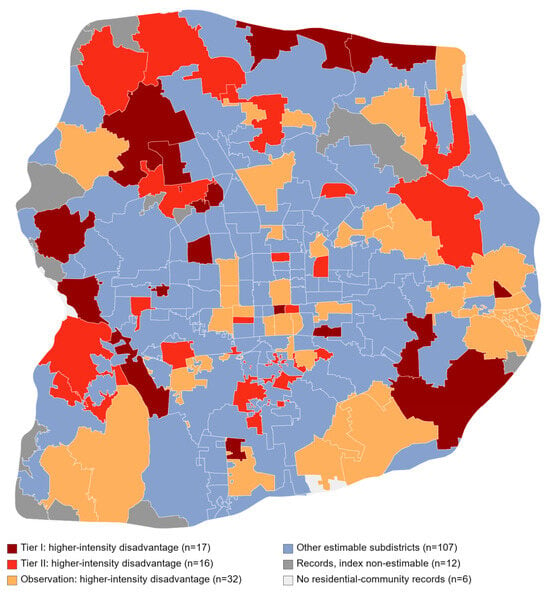
Figure 4 maps the recurrent screening candidates. Low-accessibility communities in either intensity group warrant attention regardless of the relative Fairness-index sign. An index may be unavailable when either group is empty; such units should not be coded as neutral and should remain in absolute-access review.
Figure 4.
Subdistricts identified by the original double-disadvantage screening exercise.
5. Discussion
5.1. Comparison with Related Studies and Complementarity of the Measures
Earlier EMS equity research has used several complementary approaches. Studies have used regression to identify district-level determinants of EMS timeliness [11], percentile-based measures to compare age-group access distributions [12], Lorenz/Gini analyses to assess inequality across building-height scenarios [23], and location/capacity optimization to balance equality and coverage [30]. Group-specific work has also assessed social disparities in access to emergency equipment [28]. Together, these approaches quantify horizontal equality in aggregate distributions or test associations between access and social or contextual characteristics—evidence relevant to vertical equity, but not a direct estimate of which FAR-defined intensity group has a relative advantage within each subdistrict. We address this complementary question by comparing the full accessibility-score distributions of higher- and lower-intensity communities within each subdistrict using the percentile-based Fairness index [12]. Its sign identifies relative group advantage in that subdistrict; it does not establish adequate absolute access or overall equality across Beijing.
The Wuhan study by Luo et al. [23] is the closest comparison because it also links built form with EMS accessibility equity. Both studies indicate that urban form can matter for how access is distributed. Their estimands differ, however: Luo et al. measured building height and added the in-building patient-access trip, then compared Lorenz/Gini inequality across citywide scenarios; we use FAR as a community-level proxy and assess relative group positions within subdistricts using potential-opportunity and road-based vehicle-time measures. We do not observe building height, internal circulation, or patient access inside buildings. At FAR = 2.0, mean Fairness values were close to zero (−0.023 for opportunity and 0.004 for vehicle time), yet 71 subdistricts favored the higher-intensity group and 65 favored the lower-intensity group. This local mixture differs from a single citywide inequality estimate because FAR is not a one-to-one measure of building height or access conditions: station proximity, facility supply-demand competition, street connectivity, and community layout can vary within the same FAR group. The positive correlation between the two indices (r = 0.805) indicates that the measures often move together across subdistricts, plausibly because they share spatial service geography and travel-time inputs, but it does not imply identical classifications or a causal FAR effect. The 51.02% friendly-type agreement and low Tier I/Tier II overlap between FAR = 2.0 and 3.0 further show that changing the cut-off reassigns communities and changes both group distributions and the resulting shortlist.
Group size also explains why the index is less stable for some subdistricts. At FAR = 2.0, indices were estimable in 172 of 190 study subdistricts; 18 were non-estimable because one group was absent or no community records were available. Among the 172 estimable units, 15 had fewer than five communities in at least one group (40 had fewer than ten). At FAR = 3.0, only 147 subdistricts were estimable, and 44 of these had fewer than five communities in at least one group (74 had fewer than ten; Supplementary Table S2). With nine percentile thresholds, a small group makes each observation influential and produces coarse, sometimes tied empirical proportions; an empty group makes the comparison undefined. These features explain why the Fairness index is more defensible for larger administrative units, or for harmonized district- or city-level comparisons, when both groups have adequate sample sizes. Aggregation can itself conceal local differences, so we retain the subdistrict screen as a cautious diagnostic, report group counts, treat absent-group cases as non-estimable rather than neutral, and pair relative indices with absolute-access review.
The same comparison logic could be adapted to other public services, including park accessibility and service diversity in 15-min community life circles. Existing studies have developed age-grouped park-access measures and examined spatial inequities in green-space access [14,29]. Transfer would require service-specific definitions of supply, quality, capacity, travel mode, catchment, and the groups being compared; a life-circle diversity measure would also need an explicit and validated definition of facility-category richness or balance. The Fairness index could then describe relative group positions, while absolute access and minimum service needs would still need separate assessment. These are potential applications for future work, not outcomes tested in this EMS study.
5.2. Interpretation Boundaries of the FAR Node and Planning Use
FAR is an imperfect proxy for development intensity and cannot identify building height, internal layout, or access conditions on its own. Within a subdistrict, higher-intensity communities may be more crowded, have taller buildings, and have less outdoor space than lower-intensity communities; these conditions could complicate emergency access, but they were not measured directly. Where lower-intensity communities have a relative advantage, higher-intensity communities in that subdistrict may be candidates for follow-up assessment.
5.3. Using the Screening Results in Urban-Renewal Review
Screening candidates should be reviewed by municipal managers, urban and transport planners, EMS providers, hospitals, and residents. Site audits can identify blocked or narrow emergency routes, curbside parking conflicts, difficult turning movements, signal delay, missing ambulance staging areas, and weak connections to the road network. Potential actions include keeping emergency access lanes clear, adjusting parking and signal operations, improving feasible network connections, identifying ambulance staging locations, reviewing station deployment, and coordinating hospital receiving capacity. Densification can worsen access if roads, ambulance supply, curb management, and hospital capacity do not keep pace; assess these effects before approving added intensity and evaluate interventions before and after implementation.
Sustainability implications. This study contributes to sustainable urban development by offering an initial, subdistrict-level screening step for improving EMS accessibility and equity. By comparing the relative accessibility of higher- and lower-intensity communities within each subdistrict, the framework identifies which group is comparatively advantaged and where the difference may warrant further attention. At the citywide level, this screening can help decision-makers locate subdistricts for closer assessment. Subsequent renewal planning should seek both to narrow within-subdistrict accessibility gaps and to improve absolute access, rather than merely shift relative advantage between groups. Progress on both objectives can support more inclusive and sustainable residential communities and is relevant to SDG 3 (good health and well-being), SDG 10 (reduced inequalities), and SDG 11 (inclusive and sustainable cities). The Fairness index is a relative measure; it does not establish that either group has adequate access or that an intervention is sustainable overall. Renewal options should therefore be assessed against absolute accessibility and locally verified needs, alongside environmental performance, affordability, economic feasibility, and life-cycle effects, which this study does not measure.
5.4. Limitations and Future Work
Several limitations qualify interpretation. The collected data are not on the same time scale, which will lead to deviations in the results. Routing application programming interface (API) quotas limited the analysis to 08:00; accessibility patterns at other times and on other days may differ and should be examined in future work. Double min–max normalization and equal weighting of the two travel legs are analytical choices rather than empirically validated weights. Fairness results may be unstable when target and reference groups are small or highly imbalanced; we report group counts, but do not yet have a defensible uncertainty estimator for these comparisons. We lack observed 120 ambulance en-route and response times to validate routing API estimates; future work should obtain operational records and use regression analysis to assess their association with API travel-time estimates. FAR does not measure building height, internal circulation, or on-site access, and the study does not measure environmental, economic, or life-cycle outcomes; therefore, it assesses an equity-related social dimension of sustainable urban renewal rather than sustainability as a whole.
6. Conclusions
This study presents a relative Fairness framework for screening EMS accessibility differences between FAR-defined higher- and lower-intensity communities. At FAR = 2.0, indices were estimable in 172 subdistricts; comparisons at FAR = 3.0 provide a threshold-sensitivity check. The method is a screening procedure for identifying relative within-subdistrict advantages, not an absolute service standard or a ranking of renewal investments. It may be unstable when either group is small, or group sizes are highly imbalanced, a limitation of the index to consider when interpreting results. Its value is that it makes the relative advantage between the two groups visible. Regardless of the index sign, low-accessibility communities in both intensity groups warrant review.
Supplementary Materials
The following supporting information can be downloaded at: https://www.mdpi.com/article/10.3390/buildings16224500/s1, Figure S1, study area; Table S1, Data sources, variables and analytic roles; Table S2, Subdistrict group counts and Fairness indices at FAR = 2.0; Table S3, Original FAR = 2.0 and FAR = 3.0 double-disadvantage screening list.
Author Contributions
Conceptualization, F.L., L.S., S.L., and Z.W.; methodology, F.L., S.L., and Z.W.; software, Y.W. and Q.Y.; validation, Z.W.; formal analysis, Z.W.; investigation, Y.W., Q.Y., and Z.W.; data curation, F.L., Y.W., Q.Y., L.S., and S.L.; writing—original draft, F.L., Y.W., Q.Y., and Z.W.; writing—review and editing, F.L. and Z.W.; supervision, Z.W.; project administration, L.S. and Z.W. All authors have read and agreed to the published version of the manuscript.
Funding
This work was funded by the Hebei Provincial Department of Science and Technology through the Hebei Provincial Natural Science Foundation General Project (E2025402020).
Data Availability Statement
Derived summary results and analysis materials may be requested from the corresponding author.
Acknowledgments
The authors thank the anonymous reviewers for their constructive comments.
Conflicts of Interest
The authors declare no conflicts of interest.
References
- David, G.; Harrington, S.E. Population density and racial differences in the performance of emergency medical services. J. Health Econ. 2010, 29, 603–615. [Google Scholar] [CrossRef] [Scilit] [PubMed]
- Tansley, G.; Stewart, B.T.; Zakariah, A.; Boateng, E.; Achena, C.; Lewis, D.; Mock, C. Population-level spatial access to prehospital care by the National Ambulance Service in Ghana. Prehosp. Emerg. Care 2016, 20, 768–775. [Google Scholar] [CrossRef] [Scilit] [PubMed]
- Carr, B.G.; Bowman, A.J.; Wolff, C.S.; Mullen, M.T.; Holena, D.N.; Branas, C.C.; Wiebe, D.J. Disparities in access to trauma care in the United States: A population-based analysis. Injury 2017, 48, 332–338. [Google Scholar] [CrossRef] [Scilit] [PubMed]
- Shin, K.; Lee, T. Improving the measurement of the Korean emergency medical system’s spatial accessibility. Appl. Geogr. 2018, 100, 30–38. [Google Scholar] [CrossRef] [Scilit]
- Xia, T.; Song, X.; Zhang, H.; Song, X.; Kanasugi, H.; Shibasaki, R. Measuring spatio-temporal accessibility to emergency medical services through big GPS data. Health Place 2019, 56, 53–62. [Google Scholar] [CrossRef] [Scilit] [PubMed]
- Luo, W.; Yao, J.; Mitchell, R.; Zhang, X. Spatiotemporal access to emergency medical services in Wuhan, China: Accounting for scene and transport time intervals. Int. J. Health Geogr. 2020, 19, 52. [Google Scholar] [CrossRef] [Scilit] [PubMed]
- Xiong, Q.; Liu, Y.; Xing, L.; Wang, L.; Ding, Y.; Liu, Y. Measuring spatio-temporal disparity of location-based accessibility to emergency medical services. Health Place 2022, 74, 102766. [Google Scholar] [CrossRef] [Scilit] [PubMed]
- Hashtarkhani, S.; Kiani, B.; Bergquist, R.; Bagheri, N.; VafaeiNejad, R.; Tara, M. An age-integrated approach to improve measurement of potential spatial accessibility to emergency medical services for urban areas. Int. J. Health Plan. Manag. 2020, 35, 788–798. [Google Scholar] [CrossRef] [Scilit] [PubMed]
- Zhu, H.; Pan, L.; Li, Y.; Jin, H.; Wang, Q.; Liu, X.; Wang, C.; Liao, P.; Jiang, X.; Li, L. Spatial accessibility assessment of prehospital EMS with a focus on the elderly population: A case study in Ningbo, China. Int. J. Environ. Res. Public Health 2021, 18, 9964. [Google Scholar] [CrossRef] [Scilit] [PubMed]
- Burdick, K.J.; Rees, C.A.; Lee, L.K.; Monuteaux, M.C.; Mannix, R.; Mills, D.; Hirsh, M.P.; Fleegler, E.W. Racial and ethnic disparities in geographic access to critical care in the United States: A geographic information systems analysis. PLoS ONE 2023, 18, e0287720. [Google Scholar] [CrossRef] [Scilit] [PubMed]
- Jana, A.; Sarkar, A.; Parmar, V.; Saunik, S. Examining district-level disparity and determinants of timeliness of emergency medical services in Maharashtra, India. Sci. Rep. 2023, 13, 21239. [Google Scholar] [CrossRef] [Scilit] [PubMed]
- Han, Y.; Liao, P.-Y.; Li, W.; Wang, Q.R. Visitation patterns reveal service access disparities for ageing populations in the USA. Nat. Hum. Behav. 2025, 9, 2370–2381. [Google Scholar] [CrossRef] [Scilit] [PubMed]
- Shen, Z.; Gao, G.; Wang, Z. Accessibility assessment of prehospital emergency medical services considering supply-demand differences. J. Adv. Transp. 2021, 2021, 1925354. [Google Scholar] [CrossRef] [Scilit]
- Li, C.; Wang, J. Using an age-grouped Gaussian-based two-step floating catchment area method (AG2SFCA) to measure walking accessibility to urban parks: With an explicit focus on elderly. J. Transp. Geogr. 2024, 114, 103772. [Google Scholar] [CrossRef] [Scilit]
- Li, C.; Jia, B. Measuring emergency medical service accessibility using the improved 3SFCA: With a focus on key population influence. J. Transp. Geogr. 2025, 128, 104310. [Google Scholar] [CrossRef] [Scilit]
- Huang, Z.; Sun, Y. Assessing emergency medical services (EMS) accessibility before and after road pricing: A dynamic 2SFCA approach. J. Transp. Geogr. 2026, 130, 104489. [Google Scholar] [CrossRef] [Scilit]
- Li, L.; Niu, N. Uncovering inequity in aging cities: A dynamic, multi-scale assessment of geriatric EMS accessibility in Zhengzhou. Cities 2025, 167, 106339. [Google Scholar] [CrossRef] [Scilit]
- Liu, Z.; Zhang, E.; Pan, S.; Li, S.; Long, Y.; Witlox, F. Assessing urban emergency medical services accessibility for older adults considering ambulance trafficability using a deep learning approach. Sustain. Cities Soc. 2025, 132, 106804. [Google Scholar] [CrossRef] [Scilit]
- Pandey, B.; Brelsford, C.; Seto, K.C. Infrastructure inequality is a characteristic of urbanization. Proc. Natl. Acad. Sci. USA 2022, 119, e2119890119, Correction in Proc. Natl. Acad. Sci. USA 2022, 119, e2206814119. [Google Scholar] [CrossRef] [Scilit] [PubMed]
- Berry, C.; Escobar, N.; Mann, N.C.; DiMaggio, C.; Pfaff, A.; Duncan, D.T.; Frangos, S.; Sairamesh, J.; Ogedegbe, G.; Wei, R. Ambulance deserts and inequities in access to emergency medical services care: Are injured patients at risk for delayed care in the prehospital system? J. Trauma Acute Care Surg. 2025, 99, 484–488. [Google Scholar] [CrossRef] [Scilit] [PubMed]
- Han, B.; Hu, W.; Tang, X.; Zheng, J.; Hu, M.; Li, Z. Optimization of pre-hospital emergency facility layout in Nanjing: A spatiotemporal analysis using multi-source big data. Int. J. Appl. Earth Obs. Geoinf. 2024, 133, 104112, Correction in Int. J. Appl. Earth Obs. Geoinf. 2024, 135, 104325. [Google Scholar] [CrossRef] [Scilit]
- Zhang, S.; Wang, L.; Shen, Y.; Zhang, Y.; Gao, Y.; Xu, T.; Zhang, Z. What causes Emergency Medical Services (EMS) delay? Unravel high-risk buildings using citywide ambulance trajectory data. Habitat Int. 2024, 153, 103198. [Google Scholar] [CrossRef] [Scilit]
- Luo, W.; Zhu, Y.; Yang, Z.; Wang, F.; Wang, Y. When buildings become barriers: Assessing the impact of building height on the equality of emergency medical services accessibility—A dual-trip study in Wuhan, China. Int. J. Health Geogr. 2025, 24, 16. [Google Scholar] [CrossRef] [Scilit] [PubMed]
- Luo, W.; Chen, X.; Zhao, L.; He, L. Measuring and optimizing spatial accessibility to emergency medical services with a focus on age-based spatial variations in EMS risk. Front. Public Health 2026, 14, 1827404. [Google Scholar] [CrossRef] [Scilit] [PubMed]
- Conway, A.B.; McDavid, A.; Emert, J.M.; Kudenchuk, P.J.; Stubbs, B.A.; Rea, T.D.; Yin, L.; Olsufka, M.; McCoy, A.M.; Sayre, M.R. Impact of building height and volume on cardiac arrest response time. Prehosp. Emerg. Care 2016, 20, 212–219. [Google Scholar] [CrossRef] [Scilit] [PubMed]
- Fu, X.; Nie, Q.; Li, X.; Liu, J.; Nambisan, S.; Jones, S. The role of the built environment in emergency medical services delays in responding to traffic crashes. J. Transp. Eng. A Syst. 2022, 148, 04022085. [Google Scholar] [CrossRef] [Scilit]
- Zhao, Y.; Zhou, Y. Isochrone-based accessibility analysis of pre-hospital emergency medical facilities: A case study of central districts of Beijing. ISPRS Int. J. Geo-Inf. 2024, 13, 288. [Google Scholar] [CrossRef] [Scilit]
- Gao, F.; Lu, S.; Liao, S.; Chen, W.; Chen, X.; Wu, J.; Wu, Y.; Li, G.; Han, X. AED inequity among social groups in Guangzhou. ISPRS Int. J. Geo-Inf. 2024, 13, 140. [Google Scholar] [CrossRef] [Scilit]
- Adorno, B.V.; Pereira, R.H.M.; Amaral, S. Combining spatial clustering and spatial regression models to understand distributional inequities in access to urban green spaces. Landsc. Urban Plan. 2025, 256, 105297. [Google Scholar] [CrossRef] [Scilit]
- Li, M.; Wang, F.; Kwan, M.-P.; Chen, J.; Wang, J. Equalizing the spatial accessibility of emergency medical services in Shanghai: A trade-off perspective. Comput. Environ. Urban Syst. 2022, 92, 101745. [Google Scholar] [CrossRef] [Scilit]
- Luo, W.; Yao, J.; Mitchell, R.; Zhang, X.; Li, W. Locating emergency medical services to reduce urban-rural inequalities. Socio-Econ. Plan. Sci. 2022, 84, 101416. [Google Scholar] [CrossRef] [Scilit]
- Luo, W.; Yao, J.; Mitchell, R.; Zhang, X.; Li, W. Location optimization of emergency medical services: Considering joint service coverage of ambulances and emergency centers. Environ. Plan. B Urban Anal. City Sci. 2025, 52, 150–167. [Google Scholar] [CrossRef] [Scilit]
- Yao, Y.; Wang, Y.; Liang, L.; Yan, X.; Dong, A.; Guan, Q.; Luo, P. Evaluation and spatial optimization model of urban medical resource distribution considering equity and efficiency. Trans. GIS 2025, 29, e70089. [Google Scholar] [CrossRef] [Scilit]
- Zhou, D.; Li, Z.; Wang, S.; Tian, Y.; Zhang, Y.; Jiang, G. How does the newly urban residential built-up density differ across Chinese cities under rapid urban expansion? Evidence from residential FAR and statistical data from 2007 to 2016. Land Use Policy 2021, 104, 105365. [Google Scholar] [CrossRef] [Scilit]
- Cheshmehzangi, A.; Dawodu, A. Towards a sustainable energy planning strategy: The utilisation of floor area ratio for residential community planning and design in China. Front. Sustain. Cities 2021, 3, 687895. [Google Scholar] [CrossRef] [Scilit]

Disclaimer/Publisher’s Note: The statements, opinions and data contained in all publications are solely those of the individual author(s) and contributor(s) and not of MDPI and/or the editor(s). MDPI and/or the editor(s) disclaim responsibility for any injury to people or property resulting from any ideas, methods, instructions or products referred to in the content. |
© 2026 by the authors. Licensee MDPI, Basel, Switzerland. This article is an open access article distributed under the terms and conditions of the Creative Commons Attribution (CC BY) license.