


Abstract
This study explores the combined use of volcanic pumice powder (VPP) and recycled nylon fiber (RNF), sourced from discarded fishing nets, in developing sustainable concrete. Ten mixtures were designed using 10–20% VPP as a partial cement replacement alongside 0–2% RNF. Fresh-state behavior, mechanical performance (compressive, tensile, and flexural strength), and non-destructive testing (rebound hammer and ultrasonic pulse velocity) were assessed, while SEM-based microstructural analysis confirmed pore refinement and enhanced C–S–H gel formation. The 10% VPP–1% RNF mixture achieved the highest compressive strength, exceeding the control by about 18%, while 10% VPP–2% RNF delivered the best tensile and flexural results, improving by roughly 35% and 34%, respectively. Environmentally, 20% VPP replacement reduced CO2 emissions by nearly 20%, highlighting the mixture’s sustainability benefits. Machine learning models were also applied to predict mechanical properties, with the Gradient Boosting Regressor outperforming Random Forest and XGBoost, achieving a test R2 of 0.924 and MAE of 6.75 MPa. Feature importance analysis identified curing age, supplementary cementitious materials, and cement content as the most influential parameters. Overall, the VPP–RNF combination enhances concrete’s strength, durability, and environmental performance, while machine learning provides reliable, interpretable tools for optimizing sustainable concrete mix design.
1. Introduction
Concrete is an adaptable and frequently utilized building material that serves as the primary structural component of many buildings all over the world. Its strong compressive strength, resistance to combustion, versatility, and affordability have made it a global construction material. Nowadays, concrete is employed in the modern construction sector at a rate that exceeds 10 billion tons per year [1,2]. Ordinary Portland cement (OPC), aggregates (such as sand, gravel, or crushed stone), water, and occasionally admixtures are the usual ingredients of concrete [3]. OPC serves as a binding agent and enhances the strength and durability of concrete, making it a crucial component. However, because OPC production contributes 5% to 7% of worldwide CO2 emissions, it has a substantial negative impact on the environment [4]. Therefore, supplementary cementitious materials (SCMs), which have a far lower carbon footprint, are employed to improve the mechanical and fresh qualities of concrete while simultaneously lowering emissions [5]. Silica and alumina species are found in pozzolanic SCMs, which aid in the pozzolanic reaction and produce concrete that is stronger and more resilient [6]. Several studies addressed the mechanical and durability characteristics of concrete employing SCMs as a partial replacement for OPC, including but not limited to fly ash, blast furnace slag, silica fume, metakaolin, palm oil fuel ash, marble powder, and rice husk ash, and combining SCMs is a part of that approach as well. Nath and Sarker [7] demonstrated that the durability properties of concrete improved by 30–40% with the incorporation of fly ash as a partial replacement for cement. Similarly, Bagheri et al. [8] reported a 30–50% enhancement in the strength development rate and durability characteristics of concrete when supplementary cementitious materials were used. Their study included mixes containing silica fume and blast furnace slag at cement replacement levels of 15%, 30%, and 50%, as well as mixes with silica fume at replacement levels of 2.5%, 5%, 7.5%, and 10%. Additionally, Santhosh et al. [9] conducted a comprehensive review of the performance of two widely available agro-waste ashes, palm oil fuel ash and rice husk ash, in concrete. Furthermore, Chowdhurya et al. [10] reported that a composite incorporating 25% boiler slag, combined with an alkali activator ratio of 1.5, attained the highest compressive strength of 30.38 MPa after 7 days of curing. Sathiparan and Subramaniam [11] demonstrated that the use of fly ash and rice husk ash in concrete led to an estimated 15% reduction in cost per cubic meter and a 20% decrease in CO2 emissions compared to conventional concrete production. The inclusion of aluminum oxide and iron (III) oxide in fly ash enhances its chloride-binding capacity, leading to a denser microstructure with higher strength, as reported by Tan et al. [12].
Volcanic pumice powder (VPP), a naturally occurring pozzolan, has recently been suggested for inclusion in the canon of fine pozzolanic materials. A naturally occurring volcanic mineral, pumice is produced when lava solidifies and releases gasses. According to Jackson and Dhir [13], volcanic pumice has pozzolanic activity because of its reactivity with lime, which results during cement hydration. Volcanic pumice contains a substantial quantity of amorphous silica (SiO2), which combines with calcium hydroxide (Ca(OH)2) to form calcium silicate hydrate (C-S-H) gel, which is responsible for the durability and strength of cementitious materials. Numerous characteristics of VPP-based concrete with replacement levels ranging from 0 weight percent to 30 weight percent have been studied by researchers. Zeyad et al. [14] claim that high-strength concrete’s durability and strength were enhanced using VPP. According to their research, VPP increased compressive strength, indirect tensile strength, and flexural strength with time while generally decreasing permeability during the Rapid Chloride Permeability Test (RCPT) and water absorption tests. Natural pozzolans and industrial by-products have been widely investigated as a partial replacement for cement in concrete in recent years. For instance, Rosales et al. [15] showed that volcanic ash and pumice as binders reach 80–90% of the strength of ordinary Portland cement (OPC) at 28 days due to the high content of amorphous silica. Comparable performance trends were reported in the literature for metakaolin and fly-ash-based concretes.
Like VPP, recycled nylon fiber (RNF) has been applied as an environmentally friendly concrete reinforcement material in the building industry [16,17,18]. These days, fishing nets are manufactured with materials like nylon, which is non-biodegradable and adds to ocean pollution, and available in a range of sizes and designs. Approximately 640,000 tons of commercial fishing gear (nets, lines, pots, and traps) are thrown into the ocean annually, according to Laville [19]. As a result, reusing abandoned fishing nets has received strong support. Glass, polypropylene, nylon, and other synthetic fibers have better mechanical performance than recycled plastic fibers, according to Habib et al. [20]. However, the production of 1 kg of nylon releases 1.91 kg of CO2, according to the Intergovernmental Panel on Climate Change (IPCC) [21]. Therefore, this study considers employing recycled nylon fibers to make sustainable concrete structures. The inclusion of recycled nylon fibers from discarded fishing nets in concrete increased toughness, ductility, and compressive, tensile, and flexural strength while reducing the rate of crack creation, according to research by Spadea et al. [22] and Orasutthikul et al. [23].
Recently, several research studies in the field of civil engineering have discovered that it is feasible to model the intended outcome as an expression of numerous variables and provide an accurate prognosis by employing machine learning and deep learning techniques [24]. Large amounts of data from previous combinations can be analyzed by machine learning approaches to forecast long-term efficacy, optimize material percentages, improve quality surveillance, and predict concrete excellence [25,26]. Machine learning systems can identify the best material selections that reduce waste, cut carbon emissions, and enhance the overall performance of concrete buildings by considering variables like cost, accessibility, and environmental impact. In addition to ML algorithms, numerical simulation and modeling have also shown significant progress in civil engineering applications [27,28,29]. To accurately predict the shear strength of deep beams made of reinforced concrete, Feng et al. [30] used four common machine learning methods (Random Forest, Adaptive Boosting, Gradient Boosting Regression Tree, and Extreme Gradient Boosting). Likewise, Paudel et al. [31] created an ensemble model with 85% validity to predict compressive strength by integrating Multiple Linear Regression and Support Vector models. Salami et al. [32] developed three innovative AI techniques to assess the compressive strength of foamed concrete: gradient boosting tree (GBT), gene expression programming (GEP), and artificial neural network (ANN). All three models had R2 values over 0.96, suggesting good performance. Al-Gburi et al. [33] found that ANN models provide accurate predictions of compressive strength based on 28-day data. Sobuz et al. [34] observed that in the strength testing phase involving sugarcane bagasse ash, the Random Forest model achieved the highest R2 values, varying between 0.96 and 0.98. Saha et al. [35] found that although various ML models exhibited strong regression coefficients, the RF model delivered the most accurate and reliable results when applied to waste glass aggregate. Sobuz et al. [36] reported that the predicted results yielded an R2 of 0.97, consistent with the performance of XG-Boost, while the Linear Regression (LR) model demonstrated a lower R2 value of 0.78 in the compressive strength test. According to Islam et al. [37], the Random Forest model demonstrated a R2 of 0.98, while the LR model showed a slightly higher coefficient of 0.99 when using e-waste plastic.
While many studies have examined the impacts of recycled nylon fiber (RNF) and volcanic pumice powder (VPP) separately in concrete, few have examined their combined impact. This joint evaluation is especially important since RNF contributes to crack-bridging, ductility, and toughness, whereas VPP, as a pozzolanic material, mainly improves the microstructure and durability of the cementitious matrix. Exploring their interaction is both important and challenging, as the simultaneous presence of a mineral-based pozzolan and a polymeric fiber may result in synergistic improvements or potential trade-offs in performance. When discussing SCMs in concrete, their impact is generally more pronounced on compressive strength than on tensile strength. Therefore, this study includes both VPP as SCM and RNF as fiber to investigate their combined effect on concrete. On the other hand, as per the aforesaid literature analysis, no prior work has been attempted to compare machine learning models for predicting the mechanical and fresh parameters of VPP and RNF-based concrete. Furthermore, the authors’ research also revealed that, from a non-destructive test (NDT) perspective, no studies have previously investigated the interplay between VPP and RNF and concrete quality. Therefore, this study’s overarching goal is to ascertain how integrating VPP and RNF into concrete affects sustainability efforts and how these waste products can be converted into value-added building materials. Two types of machine learning algorithms, named SVM and XGBoost, are applied after empirical evaluation for anticipating the concrete’s fresh and mechanical properties. This research also shows the connections between destructive (DT) and non-destructive (NDT) testing of concrete with the help of VPP and RNF, as well as the possibility of lowering CO2 emissions by decreasing the quantity of OPC by using VPP. Thus, this study develops eco-friendly concrete and provides a sustainable and affordable remedy for the construction sector.
2. Materials and Methods
2.1. Raw Materials
All concrete mixes contain OPC type I that satisfies the standard ASTM C150 [38]. Additionally, silica fume (SF) was acquired from a nearby market to be utilized as a mineral additive. Similarly, volcanic pumice was procured from the local market and ground into powder in the laboratory using a ball mill machine (see Figure 1a,b). Both the SF and volcanic pumice were sourced from Nutech Construction Chemicals Company Limited, Dhaka, Bangladesh. In this study, VPP was sieved through a 600 μm opening to ensure that all particles passing through were below this size limit. A portion of the experimental work associated with this research project was previously reported by the authors in [39], and the physical and chemical properties of VPP, OPC, SF, and RNF, along with the corresponding material images, are reproduced from that publication. The physical characteristics of OPC, SF, and VPP are presented in Table 1, while their chemical compositions, determined by X-ray fluorescence (XRF) analysis, are detailed in Table 2. According to the XRF results, ASTM C618-93 [40] can be used as a standard for the chemical characteristics of VPP (SiO2 + Al2O3 + Fe2O3 exceeds 76%). A superplasticizer based on polycarboxylic ethers was used in all concrete mixtures, and its percentage by weight was held constant to ensure the cement remained at the correct consistency. Waste fishing nets were obtained from a local fish market and thoroughly washed to remove impurities such as dirt, salt, and organics. Cleaning was carried out by dipping the nets in fresh water and scrubbing to the satisfaction of the user after the last traces of dirt had been removed. The nets were gently dried after washing to remove excess water. Following this, the nets were cut into 15 mm (±2 mm) long pieces with a standard cutting system to provide uniform fiber length. These pieces were used as recycled nylon fiber, as shown in Figure 1c. This operation was strictly regulated to preserve the homogeneity of the fiber size and shape. The fibers were then examined to prevent any interference from remaining impurities, and the standardization ensured the homogeneity and reproducibility of the material used for any further study. The fishing net breaking strength was evaluated using a Universal testing machine (Testometric in Rochdale, UK), which is managed by WinTest Analysis material testing software (see Figure 1d). Table 3 shows the physicochemical properties of RNF.
Figure 1.
(a) Volcanic pumice, (b) volcanic pumice powder, (c) trimmed recycled fishing net, (d) breaking strength test of fishing net, (e) gradation curve of coarse and fine aggregate.
Table 1.
Physical attributes of OPC, VPP, and SF.
Table 2.
Chemical attributes of OPC, VPP, and SF.
Table 3.
Physical attributes of recycled nylon fiber.
Natural river sand provided the fine aggregate (FA), while crushed natural stone with a nominal size of up to 12 mm made up the coarse aggregate (CA). Measurements of the coarse and fine aggregates’ physical characteristics were made in compliance with ASTM C127 and ASTM C128 [41], as shown in Table 4. Figure 1e displays the particle size distribution curve based on the ASTM C33 standard [42].
Table 4.
Physical attributes of aggregates.
2.2. Mixture Proportion
Ten concrete mixture compositions were investigated in this study, with RNF added at two different doses to partially replace differing masses of VPP in the cement. The weight of the cement indicated a 1:1.3:1.8:0.32 mix ratio with fine aggregate, coarse aggregate, and water after several trial mixes with different ratios of water to binder and superplasticizer (SP). In this study, SF was incorporated at 17% of the OPC content to support the development of high strength, considering its well-established contribution to strength enhancement. However, the SF content was selected and kept constant throughout this study using experimental trials to maintain a consistent binder modification. The mix design was carried out following ACI 211R [43]. Mixing and curing of the mixture were carried out according to ASTM C192 and C511, respectively. Curing was realized at a temperature of 23 ± 2 °C and with a relative humidity that exceeded >95%. Such control provides for reproducibility and is in accordance with the industrial ready-mix approach. In order to identify the specimen where 0M-0% is specified as the control mix, the combination compositions are referred to as 0M-0%, 10M-0%, 10M-1%, 10M-2%, 15M-0%, 15M-1%, 15M-2%, 20M-0%, 20M-1%, and 20M-2%. The remaining mixes comprised 10%, 15%, and 20% VPP replacement with cement combined with 0%, 1%, and 2% RNF. Table 5 displays the concrete mix proportions used in this experiment. It should be noted that 1% superplasticizer and 17% silica fume were added to the binder’s overall weight.
Table 5.
Mix proportion of concrete mixtures in kg/m3.
2.3. Specimen Preparation and Curing
For all concrete combinations used in this study, 100 mm diameter × 200 mm height cylindrical specimens and 100 mm × 100 mm × 500 mm prism specimens were cast. The concrete specimens were mixed and cured following ASTM C192 standards [44], as ASTM C192/C192M provides standardized procedures for mixing, casting, and curing concrete specimens in the laboratory to ensure uniformity and reliability in strength testing. It specifies methods for consolidation (rodding or vibration), initial and final curing conditions (23 ± 2 °C with high humidity), and proper handling to prevent moisture loss or damage. These guidelines help produce consistent and accurate test results for compressive and flexural strength evaluations. The samples were then stored in the laboratory for 48 h at room temperature. After that, the samples were carefully demolded to avoid causing any surface damage to the specimens. Finally, the samples were stored in a curing tank filled with potable water for 7, 28, and 56 days.
2.4. Testing Standards
To assess the fresh properties of concrete, a slump test was conducted following the ASTM C143 [45] standard. A considerable influence on the concrete slump is also exerted by the mixture’s plastic viscosity and yield stress. The yield stress was expressed as a function of slump and concrete density using a finite element model by Hu et al. [46], as shown in Equation (1). The computations with the finite elements were carried out for concretes with slumps fluctuating from 0 to 25 cm. The plastic viscosity of concretes with a value greater than 300 Pa·s [47] renders this equation inappropriate.
Here, τ0 = yield stress in Pa, s = slump in mm, and ρ = density in kg/m3.
At 7, 28, and 56 days, the compressive and splitting tensile strength tests were performed following the ASTM C39 [48] and ASTM C496 [49] standards, correspondingly. Similarly, using three-point loading, the flexural strength test was carried out at 28 and 56 days following ASTM C78’s code [50] of practice. The digital rebound hammer test per ASTM C805 [51] was used to obtain the specimen’s non-destructive compressive strength. Table 6 criteria were used to evaluate the quality of concrete by using rebound numbers. In addition, ultrasonic pulse velocity tests at 56 days were carried out following the ASTM C597 standard [52] to evaluate the defects in specimens. Three replicate specimens were tested for each mechanical property, and three replicate measurements were obtained for the relevant fresh-property and non-destructive tests. However, the arithmetic mean of the three measurements was reported as the final result. Table 7 defines structural concrete quality using ultrasonic pulse velocity. A scanning electron microscope (SEM) was employed in accordance with ASTM C1723-16 [53] to assess the microstructural characteristics in concrete specimens.
Table 6.
Rebound number specifications [51].
Table 7.
Velocity criterion for concrete [52].
2.5. Machine Learning Analysis
The machine learning models were trained and tested with Python 3.8.0, a powerful language suitable for data modeling and analysis. Important libraries used include scikit-learn for implementing XG Boost for the XG Boost model. Data processing and numerical computation were performed using Pandas and NumPy, and data visualization was implemented using Matplotlib (version 3.8.0). The models were trained and evaluated on a 10-concrete-mix-designs dataset, and the relative performance metrics R2, RMSE, MAPE and MAE were deployed for evaluation. A desktop personal computer with an Intel i7 processor, 16 GB of RAM, and an NVIDIA GTX 1060 graphics processing unit (GPU) was used to make the previously trained neural networks’ weights available for model training computations.
2.5.1. Data Preprocessing
The dataset was thoroughly cleaned and pre-processed before the models were trained in this study, to ensure the quality and robustness of the data. All missing values were checked, and no empty records were observed in the dataset. Outlier n values were detected through box plots and statistical analysis; n was compared with the uncorrected experimental values; none of the latter were deleted, since all values were physically plausible. Discrepancies (e.g., unit or formatting issues) in the input data were adjusted to ensure consistency across input features. Finally, the dataset was normalized using Min-Max scaling, such that all the input features would fall into the same range, which avoided potential bias by features having larger magnitudes and facilitated the model to accurately learn the features. Figure 2 shows the flowchart of the suggested models. Table 8 shows feature distribution statistics in databases. In this study, the dataset was divided into training and testing subsets using an 80:20 ratio. To minimize potential data leakage associated with repeated measurements of the same mixture at different curing ages, observations corresponding to an identical mixture composition were assigned to the same subset. The training subset was used for model development, while the testing subset was retained for final performance evaluation. This approach was intended to reduce information overlap between the training and testing data and provide a more reliable assessment of model generalization.
Figure 2.
The flowchart of the suggested models.
Table 8.
Feature distribution statistics in databases.
2.5.2. Gradient Boosting Regressor
Researchers like Friedman [54] were the first to use ensemble methods for classification and regression. One of the most common methods is the Gradient Boosting Regressor (GBR). GBR is a good method, but it is similar to other boosting methods. Researchers propose that the implementation of random sampling on the training data can improve the efficiency of GBR and mitigate overfitting by accelerating the learning process. The learning rate (shrinkage factor) and the number of boosting trees (n-trees) are two very important hyperparameters that need to be carefully adjusted to obtain the best results. The learning rate changes for each tree, but the number of trees must stay high enough to maintain the model’s ability to make predictions.
2.5.3. Extreme Gradient Boosting (XGBoost)
Extreme Gradient Boosting (XGB) or XG Boost is an ensemble machine learning technique that uses gradient boosting and decision trees to provide forecasts on disorganized data. Cui et al. [55] developed extreme gradient boosting techniques. These state-of-the-art methods expand upon the conventional tree gradient boosting method. By adding new learners calibrated to the discarded data from the prior generation of learners, this technique seeks to update the current components.
2.5.4. Random Forest (RF)
The Random Forest (RF) model is an ensemble learning algorithm that builds many decision trees and combines their outputs to make better predictions. It averages the outputs of individual trees for regression tasks and uses majority voting for classification tasks. RF works by taking several bootstrap samples from the original dataset (a method called bagging) and training each tree on a random set of features. This randomness makes the trees less correlated, which helps the model not to overfit.
2.5.5. SHAP Analysis
SHAP (SHapley Additive exPlanations), first proposed by Lundberg and Lee [56], is a prevalent technique for elucidating machine learning models. It uses cooperative game theory to give each feature a score that shows how much it helps make predictions. SHAP looks at variable importance and interactions on both a local and a global level. It works especially well with ensemble models like random forests and gradient boosting. Summary and dependence plots are examples of visualization tools that make it even easier to understand.
2.6. Performance Metrics
2.6.1. The Coefficient of Determination (R2)
R2 is a statistical measure that measures the proportion of variation from the mean for a set of values. It is a measure of the ratio of the variance in the dependent variable that is predictable from the independent variables. The R2 value varies between 0 and 1, with a value closer to 1 indicating that a large proportion of the variability in the data is accounted for by the model, i.e., a good fit. Where n is the total number of samples, Y is the standard of the measured values, and Yi is the average of the expected values. The precision of the statistical model for prediction can be measured using the R2 equation.
2.6.2. Root Mean Square Error (RMSE)
RMSE is a commonly used metric to evaluate the accuracy of a prediction relative to the actual value. It is computed by taking the square root of the mean of the squared differences. A lower value for the RMSE suggests that the model’s predictions are closer to the actual values, thus it is better for accurate prediction.
2.6.3. Mean Absolute Percentage Error (MAPE)
The Mean Absolute Percentage Error (MAPE) is a common way to measure how accurate predictions, regression analysis, and machine learning are. It finds the average absolute difference between the predicted and actual values and shows it as a percentage of the actual values. MAPE is easy to understand and compares different datasets because it does not depend on scale.
2.6.4. Mean Absolute Error (MAE)
Using MAE is an easier way to compare two models, as it only measures the size of the errors, regardless of whether the prediction is above or below the truth. It is computed as the average of the absolute differences between the predicted value and the actual value. It gives a very clear and easy-to-understand interpretation of the accuracy of the predictions by the model, and in the units of the original data.
3. Results and Discussion
3.1. Fresh Properties
Concrete workability, which has an impact on performance, is evaluated using the slump test. The slump tests performed on newly mixed concrete are shown in Figure 3. The Figure shows that slump values vary from 115 mm to 130 mm for VPP replacement with RNF and from 170 mm to 195 mm for VPP replacement without RNF. The concrete was quite workable, as evidenced by the control mix slump of 150 mm. On the other hand, workability improved when more VPP was added. The results indicated that after applying VPP at replacement levels of 10%, 15%, and 20%, respectively, the slump value improved by 13, 23, and 30%. The increasing fineness of VPP content may be the reason for the increase in slump. The fineness of the VPP increased lubrication for the aggregates, lowering frictional resistance. Zeyad et al. [14] revealed a similar pattern where slump increased to 11% and 16%, respectively, when 10% and 20% VPP were used in place of cement. RNF, on the other hand, reduces the slump value in all concrete mixes and negatively affects workability. The slump test results indicated that the addition of recycled nylon fiber (RNF) generally reduced concrete workability, with higher fiber content (2% RNF) causing a more pronounced decrease. In contrast, increasing VPP slightly improved slump, with the maximum workability observed at 20% VPP without RNF. When combined, RNF offset the flow-enhancing effect of VPP, showing that higher fiber content limited workability even at elevated VPP levels. The stickiness and cohesion imparted by the recycled nylon fiber could be the causes of this decline in workability. Additionally, the amount of free water may have been reduced, which also contributed. According to Zareei et al. [57], the slump was reduced by up to 30% with just 1% waste carpet fiber (WCF). Prior studies have also observed that adding fibers with SCMs to concrete reduces its slump [58]. However, illustrated in Figure 4 is a regression analysis showing the correlation between the slump value and the yield stress of freshly mixed VPP-RNF concrete. The most effective determination (R2 = 0.731) indicates that the slump value and yield stress of newly mixed concrete are positively correlated with each other. In further analysis of the Figure, yield stress decreases linearly with fresh concrete slump since a high slump indicates low flow resistance. Furthermore, the yield stress of the concrete is significantly increased due to the incorporation of fiber.
Figure 3.
Slump value for different percentages of VPP and RNF.
Figure 4.
Relationships between yield stress and slump values for fresh concrete mixes.
3.2. Mechanical Properties
3.2.1. Compressive Strength of VPP- and RNF-Based Concrete
One of the most crucial aspects of hardened concrete is its compressive strength, which is commonly used as a characteristic material value for concrete categorization. Figure 5 displays the results of the compressive strength test for the mixes at 7, 28, and 56 days. Normalized strength is the strength of each mixture divided by the strength of the control mixture (0M-0%) at the same curing age, so the control mixture has a value of 1. The graphical representation shows that after 7 days, the compressive strength of the 10M-0%, 15M-0%, and 20M-0% mixtures decreased to 2, 4, and 14%, respectively, in comparison to the control mix. However, for the 10M-0% and 15M-0% mixtures, these values rose by 4.2% and 1.8% and by 4.8% and 0.8% at 28 and 56 days, respectively. This is because an early hydration process is not favored by the dilution of cement and other reactant particles brought on by the injection of VPP. Zeyad et al. [58] described how using up to 15% pumice over time improved compressive strength. In contrast, the 20M-0% mix (20% VPP, 0% RNF) demonstrated 11% and 21% poorer compressive strength after 28 and 56 days compared to the control, as shown in Figure 5. This was primarily because VPP diluted the cement, reducing the reactive material for hydration and creating a less dense microstructure. Despite a constant water-to-binder ratio, strength was limited, while RNF inclusion improved all mixes by enhancing crack bridging and stress distribution [59]. All the mixes’ compressive strengths were, however, increased with the addition of RNF. The testing results showed that the addition of 1% of RNF boosted the compressive strength in comparison to other added ratios (2% RNF), which resulted in a lesser rise. After 7, 28, and 56 days, the strength of the 10M-1% and 15M-1% blends grew by 10% and 5%, 17% and 18%, and 7% and 6%, respectively, whereas the strength of the 10M-2% and 15M-2% blends declined. The pores the fibers form weaken the link between the binder particles, aggregates, and any other material in the mix, illustrating how compressive strength decreases as the amount of fiber added to concrete blends increases.
Figure 5.
Compressive and normalized strength variations for the mixes at 7, 28, and 56 days. Normalized strength is the strength of each mixture divided by the strength of the control mixture (0M-0%) at the same age.
Conversely, 20M-1% and 20M-2% showed lower compressive strength than the control mix (up to 10% to 13% and 18% to 21% at 7 to 56 days, respectively). A higher percentage of RNF addition leads to increased porosity and fiber balling, which in turn contributes to the formation of honeycombing in the concrete matrix. The excessive fiber content disrupts the uniform dispersion of the cementitious materials, creating clusters of entangled fibers that hinder proper compaction and reduce matrix densification. Previous studies have shown that excessive fiber inclusion can disrupt the homogeneity of the cementitious matrix, leading to the formation of micro-voids and weak interfacial transition zones (ITZ) between the fibers and the surrounding paste [60]. These voids can act as stress concentrators, reducing the overall load-bearing capacity of the concrete. According to Sun and Xu [61], a comparable course of behavior confirmed that a rise in the fiber percentage enhanced the concrete’s compressive strength. They discovered that concrete made with 0.15–0.45% polypropylene fiber improved its compressive strength by 5–8% at 7 days and 10–13% at 28 days when compared to control concrete. In addition, Zeyad et al. [14] also claimed that the combination of pumice powder and polypropylene fiber showed a similar pattern. In comparison to other mixtures, the combination of 10% VPP and 1% RNF increased compressive strength in this study. The RNF’s ability to stop fracture expansion and slow the rate at which cracks grow is linked to the concrete’s higher compressive strength.
3.2.2. Splitting Tensile Strength of VPP- and RNF-Based Concrete
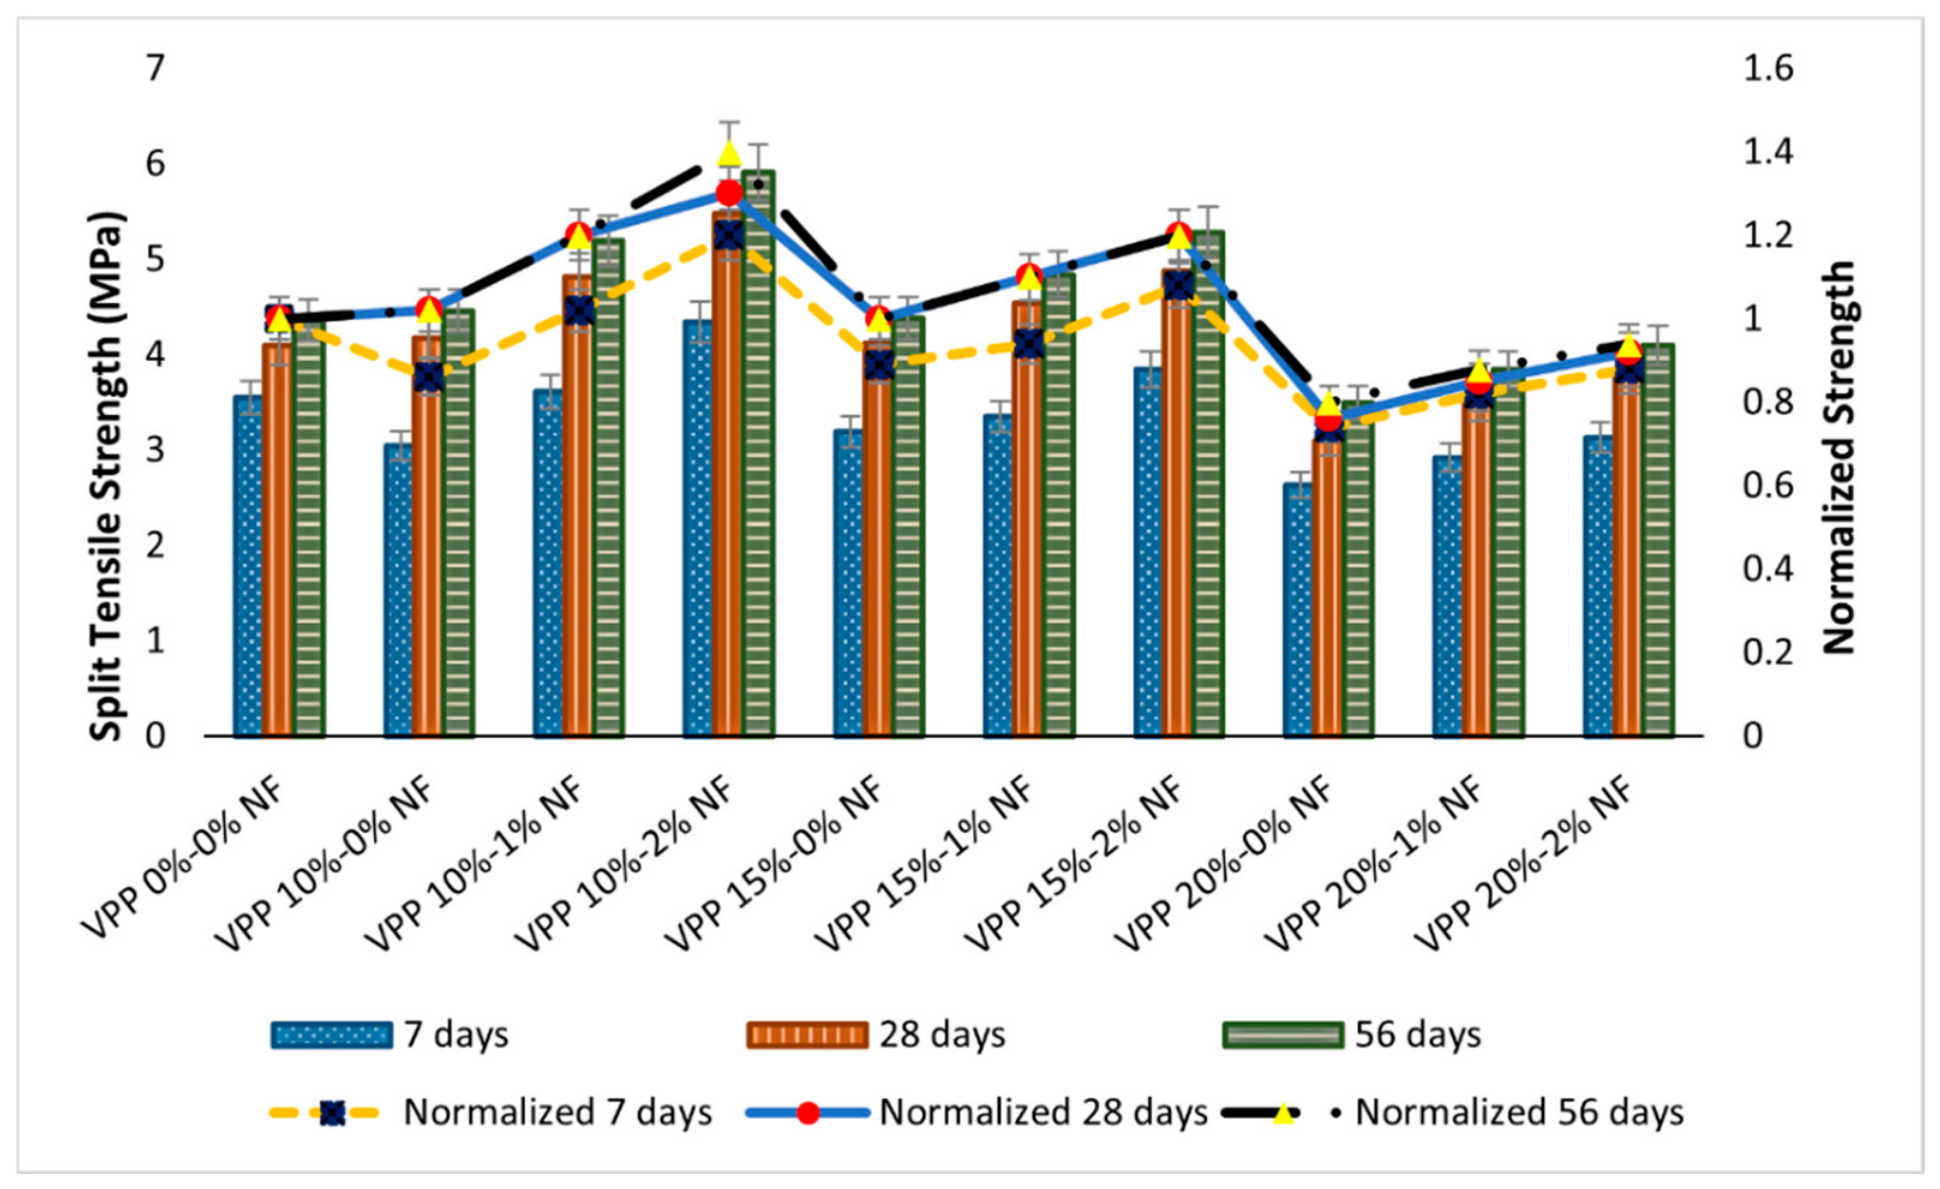
Several samples of various VPP and RNF compositions were tested for indirect tensile strength for curing times of 7, 28, and 56 days; the results are shown in Figure 6. These results were comparable to compressive strength values, apart from RNF inclusion. The collected information supports the findings published by Zeyad et al. [58]. Nevertheless, the results also show that as the proportion of RNF concentration increased, so did the splitting tensile strength. The most strength was obtained when 2% RNF was added to solutions with different VPP concentrations, according to the data. Of all the mixes, 10M-2% had the biggest strength gain, ranging from 22.3% to 35.5% over a period of 7 to 56 days. The 10M-1% mix showed a marginally reduced gain, between 2% and 19%, when compared to the same course with the 10M-2% mix. The pattern was similar for the 15M-1%, 15M-2%, and 20M-1%, 20M-2% combinations. An increase in tensile strength is associated with the addition of RNF to concrete mixtures, which prevented cracks from starting, growing, and spreading. Afroughsabet and Ozbakkaloglu [62] discovered a comparable pattern of tensile strength improvement as fiber content increased. They found that the tensile strength increased by 11–15% after 7 days and by 13–20% after 28 days when compared to the control mixture, which contained 0.15–0.45 percent polypropylene fiber. Another researcher, Abdullah et al. [63], stated that the splitting tensile strength of concrete increased by 19.38% when steel fiber and volcanic pumice powder were added.
Figure 6.
Splitting tensile and normalized strength variations for the mixes at 7, 28, and 56 days.
3.2.3. Flexural Strength of VPP- and RNF-Based Concrete
The flexural strength results at 28 and 56 days are shown in Figure 7. According to an analysis of the data, the strength increased by around 2% after 56 days, while it decreased by 4.2% with the 10M-0% combination. Prolonged time was required for the pozzolanic components in VPP to react with Ca(OH)2 [14]. However, the 15M-0% mix showed a small decline of up to 6% at 28 and 56 days. The 20M-0% mix, on the other hand, showed a notable decline of up to 19% throughout the same time frame. This could be explained by the fact that it is referred to as compressive strength. One possible explanation is the increased porosity of VPP, which weakens the connections between particles. Nevertheless, the strength was enhanced by the addition of RNF. Critical examination of the graph reveals that 2% RNF enhanced strength by 34.4% for both 28 and 56 days, reaching its maximum strength with 10% VPP replacement in cement. Comparable trends of growing flexural strength as polypropylene fiber content increased were observed by Ananthi and Karthikeyan [59].
Figure 7.
Flexural and normalized strength variations for the mixes at 28 and 56 days.
The mechanical performance trends revealed that the improvement accomplished through VPP and RNF addition is dependent not on the universal but on the composition. Specifically, the increased strength level was noticed at the optimal 10% VPP with 1% RNF, enabled by a more favorable pozzolanic reactivity, efficient secondary C–S–H gel, and effective bridging of cracks with uniformly distributed fibers. The creation of a tighter microstructure and better fiber–matrix interlock at the specified doses contributed to higher compressive, tensile, and flexural strength. In contrast, at greater VPP content of ≥20% and RNF consumption of ≥2%, the blend revealed minor force reduction against the materiality. High VPP content produces sharper strength decreases due to cementitious content dilution and a lack of reactive silica in the early phase, which limits the binder phase. The high fiber content may result in fiber sticking and poor local zones in the reduced section, reducing load transfer efficacy. These results were in harmony with the optimal pozzolan and fiber content levels, resulting in fewer returns or protruding performances. All in all, they demonstrate that the VPP + RNF system takes advantage of performance opportunities at certain dose limits while stressing the need for mix creation to optimization of pozzolanic activity, binder compaction, and fiber dispersal.
3.3. Qualitative Assessment of Concrete
3.3.1. Digital Rebound Hammer Test of VPP- and RNF-Based Concrete
Digital rebound hammer test results for varying percentages of VPP and RNF are presented in Figure 8. Based on outcomes, the RI of the 10M-0% mix increased slightly by 0.4%, while for 15M-0% and 20M-0% mixes, it declined by 0.2% and 13.6%, respectively. With the addition of 1% RNF, this RI increased, while for 2% RNF, it contrarily decreased. It reveals that 10% VPP and 1% RNF addition reduces the pore space, which leads to an increase in strength. Conversely, the higher replacement (20% VPP) and 2% RNF addition produce weak bonding between mortar and aggregate and higher porosity, leading to a decrease in strength (Chakrawarthi et al. [64]).
Figure 8.
Rebound and normalized rebound number variations for the mixes at 56 days.
3.3.2. Ultrasonic Pulse Velocity (UPV) of VPP- and RNF-Based Concrete
The ultrasonic pulse velocity (UPV) is a non-destructive measure used to assess the consistency and durability of concrete as well as to detect flaws like pores and cracks. Figure 9 demonstrates the range of UPV values for concretes with VPP and RNF. However, following Malhotra [65] concrete quality assessment, it is observed that 0% to 15% VPP replacement with 1% RNF created excellent-quality concrete, as the UPV value exceeded 4.5 km/s, whereas the other mixture’s quality was identified as good although the nylon fiber affected the UPV test slightly. According to the figure, concrete compositions with 10% and 15% VPP increased UPV by 4.6% and 1.4%, respectively, whereas 20% VPP lowered the value by 10.5% when compared with the control mix. The pozzolanic reactivity of VPP is responsible for the densification of the pore system, which led to the improvement. In addition, previous research has demonstrated that pozzolanic materials, such as palm oil fuel ash and recycled ceramic powder, can improve the pore structure of concrete by adding C-S-H gel to the pores as a result of pozzolanic reactivity (Shahbazpanahi and Faraj [66]). Furthermore, the incorporation of RNF increased the UPV values. The results for 1% RNF in concrete with 10% and 15% VPP, respectively, increased by 7% and 6%. Inversely, these levels dropped to 3% and 7% with increased fiber content (2% RNF). The results of a study that Awal and Mohammadhosseini [67] carried out using waste carpet fiber revealed an increased UPV for 0.25% and 0.5% fiber content but a decreased value for 0.75% to 1.25% fiber content. They reported the homogeneity of the concrete specimens is diminished at greater fiber volume fractions due to the presence of voids and micro-cracks. The UPV results corroborated the compression test outcomes, which showed that the 10M-1% mix had the highest compressive strength.
Figure 9.
UPV and normalized values for concrete mixes at 56 days.
3.4. Microstructural Analysis
3.4.1. Scanning Electron Microscopy (Sem) of VPP- and RNF-Based Concrete
Scanning electron microscopy (SEM) analysis of OPC and VPP concrete mixtures with and without RNF after 28 days of curing revealed obvious morphological changes, as illustrated in Figure 10. Figure 10a depicts the surface attributes of the control mix. This figure demonstrates that the reference specimen’s surface had more voids and wider cracks. On the other hand, replacement of cement with 10% VPP demonstrated the uniform dispersion of C-S-H gel. After incorporating VPP, the responsive silica (SiO2) of VPP interacts with the released CH during the hydration process, forming further C-S-H gels that make concrete denser and give it increased compressive strength. Consequently, the exchange of 10% of the cement with VPP resulted in an improvement in the microstructure of the sample. This improvement was attributable to the small particle size, porous structure, and increased pozzolanic reactivity of the VPP. Selected images were used for qualitative assessment of the local microstructural features of the investigated mixtures. As the images were acquired at different magnifications, their scales are not consistent across all mixtures, limiting direct comparison of feature dimensions. Therefore, the SEM observations were interpreted qualitatively and in conjunction with the mechanical test results. Awal and Mohammadhosseini [67] investigated the microstructure of a concrete matrix with natural pozzolanic material labeled palm oil fuel ash (POFA) through a pozzolanic reaction and observe the same outcome. However, Figure 10c exhibits the even distribution of nylon fibers and the bonding effect of the fibers with concrete mixtures. As seen in the figure, a reduced crack size at the interface was achieved due to the strong interfacial bonding produced by the fibers. Reducing crack growth and increasing strength is attributed to the fibers’ bridging effect, partially transferring stress across cracks [68].
Figure 10.
SEM micrographs of the mixture (a) 0M-0% (b) 10M-0% (c) 10M-1%.
3.4.2. Sustainability Analysis
According to research, cement manufacturing and processing account for almost 8% of the total CO2 emissions from the concrete industry [69]. Regarding the manufacture and delivery of the materials under study, the following equation (Equation (7)) has been developed to compute the total greenhouse gas emissions (GHGtotal in kgCO2/ton) [70].
GHGtotal = GHGraw + GHGsub
Here, GHGraw (kgCO2/ton) stands for the greenhouse gases generated by the raw substances and is evaluated using the following equation (Equation (8)).
With the use of the subsequent equation (Equation (9)), the greenhouse gases discharged by substituting materials can be estimated as GHGsub (kgCO2/ton).
Here, Pk is the relationship involving the unprocessed substance k and the overall weight of the material (kg/kg), n indicates the entire distinctive material used (in the control specimen), m whole replacing raw components, and f demonstrates the phases of the life cycle (CV) that are going to be examined. Rk is the raw material k’s replacement ratio (when it is replaced) or addition ratio (where it is added). θfk is the raw material k’s CO2 generation ratio in the f stage of the life cycle (kgCO2/ton), where θpk is the volume of emissions related to the raw material k’s production phase, and θtk is the volume of emissions related to the raw material k’s transport, which is measured with the following equation (Equation (10)):
where dk is the raw material’s travel distance in kilometers, and G is the emissions produced by moving a ton of cargo every kilometer (kgCO2/(ton-km)). According to the previously described approach, the parameters and findings for CO2 emitted (in kgCO2 per ton of specimen) and the absorbed energy for the analyzed specimens are shown in Table 9. The “Inventory of Carbon and Energy” [71] was used to determine the factors related to cement. The energy used in the sorting operation and the accompanying emissions for the volcanic powder were estimated according to Letelier et al. [70]. The UK government’s database for Conversion Factors for Greenhouse Gases was used to determine the emissions produced when shipping fresh materials. The system boundary covered the production of cement and VPP and their transport to the concrete plant over a distance of 100 km. The emission factors adopted for production were 830 kgCO2/ton for cement and 6 kgCO2/ton for VPP, and the transport factor was 0.44 kgCO2/(ton·km), as listed in Table 9. The processing of VPP was included through its production emission factor, estimated following Letelier et al. [64]. Silica fume, aggregates, water, and superplasticizer were the same in all mixtures, and recycled nylon fibers were not included in this calculation, so the reported reductions reflect the replacement of cement with VPP only. The sustainability of the materials employed (volcanic powder) in comparison to the original ones (cement) was then evaluated using the SUB-RAW Index [72] (Equation (11)).
where EEraw reflects the concentrated energy of the cement (replaced material) (MJ/kg), and EEsub represents the inherent energy of the substitute substance (MJ/kg). The more positive the number for this index, which ranges from negative 9 to positive 9, the better the overall durability of the studied substance.
Table 9.
Factors used to calculate greenhouse gas (GHG) emissions.
Table 10 compares cradle-to-gate CO2 per ton of concrete for the control mix with that of the VPP replacement mixes. Because VPP has a low emission factor compared with cement, production CO2 decreases with increasing VPP (10 → 20%), while transport CO2 remains unchanged (same binder mass and 100 km distance). Total emissions drop from 213.26 kgCO2/ton (control) to 173.05 kgCO2/ton (20% VPP), ~19% lower: tanking the high-carbon cement in exchange for low-GWP VPP, under the assumptions provided.
Table 10.
CO2 totals for control and VPP mixes (boundary: gate-to-plant; material factors from ICE v3.0; transport factor from DEFRA; distance = 100 km; binder mass fraction Pk = 0.244).
Cement’s CO2 emissions were over 138 times greater than VPP’s when compared using the same set of equations. In addition, according to the calculations, 20% VPP only produced 0.3 kg CO2 per ton, whereas 20% OPC generated 40.5 kg CO2 per ton, which indicates that the substitution of OPC with VPP has considerable effects on the environment. However, variations in GHG emissions are shown in Figure 11, corresponding to varied mixture compositions of VPP. According to the graphical representation, for every 1% cement replacement with VPP, CO2 emissions were reduced by 0.93% as opposed to the control specimen. As a direct outcome of this, the greatest reduction in emissions (19.9%) was achieved when OPC was replaced at a rate of 20% with VPP. Similarly, according to Equation (11), the obtained SUB-RAWIndex was 2.58, meaning the carbon footprint of VPP is approximately two orders of magnitude lower than that of cement. Letelier et al. [70] tested substituting cement with 10% and 20% volcanic power to create a more environmentally friendly mortar. They claimed an almost 21% CO2 emission reduction, which is consistent with the findings of this study. Figure 11 shows GHG emissions for different mixture compositions of VPP.
Figure 11.
GHG emissions for different mixture compositions of VPP.
4. Correlation Between Analytical Prediction and Mechanical Properties
4.1. Relation Between DT Versus DT
4.1.1. Splitting Tensile Strength Versus Compressive Strength
Figure 12 shows the correlations between the splitting tensile strength and compressive strength test results for 7, 28, and 56 days, which are calculated analytically using various standard codes. To calculate the splitting tensile strength from the compressive strength, ACI 318 [73], ACI 363 [74], CEB-FIP [75], AS 3600 [76], EHE [77], GB 50010 [78], and NBR 6118 [79] recommend utilizing the following equations (Equations (12)–(18)):
where, f′c = cylindrical compressive strength (MPa) and fsp = splitting tensile strength (MPa).
Fsp = 0.59f′c0.5
Fsp = 0.56f′c0.5
Fsp = 0.3f′c2/3
Fsp = 0.4f′c0.5
Fsp = 0.21f′c2/3
Fsp = 0.19f′c0.75
Fsp = 0.3f′c2/3
Figure 12.
Correlation between compressive strength and splitting tensile strength of concrete.
As can be shown, concrete mixes’ tensile strength improves noticeably when compressive strength improves, and these improvements hold steady throughout the inquiry. However, the highest estimate deviation from the forecast and the confidence intervals are shown for AS 3600 and EHE. On the other hand, ACI 363R-92 covered a large percentage of the prediction zone and exhibited outstanding estimation when compared to other codes or standards. Notably, the results of the current study closely match those predicted by CEB-FIP and NBR equations. Overall, based on the R2 (0.7613) value, it can be concluded that there is a reasonably strong relationship between the splitting and compressive strength, considering most of the variance. Figure 12 shows the correlation between compressive strength and splitting tensile strength of concrete.
4.1.2. Flexural Strength Versus Compressive Strength
Figure 13 presents a visual representation of the analytical prediction’s association with the experimental findings about the compressive and flexural strengths of the concrete mixture. Based on its compressive strength, equations of various specifications can be used to determine the flexural strength of concrete. Here, the flexural strength of concrete was projected from its compressive strength using several formulas, each displayed below, following ACI 363R [73], ACI 318 [74], CEB-FIP [75], and AS 3600 [76] (Equations (19)–(22)).
where fr shows flexural strength (MPa), and f′c denotes compressive strength (MPa).
fr = 0.62√f′c
fr = 0.94√f′c
fr = 0.6√f′c
Figure 13.
Correlation between compressive strength and flexural strength of concrete.
The correlation plot shows that, among all other codes of standardized equations, ACI 363R was revealed as being the best predictor of flexural strength. Comparable forecasts for the splitting tensile and compressive strength scenarios were discovered, and the AS 3600 result diverges the most from the experimental flexural strength data. All codes generated lower forecasts than the experimental results of this study, except for ACI 363R and CEB-FIP, respectively. It is also clear that all the rules and guidelines used in this investigation are covered within the lower confidence interval. This investigation demonstrated a substantial correlation between compressive and flexural strengths (R2 = 0.7351), demonstrating the relatively strong consistency of the hypothesized correlations. The suggested linear regression model produced better results in comparison to these best practices. Considering this, it may be said that the concrete performs better in flexure than in compression.
4.2. Relation Between DT Versus NDT
4.2.1. Compressive Strength Versus Rebound Number
This research also presents a simplified, single-factor regression formula for estimating the compressive strength of concrete. Although the formula relies on insights derived from a comprehensive analysis of multiple regression models, it allows for straightforward calculation using only one key variable. The comparison of concrete’s compressive strength and rebound number is depicted in Figure 14. The following equation (Equation (23)) is used to depict the straight line that best fits the red line in Figure 14.
f′c = l.09RN − 4.97
Figure 14.
Correlation between rebound number and compressive strength, including previous studies [80,81,82,83].
The coefficient of regression (R2) value is 0.9446, which shows that the results are reliable and have little variability. The other plot points were discovered by various rebound numbers (RNs) and f′c research by Qasrawi [83], Kheder [80], Domingo and Hirose [81], and De Almeida [82]. These points provide a reference to evaluate the consistency of the current findings, showing that most prior data converge closely with the current regression, while minor deviations highlight differences in mix design or testing conditions.
4.2.2. Compressive Strength Versus UPV
The plot of UPV and compressive strength for several studied concrete blends is illustrated in Figure 15. An exponential correlation (Equation (24)) between UPV and compressive strength was obtained.
f′c = 0.015 × UPV − 30.263
Figure 15.
Correlation between UPV and compressive strength, including other previous studies [80,81,83,84].
The UPV measurement, whose significance has already been established, also exhibits a significant correlation with compressive strength (R2 = 0.9283), allowing for a good estimation of the strength values. Moreover, due to different concrete mixes, Qasrawi [83] and Yoo and Ryu [84] show divergence from the 95% confidence band area. They observed that the characteristics of all mixes are very dependable in assessing the concrete’s compressive strength by using the measurement of ultrasonic pulse velocity. However, neither the exponential nor the polynomial models fully capture the behavior across all mix types, due to limitations such as plateauing in the exponential model and inflection points in the polynomial model.
4.3. Machine Learning Models
4.3.1. Distribution of Concrete Mix Components and Compressive Strength
Figure 16 shows that several factors have a clear effect on predicting compressive strength (CS). The higher the cement content, the stronger the material becomes. SCMs have a bimodal distribution, which means that the effects are different depending on whether the mixes use low or high amounts. Water content, which is very close to 160 kg/m3, is very important for balancing workability and strength. Small changes can have a big effect on CS. Superplasticizer is important because even small changes make hydration more effective and stronger. Curing age, which peaks at 28 and 90 days, is a major factor in results because it shows standard strength development milestones. RNF and VPP show more variation but are used less overall. They work more as secondary enhancers than as main strength drivers. In this dataset, the most important factors that affect compressive strength are cement, SCMs, water, and curing age.
Figure 16.
Histograms that show the density of parameters across the dataset for (a) Cement, (b) SCMs, (c) Fine aggregate, (d) Coarse aggregate, (e) Water, (f) Superplasticizer, (g) VPP, (h) RNF, (i) Curing age and (j) Compressive strength.
4.3.2. Pearson Correlation of Input and Output Features
Figure 17 shows how different mix components are related to compressive strength (CS). Cement has a moderate positive correlation with SCMs (0.52), FA (0.35), and CS (0.44), which means that more cement usually makes things stronger. SCMs (supplementary cementitious materials) have a strong link to CS (0.61), which means they are a big part of compressive strength. On the other hand, SCMs have a negative correlation with CA (−0.44) and Water (−0.34), which means that using more SCMs tends to lower the need for coarse aggregate and water. FA has weaker correlations overall, but it does have a positive correlation with CS (0.23). CA (coarse aggregate) has small negative correlations with SCMs (−0.44) and CS (−0.11), which means that too much aggregate may make things weaker. SP (Superplasticizer) has a weak positive correlation with CS (−0.11), and VPP and RNF have very weak relationships with most features. Age has a positive correlation with CS (0.48), which shows that the compressive strength becomes stronger as the curing time progresses. The most positive effects on CS are from SCMs (0.61), cement (0.44), and age (0.48). The most negative effects are from CA (−0.11) and water (−0.11).
Figure 17.
Pearson’s correlation matrix.
4.3.3. Comparison of ML Models for CS Prediction
Figure 18 shows scatter plots of the predicted compressive strength (CS) versus the observed compressive strength for three machine learning models. The GBR model had a coefficient of determination of R2 0.960 for training data and 0.924 for test data. This means that it was very good at making predictions, but it did not work as well for other datasets. The RF model had the best training accuracy, with an R2 value of 0.985. However, the test accuracy dropped to 0.909, which showed that the model was too accurate. The XGB model, on the other hand, had the best training fit with R2 0.997, but its test performance dropped more sharply to 0.868, showing that it was more likely to overfit than GBR and RF. When looking at all three, GBR has the most balanced performance. It has a high level of accuracy on both training and test datasets. RF and XGB, on the other hand, are better on training sets but do not work as well on data that have not been seen before. In this study, the XGBoost model exhibited a larger training–testing performance gap, indicating a greater tendency to overfit the limited dataset by capturing training-specific patterns that may not generalize well to unseen data. In contrast, GBR showed a smaller performance gap and lower testing errors, demonstrating more consistent predictive performance for the present dataset. Wang et al. [85] conducted a comparable study that evaluated Random Forest, Gradient Boosting, and XG-Boost for predicting concrete strength. Their scatter plots showed that XG-Boost had R2 values of 0.982 (train) and 0.966 (test), which were somewhat higher than those of RF and GBR.
Figure 18.
Scatter plot for predicted compressive strength vs observed compressive strength for (a) GBR, (b) RF and (c) XGB model.
4.3.4. Comparison Among Performance Metrics
Figure 19 compares GBR, RF, and XGB models using four evaluation metrics (MAE, MAPE, R2, and RMSE) for both training and testing datasets. For MAE, GBR achieved the lowest test error (about 6.75 MPa), followed by RF (about 7.08 MPa), while XGB performed the worst (about 7.90 MPa). In MAPE, GBR again showed the smallest error (approximately 11.24%), while RF (approximately 11.66%) and XGB (approximately 12.77%) were less accurate. For R2, all models performed well in training (R2 close to 0.96–0.99), but testing revealed clearer differences: GBR retained high accuracy (about 0.924), RF was slightly lower (about 0.909), and XGB dropped more sharply (about 0.868). In terms of RMSE, GBR had the lowest test error (about 9.10 MPa), compared to RF (about 10.17 MPa) and XGB (about 10.56 MPa). Overall, GBR emerges as the best model, as it balances high predictive accuracy (R2) with the lowest errors across MAE, MAPE, and RMSE, demonstrating strong generalization to unseen data. RF performs competitively but tends to overfit slightly, while XGB, despite excelling on training data, suffers from the largest performance gap in testing, indicating weaker generalization. Table 11 shows the results for performance metrics.
Figure 19.
A radar chart that compares the four models based on (a) MAE, (b) MAPE, (c) R2, and (d) RMSE for both training and testing datasets.
Table 11.
Results for performance metrics.
4.3.5. SHAP Feature Importance Ranking for Predicting Compressive Strength
Figure 20 shows the SHAP feature importance ranking for predicting compressive strength (CS). Supplementary cementitious materials (SCMs) had the biggest effect on strength development, with a mean SHAP value of 21.31. Curing age (17.19) and cement content (9.3) were next, showing that they are also important. VPP (5.02) and coarse aggregate (4.87) made moderate contributions, while superplasticizer (1.11) and RNF (1.04) made smaller ones. Fine aggregate (0.35) and water (0.07) had little effect, which means this dataset does not have much predictive value. These results show that the chemistry of the mix (SCMs and cement) and the time it takes to cure have a bigger effect on strength prediction than the proportions of the aggregates. Wang et al. [86] reported similar results, showing through SHAP analysis that SCMs and curing age are the most important factors in predicting concrete strength. Similarly, a recent study on high-performance concrete by Li et al. [87] demonstrated that cement and curing conditions were the most significant predictors across various ML models, thereby confirming the consistency of these findings across different concrete types.
Figure 20.
Contribution of input variables to compressive strength prediction based on mean SHAP values.
4.3.6. SHAP Summary Plot
Figure 21 shows the SHAP summary analysis for predicting compressive strength (CS). SHAP values show how important each input variable is in relation to the others. The model output was most affected by supplementary cementitious materials (SCMs), which had SHAP values as high as +43.18. This shows that they play a big role in developing strength over time. The second most important factor was curing age, with SHAP contributions of about +35. This shows that longer hydration periods always lead to higher CS. Cement content was the third most important factor, with SHAP values around +20, which shows that it is the main binding material. VPP (~+12) and coarse aggregate (~+10) had a moderate effect, while superplasticizer (~+5) and RNF (~+5) had a smaller but still noticeable effect. Fine aggregate (~+2) and water (~+1) had very little effect on predictions, which means that their influence was not very different. SCMs, curing age, and cement were the most important factors that affected CS prediction. The other variables had little or no effect. These results are in line with what other studies have found. Khan et al. [88] utilized SHAP on concrete datasets, identifying SCMs and curing age as the primary determinants for strength prediction, followed by cement and aggregate proportions.
Figure 21.
Feature-level SHAP analysis.
Figure 22 shows a SHAP dependence plot for the prediction of compressive strength (CS). It shows how different input variables affect the output of the model. The horizontal spread of SHAP values shows how much influence there is, and the color bar shows feature values (blue = low, red = high). Supplementary cementitious materials (SCMs) have the most positive effect. When the SCM content is higher, the SHAP values go up to +40, which greatly raises the predicted CS. Curing age is the next most important factor, and longer ages are better (SHAP up to +25), which shows how important hydration time is. The amount of cement also has a big effect, with higher amounts pushing SHAP contributions up to +20. VPP and coarse aggregate have a moderate effect (about +10), while superplasticizer and RNF have a smaller effect (about ±5). Fine aggregate and water stay close to zero, which means they do not have much of an effect on the prediction. These results corroborate prior research. Uddin and Hossain [89] showed that SCMs and curing age were the main factors that affected strength in their SHAP-based analysis of concrete mixes.
Figure 22.
Feature-level SHAP visualization highlights positive and negative contributions of concrete mix components to model output.
5. Conclusions
An in-depth investigation of the experiments in this study may lead to useful findings:
- These findings pave the way for utilizing VPP and RNF to fabricate highly workable concrete. Samples of concrete that used VPP had a higher slump, perhaps because the surface was smoother and less water was absorbed. Contrarily, the slump value indicated a lessening of workability as RNF was added. This is likely due to the greater water absorption capacity of the recycled fiber from the concrete solution.
- For mechanical properties, the early-age compressive strength of VPP-containing mixes was slightly lower than that of the control due to slower pozzolanic reactivity. However, strength increased over time, and the inclusion of 1% RNF led to a noticeable improvement. The combination of 10% VPP and 1% RNF achieved the highest compressive strength, which was approximately 17% higher than that of the control at 56 days.
- Splitting and flexural strengths were optimized with 10% VPP and 2% RNF. While 1% fiber improved both strengths, 2% RNF resulted in a further increase of 11.92% in splitting strength and 4.62% in flexural strength compared to 1% fiber mixes at 56 days. This enhancement is attributed to fiber-bridging effects and their distribution within the matrix.
- The 10M-1% mix exhibited improved non-destructive test results, with UPV increasing by 7% and rebound number by 7.36% relative to the control. The densification of pores due to VPP and fiber bridging contributed to this enhancement.
- According to SEM assessment, the microstructure of the specimens was improved when up to 10% of the cement was replaced with VPP containing 1% fiber inclusion. C–S–H was identified to be more evenly distributed in the VPP matrix than in the control specimen. In addition, C-S-H gels encased the fibers securely, forming a sturdy connection.
- From a sustainability point of view, the suggested substance VPP has the potential to lessen or eliminate the negative impact on the environment. Total GHG emissions were shown to be reduced by as much as 9%, 14%, and 19% when OPC was replaced with VPP at 10%, 15%, and 20%.
- According to the prediction findings, the GBR model outperformed RF and XGBoost in predicting compressive strength. However, all three models can be employed as alternatives for predicting the strength of concrete, even though the GBR model demonstrated greater dependability than the RF and XGBoost models on several statistical criteria.
Based on the conclusions and observations of this current research, it appears that the engineering qualities of concrete composites manufactured from volcanic pumice powder and recycled nylon fiber are suitable for their usage in building applications. Nonetheless, this work is confined to laboratory scale. This research had different constraints. This study used small sample numbers and investigated different curing ages but did not address the durability performance under prolonged curing times with toughness conditions such as freeze–thaw durability, sulfate impact, and long-term shrinkage or surface testing. Future studies should examine the long-term durability using various environmental durability criteria and conduct long-term field assessments to obtain further confirmation of efficiency and promote widespread adoption. Ensemble ML-based models can also be a viable, sustainable option, allowing the prediction of novel concrete properties like those of self-compacting concrete, high-strength lightweight concrete, and high-performance concrete.
Author Contributions
M.H.R.S.: Conceptualization, Validation, Methodology, Formal analysis, Writing—original draft, Writing—review and editing. M.T.H.K.: Conceptualization, Methodology, Validation, Supervision, Writing—original draft, Writing—review and editing. J.A.J.: Conceptualization, Methodology, Formal analysis, Investigation, Writing—original draft, Writing—review and editing. M.H.I.: Methodology, Investigation, Writing—original draft, Writing—review and editing. M.K.I.K.: Formal analysis, Writing—review and editing. M.A.K.M.: Data curation, Investigation, Writing—review and editing. M.A.: Data curation, Investigation, Writing—review and editing. B.G.: Data curation, Funding acquisition, Writing—review and editing. All authors have read and agreed to the published version of the manuscript.
Funding
This research work was funded by Umm Al-Qura University, Saudi Arabia, under grant number: 26UQU4350294GSSR09.
Data Availability Statement
Data will be provided upon request.
Acknowledgments
The authors extend their appreciation to Umm Al-Qura University, Saudi Arabia, for funding this research work through grant number: 26UQU4350294GSSR09.
Conflicts of Interest
The authors declare no conflicts of interest.
References
- Meyer, C. The greening of the concrete industry. Cem. Concr. Compos. 2009, 31, 601–605. [Google Scholar] [CrossRef] [Scilit]
- Al-Ajmai, F.F.; Al-Otaibi, F.A.; Aldaihani, H.M. Effect of type of ground cover on the ground cooling potential for buildings in extreme desert climate. Jordan J. Civ. Eng. 2018, 12, 534–546. [Google Scholar]
- Yang, G.; Cao, Q.; Zhao, H.; He, J.; Teng, L.; Hu, Z.; Li, W.; Wan-Wendner, R.; Liu, J. New insights into linear-nonlinear tensile creep mechanisms of UHPC: Stress level-dependent creep-active site transitions. Cem. Concr. Res. 2025, 198, 107988. [Google Scholar] [CrossRef] [Scilit]
- Alahmari, T.S.; Kabbo, M.K.I.; Sobuz, M.H.R.; Rahman, S.M.A. Experimental assessment and hybrid machine learning-based feature importance analysis with the optimization of compressive strength of waste glass powder-modified concrete. Mater. Today Commun. 2025, 44, 112081. [Google Scholar] [CrossRef] [Scilit]
- Wang, X.; Li, B.; Wu, F.; Gu, K.; Tan, Y.; Zhou, X.; He, H.; Zhang, Y. Enhancing Interlayer Properties and Sustainability of 3D-Printed UHPC with Antimony Tailings. Buildings 2026, 16, 53. [Google Scholar] [CrossRef] [Scilit]
- Harle, S.; Meghe, R. Glass Fiber Reinforced Concrete & Its Properties. Int. J. Eng. Sci. Res. Technol. 2014, 3, 118–120. [Google Scholar] [CrossRef] [Scilit]
- Nath, P.; Sarker, P. Effect of Fly Ash on the Durability Properties of High Strength Concrete. Procedia Eng. 2011, 14, 1149–1156. [Google Scholar] [CrossRef] [Scilit]
- Bagheri, A.R.; Zanganeh, H.; Moalemi, M.M. Mechanical and durability properties of ternary concretes containing silica fume and low reactivity blast furnace slag. Cem. Concr. Compos. 2012, 34, 663–670. [Google Scholar] [CrossRef] [Scilit]
- Santhosh, K.G.; Subhani, S.M.; Bahurudeen, A. Recycling of palm oil fuel ash and rice husk ash in the cleaner production of concrete. J. Clean. Prod. 2022, 354, 131736. [Google Scholar] [CrossRef] [Scilit]
- Chowdhurya, J.A.; Islama, M.S.; Islama, M.A.; Al Bari, M.A.; Debnatha, A.K. Analysis of mechanical properties of fly ash and boiler slag integrated geopolymer composites. Sustain. Struct. 2025, 5, 000073. [Google Scholar] [CrossRef] [Scilit]
- Sathiparan, N.; Subramaniam, D.N. Optimizing fly ash and rice husk ash as cement replacements on the mechanical characteristics of pervious concrete. Sustain. Struct. 2025, 5, 000065. [Google Scholar] [CrossRef] [Scilit]
- Tan, Y.Y.; Awang, H.; Kaus, N.H.M. Integration of fly ash and ground granulated blast furnace slag into palm oil fuel ash based geopolymer concrete: A review. Sustain. Struct. 2024, 4, 000050. [Google Scholar] [CrossRef] [Scilit]
- Jackson, N.; Dhir, R.K. Structural Engineering Materials; CRC Press: Boca Raton, FL, USA, 1989. [Google Scholar]
- Zeyad, A.M.; Tayeh, B.A.; Yusuf, M.O. Strength and transport characteristics of volcanic pumice powder based high strength concrete. Constr. Build. Mater. 2019, 216, 314–324. [Google Scholar] [CrossRef] [Scilit]
- Rosales, J.; Rosales, M.; Díaz-López, J.L.; Agrela, F.; Cabrera, M. Effect of processed volcanic ash as active mineral addition for cement manufacture. Materials 2022, 15, 6305. [Google Scholar] [CrossRef] [Scilit] [PubMed]
- Lee, G.; Han, D.; Han, M.-C.; Han, C.-G.; Son, H.-J. Combining polypropylene and nylon fibers to optimize fiber addition for spalling protection of high-strength concrete. Constr. Build. Mater. 2012, 34, 313–320. [Google Scholar] [CrossRef] [Scilit]
- Ali, B.; Fahad, M.; Mohammed, A.S.; Ahmed, H.; Elhag, A.B.; Azab, M. Improving the performance of recycled aggregate concrete using nylon waste fibers. Case Stud. Constr. Mater. 2022, 17, e01468. [Google Scholar] [CrossRef] [Scilit]
- Huang, H.; Yuan, Y.; Zhang, W.; Zhu, L. Property assessment of high-performance concrete containing three types of fibers. Int. J. Concr. Struct. Mater. 2021, 15, 39. [Google Scholar] [CrossRef] [Scilit]
- Laville, S. Dumped fishing gear is biggest plastic polluter in ocean, finds report. Guardian 2019, 6. [Google Scholar]
- Habib, A.; Begum, R.; Alam, M.M. Mechanical properties of synthetic fibers reinforced mortars. Int. J. Sci. Eng. Res. 2013, 4, 923–927. [Google Scholar]
- Mishra, M.; Das, D.; Laurinavicius, A.; Laurinavicius, A.; Chang, B.H. Sectorial Analysis of Foreign Direct Investment and Trade Openness on Carbon Emissions: A Threshold Regression Approach. J. Int. Commer. Econ. Policy 2025, 16, 2550003. [Google Scholar] [CrossRef] [Scilit]
- Spadea, S.; Farina, I.; Carrafiello, A.; Fraternali, F. Recycled nylon fibers as cement mortar reinforcement. Constr. Build. Mater. 2015, 80, 200–209. [Google Scholar] [CrossRef] [Scilit]
- Orasutthikul, S.; Unno, D.; Yokota, H. Effectiveness of recycled nylon fiber from waste fishing net with respect to fiber reinforced mortar. Constr. Build. Mater. 2017, 146, 594–602. [Google Scholar] [CrossRef] [Scilit]
- Niu, Y.; Wang, W.; Su, Y.; Jia, F.; Long, X. Plastic damage prediction of concrete under compression based on deep learning. Acta Mech. 2024, 235, 255–266. [Google Scholar] [CrossRef] [Scilit]
- Mishra, M. Quantifying compressive strength in limestone powder incorporated concrete with incorporating various machine learning algorithms with SHAP analysis. Asian J. Civ. Eng. 2024, 26, 731–746. [Google Scholar] [CrossRef] [Scilit]
- Long, X.; Mao, M.-h.; Su, T.-x.; Su, Y.-t.; Tian, M.-k. Machine learning method to predict dynamic compressive response of concrete-like material at high strain rates. Def. Technol. 2023, 23, 100–111. [Google Scholar] [CrossRef] [Scilit]
- Zhang, W.; Yang, X.; Lin, J.; Lin, B.; Huang, Y. Experimental and numerical study on the torsional behavior of rectangular hollow reinforced concrete columns strengthened By CFRP. Structures 2024, 70, 107690. [Google Scholar] [CrossRef] [Scilit]
- Sun, L.; Wang, X.; Zhang, C. Three-dimensional high fidelity mesoscale rapid modelling algorithm for concrete. Structures 2024, 70, 107561. [Google Scholar] [CrossRef] [Scilit]
- Huang, H.; Li, M.; Yuan, Y.; Bai, H. Theoretical analysis on the lateral drift of precast concrete frame with replaceable artificial controllable plastic hinges. J. Build. Eng. 2022, 62, 105386. [Google Scholar] [CrossRef] [Scilit]
- Feng, D.-C.; Wang, W.-J.; Mangalathu, S.; Hu, G.; Wu, T. Implementing ensemble learning methods to predict the shear strength of RC deep beams with/without web reinforcements. Eng. Struct. 2021, 235, 111979. [Google Scholar] [CrossRef] [Scilit]
- Paudel, S.; Pudasaini, A.; Shrestha, R.K.; Kharel, E. Compressive strength of concrete material using machine learning techniques. Clean. Eng. Technol. 2023, 15, 100661. [Google Scholar] [CrossRef] [Scilit]
- Salami, B.A.; Iqbal, M.; Abdulraheem, A.; Jalal, F.E.; Alimi, W.; Jamal, A.; Tafsirojjaman, T.; Liu, Y.; Bardhan, A. Estimating compressive strength of lightweight foamed concrete using neural, genetic and ensemble machine learning approaches. Cem. Concr. Compos. 2022, 133, 104721. [Google Scholar] [CrossRef] [Scilit]
- Al-Gburi, M.; Almssad, A.; Al-Zuhairi, O.I. Evaluating Concrete Strength Under Various Curing Conditions Using Artificial Neural Networks. Nord. Concr. Res. 2024, 71, 1–23. [Google Scholar] [CrossRef] [Scilit]
- Sobuz, M.H.R.; Datta, S.D.; Jabin, J.A.; Aditto, F.S.; Hasan, N.M.S.; Hasan, M.; Zaman, A.A.U. Assessing the influence of sugarcane bagasse ash for the production of eco-friendly concrete: Experimental and machine learning approaches. Case Stud. Constr. Mater. 2024, 20, e02839. [Google Scholar] [CrossRef] [Scilit]
- Saha, A.; Aditto, F.S.; Kundu, L.; Sobuz, M.H.R.; Sunny, M.M.H. Analysis of waste glass as a partial substitute for coarse aggregate in self-compacting concrete: An experimental and machine learning study. J. Build. Eng. 2024, 98, 111112. [Google Scholar] [CrossRef] [Scilit]
- Sobuz, M.H.R.; Joy, L.P.; Akid, A.S.M.; Aditto, F.S.; Jabin, J.A.; Hasan, N.M.S.; Meraz, M.M.; Kabbo, M.K.I.; Datta, S.D. Optimization of recycled rubber self-compacting concrete: Experimental findings and machine learning-based evaluation. Heliyon 2024, 10, e27793. [Google Scholar] [CrossRef] [Scilit] [PubMed]
- Islam, M.H.; Prova, Z.N.; Sobuz, M.H.R.; Nijum, N.J.; Aditto, F.S. Experimental investigation on fresh, hardened and durability characteristics of partially replaced E-waste plastic concrete: A sustainable concept with machine learning approaches. Heliyon 2025, 11, e41924. [Google Scholar] [CrossRef] [Scilit] [PubMed]
- C150/C150M-20; Standard Specification for Portland Cement. ASTM: West Conshohocken, PA, USA, 2020.
- Jabin, J.A.; Sobuz, M.H.R.; Khondoker, M.T.H. Use of artificial intelligence to predict properties of cementitious materials. In Recent Trends in the Sustainability Improvement and Use of Wastes in Cementitious Materials; Woodhead Publishing: Cambridge, UK, 2026; pp. 559–583. [Google Scholar]
- C618-15; Standard Specification for Coal Fly Ash and Raw or Calcined Natural Pozzolan for Use in Concrete. ASTM International: West Conshohocken, PA, USA, 2015.
- C128-15; Standard Test Method for Relative Density (Specific Gravity) and Absorption of Fine Aggregate. ASTM International: West Conshohocken, PA, USA, 2015.
- C33; Standard Specification for Concrete Aggregates. ASTM International: West Conshohocken, PA, USA, 2018.
- American Concrete Institute. State-of-the-Art Report on High-Strength Concrete; American Concrete Institute: Farmington Hills, MI, USA, 1992. [Google Scholar]
- C192/C192M-13a; Standard Practice for Making and Curing Concrete Test Specimens in the Laboratory. ASTM International: West Conshohocken, PA, USA, 2013.
- C143; Standard Test Method for Slump of Hydraulic Cement Concrete. ASTM International: West Conshohocken, PA, USA, 2003.
- Hu, C.; de Larrard, F.; Sedran, T.; Boulay, C.; Bosc, F.; Deflorenne, F. Validation of BTRHEOM, the new rheometer for soft-to-fluid concrete. Mater. Struct. 1996, 29, 620–631. [Google Scholar] [CrossRef] [Scilit]
- Hu, C.; de Larrard, F. The rheology of fresh high-performance concrete. Cem. Concr. Res. 1996, 26, 283–294. [Google Scholar] [CrossRef] [Scilit]
- ASTM C39/C39M; Standard Test Method for Compressive Strength of Cylindrical Concrete Specimens. ASTM International: West Conshohocken, PA, USA, 2014.
- C496/C496M-17; Standard Test Method for Splitting Tensile Strength of Cylindrical Concrete Specimens. ASTM International: West Conshohocken, PA, USA, 2017.
- C293/C293M; Standard Test Method for Flexural Strength of Concrete (Using Simple Beam with Center-Point Loading). ASTM International: West Conshohocken, PA, USA, 2010.
- C805; Standard Test Method for Rebound Number of Hardened Concrete. ASTM International: West Conshohocken, PA, USA, 2008.
- C597; Standard Test Method for Pulse Velocity Through Concrete. ASTM International: West Conshohocken, PA, USA, 2009.
- C1723; Standard Guide for Examination of Hardened Concrete Using Scanning Electron Microscopy. ASTM International: West Conshohocken, PA, USA, 2016.
- Friedman, J.H. Greedy function approximation: A gradient boosting machine. Ann. Stat. 2001, 29, 1189–1232. [Google Scholar] [CrossRef] [Scilit]
- Cui, L.; Chen, P.; Wang, L.; Li, J.; Ling, H. Application of extreme gradient boosting based on grey relation analysis for prediction of compressive strength of concrete. Adv. Civ. Eng. 2021, 2021, 1–14. [Google Scholar] [CrossRef] [Scilit]
- Lundberg, S.M.; Lee, S.-I. A unified approach to interpreting model predictions. Adv. Neural Inf. Process. Syst. 2017, 30, 4768–4777. [Google Scholar]
- Zareei, S.A.; Ameri, F.; Bahrami, N.; Shoaei, P.; Musaeei, H.R.; Nurian, F. Green high strength concrete containing recycled waste ceramic aggregates and waste carpet fibers: Mechanical, durability, and microstructural properties. J. Build. Eng. 2019, 26, 100914. [Google Scholar] [CrossRef] [Scilit]
- Zeyad, A.M.; Khan, A.H.; Tayeh, B.A. Durability and strength characteristics of high-strength concrete incorporated with volcanic pumice powder and polypropylene fibers. J. Mater. Res. Technol. 2020, 9, 806–818. [Google Scholar] [CrossRef] [Scilit]
- Ananthi, A.; Karthikeyan, J. Combined performance of polypropylene fibre and weld slag in high performance concrete. J. Inst. Eng. Ser. A 2017, 98, 405–412. [Google Scholar] [CrossRef] [Scilit]
- Ahmad, J.; Zhou, Z. Mechanical properties of natural as well as synthetic fiber reinforced concrete: A review. Constr. Build. Mater. 2022, 333, 127353. [Google Scholar] [CrossRef] [Scilit]
- Sun, Z.; Xu, Q. Microscopic, physical and mechanical analysis of polypropylene fiber reinforced concrete. Mater. Sci. Eng. A 2009, 527, 198–204. [Google Scholar] [CrossRef] [Scilit]
- Afroughsabet, V.; Ozbakkaloglu, T. Mechanical and durability properties of high-strength concrete containing steel and polypropylene fibers. Constr. Build. Mater. 2015, 94, 73–82. [Google Scholar] [CrossRef] [Scilit]
- Abdullah, G.M.S.; Alshaikh, I.M.H.; Zeyad, A.M.; Magbool, H.M.; Bakar, B.H.A. The effect of openings on the performance of self-compacting concrete with volcanic pumice powder and different steel fibers. Case Stud. Constr. Mater. 2022, 17, e01148. [Google Scholar] [CrossRef] [Scilit]
- Chakrawarthi, V.; Dharmar, B.; Avudaiappan, S.; Amran, M.; Flores, E.S.; Alam, M.A.; Fediuk, R.; Vatin, N.I.; Rashid, R.S. Destructive and non-destructive testing of the performance of copper slag fiber-reinforced concrete. Materials 2022, 15, 4536. [Google Scholar] [CrossRef] [Scilit] [PubMed]
- Malhotra, V. Testing Hardened Concrete: Non-Destructive Methods, ACI Monograph No. 9, ACI; Iowa State University Press: Ames, IA, USA, 1976. [Google Scholar]
- Shahbazpanahi, S.; Faraj, R.H. Feasibility study on the use of shell sunflower ash and shell pumpkin ash as supplementary cementitious materials in concrete. J. Build. Eng. 2020, 30, 101271. [Google Scholar] [CrossRef] [Scilit]
- Awal, A.S.M.A.; Mohammadhosseini, H. Green concrete production incorporating waste carpet fiber and palm oil fuel ash. J. Clean. Prod. 2016, 137, 157–166. [Google Scholar] [CrossRef] [Scilit]
- Li, J.; Yao, Y. A study on creep and drying shrinkage of high performance concrete. Cem. Concr. Res. 2001, 31, 1203–1206. [Google Scholar] [CrossRef] [Scilit]
- Scrivener, K.L.; Kirkpatrick, R.J. Innovation in use and research on cementitious material. Cem. Concr. Res. 2008, 38, 128–136. [Google Scholar] [CrossRef] [Scilit]
- Letelier, V.; Ortega, J.M.; Tarela, E.; Muñoz, P.; Henríquez-Jara, B.I.; Moriconi, G. Mechanical performance of eco-friendly concretes with volcanic powder and recycled concrete aggregates. Sustainability 2018, 10, 3036. [Google Scholar] [CrossRef] [Scilit]
- Hepworth, N.; Goulden, M. Climate Change in Uganda: Understanding the Implications and Appraising the Response; LTS International: Edinburgh, Scotland, 2008. [Google Scholar]
- Bontempi, E. A new approach for evaluating the sustainability of raw materials substitution based on embodied energy and the CO2 footprint. J. Clean. Prod. 2017, 162, 162–169. [Google Scholar] [CrossRef] [Scilit]
- ACI 318-08; Building Code Requirements for Structural Concrete (ACI 318-08) and Commentary. American Concrete Institute: Farmington Hills, MI, USA, 2008.
- Russell, H.G.; Anderson, A.R.; Banning, J.O.; Cantor, I.G.; Carrasquillo, R.L.; Cook, J.E.; Frantz, G.C.; Hester, W.T.; Saucier, K.L.; Aitcin, P.C. State-of-the-art report on high-strength concrete. ACI Comm. 1997, 363, 92. [Google Scholar]
- Comité Euro-International du Béton (CEB). International du Beton: CEB-FIP Model Code 1990, Final Draft 1991. Bull. d’Information 1991, 2.1–2.16. [Google Scholar]
- AS 3600-2001; Concrete Structures. Standards Australia International Ltd.: Sydney, Australia, 2001; p. 175.
- Martín-Morales, M.; Zamorano, M.; Ruiz-Moyano, A.; Valverde-Espinosa, I. Characterization of recycled aggregates construction and demolition waste for concrete production following the Spanish Structural Concrete Code EHE-08. Constr. Build. Mater. 2011, 25, 742–748. [Google Scholar] [CrossRef] [Scilit]
- GB/T 50081–52002; Method for Testing Mechanical Properties of Normal Concrete. China Architecture and Building Press: Beijing, China, 2002.
- Técnicas, N. Projeto de estruturas de concreto-Procedimento. NBR 2002, 6118, 20072007. [Google Scholar]
- Kheder, G. A two stage procedure for assessment of in situ concrete strength using combined non-destructive testing. Mater. Struct. 1999, 32, 410–417. [Google Scholar] [CrossRef] [Scilit]
- Domingo, R.; Hirose, S. Correlation between concrete strength and combined nondestructive tests for concrete using high-early strength cement. In Proceedings of the Sixth Regional Symposium on Infrastructure Development, Bangkok, Thailand, 12–13 January 2009; pp. 12–13. [Google Scholar]
- De Almeida, I. Non-destructive testing of high strength concretes: Rebound (Schmidt hammer and ultrasonic pulse velocity), quality control of concrete structures. In Proceedings of the International Symposium Held by RILEM, Belgium; E&FN SPON: London, UK, 1991; pp. 387–397. [Google Scholar]
- Qasrawi, H.Y. Concrete strength by combined nondestructive methods simply and reliably predicted. Cem. Concr. Res. 2000, 30, 739–746. [Google Scholar] [CrossRef] [Scilit]
- Yoo, J.K.; Ryu, D.W. A study of the evaluation of strength development property of concrete at early ages. In Proceedings of the 3rd ACF International Conference (ACF/VCA 2008), Ho Chi Minh City, Vietnam, 11–13 November 2008. [Google Scholar]
- Wang, W.; Zhong, Y.; Liao, G.; Ding, Q.; Zhang, T.; Li, X. Prediction of compressive strength of concrete specimens based on interpretable machine learning. Materials 2024, 17, 3661. [Google Scholar] [CrossRef] [Scilit] [PubMed]
- Wang, H.; Ding, Y.; Kong, Y.; Sun, D.; Shi, Y.; Cai, X. Predicting the Compressive Strength of Sustainable Portland Cement–Fly Ash Mortar Using Explainable Boosting Machine Learning Techniques. Materials 2024, 17, 4744. [Google Scholar] [CrossRef] [Scilit] [PubMed]
- Li, Y.; Shen, J.; Li, Y.; Wang, K.; Lin, H. The data-driven research on the autogenous shrinkage of ultra-high performance concrete (UHPC) based on machine learning. J. Build. Eng. 2024, 82, 108373. [Google Scholar] [CrossRef] [Scilit]
- Khan, A.U.; Asghar, R.; Hassan, N.; Khan, M.; Javed, M.F.; Othman, N.A.; Shomurotova, S. Predictive modeling for compressive strength of blended cement concrete using hybrid machine learning models. Multiscale Multidiscip. Model. Exp. Des. 2025, 8, 25. [Google Scholar] [CrossRef] [Scilit]
- Uddin, M.N.; Hossain, S. Revolutionizing engineered cementitious composite materials (ECC): The impact of XGBoost-SHAP analysis on polyvinyl alcohol (PVA) based ECC predictions. Low-Carbon Mater. Green Constr. 2024, 2, 11. [Google Scholar] [CrossRef] [Scilit]
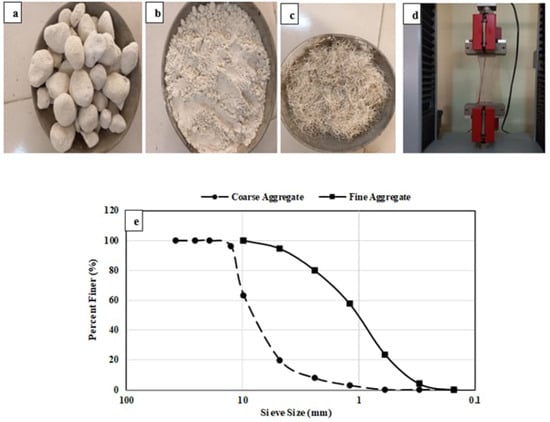
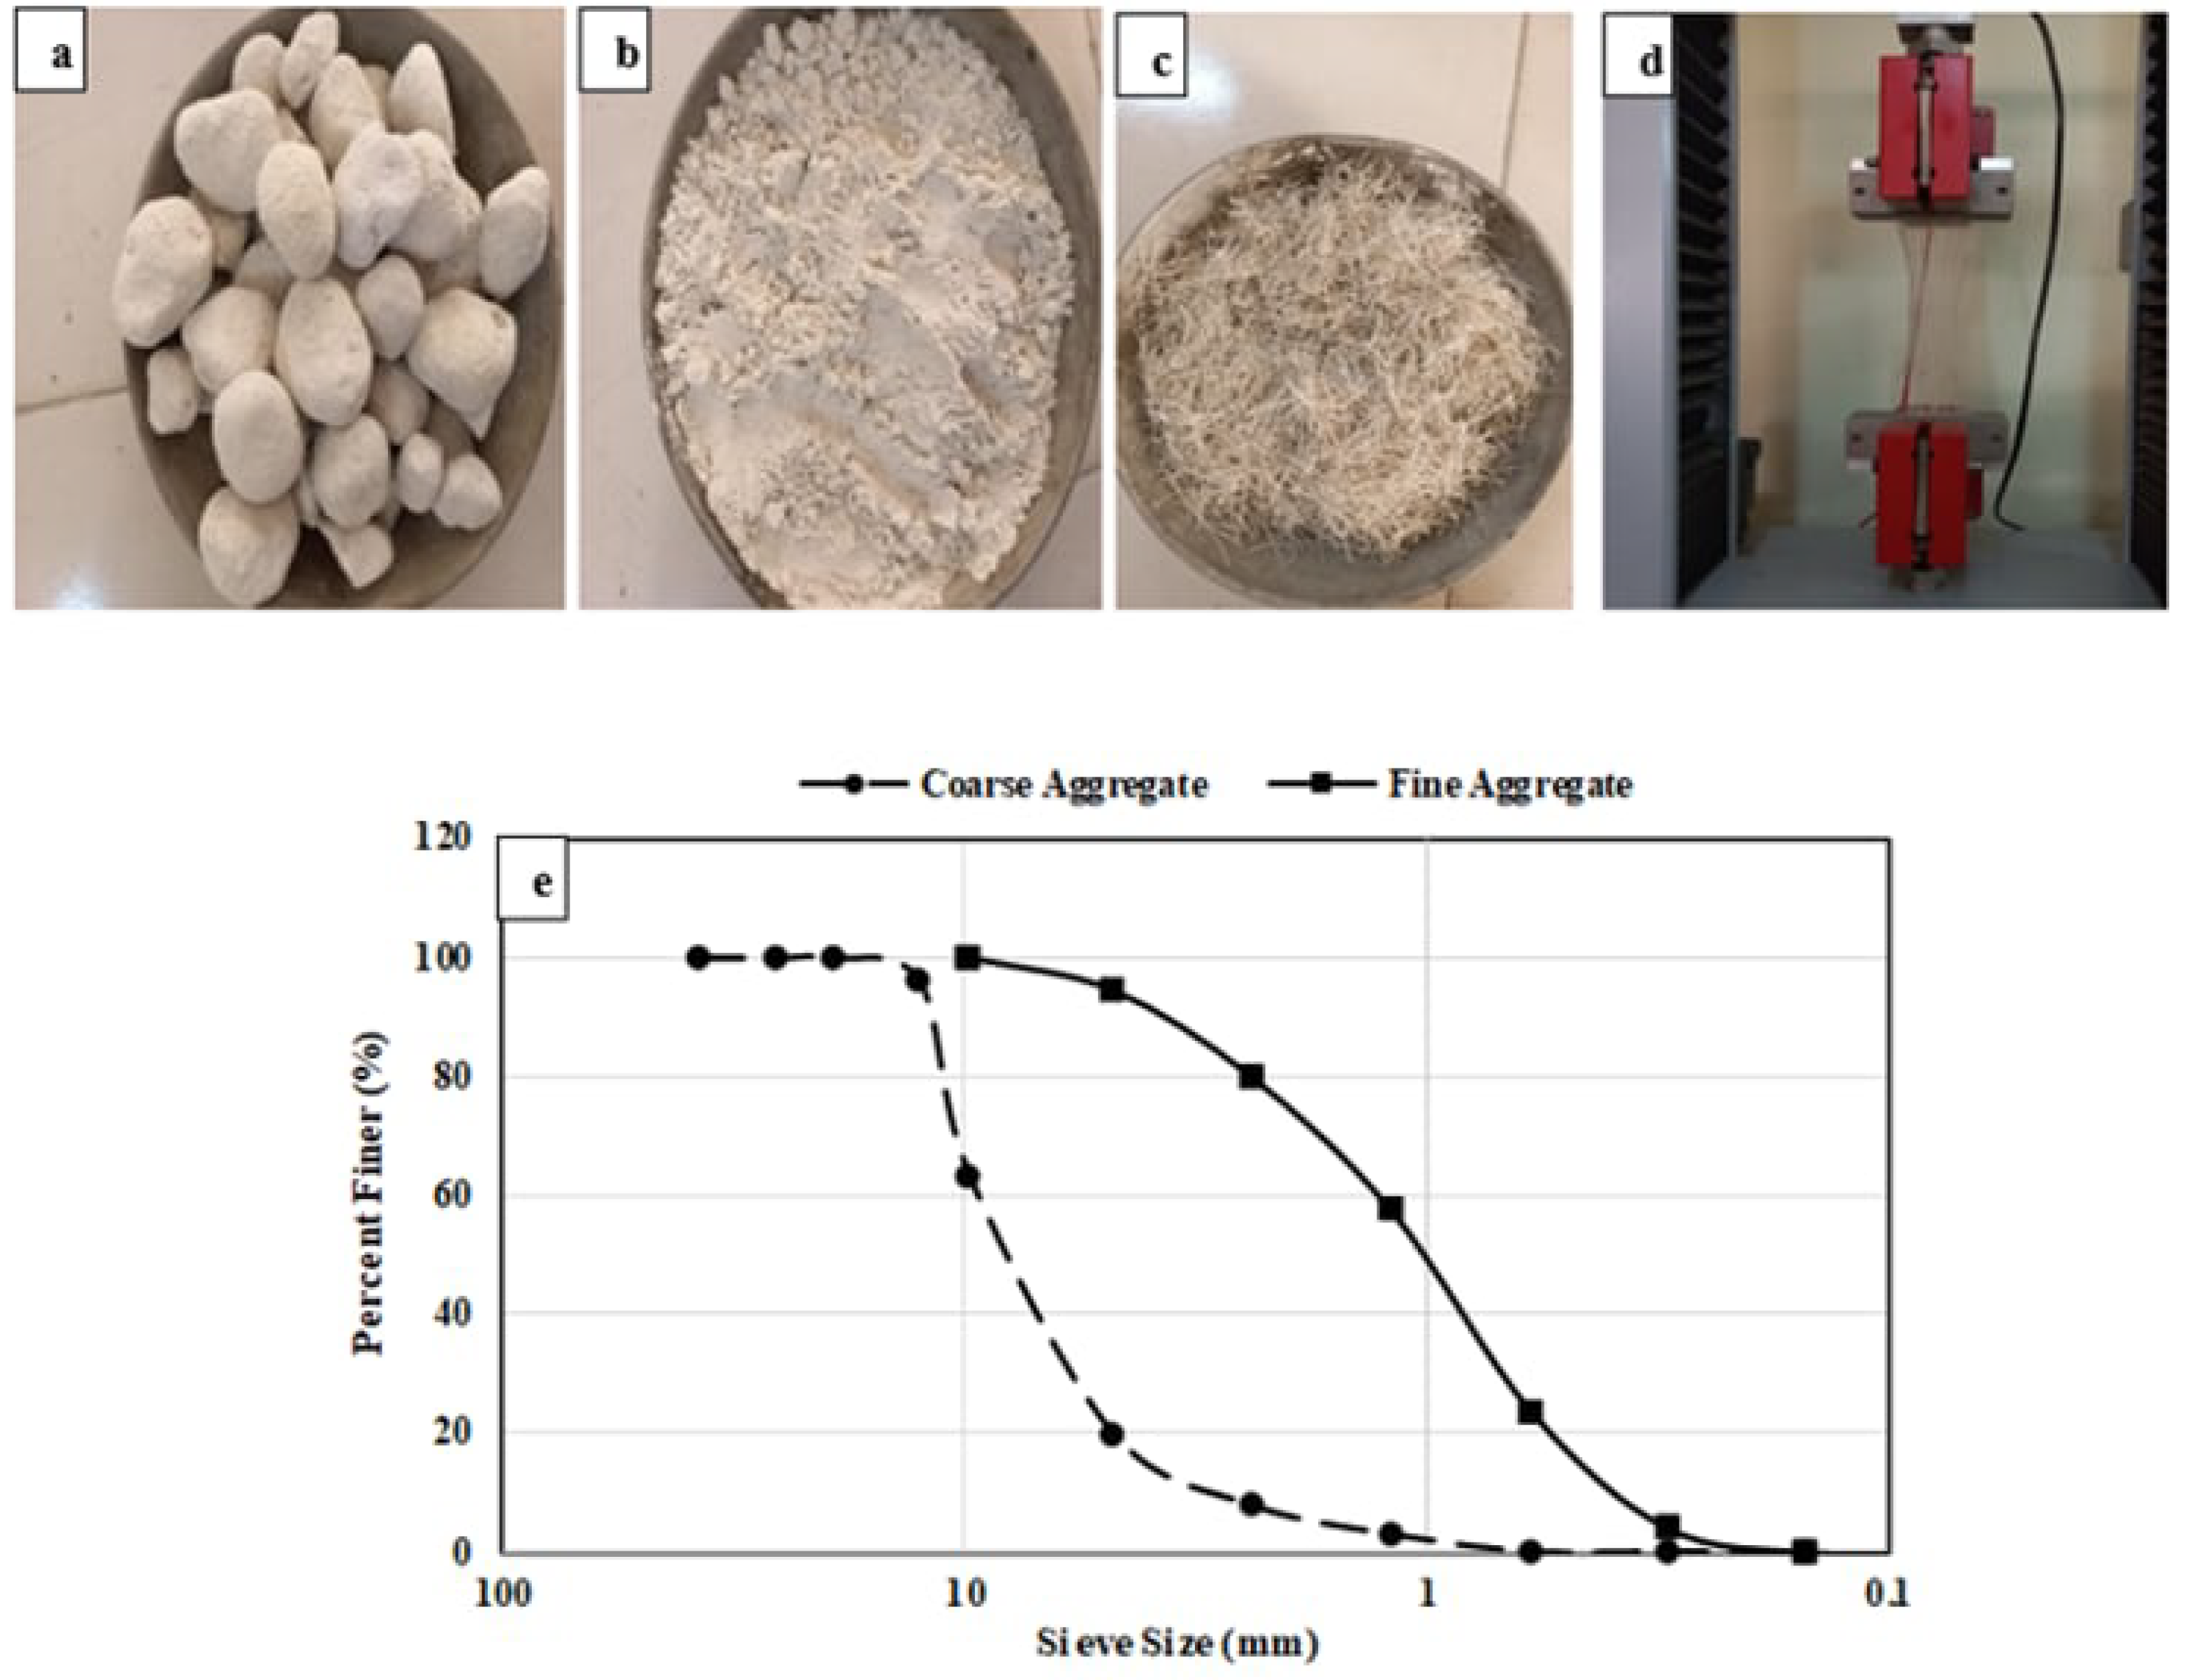
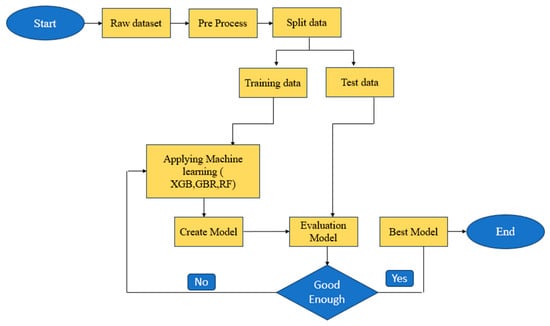
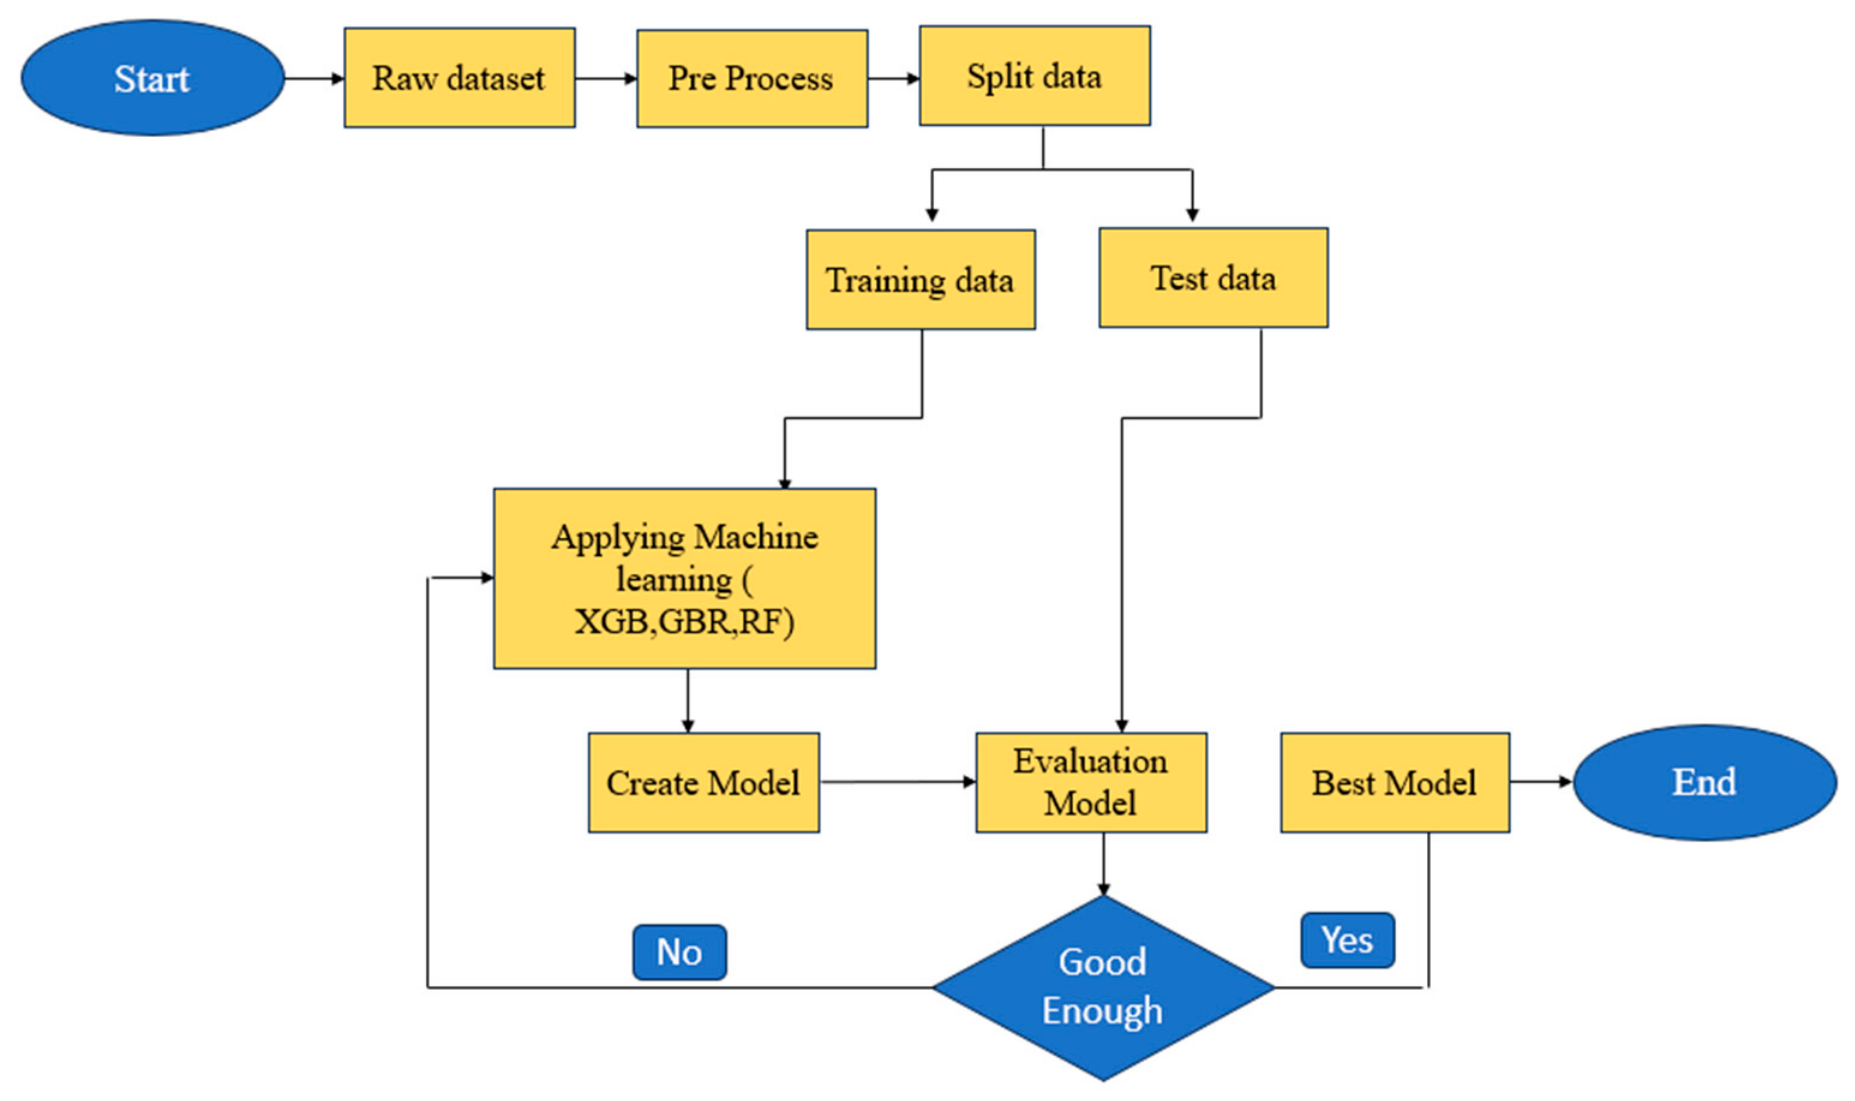
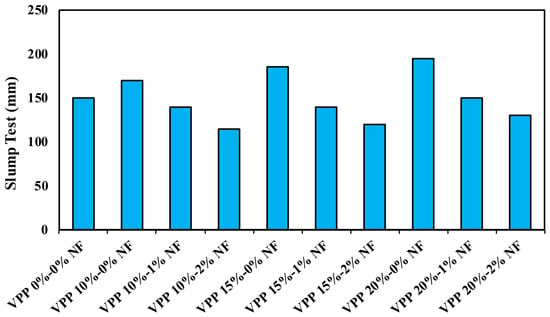
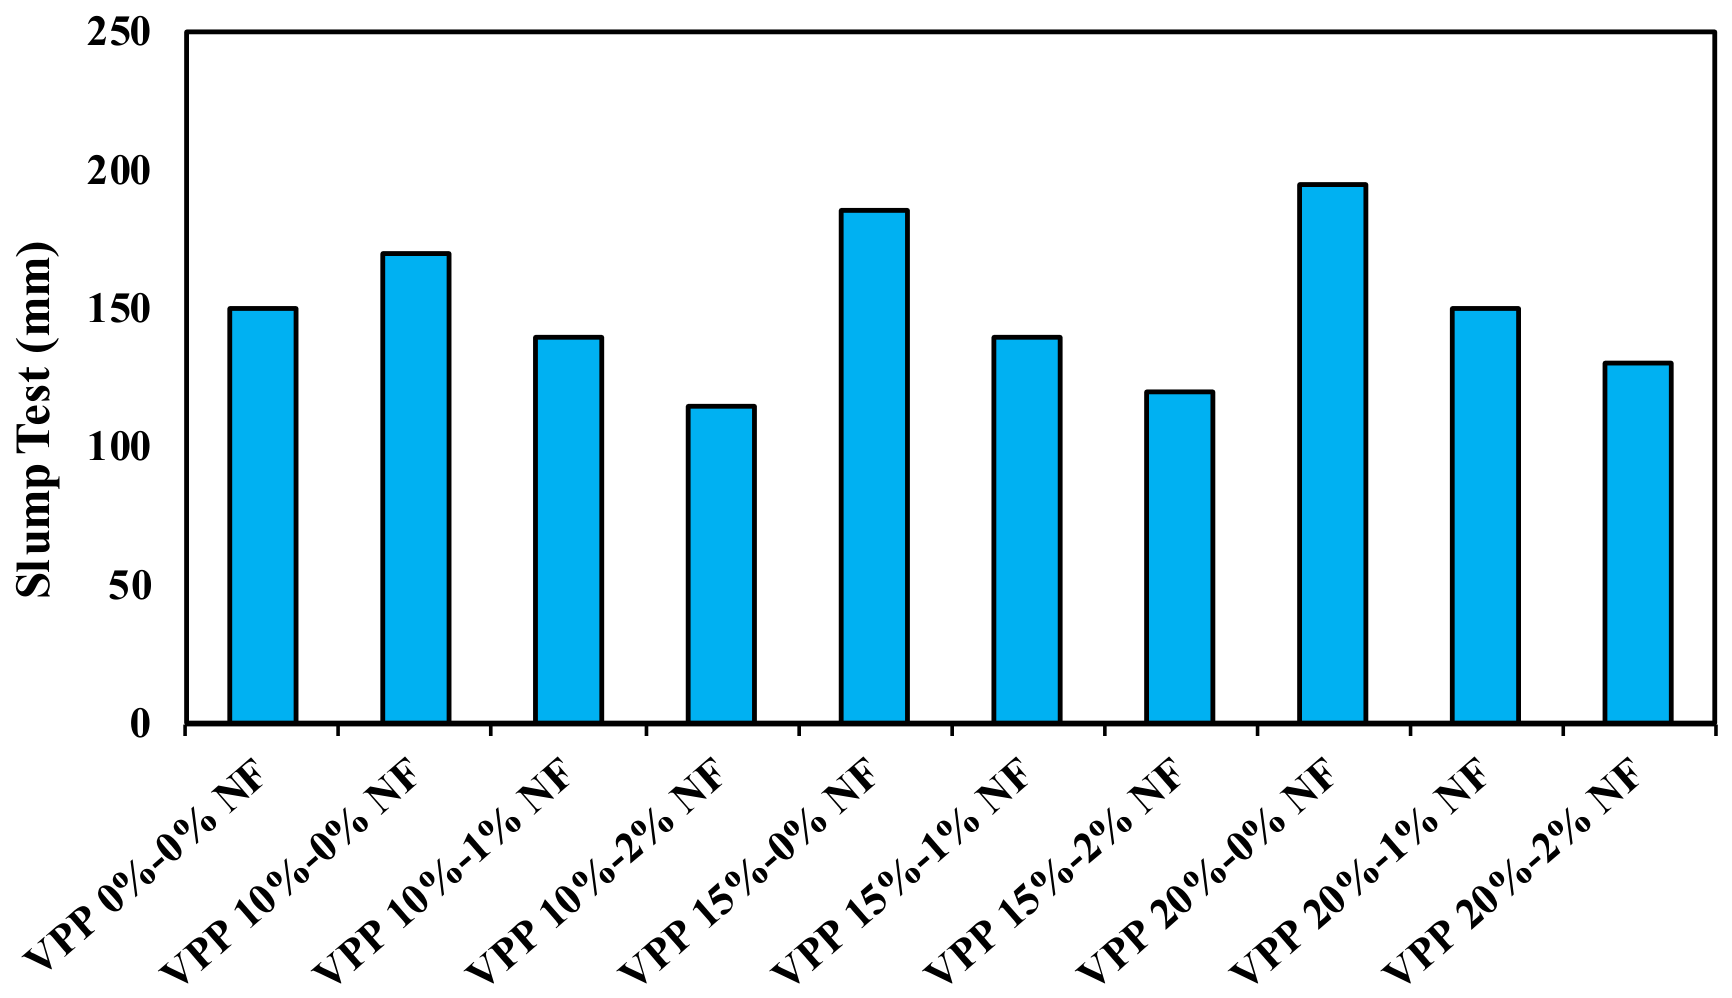
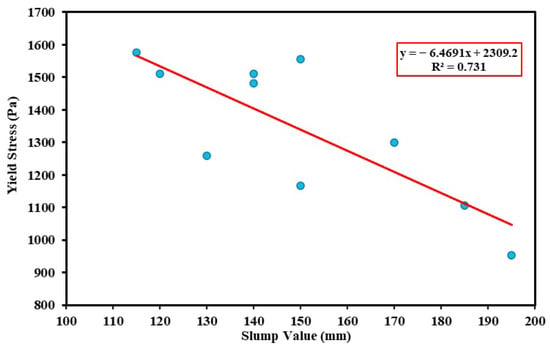
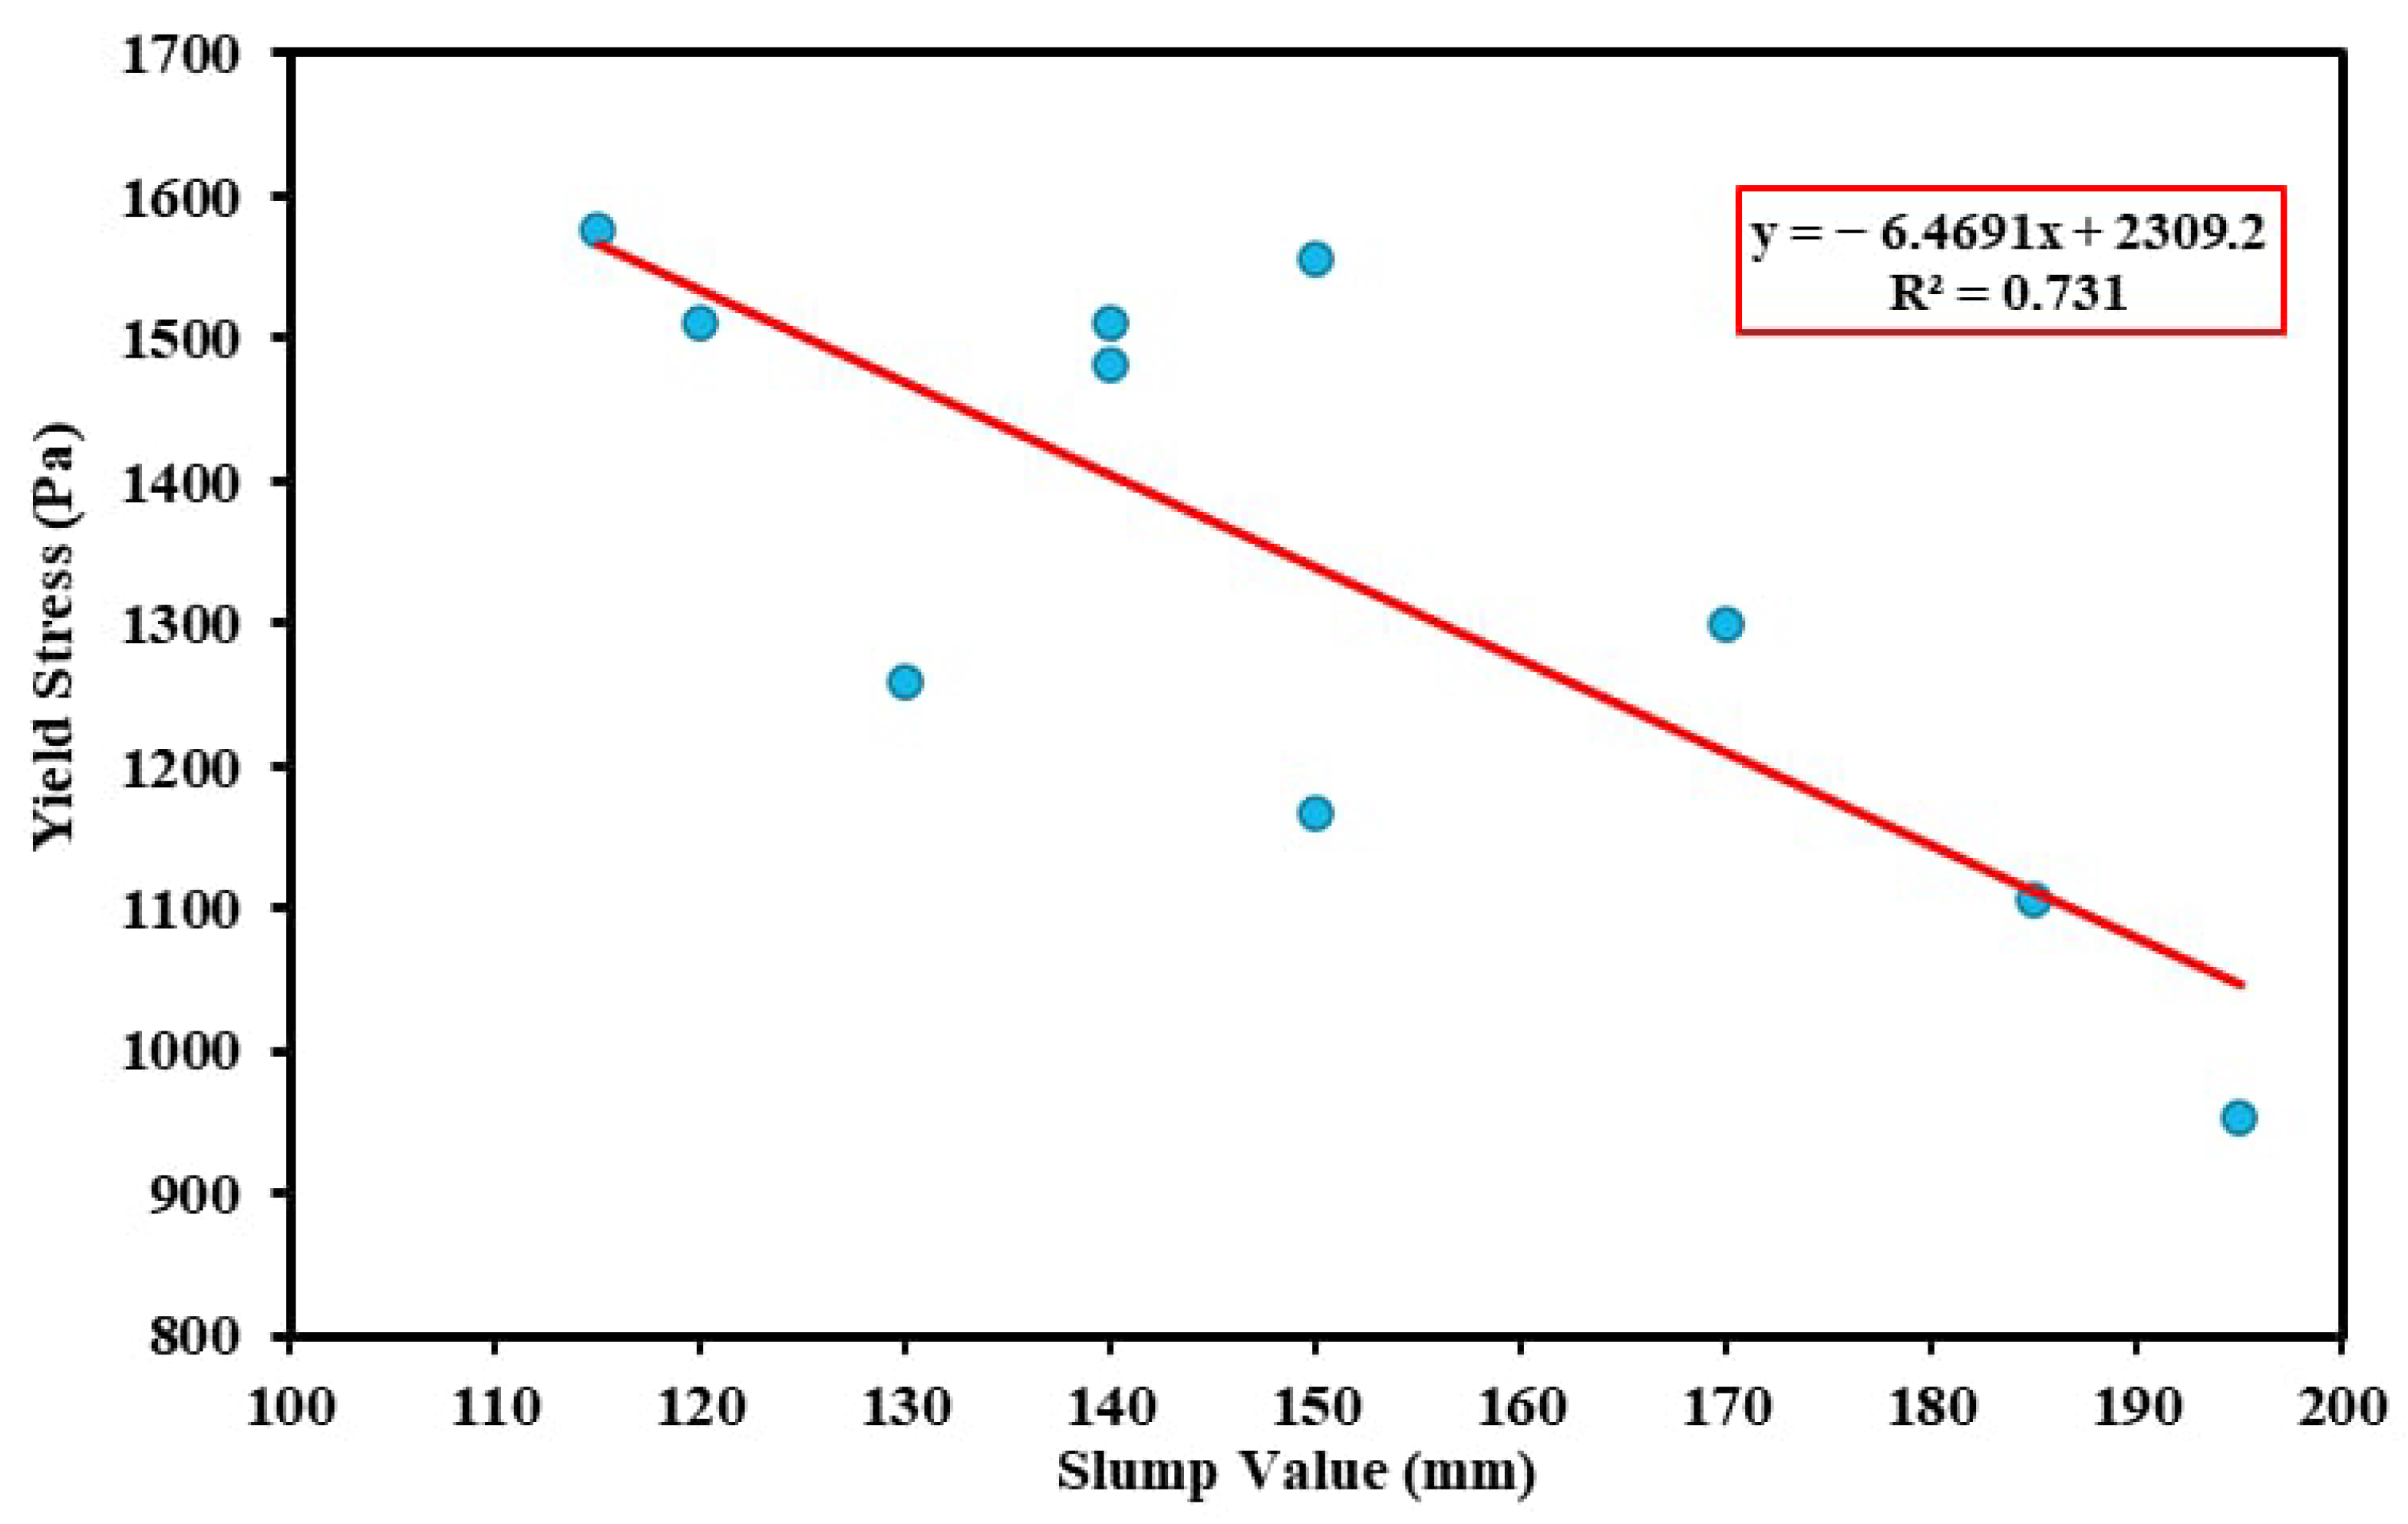
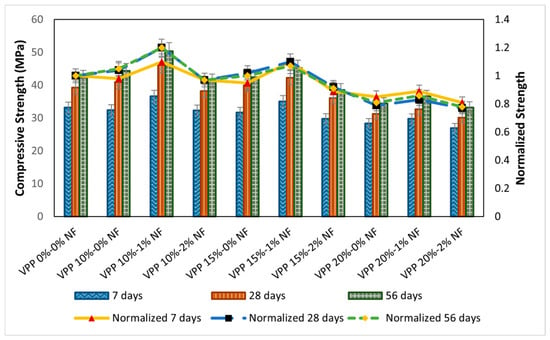
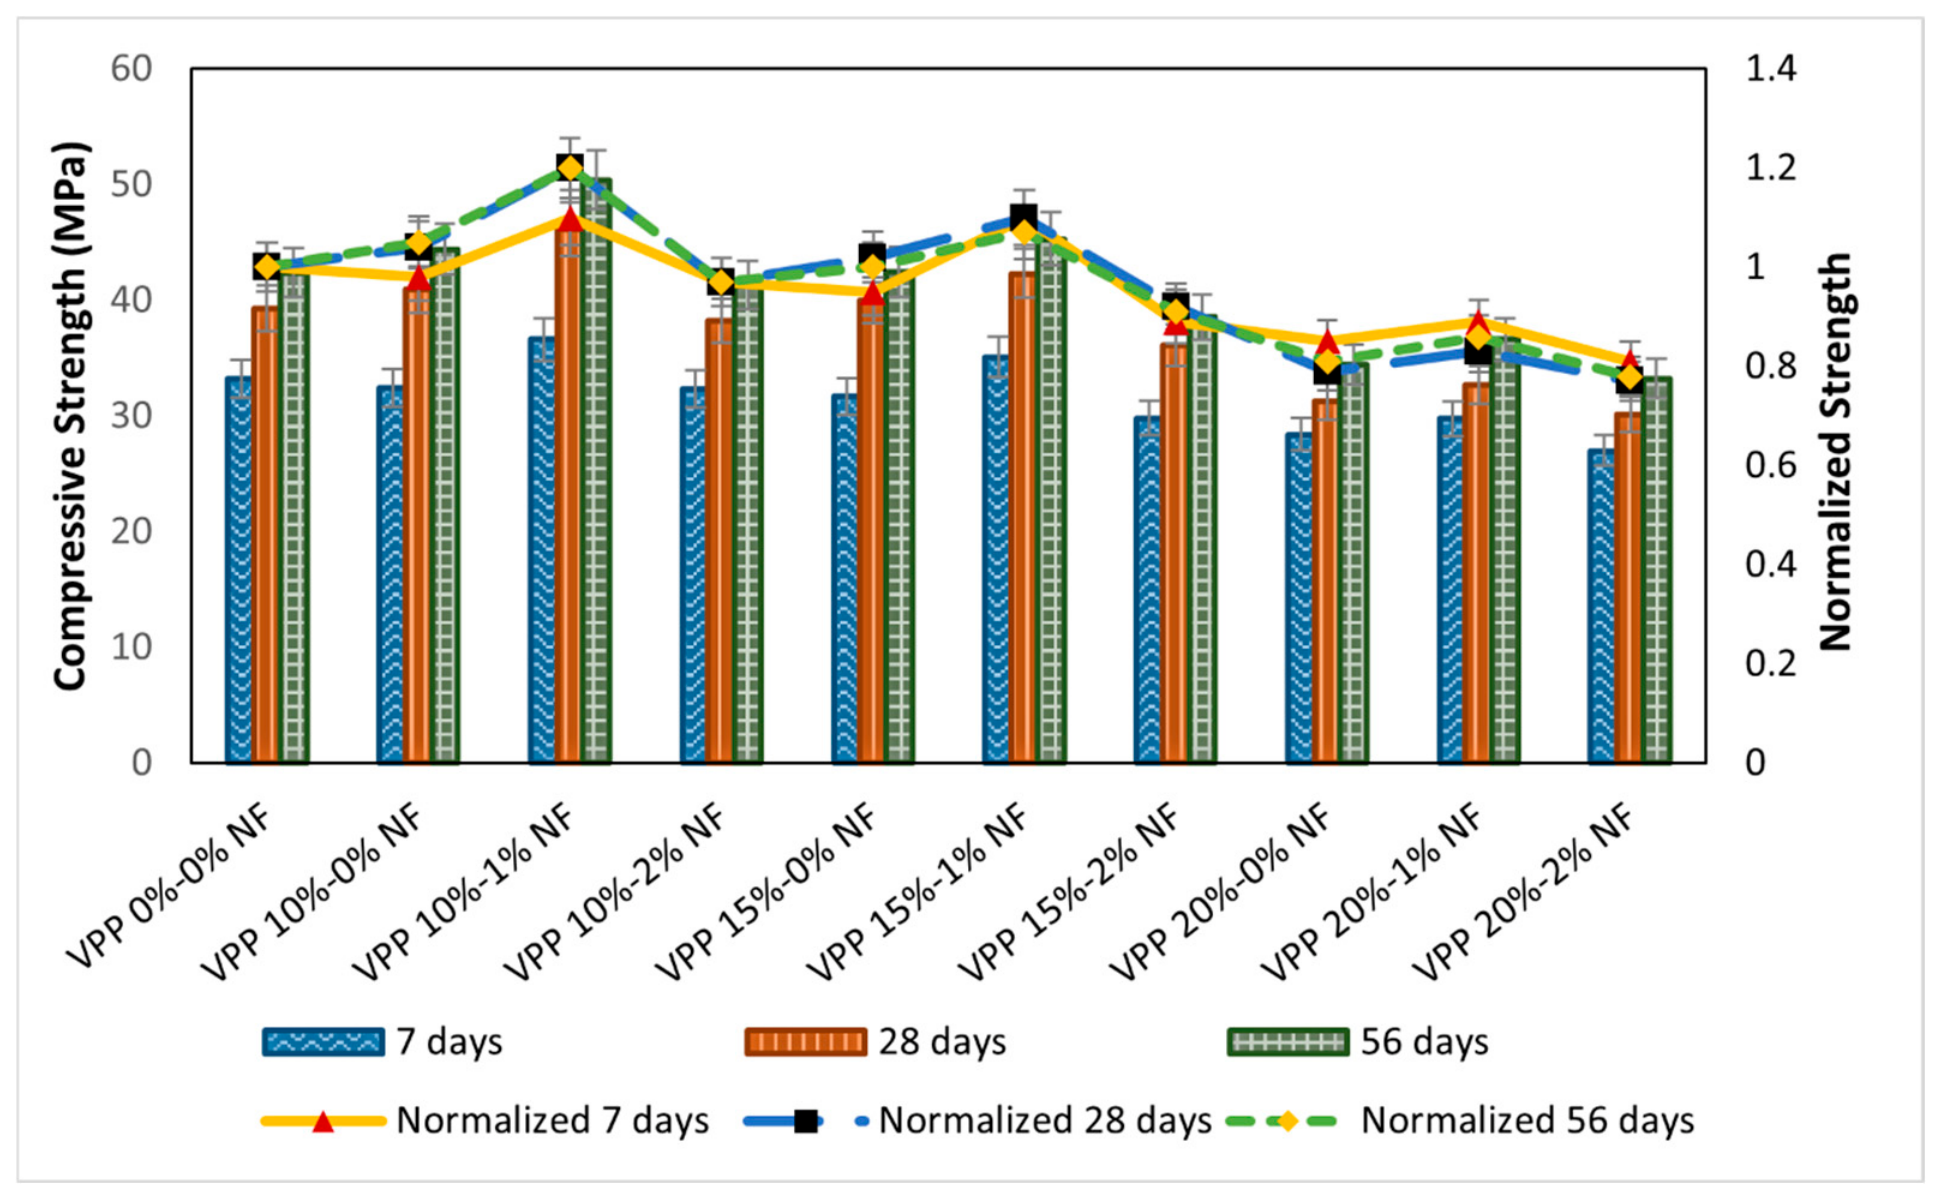
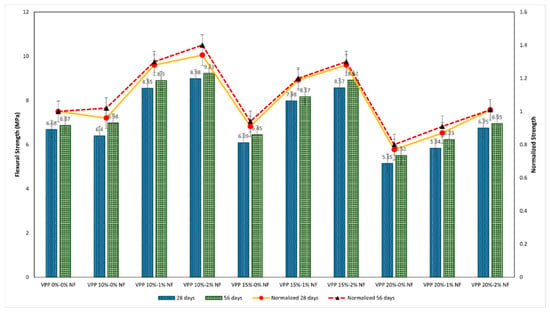
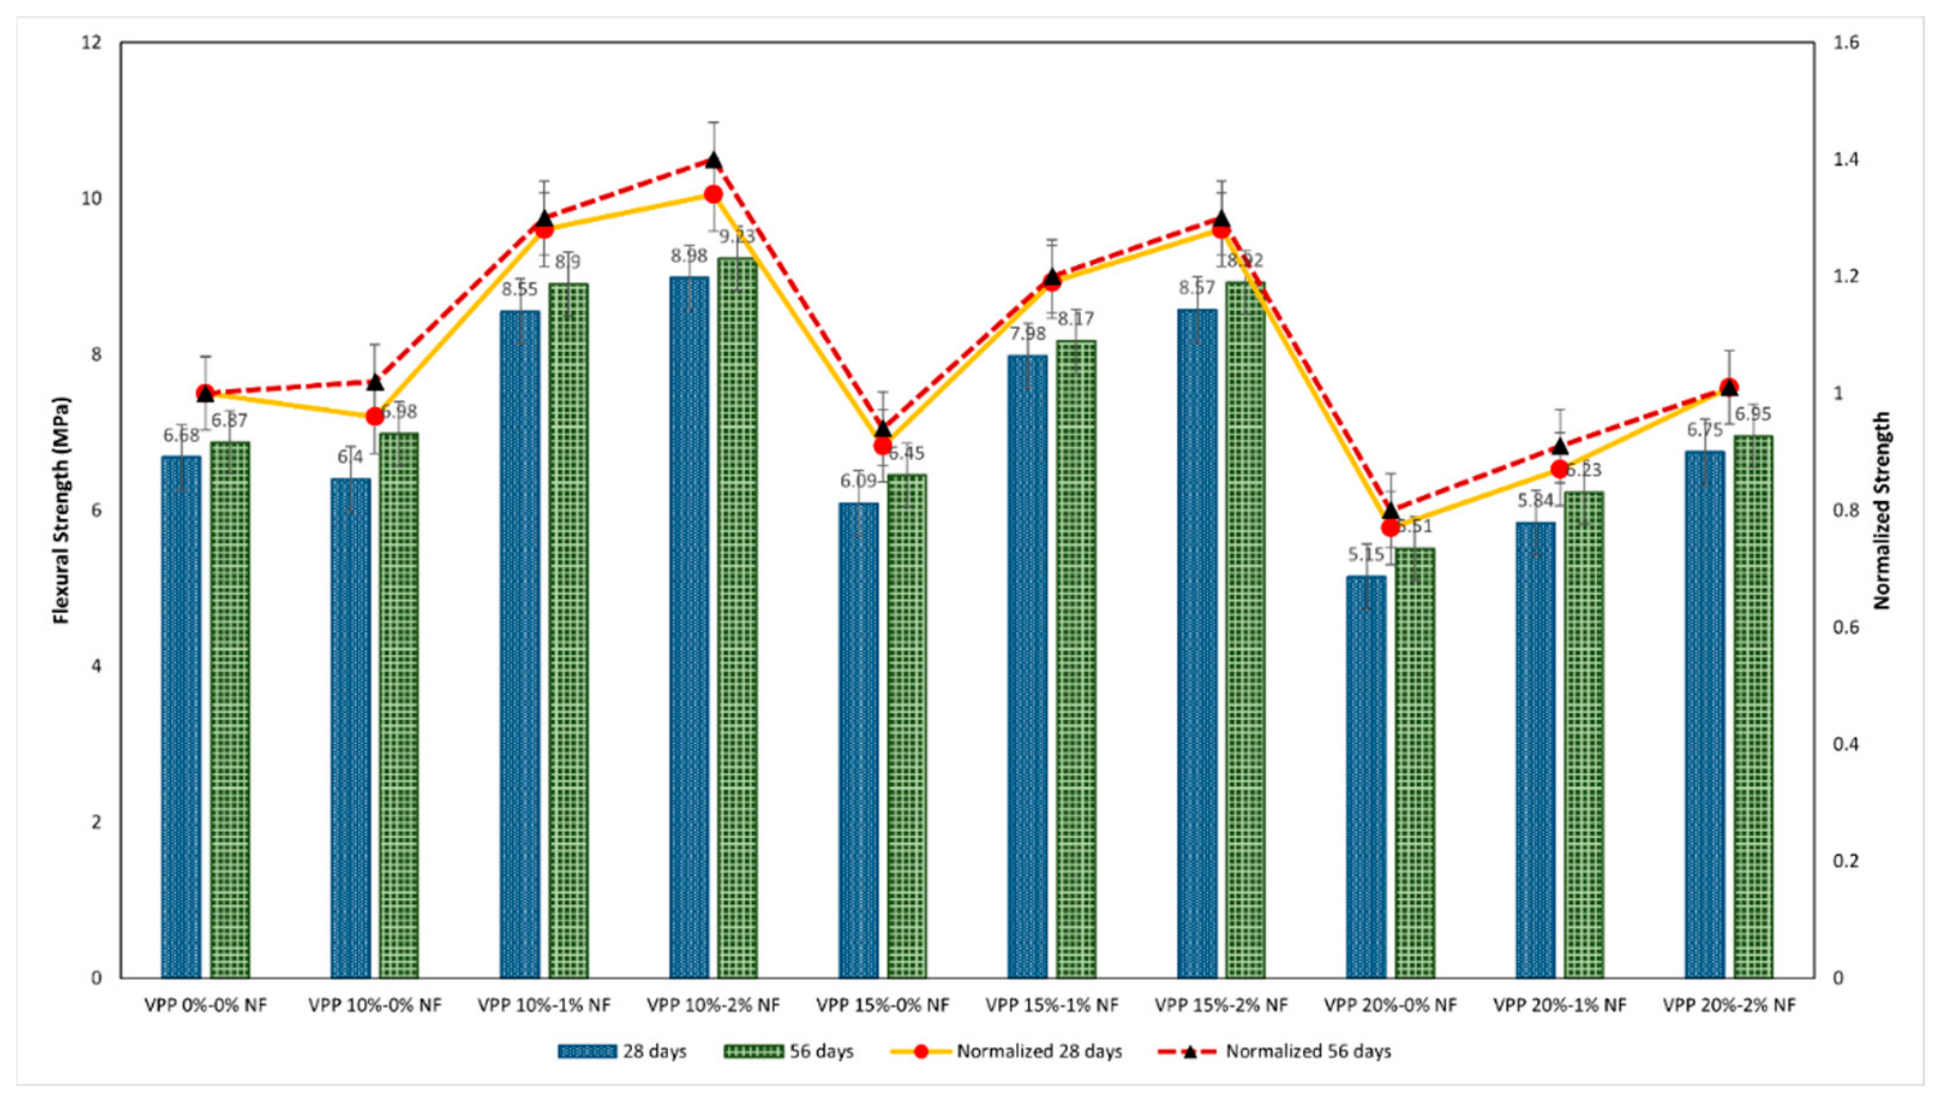
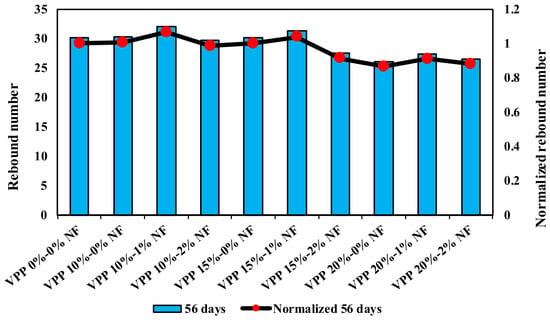
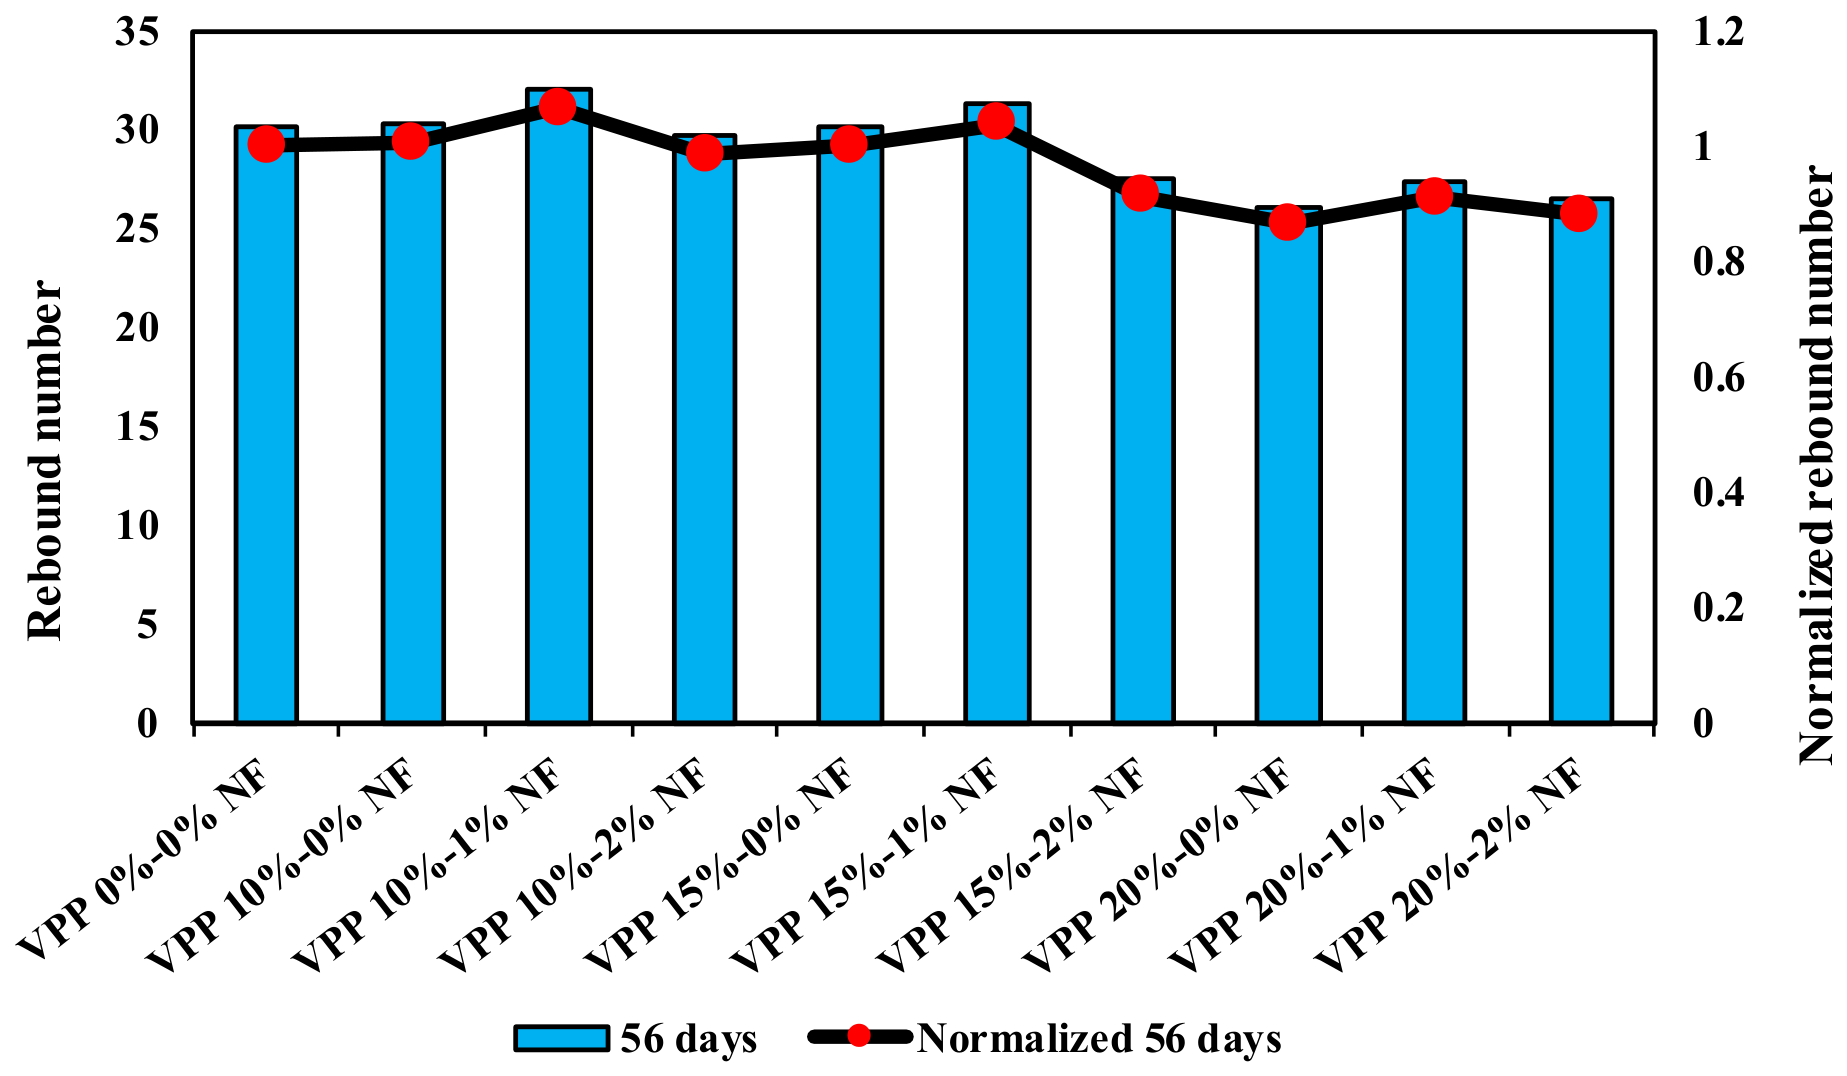
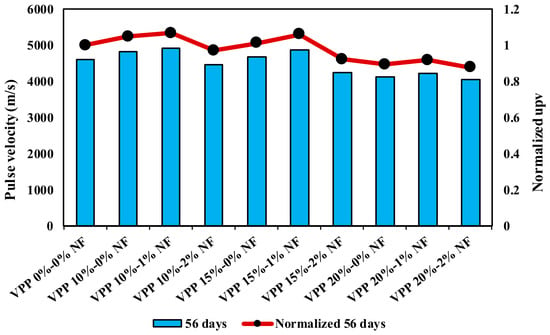
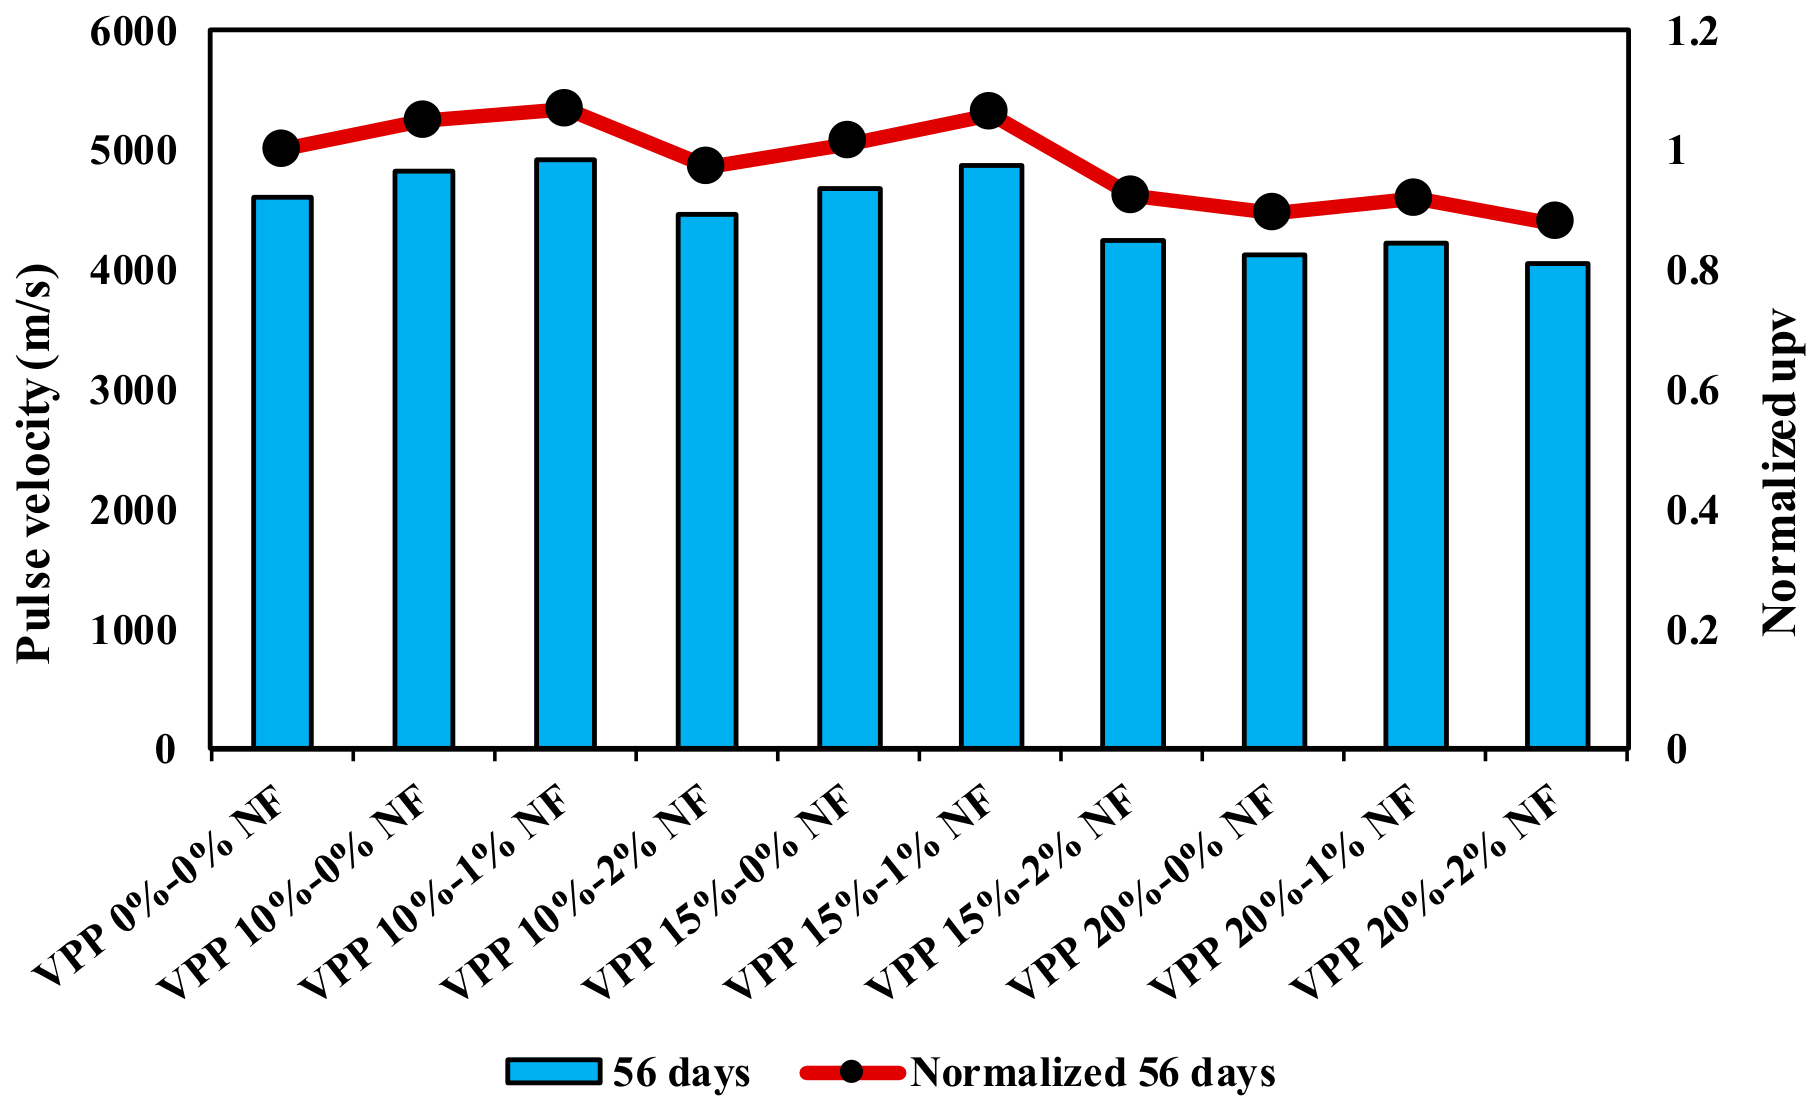
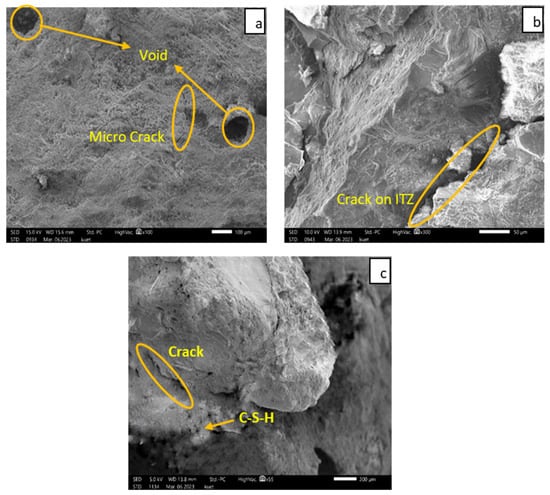
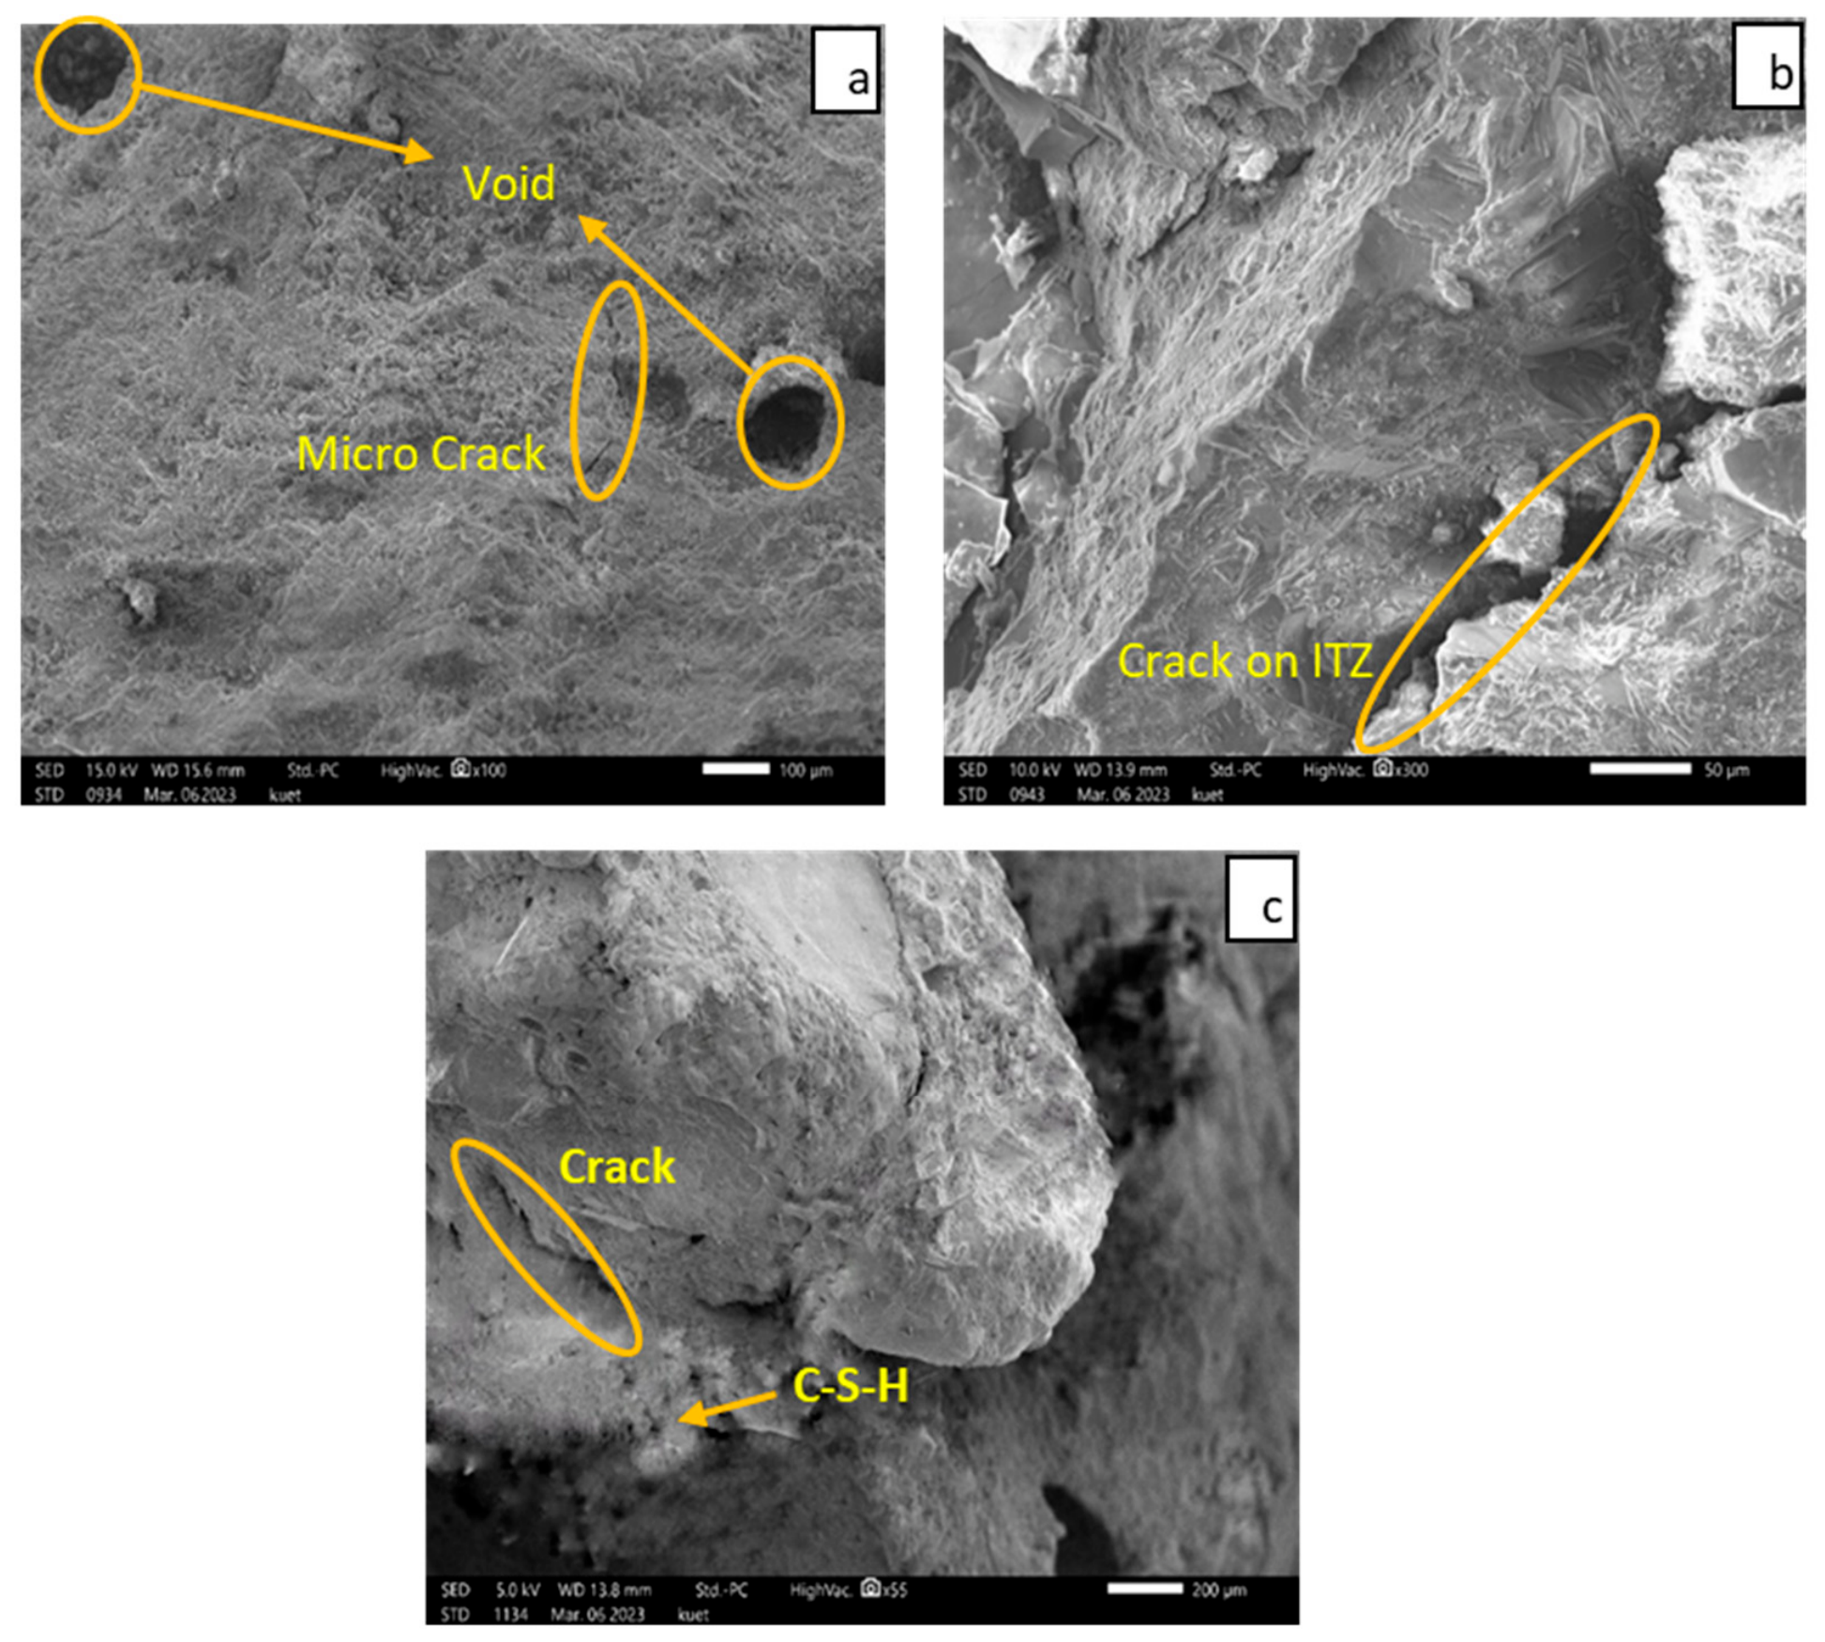
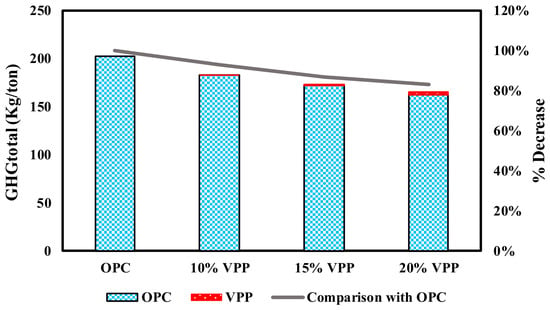
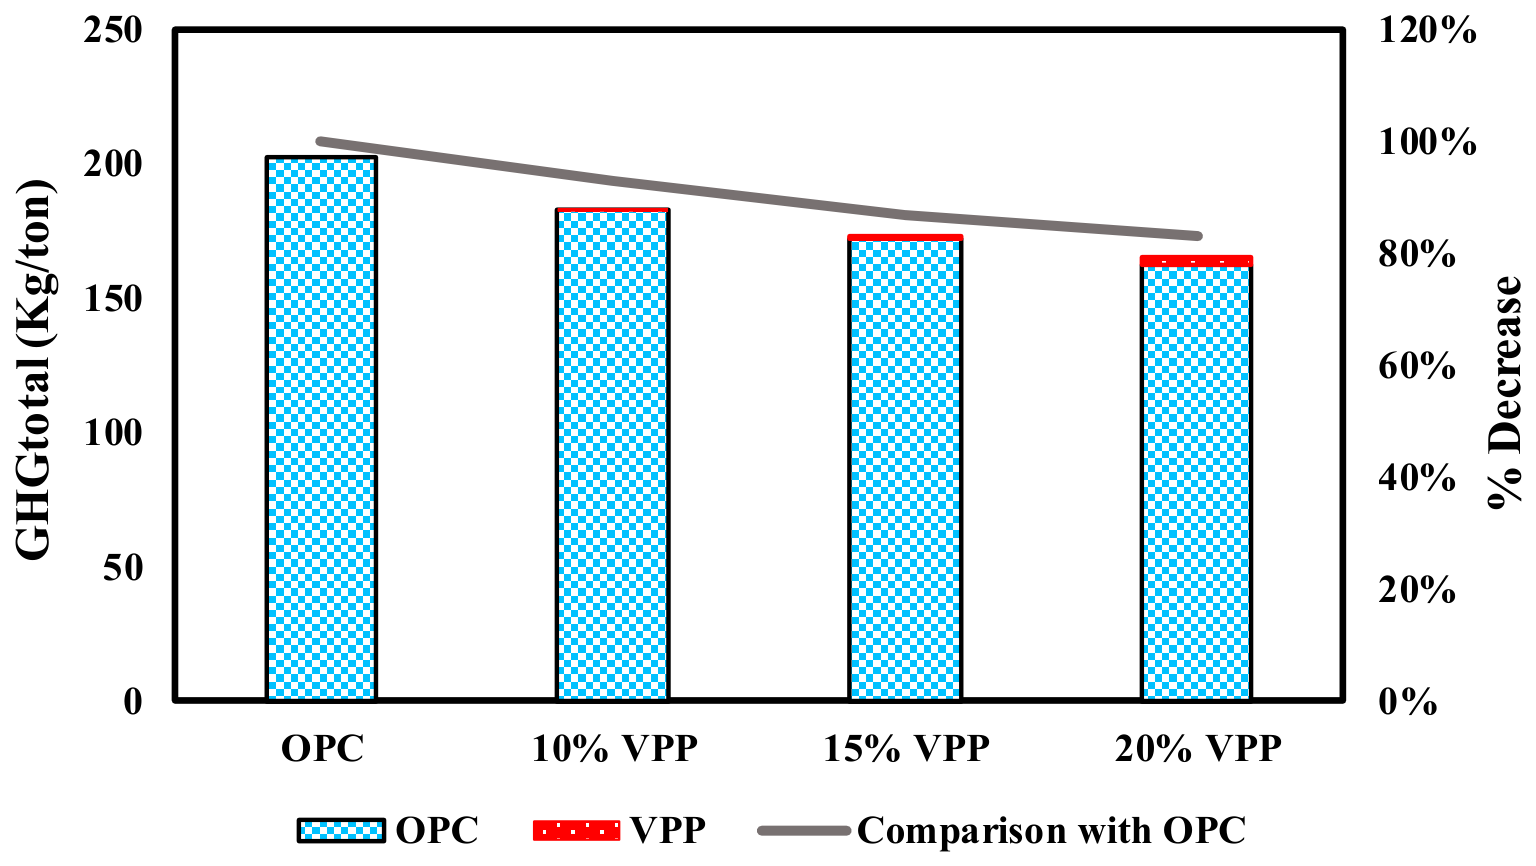
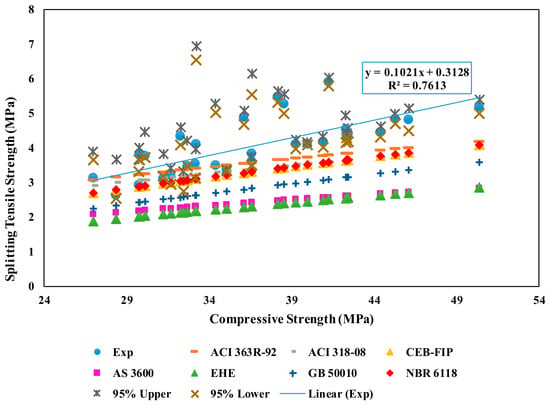
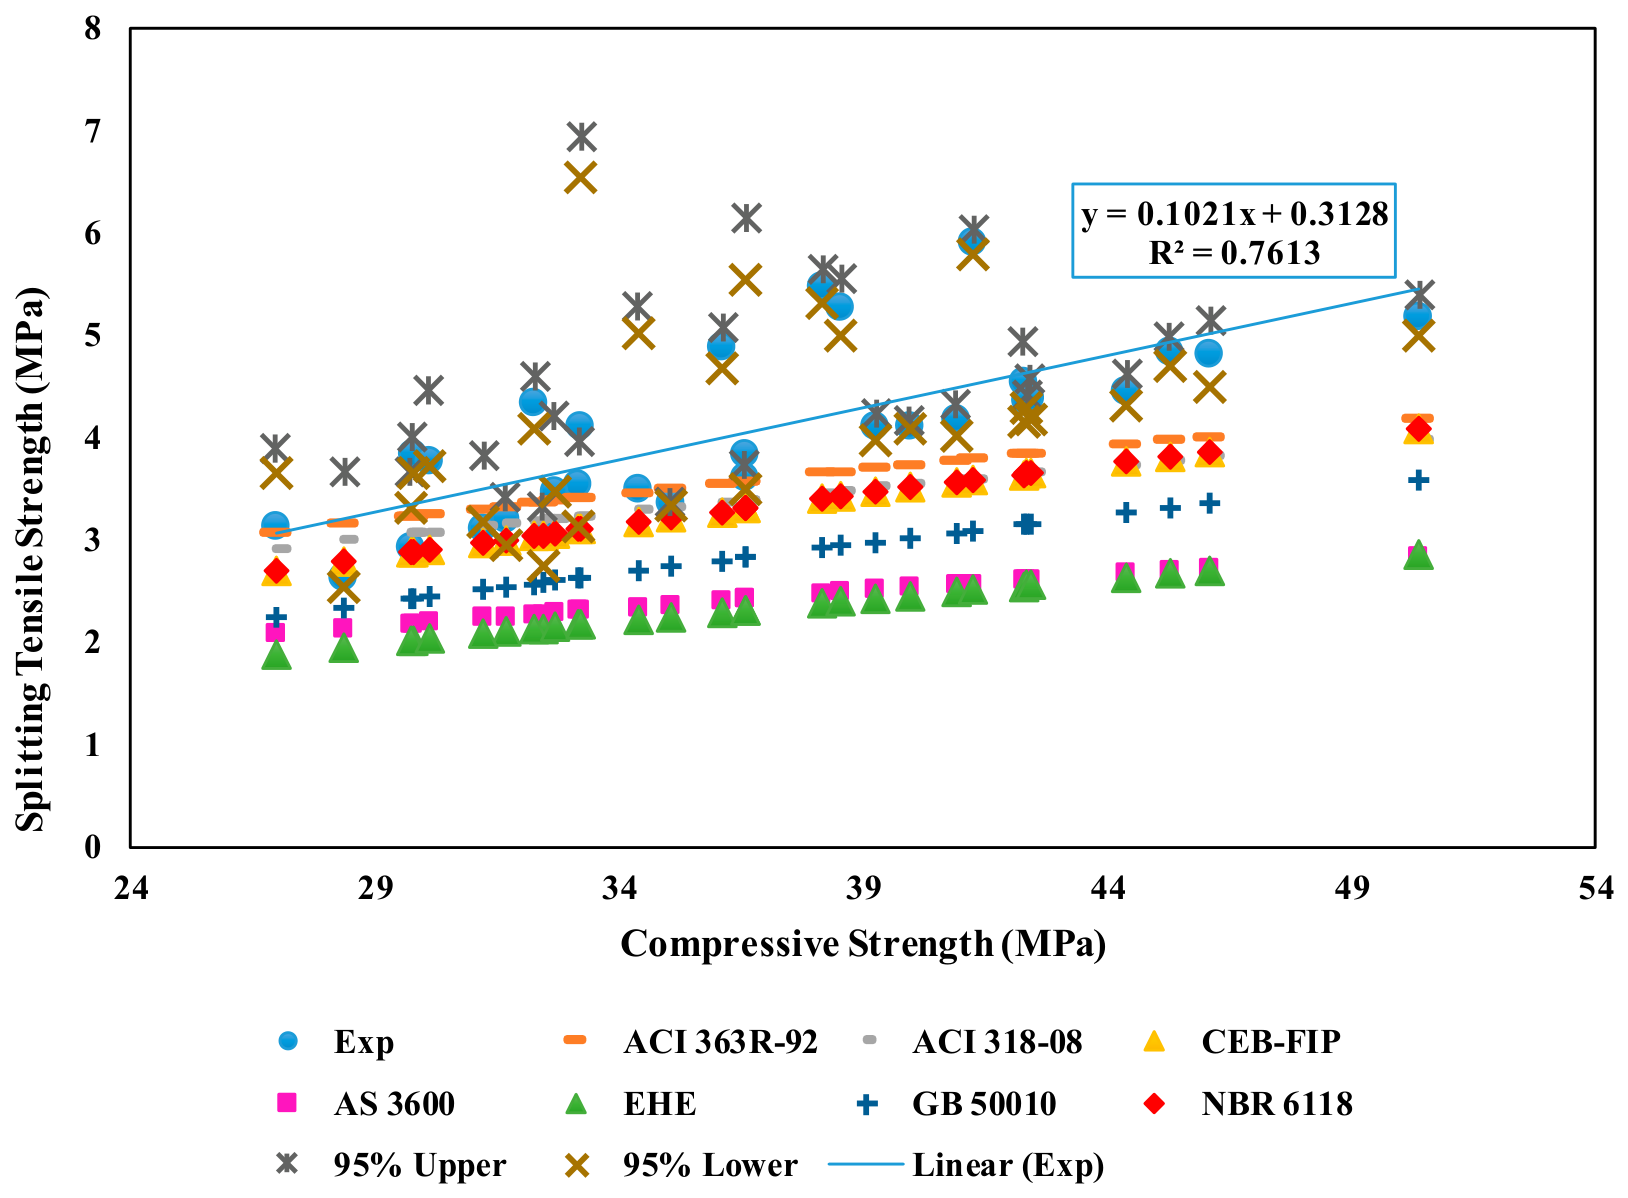
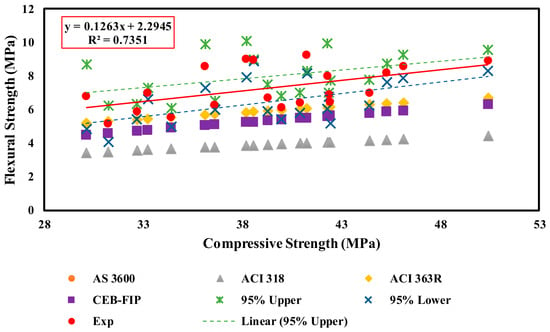
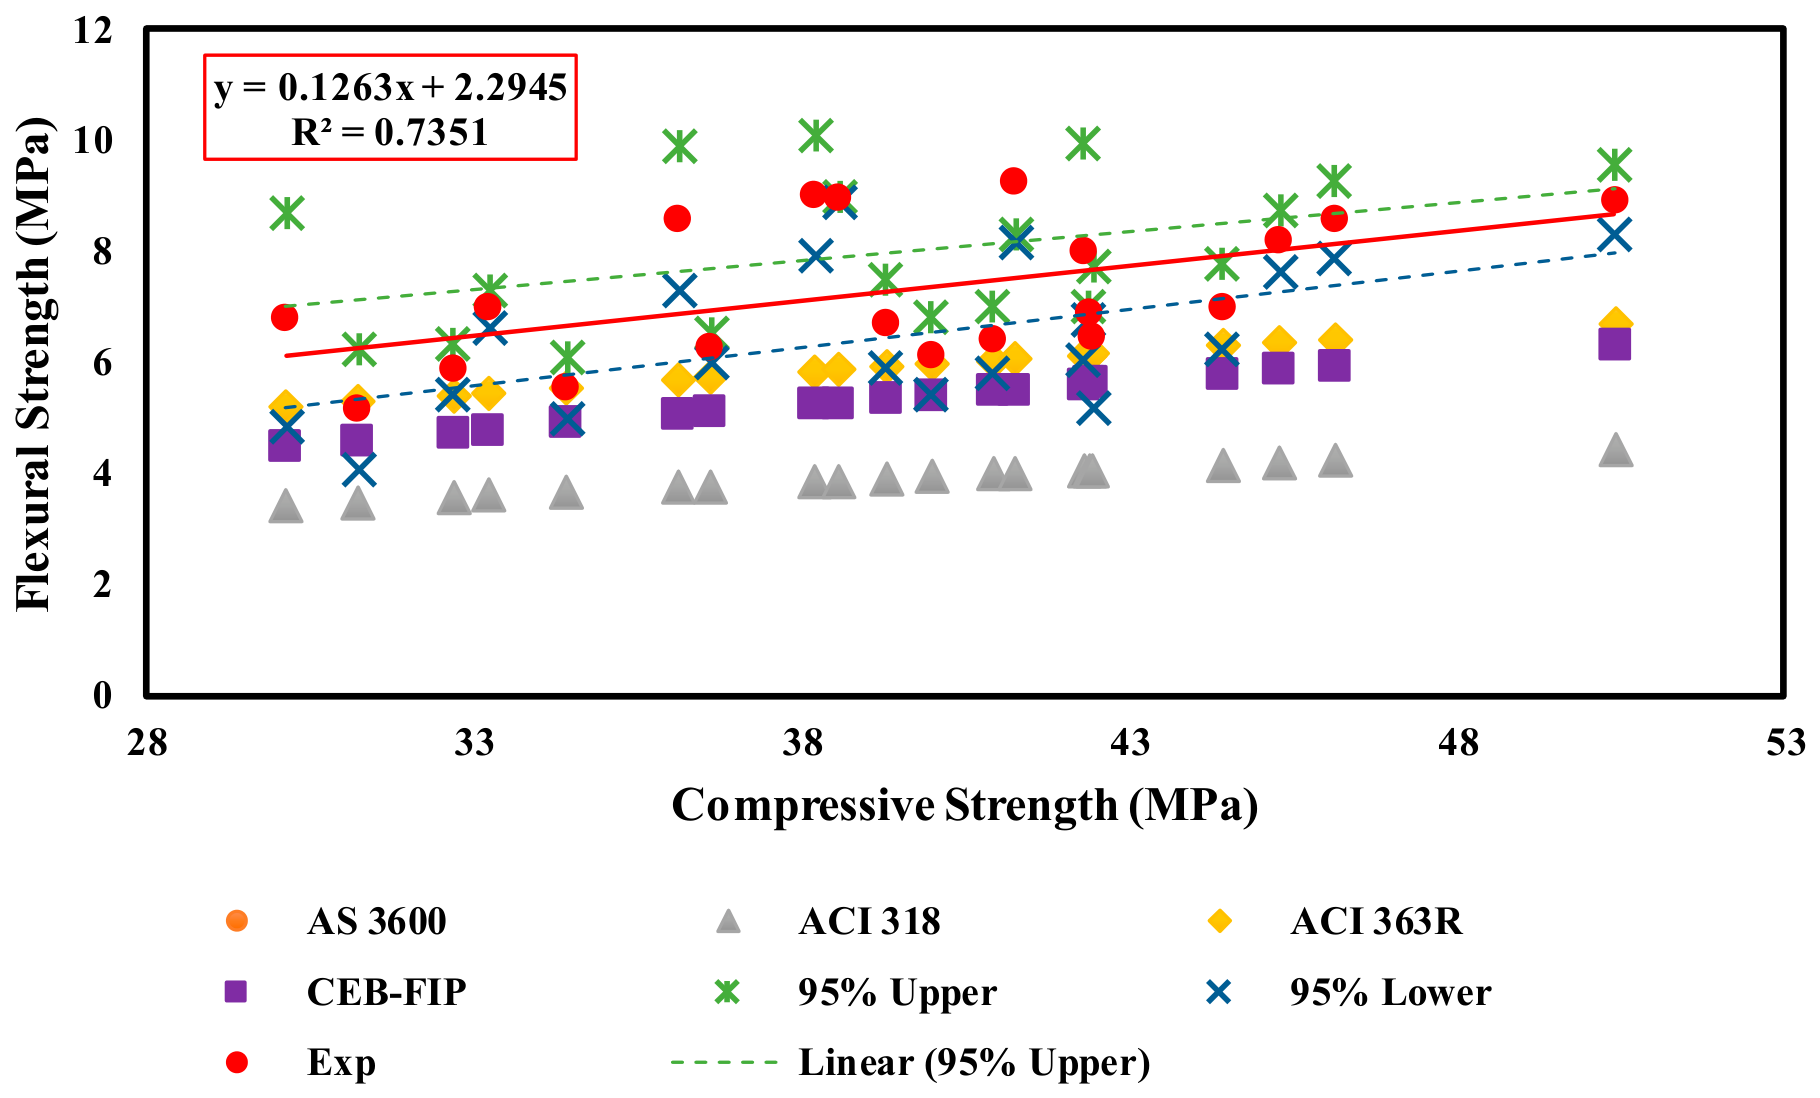
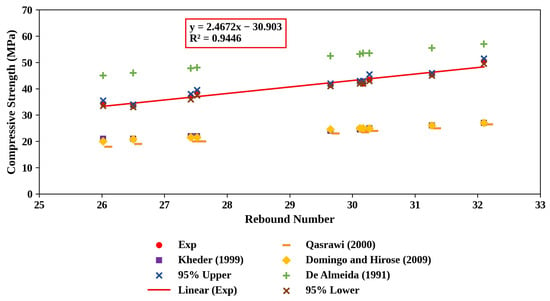
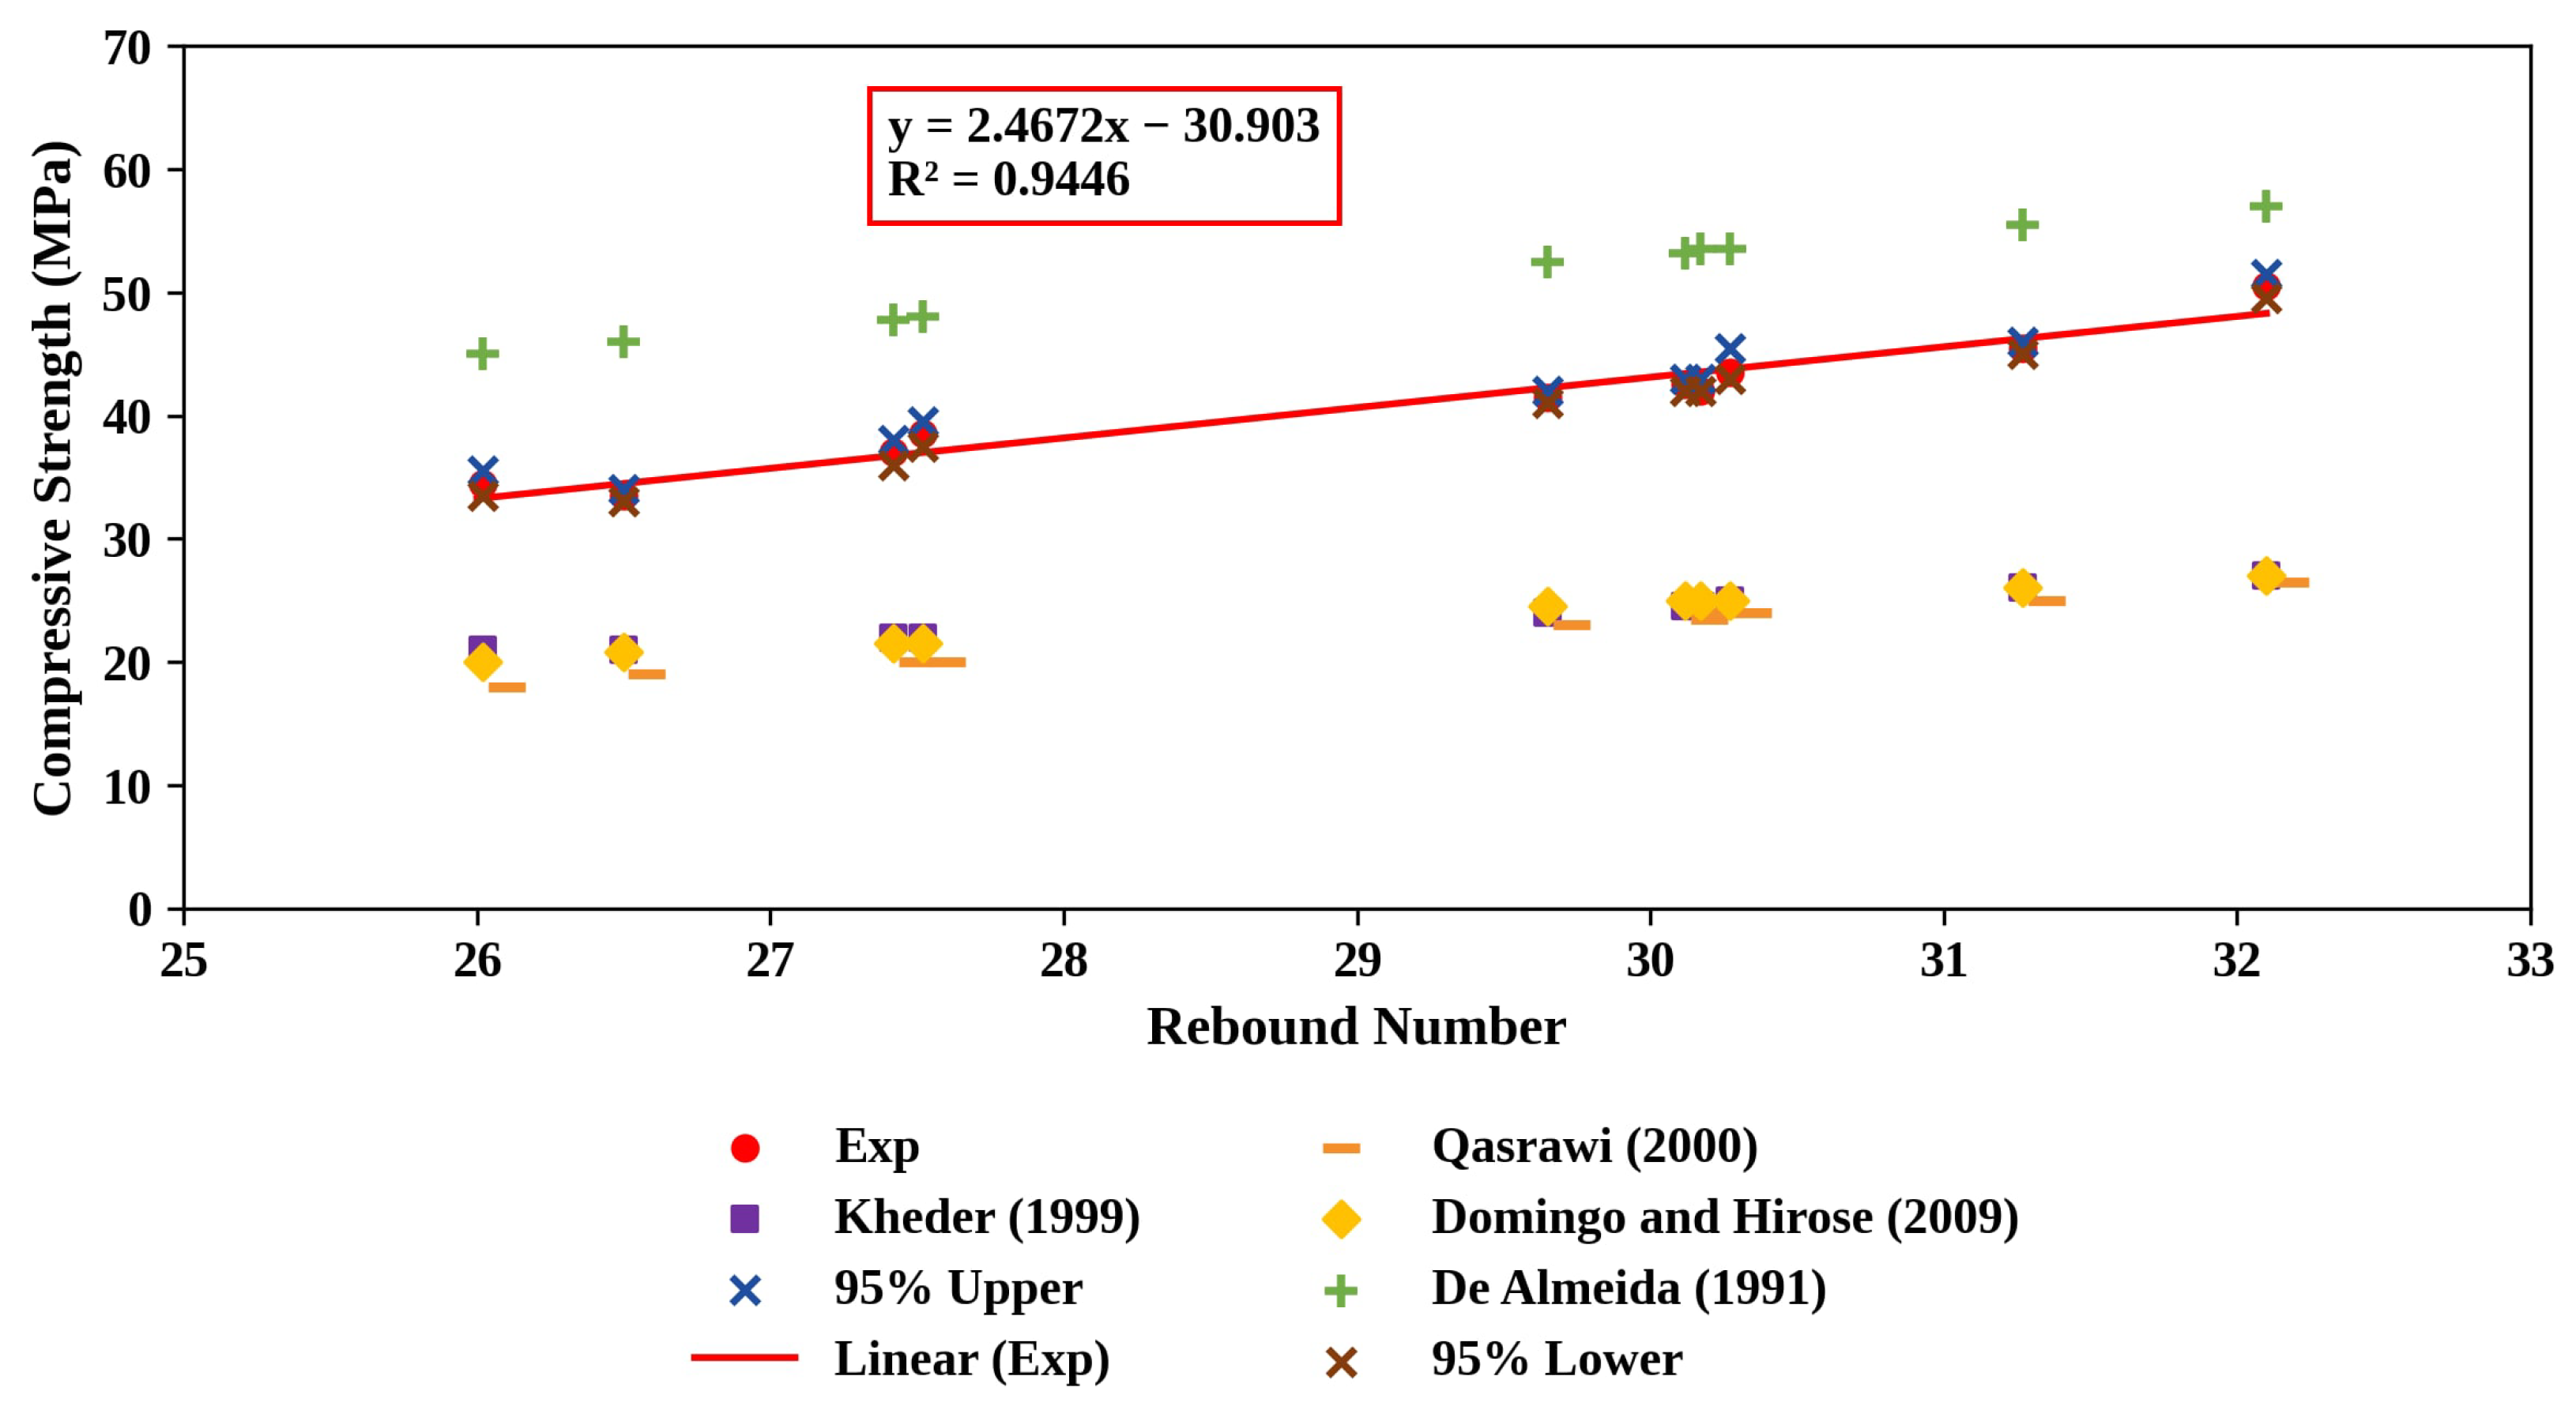
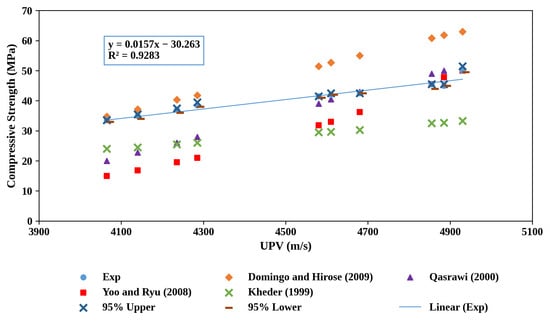
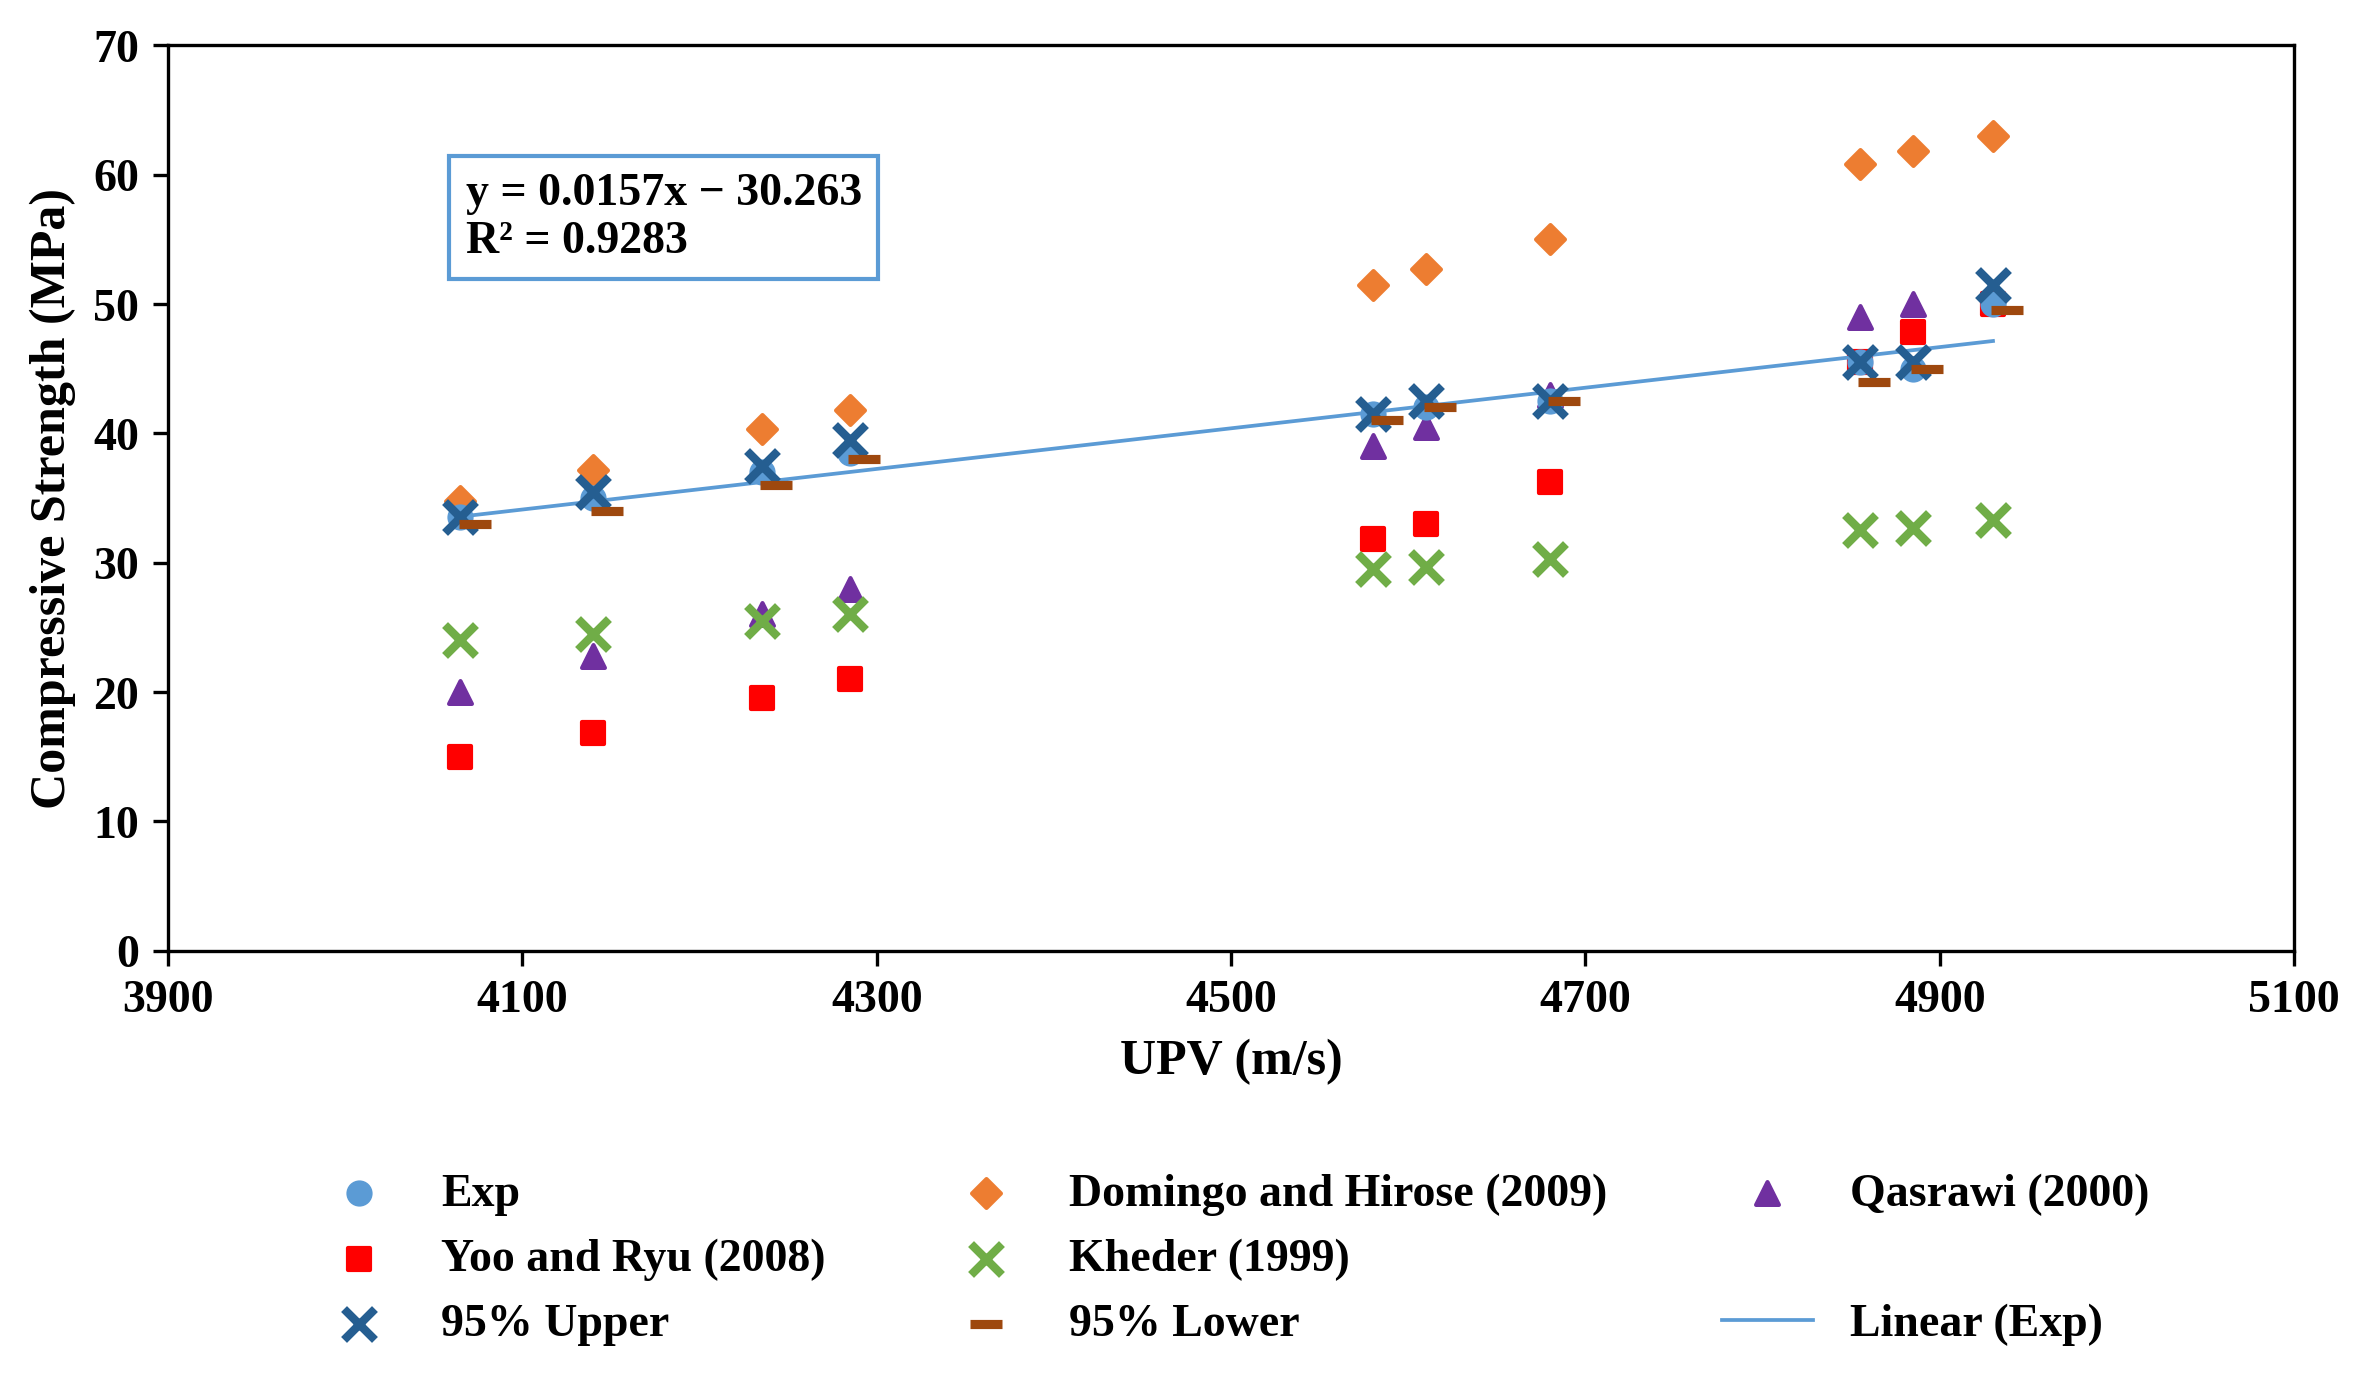
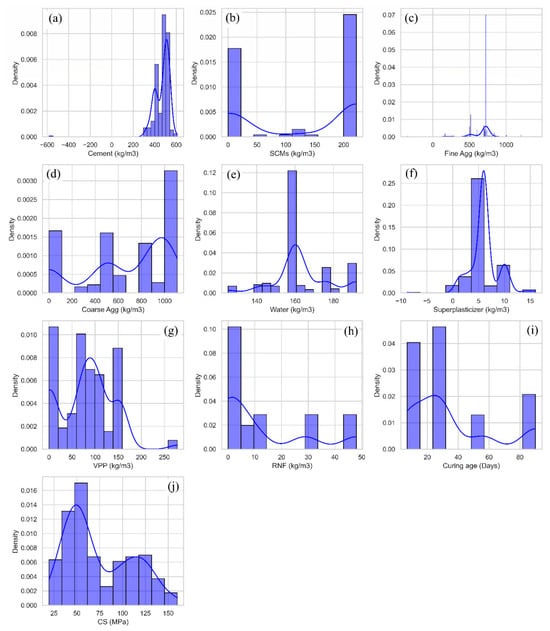
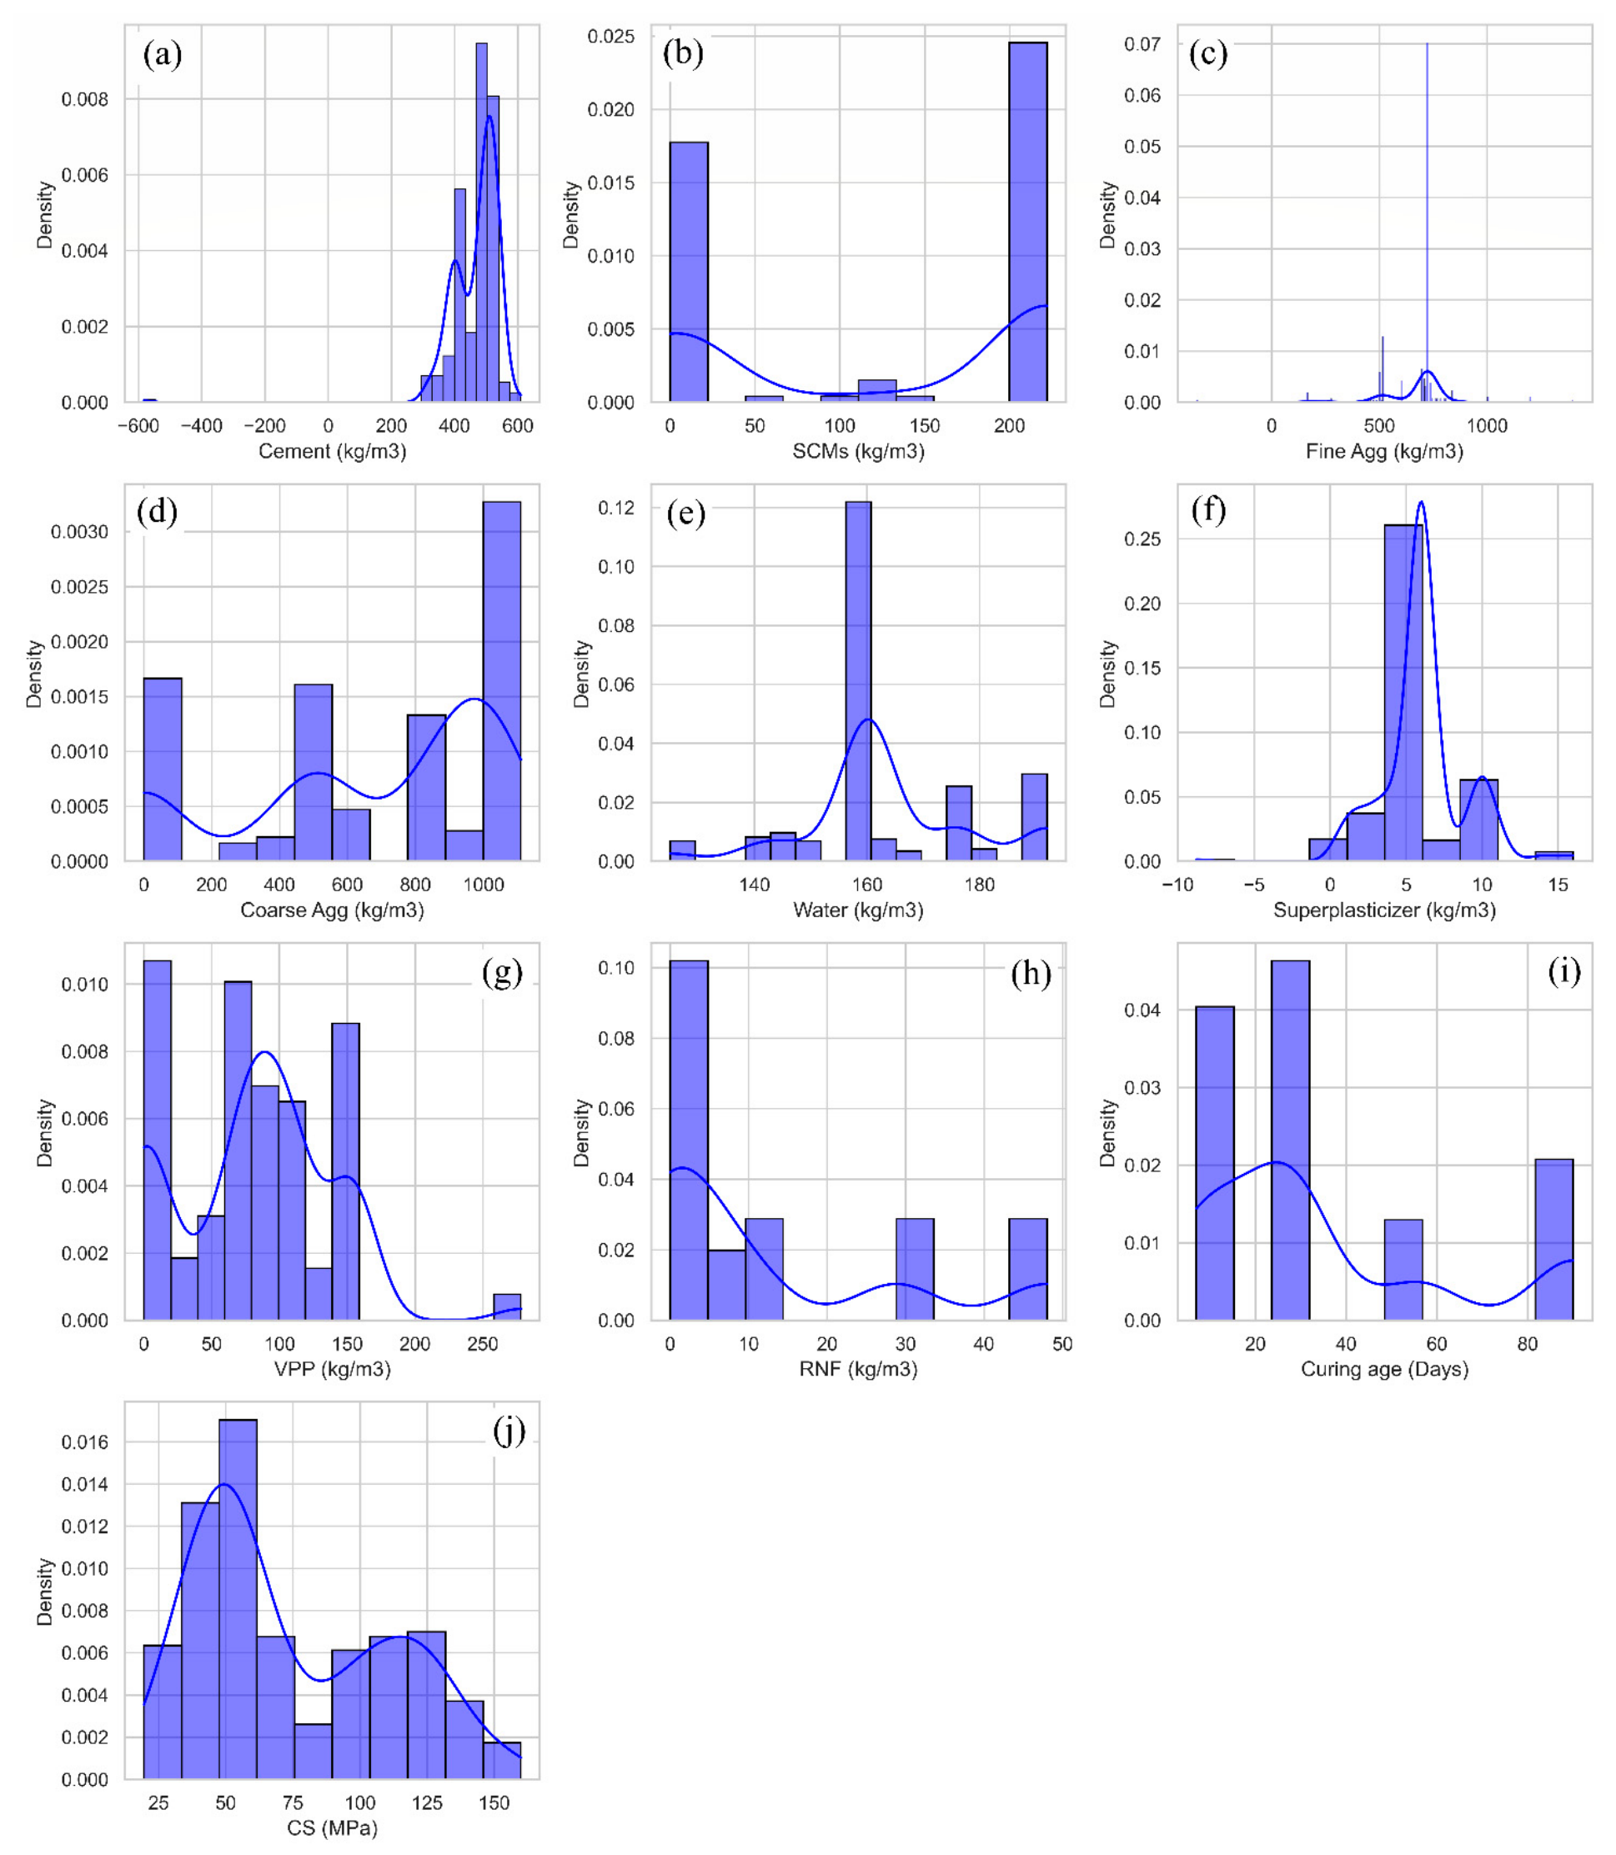
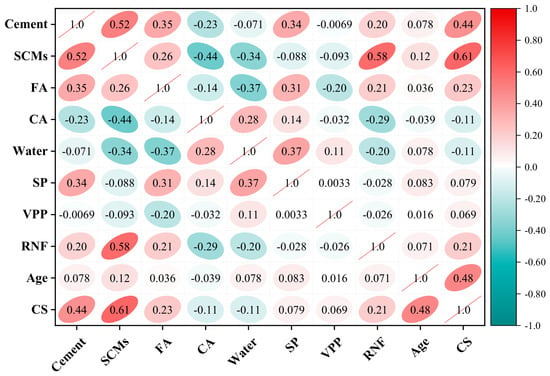
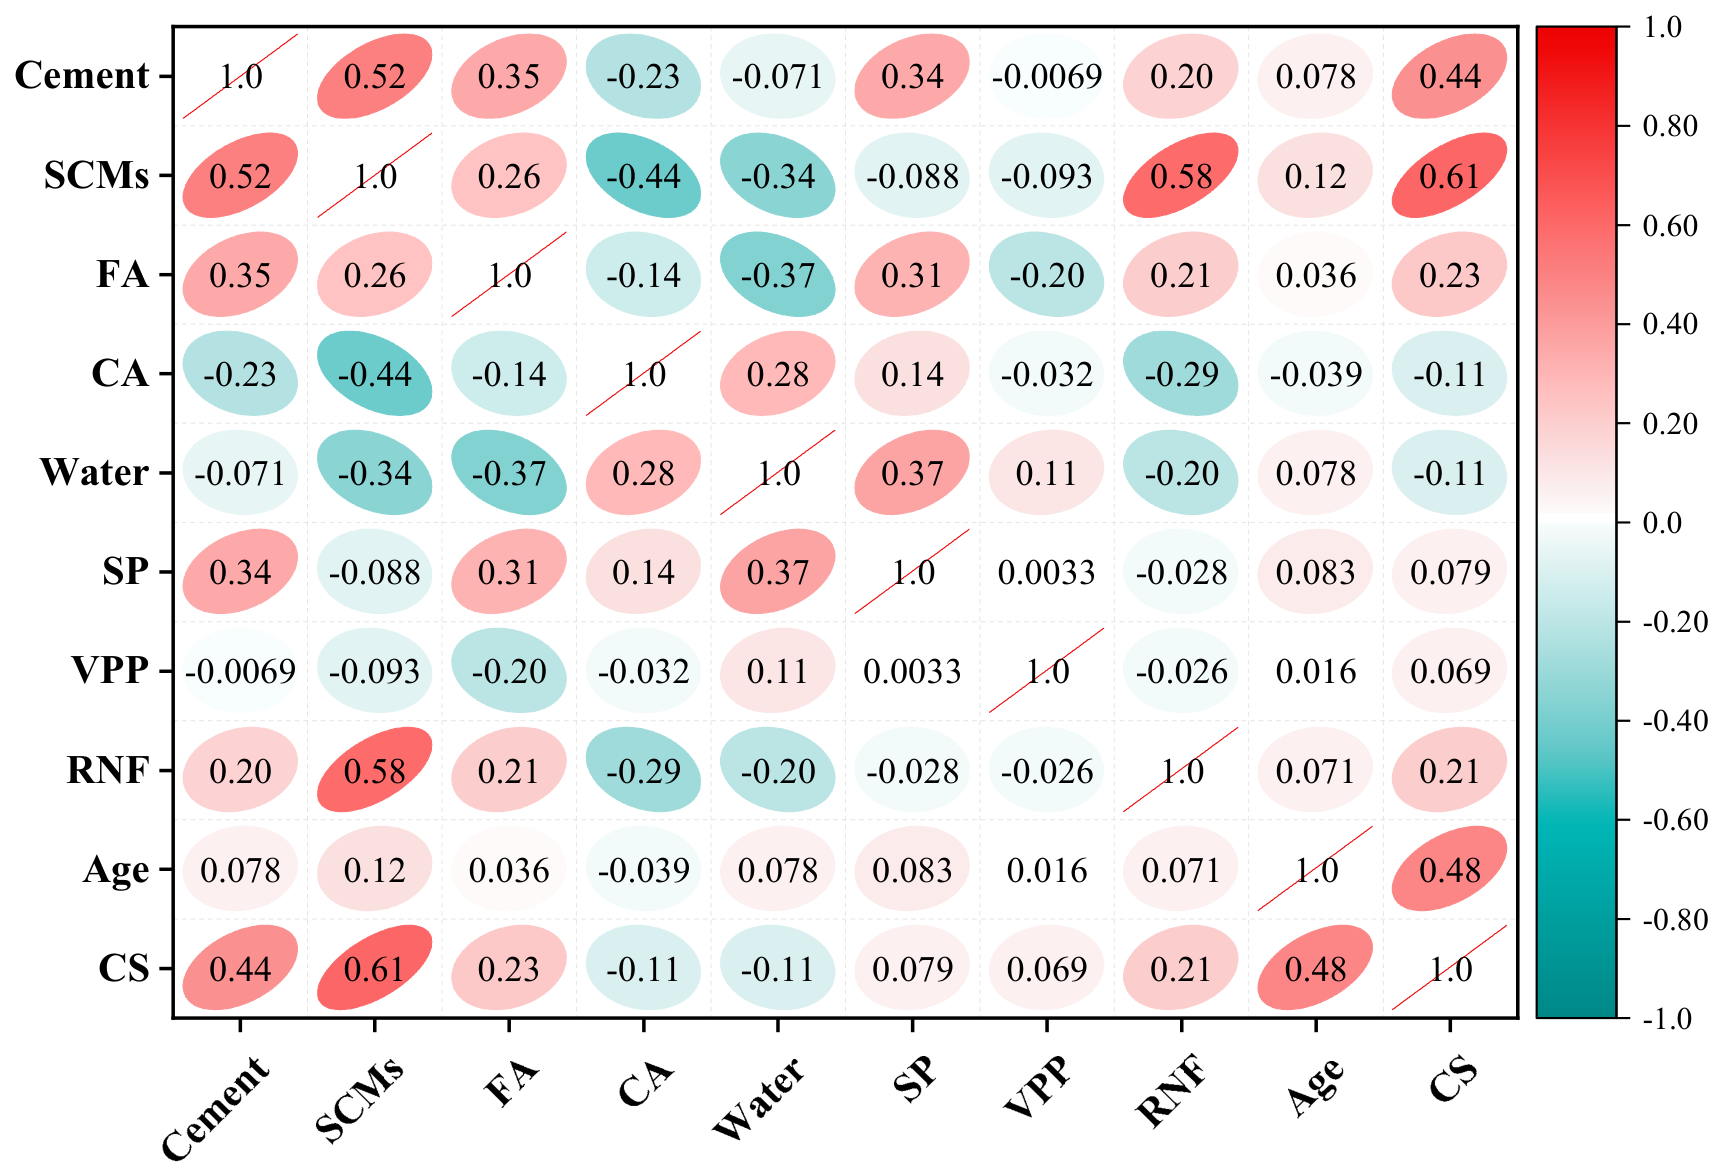
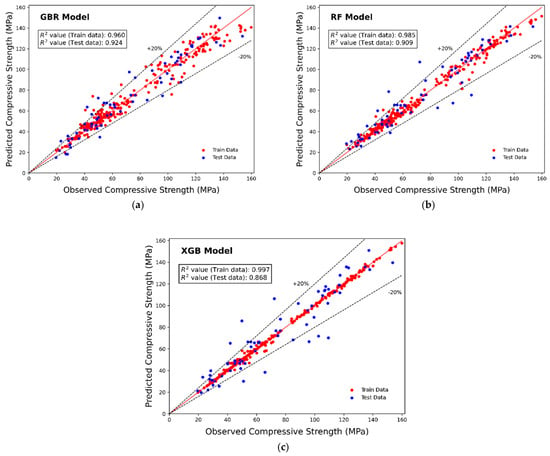
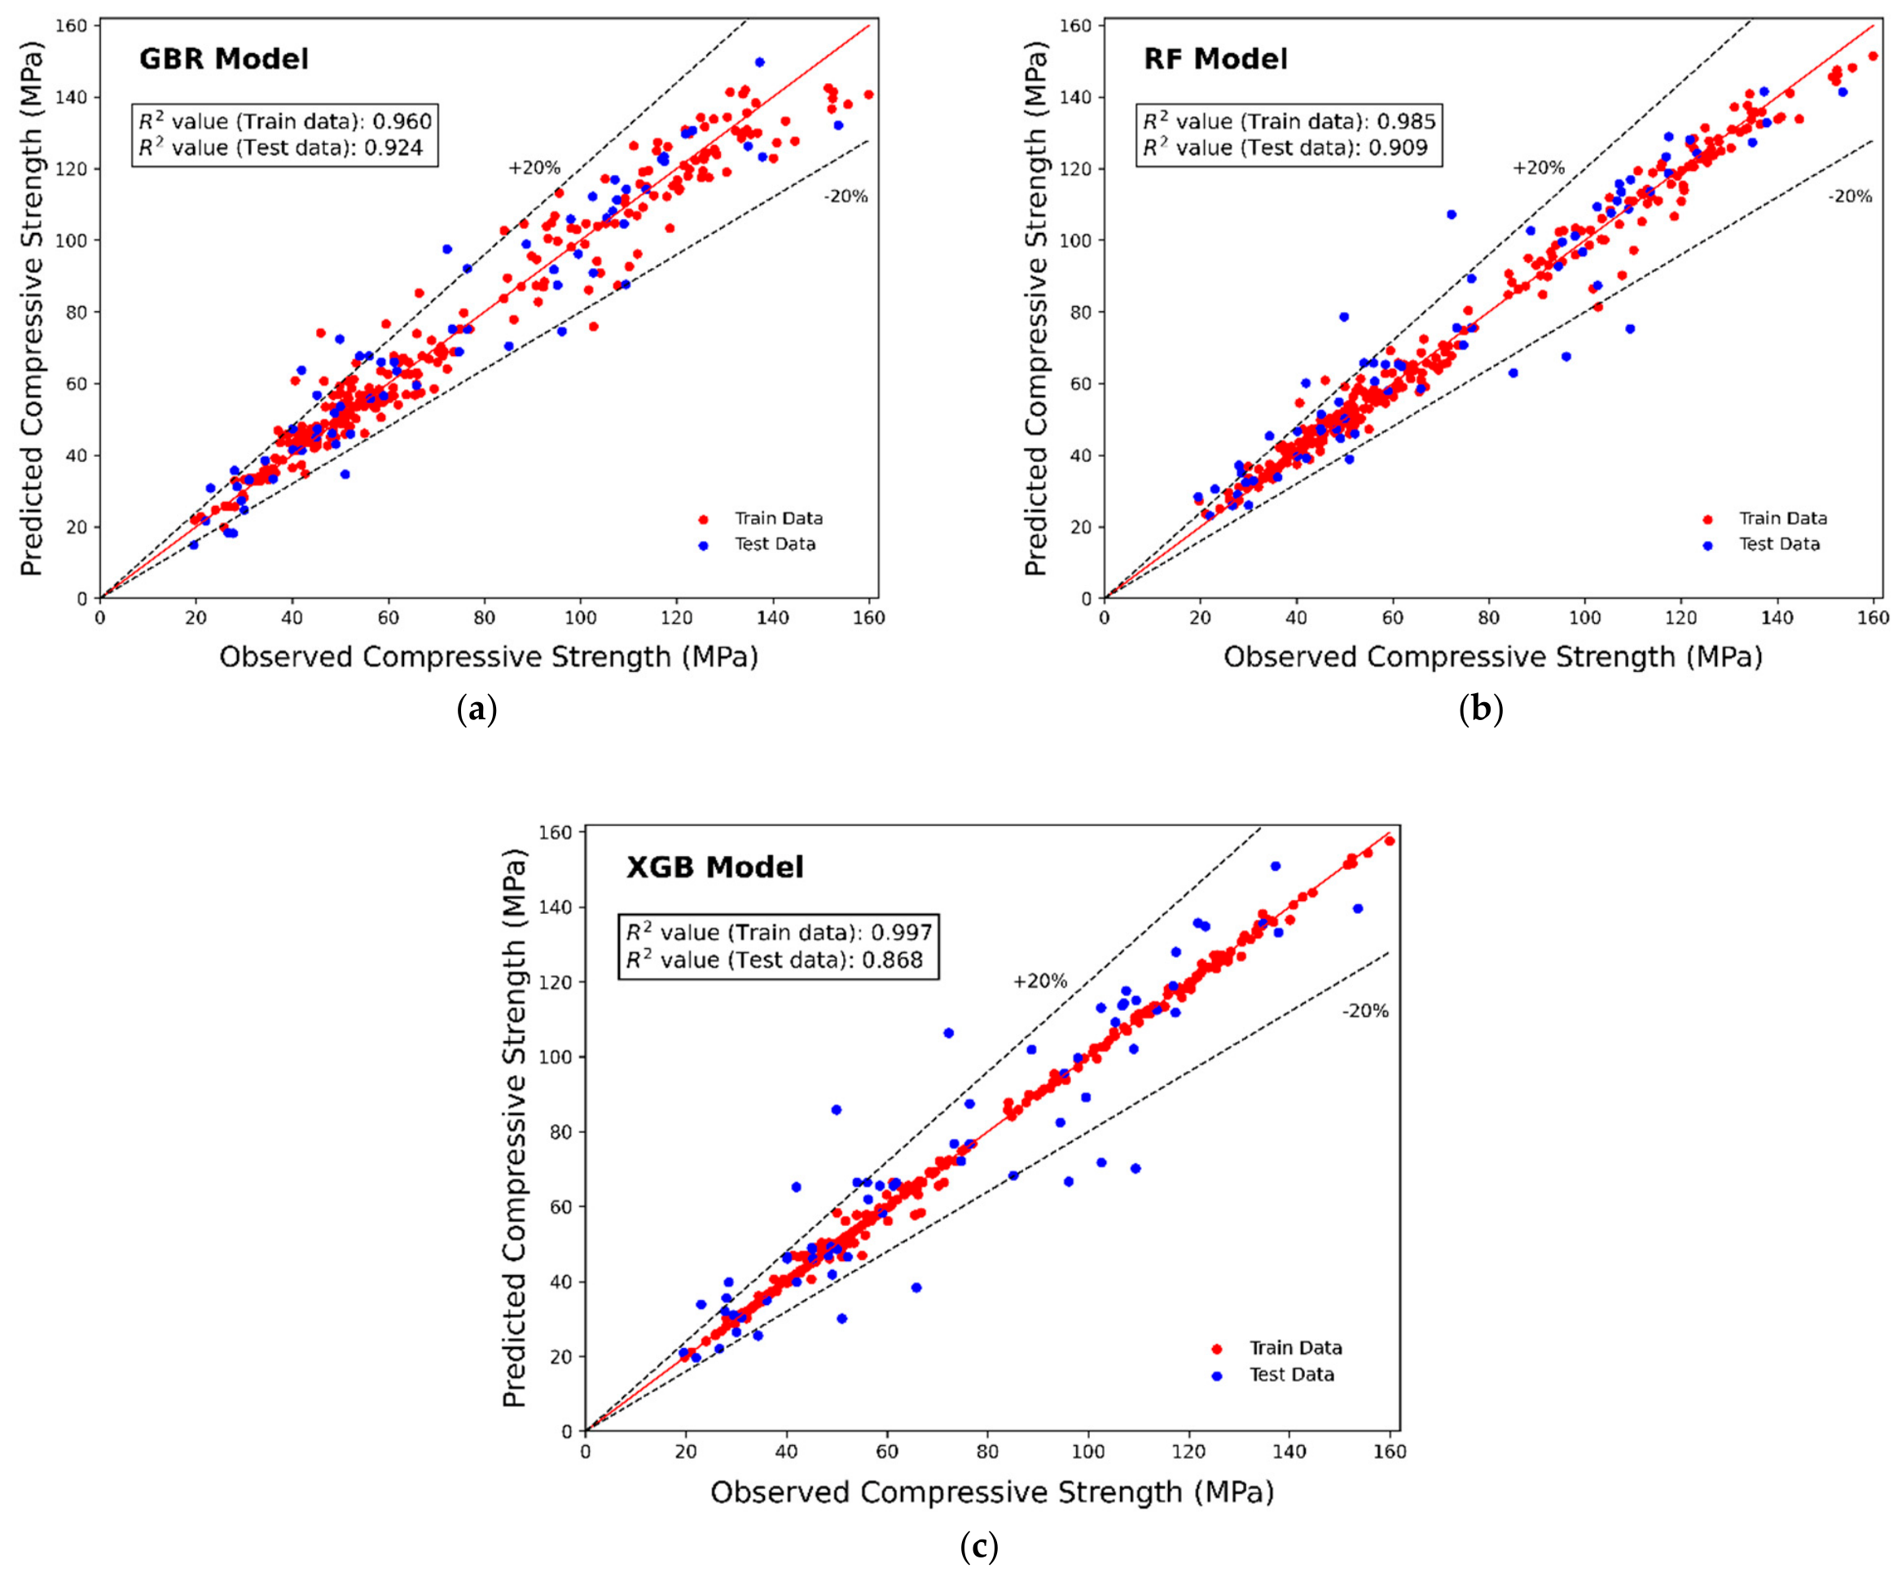
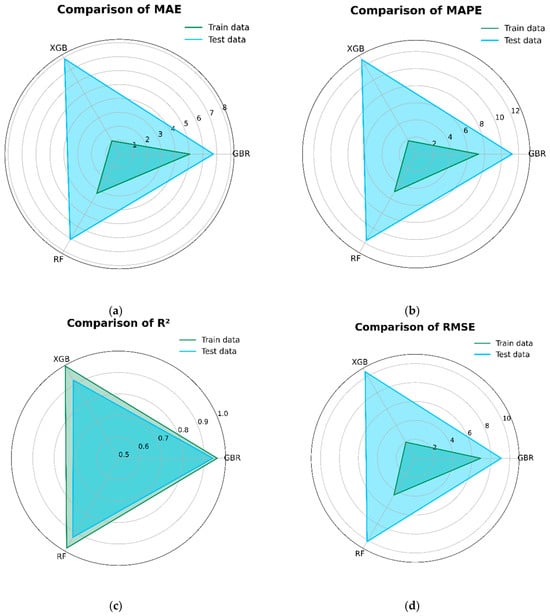
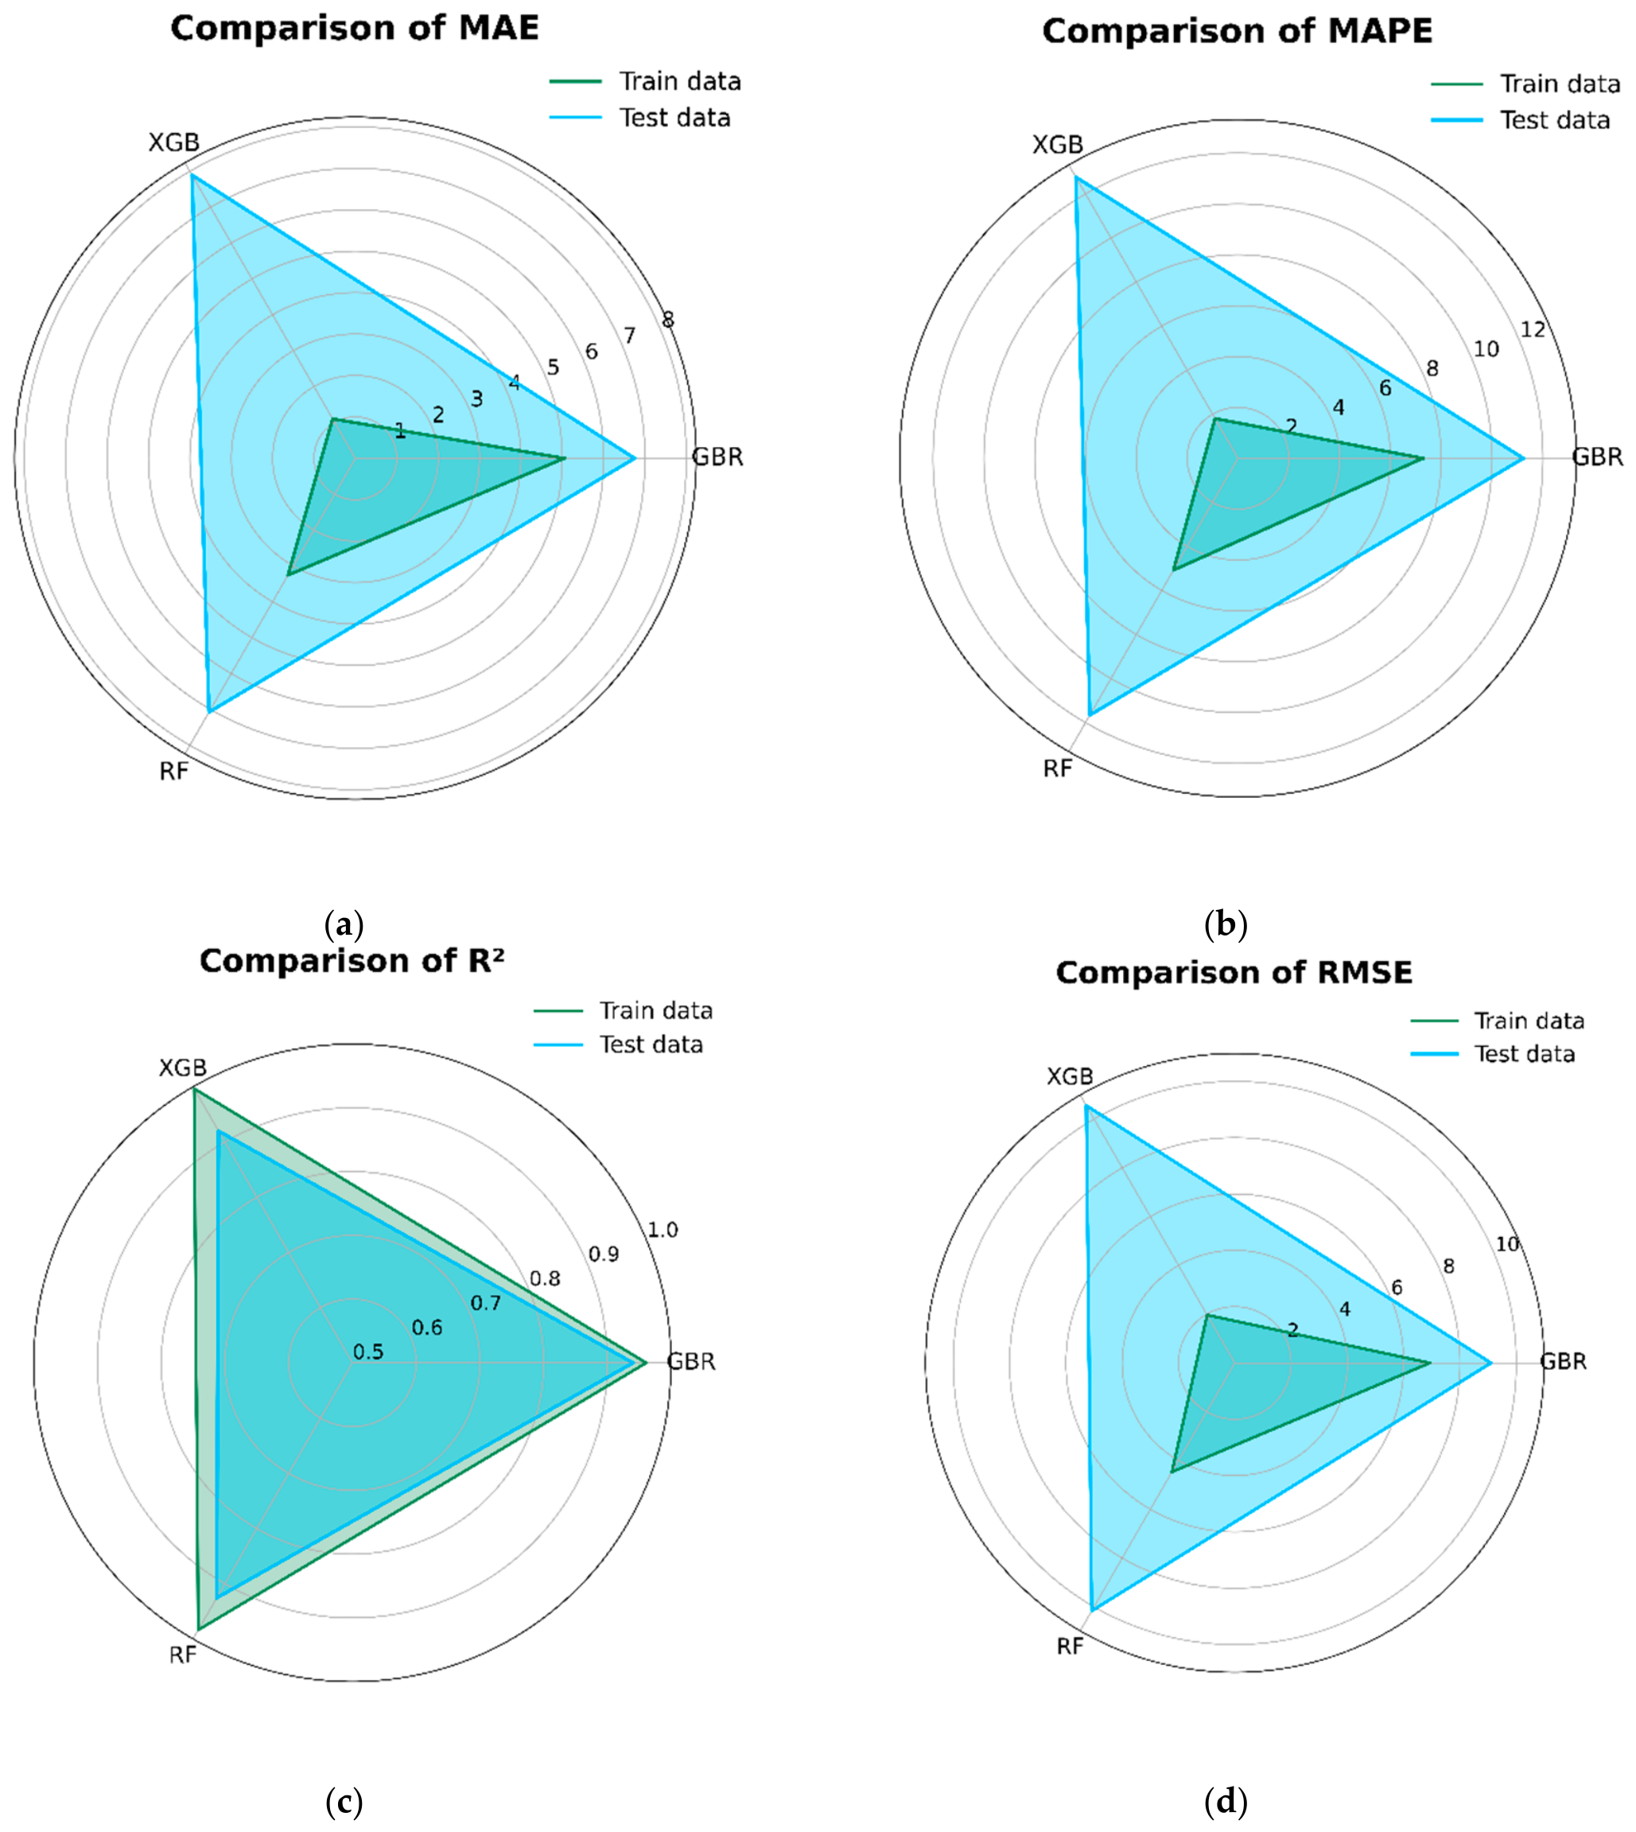
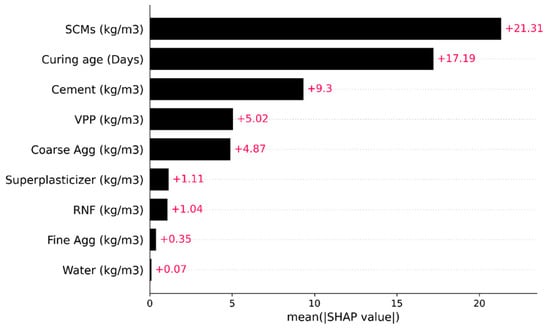
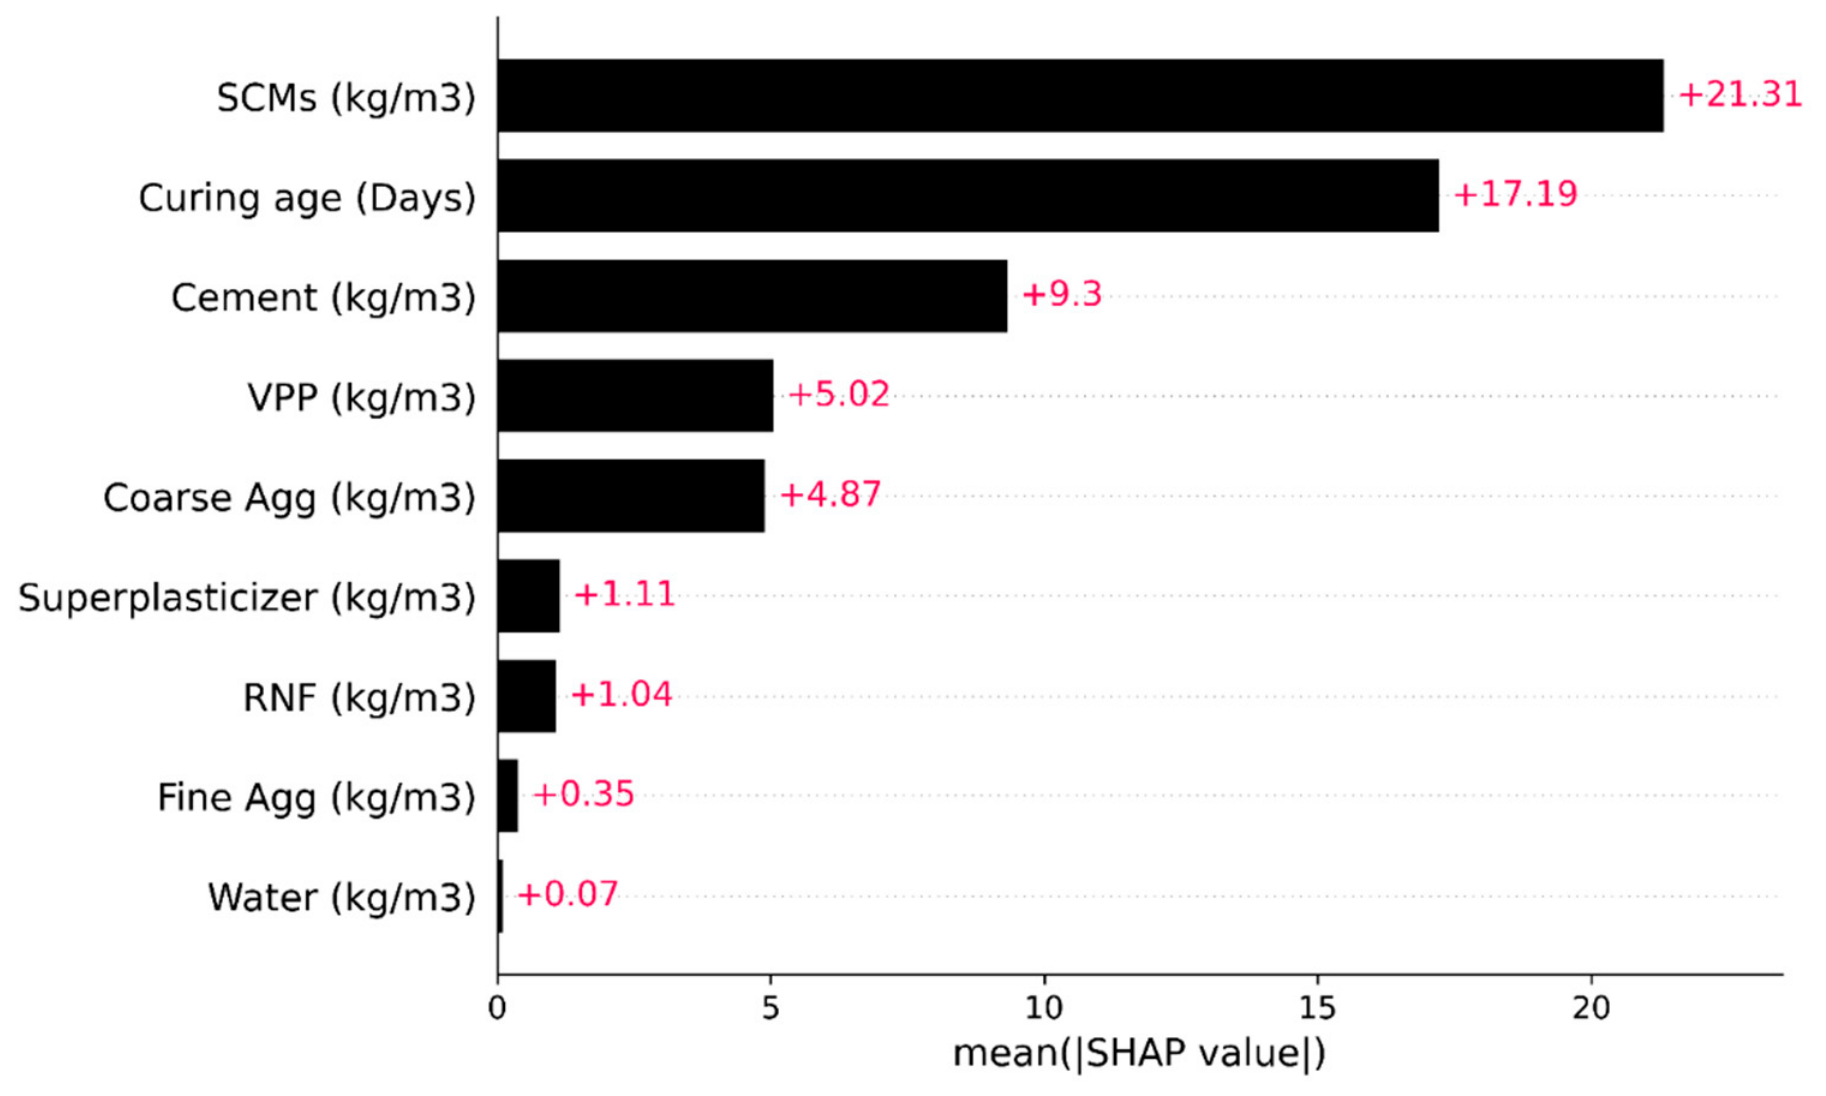
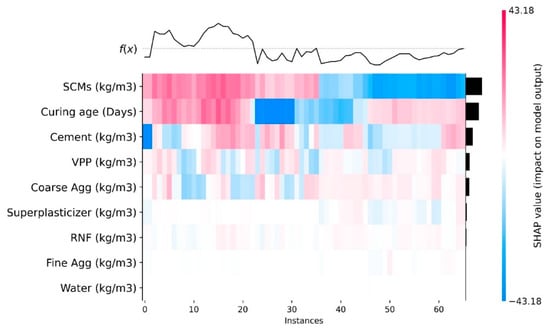
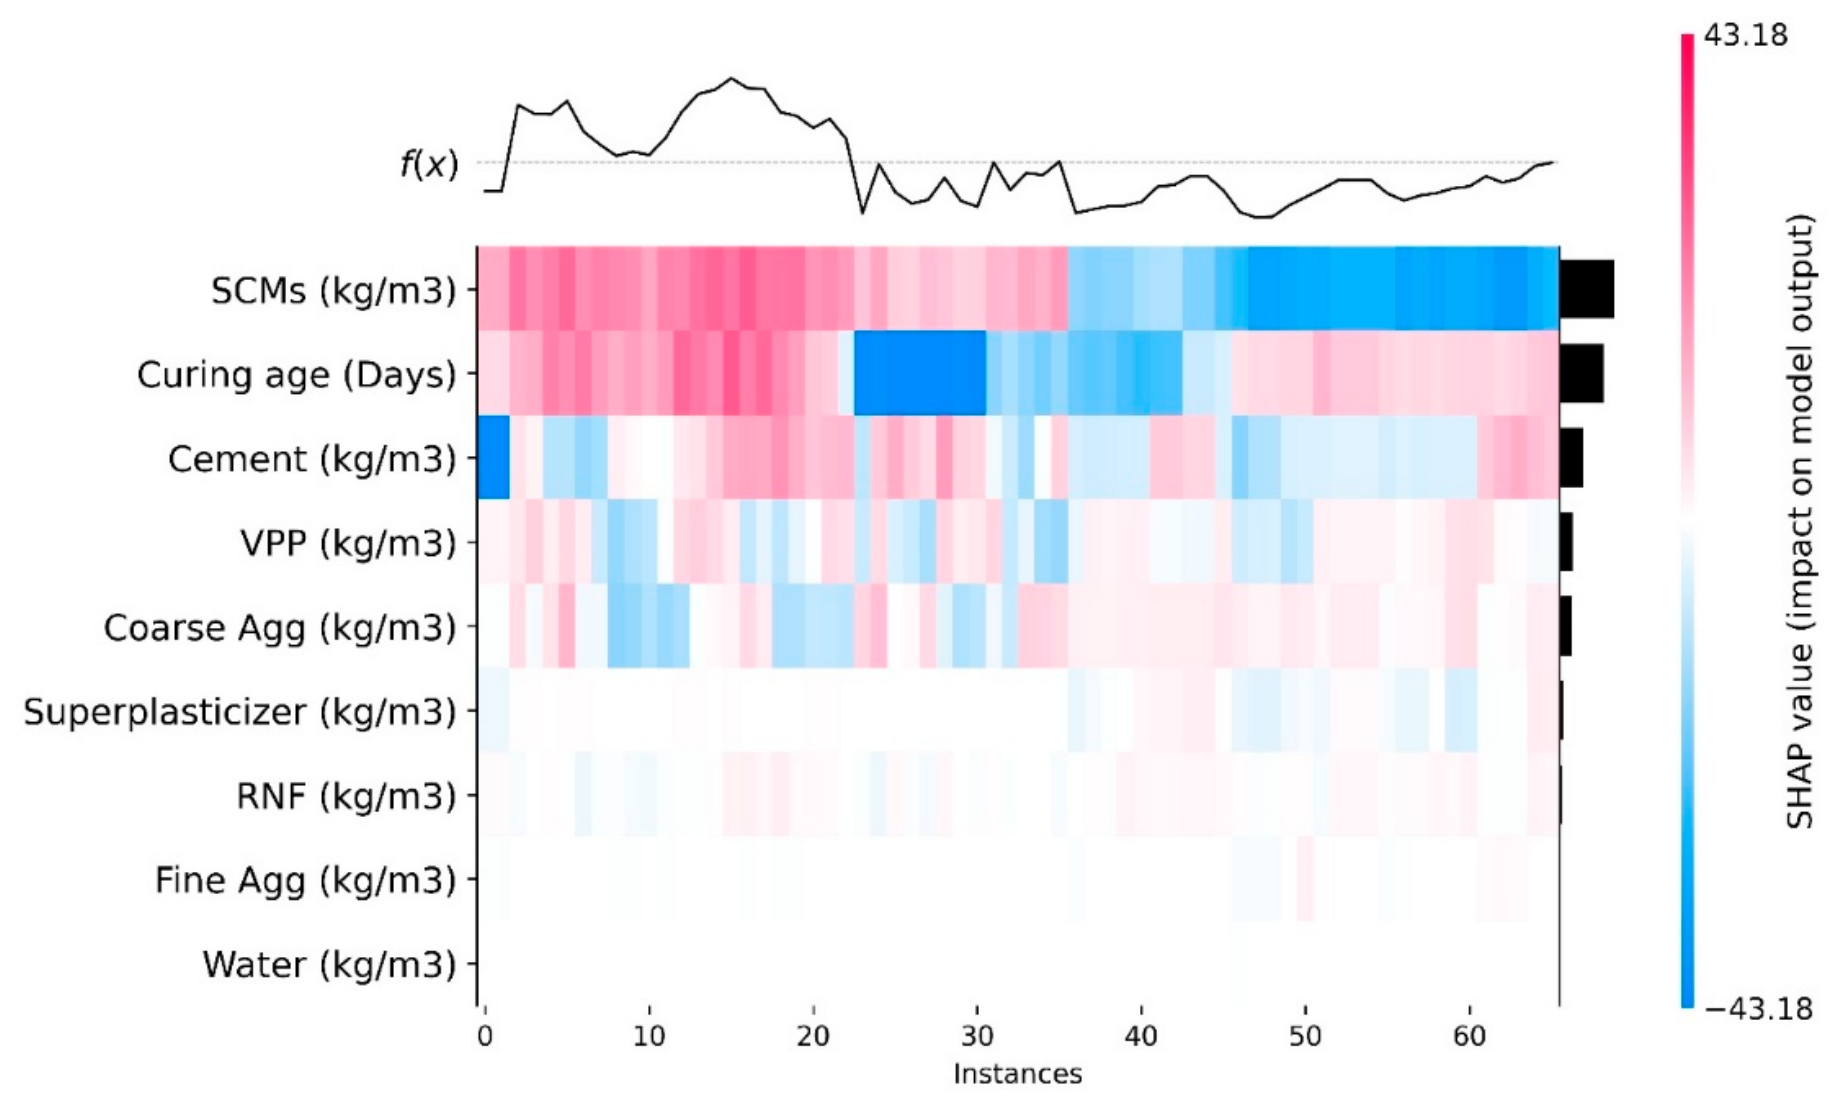
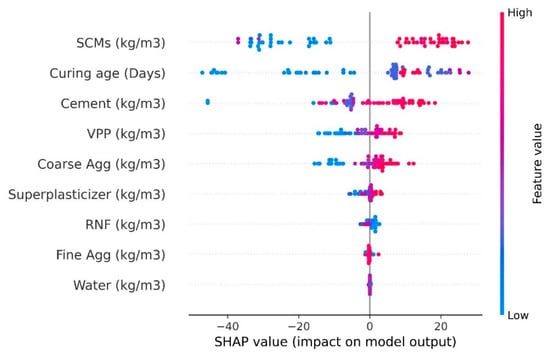
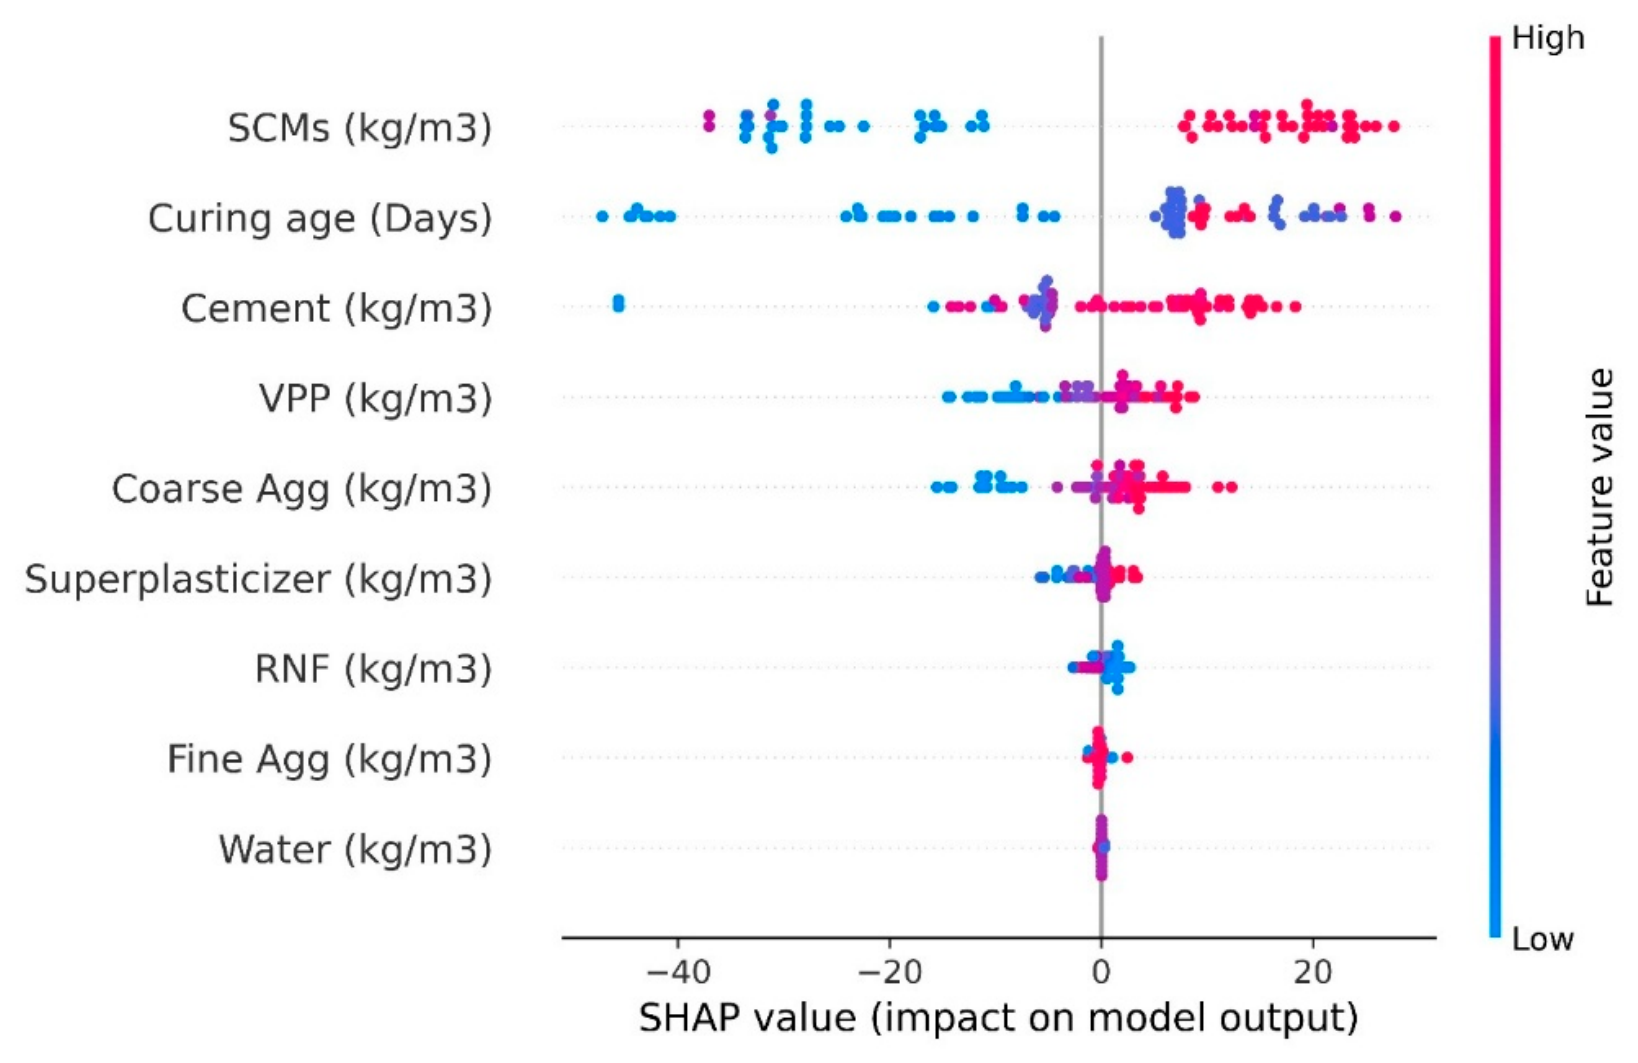

Disclaimer/Publisher’s Note: The statements, opinions and data contained in all publications are solely those of the individual author(s) and contributor(s) and not of MDPI and/or the editor(s). MDPI and/or the editor(s) disclaim responsibility for any injury to people or property resulting from any ideas, methods, instructions or products referred to in the content. |
© 2026 by the authors. Licensee MDPI, Basel, Switzerland. This article is an open access article distributed under the terms and conditions of the Creative Commons Attribution (CC BY) license.