


Abstract
Ensuring deformation control of deep excavations and the safety of adjacent structures is a paramount concern in urban underground construction. This study investigates the disturbance effects induced by the excavation of a long and narrow foundation pit on the surrounding environment, using the Chexie Road Station pit of Suzhou Rail Transit Line 8 as a case study. Comprehensive and usable geotechnical data were acquired through a series of laboratory and field tests, which served as the foundation for this research. Both numerical simulation (Midas GTS NX) and on-site monitoring were employed to analyze the responses of the ground surface, enclosure structure, and an adjacent operating metro station, as well as nearby buildings to the excavation unloading. The results indicate that the maximum ground surface settlement occurs near the midpoint of the pit’s long side, and the settlement trough is located approximately 10 to 15 m from the pit edge. The depth of the maximum lateral displacement of the diaphragm wall (Hm) is found to be within the range of (He−2) to (He+2), where He is the excavation depth. Furthermore, existing buildings situated adjacent to the middle of the foundation pit’s long side are most susceptible to excavation-induced disturbances, whereas the impact on the operating station near the end well is relatively minimal. Consequently, it is recommended that monitoring efforts be intensified in the central region of the foundation pit’s long side during construction to strictly control excavation-induced disturbances.
1. Introduction
Due to their unique structural characteristics and excavation geometries, long and narrow foundation pits in urban areas with existing buildings and operating metro stations face increasingly stringent construction requirements [1]. Excavation of metro station foundation pits is not only related to soil deformation and the stability of retaining structures, but also exerts potential impacts on surrounding buildings and adjacent metro stations [2]. Therefore, monitoring the deformation of foundation pits and the responses of surrounding existing buildings during deep excavation of metro stations has become a major research focus, and numerical analysis methods have been widely adopted in such engineering projects [3].
With regard to deformation mechanisms and failure evolution during foundation pit excavation, studies have proven that soil unloading and stress redistribution are the primary causes of lateral displacement of retaining structures and deformation of adjacent structures. Zhou et al. [4] systematically analyzed the structural responses of existing metro stations under unilateral deep foundation pit excavation conditions and identified the influences of excavation depth and structural width on deformation characteristics and failure evolution. The results indicate that structural deformation shows obvious staged features, and the failure process can be divided into stable, warning, and instability failure stages. Zhang and Zhu used three-dimensional numerical simulations to study the evolution of lateral displacement of retaining structures and axial forces of struts during deep foundation pit construction of metro stations, and regarded pit bottom heave as an important factor affecting the vertical displacement of columns [5]. Based on engineering cases in soft soil areas, Ge et al. [6] revealed the nonlinear evolution laws of retaining structure lateral displacement, ground settlement and pit bottom heave.
In terms of spatiotemporal responses and spatially heterogeneous deformation behaviors, a broad consensus has been reached that deep foundation pit projects deviate from the conventional two-dimensional plane strain assumption, as their deformation responses possess prominent spatial variability. From a spatiotemporal viewpoint, Zhang examined the distribution rules of retaining wall deflection and ground surface settlement for deep excavations. The results show that displacement magnitudes at the mid-length of pit long sides are substantially higher than those at pit corners, and deformation accumulates gradually throughout construction [7]. Combining full-life-cycle on-site monitoring data with three-dimensional nonlinear finite element models, Li et al. systematically explored the spatiotemporal evolution of excavation deformation in soft soil and validated the capability of 3D coupled models to reproduce spatial deformation distributions [8]. Guo et al. further revealed that the lateral deflection of retaining walls presents a distinct bulging mode for large and deep foundation pits in complex surroundings, and proved that the influential range of wall-rear settlement greatly surpasses the excavation depth [9].
Regarding the adverse impacts of deep excavation on nearby existing structures, current studies predominantly target sensitive infrastructures such as metro tunnels, station frameworks and bridges [10,11]. Xiao et al. evaluated the deformation control capacity of MJS cement-soil composite piles and grouting reinforcement at an irregular deep pit adjacent to multiple tunnels, and verified that rational reinforcement measures can significantly alleviate excavation-triggered structural displacements [12]. Zhao et al. quantified the influences of strut installation sequence and retaining wall embedment ratio on deformation restriction of metro station pits constructed within weathered rock–soft soil mixed ground [13]. Based on field engineering cases, Di et al. analyzed the threats posed by strip excavation next to high-speed railways to subgrade stability and confirmed the reliability of multi-combination protection methods for excavation deformation control [14]. Targeting adjacent bridges and operating metro tunnels separately, Yan et al. and Zhao et al. investigated excavation-induced disturbance as well as the engineering value of automatic monitoring and feedback regulation technologies [15,16].
For numerical simulation and deformation prediction techniques, three-dimensional finite element methods have become the dominant tool to characterize the deformation behaviors of deep foundation pits [17,18,19]. By constructing 3D finite element models, Liu et al., Lin et al., and Huang et al. systematically examined the deformation laws of retaining walls, support systems and nearby rail transit facilities, and confirmed favorable consistency between numerical outputs and on-site monitoring measurements [20,21,22]. Building upon these findings, Liu et al. developed a two-stage surrogate model for fast forecasting of stratum and tunnel displacements triggered by excavation unloading [23]. Relying on the minimum potential energy theorem, Luo et al. established a deformation prediction framework that accounts for spatial excavation effects [24]. Later, Li et al. incorporated machine learning algorithms to realize high-efficiency forecasting of lateral deflections of adjacent pile groups [25]. More recently, mix-specific calibration and uncertainty-aware prediction have received increasing attention. Studies on concrete and non-destructive strength prediction have shown that generic correlations can produce large errors when applied outside their calibration range, highlighting the need for local calibration of material parameters [26,27]. In parallel, depth-dependent soil characterization and uncertainty-aware 3D geotechnical mapping have been developed to represent vertical variability and prediction uncertainty, which are difficult to capture with layer-wise uniform properties [28,29,30]. These approaches provide a basis for improving parameter assignment in excavation analysis, particularly where borehole data are sparse and soil properties vary systematically with depth.
In summary, substantial achievements have been obtained in existing studies regarding deformation mechanisms, spatiotemporal effects, numerical simulation, and deformation control techniques of deep foundation pits. However, most research objects have focused on conventional rectangular or locally irregular foundation pits, while systematic investigations remained limited for long and narrow metro station foundation pits with pronounced spatial effects and engineering particularities, especially concerning the spatial deformation patterns of retaining structures, ground surface, and adjacent existing buildings and operational stations under excavation-induced unloading.
Therefore, this study conducted a case analysis using the cave at Chexie Road Station of Suzhou Metro Line 8 as an example. Through phased three-dimensional finite element models and on-site monitoring, the coupled responses between the surface, the wall panels, the existing station, and the adjacent buildings in a subway station cave with a high aspect ratio (adjacent to an existing operating station and a construction site) were quantified. The aim of this study is to serve as a case analysis for deformation performance and excavation disturbance, providing a reference for the construction of long and narrow subway station pits in similar soft soil urban environments.
2. Project Background
2.1. Overview of the Foundation Pit Project of the Metro Station
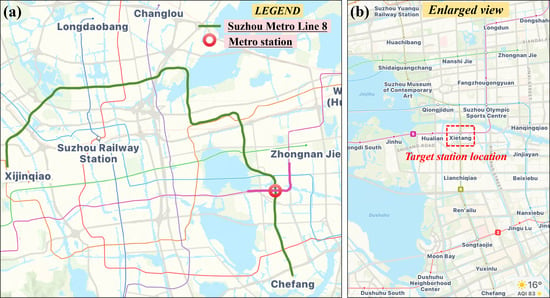
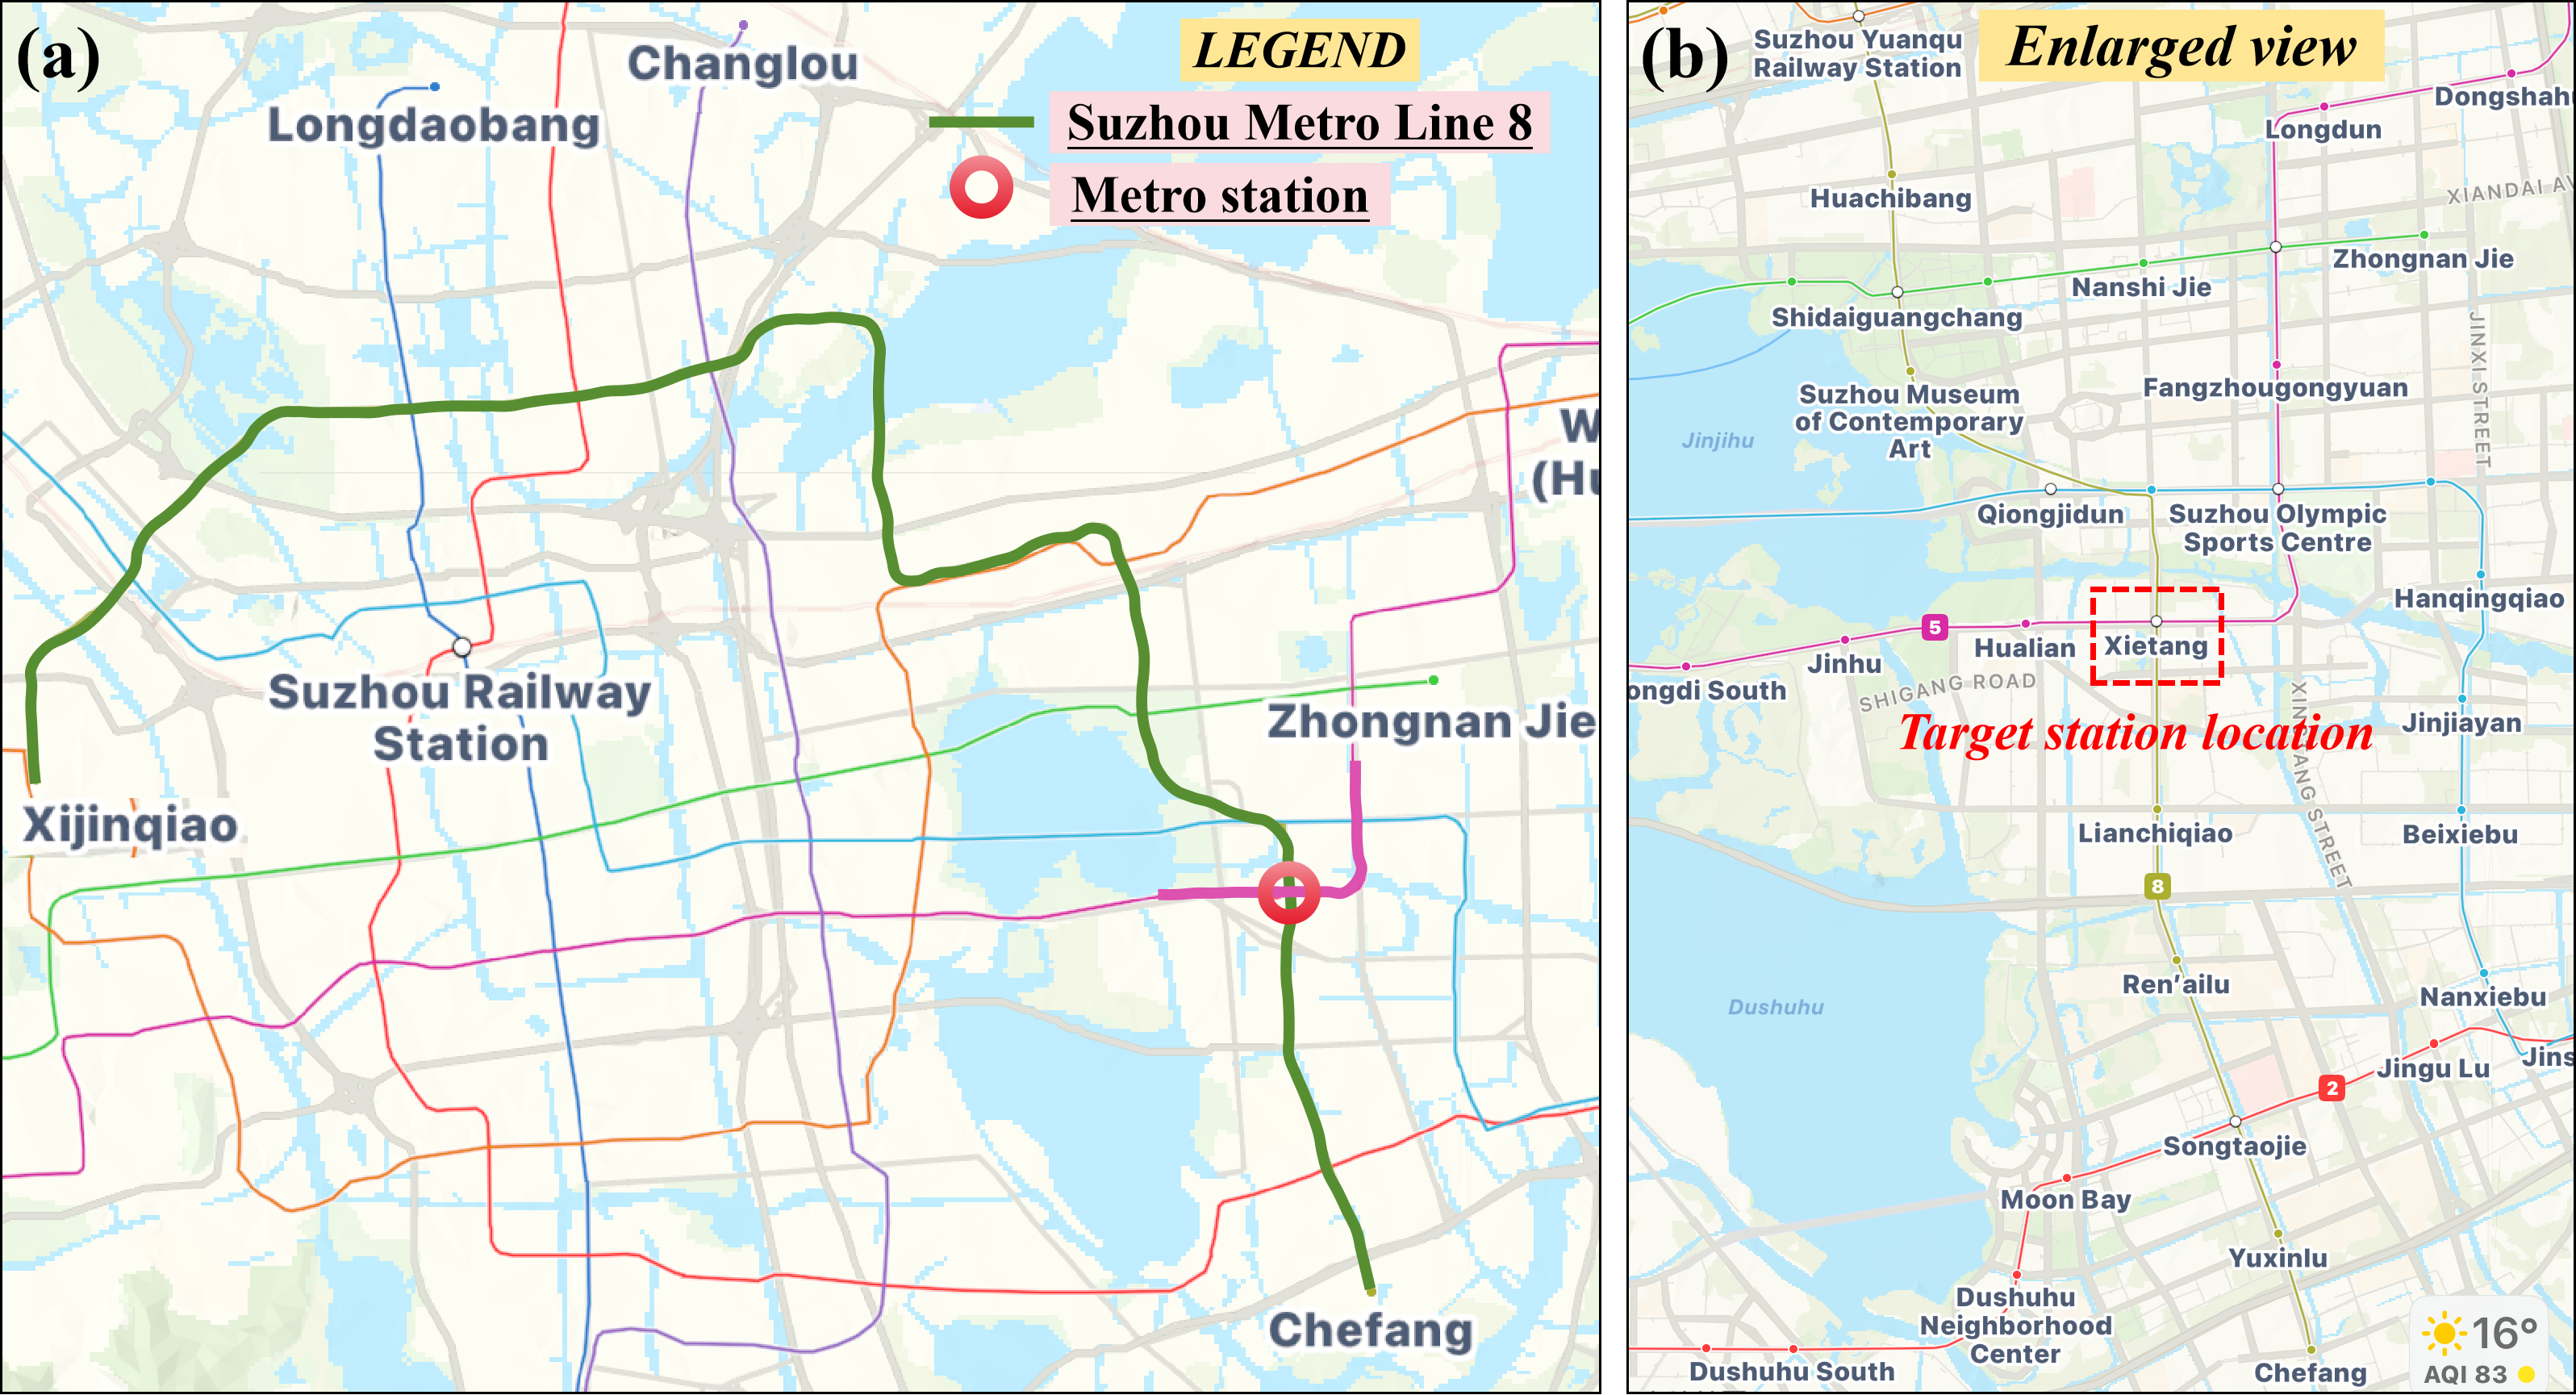
Chexie Road Station is the 23rd station of Suzhou’s Metro Line 8, located at the intersection of Songjiang Road and Songtao Street, and transfers with the existing operational Metro Line 5 Chexie Road Station. The station is designed as a three-story double-span frame structure, measuring 175 m in length, 24.1 m in width, and 24.8 m in depth. The main structure of the station is constructed using the open-cut method, with the surrounding protection system consisting of a 1000 mm thick underground diaphragm wall and internal supports, with the diaphragm wall buried to a depth of approximately 50 m. Vertical piles are installed in the center of the station, serving as both support piles and anti-lift piles, with an effective pile length of 24 m (measured from the bottom of the pit), and the bottom of the piles is embedded approximately 50 m deep. The excavation of the foundation pit affects the surrounding area, including the adjacent existing buildings and the structure of the operational Metro Line 5 Chexie Road Station. The geographical location and surrounding environment of the foundation pit project are shown in Figure 1.
Figure 1.
Geographical location of the foundation pit project: (a) comprehensive map of Suzhou Metro Line 8; (b) the surrounding environment of the target station location.
2.2. Study on the Basic Mechanical Properties of Soil
The soil structure at the location of the foundation pit project is complex and variable, and there are large, high-protection-grade existing structures nearby. Understanding and determining the various soil parameters within the influence range of the foundation pit excavation are crucial for this study. This section combines on-site measurements with laboratory soil tests to identify key parameters, including wave velocity, soil type, dynamic shear modulus, dynamic elasticity modulus, dynamic Poisson’s ratio, density, cohesion, and internal friction angle. The relevant dynamic parameters provide essential stratigraphic physical and design parameters for the subsequent simulation and calculation.
2.2.1. Soil Wave Velocity Test
To determine the dynamic characteristics of the various soil layers in the foundation pit area of Chexie Road Station, particularly the shear wave velocity (Vs), this study employed a single-hole velocity testing method. A combination of suspended and wall-mounted testing systems was used to measure wave velocity at different depths of the soil layers. The testing covered four boreholes, including S16CZ01, S16XZ03, S16XZ04, and S16XZ06, with data spanning different soil layers at depths of 0 to 40 m.
- (1)
- Experimental methods and equipment
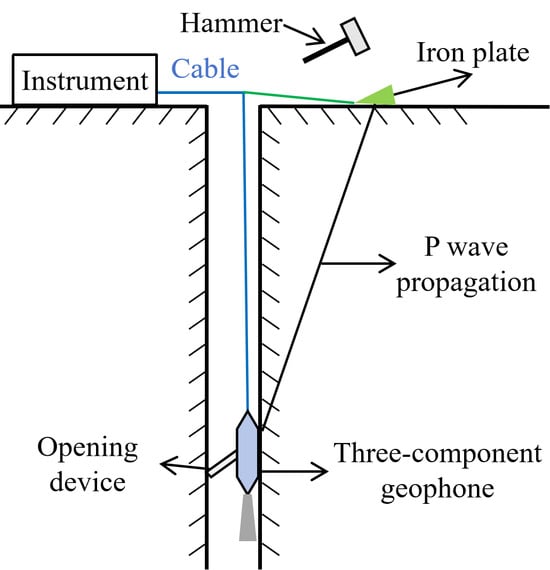
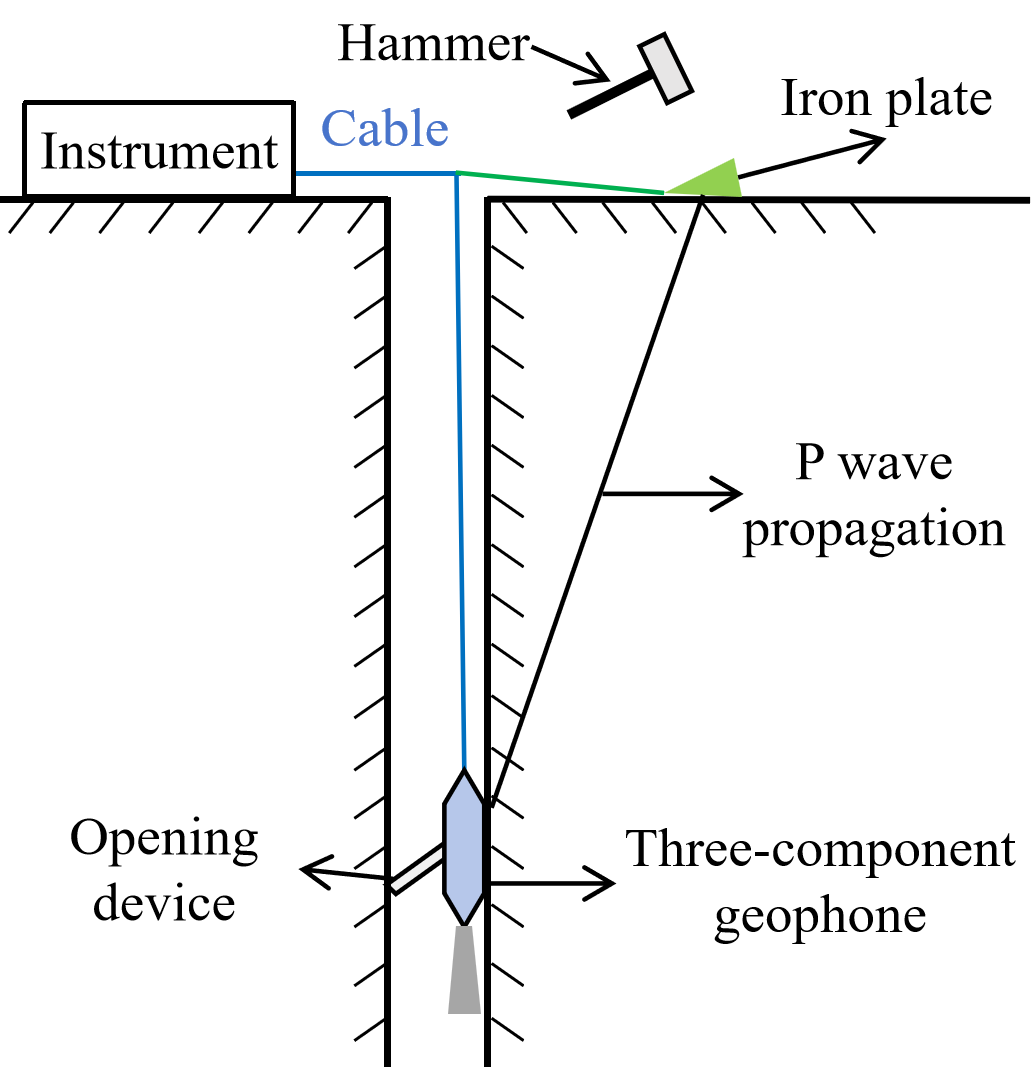
Wave velocity tests were conducted using the XG-I wave velocity tester. The suspended system was used to measure the shear-wave (S-wave) velocity: a three-component geophone was lowered into the borehole, an S-wave was generated by horizontal hammering on a shear-wave source, and Vs was calculated from the travel time between the source and the geophone, with a test interval of 1 m. The wall-mounted system was used to measure the longitudinal-wave (P-wave) velocity: a P-wave was generated by vertical hammering on an iron plate at the ground surface, and the P-wave first arrival was received by the downhole three-component geophone. The setting method is shown in Figure 2.
Figure 2.
Schematic diagram of wall-mounted testing of XG-I wave velocity logging tool.
- (2)
- Experimental data analysis
The dynamic shear modulus was calculated from the measured shear-wave velocity and the soil density, and the dynamic elastic modulus and dynamic Poisson’s ratio were then obtained from the standard elastic relations using the measured P-wave and S-wave velocities. The density values were taken from the geotechnical investigation report and are listed in Table 1. The equivalent shear-wave velocity was obtained by thickness-weighted harmonic averaging of the layer-wise shear-wave velocities over the specified depth range. The detailed calculation procedure follows the equations given in GB 50011-2010 and GB 50909-2014.
Table 1.
Statistical table of wave velocity test results.
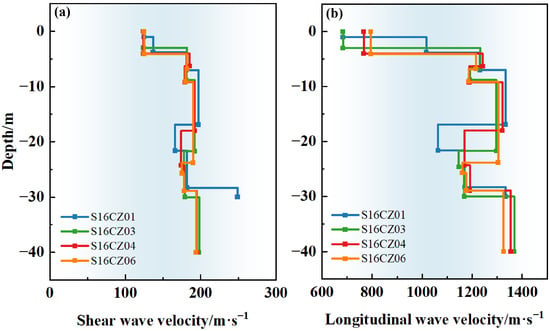
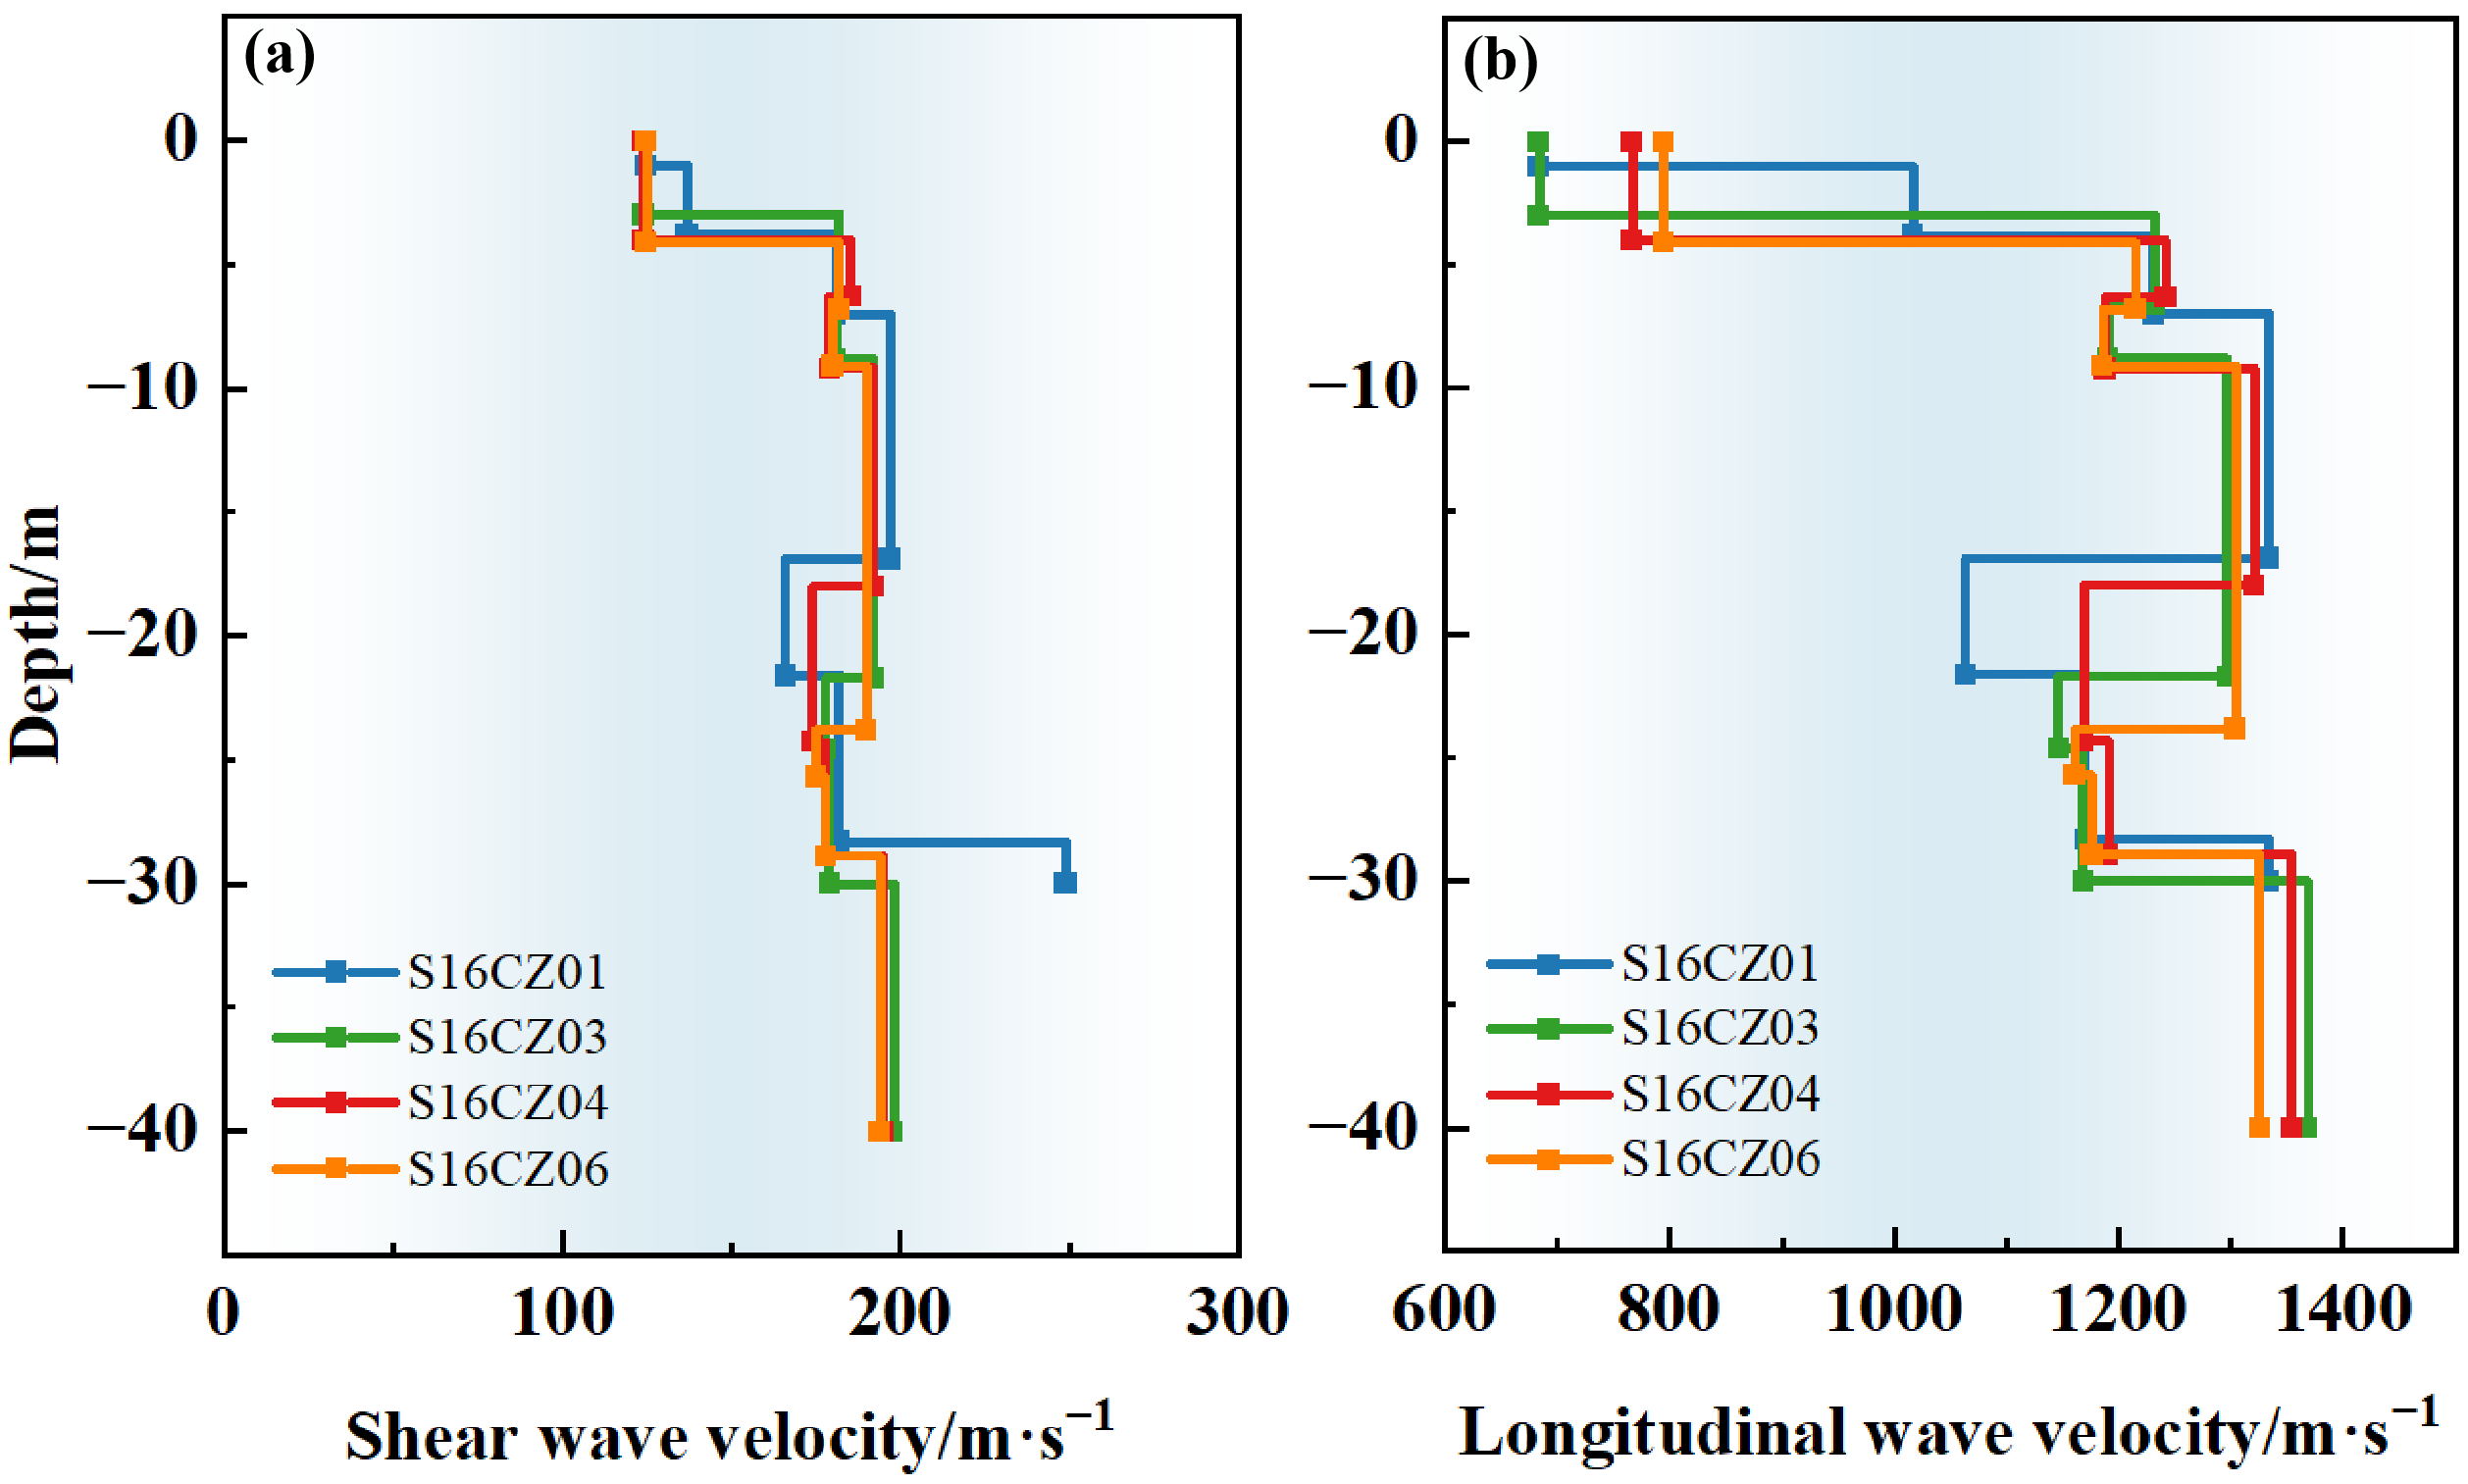
A total of four single-hole shear wave velocity test holes were tested at this site. According to the Code for Seismic Design of Buildings (GB 50011-2010) and Code for Seismic Design of Urban Rail Transit Structures (GB 50909-2014), the thickness of the site’s cover layer was determined to be greater than 50 m based on the survey results and engineering experience in the region [31,32]. Various data obtained from the experimental holes were calculated using the relevant formulas. The original waveforms for each testing borehole are shown in Figure 3, while the calculated results for equivalent shear wave velocity, longitudinal wave velocity, dynamic shear modulus, dynamic elasticity modulus, dynamic Poisson’s ratio, and site classification are summarized in Table 1. Some of the data listed in Table 1 are worth noting: “Gd and Ed are small-strain dynamic moduli obtained from wave-velocity tests (strain level approximately 10−6–10−5). They are used for site classification and seismic input only and are not used as the static stiffness parameters for the excavation analysis in Table 2. The static moduli in Table 2 were derived separately from Es and checked against local experience, as explained in Section 3.2. Density values are taken from the geotechnical investigation report. Vse is the thickness-weighted harmonic average shear-wave velocity.”
Figure 3.
Original wave velocity test results of the four test holes: (a) shear wave velocity; (b) longitudinal wave velocity.
Table 2.
Physical and mechanical parameters of each soil layer.
Based on the single-hole wave velocity tests conducted for the Chexie Road Station project, the following conclusions were drawn: (1) The equivalent shear wave velocity within 20 m of the underground section of the station ranged from Vse = 169 to 175 m/s, and within 25 m, it ranged from Vse = 170 to 176 m/s. The site is classified as a medium-soft soil site. (2) Given that the site’s equivalent shear wave velocity is in the range of 150 < Vse ≤ 250 m/s, and the thickness of the cover layer exceeds 50 m, according to the aforementioned Chinese national standards, the site is classified as Category III for building construction.
2.2.2. Static Shear Test of Soil
- (1)
- Experimental procedure
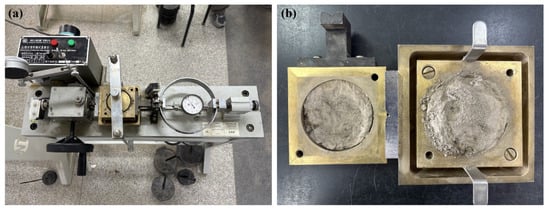
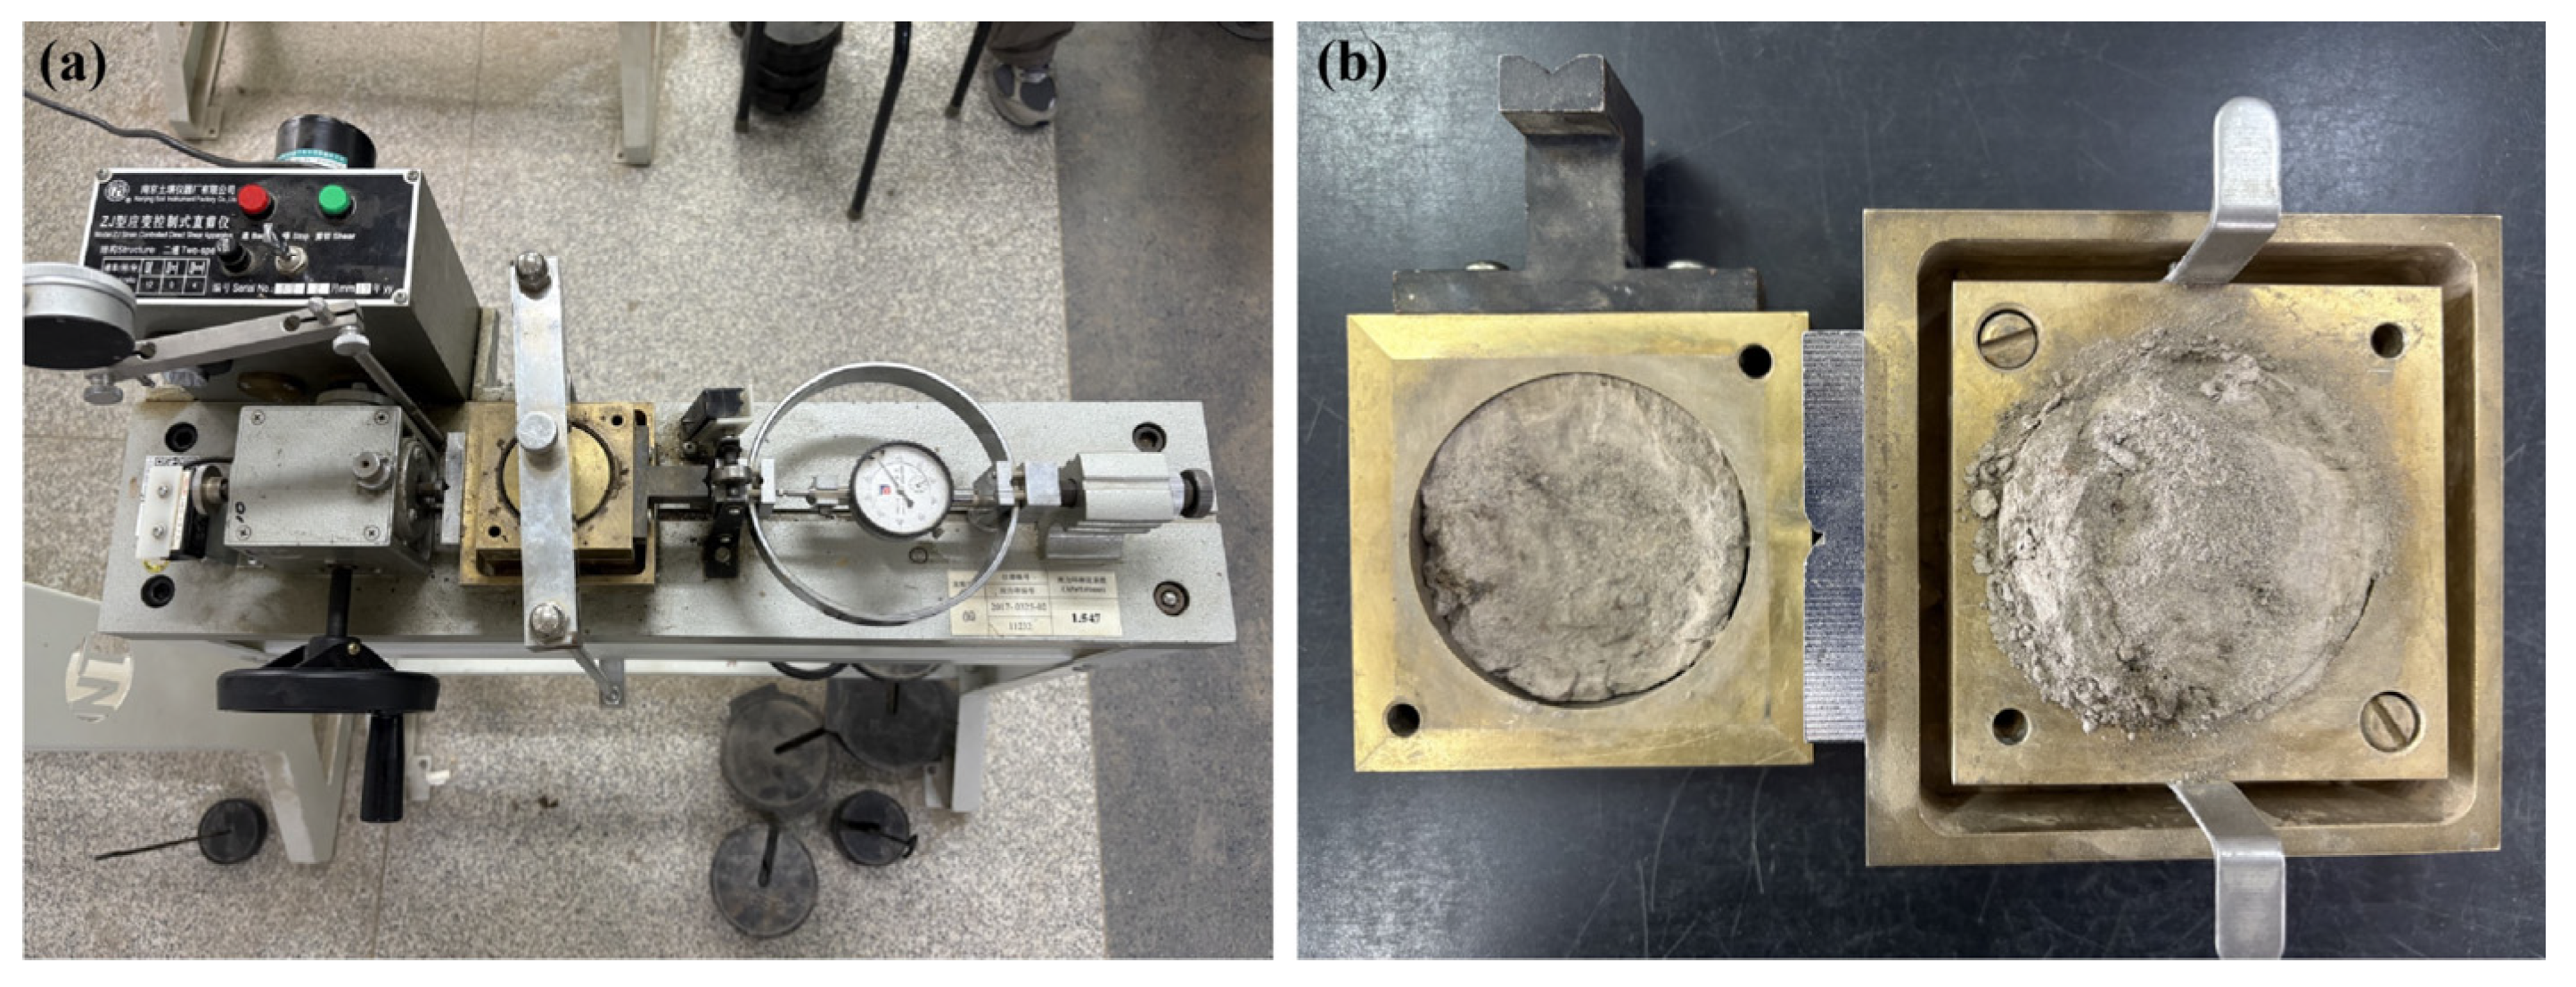
The static shear test is primarily used to obtain the shear strength parameters of soil: cohesion and internal friction angle. These parameters are crucial for evaluating the stability and shear strength of the soil, especially when considering the impact of foundation pit excavation on soil stability. In this study, static shear tests were conducted in the laboratory following standard testing procedures to measure the shear strength parameters of soil layers at different depths within the foundation pit area of Chexie Road Station. A portion of the testing process is shown in Figure 4.
Figure 4.
Laboratory geotechnical tests: (a) testing instruments; (b) soil sample.
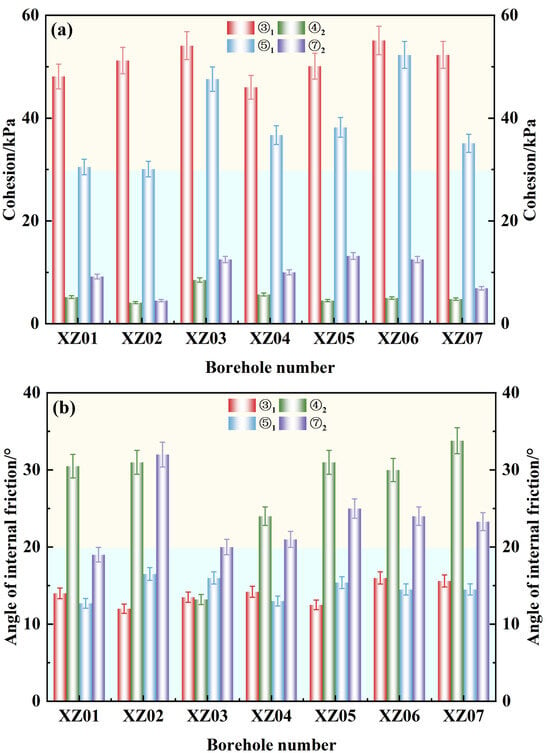
The direct shear tests were conducted in general accordance with GB/T 50123-2019. Specimens were taken from seven boreholes (XZ01–XZ07) at the depths corresponding to the key layers ③1, ④2, ⑤1 and ⑦2. A total of 42 specimens (6 per borehole) were prepared, with 3 specimens per layer per borehole where sufficient material was available. Specimen quality was classified as Class I–II for cohesive soils and remoulded for the sandy interlayer. The apparatus was a strain-controlled direct shear box with a specimen diameter of 61.8 mm and a height of 20 mm. For each specimen, four normal stresses in the range of 50 to 400 kPa were applied, and the shear rate was 0.8 mm/min. Cohesive specimens were saturated by vacuum saturation before testing. The tests were performed under consolidated undrained conditions for cohesive layers and drained conditions for the sandy interlayer, consistent with the drainage assumption adopted in the numerical model. The reported cohesion c and friction angle φ are total stress parameters for the cohesive layers and effective stress parameters for the sandy layer; this is consistent with the undrained/consolidated undrained idealization used in the Mohr–Coulomb model. The variability of c and φ among boreholes is shown in Figure 5. For each layer, the representative parameter set in Table 2 was obtained by taking the mean of the acceptable test values from all boreholes after excluding outliers beyond one standard deviation; the coefficient of variation was generally below 25% for c and below 15% for φ. The number of tests and the exclusion criterion are now stated in the caption of Figure 5.
Figure 5.
Cohesion (a) and internal friction angle (b) of key strata at different depths within the station foundation pit. Bars are layer-wise means from seven boreholes; error bars denote one standard deviation. Outliers beyond one standard deviation were excluded before averaging.
- (2)
- Experimental data analysis
The experimental data cover shear strength values for soil layers at various depths from seven boreholes. The borehole identifiers are XZ01, XZ02, XZ03, XZ04, XZ05, XZ06, and XZ07. The test results from each borehole demonstrate the variation in cohesion (c) and internal friction angle (φ) across different soil layers at varying depths.
Figure 5 illustrates the changes in cohesion and internal friction angle at key soil layers (③1, ④2, ⑤1, and ⑦2) across the seven boreholes at different depths. From the figure, it can be observed that the cohesion values exhibit significant variation among the different soil layers, with a particularly notable difference between the clay layers and silty sand intercalated with silt. The internal friction angle also fluctuates across the soil layers in each borehole, with more pronounced variations observed in the soil at depths of 10 to 20 m. These data provide critical input for subsequent numerical simulations and impact analysis of foundation pit construction.
2.3. Hydrogeological Conditions
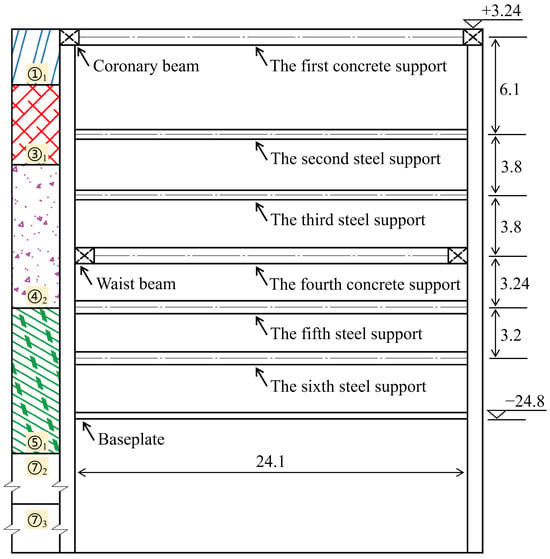
Based on the study of the basic mechanical properties of the soil in the foundation pit and other engineering data, it is determined that the soil layers within the excavation range of the Chexie Road Station foundation pit for Metro Line 8, from top to bottom, consist of the following: fill soil ①1, clay ③1, silty clay ③3, silty sand intercalated with silt ④2, silty clay ⑤1, silty sand intercalated with silt ⑦2, and silty clay ⑦3. The basic physical and mechanical parameters of each soil layer are provided in Table 2.
The longitudinal section of the newly constructed Chexie Road Station foundation pit excavation is shown in Figure 6. The groundwater table at the foundation pit site is relatively shallow and consists primarily of unconfined water, slightly confined water, and confined water. According to the investigation report, the groundwater at the site consists of unconfined water, slightly confined water and confined water. The stable unconfined water level is approximately 1.5 m below the ground surface, the slightly confined water head is approximately 8 m below the ground surface, and the confined water head is approximately 15 m below the ground surface. During construction, dewatering was carried out inside the pit using tube wells, with the water level lowered to about 1 m below the excavation base before each excavation stage. Recharge wells were installed outside the pit where necessary to reduce the drawdown-induced settlement of the adjacent station and building. The dewatering was carried out in stages to match the excavation sequence. In addition, some of the data listed in Table 2 are worth noting: “E is the static secant modulus at working strain levels, derived from Es as described in Section 3.2; it is not the small-strain dynamic modulus in Table 1. ψ = 0° for fine-grained layers and 5° for the sandy interlayer. σt = 0 is the tension cutoff. Eur/E = 1.0 because the Mohr–Coulomb model uses the same elastic stiffness for unloading/reloading. K0 = 1 − sinφ. c and φ are total stress parameters for cohesive layers and effective stress parameters for the sandy interlayer, consistent with the drainage conditions described in Section 2.2.2. The values are layer-wise means of acceptable test results from seven boreholes, as shown in Figure 5.”
Figure 6.
Cross section of excavation for the foundation pit of Chexie Road Station. (Unit: m).
2.4. Analysis of Major Challenges and Difficulties in Project Construction
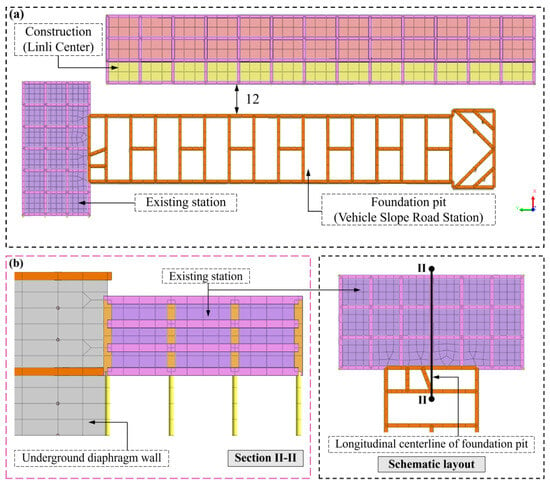
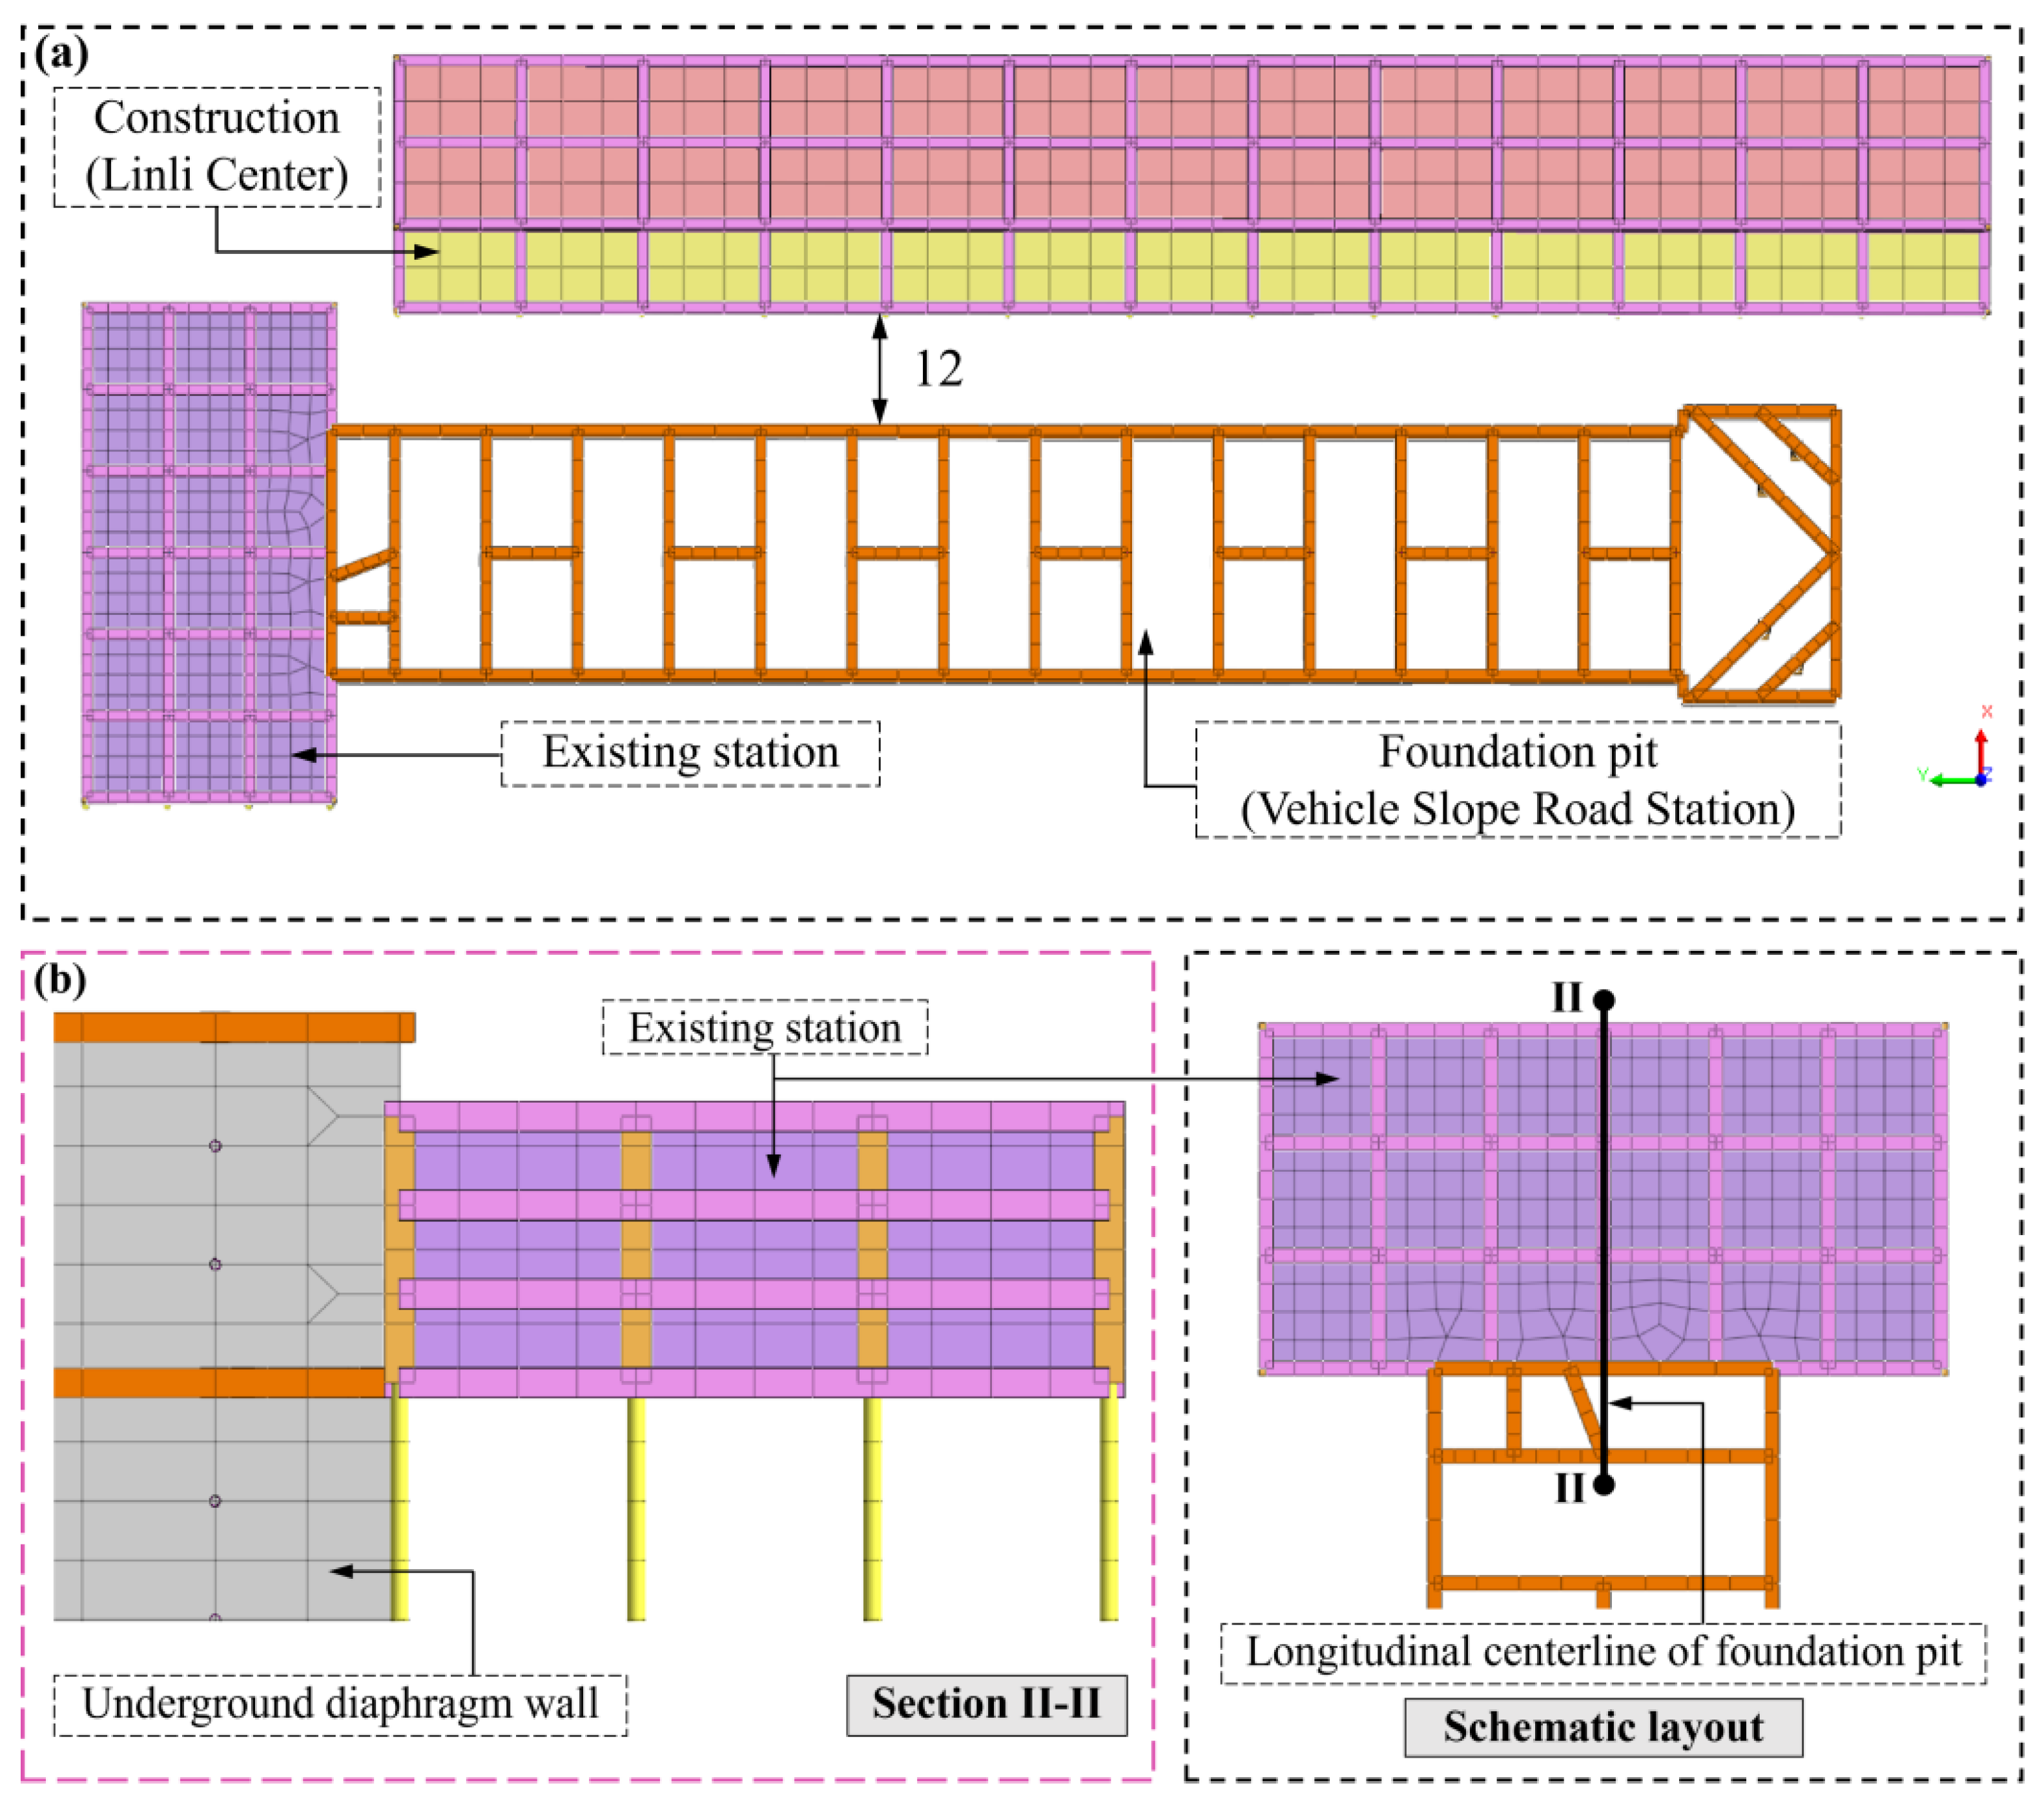
The proposed long and narrow foundation pit for the metro station is primarily situated within silty clay, silty sand intercalated with silt. Due to the unloading disturbance caused by foundation pit excavation, the soil layers are highly susceptible to deformation, which can lead to uneven settlement and heave. More importantly, the newly proposed long and narrow foundation pit is in close proximity to the existing operational Chexie Road Station on Line 5 and the ongoing construction of the adjacent Neighborhood Center building. The deformation of the soil layers may indirectly result in the deformation of the existing structures. Therefore, during construction, it is essential to strictly control the deformation accuracy and extent of the foundation pit excavation to avoid any unnecessary safety risks or accidents to the existing structures. The spatial relationship between the foundation pit and the surrounding buildings/structures is shown in Figure 7.
Figure 7.
Layout plan of foundation pit, existing stations, and buildings under construction (Unit: m): (a) floor plan; (b) longitudinal section drawing.
3. Numerical Analysis of the Deformation of the Long and Narrow Excavation Pit
3.1. Construction of Numerical Models
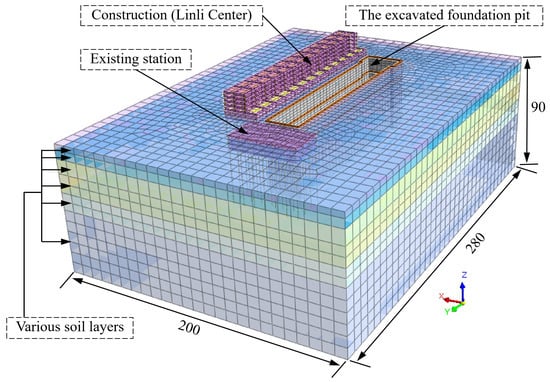
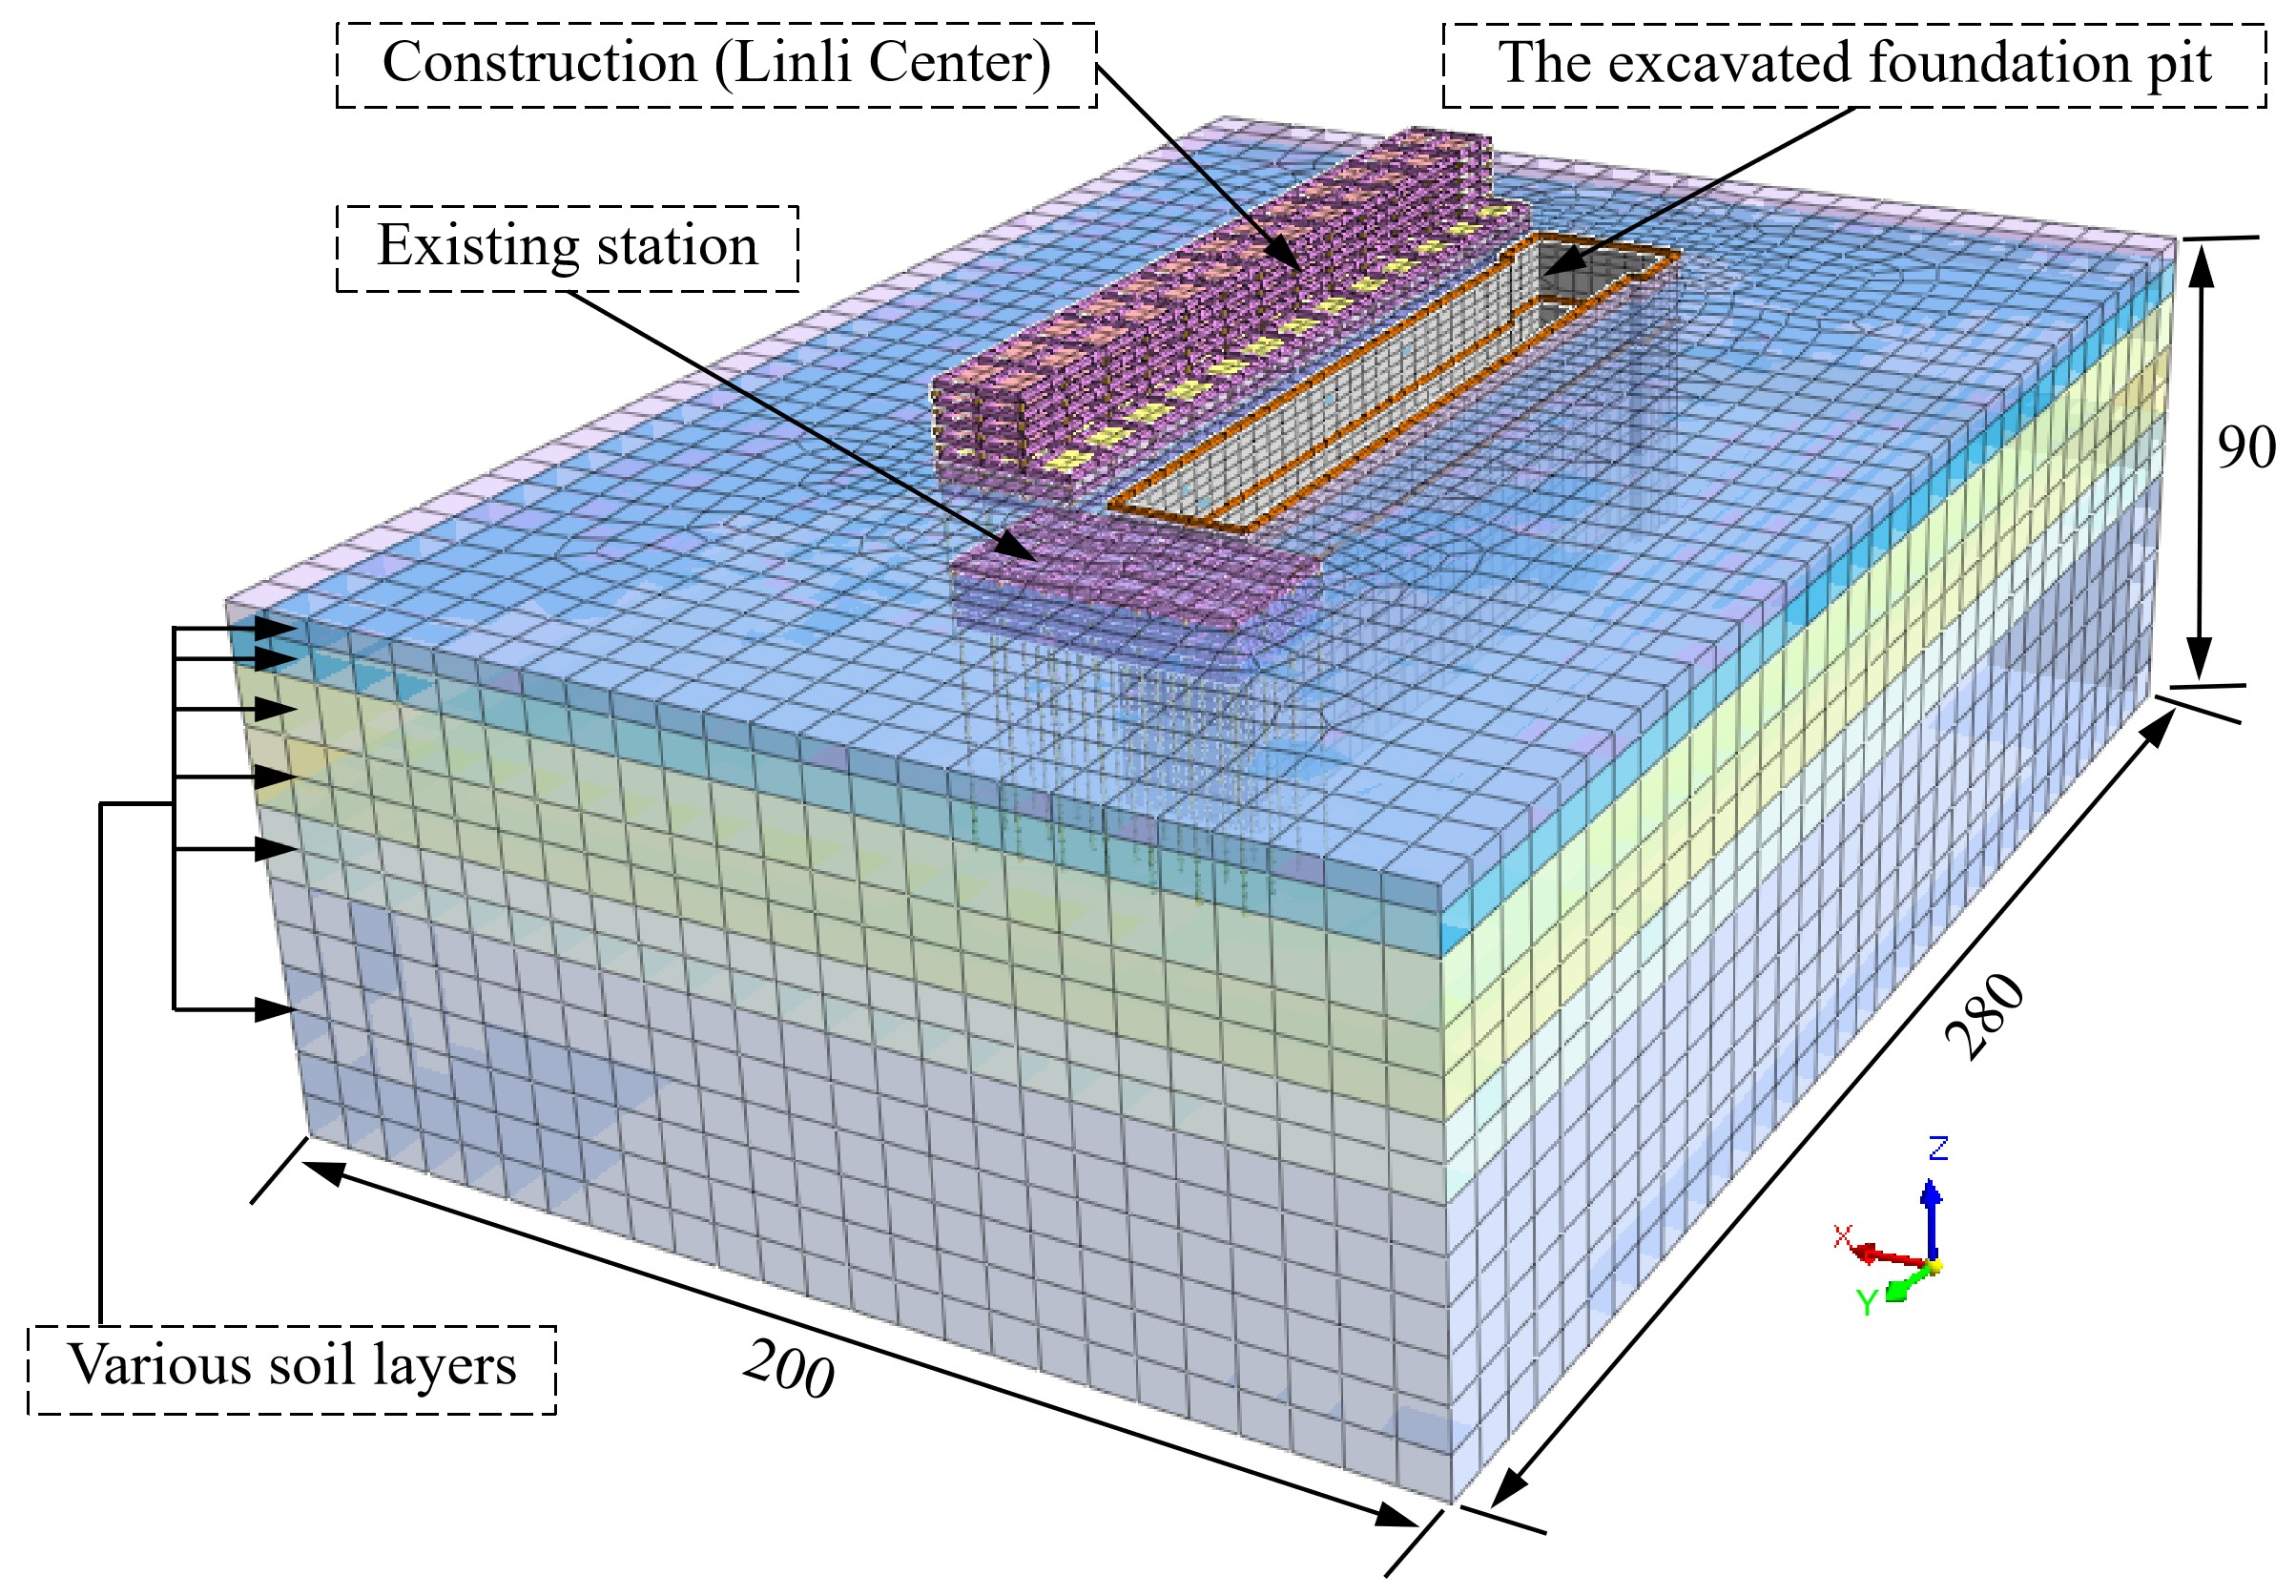
To investigate the impact of excavation of the long and narrow foundation pit on existing operational stations and buildings, this study uses Midas GTS NX V2021R1 finite element software to develop a detailed 3D numerical model that incorporates the foundation pit, the existing operational station, and surrounding buildings [33]. The physical dimensions of the foundation pit to be excavated are 175 m in length, 24 m in width, and approximately 25 m in depth for the standard section. According to the design data, the existing buildings and structures are simulated using structural elements such as plate and beam elements at their original scale. Based on the geological survey data, the numerical model includes a total of 6 soil layers. From top to bottom, the soil layers are: a fill soil layer with a thickness of 4.0 m, a clay layer with a thickness of 6.0 m, a silty sand intercalated with silt layer with a thickness of 10.0 m, a silty clay layer with a thickness of 13.0 m, a silty sand intercalated with silt layer with a thickness of 12.0 m, and the bottommost silty clay layer with a thickness of 45 m. Finally, the dimensions of the constructed 3D numerical model are 200 m × 280 m × 90 m (X × Y × Z). The numerical model employs a hybrid meshing technique, comprising a total of 33,629 nodes and 66,880 elements, as shown in Figure 8.
Figure 8.
Numerical calculation model for foundation pit excavation. (Unit: m).
The global X-axis is perpendicular to the pit long side, the Y-axis is along the pit length, and the Z-axis is vertical. The lateral boundaries were restrained in their normal directions, and the bottom boundary was fully fixed. The initial stress field was generated using the gravity loading method with K0 = 1 − sinφ for each layer. Eight-node hexahedral elements were used for the soil, and the structural elements were modelled as 1D beam and 2D plate elements. The mesh was refined near the diaphragm wall, the pit ends and the existing station, with a minimum local size of approximately 1.0 m, and coarsened towards the far boundaries. The convergence criterion was based on a maximum unbalanced force ratio of 10−5 and a displacement increment tolerance of 10−4 m. A mesh sensitivity check was performed using a coarser mesh and a finer mesh; the maximum wall displacement and station uplift differed by less than 5%, and the surface settlement trough was essentially unchanged. A domain sensitivity check with the lateral boundaries moved outwards by 50 m produced differences of less than 3% in the key response measures. The model domain and mesh adopted in this study are therefore considered adequate.
3.2. Assignment of Model Material Parameters
The soil layers were represented using the built-in Mohr–Coulomb elastoplastic model in Midas GTS NX, with a tension cutoff and a non-associated flow rule. The yield surface is the Mohr–Coulomb criterion defined by cohesion c and internal friction angle φ; the plastic potential uses the dilation angle ψ. No hardening/softening law and no stress-dependent stiffness were activated, because the available investigation data do not include multi-confining-pressure tests or cyclic loading tests. The required input parameters are therefore E, ν, c, φ, ψ, tensile strength σt, and the initial lateral earth pressure coefficient K0. The values are summarized in Table 2. For the fine-grained layers, ψ = 0° was adopted to represent non-associated flow under essentially undrained/consolidated undrained conditions; for the sandy interlayer, a conservative ψ = 5° was used. A zero tensile strength (σt = 0) was assigned to all layers as a tension cutoff. The initial stress field was generated using K0 = 1 − sinφ, which is consistent with normally consolidated to lightly overconsolidated soft deposits. In the Mohr–Coulomb model, unloading and reloading are governed by the same elastic stiffness as primary loading; hence Eur/E = 1.0.
The static elastic modulus E in Table 2 was not obtained from the wave-velocity tests. It was derived from the confined compression modulus Es reported in the geotechnical investigation using E = Es(1 + ν)(1−2ν)/(1−ν), with ν taken from Table 2, and was checked against the deformation modulus back-analysed from nearby excavation cases and local experience. For layers without direct Es measurements, the values were determined by combining laboratory consolidation tests, SPT/CPT correlations and regional empirical relations. The resulting E values represent the secant stiffness at working strain levels of approximately 10−3 to 10−2, which is the relevant strain range for excavation-induced unloading. By contrast, the dynamic shear modulus Gd and dynamic elastic modulus Ed in Table 1 were obtained from small-strain wave-velocity tests (strain level approximately 10−6 to 10−5). They are used only for site classification and seismic input and were not used as the static stiffness in the excavation model. The difference between the two data sets is therefore intentional and reflects the well-known strain dependence of soil stiffness, rather than a inconsistency.
The wall-soil interface was modelled using zero-thickness interface elements with the Mohr–Coulomb slip criterion. The interface strength was taken as Rinter = 0.7 times the adjacent soil strength, and the normal stiffness and shear stiffness were set to 105 kN/m3 and 104 kN/m3, respectively; separation was permitted when the normal stress reached zero. The diaphragm wall was 1000 mm thick, and the station slabs were 400 mm (roof and middle slabs) and 800 mm (base slab) thick. The beams were modelled as 800 × 1000 mm rectangular sections, the columns as 800 × 800 mm, and the center piles as 800 mm diameter bored piles with a spacing of 8 m and an embedment of 24 m below the pit bottom. The steel bracing were φ 609 × 16 mm steel pipes, spaced at 6 m horizontally and 3.2–6.1 m vertically, with a prestress of 300 kN applied to each steel strut. The connections between bracing and the wall were modelled as rigid joints. C30 concrete was modelled with E = 25,000 MPa, which is the elastic modulus specified in GB 50010-2010 for serviceability analysis; cracking and stiffness reduction were not explicitly represented, which is a conservative simplification for deformation prediction. The parameters are summarized in Table 3.
Table 3.
Parameter values of enclosure structure and internal support.
3.3. Numerical Simulation Process for Excavation of Foundation Pits
To closely replicate the on-site construction process, the simulation of the foundation pit excavation is divided into the following 9 steps. The details of each construction step are shown in Table 4. In each excavation step, the soil was excavated to 0.5 m below the support elevation, and the support was then activated and prestressed before the next excavation. The short unsupported exposure between excavation and support installation was not modelled as a separate stage because the construction sequence specified prompt support installation; this simplification is stated here for clarity. The maximum settlement value is approximately 8 mm. The duration column gives representative time intervals consistent with the site construction sequence, not calendar dates. The diaphragm wall construction period is representative; each excavation step includes excavation to 0.5 m below the support elevation and prompt support installation. Concrete bracing were activated after a curing period of about 7 d, and steel bracing were prestressed immediately after installation. The bottom slab was poured after Step 9.
Table 4.
Simulated construction steps of foundation pit excavation.
3.4. Results Analysis
3.4.1. Characteristics of Surface Deformation During Excavation of the Foundation Pit
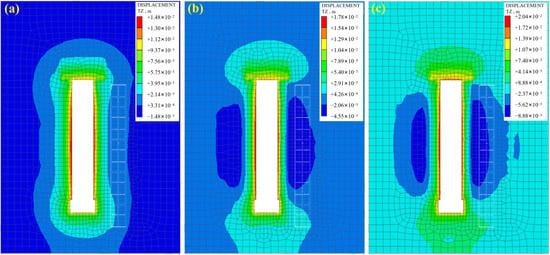
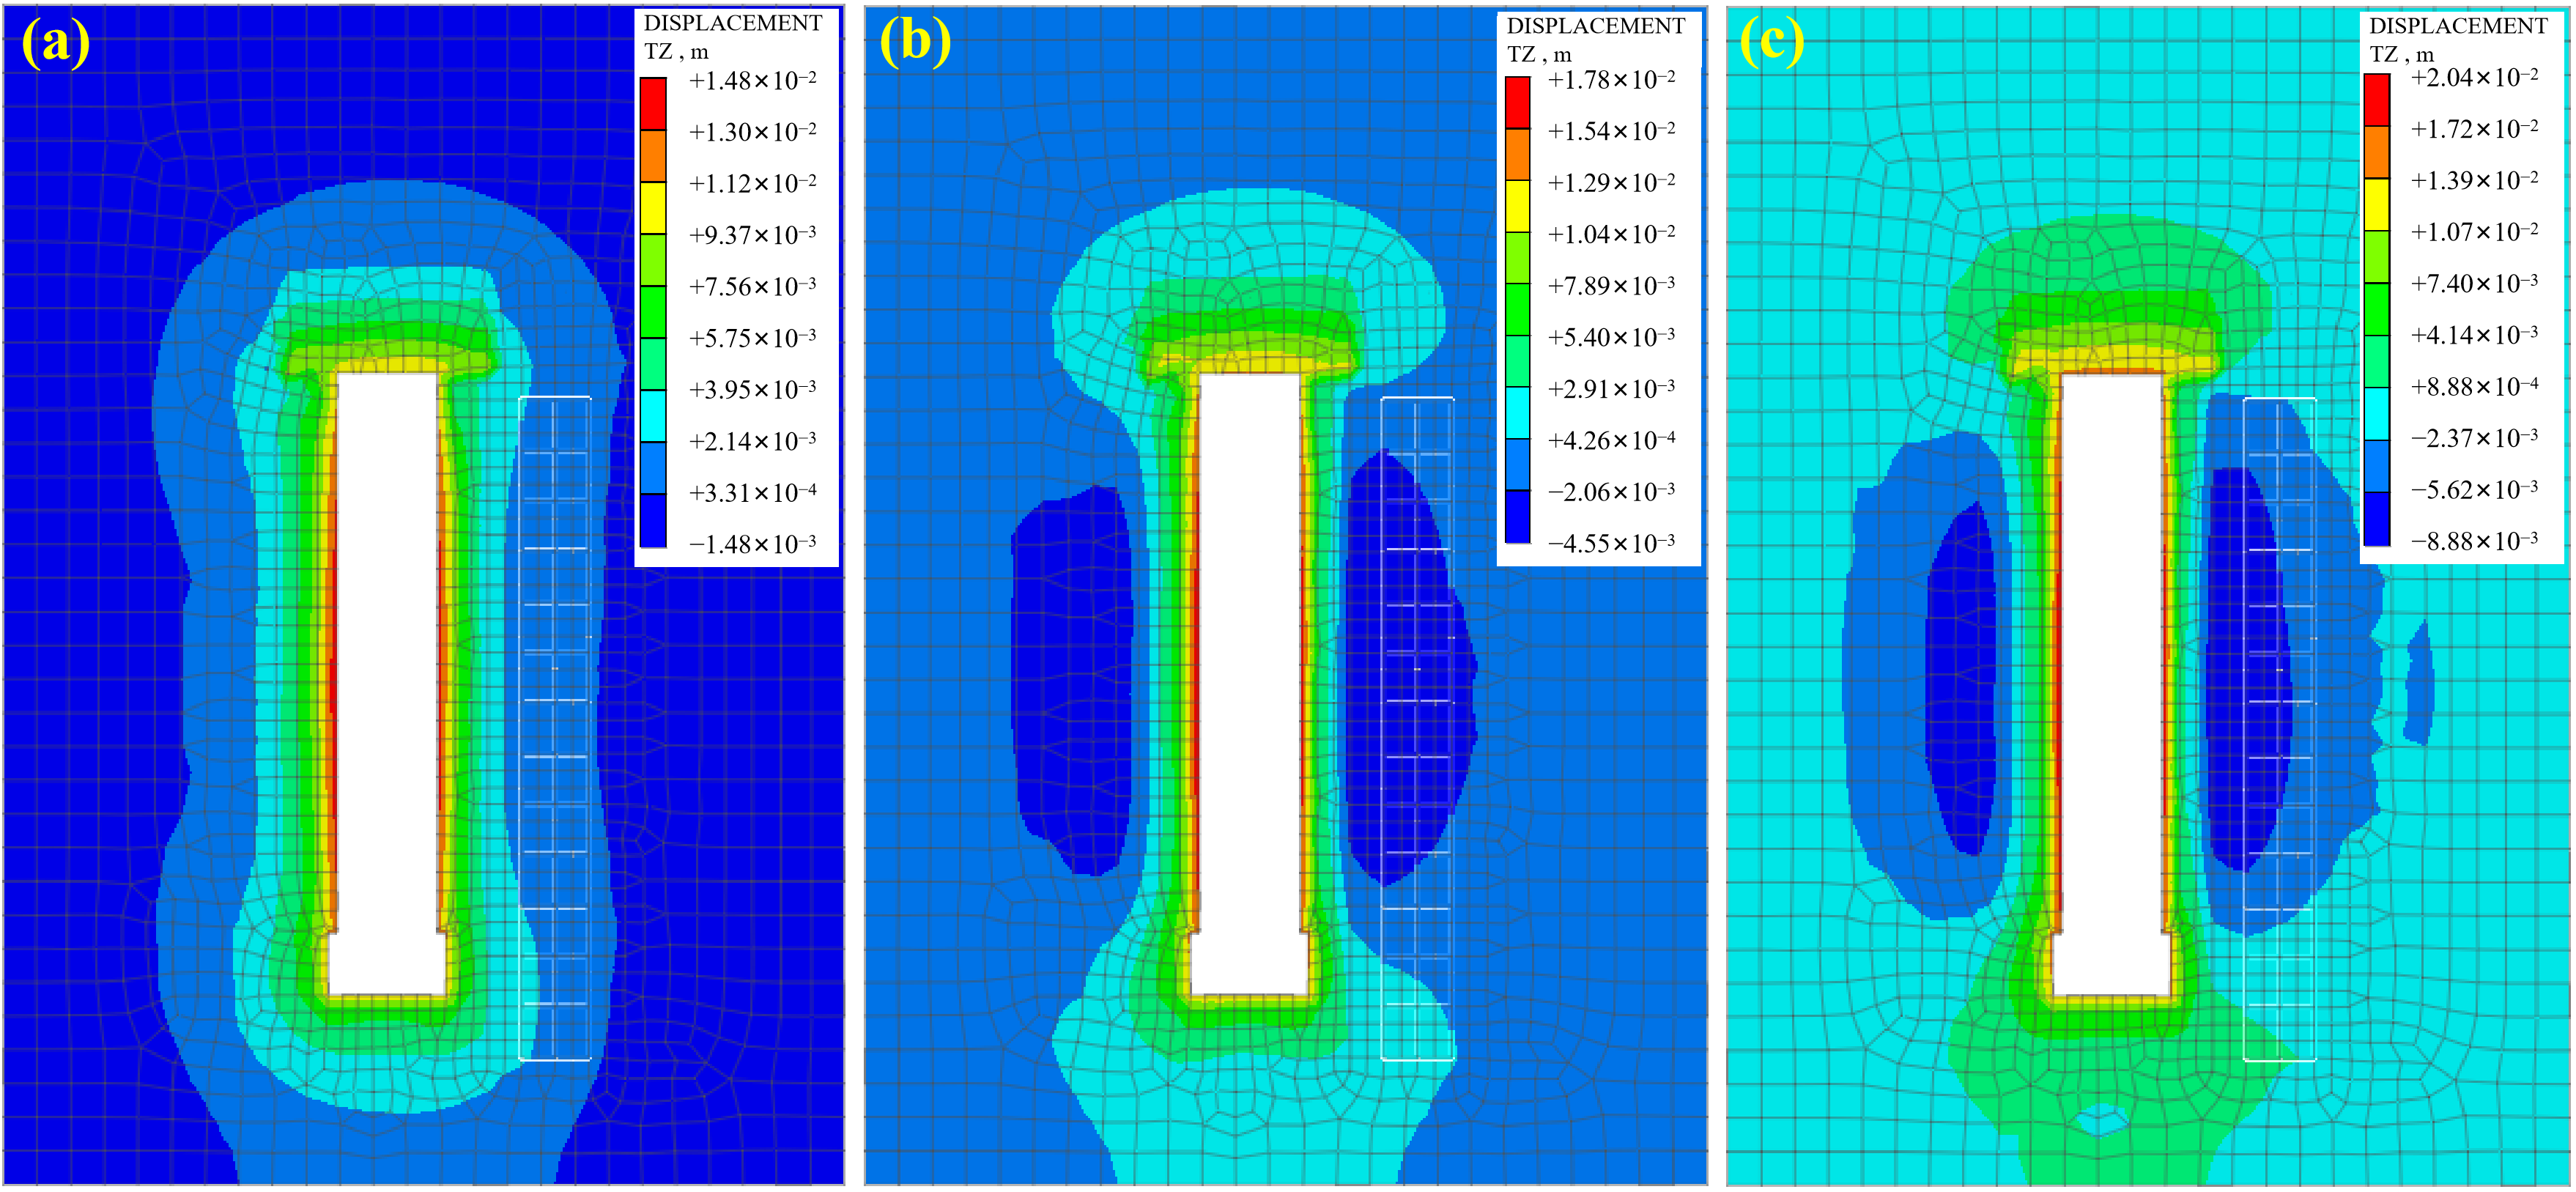
Figure 9 shows the contour map of surface settlement deformation during the foundation pit excavation process. Due to space limitations, only the excavation results from the last three steps are presented. As seen in the figure, when the excavation depth is relatively shallow, the surrounding surface soil is affected by the excavation over a larger area, but the extent of this effect is small. This is primarily reflected in the uplift of the soil near the edge of the foundation pit and the top of the diaphragm wall, with the uplift values being significant. In the 7th analysis step, corresponding to the completion of the 5th excavation, the maximum uplift is 15 mm. In the 8th analysis step, corresponding to the completion of the 6th excavation, the maximum uplift increases to 18 mm. By the time the excavation is completed, before the bottom slab is constructed, the maximum uplift near the diaphragm wall is approximately 20 mm. This uplift is mainly caused by basal heave and radial unloading: excavation reduces vertical stress at the pit base, and the wall-soil interface transfers shear stress that drags the near-wall soil upward. However, the monitored near-wall uplift at section DB09 was only about 5–6 mm (Section 5.1), indicating that the model overestimated this local rebound. The overestimation is attributed to the use of Eur = E in the Mohr–Coulomb model, the relatively high interface strength (Rinter = 0.7) and the rigid wall-soil connection, all of which reduce the relative slip between the wall and the soil and thus exaggerate the upward drag. From the overall surface deformation pattern, it can be observed that in the 7th construction step, the surface settlement range is relatively large, but the settlement value is very small, approximately 1 mm. As the excavation depth increases and internal supports are timely installed, the surface soil settlement shows a steady increase. In the 9th construction step, the maximum surface settlement reaches about 8 mm, with the maximum settlement occurring in the surface soil on the outer side of the foundation pit center, within 10 to 15 m from the diaphragm wall. The surface soil near the foundation pit end and at the corners is less affected by the excavation, showing slight uplift. This phenomenon may be attributed to the arching effect of the soil at the pit ends. Additionally, due to the unloading effect, the ground surface at the building location settled, with a simulated maximum surface settlement of approximately 8 mm near the pit center. It should be clarified that this value refers to the ground surface settlement, not to the foundation settlement of the building itself. When the building is represented by structural elements, the simulated foundation settlement was approximately 2–3 mm, which is of the same order as the monitored values.
Figure 9.
Cloud chart of surface settlement and deformation during foundation pit excavation: (a) Simulation result of step 7; (b) simulation result of step 8; (c) simulation result of step 9.
3.4.2. Deformation Characteristics of Soil and Diaphragm Walls During Excavation of the Foundation Pit
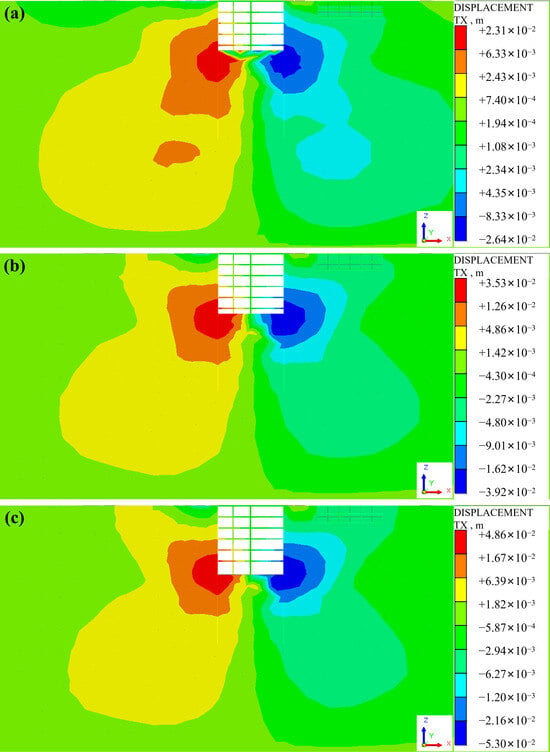
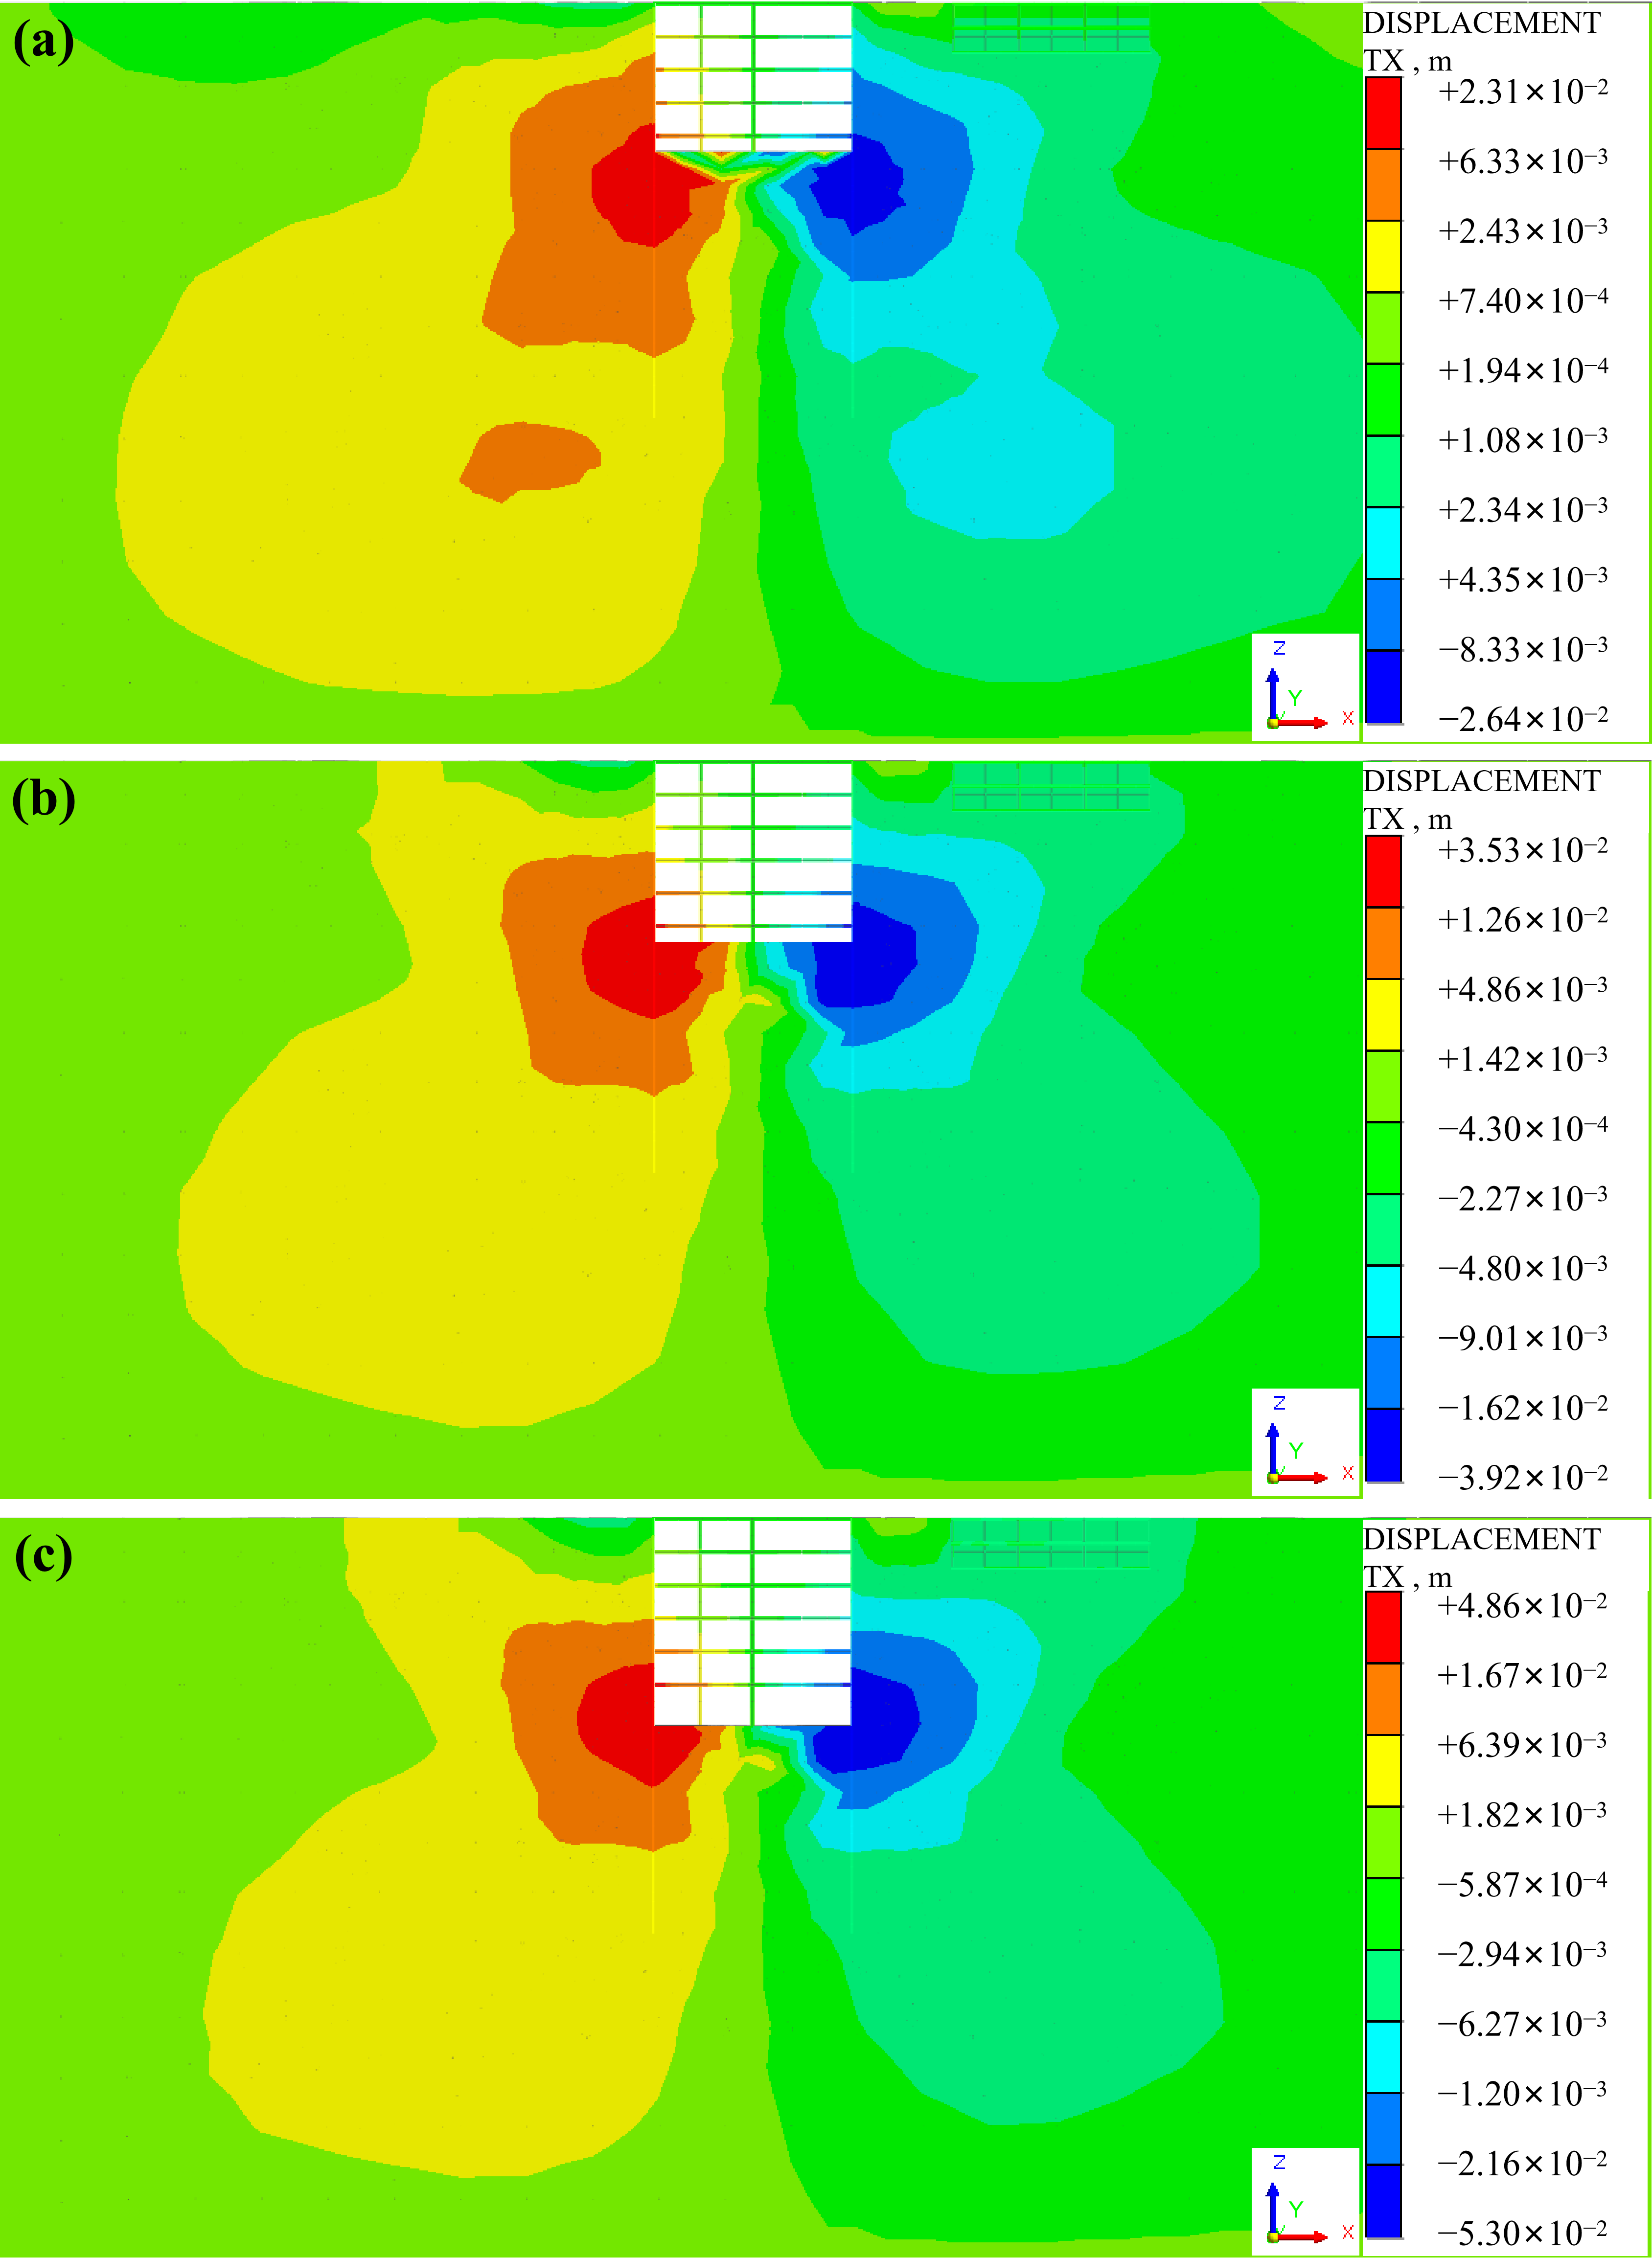
Figure 10 shows the deformation characteristics contour map of the surrounding soil and diaphragm wall during the foundation pit excavation process. From the figure, the horizontal deformation of the soil on both sides of the foundation pit exhibits a symmetrical distribution, with the maximum deformation concentrated near the excavation face. When the foundation pit has completed the 5th excavation (corresponding to the 7th excavation step), the maximum horizontal displacement of the diaphragm wall is about 19 mm, with the maximum deformation occurring at the level of the excavation face. As the excavation depth of the foundation pit increased, the position of the maximum lateral deformation of the underground diaphragm wall shifted downward. The lateral deformation of the diaphragm walls in the depth where the internal supports had been installed gradually converges, and the lateral displacement tends to stabilize. When the excavation reached the bottom of the pit, and before the bottom slab is poured, the maximum horizontal displacement of the diaphragm wall is approximately 48 mm, with the maximum deformation consistently located within ±5 m of the excavation face. This indicates that during the excavation process, the deformation of the diaphragm wall showed a gradually increasing trend, which was consistent with the actual construction conditions.
Figure 10.
Cloud chart of horizontal displacement of soil and diaphragm wall during foundation pit excavation: (a) simulation result of step 7; (b) simulation result of step 8; (c) simulation result of step 9.
4. Analysis of the Effect of Long and Narrow Foundation Pit Construction on Adjacent Buildings and Structures
4.1. On-Site Monitoring Plan
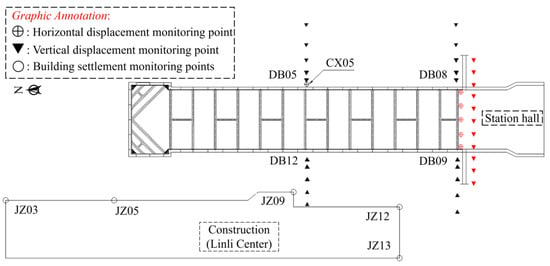
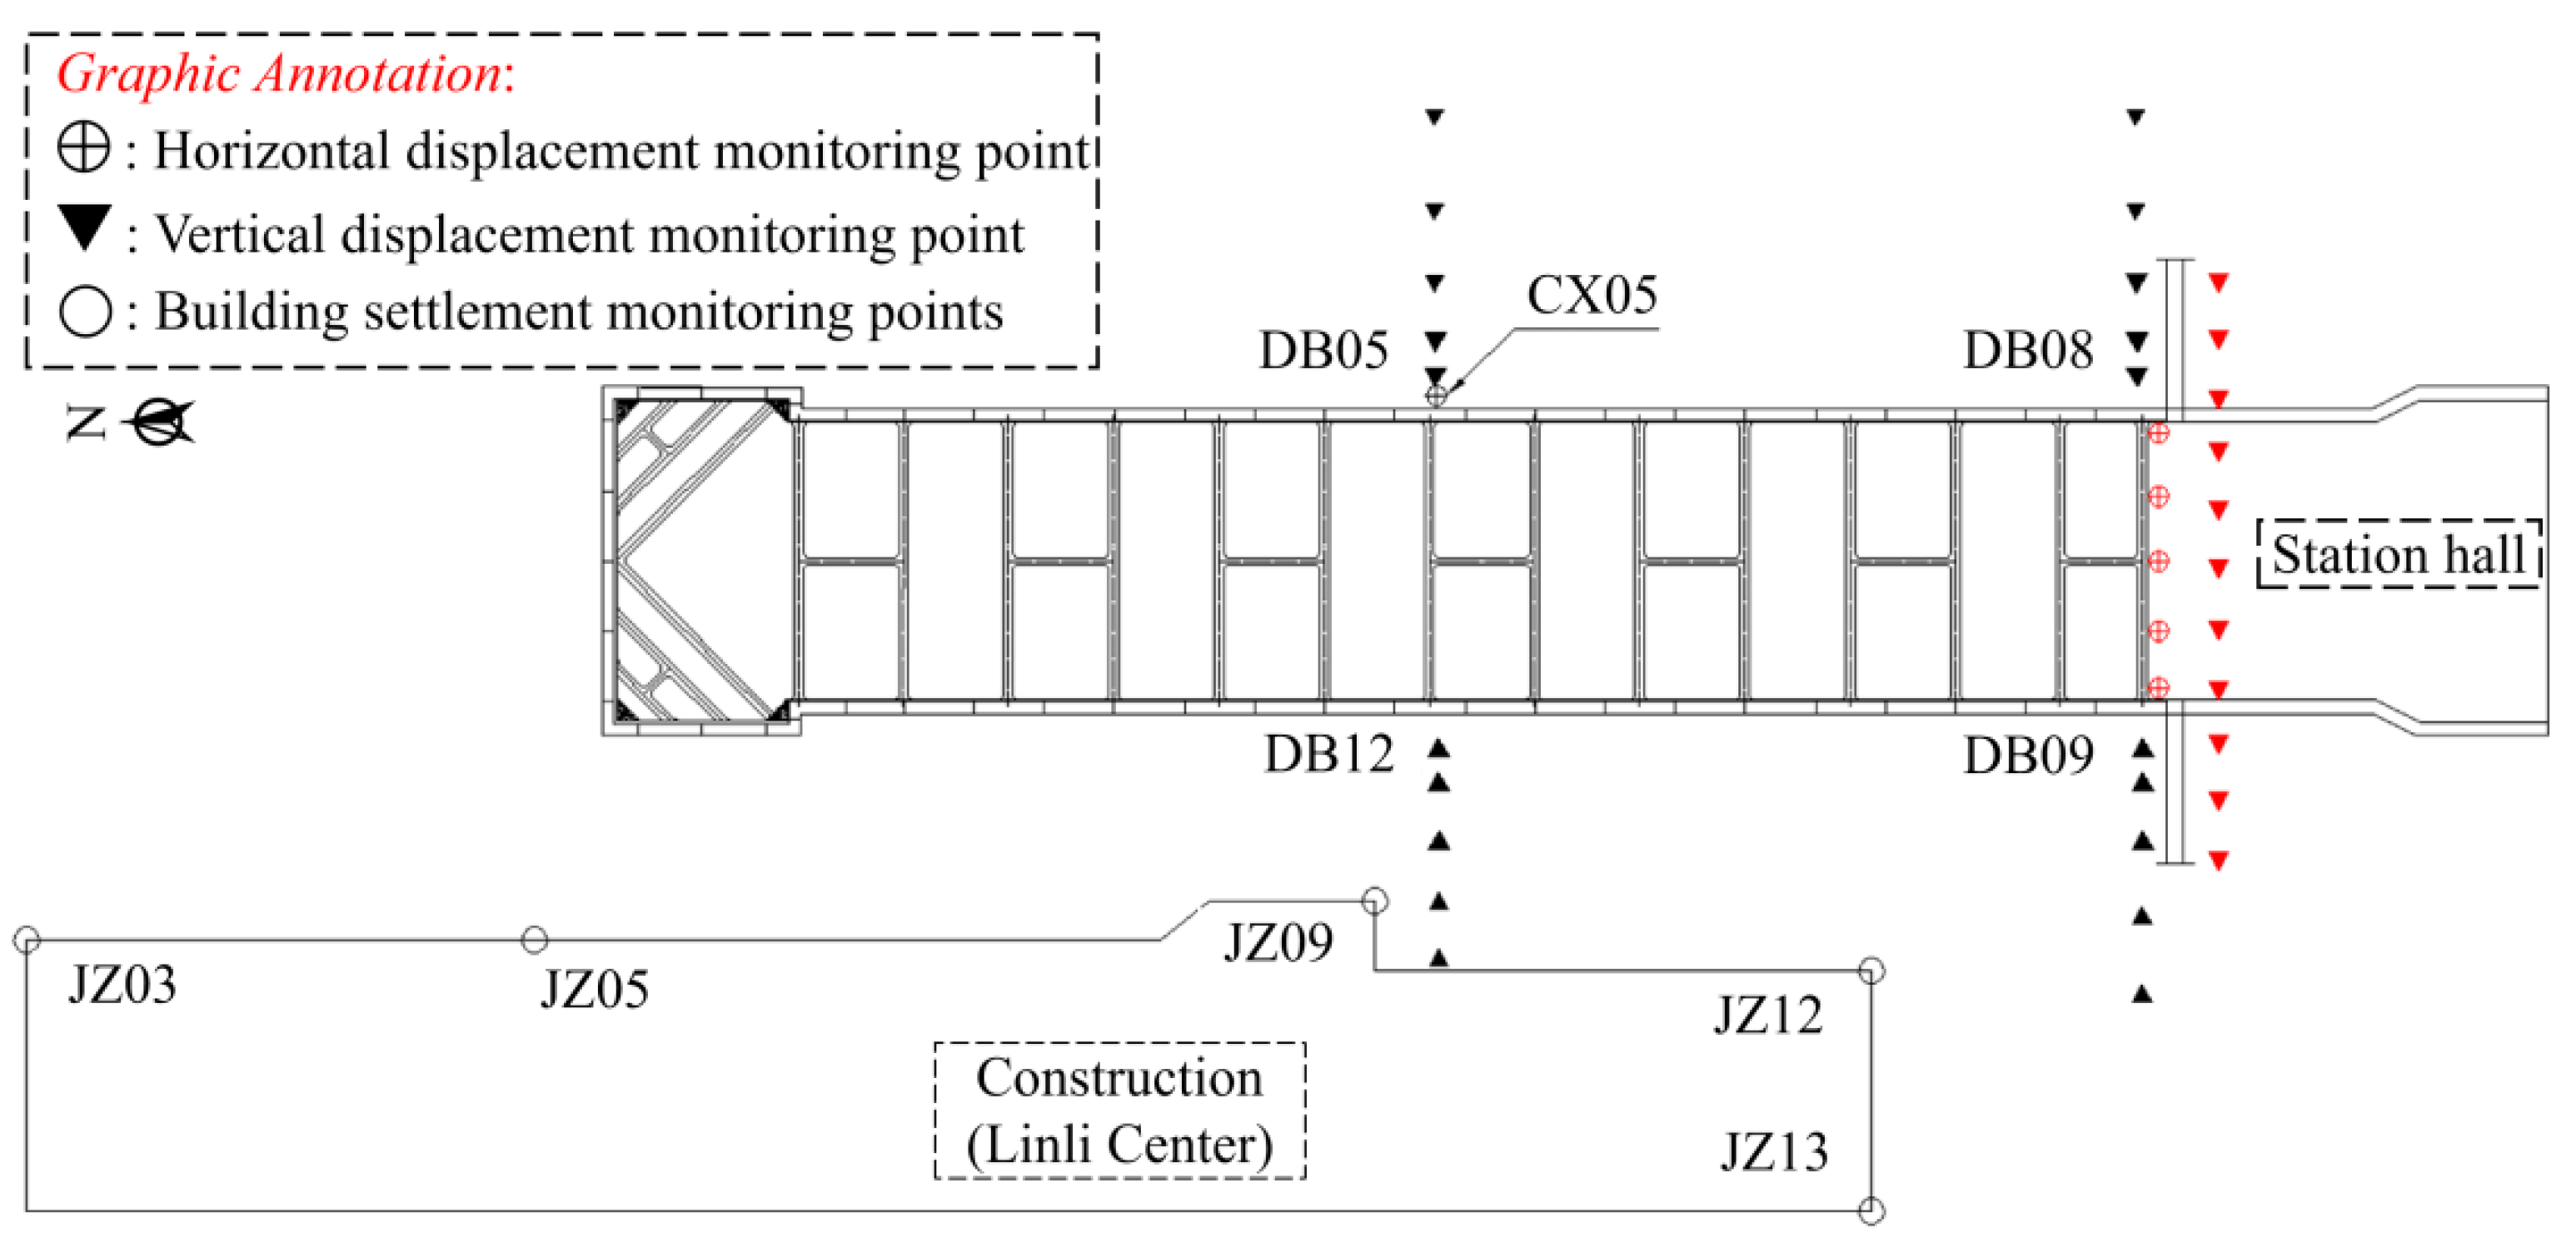
Figure 11 shows the layout of the monitoring points during the foundation pit excavation process. Only the monitoring points studied in this paper are provided in the figure. The monitoring items primarily include surface deformation monitoring, building deformation monitoring, and diaphragm wall deformation monitoring. The selected monitoring points for this study include surface settlement monitoring points: DB05, DB08, DB09, and DB12; building settlement monitoring points: JZ03, JZ05, JZ09, JZ12, and JZ13; and monitoring points for the existing station hall level, which are marked in red. It should be noted that the existing station hall level employs fully automated monitoring, with the monitoring points arranged at the level of the station hall.
Figure 11.
Schematic diagram of the layout of each measuring point during the construction process of the foundation pit.
4.2. Surface Subsidence Monitoring and Analysis
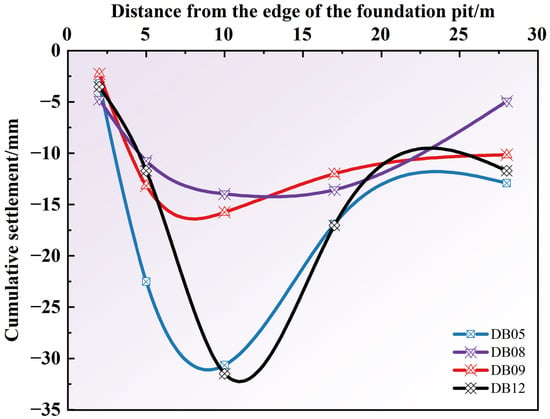
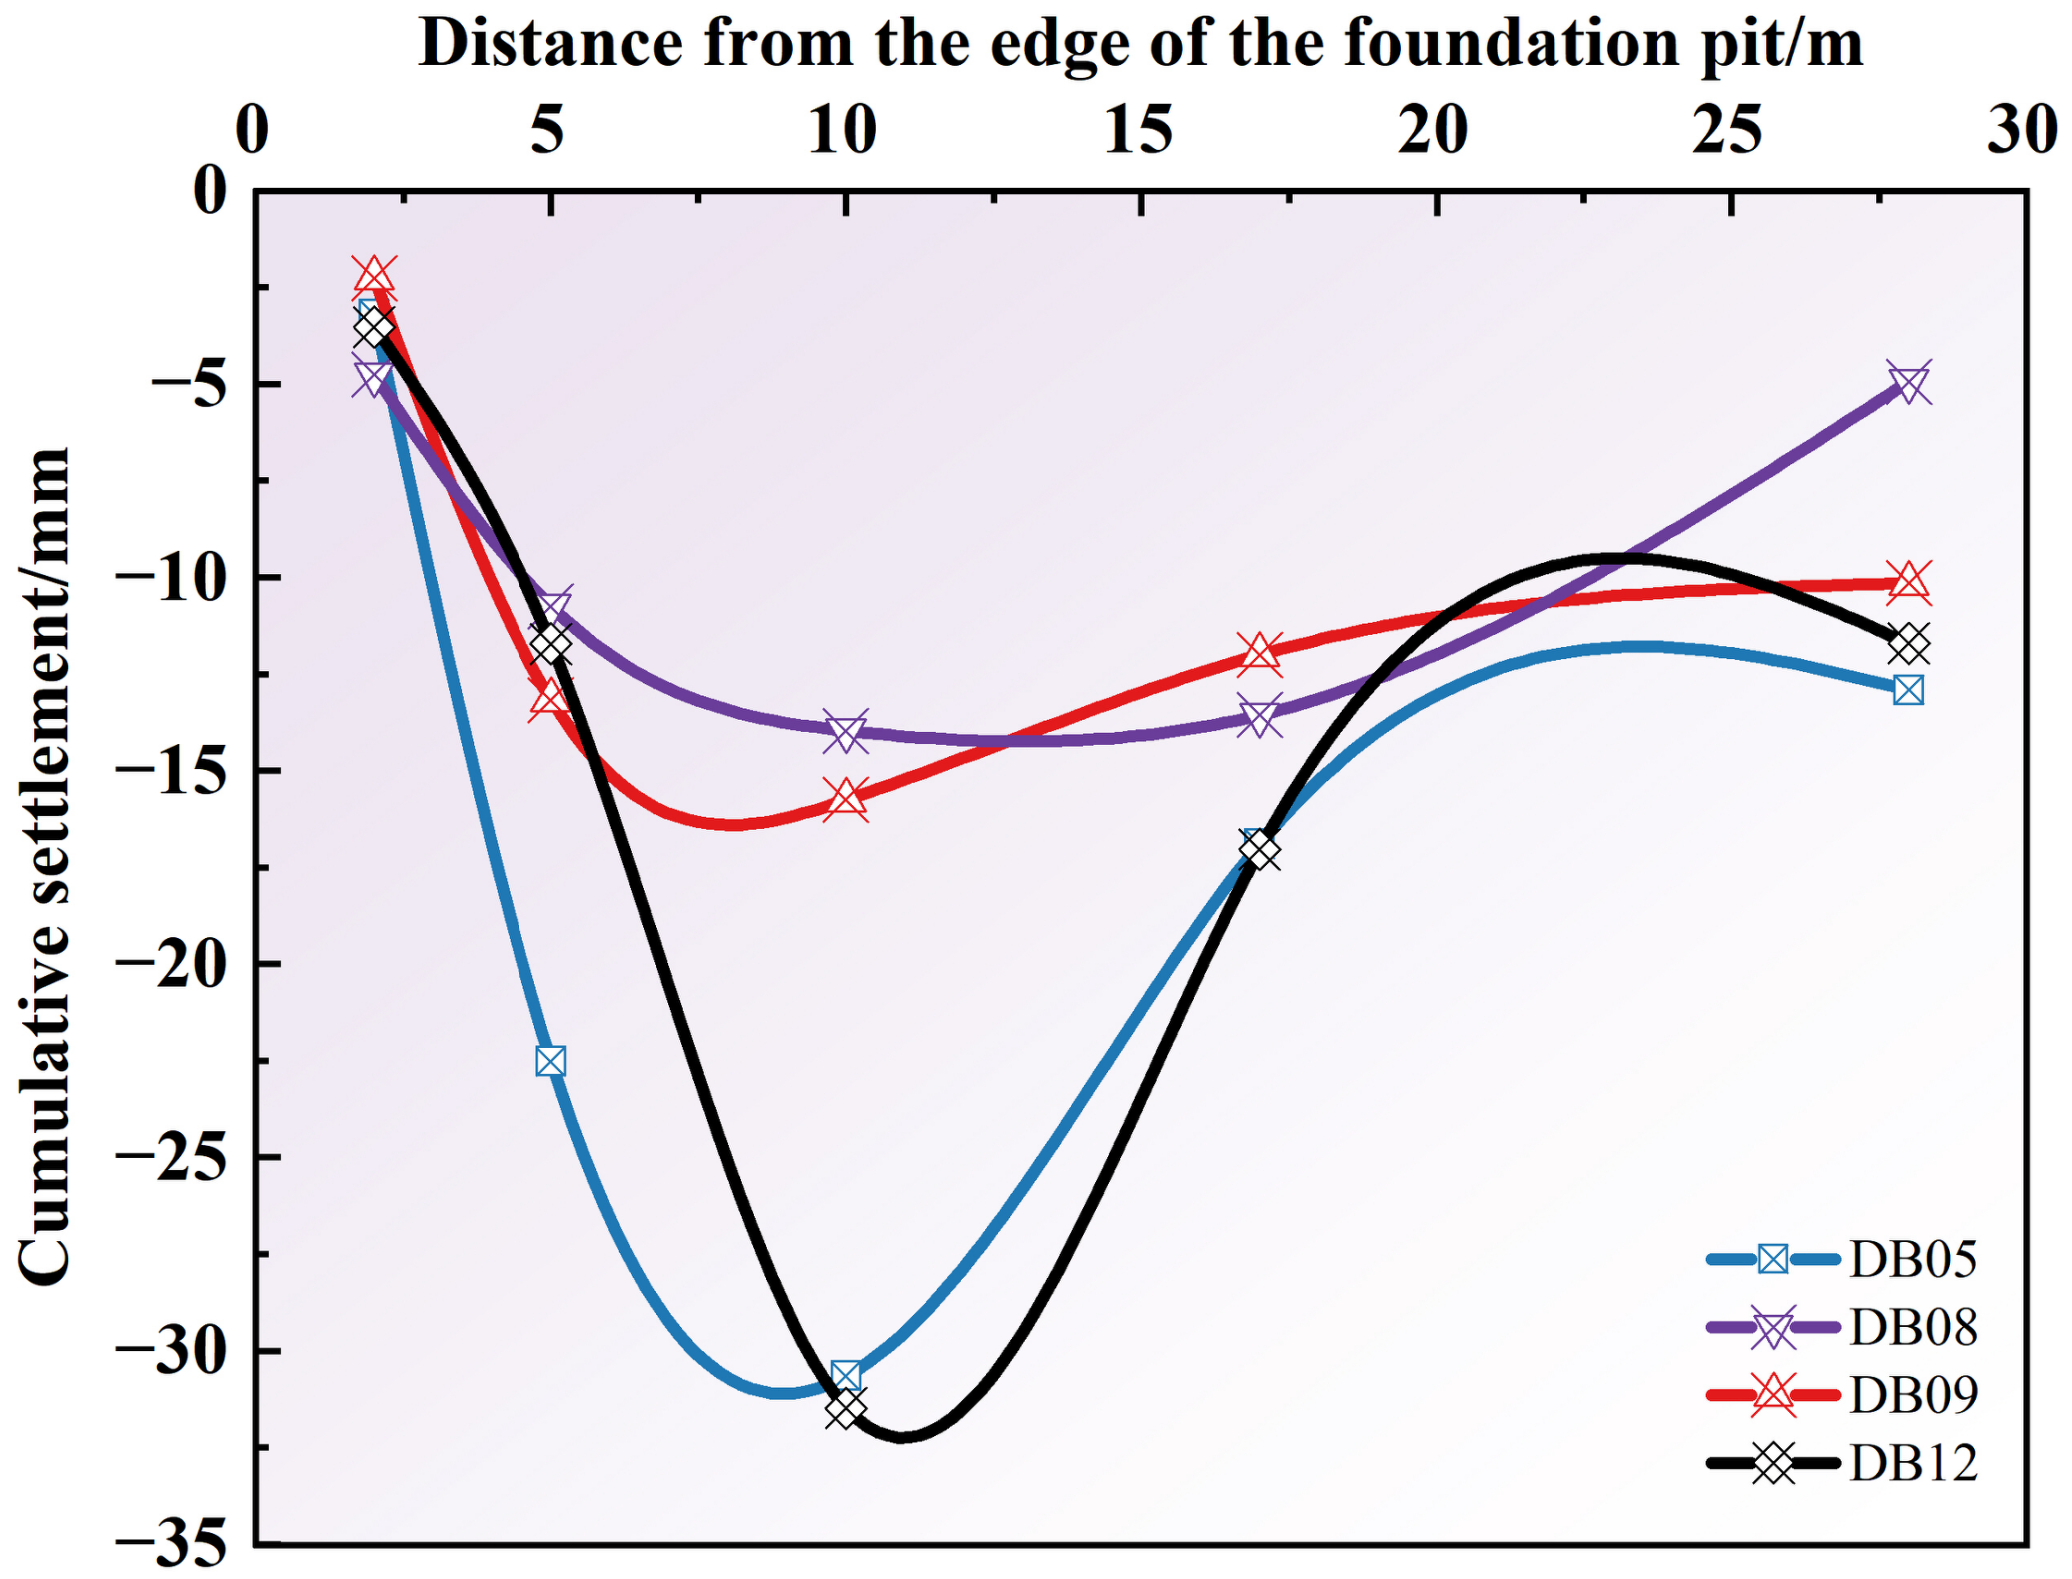
Figure 12 presents the cumulative surface deformation monitoring results for each monitoring section. It can be observed that the surface settlement near the end of the foundation pit is generally smaller than that at the central section of the long side of the pit, with a larger settlement value located about 10.0 m from the edge of the foundation pit. The two monitoring sections, DB08 and DB09, are located at relative positions on both sides of the foundation pit end. Their surface settlement deformation curves are nearly identical, and the surface settlement is much smaller compared to the sections at the center of the long side of the pit. This is due to the shielding effect of the soil arching at the corner of the foundation pit, which reduces the soil pressure, thus resulting in relatively smaller surface settlement.
Figure 12.
Surface settlement envelope map.
The two monitoring sections, DB05 and DB12, are located at the center of the long side of the foundation pit, and their sections are nearly parallel. Upon examining the settlement curves, it can be seen that the surface settlement trends measured by DB05 and DB12, located on either side of the pit, are fairly consistent. Compared to other sections, the cumulative surface settlement at the central part of the long side of the pit is larger, which is in line with the typical surface settlement pattern observed during foundation pit excavation. The spatial pattern, namely larger settlement at the central long side and smaller settlement near the end walls, is primarily attributed to the soil arching and shielding effect at the pit corners, which reduces the soil pressure and thus the settlement near the ends. Superimposed on this spatial effect, the surface surcharges from machinery, stockpiles and construction materials at the central long side increased the upper soil load and further amplified the central settlement. The two contributions are therefore distinguished: corner shielding controls the spatial distribution, whereas surface surcharge mainly increases the magnitude at the central long side.
4.3. Deformation Monitoring and Analysis of Underground Continuous Walls
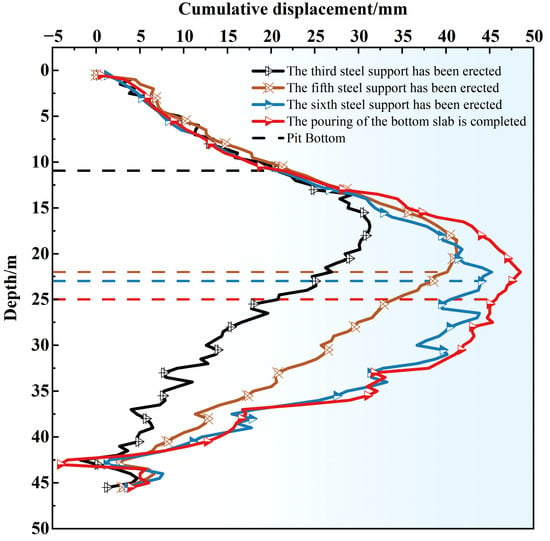
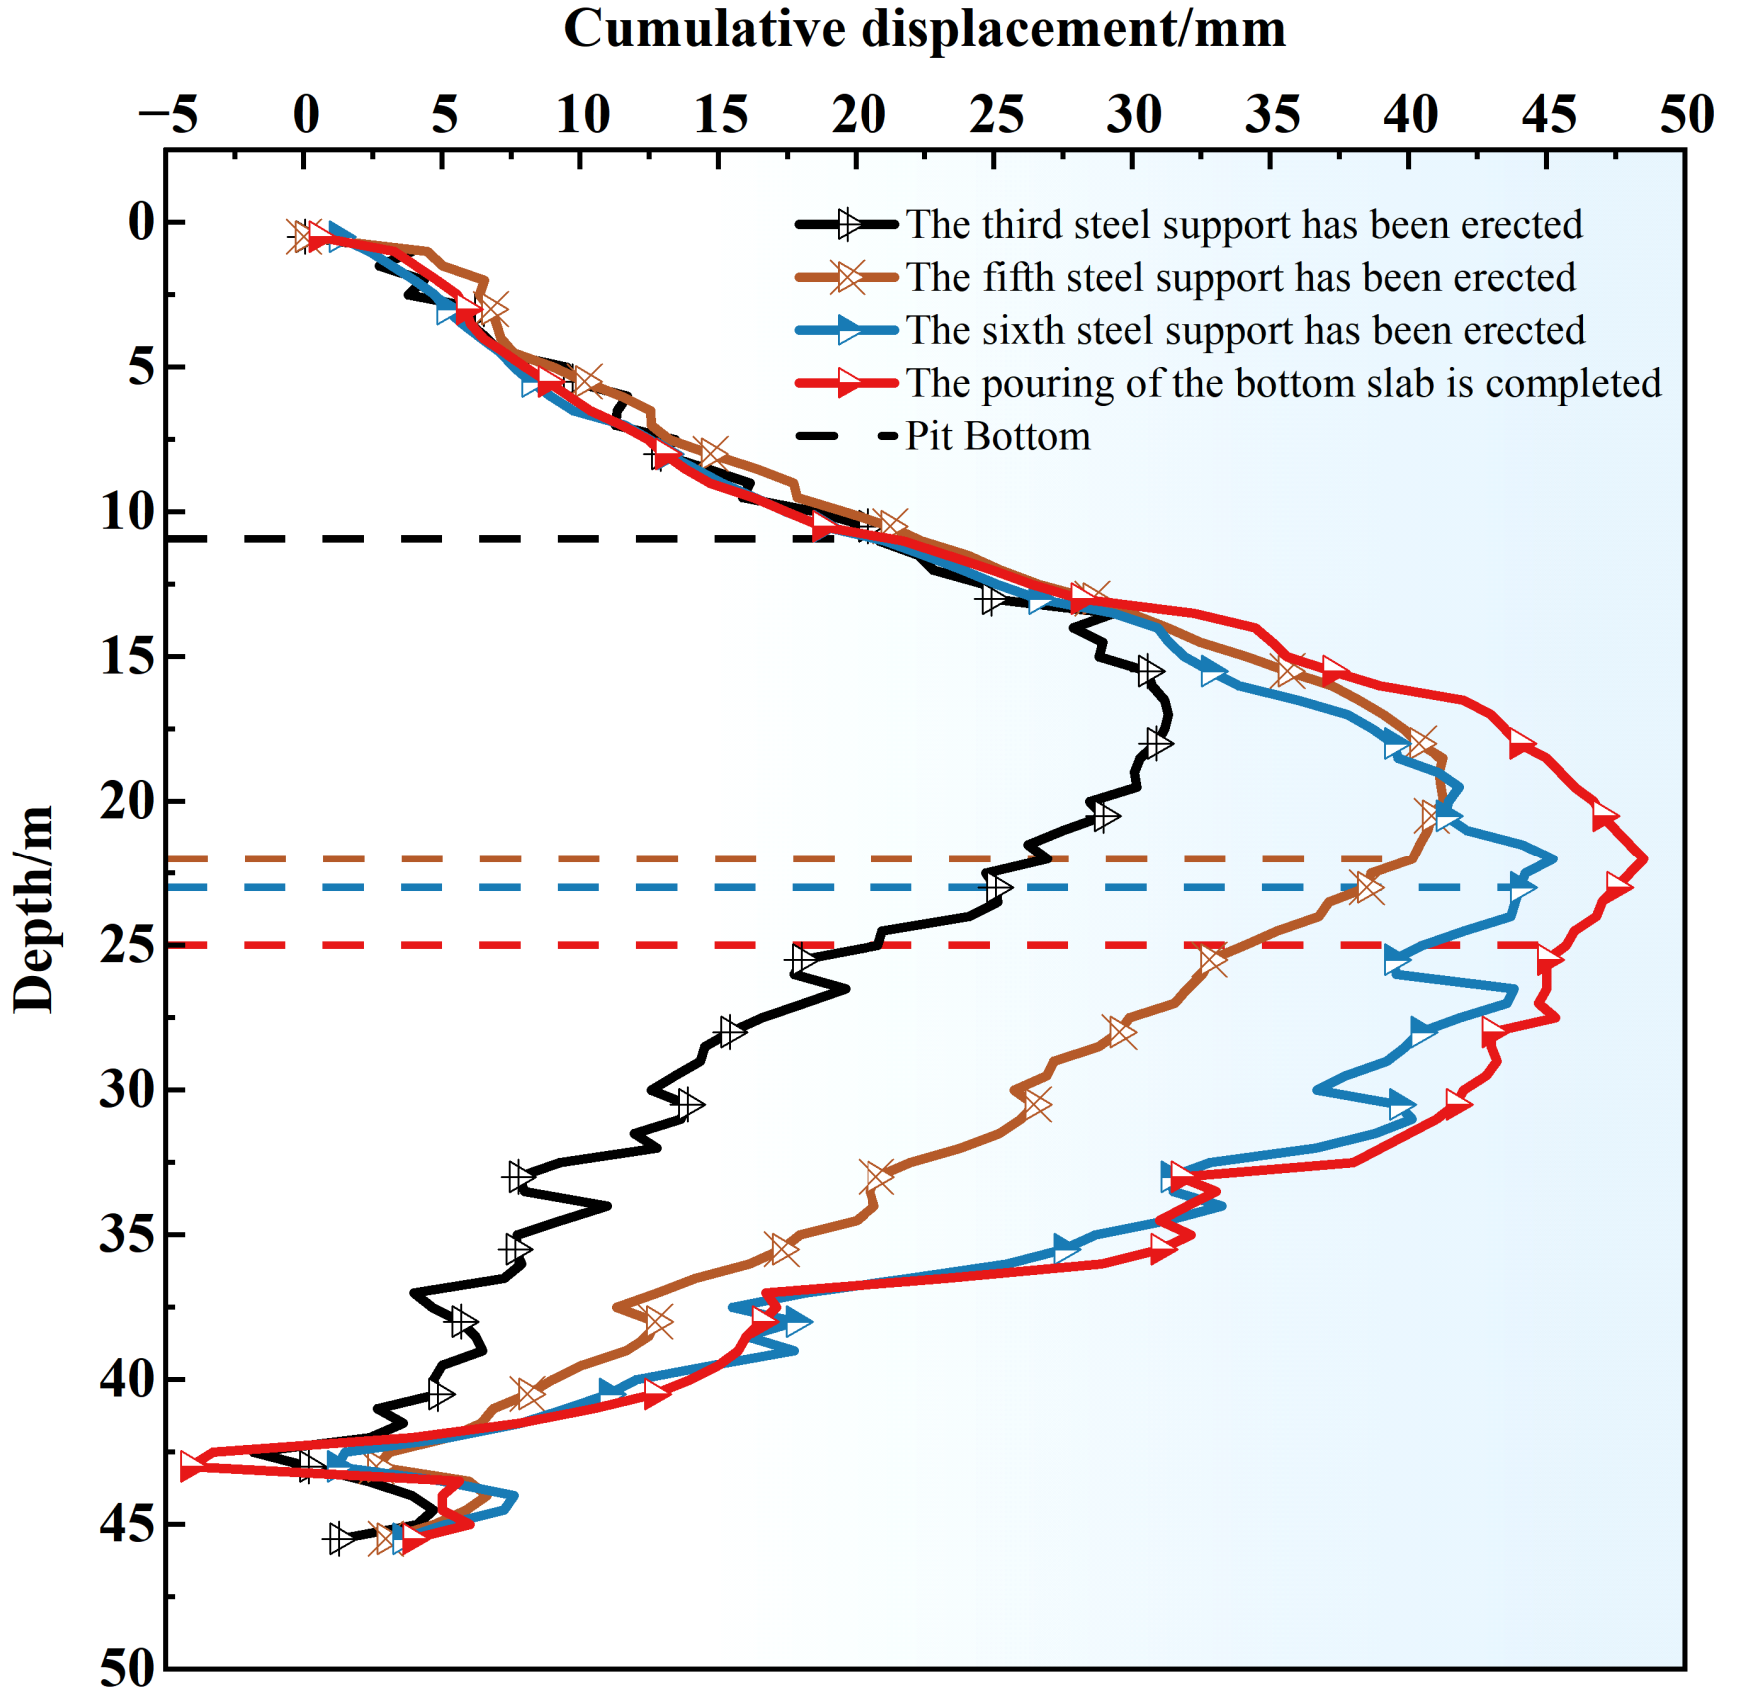
Taking monitoring point CX05 as the research object, the deformation characteristics of the underground diaphragm wall during the foundation pit excavation process were investigated. Figure 13 shows the variation in lateral displacement of the diaphragm wall during the foundation pit excavation process. It can be seen that as the excavation depth increases, the lateral deformation of the diaphragm wall also gradually increases. After the installation of the 3rd layer of steel support, when the excavation depth reaches approximately 10 m (Step 5 in Table 4), the maximum lateral deformation occurs at a depth of around 15 m below ground. After the 4th concrete support and the 5th steel support were installed, at this point, the excavation depth of the foundation pit (He) was 18 m, and the maximum deformation depth Hm of the diaphragm wall was within the range of (He−2) to (He+2), with the maximum horizontal displacement of about 42 mm. In contrast, during the construction of the 4th concrete support and the 5th steel support, the diaphragm wall underwent significant deformation. After the completion of the 6th steel support installation, the deformation of the diaphragm wall became smaller. This suggests that during the installation of the concrete supports, the deformation rate of the diaphragm wall was higher. Once the excavation reached the pit bottom and the bottom slab was poured, the deformation of the diaphragm wall stabilized, with the maximum deformation reaching approximately 48 mm.
Figure 13.
Lateral displacement curve of enclosure structure.
4.4. Calculation and Analysis of Building Settlement and Tilt Values
According to the on-site monitoring plan, settlement monitoring points were placed along the exterior of the building before the diaphragm wall construction. This paper analyzes the on-site monitoring data from five monitoring points: JZ03, JZ05, JZ09, JZ12, and JZ13. The control values used in this study are as follows. For the building, the 20 mm settlement limit is specified in the project monitoring scheme, not exceed the allowable value. The tilt limit of 0.004 for the Neighborhood Center is taken from GB 50007-2011 for the overall tilt of multi-storey and high-rise buildings with Hg ≤ 24 m; the building is a multi-storey structure below 24 m, so this limit is applicable. For the existing operating station, the 20 mm displacement limit is specified in the project monitoring scheme and is consistent with the deformation safety threshold adopted for existing metro structures in comparable studies. A three-level threshold system is used: the warning value is set at 60% to 70% of the control value, and the action value at 80%; for building tilt, a cumulative value of 2/1000 (0.002) or a rate exceeding 0.0001 H/d for three consecutive days triggers a warning, following GB 50497-2019. It should be emphasized that these values are deformation-control indicators, not complete structural damage criteria. At the building monitoring points JZ03, JZ05, JZ09, JZ12 and JZ13, the simulated foundation settlements were of the same order of magnitude as the monitored values, with differences of about 1 to 2 mm; the model also reproduced qualitatively the slight uplift at some points and the settlement at the northern end. The remaining differences are attributed to the simplified structural representation, which does not fully include the local stiffness of the building, and to the exclusion of groundwater. The tilt comparison in Section 5.1 is therefore complementary to, rather than a substitute for, the point-wise comparison.
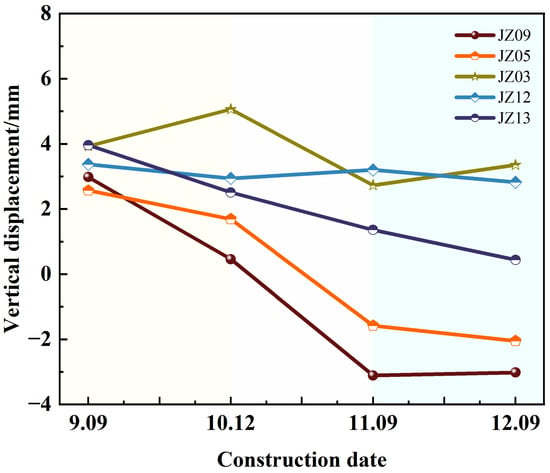
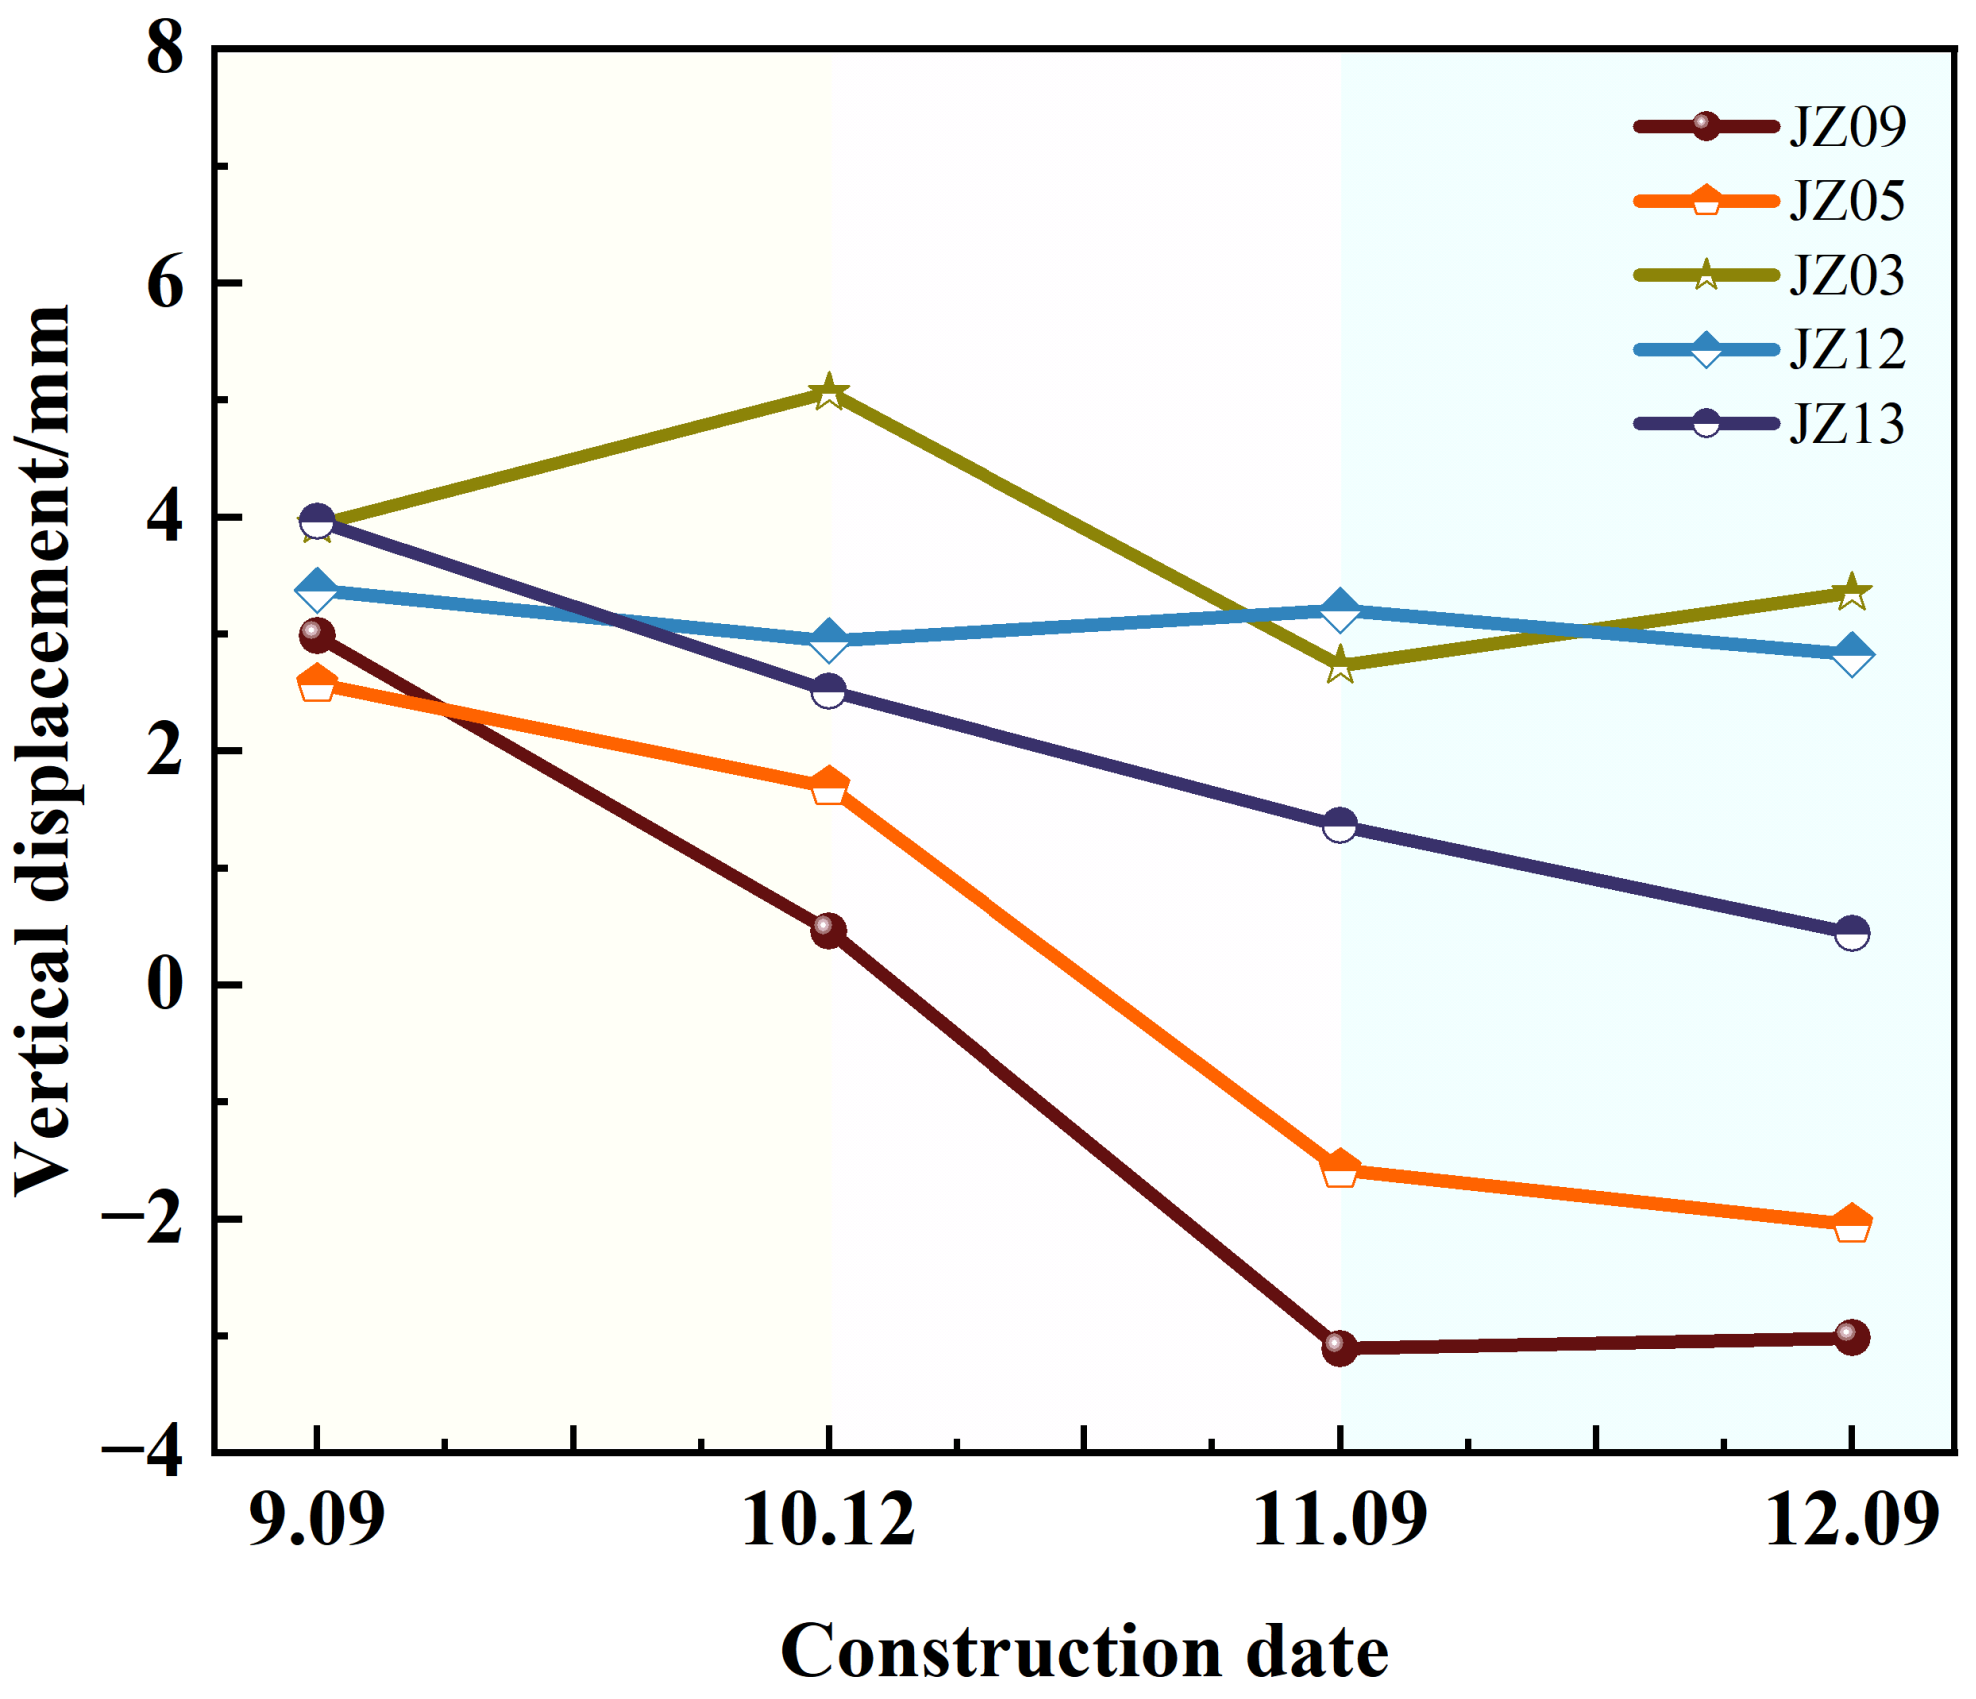
The cumulative displacement in the building settlement monitoring points over time is shown in Figure 14. In the figure, positive values indicate uplift, while negative values indicate settlement. According to the monitoring data, it can be seen that during the foundation pit excavation process, the maximum cumulative settlement of the building was approximately 3 mm, which is significantly smaller than the control value of 20 mm specified in the design standards. Furthermore, the cumulative settlement of monitoring points JZ03 and JZ05, located near the northern end of the foundation pit, changed to negative values after October 12, indicating a shift from slight uplift to settlement, which stabilized around November 9. The monitoring values at points JZ09 and JZ12 remain relatively stable throughout the construction process. Monitoring point JZ13, located at the central part of the long side of the foundation pit, farther from the pit, and farther from the pit, shows consistent uplift during the excavation, with the uplift gradually decreasing and eventually stabilizing. Both JZ09 and JZ12, located closer to the foundation pit, exhibit slight uplift with minimal variation.
Figure 14.
Settlement time history curve of building measurement points.
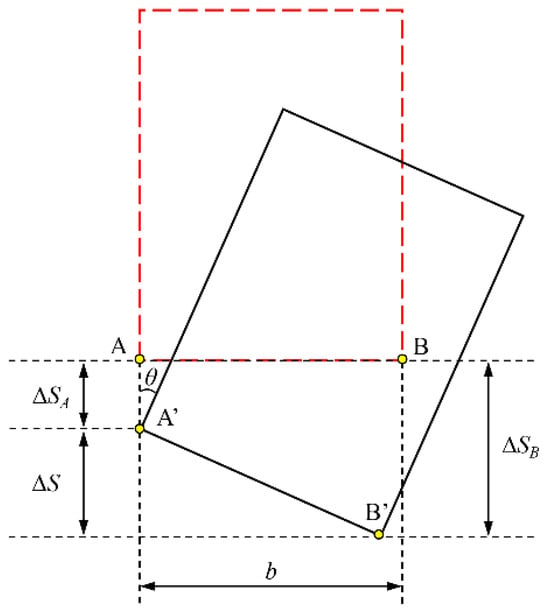
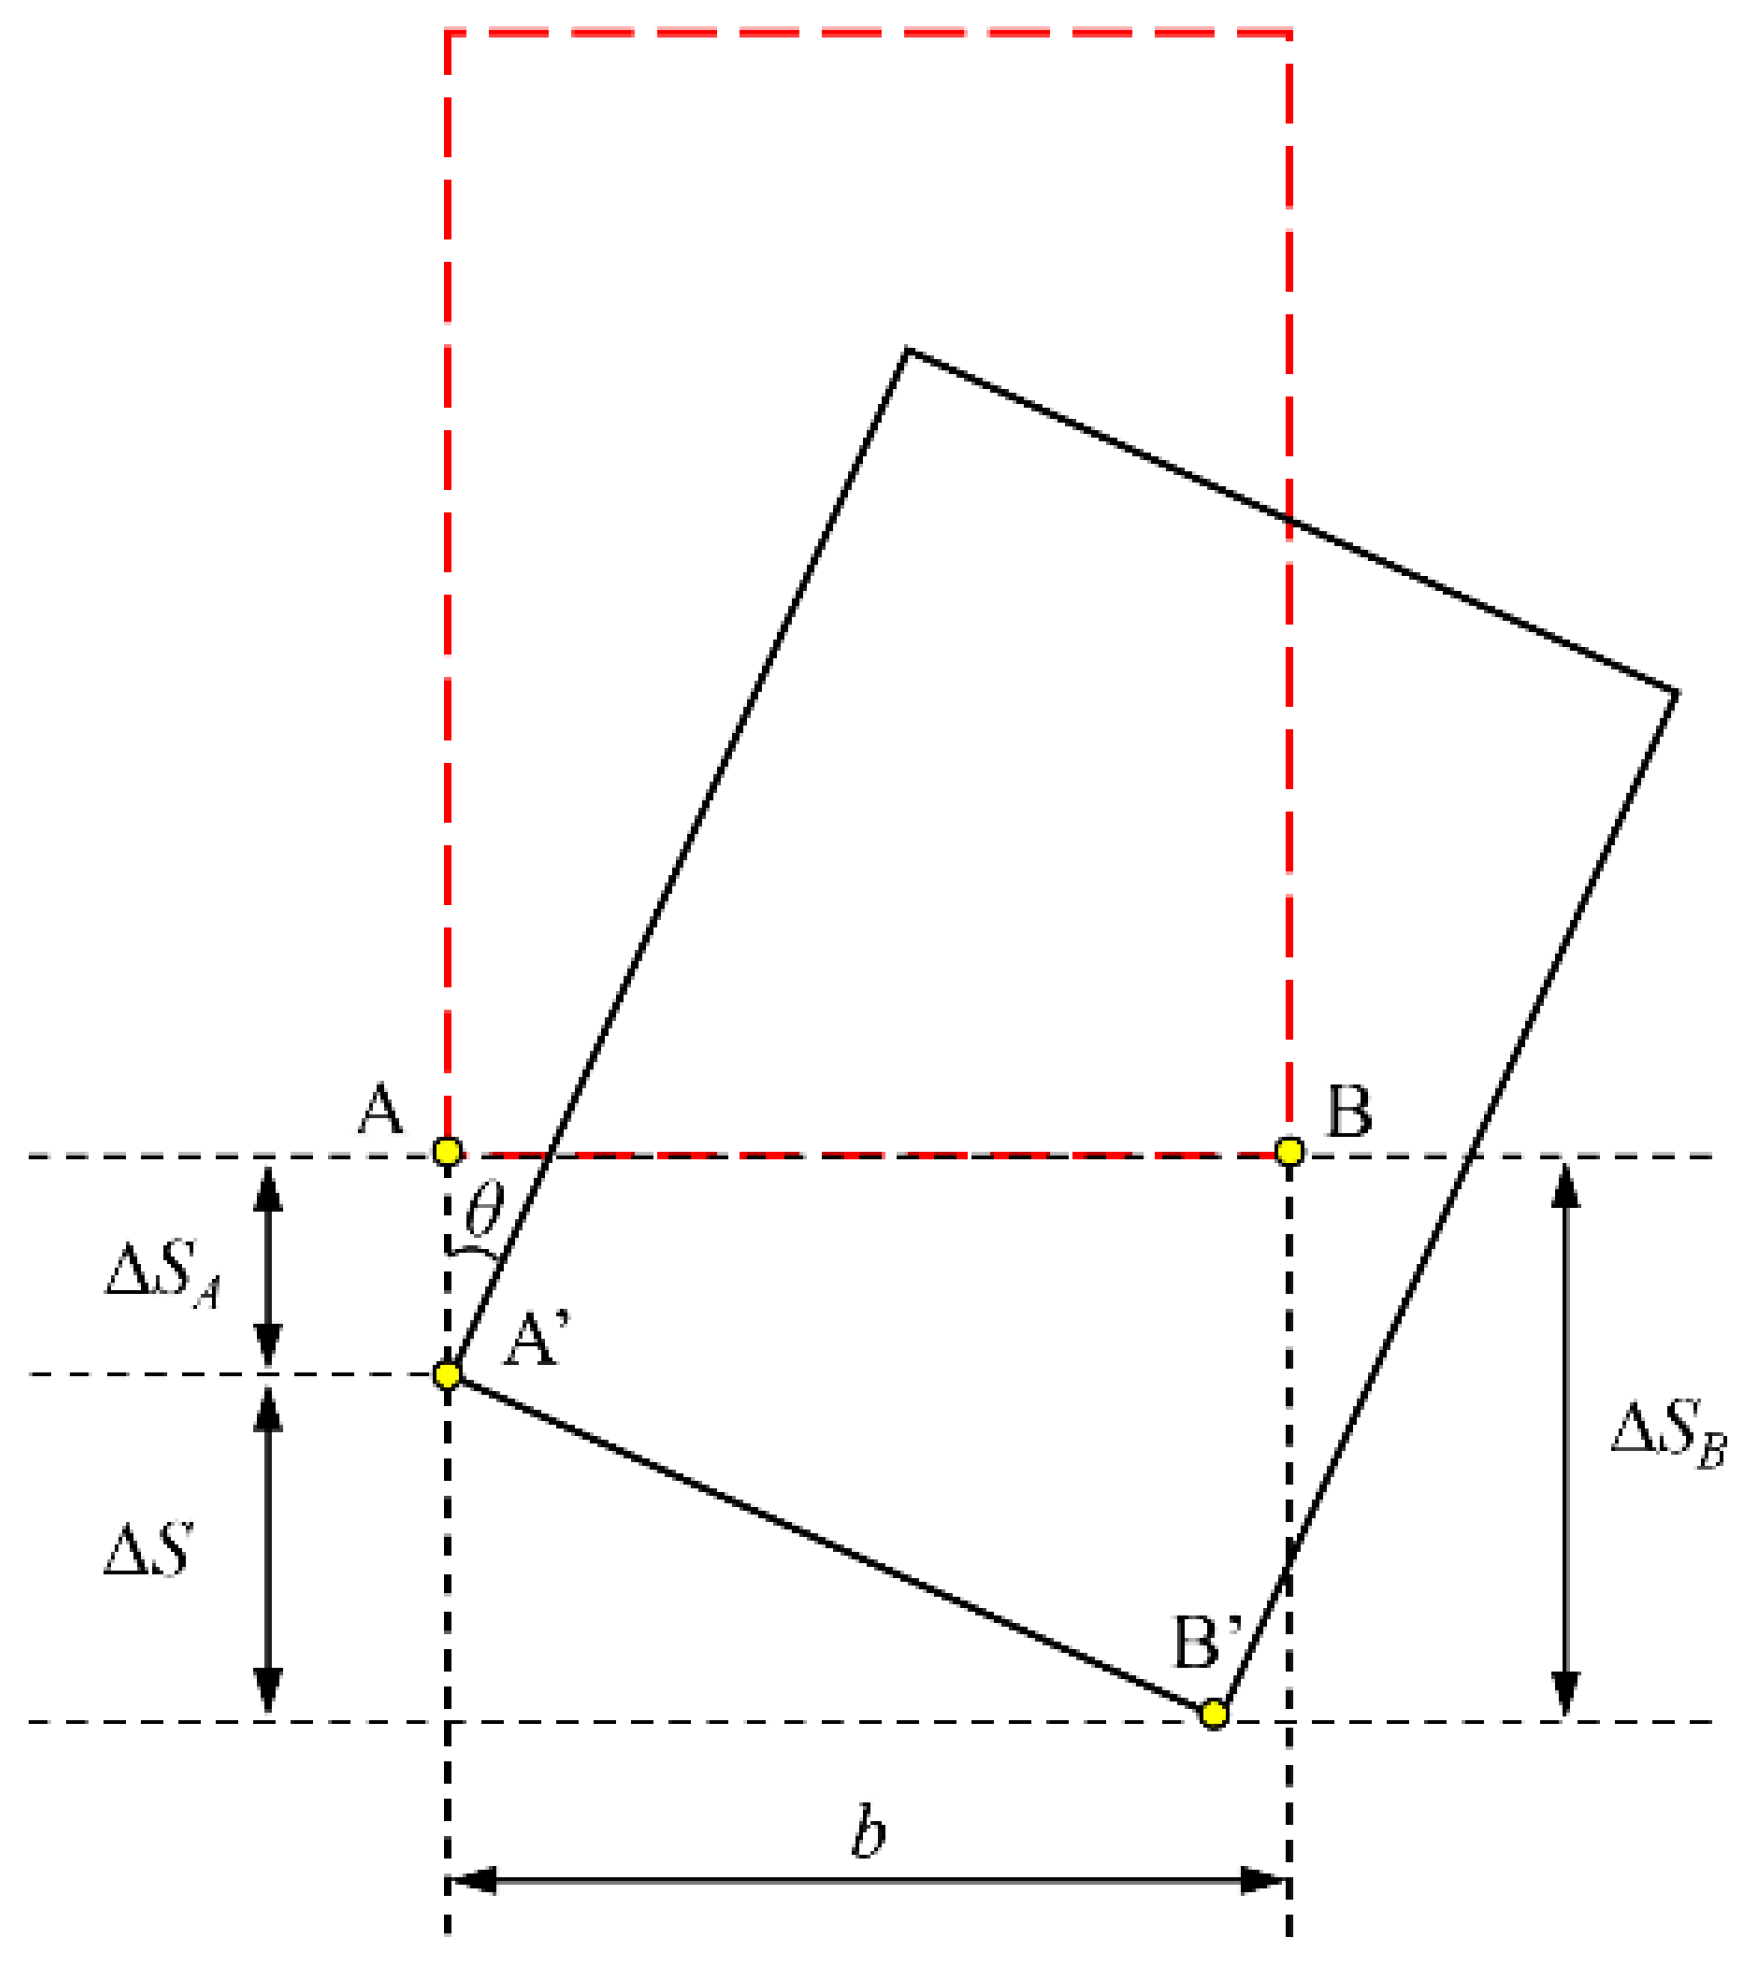
Due to significant differential settlement on both sides of the building, it is necessary to calculate its tilt. According to Equation (1), monitoring points JZ12 and JZ13 were selected to calculate the building’s tilt, with the calculation schematic shown in Figure 15.
Figure 15.
Schematic diagram of building inclination calculation.
In the formula, b is the horizontal distance between monitoring points JZ12 and JZ13 (denoted as A and B). Using the monitoring data from December 9 (after the pit’s foundation slab was poured), the differential settlement ∆S between the two monitoring points was calculated to be 2.38 mm. Using Equation (1), the tilt value of the Neighborhood Center was calculated to be 0.99 × 10⁻⁴, which was much smaller than the allowable tilt value of ≤0.004 for multi-story buildings with a height of less than 24 m, as specified in the Code for Design of Building Foundation (GB 50007-2011) [34]. Given the actual on-site conditions, it can be concluded that the Neighborhood Center building remains in a safe and stable state.
5. Comparative Analysis of Numerical Calculations and On-Site Monitoring Results
5.1. Comparative Analysis of Ground Subsidence and Building Tilting
The soil parameters were determined independently from laboratory tests and the geotechnical investigation, and no monitoring data were used to back-fit the model. The monitoring data were therefore used for independent assessment. Four surface settlement sections (DB05, DB08, DB09 and DB12) and one wall deflection section (CX05) were compared. The bias, root-mean-square error (RMSE), peak magnitude error and peak location error are summarized in Table 5. DB09 and CX05 were used for detailed curve comparison, while DB05 and DB12, located at the central long side where the key risk is claimed, were used as additional independent checks. The relevant explanations are shown in Table 5.
Table 5.
Comparison between simulated and monitored peak responses.
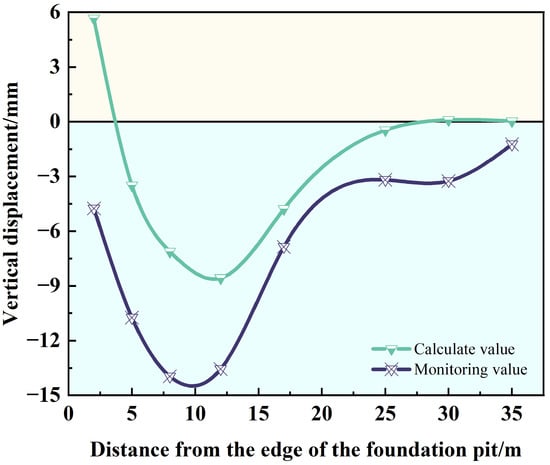
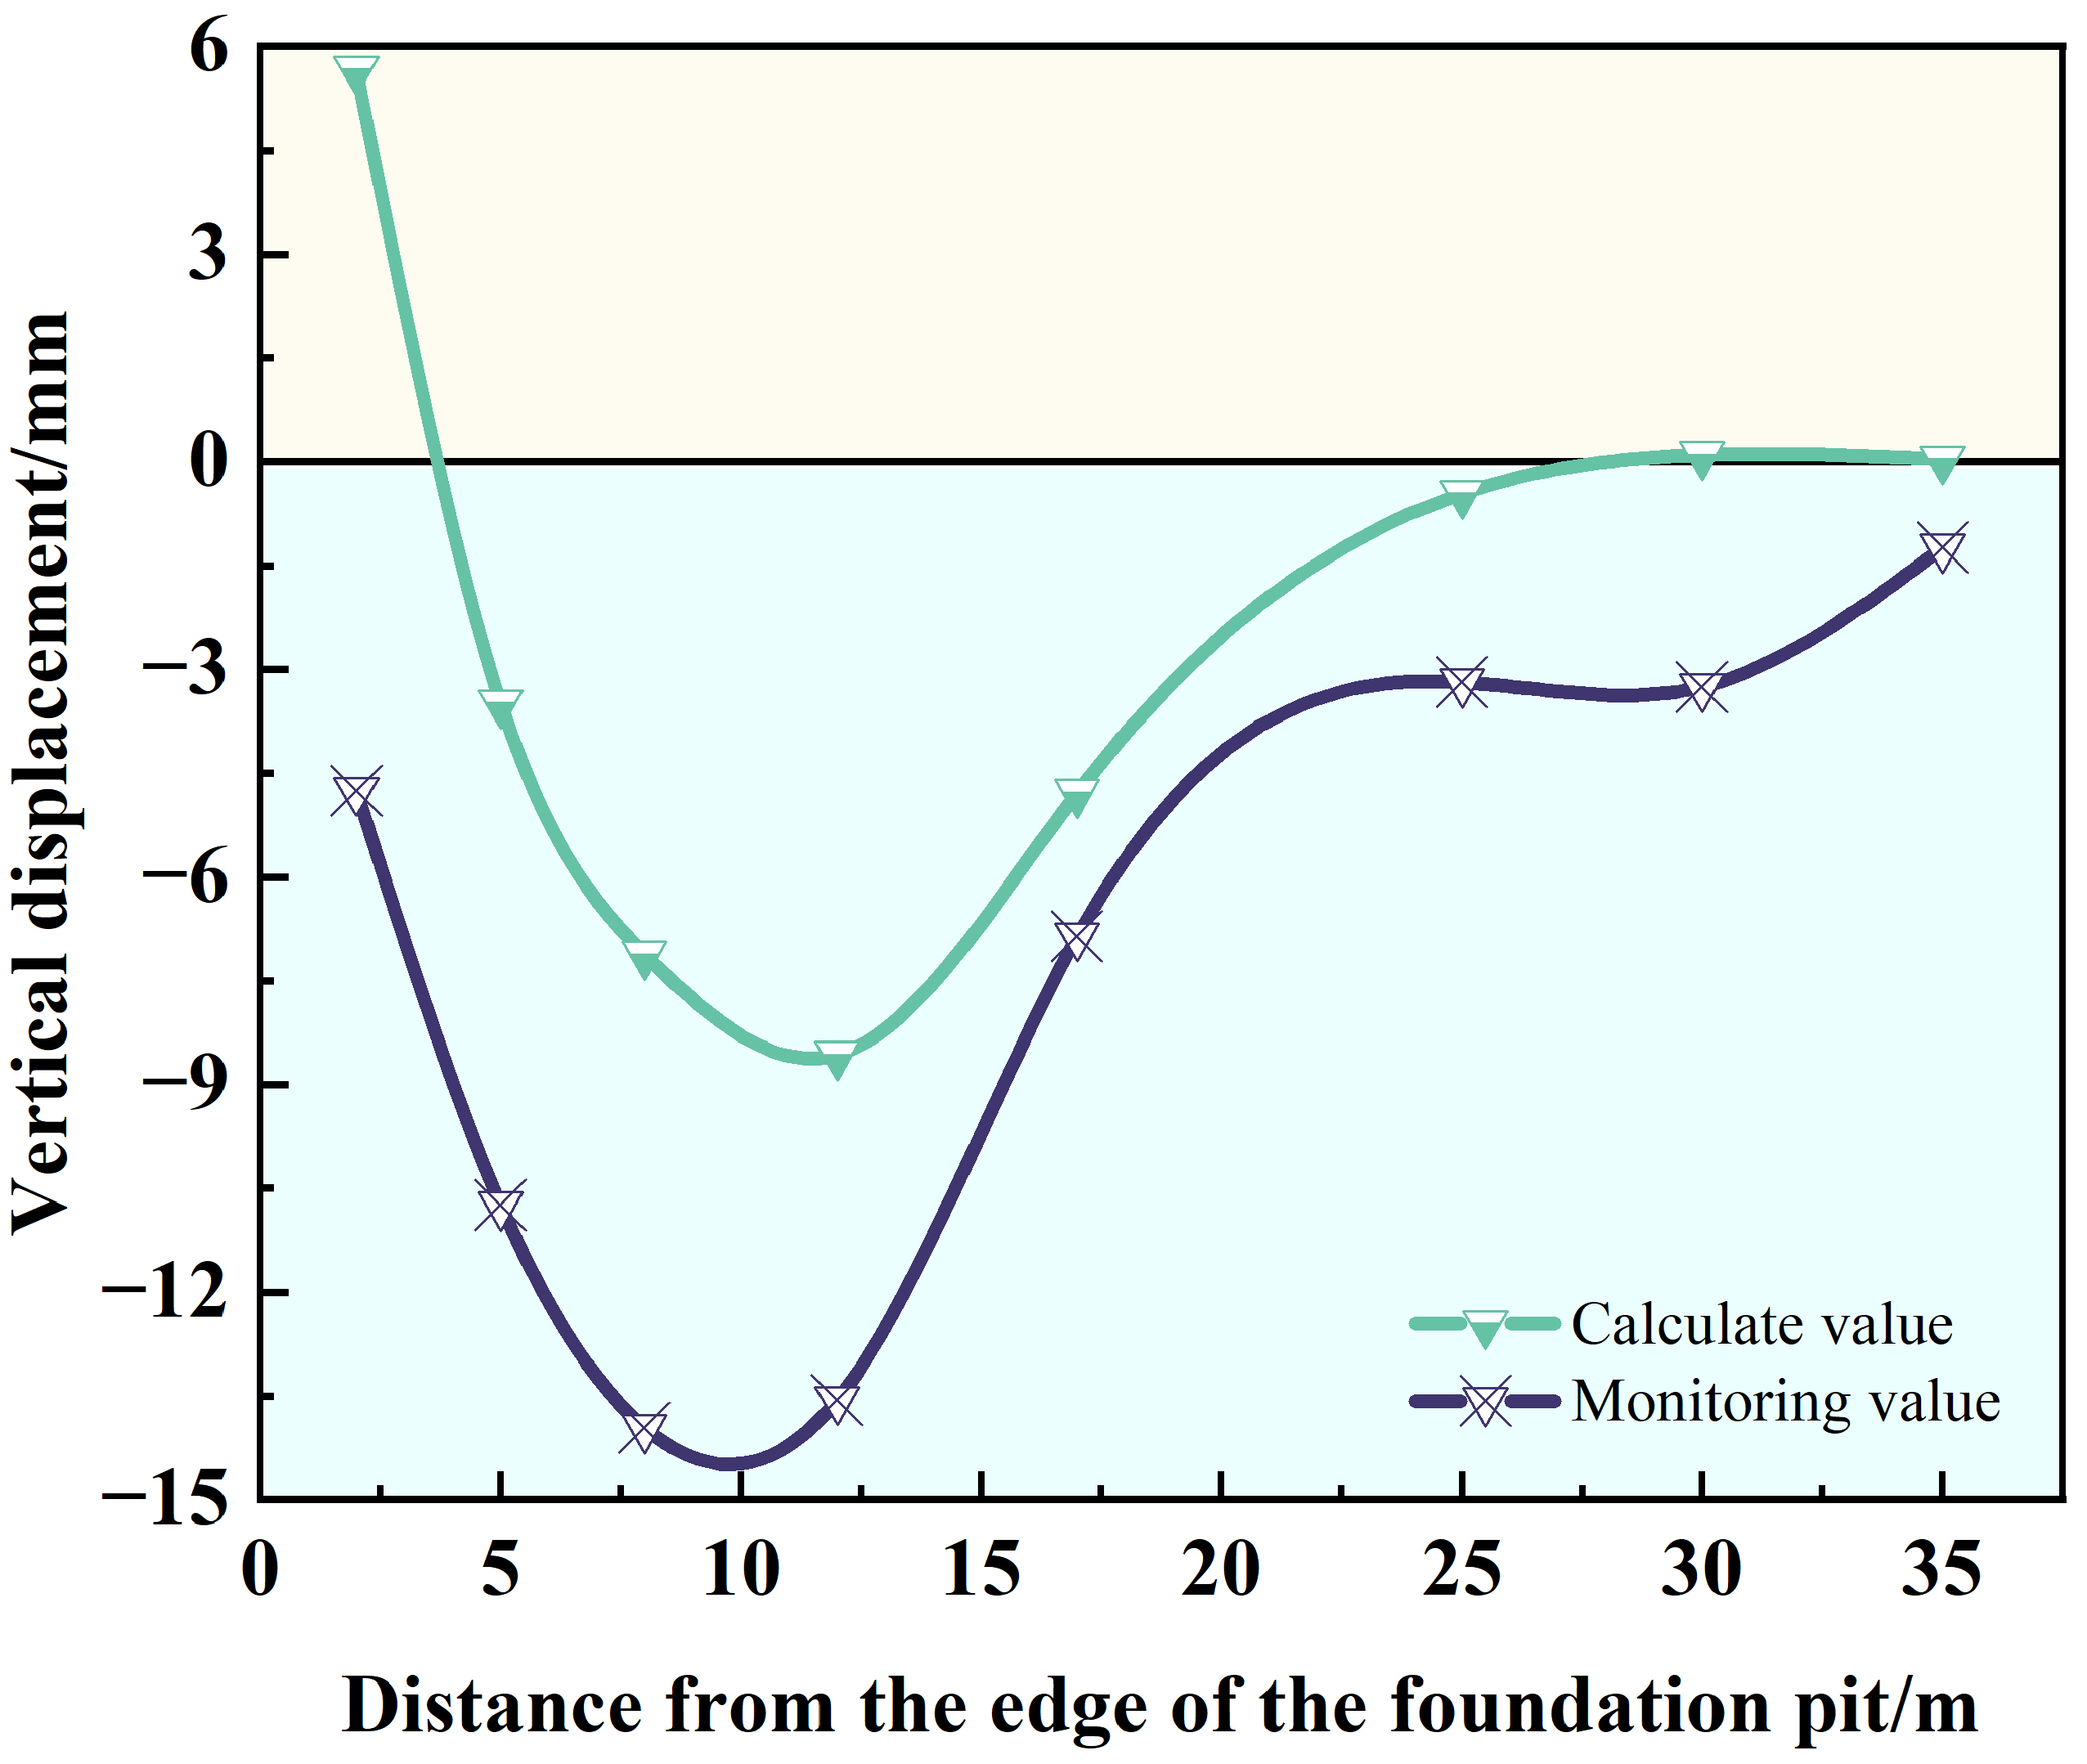
Figure 16 compares the final settlement variations between the on-site monitoring data and the numerical simulation at monitoring point DB09. It can be observed that the numerical calculation and the on-site monitoring data exhibit similar trends in surface settlement, with the location of the maximum settlement being fairly consistent. However, there is a noticeable difference in the settlement values. Based on the on-site construction conditions, the discrepancy in settlement values may be attributed to the following two factors: (1) The presence of a significant amount of machinery and material stockpiles on the construction site surface, which increased the upper soil load, leading to higher surface settlement readings in the on-site monitoring data compared to the simulation. To separate these two contributions, an additional numerical test was carried out by removing the surface surcharge from the central long side while keeping all other conditions unchanged. Without the surcharge, the simulated central settlement significantly decreases, approaching the monitored magnitude, whereas the difference between the central and end sections remained. This confirms that corner shielding governs the spatial pattern, while surface surcharge is the main reason for the larger measured central settlement. (2) The numerical simulation did not account for the effect of groundwater. This simplification has two consequences. First, without seepage and water pressure, the simulated wall deflection and wall-rear settlement tend to be underestimated, because the stabilizing effect of effective stress is overestimated and the drawdown-induced consolidation settlement is not captured. Second, the confined water uplift and basal heave are not represented, so the model cannot be used to check hydraulic stability. These effects partly explain why the monitored central-section settlement (about 30 to 34 mm) was larger than the simulated value (about 8 mm), together with the surface surcharges from machinery and stockpiles.
Figure 16.
Comparison curve of surface subsidence.
The monitored values were nevertheless below the control thresholds, and the deformation pattern was reproduced. In addition, the simulated near-wall uplift was larger than the measured value, which is consistent with the overestimation of local rebound discussed in Section 3.4.1. This difference does not affect the main conclusion regarding the settlement trough and wall deflection. The same comparison at DB05 and DB12 shows that the simulated central-section settlement was considerably smaller than the monitored values, with a bias of about 23 to 24 mm and an RMSE of about 18 to 19 mm. This larger discrepancy is consistent with the two factors noted above, surface surcharges and the exclusion of groundwater, which are more pronounced at the central long side where machinery and stockpiles were concentrated. The peak location, however, was reproduced within about 2 m, and the settlement trough shape remained consistent. This indicates that the model reproduces the spatial pattern but underestimates the magnitude at the central long side.
Similarly, using Equation (1), vertical displacement data from eight nodes located at both ends and the center of the building were selected to calculate the tilt value of the building. According to the calculation results, the tilt value at the center of the building reached a maximum of 1.8 × 10⁻⁴. The tilt value at the northern end, which is the farthest from the foundation pit along the foundation pit’s longitudinal direction, was the smallest, approximately 0.17 × 10⁻⁴. At the southern end of the building, the tilt value calculated from the on-site monitoring data was 0.99 × 10⁻⁴, while the simulation results were 1.1 × 10⁻⁴. The tilt values obtained from the numerical simulation and on-site monitoring were in close agreement, and both were well below the allowable deformation values. These results indicate that the adopted foundation pit protective structure provided effective support, ensuring the safety and stability of the pit’s own structure while also effectively controlling the impact on the surrounding buildings.
5.2. Comparative Analysis of Horizontal Displacements of Underground Continuous Walls
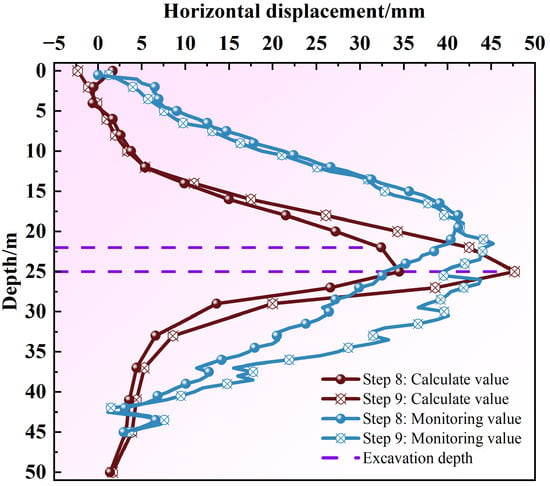
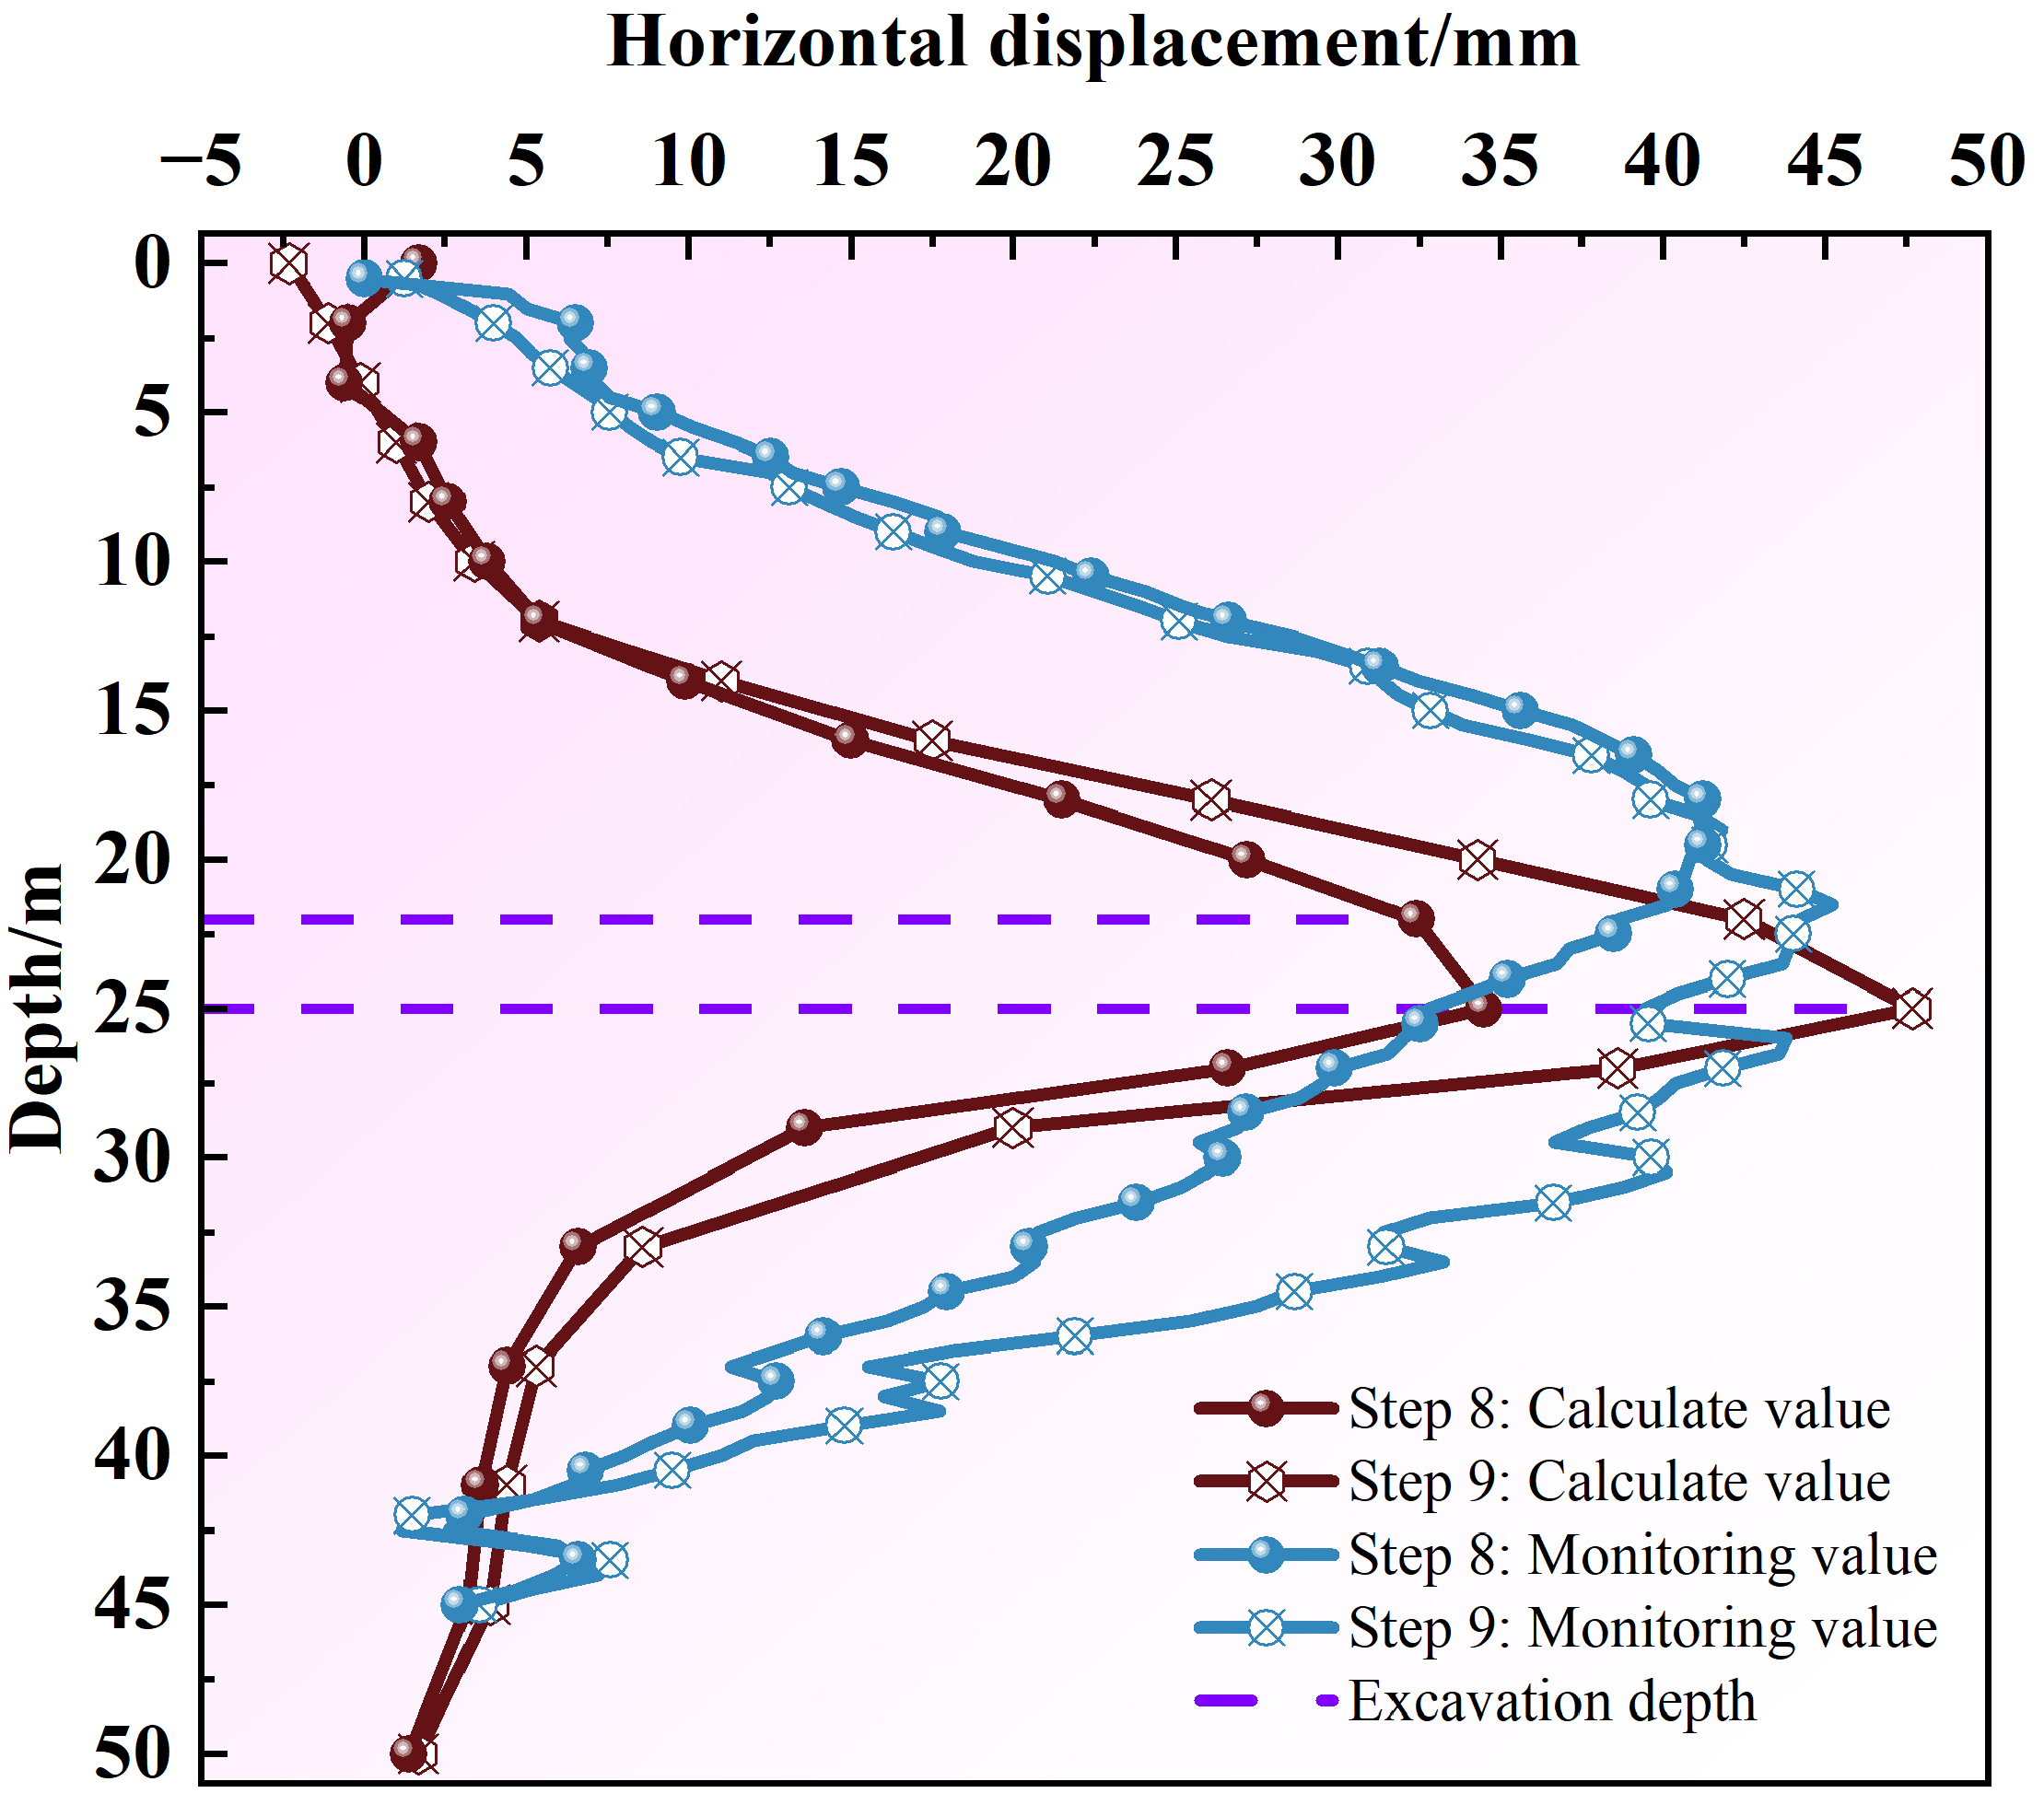
The comparison curve was plotted using the on-site monitoring data and the calculated values for monitoring point CX05, as shown in Figure 17. From the figure, the deformation patterns of the diaphragm walls obtained through numerical calculation and on-site monitoring were basically the same. The calculation results showed that the maximum lateral displacement occurred at a depth Hm within the range of (He−1) to (He+1). The actual on-site monitoring showed that the maximum lateral displacement occurred at a depth Hm within the range of (He−2) to (He+2). The maximum deformation depth of the two methods was quite consistent.
Figure 17.
Comparison curve of horizontal displacement of ground wall.
As can be seen from the figure, the deformation patterns of the diaphragm wall derived from both the numerical calculation and the on-site monitoring are generally consistent. The calculation results indicated that the maximum lateral displacement point depth Hm was within the range of (He−1) to (He+1), while the actual on-site monitoring showed that the maximum lateral displacement point depth Hm was within the range of (He−2) to (He+2). The maximum deformation depth of the two methods was fairly consistent. By comparing the curves, it can be observed that the maximum lateral displacement of the diaphragm wall calculated from the numerical model was very close to the value obtained from the on-site monitoring, both being approximately 48 mm. The difference was that the maximum deformation depth of the diaphragm wall obtained from numerical simulation was smaller, while the on-site monitoring data showed that the lateral displacement affected a larger depth. The reason for this phenomenon may be that there were many factors influencing construction on-site, and the numerical calculation process did not consider the effects of groundwater and surface additional loads. These factors resulted in a significant difference between the maximum deformation ranges obtained from the numerical calculation and the on-site monitoring. Quantitatively, the simulated and monitored maximum wall displacements were both about 48 mm, with an RMSE of about 3 mm and a peak location error of about 2 m. The simulated maximum displacement depth was within He±1 m, while the monitored value was within He±2, as summarized in Table 5.
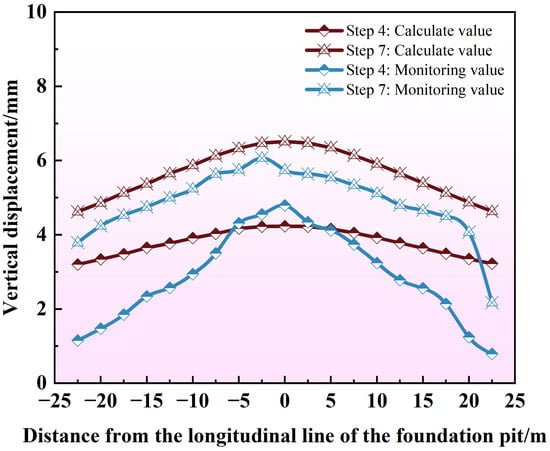
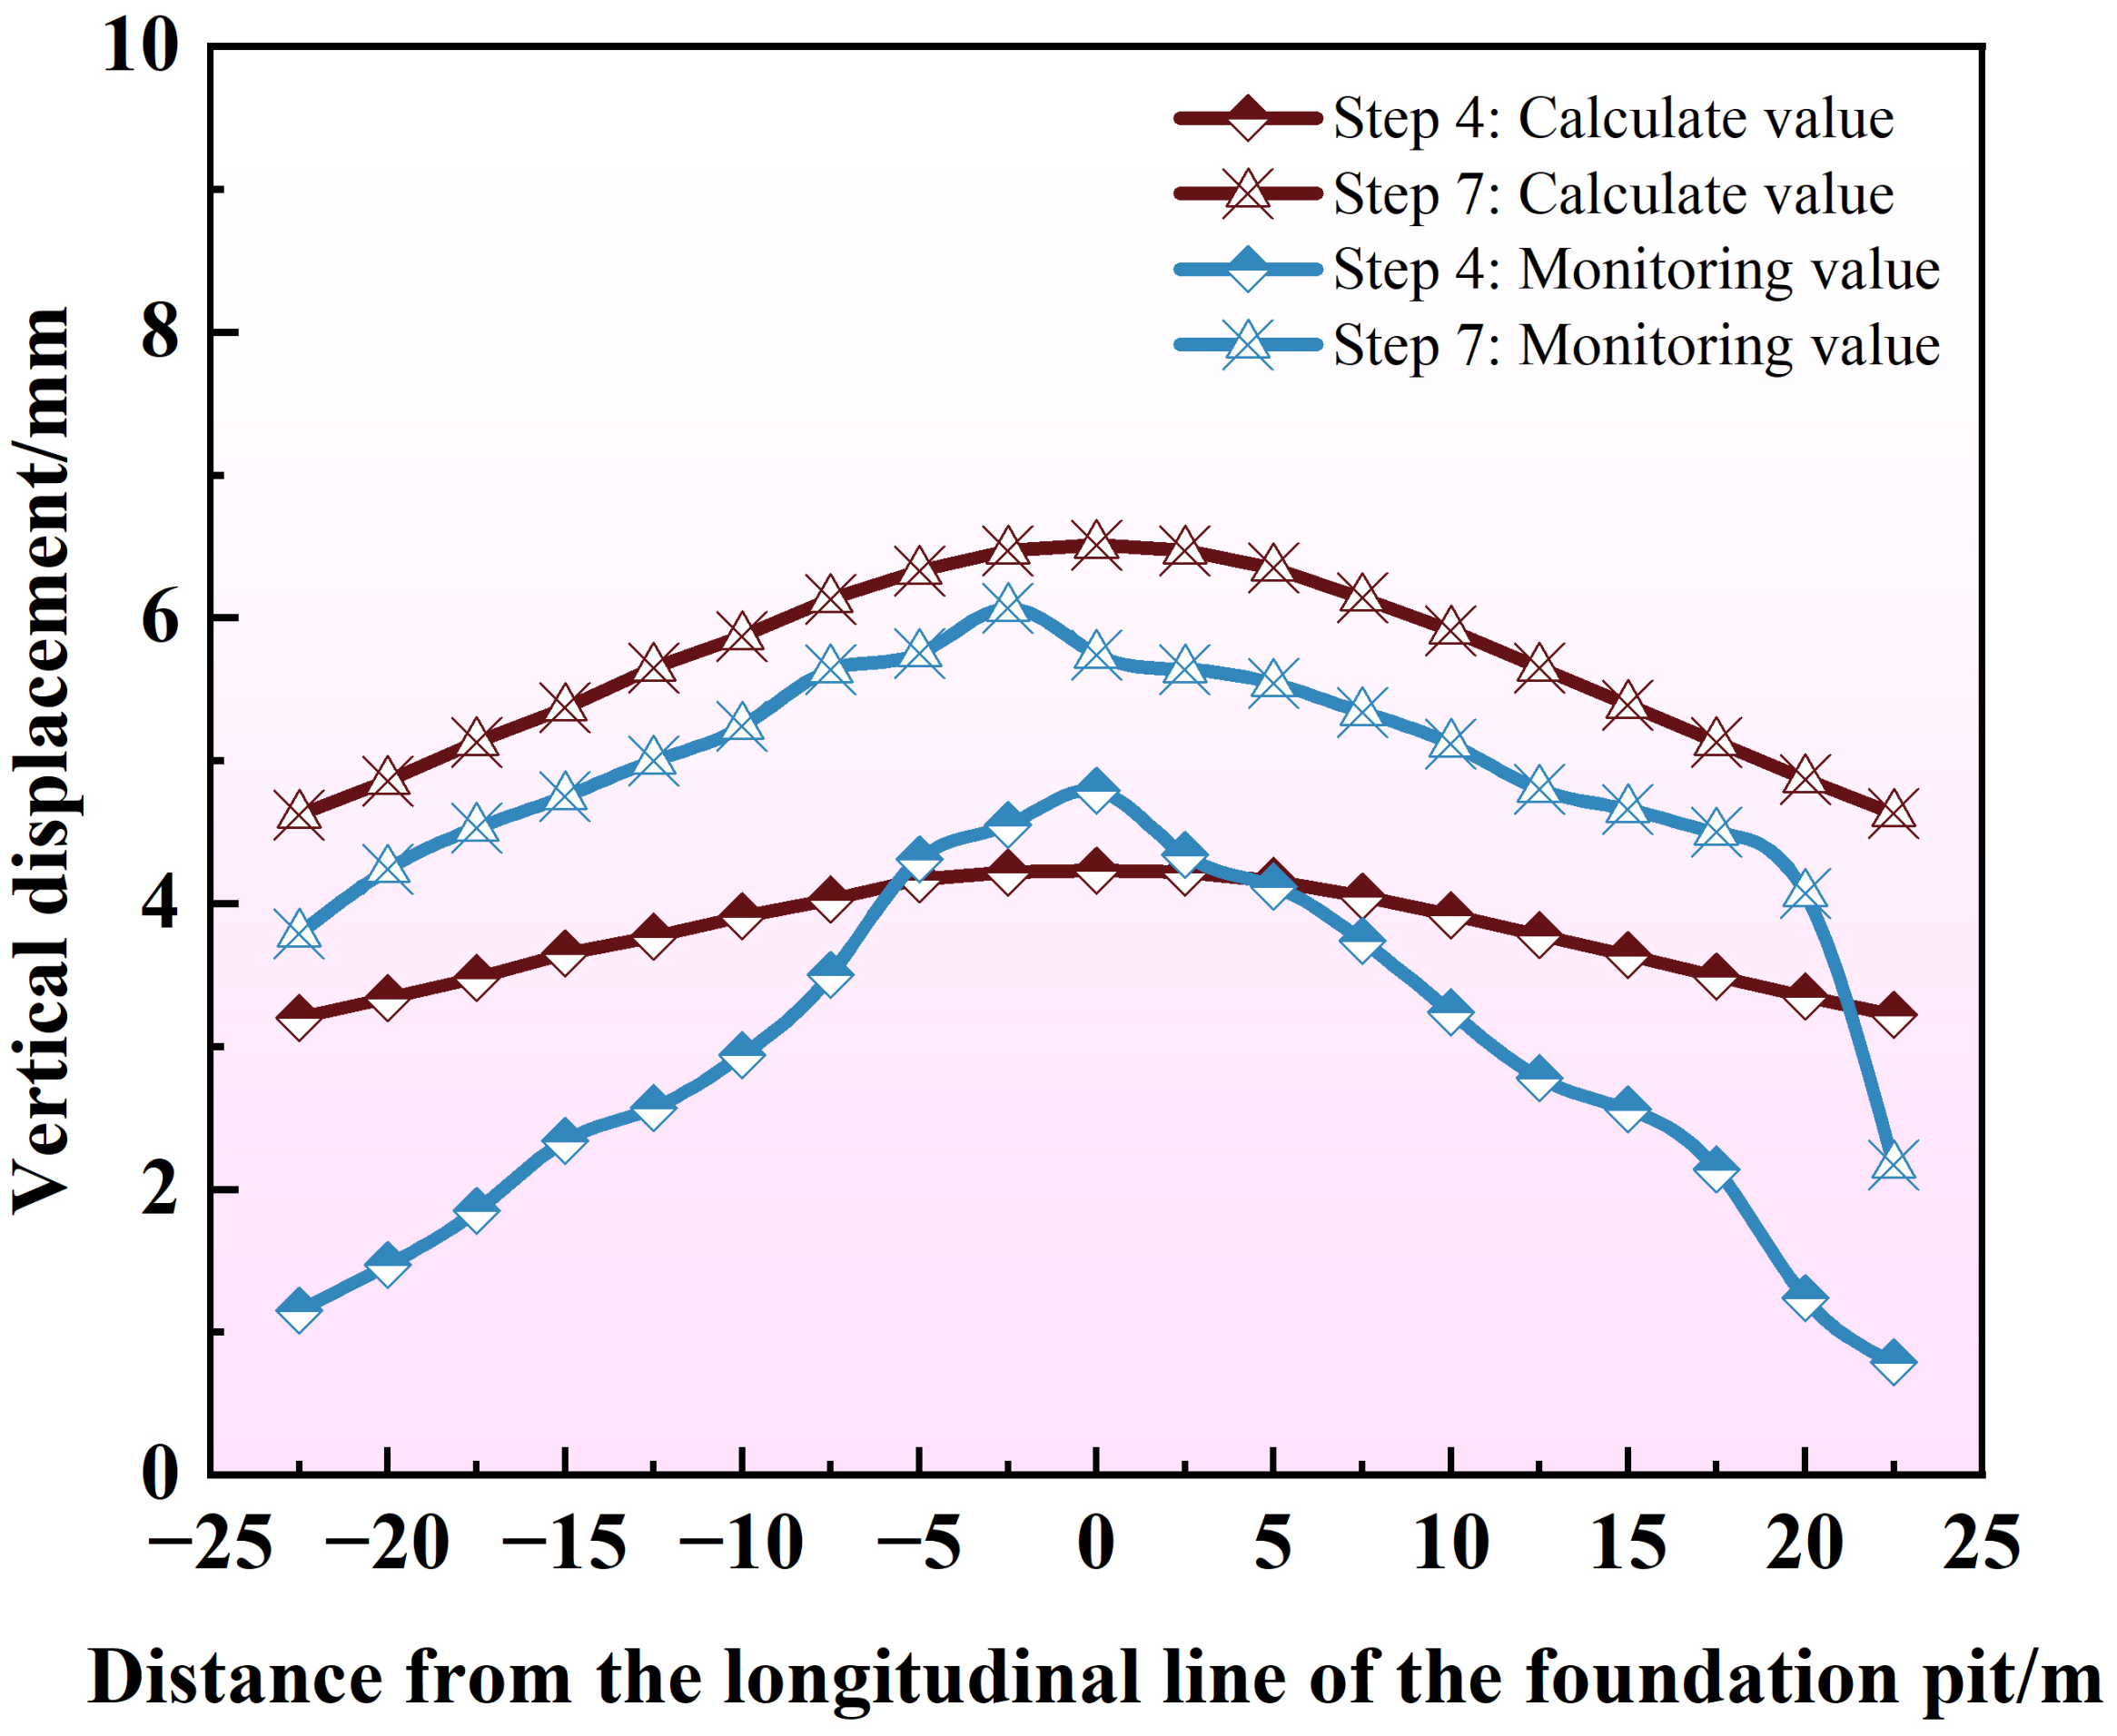
Figure 18 compares the numerical simulation and on-site measurement results of the vertical deformation of the existing operational station hall layer. During the excavation process, the vertical displacement of the existing station hall layer exhibits uplift, symmetrically distributed around the longitudinal centerline of the foundation pit. The uplift is greatest at the center and gradually decreases towards the sides. At the completion of the 6th construction step (i.e., the 4th excavation of 4 m) and the installation of the 4th layer of concrete support, the calculated maximum uplift was approximately 4 mm, with a small magnitude of uplift within the monitoring range. In contrast, the actual uplift was about 5 mm, with a more noticeable variation in uplift amplitude. At the completion of the 9th construction step (i.e., the 7th excavation of 3 m) and before the bottom slab was poured, the maximum calculated uplift was approximately 6 mm, which was quite close to the value obtained from the actual monitoring. Furthermore, both the calculated and measured values show the same trend of change. Overall, the cumulative uplift of the station hall layer fluctuated within a range of 6 mm, which was smaller than the control value of 20 mm (in absolute value).
Figure 18.
Vertical displacement comparison curve of station hall floor. Vertical displacement comparison curve of the station hall floor. Step 4 corresponds to the 2nd excavation (cumulative depth 6 m) and Step 7 to the 5th excavation (cumulative depth 18 m), as defined in Table 4.
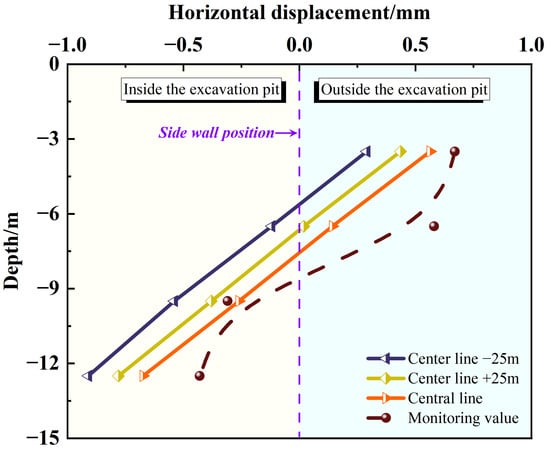
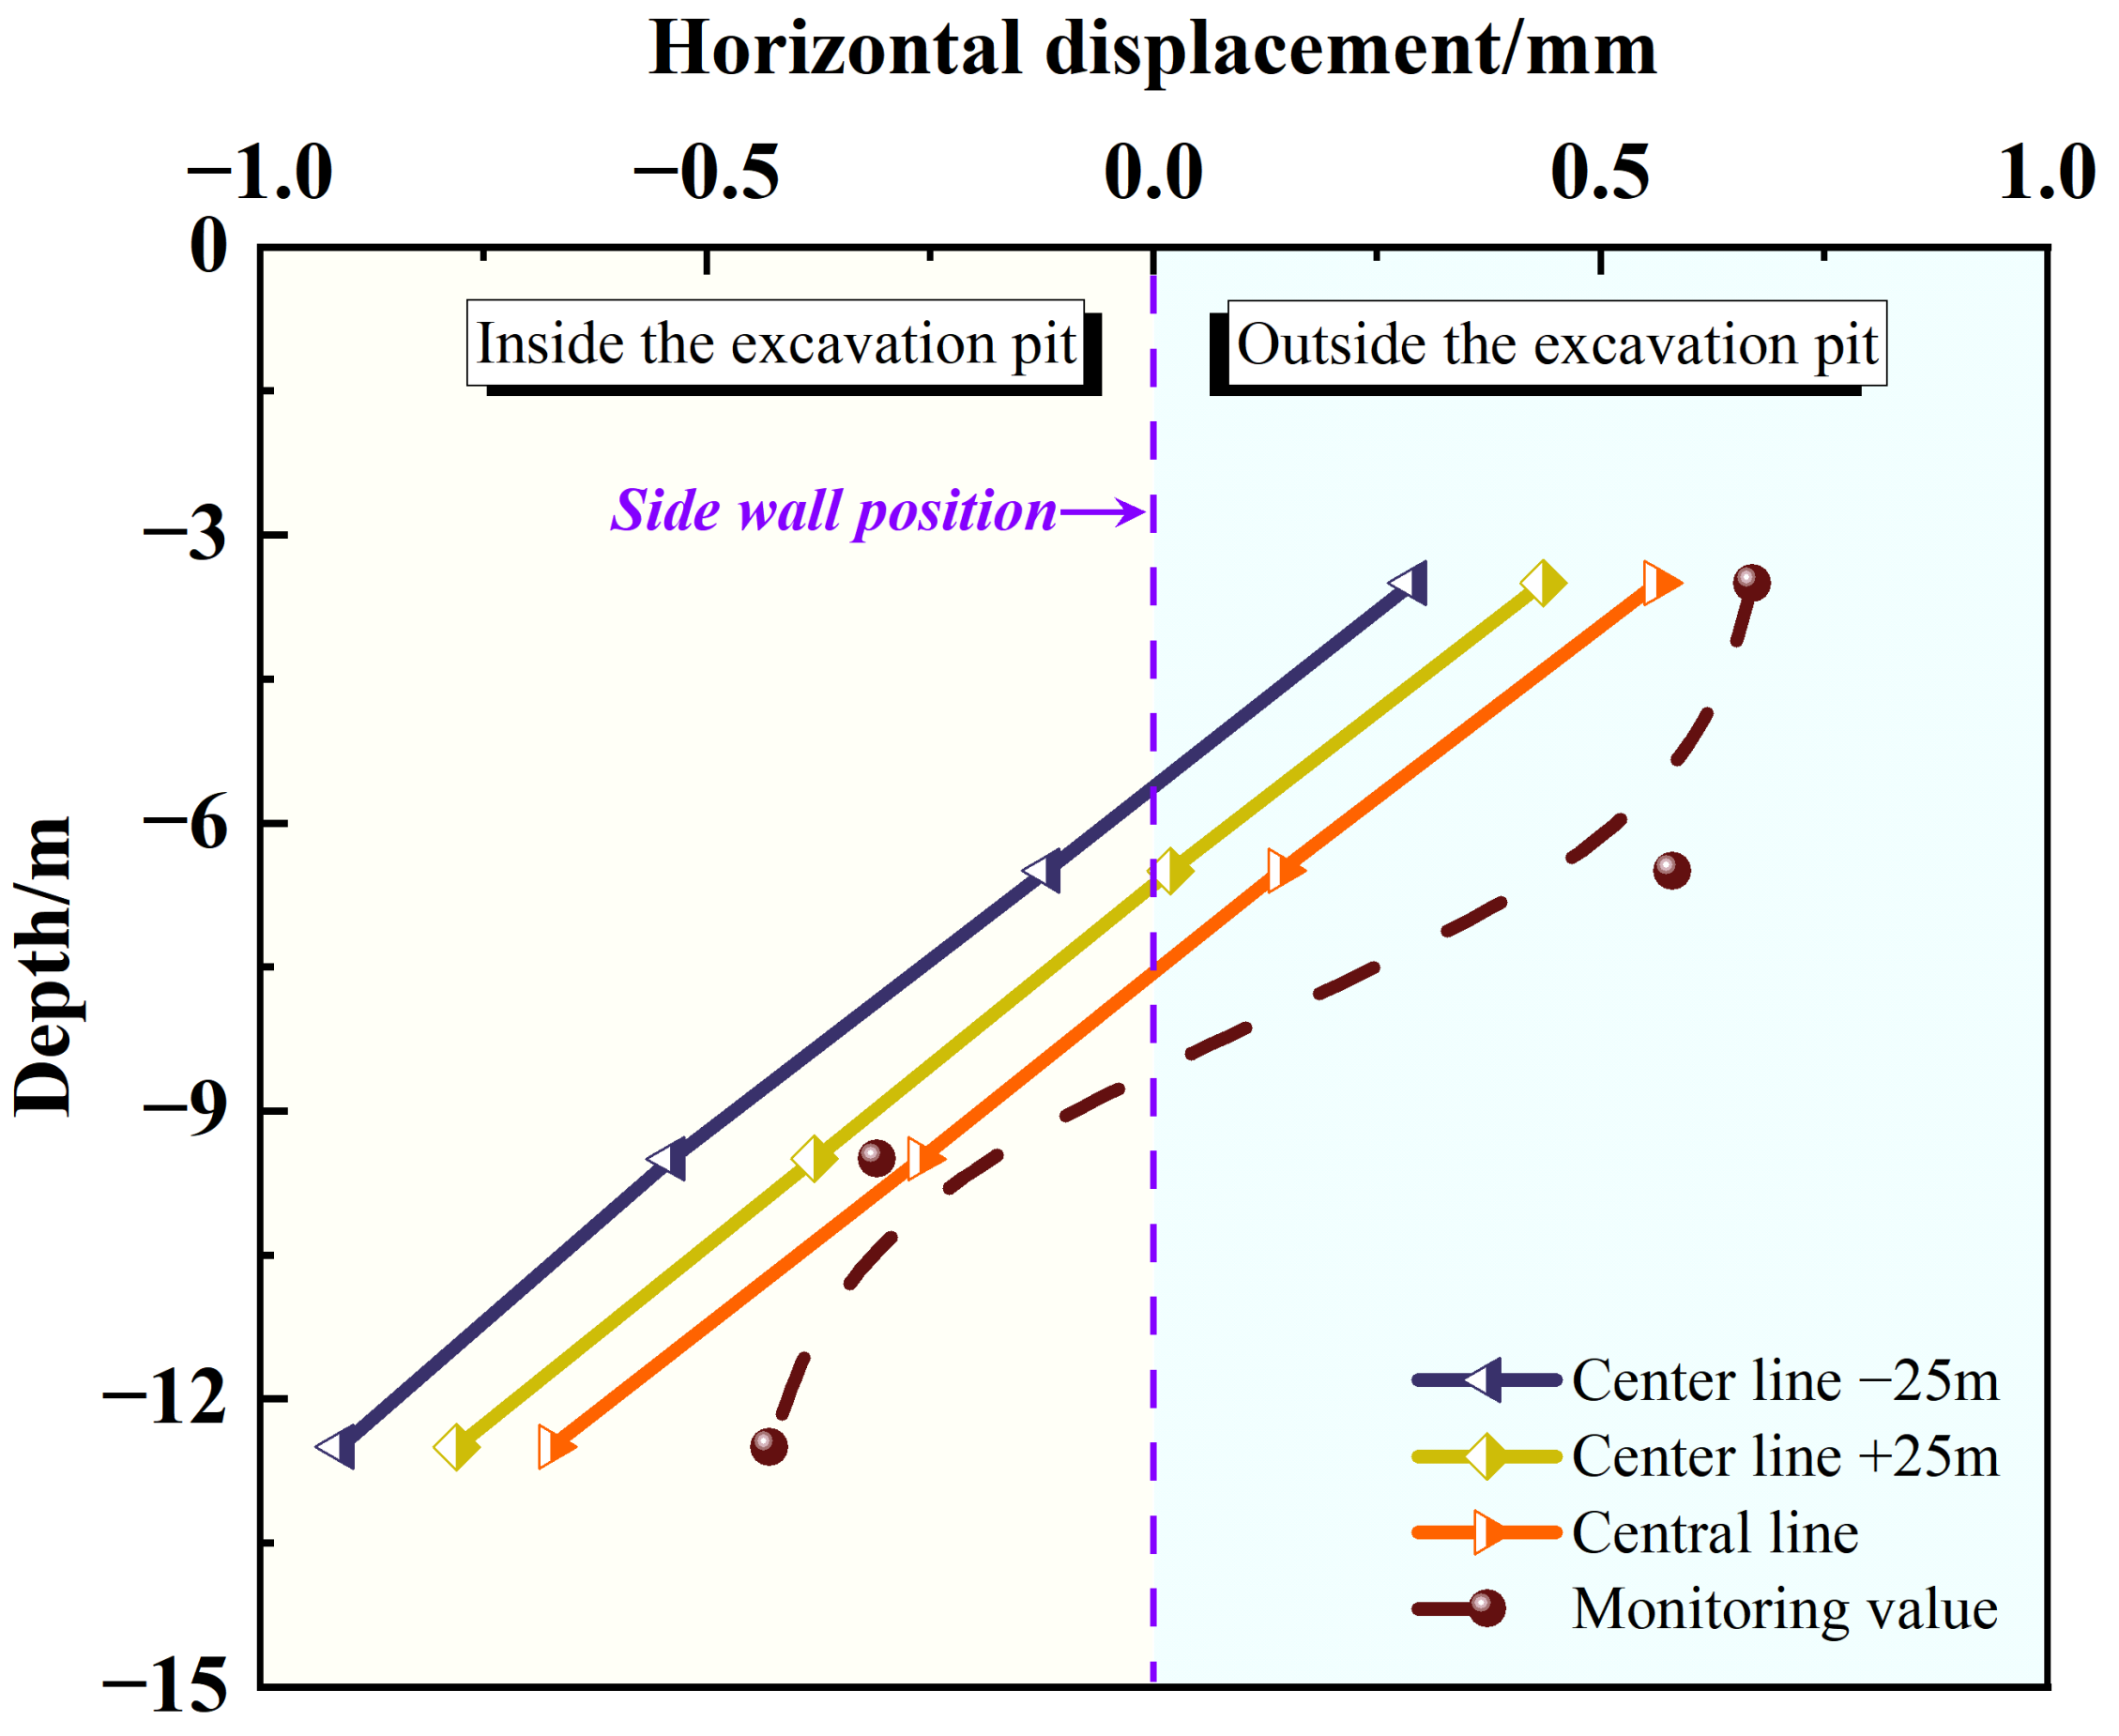
Similarly, the comparison between the numerical calculation and on-site measurement of the horizontal deformation of the side walls of the existing operational station hall layer is shown in Figure 19. It is worth noting that the data in the figure correspond to the horizontal displacement of the station hall layer walls after the foundation pit excavation was completed but before the bottom slab was poured. From the figure, it can be seen that the calculated and measured values of the wall closest to the longitudinal centerline of the foundation pit matched closely. The calculated maximum horizontal displacements in the directions outside and inside the pit, as calculated, were +0.56 mm and −0.67 mm, respectively, while the measured maximum horizontal displacements outside and inside the pit were +0.67 mm and −0.43 mm, respectively.
Figure 19.
Horizontal displacement comparison curve of station.
This result indicates that the numerical calculation results accurately represent the horizontal deformation of the existing station hall walls. Additionally, it can be observed that the horizontal displacement of the existing station hall walls near the pit ends shifts towards the inside of the pit as the burial depth increases. This change is characterized by a transition from displacement towards the outside of the pit at shallower depths to displacement towards the inside of the pit at greater depths.
Additionally, it can be observed that the horizontal displacement of the existing station wall at the end of the foundation pit increases as the burial depth increases, showing a trend of shifting from the outside of the foundation pit to the inside. Moreover, the displacement increases inversely with distance: smaller distances result in greater displacement. Considering both the vertical and horizontal displacements of the existing station hall layer, it can be concluded that the impact of the newly constructed foundation pit excavation on the existing station was within the controlled range. No additional reinforcement was required on-site, and only real-time monitoring of its dynamic deformation was necessary.
6. Discussion
A numerical analysis model for foundation pit settlement during excavation was established, and combined with on-site measurement methods, the stability of long and narrow foundation pits and the disturbance effects on adjacent buildings and structures were investigated. Several key laws were revealed, including the occurrence of maximum surface subsidence at the center of the foundation pit’s long side, the existence of a specific depth range for the maximum lateral displacement of the diaphragm wall, and the minimal disturbance effects of excavation-induced settlement on adjacent buildings and structures near the foundation pit’s ends. These findings provide a theoretical basis for the construction of long and narrow foundation pits in urban subway projects and the protection of surrounding buildings and structures.
The pit analyzed here has a plan aspect ratio of 175/24.1 ≈ 7.3, which is considerably larger than those of conventional rectangular pits and is expected to amplify the spatial effects of excavation. The maximum simulated lateral displacement of the diaphragm wall was approximately 48 mm, i.e., δh,max/He ≈ 0.19% for He = 25 m, with the depth of maximum deflection Hm within He±2 m; the monitored value was of the same magnitude and showed a similar Hm. The simulated maximum surface settlement was approximately 8 mm (about 0.03%He), located 10–15 m (approximately 0.4He–0.6He) from the pit edge, whereas the monitored central-section settlement reached approximately 30 to 34 mm (about 0.12%He–0.14%He). This difference is attributed mainly to surface surcharges from machinery and stockpiles and to the exclusion of groundwater from the model, and it is treated as a limitation rather than concealed. The existing station exhibited a maximum uplift of approximately 6 mm (about 0.02%He), and the building showed a maximum monitored settlement of approximately 3 mm with a tilt of about 0.99 × 10⁻⁴; both were below the specified control values. These spatial patterns, larger movements at the central long side and smaller movements near the corners and end walls, are consistent with the spatial effects reported by Zhang [7], Li et al. [8] and Guo et al. [9], and with the nonlinear settlement evolution reported by Ge et al. [6]. For instance, Zhang [7] discovered through on-site monitoring of a deep foundation pit in Anyang that the maximum displacement of the retaining structure in the middle of the long side of the pit was 13 mm, while the maximum displacement at the corners of the pit was 5 mm. This indicates that the rule of larger deformation in the middle of the long side and smaller deformation at the corners, which has been observed in this case, has indeed been verified through on-site investigations in other engineering projects. The present case adds a quantified high-aspect-ratio example with an adjacent operating station and a building under construction, rather than claiming the spatial pattern itself as a new finding. Because the evidence is derived from a single site, the research conclusions are limited to long and narrow metro station pits in comparable soft-soil urban conditions.
Although significant progress was made in this research, limitations still existed. For instance, on-site monitoring only focused on static deformation indicators during the construction stage, failing to cover the long-term deformation evolution characteristics after foundation pit excavation and during the operation stage, and it was unable to reflect the deformation response patterns under long-term environmental disturbances. The Mohr–Coulomb model adopted here does not capture stress-dependent stiffness, small-strain stiffness degradation or stiffness anisotropy, and it uses Eur = E These simplifications may affect the predicted rebound and wall deflection to some extent. Given the available investigation data, a single set of parameters was assigned to each layer; future work should incorporate depth-dependent and uncertainty-aware 3D geotechnical mapping and more advanced constitutive models to quantify these effects. In addition, the absence of groundwater in the model means that drawdown-induced consolidation and hydraulic uplift were not captured; this is a limitation of the present deformation analysis and should be addressed in future coupled seepage-stress studies. The overestimation of near-wall uplift also reflects the limitations of the Mohr–Coulomb model with Eur = E and the simplified interface representation.
To mitigate these limitations, the following future research directions are proposed for further investigation: (1) The on-site monitoring period will be extended, and long-term deformation monitoring of the foundation pit will be conducted; based on this monitoring, the long-term evolution patterns of deformation in long and narrow foundation pits and adjacent buildings and structures will be analyzed, and the deformation response characteristics under long-term environmental disturbances will be clarified [35]. (2) A coupling analysis model of the foundation pit-soil-building structure system will be developed; the mechanical responses of building foundations and superstructures during excavation will be explored; combined with the allowable structural damage criteria, a quantitative correlation model between foundation pit deformation and building damage will be established; and targeted deformation control and protection schemes will be proposed [36].
7. Conclusions
This paper, based on the foundation pit construction of the Chexie Road Station on Suzhou Metro Line 8, employs numerical simulation and on-site monitoring methods to investigate the deformation performance and excavation-induced disturbance of a long and narrow foundation pit projects and their effects on surrounding existing buildings and structures. The following main conclusions were drawn:
- (1)
- For the long and narrow metro station pit examined in this case (plan aspect ratio ≈ 7.3, He = 25 m, in soft silty clay and silty sand intercalated with silt), the maximum surrounding soil settlement occurred at the central long side, approximately 10 to 15 m (about 0.4He–0.6He) from the pit edge. The maximum lateral displacement of the diaphragm wall occurred at a depth of (He −2) to (He+2), with a normalized value of δh,max/He ≈ 0.19%. The numerical simulation results are consistent with the on-site monitoring results. These findings are limited to long and narrow metro station pits in similar soft-soil urban environments.
- (2)
- The deformation of surface buildings was closely related to the deformation of the foundation pit’s protective structure, surface settlement, and other indicators. The building components near the midpoint of the long side of the long and narrow foundation pit were potential risk points. During the foundation pit construction, real-time monitoring and measurement should be strengthened, and deformation information of the buildings should be promptly fed back.
- (3)
- The existing transfer station near the end of the foundation pit was less affected by soil unloading during excavation. The deformation values of the existing station were all within the design specification requirements. The numerical simulation results were highly consistent with the on-site monitoring data, indicating the reliability and accuracy of the constructed numerical model.
- (4)
- The results of numerical simulation and on-site monitoring on the unloading effect during the excavation of the long and narrow foundation pit projects show that the adopted foundation pit protective structure can effectively control the deformation of the foundation pit while reducing the impact on surrounding buildings and structures.
Author Contributions
Conceptualization, H.X.; methodology, Y.G. and C.H.; software, H.X. and W.Q.; validation, T.W. and P.L.; formal analysis, Y.P.; investigation, F.Y.; resources, Y.G., W.Q. and P.L.; data curation, H.X.; writing—original draft preparation, H.X.; writing—review and editing, Y.G. and T.W.; visualization, T.W. and W.Q.; supervision, Y.G. and C.H.; project administration, C.H.; funding acquisition, T.W. and Y.P. All authors have read and agreed to the published version of the manuscript.
Funding
This research was funded by the National Key Research and Development Plan of China (grant number 2023YFC3707803); the National Natural Science Foundation of China (grant number 52504116); the Young Elite Scientists Sponsorship Program by CAST (grant number YESS20240158); the International Exchange and Development Program for Young Faculty of USTB (grant number QNXM20260032); the China Postdoctoral Science Foundation (grant number 2024M760209); and the Research and Development Projects of Science and Technology of China Railway Construction Co., Ltd. (grant number 2023-A02).
Data Availability Statement
The original contributions presented in this study are included in the article. Further inquiries can be directed to the corresponding author.
Conflicts of Interest
Author Changfu Huang was employed by the company China Railway Construction Co., Ltd. Authors Wenrui Qi, Yuandong Peng, and Fei Yan were employed by the company China Railway 15th Bureau Group Co., Ltd. Author Peng Li was employed by the company Rongtong Agricultural Development Co., Ltd. The remaining authors declare that the research was conducted in the absence of any commercial or financial relationships that could be construed as a potential conflict of interest.
References
- Sun, R.; Zhang, K.; Cai, H.B. Three-dimensional analysis of shield tunnel face stability using adaptive lower bound finite element limit analysis with the Drucker-Prager criterion. Geotech. Geol. Eng. 2025, 44, 43. [Google Scholar] [CrossRef] [Scilit]
- Oztoprak, S.; Cinicioglu, S.F.; Oztorun, N.K.; Alhan, C. Impact of neighbouring deep excavation on high-rise Sun Plaza building and its surrounding. Eng. Fail. Anal. 2020, 111, 104495. [Google Scholar] [CrossRef] [Scilit]
- Yan, F.; Gao, Y.T.; Huang, C.F.; Li, P.; Wu, T.H.; Pei, B.W.; Li, J.W.; Zhou, Y. Numerical insights into ground disturbance and control measures in vertically stacked twin shield tunneling. Geotech. Geol. Eng. 2025, 43, 357. [Google Scholar] [CrossRef] [Scilit]
- Zhou, F.C.; Zhou, P.; Li, J.Y.; Lin, J.Y.; Ge, T.C.; Deng, S.M.; Ren, R.; Wang, Z.J. Deformation characteristics and failure evolution process of the existing metro station under unilateral deep excavation. Eng. Fail. Anal. 2022, 131, 105870. [Google Scholar] [CrossRef] [Scilit]
- Zhang, L.Y.; Zhu, J.M. Numerical simulation and field monitoring analysis for deep foundation pit construction of subway station. Struct. Durab. Health Monit. 2023, 16, 397–416. [Google Scholar] [CrossRef] [Scilit]
- Ge, C.H.; Yang, M.; Li, P.F.; Zhang, M.J.; Zhang, Z.H. Performance and environmental impacts of deep foundation excavation in soft soils: A field and modeling-based case study in Nanjing, China. Undergr. Space 2024, 18, 218–238. [Google Scholar] [CrossRef] [Scilit]
- Zhang, Q.W. Deformation analysis of deep foundation pit excavation in China under time-space effect. Geotech. Res. 2020, 7, 146–152. [Google Scholar] [CrossRef] [Scilit]
- Li, Y.J.; Zhou, Z.W.; Alcala, J.; Yepes, V. Research on spatial deformation monitoring and numerical coupling of deep foundation pit in soft soil. J. Build. Eng. 2025, 99, 111636. [Google Scholar] [CrossRef] [Scilit]
- Guo, C.; Yang, X.D.; Guo, C.C.; Li, P.F. Analysis of deformation of deep and large foundation pit support structure and impact on neighbouring buildings in complex environments. Buildings 2025, 15, 1435. [Google Scholar] [CrossRef] [Scilit]
- Fan, Z.Y.; Fu, J.F.; Fu, J.T.; Zhang, J.R. Influence of pilot tunnel excavation sequence on surface subsidence in metro stations constructed using the pile beam arch method. Geotech. Geol. Eng. 2026, 44, 89. [Google Scholar] [CrossRef] [Scilit]
- Li, D.Q.; Liao, F.; Wang, L.X.; Lin, J.F.; Wang, J.F. Multi-stage and multi-parameter influence analysis of deep foundation pit excavation on surrounding environment. Buildings 2024, 14, 297. [Google Scholar] [CrossRef] [Scilit]
- Xiao, Z.R.; Xie, S.L.; Hu, A.F.; Chen, Y.; Wang, M.H. Displacement control in irregular deep excavation adjacent to tunnel groups in structural soil: A case study of MJS cement-soil composite piles and grouting rectification. Case Stud. Constr. Mater. 2024, 20, e03085. [Google Scholar] [CrossRef] [Scilit]
- Zhao, J.P.; Tan, Z.S.; Yu, R.S.; Li, Z.L.; Zhang, X.R.; Zhu, P.C. Deformation responses of the foundation pit construction of the urban metro station: A case study in Xiamen. Tunn. Undergr. Space Technol. 2022, 128, 104662. [Google Scholar] [CrossRef] [Scilit]
- Di, H.G.; Wang, B.C.; Zhou, S.H.; Wang, B.L.; Song, F.H. Protective measures for railway subgrade adjacent to excavation of a parallel pit. Proc. Inst. Civ. Eng.-Geotech. Eng. 2025, 178, 146–163. [Google Scholar] [CrossRef] [Scilit]
- Yan, X.; Tong, L.Y.; Li, H.J.; Liu, W.Y.; Xiao, Y.; Wang, W. Effects of the excavation of deep foundation pits on an adjacent double-curved arch bridge. Undergr. Space 2025, 21, 164–177. [Google Scholar] [CrossRef] [Scilit]
- Zhao, Y.R.; Chen, X.S.; Hu, B.; Huang, L.P.; Lu, G.H.; Yao, H.L. Automatic monitoring and control of excavation disturbance of an ultra-deep foundation pit extremely adjacent to metro tunnels. Tunn. Undergr. Space Technol. 2023, 142, 105445. [Google Scholar] [CrossRef] [Scilit]
- Cui, Z.D.; Zhang, L.J.; Xu, C. Numerical simulation of freezing temperature field and frost heave deformation for deep foundation pit by AGF. Cold Reg. Sci. Technol. 2023, 213, 103908. [Google Scholar] [CrossRef] [Scilit]
- Liu, X.X.; Huang, H.; Liu, X.; He, S. Analysis of deep dewatering foundation pit and retaining structure considering seepage-stress coupling. KSCE J. Civ. Eng. 2025, 29, 100212. [Google Scholar] [CrossRef] [Scilit]
- Huang, H.; Liu, Z.M.; Wang, Y.D.; Wang, H.N. Parametric modeling and safety simulation of pit excavation affecting adjacent tunnels based on BIM-FEM framework. Tunn. Undergr. Space Technol. 2025, 164, 106800. [Google Scholar] [CrossRef] [Scilit]
- Liu, H.F.; Li, K.Z.; Wang, J.Q.; Cheng, C.X. Numerical simulation of deep foundation pit construction under complex site conditions. Adv. Civ. Eng. 2021, 2021, 6669466. [Google Scholar] [CrossRef] [Scilit]
- Lin, P.; Liu, P.; Ankit, G.; Singh, Y.J. Deformation monitoring analysis and numerical simulation in a deep foundation pit. Soil Mech. Found. Eng. 2021, 58, 56–62. [Google Scholar] [CrossRef] [Scilit]
- Huang, J.Z.; Liu, J.Z.X.; Guo, K.; Wu, C.; Yang, S.; Luo, M.X.; Lu, Y.N. Numerical simulation study on the impact of deep foundation pit excavation on adjacent rail transit structures—A case study. Buildings 2024, 14, 1853. [Google Scholar] [CrossRef] [Scilit]
- Liu, Z.H.; Fang, Q.; Shen, Y.; Ai, Q.; Wang, H.; Huang, X.C.; Yuan, Y. Two-stage surrogate modeling strategy for predicting foundation pit excavation-induced strata and tunnel deformation. Tunn. Undergr. Space Technol. 2024, 151, 105845. [Google Scholar] [CrossRef] [Scilit]
- Luo, L.J.; Zheng, Y.X.; Wang, R.; Ren, X.; Zhang, Y.H. Method for predicting deformation field of deep foundation pit considering spatial effect. Proc. Inst. Civ. Eng.-Geotech. Eng. 2025, 178, 290–306. [Google Scholar] [CrossRef] [Scilit]
- Li, B.; Xue, J.; Wang, Y.F.; Yang, M.; Guo, X.; Wang, J.; Zhang, Y.Y. The use of machine learning models for predicting maximum bridge pile lateral displacements caused by excavation of adjacent foundation pit. J. Eng. Res. 2026, 14, 93–104. [Google Scholar] [CrossRef] [Scilit]
- Imoh, U.U.; Habashneh, M.; Kaine, S.C.; Babafemi, A.J.; Hassan, R.; Movahedi Rad, M. Metakaolin-enhanced laterite rock aggregate concrete: Strength optimization and sustainable cement replacement. Buildings 2025, 15, 4553. [Google Scholar] [CrossRef] [Scilit]
- Hassan, R.; Imoh, U.U.; Movahedi Rad, M.; Schlangen, E.; Ikponmwosa, E.E.; Ali, M. Developing a mix-specific NDT model for compressive strength prediction of concrete using local Nigerian materials. Results Eng. 2026, 30, 110102. [Google Scholar] [CrossRef] [Scilit]
- Ijaz, Z.; Zhao, C.; Ijaz, N.; Hussain, W.; Akbar, M.; Rehman, Z.U.; Khalid, U. Uncertainty-aware digital stratigraphic reconstruction of geotechnical variability using vertically augmented empirical Bayesian Kriging. Earth Sci. Inform. 2026, 19, 192. [Google Scholar] [CrossRef] [Scilit]
- Ijaz, Z.; Zhao, C.; Ijaz, N.; Hussain, W.; Chen, H.G.; Rehman, Z.U.; Khalid, U. A depth-responsive EBK3D framework for risk-informed digital geotechnical mapping in heterogeneous subsurface conditions. Georisk Assess. Manag. Risk Eng. Syst. Geohazards 2026, 1–30. [Google Scholar] [CrossRef] [Scilit]
- Ijaz, N.; Ijaz, Z.; Zhou, N.Q.; Rehman, Z.U.; Ijaz, H.; Ijaz, A.; Hamza, M. Optimizing subsurface geotechnical data integration for sustainable building infrastructure. Buildings 2025, 15, 140. [Google Scholar] [CrossRef] [Scilit]
- GB 50011-2010; Code for Seismic Design of Buildings. Ministry of Housing and Urban-Rural Development of the People’s Republic of China: Beijing, China; China Architecture & Building Press: Beijing, China, 2016.
- GB 50909-2014; Code for Seismic Design of Urban Rail Transit Structures. Ministry of Housing and Urban-Rural Development of the People’s Republic of China: Beijing, China; China Planning Press: Beijing, China, 2014.
- Wang, Y.P.; Cui, Y.H. Method of modeling the FLAC 3D based on Midas/Gts. J. North China Univ. Technol. 2010, 22, 78–81. [Google Scholar]
- GB 50007-2011; Code for Design of Building Foundation. Ministry of Housing and Urban-Rural Development of the People’s Republic of China: Beijing, China; China Construction Industry Press: Beijing, China, 2011.
- Guo, Y.H.; Li, C.J.; Yan, M.; Ma, R.; Bi, W. Research on deformation safety risk warning of super-large and ultra-deep foundation pits based on long short-term memory. Buildings 2024, 14, 1464. [Google Scholar] [CrossRef] [Scilit]
- Shao, L.; Sun, W.H.; Du, X.; Zhong, Z.; Yan, C.; Jia, P.J.; Lu, B. Scaled model tests of foundation pit excavation adjacent to buildings under structural renovation-induced load changes. Tunn. Undergr. Space Technol. 2026, 167, 106964. [Google Scholar] [CrossRef] [Scilit]

Disclaimer/Publisher’s Note: The statements, opinions and data contained in all publications are solely those of the individual author(s) and contributor(s) and not of MDPI and/or the editor(s). MDPI and/or the editor(s) disclaim responsibility for any injury to people or property resulting from any ideas, methods, instructions or products referred to in the content. |
© 2026 by the authors. Licensee MDPI, Basel, Switzerland. This article is an open access article distributed under the terms and conditions of the Creative Commons Attribution (CC BY) license.