


Abstract
Tunnel construction accidents arise from factors operating across organisational and operational levels. Using investigation reports from 88 tunnel construction accidents in China between 2010 and 2025, this study developed an exploratory framework for retrospective probabilistic inference. The reports and the 24Model informed a hierarchy linking safety culture, safety management, unsafe acts and conditions, and accident occurrence. The Apriori algorithm screened associations between adjacent layers using prespecified criteria. The retained associations defined the network structure, which was parameterised using smoothed conditional probability tables estimated from accident data and expert-elicited Noisy-MAX parameters. In five-fold internal cross-validation, the fixed-structure network and the networks reconstructed within training folds had higher overall probabilistic losses than the training-fold prevalence baseline when reconstructing masked risk factor states from the remaining observed factors. At the node level, UA3, UC2 and UC3 showed relatively good discrimination between states. Sensitivity and maximum J-divergence analyses characterised local parameter responses and direct probabilistic dependencies, respectively. The Manme Tunnel case, which both experts knew before parameter elicitation, illustrated how partial accident evidence updated the probabilities of unobserved risk factors. The framework provides a basis for retrospective probabilistic analysis of tunnel construction accidents, with its added value for state reconstruction and its diagnostic validity requiring independent evaluation.
1. Introduction
As infrastructure development continues to expand in China, tunnel engineering is progressing towards greater depths, larger dimensions and longer lengths [1]. By 2025, the combined length of completed railway and highway tunnels in China exceeded 50,000 km. China has become the country with the greatest number of tunnels and the largest scale of tunnel construction worldwide. However, complex geological conditions, intricate construction procedures and diverse construction techniques expose tunnel construction to numerous unforeseen risks [2,3,4]. Furthermore, tunnel construction involves overlapping activities across time, space and work sequences [5,6], making it a typical setting for concurrent operations [7]. The main accident types include collapses [8], water inrushes [9] and gas explosions [10], which can cause substantial casualties and economic losses. Therefore, systematically identifying accident causation factors, analysing associations between factors at multiple levels and conducting probabilistic accident diagnosis are important for improving tunnel construction safety management.
Einstein [11] first introduced the concept of safety risk management into tunnel construction and developed a risk analysis model for three planning alternatives for the Adler Tunnel project. The model systematically assessed the pathways through which risk factors operated and the uncertainty in loss distributions for each alternative, providing theoretical insights to guide engineering practice. In recent years, probabilistic reliability methods, fuzzy evaluation, cloud models and bow-tie analysis have been widely applied to risk assessment in tunnel and underground engineering. For example, probabilistic reliability methods have been used to analyse slope instability risks under different hydraulic conditions [12]. Zhang et al. [13] improved the extension evaluation method and developed a framework for assessing ground collapse risks along tunnel alignments in karst areas. Meng et al. [14] combined the fuzzy analytic hierarchy process with a cloud model to assess tunnel construction risk levels. Sharafat et al. [15] used bow-tie analysis to examine tunnel boring machine (TBM) construction risks and proposed targeted preventive and mitigation measures. These studies have advanced qualitative and quantitative engineering risk assessment. However, further research is needed to identify complex accident causation relationships, uncover association structures in historical accident data and conduct retrospective probabilistic diagnosis after accidents.
Data mining and Bayesian network methods have been widely applied to engineering accident analysis in recent years. Association rule mining can identify co-occurrence relationships among coded factors in historical accident data that meet prespecified support, confidence and lift thresholds [16]. It provides a data-driven complement to expert judgement, reducing reliance on subjective experience alone when selecting relationships. However, association rules reflect statistical associations and cannot independently establish causal directions. Existing studies commonly use subjective assessment to determine relationships among hazards [17], whereas research mining data from actual accidents remains limited. Bayesian networks offer advantages in handling uncertain data [18]. They can integrate subjective and objective data for quantitative analysis, diagnosis, prediction and detection [19], supporting both forward prediction and backward diagnosis. Their application and evaluation have extended across multiple industries [20,21,22,23]. Existing tunnel accident studies have largely focused on individual risk factors or overall risk levels. However, systematic research remains limited on integrating historical accident associations within an explicit theoretical framework to construct interpretable probabilistic diagnostic networks.
To address these research questions, this study develops a retrospective accident diagnosis framework integrating accident causation theory, association rule mining and a hybrid Bayesian network. An exploratory evaluation examines its factor-state reconstruction performance and scope of application given the available accident-only data. The main components are as follows:
A tunnel construction accident causation pathway model is developed using investigation reports from 88 tunnel construction accidents occurring between 2010 and 2025, together with the 24Model.
Under predefined theoretical hierarchy and direction constraints, the Apriori algorithm screens exploratory associations between adjacent layers against prespecified thresholds to construct the Bayesian network topology.
Hybrid parameterization combines conventional conditional probability tables (CPTs) with Noisy-MAX. Five-fold internal cross-validation, sensitivity analysis and J-divergence analysis assess internal probabilistic performance and relative influence characteristics under the specified model conditions.
- (1)
- The Manme No. 1 Railway Tunnel collapse, which is not included in the 88-case accident database, is selected for a diagnostic case application. This application illustrates backward probabilistic updating and the identification of potential accident causation factors given partial known accident evidence.
2. Materials and Methods
2.1. Research Framework
The research framework comprises four stages, as shown in Figure 1.
Figure 1.
The proposed research framework.
Stage 1: Construction of the accident database and tunnel construction accident causation pathway model. Accident information is screened and coded using investigation reports and the 24Model to establish the accident causation database and pathway model.
Stage 2: Association screening and network topology construction. Under predefined hierarchical direction constraints, the Apriori algorithm selects exploratory associations between adjacent layers using prespecified thresholds. These associations are screened for theoretical consistency to construct the Bayesian network structure.
Stage 3: Bayesian network parameterization and internal evaluation. A hybrid parameterization strategy combines conventional conditional probability tables (CPTs) with Noisy-MAX according to node connectivity characteristics. Five-fold cross-validation evaluates the model’s internal probabilistic reconstruction performance using the available accident data.
Stage 4 includes sensitivity analysis by parameterisation group, maximum J-divergence analysis of direct probabilistic dependencies, posterior updating for an illustrative accident case, and a comparison of posterior results between the full and core networks.
2.2. Accident Cause Database
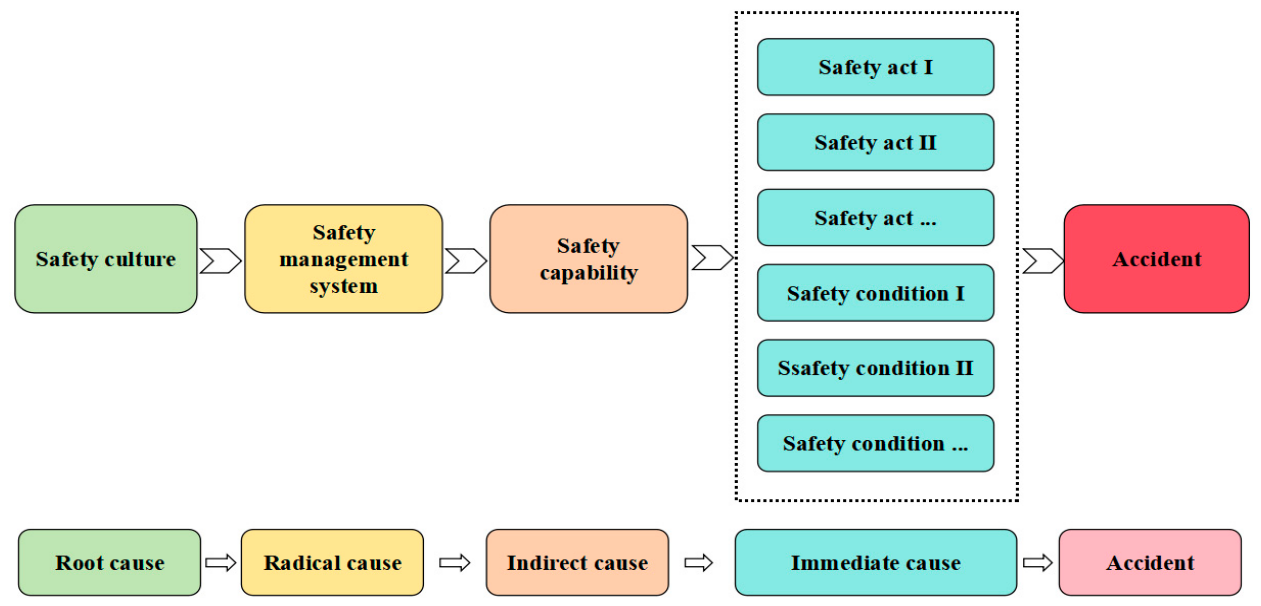
This study collected investigation reports on tunnel construction accidents occurring in China between 2010 and 2025. The reports were obtained from government emergency management departments, transport authorities, local governments and other bodies authorized to conduct accident investigations. Cases were screened according to three criteria: (1) whether the accident occurred during tunnel construction; (2) whether the investigation report was publicly accessible; and (3) whether the report contained sufficient information on accident causes. Where multiple versions of a report existed for the same accident, only the final official investigation report was retained. Cases with incomplete information or insufficient evidence to support accident causation coding were excluded. The complete list of accident cases is provided in Appendix Table A1a. Tunnel construction accidents were analysed across five dimensions [24]: unsafe conditions, unsafe acts, individual safety competence, safety management systems and safety culture (Figure 2). The identified accident causes were further reviewed and used in the subsequent analysis.
Figure 2.
Accident pathway model based on the 24Model.
2.3. Causal Pathway Model of Tunnel Construction Accidents
In many accident models, safety culture is incorporated into management and reflects managers’ beliefs about and commitment to safety. In recent years, its importance for workplace safety has become increasingly apparent [25]. Accordingly, this study treats safety culture as a distinct accident causation layer and regards deficiencies in safety culture as root causes of accidents.
Deficiencies in safety culture may result in an absent or inadequate safety management system. This system comprises the mechanisms and procedures through which a company manages its personnel and working environment. It encompasses employee competence development, supervision of work safety and maintenance of safe working conditions. Deficiencies in safety management systems are likewise regarded as root causes of accidents. They may undermine workers’ safety competence and consequently lead to unsafe acts [26], or directly create unsafe equipment or environmental conditions.
Individual safety competence plays an important mediating role in the theoretical accident pathway. It encompasses safety-related capabilities, safety awareness, safety habits, and psychological and physiological states [27]. These factors influence employees’ ability to identify workplace hazards and maintain a safe working environment. Insufficient safety competence may lead to unsafe acts and subsequent accidents. However, accident reports often provide insufficient information to consistently distinguish individual safety competence from management-related factors such as training, qualifications and awareness. Therefore, this study does not represent individual safety competence as a separate network node. Instead, the relevant information is incorporated into the operational definitions of the corresponding safety management factors.
Unsafe acts and unsafe conditions are commonly regarded as direct causes of accidents [28,29,30]. Many accident investigation reports indicate a close relationship between workers’ unsafe acts and their safety competence. Inadequate safety competence may therefore lead to unsafe acts during work.
Based on these considerations, this study establishes a tunnel construction accident causation pathway model following the hierarchy Safety Culture → Safety Management → Unsafe Acts/Unsafe Conditions → Accident, as shown in Figure 3.
Figure 3.
Causation reasoning model for tunnel construction accidents.
2.4. Causes of Tunnel Construction Accidents
The tunnel construction accident model served as the theoretical framework for analysing 88 tunnel construction accidents occurring in China between 2010 and 2025. The main accident causes were systematically identified and are presented in Table 1.
Table 1.
Risk factors and their corresponding codes.
- (1)
- Safety culture: Deficiencies in safety culture were identified in five areas: safety orientation, safety values, leadership commitment to safety, safety climate and safety training quality.
- (2)
- Safety management systems: Deficiencies in safety management systems fell into three categories: (I) non-compliance with safety policies; (II) inadequate organizational structures, including insufficient staffing and unclear allocation of responsibilities; and (III) absent safety management procedures. These three categories were further divided into 12 safety management factors.
- (3)
- Unsafe acts and unsafe conditions: The direct causes of accidents primarily involved unsafe acts and unsafe conditions. Unsafe acts included: (I) operational violations; (II) unauthorized entry into hazardous areas; (III) unsafe supervisory instructions; (IV) improper use of personal protective equipment; and (V) risk-taking during work. Unsafe conditions included: (I) adverse geological conditions; (II) deficiencies in support and protective structures; (III) deficiencies in mechanical, electrical and safety equipment condition; and (IV) adverse working conditions.
Each accident causation factor was coded to facilitate subsequent association rule mining.
2.5. Mining of Tunnel Construction Accident Pathways
The association rule mining (ARM) procedure used in this study comprises five steps. (1) Data collection: Data are extracted from tunnel construction accident investigation reports to establish the initial database. (2) Data preprocessing: Risk factor coding across accident cases is converted into a Boolean matrix for computational processing. A factor is coded as 1 when the report provides explicit evidence satisfying its operational definition. It is coded as 0 when no corresponding supporting evidence is identified in the available report. (3) Mining parameter specification: Minimum support (min_sup) and minimum confidence (min_conf) are specified according to the dataset size and research objectives to filter infrequent or insufficiently supported rules. (4) Rule generation: Association rules are mined from the Boolean matrix using the Apriori algorithm implemented in the R package arules. Permitted rule directions are predefined according to the tunnel construction accident causation model. The main analysis focuses on adjacent-layer relationships: Safety Culture → Safety Management and Safety Management → Unsafe Acts/Unsafe Conditions. This constraint maintains consistency with the theoretical accident propagation mechanism rather than simplifying the mining procedure. Associations spanning non-adjacent layers or occurring within the same layer may provide Supplementary Information. However, their causal directions are neither predefined by the reconstructed model nor identifiable through association rule mining alone. They are therefore not directly converted into directed edges in the Bayesian network. All rules satisfying the support and confidence thresholds are generated, and lift is calculated for each rule. (5) Rule screening: Rules with lift > 1 are retained. Rules meeting the statistical thresholds are also screened for theoretical consistency with the tunnel construction accident causation pathway model. This step only removes rules inconsistent with the predefined accident causation framework; it does not introduce relationships that fail to meet the statistical thresholds.
2.6. Bayesian Network Model
A Bayesian network is a mathematical model for handling uncertain information, with its structure represented by a directed acyclic graph [31]. Nodes represent the variables under study, while directed edges represent conditional probabilistic dependencies between parent and child nodes within the specified network structure. By combining a graphical structure with probability parameters, a Bayesian network describes the joint probability distribution of multiple uncertain factors. It also updates the probability distributions of unobserved nodes when new observational evidence becomes available. These capabilities make Bayesian networks suitable for uncertainty analysis and backward probabilistic diagnosis in complex accident scenarios. The main equations used in this study are presented below:
For a Bayesian network comprising n nodes X1, X2, …, Xn, the joint probability distribution can be factorized according to the network structure as:
where Pa(Xi) denotes the set of parent nodes of node Xi, and P(Xi∣Pa(Xi)) denotes the conditional probability distribution of node Xi. For a root node without parent nodes, its probability distribution is directly expressed as the marginal probability P(Xi).
Conditional probability formula:
where P(A|B) denotes the probability of event A occurring given that event B occurs, and P(B) denotes the probability that event B occurs.
Prior probability: The probabilities of various events are determined based on historical data, expert judgment, and related sources. In this study, prior probability refers to the node probability distribution obtained from existing data, expert knowledge, or network parameters before any current observational evidence is entered.
Posterior probability: The conditional probability of a node updated according to the network structure and conditional probability relationships after new observational evidence is entered.
Full probability formula: Let A1, A2, …, An form a partition of the sample space (they are pairwise mutually exclusive and their union is the entire space), and let P(Ai) > 0; then for any event B, we have:
The significance of the law of total probability lies in the fact that, whereas directly calculating P(B) is relatively difficult, calculating P(Ai) and P(B|Ai) is comparatively straightforward, so the law of total probability can be used to compute the probability of event B.
Bayesian formula: Let A1, A2, …, An form a set of mutually exclusive and exhaustive events, and let B be the observed evidence; then, according to Bayesian formula, after observing evidence B, the posterior probability of event Ai can be expressed as:
where P(Ai) is the prior probability of event Ai before the current evidence is entered, P(B|Ai) is the likelihood, and P(Ai|B) is the posterior probability updated after evidence B is obtained.
After clarifying the above network structure and probabilistic inference mechanism, it remains necessary to determine the conditional probability parameters of each node. Considering that this study includes only 88 accident cases and that the number of parent nodes varies considerably across nodes, directly applying a full CPT to all nodes may lead to pronounced data sparsity and zero-frequency parent-node combinations. Therefore, this study adopts a hybrid parameterization strategy combining conventional smoothed CPT with Noisy-MAX, as detailed in Section Bayesian Network Parameterization Method.
Bayesian Network Parameterization Method
The accident database contains only 88 cases, and the number of parents varies considerably across nodes in the final Bayesian network. Using full CPTs for all nodes would generate numerous parent-state configurations for highly connected nodes. Some configurations occur infrequently or are absent from the limited dataset, potentially causing unstable parameter estimates or zero-frequency problems. To balance data utilization and parameter identifiability, this study combines smoothed CPTs with Noisy-MAX in a hybrid parameterization strategy. Smoothed CPTs are used for nodes with fewer parents and relatively adequate sample coverage. Noisy-MAX provides a reduced-dimensional parameterization for binary nodes with many parents, for which full CPTs would require an excessive number of parameters.
For binary nodes parameterized using ordinary CPTs, smoothing is performed with a symmetric Beta(0.5, 0.5) prior. This is equivalent to adding 0.5 pseudo-counts to each of the two states, yielding a total equivalent sample size (ESS) of 1. This approach prevents extreme conditional probability estimates of 0 or 1 arising from missing observations under particular parent-state configurations. It also reduces parameter estimation instability under limited sample sizes.
Nodes with many parents were parameterized using the Noisy-MAX model implemented in GeNIe. Because all variables in this study are binary, Noisy-MAX reduces to Noisy-OR [32]. This approach was applied to five nodes: UA1, UA3, UC2, UC4 and Accident. Throughout the model, State1 denotes the occurrence of a factor or event, whereas State0 indicates that no supporting evidence was identified in the report.
The Noisy-MAX parameters were elicited from two experts through joint discussion to reach consensus. Both experts were professors with more than 10 years of relevant professional or research experience. They were selected based on their engineering practice and relevant expertise. Before parameter elicitation, both experts had access to the complete records of all 88 accidents, the final Boolean coding matrix and the final network structure. They also had access to the accident materials subsequently used for the diagnostic case application. Their probability judgements drew on node definitions, accident mechanisms, these study materials and their professional experience. The activation probability of a parent node is defined as its independent contribution to activating the child node. When assessing a particular parent factor, all other explicit parent factors are assumed to be inactive. Its contribution is considered separately from the residual activation represented by the leak parameter. The leak probability is elicited independently to represent residual activation by factors not explicitly included in the network. The parent activation parameters and leak probability therefore jointly determine the conditional occurrence probability of the child node. The experts provided probability judgements on a scale from 0 to 1, in increments of 0.05. Joint discussion produced a single consensus value for each parameter; neither arithmetic nor weighted averaging of independent ratings was used. All expert-elicited parameters were finalized before cross-validation and case diagnosis and remained fixed throughout these calculations. Finalizing parameters beforehand indicates only that they were not adjusted during the current calculations; it does not establish information independence from the evaluation materials. Because the experts had accessed the complete study materials before elicitation, these parameters cannot be regarded as external knowledge formed independently of the subsequent test cases.
For a binary child node Y, assuming that the set of parent nodes currently in the occurrence state is Xi, with corresponding independent activation probability parameters pi, and a leak probability λ, the conditional probability of the child node’s occurrence is expressed as:
where P(Y = 1∣X) denotes the probability of child node Y occurring given a parent-node state combination X; pi denotes the independent causal strength of the i-th parent node in the occurrence state on the child node; and λ denotes the leak probability arising from latent factors not explicitly considered in the model.
The database contains only cases in which accidents have occurred and therefore cannot identify the probability of accident occurrence, P(Accident = 1), in construction settings. The Accident node is parameterized using expert judgement not merely to reduce the number of parameters, but because its conditional probabilities cannot be estimated from the available data. Its parameters have not been independently validated using the 88 accident cases. Sensitivity analysis, J-divergence analysis and diagnostic updates involving this node should therefore be interpreted as model results conditional on the specified expert assumptions.
3. Theory-Constrained Association Pathway Mining
The 88 accident investigation reports were coded as binary observations using the risk factor codes in Table 1. A factor was coded as 1 when the report contained explicit evidence satisfying its operational definition. It was coded as 0 when no corresponding supporting evidence was identified in the available report. Importantly, 0 denotes “no supporting evidence identified in the report” and does not establish that the factor was absent during construction. The complete coding matrix is provided in Appendix Table A1b.
The Apriori algorithm was used to mine tunnel construction accident pathways under the following rules:
- (1)
- The minimum support was set to 0.1.
- (2)
- The minimum confidence was set to 0.3.
- (3)
- During mining, only associations between adjacent levels were considered for network construction, while within-level influences among factors were ignored.
- (4)
- The correlations reflected in the data mining results may deviate from the actual causal relationships among accident causes; therefore, theoretical consistency screening was performed according to the predefined hierarchy and direction constraints.
- (5)
- The UC1 indicator within unsafe conditions in this study represents an inherent environmental factor and constitutes an objective environmental baseline during construction rather than a management- or behavior-related failure state; therefore, UC1 was not included in association mining of the relationships among safety culture, safety management system, and unsafe acts. However, UC1 remains an important objective hazardous condition affecting tunnel construction accidents and was therefore defined as an exogenous risk node in the BN. It does not need to have parent nodes from the safety culture or safety management levels, but it can directly participate in probabilistic inference and sensitivity analysis under accident conditions.
Under the constraints of Support ≥ 0.10, Confidence ≥ 0.30, Lift > 1, and the predefined theoretical hierarchy, 39 Safety Culture → Safety Management associations and 54 Safety Management → Unsafe Acts/Unsafe Conditions associations were ultimately retained, yielding a total of 93 network relationships (Table 2). Based on these adjacent-level relationships, 201 two-stage SC → SM → UA/UC → Accident unique hierarchical association chains can be formed (Figure 4), and the complete association rule results for different causation levels are provided in Appendix Table A2. Note: SM12 was retained in the initial coding system; however, because none of its associations under the theoretically permitted directions met the predefined Apriori screening criteria, it was not included in the final Bayesian network.
Figure 4.
Tunnel construction accident pathways.
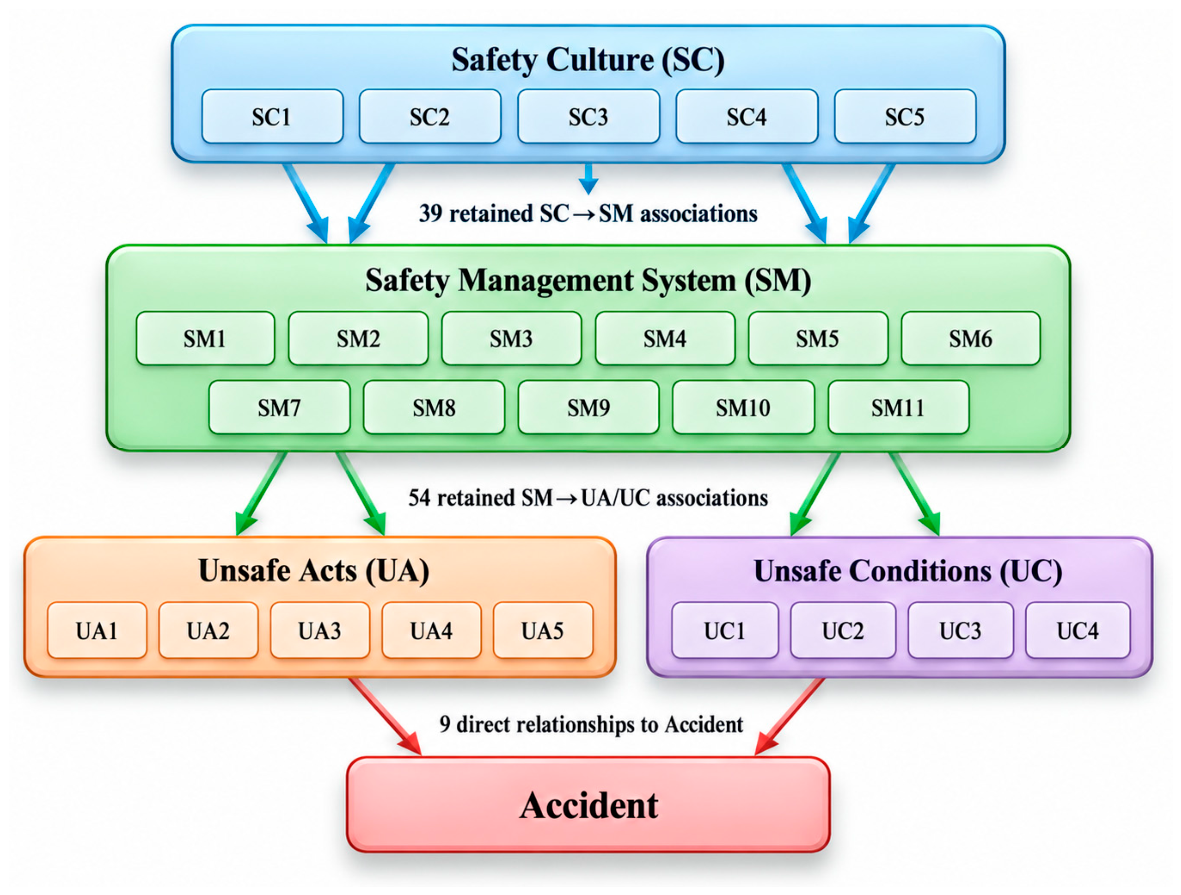
Table 2.
Mined association rules for tunnel construction accident causation.
Robustness Evaluation of Association Rules
To assess the resampling stability of association rules under limited sample conditions, this study performed 1000 case-level non-parametric bootstrap repetitions using random seed 2026. Each repetition sampled 88 cases with replacement from the original 88 accidents. The same theoretical direction constraints and screening criteria of Support ≥ 0.10, Confidence ≥ 0.30 and Lift > 1 were applied in every repetition. The selection frequency of each baseline rule was then calculated. This frequency describes resampling stability under the specified screening procedure and is not a significance-test p-value. Support and Confidence were also varied to assess threshold dependence using the number of retained rules and their Jaccard similarity to the baseline set.
Statistical association testing covered all 156 theoretically permitted candidate factor pairs before screening. These comprised 60 pairs between SC1–SC5 and SM1–SM12, and 96 pairs between SM1–SM12 and UA1–UA5 or UC2–UC4. A 2 × 2 contingency table was constructed for each pair and analysed using a two-sided Fisher’s exact test. The null hypothesis was independence between the two factors, corresponding to a population odds ratio (OR) of 1. With margins fixed, the two-sided p-value summed the probabilities of all possible tables whose probabilities were no greater than that of the observed table. Benjamini–Hochberg (BH) adjustment was applied jointly to all 156 raw p-values. Adjusted values were denoted by q, with q < 0.05 as the threshold. Benjamini–Yekutieli (BY) adjustment provided a conservative sensitivity comparison. Although SM12 was excluded from the final network, it remained in the original candidate testing family. Multiplicity adjustment was therefore not restricted to the 93 relationships retained after screening.
Under baseline conditions, 93 exploratory associations were retained based on the predefined theoretical directions and Apriori screening thresholds. Of these, 53 had bootstrap selection frequencies of at least 80%, accounting for 56.99% of the baseline associations; the remaining 40 did not reach this stability threshold. After BH adjustment across the complete candidate family, 10 associations satisfied q < 0.05, representing 10.75% of the baseline associations. Their bootstrap selection frequencies ranged from 93.3% to 100%. Five of these associations also satisfied q < 0.05 after BY adjustment. The 10 associations meeting the BH criterion across the complete candidate family, together with their statistics, are presented in Appendix Table A3a. Asterisks identify those also meeting the BY criterion. These results indicate differences in resampling stability and statistical association evidence across relationships. The 93 associations should therefore not be regarded as equally reliable evidence for network structure. These threshold-retained associations were used to construct the exploratory full network based on the theoretical directions and Apriori screening criteria. Their retention does not imply that all associations achieved statistical significance after adjustment for multiple testing. Bootstrap selection frequencies and Fisher’s exact test assess resampling stability and statistical association evidence, respectively, and are not interchangeable.
Threshold sensitivity analysis showed that, with Support fixed at 0.10, increasing Confidence from 0.30 to 0.35 and 0.40 reduced the rule count from 93 to 84 and 70, respectively. The corresponding Jaccard similarities were 0.9032 and 0.7527. With Confidence fixed at 0.30, increasing Support to 0.15 retained 83 rules, with a Jaccard similarity of 0.8925. Key comparisons are provided in Appendix Table A3b. Although some threshold changes preserved substantial overlap with the baseline rules, stricter screening considerably changed the relationship set. The current topology therefore exhibits non-negligible dependence on the sample and screening thresholds.
To further examine whether topology changes affected posterior inference for the case, this study constructed a core network based on bootstrap stability. Of the 93 baseline relationships, the 53 with bootstrap selection frequencies of at least 80% were retained. This frequency threshold defined the core network solely for the present topology sensitivity analysis and did not indicate statistical significance. The nine expert-specified edges directed into Accident were outside the Apriori rule-screening family and were therefore retained unchanged in both the full and core networks. Both networks used the same parameterization rules and case evidence. The posterior probabilities and their changes were compared across the 22 unobserved risk factor nodes. This comparison assessed the sensitivity of model outputs to topology selection, with detailed results presented in Section 5.2.5.
4. Tunnel Construction Accident Modelling
4.1. Bayesian Modelling of Tunnel Construction Accidents
The Bayesian network topology was constructed using the 93 theoretically consistent associations identified in Section 3. Safety Culture nodes occupy the upstream layer, Safety Management nodes form the intermediate layer, and Unsafe Acts/Unsafe Conditions constitute the direct causation layer. Accident serves as the outcome node, while UC1 is an exogenous environmental risk node directly connected to Accident. The network uses the hybrid parameterization described in Section Bayesian Network Parameterization Method. UA1, UA3, UC2, UC4 and Accident are parameterized using expert-elicited Noisy-MAX, whereas the remaining nodes use smoothed CPTs estimated from the data. The complete activation probabilities and leak parameters for the five Noisy-MAX nodes are provided in Appendix Table A4. The final network is shown in Figure 5.
Figure 5.
Bayesian model of tunnel construction accidents.
4.2. Bayesian Network Analysis of Tunnel Construction Accidents
The model marginal probability of State1 was calculated for each risk factor node without additional evidence. The results are described across three layers: Safety Culture, Safety Management, and Unsafe Acts/Unsafe Conditions, as follows.
- (1)
- Safety culture: Several typical deficiencies were identified at this layer. The model showed relatively high probabilities for four factors: safety values (SC2), leadership commitment to safety (SC3), safety climate (SC4) and safety training quality (SC5).
- (2)
- Safety Management: This layer comprised 11 main factors, five of which had State1 marginal probabilities exceeding 50%. The three highest were the on-site management and supervision system (SM2), training and education system (SM3), and hazard identification and rectification system (SM8). These results indicate relatively high marginal probabilities for the corresponding management deficiency states within the current model.
- (3)
- Unsafe acts and unsafe conditions: This layer comprised nine main factors, four of which had probabilities exceeding 60%. The modelled State1 probabilities were 70% for operational violations (UA1), 67% for unsafe supervisory instructions (UA3), 62% for risk-taking during work (UA5), and 67% for support and protective structures (UC2).
The engineering implications for tunnel construction safety management are as follows:
- (I)
- Management responsibilities for safety should be implemented, and job-specific training and technical briefings should be strengthened. Training implementation should be checked through on-site assessments and routine supervision.
- (II)
- Implementation of construction plans and ongoing hazard identification should be strengthened. Attention should address geological changes, support deformation, ventilation, and toxic or hazardous gases according to project conditions. Identified problems should undergo rectification and follow-up verification within a closed-loop management process.
- (III)
- Working conditions should be checked before tunnel entry. Excavation, support installation and acceptance inspections should follow design requirements and approved construction plans, with the required spacing maintained between construction stages. Support materials should undergo acceptance inspections, and installed support structures should be inspected. Appropriate action should be taken promptly when abnormalities are detected.
4.3. Bayesian Network Internal Cross-Validation
Five-fold cross-validation was conducted on 88 tunnel construction accident cases to evaluate the Bayesian network’s performance in reconstructing risk factor states. Using a fixed random seed of 2026, the cases were randomly divided into five disjoint folds of 18, 18, 18, 17 and 17 cases. In each iteration, four folds were used for training and the remaining fold for testing, yielding one out-of-fold prediction per case for each of the nine target nodes (UA1–UA5 and UC1–UC4). For each prediction, the target state was masked and the remaining observed risk factor states were entered as evidence. The predicted probability of State1 was evaluated against the corresponding accident report coding. The Accident node was excluded from both the target set and the evidence.
Three model configurations were evaluated under two settings: a fixed network structure and a network structure reconstructed within each training fold. The fixed-structure hybrid model retained the final network topology. Its ordinary conditional probability tables (CPTs) were re-estimated using data from the corresponding training fold and smoothed with a symmetric Beta(0.5, 0.5) prior. Among the nine target nodes, UA1, UA3, UC2 and UC4 retained their expert-elicited Noisy-MAX activation probabilities and leak parameters across folds. The other five target nodes used ordinary CPTs re-estimated within each training fold.
For both reconstructed models, association screening, topology construction and data-based parameter estimation were performed within each training fold. Associations between adjacent causation layers were screened using prespecified thresholds of support ≥ 0.10, confidence ≥ 0.30 and lift > 1. The reconstructed hybrid model retained the expert-elicited parameters for parent relationships covered by the original assessments. If a Noisy-MAX node acquired a parent relationship without an elicited parameter, the entire node was parameterized using a smoothed CPT estimated from the training fold. The reconstructed data-CPT model used ordinary CPTs estimated from the corresponding training fold throughout.
Before parameter elicitation, both experts had accessed all 88 accident records, including the cases subsequently assigned to the test folds, as well as the final Boolean coding matrix, the final network structure and the Manme Tunnel case. The elicited parameters were finalized before cross-validation and held fixed wherever used. The two hybrid models thus assessed internal reconstruction conditional on expert parameters informed by the full study materials. The reconstructed data-CPT model assessed the data-driven reconstruction procedure under the specified coding scheme and theoretical constraints.
To assess whether the network provided additional probabilistic reconstruction capability over simpler methods, three baselines were evaluated using the same five-fold partition. These were training-fold prevalence prediction, majority-class prediction and L2-regularized logistic regression [33]. Prevalence and the majority class were determined exclusively from the corresponding training fold. Logistic regression used the same available observed factors. Its regularization strength was selected by minimizing Logarithmic Loss through three-fold stratified cross-validation within each training fold, keeping hyperparameter tuning separate from test-set evaluation [34]. Probabilities greater than 0.5 were classified as State1; all others were classified as State0. Accuracy and balanced accuracy assessed classification performance, whereas Brier score and Logarithmic Loss assessed probabilistic prediction quality. Node-specific Brier Skill Scores relative to the prevalence baseline were calculated and then macro-averaged. Node AUCs calculated from pooled out-of-fold predictions and mean within-fold AUCs were reported separately. Appendix Table A5a–c report the results for all nine targets, the overall baseline comparisons and the eight-target comparisons excluding UC1, respectively.
The fixed-structure hybrid network generated 792 out-of-fold predictions across 88 cases and nine target nodes. Of these, 475 were classified correctly, yielding an overall accuracy of 59.97%. Its macro-averaged Brier score and logarithmic loss were 0.2291 and 0.6453, respectively, compared with 0.2139 and 0.6176 for the training-fold prevalence baseline. The mean node-specific Brier skill score was −0.0663. L2-regularized logistic regression achieved an accuracy of 75.88%, a Brier score of 0.1598, a logarithmic loss of 0.4899 and a mean node-specific Brier skill score of 0.2710.
The fixed-structure hybrid network achieved a macro-averaged balanced accuracy of 0.5342, compared with 0.4854 for the prevalence baseline. Across the target nodes, the macro-average of the pooled out-of-fold AUCs was 0.6340, and the macro-average of the mean within-fold AUCs was 0.6727. The corresponding within-fold AUC for the prevalence baseline was 0.5000.
The five training folds yielded 98, 91, 79, 92 and 89 risk factor relationships, respectively. In the reconstructed hybrid network, UC4 was the only target node that switched from Noisy-MAX to a smoothed CPT. This occurred in folds 1, 3 and 4 because expert parameters were unavailable for newly introduced parent relationships. The other expert-parameterized target nodes retained their corresponding Noisy-MAX parameters. In these three folds, UC4 had 9, 8 and 8 parents, yielding 512, 256 and 256 possible parent-state configurations, respectively. The training data covered 43, 36 and 49 configurations, corresponding to coverage rates of 8.40%, 14.06% and 19.14%. The remaining 469, 220 and 207 configurations had no training observations, so their State1 probabilities were estimated as 0.5 under the symmetric Beta(0.5, 0.5) prior. In the corresponding test folds, 11 of 18, 6 of 18 and 3 of 17 cases had parent-state configurations absent from the training data.
The reconstructed hybrid network had a macro-averaged accuracy of 0.5972, a Brier score of 0.2336 and a logarithmic loss of 0.6541. Its mean node-specific Brier skill score was −0.1000. The corresponding values for the reconstructed data-CPT network were 0.6338, 0.2176, 0.6187 and −0.0305.
In the fixed-structure analysis, UA3, UC2 and UC3 achieved pooled out-of-fold AUCs of 0.8842, 0.8612 and 0.7849, respectively. UC3 used an ordinary CPT re-estimated within each training fold and achieved a Brier skill score of 0.2534, indicating a lower Brier score than the prevalence baseline. UA3 and UC2 retained fixed expert parameters. Their Brier skill scores were −0.0636 and −0.1070, respectively, indicating higher Brier scores than the prevalence baseline despite their relatively high AUCs.
The fixed-structure hybrid network outperformed the prevalence baseline on some discrimination metrics and for individual targets. Across the three network configurations, macro-averaged Brier scores and logarithmic losses were higher than those of the prevalence baseline. L2-regularized logistic regression achieved the lowest values on both loss metrics among the methods evaluated.
5. Application of Bayesian Networks to the Analysis of Tunnel Construction Accident Causes
5.1. Parameter Sensitivity and Direct Probabilistic Dependence
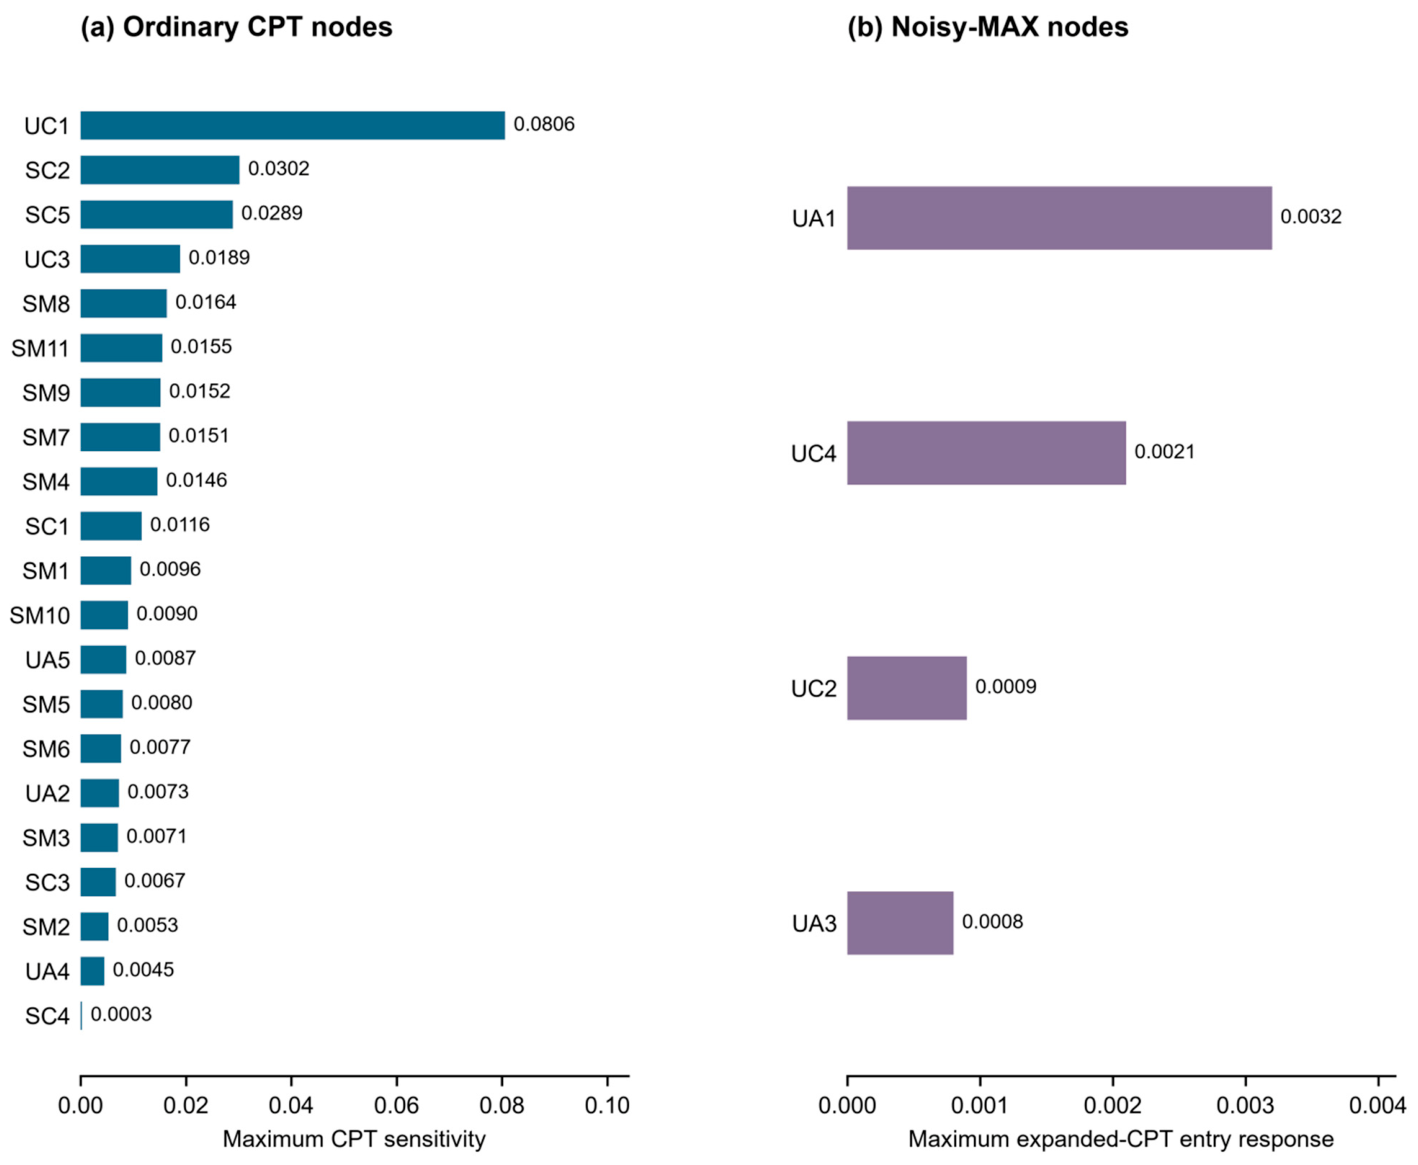
Sensitivity analysis targeted State1 of the Accident node and assessed the local response of its modelled marginal probability to changes in conditional probabilities without additional evidence. Results were reported separately by parameterization type, without a unified ranking across all 25 risk nodes (Figure 6). For the 21 ordinary CPT risk nodes, Maximum CPT sensitivity—the maximum absolute derivative of the target probability with respect to a conditional probability parameter—was used for within-group comparisons (Table 3a). For the four Noisy-MAX risk nodes, UA1, UA3, UC2 and UC4, maximum local responses to individual expanded-CPT entries were reported separately (Table 3b). These responses did not preserve the constraints linking entries through the Noisy-MAX activation and leak parameters and therefore do not represent sensitivities to those free parameters. All results are conditional on the current network structure, data-estimated parameters and expert-elicited parameters, including those assigned to Accident.
Table 3.
(a). Local parameter sensitivity and within-group ranking of ordinary CPT risk nodes. (b). Local responses of expanded CPT cells for Noisy-MAX risk nodes.
- (1)
- Safety culture: SC2 had the highest Maximum CPT sensitivity within this layer, at 0.0302, followed by SC5 (0.0289), SC1 (0.0116), SC3 (0.0067) and SC4 (0.0003). Under the current model, the Accident marginal probability was relatively more sensitive to local changes in conditional probability parameters associated with SC2 and SC5, while its response to those associated with SC4 was the lowest within this layer.
- (2)
- Safety management: All nodes in this layer used ordinary CPT parameterization. The hazard identification and rectification system (SM8) had the highest Maximum CPT sensitivity, at 0.0164, followed by emergency preparedness (SM11, 0.0155), construction plan (SM9, 0.0152), work instruction errors (SM7, 0.0151) and investment in safety protection facilities (SM4, 0.0146). The remaining values were 0.0096 for preconstruction investigation and design (SM1), 0.0090 for technical briefings (SM10), 0.0080 for operating procedures (SM5), 0.0077 for staffing (SM6), 0.0071 for the training and education system (SM3), and 0.0053 for the on-site management and supervision system (SM2). These values indicate differences in the local response of the Accident marginal probability to conditional probability parameters associated with different safety management nodes.
- (3)
- Unsafe acts and unsafe conditions: Among ordinary CPT nodes in this layer, UC1 had the highest Maximum CPT sensitivity, at 0.0806, followed by UC3 (0.0189), UA5 (0.0087), UA2 (0.0073) and UA4 (0.0045). For the Noisy-MAX nodes, the maximum expanded-CPT entry responses were 0.0032 for UA1, 0.0021 for UC4, 0.0009 for UC2 and 0.0008 for UA3, as reported separately in Table 3b.
Across the 21 ordinary CPT risk nodes, UC1, SC2, SC5, UC3 and SM8 had the five highest Maximum CPT sensitivity values. These nodes span the unsafe conditions, safety culture and safety management layers. Their within-group comparisons can inform checks of the corresponding conditional probability parameters. The Noisy-MAX expanded-CPT results describe responses within that representation only and cannot establish calibration priorities for activation or leak parameters.
Figure 6.
Local responses of the Accident probability by parameterisation group.
This study uses J-divergence as a distributional distance measure to quantify the strength of probabilistic dependence between adjacent nodes in the Bayesian network. Koiter [35] proposed characterizing the influence strength of directed edges by comparing the child node’s conditional probability distributions under different parent states. J-divergence is one of the available distributional distance measures for this purpose. This approach has been applied to quantify probabilistic relationship strength in Bayesian networks. For example, Halabi [36] used J-divergence to assess arc strength in Bayesian networks for risk and reliability analysis.
For two discrete probability distributions P = (p1, p2, …, pm) and Q = (q1, q2, …, qm), the Kullback–Leibler divergence is first defined as:
J-divergence is the symmetric form of the Kullback–Leibler divergence and is calculated as follows:
GeNIe further uses a normalized form of J-divergence, expressed as follows:
Here, α controls the smoothness of the J-divergence normalization and was set to 10 in GeNIe. Probability terms that are zero in both distributions contribute nothing to the calculation. If a state has positive probability in one distribution but zero probability in the other, the symmetric divergence becomes infinite, and its normalized value approaches 1. Therefore, a single zero probability term does not, by itself, justify assigning a value of 1 to the overall distributional difference.
For each directed parent–child relationship, GeNIe calculates Strength of Influence by comparing the child node’s conditional probability distributions under different parent states. This study selected J-Divergence as the distributional distance measure and Maximum as the aggregation option in GeNIe’s Strength of Influence function. The Maximum J-divergence reported for each directed edge is therefore the largest value obtained from the relevant conditional distribution comparisons. This option captures the maximum change in the child node’s probability distribution associated with changes in parent states, rather than summing influence values across multiple edges.
Larger J-divergence values indicate greater differences in the child node’s probability distributions across parent states under the current network structure and parameter settings. They therefore represent relatively stronger probabilistic influence within the specified model. This study interprets J-divergence only at the individual directed-edge level. Values from different edges are not summed, multiplied or otherwise aggregated into path-level measures. Figure 7 presents the network’s probabilistic influence structure based on Maximum J-divergence. Complete edge-level results across the causation layers are provided in Appendix Table A6, with the main relationships reported in Table 4.
Figure 7.
J-divergence-based probabilistic influence structure of the Bayesian network.
Table 4.
Main Maximum J-divergence Influence Relationships Across Different Causation Levels in the Bayesian Network.
Maximum J-divergence was used to compare direct parent–child relationships across three interlayer transitions. The results showed differences in the strength of probabilistic dependence among these relationships.
For Safety Culture → Safety Management, SC5 → SM3 had the highest Maximum J-divergence (0.7409), followed by SC2 → SM2 and SC2 → SM5 (both 0.5173). The next highest values were observed for SC3 → SM6 (0.5082) and SC1 → SM5 (0.5003). These relationships exhibited relatively strong direct probabilistic dependence within this interlayer transition.
For Safety Management → Unsafe Acts/Unsafe Conditions, SM6 → UA4 had the highest Maximum J-divergence (0.4662). It was followed by SM7 → UA2 (0.4536), SM4 → UC3 (0.4086) and SM11 → UA4 (0.3593). Thus, the stronger direct probabilistic dependencies involving safety management nodes extended to both unsafe acts and unsafe conditions in the current model.
Among relationships directly connected to Accident, UA1 → Accident had the highest Maximum J-divergence (0.1628). Values were 0.0862 for UA2 → Accident, UA5 → Accident, UC1 → Accident and UC2 → Accident. UA3 → Accident, UA4 → Accident and UC4 → Accident each yielded 0.0542, whereas UC3 → Accident yielded 0.0277. Identical values indicate only equal maximum differences between the corresponding conditional distributions. They do not imply that these factors have equal real-world contributions to accident causation.
Overall, J-divergence analysis identifies relatively strong direct probabilistic dependencies within the current network. Because the Accident node uses expert-elicited parameters, results for its connected edges depend on those parameter settings. These values should not be interpreted as causal effects independently validated by accident data, nor should they be used to evaluate effects along multiedge paths.
5.2. Illustrative Application of the Bayesian Network to an Accident Case Outside the Database
5.2.1. Accident Case Information
A case outside the database was selected to illustrate the retrospective accident diagnosis process using the developed Bayesian network. The case involved the 14 September roof collapse at the Manme No. 1 Railway Tunnel in Contract Lot 18 of the Yumo Railway. Both experts were familiar with this case before parameter elicitation. It was therefore used only to demonstrate the model’s diagnostic process under specified evidence conditions, rather than as independent external validation or independent evidence of diagnostic accuracy. The accident timeline is shown in Figure 8.
Figure 8.
Accident occurrence history diagram.
5.2.2. Analysis of Accident Causes
Accident causes were identified using the tunnel construction accident model and the Investigation Report on the 14 September Roof Collapse at the Manme No. 1 Railway Tunnel in Contract Lot 18 of the Yumo Railway, published by China’s Ministry of Emergency Management. The identified accident causes are presented in Table 5.
Table 5.
Accident Causes.
5.2.3. Evidence Specification and Bayesian Updating
According to the investigation report, the local emergency management department had identified three safety violations at the project before the accident: (1) construction-stage safety distances substantially exceeding prescribed limits, (2) persistent operational violations by labour crews, and (3) unsupported steel arches that violated construction requirements. These findings were mapped to UA1, UA5 and UC2, respectively. The three risk nodes and the Accident node were set to State1 as case evidence. The Bayesian network then updated the probabilities of the 22 unobserved risk nodes. For each node, the posterior probability of State1 was compared with its baseline probability to determine the direction and magnitude of the change.
Figure 9 shows the Bayesian network after the specified evidence was entered. Posterior updating increased the probabilities of several nodes, with the results presented in Table 6.
Figure 9.
Posterior distributions in the Bayesian network after entering the case evidence.
Table 6.
Posterior probability increases for selected unobserved risk nodes.
5.2.4. Conditional Interpretation of Posterior Updating Results
- (1)
- Unsafe Acts and Unsafe Conditions: Among the 14 nodes with the largest probability increases in Table 6, three belonged to this layer. These were mechanical, electrical and safety equipment condition (UC3), adverse working conditions (UC4), and unsafe supervisory instructions (UA3). All three showed increased probabilities after the case evidence was entered. For example, the model probability for UC3 increased from 22% to 27%, reflecting a change in its conditional distribution under the current network structure and parameters.
- (2)
- Safety Management: This layer included preconstruction investigation and design (SM1), on-site management and supervision system (SM2), and training and education system (SM3). It also included investment in safety protection facilities (SM4), operating procedures (SM5), and work instruction errors (SM7). The remaining factors were hazard identification and rectification system (SM8), construction plan (SM9), and technical briefings (SM10). SM4 showed the largest probability increase, with its model probability rising from 51% to 62%. These changes illustrate how the given evidence updated the conditional probabilities of management-layer nodes. They do not indicate that the model independently confirmed the corresponding management deficiencies.
- (3)
- Safety Culture: This layer included safety training quality (SC5) and safety values (SC2). The model probabilities of the corresponding risk states increased for both nodes. This illustrates how entering evidence can also update the conditional distributions of upstream nodes through the network’s predefined dependencies.
These results illustrate how the specified case evidence updates probabilities across the network layers.
5.2.5. Comparison of the Full and Core Networks
To assess the sensitivity of posterior updating to network topology in the Manme case, we compared the full network of 93 risk factor associations with a core network comprising the 53 associations that had bootstrap selection frequencies of at least 80%. Both networks retained the same nine expert-specified edges into the Accident node and used the same case evidence. Ordinary CPTs in both networks were re-estimated from all 88 cases using a Beta(0.5, 0.5) prior. For Noisy-MAX nodes in the core network, the activation probabilities associated with retained parents and the original leak parameters were preserved.
Using unrounded probabilities for the 22 unobserved risk nodes, we obtained Spearman’s rank correlations of 0.883 for posterior probabilities and 0.528 for changes from baseline between the two networks. The mean and median absolute differences in posterior probabilities, calculated from the same unrounded values, were 4.50 and 3.06 percentage points, respectively. The two networks showed closer agreement in the ranking of posterior probabilities than in the ranking of probability changes.
Appendix Table A7 reports results for all 22 nodes. For display, baseline and posterior probabilities were rounded to the nearest whole percent before differences were calculated. UC4 had the largest absolute difference in displayed posterior probabilities, at 29 percentage points (55% in the full network and 26% in the core network). For SM6, the displayed probability remained at 50% in the full network and increased from 50% to 57% in the core network. For SM11, it increased from 27% to 29% in the full network and remained at 26% in the core network.
6. Discussion
This study integrates the theoretical hierarchy, historical accident associations and expert judgement into an inspectable probabilistic inference framework. It explicitly specifies candidate relationship directions and parameter sources and illustrates posterior updating under given evidence conditions. Baseline comparisons have not established additional overall probabilistic reconstruction value, so the framework remains an exploratory research tool requiring further calibration and testing.
Its interpretation is constrained by data and model limitations. First, the database contains only 88 tunnel construction accident cases, without controls representing normal construction or non-accident conditions. Data-estimated parameters reflect the distributions of report-coded factors, while hybrid model outputs also depend on expert parameters. These outputs cannot be directly interpreted as absolute probabilities or relative risks of accident occurrence under actual construction conditions. The study therefore explores conditional probabilistic inference after accidents without validating prospective accident risk prediction capability.
Second, accident investigation reports vary in their sources, investigative focus and level of detail. Converting narrative accounts into binary risk factors depends on operational definitions and human judgement. Identifying the latent organizational characteristics represented by SC1–SC5 is particularly susceptible to differences in evidence completeness and coders’ interpretations. Individual violations or isolated management deficiencies cannot be directly equated with organizational safety culture problems. Independent coding records generated before consensus were not fully retained, and no additional assessors conducted independent blinded recoding during this revision. Consequently, agreement in the original coding cannot be quantified retrospectively, and the reproducibility of the final codebook lacks independent empirical evaluation. The operational definitions in Table 1 and case-level coding in Table A1b improve transparency but do not establish coding reliability. Because the final Boolean matrix underlies all subsequent analyses, factor omissions, misclassification and interpretive bias may affect factor frequencies, association rules, network topology, CPT estimates and posterior updating. Bootstrap analysis and cross-validation both use this matrix. They cannot distinguish how much of the detected association structure reflects patterns in the reports and how much reflects coders’ interpretations. Coding reliability therefore remains an unresolved methodological limitation, and the findings remain exploratory and conditional on the available reports, operational definitions and consensus coding. Future studies should use a fixed codebook to conduct independent blinded recoding of all cases or a prespecified random subsample. Independent results should be retained before disagreements are resolved, and factor-specific agreement statistics and confidence intervals should be reported to assess coding reproducibility.
Third, the accident causation structure combines theory-driven and data-driven approaches. The 24Model informed the predefined hierarchy Safety Culture → Safety Management → Unsafe Acts/Unsafe Conditions → Accident, which constrained the network structure. Apriori screened exploratory associations meeting prespecified criteria within these directions; it did not independently identify causal directions. Subsequent theoretical consistency screening followed the same predefined hierarchy and directions, without arbitrary additions or removals based on the results. The resulting network therefore depends on the theoretical framework and screening criteria adopted. Its directed edges represent probabilistic dependencies under theoretical constraints, rather than causal effects directly validated by the current data. The plausibility of these directions still requires support from theoretical mechanisms and domain evidence. Restricting relationships to adjacent layers does not exclude influences spanning non-adjacent layers, within-layer coupling, reverse influences or alternative structures. The current topology is therefore not the only possible representation. Resampling and threshold analyses showed that the association set depended on the sample and screening conditions. Comparison of the full and core networks further indicated that posterior updates for some nodes were sensitive to topology selection. Sensitivity results and case posterior updates should therefore be interpreted as model outputs conditional on the specified structure, parameters and evidence. Future studies could combine larger datasets and temporal information with structural equation modelling (SEM), causal structure learning and expert causal judgement. These approaches could support further comparison and validation of the predefined directions and alternative structures.
Fourth, Noisy-MAX reduces parameter requirements under limited sample conditions, but this does not establish empirical validation of the parameters. The two experts reached consensus through discussion, without retaining independent initial ratings or systematically quantifying and propagating judgement uncertainty [37]. Before elicitation, both had accessed all 88 accident records, the final coding matrix, the network structure and the diagnostic case. Fixing parameters before computation therefore does not establish information independence. Both the fixed-structure and reconstructed hybrid models retained these parameters and cannot constitute independent validation of the complete modelling procedure. Reconstruction using exclusively data-estimated CPTs excludes fixed expert activation parameters and provides clearer training–test separation, but remains an internal evaluation under the specified coding and theoretical constraints. The diagnostic case serves only to illustrate posterior updating. Because the Accident conditional probabilities cannot be identified from accident-only data, its associated sensitivity, J-divergence and diagnostic updates depend on expert assumptions. Parameter disclosure and numerical perturbation cannot replace empirical calibration or assessment of expert judgement uncertainty. The binary factor system also does not explicitly represent continuous physical processes or their coupled evolution. For example, research on non-isothermal seepage in fractured rock masses indicates that temperature–seepage coupling may alter equilibrium states and critical transition conditions [38]. Extending this framework to construction-process analysis would require monitoring information to assess whether relevant physical state variables should be incorporated. Future studies should separate expert elicitation materials from independent evaluation cases, retain pre-consensus ratings, propagate their uncertainty and compare alternative parameterization methods. Prospective accident risk estimation would additionally require normal construction samples, construction exposure data, recalibration and independent validation.
Fifth, five-fold internal cross-validation showed that favourable local discrimination did not translate into lower overall probabilistic losses. The network’s balanced accuracy and mean within-fold AUC exceeded the prevalence baseline, and UC3 had a Brier Skill Score of 0.2534. However, the fixed-structure hybrid network’s mean node-specific Brier Skill Score was −0.0663, indicating no overall probabilistic reconstruction advantage. Regularized logistic regression achieved lower probabilistic losses, and structure reconstruction within training folds did not change this overall conclusion. Discrimination and probabilistic prediction quality require separate assessment; higher AUCs cannot replace the probability-loss assessment provided by brier score and Logarithmic Loss [39]. Better discrimination also does not guarantee good calibration, which the current loss metrics alone cannot establish [40]. Because UA3 and UC2 used fixed expert parameters, their higher AUCs do not demonstrate successful parameter learning from the training data. Limited sample size, coding uncertainty, structural constraints and expert parameters may all affect performance, but their respective contributions have not been isolated. Logistic regression performed better using the same cases, so sample size alone cannot explain the differences between models. The fold-specific audit showed that, after UC4 reverted to an ordinary CPT, training observations covered only 8.40–19.14% of possible parent configurations. Predictions for some test cases depended entirely on the Beta prior. Although fallback avoided introducing unelicited expert parameters for new parent relationships, high-dimensional configuration sparsity remained, and smoothing cannot replace empirical support. The reconstructed hybrid network also changed both topology and parameterization. Their contributions to overall performance have not been separated, so the unfavourable results cannot be attributed directly to fallback. Internal reconstruction and the case application also used different evidence configurations. Cross-validation masked one target factor and reconstructed it using the remaining observed risk factors, without Accident as evidence. The case application instead entered UA1, UA5, UC2 and Accident to update the remaining nodes. Internal reconstruction metrics therefore cannot be interpreted directly as case diagnostic accuracy. However, this difference does not remove the constraints that the unfavourable baseline comparisons impose on the conclusions. The results support further investigation of this modelling approach, but establish neither additional overall reconstruction value nor diagnostic validity.
Sixth, sensitivity results depend on the parameterization and the perturbations permitted. Ordinary CPT parameters and expanded-CPT entries of Noisy-MAX nodes differ in how they can be adjusted. Results were therefore reported separately by parameterization type, with comparisons restricted to each group rather than a unified ranking of all 25 nodes. Varying individual expanded-CPT entries independently does not preserve the constraints linking them through the activation and leak parameters. The resulting responses describe local changes within the expanded representation, rather than sensitivities to the underlying free parameters, and cannot establish their calibration priorities. Moreover, the maximum absolute derivative summarizes only the largest local response among a node’s parameters, without describing their full response distribution. Node sensitivity should therefore be interpreted as a relative local parameter response under the specified network structure and parameters, rather than a fixed ranking of causal importance.
Seventh, probabilistic model outputs should be distinguished from acceptable states in engineering decision-making. Posterior probabilities describe conditional factor-state probabilities, sensitivity metrics characterize relative local parameter responses, and J-divergence measures direct probabilistic influence strength. These outputs do not directly constitute engineering safety thresholds. Related sinking-well studies illustrate how mechanical criteria can define acceptable engineering states. Research on circular sinking wells evaluated admissible tilt ranges based on changes in contact stress [41]. Studies of rectangular sinking wells examined the effects of geometric proportions and inclination direction on admissible tilt angles [42], alongside acceptable regions under combined biaxial inclinations [43]. Applying the present probabilistic diagnostic results to on-site decisions would require project-specific risk tolerances, code requirements and expert judgement. These would inform a mapping from probabilistic outputs to intervention thresholds or risk acceptability regions.
Eighth, the model’s practical scope requires clarification. With the current accident-only database, the framework organizes accident evidence and illustrates retrospective probabilistic inference when accident-related evidence is known. Bayesian updating provides model-based leads for unobserved risk factors, but its practical diagnostic utility requires independent evaluation. It does not directly predict real-time accident probabilities during construction. Extending the framework to prospective dynamic risk management would require normal construction samples, construction exposure data and time-series information, together with network recalibration and independent validation. Relatively fast-changing variables in Safety Management, Unsafe Acts and Unsafe Conditions would require continuous or stage-specific monitoring and updating. Examples include on-site management and supervision, hazard identification and rectification, construction plans and technical briefings, unsafe acts, and geological, support, equipment and working environment conditions. Relatively stable organizational variables in Safety Culture would be more appropriately updated through periodic surveys or stage-specific assessments. A dynamic Bayesian network (DBN) could introduce temporal dependencies between construction stages or time slices. It could represent changes in geological conditions, construction-related technical states, organizational management and personnel behaviour as construction progresses. It could also assess how risk states in one stage influence subsequent stages. DBNs therefore offer an important direction for extending static accident diagnosis towards temporal, dynamic risk management. Their implementation would nevertheless require continuous monitoring data, clearly defined temporal scales and sufficient longitudinal construction observations.
Finally, posterior updating was illustrated using only one case outside the database, which the experts had accessed before parameter elicitation. This application therefore provides neither independent external validation nor evidence of diagnostic performance. Future evaluation should use multiple accident cases excluded from structure determination, expert elicitation and parameter adjustment. Under predefined coding standards, evidence configurations and assessment criteria, comparisons with simpler methods should address the same task and evaluate probabilistic losses, classification performance and their uncertainty. Furthermore, the model was developed using Chinese tunnel construction accident cases. Its parameters and relationships may reflect regional construction management practices, regulatory systems, project organization and geological conditions. Applications to other regions or project types would therefore require local calibration and independent validation to assess applicability and transferability.
7. Conclusions
Using investigation reports from 88 tunnel construction accidents, this study integrated the 24Model, association rule mining and a hybrid Bayesian network. It developed a probabilistic diagnostic framework for post-accident cause analysis and backward inference and evaluated it on an exploratory basis. The main conclusions are as follows.
- (1)
- A modelling process integrating theoretical constraints, accident report information and expert judgement was developed. The 24Model specified the hierarchy and directions of candidate relationships, while Apriori screened associations between adjacent layers. Hybrid parameterization combined smoothed CPTs with expert-elicited Noisy-MAX parameters. The framework explicitly distinguished data-estimated and expert-elicited parameter sources and reduced parameter requirements for some highly connected nodes. These features provide a basis for examining how structural choices, parameter settings and evidence inputs affect inference.
- (2)
- Five-fold internal cross-validation showed heterogeneous reconstruction performance across nodes. The fixed-structure hybrid network achieved macro-averaged brier score and Logarithmic Loss values of 0.2291 and 0.6453, respectively, with a mean node-specific Brier Skill Score of −0.0663. It did not outperform the training-fold prevalence baseline, whereas regularized logistic regression achieved lower probabilistic losses. Both hybrid models retained expert parameters informed by the complete study materials, so these analyses did not independently validate the complete modelling procedure. Reconstruction using exclusively data-estimated CPTs provided clearer separation between training and testing, but also produced higher overall probabilistic losses than the prevalence baseline. Nevertheless, the network’s balanced accuracy and mean within-fold AUC exceeded the prevalence baseline, and UC3 achieved a Brier Skill Score of 0.2534.
- (3)
- The network represents probabilistic dependencies constrained by accident causation theory. Assessing the engineering plausibility of these dependencies requires mechanistic and domain-specific evidence. Of the 93 retained associations, 53 had bootstrap selection frequencies of at least 80%, 10 met the BH-adjusted significance criterion, and five of those also met the BY criterion. These results indicate variation in the stability and statistical support of the retained associations. Based on unrounded model probabilities, the rank correlations between the full and core networks were 0.883 for posterior probabilities and 0.528 for changes from baseline. The mean absolute difference in posterior probabilities was 4.50 percentage points, and the largest difference was 29.30 percentage points for UC4. The two networks showed closer agreement in the rankings of posterior probabilities than in the rankings of probability changes, and the magnitude of the updates differed between networks for some nodes.
- (4)
- Sensitivity analysis by parameterization group and Maximum J-divergence analysis identified differences in local parameter responses and direct probabilistic dependencies. Among the 21 ordinary CPT risk nodes, UC1, SC2 and SC5 had the highest Maximum CPT sensitivity values at 0.0806, 0.0302 and 0.0289, respectively. Expanded-CPT responses for Noisy-MAX nodes were reported separately, without a unified ranking alongside ordinary CPT nodes. They were not interpreted as sensitivities to independent activation probabilities or leak parameters. SC5 → SM3 (0.7409) and SM6 → UA4 (0.4662) had the highest Maximum J-divergence values within their respective interlayer transitions. Among edges directly connected to Accident, UA1 → Accident had the highest value (0.1628). These results can inform checks of model parameters and dependencies.
- (5)
- The Manme No. 1 Railway Tunnel case illustrated posterior updating after UA1, UA5, UC2 and Accident were set to State1. Posterior distributions were calculated for the remaining risk nodes, showing how evidence updates unobserved factor probabilities under the specified network structure and parameters. Because the experts had accessed the case before parameter elicitation, the application served as an inference example rather than independent external validation.
Overall, the framework remains exploratory, with its additional overall reconstruction value and diagnostic validity requiring independent evaluation. Future evaluations should use multiple cases excluded from model development, prespecified coding standards and evidence configurations, and comparisons with simpler methods on the same task. Extension to prospective accident probability estimation or dynamic risk management would require normal construction samples, construction exposure data and longitudinal monitoring, together with recalibration and independent validation.
Supplementary Materials
The following supporting information can be downloaded at https://www.mdpi.com/article/10.3390/buildings16224486/s1, Table S1: Supplementary accident case sources and construction settings.
Author Contributions
Methodology, H.H.; software, H.H.; formal analysis, H.H.; investigation, Z.T., and H.H.; data curation, H.H.; writing—original draft preparation, H.H.; writing—review and editing, Z.T.; supervision, Z.T. All authors have read and agreed to the published version of the manuscript.
Funding
This research received no external funding.
Data Availability Statement
The original contributions presented in this study are included in the article and Supplementary Materials. Further inquiries can be directed to the corresponding author.
Conflicts of Interest
The authors declare no conflicts of interest.
Appendix A
Table A1.
(a). Accident cases and occurrence dates. (b). Causation information table of 88 tunnel construction accidents.
Table A2.
Complete association rule results across different causation levels.
Table A3.
(a). BH-significant relationships. (b). Selected threshold comparisons.
Table A4.
(a). Noisy-MAX parameters for UA1. (b). Noisy-MAX parameters for UA3. (c). Noisy-MAX parameters for UC2. (d). Noisy-MAX parameters for UC4. (e). Noisy-MAX parameters for Accident.
Table A5.
(a). Nine-target validation of the hybrid Bayesian network. (b). Nine-target model and baseline comparisons. (c). Eight-target model and baseline comparisons.
Table A6.
Edge-level Maximum J-divergence across causation layers in the Bayesian network.
Table A7.
Node-level posterior probability comparison between the full and bootstrap-stable core networks.
References
- Li, L.; Tu, W.; Shi, S.; Chen, J.; Zhang, Y. Mechanism of water inrush in tunnel construction in karst area. Geomat. Nat. Hazards Risk 2016, 7, 35–46. [Google Scholar] [CrossRef] [Scilit]
- Sun, H.; Zhu, M.; Dai, Y.; Liu, X.; Li, X. Dynamic risk early warning system for tunnel construction based on two-dimensional cloud model. Expert Syst. Appl. 2024, 255, 124799. [Google Scholar] [CrossRef] [Scilit]
- Duan, K.; Zhang, G.; Sun, H. Construction practice of water conveyance tunnel among complex geotechnical conditions: A case study. Sci. Rep. 2023, 13, 15037. [Google Scholar] [CrossRef] [Scilit] [PubMed]
- Mei, Y.; Zhang, X.; Nong, X.; Fu, L. Experimental study of the comprehensive technology of grouting and suspension under an operating railway in the cobble stratum. Transp. Geotech. 2021, 30, 100612. [Google Scholar] [CrossRef] [Scilit]
- Zhang, K.; Zhang, Y.; Zhou, S.; Wang, W.; Huang, B.; Zhai, G.; Qin, Z. Application of Direct Current Method and Seismic Wave Method in Advanced Detection of TBM Construction Tunnels. Buildings 2025, 15, 3201. [Google Scholar] [CrossRef] [Scilit]
- Yixiong, H.; Ning, L.; Baoshun, S.; Bo, W.; Chengyong, C. Construction of Multiple Intersections of Tunnel Structures in Limestone and Mudstone Sections: A Case Study. Arab. J. Sci. Eng. 2022, 47, 12817–12837. [Google Scholar] [CrossRef] [Scilit]
- Chen, Q.; Tian, Z.; Lei, T.; Huang, S. An association rule mining model for evaluating the potential correlation of construction cross operation risk. Eng. Constr. Archit. Manag. 2022, 30, 5109–5132. [Google Scholar] [CrossRef] [Scilit]
- Meng, G.; Liu, J.; Qiu, W.; Wu, B.; Xu, S. A Failure Probability Evaluation Method for the Collapse of Drill-Blast Tunnels Based on a Multistate Cloud Bayesian Network. Front. Earth Sci. 2022, 10, 856701. [Google Scholar] [CrossRef] [Scilit]
- Gu, J.; Guo, J.; Chen, F.; Li, J. Evolution Law and Grouting Treatment of Water Inrush in Hydraulic Tunnel Approaching Water-Rich Fault: A Case Study. Appl. Sci. 2024, 14, 3407. [Google Scholar] [CrossRef] [Scilit]
- Yang, H.; Jiang, C.; Ding, Y.; Lin, Z.; Chen, X.; Wang, Z.; Gong, H. Research on the influence of high-altitude tunnel environment on gas explosion characteristics and explosion limits. Tunn. Undergr. Space Technol. 2025, 159, 106435. [Google Scholar] [CrossRef] [Scilit]
- Einstein, H.H. Risk and risk analysis in rock engineering. Tunn. Undergr. Space Technol. 1996, 11, 141–155. [Google Scholar] [CrossRef] [Scilit]
- Zhu, D.; Griffiths, D.V.; Fenton, G.A.; Huang, J.; Gao, Y. Reliability analysis of slopes under slow drawdown conditions. Géotechnique 2026, 76, 835–841. [Google Scholar] [CrossRef] [Scilit]
- Zhang, K.; Zheng, W.; Liao, Z.; Xie, H.; Zhou, C.; Chen, S.; Zhu, J. Risk assessment of ground collapse along tunnels in karst terrain by using an improved extension evaluation method. Tunn. Undergr. Space Technol. 2022, 129, 104669. [Google Scholar] [CrossRef] [Scilit]
- Meng, G.; Ye, Y.; Wu, B.; Luo, G.; Zhang, X.; Zhou, Z.; Sun, W. Risk Assessment of Shield Tunnel Construction in Karst Strata Based on Fuzzy Analytic Hierarchy Process and Cloud Model. Shock Vib. 2021, 2021, 7237136. [Google Scholar] [CrossRef] [Scilit]
- Sharafat, A.; Latif, K.; Seo, J. Risk analysis of TBM tunneling projects based on generic bow-tie risk analysis approach in difficult ground conditions. Tunn. Undergr. Space Technol. 2021, 111, 103860. [Google Scholar] [CrossRef] [Scilit]
- Liu, Z.; Zhou, J.; Reniers, G. Association analysis of accident factors in petrochemical storage tank farms. J. Loss Prev. Process Ind. 2023, 84, 105124. [Google Scholar] [CrossRef] [Scilit]
- Liao, P.C.; Chen, H.; Luo, X. Fusion Model for Hazard Association Network Development: A Case in Elevator Installation and Maintenance. KSCE J. Civ. Eng. 2019, 23, 1451–1465. [Google Scholar] [CrossRef] [Scilit]
- Phan, T.D.; Smart, J.C.; Capon, S.J.; Hadwen, W.L.; Sahin, O. Applications of Bayesian belief networks in water resource management: A systematic review. Environ. Model. Softw. 2016, 85, 98–111. [Google Scholar] [CrossRef] [Scilit]
- Hon, C.K.; Sun, C.; Xia, B.; Jimmieson, N.L.; Way, K.A.; Wu, P.P.Y. Applications of Bayesian approaches in construction management research: A systematic review. Eng. Constr. Archit. Manag. 2021, 29, 2153–2182. [Google Scholar] [CrossRef] [Scilit]
- Turner, R.J.; Hagoort, K.; Meijer, R.J.; Coenen, F.; Scheepers, F.E. Bayesian network analysis of antidepressant treatment trajectories. Sci. Rep. 2023, 13, 8428. [Google Scholar] [CrossRef] [Scilit] [PubMed]
- Stylianou, K.; Dimitriou, L. Analysis of Rear-End Conflicts in Urban Networks using Bayesian Networks. Transp. Res. Rec. J. Transp. Res. Board 2018, 2672, 302–312. [Google Scholar] [CrossRef] [Scilit]
- Shi, L.; Liu, Y.; Zhang, Y.; Liang, J. Data-Driven Bayesian Network Analysis of Railway Accident Risk. IEEE Access 2024, 12, 38631–38645. [Google Scholar] [CrossRef] [Scilit]
- Liu, Z.; Han, Z.; Chen, Q.; Shi, X.; Ma, Q.; Cai, B.; Liu, Y. Risk assessment of marine oil spills using dynamic Bayesian network analyses. Environ. Pollut. 2023, 317, 120716. [Google Scholar] [CrossRef] [Scilit] [PubMed]
- Fu, G.; Cao, J.L.; Zhou, L.; Xiang, Y.C. Comparative study of HFACS and the 24Model accident causation models. Pet. Sci. 2017, 14, 570–578. [Google Scholar] [CrossRef] [Scilit]
- Naji, G.M.; Isha, A.S.; Mohyaldinn, M.E.; Leka, S.; Saleem, M.S.; Rahman, S.M.; Alzoraiki, M. Impact of Safety Culture on Safety Performance; Mediating Role of Psychosocial Hazard: An Integrated Modelling Approach. Int. J. Environ. Res. Public Health 2021, 18, 8568. [Google Scholar] [CrossRef] [Scilit] [PubMed]
- Li, G.; Xiao, Z.; Chen, Y.; Martek, I.; Zeng, Y. The Role of Individual Cognition in the Formation of Unsafe Behaviors: A Case Study of Construction Workers. Buildings 2026, 16, 395. [Google Scholar] [CrossRef] [Scilit]
- Lyu, Q.; Fu, G.; Wang, Y.; Zhang, R.; Wu, Y.; Xie, X. Cause analysis framework from a safety capability perspective: Application to Tianjiayi hazardous chemical explosion accident. Process Saf. Prog. 2023, 42, 567–577. [Google Scholar] [CrossRef] [Scilit]
- Lan, H.; Ma, X. Risk Evolution Analysis of Seafarers’ Unsafe Acts in Maritime Accidents Based on Directed Weighted CN. Appl. Sci. 2024, 14, 2595. [Google Scholar] [CrossRef] [Scilit]
- Mohammadiyan, M.; Ahmadi, O.; Yaseri, M.; Karimi, A. Factors influencing unsafe acts in the automotive industry using grounded theory and fuzzy DEMATEL. Sci. Rep. 2025, 15, 7532. [Google Scholar] [PubMed]
- Li, P.; Wu, F.; Xue, S.; Guo, L. Study on the Interaction Behaviors Identification of Construction Workers Based on ST-GCN and YOLO. Sensors 2023, 23, 6318. [Google Scholar] [CrossRef] [Scilit] [PubMed]
- Sun, B.; Zhang, X.; Jiang, J.; Gong, J.; Lin, D. Bayesian network structure learning by opposition-based learning. Sci. Rep. 2025, 15, 18447. [Google Scholar] [CrossRef] [Scilit] [PubMed]
- Díez, F.J. Parameter adjustment in Bayes networks. The generalized noisy OR-gate. In Uncertainty in Artificial Intelligence: Proceedings of the Ninth Conference; Morgan Kaufmann: Washington, DC, USA, 1993. [Google Scholar]
- Cessie, S.L.; Houwelingen, J.V. Ridge Estimators in Logistic Regression. J. R. Stat. Soc. Ser. C 1992, 41, 191–201. [Google Scholar] [CrossRef] [Scilit] [PubMed]
- Varma, S.; Simon, R. Bias in error estimation when using cross-validation for model selection. BMC Bioinform. 2006, 7, 91. [Google Scholar] [CrossRef] [Scilit] [PubMed]
- Koiter, J.R. Visualizing Inference in Bayesian Networks. Master’s Thesis, Delft University of Technology, Delft, The Netherlands, 2006. [Google Scholar]
- Halabi, A.; Kenett, R.S.; Sacerdote, L. Modeling the relationship between reliability assessment and risk predictors using Bayesian networks and a multiple logistic regression model. Qual. Eng. 2017, 30, 663–675. [Google Scholar] [CrossRef] [Scilit]
- O’Hagan, A. Expert Knowledge Elicitation: Subjective but Scientific. Am. Stat. 2019, 73, 69–81. [Google Scholar] [CrossRef] [Scilit]
- Cao, Z. The Bifurcation Characteristics and Dynamical Evolution Rule of Non-Isothermal Seepage Mechanical Model in Fractured Rock Mass. Processes 2026, 14, 1985. [Google Scholar]
- Gneiting, T.; Raftery, A.E. Strictly Proper Scoring Rules, Prediction, and Estimation. J. Am. Stat. Assoc. 2007, 102, 359–378. [Google Scholar] [CrossRef] [Scilit]
- Calster, B. Calibration: The Achilles heel of predictive analytics. BMC Med. 2019, 17, 230. [Google Scholar] [CrossRef] [Scilit] [PubMed]
- Szymczak-Graczyk, A.; Garbowski, T.; Grajçevci, F.; Sadiku, H. Static Analysis and Safety Assessment of Tilted Circular Sinking Wells. Struct. Durab. Health Monit. 2026, 20, 8. [Google Scholar] [CrossRef] [Scilit]
- Karasiewicz, D.; Garbowski, T.; Szymczak-Graczyk, A. Directional Anisotropy of Admissible Tilt in Rectangular Sinking Wells: A Closed-Form Analytical Model. Symmetry 2026, 18, 845. [Google Scholar]
- Karasiewicz, D.; Garbowski, T.; Szymczak-Graczyk, A. Biaxial Inclination of Rectangular Sinking Wells: Analytical Model and Admissible Tilt Envelope. Buildings 2026, 16, 1656. [Google Scholar]
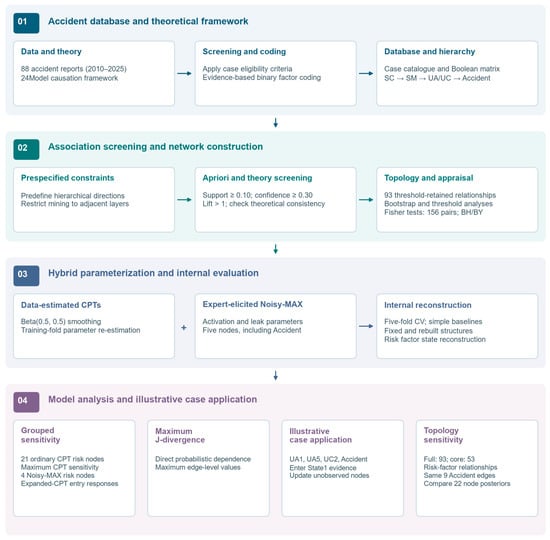
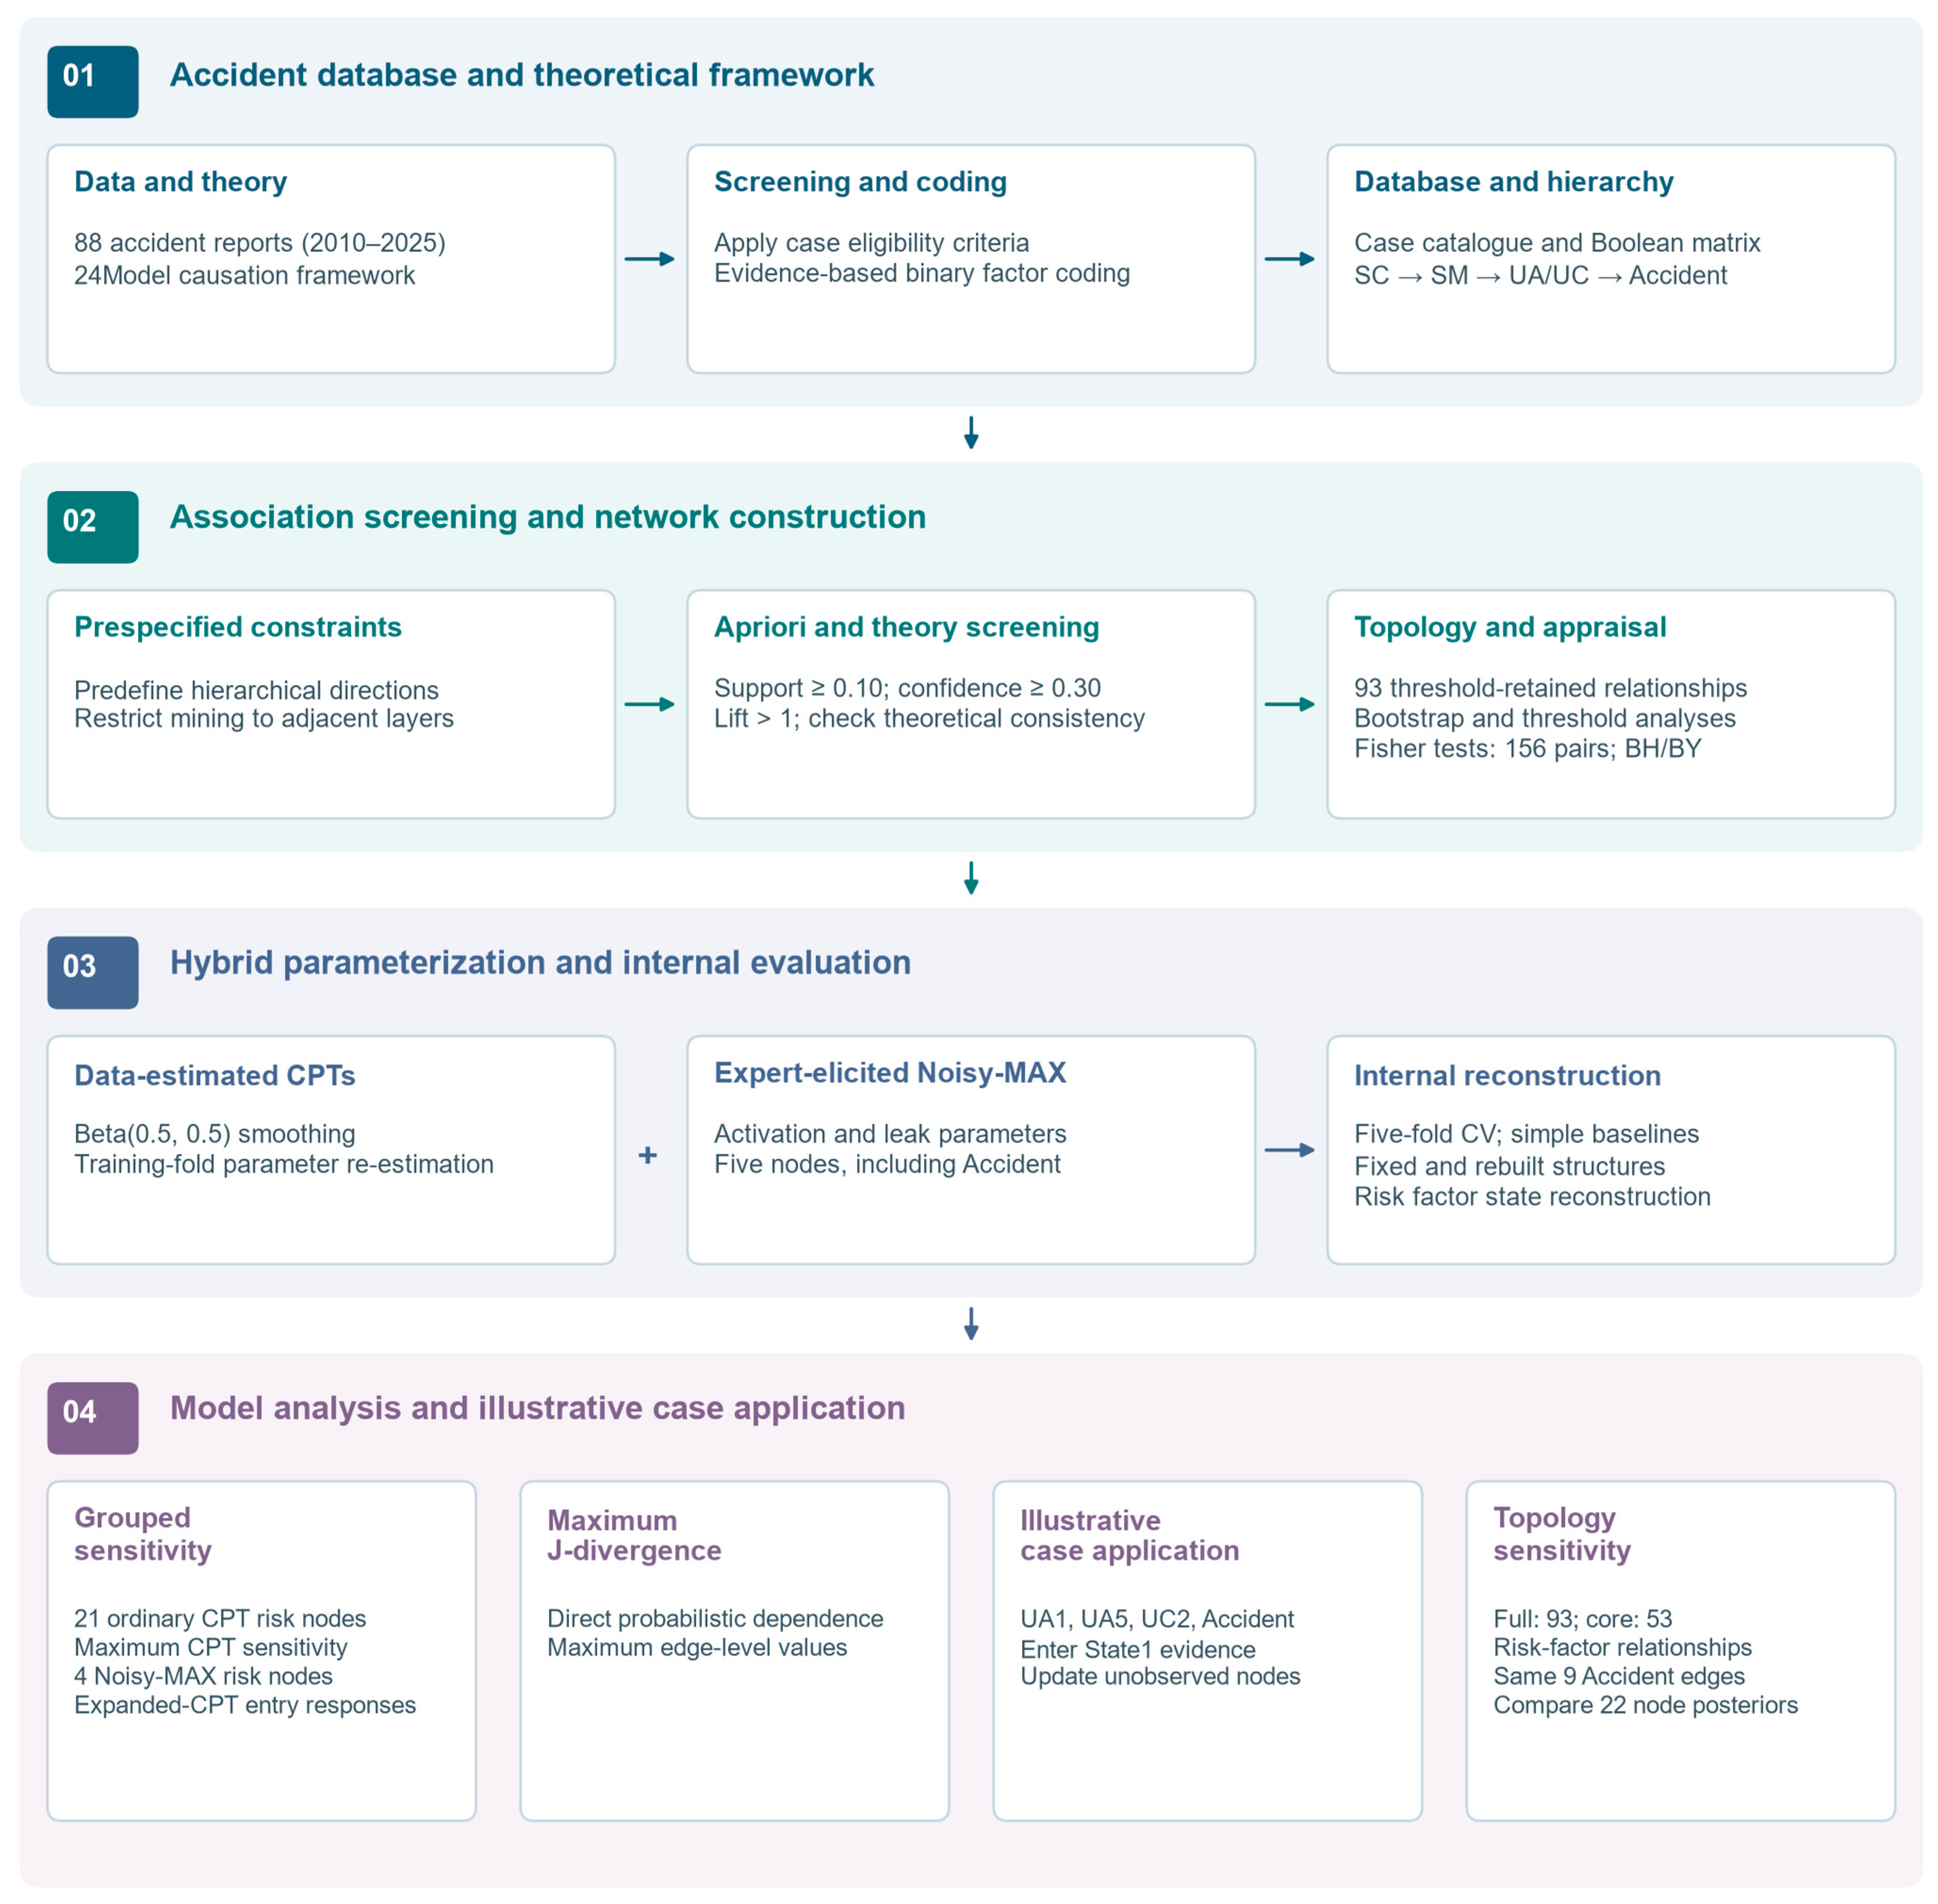
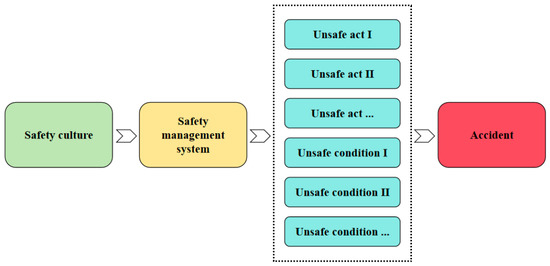
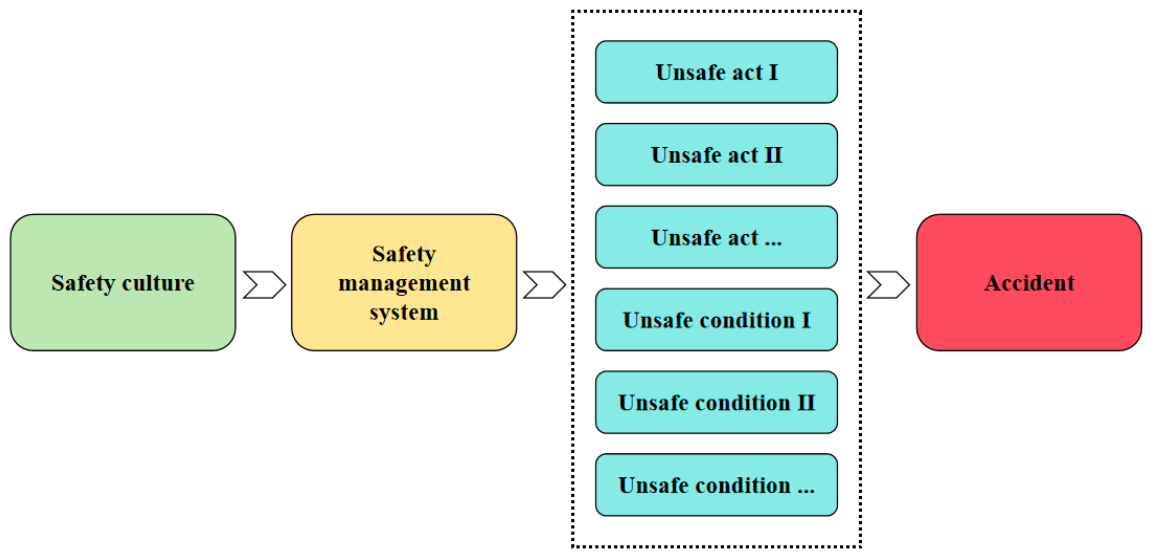
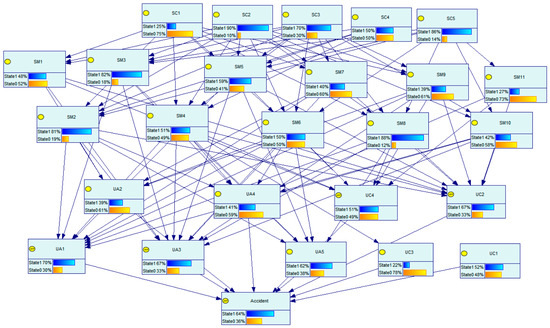
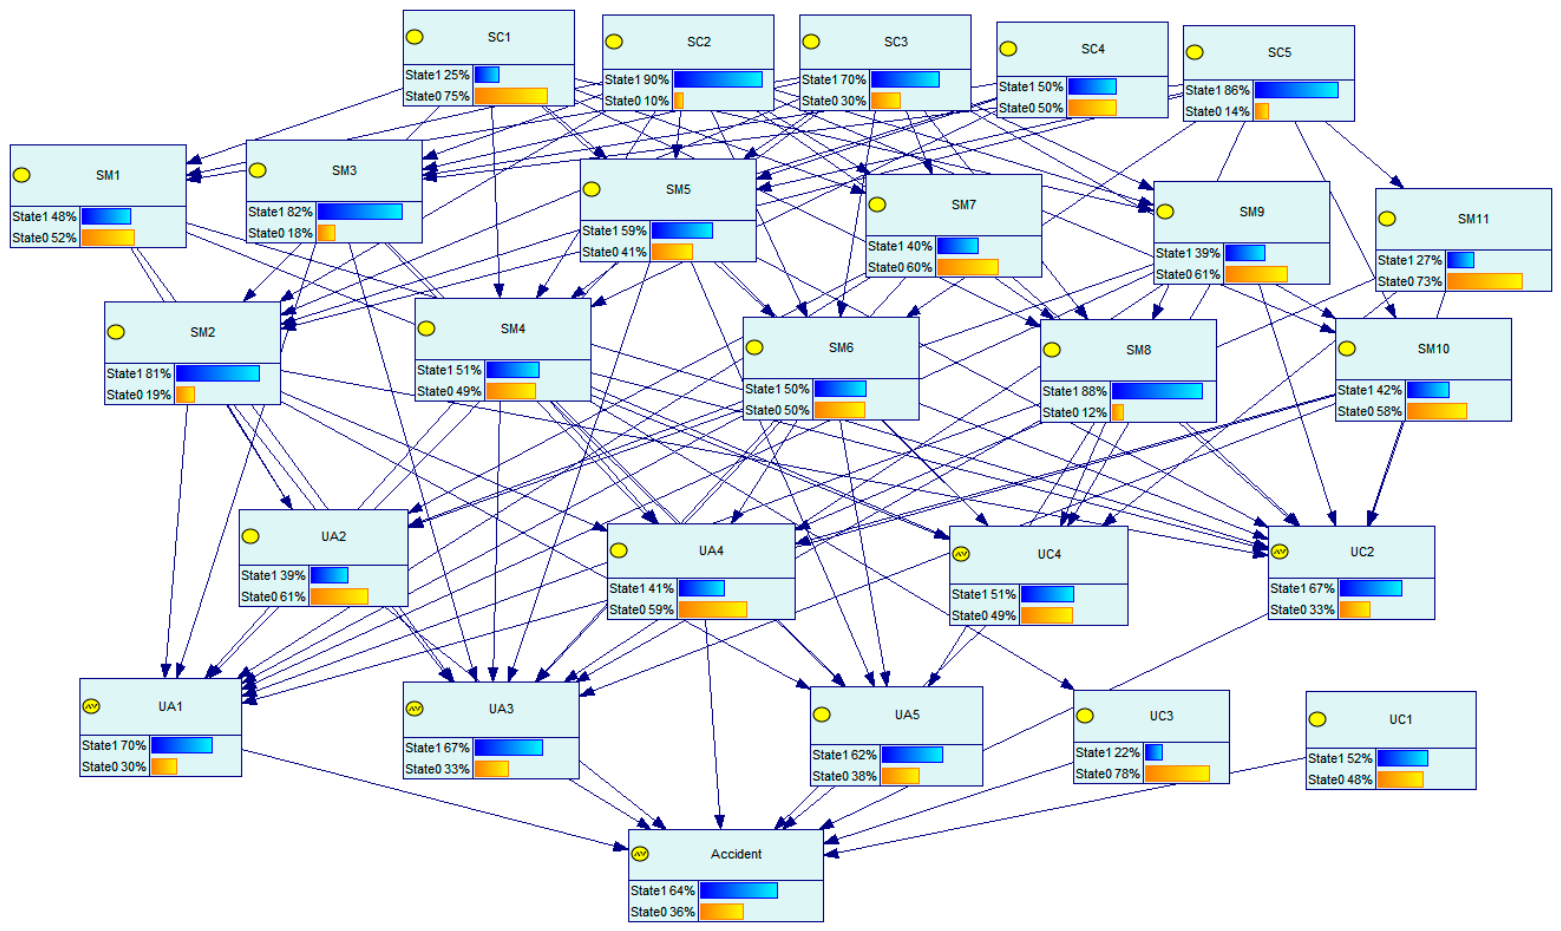
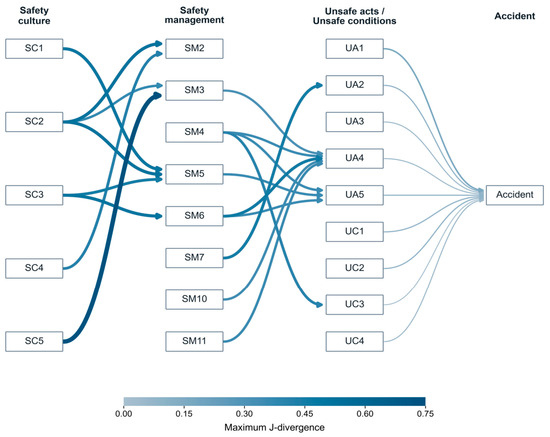
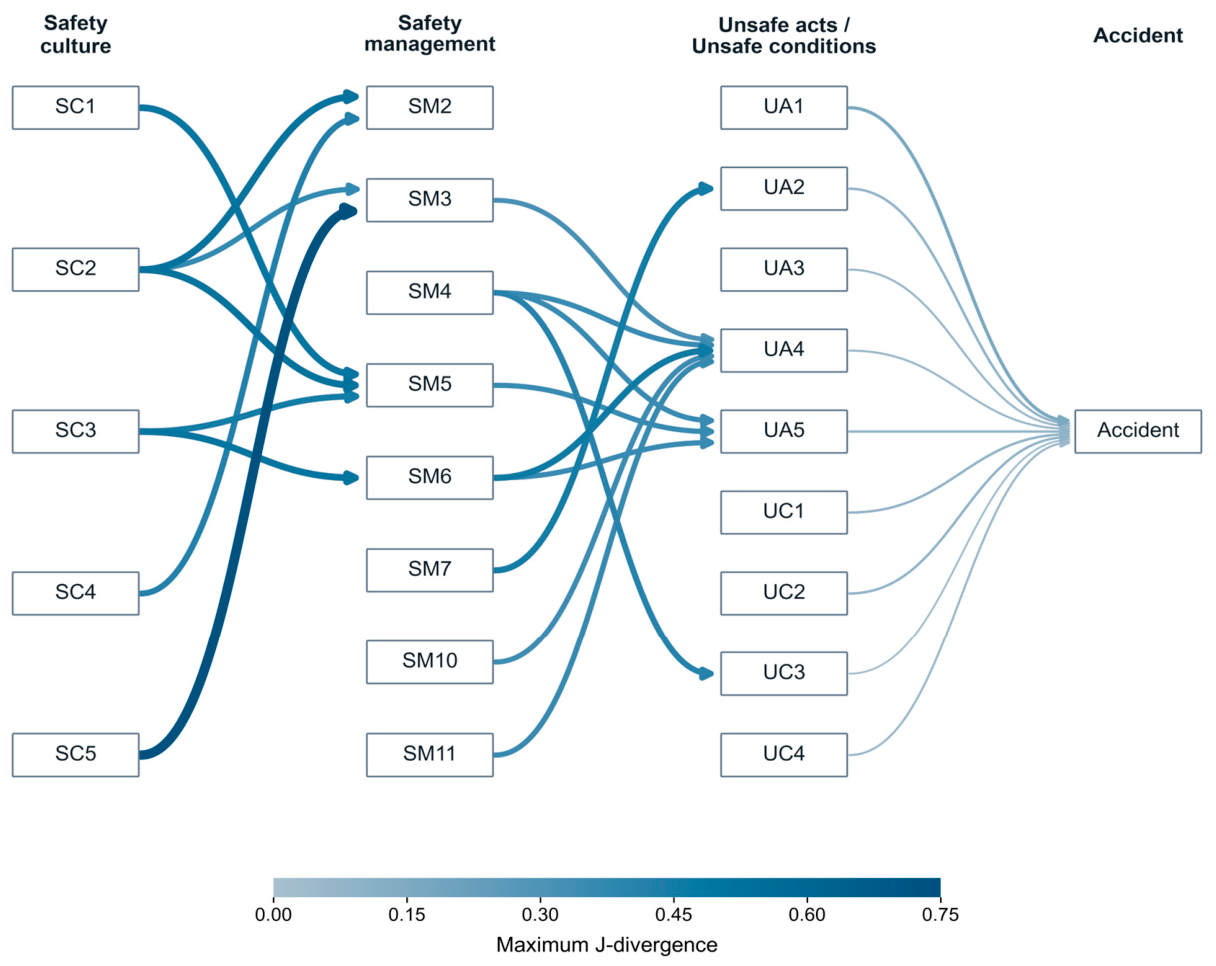
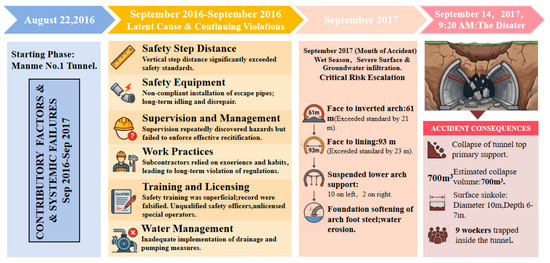
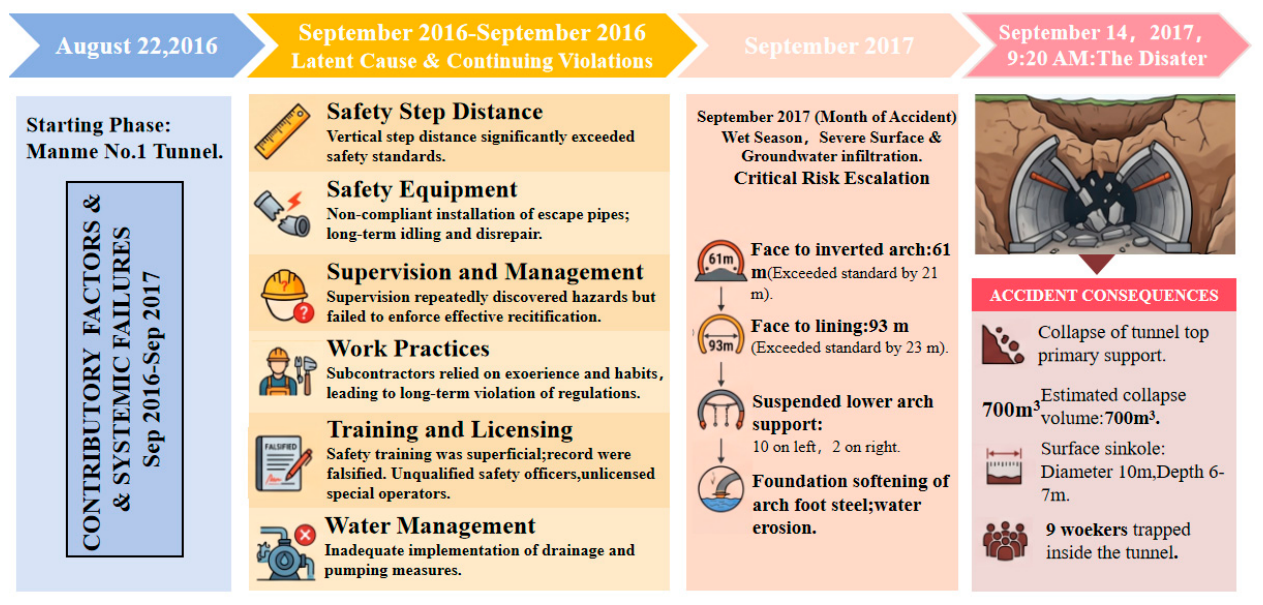
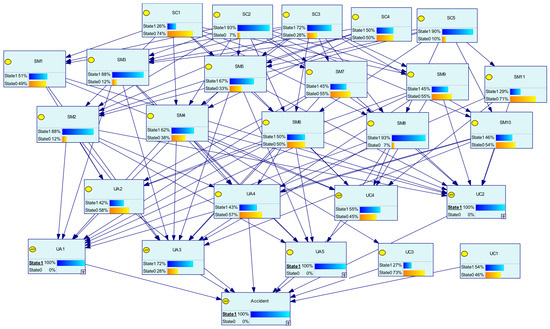
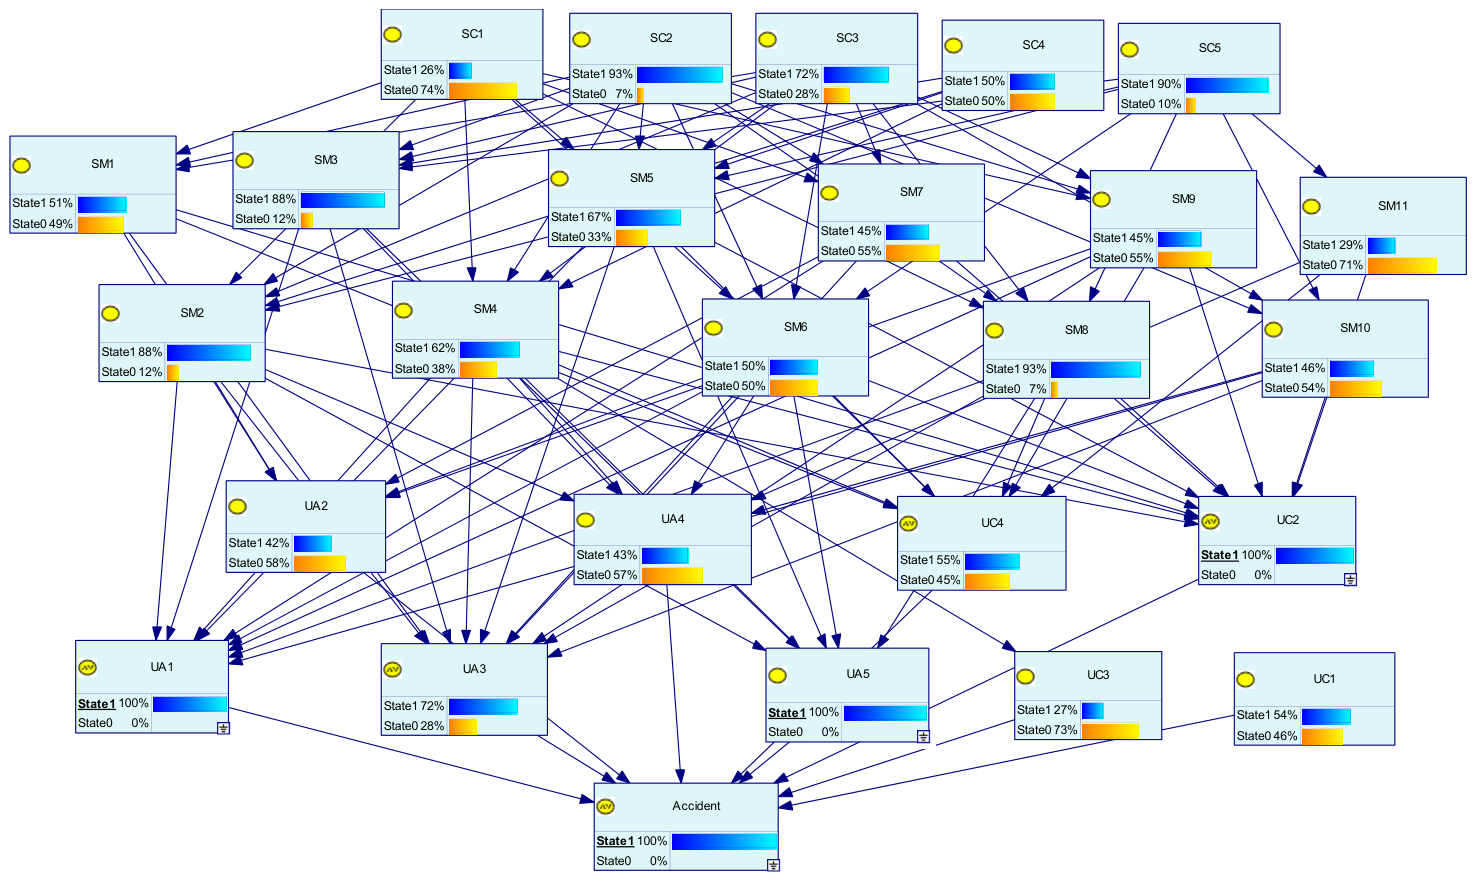

Disclaimer/Publisher’s Note: The statements, opinions and data contained in all publications are solely those of the individual author(s) and contributor(s) and not of MDPI and/or the editor(s). MDPI and/or the editor(s) disclaim responsibility for any injury to people or property resulting from any ideas, methods, instructions or products referred to in the content. |
© 2026 by the authors. Licensee MDPI, Basel, Switzerland. This article is an open access article distributed under the terms and conditions of the Creative Commons Attribution (CC BY) license.