


Abstract
The second generation of Eurocode 8 (EC8-1-2) introduced revised design rules for dissipative concentrically braced frames (CBFs). This paper investigates the seismic response of low- and medium-rise X-CBFs designed according to EC8-1-2 to provide an evaluation of the effectiveness of the code design provisions. Three- and six-story frames were designed for different seismic action intensities in medium- (DC2) and high-dissipative (DC3) ductility classes. Their lateral response was evaluated through nonlinear static analyses performed on global numerical models. The capacity curves were derived to determine the target displacements at the Damage Limitation (DL), Significant Damage (SD), and Near Collapse (NC) limit states. The calculated behavior factor components were consistent with the corresponding EC8 q-values. The frames developed the intended dissipative mechanism, with braces buckling in compression and yielding in tension at both SD and NC limit states. Moreover, braces in DC3-compliant frames exhibited incipient buckling at the DL limit state. Capacity design prevented yielding of beams and columns. Despite adequate cross-sectional resistance, the EC3 member stability checks were generally not satisfied for first-story columns in both ductility classes. In DC3, peak column moments exceeded the design value, although their distributions were less severe than the uniform shape assumed in the design. The EC8-1-2 design rules provided satisfactory system-level responses, while the column stability verifications were not consistently satisfied.
1. Introduction
Steel concentrically braced frames (CBFs) are widely used as seismic force-resisting systems due to their high lateral stiffness, resistance, and energy dissipation capacity. In dissipative CBFs, the diagonal braces are designed to yield in tension and buckle in compression under severe seismic actions, whereas beams, columns, and connections should remain essentially elastic. However, several studies have shown that the first generation of Eurocode 8 (EC8) [1] did not consistently promote the intended dissipative response or a uniform engagement of the dissipative members along the building height. Different design methods were developed and proposed to overcome the criticisms of dissipative CBFs designed in accordance with the first generation of EC8. Marino and Nakashima [2] proposed a design procedure in which brace sizing is based on the combined resistance of the tension and compression diagonals. The procedure led to a satisfactory response without increasing brace sizes relative to the conventional EC8 design. Longo et al. [3] proposed a plastic-design procedure aimed at enforcing a global collapse mechanism and preventing premature column buckling. Bosco et al. [4] introduced the Ω* method to reduce unnecessary global overstrength associated with EC8 design rules while preserving a satisfactory inelastic response. Previous studies [5] confirmed that first-generation EC8 provisions could lead to poor energy dissipation and non-uniform plastic engagement of braces and, in particular, that controlling story-to-story variation in brace tensile overstrength alone did not ensure a uniform distribution of inelastic demand.
Several studies have shown that column seismic demand remains one of the most critical aspects for the design of dissipative CBFs. For chevron CBFs, Barbagallo et al. [6] found that EC8 capacity-design rules may underestimate column bending moments and proposed a procedure accounting for combined axial and flexural demand. Mahmoudi and Imanpour [7] showed that column moment demand depends on brace configuration, member sizing, and drift concentration, and developed system-specific expressions for chevron and split-X CBFs. More recently, Gnazzo et al. [8] showed that both the magnitude and the distribution of column bending moments depend on beam-to-column joint rigidity and seismic-action intensity.
The second generation of EC8 introduced revised rules for dissipative CBFs to address these concerns and improve the protection of non-dissipative members. Nevertheless, recent studies indicate that column stability may remain critical [9,10]. In light of the review of the state of the art, the lateral response of X-CBFs compliant with the second generation of EC8 has not yet been systematically compared across different ductility classes, building heights, seismic-action levels, and lateral-load distributions. This study assesses the EC8-2nd gen X-CBFs designed in medium-dissipative (DC2) and high-dissipative (DC3) classes. The results of this work provide a systematic evaluation of the EC8 design rules in terms of demand parameters on the overall seismic force-resisting system and structural members. The lateral response was evaluated through nonlinear static analyses using both first-mode and mass-proportional lateral-load distributions. The pushover curves were used to evaluate the components of the behavior factor, q, and to determine the roof target displacement at the Damage Limitation (DL), Significant Damage (SD), and Near Collapse (NC) limit states. At each target displacement, the lateral response of the CBF was examined in terms of interstory drift ratios, brace ductility demand, resistance and stability of beams and columns, and column flexural demand. The results show that the EC8 design provisions allow achieving the intended dissipative response and preventing yielding in the capacity-protected members. Nevertheless, the EC3 member stability verifications under combined axial compression and bending were not satisfied for several lower-story columns, indicating the need for further investigation and potential refinements to the column design rules.
2. EC8-1-2 Design Rules for Dissipative CBFs
2.1. Behavior Factors
This section briefly recalls the EC8 provisions for designing dissipative cross concentrically braced frames (X-CBFs). The general seismic design requirements are provided in EN 1998-1-1 (EC8-1-1) [11], whereas the material- and system-specific provisions for steel structures are given in EN 1998-1-2 (EC8-1-2) [12].
Eurocode 8 permits the evaluation of the seismic action effects on structures through linear elastic analyses using a design response spectrum. The ordinates of the elastic response spectrum are thereby reduced by the behavior factor, q, which is defined in EC8 as follows:
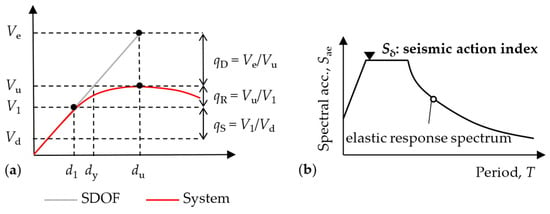
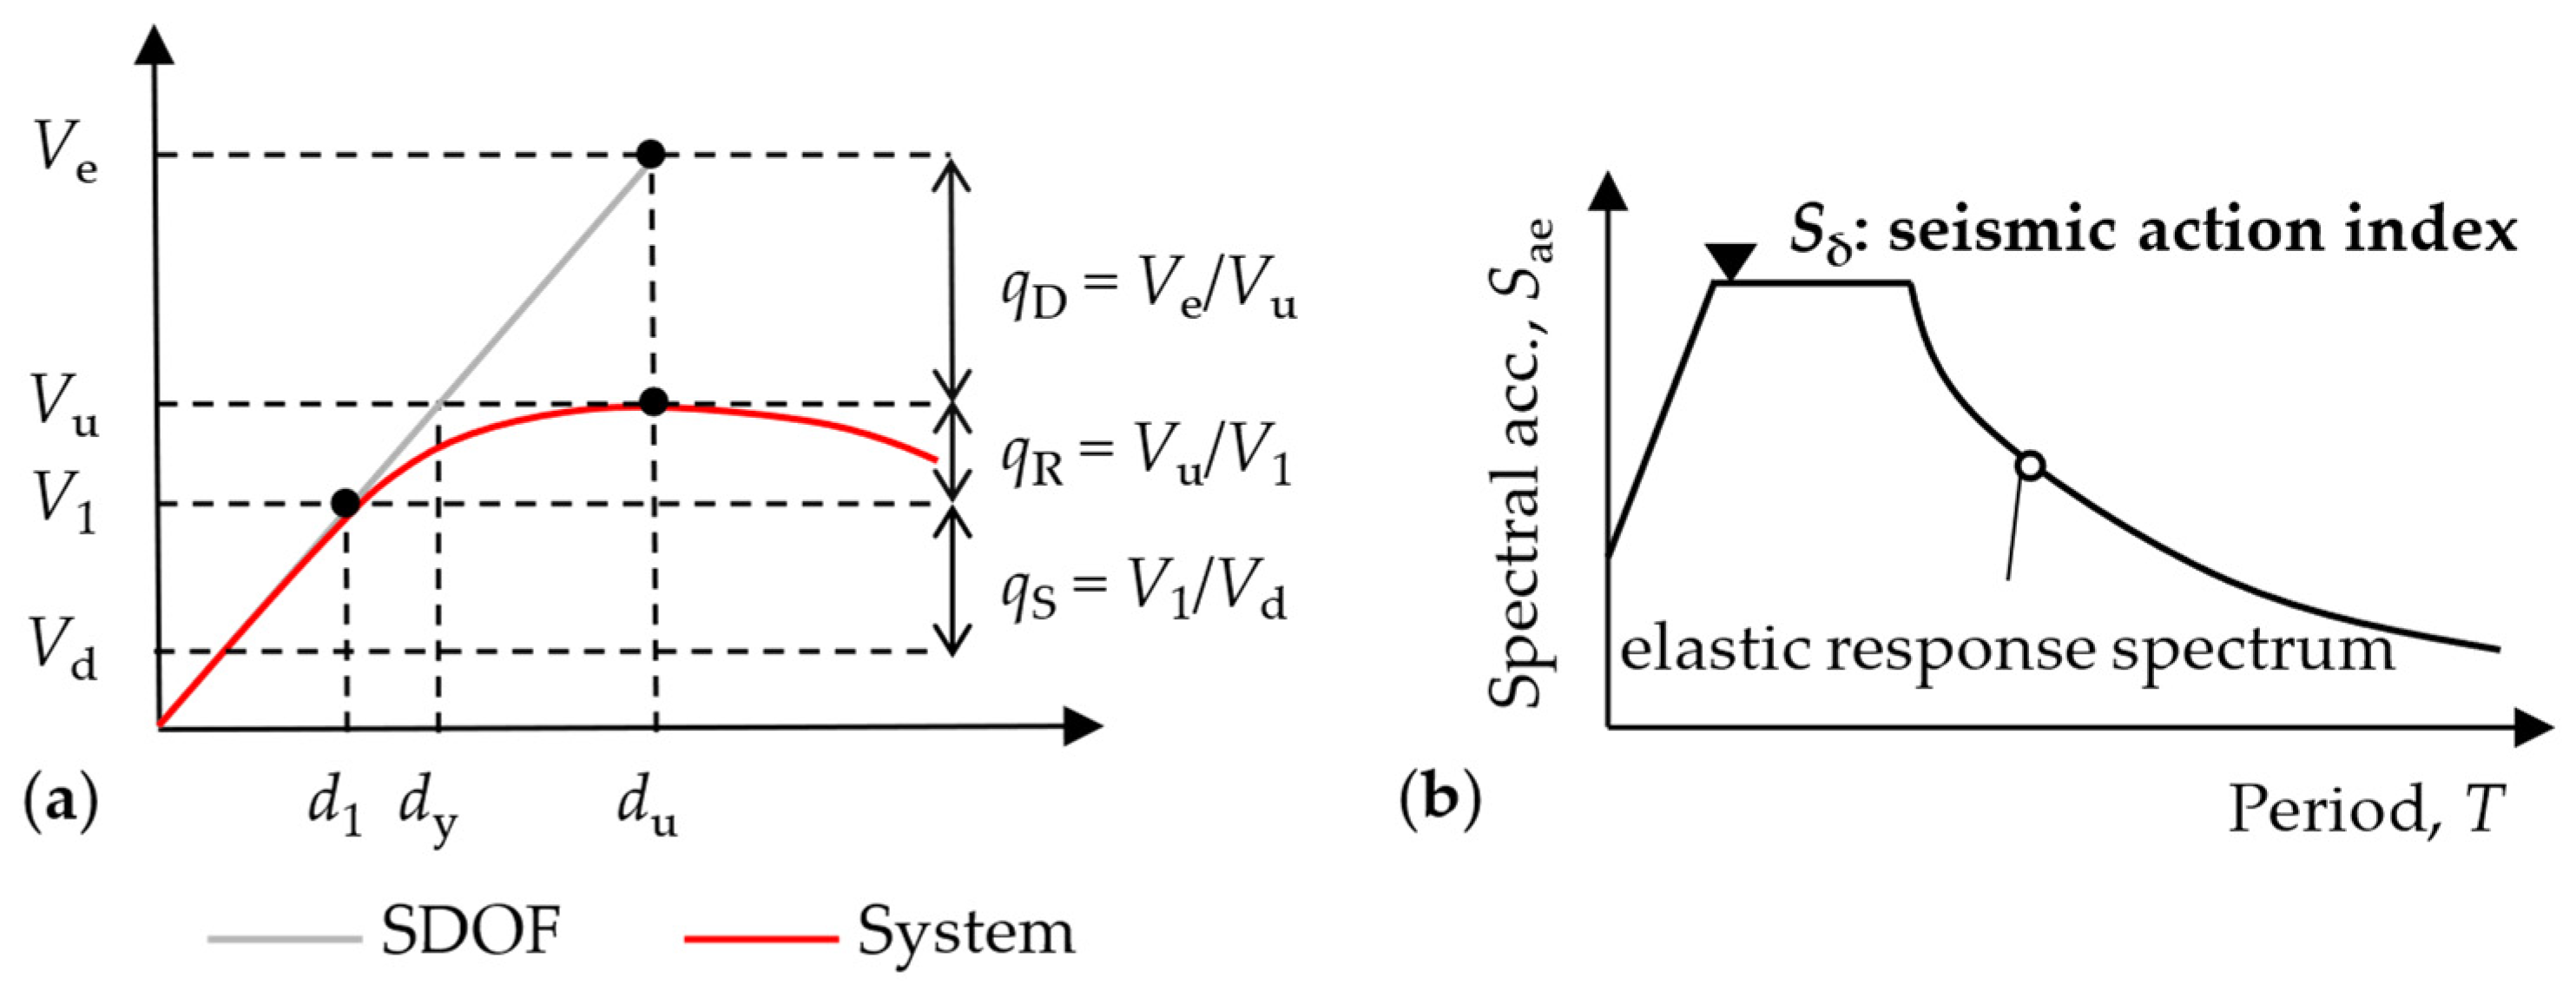
where qS accounts for the system design overstrength before the activation of the dissipative mechanism, qR takes into account the structural redundancy, and qD accounts for the energy dissipation capacity. Figure 1a compares the lateral response of a structure and its equivalent linear elastic single-degree-of-freedom (SDOF) system assuming that the equal displacement rule applies [13]. The qS component of the behavior factor can be calculated as V1/Vd, where V1 is the base shear corresponding to the attainment of the first nonlinear event, while Vd is the design base shear. The qR component can be defined as Vu/V1, where Vu is the maximum base shear on the pushover curve. Finally, qD can be calculated as the ratio Ve/Vu, where Ve corresponds to the base shear of the equivalent SDOF system evaluated for the displacement du.
q = qS qR qD
Figure 1.
Definition of (a) EC8 behavior factor and (b) seismic action index.
The applicability of different ductility classes in EC8-1-2 also depends on the intensity of the design seismic action. This is quantified by the seismic action index, Sδ, that corresponds to the pseudo-acceleration value on the plateau of the elastic response spectrum, as illustrated in Figure 1b.
For CBFs in DC2 that satisfy the EC8 regularity requirements, EC8-1-2 specifies qS = 1.5, qR = 1.0, and qD = 1.7, corresponding to an upper-limit behavior factor q = 2.5. Moreover, because of its simplified capacity-design requirements, DC2 is limited to Sδ = 6.5 m/s2 for CBFs. For regular DC3 CBFs, the prescribed q-factor components are qS = 1.5, qR = 1.1, and qD = 2.4, resulting in an upper-limit behavior factor q = 4.0. EC8-1-2 provides no limitation on Sδ for DC3, since the rigorous capacity-design requirements are intended to provide a stable global dissipative mechanism.
2.2. Design of Braces
EC8-1-2 requires modeling the brace both in tension and compression to evaluate the seismic effects on structural members and components. Regardless of the ductility class, the structural model explicitly considers both tensile and compressive diagonals, and the brace buckling resistance, Nb,Rd,br, must exceed the corresponding axial force, NEd,br, obtained from the seismic design combination. The requirements governing cross-section classification and member slenderness depend on the selected ductility class. DC2 permits class 1 and class 2 cross-sections and requires a non-dimensional brace slenderness below 2.5 to limit cyclic response degradation.
DC3 adopts a lower non-dimensional slenderness limit of 2.0 and restricts brace cross-sections to class 1. Additional local slenderness requirements apply to circular, rectangular, and square hollow sections to limit their susceptibility to fracture under repeated inelastic loading. DC3 also controls the variation in brace buckling overstrength between stories. EC8-1-2 stipulates that, with the exception of the top story, the i-th story buckling overstrength ratio, Ωb,i = Nb,Rd,br,i/NEd,br,i, should not exceed 1.25 Ωb, where Ωb is the minimum buckling overstrength ratio of the dissipative braces along the building height. For DC3 frames, top-story braces may be excluded from the set of dissipative bracings, provided that they are designed to remain elastic under the design seismic action.
2.3. Design of Beams and Columns
Beams and columns are designed as non-dissipative members and should remain essentially elastic while the braces develop the intended dissipative mechanism. EC8-1-2 provides simplified capacity design rules for DC2 CBFs. The seismic axial force in beams and columns is amplified by a seismic overstrength factor, Ω, equal to 1.5 for CBFs, whereas bending moments and shear forces are obtained directly from the seismic design combination.
Beams and columns in DC3 are designed on the basis of the following conditions:
- The most severe combination of axial force, shear force and bending moment in the seismic design combination, where each seismic design effect is amplified by the product of ωrm ωsh Ωd, being ωrm and ωsh the material overstrength and strain-hardening coefficients of the dissipative zones, and Ωd = min(Npl,Rd,br,i/NEd,br,i) is the minimum overstrength ratio of braces in tension along the building height;
- The internal forces obtained considering a free-body distribution of axial forces in the braces equal to their expected buckling resistance;
- The internal forces obtained considering the expected tensile resistance in the braces in tension and the expected post-buckling resistance for the braces in compression.
For column design under the plastic mechanism condition, EC8-1-2 additionally requires an in-plane uniform bending moment of 0.20 Mpl,col, where Mpl,col is the plastic moment resistance of the gross column cross-section.
3. Parametric Study
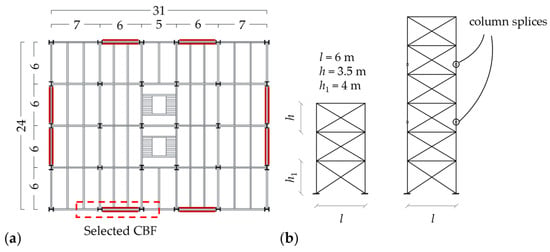
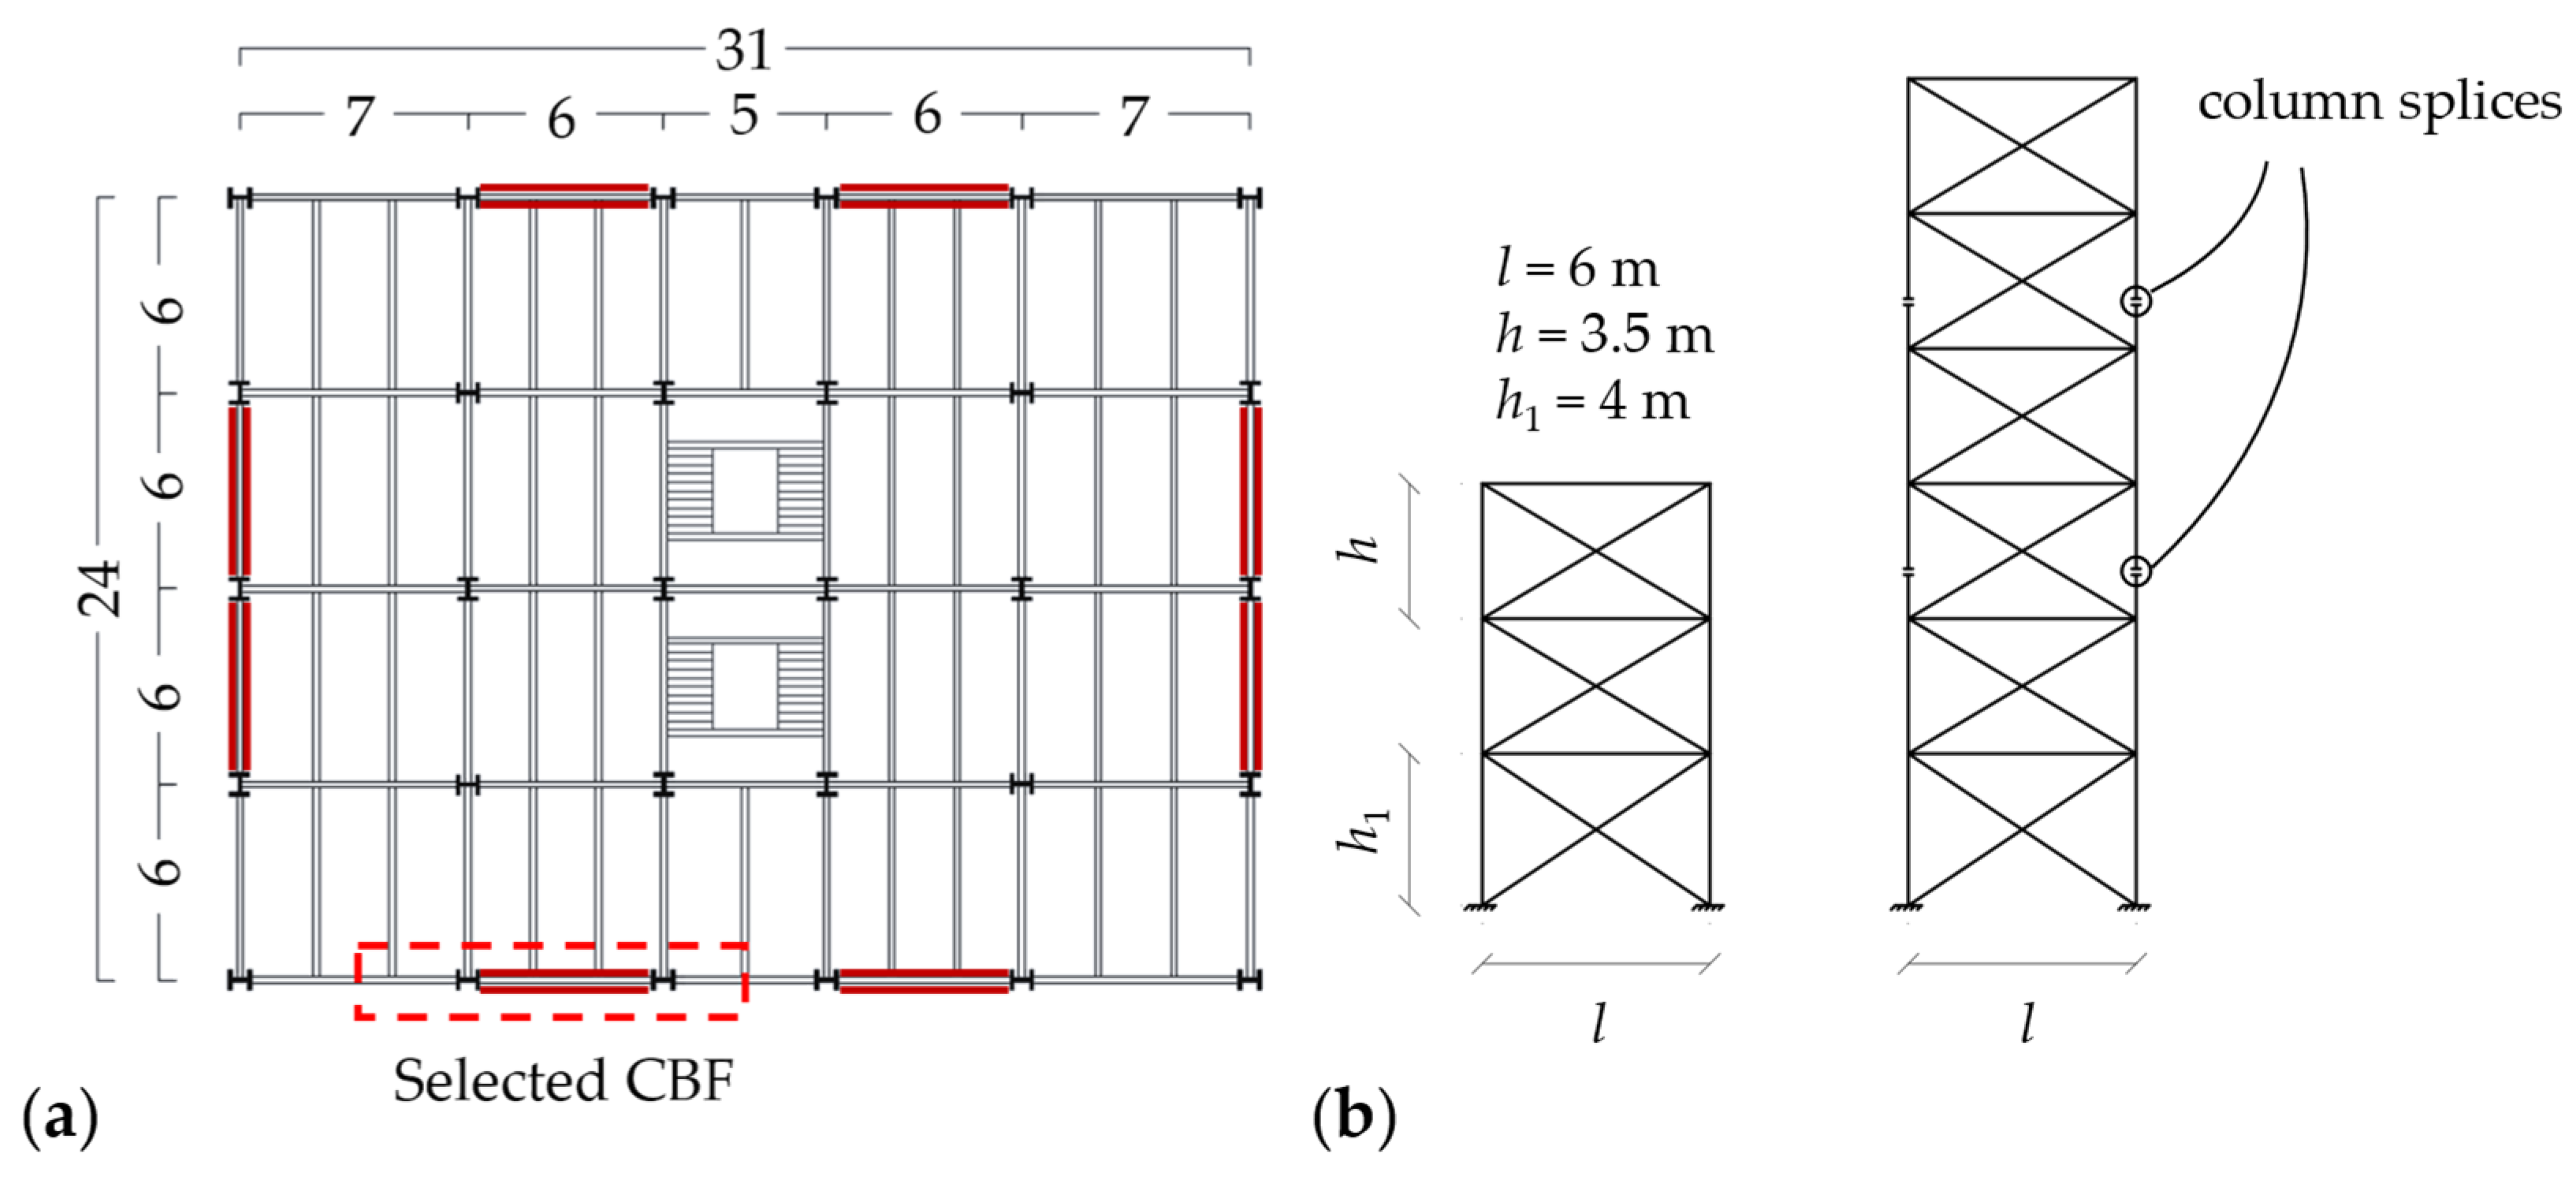
The plan layout of the building considered as the structural archetype and the vertical configurations of the selected frames are depicted in Figure 2. The lateral load-resisting system consists of four perimetral X-CBFs in each horizontal direction of the building plan. The parametric study considered three- and six-story buildings to examine the effectiveness of the EC8-1-2 design rules for low- and medium-rise braced frames. The interstory height is 3.50 m, except for the first story, which is 4.00 m, while the span length of the braced bay is 6.00 m. Dead (Gk) and live (Qk) loads were assumed equal to 4.7 kN/m2 and 3.0 kN/m2 for the intermediate stories, and 1.4 kN/m2 and 1.0 kN/m2 for the roof, respectively. This study selected three seismicity levels, identified by the seismic action index Sδ: 5.0 m/s2, 6.5 m/s2, and 7.5 m/s2. For each design scenario, the CBF ductility class was appropriately selected in accordance with the applicability limits of the EC8-1-2 design provisions. In particular, for the first design scenario corresponding to Sδ = 5.0 m/s2, the selected CBFs were designed in DC2. DC3 was not considered in this first design scenario, as it would result in an uneconomical design for this seismicity level. In the second design scenario, corresponding to Sδ = 6.5 m/s2, frames were designed in DC2 and DC3 alternatively, as this seismicity level represents the EC8-1-2 upper bound for the design of DC2 CBFs and therefore provides a meaningful basis for comparing the two ductility levels. These frames were previously designed by the Authors in [14], where initial findings on the CBF nonlinear response were discussed. Finally, only the DC3 design provisions were adopted for the frame design for Sδ = 7.5 m/s2, since this seismic level exceeds the applicability range of DC2.
Figure 2.
(a) Building plan layout and (b) vertical configurations of the three- and six-story X-CBFs.
The gravity load-resisting members were designed according to Eurocode 3 Part 1-1 (EC3-1-1) [15], while the seismic design of the CBFs was carried out according to the relevant EC8-1-1 and EC8-1-2 design provisions. The seismic load on the examined CBF was computed on a three-dimensional (3D) model by means of a response spectrum analysis. The design seismic effects on the structure were evaluated using a “tension-compression” model of the braces; the buckling length of the braces was computed by taking into account the dimensions of the gusset plates and brace end connections. To this end, gusset plates with linear clearance were detailed in accordance with Annex E of EC8-1-2 to accommodate out-of-plane flexural buckling of the brace. Cold-formed circular hollow sections (CHS) were adopted for braces, while IPE and HE profiles were used for beams and columns, respectively. S355 steel with a nominal yield strength of 355 MPa was assumed for all structural members. The selected member sizes are given in Table 1.
Table 1.
Member cross-sections of the designed three- and six-story X-CBFs.
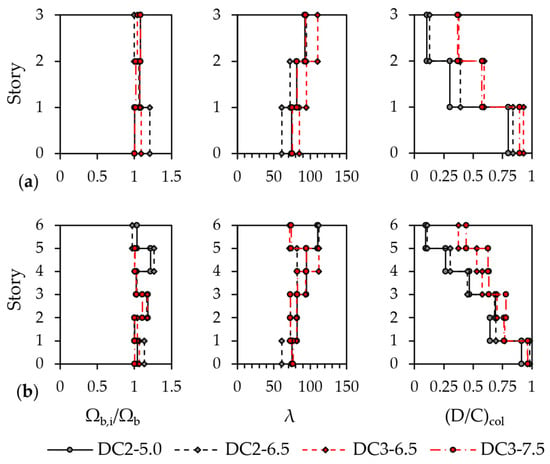
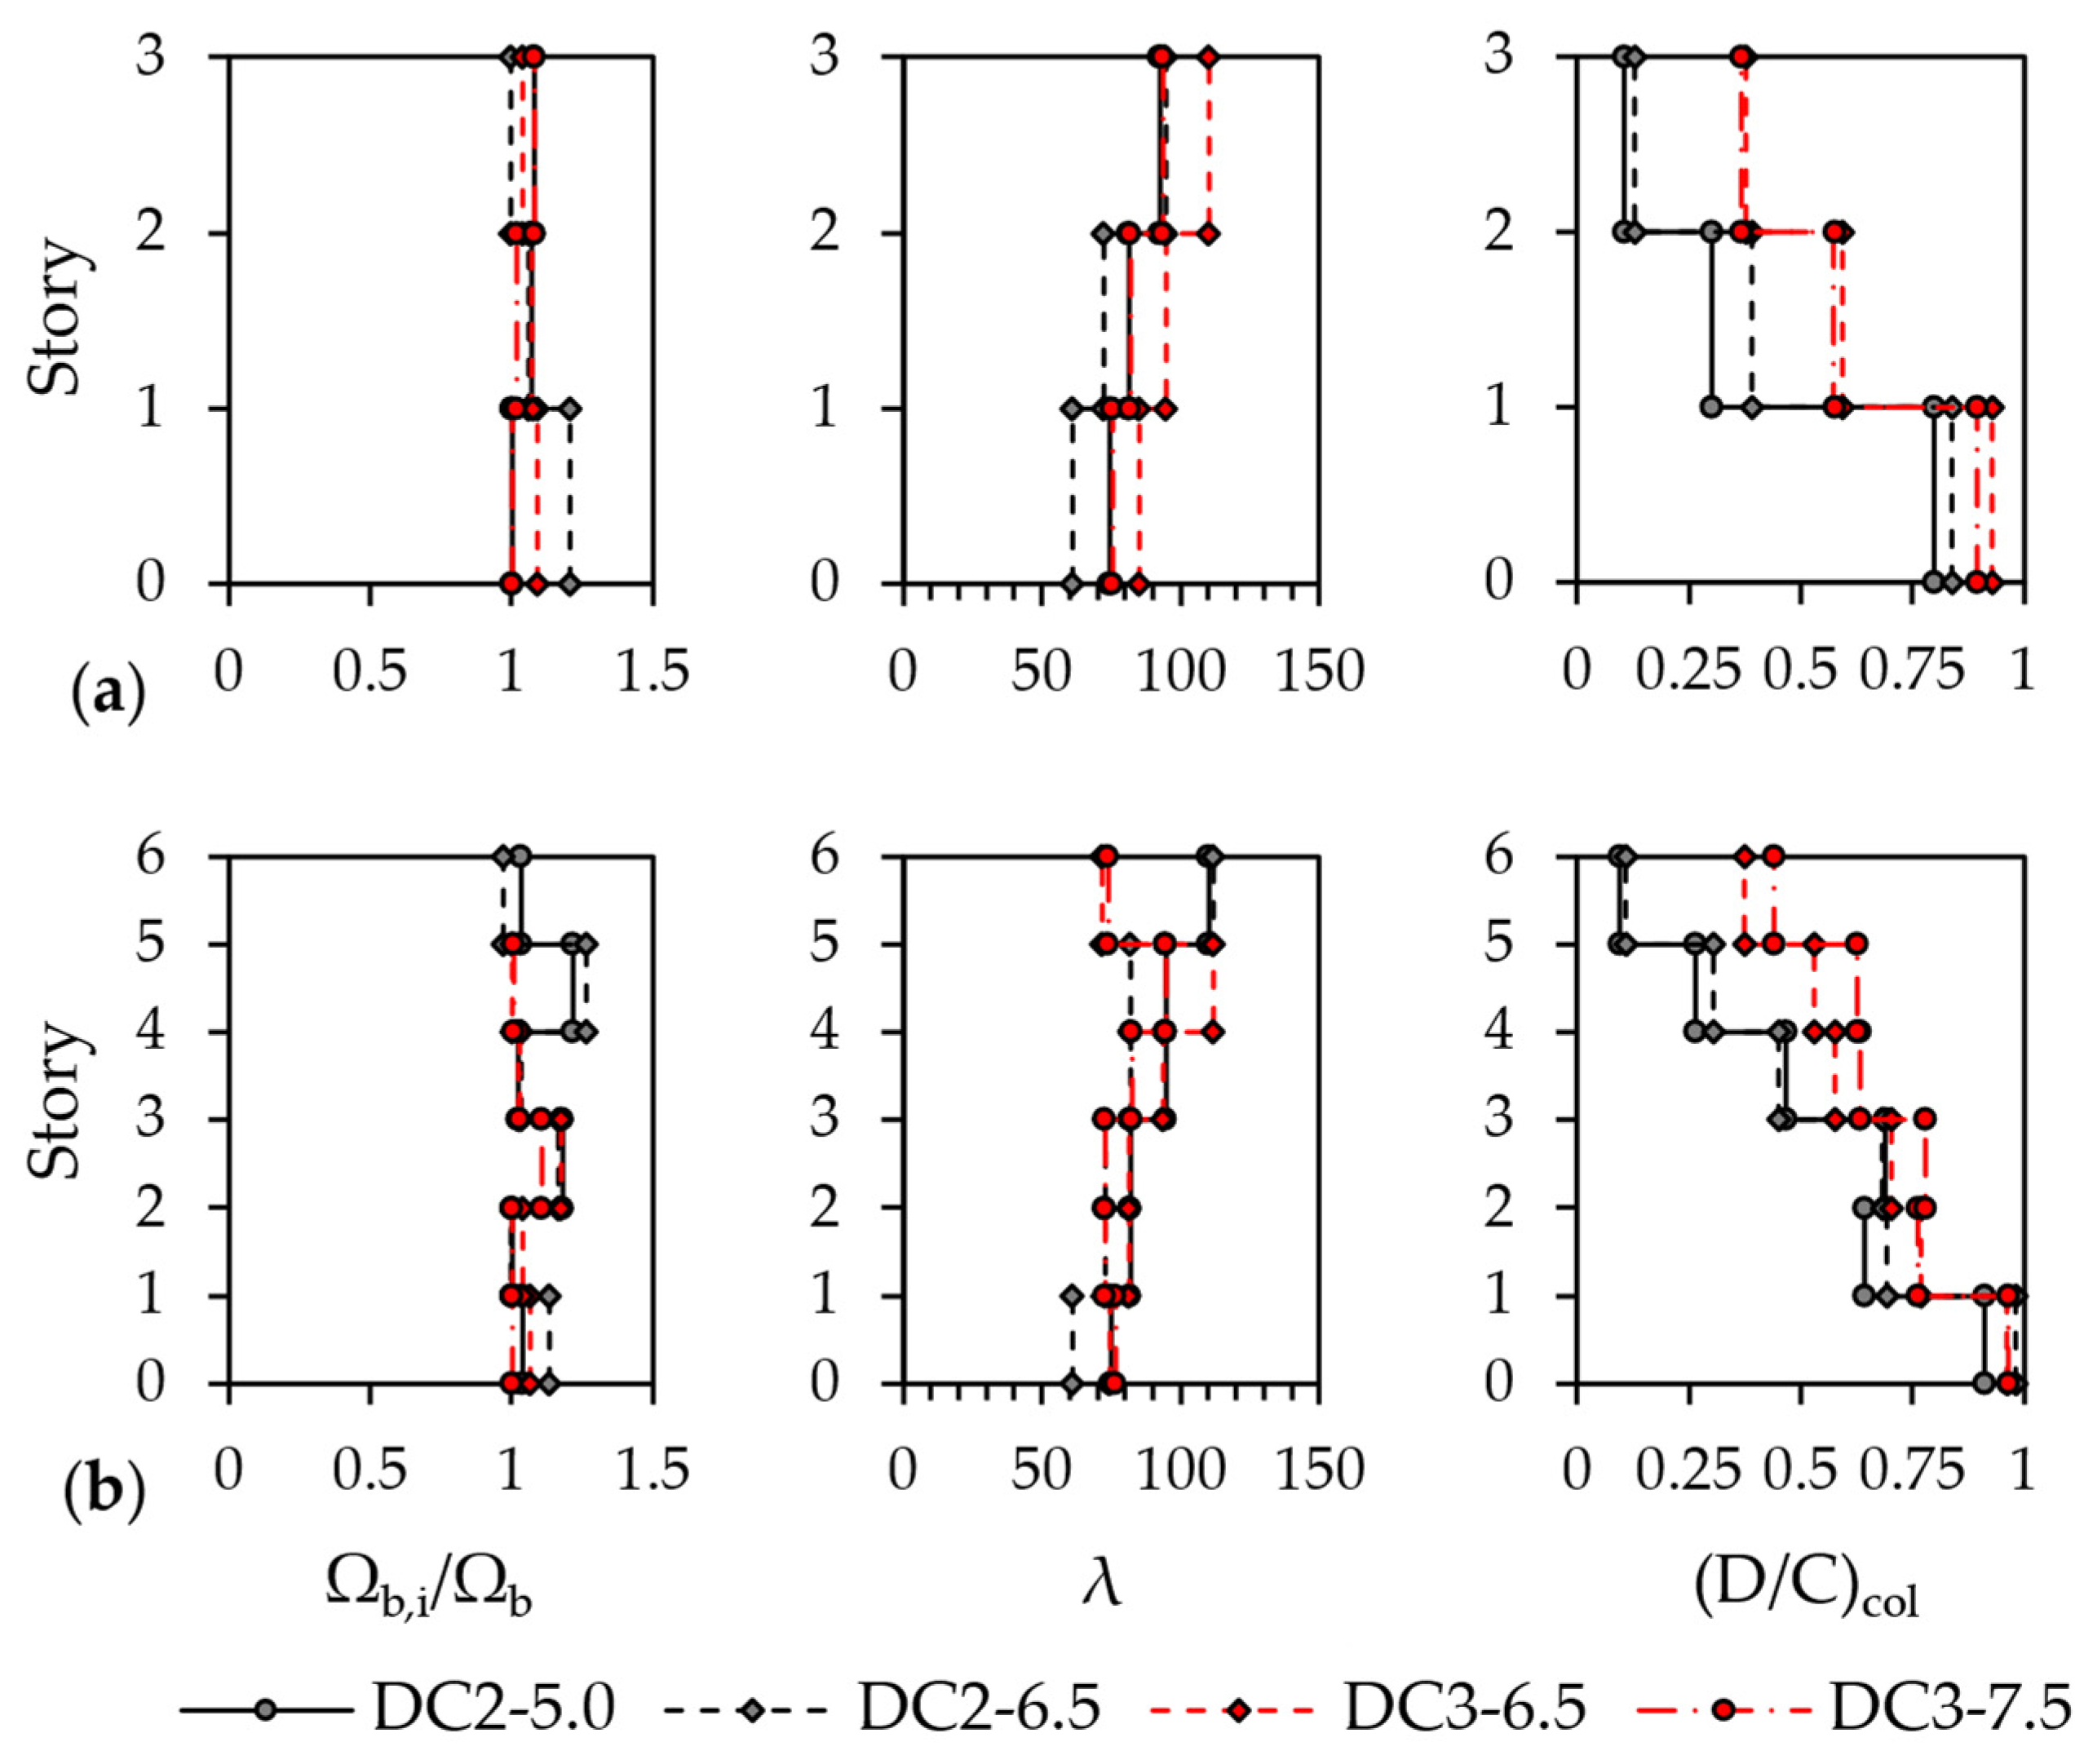
Class 1 cross-sections compliant with the more stringent EC8-1-2 diameter-to-thickness limits were adopted for DC3 braces, whereas Class 1 and Class 2 sections were used in DC2. The selected beam and column cross-sections were Class 1 or Class 2 under the relevant combinations of axial force and bending moment. Regardless of ductility class, beam design of braced frames was governed by ultimate limit state (ULS) resistance and serviceability limit state (SLS) checks under gravity loads. Consequently, beam sections and governing design utilization ratios were identical for floors with the same gravity loading conditions. Figure 3 summarizes the design outcomes in terms of brace buckling overstrength ratios, Ωb,i/Ωb, brace geometric slenderness, λ, and column design utilization ratios, (D/C)col. DC3 frames exhibited uniform Ωb,i/Ωb distributions along the building height, with values not exceeding the EC8-1-2 limit of 1.25. Although no similar requirement is prescribed for DC2, the corresponding distributions were also reasonably uniform, with values generally lower than 1.25. The Ωb,i/Ωb values at the roof for the six-story DC3 frames are omitted because these braces were excluded from the set of dissipative members and designed to remain elastic. The brace geometric slenderness, calculated as λ = Lcr/r, where Lcr is the buckling length and r is the radius of gyration about the buckling axis, ranged approximately between 60 and 120. DC3 braces were generally more slender than those in DC2, regardless of the seismic design intensity. The only exception is the roof story of the six-story frames, where DC3 braces were generally stockier because of their design for elastic behavior. The column design utilization ratios, (D/C)col, were determined from the flexural and flexural-torsional stability checks that governed the design. The largest values occurred at the base, with peak ratios close to 1, and generally reduced with height as the axial force demand decreased. In the six-story frames, column section selection also reflected constructability considerations at column-to-column splices. Indeed, abrupt changes in section dimensions were avoided to simplify splice detailing and limit additional fabrication requirements [16], otherwise resulting in uneconomical designs.
Figure 3.
Brace buckling overstrength ratios, Ωb,i/Ωb, brace geometric slenderness, λ, and column design utilization ratios, (D/C)col: (a) three-story and (b) six-story frames.
3.1. Modeling and Analysis Assumptions
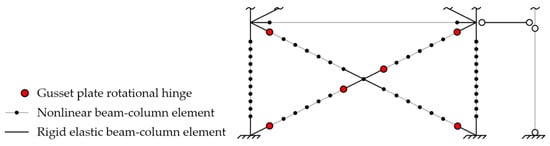
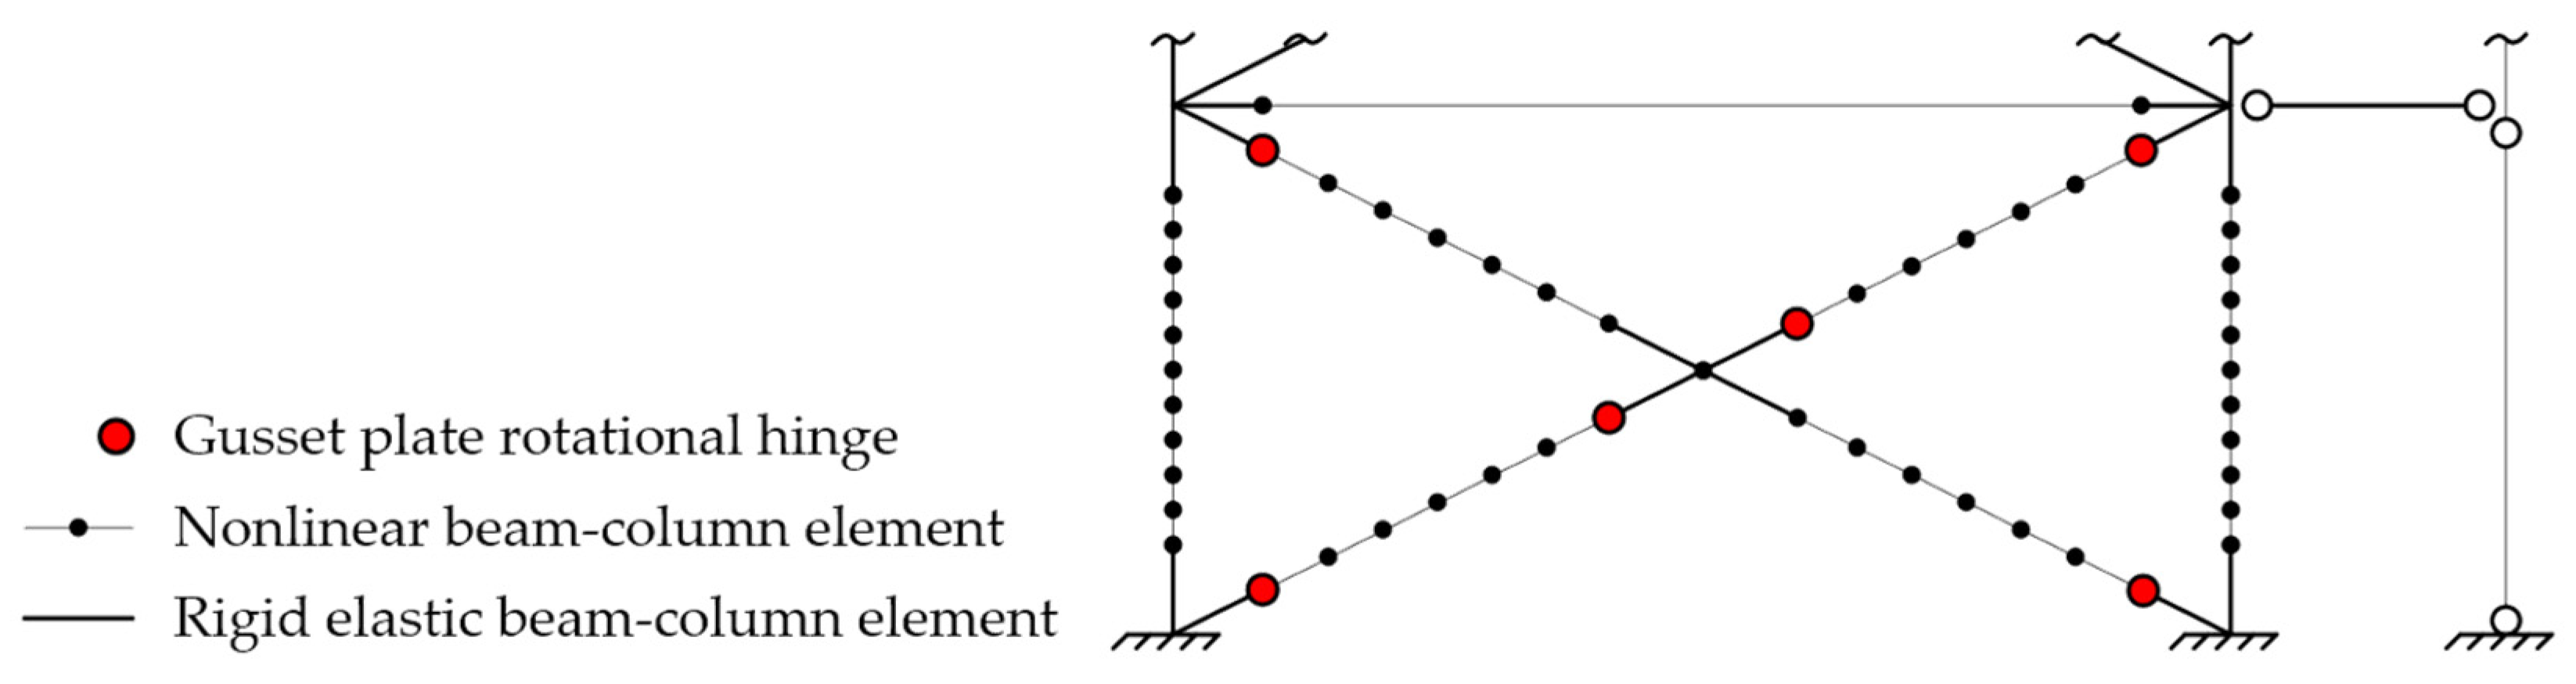
The lateral response was evaluated using three-dimensional (3D) planar numerical models developed in OpenSees [17] as depicted in Figure 4. Braces, beams, and columns were modeled using a distributed-plasticity formulation, with force-based nonlinear beam-column elements [18] and fiber-discretized cross-sections, using five Gauss-Lobatto integration points for each element. Each brace was discretized into six sub-elements, and an initial sinusoidal out-of-plane imperfection with a maximum amplitude of L/1000 was assigned, where L is the brace effective length. A co-rotational formulation was adopted to account for the geometric nonlinearity at the member level. This modeling approach has been shown to accurately simulate the nonlinear response of braces [19]. Each column was discretized into ten sub-elements, and an initial sinusoidal out-of-plane imperfection with a maximum amplitude equal to L/1000 was assigned to capture the potential development of global flexural buckling under combined axial force and bending moment actions [20]. It is worth noting that the adopted beam-column formulation can simulate global flexural buckling but does not account for cross-section warping and therefore does not capture combined flexural-torsional buckling phenomena. Column bases were modeled as fixed, while the out-of-plane displacements of the beam nodes were restrained to represent the continuous lateral support provided by the floor system. The cyclic stress–strain response of steel was represented using the Steel02 uniaxial material model. A Young’s modulus of 210 GPa and an expected steel yield strength ωrmfy = 444 MPa were assigned to the fiber cross-sections. The strain-hardening, transition, and isotropic-hardening parameters were calibrated according to [21]. The out-of-plane flexural response of the gusset plates was represented by nonlinear zero-length rotational springs located at the brace ends. Their moment-rotation properties were defined according to the model proposed in [22]. Relatively rigid beam-column elements were introduced at the ends of braces, beams, and columns to account for the stiffening effect provided by the gusset plate and its connections. These links were modeled using elastic beam-column elements, whose geometric properties were based on an equivalent composite section including the adjoining member and the gusset plate. In accordance with previous studies [23], the beam-to-column joints were modeled as fully rigid moment-resisting connections because of the flexural continuity provided by the gusset plate and the gusset-to-column and gusset-to-beam connections [24]. The seismic masses tributary to the examined CBF were lumped at the top end of columns at each story. To simulate global P-Δ effects, gravity loads associated with the gravity system that was not explicitly modeled were applied to a leaning column with no horizontal stiffness. At each story, the horizontal displacement of the leaning column was coupled to the horizontal displacement of the frame through an equalDOF constraint. Gravity loads were applied through a load-controlled static analysis and held constant throughout the subsequent pushover analyses. These analyses were performed under displacement control at roof level, with the horizontal roof displacement monotonically increased until a target roof drift ratio of 10% was reached.
Figure 4.
Overview of the numerical model.
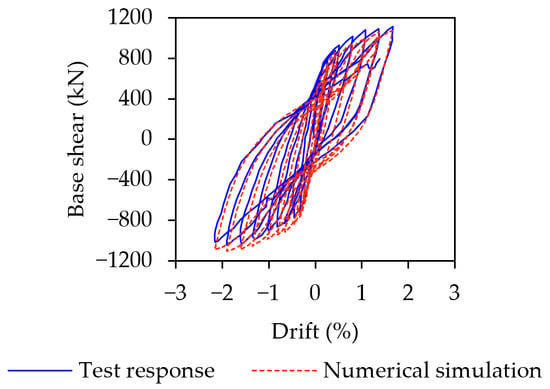
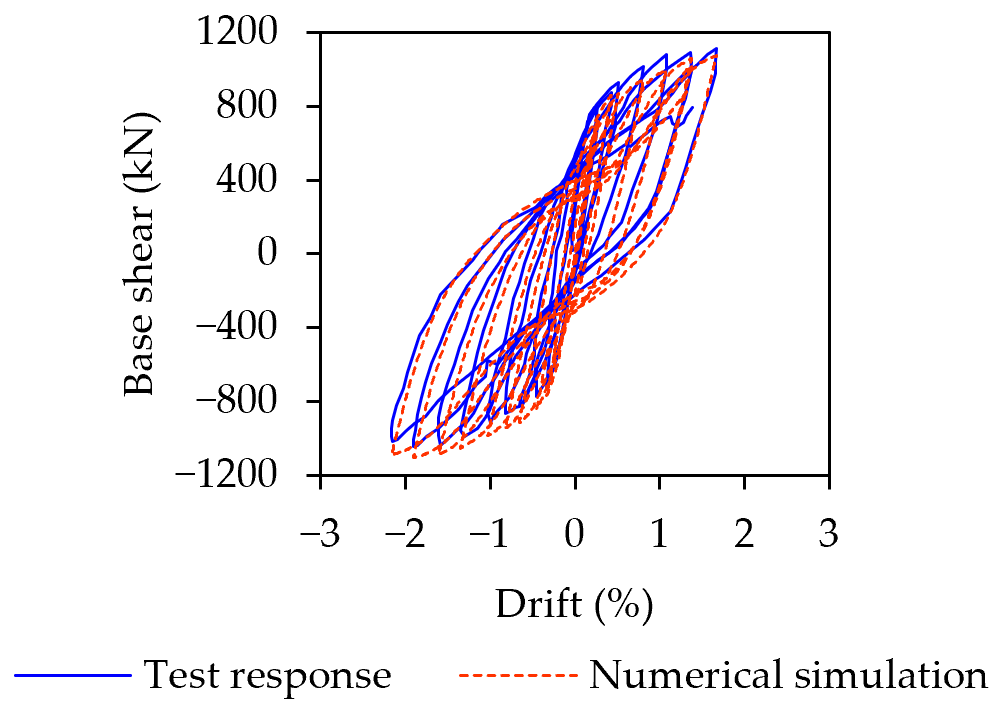
The modeling assumptions adopted to simulate the lateral response of the frames were validated against the experimental tests of a single-story X-CBF specimen reported in [25]. The comparison of the experimental and numerical results is given in Figure 5 in terms of base shear versus drift response. The model reproduced the lateral resistance in both loading directions and the overall shape of the hysteretic response, with minor discrepancies along the unloading and reloading branches. Overall, the comparison confirmed the validity of the adopted modeling strategy in reproducing the key features of the lateral response of the frames considered in this study.
Figure 5.
Comparison between the experimental test [25] and the simulated numerical response.
The seismic capacity was evaluated through nonlinear static analyses considering first-mode and mass-proportional lateral load distributions. For each analysis, the lateral response was represented by the relationship between the base shear, Vb, and the roof displacement, dr, of the CBF system. The roof displacement at collapse, dr,u, was evaluated as the minimum roof displacement corresponding to the attainment of one of the following conditions: (i) a 20% reduction in lateral resistance with respect to the peak base shear and (ii) a maximum interstory drift ratio, IDR, equal to 4%. The capacity curve of the equivalent single-degree-of-freedom (SDOF) system was derived from the CBF pushover curve following the method discussed in [13] and adopted by EC8-1-1. For each lateral load distribution, the SDOF equivalent mass, m*, and transformation factor, Γ, were calculated as:
where mi and Φi are the i-th story mass and normalized displacement of the considered mode shape. The force, F*, and displacement, d*, of the equivalent SDOF system were then calculated as:
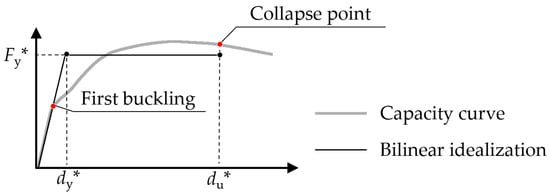
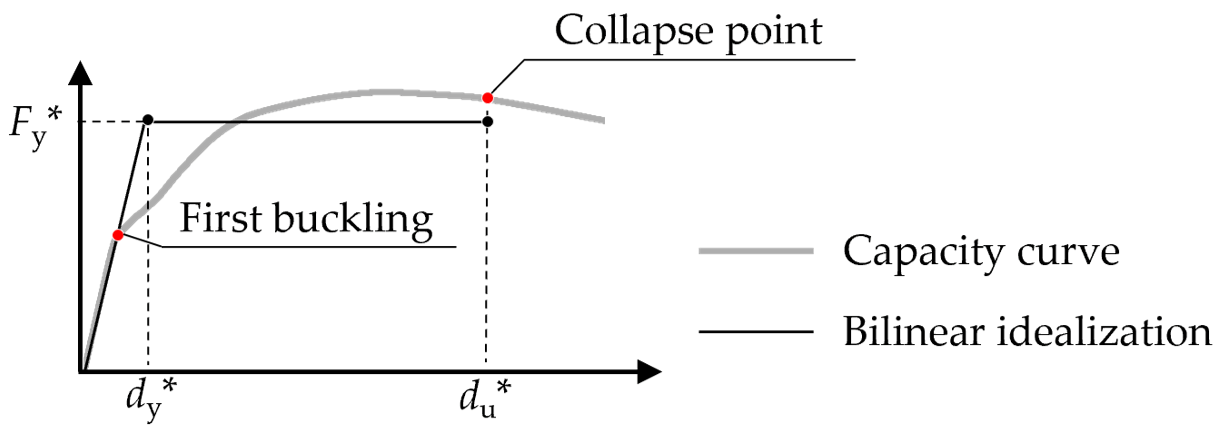
where Φr is the normalized roof displacement value of the considered mode shape. The F*-d* relationship of the equivalent SDOF was idealized adopting an elastic-perfectly plastic representation. An example of this procedure is depicted in Figure 6. The initial stiffness, k*, was defined by the secant line connecting the origin to the occurrence of the first nonlinear event, generally corresponding to brace buckling. In accordance with EC8-1-1, the yield force, Fy*, and yield displacement, dy*, were determined from a bilinear idealization of the SDOF capacity curve, based on the equal-area criterion, up to the ultimate displacement du*. The period, T*, and yield spectral acceleration, Sa,y, were calculated as:
m* = ΣmiΦi; Γ = m*/Σ(miΦi2)
F* = Vb/Γ; d* = dr/(ΓΦr)
Figure 6.
Bilinearization of the SDOF capacity curve.
The target displacement demand was derived from the displacement of the equivalent SDOF for three limit states: Damage Limitation (DL), Significant Damage (SD), and Near Collapse (NC). In accordance with EC8-1-2, the corresponding elastic pseudo-acceleration spectra were obtained by multiplying the ordinates of the SD elastic response spectrum by a performance factor γLS,CC equal to 0.6, 1, and 1.5, respectively. For each limit state, the elastic spectral acceleration, Sa(T*), was evaluated at the period of the equivalent SDOF system, T*. The corresponding target displacement, dt*, of the SDOF was assumed equal to the elastic displacement response spectrum at the period T*, Sd(T*), when the system remained elastic or when the equal-displacement rule can be applied
and using the strength-reduction factor, Rμ, and the short-period correction formula when T* < TC, as follows:
where TC is the upper corner period of the plateau of the elastic response spectrum.
dt* = Sd(T*)
Rμ = Sa(T*)/Sa,y
The displacement demand of the equivalent SDOF system was converted into the corresponding target roof displacement of the MDOF frame as dr,t = Γ Φr dt*. For each limit state, the story and member demands were then extracted from the MDOF pushover analyses at this target roof displacement. Finally, the following parameters were evaluated at each story to characterize the CBF lateral response:
- Interstory drift ratios, IDRs, calculated as the difference between lateral displacements of two consecutive stories divided by the story height;
- Brace ductility demand, μbr, calculated in tension as dbr/dbr,pl and in compression as dbr/dbr,b; dbr is the axial deformation in tension or compression, dbr,pl is the axial elongation at yielding, and dbr,b is the axial shortening at buckling;
- In-plane flexural demand on columns, MEd,col/Mpl,col, where MEd,col is the maximum bending moment between column ends and Mpl,col is the nominal plastic resistance of the cross-section;
- Moment distribution between column ends, characterized using the EC3-1-1 parameter ψ = MEd,col,min/MEd,col,max; positive values identify single-curvature bending, whereas negative values identify double-curvature distributions;
- Cross-sectional resistance of beams and columns evaluated using the equations provided by EC3-1-1 through the axial force-bending moment interaction indices, Ib,PL and Ic,PL, in accordance with previous studies [8];
- Flexural-torsional resistance of columns evaluated using the equations provided by EC3-1-1 through the stability index Ic,S in accordance with previous studies [8]; the column stability check using a force-based approach provided a complementary assessment of member resistance as the adopted fiber beam-column formulation does not capture flexural-torsional buckling phenomena.
3.2. Lateral Response
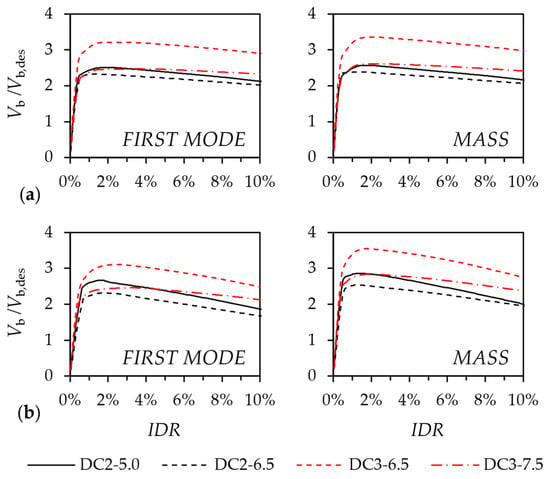
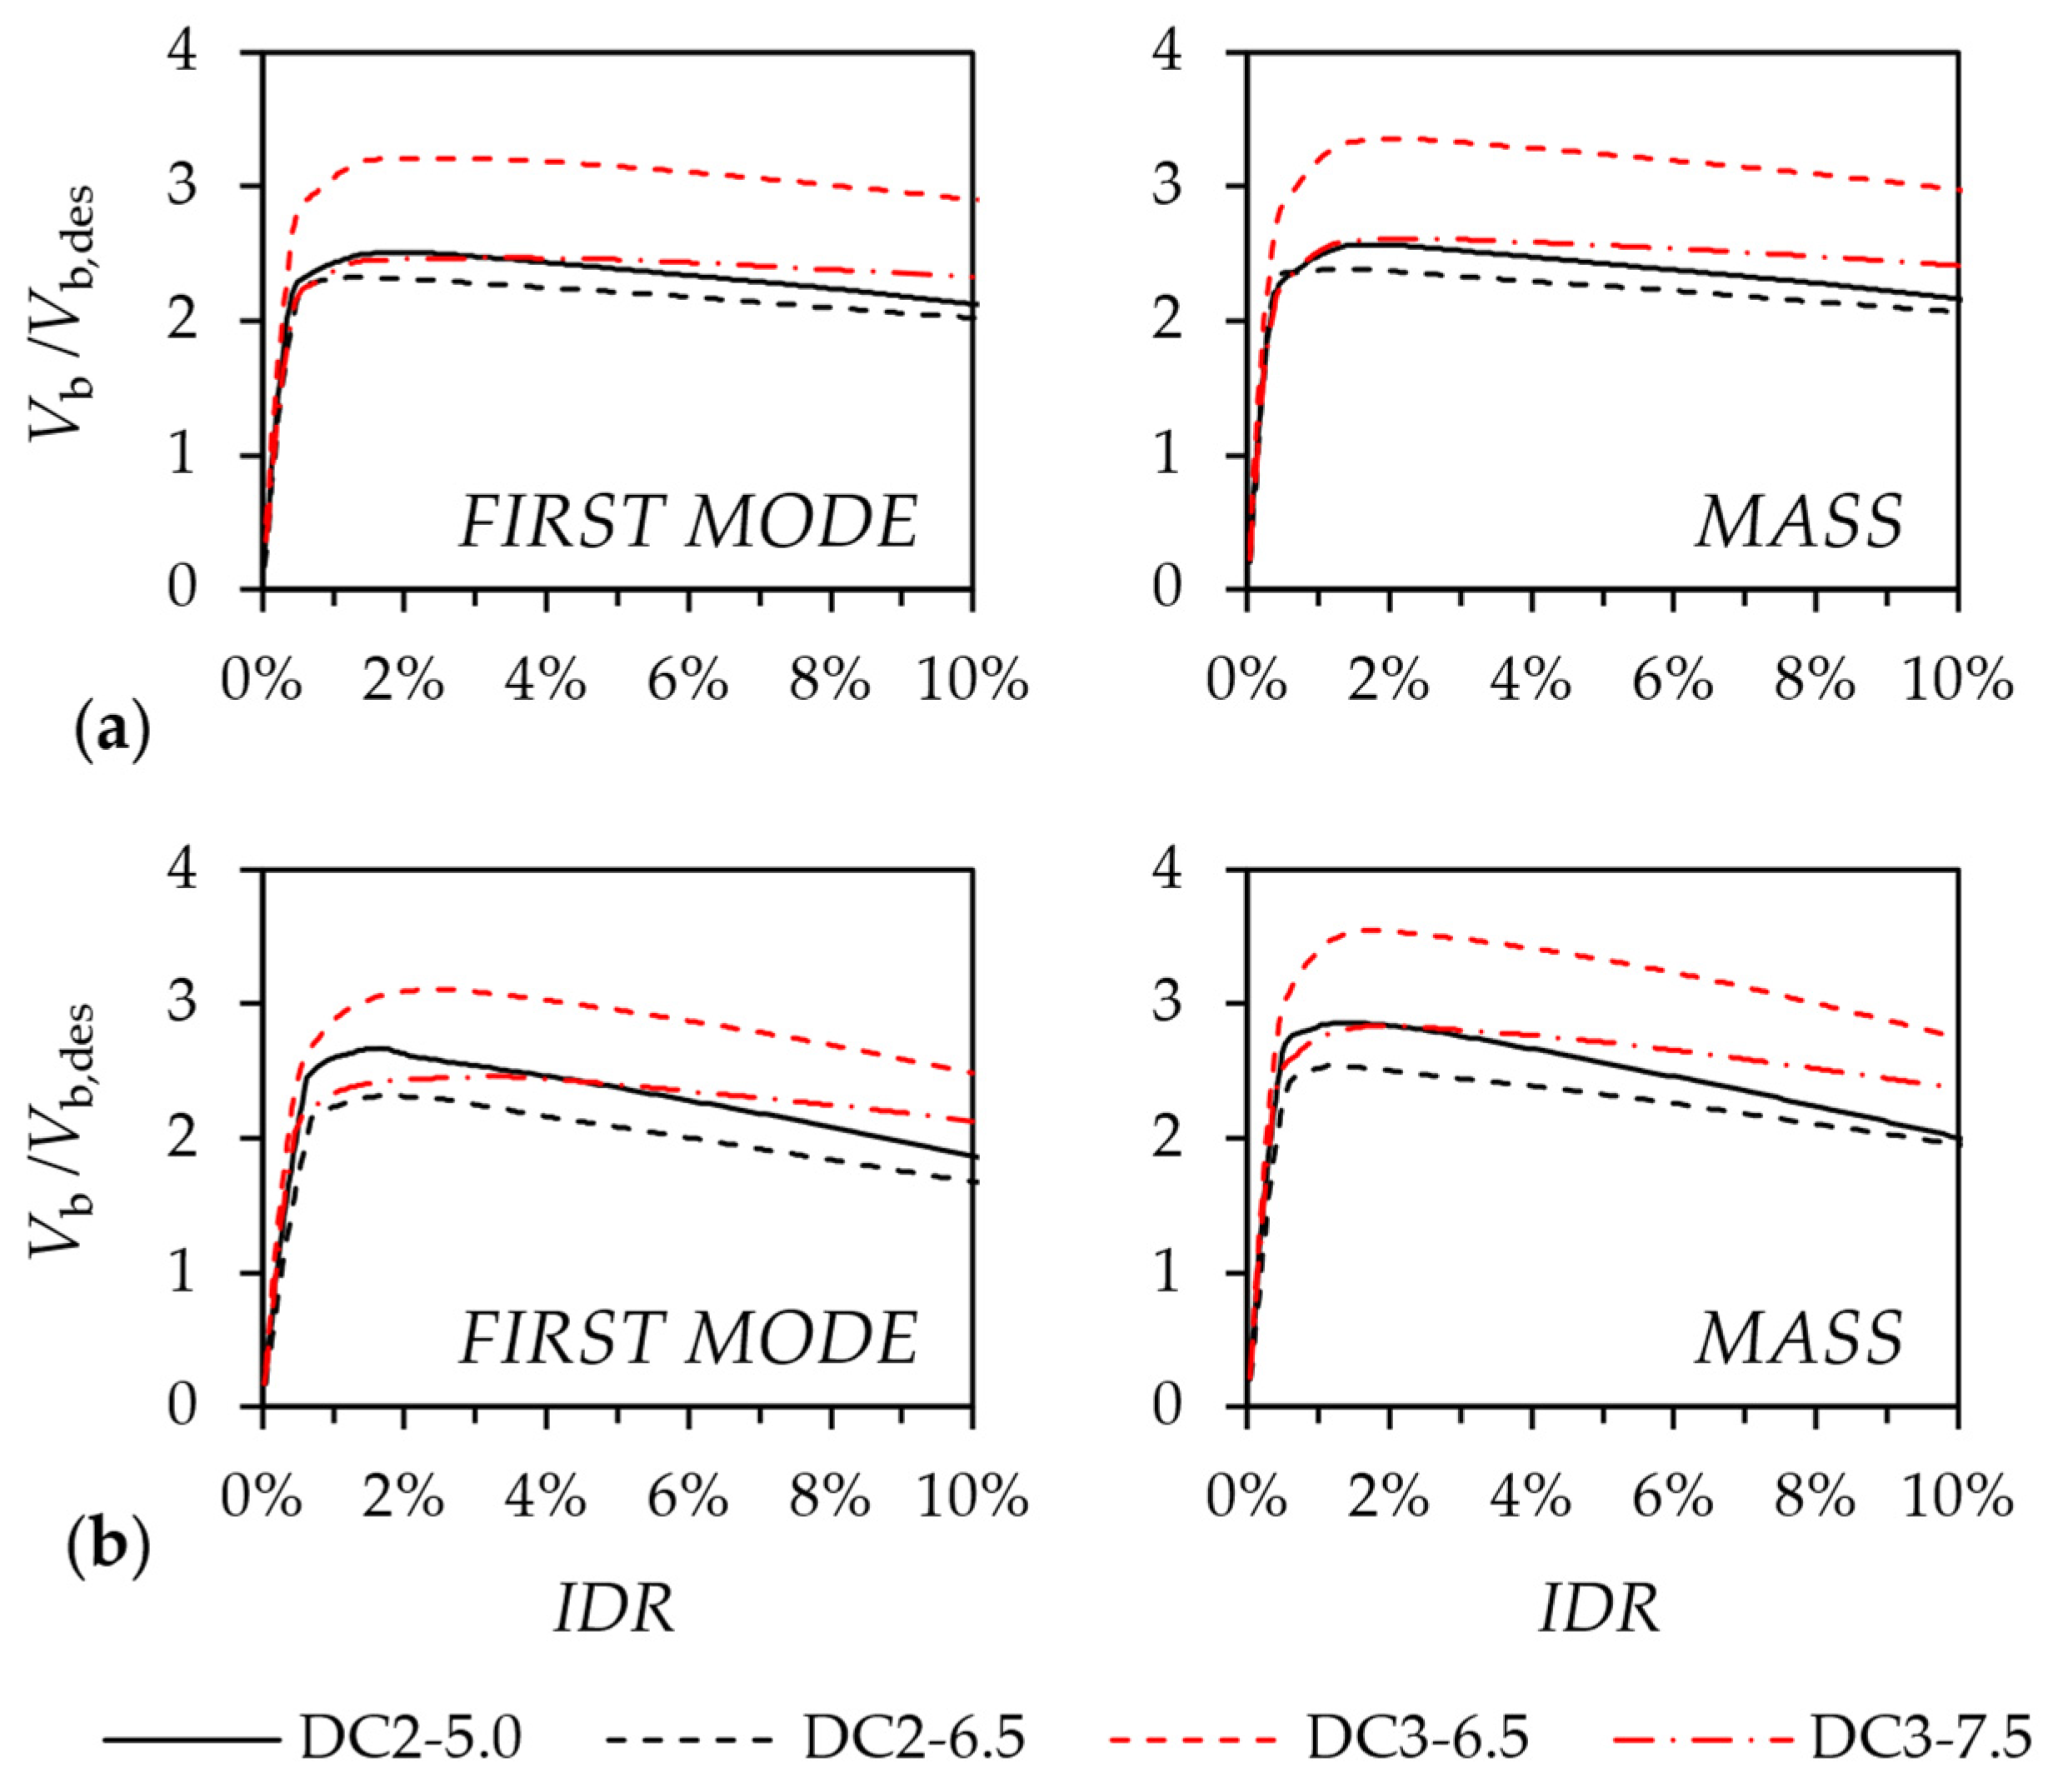
The pushover curves are given in Figure 7 in terms of the base shear, Vb, normalized to the corresponding design value, Vb,des, as a function of the maximum interstory drift ratio, IDR, recorded for each step of the analysis. All the examined CBFs exhibited significant lateral overstrength with respect to their design base shear. For most archetypes, the peak Vb/Vb,des ratios ranged between 2.2 and 2.8, without a systematic dependence on the ductility class. The main exceptions were the three- and six-story DC3-6.5 CBFs that developed peak lateral overstrength values between 3.2 and 3.5. In these cases, the brace design was mainly governed by the EC8-1-2 requirement controlling the variation in brace buckling overstrength along the building height and by the stricter limits on the local slenderness of cross-sections. Compliance with those requirements resulted in brace buckling resistances exceeding those strictly required by the corresponding design actions, thereby providing an additional source of design overstrength. Conversely, the DC3-7.5 frames exhibited peak Vb/Vb,des ratios comparable to those of the DC2 frames. The pushover curves showed a loss of strength and stiffness at IDR = 2.0–2.5% associated with the increasing influence of second-order effects. The lateral load pattern had a limited influence on the overall nonlinear static response. The first-mode and mass-proportional distributions produced similar peak strengths and post-peak trends for both building heights. Slightly larger differences were observed for the six-story frames, but the adopted load pattern did not alter the relative response of the different frames or the main conclusions regarding system overstrength and post-peak reduction in strength and stiffness.
Figure 7.
Pushover curves: (a) three-story and (b) six-story frames.
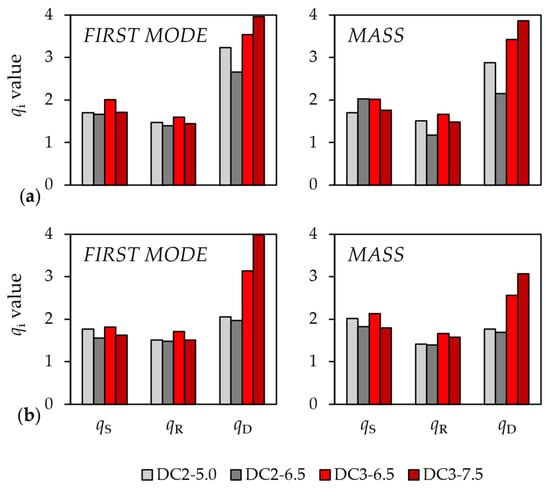
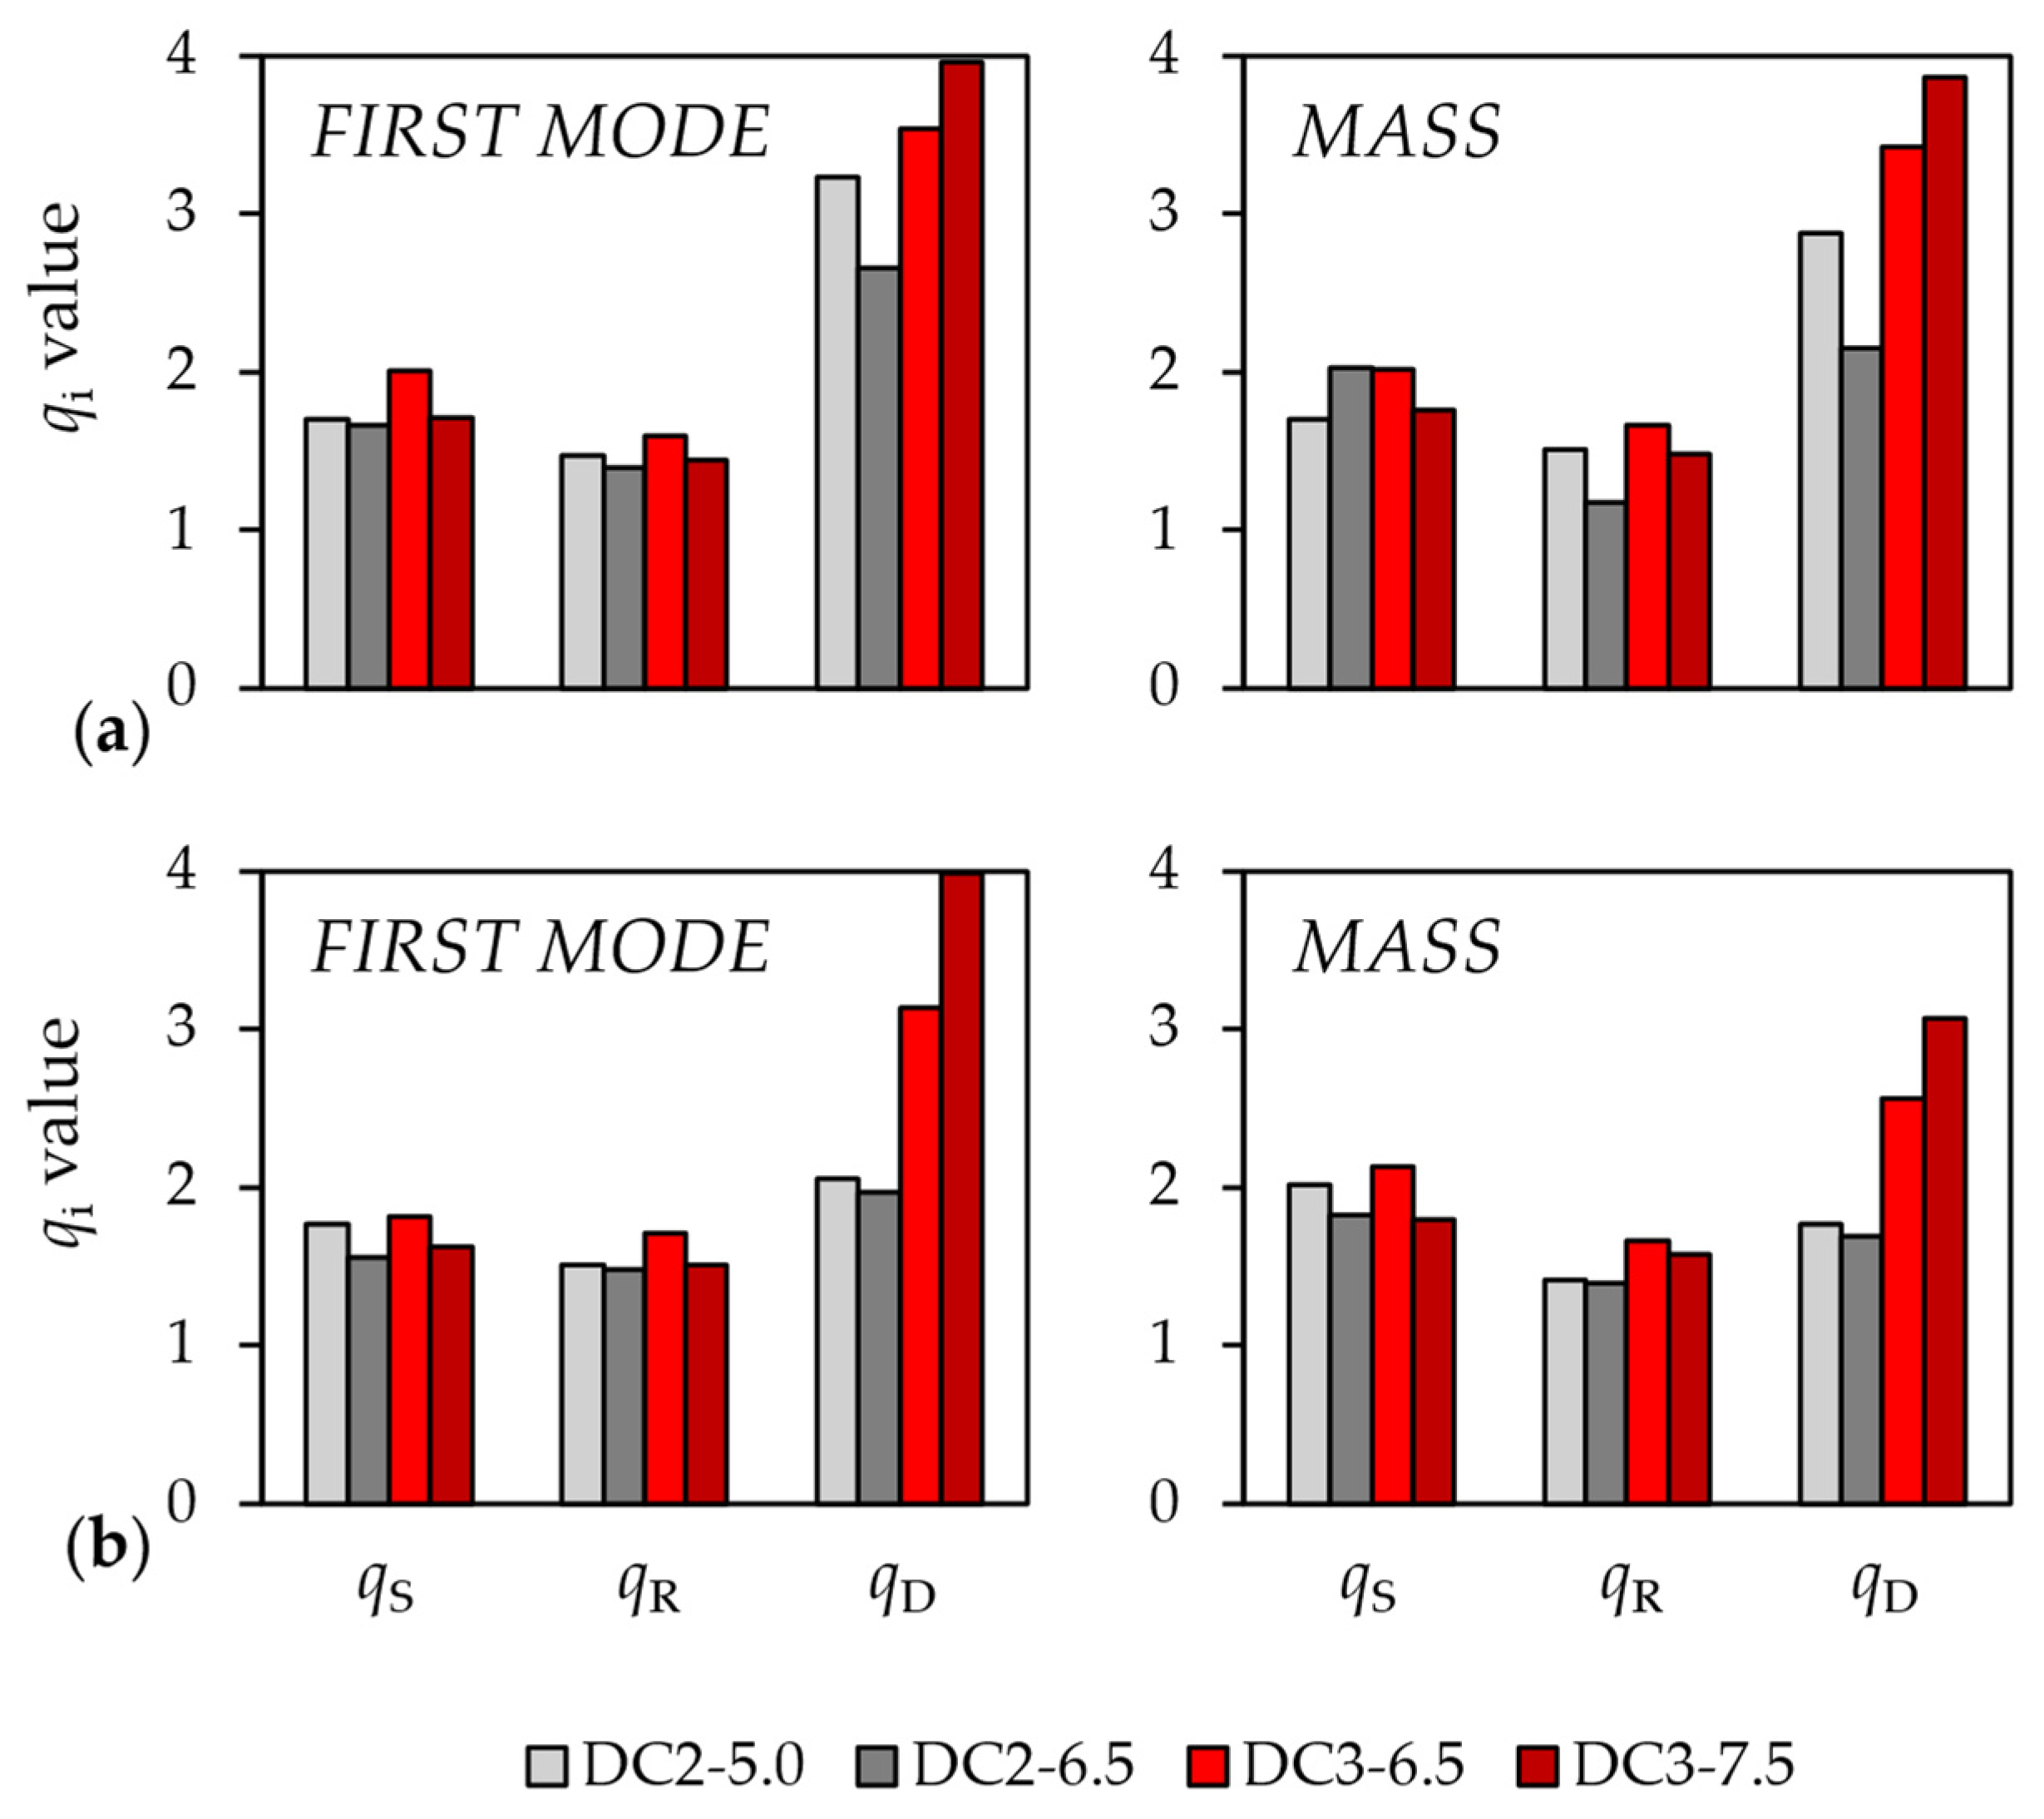
The components of the behavior factor were evaluated in accordance with the EC8-1-2 definition depicted in Figure 1a. The q-factor components obtained for the designed frames are given in Figure 8. The calculated qS values ranged between 1.5 and 2.1 and were therefore equal to or larger than the EC8-1-2 design value. No systematic dependence on ductility class or building height was observed. The mass-proportional load pattern produced slightly larger qS values in some cases, particularly for the six-story frames, although the differences between the two load patterns remained relatively limited. The redundancy component qR ranged between 1.2 and 1.7, exceeding the code values prescribed for both DC2, qR = 1.0, and DC3, qR = 1.1. DC3 frames generally exhibited greater values than those in DC2, consistent with the stricter capacity-design rules that provided a more uniform dissipative response and additional damage redistribution along the building height. Nevertheless, qR showed only moderate sensitivity to building height and lateral load pattern. More substantial differences were observed for the ductility-related component qD. For the three-story DC2 frames, qD ranged between 2.2 and 3.2, exceeding the EC8-1-2 value of 1.7. The six-story DC2 frames developed lower values, approximately between 1.7 and 2.1, which were closer to the code reference value. Thus, increasing the number of stories primarily reduced the overall ductility component, qD, whereas its influence on qS and qR was comparatively limited. The DC3 frames consistently developed larger qD values than DC2. Values of approximately 3.4–4.0 were obtained for the three-story archetypes, while the six-story frames exhibited values between approximately 2.5 and 4.0, depending on the seismic design level and lateral load pattern. All these values exceeded the EC8-1-2 reference value of 2.4. The mass-proportional load pattern generally resulted in lower qD values than the first-mode pattern, particularly for the six-story frames. In conclusion, the stricter capacity design requirements in DC3 primarily increased the ductility-related component of the q-factor, whereas the corresponding variations in qS and qR were relatively modest compared to DC2. As a general remark, although nonlinear static analyses provide a less comprehensive representation of seismic response than nonlinear response-history analyses [26], the evaluation of the q-factor components provides useful insight into the relative contributions of overstrength, redundancy, and ductility for such systems, while enabling a preliminary assessment of the corresponding values prescribed by EC8-1-2.
Figure 8.
Behavior factor components: (a) three-story and (b) six-story frames.
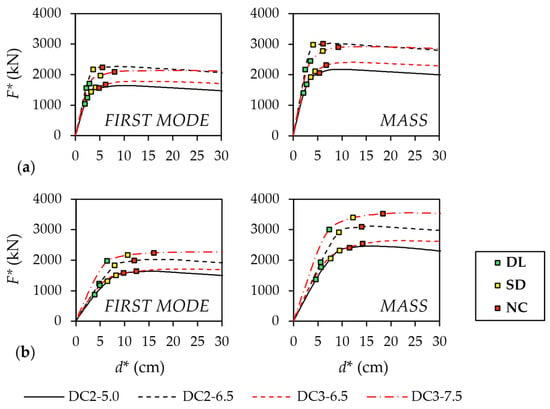
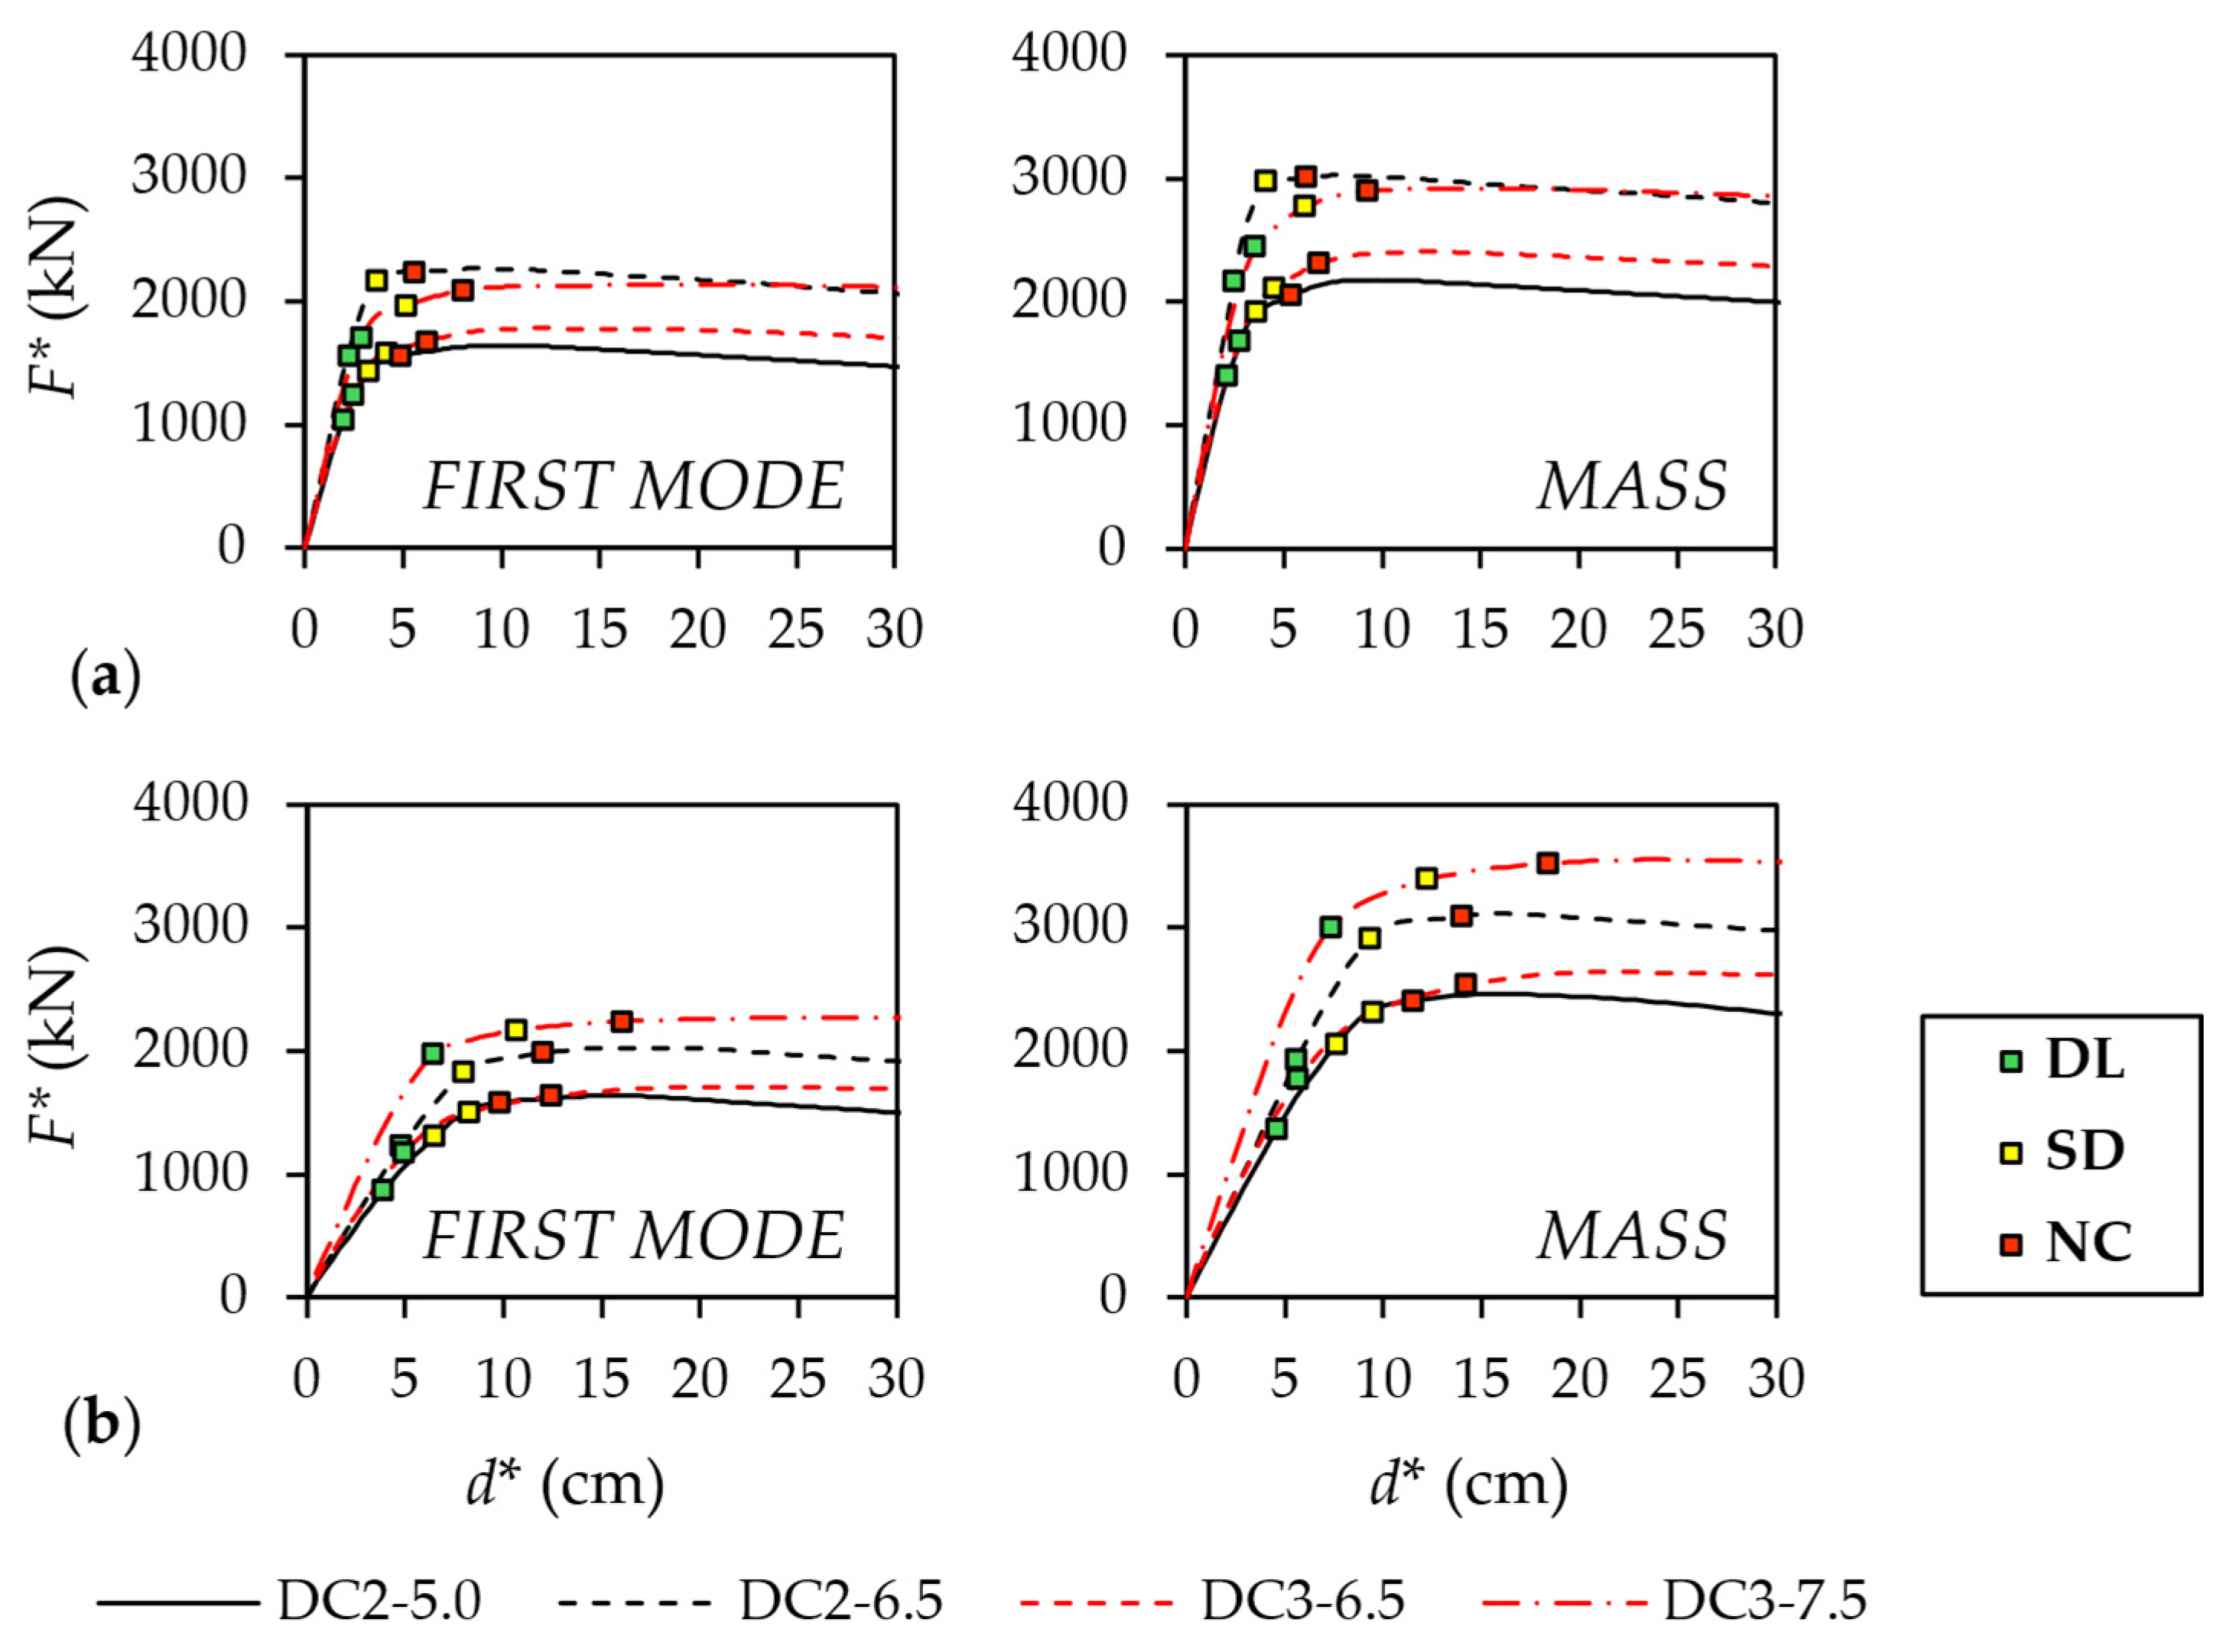
Figure 9 depicts the capacity curves of the equivalent SDOF system, derived from the CBF pushover curves for both lateral load patterns, given in terms of the F*-d* relationship. The target displacement demands, dt*, at the DL, SD, and NC limit states are also plotted on the corresponding capacity curves. Although the mass-proportional capacity curves produced systematically larger F*(d*) values than the first-mode distribution, the two load patterns provided consistent results. The DL target points were generally located close to the transition between the initial elastic branch and subsequent nonlinear response. The SD and NC points were progressively located along the nonlinear branch before any appreciable strength deterioration occurred. Therefore, all the examined frames retained a stable global lateral response up to the NC target displacement.
Figure 9.
Capacity curves of the equivalent SDOF system: (a) three-story and (b) six-story frames.
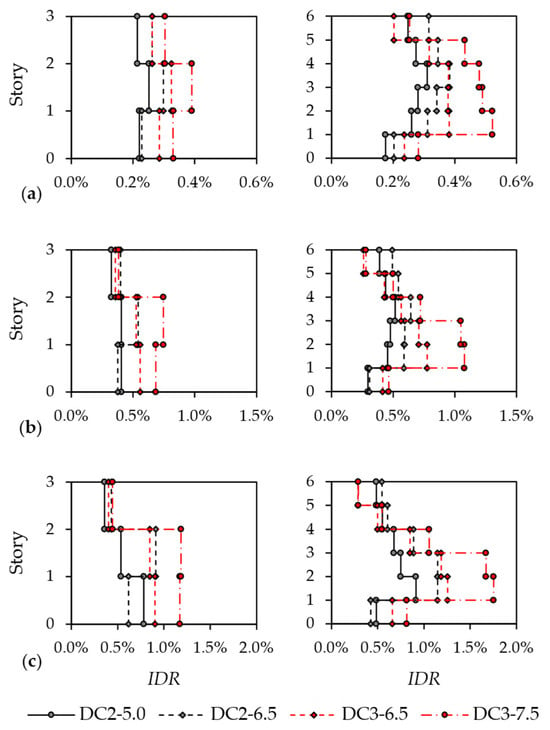
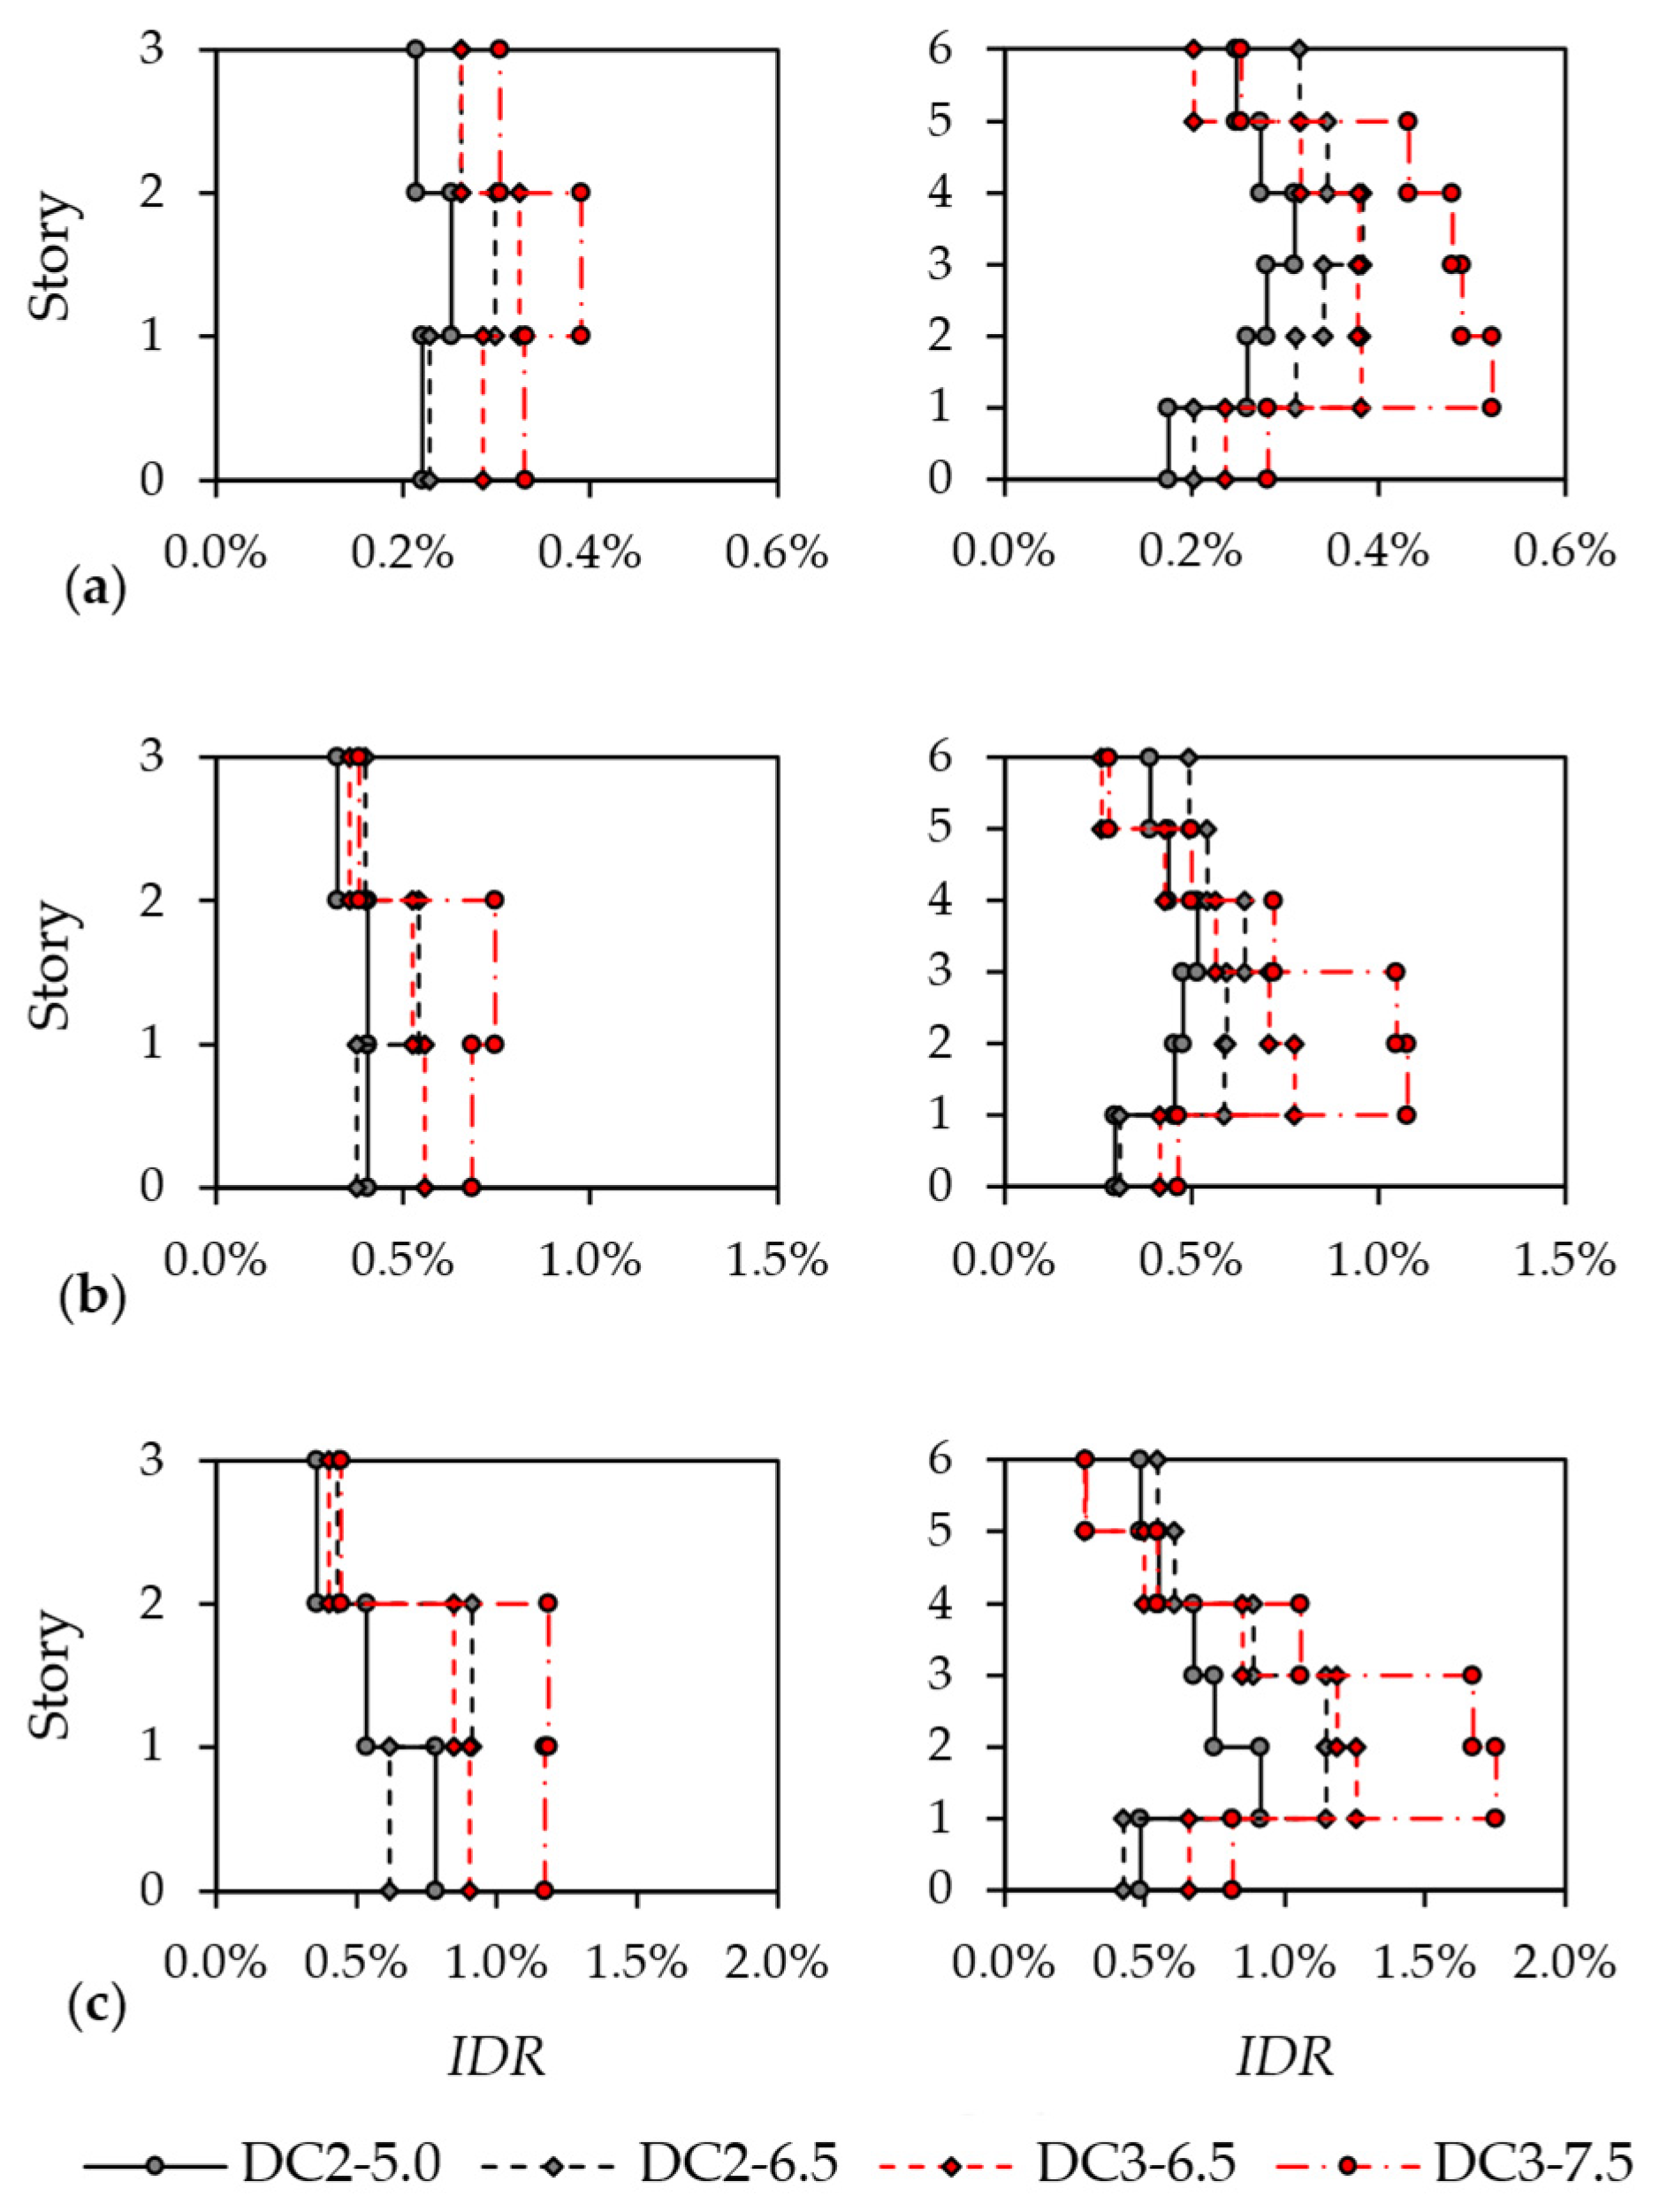
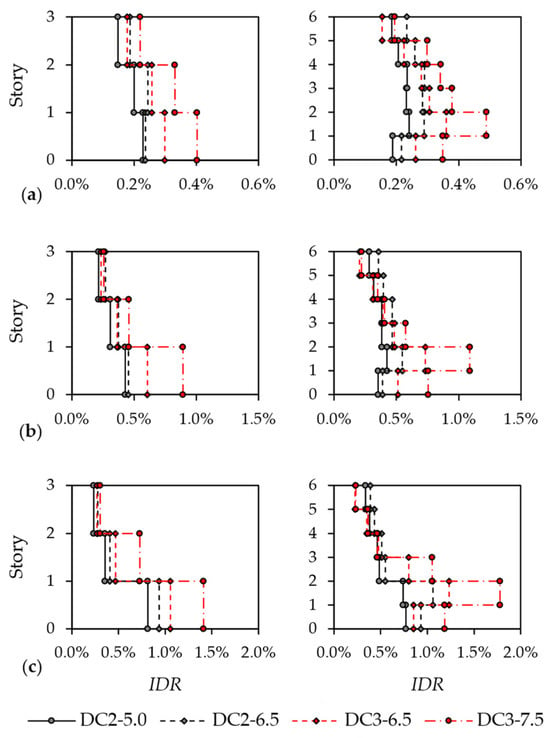
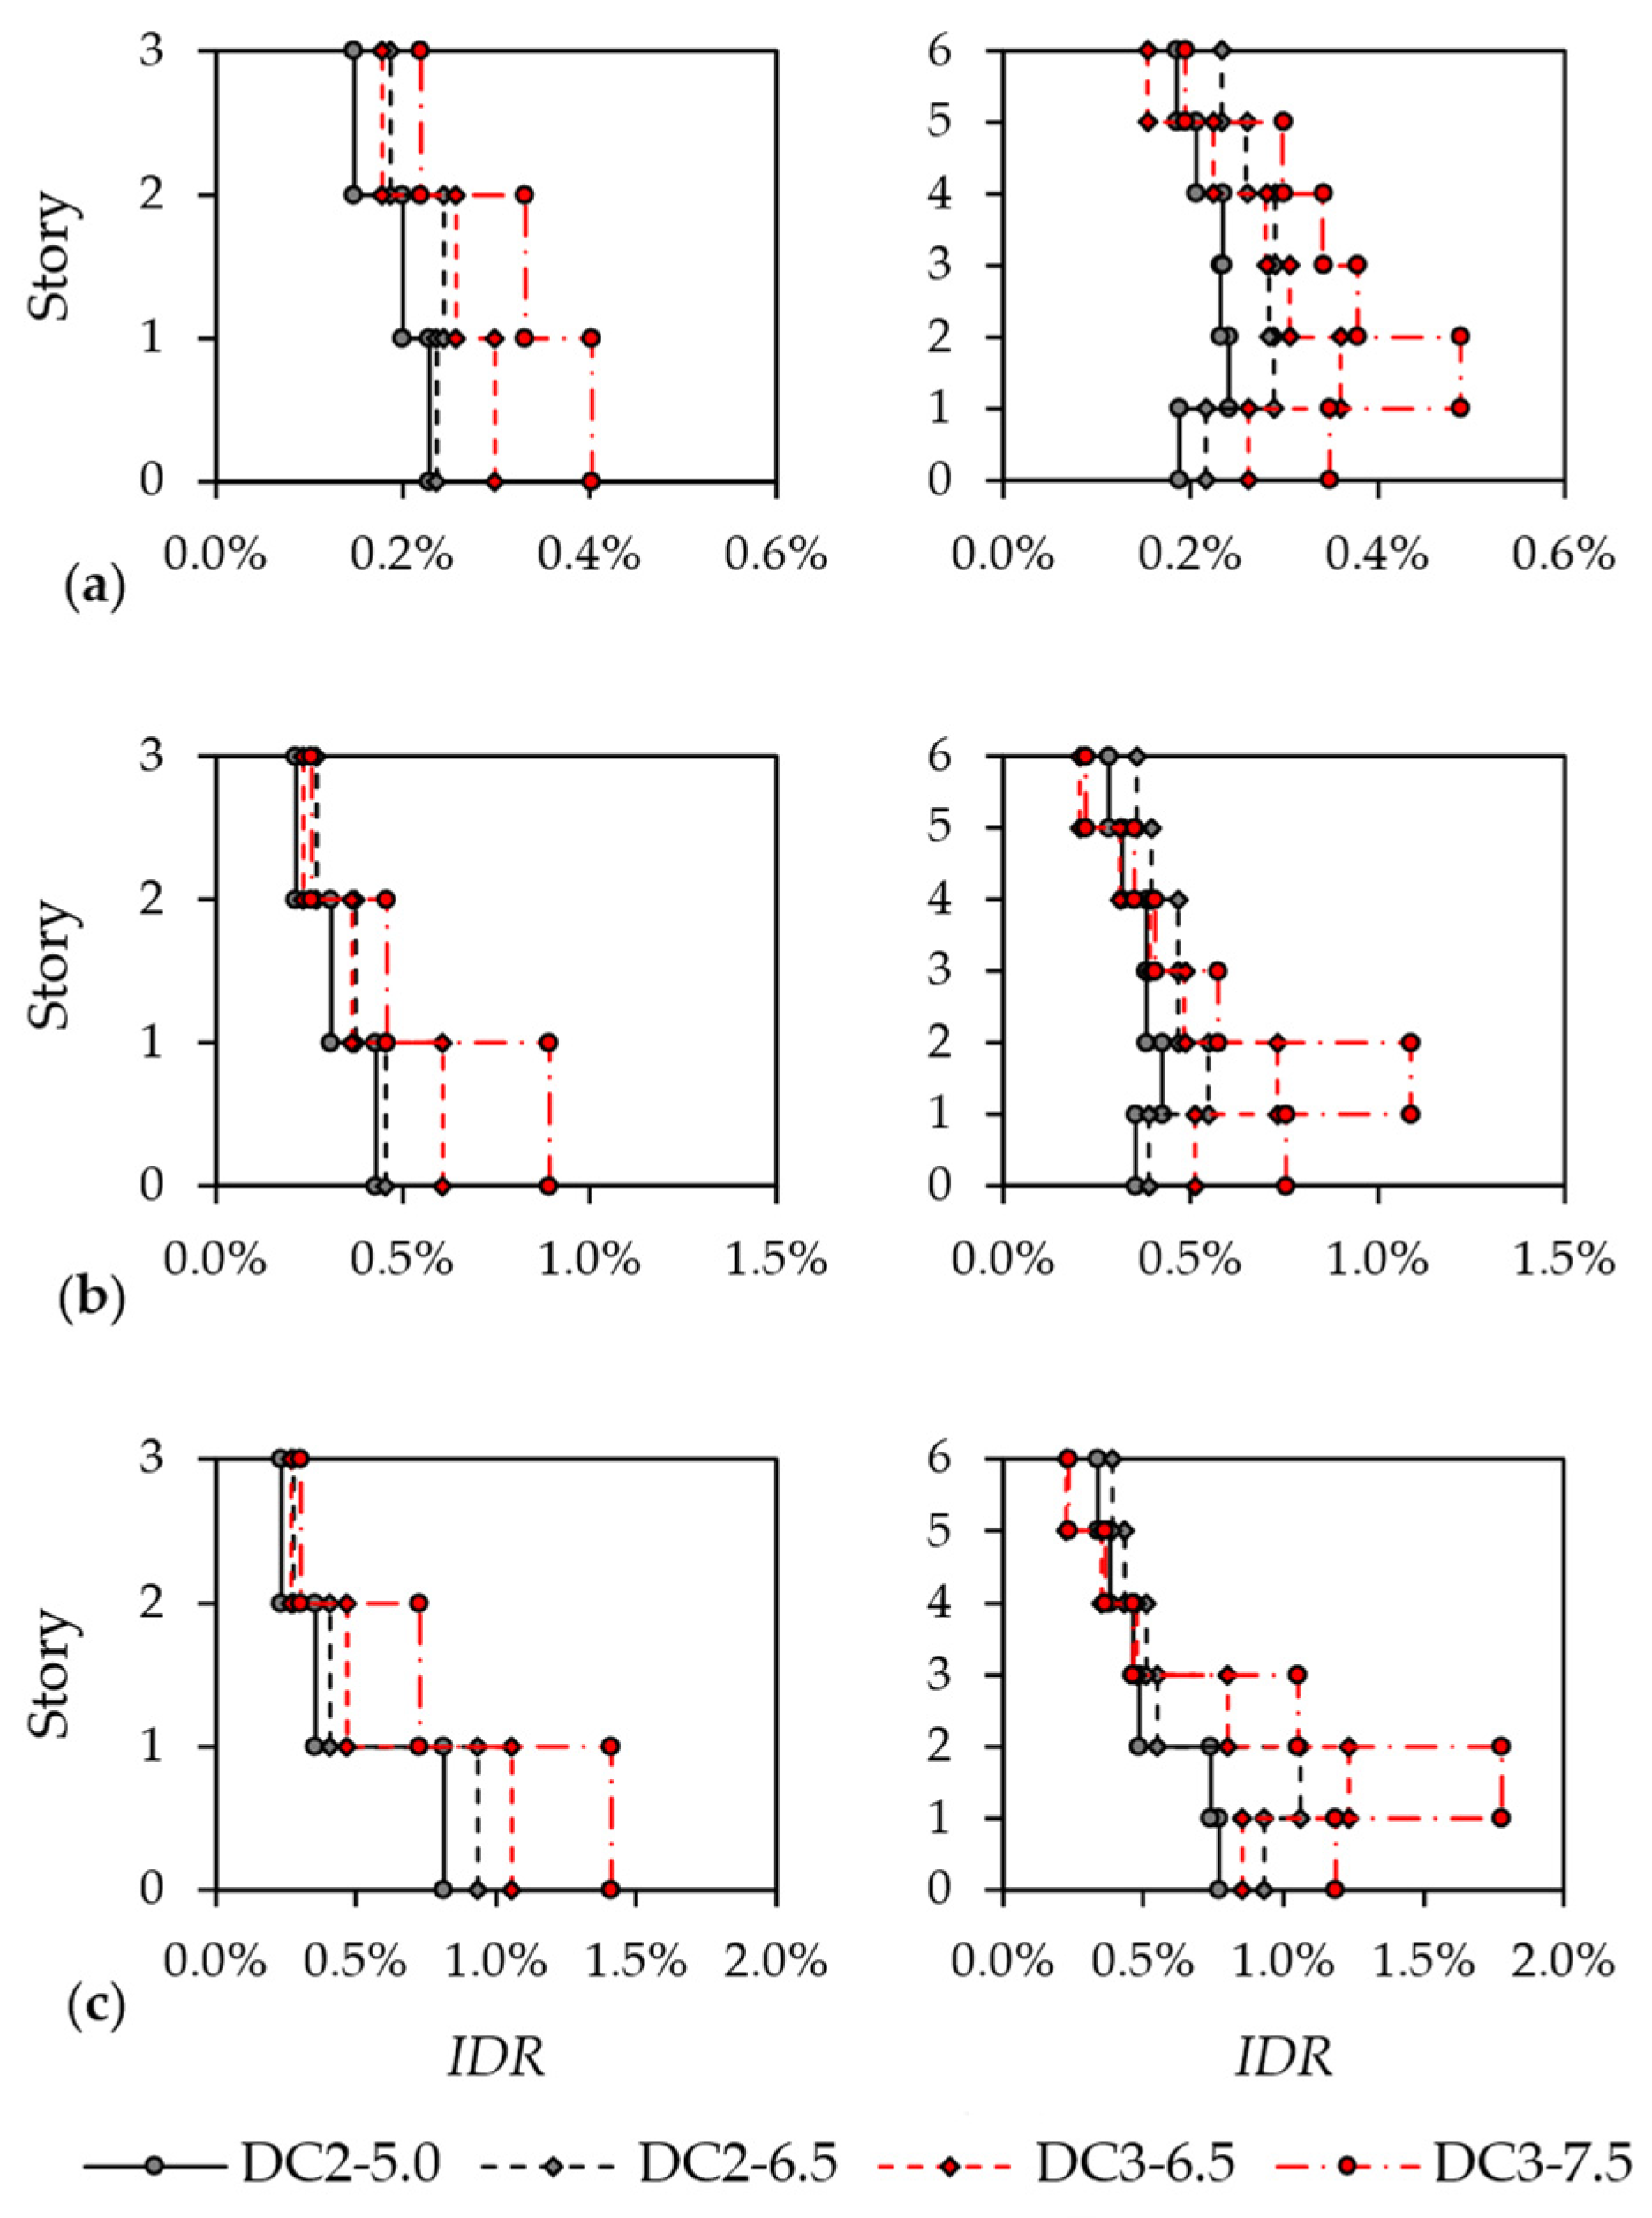
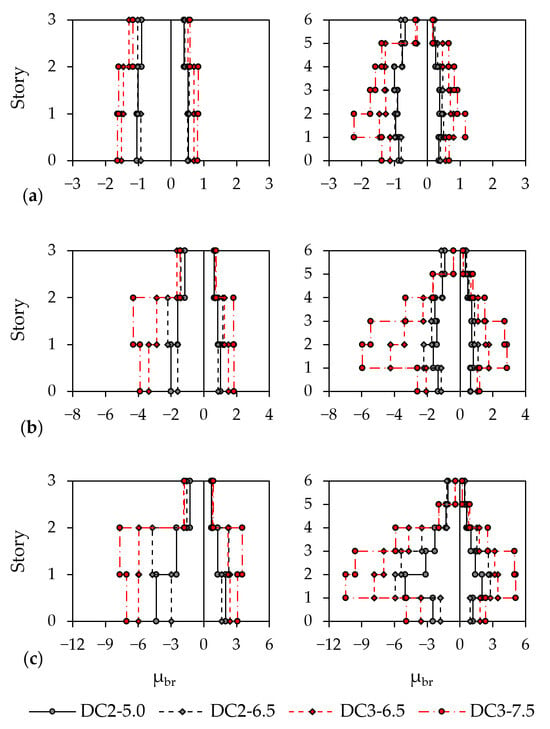
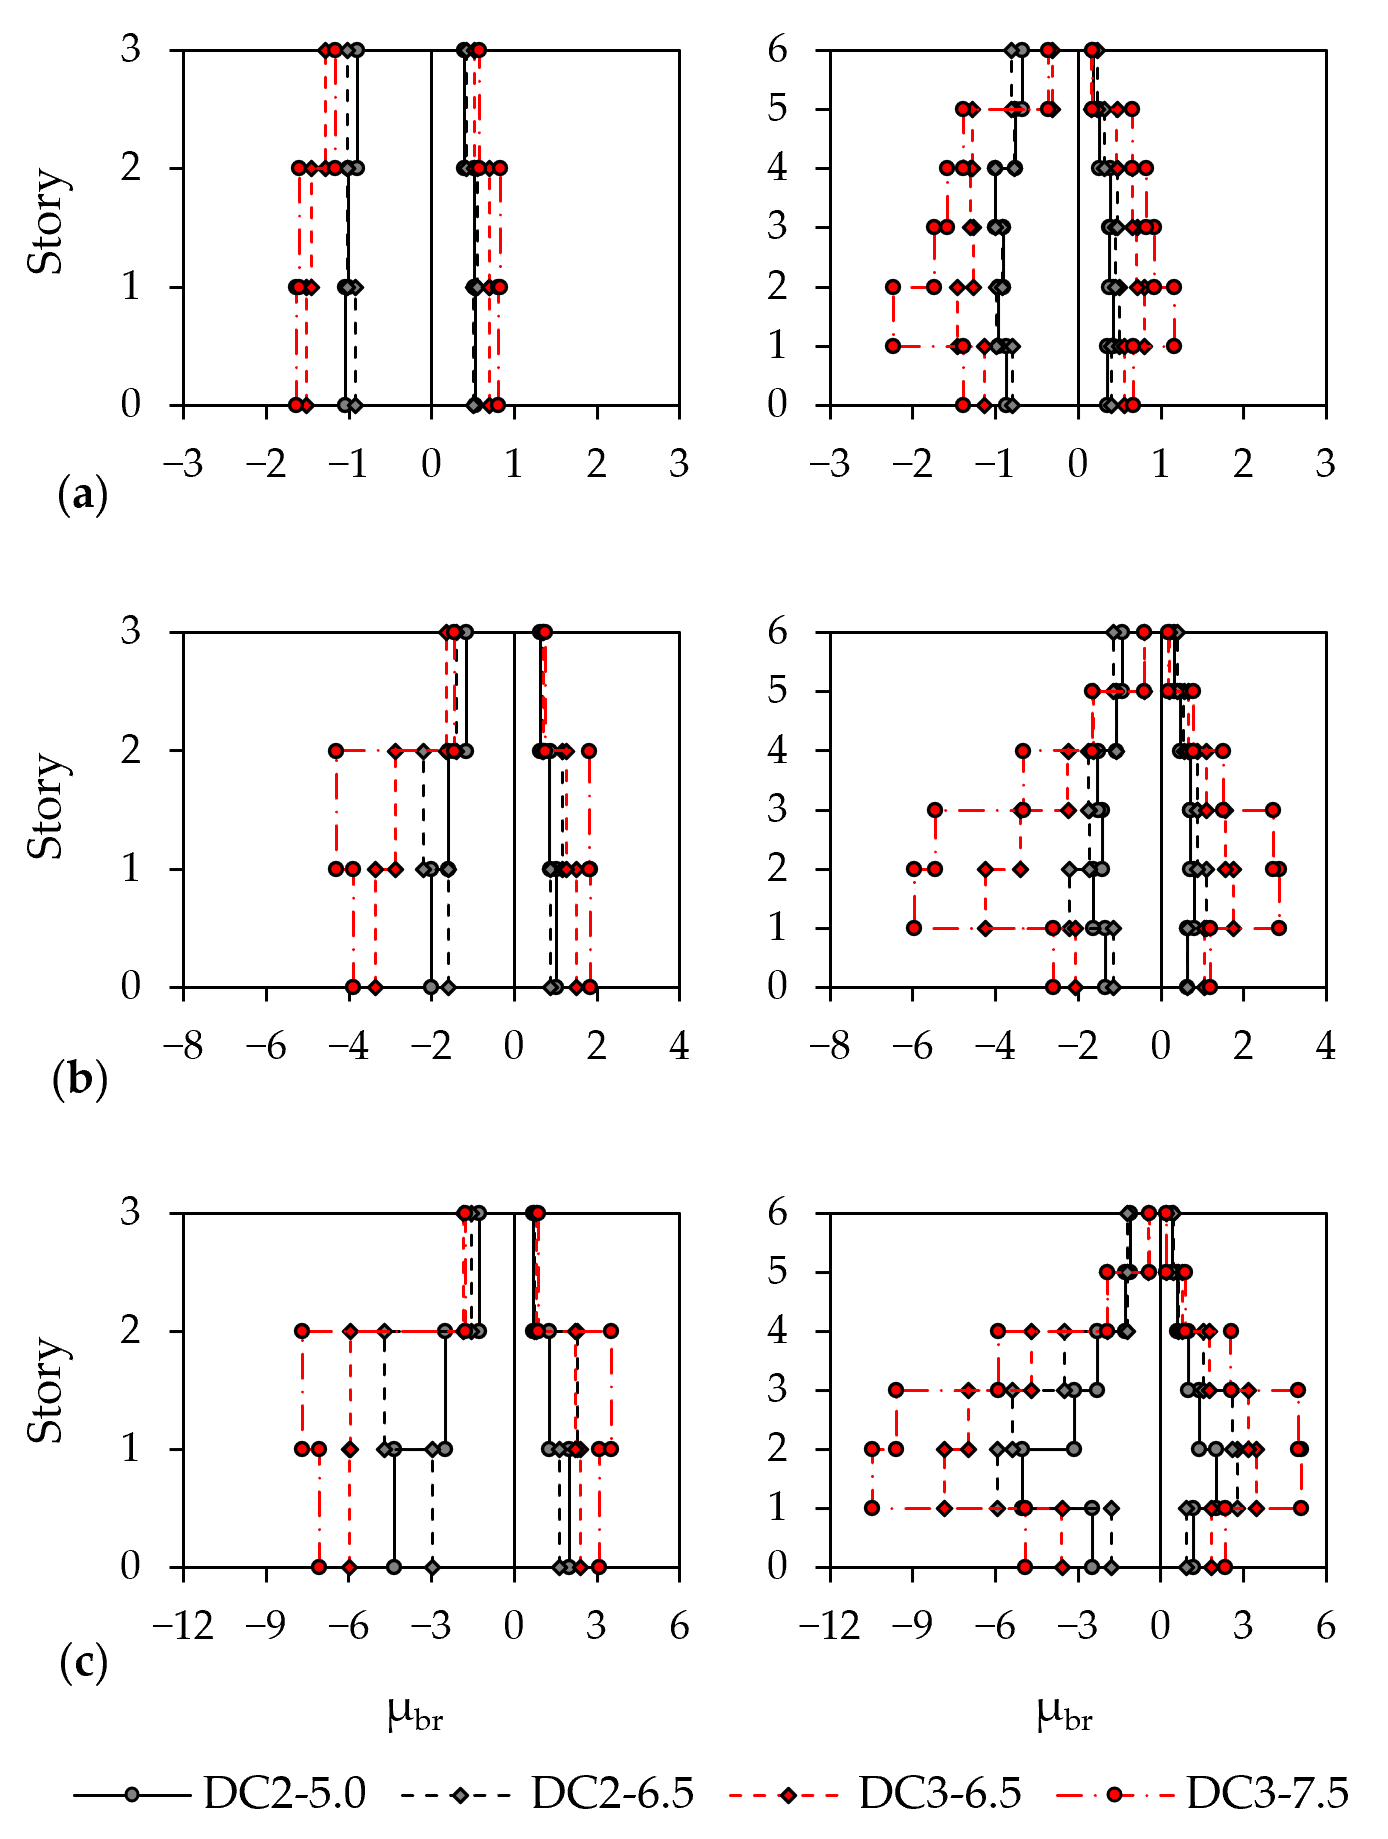
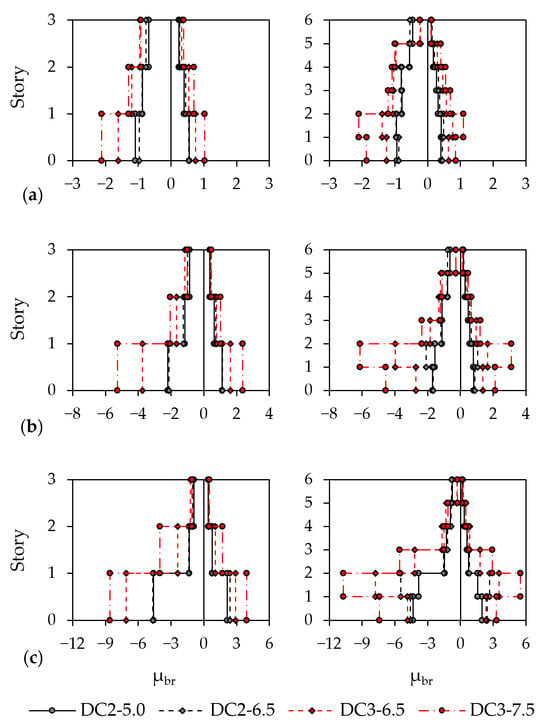
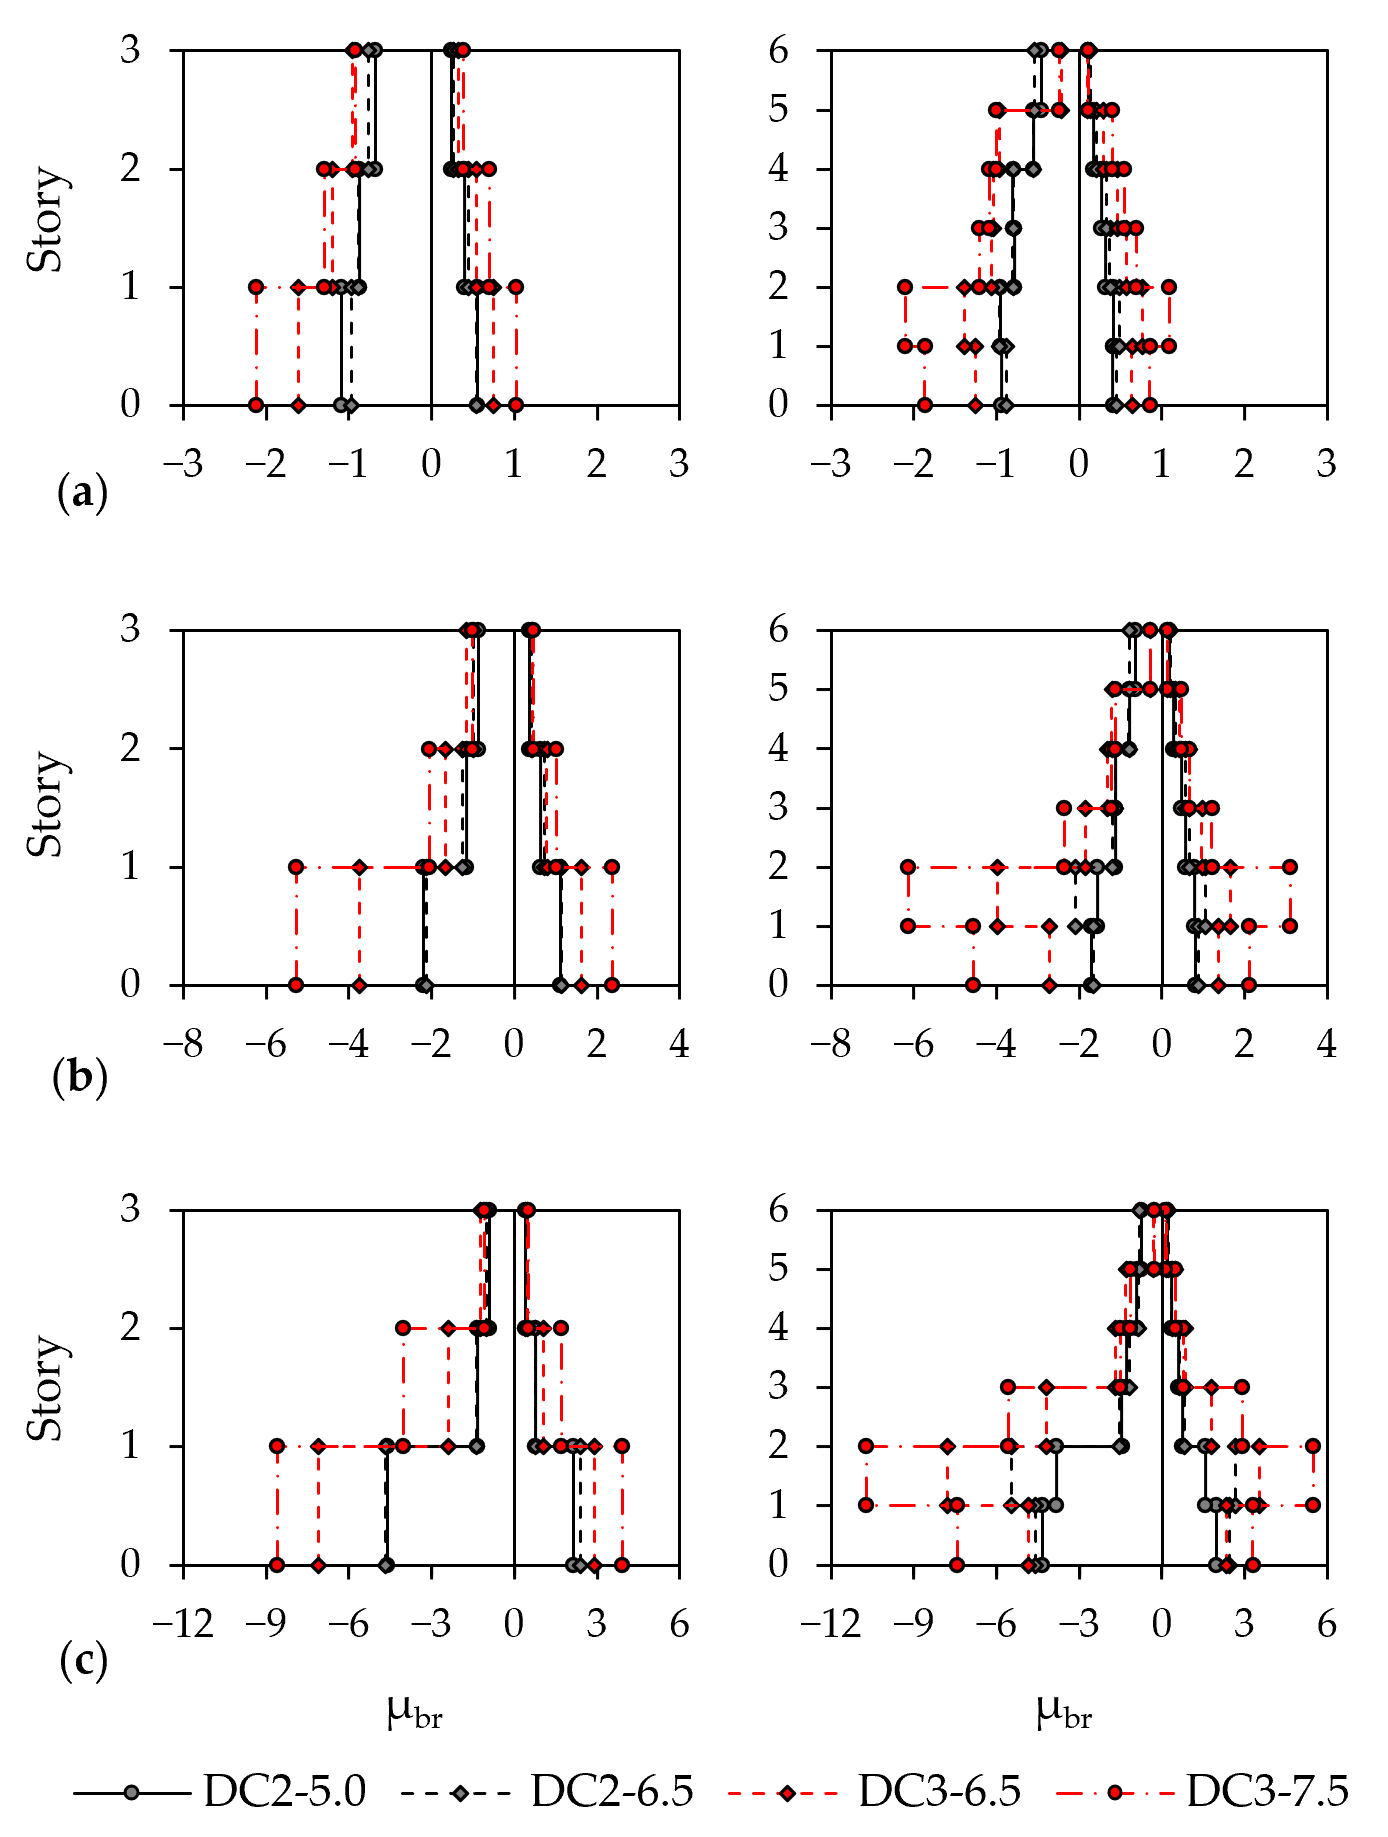
Figure 10 and Figure 11 show the interstory drift ratio, IDR, profiles obtained using the first mode and mass-proportional load patterns, respectively, associated with the roof target displacement for each limit state. The corresponding brace ductility demands in tension and compression, depicted in Figure 12 and Figure 13, generally reflect the IDR distributions along the building height. Positive and negative μbr values denote brace elongation and shortening, respectively. Thus, μbr = 1 identifies tensile yielding, whereas μbr = −1 identifies brace buckling in compression. At the DL limit state, peak IDR values ranged between 0.2% and 0.5%. The three-story DC2 frames generally remained below or close to 0.3%, whereas larger values were obtained for the DC3 frames and for most of the six-story CBFs. The largest DL demand, approximately equal to 0.5%, was observed in the lower levels of the six-story DC3-7.5 frame. Therefore, all the examined frames remained well below the 1.25% limit prescribed by EC8 for buildings with ductile ancillary elements or elements that do not interfere with the structural deformation. Conversely, the more restrictive 0.30% limit for brittle ancillary elements was exceeded in several cases, particularly in the case of DC3 CBFs. Referring to the corresponding brace ductility demand at the DL limit state, braces of DC2 frames behaved elastically in tension, while peak μbr values in compression were close to −1. Conversely, DC3 braces exhibited significantly larger ductility demands with peak values in compression ranging between −1 and −2.5, particularly at the lower stories, while their tensile demand generally remained lower than 1. Thus, some DC3 frames exhibited an incipient nonlinear response, primarily associated with brace buckling in compression. Peak IDRs at the SD limit state remained generally well below 1.5%, namely the EC8-1-2 upper threshold for the design of such systems. At the target SD displacement, the frames developed the intended dissipative response with brace buckling in compression and yielding in tension. The DC2 frames exhibited comparatively moderate brace ductility demands compared with DC3. DC3 CBFs exhibited peak compressive demands of between −5 and −6, while the largest tensile values generally ranged between 2 and 3. At the NC target displacement, the peak IDRs remained below approximately 1.5% for the three-story frames and 1.8% for the six-story frames. The largest μbr values were observed in the six-story DC3-7.5 frames, with peak compressive ductility demands of −10 and tensile demands between 5 and 6. At the same seismic-action level (i.e., Sδ = 6.5 m/s2), DC3 frames generally developed larger brace ductility demands than the corresponding DC2, consistent with the larger behavior factor and the lower seismic forces adopted in their designs. Moreover, no buckling phenomena were observed for the roof braces belonging to the six-story CBFs in DC3, consistent with the design assumptions. The lateral load pattern had a limited influence on the overall shape of the capacity curves but appreciably affected the distribution of drift and ductility demand. The first-mode pattern, defined by lateral forces proportional to mi Φ1,i, resulted in a more uniform distribution of drift and brace ductility over the lower and intermediate stories. Conversely, mass-proportional story shears decreased more rapidly along the building height, concentrating both drift and brace deformation demand at the base and lower levels. The influence of the load pattern was more evident for the six-story frames, for which the difference between the two lateral load patterns was more pronounced.
Figure 10.
First-mode IDR distribution: (a) DL, (b) SD and (c) NC limit states.
Figure 11.
Mass-proportional IDR distribution: (a) DL, (b) SD and (c) NC limit states.
Figure 12.
First-mode μbr distribution: (a) DL, (b) SD and (c) NC limit states.
Figure 13.
Mass-proportional μbr distribution: (a) DL, (b) SD and (c) NC limit states.
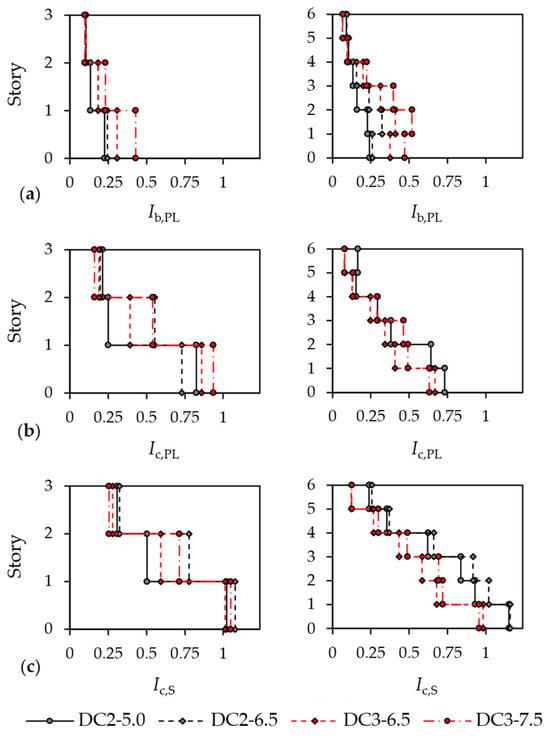
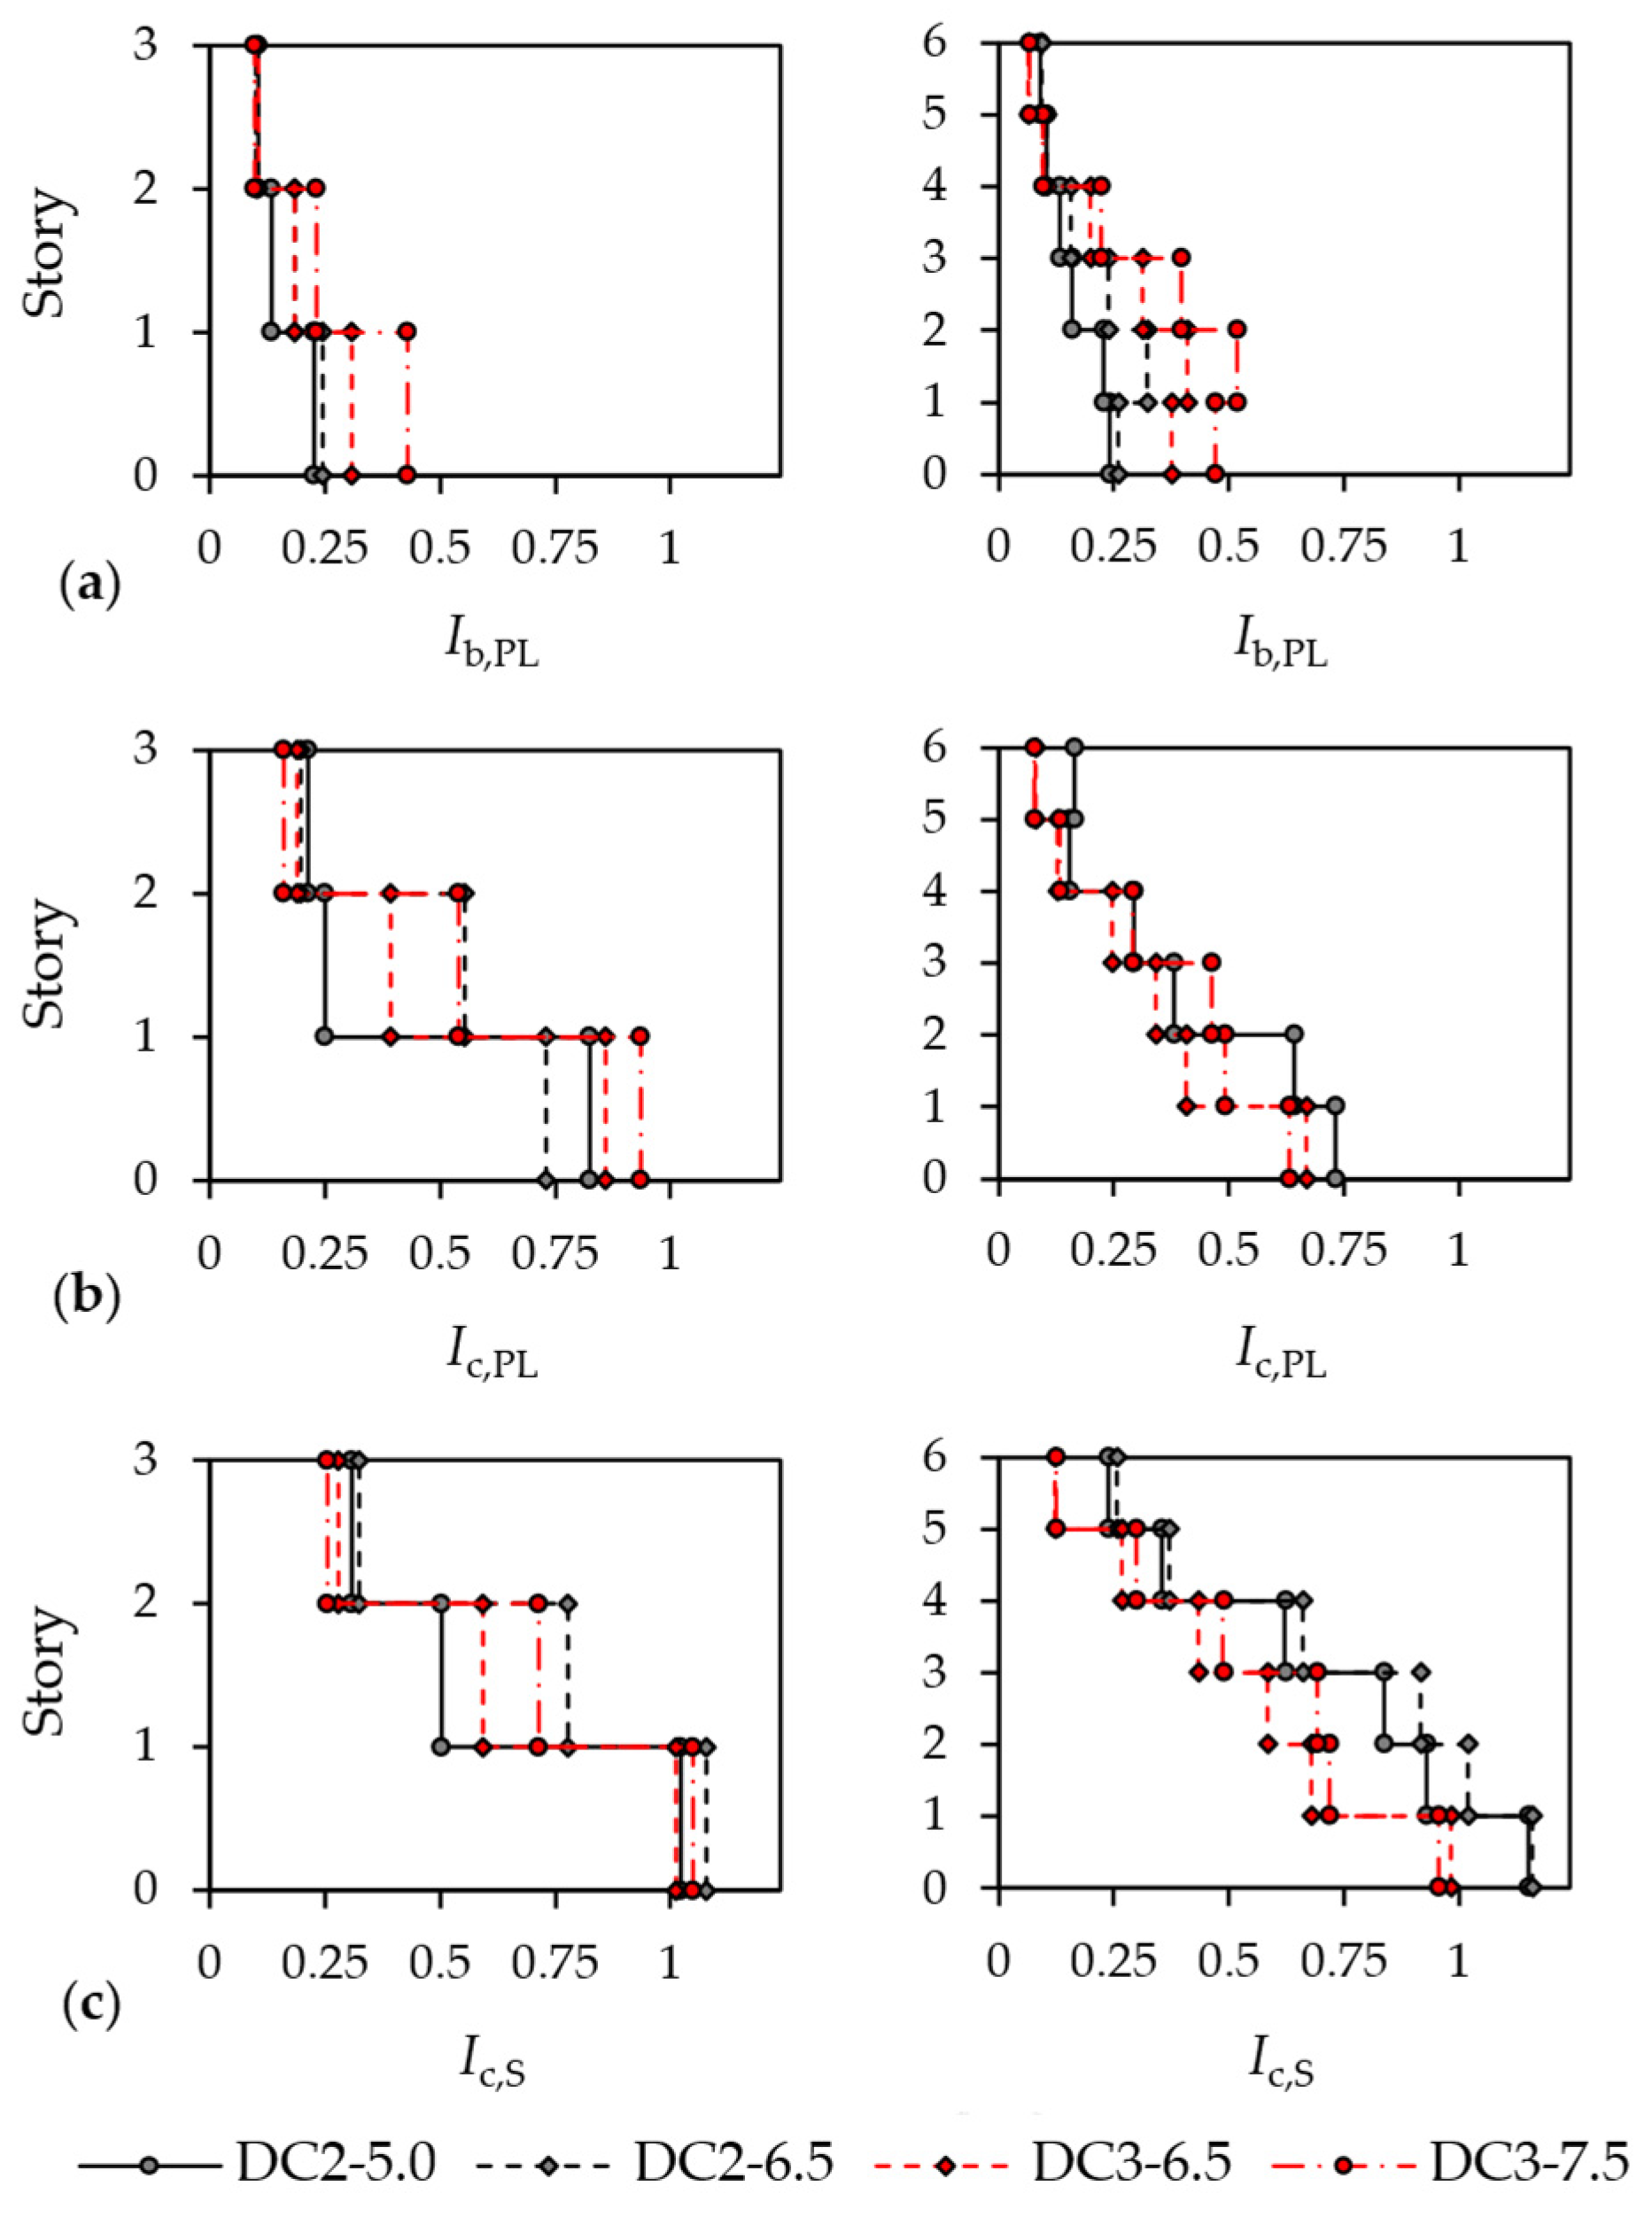
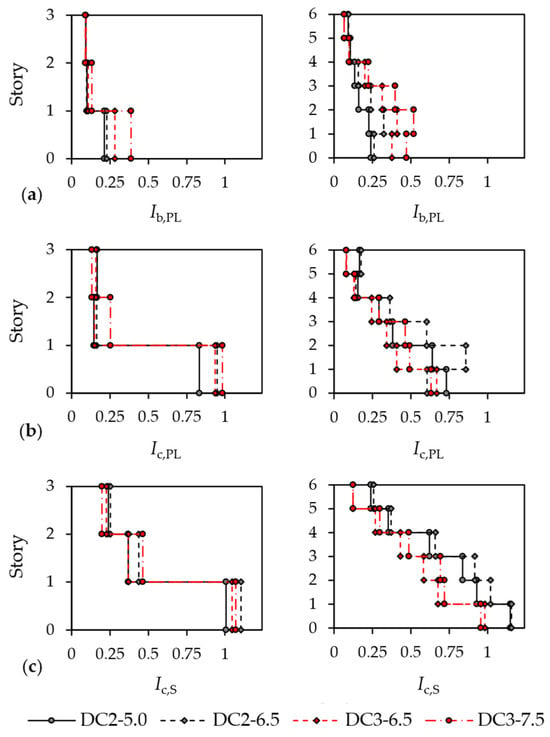
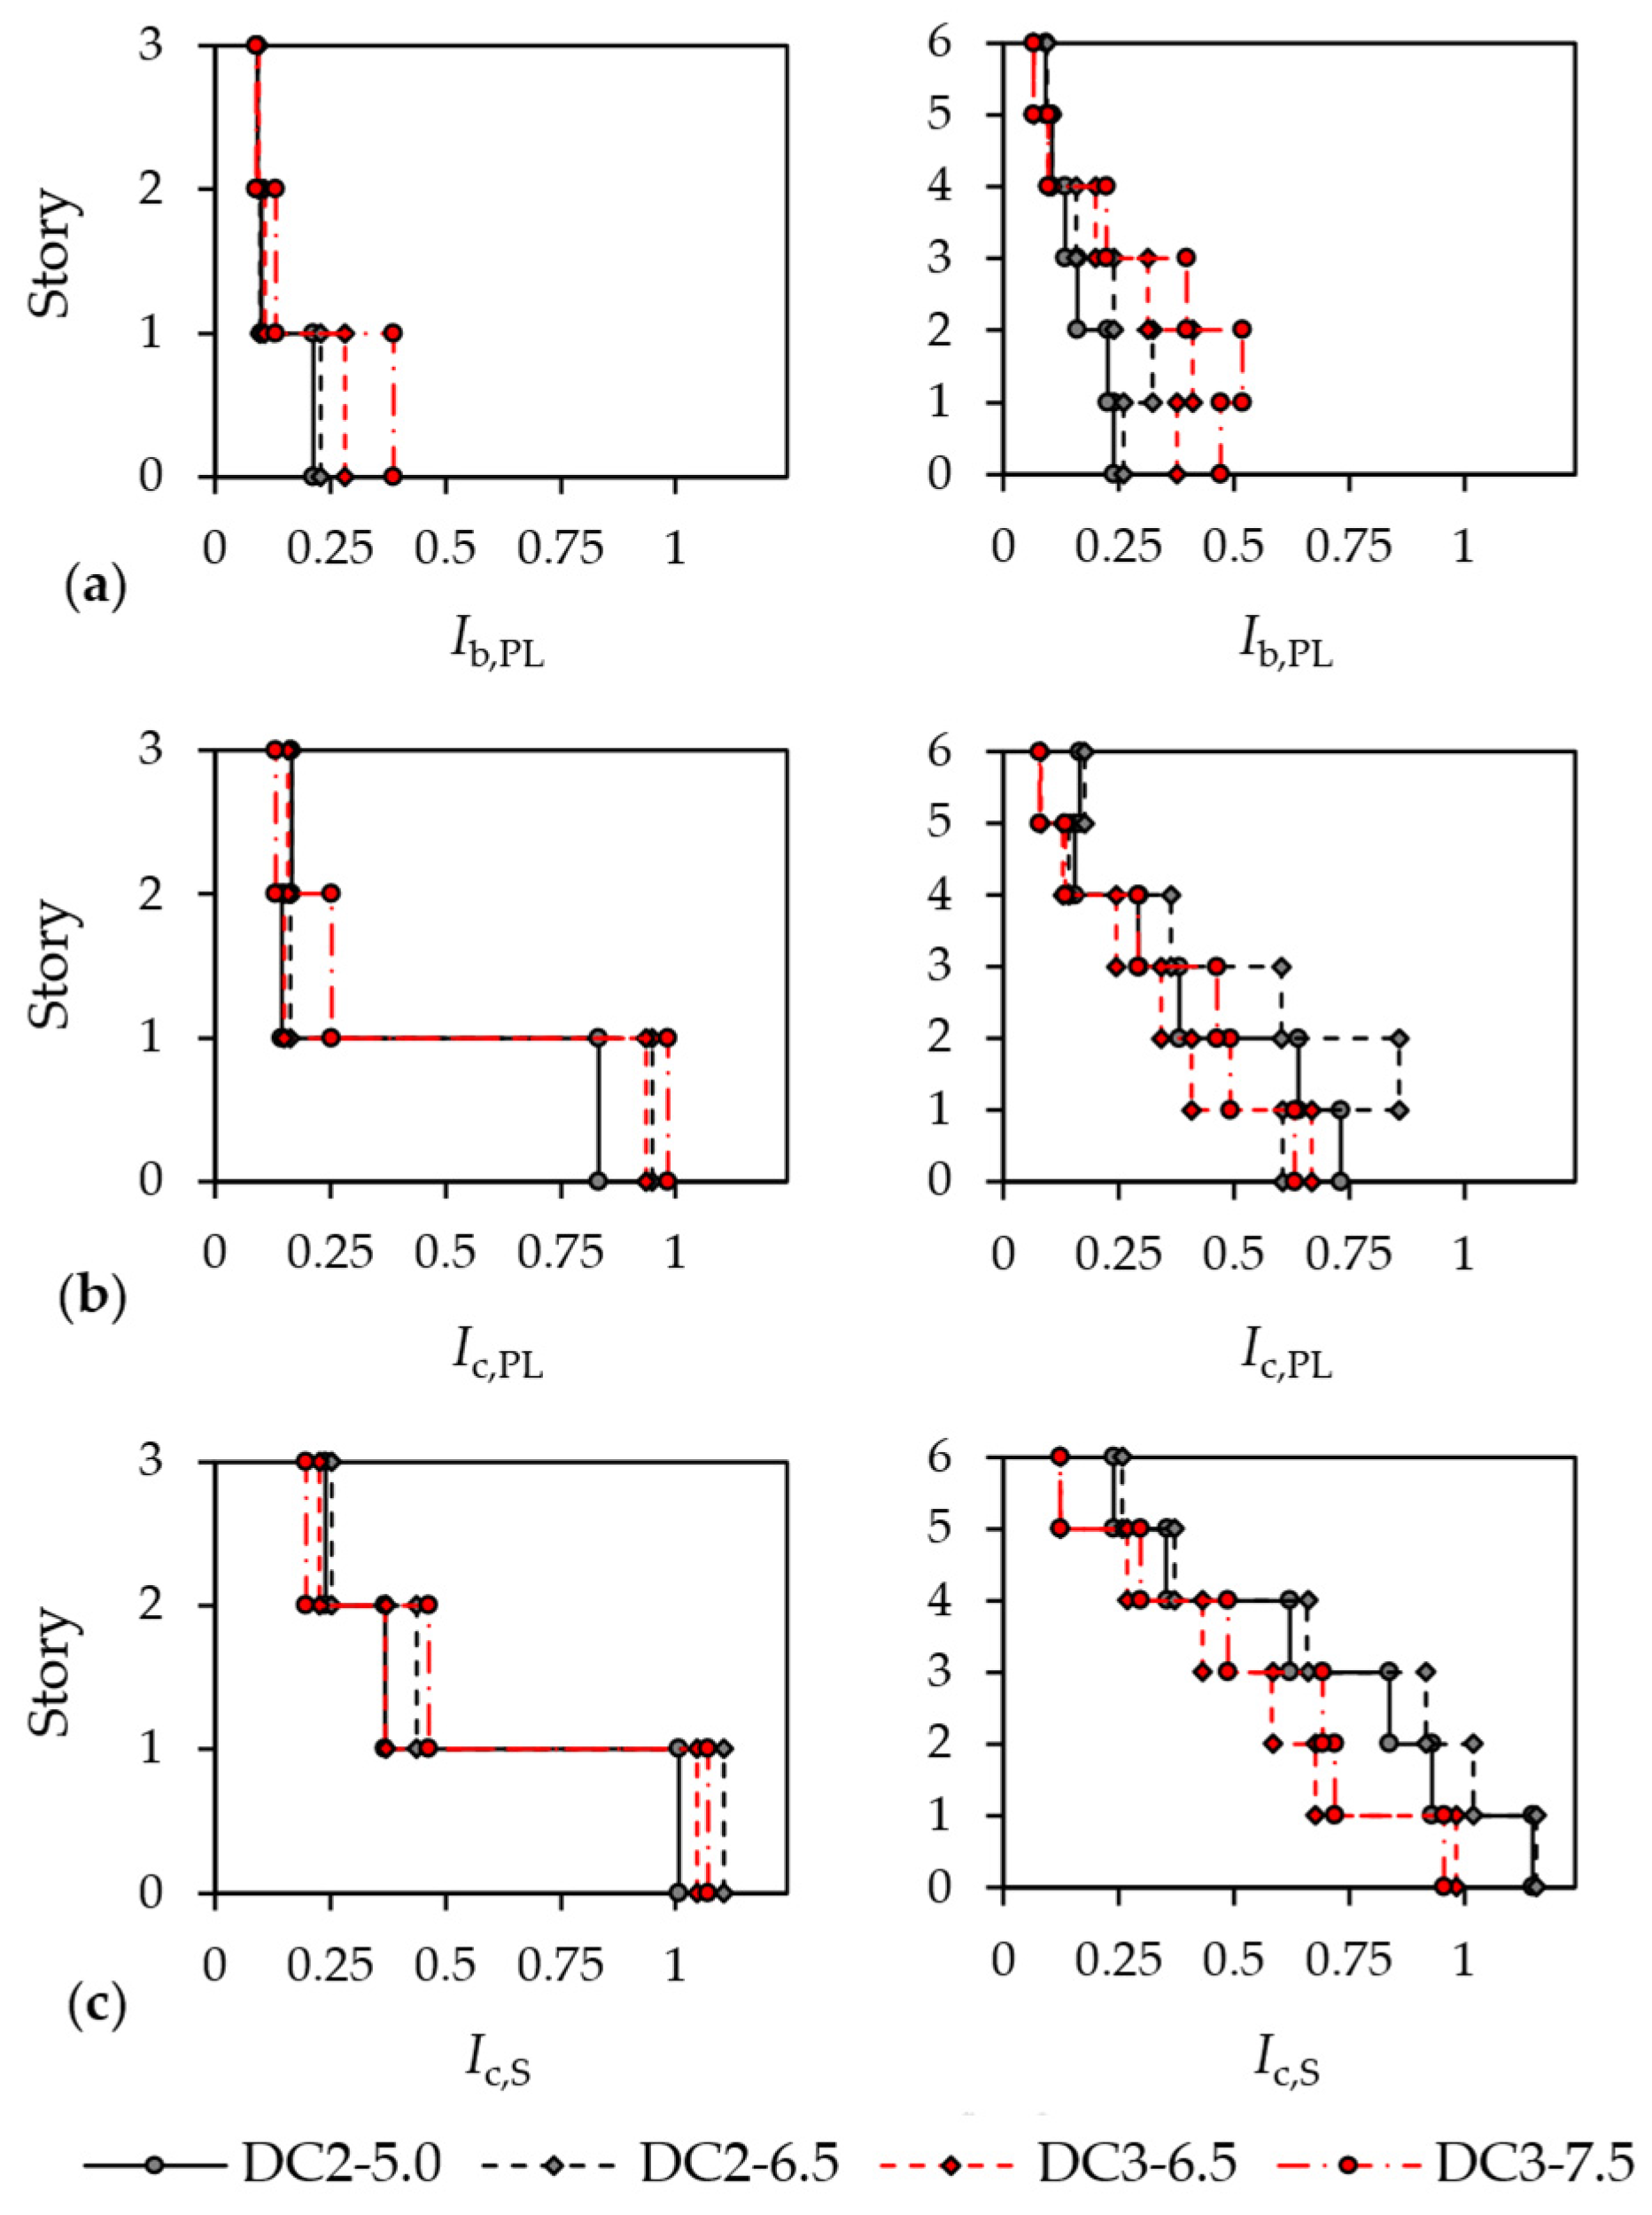
Figure 14 and Figure 15 depict the resistance and stability indices of beams and columns at the NC limit state for the first mode and mass-proportional load patterns, respectively, which were derived from the internal forces obtained from the analyses. The results corresponding to DL and SD are not discussed, since the relevant interaction indices remained below 1 at the corresponding target displacements. Ib,PL and Ic,PL represent the axial force–bending moment interaction indices used to assess the cross-sectional resistance of beams and columns, respectively. The flexural-torsional buckling interaction index Ic,S is used to assess column stability under the combined axial force in compression and bending moment demand. A value greater than 1 indicates that the corresponding EC3 resistance or stability verification is not satisfied. Referring to the beams, the peak Ib,PL values were generally observed at the stories affected by the larger lateral deformation and, consequently, larger brace ductility demand. Nevertheless, the peak values did not exceed 0.5, regardless of building height, ductility class, or lateral load pattern. The peak Ic,PL indices for columns were generally below 1 at the base and progressively decreased with height. The mass-proportional pattern produced slightly larger indices in some lower-story columns, consistent with the greater concentration of drift and brace ductility demand at these levels. These results indicate that cross-sectional resistance was generally not critical for beams and columns at the NC target displacement. Conversely, column stability represented a more critical aspect of the CBF lateral response. For the three-story frames, the Ic,S indices reached or slightly exceeded 1 at the first story for both ductility classes and lateral load patterns. Larger Ic,S indices were observed for the six-story DC2 frames, for which peak values of approximately 1.1–1.2 were obtained in the lower stories. Conversely, the six-story DC3 frames generally exhibited lower stability indices, although their values were larger than 1 at the base. Overall, while the EC8-1-2 capacity-design rules satisfied cross-sectional verification for beams and columns, the EC3 column stability verifications were not consistently fulfilled under the combined axial compression and bending demand in both DC2 and DC3.
Figure 14.
First-mode lateral load pattern: (a) Ib,PL, (b) Ic,PL, and (c) Ic,S indices at NC limit state.
Figure 15.
Mass-proportional lateral load pattern: (a) Ib,PL, (b) Ic,PL, and (c) Ic,S indices at NC limit state.
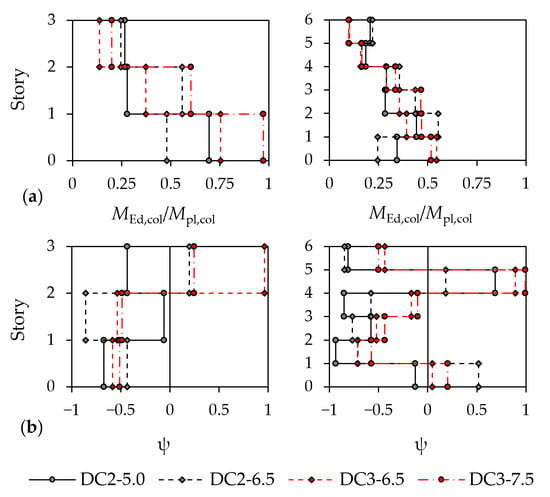
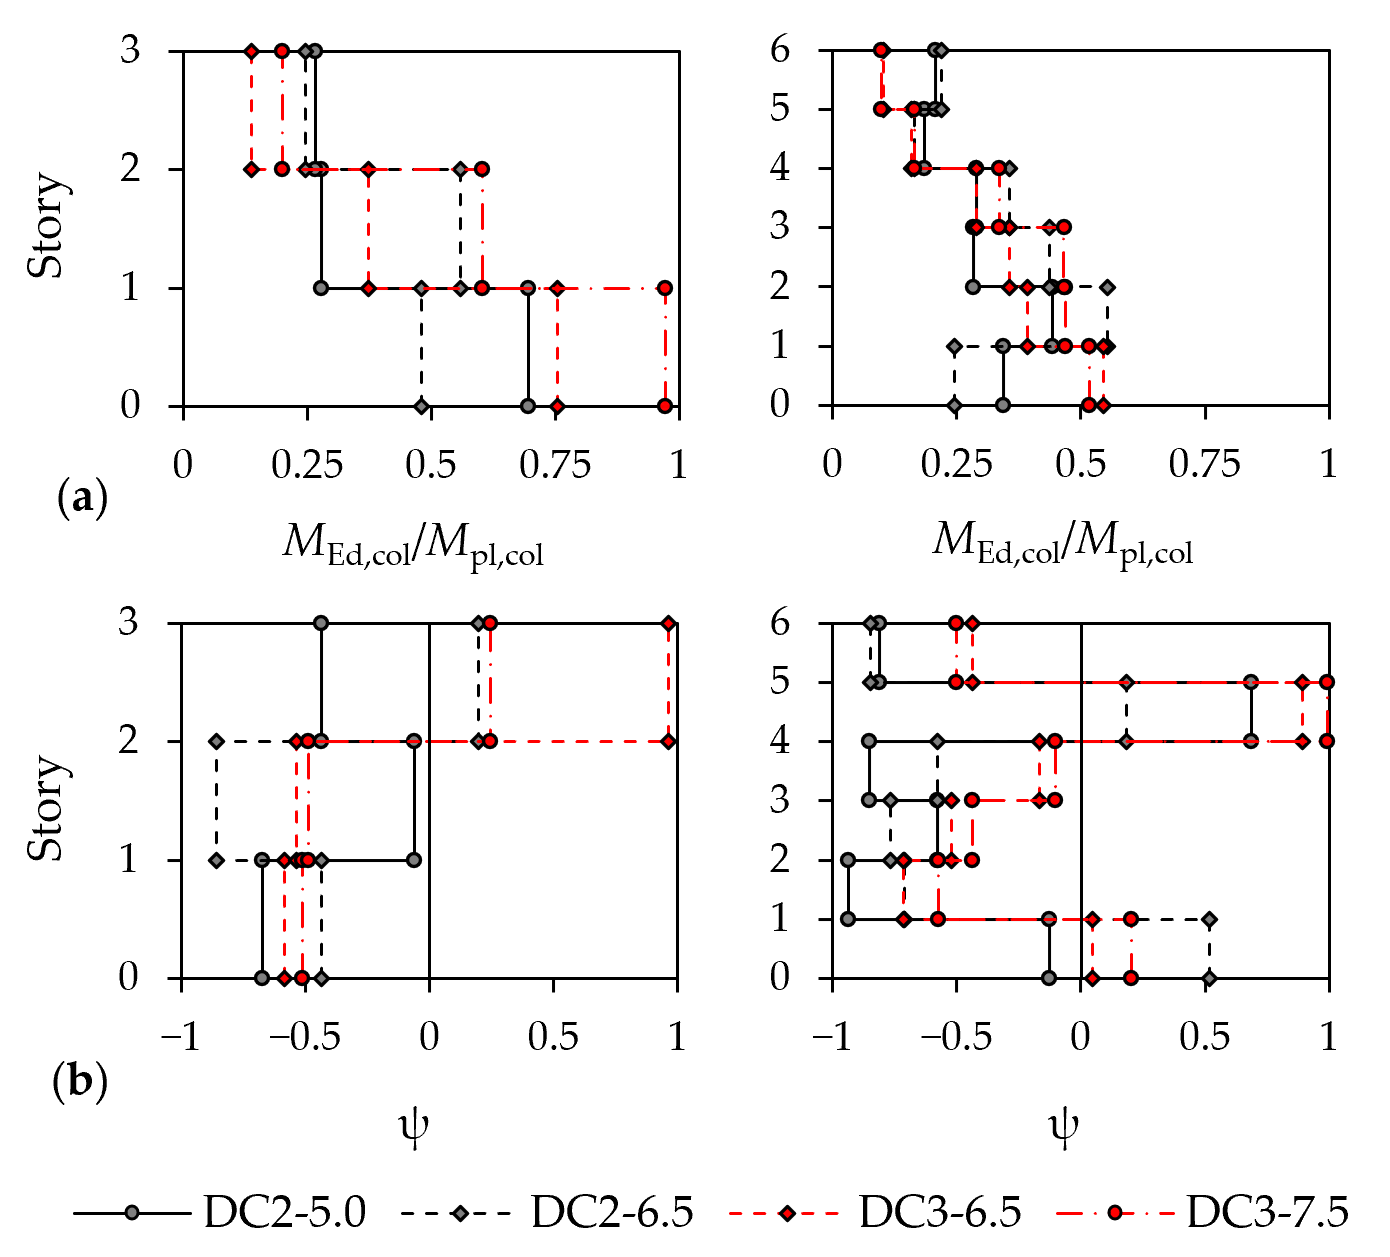
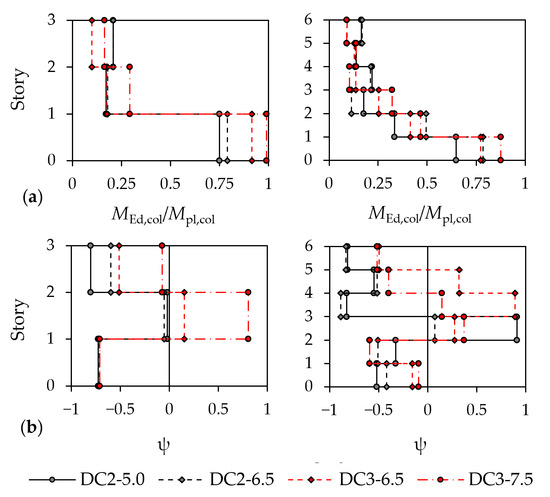
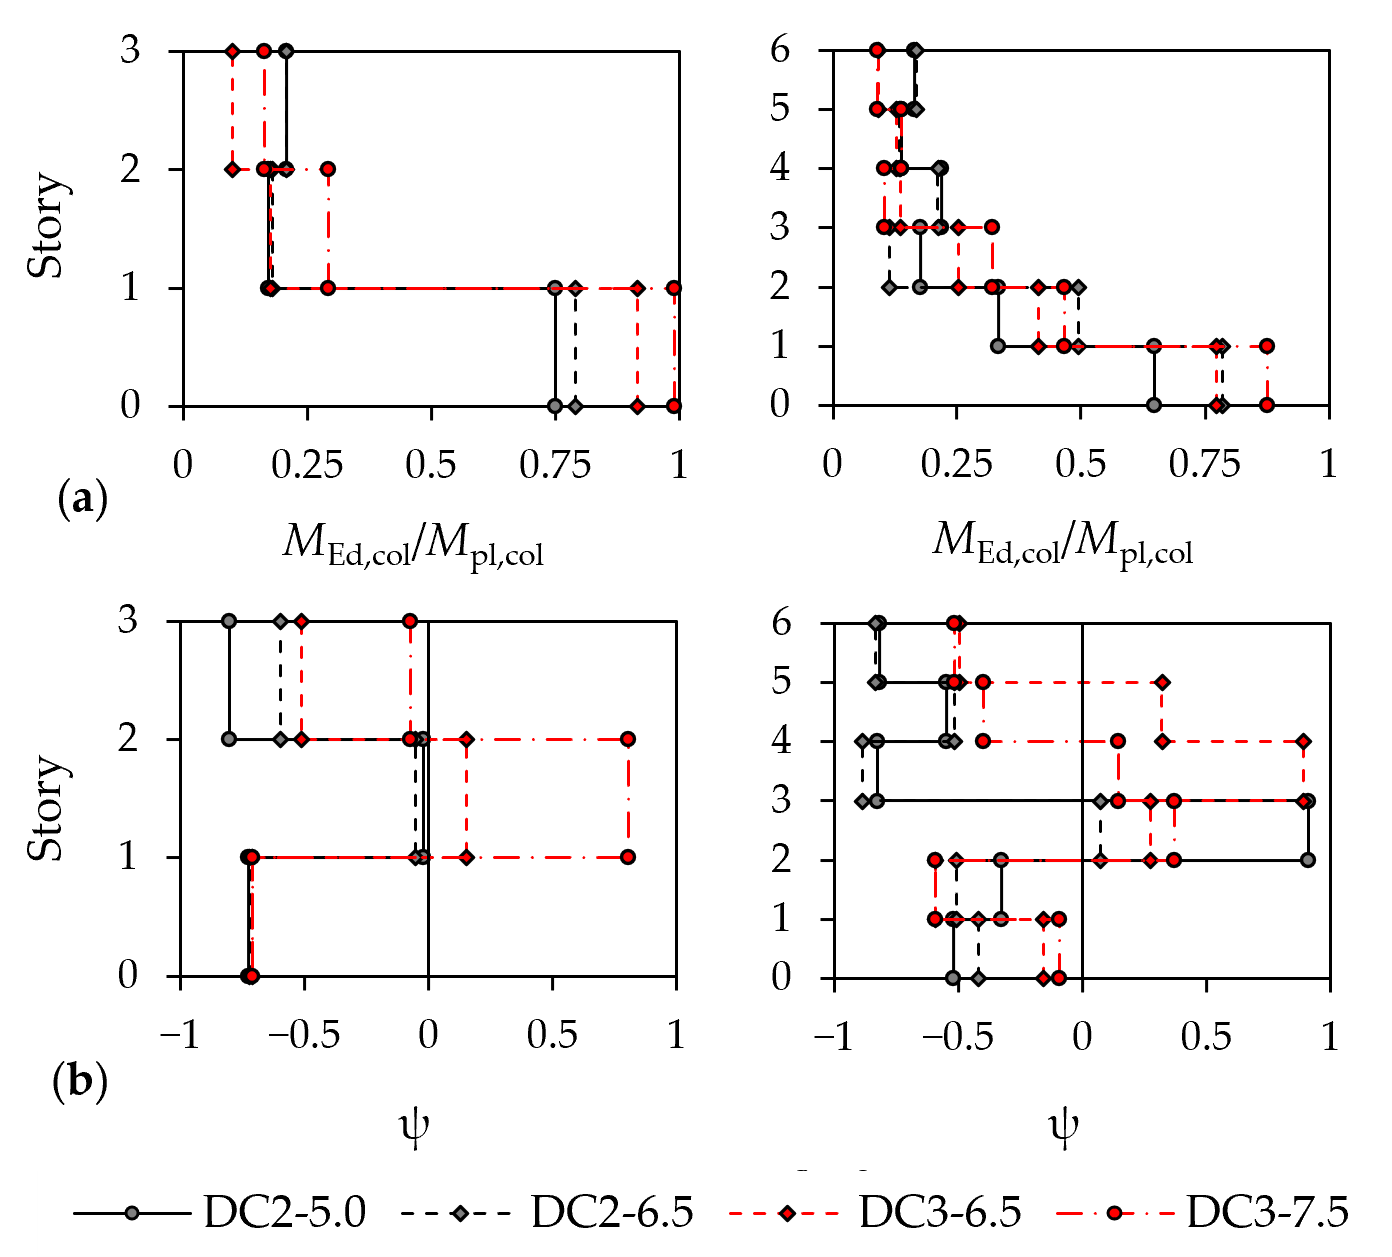
The normalized column flexural demand, MEd,col/Mpl,col, and the corresponding bending moment distribution parameter, ψ, at the NC target displacement are depicted in Figure 16 and Figure 17 for the first-mode and mass-proportional load patterns, respectively. Results for DL and SD limit states are not discussed because the column resistance and stability did not represent a critical aspect of the CBF response at these limit states. The peak MEd,col/Mpl,col ratios were generally concentrated at the base level of the three-story CBFs. The largest values were observed for the DC3-7.5 frame, for which the flexural demand approached the nominal plastic resistance. The demand decreased considerably along the building height, although isolated values between 0.4 and 0.6 in DC3 and between 0.25 and 0.5 in DC2 were obtained at the intermediate levels. The six-story frames exhibited a more uniform distribution of the flexural demand along the building height. Under the first-mode lateral load pattern, the peak MEd,col/Mpl,col at the lower stories generally ranged between 0.30 and 0.55. The mass-proportional pattern produced considerably larger values, reaching approximately 0.65–0.90 at the first story. This increase is consistent with the concentration of lateral deformation in the lower part of the frame, which resulted in a more significant secondary frame action due to the larger relative displacement between adjacent stories. In the second design scenario (i.e., Sδ = 6.5 m/s2), the DC3 frames generally developed greater normalized flexural demands than their DC2 counterparts, particularly at the lower stories. This result is consistent with the larger deformation demand associated with the higher behavior factor adopted in DC3. For the stability verification of DC3 CBF columns, EC8-1-2 prescribes an in-plane bending moment equal to 0.20 Mpl,col, combined with a uniform bending moment distribution corresponding to ψ = 1. The analyses show that the design moment amplitude may considerably underestimate the actual demand at the critical stories. Indeed, MEd,col/Mpl,col exceeded 0.20 in columns at the lower and intermediate stories. Although the comparison with the EC8-1-2 design value regards DC3 CBFs, appreciable bending moments were also observed in DC2 columns, indicating that flexural contributions may be relevant when assessing their stability. Regarding the shape of the bending moment diagram, DC2 columns were predominantly characterized by double-curvature bending moment diagrams, particularly at the lower stories. The DC3 frames more frequently exhibited single-curvature distributions at the intermediate and upper levels, although double-curvature diagrams were generally observed at the base and roof stories. The load pattern also affected the local distribution; nevertheless, no frame consistently developed a uniform bending moment diagram over its full height. ψ values close to 1 occurred only at isolated stories, whereas most profiles were characterized by substantially smaller ψ values, especially at the stories affected by the largest MEd,col/Mpl,col demands.
Figure 16.
First-mode lateral load pattern: (a) MEd,col/Mpl,col and (b) ψ values at NC limit state.
Figure 17.
Mass-proportional lateral load pattern: (a) MEd,col/Mpl,col and (b) ψ values at NC limit state.
4. Conclusions
This study discussed the lateral response of three- and six-story X-CBFs designed according to the second generation of Eurocode 8 for different seismic-action levels and ductility classes. Nonlinear static analyses were performed considering both first-mode and mass-proportional lateral load patterns. The capacity curves of the equivalent SDOF systems were used to calculate the target displacements at the DL, SD, and NC limit states and to evaluate the CBF lateral performance. The following conclusions solely apply to the low- and medium-rise CBFs considered in this study.
All the designed frames exhibited significant lateral overstrength and a stable global post-yield response up to the NC target displacement. The qS and qR components derived from the pushover curves met or exceeded the corresponding EC8-1-2 design values. The main difference between DC2 and DC3 is related to the overall ductility component, qD, which is consistently larger for DC3 and generally decreases with building height. The lateral load pattern had a limited influence on the q-factor components, although the mass-proportional distribution produced lower qD values in some six-story frames.
The intended dissipative mechanism, with brace buckling in compression and yielding in tension, was observed for all the examined frames at both SD and NC limit states. The first-mode distribution produced a more uniform response along the building height, whereas the mass-proportional pattern concentrated drift and brace demand at the lower stories, particularly in the six-story frames. Peak IDRs at NC remained below approximately 1.5% and 1.8% for the three- and six-story frames, respectively. DC3 generally resulted in larger brace ductility demands than DC2. The roof-story braces of the six-story DC3 frames remained essentially elastic, consistent with the corresponding EC8-1-2 design assumption.
The capacity design rules prevented significant yielding of beams and columns, while column stability was more critical as the EC3 member checks were not consistently satisfied. The stability indices reached or exceeded unity at the lower stories in both ductility classes, with the largest values, approximately 1.1–1.2, obtained for the six-story DC2 frames. The DC2 columns developed appreciable in-plane moments, although their moment diagrams were predominantly characterized by double-curvature distributions. In DC3, the peak bending moments generally exceeded the EC8-1-2 design value of 0.20 Mpl,col, whereas the corresponding distributions were less severe than the uniform shape considered in the design. Despite the more favorable bending moment shape, the calculated flexural demand was sufficiently large to result in column stability indices larger than 1 when combined with axial forces in compression developed in the plastic mechanism.
Overall, the EC8-1-2 provisions led to a satisfactory system-level response, but the EC3 column stability verifications were not consistently satisfied under the combined axial compression and bending demand. These conclusions are limited to the low- and medium-rise X-CBFs, which satisfy the EC8 regularity criteria in plan and elevation and were assessed through nonlinear static analyses. Future studies should investigate additional building heights and structural configurations using more refined analysis methods, such as nonlinear response-history analyses. Detailed local finite element models of the critical columns and their connections, using shell elements or beam formulations incorporating warping, should also be considered to investigate the development of instability and the influence of imperfections and restraint conditions. Particular attention should also be devoted to the influence of different types of beam-to-column joints (i.e., pinned, fully rigid and semi-rigid in flexure) on column seismic demand. These investigations should verify the observed trends and provide a broader basis for refining the column design provisions in future generations of the Eurocodes.
Author Contributions
Conceptualization, M.D., M.G. and R.L.; methodology, M.D., M.G. and R.L.; software, M.G.; validation, M.D. and M.G.; formal analysis, M.D. and M.G.; investigation, M.D. and M.G.; data curation, M.G.; writing—original draft preparation, M.G.; writing—review and editing, M.D., M.G., and R.L.; visualization, M.D. and M.G.; supervision, M.D. and R.L.; project administration, R.L.; funding acquisition, R.L. All authors have read and agreed to the published version of the manuscript.
Funding
This research received no external funding.
Data Availability Statement
The original contributions presented in this study are included in the article. Further inquiries can be directed to the corresponding author.
Conflicts of Interest
The authors declare no conflicts of interest.
References
- EN 1998-1:2004; Eurocode 8: Design of Structures for Earthquake Resistance—Part 1: General Rules, Seismic Actions and Rules for Buildings. European Committee for Standardization (CEN): Brussels, Belgium, 2004.
- Marino, E.M.; Nakashima, M. Seismic performance and new design procedure for chevron-braced frames. Earthq. Eng. Struct. Dyn. 2006, 35, 433–452. [Google Scholar] [CrossRef] [Scilit]
- Longo, A.; Montuori, R.; Piluso, V. Plastic design of seismic resistant V-braced frames. J. Earthq. Eng. 2008, 12, 1246–1266. [Google Scholar] [CrossRef] [Scilit]
- Bosco, M.; Brandonisio, G.; Marino, E.M.; Mele, E.; De Luca, A. Ω* method: An alternative to Eurocode 8 procedure for seismic design of X-CBFs. J. Constr. Steel Res. 2017, 134, 135–147. [Google Scholar] [CrossRef] [Scilit]
- Costanzo, S.; D’Aniello, M.; Landolfo, R. Proposal of design rules for ductile X-CBFs in the framework of Eurocode 8. Earthq. Eng. Struct. Dyn. 2019, 48, 124–151. [Google Scholar] [CrossRef] [Scilit]
- Barbagallo, F.; Bosco, M.; Marino, E.M.; Rossi, P.P. Proposal and validation of a design procedure for concentrically braced frames in the chevron configuration. Earthq. Eng. Struct. Dyn. 2021, 50, 3041–3063. [Google Scholar] [CrossRef] [Scilit]
- Mahmoudi, B.; Imanpour, A. Seismic design of steel chevron and split-X concentrically braced frames. Earthq. Eng. Struct. Dyn. 2025, 54, 2565–2585. [Google Scholar] [CrossRef] [Scilit]
- Gnazzo, M.; Mahmoudi, B.; D’Aniello, M.; Imanpour, A.; Landolfo, R. Seismic design and response of inverted-V CBFs compliant with European and Canadian standards. Eng. Struct. 2026, 363, 123071. [Google Scholar] [CrossRef] [Scilit]
- Bosco, M. Influence of uncertainties on the seismic performance assessment of chevron braced frames. Eng. Struct. 2023, 294, 116594. [Google Scholar] [CrossRef] [Scilit]
- Bosco, M.; Fiamingo, A.; Massimino, M.R.; Rossi, P.P. An assessment of the seismic performance of EC8-compliant CBFs taking into account the role of soil: A case study. Buildings 2024, 14, 2161. [Google Scholar] [CrossRef] [Scilit]
- EN 1998-1-1:2024; Eurocode 8: Design of Structures for Earthquake Resistance—Part 1-1: General Rules and Seismic Action. European Committee for Standardization (CEN): Brussels, Belgium, 2024.
- EN 1998-1-2:2026; Eurocode 8: Design of Structures for Earthquake Resistance—Part 1-2: Buildings. European Committee for Standardization (CEN): Brussels, Belgium, 2026.
- Fajfar, P. A nonlinear analysis method for performance-based seismic design. Earthq. Spectra 2000, 16, 573–592. [Google Scholar] [CrossRef] [Scilit]
- Gnazzo, M.; D’Aniello, M.; Landolfo, R. Nonlinear Response of EC8-Compliant Dissipative Steel Concentrically Braced Frames Under Seismic Loading. In Congress of the Italian College of Steel Technicians 2026; Lecture Notes in Civil Engineering; Zanon, R., Nastri, E., Simoncelli, M., Paolacci, F., Eds.; Springer: Cham, Switzerland, 2026; Volume 942, pp. 712–722. [Google Scholar] [CrossRef] [Scilit]
- EN 1993-1-1:2022; Eurocode 3: Design of Steel Structures—Part 1-1: General Rules and Rules for Buildings. European Committee for Standardization (CEN): Brussels, Belgium, 2022.
- The Steel Construction Institute; The British Constructional Steelwork Association. Joints in Steel Construction: Simple Joints to Eurocode 3; SCI P358; SCI and BCSA: London, UK, 2014. [Google Scholar]
- McKenna, F.; Scott, M.H.; Fenves, G.L. Nonlinear finite-element analysis software architecture using object composition. J. Comput. Civ. Eng. 2010, 24, 95–107. [Google Scholar] [CrossRef] [Scilit]
- Spacone, E.; Filippou, F.C.; Taucer, F.F. Fibre beam-column model for non-linear analysis of R/C frames: Part I. Formulation. Earthq. Eng. Struct. Dyn. 1996, 25, 711–725. [Google Scholar] [CrossRef] [Scilit]
- D’Aniello, M.; La Manna Ambrosino, G.; Portioli, F.; Landolfo, R. Modelling aspects of the seismic response of steel concentric braced frames. Steel Compos. Struct. 2013, 15, 539–566. [Google Scholar] [CrossRef] [Scilit]
- Sen, A.D.; Roeder, C.W.; Lehman, D.E.; Berman, J.W. Nonlinear modeling of concentrically braced frames. J. Constr. Steel Res. 2019, 157, 103–120. [Google Scholar] [CrossRef] [Scilit]
- Ashrafi, A.; Imanpour, A. Seismic response of steel multi-tiered eccentrically braced frames. J. Constr. Steel Res. 2021, 181, 106600. [Google Scholar] [CrossRef] [Scilit]
- Hsiao, P.-C.; Lehman, D.E.; Roeder, C.W. Improved analytical model for special concentrically braced frames. J. Constr. Steel Res. 2012, 73, 80–94. [Google Scholar] [CrossRef] [Scilit]
- Mohsenzadeh, V.; Wiebe, L. Effect of beam-column connection fixity and gravity framing on the seismic collapse risk of special concentrically braced frames. Soil Dyn. Earthq. Eng. 2018, 115, 685–697. [Google Scholar] [CrossRef] [Scilit]
- Stoakes, C.D.; Fahnestock, L.A. Cyclic flexural testing of concentrically braced frame beam-column connections. J. Struct. Eng. 2011, 137, 739–747. [Google Scholar] [CrossRef] [Scilit]
- Palmer, K.D.; Roeder, C.W.; Lehman, D.E.; Okazaki, T.; Shield, C.K.; Powell, J. Concentric X-braced frames with HSS bracing. Int. J. Steel Struct. 2012, 12, 443–459. [Google Scholar] [CrossRef] [Scilit]
- Fragiadakis, M.; Vamvatsikos, D.; Aschheim, M. Application of nonlinear static procedures for the seismic assessment of regular RC moment frame buildings. Earthq. Spectra 2014, 30, 767–794. [Google Scholar] [CrossRef] [Scilit]

Disclaimer/Publisher’s Note: The statements, opinions and data contained in all publications are solely those of the individual author(s) and contributor(s) and not of MDPI and/or the editor(s). MDPI and/or the editor(s) disclaim responsibility for any injury to people or property resulting from any ideas, methods, instructions or products referred to in the content. |
© 2026 by the authors. Licensee MDPI, Basel, Switzerland. This article is an open access article distributed under the terms and conditions of the Creative Commons Attribution (CC BY) license.