


Abstract
The shear response of steel-reinforced elastomeric bearings (SREBs) governs their performance in bridges and base-isolated buildings, yet the material and geometric nonlinearities involved are not captured by the simplified design rules of current standards. In this study, cyclic shear tests were performed on nine groups of rectangular low-damping SREBs with different dimensions and lower values of the shape factor to determine the apparent values of the shear modulus and shear stiffness. Uniaxial compression and tensile tests were also performed on rubber specimens to calibrate the appropriate built-in material models for the finite element (FE) simulations of shear tests. Geometric characteristics had a limited influence on the apparent values of the shear modulus, with rollover at the bearing edges as the main source of variation. FE plane-strain models reproduced the three-dimensional shear response with negligible loss of accuracy at substantially lower computational cost, rigid plates may replace the realistic elastic–plastic properties of steel without compromising accuracy, and moderate compressive preload had a negligible effect on shear response. Material models calibrated from compression tests reproduced the nonlinear and hysteretic behavior more accurately than those calibrated from tensile tests. A simplified modeling strategy combining plane-strain analysis, rigid reinforcement, and compression-calibrated built-in material models is recommended for the FE analysis of low-damping SREBs in shear.
1. Introduction
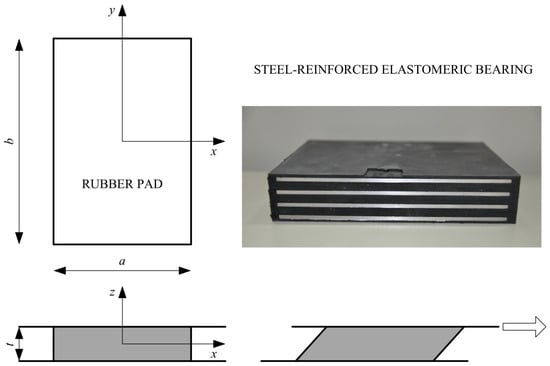
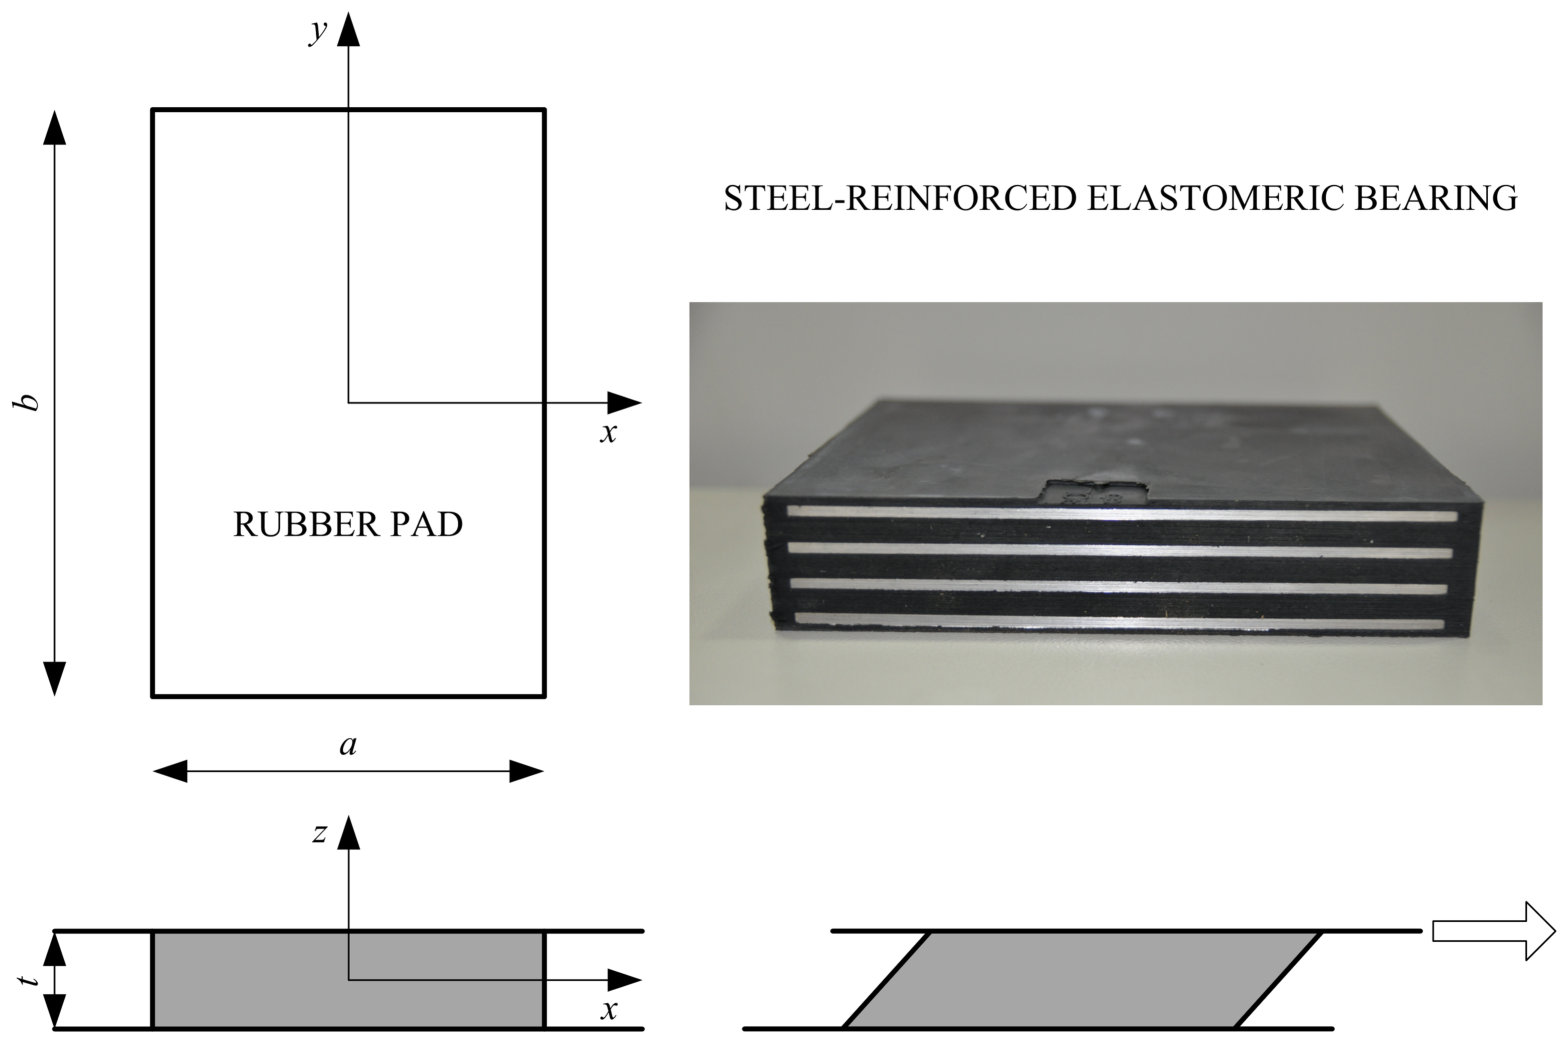
Elastomeric bearings accommodate displacements and rotations of the superstructure through the deformation of the elastomer, i.e., rubber. Owing to their relatively low production cost, easy installation, and favorable mechanical properties, low-damping rubber bearings are predominantly used in bridges, and combined with supplemental dampers, as isolators in base-isolated buildings. Steel-reinforced elastomeric bearings (SREBs) are produced by inserting steel plates between rubber layers, which increases their vertical stiffness (Figure 1). On the other hand, the horizontal, i.e., shear stiffness is not affected by the presence of the reinforcing plates [1].
Figure 1.
Steel-reinforced elastomeric bearing (SREB) in cross-section and a rectangular rubber pad in simple shear.
Although current European standards for elastomeric bearings [2,3] reduce the shear behavior to a small number of design parameters and assume a strictly linear force–displacement relationship, this simplification has long been recognized as inadequate for capturing the actual, highly nonlinear material response [4,5]. The dominant material parameter governing bearing behavior is the shear modulus of the elastomer [6], since both vertical loading and horizontal deformation ultimately induce shear strain in the rubber.
Under service conditions, SREBs are subjected to a combination of compressive and shear loading. The following researchers addressed the influence of compressive load on shear stiffness. Kalfas et al. [7] found that shear stiffness decreases by 12.9% as compression increases to 10 MPa, with a corresponding 29% increase in damping ratio which is consistent with the findings by [8,9,10]. Zhou et al. [11] and Ishii and Kikuchi [12] address the compression–shear interaction primarily through the lens of buckling and critical load rather than the service-level shear stiffness, showing that increasing compression reduces the critical (buckling) load and can precipitate instability at large shear displacements.
One of the issues in the finite element analysis (FEA) of SREBs under compression and shear is the choice between two-dimensional (plane-strain) and three-dimensional (3D) models. The results from Gajewski et al. [13] and Saidou et al. [14] show that, for shear loading, the plane-strain and three-dimensional models produce nearly identical force–displacement responses, whereas for compression loading the two-dimensional model is much stiffer than the three-dimensional one. This discrepancy was attributed to the inability of the plane-strain assumption to capture the lateral bulging of the elastomer under compressive load.
None of the reviewed studies present a direct comparison between finite element (FE) models using rigid reinforcing plates and models using steel plates with realistic elastic or elastic–plastic material properties. However, most researchers model the reinforcing steel plates with actual material properties [14,15,16].
In the numerical analysis of SREBs, both material and geometric nonlinearities must be considered, whereby the modeling of the elastomeric material represents the main challenge due to its complex properties. The modeling of rubber in FE analysis typically proceeds in three steps: the material is first characterized experimentally, a suitable material model is then chosen, and the model is finally calibrated against the measured data [17]. Built-in options for rubber in commercial FE codes include hyperelastic formulations, which may be combined with linear viscoelasticity, permanent set, hysteresis or the Mullins effect [18]. The latter refers to the stress softening exhibited by elastomers under repeated loading, which is strongest in the first loading cycle [19]. More advanced behavior can be captured by user-defined models that treat rubber as a nonlinear viscoelastic [20] or a viscoelastic–elastoplastic [21] material. For model calibration, it is recommended to perform uniaxial tensile or compressive tests with monotonic loading at different strain rates, together with cyclic and stress relaxation tests [17].
In this study, uniaxial compression and tensile tests were performed on rubber specimens to calibrate the appropriate built-in material models. Shear tests were also performed on nine groups of rectangular low-damping SREBs with different dimensions and lower values of the shape factor to determine the apparent values of the shear modulus. Geometrical influences were addressed based on the experimental results. These experimental results were also used to validate the FE simulations and evaluate the usage of simplified modeling procedures. The aim of this study is to offer guidelines for modeling SREBs under moderate compression and shear by considering the plane-strain analysis, rigid steel plates, the influence of the compressive stress and the selection of the appropriate material model as well as calibration test.
The paper is organized as follows. Section 2 presents analytical solutions for the bonded elastomeric pad under shear. The description of the experimental tests and the determination of the apparent shear modulus are given in Section 3. Section 4 presents the FEA of SREBs under shear and Section 5 the experimental characterization of elastomeric material.
The results and discussion are summarized in Section 6. Section 6.1 deals with the determination of the apparent shear modulus based on the experimental results together with the influence of geometry. Section 6.2 and Section 6.3 provide guidelines for the FE modeling of SREBs under shear considering various influences. Section 7 presents the main conclusions.
2. Behavior of Elastomeric Pads Under Shear
In theory, an elastomeric pad bonded between two steel plates under shear is subjected to a horizontal displacement of the top surface relative to the bottom surface (Figure 1), i.e., simple shear. This is treated as a plane-strain state. The constant stress distribution under simple shear represents an idealized stress state. In reality, due to the boundary conditions at the free, unloaded surfaces, the distribution of shear stresses across the height and width of the elastomeric layer is not constant [22].
Except in the case of anchored bearings, friction develops between the bearings and the support plates, leading to rollover at the edge of the bearing at larger horizontal displacements. The rollover causes shear stiffness to decrease with increasing lateral displacement until “full rollover” occurs, after which stiffness increases again [23,24]. In the design of elastomeric bearings, the rollover effect is ignored.
It is also assumed that the behavior of the elastomeric material under shear loading is governed solely by material properties, rather than by geometric characteristics such as the shape factor S and the ratio of the pad sides a/b. The shape factor is defined as the ratio of the loaded area of a single elastomer layer to the area free to deform laterally. Strauss et al. [25] provide an extensive experimental campaign, comparing bearings with shape factors of 8.65 and 20.45 and showing that the sensitivity of the effective shear modulus to horizontal displacement depends strongly on the shape factor: bearings with a higher shape factor (thinner, more numerous elastomer layers) exhibited a more abrupt reduction in shear modulus with increasing shear displacement than bearings with a lower shape factor.
Furthermore, simple shear is, by definition, a state of deformation involving no change in volume, i.e., the assumption of incompressibility applies [26]. The design rules given in the standard EN 1337-3 [2] were established in accordance with these assumptions.
According to the linear theory of elasticity, when a horizontal displacement vx is applied, no normal stresses occur, and the shear stress is constant, given by
where the shear modulus G is a material property that is identical at all points of the elastomeric pad, and the shear strain εq is equal to
τzx = G tan γ,
The design shear stiffness of the elastomeric bearing depends on the shear modulus G, the plan area of the elastomeric bearing A, and the total thickness of the elastomeric material . It is determined by the expression
Under combined compression and shear loading, the shear stiffness decreases as the compressive force P approaches the critical buckling load Pcr, in accordance with the following expression [27]
However, the internal friction that develops within the elastomer has the opposite effect.
3. Shear Test—Specimen Design and Experiment Setup
An SREB is a rectangular or circular block of rubber in which steel plates are embedded as reinforcement. The steel reinforcing plates restrain the lateral bulging of the rubber layers, so that SREBs combine a high compressive stiffness with a low shear stiffness. In this study, the apparent shear modulus of complete elastomeric bearings was determined according to the method described in the standard EN 1337-3 [2]. The bearings investigated are low-damping elastomeric bearings commonly used in bridge engineering. The bearings are made of carbon-filled rubber of 60 IRHD hardness (International Rubber Hardness Degree), with nominal values of the shear modulus G = 0.9 MPa and bulk modulus K = 2000 MPa. American standards specify the same bulk modulus, although a higher value of K = 3100 MPa has also been suggested [28].
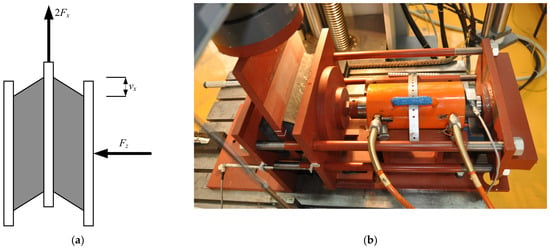
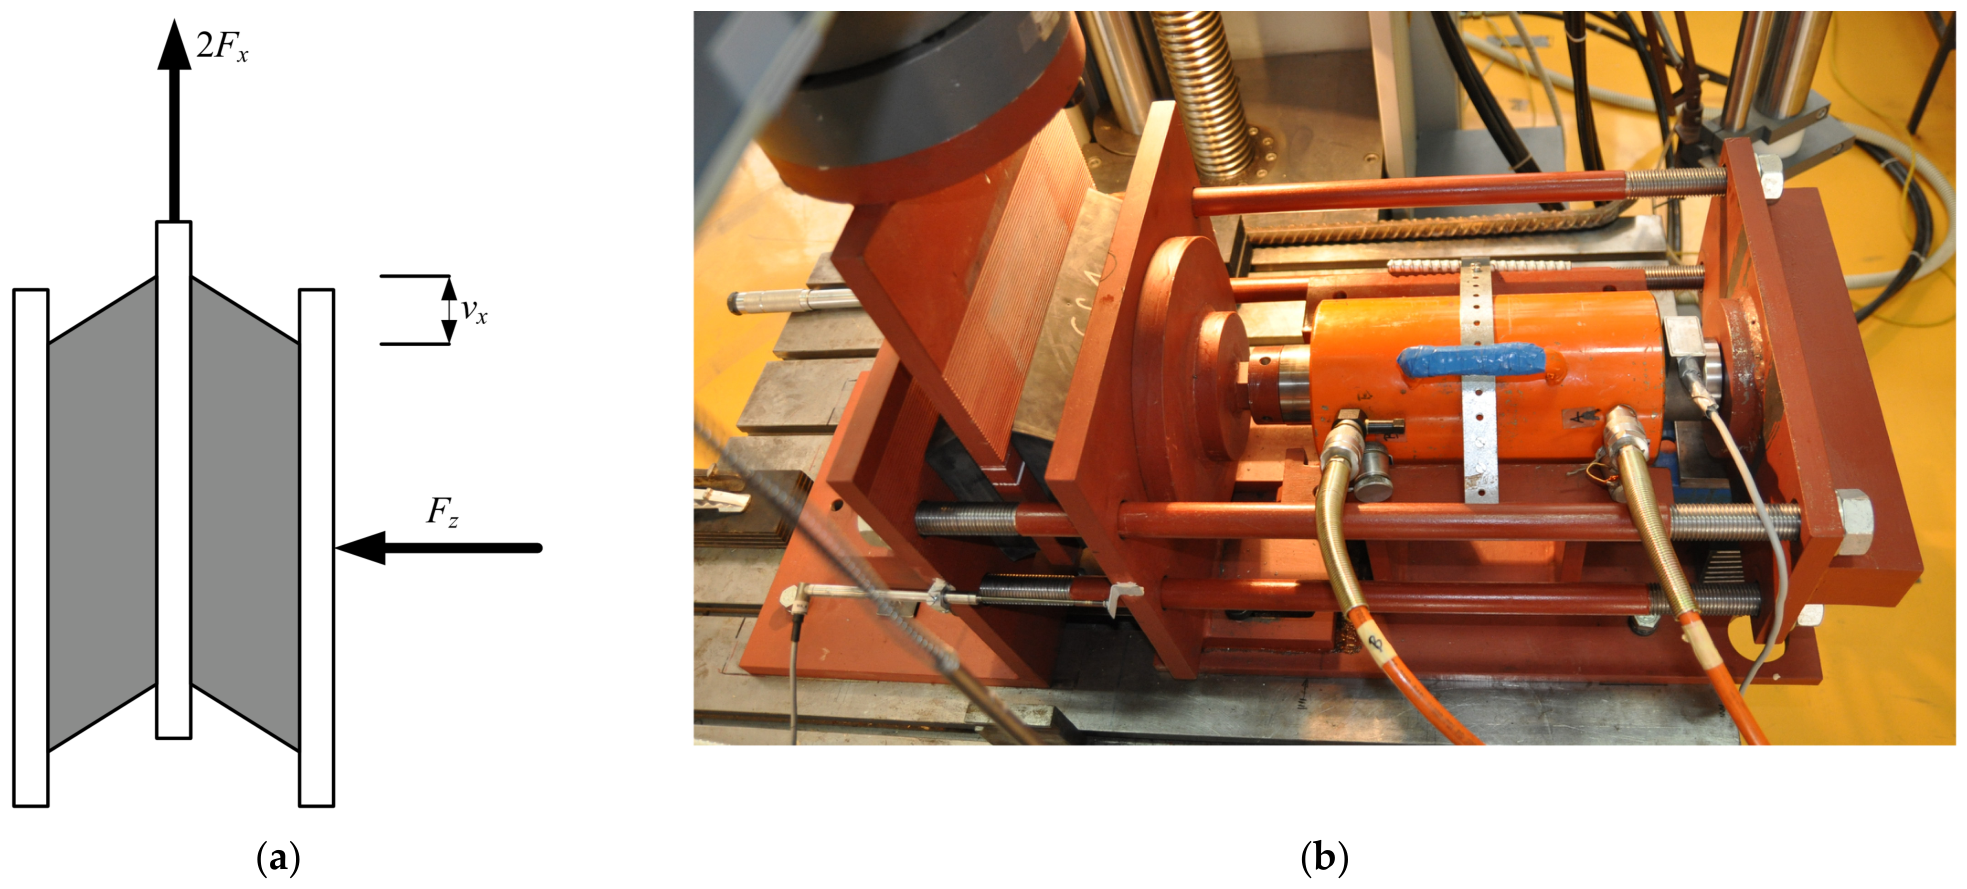
The test consisted of applying a compressive force Fz (compressive stress of 6 MPa) to a pair of identical SREBs separated by a movable steel plate, followed by shear deflection vx. Three shear loading and unloading cycles were performed in both directions at a constant rate of 100 mm/min. Ribbed steel plates were used to prevent slippage of the test specimens. The maximum shear deflection vxm corresponded to 90% of the total rubber thickness, including the top and bottom covers. The test setup and procedure were previously described in [29].
The geometric characteristics of nine groups of bearings and the corresponding test conditions are given in Table 1. Each group designation consists of a number, which indicates the standard bearing size, and a lowercase letter, which denotes the compression molding conditions applied during manufacture. The steel reinforcing plates are surrounded by rubber cover layers, 5 mm thick along the sides and 2.5 mm thick at the top and bottom, which shield them from the environment. The only exception is group 1e, whose top and bottom cover layers are 3 mm thick. Several groups were produced by cutting full-size bearings after manufacture. Within each group, three specimens, i.e., six bearings were tested, for example 1e-I (1e-1, 1e-2), 1e-II (1e-3, 1e-4) and 1e-III (1e-5, 1e-6). All bearings were tested in the direction of the longer dimension b (L was added for length).
Table 1.
Bearing dimensions and loading conditions for each test group.
The shape factor S of a rectangular bearing, i.e., the ratio between the loaded area and the area free to bulge is given by
The dimensions of the bearings were selected considering the load capacity of the static machine with a stability check against buckling according to the following expression
where Ar is the overlapping area between the top plate and the bottom plate when the bearing is displaced horizontally [2,30].
The test setup, adapted to the universal static testing machine, is shown in Figure 2 [29]. Each pair of bearings was first compressed (Fz) horizontally by a hydraulic cylinder (Holmatro (Raamsdonksveer, Netherlands), ±600 kN) acting on the outer steel plates. The shear load (Fx) was then introduced by displacing the central plate vertically with a static testing machine (Zwick/Roell Z600E (Ulm, Germany), ±600 kN), so that each bearing carried one half of the applied force.
Figure 2.
Shear test setup: (a) schematic of the double-shear test; (b) test equipment (adapted from [29]).
During shear loading, the applied shear force and shear deflection were measured. The apparent shear modulus was determined as secant modulus according to the standard EN 1337-3 [2] for elastomeric bearings using the following expression
where the values of the shear forces Fx1 and Fx2 correspond to the shear deflections vx1 = 0.27Tq and vx2 = 0.58Tq. The plan area of the bearing is A.
The effective shear stiffness of SREBs [31] is experimentally determined as
where Fxp and Fxn are the maximum positive and negative shear force and vxp and vxn are the corresponding shear deflections.
The effective viscous damping is determined in the form
where ED is the dissipated energy (area of the hysteresis loop) in a full cycle at the displacement vx.
4. Elastomeric Bearings Under Shear Loading in FEA
As part of this research, FE models were developed in Abaqus 2017 (Dassault Systèmes Simulia Corp., Johnston, RI, USA) to simulate shear tests performed on pairs of elastomeric bearings, as described in Section 3. In the numerical analysis of SREBs, both material and geometric nonlinearities must be considered, whereby the modeling of the elastomeric material represents the main challenge due to its complex properties.
In this study, FE models of SREBs under shear loading were created in Abaqus for all tested bearing groups (1e–9a). The top and bottom surfaces of the bearings without protective coatings on the lateral surfaces (1e and 2c) were tied to two rigid analytical surfaces, since the separation of the bearings from the test plates was not observed during the shear test. For the bearings with protective coatings, displacement between the bearing and the analytical surface in the direction of the shear load was prevented with friction (μ = 1.0), but separation was allowed. The lower analytical surface is unmovable, and the load is applied at the reference point of the upper analytical surface in two steps. In the first step, the compressive force is applied to activate the contact between the rubber and the analytical surfaces and in the second step, shear displacement is applied in the direction of the longer side. The shear test is performed on two identical bearings, while the numerical model consists of only one bearing, due to the symmetry of the test.
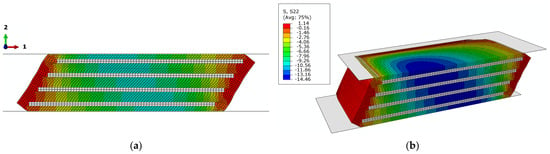
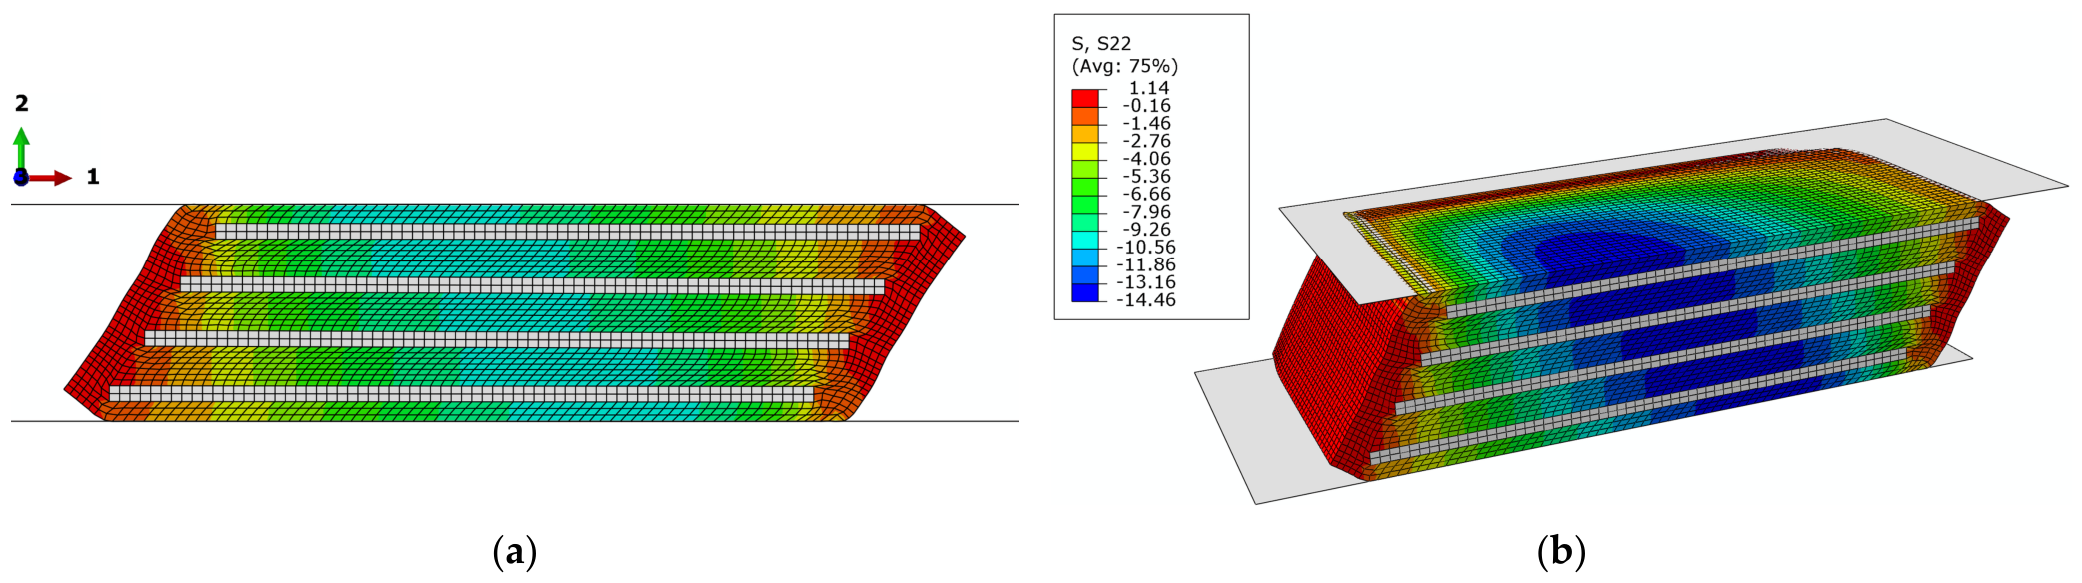
The behavior of rubber under ideal simple shear deformation corresponds to plane-strain state. Since the bearings in this study were subjected to a combination of compression and shear, both plane-strain and 3D numerical models of the same bearing were created and compared to assess the influence of the modeling approach (Figure 3).
Figure 3.
Finite element (FE) model of bearing 9a (100 × 100 × 28 mm) under shear load: (a) plane-strain; (b) 3D. The same legend applies to (a,b).
The two-dimensional (2D) FE models consist of solid 4-node bilinear elements with reduced integration and hourglass control (two translational degrees of freedom in each node). The 3D FE models consist of solid 8-node linear elements with reduced integration and hourglass control (three translational degrees of freedom in each node). The elements are labeled in Abaqus as CPE4RH and C3D8RH, respectively. Hybrid (H) elements are required for fully incompressible and are recommended for nearly incompressible materials. They cannot be used with the built-in Bergström–Boyce (BB) model for a nearly incompressible material. Therefore, the numerical models incorporating BB models were analyzed with hybrid elements and fully incompressible rubber (D1 = 0). The total number of elements in 2D and 3D models for each analyzed group is given in Table 2. A mesh sensitivity analysis showed that further refinement of the element size had a negligible influence on the computed shear force–displacement response.
Table 2.
Element types, number of elements and 3D model symmetry for all bearing groups.
To evaluate the influence of steel plates and the compressive stress on shear properties, rubber was first modeled as an incompressible hyperelastic neo-Hookean (NH) material with G0 = 1 MPa, representing a nonlinear elastic material. The NH model was chosen for its simplicity, as it is defined by only two material parameters: the initial shear modulus and the initial bulk modulus. To compare the 2D and 3D analyses the bulk modulus was set to K = 2000 MPa.
5. Experimental Characterization of the Elastomer
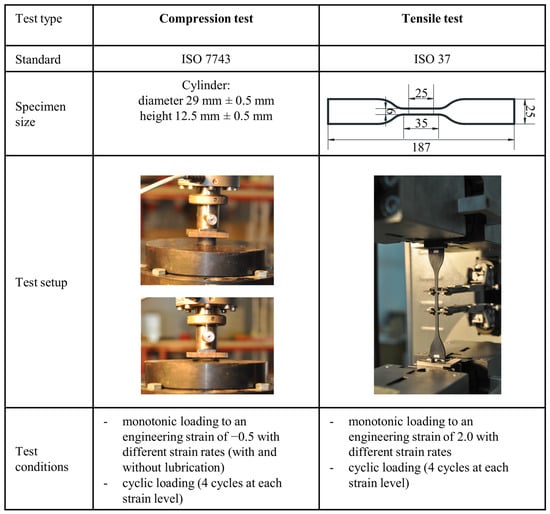
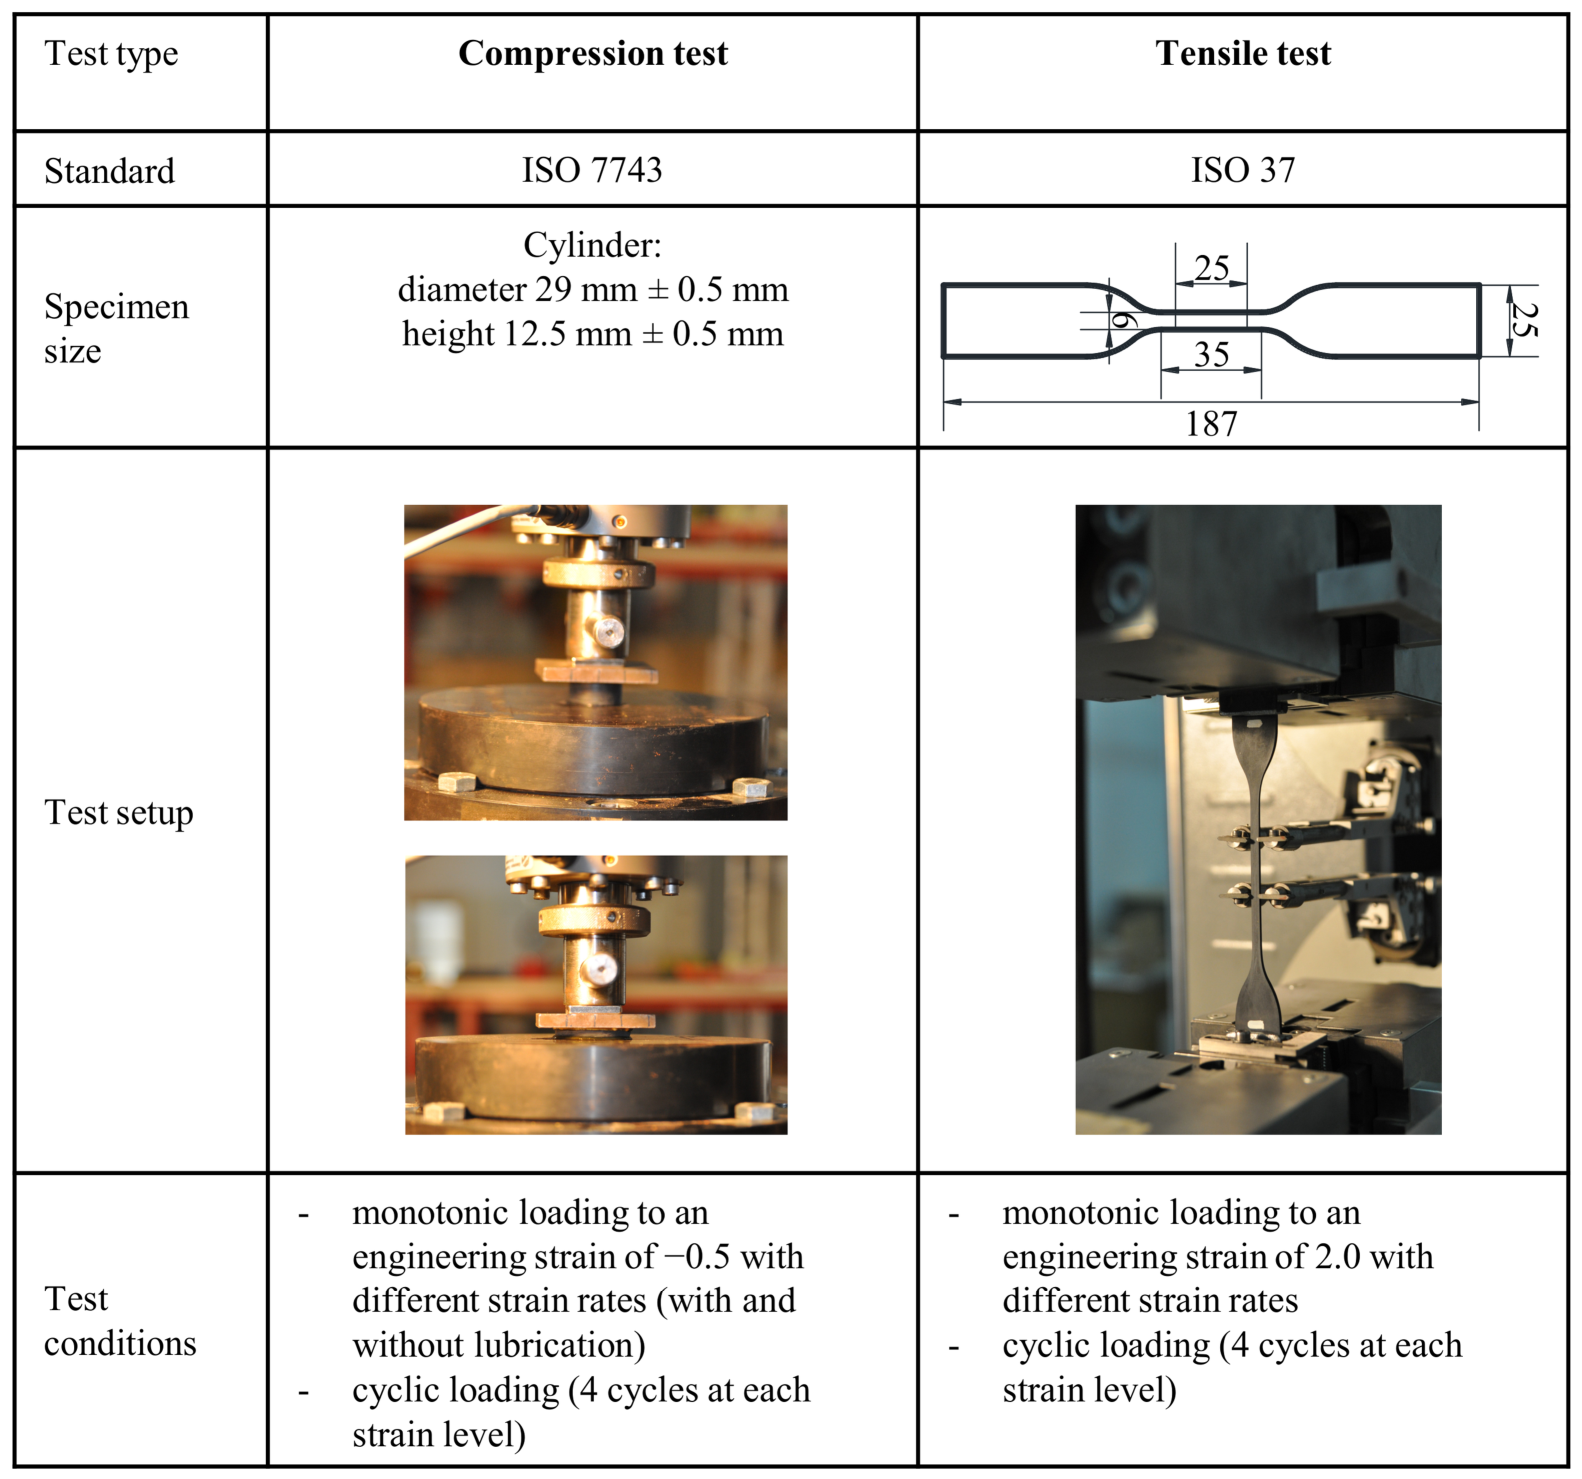
For the purpose of accurately modeling elastomeric materials in the FEA, various experimental tests were conducted to determine the actual material response under different loading conditions. Therefore, tensile and compression tests (Figure 4) were performed on the elastomeric material using standardized methods commonly applied in the quality control of elastomeric bearings [32,33]. The relevant standards were used as guidelines for specimen design and for selecting appropriate strain rates to ensure the most accurate determination of the material properties. All elastomeric material specimens were manufactured from the same batch of rubber compound that was used to produce the bearing specimens. The uniaxial compression tests were partly reported in our previous study [20], where data at lower levels of strain was used to model the compressive behavior of SREBs. The tensile tests are reported here for the first time.
Figure 4.
Experiments for material model calibration of elastomers.
The compressive behavior of elastomeric materials depends not only on their intrinsic material properties but also on geometric characteristics. To minimize the influence of specimen geometry, compression tests were performed with lubrication applied to the steel plates between which the specimen is placed. Lubricating the steel plates promotes a homogeneous compressive deformation of the elastomer pad by allowing the upper and lower surfaces of the specimen to slide freely against the plates with minimal friction.
6. Results and Discussion
6.1. Results of the Shear Tests on Elastomeric Bearings
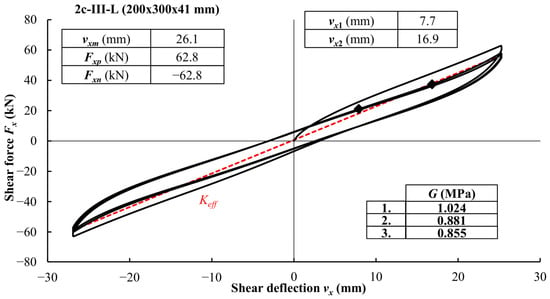
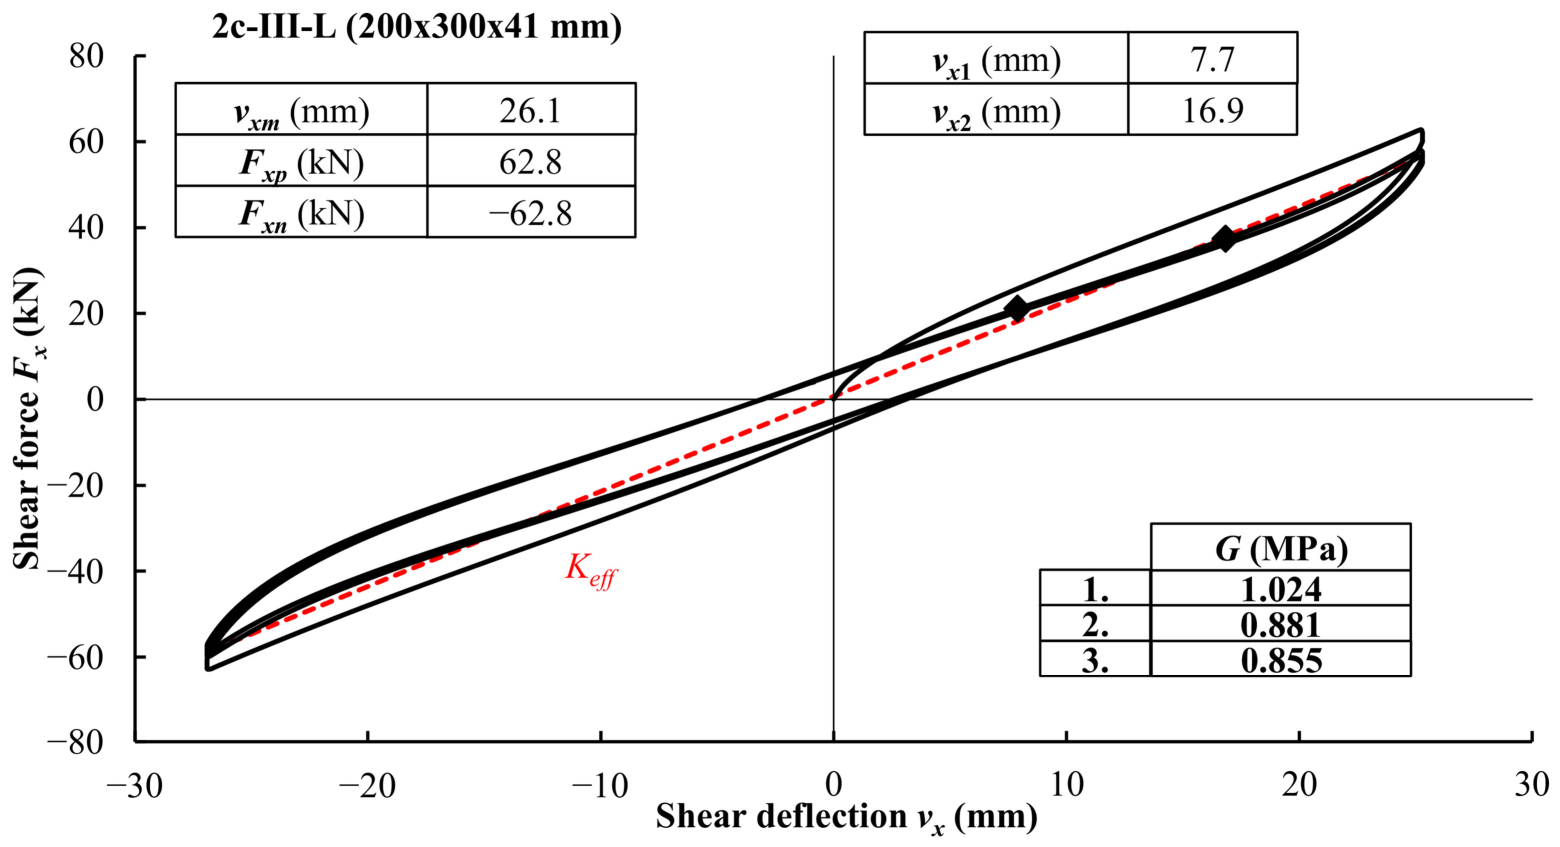
The results of the cyclic shear test are presented for specimen 2c-III-L (Figure 5). The other bearings exhibit very similar hysteretic behavior under shear loading with narrow hysteresis loops. In each of the nine groups, three specimens, i.e., six bearings, were tested in the direction of the bearing length.
Figure 5.
Results of shear modulus test on bearing 2c-III-L.
For shear strains εqx within the specified range (0.27–0.58), the material nonlinearity is negligible and the value of the shear modulus is approximately constant. At smaller strains, the shear modulus value is higher due to a more pronounced orientation of the macromolecules in the direction of loading, while at larger strains it is affected by warping of the bearings and a greater contribution of the reinforcement.
The apparent values of shear modulus were determined based on the experimental results according to Equation (7) for all three cycles and the average values are given in Table 3. Considering the Mullins effect, the relevant value of shear modulus in quality control is the value determined in the second cycle. Compared to the first cycle, the values of the shear modulus determined in the second cycle are on average 14.7% lower, while the difference between the second and the third cycle is on average 3.1%. Although the shear modulus is a relevant property for elastomeric bearings, the values of the effective shear stiffness were also determined according to Equation (8) and given in Table 3 for the third cycle. The results for group 3d were partly reported in [29].
Table 3.
Apparent values of the shear modulus and shear stiffness.
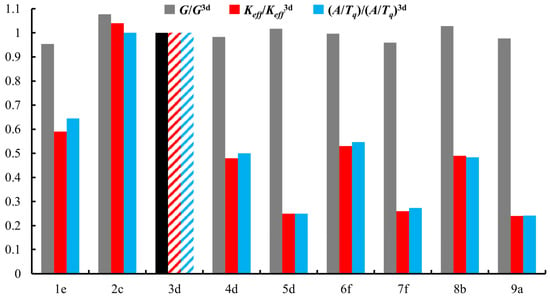
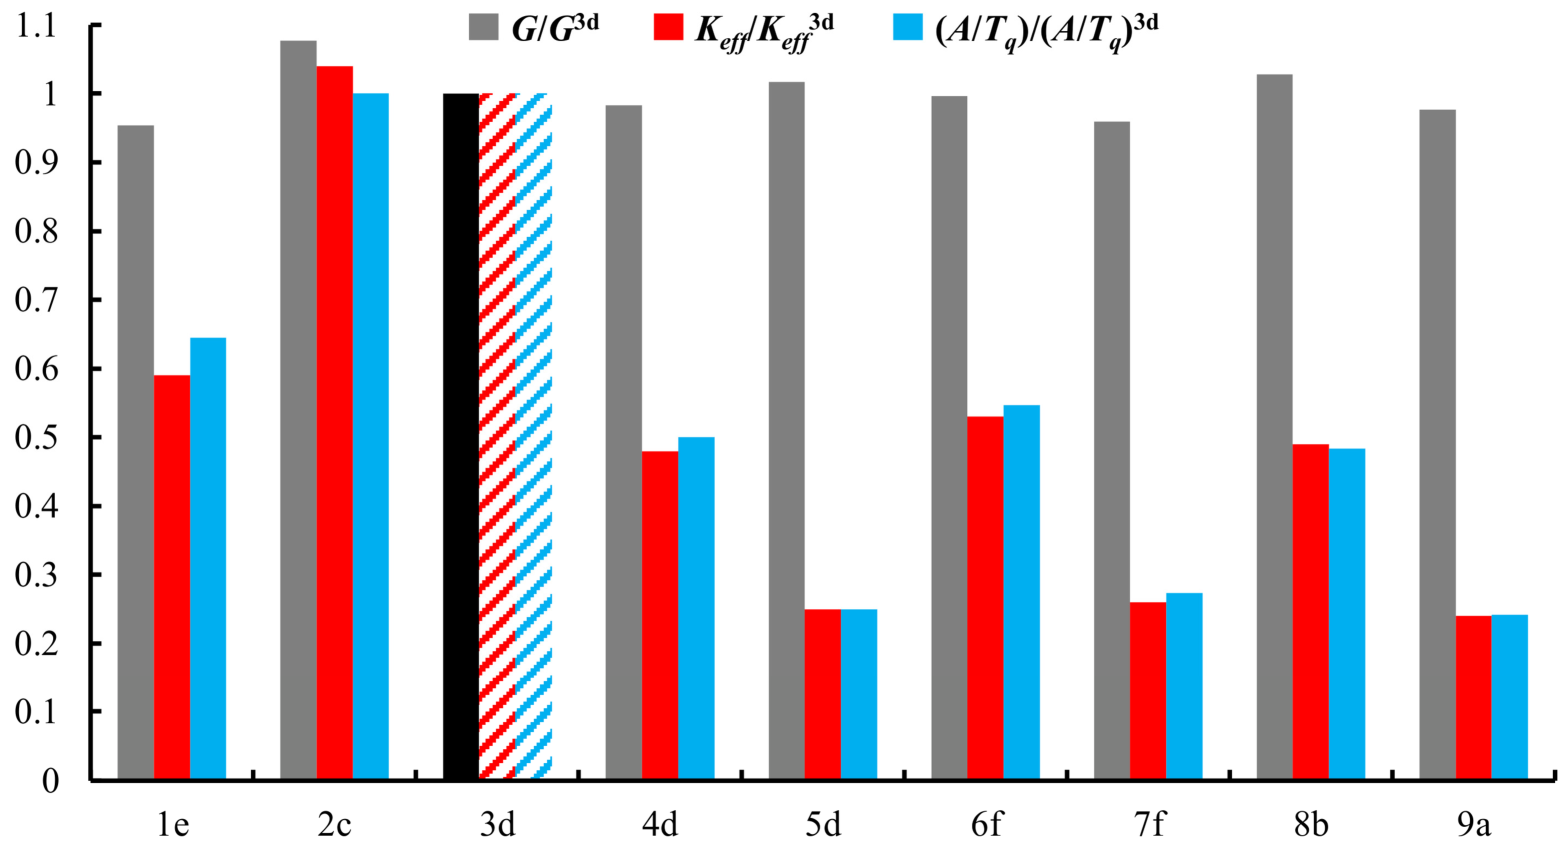
To analyze the influence of geometrical characteristics on the shear modulus and shear stiffness of SREBs, the standard 3d bearing (200 × 300 × 41 mm) was determined as a reference bearing. The experimentally determined values of shear modulus and shear stiffness for all bearing groups were normalized to the 3d group in terms of G/G3d and , as shown in Figure 6. Comparing the experimental values of shear modulus obtained in the other groups with the value obtained for the reference bearing, a deviation of −5% to +8% was observed. In the case of shear stiffness, the influence of geometric characteristics is observed in relation to the ratio A/Tq according to Equation (3).
Figure 6.
Normalized values of the shear modulus (2nd cycle) and shear stiffness (3rd cycle) for different geometries of rectangular bearings.
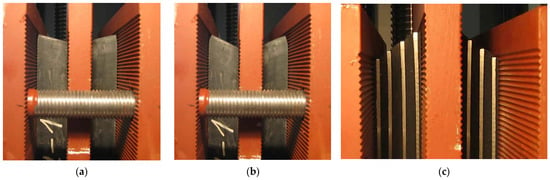
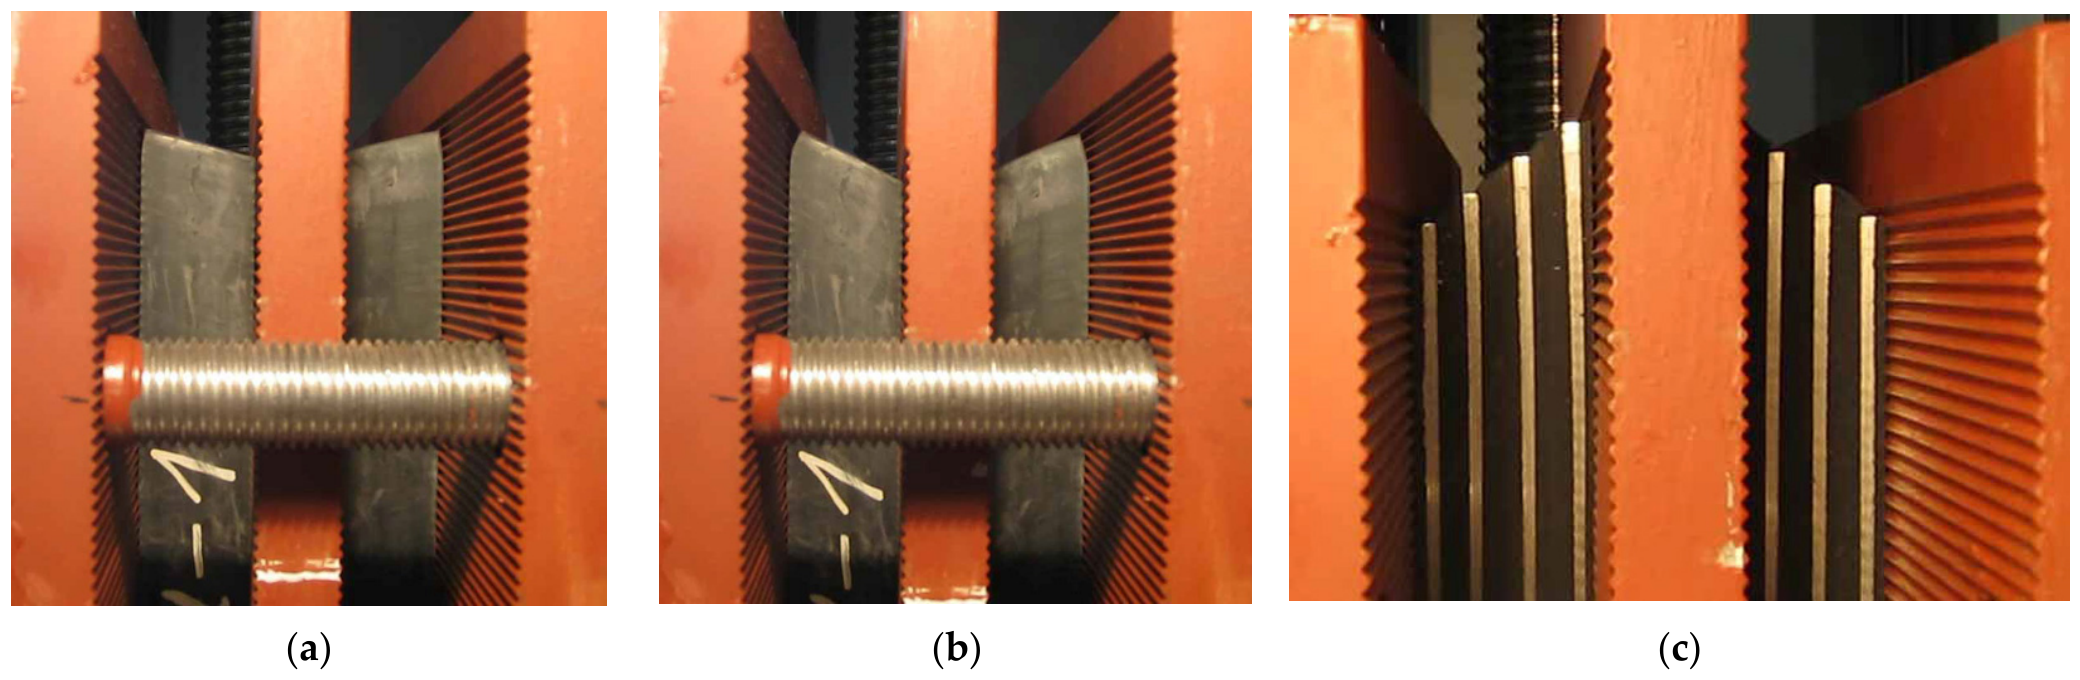
Although the shear modulus can primarily be considered a material property of rubber, the experimentally obtained shear modulus values are influenced by various factors. When an unbonded elastomeric bearing is sheared, the corners roll off the top and bottom supports. Such behavior was observed in shear modulus tests on bearings with protective coatings on the lateral surfaces, i.e., groups 3d, 4d, 5d, 6f, 7f, 8b, and 9a, even at shear deformations used to determine the value of the secant shear modulus (Figure 7a,b). The rolling off the corners reduces the contact area between the test plates and the bearing surfaces, and thus also reduces the shear stiffness.
Figure 7.
SREBs under shear: (a) 3d-I-L (εqx = 0.27); (b) 3d-I-L (εqx = 0.58); (c) 2c-III-L (εqxm = 0.90).
On the other hand, the deformation state of bearings 2c without protective coating corresponds most closely to the ideal state of simple shear (Figure 7c), in which tensile stresses occur at the edges. For this reason, higher shear modulus values were obtained. Group 1e bearings also contain no side layers but have a small shape factor and thicker inner elastomeric layers. Therefore, under compressive loading, there is considerable compressive deformation and bulging of the elastomer, so that this case cannot be equated with simple shear.
As expected for low-damping elastomeric bearings, the equivalent viscous damping ratio of ξ = 0.06 was calculated according to Equation (9). Damping was determined, in accordance with the standard EN 15129 [3], for the third loading cycle.
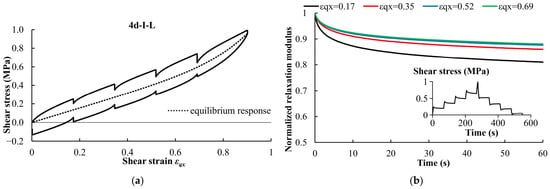
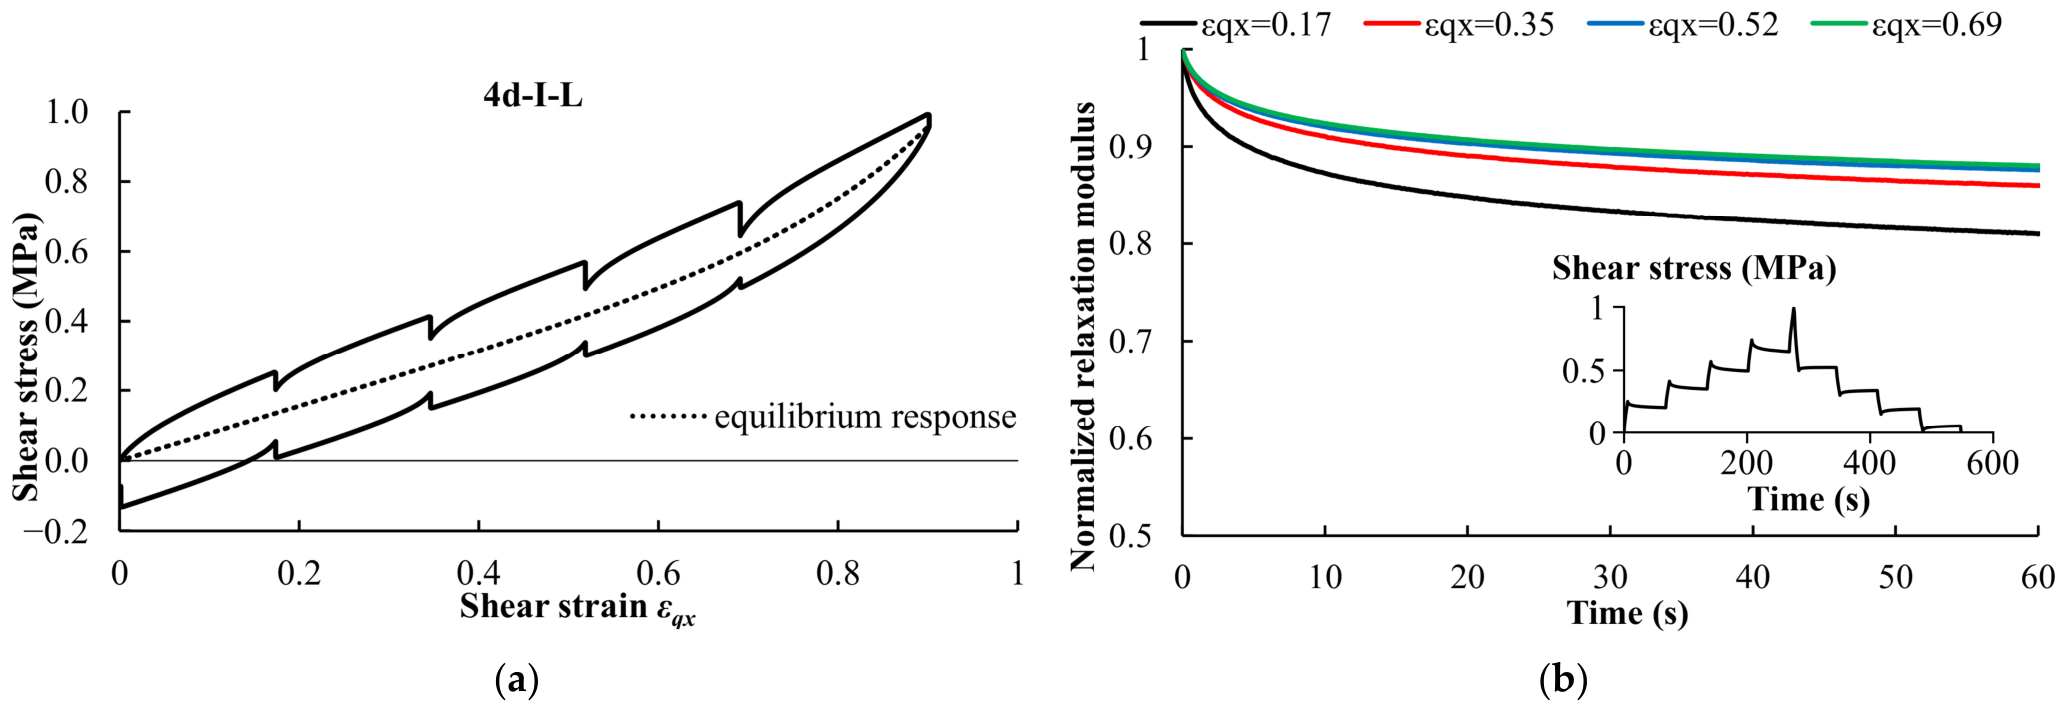
Stress relaxation tests in shear were also performed during both loading and unloading at four different strain levels, with each relaxation period lasting 60 s. Figure 8a illustrates that stress relaxes towards an equilibrium state during the hold periods [34,35]. The equilibrium response of the material can be modeled by the hyperelastic material model. The normalized relaxation modulus curves corresponding to different strain levels confirm the nonlinear viscoelastic behavior of rubber (Figure 8b). The nonlinear behavior is more pronounced at lower strain levels.
Figure 8.
Shear stress relaxation test: (a) stress–strain relationship; (b) normalized relaxation modulus.
6.2. Selection and Calibration of the Material Models
Elastomeric materials are highly deformable and gradually return to their original state after unloading. Due to their macromolecular structure, the stress–strain curves exhibit a highly nonlinear behavior. However, special attention must be given to rate-dependent properties, referred to as viscoelastic properties. The properties of viscoelastic materials depend not only on the magnitude of the applied load but also on the loading rate and the duration of the applied load.
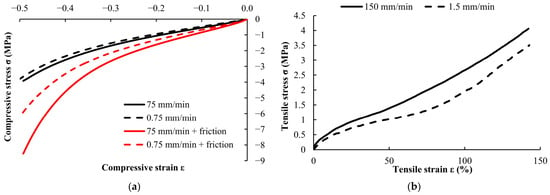
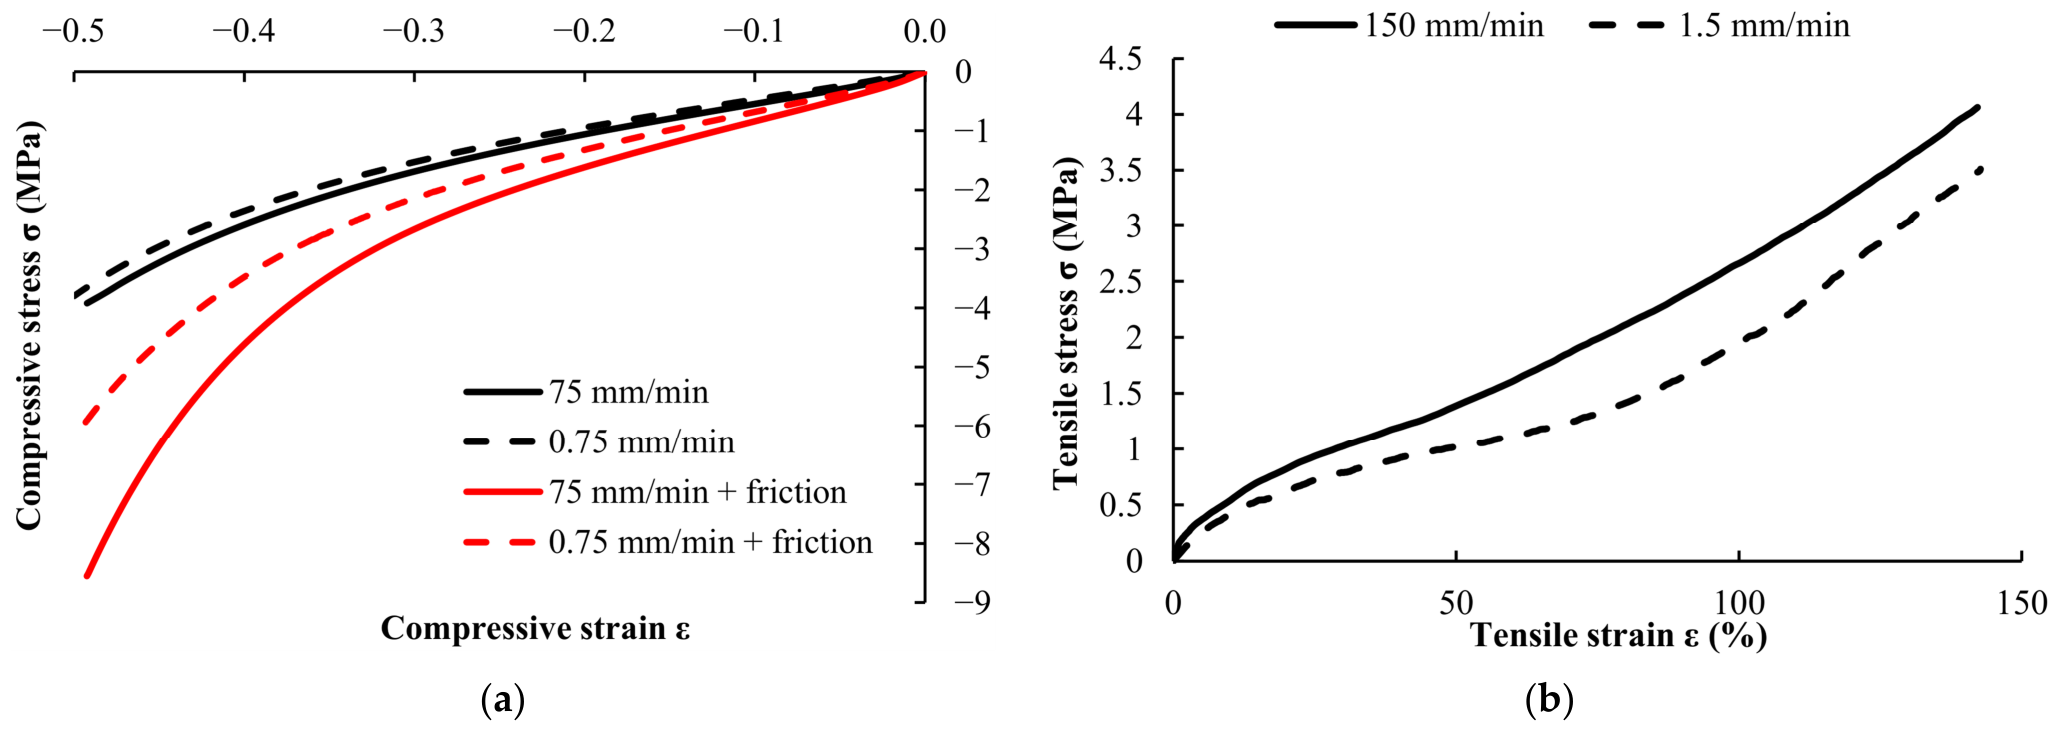
The influence of the strain rate on the mechanical properties of the elastomeric material was investigated through monotonic tensile and compression tests performed on different specimens at various strain rates (Figure 9). The loading rates were selected based on the capabilities of the testing machine. At a higher strain rate, greater stress is required to achieve the same strain, i.e., rubber is stiffer. For comparison, compression tests were performed under the same loading rates with and without lubrication. For the same level of strain, higher stresses were recorded because the applied load had to overcome frictional forces in addition to deforming the elastomer (Figure 9a).
Figure 9.
Monotonic test of rubber under: (a) compression with and without lubrication; (b) tension.
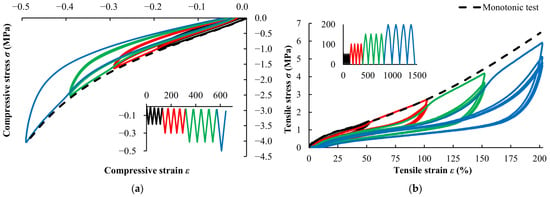
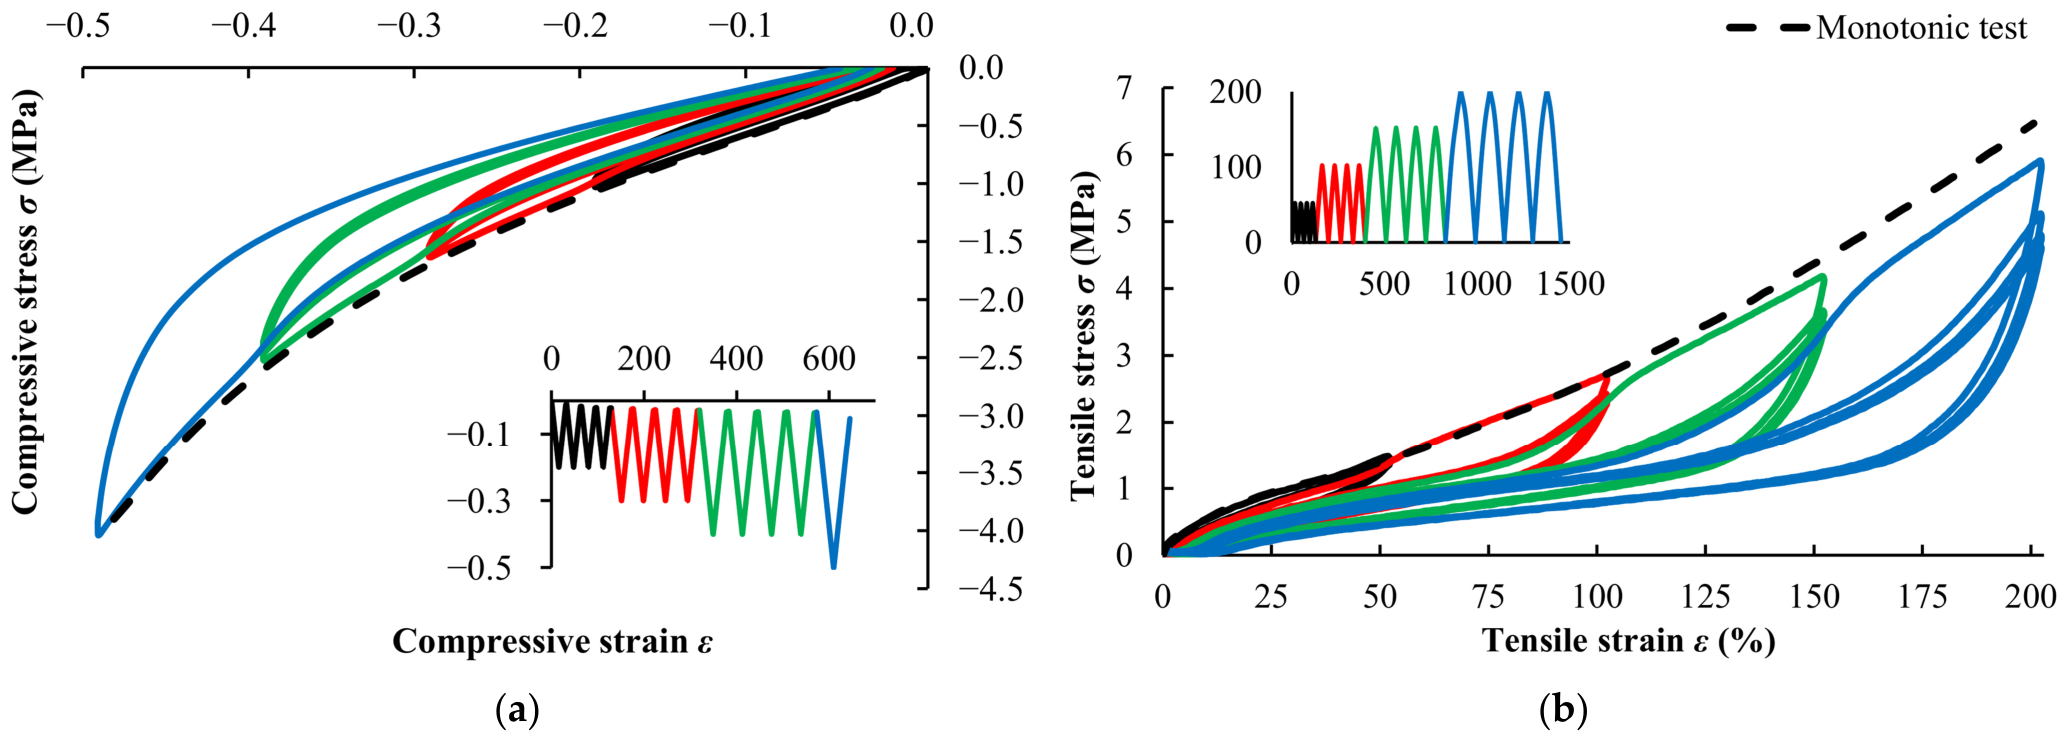
Compression and tensile cyclic tests were also performed for four different levels of strain at a loading rate of 10 mm/min for compression and 100 mm/min for the tensile test (Figure 10). As a result of viscoelastic behavior, elastomeric materials exhibit hysteresis under cyclic loading, resulting in different loading and unloading paths. This behavior is accompanied by energy dissipation, commonly referred to as damping.
Figure 10.
Cyclic loading and monotonic test of rubber under compression (a) and tension (b).
The results clearly demonstrate the Mullins effect, characterized by stress softening during the first loading cycle. The Mullins effect is a damage phenomenon that occurs in elastomeric materials during cyclic loading and is primarily attributed to the progressive breakdown of the interactions between polymer chains and filler particles [36]. It is most pronounced during the first loading cycle, after which the material response gradually stabilizes and becomes repeatable following a sufficient number of cycles [17]. This behavior is often referred to as the selective memory of elastomeric materials [37], meaning that stress softening occurs only for deformation levels less than or equal to the maximum deformation previously experienced by the material [19]. As the maximum applied deformation increases, the extent of material damage and the associated stress softening also increases. The curves obtained from monotonic tests form the envelope of the curves generated during the first loading cycles at different strain levels. After completion of the final loading cycle, a small permanent set of approximately 5% was observed in both cases.
Finite element software packages, such as Abaqus, ANSYS, and LS-DYNA, provide a range of built-in constitutive material models while also allowing user-defined material subroutines. In this study, the built-in material models combining hyperelasticity, Mullins effect and permanent set were calibrated based on experimental test results in Abaqus [18]. The built-in version of the nonlinear viscoelastic material model was calibrated in the MCalibration 4.6.0 (Veryst Engineering, Needham, MA, USA). The labels of the material models as well as the types of the calibration tests used are listed in Table 4. Based on the results of the shear stress relaxation tests, the linear viscoelastic model was not considered, as the material exhibited nonlinear viscoelastic behavior [38]. Furthermore, owing to the small permanent set observed after cyclic loading, more complex nonlinear viscoelastic elastoplastic constitutive models were not considered [39]. Calibrated material model parameters are given in Table 5. The input files with the calibrated material models are provided in the Supplementary Materials Files.
Table 4.
Built-in material models for rubber in Abaqus.
Table 5.
Calibrated material model parameters.
6.3. FE Modeling of Low-Damping SREBs
Based on the FEA using only a simple hyperelastic neo-Hookean material, the difference between the shear results obtained from the two-dimensional numerical analysis and those from the three-dimensional analysis was only 0.7% for bearings without the lateral covers. For bearings with lateral covers, it was up to 3.5%. The computational time was reduced by two to three orders of magnitude.
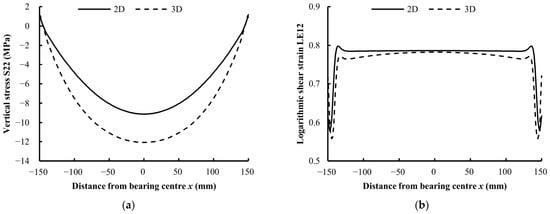
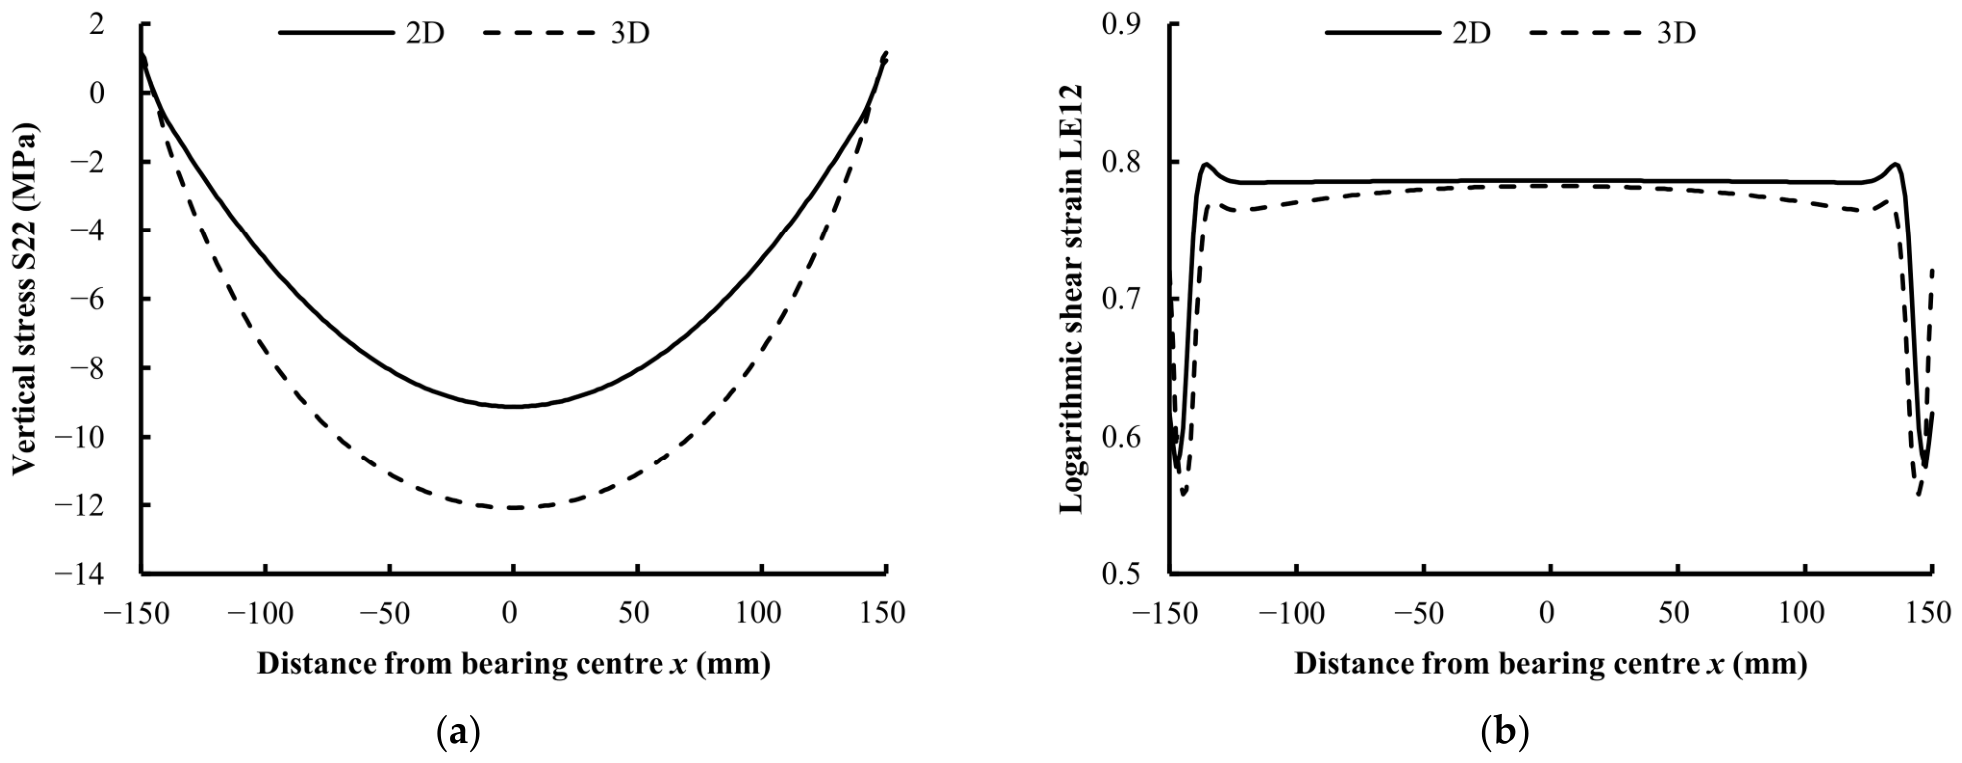
Figure 11 compares the results of the 2D and 3D FEA of bearing 1e with the Bergström–Boyce material model calibrated based on the compression tests (C_BB). It shows the vertical normal stress S22 and the logarithmic shear strain LE12 along the bearing length at mid-height of the middle rubber layer at the maximum loading condition (Fz = 360 kN, vxm = 40.5 mm). Both analyses give nearly the same shear strain, whereas the peak compressive stress in the 3D analysis is about 30% higher than in the 2D analysis, because the plane-strain model cannot represent the pressure variation across the bearing width. For bearing 1e with the C_BB material model, the 2D analysis differed from the 3D analysis by +0.2% in the effective horizontal stiffness Kh and by −7.1% in the dissipated energy per cycle ED, while the CPU time was about 700 times shorter. Therefore, the plane-strain (2D) analysis can be used to determine the shear response of the investigated bearings with sufficient accuracy for both the simple (NH) and the hysteretic (C_BB) material model.
Figure 11.
Results of the two-dimensional and three-dimensional numerical analysis of the bearing 1e at the maximum loading condition: (a) stress profile; (b) strain profile.
In a two-dimensional analysis, the compressive stage of the test cannot be accurately reproduced. However, for sufficiently low compressive stresses (up to 6 MPa), the influence on the horizontal stiffness is negligible as indicated by Equation (4). Two numerical models of bearing 8b, which has the highest shape factor (S = 8.06), were also compared: one subjected only to shear loading and the other subjected to combined loading consisting of a compressive stress of 6 MPa and shear. The reduction in the shear force was 0.5% when the compression step was added. To verify this for bearings with lower shape factors, the same comparison was performed for bearings 5d (S = 3.59) and 7f (S = 5.14), with the compressive stress varied from 0 to 6 MPa. The reduction in the shear force was 2.1% and 2.8%, respectively. Therefore, for all investigated bearings and compressive stresses up to 6 MPa, the influence of compression on the shear behavior does not exceed 3%. Since the aim of this part of the research was to evaluate the material models and the type of tests used for calibration in the simulation of shear behavior, all further analyses were performed using two-dimensional models.
Within the scope of this research, numerical models with rigid plates and models incorporating the actual material properties of steel were developed. An elastoplastic material with hardening was selected for the steel, although plastic deformations should not occur in the steel components of elastomeric bearings under normal operating conditions [40,41]. Shear force–displacement curves were determined based on numerical models with rigid and steel plates for groups 3d (S355) and 8b (S275). The difference between the numerical models with discrete rigid plates and those with steel plates was approximately 2%. Since the actual mechanical properties of steel have a minor influence on the results of the numerical analysis, all subsequent models were developed using rigid plates.
The behavior of elastomeric materials under shear loading, by definition, is independent of the level of compressibility. In the numerical models without lateral protective layers (Group 2c), only shear loading was applied with different values of the bulk modulus, and no influence of changes in compressibility was observed. Therefore, material models calibrated based on experimental tests contain the same value of the bulk modulus K0 = 2000 MPa as recommended in EN 1337-3 [2], except for the BB models, which were defined as fully incompressible, since hybrid elements cannot be combined with the BB model for a nearly incompressible material. When modeling the behavior of elastomeric materials under shear loading, volumetric testing is not required for the material model calibration.
Comparison of Numerical and Experimental Results
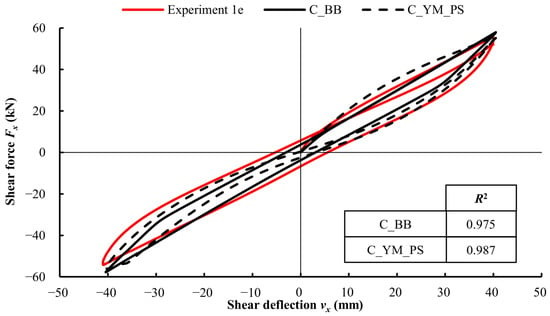
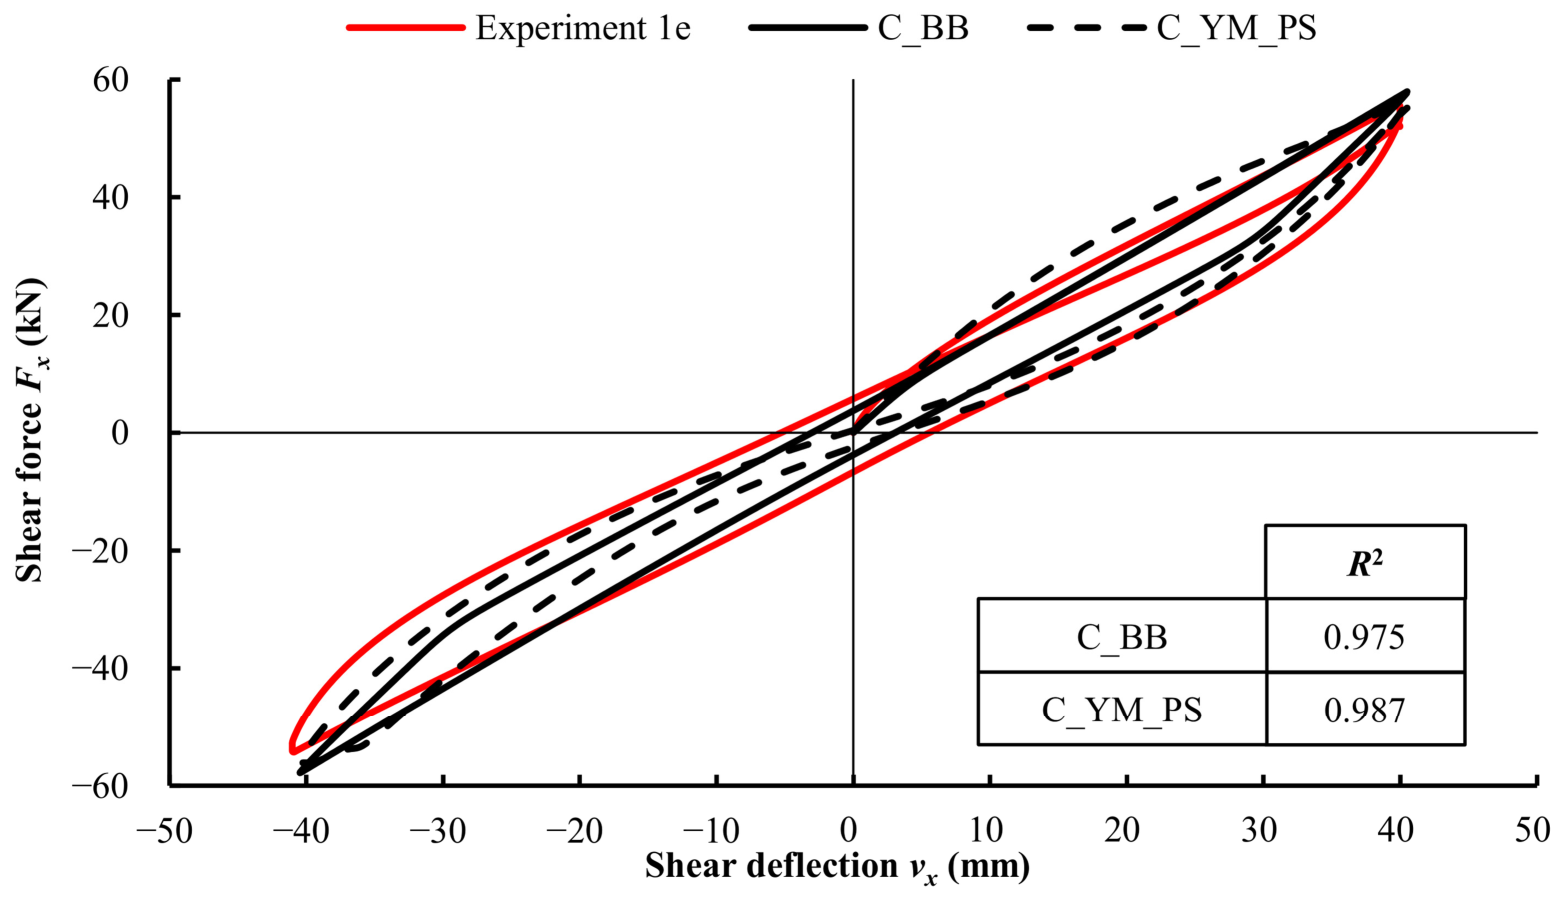
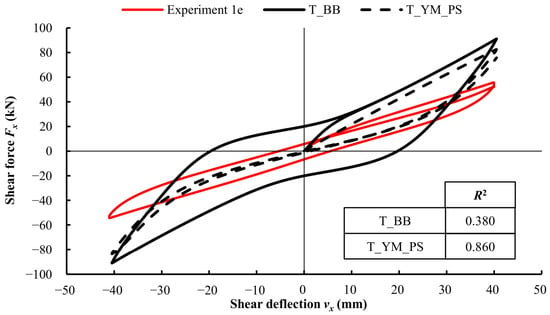
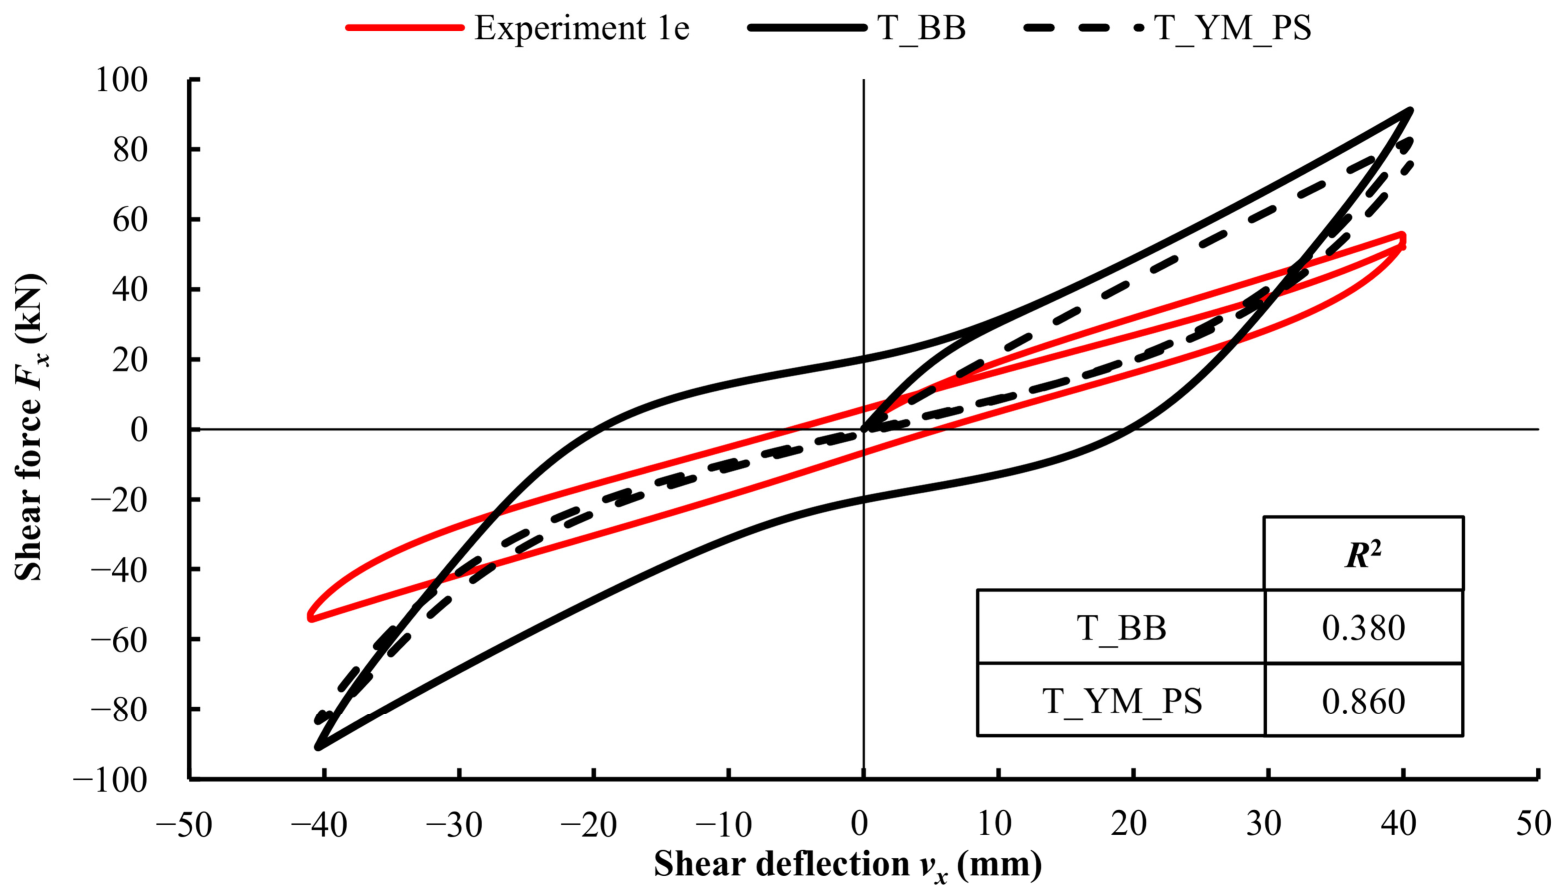
The numerical results based on more accurate calibrated material models were compared to the corresponding experimental results from the shear tests. The comparison is shown for the bearing group 1e for material models calibrated using compression and tensile tests in Figure 12 and Figure 13, respectively.
Figure 12.
Experimental and numerical results using material models calibrated based on compression tests.
Figure 13.
Experimental and numerical results using material models calibrated based on tensile tests.
The goodness-of-fit between numerical and experimental results was evaluated using the coefficient of determination R2 (Table 6). A much better agreement between the experimental and numerical results was obtained when the calibration of the material models was performed based on compression tests of the elastomer (C_BB and C_YM_PS). Both models reproduce the overall shape, the peak force amplitude and the enclosed hysteresis area of the experimental curve with good accuracy. With the C_BB model the second half-cycle of the hysteresis loop is reproduced more accurately.
Table 6.
Evaluation of different material models.
The reduced suitability of tensile test data for calibrating the material models is evident in Figure 13, as reflected by the shape of the hysteresis loop. Filled rubber compounds do not have a symmetric stress–strain curve around zero strain: the large-strain stiffening mechanism in tension (chain alignment, and in some compounds strain-induced crystallization) is physically different from the stiffening mechanism in compression (which is dominated by the near-incompressibility of the material and geometric confinement).
Better performance of material models calibrated using compression test data does not imply that compression is a fundamentally more representative loading mode than tension. Rather, it reflects the range of strains covered by the calibration tests. At the maximum shear strain in the tests, the principal strains in the rubber lie within the range of the compression tests (up to −50%), whereas the tension tests are dominated by the large-strain stiffening of the rubber, which does not occur in the bearings. The compressive preload and the confinement of the rubber layers between the steel plates further favor calibration based on compression tests.
Rather, it reflects the fact that the stress state within SREBs subjected to combined compression and shear more closely resembles that encountered during compression tests than that in tensile tests.
Another evaluation criterion is the availability of calibration procedures, specifically whether the material models can be calibrated directly within the FE software or require the use of external calibration software.
7. Conclusions
This study combined experimental tests on nine groups of low-damping steel-reinforced elastomeric bearings with finite element analysis to establish a simplified yet accurate modeling approach for their behavior under combined compressive preload and cyclic shear loading.
The elastomer was first characterized through uniaxial tension and compression tests demonstrating behavior typical of low-damping rubber, that is narrow hysteretic loops including the Mullins effect and a small permanent set after cyclic loading.
The results of the cyclic shear tests on SREBs showed that geometric characteristics, including the shape factor, have a limited effect on the apparent shear modulus, with rollover at the bearing edges being the main source of variation between groups. Shear stress relaxation tests were also performed confirming the nonlinear viscoelastic behavior of the elastomer.
As part of this research, FE models were developed in Abaqus to simulate shear tests performed on pairs of elastomeric bearings. Three common modeling simplifications were evaluated and found to be valid for shear-dominated analysis of low-damping SREBs: a plane-strain (2D) formulation reproduces the three-dimensional shear response with negligible loss of accuracy at a fraction of the computational cost; rigid steel plates may replace steel modeled with realistic elastic–plastic properties without compromising accuracy; and a moderate compressive preload has a negligible effect on the shear response.
Material models calibrated from compression tests reproduced the measured hysteretic shear response considerably better than those calibrated from tension tests. This is attributed to the strain range: the compression tests cover strains comparable to the principal strains in the bearings under shear, whereas the tension tests are dominated by the large-strain stiffening of the rubber, which does not occur in the bearings, together with the compressive preload and confinement of the rubber layers. Given the properties of low-damping rubber and small permanent set as well as the limited availability of calibration procedures, more complex nonlinear viscoelastic elastoplastic models were not considered.
Taken together, these findings support a simplified and computationally efficient modeling strategy for low-damping SREBs under combined compression and shear, combining plane-strain analysis, rigid reinforcement, and a built-in material model calibrated from compression data. Future work should extend this approach to bearings with higher shape factors and higher compressive stresses.
Supplementary Materials
The following supporting information can be downloaded at https://www.mdpi.com/article/10.3390/buildings16214472/s1, Calibrated material models C_BB.inp, C_YM_PS.inp, T_BB.inp and T_YM_PS.inp in Abaqus input format; README.txt: Description of the supplementary files.
Author Contributions
Conceptualization, A.S. and D.D.; methodology, A.S. and M.B.; software, A.S.; validation, A.S., M.B. and I.D.; formal analysis, A.S.; investigation, A.S., M.B. and I.D.; resources, D.D.; data curation, A.S.; writing—original draft preparation, A.S.; writing—review and editing, M.B., D.D. and I.D.; visualization, A.S.; supervision, D.D.; project administration, I.D.; funding acquisition, I.D. All authors have read and agreed to the published version of the manuscript.
Funding
This research was funded through the NextGenerationEU call—Projects for Enhancing Scientific Excellence, National Recovery and Resilience Plan 2021–2026. Institutional research project DT4SIM Digital twins of bridges: Integrating Experimental Data and Numerical Modelling for Intelligent Infrastructure Maintenance (100-029/26).
Data Availability Statement
The calibrated material models developed in this study are provided in the Supplementary Materials. Other raw data supporting the conclusions of this article will be made available by the authors on request.
Acknowledgments
The authors gratefully acknowledge Polirol d.o.o. (Zagreb, Croatia), for providing the elastomeric bearings and the rubber specimens used in this study. During the preparation of this manuscript, the authors used Claude Opus 5.5 (Anthropic) for language editing and suggestions for improving the clarity of the text. The experimental work, the numerical simulations, the analysis and interpretation of the results, the original figures and graphs, and the conclusions are entirely the work of the authors. The authors have reviewed and edited the output and take full responsibility for the content of this publication.
Conflicts of Interest
The authors declare no conflicts of interest.
Abbreviations
The following abbreviations are used in this manuscript:
| 2D | two-dimensional |
| 3D | three-dimensional |
| BB | Bergström–Boyce (material model) |
| C_ | prefix of material models calibrated from compression tests |
| EN | European Standard |
| FE | finite element |
| FEA | finite element analysis |
| IRHD | International Rubber Hardness Degree |
| NH | neo-Hookean |
| SREB | steel-reinforced elastomeric bearing |
| T_ | prefix of material models calibrated from tension tests |
| YM_PS | Yeoh model with Mullins effect and permanent set |
References
- Lindley, P.B. Engineering Design with Natural Rubber, 4th ed.; The Malaysian Rubber Producers Research Association: Hertfordshire, UK, 1978. [Google Scholar]
- CEN EN 1337-3; Structural Bearings—Part 3: Elastomeric Bearings. European Committee for Standardization: Brussels, Belgium, 2005.
- CEN EN 15129; Antiseismic Devices. European Committee for Standardization: Brussels, Belgium, 2018.
- Gerhaher, U.; Strauss, A.; Bergmeister, K. Numerical Modeling of Elastomeric Bearings in Structural Engineering. Adv. Mater. Sci. 2011, 11, 51–63. [Google Scholar] [CrossRef] [Scilit]
- Kalfas, K.N.; Forcellini, D. Analytical Formulas of the Mechanical Behavior of Rubber Bearings Considering the Isolator Nonlinearities and the Influence of Shear Modulus. In Seismic Evaluation, Damage, and Mitigation in Structures; Woodhead Publishing: Cambridge, UK, 2023; pp. 343–363. ISBN 9780323885300. [Google Scholar]
- Kalfas, K.N.; Ghorbani Amirabad, N.; Forcellini, D. The Role of Shear Modulus on the Mechanical Behavior of Elastomeric Bearings When Subjected to Combined Axial and Shear Loads. Eng. Struct. 2021, 248, 113248. [Google Scholar] [CrossRef] [Scilit]
- Kalfas, K.N.; Mitoulis, S.A.; Katakalos, K. Numerical Study on the Response of Steel-Laminated Elastomeric Bearings Subjected to Variable Axial Loads and Development of Local Tensile Stresses. Eng. Struct. 2017, 134, 346–357. [Google Scholar] [CrossRef] [Scilit]
- Maghsoudi-Barmi, A.; Khaloo, A.; Ehteshami Moeini, M. Experimental Investigation of Unbonded Ordinary Steel Reinforced Elastomeric Bearings as an Isolation System in Bridges. Structures 2021, 32, 604–616. [Google Scholar] [CrossRef] [Scilit]
- Orfeo, A.; Tubaldi, E.; Muhr, A.H.; Losanno, D. Mechanical Behaviour of Rubber Bearings with Low Shape Factor. Eng. Struct. 2022, 266, 114532. [Google Scholar] [CrossRef] [Scilit]
- Zhang, Z.; Vassiliou, M.F.; Zhou, Y.; Guan, Q. Critical Behavior of Thick Rubber Bearings under Compression and Shear. Eng. Struct. 2024, 315, 118488. [Google Scholar] [CrossRef] [Scilit]
- Zhou, T.; Wu, Y.F.; Li, A.Q. Numerical Study on the Ultimate Behavior of Elastomeric Bearings under Combined Compression and Shear. KSCE J. Civ. Eng. 2018, 22, 3556–3566. [Google Scholar] [CrossRef] [Scilit]
- Ishii, K.; Kikuchi, M. Improved Numerical Analysis for Ultimate Behavior of Elastomeric Seismic Isolation Bearings. Earthq. Eng. Struct. Dyn. 2019, 48, 65–77. [Google Scholar] [CrossRef] [Scilit]
- Gajewski, M.; Szczerba, R.; Jemioło, S. Modelling of Elastomeric Bearings with Application of Yeoh Hyperelastic Material Model. Procedia Eng. 2015, 111, 220–227. [Google Scholar] [CrossRef] [Scilit]
- Saidou, A.; Gauron, O.; Busson, A.; Paultre, P. High-Order Finite Element Model of Bridge Rubber Bearings for the Prediction of Buckling and Shear Failure. Eng. Struct. 2021, 240, 112314. [Google Scholar] [CrossRef] [Scilit]
- Han, D.; Che, W. Comparison of the Shear Modulus of an Offshore Elastomeric Bearing between Numerical Simulation and Experiment. Appl. Sci. 2021, 11, 4384. [Google Scholar] [CrossRef] [Scilit]
- Kalfas, K.N.; Mitoulis, S.A.; Konstantinidis, D. Influence of Steel Reinforcement on the Performance of Elastomeric Bearings. J. Struct. Eng. 2020, 146, 04020195. [Google Scholar] [CrossRef] [Scilit]
- Bergström, J. Mechanics of Solid Polymers: Theory and Computational Modeling, 1st ed.; Elsevier Inc.: Amsterdam, The Netherlands, 2015; ISBN 978-0-323-31150-2. [Google Scholar]
- Dassault Systèmes Abaqus Online Documentation. Available online: https://help.3ds.com/2026/English/DSSIMULIA_Established/SIMULIA_Established_FrontmatterMap/sim-t-SIMULIA_EstablishedDocSearchOnline.htm?contextscope=all (accessed on 20 June 2026).
- Diani, J.; Fayolle, B.; Gilormini, P. A Review on the Mullins Effect. Eur. Polym. J. 2009, 45, 601–612. [Google Scholar] [CrossRef] [Scilit]
- Skender, A.; Damjanović, D.; Bartolac, M.; Duvnjak, I. Influence of Rubber Compressibility on the Compressive Stiffness of Steel-Reinforced Elastomeric Bearings in Finite Element Simulations Considering the Shape Factor. Polym. Eng. Sci. 2022, 62, 4235–4248. [Google Scholar] [CrossRef] [Scilit]
- Castillo Ruano, P.; Strauss, A. Finite Element Analysis for Nonlinear Unbonded Circular Fiber-Reinforced Elastomeric Bearings. J. Compos. Sci. 2021, 5, 170. [Google Scholar] [CrossRef] [Scilit]
- Kelly, J.M.; Konstantinidis, D.A. Mechanics of Rubber Bearings for Seismic and Vibration Isolation; John Wiley & Sons, Ltd.: Chichester, UK, 2011. [Google Scholar]
- Al-Anany, Y.M.; Van Engelen, N.C.; Tait, M.J. Vertical and Lateral Behavior of Unbonded Fiber-Reinforced Elastomeric Isolators. J. Compos. Constr. 2017, 21, 04017019. [Google Scholar] [CrossRef] [Scilit]
- Toopchi-Nezhad, H.; Tait, M.J.; Drysdale, R.G. Influence of Thickness of Individual Elastomer Layers (First Shape Factor) on the Response of Unbonded Fiber-Reinforced Elastomeric Bearings. J. Compos. Mater. 2013, 47, 3433–3450. [Google Scholar] [CrossRef] [Scilit]
- Strauss, A.; Apostolidi, E.; Zimmermann, T.; Gerhaher, U.; Dritsos, S. Experimental Investigations of Fiber and Steel Reinforced Elastomeric Bearings: Shear Modulus and Damping Coefficient. Eng. Struct. 2014, 75, 402–413. [Google Scholar] [CrossRef] [Scilit]
- Treloar, L.R.G. The Physics of Rubber Elasticity, 3rd ed.; Clarendon Press: Oxford, UK, 1975. [Google Scholar]
- Kelly, J.M. Earthquake-Resistant Design with Rubber, 2nd ed.; Springer: London, UK, 1997. [Google Scholar]
- Constantinou, M.C.; Kalpakidis, I.; Filiatrault, A.; Ecker Lay, R.A. LRFD-Based Analysis and Design Procedures for Bridge Bearings and Seismic Isolators; Technical Report MCEER-11-0004; University at Buffalo: Buffalo, NY, USA, 2011. [Google Scholar]
- Skender, A.; Damjanović, D.; Šimunić, Ž. Shear Modulus Testing Method for Elastomeric Bearings. In Proceedings of the 29th Danubia-Adria-Symposium on Advances in Experimental Mechanics; Serbian Society of Mechanics: Beograd, Serbia, 2012; pp. 38–39. [Google Scholar]
- Cardone, D.; Perrone, G. Critical Load of Slender Elastomeric Seismic Isolators: An Experimental Perspective. Eng. Struct. 2012, 40, 198–204. [Google Scholar] [CrossRef] [Scilit]
- Pianese, G.; Milani, G.; Milani, F. Prediction of the Optimal Vulcanization of a Fiber-Reinforced Elastomeric Isolator Made of Natural Rubber-Ethylene Propylene Diene Monomer Blend. Polym. Eng. Sci. 2023, 63, 2421–2443. [Google Scholar] [CrossRef] [Scilit]
- ISO 37:2017; Rubber, Vulcanized or Thermoplastic—Determination of Tensile Stress-Strain Properties. ISO: Geneva, Switzerland, 2017.
- ISO 7743:2017; Rubber, Vulcanized or Thermoplastic—Determination of Compression Stress-Strain Properties. ISO: Geneva, Switzerland, 2017.
- Bergström, J.S. Large Strain Time-Dependent Behavior of Elastomeric Materials; Massachusetts Institute of Technology: Cambridge, MA, USA, 1999. [Google Scholar]
- Bhuiyan, A.R.; Okui, Y. Mechanical Characterization of Laminated Rubber Bearings and Their Modeling Approach. In Earthquake Engineering; Sezen, H., Ed.; InTech: London, UK, 2012; ISBN 978-953-51-0694-4. [Google Scholar]
- Miehe, C.; Keck, J. Superimposed Finite Elastic–Viscoelastic–Plastoelastic Stress Response with Damage in Filled Rubbery Polymers. Experiments, Modelling and Algorithmic Implementation. J. Mech. Phys. Solids 2000, 48, 323–365. [Google Scholar] [CrossRef] [Scilit]
- Beatty, M.F. The Mullins Effect in a Pure Shear. J. Elast. 2000, 59, 369–392. [Google Scholar] [CrossRef] [Scilit]
- Ghoreishy, M.H.R.; Naderkhamse, M.; Karrabi, M.; Naderi, G. Finite Element Analysis of a Rubber Bearing Base Isolator under Vertical and Horizontal Loads Using a Nonlinear Hyper-Viscoelastic Material Model. Polym. Test. 2024, 137, 108522. [Google Scholar] [CrossRef] [Scilit]
- Fiedler, N.; Kleine, T.; Oschatz, S.; Schultz, S.; Grabow, N.; Lebahn, K. Calibration Framework for Modeling Nonlinear Viscoelastic–Plastic Behavior of Bioresorbable Polymers in Finite Element Analysis for Stent Applications. Polymers 2025, 17, 2863. [Google Scholar] [CrossRef] [Scilit] [PubMed]
- Nguyen, H.H.; Tassoulas, J.L. Directional Effects of Shear Combined with Compression on Bridge Elastomeric Bearings. J. Bridge Eng. 2010, 15, 73–80. [Google Scholar] [CrossRef] [Scilit]
- Block, T. Verdrehwiderstände Bewehrter Elastomerlager; Ruhr-Universität Bochum: Bochum, Germany, 2010. [Google Scholar]

Disclaimer/Publisher’s Note: The statements, opinions and data contained in all publications are solely those of the individual author(s) and contributor(s) and not of MDPI and/or the editor(s). MDPI and/or the editor(s) disclaim responsibility for any injury to people or property resulting from any ideas, methods, instructions or products referred to in the content. |
© 2026 by the authors. Licensee MDPI, Basel, Switzerland. This article is an open access article distributed under the terms and conditions of the Creative Commons Attribution (CC BY) license.