


Abstract
Impact-Echo (IE) testing is a promising nondestructive evaluation technique for concrete structures, but interpreting its frequency response in cylindrical bridge piers remains challenging because structural geometry, propagation paths, and internal discontinuities can produce overlapping spectral characteristics. This study investigates IE responses of cylindrical concrete bridge piers through field measurements and three-dimensional finite-element simulations. Field tests were conducted on two in-service bridges to characterize dominant-frequency responses and measurement repeatability under practical conditions. The numerical investigation considered hollow voids and segregation-like low-stiffness regions with different sizes and spatial configurations. The effects of defect type, size, and location on dominant frequency, waveform timing, and transmission characteristics were examined to interpret the underlying response mechanisms. The simulations showed that hollow voids generally produced stronger transmission blockage and more pronounced temporal shifts in the backside response than segregation-like regions in the representative cases, although their frequency responses were not uniquely distinguishable. A normalized dominant-frequency-shift index was subsequently evaluated as a candidate measure of relative spectral deviation. Within the deduplicated numerical parameter set, hollow-void cases generally exhibited larger dominant-frequency shifts than segregation cases. However, the distributions overlapped, and one segregation case was highly sensitive to dominant-peak selection because of two nearly equal spectral peaks. The field measurements demonstrated repeatable dominant-frequency responses under the investigated conditions, while spatial variations and measurement geometry highlighted the limitations of single-frequency interpretation. The findings support comparative interpretation of IE responses in cylindrical members but also highlight the need for further validation using independently confirmed defect conditions.
1. Introduction
Concrete bridge piers are critical load-bearing components that transfer superstructure loads to the foundation and are expected to maintain adequate integrity throughout long service periods. However, construction-related imperfections and service-induced deterioration may result in internal discontinuities such as voids, poorly compacted concrete, segregation, cracking, and locally degraded material zones. Because these defects may not produce obvious surface manifestations, visual inspection alone is often insufficient for evaluating the internal condition of concrete members. A range of nondestructive testing (NDT) techniques has therefore been developed for concrete infrastructure, including ultrasonic pulse velocity, ultrasonic tomography, ground-penetrating radar, infrared thermography, acoustic and stress-wave methods, and combined inspection approaches [1,2]. Comparative investigations of bridge-deck NDT techniques have further demonstrated that different methods respond to different physical properties and defect characteristics, suggesting that no single technique is universally optimal for all internal anomalies [3]. Among stress-wave-based techniques, the Impact-Echo (IE) method is particularly attractive for concrete inspection because it can be implemented from an accessible surface and provides information related to subsurface interfaces and structural boundaries through transient mechanical excitation.
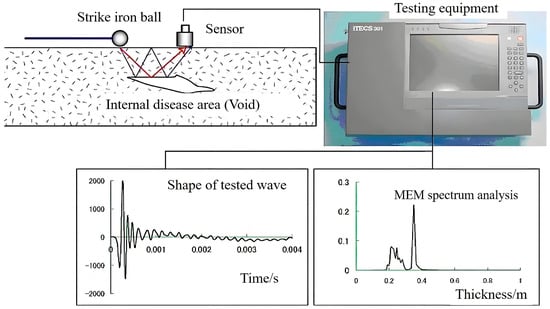
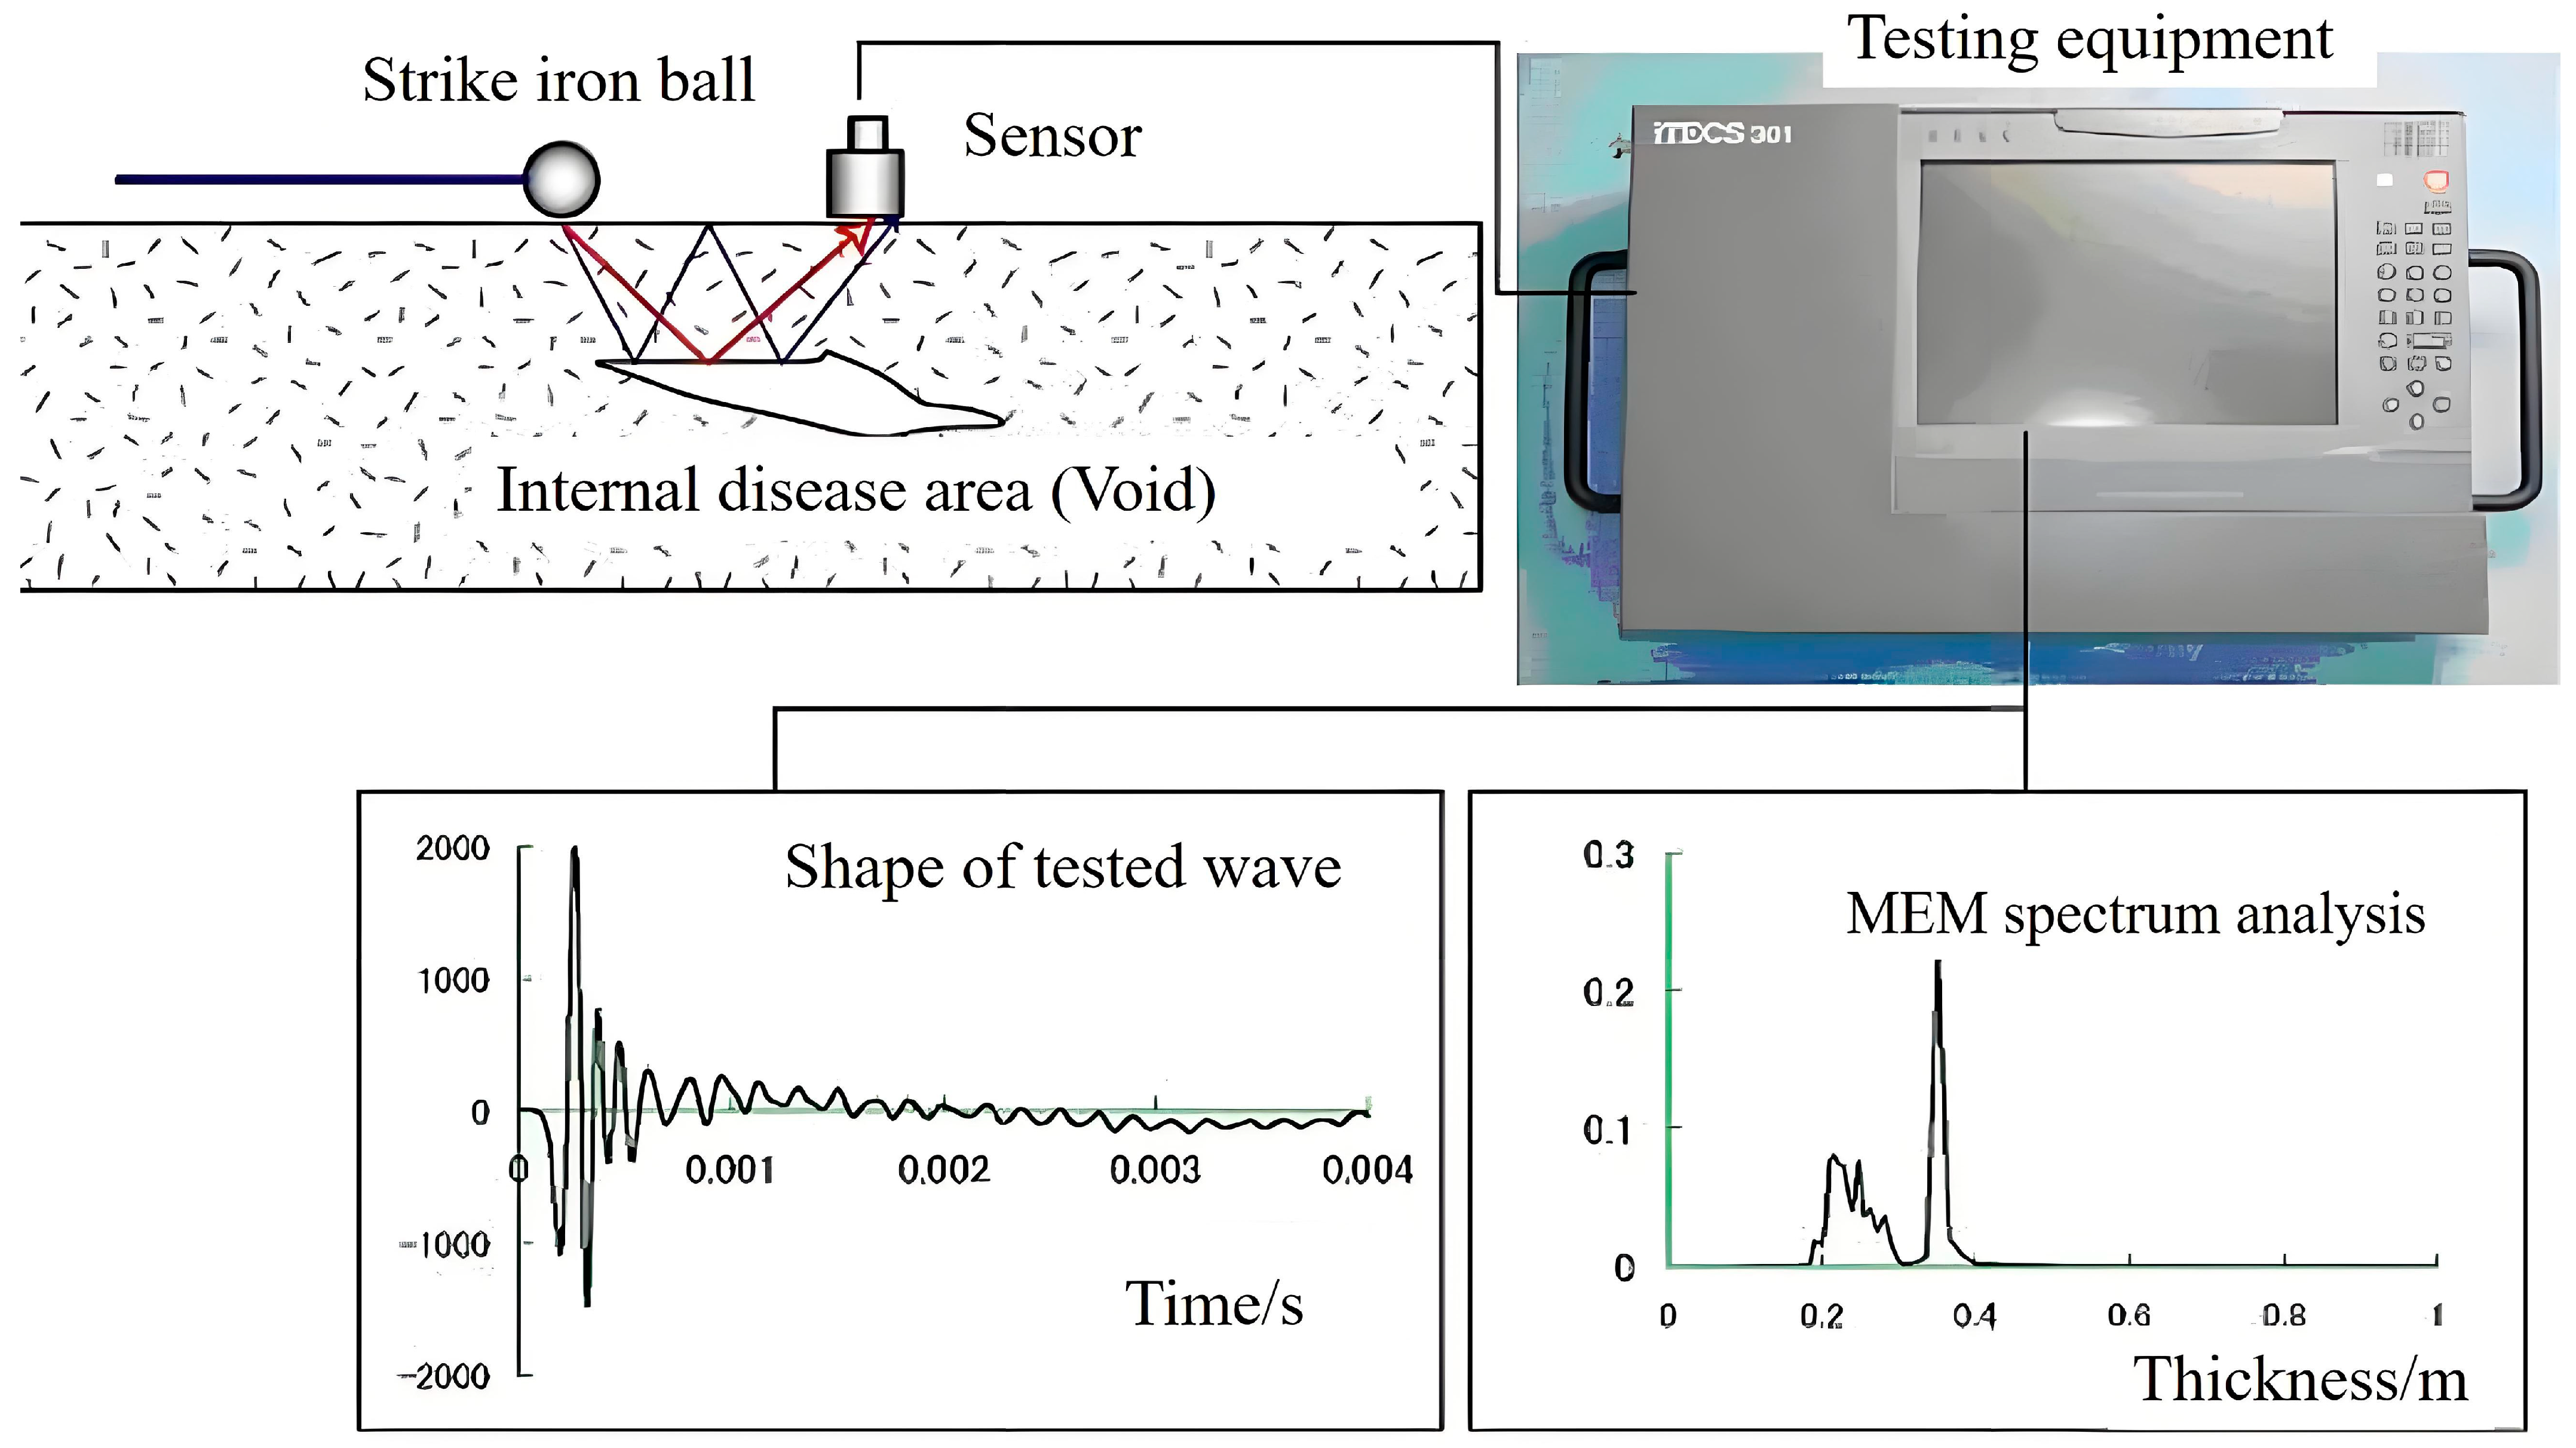
The theoretical and experimental foundations of IE were established through the pioneering work of Sansalone and Carino. Their early studies demonstrated that a short-duration mechanical impact generates transient elastic waves within concrete and that the resulting surface response contains information associated with the geometry of the structural element and the presence of internal discontinuities [4,5]. Transformation of the recorded time-domain response into the frequency domain subsequently became a central component of conventional IE interpretation, as shown in Figure 1. Carino summarized the principal parameters governing IE testing, including impact duration, stress-wave velocity, structural dimensions, defect depth, and the frequency content generated by the impact [6]. Sansalone further synthesized the theoretical, numerical, laboratory, and field developments of the technique and demonstrated that IE principles can be extended from plate-like components to bar-like elements and hollow cylindrical structures [7]. Schubert and Köhler later provided a detailed theoretical treatment of stress-wave generation and IE spectral interpretation [8]. These developments established IE as a mature stress-wave NDT technique, while also demonstrating that the measured spectrum is governed by an interaction among material properties, geometry, wave modes, and internal reflecting interfaces rather than by defect depth alone.
Figure 1.
Impcat−Echo test procedure.
Conventional descriptions often relate a dominant resonance frequency to repeated wave reflections between the test surface and an opposing boundary or internal interface. However, Gibson and Popovics showed that the dominant thickness resonance of plate-like structures can be interpreted in terms of the zero-group-velocity S1 Lamb-wave mode, highlighting the importance of guided-wave behavior in IE measurements [9]. Subsequent studies have examined geometrical effects, modal characteristics, and frequency shifts under finite structural dimensions and non-ideal boundary conditions [9,10,11]. Such findings are particularly important for structural elements whose dimensions cannot be approximated by an infinite plate. In these cases, cross-sectional vibration modes and structural eigenmodes may produce additional spectral peaks or modify the frequencies conventionally associated with internal reflection. Therefore, interpretation strategies developed for plate-like members cannot necessarily be transferred directly to columns and piers without considering the influence of their finite and curved geometry.
Importantly, the application of IE to columns and cylindrical concrete members is not itself new. Sansalone et al. reported early extensions of IE from plate-like structures to bar-like members, including reinforced-concrete columns with circular and rectangular cross sections [12]. Lin and Sansalone subsequently combined numerical simulation and full-scale experiments to investigate square, rectangular, and circular columns and beams containing controlled voids, cracks, and honeycombing [13]. Their results demonstrated that intact beam and column responses contain multiple resonant frequencies associated with cross-sectional vibration modes and that internal defects can disrupt these characteristic spectral patterns. Wang further investigated resonant frequencies in solid circular rods, confirming the importance of cross-sectional geometry in frequency interpretation. More recently [10], Liu specifically examined IE measurements near concrete-column edges and showed that the predominant response can be strongly affected by cross-sectional vibration modes, while finite-element modeling was required to interpret the observed frequencies [14]. These studies demonstrate that the primary challenge in cylindrical members is not whether IE can be applied, but how defect-related responses can be separated from the geometric and modal characteristics inherent to the structural form.
Similar complexities have been reported in other concrete configurations containing embedded interfaces and cylindrical inclusions. Impact-Echo has been extensively investigated for grouted tendon ducts and post-tensioning systems, where voids and incomplete grouting generate distinct wave-reflection and resonance phenomena [15,16]. Studies of tunnel linings, bonded interfaces, pipelines, and grouted sleeves have likewise shown that defect response depends not only on the presence of a discontinuity but also on its dimensions, material contrast, position, surrounding geometry, and source–receiver configuration [17,18,19]. In a recent experimental and numerical investigation of sleeve grouting defects, Cao demonstrated that impact-point spacing, sleeve location, specimen thickness, and impact characteristics can substantially affect the resulting IE spectrum [20]. Numerical investigations of thick concrete structures have also emphasized that modeling parameters and finite geometry may alter simulated IE responses [21]. Collectively, these studies indicate that a particular absolute resonant frequency should generally be interpreted within the context of structural geometry and measurement conditions rather than treated as a universal defect-identification threshold.
The interpretation problem becomes more challenging when different internal anomalies produce partially overlapping spectral characteristics. Traditional IE evaluation relies heavily on dominant-frequency peaks because these provide a convenient indicator of reflective interfaces. Nevertheless, complex defects can affect several aspects of wave propagation simultaneously. Stress-wave NDT research has shown that structural condition may influence propagation time, dominant frequency, energy attenuation, reflections, and waveform characteristics to different degrees [2]. For example, an air-filled void can produce strong impedance contrast, wave diffraction, reflection, and substantial blockage of transmitted energy, whereas a region of poorly consolidated or low-stiffness concrete may continue to transmit stress waves while producing reductions in propagation velocity and signal energy. Consequently, two physically different internal conditions may exhibit partially similar dominant-frequency shifts while differing substantially in their temporal or amplitude responses. Studies of shallow delamination have similarly shown that interpretation based on a single IE mode can be ambiguous and that incorporating complementary dynamic characteristics can improve defect identification [22]. Kang also demonstrated, in cavity detection around concrete pipelines, that additional time–frequency information could provide diagnostic information that was not adequately represented by conventional Fourier-spectrum interpretation alone [18].
These limitations have motivated increasingly sophisticated methods for extracting information from IE and related stress-wave measurements. Wavelet transforms and enhanced Fourier representations have been proposed to improve the identification of transient spectral characteristics and overlapping reflections [23], while tomography and depth-spectrum approaches have been investigated for spatial visualization of internal anomalies. Zhu and Popovics demonstrated that air-coupled IE measurements could be used to generate defect images over concrete surfaces, further extending the technique toward spatial scanning applications [24]. More recently, statistical and data-driven interpretation methods have attracted attention. Zhang applied extreme learning machines to IE signals and argued that simple frequency-spectrum analysis may be insufficient for comprehensive concrete condition assessment [25]. Dorafshan and Azari subsequently developed deep learning models for subsurface defect classification in concrete bridge decks, while additional work demonstrated the feasibility of deep learning-based interpretation for bridge decks with overlays [26]. Sajid used statistical pattern recognition with stress-wave response functions for defect detection, illustrating the potential value of considering a multidimensional feature space rather than relying on a single scalar response [27]. Related studies have continued to develop automated classification and signal-quality evaluation procedures for IE measurements.
Although advanced statistical and machine learning approaches can improve automated interpretation, they typically require sufficiently representative labeled datasets and may reduce the direct physical interpretability of individual diagnostic variables. Such requirements are difficult to satisfy for in-service bridge piers, where destructive verification of internal defects is often unavailable, and the number of accessible measurement locations may be limited. Under these conditions, physically interpretable response features remain useful for examining stress-wave behavior. Dominant frequency reflects changes in the spectral and modal response, while waveform timing and amplitude can provide complementary qualitative information on scattering, transmission blockage, attenuation, and wave-path modification. In the present study, these features are therefore not combined into a weighted field-classification index. Instead, the dominant-frequency shift is quantified only within the numerical dataset, whereas temporal and amplitude responses are retained for qualitative physical interpretation.
Another important issue in field NDT is the availability of an appropriate reference condition. Historical measurements of the undamaged structure are seldom available for existing bridge piers, and destructive confirmation of apparently intact regions is usually impractical. Stress-wave-based condition assessment is therefore frequently implemented on a relative basis, in which spatial variations in response parameters are used to distinguish locally anomalous regions from representative surrounding responses [28]. Similar relative or spatial mapping concepts have been applied in IE inspection of bridge decks, where large-area measurements are interpreted in terms of variations in spectral or defect-related response rather than through a universal signal threshold [24,26]. This perspective is particularly relevant for cylindrical bridge piers, for which local measurement geometry, surface condition, coupling, and structural boundaries may introduce systematic variations that should be distinguished from genuine defect-induced changes. However, in the absence of an independently verified intact reference, such relative field comparisons should not be interpreted as quantitative indicators of defect presence or severity.
Despite the substantial body of IE research described above, several issues remain insufficiently resolved for practical assessment of full-scale cylindrical concrete bridge piers. First, the combined influence of curved geometry, finite cross-sectional dimensions, defect type, and defect position complicates direct transfer of conventional plate-based frequency interpretation. Recent modal and numerical studies have emphasized the importance of geometry effects but have focused primarily on idealized structural configurations or individual response characteristics [14,21]. Second, voids and segregation-like degraded regions differ fundamentally in their stress-wave transmission mechanisms, yet the extent to which these differences are reflected in spectral response, waveform timing, and transmission characteristics has received less systematic investigation for cylindrical pier geometries. Third, although advanced classification approaches have been proposed for concrete slabs and bridge decks, practical field assessment of in-service piers often lacks sufficient labeled data or destructive ground truth to support direct defect classification or universal damage thresholds.
Accordingly, the present study investigates the Impact-Echo response of cylindrical concrete bridge piers through combined field measurements and three-dimensional numerical interpretation. Field testing of two in-service bridge piers is first used to characterize representative spectral responses and measurement repeatability under practical testing conditions. A simplified three-dimensional finite-element model is then employed as a mechanism-interpretation and parametric-comparison tool to examine the effects of hollow voids and segregation-like low-stiffness regions on dominant frequency, waveform timing, and transmission characteristics, with particular attention to defect type, size, and spatial position. Based on the numerical frequency responses, a normalized dominant-frequency-shift feature is evaluated as a candidate measure of relative spectral deviation from the intact numerical reference. The indicator is used only for comparative analysis within the numerical dataset and is not transferred directly to the field measurements. The field results are interpreted independently in terms of spectral variability and repeatability and are not used to infer confirmed defect presence, type, severity, or location.
2. Field Investigation
2.1. Field Sites and Test Arrangement
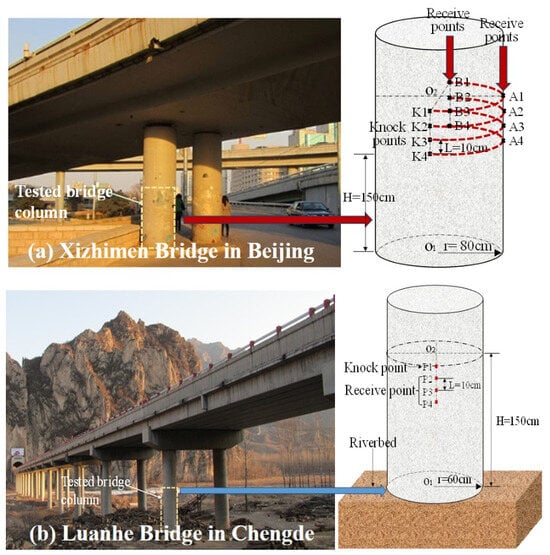
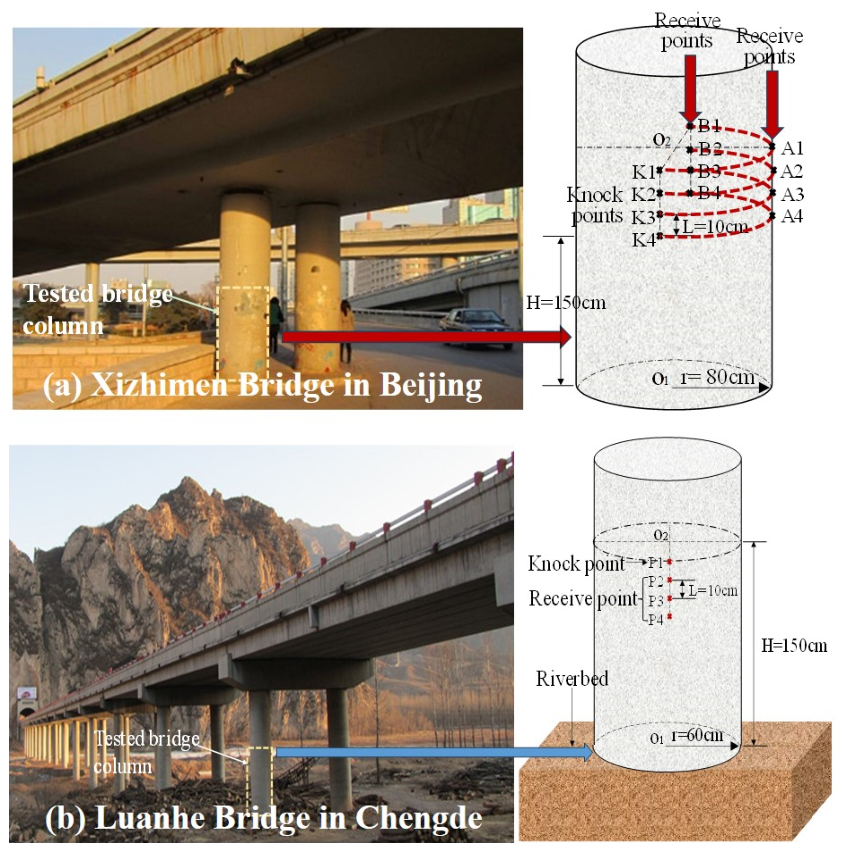
Field Impact-Echo (IE) measurements were conducted on two in-service cylindrical concrete bridge piers to examine the characteristics and repeatability of stress-wave responses under practical testing conditions. The two sites were the Xizhimen Overpass and the Luanhe Bridge; see Figure 2. The field investigation was designed primarily to characterize representative IE responses of cylindrical pier structures and to provide field observations for subsequent comparison with the numerical results, rather than to establish independently verified defect labels.
Figure 2.
Position of tested points at two testing sites.
At the Xizhimen Overpass, eight measurement locations were arranged and divided into two groups according to their source–receiver propagation geometries, denoted A1–A4 and B1–B4. Each location was tested twice, resulting in 16 recorded waveforms. Repeated measurements were adopted to evaluate local response stability and to reduce the influence of individual impacts on the subsequent signal-feature extraction. Because Groups A and B corresponded to different propagation configurations, their responses were analyzed separately rather than assuming that all eight measurement locations shared an identical propagation path. At the Luanhe Bridge section, additional IE measurements were performed on a cylindrical pier using multiple source–receiver arrangements. Repeated measurements were conducted to examine the consistency of the dominant spectral response and to estimate the bulk P-wave velocity of the concrete. The corresponding source–receiver configurations and measured propagation velocities are summarized in Table 1 and Table 2. Distances reported in these tables represent the actual source–receiver spacing used for the corresponding propagation-time calculations. To avoid ambiguity associated with the curved pier surface, source–receiver spacing, circumferential distance, and vertical spacing are distinguished explicitly where applicable.
Table 1.
Elastic wave velocity test results—Xizhimen Overpass.
Table 2.
Elastic wave velocity test results—Luanhe Bridge.
The source–receiver distances listed in Table 1 and Table 2 refer specifically to the measurements used to estimate the bulk P-wave velocity. They should not be interpreted as propagation-path lengths corresponding to the instrument-reported TOF values discussed below.
The field tests were conducted on existing bridge piers for which destructive verification, such as core sampling, was unavailable. Therefore, none of the measurement locations was assumed to represent a confirmed internal defect or a verified intact region. The field measurements were used primarily to characterize spatial variations and response repeatability. The limitations associated with reference selection and field interpretation are further discussed in Section 4.3.
2.2. Signal Processing and Feature Extraction
The recorded IE signals were processed using a consistent workflow to enable comparison among repeated measurements and measurement locations. For the Xizhimen data, each waveform covered a duration of 10 ms with a sampling interval of approximately 0.01 ms, corresponding to a sampling frequency of approximately 100 kHz. The same processing procedure was applied to all repeated measurements.
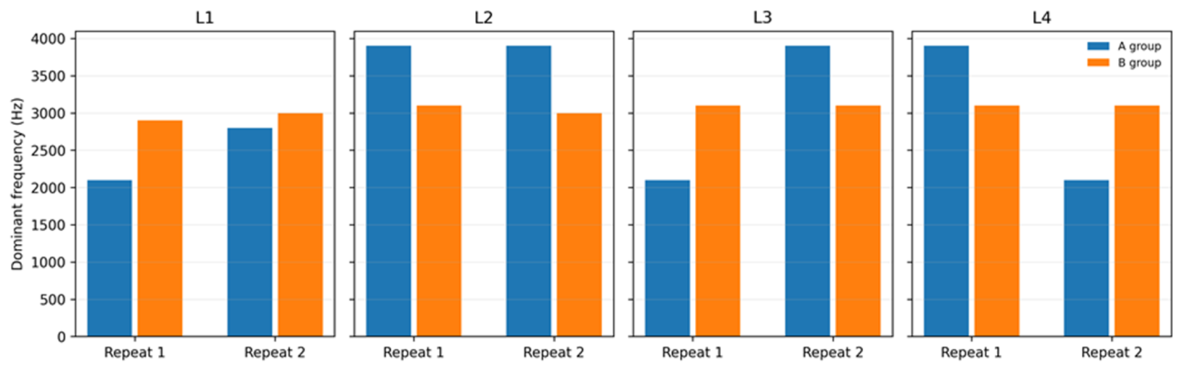
The recorded time-domain signals were first examined for signal quality and measurement repeatability. For each measurement location, the two repeated records were processed independently using the same Fourier-transform procedure, and the dominant frequency of each individual record was identified from its amplitude spectrum. These individual dominant-frequency results are presented in Figure 3 to illustrate the variability between repeated measurements. For the pointwise summary in Table 3, the amplitude spectra of the two repeated measurements were averaged frequency by frequency, and the dominant frequency was determined from the resulting averaged spectrum within the specified analysis band. Where multiple spectral peaks exhibited comparable magnitudes, they were described as competing spectral components rather than being assigned unique physical interpretations.
Figure 3.
Dominant frequencies extracted from individual repeated measurements at the Xizhimen Overpass.
Table 3.
Dominant frequency derived from the averaged amplitude spectrum.
For the field measurements, the time-of-flight (TOF) values reported in the subsequent analysis were obtained directly from the field testing instrument. The internal algorithm used by the instrument to determine these values was not independently reconstructed or verified in the present study. Therefore, the instrument-reported TOF values are treated as comparative temporal response features rather than independently determined first-arrival P-wave travel times. It should also be noted that these TOF values are distinct from the propagation time intervals listed in Table 1 and Table 2, which were used together with the known source–receiver distances to estimate the bulk P-wave velocities. Accordingly, comparisons of instrument-reported TOF values are restricted to repeated measurements with similar source–receiver configurations, and no direct quantitative equivalence with the numerical temporal response features is assumed.
For the field frequency analysis, the dominant frequency was identified as the maximum peak in the Fourier amplitude spectrum within the frequency range of 1–50 kHz. The same frequency-selection criterion was applied consistently to the repeated measurements.
2.3. Basic Field Response Characteristics
2.3.1. Xizhimen Overpass
The repeated measurements at the Xizhimen Overpass revealed spatial variations in spectral characteristics and differences in repeatability among measurement locations (Figure 3). For Group B, the principal spectral responses were generally concentrated within approximately 2.9–3.1 kHz, with B2–B4 exhibiting dominant responses near 3.1 kHz. In Group A, A2 exhibited a relatively stable dominant response near 3.9 kHz, whereas A1, A3, and A4 showed stronger competing spectral components within approximately 2.1–3.9 kHz.
The dominant-frequency characteristics of the Xizhimen measurements are summarized in Table 3. While Figure 3 presents the dominant frequencies extracted from individual repeated measurements, Table 3 provides the corresponding pointwise summary based on the averaged amplitude spectra. Several locations exhibited competing spectral peaks of comparable magnitude, indicating that the identification of a single dominant frequency may be sensitive to the spectral peak-selection procedure.
The presence of competing spectral peaks should not be interpreted as evidence of an internal defect. In cylindrical structural members, the measured frequency response can be affected by propagation geometry, cross-sectional vibration modes, local material variability, and boundary-related wave interactions [13,14]. The field observations are therefore interpreted as spatial variations in the measured response rather than as direct identification of specific defect types.
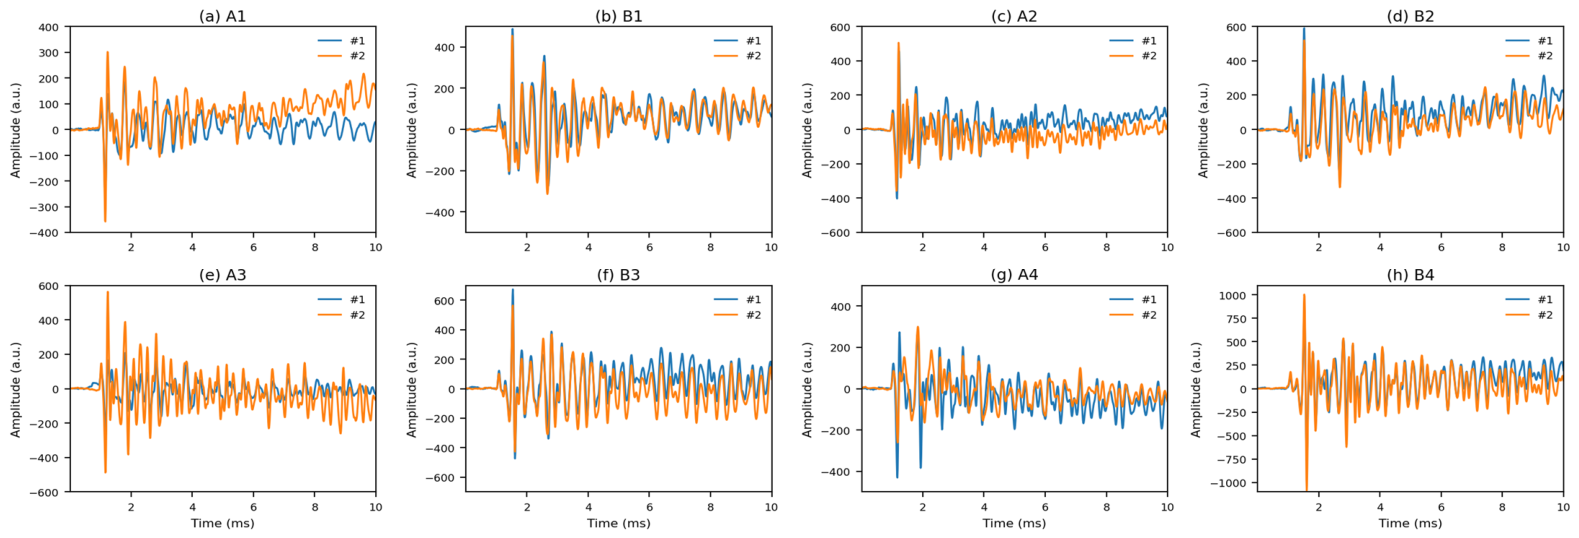
The extracted time-of-flight (TOF) values showed relatively high repeatability between repeated impacts at individual measurement locations. The field waveform amplitudes are reported in instrument-output units because an independent calibration of the complete sensor and acquisition chain was not available. Accordingly, the absolute field amplitude is not interpreted as a calibrated particle velocity and is not quantitatively compared with the finite-element velocity amplitude. For Group A, the measured TOF values were approximately 0.96–0.98 ms, whereas those for Group B were approximately 1.01–1.05 ms (Figure 4).
Figure 4.
Representative time-domain responses of the repeated Xizhimen measurements.
The difference in the instrument-reported TOF values between Groups A and B may be associated with their different source–receiver configurations. However, because the instrument’s internal TOF determination algorithm was not independently verified, the absolute values should not be interpreted as uniquely defined direct-path travel times. Their repeatability primarily indicates consistency of the instrument output under comparable measurement conditions.
The repeated measurements also indicated differences in response consistency among locations, with Group B generally exhibiting more consistent waveforms than Group A. These observations highlight the importance of repeated impacts when interpreting field IE measurements, particularly when several spectral components have comparable magnitudes. Comparisons should be made primarily within geometrically comparable measurement groups, and substantial deviations should prompt repeat measurements or complementary nondestructive evaluation rather than immediate defect classification. Because destructive verification was unavailable, the field measurements provide evidence of response variability and repeatability but do not independently establish the presence, type, or severity of internal defects.
2.3.2. Luanhe Bridge
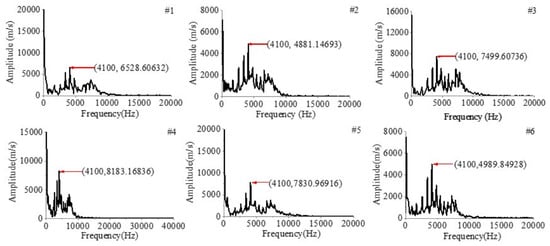
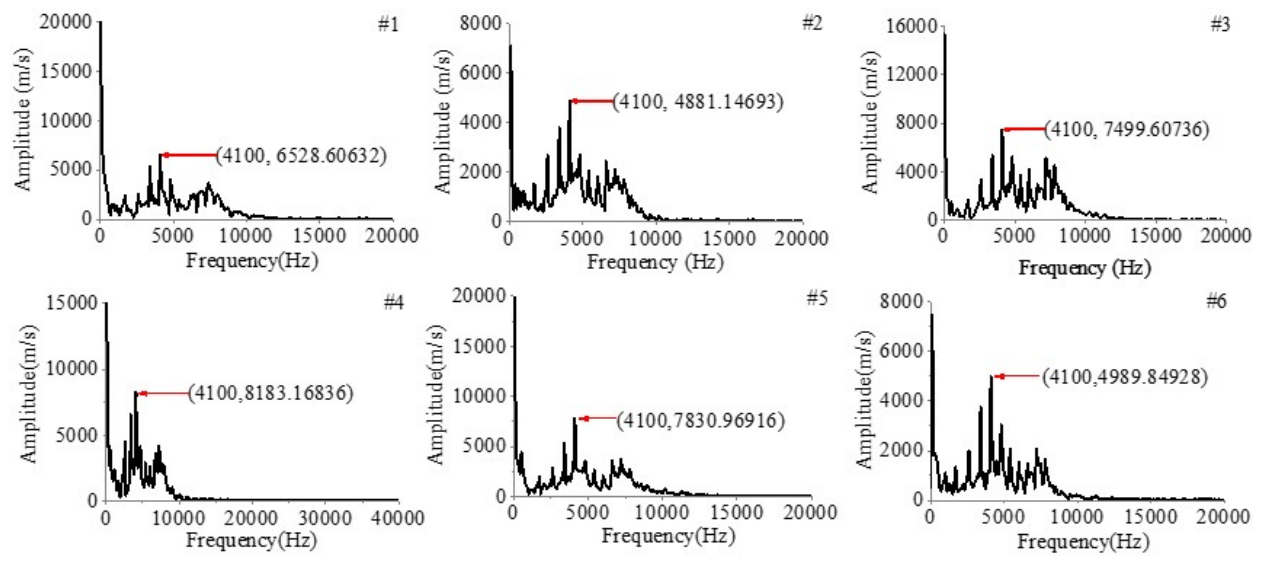
The Luanhe Bridge measurements exhibited a comparatively stable dominant-frequency response. A fixed impact position was used with three receiving locations arranged along the pier surface, and two repeated measurements were acquired at each location. Across the six recorded signals, the principal spectral component remained near approximately 4.1 kHz (Figure 5). The measured bulk P-wave velocity averaged approximately 4108 m/s, providing a field estimate of the elastic-wave propagation characteristics of the concrete.
Figure 5.
Dominant-frequency spectra obtained from FFT analysis of the Luanhe Bridge measurements.
The Luanhe Bridge measurements exhibited a reproducible dominant spectral component near approximately 4.1 kHz. However, the physical origin of this component cannot be uniquely identified from the available field data. In a cylindrical pier, the measured response may be influenced by cross-sectional or structural vibration modes, reinforcement, construction-related interfaces, local material variability, boundary conditions, and other wave-interaction effects. In the absence of destructive verification, complementary subsurface information, or dedicated modal identification, the approximately 4.1 kHz component is therefore treated only as a repeatable field spectral response and is not used to infer a specific internal reflector depth, void, or defect location.
Although the dominant spectral peak was consistent across the six records, the three receiving locations corresponded to different source–receiver propagation paths. In the present study, TOF and transmission amplitude are treated as supplementary stress-wave response features rather than as classical Impact-Echo observables. The conventional Impact-Echo interpretation is based primarily on the transient frequency response, whereas the additional temporal and amplitude quantities are used only for comparative analysis of wave-propagation changes. Their TOF and amplitude responses should therefore not be compared using a single global reference without accounting for measurement geometry. The confirmed field frequency analysis was based on Fourier transformation of the recorded time histories. Because the instrument’s internal TOF algorithm was not independently reconstructed, its TOF output is treated separately from the numerical time-domain features evaluated in this study.
Taken together, the Luanhe Bridge measurements demonstrate that a repeatable dominant spectral response can be obtained under the investigated field conditions. However, repeatability alone does not establish whether a specific internal defect is present or absent.
3. Numerical Interpretation of Defect-Induced IE Responses
3.1. Numerical Model and Simplifying Assumptions
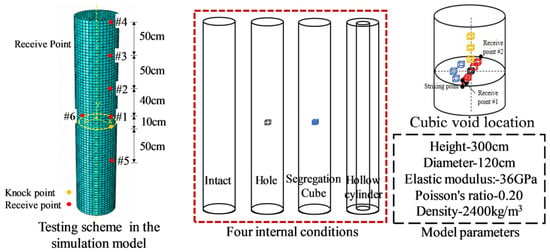
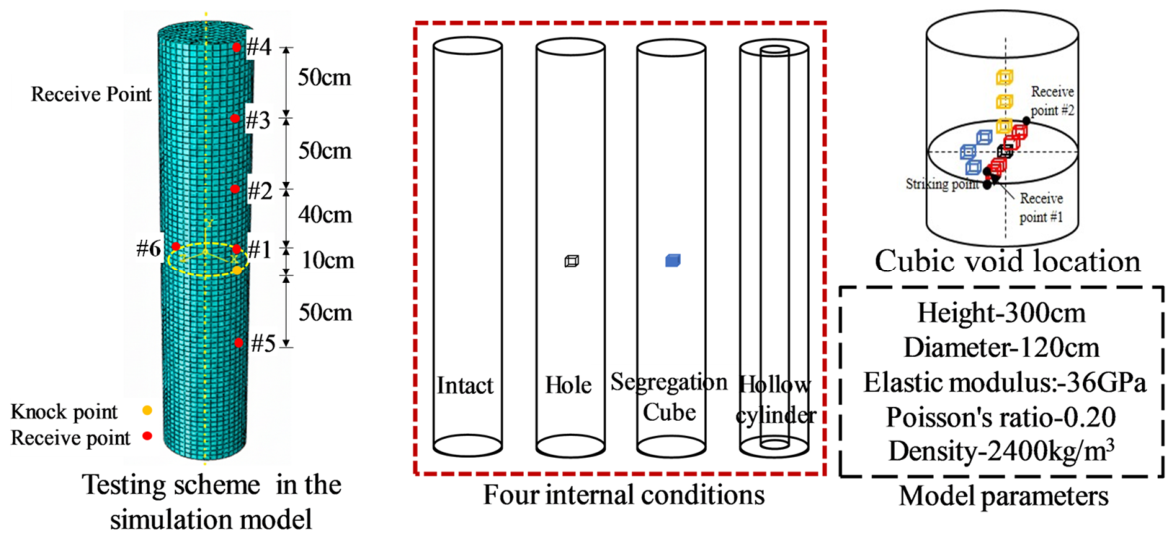
Three-dimensional numerical modeling has been increasingly used to investigate IE wave propagation and defect-related response mechanisms under controlled conditions [29]; see Figure 6. The model consisted of a simplified cylindrical member with a diameter of 1.20 m and a height of 3.00 m, dimensions representative of the bridge-pier scale considered in the field investigation. The adopted material parameters produced a P-wave velocity of approximately Vp = 4100 m/s, which is consistent with the field-measured values of 4034 m/s at the Xizhimen Overpass and 4108 m/s at the Luanhe Bridge. This agreement is used here as a consistency check for the bulk elastic properties rather than as a full validation of the numerical model. Impact excitation was represented by a half-sine force applied to the cylinder surface at a height of 1.5 m. The force amplitude was 1 N, and the loading duration was 100 μs. The temporal characteristics of the excitation are relevant because the impact duration and excitation mechanism govern the frequency bandwidth introduced into the concrete member [30]. Eight-node linear brick elements with reduced integration (C3D8R) were used.
Figure 6.
Threedimensional finite element model of the cylindrical concrete member.
A refined mesh size of 1 cm was adopted near the impact region, while a mesh size of 2 cm was used in the remaining regions. Based on the compressional-wave velocity of approximately 4100 m/s, the adopted mesh provides at least six elements per P-wave wavelength within the principal frequency range of 1–25 kHz. This resolution criterion applies specifically to P-waves and does not necessarily extend to shear waves, which have shorter wavelengths. Therefore, the adequacy of the numerical discretization was further assessed through the mesh-sensitivity analyses presented in Table 4. Numerical sensitivity was evaluated using representative intact, 10 cm hollow-void, and 10 cm segregation cases. Mesh refinement produced only minor changes in the dominant spectral frequencies and did not alter the principal relative response trends. A separate temporal-resolution check likewise showed that the dominant spectral components were insensitive to the output/time-resolution setting used for post-processing. In addition, an extended-height model was analyzed to evaluate the influence of reflections from the finite axial boundaries. Although the end boundaries contribute to the complete transient response, the principal comparative spectral trends discussed in this study remained stable.
Table 4.
Mesh sensitivity.
The refined-mesh results produced only minor changes in the dominant frequencies at the principal monitoring locations. The frequency differences remained within 3% for the representative intact and defective cases, while the principal spectral trends were unchanged. This comparison indicates that the reported dominant-frequency shifts are not primarily caused by the baseline mesh resolution.
Temporal output-resolution sensitivity was evaluated by repeating a representative simulation with the recorded output interval reduced by half. This check evaluates the sensitivity of the extracted spectral response to output sampling and should not be interpreted as a formal convergence test of the Abaqus/Explicit integration time step. The principal spectral peaks changed only marginally (Table 5), indicating that the reported frequency components were not controlled by the temporal output resolution used for post-processing. No mass scaling was employed.
Table 5.
Temporal output-resolution sensitivity.
The influence of the finite axial boundaries was examined by extending the cylinder height while preserving the local impact–receiver configuration. Although changes in the finite geometry modified parts of the transient response, the dominant frequencies changed by approximately 2.1% or less, as summarized in Table 6. The results are therefore treated as model-specific comparative responses rather than as boundary-independent resonance frequencies.
Table 6.
End-boundary sensitivity.
Seven monitoring locations were arranged on the model to record velocity–time histories along representative propagation paths. Point 1# was used as the near-field response location, while Point 6# represented the backside response on the opposite side of the cylinder. Additional points were distributed along the surface and axial direction to examine spatial variation. Their geometric locations are shown in Figure 6. Subsequent analysis focuses primarily on the near-field and backside responses because these two locations provide clear contrasts in spectral response, waveform timing, and transmission characteristics.
The numerical model was intentionally simplified to isolate defect-induced changes in the IE response. Concrete was treated as a homogeneous and isotropic elastic medium. Reinforcing bars, aggregate-scale heterogeneity, microcracking, soil–pier interaction, and superstructure coupling were not explicitly represented. The internal defects were also idealized using regular geometric shapes. Accordingly, the model is used primarily as a mechanism-interpretation and parametric-comparison tool rather than as a complete predictive representation of an in-service reinforced-concrete pier. Such idealization is commonly adopted in numerical NDT studies to isolate individual defect parameters, although actual concrete defects may exhibit substantially more complex geometries and material distributions [31]. These simplifications should therefore be considered when extrapolating the numerical results to quantitative field assessment.
3.2. Representative Defect Scenarios
Three idealized defect categories were considered to examine how geometric discontinuities and material degradation modify the IE response. The purpose of these models was not to reproduce the exact morphology of field defects, which may be irregular and spatially heterogeneous, but to provide controlled numerical cases in which the effects of defect type, size, and position could be compared systematically.
- (1)
- Cubic hollow voids. Air-filled cubic regions were represented as internal voids to approximate geometric discontinuities associated with incomplete compaction or localized void formation. Cube edge lengths of 5, 10, and 15 cm were investigated. Previous numerical and experimental IE studies have demonstrated that void dimensions and depth can substantially modify the characteristic spectral response [32].
- (2)
- Segregation zones. Low-quality concrete regions were assigned a density ρ = 2000 kg/m3, Young’s modulus E = 10 GPa, and Poisson’s ratio ν = 0.20. These regions represent a simplified material-degradation condition in which elastic waves can still propagate through the affected zone, although with altered velocity and attenuation characteristics. The same 5, 10, and 15 cm size range was examined.
- (3)
- Concentric hollow cylinders. Coaxial cylindrical voids with inner diameters of 30, 60, and 90 cm were introduced to investigate the influence of larger internal hollow regions on circumferential and backside responses.
For the cubic defects, the defect center was initially aligned with the impact height to promote interaction between the incident wavefield and the internal anomaly. Additional parametric cases varied the radial distance from the impact point, circumferential angle, and axial distance. Numerical defect simulations were generated across the parameter series listed in Table 7. These cases are referred to as a parametric set rather than a calibration database because they were designed primarily to identify response trends under controlled numerical conditions. The numerical investigation included 22 unique cubic-defect configurations, comprising 15 hollow-void cases and 7 segregation cases, as summarized in Table 8. In addition, three coaxial hollow-cylinder configurations with inner diameters of 30, 60, and 90 cm were investigated separately to examine the influence of larger internal hollow regions on the spectral response. These coaxial configurations were excluded from the DI statistical evaluation. Each physical configuration was counted only once to avoid duplication arising from overlapping parameter series.
Table 7.
Numerical parameter series investigated for different defect configurations.
Table 8.
Inventory of the numerical defect configurations and corresponding dominant-frequency features.
The defect geometries adopted in the numerical analysis represent idealized conditions designed to isolate the effects of defect type, size, and spatial position. In particular, the cubic low-modulus regions used to represent segregation are not intended to reproduce the exact irregular morphology of honeycombed or spatially heterogeneous concrete in practice. Rather, they provide a controlled representation of a localized region with reduced stiffness and density. Consequently, the present numerical results should be interpreted in terms of general response trends, while the influence of irregular defect boundaries and heterogeneous material distributions requires further investigation.
3.3. Influence of Defect Type, Size, and Location on IE Responses
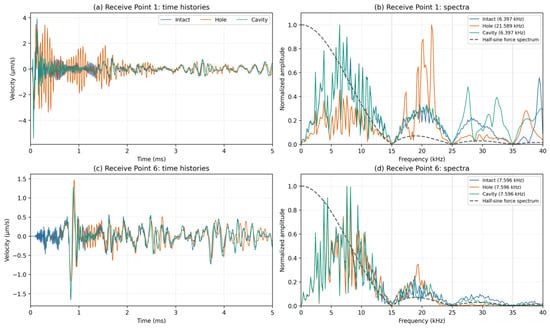
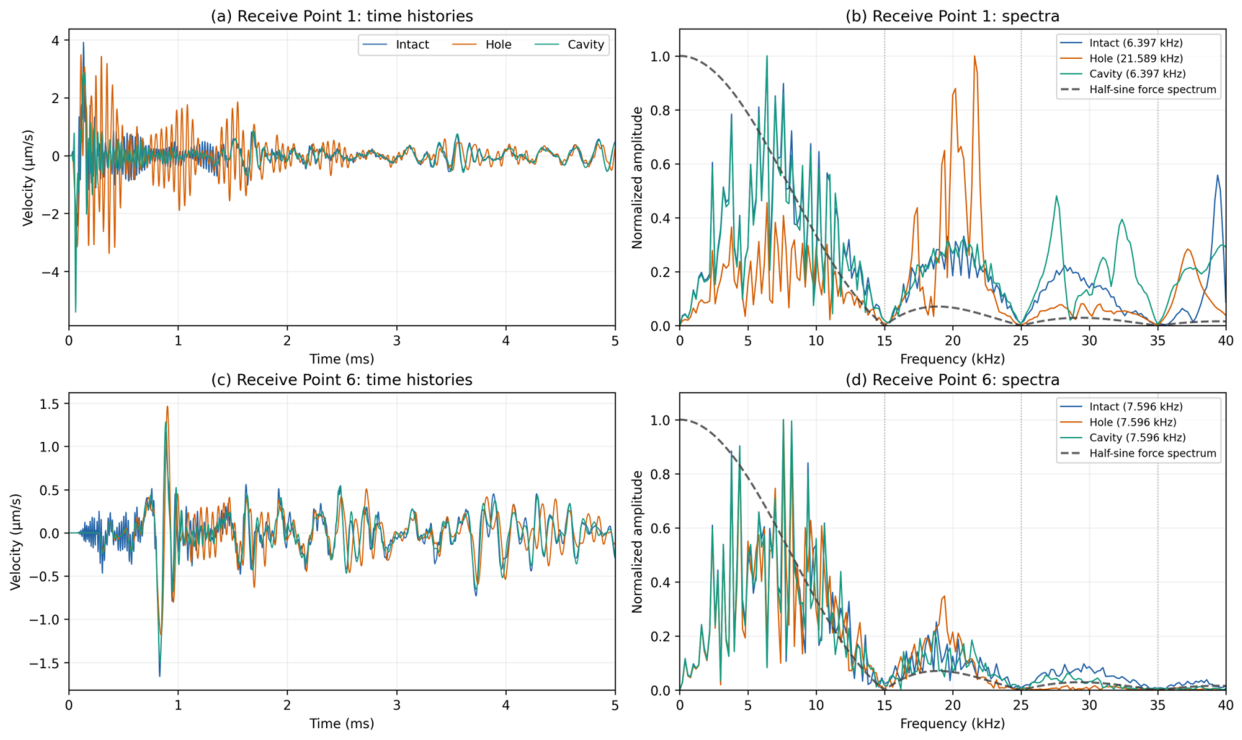
The simulated responses were examined in both the time and frequency domains. Representative results for the intact, hollow-void, and segregation-like conditions are presented in Figure 7. For the intact model, the dominant frequencies at Receive Points 1# and 6# were approximately 6.397 and 7.596 kHz, respectively. For the representative hollow-void configuration, the dominant frequency at Receive Point 1# increased to approximately 21.589 kHz, whereas that at Receive Point 6# remained at approximately 7.596 kHz, consistent with the intact reference. This contrast highlights the dependence of the spectral response on the monitoring location.
Figure 7.
Representative numerical time-domain responses and normalized frequency spectra.
The spectral characteristics of the applied excitation must also be considered. The 100 µs half-sine force has a nonuniform amplitude spectrum, with spectral nulls at approximately 15, 25, and 35 kHz. The high-frequency dominant peak near 21.589 kHz falls within a side lobe of the excitation spectrum. Consequently, the observed dominant-frequency shifts reflect the combined effects of the excitation characteristics and the frequency-dependent dynamic response of the cylindrical member. Although identical excitation conditions were employed for all numerical configurations, changes in defect geometry and material properties may redistribute the relative amplitudes of competing spectral components and alter which component becomes dominant. Therefore, the high-frequency response should not be attributed exclusively to the presence of an internal defect or interpreted as a uniquely identifiable defect resonance frequency. The results are instead considered excitation-dependent, model-specific spectral features that provide a basis for comparative assessment under consistent numerical excitation and processing conditions.
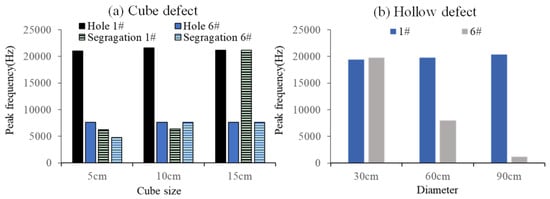
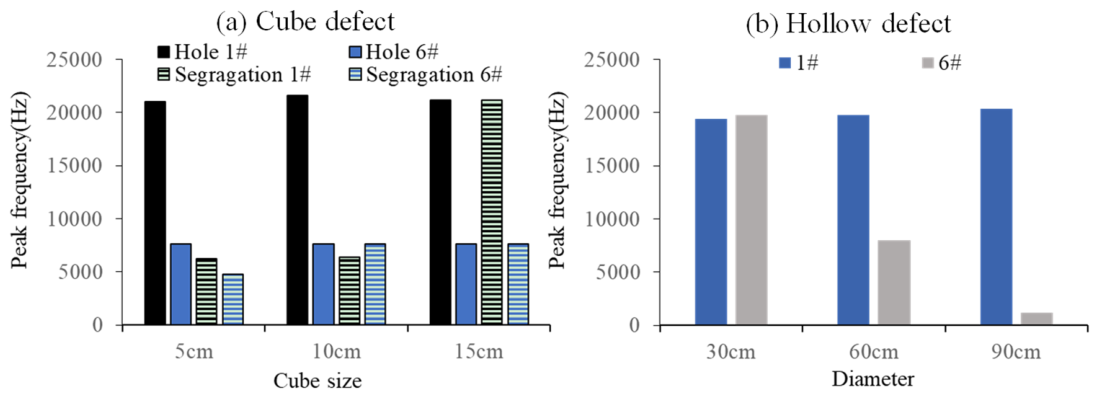
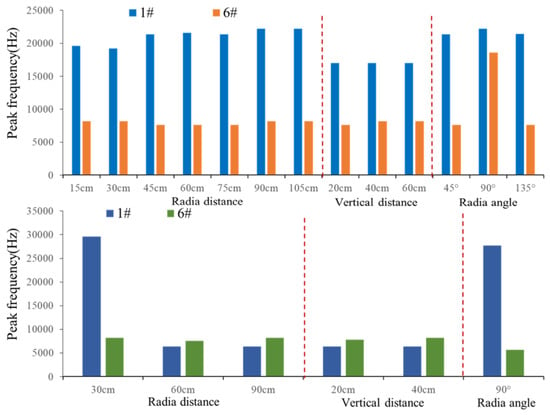
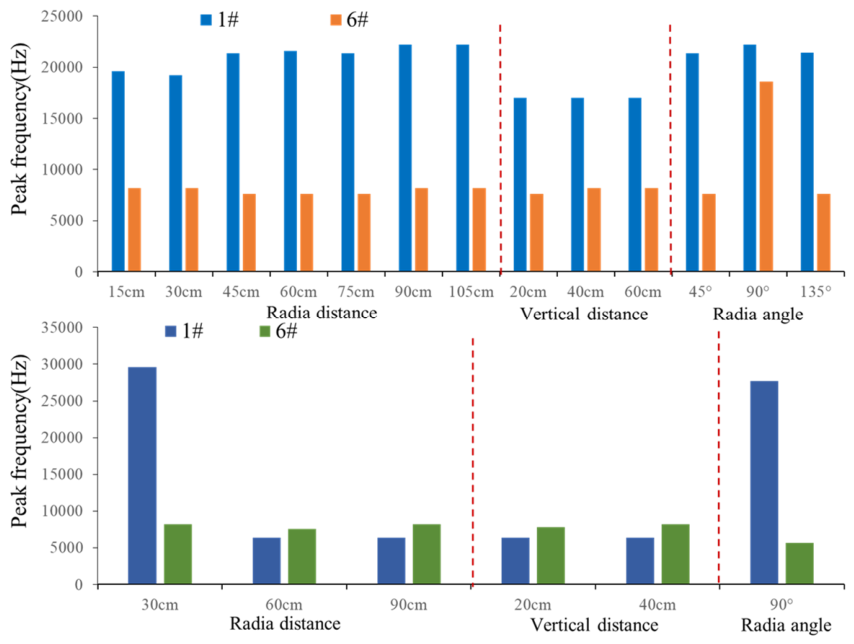
Defect size produced different trends for hollow voids and segregation zones presented in Figure 8. Within the modeled cubic-void cases, the near-field dominant frequency remained close to 21 kHz for void sizes of 5–15 cm. This trend suggests that, for the investigated geometry and impact configuration, the near-field spectral response is governed more strongly by the local wave-boundary configuration than by cube size alone. At the backside location, however, the dominant-frequency response exhibited a different size-dependent pattern. The 10 cm hollow void retained a dominant frequency of approximately 7.60 kHz, consistent with that of the intact model, whereas the other void sizes exhibited different spectral responses. These results suggest that the influence of void size on the dominant-frequency response is measurement-location dependent and does not necessarily produce a systematic frequency shift.
Figure 8.
Effect of defect size on the dominant frequency for cubic voids, segregation zones, and concentric hollow-cylinder cases.
The segregation cases exhibited a contrasting size dependence. The 5 and 10 cm segregation zones retained dominant frequencies near 6.2–6.4 kHz, while the 15 cm case produced a dominant frequency of approximately 21.19 kHz. The large frequency shift in this case demonstrates that high-frequency spectral content is not unique to hollow defects. Instead, sufficiently large or favorably positioned degraded regions may also alter the local vibration response.
The concentric hollow-cylinder models further demonstrate the influence of defect scale. Near-field dominant frequencies remained in the range of approximately 19.0–20.4 kHz across the investigated inner diameters. In contrast, the backside frequency was strongly size-dependent, decreasing from approximately 19.79 KHz for an inner diameter of 30 cm to approximately 7.996 KHz at 60 cm and 1.199 KHz at 90 cm. Within the present model, the backside response therefore provides a sensitive indication of changes in the scale of a large internal hollow region.
As shown in Figure 9, the dominant-frequency responses varied with defect location and monitoring position. For the hollow-void configurations, the near-field dominant frequencies generally remained in the high-frequency range, whereas the backside responses exhibited greater variability across the investigated positions. The segregation configurations showed different spectral characteristics, including a pronounced high-frequency response at selected locations. These results indicate that the dominant-frequency response depends on the combined effects of defect configuration and receiver position and does not provide a location-independent criterion for defect identification.
Figure 9.
Influence of defect position on the dominant-frequency response.
3.4. Physical Interpretation of Defect-Induced Responses
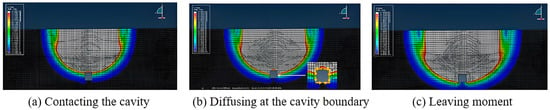
The contrasting numerical responses are interpreted primarily in terms of wave-path modification, transmission blockage, scattering, and energy redistribution. Because dedicated modal identification was not performed, individual spectral peaks are not assigned to specific structural or local resonance modes. For an air-filled void, the strong acoustic-impedance contrast substantially reduces direct transmission through the defect region. The incident wavefront is redirected around the void boundary, modifying the effective propagation path and the waveform characteristics recorded at the backside location. The wavefield snapshots in Figure 10 illustrate this diffraction and path-detour behavior.
Figure 10.
Representative wavefield snapshots.
The representative time-domain responses show clear differences among the intact, hollow-void, and segregation cases. At the backside monitoring location, the hollow-void response exhibited a more pronounced temporal shift and stronger attenuation than the intact and segregation cases, while the segregation response remained intermediate. These differences are interpreted as comparative changes in the transient waveform rather than as directly measured first-arrival P-wave travel-time delays. The observed temporal shifts may reflect the combined effects of scattering, reflection, interference, and modification of the effective propagation path [33,34]. The hollow-void case also exhibited a substantially reduced backside transmission amplitude and a pronounced high-frequency spectral component, consistent with stronger disruption of the stress-wave field.
The representative hollow-void case exhibited a reduced transmission amplitude at the backside monitoring location, while a pronounced high-frequency dominant peak near 21.6 kHz was identified at Receive Point 1#. The physical origin of this high-frequency component cannot be uniquely established without dedicated modal analysis. Therefore, it is interpreted as a configuration-specific spectral response influenced by the excitation characteristics, internal void, and finite cylindrical geometry.
Segregation produces a different physical response because the degraded material retains finite stiffness and density. Elastic waves can therefore propagate through the affected region, although their velocity, phase, and amplitude are modified. In the representative 10 cm case, the amplitude transmission ratio of 0.274 was much higher than that of the hollow void, while the dominant frequency remained at 6397 Hz. This behavior is consistent with progressive scattering and energy redistribution within a lower-stiffness region rather than near-total geometric blockage.
Taken together, the numerical results show that hollow voids and segregation zones influence the IE response through partially different mechanisms, but their individual signal features can overlap under certain geometric conditions. This is particularly evident for the 15 cm segregation case, which also develops a pronounced high-frequency response. The numerical results demonstrate that temporal, spectral, and amplitude responses can exhibit different sensitivities to defect configuration. In the present study, however, only the dominant-frequency shift is subsequently quantified as a normalized numerical indicator, while the temporal and amplitude responses are retained for qualitative physical interpretation.
It should also be emphasized that the specific dominant frequencies obtained in the representative numerical cases are not proposed as universal defect-identification criteria. The absolute frequency response is influenced by defect dimensions and depth, concrete properties, impact characteristics, and structural geometry [35,36,37,38,39]. Therefore, the present study focuses on relative spectral variation and on qualitative differences in waveform timing and transmission characteristics rather than on a universal frequency threshold. The numerical analysis is consequently used to support physical interpretation of the observed response mechanisms and parametric trends, rather than to directly infer the exact size or morphology of field defects.
4. Normalized Frequency-Shift Analysis
4.1. Definition of the Frequency-Shift Indicator
The numerical results indicate that a single dominant frequency cannot uniquely distinguish all hollow-void and segregation configurations. Nevertheless, a normalized frequency shift provides a transparent measure for describing how an investigated numerical response departs from the corresponding intact reference. For the numerical simulations, the dominant frequency was determined from the Fourier amplitude spectrum of the complete velocity–time record. The spectral peak search was performed over the frequency range of 1–50 kHz. Prior to Fourier transformation, the mean value of each signal was removed, and no additional window function was applied. Where necessary, the time histories were linearly interpolated onto a uniform time grid for spectral processing. This interpolation was used only as a computational preprocessing step and did not introduce additional physical information. The normalized dominant-frequency shift is defined as Equation (1):
where fi is the dominant frequency of the investigated defective case, and f0 is the corresponding dominant frequency of the intact reference at the same receiver point, extracted using the same processing rule. The receiver-specific intact reference frequencies are 6396.8 Hz at Receive Point 1# and 7596.2 Hz at Receive Point 6#. The numerical f0 is used only as an internal model-specific reference and should not be interpreted as the expected intact frequency of the field pier. DI is dimensionless and quantifies the relative spectral deviation from this numerical reference. It is not a calibrated measure of defect size, severity, or probability. Because the feature depends on the peak-selection rule, a near-equal double-peak response must be flagged rather than resolved retrospectively in favor of a preferred classification.
DI = |fi − f0|/f0
4.2. Numerical Evaluation of the Frequency-Shift Indicator
After identifying and removing duplicate entries corresponding to the same physical defect configuration, the numerical dataset comprised 22 unique configurations, including 15 hollow-void cases and 7 segregation cases, as summarized in Table 8. The baseline 10 cm cubic hollow-void configuration, which was included in the axial-position, radial-position, and defect-size parameter series, was counted only once in the statistical analysis.
At Receive Point 1#, the mean normalized dominant-frequency shift (DI) was 2.185 for the hollow-void cases and 0.810 for the segregation cases. The corresponding median values were 2.344 and 0.000, respectively, while the ranges were 1.656–2.469 for the hollow-void cases and 0–3.325 for the segregation cases.
These descriptive statistics indicate that the hollow-void configurations generally exhibited larger dominant-frequency shifts than the segregation configurations within the investigated numerical parameter set. Nevertheless, the distributions overlapped, and certain segregation configurations also exhibited pronounced frequency shifts. Furthermore, because the dominant-frequency response depends on both the excitation spectrum and the dynamic characteristics of the model, the DI values should be interpreted as excitation-dependent, model-specific measures of relative spectral deviation rather than universal indicators of defect type or severity.
Particular attention is required for the segregation case at a radial distance of 30 cm, which contains a peak near 6396.8 Hz and a competing peak near 29,585.2 Hz. The competing peak magnitude is approximately 99.69% of the primary peak. Because the selected dominant frequency, and consequently the calculated indicator, may change substantially depending on the peak-selection rule, this case is considered peak-selection-sensitive. The peak-selection procedure should therefore be fixed before comparing defect categories, rather than adjusted retrospectively to maximize their separation. The category-level results are exploratory because the numerical cases form a designed parameter sweep rather than an independent random validation sample.
4.3. Field Interpretation and Study Limitations
The numerical frequency-shift indicator was not applied quantitatively to the present field measurements because no independently verified intact field reference was available. More generally, any future field application would require a reliable reference obtained under comparable source–receiver geometry, excitation, sensor configuration, and signal-processing conditions. The intact reference frequencies used in the numerical simulations cannot be transferred directly to field measurements because the numerical and field systems differ in structural geometry, reinforcement, material heterogeneity, boundary conditions, excitation, coupling, and propagation configuration [40,41]. Accordingly, the present field results are interpreted only in terms of spectral variability and measurement repeatability.
The present study has several limitations. The numerical cases represent a controlled parametric investigation rather than an independently validated defect-classification dataset. Furthermore, the field measurements were conducted on a limited number of in-service bridge piers without independent confirmation of internal defects. Consequently, the normalized frequency-shift indicator should be regarded as an exploratory, model-specific measure of relative spectral deviation rather than a validated criterion for determining defect presence, type, or severity.
Future research should systematically evaluate the effects of reference selection, competing spectral peaks, record duration, and signal-processing parameters before extending the frequency-shift concept to field assessment [42,43,44,45].
5. Conclusions
This study investigated the Impact-Echo (IE) responses of cylindrical concrete bridge piers through field measurements and three-dimensional finite-element simulations. The main conclusions are as follows:
- (1)
- Field measurements demonstrated that repeatable IE spectral responses can be obtained from in-service cylindrical concrete bridge piers under the investigated testing conditions. The Xizhimen Overpass exhibited spatial variations and competing spectral peaks, while the Luanhe Bridge showed a relatively stable dominant frequency near 4.1 kHz. These results highlight the importance of measurement repeatability and geometry in interpreting IE responses.
- (2)
- Numerical simulations showed different stress-wave response characteristics for hollow voids and segregation-like low-stiffness regions. Hollow voids generally caused stronger transmission blockage, whereas waves continued to propagate through segregation regions. However, the dominant-frequency responses of the two defect types overlapped under certain configurations, indicating that frequency alone cannot reliably distinguish defect types.
- (3)
- The normalized dominant-frequency shift (DI) provided a quantitative measure of relative spectral deviation within the numerical model. Hollow-void configurations generally exhibited larger frequency shifts than segregation configurations within the investigated parameter set. However, the distributions overlapped, and the result for at least one segregation case was strongly sensitive to dominant-peak selection.
Overall, the findings support the use of IE measurements and numerical modeling for comparative characterization of stress-wave responses in cylindrical concrete bridge piers. Further validation using independently confirmed defect conditions is required before the proposed numerical frequency-shift indicator can be extended to quantitative field assessment.
Author Contributions
Conceptualization, L.D. and Y.M.; methodology, L.D. and X.Z.; software, L.D.; validation, X.D.; formal analysis, Z.X.; investigation, X.Z.; resources, X.Z. and Z.X.; data curation, L.D.; writing—original draft preparation, L.D.; writing—review and editing, L.D.; visualization, L.D.; supervision, X.D.; project administration, L.D. and Y.M.; funding acquisition, L.D. All authors have read and agreed to the published version of the manuscript.
Funding
The authors gratefully acknowledge financial support from the National Natural Science Foundation of China (Grant No 52608743); the Excellent Youth Project of the Hunan Provincial Department of Education (Grant No 23B0736); the Hunan Provincial Natural Science Foundation of China (Grant Nos. 2026JJ80347, 2026JJ60177); the Yiyang City Science and Technology Innovation Programme (Grant No. 2025YR01); and the Open Fund of the National Engineering Research Center of Highway Maintenance Technology (Changsha University of Science & Technology, Grant No. kfj230204).
Data Availability Statement
The data in this study are available upon request from the first author or corresponding author.
Acknowledgments
The authors gratefully acknowledge financial support from the Hunan Provincial Department of Education, Hunan Provincial Natural Science Foundation of China, and Changsha University of Science & Technology.
Conflicts of Interest
The authors declare no conflicts of interest.
References
- Kashif Ur Rehman, S.; Ibrahim, Z.; Memon, S.A.; Jameel, M. Nondestructive Test Methods for Concrete Bridges: A Review. Constr. Build. Mater. 2016, 107, 58–86. [Google Scholar] [CrossRef] [Scilit]
- Hertlein, B.H. Stress Wave Testing of Concrete: A 25-Year Review and a Peek into the Future. Constr. Build. Mater. 2013, 38, 1240–1245. [Google Scholar] [CrossRef] [Scilit]
- Lin, S.; Meng, D.; Choi, H.; Shams, S.; Azari, H. Laboratory Assessment of Nine Methods for Nondestructive Evaluation of Concrete Bridge Decks with Overlays. Constr. Build. Mater. 2018, 188, 966–982. [Google Scholar] [CrossRef] [Scilit]
- Sansalone, M.; Carino, N.J. Laboratory and Field Studies of the Impact-Echo Method for Flaw Detection in Concrete. NDT E Int. 1989, 112, 1–20. [Google Scholar] [CrossRef] [Scilit] [PubMed]
- Sansalone, M.; Carino, N.J. Impact-Echo: A Method for Flaw Detection in Concrete Using Transient Stress Waves; NBSIR 86-3452; National Bureau of Standards: Gaithersburg, MD, USA, 1986. [Google Scholar]
- Carino, N.J. The Impact-Echo Method: An Overview. In Proceedings of the Structures 2001: A Structural Engineering Odyssey; American Society of Civil Engineers: Reston, VA, USA, 26 April 2012; pp. 1–18. [Google Scholar] [CrossRef] [Scilit]
- Sansalone, M. Impact-Echo: The Complete Story. Struct. J. 1997, 94, 777–786. [Google Scholar] [CrossRef] [Scilit] [PubMed]
- Schubert, F.; Köhler, B. Ten Lectures on Impact-Echo. J. Nondestr. Eval. 2008, 27, 5–21. [Google Scholar] [CrossRef] [Scilit]
- Gibson, A.; Popovics, J.S. Lamb Wave Basis for Impact-Echo Method Analysis. J. Eng. Mech. 2015, 131, 438–443. [Google Scholar] [CrossRef] [Scilit]
- Wang, J.-J.; Chang, T.-P.; Chen, B.-T.; Lin, H.-C.; Wang, H. Evaluation of Resonant Frequencies of Solid Circular Rods with Impact-Echo Method. J. Nondestr. Eval. 2010, 29, 111–121. [Google Scholar] [CrossRef] [Scilit]
- Dethof, F.; Keßler, S. Explaining Impact Echo Geometry Effects Using Modal Analysis Theory and Numerical Simulations. NDT E Int. 2024, 143, 103035. [Google Scholar] [CrossRef] [Scilit]
- Sansalone, M.; Lin, Y.; Pratt, D.; Cheng, C.C. Advancements and New Applications in Impact-Echo Testing. Symp. Pap. 1991, 128, 135–151. [Google Scholar] [CrossRef] [Scilit] [PubMed]
- Lin, Y.; Sansolone, M. Detecting Flaws in Concrete Beams and Columns Using the Impact-Echo Method. Mater. J. 1992, 89, 394–405. [Google Scholar] [CrossRef] [Scilit] [PubMed]
- Liu, Y.; Xu, H.; Ma, X.; Wang, D.; Huang, X. Study on Impact–Echo Response of Concrete Column near the Edge. Appl. Sci. 2023, 13, 5590. [Google Scholar] [CrossRef] [Scilit]
- Carino, N.J.; Sansalone, M. Detection of Voids in Grouted Ducts Using the Impact-Echo Method. Mater. J. 1992, 89, 296–303. [Google Scholar] [CrossRef] [Scilit] [PubMed]
- Jaeger, B.J.; Sansalone, M.J.; Poston, R.W. Detecting Voids in Grouted Tendon Ducts of Post-Tensioned Concrete Structures Using the Impact-Echo Method. Struct. J. 1996, 93, 462–473. [Google Scholar] [CrossRef] [Scilit] [PubMed]
- Aggelis, D.G.; Shiotani, T.; Kasai, K. Evaluation of Grouting in Tunnel Lining Using Impact-Echo. Tunn. Undergr. Space Technol. 2008, 23, 629–637. [Google Scholar] [CrossRef] [Scilit]
- Kang, J.M.; Song, S.; Park, D.; Choi, C. Detection of Cavities around Concrete Sewage Pipelines Using Impact-Echo Method. Tunn. Undergr. Space Technol. 2017, 65, 1–11. [Google Scholar] [CrossRef] [Scilit]
- Song, K.-I.; Cho, G.-C. Bonding State Evaluation of Tunnel Shotcrete Applied onto Hard Rocks Using the Impact-Echo Method. NDT E Int. 2009, 42, 487–500. [Google Scholar] [CrossRef] [Scilit]
- Cao, D.; Pan, Z.; Zhang, Z.; Zeng, B. Experimental and Numerical Study on Detection of Sleeve Grouting Defect with Impact-Echo Method. Structures 2023, 52, 632–650. [Google Scholar] [CrossRef] [Scilit]
- Dethof, F.; Algernon, D.; Thurnherr, C.; Keßler, S. Factors Influencing Impact Echo Simulations in Thick Concrete Structures. J. Adv. Concr. Technol. 2024, 22, 636–649. [Google Scholar] [CrossRef] [Scilit]
- Lee, I.; Kwon, S.-H.; Park, J.; Oh, T. The Effective Near-Surface Defect Identification by Dynamic Behavior Associated with Both Impact-Echo and Flexural Modes for Concrete Structures. KSCE J. Civ. Eng. 2018, 22, 747–754. [Google Scholar] [CrossRef] [Scilit]
- Yeh, P.-L.; Liu, P.-L. Application of the Wavelet Transform and the Enhanced Fourier Spectrum in the Impact Echo Test. NDT E Int. 2008, 41, 382–394. [Google Scholar] [CrossRef] [Scilit]
- Zhu, J.; Popovics, J.S. Imaging Concrete Structures Using Air-Coupled Impact-Echo. J. Eng. Mech. 2015, 133, 628–640. [Google Scholar]
- Zhang, J.-K.; Yan, W.; Cui, D.-M. Concrete Condition Assessment Using Impact-Echo Method and Extreme Learning Machines. Sens. 2016, 16, 447. [Google Scholar] [CrossRef] [Scilit] [PubMed]
- Dorafshan, S.; Azari, H. Deep Learning Models for Bridge Deck Evaluation Using Impact Echo. Constr. Build. Mater. 2020, 263, 120109. [Google Scholar] [CrossRef] [Scilit]
- Sajid, S.; Taras, A.; Chouinard, L. Defect Detection in Concrete Plates with Impulse-Response Test and Statistical Pattern Recognition. Mech. Syst. Signal Process. 2021, 161, 107948. [Google Scholar] [CrossRef] [Scilit]
- Sajid, S.; Chouinard, L. Impulse Response Test for Condition Assessment of Concrete: A Review. Constr. Build. Mater. 2019, 211, 317–328. [Google Scholar] [CrossRef] [Scilit]
- Sawicki, B.; Piotrowski, T.; Garbacz, A. Development of Impact-Echo Multitransducer Device for Automated Concrete Homogeneity Assessment. Materials 2021, 14, 2144. [Google Scholar] [CrossRef] [Scilit] [PubMed]
- Strangfeld, C.; Grotelüschen, B.; Bühling, B. Air-Coupled Broadband Impact-Echo Actuation Using Supersonic Jet Flow. J. Nondestr. Eval. 2024, 43, 45. [Google Scholar] [CrossRef] [Scilit]
- Dethof, F.; Keßler, S. Design of Concrete Mock-Ups with Complex Defect Scenarios Using Numerical Simulations. J. Nondestr. Eval. 2024, 43, 59. [Google Scholar] [CrossRef] [Scilit]
- Ju, J.; Tian, X.; Zhao, W.; Yang, Y. Detection and Identification for Void of Concrete Structure by Air-Coupled Impact-Echo Method. Sensors 2023, 23, 6018. [Google Scholar] [CrossRef] [Scilit] [PubMed]
- Scherr, J.F.; Kollofrath, J.; Popovics, J.S.; Bühling, B.; Grosse, C.U. Detection of Delaminations in Concrete Plates Using a Laser Ablation Impact Echo Technique. J. Nondestruct. Eval. 2023, 42, 11. [Google Scholar] [CrossRef] [Scilit]
- Yang, H.-C.; Lin, Y. A Simplified Procedure for Evaluation of Damage-Depth in Concrete Exposed to High Temperature Using the Impact-Echo Method. NDT E Int. 2025, 149, 103270. [Google Scholar] [CrossRef] [Scilit]
- Kachanov, V.K.; Sokolov, I.V.; Samokrutov, A.A.; Lunin, V.P.; Fedorenko, S.A. Measuring the Acoustic Characteristics of Compact Concrete Building Structures Using the Impact Echo Method. Russ. J. Nondestr. Test. 2022, 58, 1–9. [Google Scholar] [CrossRef] [Scilit]
- Sengupta, A.; Ilgin Guler, S.; Shokouhi, P. Interpreting Impact Echo Data to Predict Condition Rating of Concrete Bridge Decks: A Machine-Learning Approach. J. Bridge Eng. 2021, 26, 04021044. [Google Scholar] [CrossRef] [Scilit]
- Hoxha, E.; Feng, J.; Sengupta, A.; Kirakosian, D.; He, Y.; Shang, B.; Gjinofci, A.; Xiao, J. Contrastive Learning for Robust Defect Mapping in Concrete Slabs Using Impact Echo. Constr. Build. Mater. 2025, 461, 139829. [Google Scholar] [CrossRef] [Scilit]
- Valtierra-Rodriguez, M.; Machorro-Lopez, J.M.; Amezquita-Sanchez, J.P.; Dominguez-Gonzalez, A.; Alvarez-Junco, S.; Gasca-Zamora, H.M. A New Damage Indicator Based on Homogeneity and Wireless Accelerometers for Evaluating the Structural Condition of a Cable-Stayed Bridge. Dev. Built Environ. 2023, 14, 100166. [Google Scholar] [CrossRef] [Scilit]
- Zhang, Q.; Babanajad, S.; Ho Ro, S.; Braley, J.; Alavi, A.H. Multi-Resource Fusion of Nondestructive Evaluation Data for Bridge Deck Assessment Using Discrete Wavelet Transform and Dempster-Shafer Theory. Measurement 2023, 220, 113303. [Google Scholar] [CrossRef] [Scilit]
- Pandum, J.; Hashimoto, K.; Sugiyama, T.; Yodsudjai, W. Impact-Echo for Different Level Cracks Detection in Concrete with Artificial Intelligence Based on Un/Supervised Deep Learning. Constr. Build. Mater. 2025, 487, 142080. [Google Scholar] [CrossRef] [Scilit]
- Lamsal, A.; Lamsal, B.; Kim, B.-J.; Ham, S.P.; Jang, D. Advanced Signal Analysis Model for Internal Defect Mapping in Bridge Decks Using Impact-Echo Field Testing. Sensors 2025, 25, 6623. [Google Scholar] [CrossRef] [Scilit] [PubMed]
- Lin, S.; Meng, L.; Zhao, G.; Zhang, J.; Xin, J.; Cheng, Y.; Cheng, S.; Zhai, C. Automatic Elimination of Invalid Impact-Echo Signals for Detecting Delamination in Concrete Bridge Decks Based on Deep Learning. Dev. Built Environ. 2024, 19, 100521. [Google Scholar] [CrossRef] [Scilit]
- Coleman, Z.W.; Schindler, A.K. Investigation of Ground-Penetrating Radar, Impact Echo, and Infrared Thermography Methods to Detect Defects in Concrete Bridge Decks. Transp. Res. Rec. J. Transp. Res. Board 2025, 2679, 169–182. [Google Scholar] [CrossRef] [Scilit]
- Pashoutani, S.; Zhu, J.; Sim, C.; Won, K.; Mazzeo, B.A.; Guthrie, W.S. Multi-Sensor Data Collection and Fusion Using Autoencoders in Condition Evaluation of Concrete Bridge Decks. J. Infrastruct. Preserv. Resil. 2021, 2, 18. [Google Scholar] [CrossRef] [Scilit]
- Yang, J.; Fan, G.; Xiang, Y.; Zhang, H.; Zhu, W.; Zhang, H.; Li, Z. Low-Frequency Ultrasonic Array Imaging for Detecting Concrete Structural Defects in Blind Zones. Constr. Build. Mater. 2024, 425, 135948. [Google Scholar] [CrossRef] [Scilit]


Disclaimer/Publisher’s Note: The statements, opinions and data contained in all publications are solely those of the individual author(s) and contributor(s) and not of MDPI and/or the editor(s). MDPI and/or the editor(s) disclaim responsibility for any injury to people or property resulting from any ideas, methods, instructions or products referred to in the content. |
© 2026 by the authors. Licensee MDPI, Basel, Switzerland. This article is an open access article distributed under the terms and conditions of the Creative Commons Attribution (CC BY) license.