


Abstract
As China’s high-speed railway construction extends deeper into the karst mountainous regions of the southwest, and as engineering construction faces rigid requirements for green and low-carbon transformation under the dual-carbon goals, green construction cost management for mountainous high-speed railways is subject to distinctive constraints and challenges that differ substantially from those of plain-terrain projects. Existing research on railway green construction costs has focused mainly on plain-terrain scenarios and has emphasized independent evaluations of how individual factors affect costs, while insufficiently revealing the coupled transmission relationships and hierarchical structures of cost-influencing factors in complex mountainous terrain. Consequently, management countermeasures often lack precise correspondence with influencing factors, and research conclusions show limited scenario adaptability and practical guidance value. To address these gaps, this study examines the construction phase of the karst mountainous section of the Guiyang–Nanning High-Speed Railway (G-N HSR). Through three rounds of screening—policy benchmarking, literature review, and expert consultation—a green construction cost influencing factor system comprising 20 indicators across five dimensions (external environment, technology, management, resources, and environmental protection) is established. A coupled model combining the Decision-Making Trial and Evaluation Laboratory (DEMATEL) and Interpretive Structural Modeling (ISM) methods is introduced for systematic analysis. Compared with existing studies, this paper makes three differentiated contributions. First, it is grounded in the complex karst mountainous research scenario and fully incorporates constraints specific to mountainous terrain, such as geological complexity, ecological sensitivity, and logistical limitations. Second, it overcomes the limitations of traditional independent single-factor analysis by revealing the hierarchical transmission logic and cost formation mechanisms among factors from a systemic perspective. Third, it establishes a precise correspondence between influencing factor hierarchies and management strategies, thereby avoiding broadly empirical engineering countermeasures. The results indicate that policies and regulations constitute the most fundamental driving factor, with a centrality degree of 2.006 and a cause degree of 1.745. The constructed five-dimension indicator system demonstrates good structural validity, with a cumulative variance explanation rate of 72.35% in exploratory factor analysis. Finally, the study delineates a three-level cost transmission hierarchy comprising a fundamental driving layer, an intermediate transmission layer, and a surface result layer. On this basis, it proposes hierarchical and targeted management countermeasures that can provide theoretical support and practical reference for refined green construction cost management of high-speed railways in southwestern mountainous regions.
1. Introduction
The focus of China’s high-speed railway construction is gradually shifting deeper into the karst mountainous areas of southwest China. Backbone routes of the New Western Land–Sea Corridor, including the G-N HSR and the Chongqing–Kunming High-Speed Railway (C-K HSR), have successively entered the large-scale construction phase. With the full implementation of the dual-carbon strategy in the transport infrastructure sector, achieving precise and controllable costs under strict ecological protection requirements has become a core issue for mountainous railway projects seeking coordinated development of economic and ecological benefits [1]. At present, China’s policy system for railway green construction has been gradually improved. An institutional framework covering industry evaluation standards, process control rules, and completion acceptance assessment has been established, providing a clear compliance basis and directional guidance for engineering practice [2]. For mountainous railways in southwest China, represented by the karst mountainous section of the G-N HSR, engineering construction conditions differ substantially from those in plain areas. The routes pass through unfavorable geological conditions, resulting in a high risk of water and mud inrush during tunnel construction. Both the allocation of construction machinery and the operation schemes require targeted adjustments, leading to a significant increase in technology implementation costs [3]. The weak regional external transportation network notably increases additional costs, such as secondary transportation of building materials, the layout of temporary facilities, and soil and water conservation [4]. Traditional cost control experience summarized from plain scenarios can hardly be directly adapted to the complex geological and ecological constraints of karst areas. Problems such as green construction cost overruns and insufficient control accuracy are relatively prominent in engineering practice [5].
Existing studies related to green construction cost have been conducted from multiple dimensions, such as management capability, technology application, and policy regulation, forming a relatively rich body of research achievements. In terms of management and control, Zhang [6] addressed the problems of lagging transformation and insufficient functional adaptability of engineering cost management under the green construction mode. Adopting theoretical analysis and framework construction methods and combining the experience of domestic pilot green construction projects, he analyzed the adaptability deficiencies of the traditional cost management mode, clarified its new value positioning in three dimensions (cost control, value creation, and ecological empowerment), and proposed an implementation path for upgrading cost management to full-life-cycle value control. In terms of technology application, Zhang [7] focused on the issues of high construction waste discharge, low resource utilization rate, and high material loss costs at construction sites. Comprehensively applying the experimental research method and the life-cycle cost method, and combining the practice of zero-waste construction site development, he studied the application paths and effects of recycled construction waste products in temporary facilities and subgrade backfilling. The study determined that on-site resource utilization can reduce building material costs by approximately 12%, and proposed an implementation path for on-site classified disposal and cascading utilization of construction waste. Zhao [8] conducted research on the impact of material price fluctuations on construction project costs, clarified the cost transmission path of material price fluctuations, and put forward corresponding risk control measures. Chen [9] targeted the problems of blind investment in construction dust control measures and the mismatch between treatment effects and input costs. Using the on-site monitoring method and the cost–benefit analysis method, he carried out quantitative comparisons of the dust suppression efficiency and unit input cost of six common types of dust control measures, identified the optimal measure combinations for different construction stages, and proposed a cost optimization scheme for precise dust control. Bao [10] further focused on mountainous railway bridge and tunnel engineering, carried out balanced optimization research on key material-saving factors, quantified the material-saving and cost-reducing effects under specific mountainous conditions, and provided targeted references for cost control of mountainous engineering projects. In terms of quantitative cost analysis methods, Yang [11] applied a clustering algorithm to classify and screen the cost-influencing factors of green building construction projects, and constructed a targeted cost classification control framework, which enriched the quantitative analysis tools for green construction cost management. However, this research was carried out for conventional building scenarios, and its factor system and algorithm adaptability to the complex geological and logistical constraints of mountainous railway projects remain to be verified. From the perspective of renewable energy application, Tang [12] discussed the cost control system of green building projects based on the whole life cycle cost theory, and analyzed the cost–benefit matching relationship between renewable energy technology input and energy-saving effect. This research provides a reference for the cost–benefit analysis of energy-saving and emission-reduction measures, but it also takes civil buildings as the research object and lacks targeted discussion on the special cost structure of linear railway projects in mountainous areas. In terms of policy regulation, Liu [13] addressed the problems of unclear development stages and the lack of an evaluation standard system for railway green construction in China. Combining practical data from multiple completed railways in China, he systematically sorted out the development history and practical bottlenecks of railway green construction, constructed a railway green construction evaluation indicator system covering three primary dimensions (environmental protection, resource conservation, and process management), and proposed a phased promotion path for industry-wide green construction. Chen [14] conducted a green construction evaluation of northwestern plateau highways in the dual-carbon context, verified the special constraints and cost characteristics of green construction in ecologically sensitive areas, and provided a reference for research on green construction of mountainous transportation engineering. Jiang [15] focused on the difficulties in organizational coordination of railway projects in complex and dangerous mountainous areas and the poor adaptability of traditional cost control modes. Combining practical construction data from multiple high-speed railways in southwest China, she analyzed the core challenges and cost transmission paths of mountainous railway project management, and proposed innovative strategies for mountainous railway project management from the aspects of organizational structure, technical management, and risk prevention and control, providing practical references for refined cost control of mountainous engineering projects.
Nevertheless, overall, specialized studies on the green construction cost of railways in karst mountainous areas still have three core limitations. First, most existing studies focus on plain building construction or conventional railway projects and fail to fully incorporate unique boundary conditions of mountainous areas, such as karst geology, high ecological sensitivity, and deficiencies in regional supporting facilities, resulting in insufficient practical applicability of the research conclusions [16]. Second, existing research methods mostly emphasize single-factor independent evaluation and insufficiently reveal the coupling transmission relationships and internal action mechanisms among multiple factors, making it difficult to reflect the multi-level transmission logic of cost formation under complex mountainous scenarios [17]. Third, existing control countermeasures are mostly general summaries of experience, lacking precise correspondence with the action levels and influence intensities of the influencing factors, and thus can hardly directly guide the layered and graded management practice of mountainous projects [17,18]. To address the above research gaps, this paper takes the construction phase of the karst mountainous section of the G-N HSR as the research object. Through literature review, field investigation, and expert consultation, the influencing factors of green construction cost adapted to mountainous characteristics are screened and identified, the influencing factor system is constructed, and its validity is verified. The DEMATEL method and ISM are adopted to clarify the interaction relationships and hierarchical transmission structure among various factors and to reveal the internal formation mechanism of green construction cost of mountainous high-speed railways. Finally, hierarchical and targeted cost control countermeasures are proposed based on the hierarchical division and action attributes of the factors. This study addresses the shortcomings of existing research, including insufficient scenario adaptability and the lack of systematic hierarchical analysis and mechanism analysis, and further improves the theoretical system of railway green cost management and control [19]. The research results can provide practical support for the refined management and control of green construction cost of high-speed railways in southwestern karst mountainous areas and can also offer a methodological reference for green construction cost management of similar engineering projects in complex and perilous mountainous areas [17,18].
2. Determination of the Indicator System for Influencing Factors of Green Construction Cost for Mountainous Railways
2.1. Preliminary Determination of Green Construction Indicators
Guided by national and industrial policy requirements for green construction, this study systematically reviewed six normative industry documents, including the Guidelines for Green Construction, the Technical Code for Green Construction Sites of Railway Construction Projects, and the Technical Standard for Construction Waste Disposal, and extracted the regulatory dimensions and core assessment points explicitly stipulated in these policies. In addition, highly cited literature published over the past decade in the fields of high-speed railway green construction cost and mountainous engineering cost management was retrieved from databases such as CNKI, Web of Science, and ScienceDirect, and high-frequency influencing indicators with an occurrence frequency of ≥5 were summarized. On this basis, an initial indicator pool comprising 32 alternative indicators across five dimensions (external environment, technology, management, resources, and environmental protection) was preliminarily established. This approach ensures that the indicator system not only meets policy compliance requirements but also has a solid academic theoretical foundation. The initial indicator pool of 32 alternative indicators is presented in Table 1.
Table 1.
Initial Indicator Pool of Green Construction.
2.2. Preliminary Screening of Green Construction Indicators
In view of the typical engineering characteristics of high-speed railways in karst mountainous areas (complex geological conditions, high ecological sensitivity, restricted transportation and logistics, and scarce land resources), the 32 initial indicators were screened for adaptability to mountainous construction scenarios. Six indicators with low relevance to mountainous high-speed railway construction and excessive universality, such as the perfection of urban municipal supporting facilities, the loss rate of decoration and finishing materials, and the level of construction industrialization, were excluded. Based on field investigation and literature review, three scenario-specific indicators reflecting the cost characteristics of mountainous projects were added: adaptability of construction technology, utilization rate of locally sourced materials, and effective utilization rate of land resources. Indicators with highly overlapping content were merged; for example, the quality of construction personnel was incorporated into green construction education, management, and training, and the scale of temporary land use was incorporated into the effective utilization rate of land resources. After this stage of screening, an indicator system consisting of 24 alternative indicators across five dimensions (external environment, technology, management, resources, and environmental protection) was formed.
2.3. Final Determination of Green Construction Indicators
Five senior experts with more than 15 years of experience in mountainous high-speed railway engineering were invited. They represented four professional roles: chief engineers from construction enterprises, cost engineers from design institutes, engineering management personnel from project owners, and chief site supervision engineers. The Delphi method was used to score the 24 alternative indicators on a 5-point scale in two dimensions: the importance of each indicator and its correlation with green construction cost. According to the screening criteria, indicators with an average score lower than 3.5 were excluded, and indicators with an inter-indicator correlation coefficient higher than 0.85 were merged. As a result, four indicators with relatively low importance were eliminated: impact of construction schedule, material price fluctuation, construction personnel turnover, and standard of temporary facilities. Ultimately, an indicator system consisting of 20 influencing indicators for railway green construction cost was finalized, covering five dimensions: external environment, technology, management, resources, and environmental protection. During the establishment of the indicator system, each indicator was coded with the letter “X”. The first digit after “X” denotes the dimension number, and the second digit denotes the serial number of the indicator within the corresponding dimension. For example, the first indicator in the first dimension, impact of policies and regulations, is coded as “X11”. The final indicators are presented in detail in Table 2a, and the basis for indicator selection is presented in Table 2b.
Table 2.
(a) Influencing Factors of Green Construction Cost for Railways. (b) Basis for indicator selection.
3. Questionnaire Design and Analysis
3.1. Sample Design and Data Collection
This study adopts a two-stage dual-sample design to accommodate different research objectives, namely, indicator system validation and influence mechanism analysis. The two sets of samples differ in source, function, and analytical perspective, and they form a progressive logical relationship from basic variable verification to in-depth mechanism analysis.
The first set of samples consists of 180 valid questionnaires collected from front-line engineering practitioners of mountainous high-speed railway projects, including on-site construction personnel, supervision engineers, and project management staff. This set of samples is mainly used for the reliability test, exploratory factor analysis, and structural validity verification of the initial indicator system. The large sample size ensures the statistical effectiveness of the scale reliability and validity tests and supports confirmation of whether the constructed five-dimension indicator system conforms to practical engineering cognition, thereby laying a reliable variable foundation for subsequent mechanism analysis.
The second set of samples is a panel of 10 experts with rich practical experience in mountainous high-speed railway green construction, including senior engineers from construction units, university researchers in railway engineering, and project cost management specialists with more than 10 years of working experience. This set of samples is used to perform the pairwise influence intensity scoring required by the DEMATEL model and to identify the causal transmission relationships among influencing factors. Different from questionnaire surveys that focus on the importance of individual indicators, the DEMATEL method requires respondents to have a systematic and holistic understanding of factor interaction mechanisms, which relies heavily on professional experience and industry insight. Therefore, a small sample of senior experts is more applicable than a large sample of general practitioners.
In terms of logical progression, the first-stage questionnaire sample is used to complete indicator screening and validity verification, which serves as the premise and foundation of the research. The second-stage expert sample is used to conduct causal mechanism analysis based on the confirmed indicator system, which represents the deepening and extension of the first-stage research. The dual-sample design takes into account both the statistical rigor of scale development and the professional depth of mechanism analysis, and this design constitutes a widely accepted research paradigm in the field of DEMATEL-based influencing factor analysis.
The first set of samples: A five-point scale was adopted for this questionnaire. Based on their professional expertise and work experience, respondents evaluated the rationality of each indicator according to the core evaluation content and assigned scores on a 1–5 scale: 1 = highly unreasonable, 2 = relatively unreasonable, 3 = basically reasonable, 4 = relatively reasonable, and 5 = highly reasonable. The survey results indicate that a total of 206 questionnaires were distributed and 191 were collected, with an overall response rate of 92.7%. After invalid responses were excluded, 180 valid questionnaires were obtained, with a valid response rate of 87.37%. The average score for each factor is presented in Table 3.
Table 3.
Average Score of Each Questionnaire Item.
The data analysis of the questionnaire survey is presented as follows:
In terms of educational attainment, respondents holding a bachelor’s degree accounted for the largest proportion, at 51.67%, exceeding half of the valid sample and forming the core of the educational structure. Respondents with doctoral and master’s degrees accounted for 17.22% and 16.67%, respectively; these two proportions were comparable and together accounted for approximately 34% of the sample. Those with a junior college diploma made up 13.33%, while respondents with other educational backgrounds accounted for only 1.11%. The distribution is shown in Figure 1.
Figure 1.
Educational level.
In terms of professional work experience, the respondents exhibited a distribution pattern with a high proportion in the middle range and low proportions at both ends. Respondents with 6–10 years of work experience accounted for the largest proportion (37.78%), followed by those with 11–20 years of experience (32.78%). These two groups together accounted for more than 70% of the total sample and constituted the core of the survey population. Respondents with 5 years or less of work experience accounted for 17.22%, while senior practitioners with more than 20 years of experience accounted for 12.22%. The distribution is presented in Figure 2.
Figure 2.
Years of professional experience.
In terms of practical project experience, the distribution of respondents was consistent with actual industry conditions. Respondents who had participated in 1–2 projects accounted for the largest proportion, at 46.11%, followed by those with 3–5 projects, at 35.00%; together, these two groups formed the main group of the sample in terms of project experience. Senior practitioners who had participated in more than 5 projects accounted for 12.78%, while those with no relevant project experience accounted for only 6.11%. The distribution is presented in Figure 3.
Figure 3.
Participation experience in mountainous high-speed railway projects.
In terms of job functions, respondents working in engineering and technical management positions accounted for the largest proportion, at 28.33%. Those engaged in engineering cost management and construction production management accounted for 23.33% and 20.00%, respectively. Respondents in engineering supervision positions and in scientific research and university teaching positions made up 11.67% and 10.00%, respectively, while those in other relevant positions accounted for 6.67%. The distribution is presented in Figure 4.
Figure 4.
Job functions.
To verify the reliability of the collected data samples, this study conducted a reliability test using the reliability analysis function in SPSS 26.0. The analysis results are presented below.
3.2. Reliability Test
Reliability refers to the stability and consistency of the measurement results generated by a measurement instrument. In various research fields, reliability analysis is commonly adopted to evaluate the reliability and stability of data outcomes. The higher the reliability indicated by scale analysis, the less external interference the survey data experiences, the smaller the measurement error, and the higher the accuracy of the results. On this basis, Cronbach’s α coefficient was calculated to test the internal consistency reliability of the collected questionnaires. A coefficient greater than 0.7 is generally recognized as indicating good reliability. The collected questionnaire data were analyzed using SPSS 26.0, and the overall Cronbach’s α of the questionnaire was 0.937, indicating that the questionnaire passed the internal consistency test. The reliability test results are presented in Table 4.
Table 4.
Cronbach’s α Coefficient.
3.3. Validity Test
Validity refers to the degree of authenticity and accuracy of survey results. Validity testing is commonly adopted in academic research to examine the veracity and precision of measurement outcomes. The higher the validity indicated by scale analysis, the more authentic and accurate the measurement results are. Since correlations among variables are a prerequisite for conducting factor analysis, Bartlett’s Test of Sphericity and the Kaiser–Meyer–Olkin (KMO) statistic are utilized as verification indicators to determine whether the collected data are suitable for factor analysis. Generally, a KMO value greater than 0.6 indicates that factor analysis is feasible, while a value above 0.7 is regarded as good. The results of the KMO and Bartlett’s tests calculated using SPSS 26.0 are presented in Table 5.
Table 5.
KMO and Bartlett’s Test of Sphericity.
As can be seen from Table 5, the KMO test statistic for the 180 valid questionnaires was 0.935, which was above the threshold of 0.6, indicating that the sample data from this questionnaire survey passed the KMO test. For Bartlett’s Test of Sphericity, the significance value based on the 180 questionnaires was 0.000, indicating that the test was statistically significant at the 0.001 level and confirming that the 180 questionnaire samples passed Bartlett’s Test of Sphericity.
Principal component analysis was employed to extract common factors, and Varimax orthogonal rotation was performed to clarify the dimensional attribution of each indicator. As shown in Table 6, five common factors with eigenvalues greater than 1 were extracted, with a cumulative variance explained of 72.350%, which exceeds the 60% threshold commonly accepted in social science research. All indicators exhibited factor loadings above 0.6 on their respective dimensions and communalities greater than 0.5, satisfying the widely accepted criteria for convergent validity. The derived factor structure is highly consistent with the theoretically constructed five-dimensional indicator system, confirming the sound structural validity of the measurement scale [24].
Table 6.
(a) Total variance explained. (b) Rotated factor loadings and communalities.
4. DEMATEL-ISM Model for Influencing Factors of Railway Green Construction Cost
4.1. Analysis of Cost Influencing Factors Based on DEMATEL
DEMATEL is a systematic analysis method that addresses problems through graph theory and matrix tools. It was originally developed by the Geneva Research Center of the Battelle Memorial Institute to visualize the structure of complex causal relationships via matrices or directed graphs [31]. As a structural modeling approach, it is particularly effective for analyzing the causal interactions among the components of a system. Based on the logical relationships among elements within the system and the direct influence matrix, this method can quantify the degree to which each element influences the other elements and the degree to which each element is influenced by the other elements. Accordingly, the cause degree and centrality degree of each element can be derived, thereby providing a basis for model construction, clarifying the causal relationships among elements, and defining the position of each element within the system. In this study, a direct influence matrix is constructed by analyzing the logical relationships among the influencing factors of railway green construction cost. The degree of influence and the degree of being influenced are calculated for each factor, followed by the derivation of the cause degree and centrality degree for each factor. Finally, the causal relationships among the factors are determined [19].
The specific procedures are as follows:
(1) Determine the influencing factors of railway green construction costs. Let xi ∈ X(i = 1, 2, 3, n), where n represents the total number of cost-influencing factors, and X represents the set of cost-influencing factors.
(2) Determination of the direct cost influence matrix W. The direct influence matrix for cost influencing factors is established. The degree of influence between each pair of factors is measured on a 0–4 scale, as illustrated in Table 7.
Table 7.
Impact Severity Evaluation Scale.
Based on the influence degree evaluation scale, the direct cost influence matrix of the evaluation system is determined via expert experience scoring:
where Wij (i = 1, 2, 3, …, n; j = 1, 2, 3, …, n, i ≠ j) represents the degree of direct influence that the influencing factor xi has on xj.
(3) Determine the normalized direct cost influence matrix:
where , Wmax where it denotes the maximum value of the sum of elements in each row, and k represents the total number of columns of the direct cost influence matrix.
(4) Calculate the comprehensive cost influence matrix T:
First, the difference between the identity matrix and the normalized direct cost influence matrix is computed. Subsequently, the inverse of the resulting difference matrix is derived. Finally, the total influence matrix is obtained by multiplying the normalized direct cost influence matrix by the aforementioned inverse matrix.
where I denotes the identity matrix, and A denotes the normalized direct cost influence matrix.
(5) Calculate the degree of influence Di and the degree of being influenced Ei:
where Di denotes the degree of influence exerted by the i-th influencing factor on other influencing factors, Tij derived from the comprehensive cost influence matrix T.
where Ei denotes the degree of influence exerted by the i-th influencing factor on other influencing factors, Tij derived from the comprehensive cost influence matrix T.
(6) Calculate the centrality Bi Ci and cause-degree:
where Bi denotes the centrality of the i-th influencing factor, Di denotes the degree of influence, and Ei denotes the degree of being influenced.
where Ci denotes the cause degree of the i-th influencing factor, Di denotes the degree of influence, and Ei denotes the degree of being influenced.
Bi = Di + Ei,
Ci = Di − Ei,
Centrality represents the importance of a cost factor within the cost factor system, while cause degree reflects the logical relationships among cost factors and serves as the indicator for judging cause and effect attributes. The smaller the centrality value, the lower the importance of cost influencing factor Xi; the larger the centrality value, the higher the importance of cost influencing factor Xi. When the cause degree is less than 0, cost influencing factor Xi is susceptible to the influence of other factors and is classified as an effect factor. When the cause degree is greater than 0, cost influencing factor Xi is less susceptible to the influence of other factors and is classified as a cause factor.
(7) Calculation of factor Wi weights:
where B denotes the centrality.
A higher W weight indicates greater importance within the factor system, while a lower weight indicates lesser importance within the factor system.
(8) Plot the cost cause-effect diagram (result visualization).
Centrality degree indicates the importance of each factor in the system, whereas cause degree reflects the intensity of influence exerted by each factor on other factors. A quadrant diagram can be constructed based on these two indicators. The horizontal axis (centrality degree) is divided at the average centrality degree, and the vertical axis (cause degree) is divided at 0, thereby categorizing all influencing factors into four quadrants.
The four quadrants are interpreted as follows:
The first quadrant: high centrality and high cause degree. Factors in this quadrant are of high importance and are classified as cause factors.
The second quadrant: low centrality and high cause degree. Factors in this quadrant are of low importance and are classified as cause factors.
The third quadrant: low centrality and low cause degree. Factors in this quadrant are of low importance and are classified as effect factors.
The fourth quadrant: high centrality and low cause degree. Factors in this quadrant are of high importance and are classified as effect factors.
4.2. DEMATEL-ISM System Hierarchy Structure
ISM is a qualitative systems engineering analysis method proposed by the American scholar Warfield in 1973 and specifically designed to address complex systems characterized by multiple interwoven factors and ambiguous interrelationships [31]. By computing the total influence matrix, this method performs hierarchical partitioning of evaluation factors characterized by numerous variables, complex interconnections, and unclear structural features. On the basis of the comprehensive cost influence matrix B calculated using Equation (3), the ISM approach is adopted to determine the hierarchical structure of the influencing factors of railway green construction cost [20].
The specific steps are as follows:
(1) Overall cost influence matrix.
The overall cost influence matrix is calculated from the comprehensive cost influence matrix T, with the formula expressed as:
where T denotes the comprehensive cost impact matrix, and I denotes the identity matrix.
M = T + I,
(2) Determine the reachability matrix K Based on the overall cost influence matrix, the intercept term is introduced to determine the elements kij corresponding to cost influencing factors in the reachability matrix K.
where mij denotes the element of the overall cost influence matrix M, λ denotes the intercept term. λ = + σ; denotes the mean value of the comprehensive cost influence matrix T, σ denotes the overall standard deviation.
(3) The reachability set Ri and antecedent set are Fi defined as:
where xj represents the cost influencing factors; X denotes the set of cost influencing factors; kij denotes the cost influencing factor in the reachability matrix K.
where xj represents the cost influencing factors; X denotes the set of cost influencing factors; kij denotes the cost influencing factor in the reachability matrix K.
Ri = {xj∣xj ∈ X,kij ≠ 0},
Fi = {xj∣xj ∈ X,kji ≠ 0},
(4) Determine the hierarchical structure of the reachability matrix K, with the formula expressed as:
where Ri denotes the reachability set, and Fi denotes the antecedent set.
Ri = Ri ∩ Fi.
(5) Draw the hierarchical structure diagram of the factors influencing the green construction cost of railways.
4.3. Necessity and Advantages of the DEMATEL–ISM Hybrid Model
Green construction cost factors of high-speed railway projects in karst mountainous areas are not independent. They feature mutual coupling, causal feedback, and hierarchical transmission. A single statistical method can either describe correlation strength or classify factor levels, but cannot simultaneously identify causal relationships and clarify the internal hierarchical structure.
The DEMATEL method is used to quantify the direct and indirect influence intensity among factors, distinguish cause factors from effect factors, and identify the key driving factors. On this basis, the ISM method constructs a multi-level hierarchical structure from the reachability matrix, separating root factors, intermediate transfer factors, and surface direct factors.
The hybrid model combines their strengths: DEMATEL provides causal evidence for ISM layering, while ISM visualizes the complex causal network as a clear hierarchical path. This helps decision-makers distinguish which factors are fundamental leverage points for green cost control, rather than merely identifying correlative factors. A concise summary of model functions is shown in Table 8.
Table 8.
Core functions and outputs of the DEMATEL–ISM hybrid model.
5. Case Analysis
5.1. Project Overview
The G-N HSR is a core component of China’s “Eight Vertical and Eight Horizontal” high-speed railway network. It runs northward from Longli North Station in Guizhou to Nanning East Station in Guangxi. The main line is 481.118 km long and has a designed operating speed of 350 km/h. The project involved a total investment of approximately CNY 75.7 billion and was fully opened to traffic in 2023. The route crosses the transitional zone from the Yunnan–Guizhou Plateau to the Guangxi Hills, where karst landforms are extensively developed throughout the area, resulting in complex geological structures and high construction risks. The bridge-tunnel ratio of the entire alignment reaches 90.93%, with 184 bridges and 110 tunnels, making the project one of the most challenging mountainous high-speed railway projects in China in terms of construction difficulty. In addition, the project is subject to extremely stringent ecological constraints. Along the alignment, the railway passes through two World Natural Heritage Sites, ten nature reserves, and multiple drinking water source protection zones, with high ecological sensitivity and strict environmental control standards, as shown in Figure 5 and Figure 6.
Figure 5.
Guiyang–Nanning high-speed railway.
Figure 6.
On-site construction photographs of the Guiyang–Nanning high-speed railway.
5.2. Model Application
5.2.1. DEMATEL Calculation
Taking the G-N HSR project as the case study, this study prioritized experts with front-line construction practice experience during the expert selection process, so as to reduce the potential interference of individual differences in expert experience with the evaluation results and to align with the research focus on green construction cost control during the construction phase. A total of ten experts with long-term involvement in railway engineering were selected to form the evaluation panel, all of whom had practical on-site experience in the construction phase of mountainous high-speed railway projects. Among them, six experts (60%) were from construction enterprises and served in roles including project chief engineers, engineering cost supervisors, and green construction technical directors, and covered core work areas such as construction technology management, cost accounting, and implementation of green construction measures. The remaining four experts included a senior engineering management engineer from the project owner, a cost engineer from a railway design institute, a chief site supervision engineer, and a university researcher specializing in engineering management. They complemented the panel in terms of construction governance, design coordination, process supervision, and theoretical methodology, ensuring the systematic and rigorous nature of the evaluation. In terms of educational background, two panel members held doctoral degrees, three held master’s degrees, and five held bachelor’s degrees. In terms of professional experience, the panel was dominated by senior practitioners: five had 10–15 years of work experience, three had 15–20 years, and two had more than 20 years. The average work experience of the experts in construction positions exceeded 12 years. Before the formal evaluation, the connotation of each indicator, the scoring rules, and the engineering background of the G-N HSR were uniformly explained to all participants to ensure that all the experts conducted independent assessments based on the same standard.
In this study, ten industry experts with experience in mountainous high-speed railway engineering were invited to independently evaluate the pairwise influence intensity of the 20 influencing factors using a 0–4 scale. Specifically, when scoring the direct influence matrix, the experts were explicitly required to evaluate the influence intensity between two factors based on the degree to which a change in one factor would ultimately cause a change in green construction cost through the other factor. After the scoring data were collected, a preliminary screening was first conducted to verify data completeness and logical consistency. Kendall’s coefficient of concordance was adopted to test the overall consensus of expert opinions. For indicator pairs with high disagreement, two rounds of anonymous feedback and revision were conducted using the Delphi method. The raw scoring data provided by the ten experts were imported into SPSS for consistency analysis. The calculated Kendall’s coefficient of concordance was W = 0.712, with statistical significance at p < 0.001. According to the widely accepted criteria for Delphi method validation, a W value ≥ 0.7 represents high consistency of expert opinions, 0.5 ≤ W < 0.7 represents moderate consistency, and W < 0.5 reflects poor consistency. In this study, W = 0.712 (greater than 0.7) and p < 0.001; these results demonstrate that after two rounds of anonymous Delphi feedback, the experts’ ratings on the pairwise influence intensities for the DEMATEL direct influence matrix exhibit high statistical consistency. The expert opinions had reached satisfactory convergence, ensuring the reliability of the input data for the subsequent DEMATEL calculation. Once the expert opinions had converged, the arithmetic mean of the scores assigned by the ten experts was calculated for each factor pair, yielding a continuous average influence intensity matrix. Finally, all elements of the matrix were rounded to the nearest integer to obtain the direct influence matrix W, which contains integer values ranging from 0 to 4. Subsequently, the normalized direct influence matrix was derived using Equation (2), and the total influence matrix T was obtained using Equation (3). The degree of influence, degree of being influenced, centrality degree, and cause degree were calculated using Equations (4)–(7), respectively. The results of the DEMATEL analysis are presented in Table 9.
Table 9.
DEMATEL Analysis Results.
Based on the centrality degree and cause degree results presented in Table 9, a cause-effect analysis diagram of the factors influencing the green construction cost of the G-N HSR is drawn, as shown in Figure 7.
Figure 7.
Cause-and-effect analysis diagram.
As shown in Figure 7, the influencing factors X11, X12, X21, X22, X23, X25, X31, X32, X33, and X34 have positive cause degree values and are therefore classified as cause factors. As indirect drivers of cost escalation, these cause factors warrant heightened attention during project implementation. Interrupting their transmission paths among different influencing factors can help achieve the ultimate goal of cost control. In contrast, factors X13, X24, X41, X42, X43, X44, X51, X52, X53, and X54 have negative cause degree values and are categorized as effect factors. Located at the terminal end of the transmission chain within the overall influence system, these factors exhibit weak endogenous driving forces and strong passivity, and are susceptible to multiple effects and superimposed transmission from cause factors and other components within the system. For cost control targeting effect factors, on the premise of regulating cause factors at the source, particular attention should be paid to the interactive interference and chain transmission effects among the factors. This can prevent the amplification of cost fluctuations caused by the cross-coupling of multiple impacts and further mitigate the risk of cost runaway.
5.2.2. Adaptability of Threshold Selection in ISM
This threshold standard is a widely accepted convention in DEMATEL-ISM research in the fields of architecture and civil engineering and has been universally adopted in relevant studies published in journals such as Construction Economy, Journal of Civil Engineering and Management, and other SCI journals in the same field. The core objective of this study is to reveal the hierarchical conduction mechanism of green construction cost of mountainous high-speed railways and to propose layered and targeted control countermeasures. This requires the resulting hierarchical structure to possess clear distinguishability while fully retaining the core conduction chain. If λ = , the detailed differences among conduction paths cannot be revealed. If λ = + 0.5σ, weak correlations are gradually filtered out, intermediate layers begin to differentiate, and the core conduction path initially emerges. If λ = + 1.5σ, sub-critical conduction paths are cut off, and some intermediate layers are merged, resulting in an oversimplified structure. The hierarchical structure obtained at λ = + σ achieves the best distinguishability [32]. It not only fully preserves the full-chain conduction relationship from the root layer to the surface layer but also clearly distinguishes the functional differences among the deep, middle, and shallow layers, which is highly consistent with the research objective of this study: “layered mechanism analysis and layered control countermeasures” [31].
5.2.3. Reachability Matrix Calculation and Transitive Closure Correction in ISM
ISM requires that the matrix used for hierarchical partitioning be a reachability matrix satisfying the transitivity axiom: if factor i can reach factor j and factor j can reach factor k, then factor i must be able to reach factor k through an indirect path. However, the matrix directly obtained by threshold truncation retains only direct influence relationships with intensity above the threshold (the direct adjacency matrix) and does not incorporate indirect conduction paths, thus failing to satisfy the transitivity axiom. Direct hierarchical partitioning based on this matrix would result in an excessively fine-grained hierarchy and logical overlap. Therefore, a transitive closure operation must be performed on the direct adjacency matrix to supplement all indirect reachable relationships. In this study, the Warshall algorithm is adopted to calculate the transitive closure [20]. Based on the principle of dynamic programming, the algorithm successively takes each influencing factor as an intermediate node and traverses and supplements the indirect reachable relationships according to the logic of “starting point → intermediate node → end point”. Its formula is as follows:
where R(i,j) denotes an element of the reachability matrix and k represents the current intermediate node. After 20 sequential iterations across the 20 factors, the final reachability matrix satisfying the transitivity axiom is derived.
R(i,j) = R(i,j)∨(R(i,k)∧R(k,j))
5.2.4. ISM Calculation
The overall cost influence matrix is derived using Equation (8), and the threshold is determined on the basis of the comprehensive cost influence matrix T. The calculation is performed in MATLAB R2022b to obtain the results. = 0.04327, σ = 0.02981, and λ = + σ = 0.07308. The reachability matrix is obtained using Equation (9), and the final reachability matrix R is derived through transitive closure correction.
Through the transitive closure operation, the number of system association relationships increased from 88 in the initial direct adjacency matrix (i.e., the overall cost influence matrix without transitive closure correction) to 113, with 25 indirect association relationships newly added. These newly added relationships all originated from pre-existing indirect conduction paths, as presented in Table 10 (only representative newly added relationships in each iteration round are listed).
Table 10.
Newly Added Association Items from Transitive Closure Operation.
The reachability set R and the predecessor set F are calculated according to Equations (10) and (11), and the results are presented in Table 11.
Table 11.
Reachable set R and predecessor set F.
The cost influencing factors were categorized into six levels, with the following results:
L1 = {X12, X13, X41, X42, X43, X44, X51, X52, X53, X54}; L2 = {X24, X34}; L3 = {X33}; L4 = {X23, X25, X32}; L5 = {X21, X22, X31}; L6 = {X11}.
Compared with hierarchical partitioning without transitive closure correction, the hierarchical structure obtained after transitive closure correction is adjusted from seven layers to six layers. The core adjustment is that X21, X22, and X31 form a strongly connected component after the transitive closure operation and are mutually reachable in pairs. They are merged into the same deep conduction layer (L5), whereas they were previously split into different hierarchical levels. The root layer X11 (impact of policies and regulations) remains consistently located at the lowest level, indicating that policies and regulations are the fundamental driver of the entire green construction cost system, and the core conclusions remain robust.
Based on the hierarchical partitioning results and the interrelationships among the factors, a multi-level hierarchical structure diagram of green construction cost factors for the G-N HSR is constructed using the reachability matrix R, as shown in Figure 8. This diagram illustrates the tiered distribution of cost factors and the transmission paths among different layers, thereby providing an intuitive overview of the green construction cost influence system.
Figure 8.
Multi-level hierarchical structure model of cost influencing factors.
From the multi-level hierarchical structure model in Figure 8, the logical relationships among the influencing factors can be derived. The influencing factors of green construction cost of the G-N HSR are divided into six hierarchical levels. Specifically, X11 is located at the bottom level (Level L6) and belongs to the root influencing factors. X21, X22, and X31 are at Level L5; all of them are influenced by policies and regulations and are classified as deep influencing factors. X23, X25, and X32 are at Level L4 and are classified as middle influencing factors. X33 is at Level L3 and belongs to the mid-shallow influencing factors. Factors at these two levels serve as important guarantees for cost control during railway green construction. X24 and X34 are at Level L2 and are classified as shallow influencing factors. X12, X13, X41, X42, X43, X44, X51, X52, X53, and X54 are at the top level (Level L1) and belong to the surface influencing factors. They are direct factors affecting cost and are significantly influenced by other factors.
The outputs of DEMATEL and ISM describe the attributes of factors from two complementary dimensions rather than constituting a one-to-one correspondence. The cause degree calculated by DEMATEL reflects the global causal attribute of a factor in the entire system: a positive value means that the factor is a net driver of cost changes, while a negative value means that it is a net resultant factor. The hierarchy determined by ISM reflects the position of a factor in the conduction path: it describes where a factor lies in the upstream–downstream transmission chain of cost influence based on reachability. X12 has a positive cause degree and is indeed a driving factor, but it is a proximal direct driver in the conduction chain. Its influence acts directly on surface-level execution factors without further downstream conduction links, so its reachable set contains only itself, and it is located at the surface level of the ISM hierarchy. Its driving effect is exerted directly on the on-site execution end rather than being transmitted through multiple intermediate factors. X33 and X34 are both cause factors and are classified as execution-layer driving factors. They are located at a shallower position in the conduction chain and directly act on surface result factors such as resource consumption and waste output. Therefore, they are at a higher hierarchical level, but they are still active factors driving cost changes rather than passive resultant factors.
5.2.5. Threshold Sensitivity Analysis
The threshold λ is an artificially specified parameter. To verify the robustness of the hierarchical partitioning results and to eliminate the interference of artificial parameter settings with the core conclusions [31], four sets of gradient thresholds were established in this study based on the same total influence matrix T. Transitive closure was calculated, and hierarchical partitioning was performed for each threshold. The results are presented in Table 12.
Table 12.
Sensitivity Analysis of Hierarchical Structure Under Different Threshold Settings.
The sensitivity analysis results demonstrate the following. First, the core conclusions are highly robust. Regardless of threshold adjustments, X11 (impact of policies and regulations) consistently lies in the bottom root driving layer, indicating that the finding that policies and regulations are the core driving factor of green construction cost of mountainous high-speed railways is not affected by threshold settings. Second, the overall logical framework remains stable. The three-level hierarchical logic of the root driving layer–intermediate conduction layer–surface result layer is maintained under all threshold conditions, and the overall conduction mechanism of the system remains stable. Third, the intermediate layers show regular changes. The number of hierarchical levels first increases and then decreases as the threshold increases. The threshold λ = + σ selected in this study falls exactly within the optimal interval for hierarchical differentiation, thereby fully revealing inter-layer differences while ensuring the integrity of conduction paths.
In summary, through transitive closure correction, reachability matrix calculation, and hierarchical partitioning, the influencing factors of green construction cost of the G-N HSR form a three-level hierarchical conduction system comprising the root driving layer, the intermediate conduction layer, and the surface result layer. The root-layer factor X11 corresponds to the impact of policies and regulations; the deep conduction layer, consisting of X21, X22, and X31, serves as the collaborative driving hub of technology and management; and the surface result layer is the direct manifestation of the resource and environmental protection indicators. This system provides a systematic hierarchical basis for the subsequent proposal of layered and targeted control countermeasures.
5.2.6. Analysis of Hierarchical Transmission Mechanism
Based on the ISM hierarchical partition results and DEMATEL causal attributes, the influencing factors of green construction cost of mountainous high-speed railway projects can be divided into three functional layers: the root driving layer, the intermediate transmission layer, and the surface result layer. The effect transmission follows a top-down progressive logic, and two core action paths are summarized as follows:
The first path is the main transmission chain of “policy and regulation → management system → technology application → cost performance”. From the perspective of institutional pressure theory, policies and regulations, as the core of the root driving layer, exert mandatory constraints on construction enterprises through compliance requirements and assessment mechanisms. This institutional pressure is first transmitted to the management dimension: it forces enterprises to improve the green construction management system (X31) and carry out special training for on-site personnel (X32), transforming macro policy requirements into standardized internal management processes. On this basis, the management system further performs the functions of resource allocation and process control and guides the optimization of on-site technology selection through performance appraisal and scheme review, including the application of information technology (X21), green construction technology innovation (X22), and trenchless construction technology (X23). The implementation of green technologies directly reduces resource consumption and environmental pollution at the surface layer and ultimately acts on the total green construction cost. This path is the most important transmission channel for policy effects, and management acts as the core transmission hub connecting top-level requirements and front-line practice.
The second path is the direct transmission chain of “policy and regulation → technology selection → cost performance”. In view of the special geological conditions of karst mountainous areas, industry authorities often issue mandatory technical specifications and promoted technology catalogs for typical engineering problems such as spoil disposal and ecological protection. Such policy requirements directly define the optional scope of construction technology and can be implemented in engineering practice without going through the internal management link of enterprises. For example, the mandatory requirement for spoil resource utilization directly promotes the application of on-site aggregate processing technology, thereby quickly reflecting the cost-saving effect. This direct path serves as a beneficial supplement to the main transmission chain and reflects the characteristic of strong policy guidance in railway engineering construction.
Overall, policies and regulations are the fundamental driving force of the entire system, management is the intermediate hub of effect transmission, and technology is the direct carrier of effect implementation. Together, the three form a top-down progressive causal relationship and jointly explain the formation mechanism of green construction cost of mountainous high-speed railway projects.
6. Layered Targeted Control Countermeasures for Green Construction Cost of Mountainous High-Speed Railways Based on Hierarchical Conduction Mechanism
6.1. Root Driving Layer: Control Countermeasures from the Policy and Regulation Dimension
Policies and regulations are the root factors influencing engineering construction costs. In recent years, guided by China’s dual-carbon goals and the development philosophy of green railway construction [24], the national government has successively issued a series of policies and regulations on green construction and cost management, including the Technical Code for Green Construction Sites of Railway Construction Projects (Q/CR 9264-2024) [21] and the Acceptance Standard for Construction Quality of High-Speed Railway Engineering (TB 10751-2018 to TB 10758-2018) [28]. These documents have improved the institutional framework covering green construction, cost control, and material price adjustment for high-speed railways and have provided a policy foundation for cost compliance management in the G-N HSR project. Given that ecological control standards in the southwestern mountainous regions are stricter than those in plain areas, a two-level compliance list featuring “national industry standards plus local special requirements” was established. In addition to industry standards such as the Technical Code for Green Construction Sites of Railway Construction Projects (Q/CR 9264-2024) [21], 12 local special requirements from Guizhou Province and the Guangxi Zhuang Autonomous Region were integrated, covering soil and water conservation for karst landforms, nature reserve management, and drinking water source protection. All compliance clauses were incorporated as preconditions for cost estimation.
The practice of the G-N HSR demonstrates that pre-compliance review can reduce post-construction engineering changes for ecological rectification by approximately 32%, which corresponds to direct cost savings of around CNY 120 million [23]. This control effect is significantly superior to that of the traditional mode of “rectification during construction”.
6.2. Intermediate Conduction Layer: Conduction Path Blocking Countermeasures Through Technology-Management Collaboration
6.2.1. Optimization of Technology Conduction Chain
In response to the constraints imposed by complex geology and high ecological sensitivity in karst mountainous areas, green construction technologies are promoted to upgrade from a “plain-universal type” to a “mountain-adapted type”, thereby addressing the issue of cost amplification in the technology conduction process. Relying on building information modeling and geographic information system (BIM + GIS) technology, a full-cycle digital management platform for mountainous high-speed railways was established. Three-dimensional modeling and construction simulation were conducted for key work sites such as tunnels and bridges to predict unfavorable geological conditions, including karst formations and faults, in advance and to optimize construction schemes so as to avoid design changes and rework losses. After this platform was applied to the G-N HSR, the tunnel construction rework rate decreased from 8.2% in traditional mountainous projects to 3.7%, reducing material waste and rework costs by approximately CNY 48 million [23]. (Cost savings from rework reduction = (baseline rework rate of 8.2% − actual rework rate of 3.7%) × total contract construction-and-installation cost for all tunnels along the full line). In contrast to digital applications for plain-terrain engineering, which mainly focus on schedule control, digital management can deliver higher value-added benefits for cost control under complex geological conditions [27].
Classified disposal and resource recycling are implemented throughout the construction phase. A total of 6.1044 million m3 of tunnel spoil is processed and utilized as sand and gravel aggregates, and 5.1951 million m3 is allocated for comprehensive cross-project utilization [23]. These materials directly replace purchased subgrade fillers and concrete aggregates, simultaneously reducing waste transportation and disposal fees as well as raw material procurement costs. The total volume of recovered recyclable scrap steel reaches approximately 63,700 tons, covering processing offcuts from bridge steel structures, scraps from steel arches and steel grids for tunnel primary support, and dismantled materials from temporary steel trestles and steel formwork [23]. Of this total, 18,200 tons are directly reused for the fabrication of temporary protection facilities and subgrade auxiliary steel structures after on-site straightening and rust removal treatment. The remaining 45,500 tons are delivered to qualified renewable resource enterprises for targeted recycling and smelting, thereby directly substituting for purchased steel and concurrently reducing new material procurement costs and waste removal and disposal expenses [23].
In view of the high risk of water and mud inrush in karst tunnels, a combined construction method integrating smooth blasting and advanced geological prediction is promoted. Real-time acquisition of rock stratum data using 3D scanners is used to optimize the blasthole layout, thereby reducing overbreak and underbreak volumes as well as mucking costs. For bridge construction in wetland reserve sections, precast segmental beam technology is adopted, reducing the number of bridge piers by 34 and saving more than 2200 square meters of temporary land occupation [33]. Meanwhile, more than 30 sets of intelligent equipment, such as intelligent tunnel secondary lining pouring trolleys, have been developed, and more than 50 patented construction methods have been established. The one-time forming qualification rate has increased to 96.3%, thereby reducing subsequent rework costs by approximately CNY 21 million [25].
6.2.2. Optimization of Management Conduction Chain
A closed-loop management system comprising “target decomposition–process control–assessment feedback” was established. The green construction cost target was decomposed into 20 indicators across five dimensions and incorporated into the management responsibilities of each position across all construction sections and work sites. In accordance with the requirements of the Guidelines for Green Construction (Jianzhi [2007] No. 223) [22] and in combination with the characteristics of mountainous engineering projects, 11 additional special management systems were formulated, covering spoil resource recycling management, ecological protection patrol inspection, and other related items.
To address insufficient awareness of green construction among construction personnel in mountainous engineering projects, a three-level training system covering the management, technical, and operational levels was established. The management level focused on policy interpretation and cost control methods; the technical level emphasized the application of mountain-adapted green construction methods; and the operational level concentrated on on-site environmental operation specifications. The project delivered a total of 42 specialized training sessions, with more than 1860 participant attendances. As a result, the awareness rate of green construction specifications among front-line operators increased from 62% to 94%, and environmental rectification costs caused by non-standard operations decreased by approximately 45% [23].
Environmental control for green construction was deeply integrated with safety and quality management, and a dual control mechanism comprising “daily patrol + special inspection” was established. Priority was given to controlling pollution sources such as wastewater, tunnel spoil, and dust during karst tunnel construction, while quality management was simultaneously strengthened to reduce additional environmental costs caused by rework. Through the collaborative control implemented in the project, the rectification rate of environmental hazards reached 100%, and the one-time construction quality acceptance rate stood at 98.7%. Cost overruns amounting to approximately CNY 19 million caused by the superimposition of quality and environmental issues were avoided [21]. (Potential avoidable overrun cost = ∑ (secondary environmental costs induced by quality defects + quality rework costs caused by environmental non-compliance + potential costs arising from superimposed risks, including schedule delays, rectification work, penalties, and claims due to construction-site disputes)).
6.3. Surface Result Layer: Precise Implementation Countermeasures from the Resource and Environmental Dimension
6.3.1. Countermeasures for Improving Resource Utilization Efficiency
In response to the high costs of water intake and transportation in mountainous areas, a system of source water conservation, process control, and recycling and reuse was established. Water-saving devices, such as water-saving faucets and flow-limiting valves, were fully deployed across construction sites, achieving a utilization rate of 100%. A system for rainwater collection and construction wastewater treatment and reuse was implemented, achieving a water reuse rate of 68%. The project saved a total of 148,000 m3 of construction water, generating comprehensive cost savings of approximately CNY 4.98 million in water fees and transportation expenses. The loss rate of construction water decreased from 27% in conventional mountainous engineering projects to 11.8% [33], outperforming the 20% control target specified in the Guidelines for Green Construction (Jianzhi [2007] No. 223) [22].
In response to the scarcity of cultivated land resources in karst mountainous areas, the layout of temporary facilities was optimized. The construction of temporary facilities, including construction access roads and mixing stations, reduced temporary land occupation by approximately 320 mu. Meanwhile, the siting of spoil dumps was optimized, and mountain depressions were used for spoil placement to reduce cultivated land occupancy. The effective utilization rate of land resources in the project was approximately 22% higher than that in traditional mountainous engineering projects, generating savings of approximately CNY 36 million in costs associated with temporary land occupation [23]. The cost savings were calculated as reduced land occupation (mu) × [land acquisition compensation + crop compensation + land reclamation treatment fee].
In terms of the application of energy-saving equipment and the recycling of construction equipment, the project gave priority to energy-saving construction machinery and new-energy equipment while phasing out outdated high-energy-consumption equipment, achieving a utilization rate of energy-saving equipment exceeding 85%. Meanwhile, equipment scheduling was optimized to improve equipment utilization and reduce no-load energy consumption, reducing the project’s comprehensive construction energy consumption by approximately 12.7% compared with traditional mountainous engineering projects and generating energy cost savings of around CNY 8.9 million [23]. (Energy-saving cost savings = reduced energy consumption × energy price during the construction period − incremental premium for energy-saving equipment). In addition, a full-life-cycle equipment turnover mechanism was established for the entire project. A total of 39 sets of decommissioned large-scale engineering equipment from various construction sections (including earthwork construction machinery, tunnel lining trolleys, and environmental dust removal equipment) and more than 280 small electric construction tools were recovered [23]. After maintenance, refurbishment, and performance calibration, more than 60% of the equipment was redeployed and reused across construction sections and projects. Equipment that could not be reused was disposed of strictly in accordance with state-owned asset disposal procedures, effectively reducing investment in new equipment procurement and losses from idle assets. This turnover management mode aligned with the common industry practice of refined management of large-scale equipment assets in railway engineering [34].
6.3.2. Countermeasures for Environmental Pollution Control
Machinery meeting China Stage VI emission standards and new-energy equipment were prioritized to reduce exhaust emissions at the source. Noise barriers were installed along sensitive sections, and the schedule of high-noise operations was optimized to minimize disturbance to residents from nighttime construction. The noise compliance rate at the project’s construction site boundary reached 97%, and the exhaust emission compliance rate was 100%. No major environmental complaints occurred, thus avoiding construction schedule delays and compensation costs caused by resident disturbances [23].
During the construction prevention and control stage, wet operation methods were fully implemented for earthwork operations and material storage yards. Yard sprinkler systems maintained the surface moisture content of materials at 6–8%, and the sprinkling intensity was controlled at 2.0–3.0 L/m2 per application. Construction haul roads were regularly cleaned and sprinkled; sand and gravel stockpiles were fully covered with dust-proof nets; and vehicle washing facilities were installed at exit points, effectively suppressing secondary dust diffusion. In the assessment and optimization stage, a regular monitoring mechanism for construction dust was established to achieve quantitative control of dust emissions. The dust emission reduction coefficient of the project reached 0.98, generating cumulative savings of approximately CNY 123,900 in environmental protection tax on construction dust [23]. (Cumulative tax savings for construction-dust pollution = theoretical tax payable under the pollution-equivalent calculation method of the Environmental Protection Tax Law − actual tax paid).
In view of the project’s characteristics of a high bridge-tunnel ratio and large spoil output, and in accordance with the guidance in the Opinions on Further Strengthening Urban Construction Waste Management, which states that “engineering spoil shall be given priority for use in earthwork balance, site leveling, and road construction”, the project integrated whole-process construction waste management into the green construction cost control system and established a management chain of “source reduction–process utilization–terminal regulation”. During the design stage, the earthwork balance allocation along the entire route and the layout optimization of spoil dumps were further refined. The total spoil volume was reduced from 26.0987 million m3 to 13.2436 million m3 [23], thereby reducing construction waste generation and land occupation for spoil disposal at the source.
6.3.3. Countermeasures for Social Relations Coordination
A regular communication mechanism with communities along the route was established. Construction plans and environmental protection measures were publicly announced in advance, and local labor was given priority for employment in the project to support local economic development. The project employed more than 2300 local workers in total and carried out 17 community public welfare activities. The satisfaction rate of residents along the route reached 92%, which effectively reduced social risks such as construction obstruction and avoided cost losses caused by construction.
Green construction was integrated with local ecological protection and rural revitalization, and supporting projects such as ecological corridors and convenient rural access roads were developed to achieve a mutually beneficial outcome between engineering construction and local development. The ecological restoration area along the project route reached 1.28 million square meters, and 36 km of convenient rural access roads were completed simultaneously. This enhanced the socioeconomic benefits of the project and also created a favorable external environment for engineering construction [23]. The plant allocation scheme and cost–benefit law adopted in this project are consistent with the research conclusions on mountainous high-speed railway ecological corridor construction in existing studies [35].
7. Conclusions
Taking the karst mountainous section of the G-N HSR as the research object, this paper establishes an influencing factor system for green construction cost adapted to mountainous characteristics. It introduces a coupled DEMATEL-ISM model to analyze the coupling interactions and hierarchical conduction structure among the factors, reveals the formation mechanism of green construction cost of mountainous high-speed railways, and proposes layered and targeted control countermeasures on this basis.
This study establishes an influencing factor system for the green construction cost of mountainous high-speed railways. The system includes 20 indicators across five dimensions: external environment, technology, management, resources, and environmental protection. It was optimized through three rounds of policy benchmarking, literature review, and expert screening and was verified through questionnaire surveys and exploratory factor analysis. The cumulative variance explanation rate reached 72.35%, indicating good reliability and construct validity; the system can thus effectively reflect the influencing characteristics of green construction cost of high-speed railways in karst mountainous areas. On this basis, the DEMATEL method is adopted to identify the causal attributes and importance levels among the factors. The 20 influencing factors consist of 10 cause factors and 10 effect factors. Among them, the impact of policies and regulations ranks first in both centrality degree and cause degree, serving as the core root factor driving the entire cost system. Innovation in green construction technology and the development level of the green construction management system have high centrality, acting as key hubs in the cost conduction process. Furthermore, the ISM model is applied to reveal the hierarchical conduction logic among the factors. After transitive closure correction, the 20 factors are divided into six hierarchical levels, presenting an overall three-level conduction structure of “root driving layer–intermediate conduction layer–surface result layer”. The impact of policies and regulations lies in the bottom root layer; information technology application, innovation in green construction technology, and the development level of the green construction management system constitute the deep conduction hubs; and resource and environmental protection indicators are located in the surface layer and directly act on green construction cost. Finally, layered and targeted control countermeasures are proposed based on the hierarchical conduction mechanism. Differentiated strategies are put forward for the root driving layer, intermediate conduction layer, and surface result layer, namely, policy compliance control, technology-management collaborative optimization, and precise implementation of resource and environmental measures. A control system precisely matched to the action levels of the factors is formed, providing a systematic reference for green construction cost control of mountainous high-speed railways.
Although this study has preliminarily revealed the influencing mechanism of green construction cost of high-speed railways in karst mountainous areas, it still has several limitations due to constraints imposed by the research scenario, methodological framework, and data foundation. First, this study is a single-case study based solely on the karst mountainous section of the G-N HSR. The geological constraints, ecological characteristics, and supporting conditions considered in this study are typical features of the karst landform of the Yunnan–Guizhou Plateau. However, the southwestern mountainous areas of China also encompass various landform types, such as the alpine valleys of the Hengduan Mountains, the frozen soil of the Western Sichuan Plateau, and the Qinba Mountainous Area. Engineering geological conditions, ecological control standards, and logistics and transportation costs differ significantly among these landform regions; therefore, the applicability of the research conclusions to other types of mountainous railway projects remains to be verified. Second, the samples used in the questionnaire survey and expert scoring were mainly from construction and building units, while the proportion of samples from design, ecological supervision, and operation and maintenance units was relatively low. This distribution of respondents’ positions may introduce a certain degree of industry bias and may cause judgments of factor importance to lean toward the construction implementation level, with insufficient consideration of cost-influencing factors in the preliminary design stage and post-operation maintenance stage. Although the 180 valid samples meet the basic requirements for statistical analysis, for the analysis of complex systems with multi-factor coupling, the robustness of the model under a larger sample size still has room for improvement. Third, the research methods themselves have limitations regarding subjectivity and explanatory power. The basic data of the DEMATEL method are derived from expert experience-based scoring. Although two rounds of feedback correction using the Delphi method were adopted and the consistency of expert opinions was tested using Kendall’s coefficient of concordance, the influence of differences in expert experience and cognitive bias on the accuracy of the direct influence matrix cannot be completely eliminated, and the objectivity of the scoring results still has room for improvement. For threshold selection in the ISM model, the “mean + standard deviation” criterion commonly used in the field of construction engineering was adopted. This paper also conducted a sensitivity analysis using four sets of gradient thresholds and verified the robustness of the core conclusions. However, threshold determination remains essentially a semi-empirical and semi-statistical judgment method. No unified mathematical criterion currently exists in the academic community, and hierarchical partitioning results under different thresholds objectively differ. Therefore, the accuracy and universality of hierarchical partitioning remain debatable. Fourth, the layered control countermeasures proposed in this paper are mainly based on theoretical analysis and practical summaries from a single project, and they tend to provide framework-level and directional guidance. Standardized management processes, cost estimation tools, and assessment indicator systems have not yet been formed. When applied to different mountainous high-speed railway projects, these countermeasures need to be adjusted according to each project’s own engineering scale, geological conditions, and management level, which results in insufficient operability for direct implementation. In addition, the cost–benefit calculation of control measures relies only on data from the G-N HSR project, and large-sample empirical verification across multiple projects has not been carried out. The input–output ratio, application boundaries, and constraints of various measures remain unclear, making it impossible to provide differentiated control schemes for mountainous high-speed railway projects with different construction standards, investment scales, and terrain difficulties.
In response to the above limitations, future research can be conducted in four directions. First, research scenarios and samples should be expanded. Multi-case comparative studies should be carried out on mountainous high-speed railway projects with different landform types and construction standards to increase sample size and coverage and to improve the universality of the conclusions. Second, research methods should be optimized. Methods such as structural equation modeling and system dynamics should be introduced to quantify the contribution degree and coupling effect of factors. Time-varying models should be constructed in combination with dynamic panel data to reveal the dynamic evolution law of cost impacts. Third, research boundaries should be extended. The research scope should be extended forward to the design stage and backward to the operation and maintenance stage to investigate the influences on green construction cost from a full life-cycle perspective. Fourth, countermeasure research should be deepened. Standardized cost control toolkits should be developed in combination with engineering practice, and differentiated control schemes should be formulated for different types of mountainous engineering projects to enhance the engineering application value of the research results.
These Chinese standards set the basic green construction requirements for this case study. They are not intended for direct enforcement in other countries. Instead, they provide a reference framework for identifying green cost factors under strict ecological protection policies. It is further clarified that the indicator system and analysis method proposed in this paper can be adjusted according to local codes when applied in other regions.
Author Contributions
X.J. proposed the research innovations and drafted the manuscript, C.Z. was responsible for data collection, G.M. provided academic guidance and revised the manuscript, and F.M. provided relevant case information. All authors have read and agreed to the published version of the manuscript.
Funding
This research received no external funding.
Institutional Review Board Statement
Not applicable.
Informed Consent Statement
Informed consent was obtained from all authors participating in the study.
Data Availability Statement
The original contributions presented in this study are included in the article. Further inquiries can be directed to the corresponding author.
Acknowledgments
This thesis was successfully completed because of the careful guidance from the supervisors. We appreciate their professional instructions and constructive suggestions. Meanwhile, we sincerely thank all experts who generously provided research materials, profound insights and inspiring comments during the research.
Conflicts of Interest
The author, Fumin Ma, is affiliated with the Bridge and Tunnel Branch of Hubei Communications Construction Group Co., Ltd. The remaining authors declare that, during the conduct of this study, no commercial or financial relationships that could be construed as potential conflicts of interest were involved.
References
- Zhang, S.; Meng, K.; Jiao, A. Research on Influencing Factors and Control Strategies of Incremental Cost of Green Buildings. Constr. Econ. 2023, 44, 54–61. [Google Scholar]
- Li, Z.; Wei, Q.; Chen, Y.; Wang, H.; Niu, Y. Research on Railway Green Construction Policies Based on PMC Index Model. J. Railw. Eng. Soc. 2024, 41, 124–129. [Google Scholar]
- Bao, X.; Xu, K. Optimization Model of Railway Tunnel Construction Machinery Configuration Considering Carbon Emissions. J. China Railw. Soc. 2020, 42, 157–164. [Google Scholar] [CrossRef]
- Li, H.; Bao, X. Comprehensive Evaluation of Green Construction Level of Railway Tunnels in Qinghai-Tibet Plateau. J. Railw. Sci. Eng. 2021, 18, 524–532. [Google Scholar]
- Mao, H. Analysis on Incremental Cost Management and Control of Green Construction. Constr. Econ. 2023, 44, 257–261. [Google Scholar]
- Zhang, H. Project Cost Management under Green Construction: Value Positioning and Function Adaptation. Eng. Cost Manag. 2025, 36, 17–21. [Google Scholar]
- Zhang, L.; Liu, C.; Wang, W. Research on Application of Construction Waste Recycled Products in Zero-Waste Construction Sites. Constr. Technol. 2025, 54, 121–126. [Google Scholar]
- Zhao, B. Influence of Material Price Fluctuation on Construction Project Cost and Control Measures. Dev. Guide Build. Mater. 2024, 22, 55–57. [Google Scholar]
- Chen, K.; Zhou, J.; Nie, C. Quantitative Research on the Effect of Construction Site Dust Control Measures. J. Environ. Eng. Technol. 2024, 14, 437–445. [Google Scholar] [CrossRef]
- Bao, X.; Xiao, L.; Wan, B. Balanced Optimization of Key Material-Saving Factors for Mountain Railway Bridge and Tunnel Engineering. J. Cent. South Univ. (Sci. Technol.) 2024, 55, 1146–1155. [Google Scholar]
- Yang, Y. Research on cost control of green building construction project based on clustering algorithm. In Proceedings of the 2021 IEEE International Conference on Advances in Electrical Engineering and Computer Applications (AEECA), Dalian, China, 27–28 August 2021; p. 9574416. [Google Scholar]
- Tang, L. Research on the cost control of green building project based on the application of renewable energy. Renew. Energy Power Qual. J. 2024, 22, 87–93. [Google Scholar] [CrossRef] [Scilit]
- Liu, T. Research on Current Status and Evaluation Index System of Railway Green Construction. Value Eng. 2010, 29, 243–244. [Google Scholar]
- Chen, Z.; Zhao, W.; Wang, D.; Long, H.; Zhang, H. Evaluation of Highway Green Construction on Northwest Plateau under the “Dual Carbon” Background. Highway 2024, 69, 212–221. [Google Scholar]
- Jiang, L. Research on Management Innovation of Railway Projects in Complex and Difficult Mountainous Areas. High Speed Railw. Technol. 2025, 16, 56–61. [Google Scholar]
- Jin, C. Research on Green Construction Evaluation of Expressway Tunnel Engineering Based on Extension Cloud Theory. Master’s Thesis, Chongqing Jiaotong University, Chongqing, China, 2025. [Google Scholar]
- Huang, H. Research on Dynamic Cost Control of Green Building Construction from the Perspective of New Urban Construction. New Urban Constr. Sci. Technol. 2026, 35, 86–88. [Google Scholar]
- Wang, R.; He, B. Technological Innovation of Green Construction and Energy-Saving & Environmental Protection Technologies in Construction Engineering. Theor. Res. Urban Constr. (Electron. Ed.) 2026, 25, 89–91. [Google Scholar]
- Chen, X. Research on Green Construction Cost Control of Construction Engineering Projects. Master’s Thesis, East China University of Technology, Nanchang, China, 2025. [Google Scholar]
- Li, Y.; Wang, H.; Zhang, L. Research on the Risk-Inducing Factors of Prefabricated Building Design Change Based on Improved DEMATEL-ISM. Buildings 2023, 13, 3036. [Google Scholar] [CrossRef] [Scilit]
- Q/CR 9264-2024; Technical Specification for Green Construction Sites of Railway Construction Projects. China Railway Publishing House: Beijing, China, 2024.
- Ministry of Construction of the People’s Republic of China. Guidelines for Green Construction: Jianzhi (2007) No. 223; Ministry of Construction of the People’s Republic of China: Beijing, China, 2007. [Google Scholar]
- China State Railway Group Co., Ltd. Special Summary Report on Green Construction of the New Guiyang–Nanning High-Speed Railway; China State Railway Group Co., Ltd.: Beijing, China, 2024. [Google Scholar]
- Li, M.; Lai, J.; Chen, Q. Risk Assessment of BIM Technology Application Based on Structural Equation Modeling (SEM). J. Chongqing Univ. Technol. (Nat. Sci.) 2018, 32, 206–212. [Google Scholar]
- Chen, G.; Li, J. Research and Application of Intelligent Construction Equipment for High-Speed Railway Tunnels in Karst Mountainous Areas. Tunn. Constr. 2024, 44, 112–119. [Google Scholar]
- Paknahad, C.; Tohidi, M.; Bahadori-Jahromi, A.; Room, S. A Comparative Study of Optimised Embodied Carbon and Cost in RC Slab Structures. Buildings 2025, 17, 8662. [Google Scholar] [CrossRef] [Scilit]
- Lu, X.; Chen, Z.; Niu, K.; Lou, P. Research on Green Construction Optimization Based on Improvement Cost. Constr. Econ. 2021, 42, 48–52. [Google Scholar]
- National Railway Administration of the People’s Republic of China. Acceptance Standard for Construction Quality of High-Speed Railway Engineering (Series); China Railway Publishing House: Beijing, China, 2018. [Google Scholar]
- Low, J.K.; Hernandez, G.; Berry, T.-A. Plastic Waste Characterisation to Maximise Landfill Diversion from a New Zealand Residential Construction Site. Front. Sustain. 2024, 5, 1455480. [Google Scholar] [CrossRef] [Scilit]
- Liu, W.; Chen, Y.; Zhu, P. Can carbon reduction policies promote sustainable construction development? Evidence from China’s green building market. PLoS ONE 2024, 19, e0303149. [Google Scholar] [CrossRef] [Scilit]
- Zeng, F.; Wang, T. Modeling of Disaster-Causing Factors for Fall-from-Height Accidents of Formwork Scaffolds Based on DEMATEL and ISM. J. Shenyang Univ. Technol. 2021, 43, 342–348. [Google Scholar] [CrossRef]
- Wang, Y.; Li, S.; Chen, X. Influencing Factors of Spatial Ability for Architecture and Interior Design Students: A Fuzzy DEMATEL and Interpretive Structural Mode. Buildings 2024, 14, 2934. [Google Scholar] [CrossRef] [Scilit]
- China State Railway Group Co., Ltd. Construction Technology Summary of Segmental Assembled Girders for Chengjiang Double-Line Extra Large Bridge of Guiyang–Nanning High-Speed Railway; China State Railway Group Co., Ltd.: Beijing, China, 2023. [Google Scholar]
- Li, J. Research on Turnover Utilization of Construction Equipment and Cost Control of Mountain Railway Construction Projects. Railw. Eng. Cost. Manag. 2023, 38, 41–45. [Google Scholar]
- Wang, Y.; Zhao, X. Plant Configuration and Cost-Benefit Analysis of Ecological Corridor Greening Along Mountainous High-Speed Railways. Railw. Stand. Des. 2023, 67, 167–172. [Google Scholar]
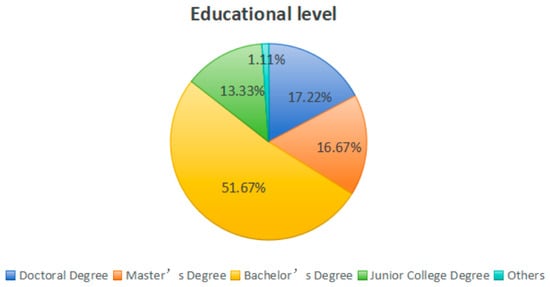
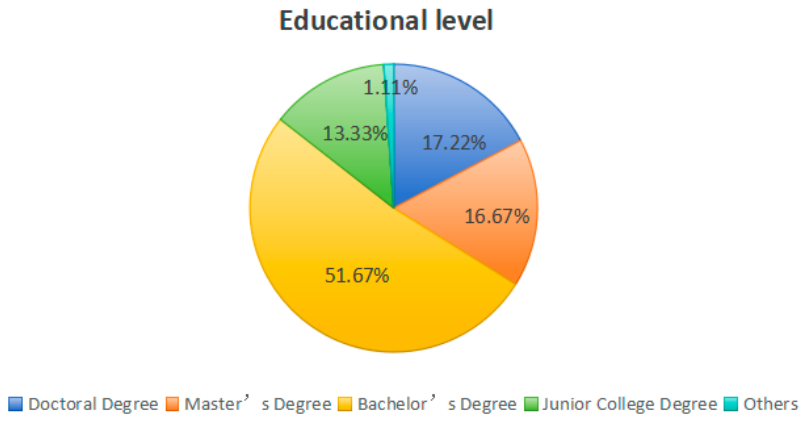
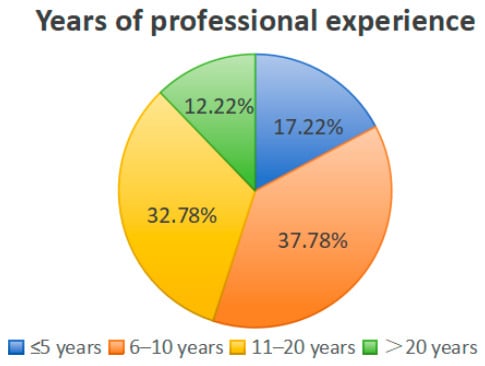
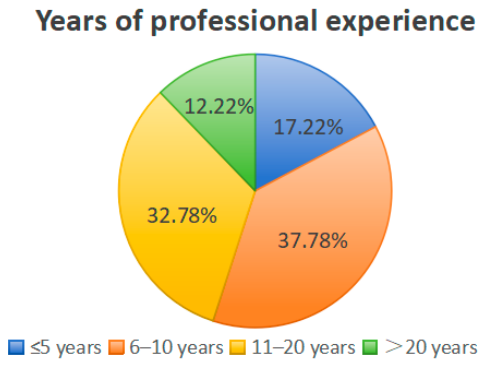
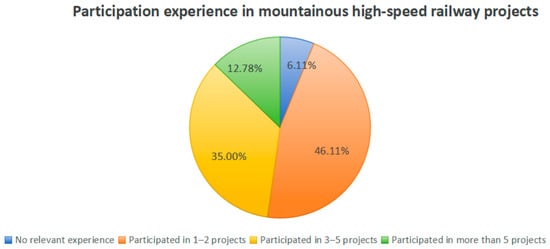
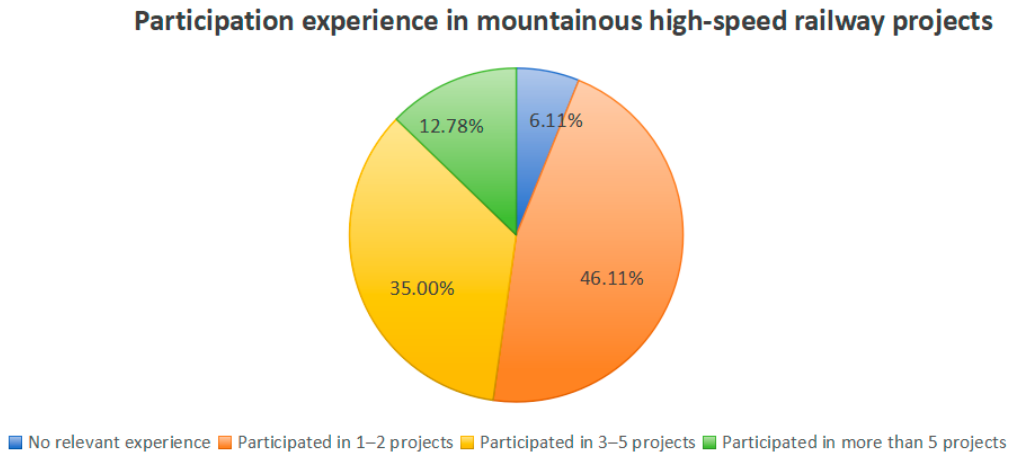
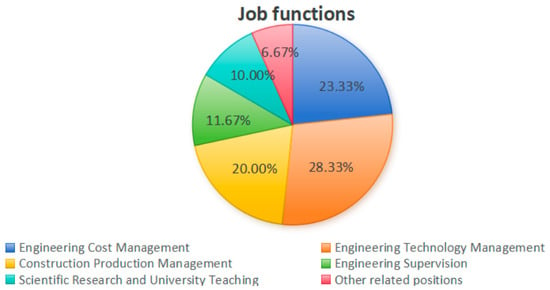
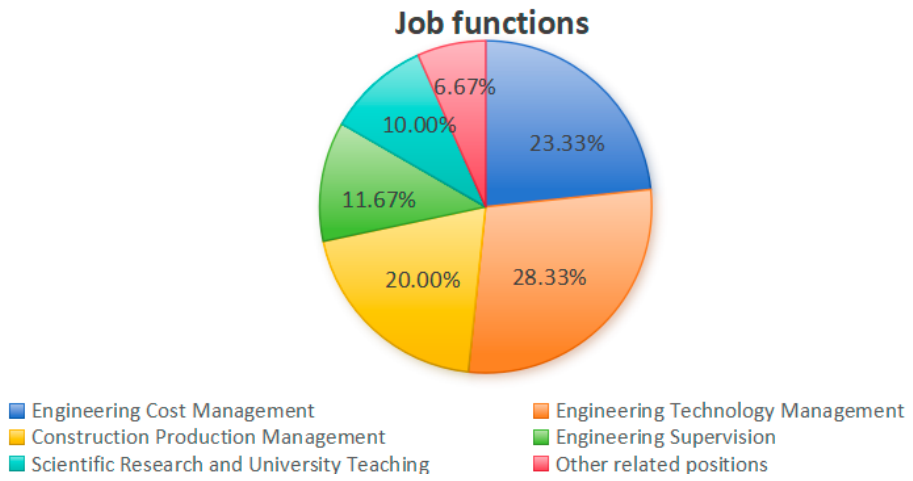
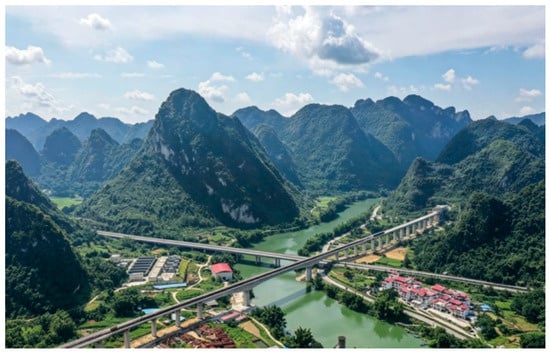
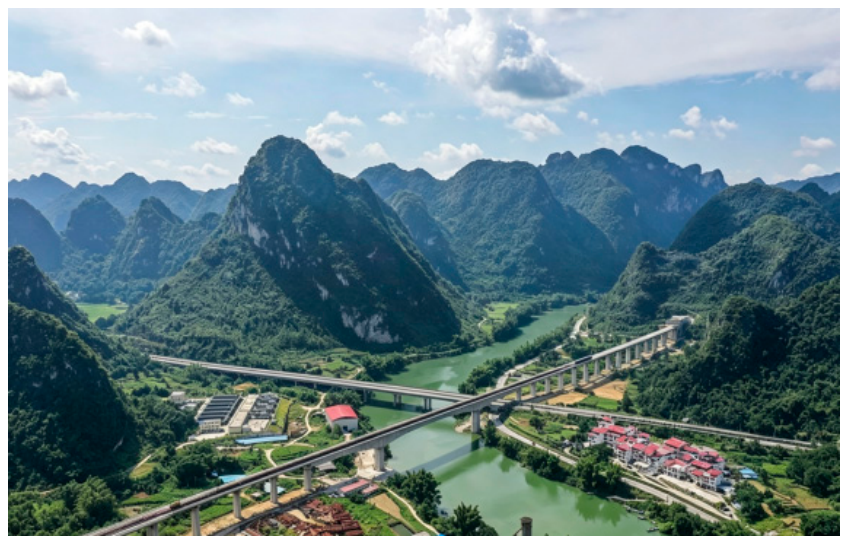
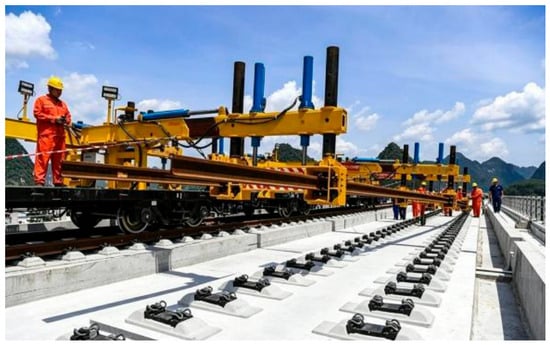
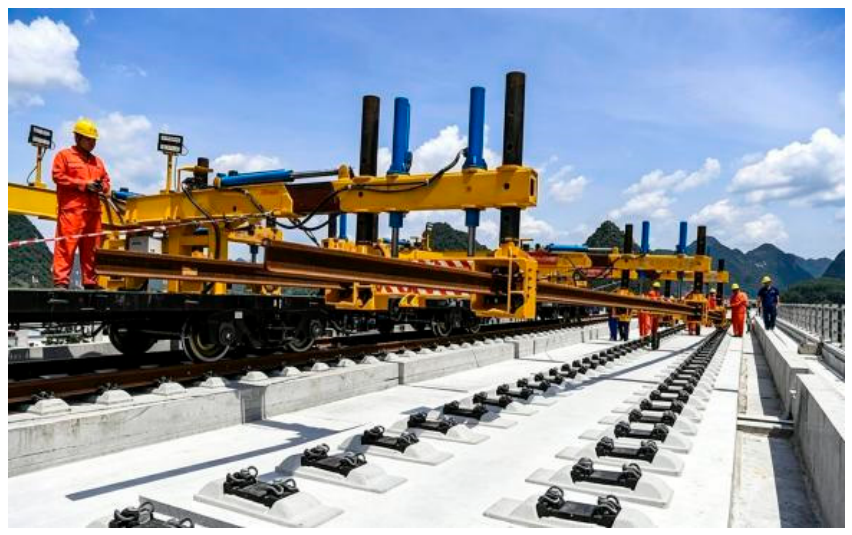
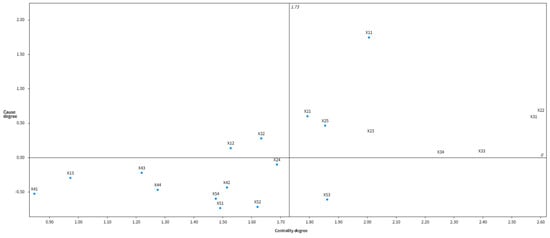
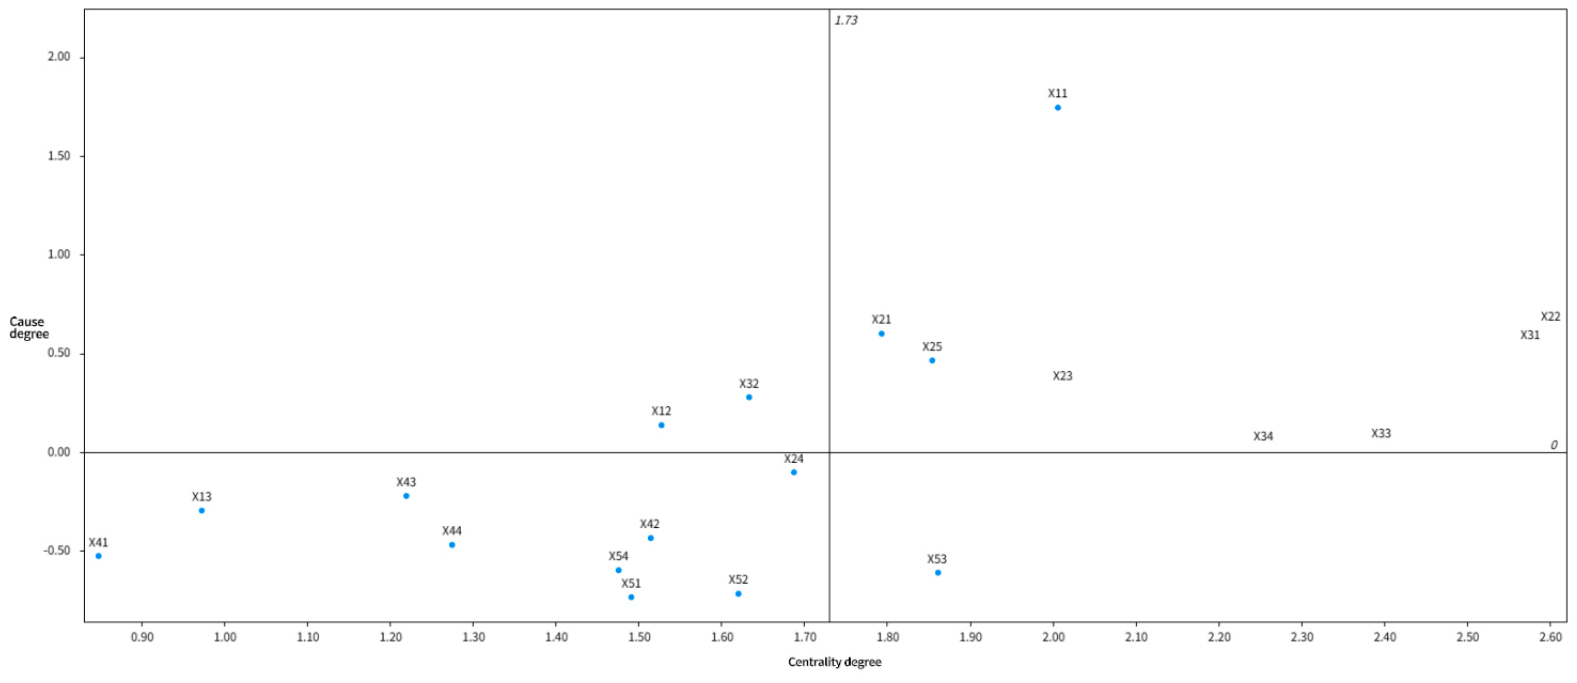
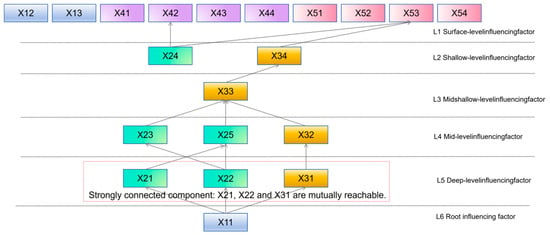
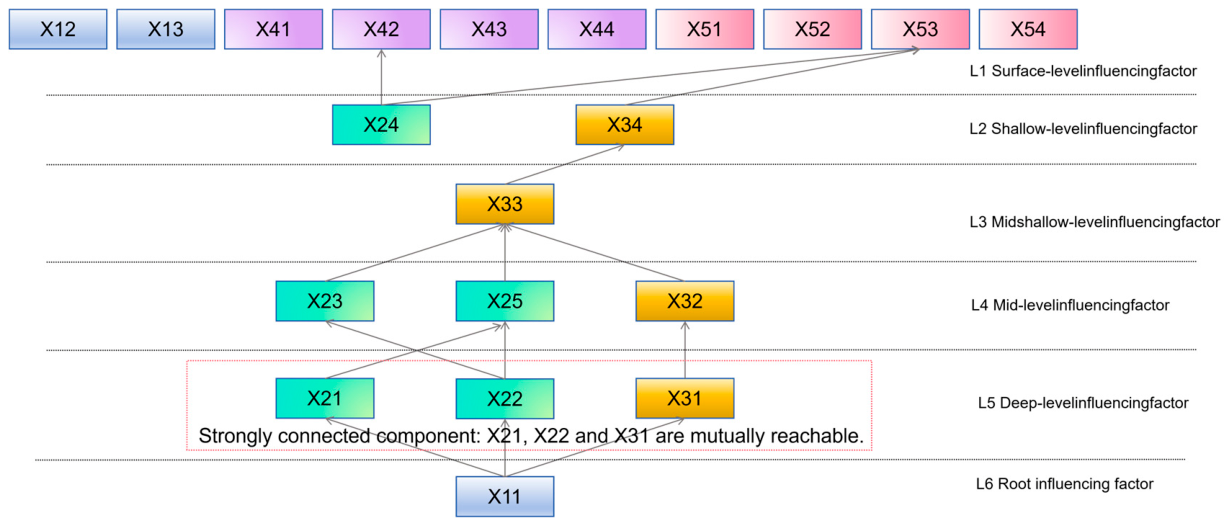

Disclaimer/Publisher’s Note: The statements, opinions and data contained in all publications are solely those of the individual author(s) and contributor(s) and not of MDPI and/or the editor(s). MDPI and/or the editor(s) disclaim responsibility for any injury to people or property resulting from any ideas, methods, instructions or products referred to in the content. |
© 2026 by the authors. Licensee MDPI, Basel, Switzerland. This article is an open access article distributed under the terms and conditions of the Creative Commons Attribution (CC BY) license.