


Abstract
Nominally optimized atrium designs may lose reliability when geometric and envelope parameters deviate during implementation. Extending a previously established deterministic surrogate-assisted workflow, this study investigates uncertainty-aware design decision-making for a multi-atrium commercial building in Urumqi, China. The severe-cold climate is treated as a fixed environmental boundary condition, while uncertainty analysis is restricted to six implementation-related design variables. A Honeybee–EnergyPlus model supported by short-term field calibration was used to generate a Latin-hypercube dataset, and CatBoost surrogate models were developed for predicted percentage of dissatisfied (PPD), daylight autonomy at 300 lx (DA), and summer–winter solar-radiation difference (D-RAD). Sobol indices and SHAP were used to interpret parameter importance and interaction effects. Monte Carlo propagation of the six uncertain variables was embedded within NSGA-II using mean–variability robust objectives, and TOPSIS was applied to select representative solutions for subsequent space-syntax evaluation. The CatBoost models achieved global holdout test-set R2 values of 0.990–0.994. Compared with the deterministic compromise solution, the robust solution shifted toward a different design configuration while maintaining broadly comparable mean performance. The uncertainty-adjusted DA and D-RAD objectives improved by approximately 2.21% and 6.20%, respectively, whereas the PPD objective deteriorated marginally by approximately 0.25%, reflecting the multi-objective trade-off inherent in the robust formulation. Expanded high-fidelity re-evaluation of ten Pareto-region designs revealed larger local errors for DA and D-RAD than suggested by the global holdout statistics, although the comparative performance ranking was strongly preserved. The results indicate that implementation-related design-variable uncertainty can alter the preferred design region and the balance among competing environmental objectives. Environmental robustness and spatial-configuration quality should therefore be treated as complementary criteria, with space-syntax analysis serving as a post-optimization screening tool rather than a direct measure of user experience.
1. Introduction
1.1. Background
Large-span atrium spaces have become increasingly common in modern commercial buildings due to their ability to enhance spatial openness [1,2], daylight utilization [3], and indoor environmental quality. However, the extensive glazing areas and large enclosed volumes of atrium structures introduce substantial thermal regulation challenges. These problems are particularly critical in severe cold regions, where large outdoor temperature differences and pronounced seasonal variations in solar heat gain impose additional constraints on building energy efficiency and occupant thermal comfort [4].
Given the widespread use of atrium spaces in commercial buildings, achieving an appropriate balance between indoor thermal comfort and building energy consumption has become an important consideration, particularly in severe cold regions [5]. Therefore, incorporating thermal comfort and energy performance into the early design stage is essential for improving the overall environmental performance of commercial atrium buildings [5,6]. Simulation-based methods, such as EnergyPlus and other dynamic building performance tools, have been widely used to evaluate the effects of envelope configurations, HVAC systems, and operational strategies on indoor thermal conditions and energy consumption, thereby supporting the assessment and optimization of design alternatives [6,7].
However, performance optimization of large and complex commercial buildings remains challenging because repeated high-fidelity simulations can impose substantial computational burdens, particularly when a large design space needs to be explored [8]. This challenge becomes more pronounced when multiple and potentially conflicting objectives, such as energy consumption, thermal comfort, daylight availability, and solar radiation control, must be considered simultaneously [5,7]. Consequently, conventional simulation-based optimization may require a large number of computationally expensive model evaluations. To address this limitation, recent building-performance studies have increasingly integrated numerical simulation with multi-objective optimization and surrogate modelling, enabling more efficient exploration of complex design spaces and identification of high-performance design solutions [7,8].
1.2. Literature Review
1.2.1. Simulation-Based Building Performance Optimization Methods
The distinctive geometric and environmental characteristics of atrium buildings have led to the extensive application of numerical simulation in their performance assessment. Unlike conventional cellular spaces, atria are characterized by large vertical volumes, extensive transparent envelopes, strong solar exposure, and interconnected thermal and airflow zones. These features give rise to complex interactions among solar heat gain, buoyancy-driven airflow, vertical thermal stratification, ventilation, and heating, ventilation, and air-conditioning (HVAC) operation. Accordingly, different simulation methods have been adopted depending on the physical processes and performance indicators of interest.
Whole-building energy simulation tools, such as EnergyPlus and DesignBuilder, are commonly employed to evaluate annual or seasonal energy consumption, cooling and heating loads, envelope performance, and HVAC operation. Pan et al. [9], for example, developed both Computational Fluid Dynamics (CFD) and EnergyPlus models for atrium buildings in hot and humid regions and demonstrated that assuming a uniformly mixed indoor air temperature can introduce substantial errors in cooling-load prediction for large atrium spaces. Baharvand et al. [10] employed DesignBuilder to compare the thermal performance of different atrium roof configurations in a tropical climate, showing its applicability in evaluating the effects of geometry on indoor temperature and ventilation performance.
In contrast, CFD provides a more detailed representation of local airflow, air-temperature distributions, buoyancy effects, and vertical thermal stratification. Hussain and Oosthuizen [11] used a validated CFD model to investigate buoyancy-driven natural ventilation in a three-storey atrium and further evaluated occupant thermal comfort through the Predicted Mean Vote (PMV) and Predicted Percentage of Dissatisfied (PPD). More recently, Su et al. [12] developed a field-measurement-validated OpenFOAM model for a large office atrium and examined the spatial and temporal characteristics of thermal stratification under different shading and air-conditioning strategies. Such studies indicate that CFD is particularly advantageous when local environmental heterogeneity is important, whereas whole-building simulation is generally more suitable for long-term energy and system-level assessment.
The principal characteristics of representative simulation approaches used in atrium performance studies are summarized in Table 1.
Table 1.
Comparison of representative simulation approaches for atrium building performance assessment.
Beyond individual performance evaluation, simulation models have increasingly been coupled with optimization algorithms to identify design alternatives that balance multiple objectives. Such simulation-based optimization provides a physics-based framework for assessing the effects of atrium geometry, envelope properties, skylight configurations, shading parameters, openings, and HVAC settings. Nevertheless, building performance optimization is inherently more complex than a conventional parametric comparison. Design variables are often strongly coupled, and their responses can be nonlinear, discontinuous, or multimodal. Furthermore, objectives such as reducing energy consumption, improving thermal comfort, increasing daylight availability [13], and limiting excessive solar heat gain may conflict with one another, resulting in a set of trade-off solutions rather than a single optimum [14].
The limitations of conventional simulation-based optimization are therefore not restricted to computational cost. High-dimensional design spaces, nonlinear interactions among variables, multiple local optima, algorithm selection and parameter sensitivity [15], and uncertainties in boundary conditions can all affect optimization efficiency and solution reliability [14]. These problems become particularly pronounced when high-fidelity CFD or dynamic building simulations must be repeatedly executed within iterative or evolutionary optimization procedures. As the numbers of design variables, performance objectives, and scenarios increase, the computational burden may become prohibitive for practical early-stage design applications.
Consequently, improving the efficiency of performance prediction and design-space exploration while maintaining sufficient physical reliability has become an important research direction in building performance optimization. This requirement has promoted the development of surrogate and data-driven approaches, which are discussed in the following section.
1.2.2. Machine-Learning-Assisted Optimization and Robust Decision-Making for Building Performance
To address the limitations of conventional simulation-based optimization, machine-learning surrogate models have increasingly been introduced into building performance optimization. By learning the nonlinear relationships between design variables and performance indicators from simulation datasets, surrogate models can approximate computationally expensive physical simulations and substantially improve optimization efficiency [8,16,17]. Various algorithms, including Artificial Neural Networks, Random Forest, Support Vector Regression, XGBoost, LightGBM, and other ensemble-learning methods, have been applied to building performance prediction and multi-objective optimization.
Recent studies have further integrated surrogate modelling with optimization and model interpretation. Shen and Pan [18] combined DesignBuilder, LightGBM, SHapley Additive exPlanations (SHAP), and multi-objective optimization to predict and interpret building energy performance. For commercial atrium buildings, Xu et al. [4] developed a deterministic surrogate-assisted optimization framework integrating parametric simulation, CatBoost, SHAP, and NSGA-II to optimize thermal comfort, daylight availability, and seasonal solar-radiation performance. That study demonstrated the feasibility of using an interpretable machine-learning surrogate to efficiently explore the multi-objective design space of multi-atrium commercial buildings in severe cold regions. However, the design variables were treated as fixed nominal values throughout the optimization process, and the resulting Pareto-optimal solutions therefore represented optimal performance under idealized implementation conditions. The previous framework did not explicitly investigate whether geometric deviations arising from construction tolerances or variations in envelope properties could alter the expected performance, variability, or relative ranking of optimized solutions. Consequently, a design identified as optimal under nominal conditions could not necessarily be assumed to remain reliable when the prescribed design parameters deviate during practical implementation. In addition, the previous study focused primarily on environmental-performance optimization and did not examine whether environmentally optimized solutions also retained favorable spatial-configuration characteristics in terms of visibility, accessibility, and spatial intelligibility.
Accordingly, the present study does not seek to re-establish the deterministic CatBoost–SHAP–NSGA-II framework. Instead, it uses the previous deterministic workflow as a methodological baseline and shifts the research focus from nominal performance optimization to uncertainty-aware design decision-making. Specifically, design-variable uncertainty is explicitly propagated through the surrogate-assisted optimization process to examine whether nominally optimal solutions remain stable under parameter perturbations, while global sensitivity analysis and post-optimization space-syntax evaluation are further introduced to investigate the mechanisms governing performance robustness and the relationship between environmental optimization and spatial-configuration quality.
However, computational efficiency and prediction accuracy alone do not ensure reliable design decisions. Building performance is affected by uncertainties in geometry, material properties, weather conditions, occupancy, and operational schedules, meaning that solutions optimized under nominal conditions may not remain optimal in practice. Lu et al. [19] demonstrated that input uncertainty can significantly affect the robustness of optimized building forms. Robust optimization is therefore required to identify solutions that maintain acceptable performance under parameter variations rather than only under a single deterministic scenario. Although building performance may be affected by multiple sources of uncertainty, including weather, occupancy, internal loads, and operational conditions, the present study does not attempt to model all of these sources simultaneously. Instead, it focuses specifically on implementation-related uncertainty in atrium geometry and skylight envelope properties, while climatic and operational conditions are treated as prescribed simulation boundary conditions.
Model interpretability is another important issue. Although nonlinear and ensemble-learning models provide strong predictive capability, their black-box nature can limit their usefulness in engineering decision-making. Explainable methods such as SHAP can identify the relative influence of design variables and reveal nonlinear response patterns [4,18,19]. Accordingly, building performance optimization is increasingly developing toward integrated frameworks combining physical simulation, machine-learning surrogates, multi-objective optimization, interpretability, and uncertainty-aware decision-making. Nevertheless, most existing studies remain focused primarily on physical environmental performance, while spatial-configuration characteristics related to visibility, accessibility, movement, and intelligibility have received comparatively limited attention.
1.2.3. Integration of Spatial-Configuration Assessment into Building Performance Optimization
In commercial buildings, particularly large atrium spaces, building performance is influenced not only by energy and indoor environmental conditions but also by spatial configuration. Changes in atrium geometry may affect visual connectivity, accessibility, circulation, and spatial intelligibility in addition to thermal and daylight performance. Therefore, a design that performs well according to physical environmental indicators may not necessarily exhibit favorable spatial-configuration characteristics.
Space syntax provides a quantitative approach for evaluating spatial configuration through indicators such as connectivity, integration, choice, visibility, and intelligibility [20]. Previous studies have demonstrated relationships between these indicators and pedestrian movement, accessibility, and spatial perception [21,22]. On the building scale, visibility-based methods such as Visibility Graph Analysis (VGA) are particularly useful for evaluating visual connectivity and spatial organization in large public and commercial interiors. Moreover, studies have begun to link spatial configuration with environmental performance. Du [23] investigated correlations between space-syntax indicators and ventilation and energy performance, while Tarabieh [24] incorporated daylight-related parameters into a space-syntax-based multi-objective framework. In commercial environments, Zinai and Chaouche [25] further showed that atrium configuration can significantly influence user movement and spatial organization.
Nevertheless, building performance optimization studies still mainly focus on physical indicators such as energy consumption, thermal comfort, daylight, and solar radiation [4,5,8,16,17,18,19], whereas space-syntax research generally emphasizes accessibility, visibility, movement, and spatial cognition [20,21,22,23,24,25]. The systematic integration of space-syntax-based spatial-configuration indicators into simulation and machine-learning-assisted building optimization remains limited. Therefore, combining environmental performance evaluation with quantitative spatial-configuration metrics provides an important direction for achieving more comprehensive optimization of commercial atrium spaces.
1.3. Research Scope and Contribution
The present study builds on the deterministic CatBoost–SHAP–NSGA-II framework established in our previous work [4] but shifts the research focus from nominal performance optimization to design reliability under explicitly prescribed uncertainty. In the present study, the severe-cold climate serves as the fixed environmental context, whereas the uncertainty analysis is restricted to implementation-related variations in the six design variables. Retaining the same case building provides a controlled basis for examining how design-variable uncertainty affects optimized solutions and enables the present study to isolate the effects of uncertainty-aware decision-making from changes in the underlying building case.
To further distinguish the present work from our previous deterministic study [4], the retained and newly generated elements are clarified as follows. The case building, the general Honeybee–EnergyPlus simulation environment, and the CatBoost–SHAP–NSGA-II methodological backbone are intentionally retained to provide a controlled basis for comparison. However, the present study uses a revised six-variable design formulation and generates a new 1000-case six-dimensional Latin-hypercube simulation dataset with DA replacing UDI as the daylight-performance target. New simulations and analyses include 5000-realization Monte Carlo uncertainty propagation for each evaluated design, mean–variability robust optimization, paired-bootstrap confidence-interval analysis, boundary-treatment sensitivity analysis, and high-fidelity re-evaluation of ten Pareto-region designs. The CatBoost algorithm itself is not new; rather, new surrogate models are trained for the revised six-variable/DA formulation, and Sobol analysis is added to complement SHAP-based interpretation. The resulting findings are also new: they quantify how prescribed implementation-related uncertainty shifts the preferred design region and objective trade-offs, evaluate the sensitivity of these conclusions to uncertainty-boundary treatment, assess local surrogate fidelity in the Pareto region, and compare the spatial-configuration characteristics of environmentally robust alternatives through post-optimization space-syntax analysis. Accordingly, this study addresses three questions: (1) whether design-variable uncertainty changes the expected performance, variability, and preferred design region of Pareto-optimal solutions; (2) which variables and interactions govern these uncertainty-aware responses; and (3) whether environmentally robust solutions remain favorable in terms of spatial visibility, accessibility, and intelligibility.
To address these questions, Monte Carlo uncertainty propagation is embedded within NSGA-II, Sobol and SHAP are used complementarily for sensitivity interpretation, and TOPSIS-selected representative solutions are further evaluated through space syntax. The principal contribution is therefore the extension of nominal performance optimization toward uncertainty-aware and spatially informed design decision-making.
2. Materials and Methods
2.1. Overall Optimization Framework
The present study extends the deterministic surrogate-assisted optimization framework established in our previous work [4] by incorporating design-variable uncertainty and post-optimization spatial evaluation (Figure 1). The workflow comprises two stages: robust environmental-performance optimization and spatial-configuration assessment.
Figure 1.
Overall framework of the uncertainty-aware multi-objective optimization and spatial evaluation workflow.
In the first stage, six design variables (D0, D1, D2, ASR, U, and SHGC) were parameterized in Honeybee–EnergyPlus simulations. Latin hypercube sampling (LHS) was used to generate the simulation dataset, based on which CatBoost surrogate models were developed to predict DA, PPD, and D-RAD. Sobol sensitivity analysis and SHAP were combined to investigate parameter importance and nonlinear effects. Monte Carlo simulation was then used to propagate design-variable uncertainty, and mean–variability objectives were optimized using Robust NSGA-II. TOPSIS was subsequently applied to select representative Pareto-optimal solutions under different decision preferences.
In the second stage, the selected solutions were evaluated using space-syntax indicators of spatial visibility (SV), spatial accessibility (SA), and spatial comprehensibility (SC). This extended workflow enables comparison between nominal and uncertainty-aware design decisions and assessment of whether robust environmental performance is accompanied by favorable spatial-configuration characteristics. The methods and software used in this workflow were selected according to their specific roles in the analysis. Rhino/Grasshopper was used to construct and update the parametric atrium geometry, while Honeybee–EnergyPlus provided the physics-based building-performance simulations required to generate the reference dataset. Latin hypercube sampling was adopted to efficiently cover the six-dimensional design space with a limited number of high-fidelity simulations. CatBoost was retained as the surrogate model to reduce the computational burden of repeated performance evaluations during sensitivity analysis, uncertainty propagation, and optimization. Sobol analysis and SHAP were used complementarily: Sobol quantified global variance-based sensitivity, whereas SHAP provided directional and conditional interpretation of individual feature effects. Monte Carlo simulation was used to propagate the prescribed design-variable uncertainty, and NSGA-II was employed to identify trade-off solutions among the conflicting robust objectives. TOPSIS was subsequently used to select representative compromise solutions from the Pareto set according to different decision preferences. Finally, Depthmap-based space-syntax analysis was applied as a post-optimization screening tool to compare the spatial-configuration characteristics of the selected environmentally robust alternatives. These components therefore serve distinct but complementary functions within the overall workflow rather than representing multiple redundant analysis methods.
2.2. Case Study Building and Field Measurements
A multi-atrium commercial complex located in Urumqi, China, was selected as the case study building to evaluate the proposed optimization framework. Urumqi is characterized by a severe cold climate, with substantial seasonal variations in outdoor temperature and solar radiation. Under such climatic conditions, large commercial buildings with extensive glazed envelopes and atrium spaces are exposed to complex thermal-performance challenges. During the heating season, heat loss through transparent envelopes may increase the indoor heating demand, whereas solar gains through skylights and glazed surfaces can substantially alter the thermal environment within large atrium spaces. The selected building therefore provides a representative engineering case for investigating the coupled effects of atrium configuration, thermal comfort, daylight availability, and seasonal solar radiation.
The case building contains multiple atrium spaces that differ in their geometric configuration and spatial relationship with the surrounding commercial areas. Large-span interior spaces and transparent roof components create strong interactions among building geometry, solar radiation, daylight penetration, and indoor thermal conditions. These characteristics make the building particularly suitable for examining the performance trade-offs considered in this study. The architectural configuration and principal atrium spaces of the case building are illustrated in Figure 2a. Based on the original architectural drawings and on-site investigation, the main geometric and envelope information required for subsequent parametric modeling was extracted and incorporated into the Rhino/Grasshopper model (Figure 2b). The same case-study building was previously investigated in our earlier work [4]. In the present study, the authors’ original Rhino and CAD model was retained as the geometric basis, while the parametric representations and definitions of the six design variables were revised to support the proposed uncertainty-aware optimization framework.
Figure 2.
Actual view and parametric model of Miguli Phase II. The Chinese characters on the building façade in panel (a) are part of the original signage and identify the building as the Miguli Commercial Complex (Phase II).
To obtain accurate geometric information for the case building, on-site dimensional measurements were conducted to characterize the spatial scale and geometric configuration of the principal atrium and adjacent spaces. A Bosch GLM 250 VF Professional laser distance meter (Robert Bosch Power Tools GmbH, Leinfelden-Echterdingen, Germany) was used for these measurements.The measured parameters mainly included the atrium length, width, and height, floor-to-floor heights, and the dimensions of major openings and transparent-envelope components. Measurement locations were selected according to the spatial layout and functional characteristics of the building. The instruments used for the dimensional survey, together with their measurement ranges and accuracies, are summarized in Table 2. Before measurement, the instruments were checked and deployed according to the corresponding measurement requirements to reduce potential errors associated with instrument accuracy and measurement position.
Table 2.
Dimension Measurement Tools Information.
The field measurements provide an empirical basis for characterizing the actual indoor environmental conditions of the commercial complex and for assessing the reliability of the simulation model. The measured data were subsequently compared with the corresponding simulation results to examine whether the established building-performance model could reasonably reproduce the environmental response of the actual building. After model verification, the validated model was used for parametric simulation, dataset generation, surrogate-model training, and subsequent robust multi-objective optimization. In this way, the optimization process was grounded in the thermal behavior of an actual commercial building rather than relying solely on an idealized numerical model.
2.3. Optimization Variables and Case Model Development
In this study, Miguli Phase II in Urumqi (Figure 2) was selected as the representative case for parametric modelling and multi-objective optimization. Based on field surveys, case screening, climatic characteristics, and envelope-performance requirements for severe cold regions, six key optimization variables were defined (Figure 3): D0, D1, D2, ASR, U-value, and SHGC. The geometric variables describe the spatial relationship among atria, entrances, and skylights, whereas the envelope variables regulate the coupled effects of daylight admission, solar heat gain, and heat loss.
Figure 3.
Schematic diagram of the six design variables for the shopping mall atriums. The three-dimensional model views and plan diagrams were newly generated from the authors’ original Rhino and CAD model files and subsequently processed to illustrate the revised design variables of the present study. The same case-study building was previously investigated in Ref. [4].
The SHGC range was set to 0.25–0.45 to balance winter solar heat utilization and summer overheating control. The skylight U-value was limited to 1.5–2.8 W/(m2·K) to ensure adequate thermal insulation while maintaining realistic construction applicability. For spatial variables, D0 was defined as 3.2–6.0 m according to structural spacing and inter-atrium environmental coupling. D1 and D2 were set to 12–45 m and 17–49 m, respectively, based on measured entrance-transition distances and atrium-area constraints. The atrium skylight ratio was set to 0.6–0.9 to reflect prevailing design practices in Urumqi while allowing the optimization model to evaluate the trade-off between daylighting potential and thermal penalties.
Numerical Simulation Model
The parametric building model was established in Rhino/Grasshopper and transferred through Honeybee to EnergyPlus for dynamic thermal and solar-performance calculations. For each design configuration, the building geometry, atrium spacing, skylight ratio, skylight thermal transmittance, and solar heat gain coefficient were updated parametrically, while the prescribed weather, occupancy, internal-load, and operational settings were kept unchanged. The same numerical workflow was applied to all sampled designs so that differences in the calculated responses could be attributed consistently to the investigated design variables.
The thermal response calculated by EnergyPlus is based on transient zone and surface heat balances. In compact form, the zone-air energy balance can be expressed as (1)
where () is the thermal capacitance of the zone air, () is the zone-air temperature, () represents internal sensible heat gains, () represents convective heat exchange between internal surfaces and zone air, () represents interzone air exchange, () represents outdoor-air infiltration, and () represents the heat supplied to or removed from the zone by the conditioning system. Solar gains transmitted through the atrium skylights and other transparent surfaces enter the surface and zone heat balances according to the specified glazing properties, including SHGC and thermal transmittance.
The resulting hourly thermal conditions were used to derive PMV/PPD, while incident solar radiation on the investigated surfaces was accumulated for the seasonal D-RAD calculation. Daylight performance was evaluated using annual daylight autonomy. For an illuminance threshold of 300 lx, DA was calculated as (2)
where () is the simulated illuminance at occupied time step (t), () is the total number of occupied time steps, and () is an indicator function equal to 1 when the illuminance threshold is satisfied and 0 otherwise.
These high-fidelity numerical outputs form the reference dataset used for surrogate-model development. CatBoost subsequently approximates the mapping from the six design variables to PPD, D-RAD, and DA, while the original Honeybee–EnergyPlus model is retained for field-based thermal calibration and high-fidelity re-evaluation of selected Pareto-region solutions.
2.4. Performance Evaluation Indicators
Accordingly, this study adopts the following parameters (Table 3) from the physical spatial environment: thermal comfort/discomfort in the atrium corridor, natural daylighting in the atrium corridor, and solar heat gain in the atrium corridor.
Table 3.
Building Energy Efficiency Optimization Metrics.
Three environmental performance indicators were adopted as the objectives of the multi-objective optimization: D-RAD, PPD, Equation (3), and DA. D-RAD was defined as the difference between summer and winter solar-radiation gains, Equation (4), and was minimized to reduce excessive summer solar gains while maintaining beneficial winter solar access. PPD, calculated from the PMV model developed by Fanger [26,27], was employed to quantify thermal discomfort and was likewise treated as a minimization objective. For daylight performance, DA was adopted instead of UDI and defined as the percentage of occupied time during which the indoor illuminance reaches or exceeds 300 lx [28,29,30]. Compared with UDI, DA provides a more direct measure of annual daylight adequacy and is therefore better suited to the present study, which further examines spatial visibility, accessibility, and configurational characteristics. Accordingly, the optimization seeks to minimize D-RAD and PPD while maximizing DA, thereby balancing seasonal solar regulation, thermal comfort, and daylight availability.
PPD = 100 − 95exp(−0.03353PMV4 − 0.21PMV2)
D-RAD = RADsummer − RADwinter
2.5. Surrogate Modeling and Sensitivity Analysis
2.5.1. CatBoost Surrogate Model
CatBoost was retained as the surrogate engine in the present study rather than introduced as a methodological novelty. In our previous deterministic optimization study [4], multiple candidate machine-learning algorithms were systematically evaluated under a common data-partitioning and hyperparameter-selection framework, and CatBoost was subsequently adopted as the surrogate model for the deterministic optimization workflow. The present study therefore does not repeat the algorithm-selection exercise. Instead, CatBoost is retained for methodological continuity and to provide a consistent surrogate basis for the subsequent SHAP interpretation, Monte Carlo uncertainty propagation, and robust multi-objective optimization.
To reduce the computational burden associated with repeated Honeybee–EnergyPlus simulations, CatBoost regression models were developed for the three performance indicators considered in the present study.
Six design variables, D0, D1, D2, ASR, U, and SHGC, were used as model inputs, while PPD, D-RAD, and the sign-reversed daylight response (−DA) were treated as prediction targets. Latin hypercube sampling (LHS) was used to generate 1000 design configurations within the predefined six-dimensional design space, each of which was evaluated using the calibrated Honeybee–EnergyPlus workflow. The resulting dataset was divided into training, validation, and test subsets at a ratio of 70:15:15 using a fixed random seed of 2026.
The surrogate model can be expressed as (5)
where X represents the vector of design variables, denotes the CatBoost-predicted response corresponding to PPD, D-RAD, or −DA. The same CatBoost configuration was adopted for the three prediction targets (PPD, D-RAD, and −DA) to maintain methodological consistency. Model performance was evaluated using the coefficient of determination (R2), root-mean-square error (RMSE), and mean absolute error (MAE) on the training, validation, and independent test subsets. The model configuration is summarized in Table 4.
Table 4.
CatBoost surrogate-model configuration.
2.5.2. Sobol Sensitivity Analysis
Although surrogate models provide efficient prediction capabilities, identifying the relative importance of input variables is essential for understanding the mechanisms governing building performance. Therefore, Sobol global sensitivity analysis was introduced to quantify the contribution of each design parameter to the variation in performance objectives.
Sobol analysis is a variance-based global sensitivity method that decomposes the total variance of a model output into contributions from individual variables and their interactions. For a model with n input variables (6)
The variance of the output can be expressed as (7)
where Vi represents the contribution of an individual variable, while Vij represents the interaction effect between variables.
The first-order sensitivity index Si was used to quantify the independent influence of each design variable (8)
whereas the total-order sensitivity index STi was adopted to evaluate the overall contribution including interaction effects (9).
where V∼i represents the variance contribution excluding variable Xi. A higher sensitivity index indicates a stronger influence of the corresponding design parameter on the target performance. By comparing the sensitivity results of PPD, DA, and D-RAD, the dominant variables controlling different performance objectives were identified, providing a theoretical basis for variable prioritization in the optimization process.
The Sobol analysis was implemented using the SALib package. The six design variables were treated as mutually independent inputs and sampled over their respective design ranges using a scrambled Sobol low-discrepancy sequence. A base sample size of N = 2048 was adopted, and second-order sensitivity indices were not calculated because the present analysis focused on the first-order (S1) and total-order (ST) effects. For six input variables, this sampling scheme resulted in N(D+2) = 16,384 surrogate-model evaluations for each performance response. A fixed random seed of 2026 was used to ensure reproducibility.
The sampled input vectors were evaluated using the final CatBoost surrogate models, and the resulting predictions were used to calculate the first-order and total-order Sobol indices. The corresponding 95% confidence intervals were estimated using 1000 bootstrap resamples. For daylight performance, the surrogate model was formulated using the sign-reversed response (−DA). Because Sobol indices are variance-based and invariant to multiplication of the model output by −1, the sensitivity indices obtained from the −DA surrogate are identical to those for the original physical DA response. Therefore, the daylight Sobol results are reported and interpreted in terms of physical DA.
2.5.3. SHAP Interpretation
While Sobol analysis can quantify the contribution of design variables, it does not provide detailed information regarding the direction and nonlinear characteristics of variable effects. Therefore, the SHAP method was further employed to interpret the prediction behavior of the CatBoost surrogate model.
SHAP is based on cooperative game theory and decomposes the prediction output into the contribution of each input variable. The prediction function can be represented as (10).
where ϕ represents the average model prediction, and ϕi represents the contribution of the i-th feature to the prediction result.
In this study, SHAP analysis was conducted for the three performance objectives (PPD, DA, and D-RAD) to identify: the relative importance of different design parameters; the positive or negative influence of each parameter on performance indicators; and potential nonlinear relationships and interaction effects between design variables. SHAP interaction values were used to identify relative pairwise conditional effects within the surrogate model and were not interpreted as variance-decomposition measures directly comparable in magnitude with Sobol interaction contributions. For the daylight surrogate, which was trained using the sign-reversed response (−DA), the SHAP values were multiplied by −1 for presentation so that positive SHAP contributions consistently indicate increases in the physical DA response.
2.6. Uncertainty Propagation and Robust Optimization
Conventional multi-objective optimization identifies optimal solutions under nominal design conditions. In practice, however, geometric construction deviations and variations in envelope properties may affect the performance and reliability of the selected design. Therefore, the present study introduces uncertainty propagation for six implementation-related design variables: D0, D1, D2, ASR, U, and SHGC.
The uncertainty scope is intentionally restricted to these six design variables. Weather, occupancy, internal loads, operational schedules, and model-form uncertainty are not treated as stochastic inputs in the present analysis. The severe-cold climate is represented by the fixed Urumqi weather dataset, while occupancy and internal-load conditions follow the prescribed simulation settings. Accordingly, the robustness results should be interpreted as conditional robustness under the specified design-variable uncertainty scenario rather than as comprehensive robustness to all sources of building-performance uncertainty.
Each uncertain design variable was assumed to follow an independent normal distribution around its nominal value, with perturbed samples constrained within the predefined design boundaries. The prescribed standard deviations represent moderate engineering perturbations rather than empirically calibrated probability distributions derived from long-term measurements. The variable-specific uncertainty settings are summarized in Table 5, while the Monte Carlo sampling and robust-evaluation settings are provided in Table 6.
Table 5.
Implementation-related design-variable uncertainty settings used in robust optimization.
Table 6.
Monte Carlo and boundary-treatment settings for robust optimization.
To evaluate the sensitivity of the results to the prescribed uncertainty magnitude, all input standard deviations were additionally scaled by factors of 0.5 and 1.5 while retaining the original distributional assumptions and design bounds. The scaling factors of 0.5 and 1.5 were selected as symmetric ±50% perturbations around the baseline standard-deviation scenario (1.0σ). They were intended to provide deliberately lower- and higher-uncertainty sensitivity cases of sufficient magnitude to test whether the comparative conclusions depended strongly on the prescribed uncertainty level, while keeping the probability-distribution form and feasible design bounds unchanged. These factors are therefore scenario-based sensitivity brackets rather than empirically calibrated confidence limits.
The relative performance ordering of the four representative solutions was preserved across the three uncertainty levels (0.5σ, 1.0σ, and 1.5σ), indicating that the main comparative conclusions were not driven by the exact magnitude of the prescribed perturbations.
For each candidate solution generated during the optimization process, uncertainty propagation was performed using Monte Carlo sampling. For reproducibility, the sampling procedure was initialized using a fixed random seed of 2026, and the same sampling rule was applied consistently throughout the robust evaluation. The perturbed design vector was expressed as Equation (11).
Because boundary clipping alters the effective perturbation distribution when a nominal design lies close to a prescribed design limit, the primary uncertainty model is more precisely described as Gaussian perturbation followed by boundary clipping rather than as an unbounded Gaussian distribution. To examine the sensitivity of the results to this boundary treatment, an additional analysis was conducted using independent truncated-normal perturbations with the same nominal standard deviations and predefined design bounds. Under this alternative treatment, samples outside the feasible interval were rejected and resampled rather than accumulated at the boundary. Both the deterministic and robust compromise solutions were re-evaluated using 5000 realizations under each boundary-treatment scheme, while all other surrogate-model and robust-objective settings were kept unchanged. This additional analysis was used as a sensitivity check and did not replace the boundary-clipping procedure employed in the original Robust NSGA-II optimization.
Monte Carlo convergence was evaluated using sample sizes of 250, 500, 1000, 2000, 5000, 10,000, and 50,000 realizations, with 50,000 realizations used as the reference. The key results are summarized in Table 7. At (N = 5000), the maximum relative deviations in the mean, standard deviation, and robust objective values were 0.075%, 2.05%, and 0.076%, respectively, while increasing the sample size to 10,000 changed the robust objective values by less than 0.10%. Therefore, 5000 realizations were adopted for the subsequent robust optimization. Therefore, 5000 realizations were considered sufficient to provide stable estimates of the uncertainty-adjusted objectives while maintaining computational efficiency during the iterative NSGA-II search.
where X represents the nominal design vector, X(k) denotes the kth perturbed realization, and N = 5000 represents the number of Monte Carlo realizations.
Table 7.
Monte Carlo sample-size convergence and selection criteria.
For each perturbed realization, the trained CatBoost surrogate models were used to predict the corresponding building performance indicators, DA, D-RAD, and PPD. The mean value and standard deviation of each performance objective were calculated to quantify both expected performance and performance variability:
where fi(X(k)) represents the predicted value of the ith performance objective under the kth uncertainty realization, while μi and σi represent the corresponding mean and standard deviation.
To incorporate uncertainty into the optimization process, robust objective functions were formulated by considering both the expected performance and the associated variability. For objectives that require minimization, including PPD and D-RAD, the robust formulations were defined as:
For daylight performance, where higher values indicate better performance, the robust objective was formulated as a conservative lower confidence bound:
where λ is the robustness coefficient controlling the trade-off between expected performance and uncertainty sensitivity. In this study, λ = 1.645 was adopted, corresponding to a one-sided 95% conservative confidence criterion. A larger λ value places greater emphasis on reducing performance variability, whereas λ = 0 corresponds to conventional deterministic optimization based only on mean performance. Because DA is a benefit-type performance indicator that is maximized, whereas the NSGA-II implementation adopts a unified minimization formulation, the sign of the robust DA objective was reversed only for optimization purposes. This sign transformation does not alter the physical interpretation of daylight performance. Because DA is a benefit-type performance indicator, whereas PPD and D-RAD are minimized, the daylight response was sign-reversed as YDA = -DA in the surrogate-assisted optimization framework. Accordingly, the CatBoost daylight surrogate predicts −DA. Under this transformation, μ−DA = −μDA, whereas σ−DA = σDA. Therefore, the robust daylight objective used by the minimization-based NSGA-II can be expressed as
which is mathematically equivalent to maximizing the physical robust daylight performance
For the post-optimization comparison between the deterministic and robust compromise solutions reported in Section 3.4.1, the same 5000 perturbation realizations were applied to both designs to enable a paired comparison. Monte Carlo estimation uncertainty in the differences in mean performance, standard deviation, and uncertainty-adjusted objective values was quantified using 10,000 paired bootstrap resamples. Percentile-based 95% confidence intervals were calculated for the difference between the robust and deterministic solutions. These intervals quantify uncertainty associated with the finite Monte Carlo sample and should not be interpreted as statistical confidence intervals for real-world building performance.
The sign transformation was used only as a mathematical representation of the daylight objective; all reported building-performance values were converted back to the original physical DA scale. The robust objective functions were subsequently optimized using the Non-dominated Sorting Genetic Algorithm II (NSGA-II). Unlike deterministic optimization, which searches for solutions based only on nominal simulation results, the proposed robust NSGA-II evaluates each candidate design according to its uncertainty-adjusted performance. During each evolutionary iteration, Monte Carlo-based objective evaluations were conducted using the CatBoost surrogate models, and Pareto-optimal solutions were identified through non-dominated sorting and crowding-distance preservation.
The NSGA-II optimization was implemented using Wallacei X 2.7. The optimization settings were selected to provide sufficient exploration of the six-dimensional design space while maintaining reproducibility. The detailed optimization parameters are summarized in Table 8.
Table 8.
NSGA-II optimization settings used for robust multi-objective optimization.
2.7. High-Fidelity Validation of Optimized Solutions
To assess the predictive fidelity of the surrogate models in the Pareto-optimal region, ten selected designs were re-evaluated using the calibrated Honeybee–EnergyPlus model. These included four representative solutions selected through the robust NSGA-II–TOPSIS workflow and six additional Pareto-region solutions (V1–V6) to extend the verification beyond the four decision scenarios.
The six-dimensional nominal design vector of each solution, comprising D0, D1, D2, SHGC, U, and ASR, was introduced into the calibrated Honeybee–EnergyPlus model. The resulting D-RAD, PPD, and DA values were compared with the corresponding predictions from the final CatBoost surrogate models. Following the independent train–validation–test assessment, the final models were refitted using the complete 1000-case simulation dataset with the selected hyperparameters. For daylight performance, the predicted −DA values were converted back to the original physical DA scale before comparison.
The agreement between the surrogate predictions and high-fidelity simulation results was evaluated using relative error (RE), root-mean-square error (RMSE), mean absolute error (MAE), mean bias error (MBE), mean absolute percentage error (MAPE), and the coefficient of determination (R2). Spearman rank correlation was additionally used to assess whether the relative performance ordering of the selected designs was preserved. Because the ten designs were selected from the Pareto region rather than sampled as an independent random test set, the resulting R2 values were treated as descriptive statistics. The assessment therefore focused on both pointwise prediction errors and ranking consistency.
2.8. Post-Optimization Space-Syntax Assessment
Following the environmental-performance optimization, space-syntax analysis was applied as a post-optimization screening step to compare the spatial-configuration characteristics of the selected representative solutions. Depthmap+ (Beta version 1.0)was used to evaluate connectivity, visual integration, visual step depth, spatial integration, and R2-based intelligibility indicators, as summarized in Table 9 and Table 10.
Table 9.
Experimental Independent Variable Metrics.
Table 10.
Space-Syntax-Based Spatial-Configuration Indicators.
These metrics were treated as configuration-based proxies for spatial visibility, accessibility, and intelligibility. They were not incorporated as objective functions within the Robust NSGA-II procedure and were not calibrated against occupant surveys, behavioral observations, or wayfinding experiments. Accordingly, the space-syntax assessment was used to identify spatial strengths and trade-offs among the environmentally optimized alternatives rather than to quantify actual occupant experience or to determine a universally optimal spatial solution.
Spatial configuration was assessed using three complementary space-syntax-based indicators: spatial visibility (SV), spatial accessibility (SA), and spatial comprehensibility (SC). SV characterizes the extent of unobstructed visual information available from a given location and describes the visual openness and permeability of the atrium–corridor system [31,32]. SA describes the topological ease with which different spatial units can be reached and therefore reflects configurational accessibility and movement continuity within the commercial space [33]. SC describes the correspondence between local and global spatial information and is commonly associated within the space-syntax framework with configurational intelligibility [34,35].
These indicators are used in the present study as configuration-based proxies for comparing the selected design alternatives. They are not treated as direct measurements of occupant perception, wayfinding behavior, satisfaction, or overall user experience. Validation of such relationships would require independent occupant surveys, behavioral observations, movement tracking, or wayfinding experiments.
2.9. Parameter Settings and Climate
The parametric model was configured with a building energy simulation environment and its associated architectural properties in accordance with the General Code for Energy Efficiency and Renewable Energy Application in Buildings (GB 55015-2021). To ensure that the analysis is grounded in the physical indoor environment, Ladybug and Honeybee within Grasshopper were further employed to assign material properties, define occupant and equipment loads, and specify environmental boundary conditions for the baseline model (Figure 4 and Figure 5). For the graphical presentation of the building-material parameters in Figure 5, OpenAI GPT-6, accessed via ChatGPT, was used solely to transform the authors’ original tabular data into a visual representation. The tool was not involved in generating, modifying, analyzing, or interpreting the underlying research data. The authors reviewed and verified the resulting figure against the original data to ensure its accuracy.
Figure 4.
Model Parameter Settings.
Figure 5.
Parameter Settings for Building Materials.
The operational parameters shown in Figure 4, including population density, lighting density, and fresh-air supply, were prescribed as baseline simulation inputs to provide consistent internal-load and operational conditions. During the short-term field calibration and thermal-consistency assessment, however, the outdoor thermal boundary condition was represented using the measured outdoor dry-bulb temperature recorded during the monitoring campaign. The simulated indoor temperature response under these measured outdoor-temperature conditions was then compared with the corresponding measured indoor temperature.
This approach effectively prevents the model from operating under entirely idealized assumptions, thereby more closely approximating the actual operational status of commercial complexes in reality. These meteorological inputs were held fixed throughout the uncertainty analysis and therefore define the climatic boundary condition rather than a stochastic uncertainty source.
The meteorological inputs for the building performance simulations were obtained from the Chinese Standard Weather Data (CSWD) database for Urumqi (WMO station 514630) [36]. The CSWD database, jointly developed by the China Meteorological Administration and Tsinghua University, provides typical hourly weather data specifically for building heating and cooling load calculations and energy-performance simulations. The dataset contains key meteorological variables required for building simulation, including dry-bulb temperature, relative humidity, wind conditions, and solar radiation. It also represents typical-year and extreme climatic conditions related to temperature and solar radiation [36]. The Urumqi weather data characterize the severe-cold and arid climatic conditions of the study area, with large seasonal temperature variations and abundant solar radiation, making them suitable for evaluating the thermal and solar performance of the commercial atrium building. The meteorological data used for the short-term field calibration and those used for the subsequent annual simulations should be distinguished. For the 11–15 May 2026 field campaign, the measured outdoor dry-bulb temperature was used as the actual short-term thermal boundary condition for model calibration and consistency assessment. By contrast, the Urumqi CSWD weather file was adopted as the standardized climatic boundary condition for the subsequent annual parametric simulations, dataset generation, surrogate-model development, and optimization. The CSWD dataset was therefore not used as a substitute for the measured outdoor-temperature series during the short-term field comparison; rather, it was used to ensure that all subsequent design alternatives were evaluated under identical annual climatic conditions.
3. Results
3.1. Short-Term Field Calibration and Thermal Consistency Assessment
An independent field-measurement campaign was conducted from 11 May to 15 May 2026 to calibrate the baseline parametric model of Miguli Phase II and to examine its short-term thermal-response consistency. Indoor dry-bulb temperature and relative humidity were continuously monitored at hourly intervals within representative atrium spaces, while outdoor dry-bulb temperature was recorded during the same monitoring period to characterize the actual short-term outdoor thermal boundary condition. For the field-based model assessment, the measured outdoor-temperature series was used as the climatic boundary input, and the resulting simulated indoor temperature was compared with the corresponding measured indoor temperature.
The transition-season period was intentionally selected to reduce the influence of active heating and air-conditioning operation, thereby allowing the thermal response associated with the building geometry, envelope characteristics, and surrounding indoor conditions to be examined with less interference from HVAC control. The instruments listed in Table 11 included an Elitech RC-4HC data logger (Jiangsu Jingchuang Electronics Co., Ltd., Xuzhou, China) and an AZ 88162 data logger (AZ Instrument Corp., Taichung, Taiwan, China).Temperature and humidity data loggers were used for continuous monitoring, while an additional instrument (Table 11) was employed to check measurement consistency. The monitoring points were arranged within the principal atrium and adjacent circulation zones used for the thermal-consistency assessment. Their locations were selected with reference to the spatial layout of the atrium and surrounding circulation areas so that the measurements reflected the broader thermal conditions of the monitored atrium environment rather than a single local position (Figure 6).
Table 11.
Information Table for Temperature and Humidity Measurement Instruments.
Figure 6.
Temperature Calibration in the Atrium of Miguli Phase II.
The monitoring arrangement was intended to provide representative short-term indoor thermal conditions for comparison with the corresponding Honeybee–EnergyPlus simulation results. The purpose of this field campaign was to support calibration and thermal-consistency assessment of the baseline model before parametric sampling and surrogate-model development, rather than to constitute a full seasonal validation of all performance objectives.
The model parameters were calibrated using the monitored thermal conditions on 11 May. To avoid evaluating the model solely against the same data used for calibration, 13 May was subsequently selected as an independent representative day for comparison between measured and simulated indoor temperatures. Figure 7 presents this representative-day comparison and shows that the simulated temperature profile reproduced the measured hourly variation with close agreement. The remaining deviations are attributable to the complexity of the open commercial environment, including thermal interactions with adjacent spaces and short-term occupant-related heat gains that could not be reproduced exactly in the simulation.
Figure 7.
Representative-day comparison of measured and simulated indoor temperatures at Miguli Phase II.
The use of a representative day was intended as an independent short-term consistency check after calibration, rather than as evidence that a single day can represent the complete heating- and cooling-season performance of the building.
To enhance the model’s fidelity, its accuracy was validated in accordance with ASHRAE Guideline 14-2014 [37]. The normalized mean bias error (NMBE) and the coefficient of variation in the root-mean-square error (CVRMSE) were adopted as the core quantitative metrics [38,39]; their respective formulas are presented in Equations (19) and (20). According to the guideline’s acceptance criteria, an NMBE within ±10% and a CVRMSE below 15% confirm that the simulation model closely aligns with the actual operational performance of the physical building [37].
Among them, ti, ti, represent the measured temperature, simulated temperature, and mean measured temperature, respectively. For the short-term thermal comparison, the calculated NMBE and CVRMSE were 2.357% and 2.981%, respectively, both of which were within the adopted acceptance thresholds. These results indicate satisfactory agreement between the measured and simulated indoor temperature response during the evaluated short-term period. This field-based assessment should therefore be interpreted as a calibration and thermal-consistency check of the baseline simulation model. It does not constitute direct seasonal validation of annual PPD, daylight autonomy (DA), or seasonal solar-radiation difference (D-RAD). In the subsequent parametric analysis, these performance indicators were evaluated consistently under the prescribed Urumqi weather file and identical simulation assumptions for all design alternatives. Further seasonal field measurements of thermal comfort, daylight, and solar-radiation performance would be required to independently validate their absolute annual values.
3.2. Development and Global Holdout Evaluation of the CatBoost Surrogate Model
The predictive performance of the CatBoost surrogate models was evaluated using the training, validation, and test datasets. Figure 8 presents the comparison between the predicted and Honeybee–EnergyPlus simulation reference values for the three performance indicators, including -DA, PPD, and D-RAD. The blue circles represent individual samples, the gray solid line indicates the ideal Y = X reference line, and the fitting curves describe the overall agreement between the predicted and simulation reference values.
Figure 8.
Comparison between predicted and simulated values of the CatBoost surrogate models.
As shown in Figure 8, all three CatBoost models exhibited strong agreement between predicted and Honeybee–EnergyPlus simulation reference values across different data partitions. For the -DA model, the coefficients of determination (R2) reached 0.998, 0.993, and 0.994 for the training, validation, and test datasets, respectively. Similarly, the PPD model achieved R2 values of 0.995, 0.986, and 0.990, while the D-RAD model obtained R2 values of 0.996, 0.995, and 0.990 for the corresponding datasets. These results indicate that the surrogate models can accurately capture the nonlinear relationships between the six atrium design variables and the building performance responses.
To further quantitatively evaluate the prediction accuracy, the R2, RMSE, and MAE values for each surrogate model and dataset partition are summarized in Table 12. The test-set results demonstrated that the three models maintained high predictive accuracy, with R2 values of 0.994, 0.990, and 0.990 for -DA, PPD, and D-RAD, respectively. The RMSE and MAE values remained relatively low across the test datasets, indicating small deviations between the predicted and simulated performance values.
Table 12.
Prediction performance of the CatBoost surrogate models on different datasets.
The small differences among the training, validation, and test performances indicate good global generalization across the randomly partitioned dataset, without obvious evidence of overfitting. These results support the use of the CatBoost surrogate models as computationally efficient global approximations for sensitivity analysis, uncertainty propagation, and multi-objective search. However, the global holdout statistics should not be interpreted as evidence of uniformly high predictive accuracy throughout the entire design space.
In particular, random holdout validation does not necessarily quantify local approximation errors in the Pareto-optimal region, where the surrogate models are ultimately used to support design decisions. Therefore, representative solutions obtained from the robust optimization were additionally re-evaluated using the calibrated Honeybee–EnergyPlus model, as described in Section 3.6. This local high-fidelity re-evaluation is used to complement, rather than replace, the global holdout assessment reported above.
3.3. Interpretation of Surrogate Model Using Sensitivity Analysis
3.3.1. Sobol Global Sensitivity Analysis
Before optimization, a global Sobol sensitivity analysis was conducted to quantify the contribution of each design variable to the three performance objectives. As shown in Figure 9, ASR consistently exhibits the largest first-order and total-order sensitivity indices and therefore represents the dominant contributor to global output variance across the three objectives. For most variables, the total-order indices are only moderately higher than the corresponding first-order indices, indicating that the aggregate contribution of interaction effects to the overall output variance is relatively modest at the global scale.
Figure 9.
Global sensitivity analysis.
This result should not be interpreted as evidence that interactions are absent. Rather, the Sobol analysis indicates that main effects account for most of the total variance over the full design space, while specific variable pairs may still exhibit meaningful conditional interactions within particular regions of the surrogate response surface. These pairwise effects are examined further using SHAP dependence and interaction analyses in Section 3.3.3 and Section 3.3.4.
3.3.2. SHAP Feature Importance Analysis
To complement the variance-based Sobol analysis and further interpret the prediction behavior of the surrogate models, the Shapley Additive exPlanations (SHAP) framework was employed to quantify the contribution of individual design variables to model predictions [40]. SHAP decomposes each prediction into additive feature contributions and therefore provides an interpretable means of examining both the relative importance and directional influence of the investigated design variables.
Figure 10 presents the SHAP beeswarm plots for PPD, D-RAD, and DA. In each plot, variables are ordered from top to bottom according to their mean absolute SHAP values; the horizontal position represents the contribution of a variable to the predicted response, and the colour gradient indicates the corresponding raw feature value, with blue representing lower values and red representing higher values [41].
Figure 10.
Global feature importance analysis of building performance indicators based on SHAP values. The plots were independently generated using the newly trained six-variable CatBoost surrogate models and the simulation dataset developed for the present study.
For PPD (Figure 10a), ASR is the dominant variable, followed by D1 and D2. U has a secondary influence, whereas D0 and SHGC contribute comparatively less. Higher ASR values are predominantly associated with positive SHAP contributions, indicating an increase in predicted PPD and therefore greater thermal discomfort. In contrast, higher D1 and D2 values are mainly associated with negative SHAP contributions, indicating that the atrium-to-exit geometric configuration also exerts a substantial influence on thermal-comfort predictions. Higher U-values generally shift the SHAP contribution toward positive values, consistent with an increase in thermal discomfort as skylight thermal insulation decreases. SHGC exhibits the weakest overall contribution within the evaluated design space.
For D-RAD (Figure 10b), ASR again exhibits the largest contribution, followed by D2 and D1, while D0 has a smaller but non-negligible effect. SHGC and U show comparatively limited global contributions. High ASR values are strongly associated with positive SHAP contributions, indicating a larger summer–winter solar-radiation difference as the skylight ratio increases. In contrast, higher D1 and D2 values are generally associated with negative SHAP contributions, suggesting that the spatial relationship between the atria and the mall exits modifies the distribution of seasonal solar exposure. These results indicate that D-RAD is governed not only by skylight aperture but also by atrium configuration within the investigated design space.
For DA (Figure 10c), ASR remains the most influential variable, followed by D2 and D1. D0 has a weaker secondary influence, whereas SHGC and U make relatively small contributions. After converting the SHAP contributions of the sign-reversed daylight surrogate back to the physical DA direction, higher ASR values are associated with positive SHAP contributions, confirming that a larger skylight ratio generally improves daylight availability. Conversely, increasing D1 and D2 tends to produce negative contributions to physical DA, indicating reduced daylight performance as the atrium-to-exit distances increase. This confirms that daylight performance is jointly controlled by skylight aperture and atrium geometry.
Taken together, the three beeswarm plots identify ASR as the only consistently dominant variable across all three environmental objectives. However, the secondary controlling variables differ among objectives. In particular, D1 and D2 make substantial contributions not only to daylight performance but also to PPD and D-RAD, indicating that atrium geometry plays a broader role in the surrogate-model responses than suggested by an envelope-only interpretation. U remains relevant primarily to PPD, whereas SHGC shows comparatively limited global SHAP importance within the present six-variable design domain.
3.3.3. SHAP Dependence Analysis
Whereas the beeswarm plot identifies which variables matter [41], the dependence plot in Figure 11 further illustrates how individual design variables influence the predicted performance responses across their respective design ranges. For each dependence plot, the horizontal axis represents the raw value of the investigated design variable, whereas the vertical axis denotes its SHAP contribution to the corresponding model prediction. The colour scale represents a secondary design variable and is used to reveal potential conditional or interaction effects.
Figure 11.
SHAP Dependence Plot.
For the daylight surrogate, ASR exhibits the clearest dependence pattern among the envelope-related variables. Across the investigated ASR range of approximately 0.60–0.90, the SHAP contribution to −DA generally decreases as ASR increases. Lower ASR values are predominantly associated with positive contributions to −DA, whereas higher ASR values shift the contribution toward negative values. Because the surrogate target is −DA, this trend corresponds to an increase in physical DA with increasing skylight ratio.
The dependence plots further show that daylight performance is influenced by the atrium-to-exit geometry. Increasing D1 and D2 generally shifts the SHAP contribution to −DA toward more positive values, indicating a tendency toward reduced physical DA at larger atrium-to-exit distances. Although these geometric effects are weaker than that of ASR, they demonstrate that daylight performance is jointly controlled by skylight aperture and spatial configuration.
3.3.4. SHAP Interaction Analysis
Figure 12 reports the SHAP feature-interaction matrices [41] for DA (Figure 12a), D-RAD (Figure 12b) and PPD (Figure 12c). The diagonal entries represent the main effects of individual variables, whereas the off-diagonal entries represent pairwise conditional effects within the fitted surrogate models. The interaction magnitudes are therefore interpreted comparatively among the evaluated variable pairs rather than as direct measures of their contribution to total output variance.
Figure 12.
SHAP Feature Interaction Matrix.
For DA (Figure 12a), the ASR–D2 pair exhibits the largest off-diagonal SHAP interaction among the evaluated variable pairs. This indicates that the marginal contribution of ASR to daylight performance varies with the position of Atrium 4 relative to the mall exit. A secondary interaction is observed between ASR and D1, suggesting that the daylight benefit associated with skylight ratio is partly conditioned by atrium-to-exit geometry. These effects are consistent with the dependence analysis showing that daylight performance is jointly influenced by skylight aperture and spatial configuration.
For D-RAD (Figure 12b), the largest pairwise SHAP interaction is observed between ASR and SHGC. This relationship is physically plausible because the effect of skylight area on solar-radiation balance depends on the solar-transmission characteristics of the glazing. A secondary ASR–U interaction indicates that the thermal effect associated with skylight ratio also varies with the heat-transfer coefficient of the skylight. These interactions represent conditional modulation within the surrogate response rather than evidence that interaction effects dominate the total output variance.
For PPD (Figure 12c), the ASR–SHGC pair similarly shows the largest pairwise interaction signal, while the ASR–U interaction represents a secondary conditional relationship. These patterns indicate that the thermal-comfort effect of skylight ratio depends partly on the optical and thermal properties of the skylight system. Weaker interaction signals among the geometric distance variables suggest additional local couplings, although their overall contribution is smaller than that of the skylight-related parameters.
The Sobol and SHAP interaction results therefore provide complementary rather than contradictory information. Sobol analysis evaluates the contribution of interaction effects to the total output variance over the entire design domain; the relatively small differences between first-order and total-order indices indicate that main effects explain most of the global variance. In contrast, SHAP interaction analysis identifies which specific variable pairs exhibit the strongest conditional dependence within the fitted surrogate model. Consequently, an interaction such as ASR–SHGC or ASR–D2 can be the largest pairwise SHAP interaction while still accounting for only a modest fraction of the total global variance.
Taken together, the Sobol and SHAP results consistently identify ASR as the principal design variable across the three environmental responses. The SHAP analyses further show that the atrium-to-exit geometric variables, particularly D1 and D2, provide important secondary contributions and conditional interactions for PPD, D-RAD, and DA. Thus, the present results do not support a simple separation in which thermal-radiative responses are governed only by envelope parameters while daylight is governed by geometry. Instead, the surrogate models indicate coupled effects between skylight aperture and atrium configuration, with the relative importance and interaction structure varying among the three performance objectives. Sobol indices describe the contribution of these effects to global output variance, whereas SHAP provides complementary information on prediction direction, local dependence, and pairwise conditional effects.
3.4. Robust Multi-Objective Optimization
3.4.1. Comparison Between Deterministic and Robust Optimization
To examine how the prescribed implementation-related design-variable uncertainty affects design selection, the deterministic and robust compromise solutions were compared in terms of both design configuration and uncertainty-dependent performance.
As shown in Table 13, incorporating uncertainty changed the preferred design configuration rather than merely modifying the objective values. D0 and D1 decreased from 5.688 m and 31.345 m to 5.434 m and 29.217 m, respectively, while D2 increased slightly from 36.535 m to 37.042 m. The envelope-related variables also shifted toward lower values, with SHGC decreasing from 0.2743 to 0.2501, U from 1.5050 to 1.5009 W/(m2·K), and ASR from 0.6289 to 0.6001. These changes indicate that the prescribed design-variable uncertainty altered the preferred region of the design space, particularly for the skylight-related parameters.
Table 13.
Comparison of design variables between the deterministic and robust compromise solutions.
Table 14 compares the two compromise solutions using the same 5000 Monte Carlo perturbation realizations. Their mean performances remained broadly comparable. Relative to the deterministic compromise solution, the robust solution increased mean DA from 44.2234 to 44.6907 (+1.06%), decreased mean D-RAD from 11.7301 to 11.6955 (−0.29%), and increased mean PPD from 10.4014 to 10.4469 (+0.44%).
Table 14.
Uncertainty-based performance comparison between deterministic and robust compromise solutions with paired-bootstrap confidence intervals.
The standard deviations of DA, D-RAD, and PPD decreased by 35.63%, 70.88%, and 9.52%, respectively. However, because performance variability is explicitly included in the robust objective formulation, these reductions are an expected consequence of penalizing variability and should not, by themselves, be interpreted as independent evidence that the robust solution is superior.
The uncertainty-adjusted objectives provide a more informative description of the resulting multi-objective trade-off. Robust DA increased from 42.8800 to 43.8260, corresponding to an improvement of approximately 2.21%, while robust D-RAD decreased from 12.8016 to 12.0076, corresponding to an improvement of approximately 6.20%. In contrast, the robust PPD objective increased from 10.6031 to 10.6294 (+0.25%). Because PPD is minimized, this represents a marginal deterioration rather than an improvement. Thus, the robust solution does not simultaneously improve all three objectives; instead, it provides improved uncertainty-adjusted daylight and solar-radiation performance at the cost of a small deterioration in the PPD objective.
Paired-bootstrap analysis based on 10,000 resamples yielded 95% confidence intervals of [0.9079, 0.9852] for the difference in robust DA, [−0.8307, −0.7584] for robust D-RAD, and [0.0206, 0.0319] for robust PPD. These intervals quantify the numerical uncertainty associated with the finite Monte Carlo sample rather than statistical uncertainty in real-world building performance.
The proximity of SHGC, U, and ASR to their prescribed lower bounds indicates that these constraints are active in defining the selected robust design. Under the original 5000-realization clipping procedure, approximately 48.88%, 50.00%, and 49.74% of the perturbed SHGC, U, and ASR samples, respectively, reached the corresponding lower bounds. The effective perturbation distributions of these variables are therefore asymmetric and should not be interpreted as unconstrained Gaussian distributions.
A boundary-treatment sensitivity analysis was consequently performed using truncated-normal sampling within the same feasible ranges. For the robust compromise solution, changing from clipping to truncated-normal sampling changed the uncertainty-adjusted DA, D-RAD, and PPD objectives from 43.8260, 12.0076, and 10.6294 to 43.7082, 12.0012, and 10.7039, respectively, corresponding to changes of −0.27%, −0.05%, and +0.70%. More importantly, the comparative conclusions between the deterministic and robust compromise solutions were preserved: under truncated-normal sampling, robust DA improved by 2.04%, robust D-RAD improved by 6.37%, and robust PPD deteriorated marginally by 0.35%. The standard deviations were more sensitive to boundary treatment than the uncertainty-adjusted objectives, confirming that the exact variability estimates are conditional on the adopted boundary-handling method. Nevertheless, the direction of the principal multi-objective trade-offs remained unchanged.
Overall, the main effect of introducing the prescribed design-variable uncertainty is therefore interpreted as a shift in the preferred design configuration and in the balance among competing objectives, rather than as a simultaneous improvement in all performance indicators. The robust formulation preserved broadly comparable mean performance while favoring solutions with improved uncertainty-adjusted DA and D-RAD performance and accepting a marginal trade-off in PPD.
3.4.2. Robust Pareto Front Analysis
To evaluate the effect of the prescribed design-variable uncertainty on multi-objective optimization, the performance characteristics of deterministic NSGA-II and Robust NSGA-II solutions were compared in terms of both expected performance and variability. Unlike deterministic optimization, which searches for optimal solutions under nominal design conditions, the robust formulation accounts for performance fluctuations caused by the prescribed perturbations of the six design variables. Therefore, the comparison considers both the mean values of PPD, D-RAD, and DA and their variability under the specified uncertainty model.
As shown in Figure 13, the deterministic and robust solutions exhibited similar mean performance levels for the three objectives, indicating that incorporating design-variable robustness did not substantially compromise expected environmental performance. However, the robust solutions showed lower variability in PPD, D-RAD, and DA under the prescribed design-variable perturbations. Because variability is explicitly penalized in the robust objective formulation, this reduction is interpreted as a characteristic of the optimization criterion rather than as independent evidence of superiority. These results indicate reduced sensitivity of the selected solutions to the implementation-related variations represented in the present uncertainty model.
Figure 13.
Deterministic vs. Robust Solutions.
Figure 14 further compares the Pareto fronts generated by deterministic NSGA-II and Robust NSGA-II. Both algorithms identified continuous non-dominated solution sets, demonstrating the trade-offs among thermal discomfort, daylight availability, and seasonal solar-radiation difference. Compared with the deterministic Pareto front, the robust Pareto front shifted toward a more conservative region associated with improved stability under the prescribed design-variable uncertainty scenario.
Figure 14.
Comparison of Pareto fronts obtained by deterministic NSGA-II and Robust NSGA-II.
Based on the robust Pareto front, representative solutions corresponding to different optimization preferences were further identified, including DA-preferred, D-RAD-preferred, and PPD-preferred schemes. TOPSIS was subsequently applied to select the compromise solution considering the comprehensive performance of all objectives. As illustrated in Figure 15, the selected solution is located within the central region of the robust Pareto front rather than at any extreme objective point, indicating a balanced compromise among thermal comfort, daylight performance, and solar radiation regulation.
Figure 15.
Representative solutions and the TOPSIS-selected compromise solution on the robust Pareto front.
Overall, the robust Pareto analysis demonstrates that the proposed optimization framework can achieve a balance between environmental performance and uncertainty resistance. The obtained robust solutions provide greater practical applicability than deterministic optima and provide a basis for the subsequent spatial-configuration assessment.
3.5. TOPSIS-Based Selection of Representative Pareto-Optimal Solutions
Although NSGA-II can generate a set of Pareto-optimal solutions, it does not directly identify a unique design alternative suitable for practical implementation. Since all Pareto solutions are non-dominated, a further multi-criteria decision-making (MCDM) procedure is required to determine representative solutions under different design preferences. Therefore, the Technique for Order Preference by Similarity to Ideal Solution (TOPSIS) was adopted to comprehensively evaluate and rank the Pareto-optimal solutions.
TOPSIS assumes that the optimal solution should simultaneously have the shortest distance from the positive ideal solution and the largest distance from the negative ideal solution. Compared with simple weighted summation methods, TOPSIS fully considers the relative distance between each candidate solution and the ideal solution, making it particularly suitable for multi-objective optimization problems involving conflicting performance indicators.
In this study, the robust optimization results generated by NSGA-II were used as the decision matrix. Three robust performance indicators were selected as evaluation criteria, namely the robust summer–winter solar radiation difference (D-RAD), the robust predicted percentage of dissatisfied (PPD), and the robust daylight autonomy (DA). According to the optimization objectives defined in this study, D-RAD and PPD were treated as cost-type criteria to be minimized, whereas DA was treated as a benefit-type criterion to be maximized.
The decision matrix is expressed as
where m denotes the number of Pareto solutions and n = 3 represents the number of evaluation criteria.
To eliminate the influence of different dimensions among indicators, vector normalization was first performed:
The normalized decision matrix was then multiplied by the weighting vector to obtain the weighted normalized matrix:
where wj represents the weight assigned to the jth criterion and satisfies
3.5.1. Decision Preference Scenarios
To investigate different design priorities, four weighting scenarios were considered (Table 15):
Table 15.
TOPSIS weighting scenarios under different decision preferences.
Considering the optimization direction of each criterion, the positive ideal solution and the negative ideal solution are respectively defined as
The Euclidean distances from each solution to the positive and negative ideal solutions were calculated as
Finally, the relative closeness coefficient of each solution was obtained as
where . A larger Ci indicates that the corresponding solution is closer to the positive ideal solution and therefore exhibits better comprehensive performance. To obtain representative solutions with distinct design characteristics, an exclusivity strategy was further introduced after TOPSIS ranking. The highest-ranked solution was first assigned to the D-RAD-oriented category. Subsequently, if the highest-ranked solution under another preference category had already been selected, it was excluded from further consideration, and the next highest-ranked solution was chosen. This strategy avoids repeatedly selecting the same Pareto solution under different weighting scenarios while preserving the original TOPSIS ranking results. Consequently, representative solutions corresponding to D-RAD-oriented, PPD-oriented, DA-oriented, and balanced preferences were obtained for subsequent spatial syntax analysis and comprehensive performance comparison.
3.5.2. Representative Solution Selection
To facilitate practical decision making, the Pareto-optimal solution set obtained by the robust NSGA-II algorithm was further evaluated using the TOPSIS method under four decision preference scenarios, namely D-RAD preference, PPD preference, DA preference, and balanced preference. The representative solutions selected under each preference are summarized in Table 16. The TOPSIS proximity coefficients indicate that different decision preferences lead to different representative solutions, reflecting distinct trade-offs among the three optimization objectives.
Table 16.
Representative Pareto-optimal solutions selected by TOPSIS under different decision preferences.
3.5.3. Comparative Analysis of Representative Solutions
Table 17 further compares the selected solutions from three perspectives. Table 17 shows the objective performance distribution of the representative solutions. The initial proposal exhibits relatively balanced performance across all objectives, whereas the TOPSIS-selected solutions shift toward the objective emphasized by the corresponding decision preference. Specifically, the DA-preference solution achieves the highest DA robustness, while the D-RAD- and PPD-preference solutions prioritize their respective objectives. The balanced solution provides a compromise among the three objectives.
Table 17.
Comparison of representative Pareto-optimal solutions selected by TOPSIS.
Table 17 quantitatively compares the performance changes in the representative solutions relative to the initial proposal. The DA-preference solution achieves the largest improvement in DA robustness (+61.22%), while maintaining the smallest reduction in D-RAD robustness (−18.30%). In contrast, the D-RAD-preference and PPD-preference solutions exhibit only marginal gains in their preferred objectives but experience considerable reductions in the remaining objectives, highlighting the inherent trade-offs among D-RAD, PPD, and DA robustness. The balanced solution moderately improves DA robustness (+9.82%) while maintaining a relatively balanced overall performance.
The corresponding simulation results shown in Table 17 demonstrate that the representative solutions produce distinct aperture layouts consistent with their optimization priorities. These results confirm that the proposed TOPSIS-based decision-making framework effectively identifies representative Pareto-optimal solutions tailored to different engineering preferences.
3.6. High-Fidelity Re-Evaluation of Pareto-Region Solutions
To assess the local predictive fidelity of the surrogate models in the optimization region, ten selected designs were re-evaluated using the calibrated Honeybee–EnergyPlus model. These comprised the four representative solutions selected under the D-RAD-preference, PPD-preference, DA-preference, and balanced scenarios, together with six additional Pareto-region designs (V1–V6). The nominal CatBoost predictions were compared with the corresponding high-fidelity simulation results. For daylight performance, the predicted −DA values were converted back to physical DA values before comparison.
Table 18 shows that the agreement between CatBoost and EnergyPlus varied across the three performance indicators. Across the ten designs, relative errors ranged from 1.42% to 17.25% for D-RAD, from 1.12% to 6.06% for PPD, and from 0.05% to 15.67% for DA. The corresponding MAPE values were 10.81%, 2.82%, and 6.06%, respectively. These results indicate that local prediction errors in the Pareto region can be appreciable, particularly for D-RAD and DA. Therefore, the high global holdout R2 values reported in Figure 8 and Table 12 should not be interpreted as evidence of uniformly high predictive accuracy throughout the optimized design region.
Table 18.
High-fidelity re-evaluation of nominal performance at ten representative Pareto-region designs.
These findings support the use of CatBoost as a computationally efficient tool for surrogate-assisted search and comparative screening, but they do not establish that every predicted Pareto solution is quantitatively reliable. The ten designs were selected for targeted high-fidelity re-evaluation rather than as an independent random test set; accordingly, the R2 values in Table 19 are descriptive. Moreover, the nominal design-point checks do not independently validate the full Monte Carlo uncertainty distributions. High-fidelity simulation therefore remains necessary when verifying final candidate designs, and the reported robust-optimality conclusions should be interpreted within the prescribed design-variable uncertainty scenario.
Table 19.
Summary statistics of CatBoost–EnergyPlus agreement for the representative optimized solutions.
Table 19 further summarizes the agreement across the ten designs. The coefficients of determination were 0.920 for D-RAD, 0.951 for PPD, and 0.925 for DA. However, the Spearman rank correlations were 0.988, 1.000, and 1.000, respectively. Thus, the relative ordering of the ten designs was fully preserved for PPD and DA and was nearly preserved for D-RAD, with one local rank reversal. This distinction indicates that the surrogate models retained strong comparative ranking capability within the evaluated set, despite non-negligible errors in some absolute predictions.
3.7. Spatial Syntax-Based Evaluation of the Selected Solutions
Based on the representative solutions obtained from the multi-objective optimization process, spatial syntax analysis was further conducted to evaluate whether the environmentally optimized schemes could simultaneously support high-quality pedestrian experience. Four centroid solutions representing different optimization preferences were selected from the Pareto solution clusters of Miguli Phase II, and Depthmap was employed to quantify spatial visibility, accessibility, and intelligibility.
Unlike the previous environmental performance evaluation, which focused on thermal comfort, daylight availability, and solar radiation balance, spatial syntax analysis provides an additional perspective on how optimized spatial configurations influence pedestrian perception and movement behavior. The final scheme was therefore determined by comprehensively considering visual openness, movement accessibility, and spatial cognition.
3.7.1. Spatial Visibility Analysis
The spatial visibility of the optimized schemes was evaluated using visibility graph analysis, including connectivity, visual integration, and visual step depth. The results demonstrate that the four optimized solutions exhibited comparable overall spatial structures, but significant differences existed in local visual accessibility and information distribution.
Among the evaluated schemes (Table 20 and Table 21), the DA-preference solution presented the strongest visual performance, with the highest average connectivity value (7050.4) and visual integration value (9.27), indicating that more spatial units could be visually perceived and connected within the atrium–corridor system. In comparison, the D-RAD-preference solution and PPD-preference solution achieved slightly lower visual integration values of 9.21 and 9.09, respectively, suggesting weaker visual continuity in certain peripheral areas.
Table 20.
Quantification of Field of View for Each Scenario.
Table 21.
Summary of space syntax visualization results for visibility graph and axial integration analyses.
The visibility heatmaps further revealed that the DA-preference solution generated more continuous high-integration regions around the atrium spaces, indicating greater visual continuity and stronger configurational connectivity within the atrium–corridor system. Conversely, the lower integration regions observed in the PPD-preference solution indicated areas of lower configurational visual continuity within the analyzed spatial network.
In terms of visual step depth, all four solutions exhibited a minimum value of 0. The DA-preference solution showed a mean visual step depth of 2.56, compared with 2.57, 2.60, and 2.58 for the D-RAD-preference, PPD-preference, and Balanced solutions, respectively. The small differences among the four solutions indicate broadly comparable visual-depth characteristics across the optimized layouts. Combined with its higher average connectivity and visual integration, the DA-preference solution exhibited favorable overall spatial visibility.
3.7.2. Spatial Accessibility Analysis
SA was evaluated through axial analysis using spatial integration as the primary indicator. Spatial integration reflects the degree to which a spatial element is connected within the overall configuration and is closely associated with pedestrian movement potential.
The results indicate that the DA-preference solution (Table 21) achieved the highest average spatial integration value (3.06) and maximum value (5.17) among the evaluated solutions, demonstrating the strongest global accessibility. D-RAD-preference solution showed relatively lower accessibility, with an average integration value of 2.86, while the PPD-preference solution achieved an intermediate level of 2.99.
The axial maps further demonstrate that the DA-preference solution formed a continuous high-integration circulation structure connecting major atrium spaces and commercial corridors. This configuration indicates a more globally integrated circulation structure within the space-syntax model.
By contrast, the D-RAD-preference solution exhibited fragmented high-integration areas, indicating weaker spatial continuity. Although the PPD-preference solution improved certain local accessibility conditions, its global circulation efficiency remained inferior to the DA-preference solution. Consequently, the DA-preference solution exhibited the highest configurational accessibility among the four evaluated solutions.
3.7.3. Analysis of Spatial Comprehensibility
Spatial intelligibility was assessed from the linear relationship between local and global configurational measures, expressed by the coefficient of determination (R2). Within the space-syntax framework, a higher (R2) indicates a stronger correspondence between locally available spatial information and the broader spatial configuration. In statistical terms, (R2) indicates the proportion of variation in the global configurational measure that is accounted for by its linear relationship with the corresponding local measure. In the present study, it is therefore used as a comparative descriptor of configurational intelligibility rather than as a direct measure of occupant cognition or wayfinding performance.
For the visibility-based analysis in Figure 16, the (R2) values ranged from 0.6008 to 0.6799. The PPD-preference solution showed the highest value ((R2 = 0.6799)), followed by the Balanced (R2 = 0.6277), DA-preference (R2 = 0.6145), and D-RAD-preference (R2 = 0.6008) solutions. These values indicate that approximately 60–68% of the variation in the corresponding global configurational measure is associated with its linear relationship with the local measure. More importantly, the relatively narrow range among the four solutions indicates that their visibility-based configurational intelligibility is broadly comparable, with only a modest advantage for the PPD-preference solution.
Figure 16.
Visibility-based configurational intelligibility of the representative solutions assessed using local–global spatial relationships.
A different pattern is observed in the axial-based analysis in Figure 17. The D-RAD-preference solution exhibited a substantially higher (R2) value of 0.7420, indicating a comparatively strong local–global configurational correspondence. By contrast, the DA-preference solution showed (R2 = 0.3990), while the PPD-preference and Balanced solutions showed considerably lower values of 0.2731 and 0.2282, respectively. Thus, the linear local–global relationship is much more pronounced in the D-RAD-preference configuration, whereas the lower (R2) values of the other solutions indicate that local connectivity provides a more limited representation of their global axial configuration.
Figure 17.
Axial-based configurational intelligibility of the representative solutions assessed using local–global spatial relationships.
The contrast between Figure 16 and Figure 17 also shows that configurational intelligibility is sensitive to the spatial representation being examined. A solution that performs relatively well in the visibility-based representation does not necessarily exhibit the same advantage in the axial-based representation. Therefore, the (R2) values should be interpreted comparatively within each analytical representation rather than as a universal measure of spatial quality.
Because these relationships were not independently validated against occupant surveys, wayfinding experiments, or behavioral observations, the reported (R2) values are interpreted only as space-syntax-based configurational descriptors. They are therefore considered together with visibility and accessibility indicators in the subsequent post-optimization comparison rather than being treated as direct measures of user experience.
3.7.4. Comparative Screening of Spatial-Configuration Performance
The comparative analysis indicates that no single representative solution simultaneously dominates all spatial-syntax indicators. Instead, the four environmentally optimized solutions exhibit different advantages across visibility, accessibility, and configurational intelligibility.
The DA-preference solution showed the strongest overall performance in several visibility and accessibility indicators, including average connectivity, visual integration, and spatial integration. It can therefore be regarded as a favorable candidate when spatial visibility and global configurational accessibility are prioritized. However, it did not achieve the highest intelligibility under either representation. The PPD-preference solution achieved the highest visibility-based intelligibility (R2 = 0.6799), whereas the D-RAD-preference solution achieved the highest axial-based intelligibility (R2 = 0.7420). Consequently, identifying the DA-preference solution as a universally optimal spatial solution would require an a priori preference for visibility and accessibility over intelligibility, which was not independently established in the present study.
Accordingly, no single solution is designated as the overall optimum in spatial-configuration terms. The space-syntax results are instead used as a complementary post-optimization screening tool to reveal spatial trade-offs among the environmentally optimized alternatives. The preferred solution may therefore depend on the spatial criterion emphasized in a particular design context. Further occupant-based studies, including perception surveys, wayfinding observations, or movement tracking, would be required to validate the relationship between the present configuration-based proxies and actual user experience and to establish empirically supported weights for integrated environmental–spatial decision-making.
4. Conclusions
This study does not re-establish the deterministic surrogate-assisted optimization framework developed in our previous work; rather, it examines whether nominally optimized multi-atrium designs remain reliable when explicitly prescribed design-variable uncertainty is introduced. Using the Miguli Phase II commercial complex in Urumqi as the case study, the main conclusions are as follows.
(1) Incorporating the prescribed design-variable uncertainty changed the preferred design configuration while largely preserving mean environmental performance. The uncertainty-adjusted DA and D-RAD objectives improved by approximately 2.21% and 6.20%, respectively, whereas the PPD objective deteriorated marginally by approximately 0.25%. The reductions in performance variability are interpreted as an expected consequence of the variability-penalized objective formulation rather than as independent evidence of superiority. These results indicate that uncertainty-aware optimization changes both the preferred design region and the balance among competing performance objectives.
(2) Different environmental objectives are governed by different design mechanisms. Although main effects dominate the global variance according to Sobol analysis, SHAP interaction analysis indicates that selected parameter pairs condition the magnitude of these effects locally. Thermal discomfort and seasonal solar-radiation balance are mainly influenced by skylight-related parameters, particularly ASR, SHGC, and U-value, whereas daylight performance is jointly affected by skylight ratio and atrium-to-exit geometry. These results support differentiated parameter priorities for thermal, radiative, and daylight design.
(3) Environmental robustness and spatial-configuration quality are not equivalent. The representative solutions showed different advantages in spatial visibility, accessibility, and intelligibility, and no single solution dominated all space-syntax indicators. Therefore, space-syntax analysis is more appropriately used as a complementary post-optimization screening tool rather than as a direct measure of user experience.
(4) For multi-atrium commercial buildings in severe cold regions, design decision-making should consider both robustness under prescribed design-variable uncertainty and spatial applicability. The proposed workflow therefore extends the design objective from identifying a nominally high-performing solution toward selecting solutions that remain reliable under the specified implementation-related uncertainty while maintaining acceptable spatial-configuration characteristics.
The reported robustness is conditional on the prescribed uncertainty distributions for the six design variables and should not be interpreted as comprehensive robustness to all sources of building-performance uncertainty. Weather variability, occupancy, internal loads, operational schedules, and model-form uncertainty were not propagated in the present study; the severe-cold climate was treated as a fixed environmental boundary condition. Seasonal field measurements covering heating and cooling periods should also be conducted to further validate the absolute PPD, daylight, and solar-radiation responses of the simulation model. Because several envelope variables in the selected robust solution lie close to their prescribed lower bounds, the exact variability estimates and preferred design region are also conditional on the adopted feasible ranges and boundary-handling method. A truncated-normal sensitivity check preserved the main comparative objective trade-offs, although the resulting variance estimates showed greater sensitivity to boundary treatment. Future research should extend the framework to multi-source uncertainty using measured construction tolerances, stochastic operational data, and multi-year or climate-ensemble weather inputs, while further validating optimized solutions through post-implementation monitoring and applications to different building types and climatic regions.
Author Contributions
Conceptualization, H.X., B.L. and T.F.; methodology, H.X.; software, H.X.; validation, H.X. and N.T.; formal analysis, H.X.; investigation, H.X. and N.T.; resources, B.L. and T.F.; data curation, H.X. and N.T.; writing—original draft preparation, H.X.; writing—review and editing, B.L., T.F. and N.T.; visualization, H.X.; supervision, B.L. and T.F.; project administration, B.L. and T.F. All authors have read and agreed to the published version of the manuscript.
Funding
This work was supported by the National Natural Science Foundation of China (Grant No. 52668020) and the Natural Science Foundation of Xinjiang Uygur Autonomous Region (Grant No. 2025D01C12).
Data Availability Statement
Data will be made available on request.
Acknowledgments
During the preparation of this manuscript, the authors used OpenAI GPT-6, accessed via ChatGPT, for the graphical visualization of author-provided tabular data in Figure 5. The authors reviewed and verified the generated output against the original data and take full responsibility for the accuracy and integrity of the figure and the content of this publication.
Conflicts of Interest
The authors declare no conflicts of interest.
Abbreviations
The following abbreviations are used in this manuscript:
| SV | Spatial Visibility |
| SA | Spatial Accessibility |
| SC | Spatial Comprehensibility |
| PPD | Predicted Percentage of Dissatisfied |
| D-RAD | Difference between summer and winter solar radiation gains |
| DA | Daylight Autonomy |
| D0 | Distance between adjacent atriums |
| D1 | Distance from the boundary of Atrium 1 to the mall exit |
| D2 | Distance from the boundary of Atrium 4 to the mall exit |
| ASR | Atrium Skylight Ratio |
| U | Thermal transmittance of the skylight |
| SHGC | Solar Heat Gain Coefficient of the skylight |
References
- Hung, W.; Chow, W.K. A review on architectural aspects of atrium buildings. Archit. Sci. Rev. 2001, 44, 285–295. [Google Scholar] [CrossRef] [Scilit]
- Pérez-Lombard, L.; Ortiz, J.; Pout, C. A review on buildings energy consumption information. Energy Build. 2008, 40, 394–398. [Google Scholar] [CrossRef] [Scilit]
- Fan, Z.; Zehui, Y.; Liu, Y. Daylight performance assessment of atrium skylight with integrated semi-transparent photovoltaic for different climate zones in China. Build. Environ. 2021, 190, 107299. [Google Scholar] [CrossRef] [Scilit]
- Xu, H.; Wang, M.; Liu, Y. Research on collaborative optimization design of light and thermal environment in multi-atrium commercial buildings in severe cold regions—A case study of Urumqi. Appl. Therm. Eng. 2026, 303, 132341. [Google Scholar] [CrossRef] [Scilit]
- Xu, H.; Fan, T.; Wang, M.; Li, B. A Sustainable Design Optimization of Atrium Spaces in Commercial Complexes for Enhanced Photothermal Comfort and Energy Efficiency in Severe Cold Regions. Sustainability 2025, 17, 10818. [Google Scholar] [CrossRef] [Scilit]
- Pan, Y.; Zhu, M.; Lv, Y.; Yang, Y.; Liang, Y.; Yin, R.; Yang, Y.; Jia, X.; Wang, X.; Zeng, F.; et al. Building energy simulation and its application for building performance optimization: A review of methods, tools, and case studies. Adv. Appl. Energy 2023, 10, 100135. [Google Scholar] [CrossRef] [Scilit]
- Harshalatha; Patil, S.; Kini, P.G. A review on simulation based multi-objective optimization of space layout design parameters on building energy performance. J. Build. Pathol. Rehabil. 2024, 9, 69. [Google Scholar] [CrossRef] [Scilit]
- Cruz, A.S.; Caldas, L.R.; Mendes, V.M.; Mendes, J.C.; Bastos, L.E.G. Multi-objective optimization based on surrogate models for sustainable building design: A systematic literature review. Build. Environ. 2024, 266, 112147. [Google Scholar] [CrossRef] [Scilit]
- Pan, Y.; Li, Y.; Huang, Z.; Wu, G. Study on simulation methods of atrium building cooling load in hot and humid regions. Energy Build. 2010, 42, 1654–1660. [Google Scholar] [CrossRef] [Scilit]
- Baharvand, M.; Bin Ahmad, M.H.; Safikhan, T.; Mirmomtaz, S.M.M. Thermal Performance of Tropical Atrium. Environ. Clim. Technol. 2013, 12, 34–40. [Google Scholar] [CrossRef] [Scilit]
- Hussain, S.; Oosthuizen, P.H. Numerical investigations of buoyancy-driven natural ventilation in a simple three-storey atrium building and thermal comfort evaluation. Appl. Therm. Eng. 2013, 57, 133–146. [Google Scholar] [CrossRef] [Scilit]
- Su, M.; Jie, P.; Zhu, S.; Li, P.; Gao, N.; Causone, F.; Wu, X.; Yang, X.; Shi, X. Evaluating the thermal environment of a large atrium in an office building using computational fluid dynamics. J. Build. Eng. 2025, 100, 111754. [Google Scholar] [CrossRef] [Scilit]
- Gou, W.; Saierjiang, H.; Shang, J.; Yang, M.; Zhang, T. Multi-objective optimization design of traditional soil dwelling renovation based on analytic hierarchy process—Quality function deployment—Non-dominated sorting genetic algorithm II: Case study in Tuyugou Village in Turpan, Xinjiang. Buildings 2024, 14, 3584. [Google Scholar] [CrossRef] [Scilit]
- Nguyen, A.-T.; Reiter, S.; Rigo, P. A review on simulation-based optimization methods applied to building performance analysis. Appl. Energy 2014, 113, 1043–1058. [Google Scholar] [CrossRef] [Scilit]
- Tuluxun, N.; Halike, S.; Liu, H.; Yelaixi, B.; Ailaitijiang, K. Climate adaptation of folk house envelopes in Xinjiang arid region: Evaluation and multi-objective optimization from historical to future climates. Buildings 2025, 15, 1240. [Google Scholar]
- Araújo, G.R.; Gomes, R.; Gomes, M.G.; Guedes, M.C.; Ferrão, P. Surrogate Models for Efficient Multi-Objective Optimization of Building Performance. Energies 2023, 16, 4030. [Google Scholar] [CrossRef] [Scilit]
- Ali, A.; Jayaraman, R.; Mayyas, A.; Alaifan, B.; Azar, E. Machine learning as a surrogate to building performance simulation: Predicting energy consumption under different operational settings. Energy Build. 2023, 286, 112940. [Google Scholar] [CrossRef] [Scilit]
- Shen, Y.; Pan, Y. BIM-supported automatic energy performance analysis for green building design using explainable machine learning and multi-objective optimization. Appl. Energy 2023, 333, 120575. [Google Scholar] [CrossRef] [Scilit]
- Lu, S.; Wang, C.; Fan, Y.; Lin, B. Robustness of building energy optimization with uncertainties using deterministic and stochastic methods: Analysis of two forms. Build. Environ. 2021, 205, 108185. [Google Scholar] [CrossRef] [Scilit]
- Bafna, S. Space Syntax. Environ. Behav. 2003, 35, 17–29. [Google Scholar] [CrossRef] [Scilit]
- Sharmin, S.; Kamruzzaman, M. Meta-analysis of the relationships between space syntax measures and pedestrian movement. Transp. Rev. 2018, 38, 524–550. [Google Scholar] [CrossRef] [Scilit]
- Fan, P.Y.; Chun, K.P.; Mijic, A.; Tan, M.L.; Liu, M.S.; Yetemen, O. A framework to evaluate the accessibility, visibility, and intelligibility of green-blue spaces (GBSs) related to pedestrian movement. Urban For. Urban Green. 2022, 69, 127494. [Google Scholar] [CrossRef] [Scilit]
- Du, X.; Bokel, R.; van den Dobbelsteen, A. Using spatial indicators to predict ventilation and energy performance-correlation analysis for an apartment building in five Chinese cities. Front. Archit. Res. 2019, 8, 175–190. [Google Scholar] [CrossRef] [Scilit]
- Tarabieh, K.; Nassar, K.; Abdelrahman, M.; Mashaly, I. Statics of space syntax: Analysis of daylighting. Front. Archit. Res. 2019, 8, 311–318. [Google Scholar] [CrossRef] [Scilit]
- Evaluation the Impact of Spatial Configuration on Socio-Economic Parameters in Emerging Shopping Centers. Case study of Ritaj Mall in Constantine, Algeria. Int. J. Built Environ. Sustain. 2022, 9, 19–33. [Google Scholar] [CrossRef] [Scilit]
- Fanger, P.; Ipsen, B.; Langkilde, G.; Olessen, B.; Christensen, N.; Tanabe, S. Comfort limits for asymmetric thermal radiation. Energy Build. 1985, 8, 225–236. [Google Scholar] [CrossRef] [Scilit]
- Fanger, P.O. Thermal Comfort. Analysis and Applications in Environmental Engineering; Danish Technical Press: Copenhagen, Denmark, 1970. [Google Scholar]
- Reinhart, C.F.; Walkenhorst, O. Validation of dynamic RADIANCE-based daylight simulations for a test office with external blinds. Energy Build. 2001, 33, 683–697. [Google Scholar] [CrossRef] [Scilit]
- Reinhart, C.F.; Mardaljevic, J.; Rogers, Z. Dynamic daylight performance metrics for sustainable building design. Leukos 2006, 3, 7–31. [Google Scholar] [CrossRef] [Scilit]
- Lm, I. Approved Method: IES Spatial Daylight Autonomy (sDA) and Annual Sunlight Exposure (ASE). Illuminating Engineering Society. 2012. Available online: https://ies.org/individual-standards/ (accessed on 31 October 2026).
- Benedikt, M.L. To take hold of space: Isovists and isovist fields. Environ. Plan. B Plan. Des. 1979, 6, 47–65. [Google Scholar] [CrossRef] [Scilit]
- Turner, A.; Doxa, M.; O’sullivan, D.; Penn, A. From isovists to visibility graphs: A methodology for the analysis of architectural space. Environ. Plan. B Plan. Des. 2001, 28, 103–121. [Google Scholar] [CrossRef] [Scilit]
- Hillier, B.; Hanson, J. The Social Logic of Space; Cambridge University Press: Cambridge, UK, 1989. [Google Scholar]
- Hillier, B. Space is the Machine: A Configurational Theory of Architecture; Space Syntax: London, UK, 2007. [Google Scholar]
- Hillier, B.; Penn, A.; Hanson, J.; Grajewski, T.; Xu, J. Natural movement: Or, configuration and attraction in urban pedestrian movement. Environ. Plan. B Plan. Des. 1993, 20, 29–66. [Google Scholar] [CrossRef] [Scilit]
- China Meteorological Bureau, Climate Information Center; Climate Data Office and Tsinghua University, Department of Building Science and Technology. China Standard Weather Data for Analyzing Building Thermal Conditions; China Building Industry Publishing House: Beijing, China, 2005. [Google Scholar]
- ASHRAE. ASHRAE Guideline 14-2014: Measurement of Energy, Demand, and Water Savings; ASHRAE: Atlanta, GA, USA, 2014. [Google Scholar]
- Coakley, D.; Raftery, P.; Keane, M. A review of methods to match building energy simulation models to measured data. Renew. Sustain. Energy Rev. 2014, 37, 123–141. [Google Scholar] [CrossRef] [Scilit]
- Guo, S.; Wang, W.; Zhou, Y. Research on energy saving and economy of old buildings based on parametric design: A case study of a hospital in Linyi city, shandong Province. Sustainability 2022, 14, 16681. [Google Scholar] [CrossRef] [Scilit]
- Lundberg, S.M.; Lee, S.-I. A unified approach to interpreting model predictions. Adv. Neural Inf. Process. Syst. 2017, 30, 4768–4777. [Google Scholar]
- Lundberg, S.M.; Erion, G.; Chen, H.; DeGrave, A.; Prutkin, J.M.; Nair, B.; Katz, R.; Himmelfarb, J.; Bansal, N.; Lee, S.-I. From local explanations to global understanding with explainable AI for trees. Nat. Mach. Intell. 2020, 2, 56–67. [Google Scholar] [CrossRef] [Scilit] [PubMed]
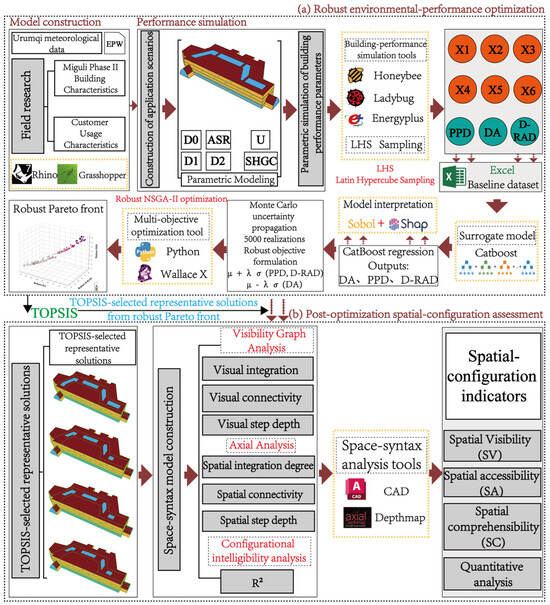
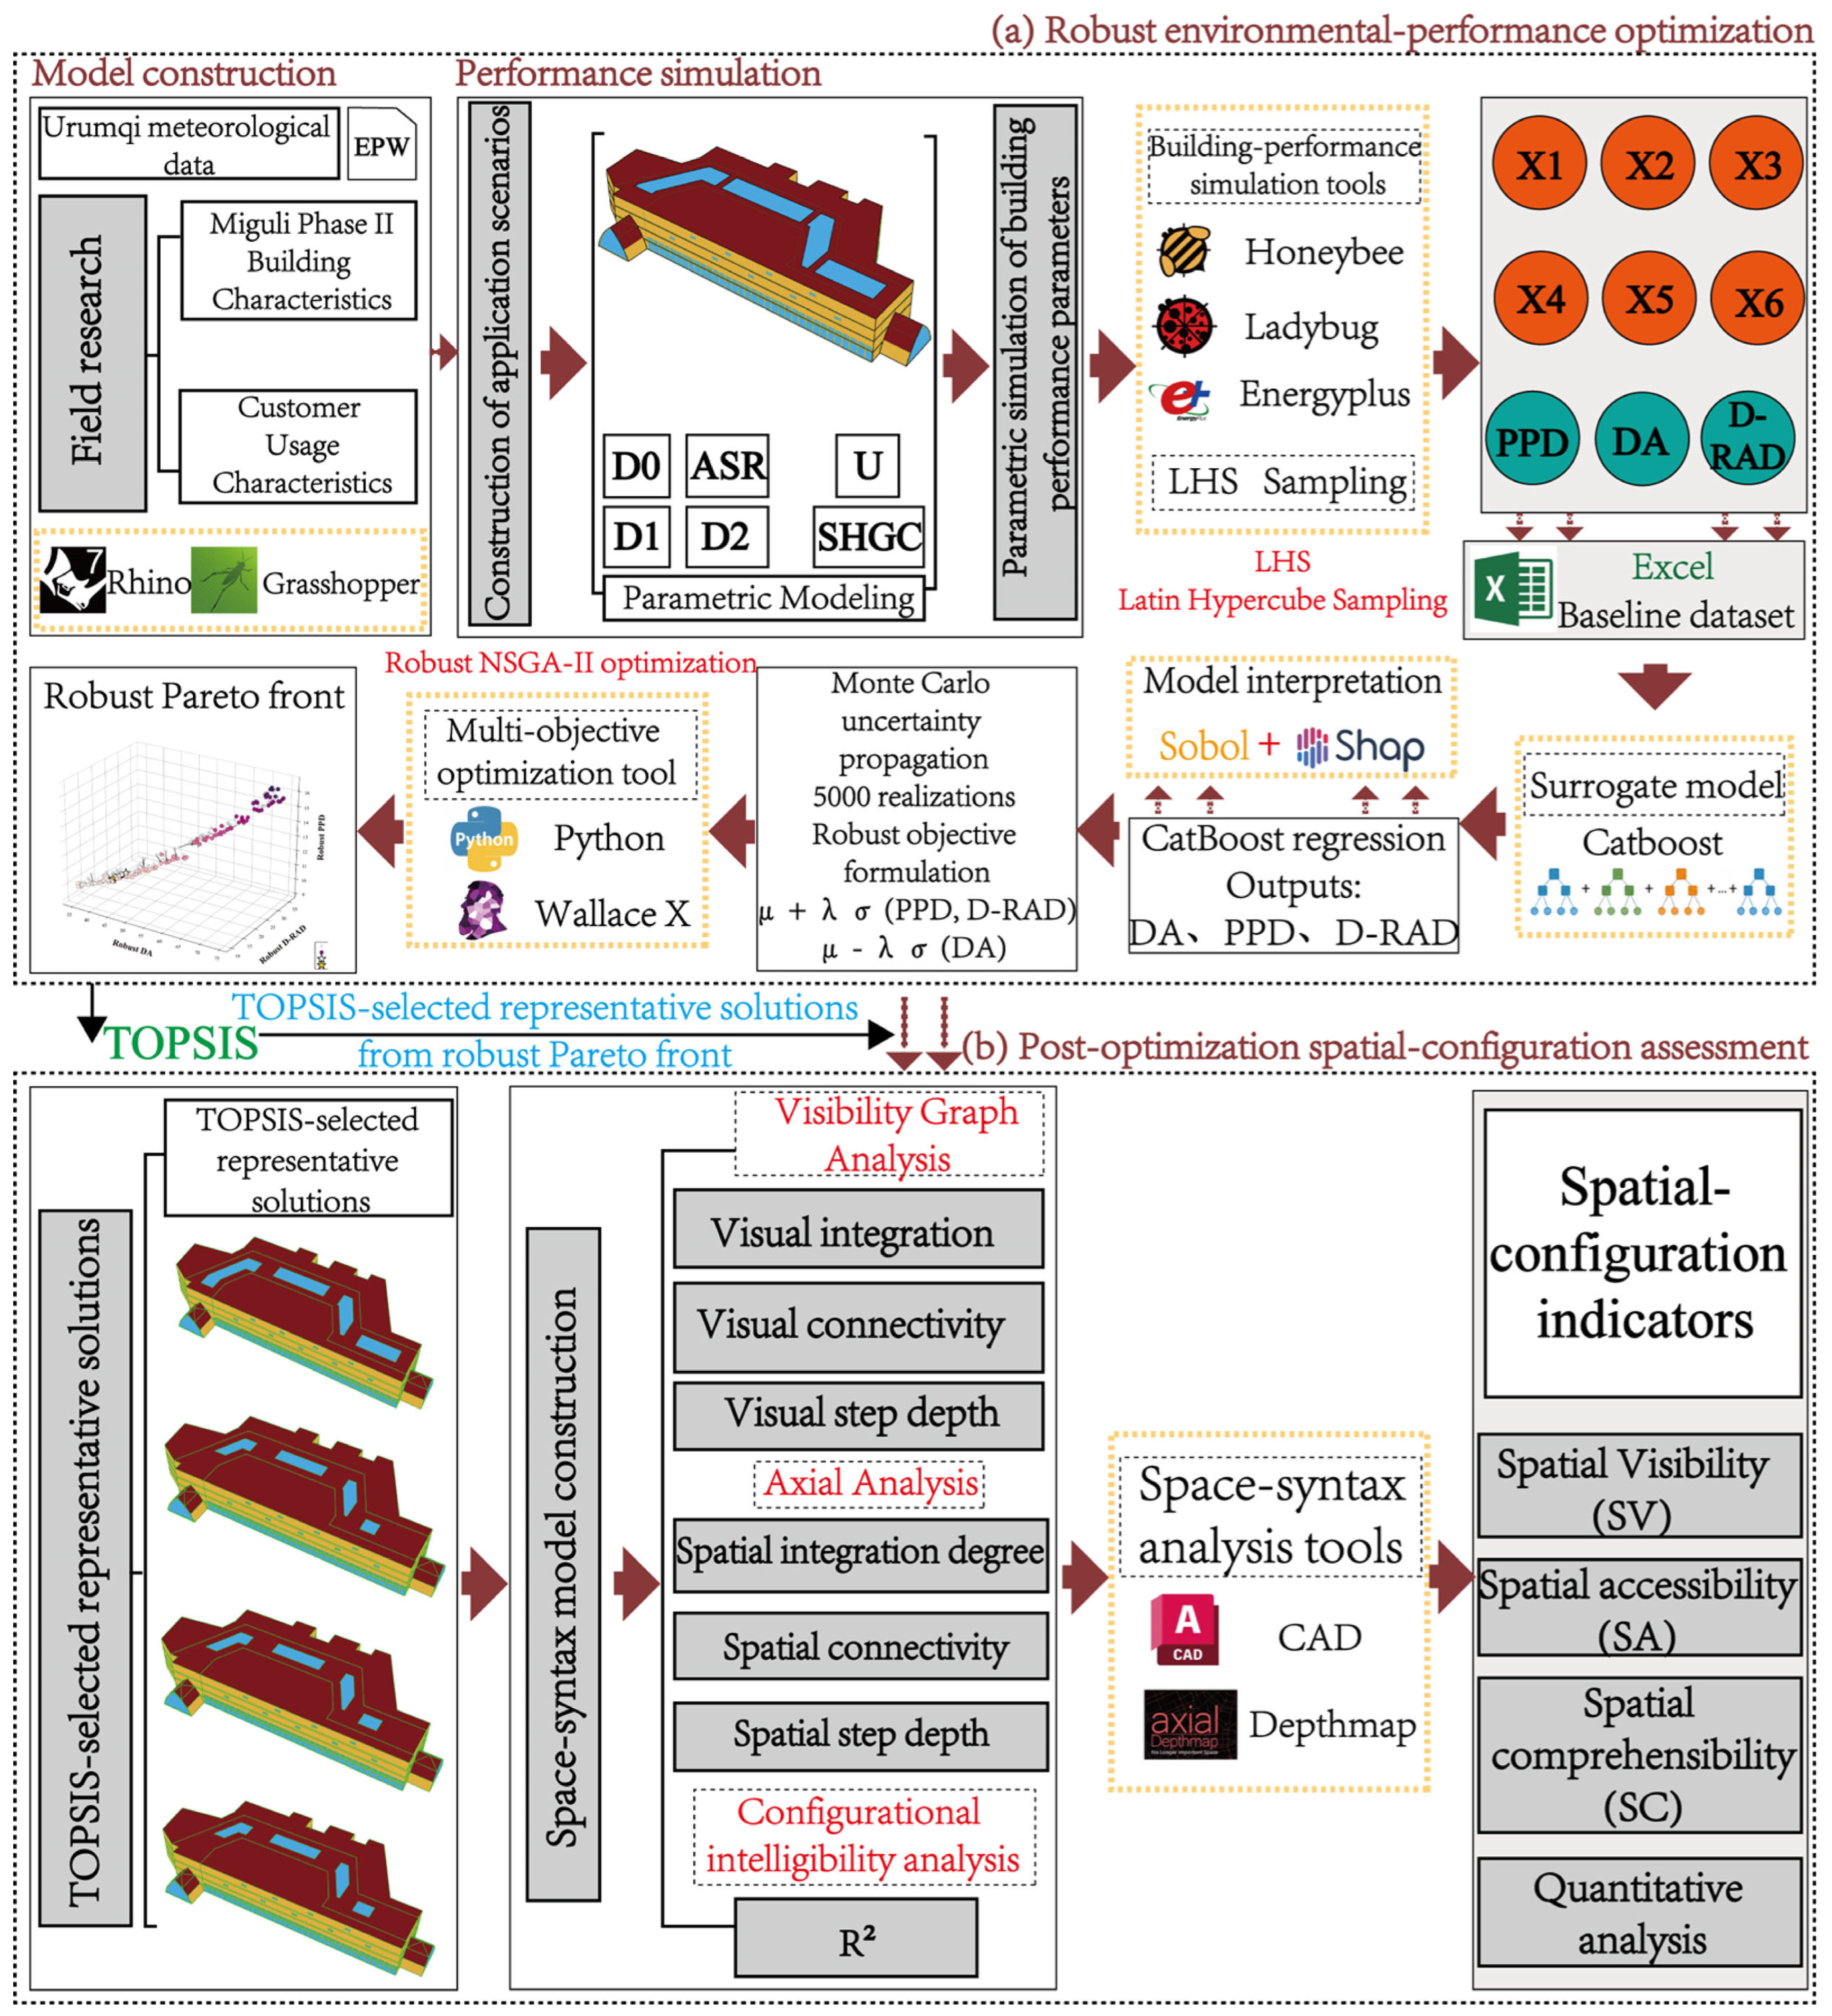
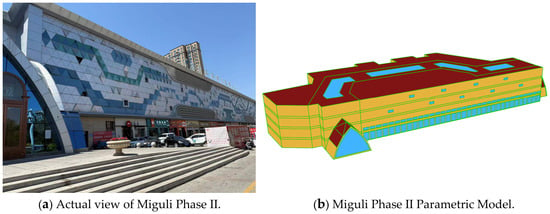
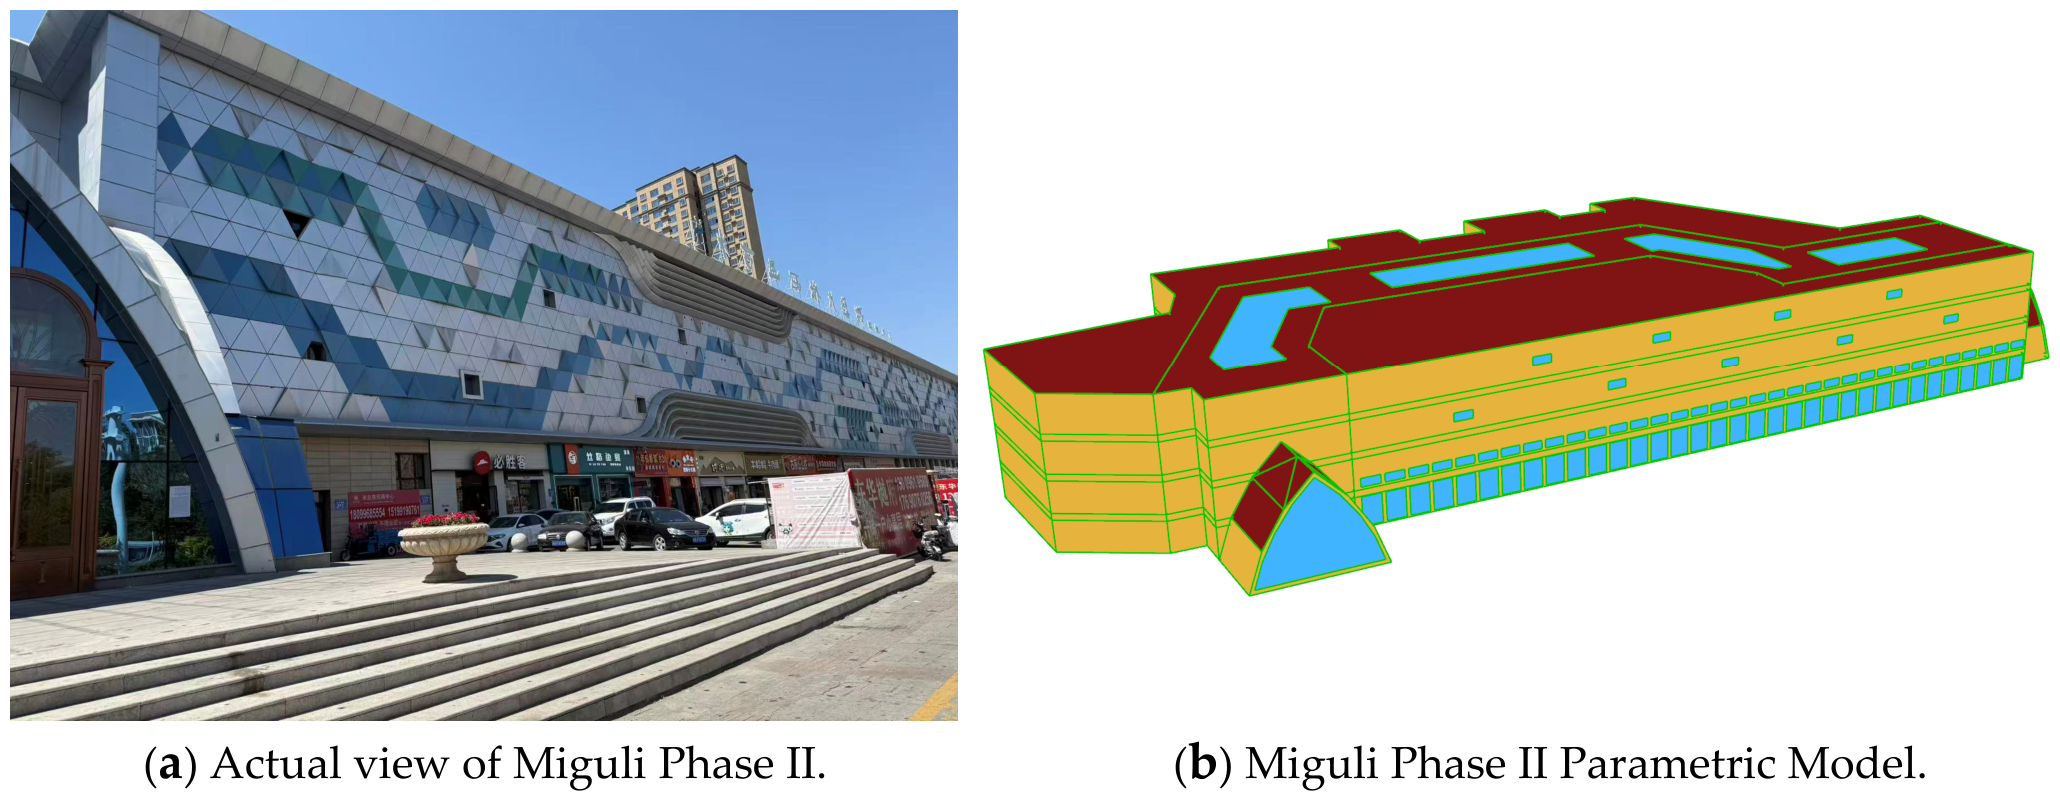
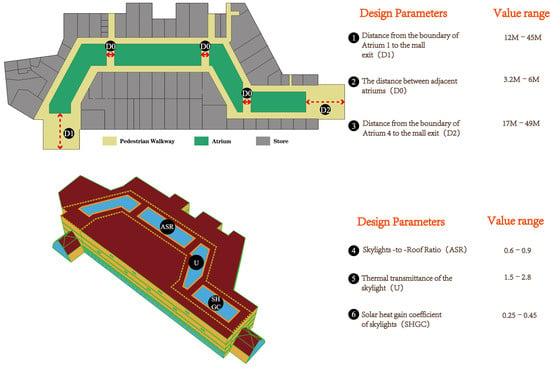
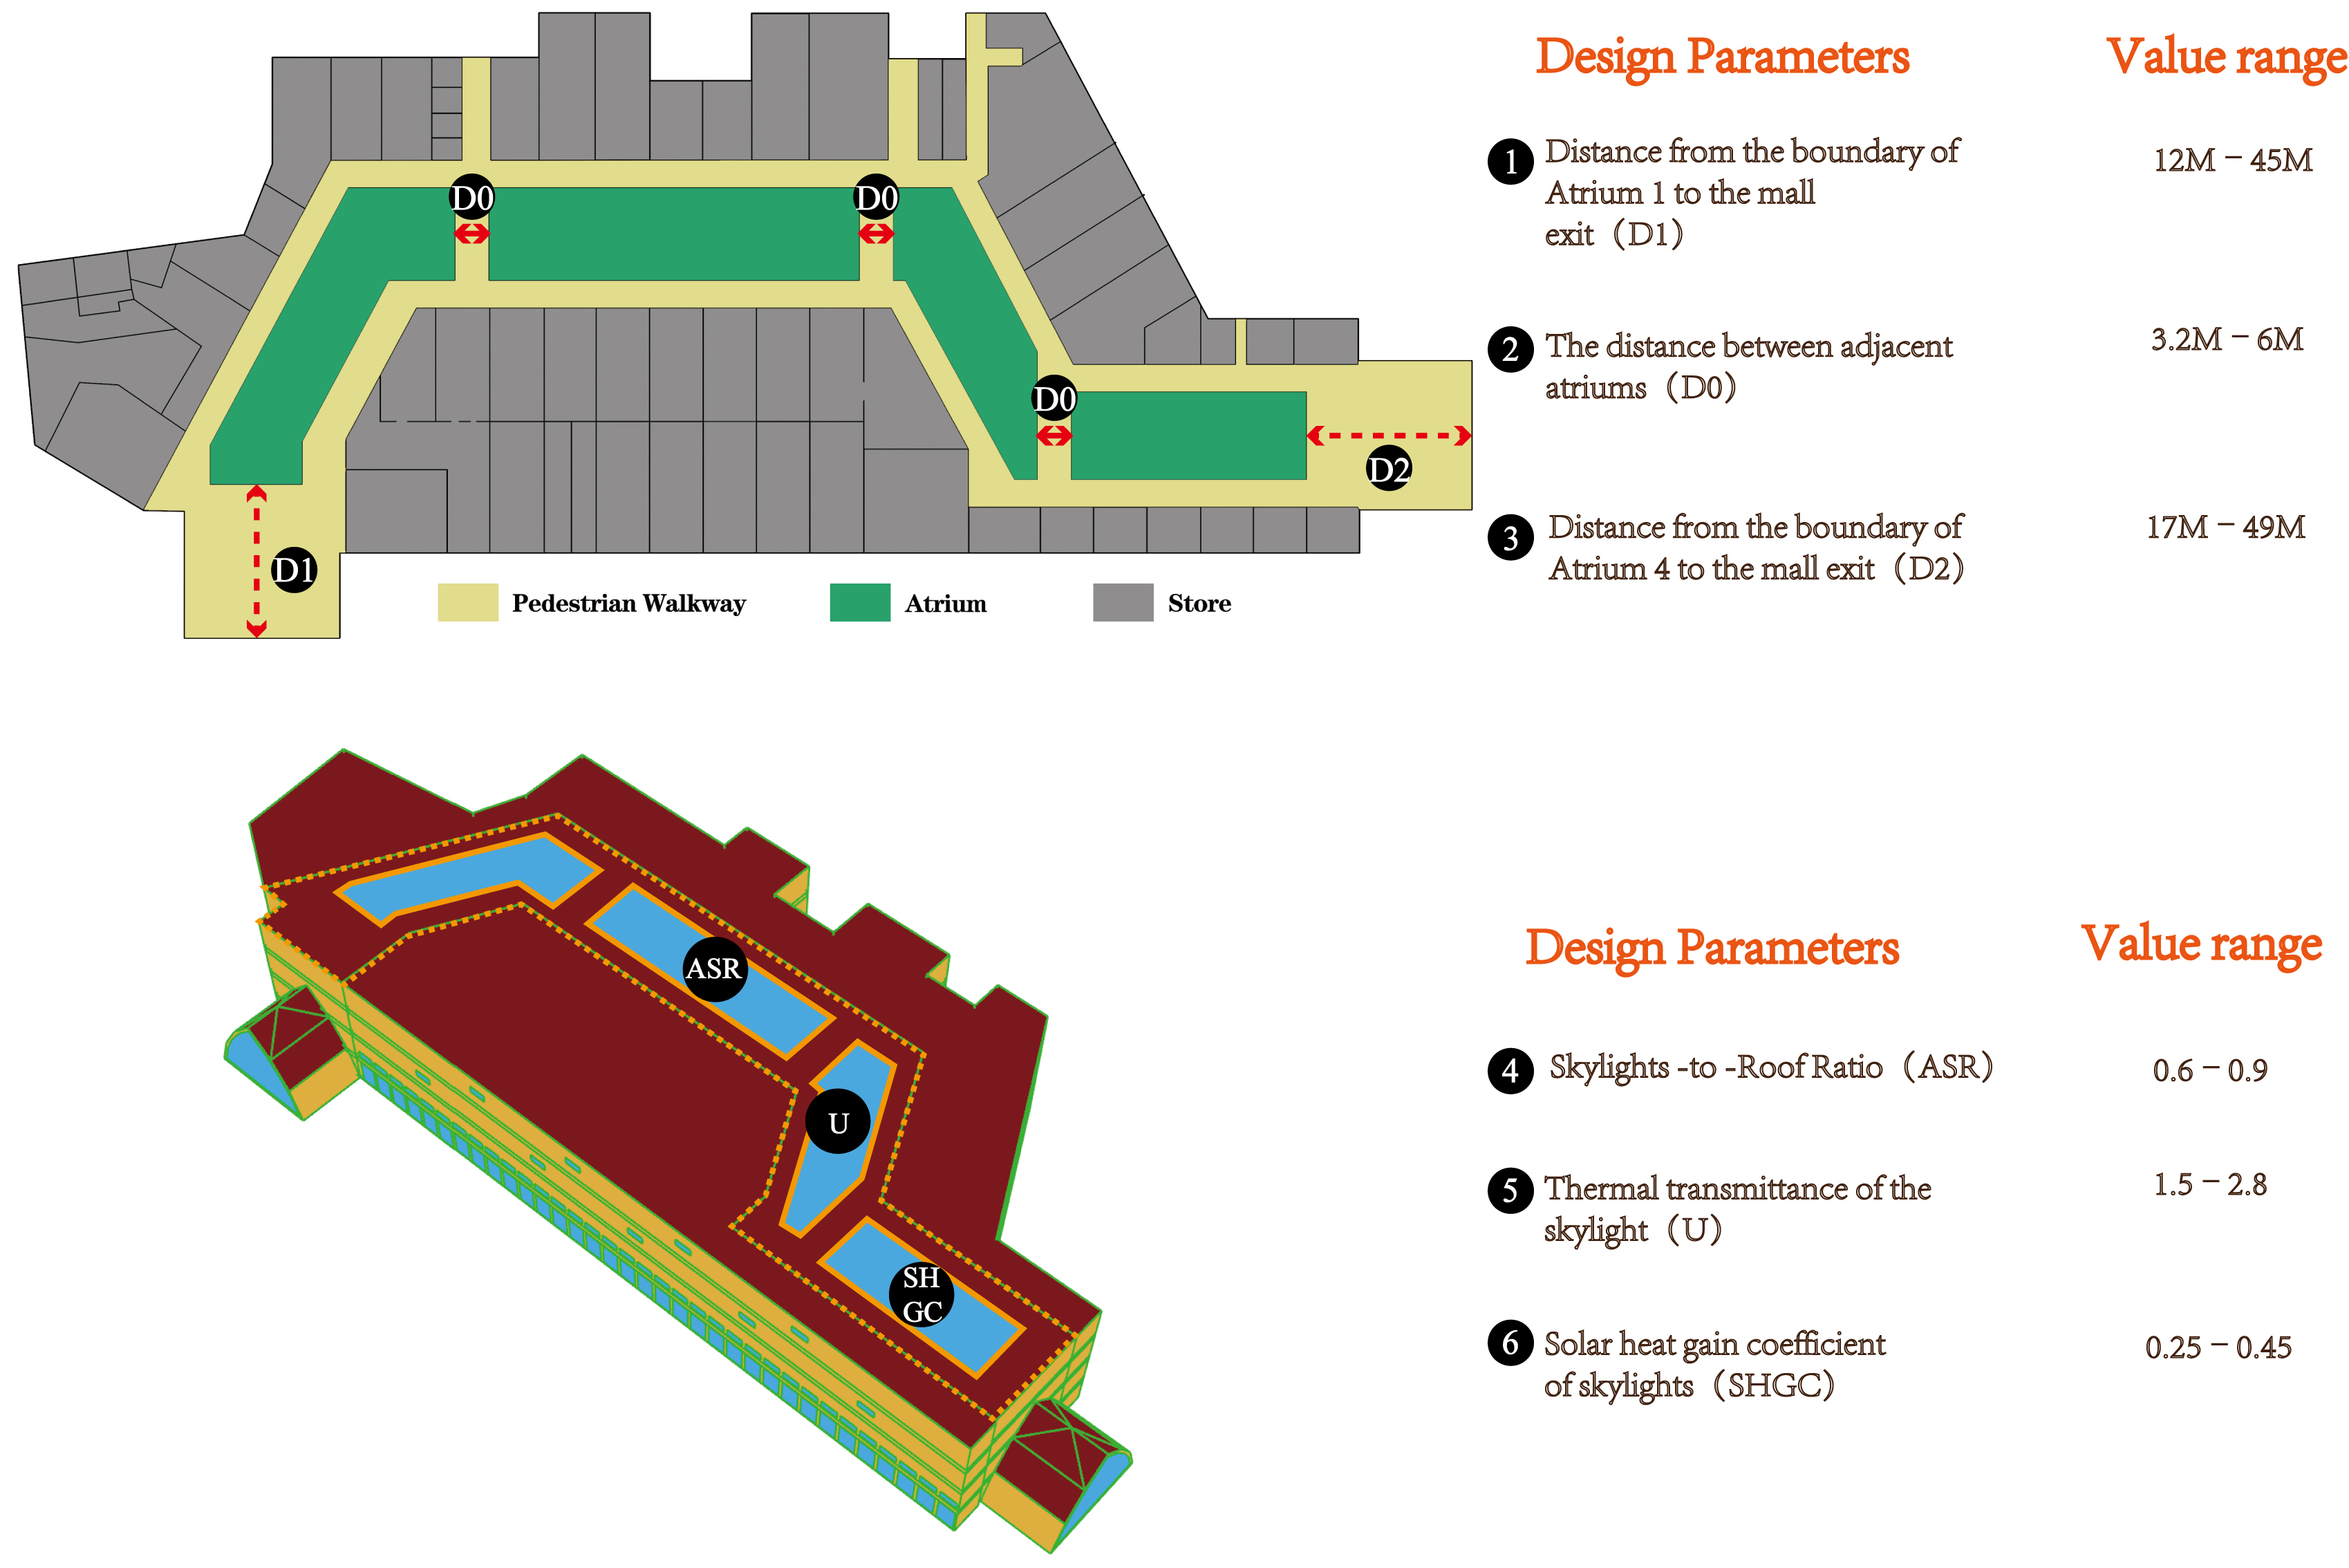
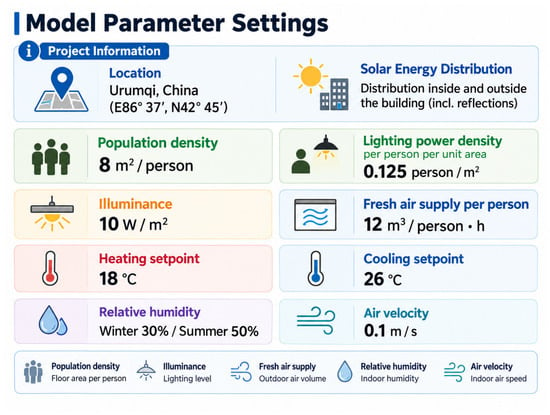
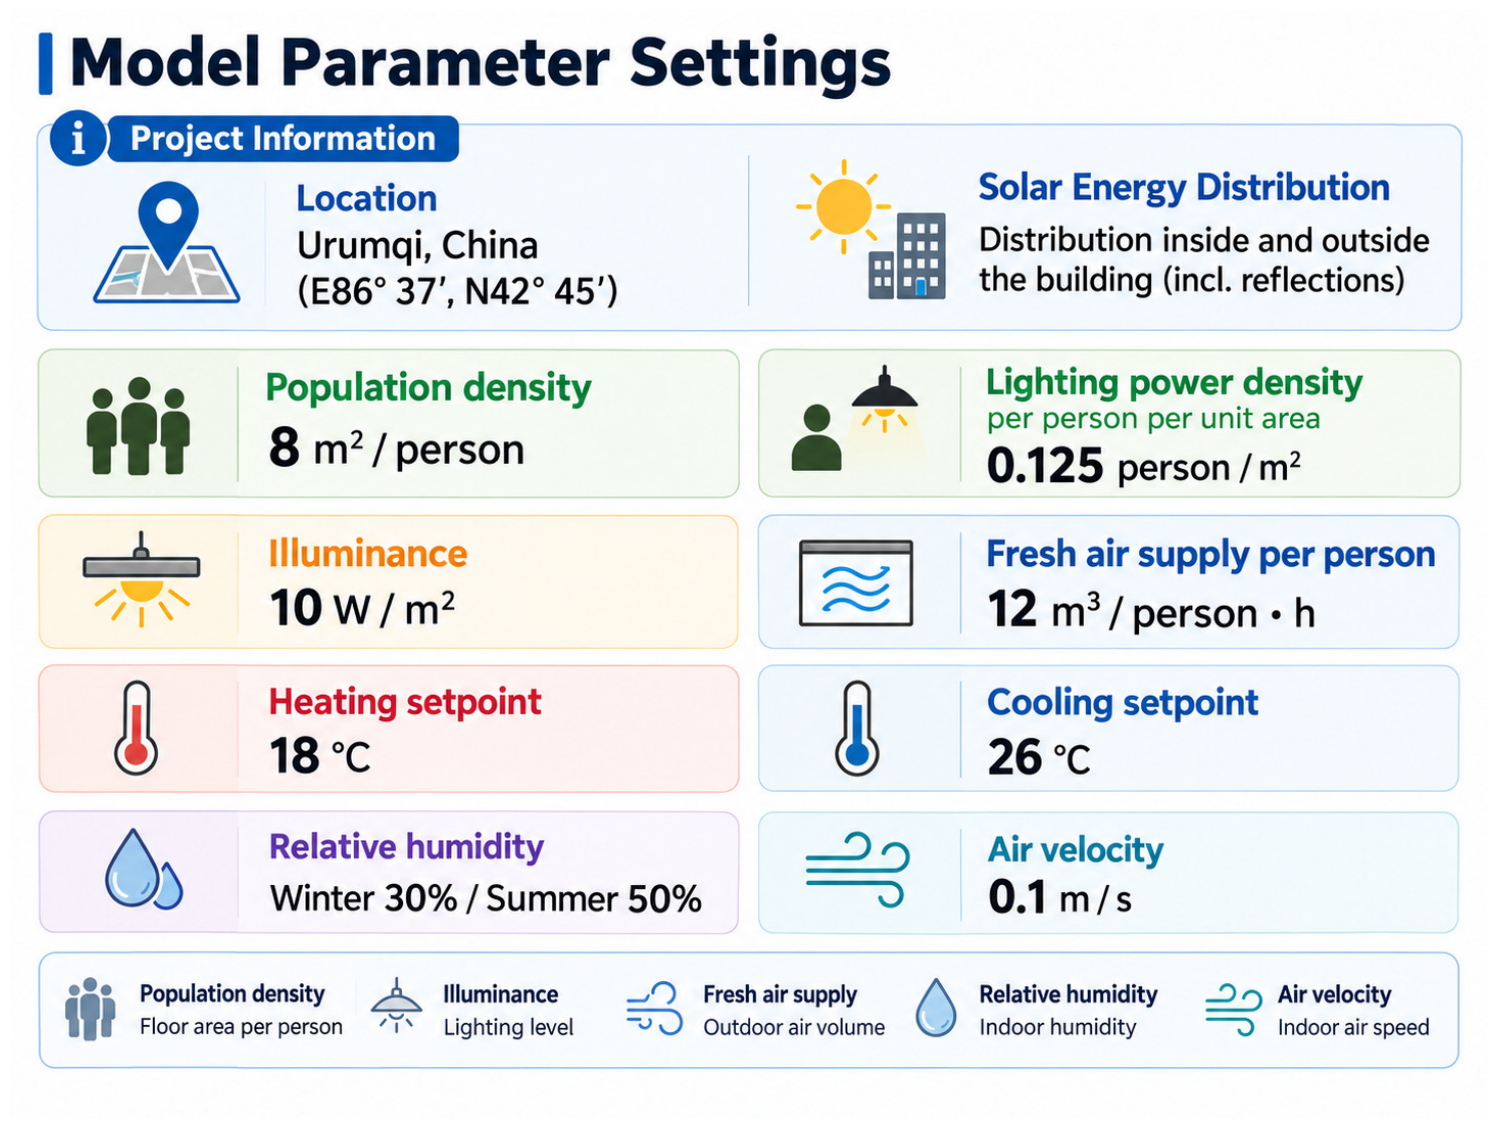
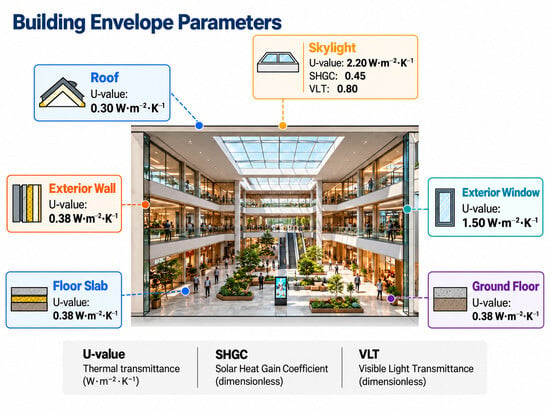
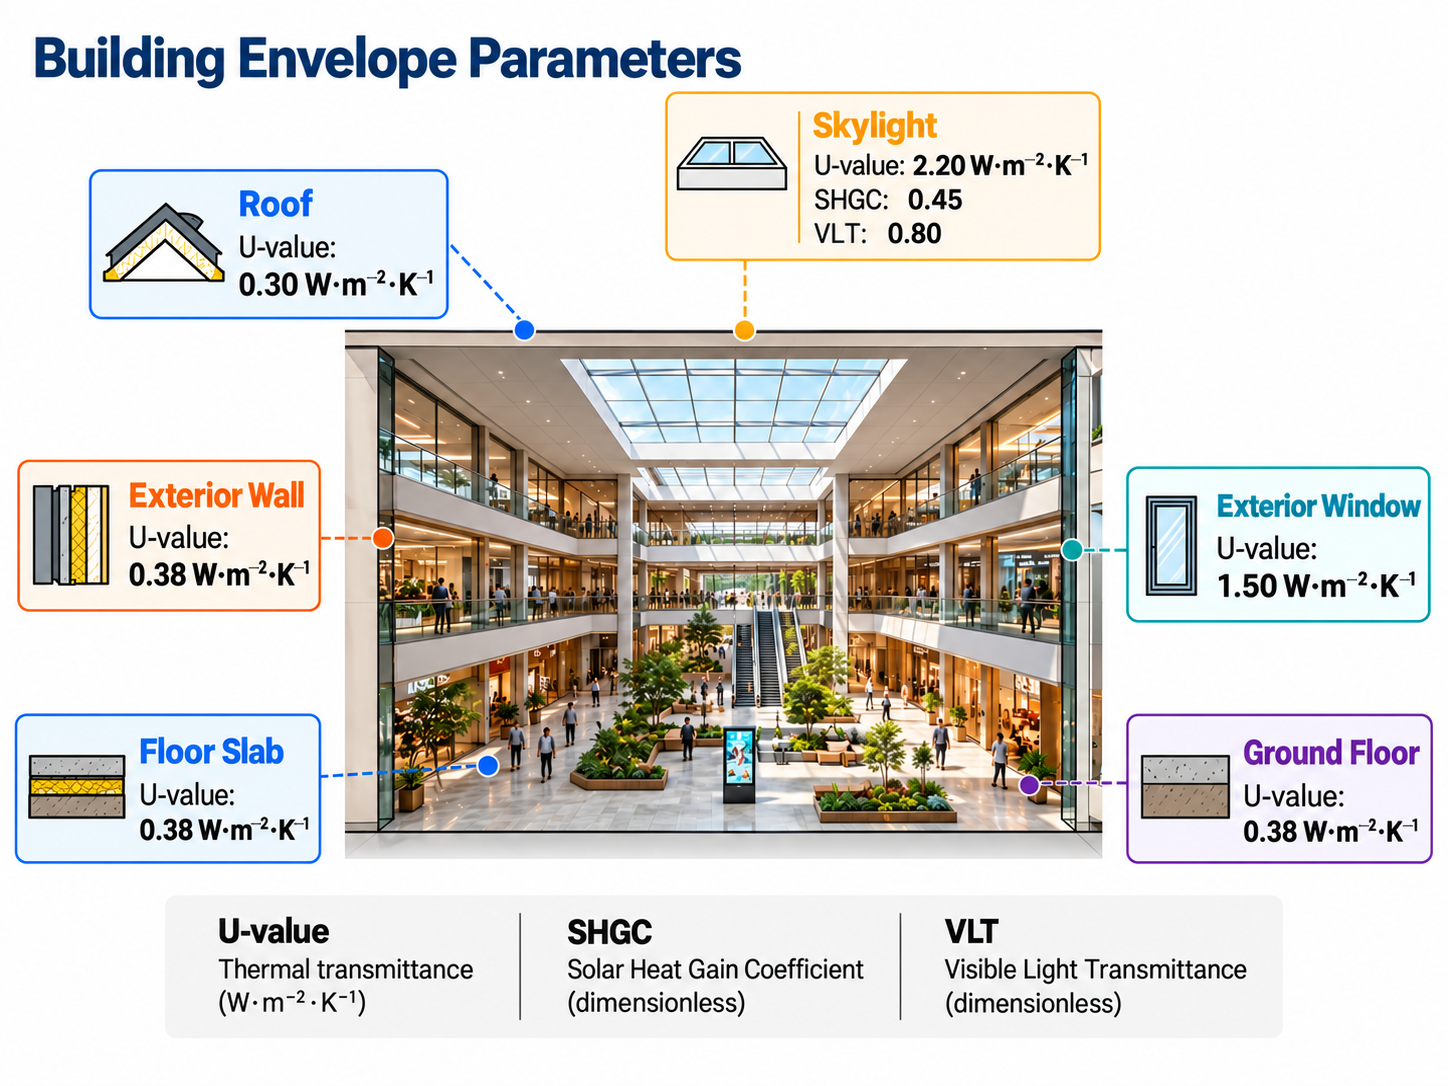
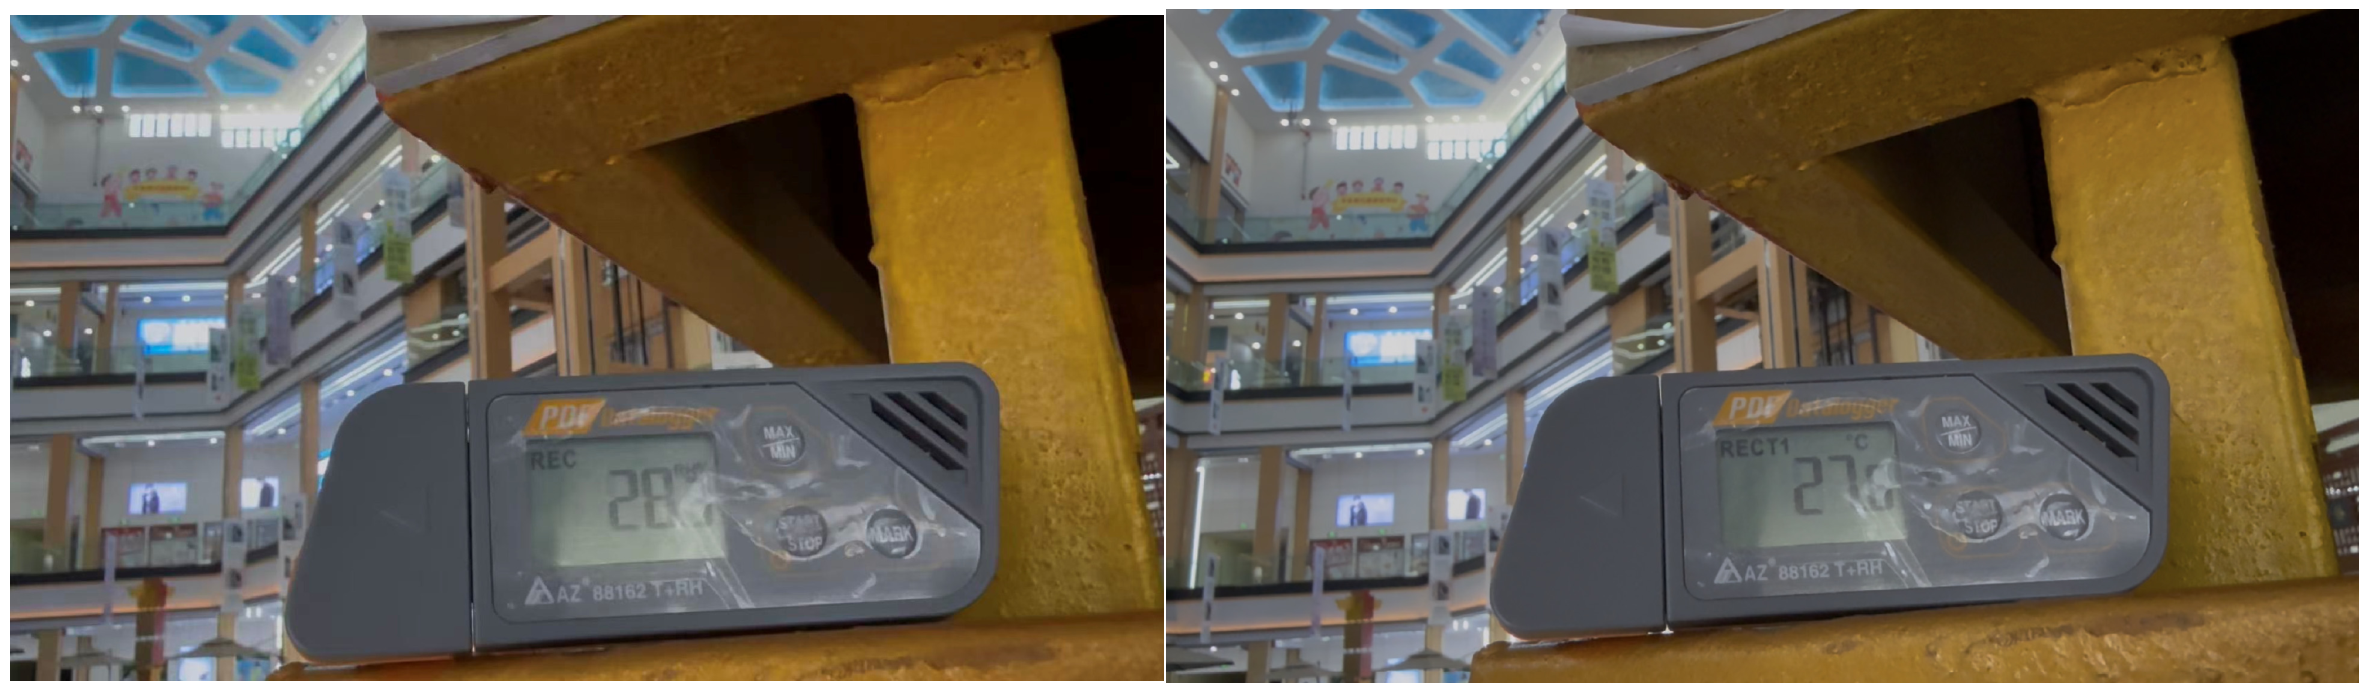
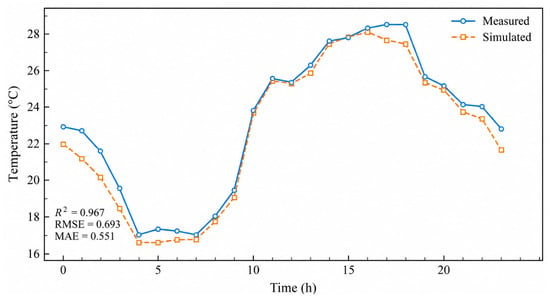
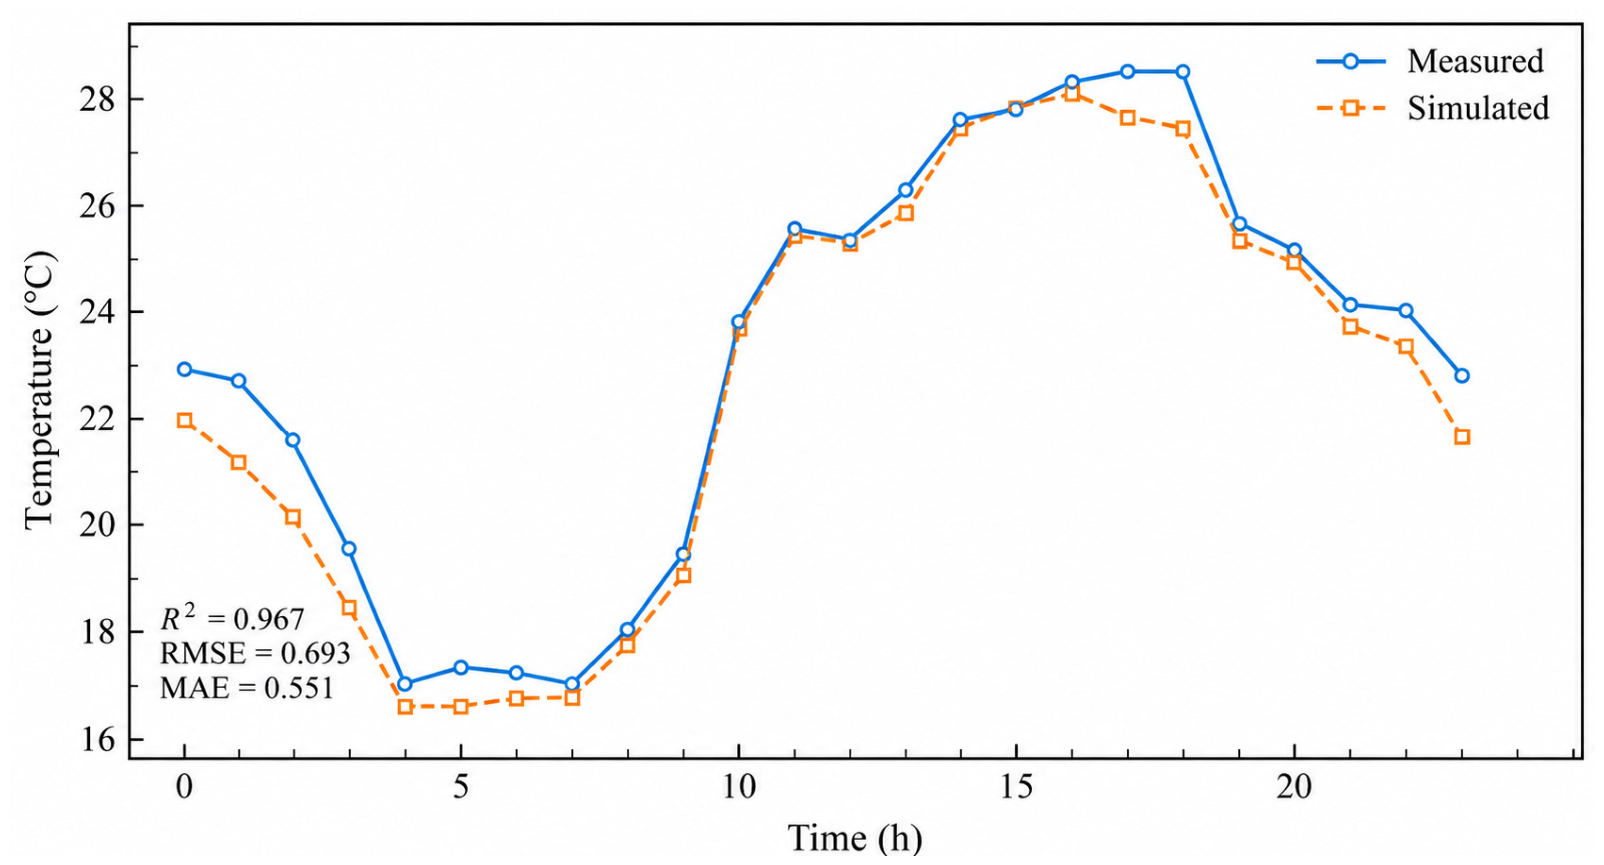
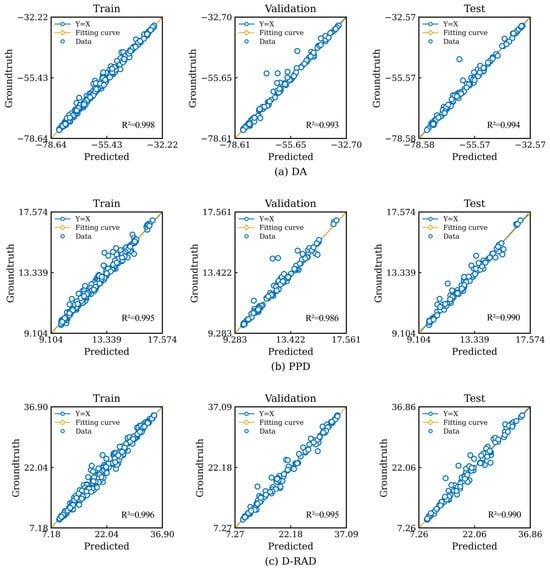
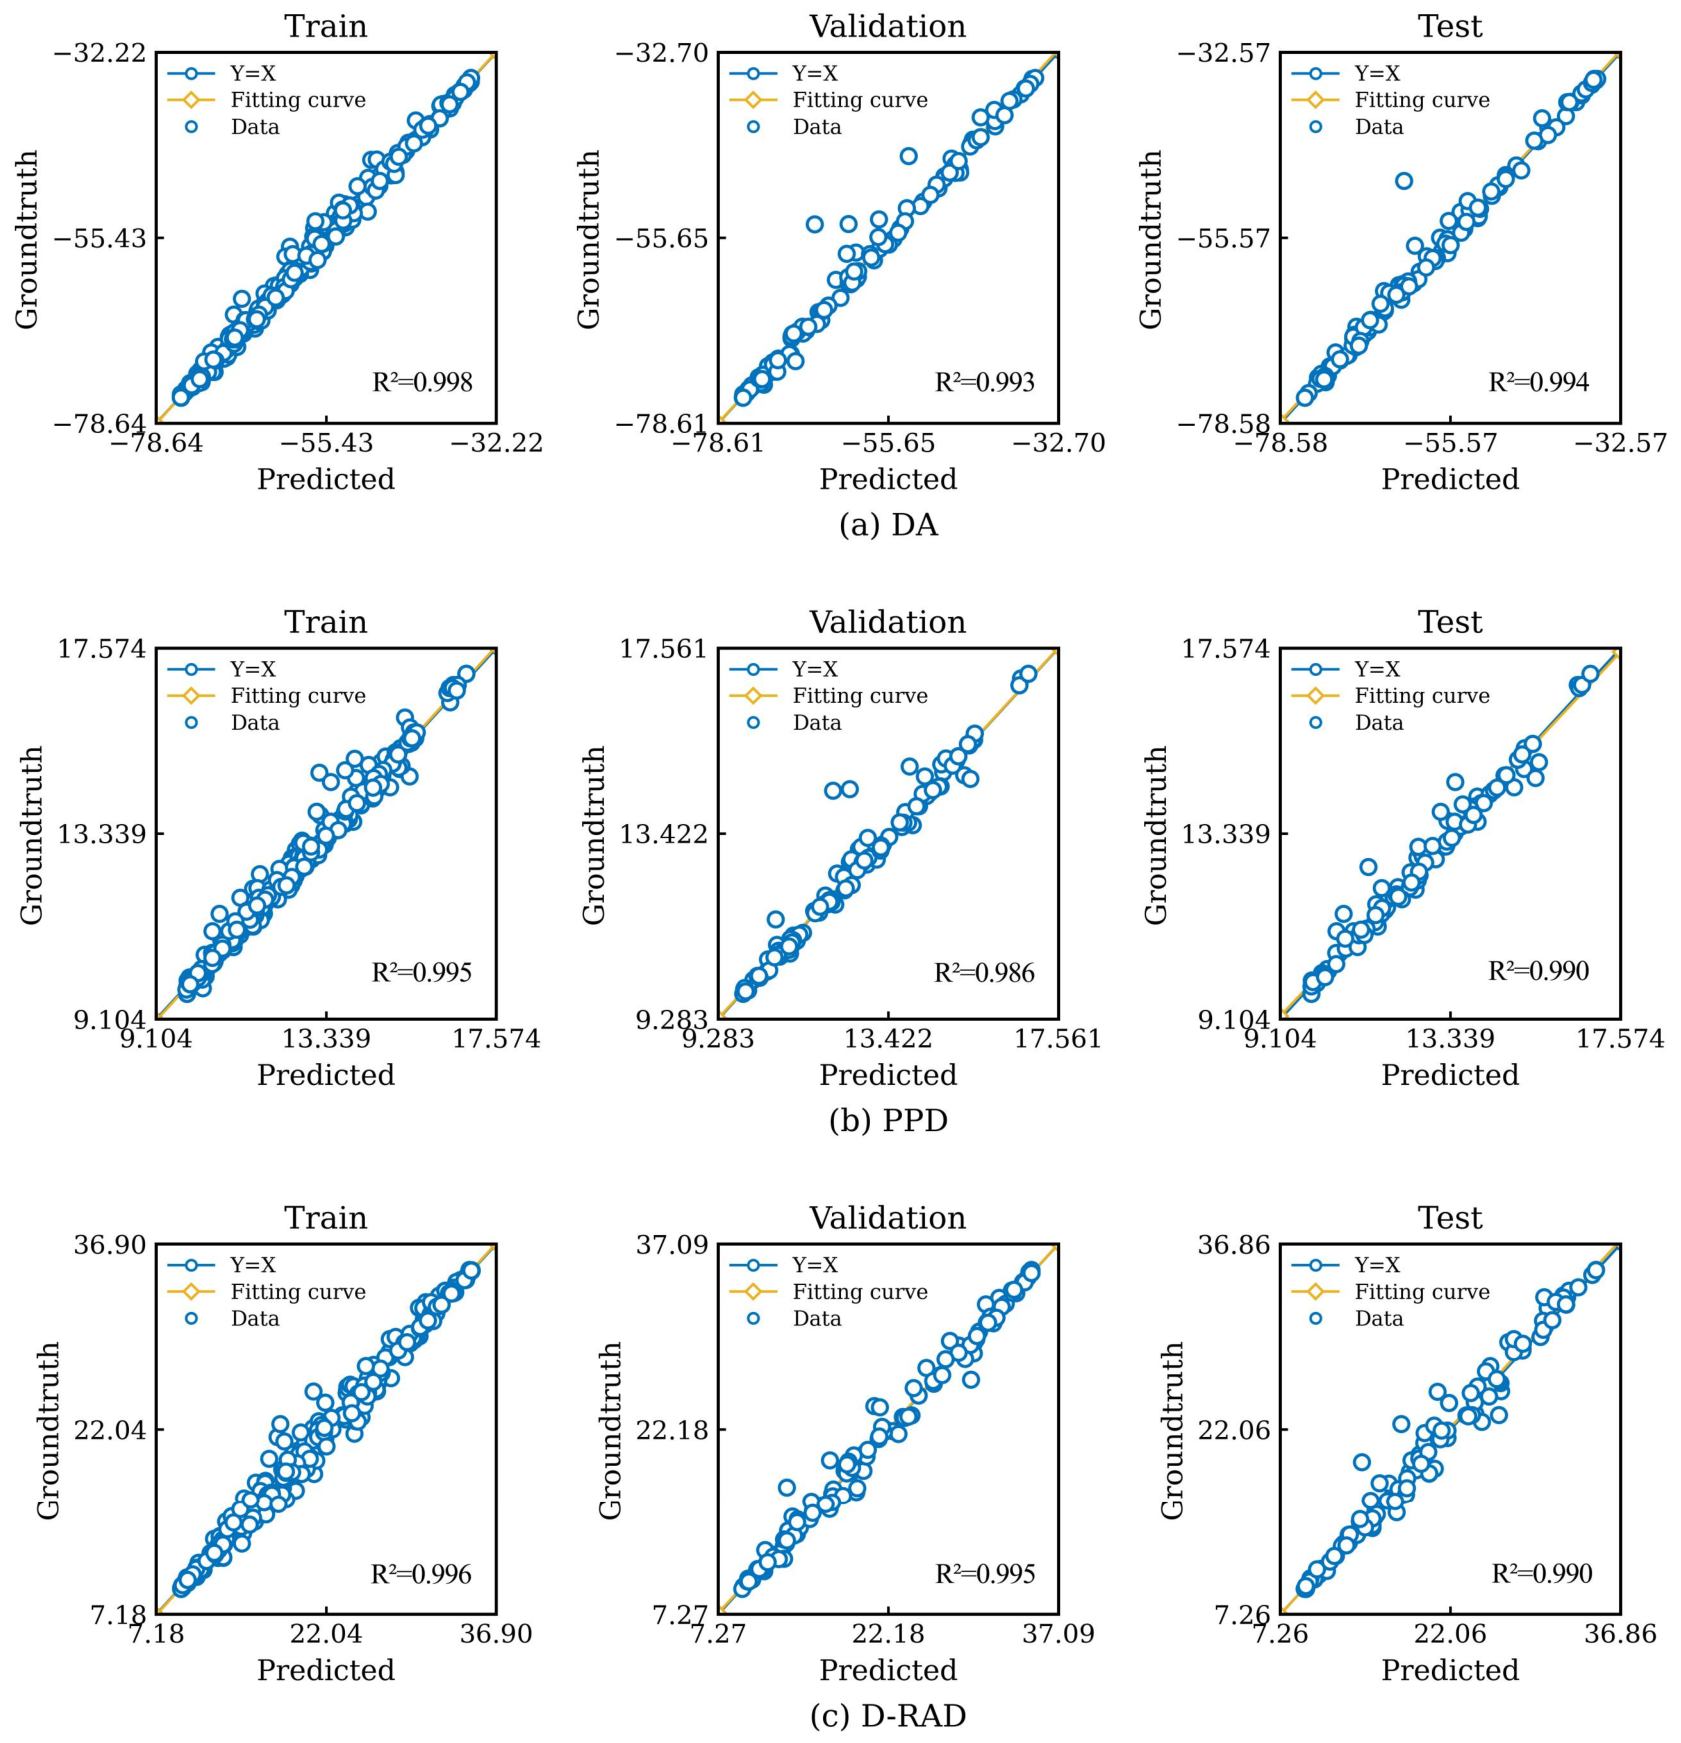
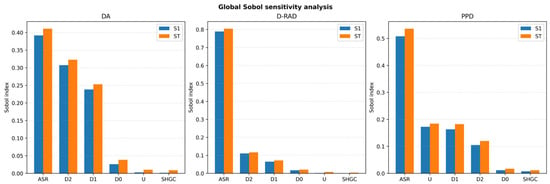
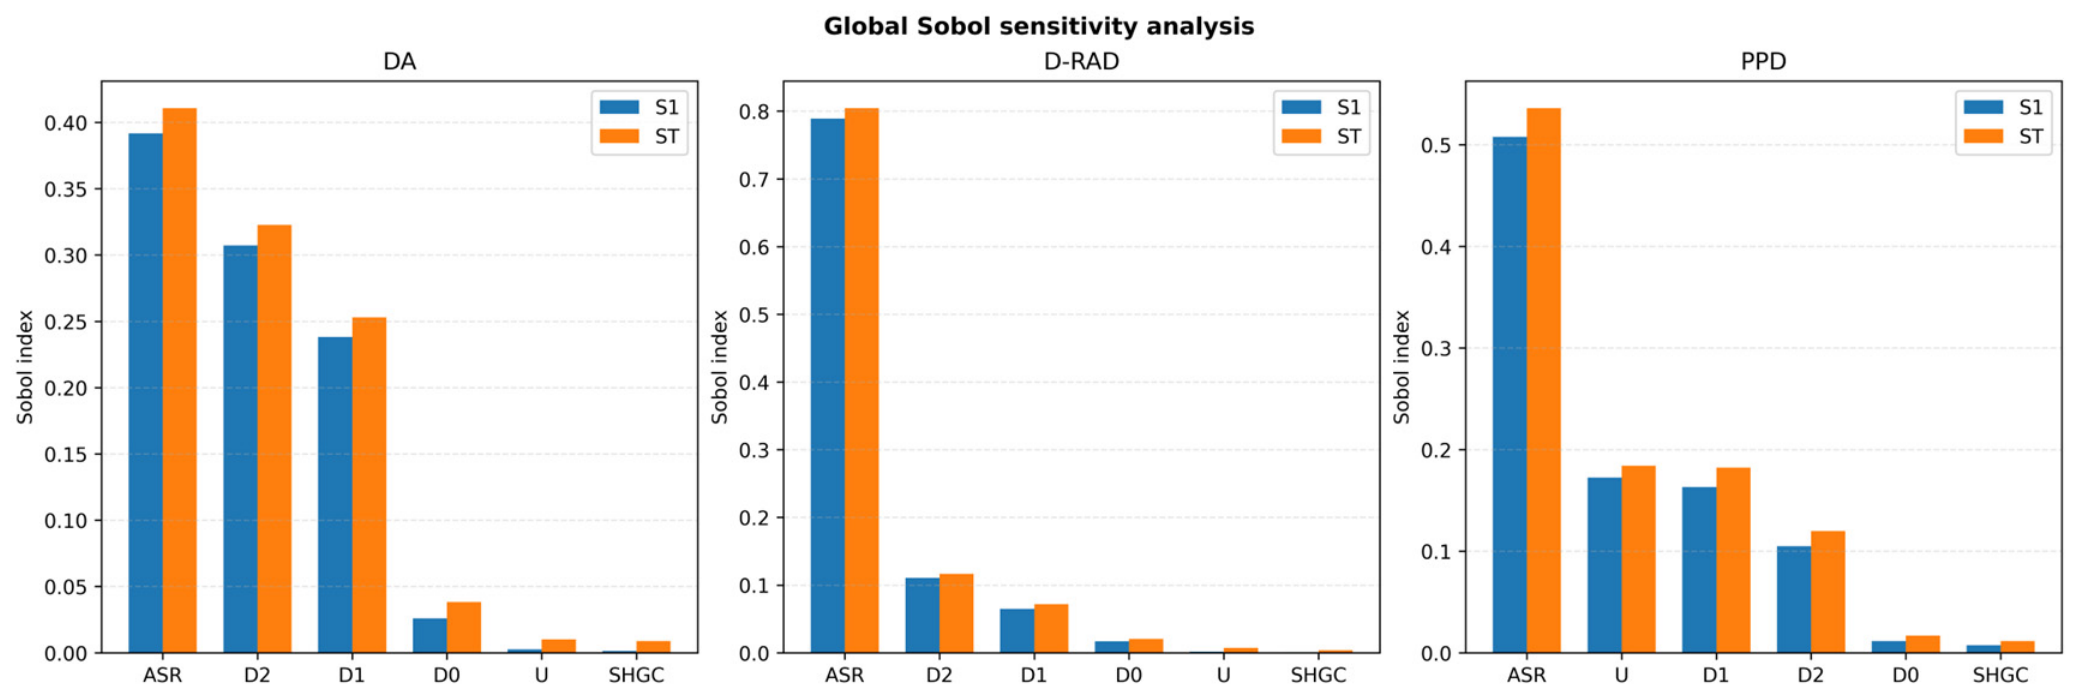
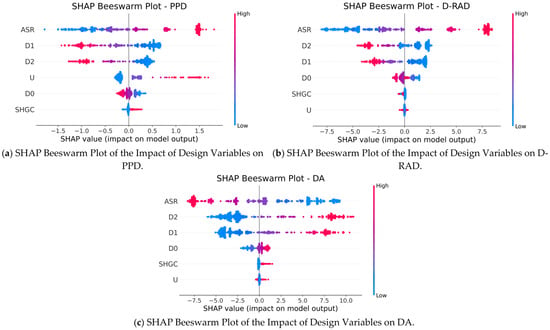
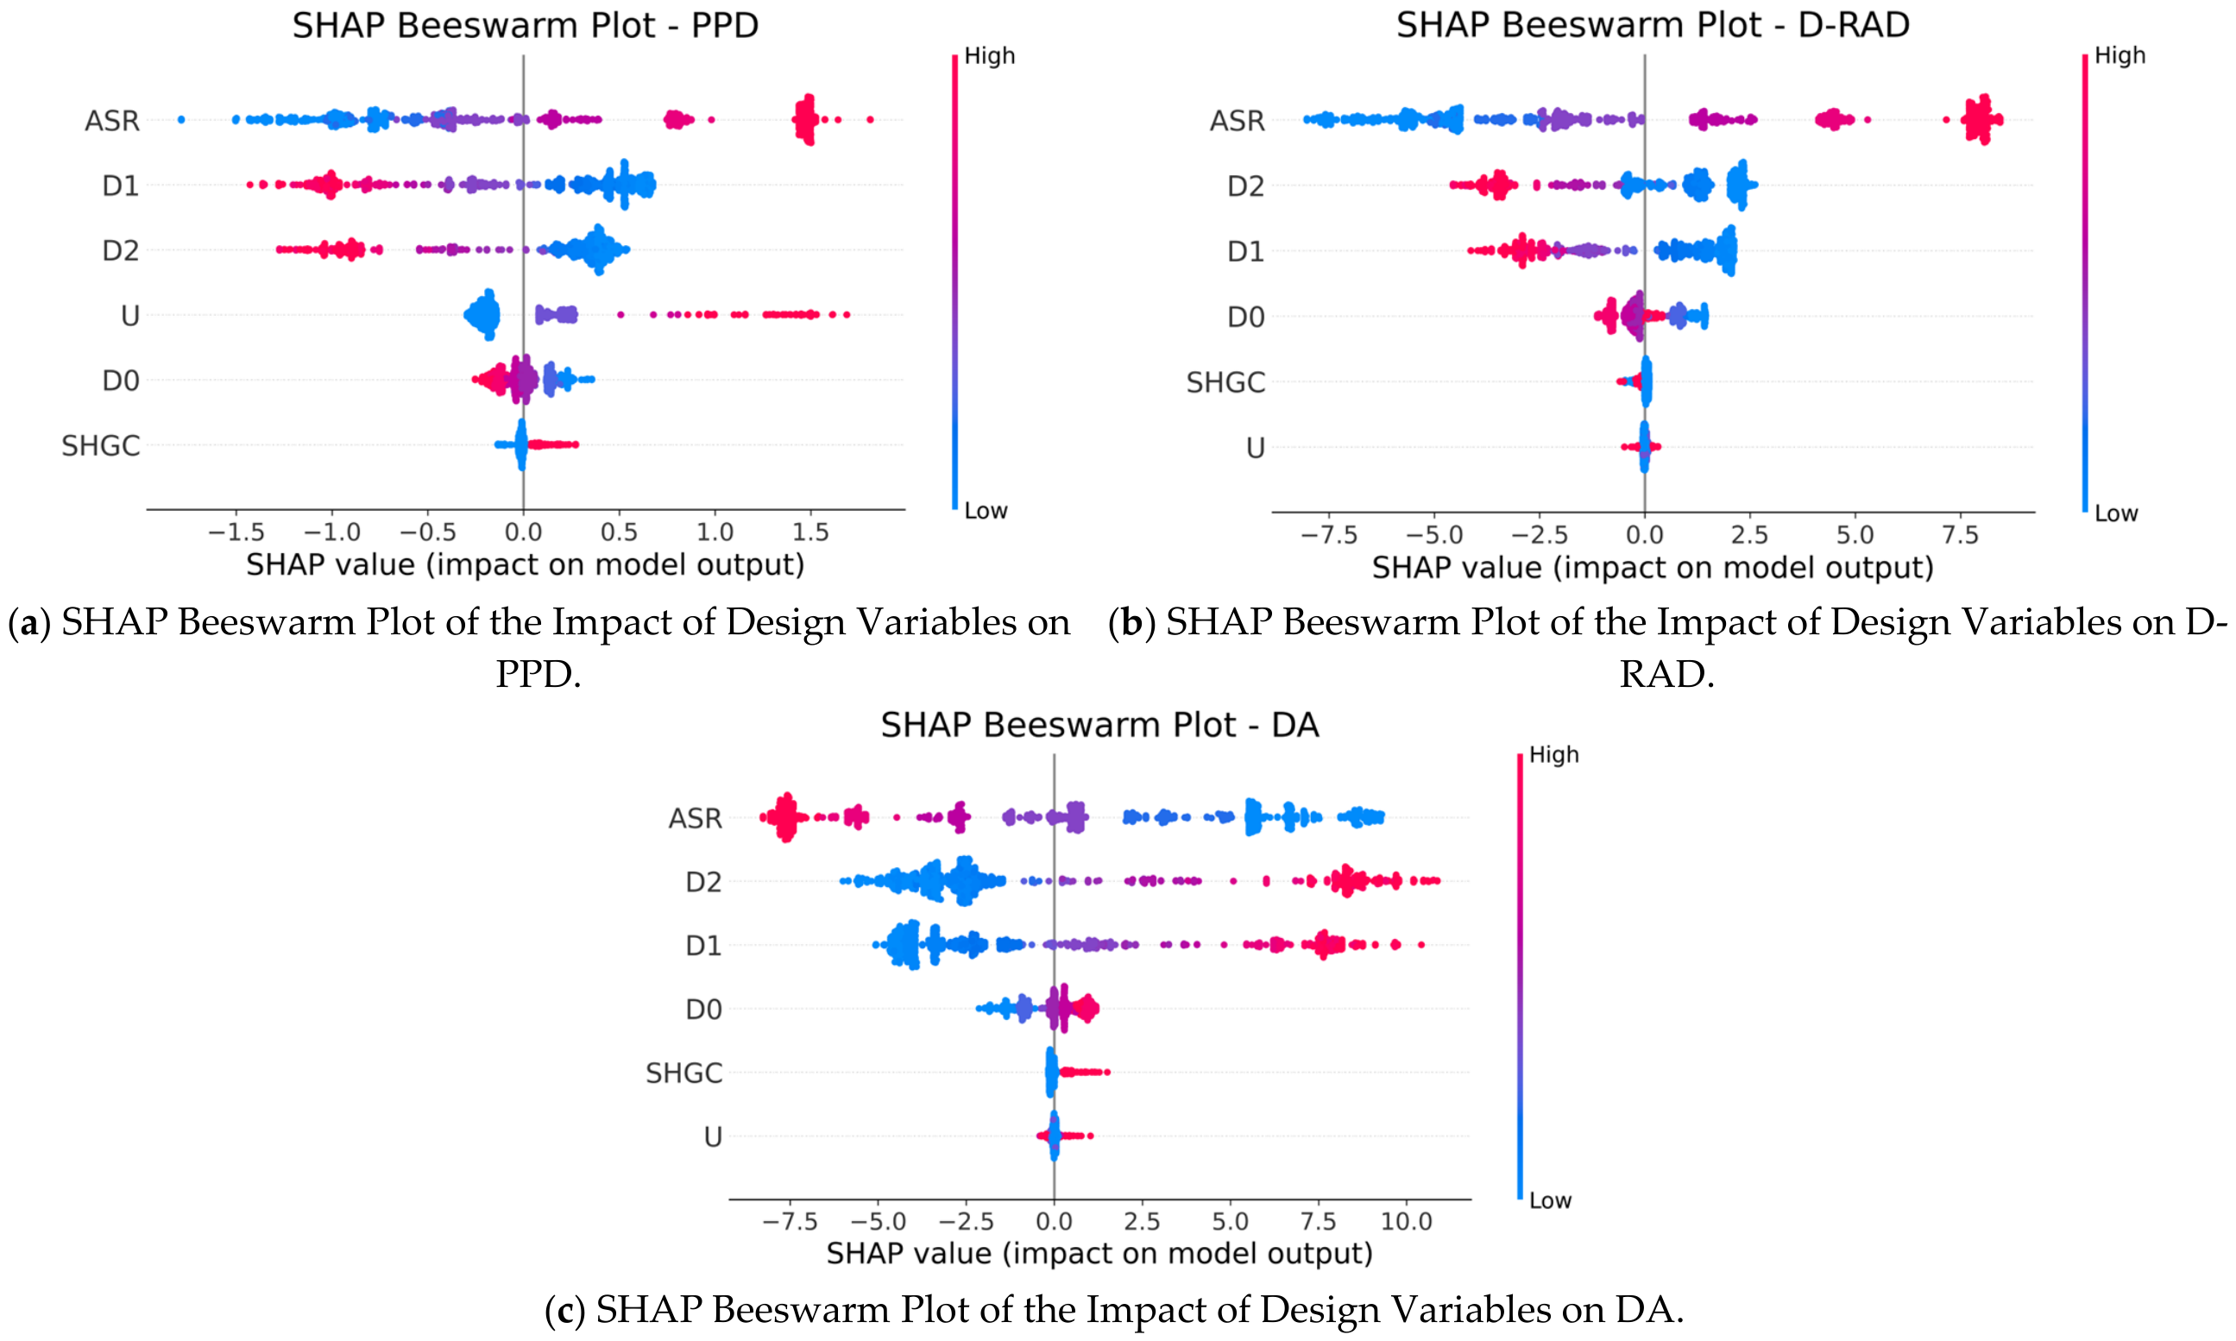
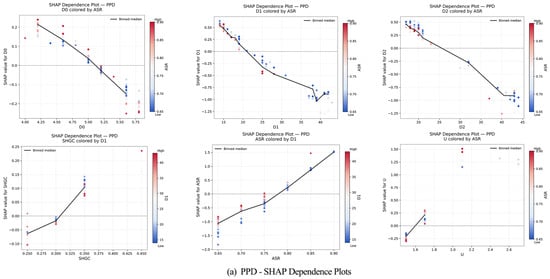
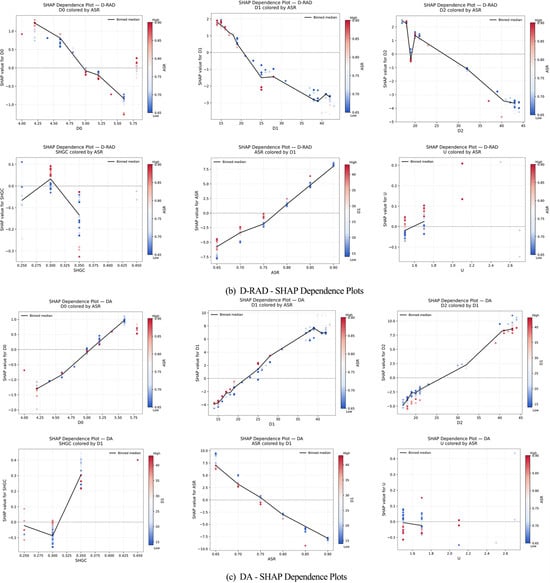
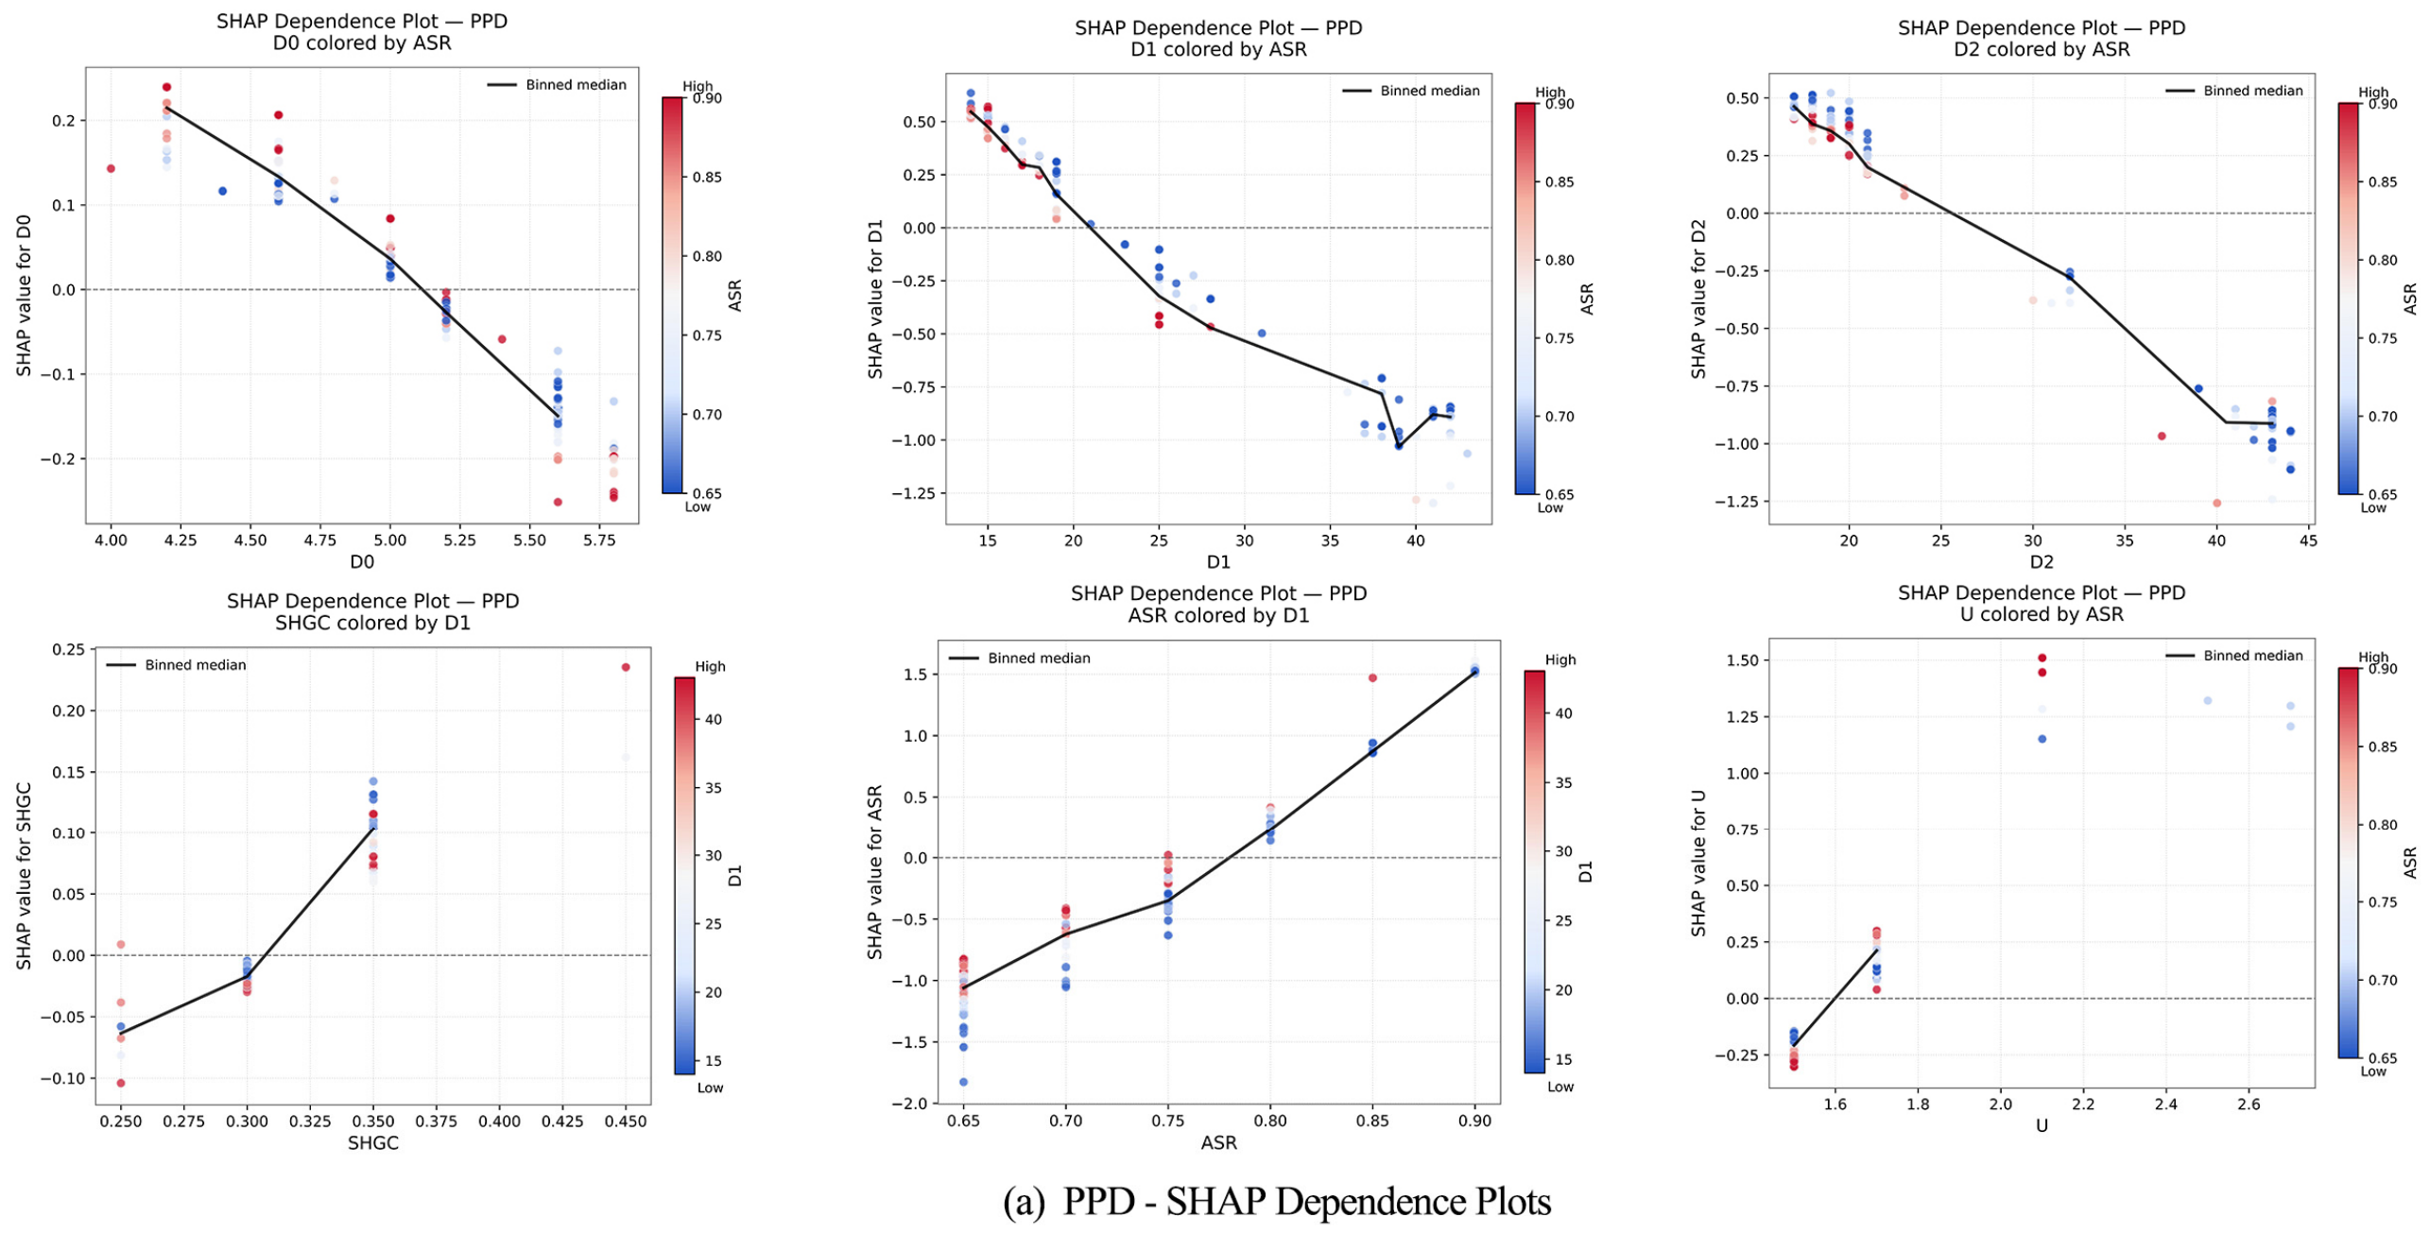
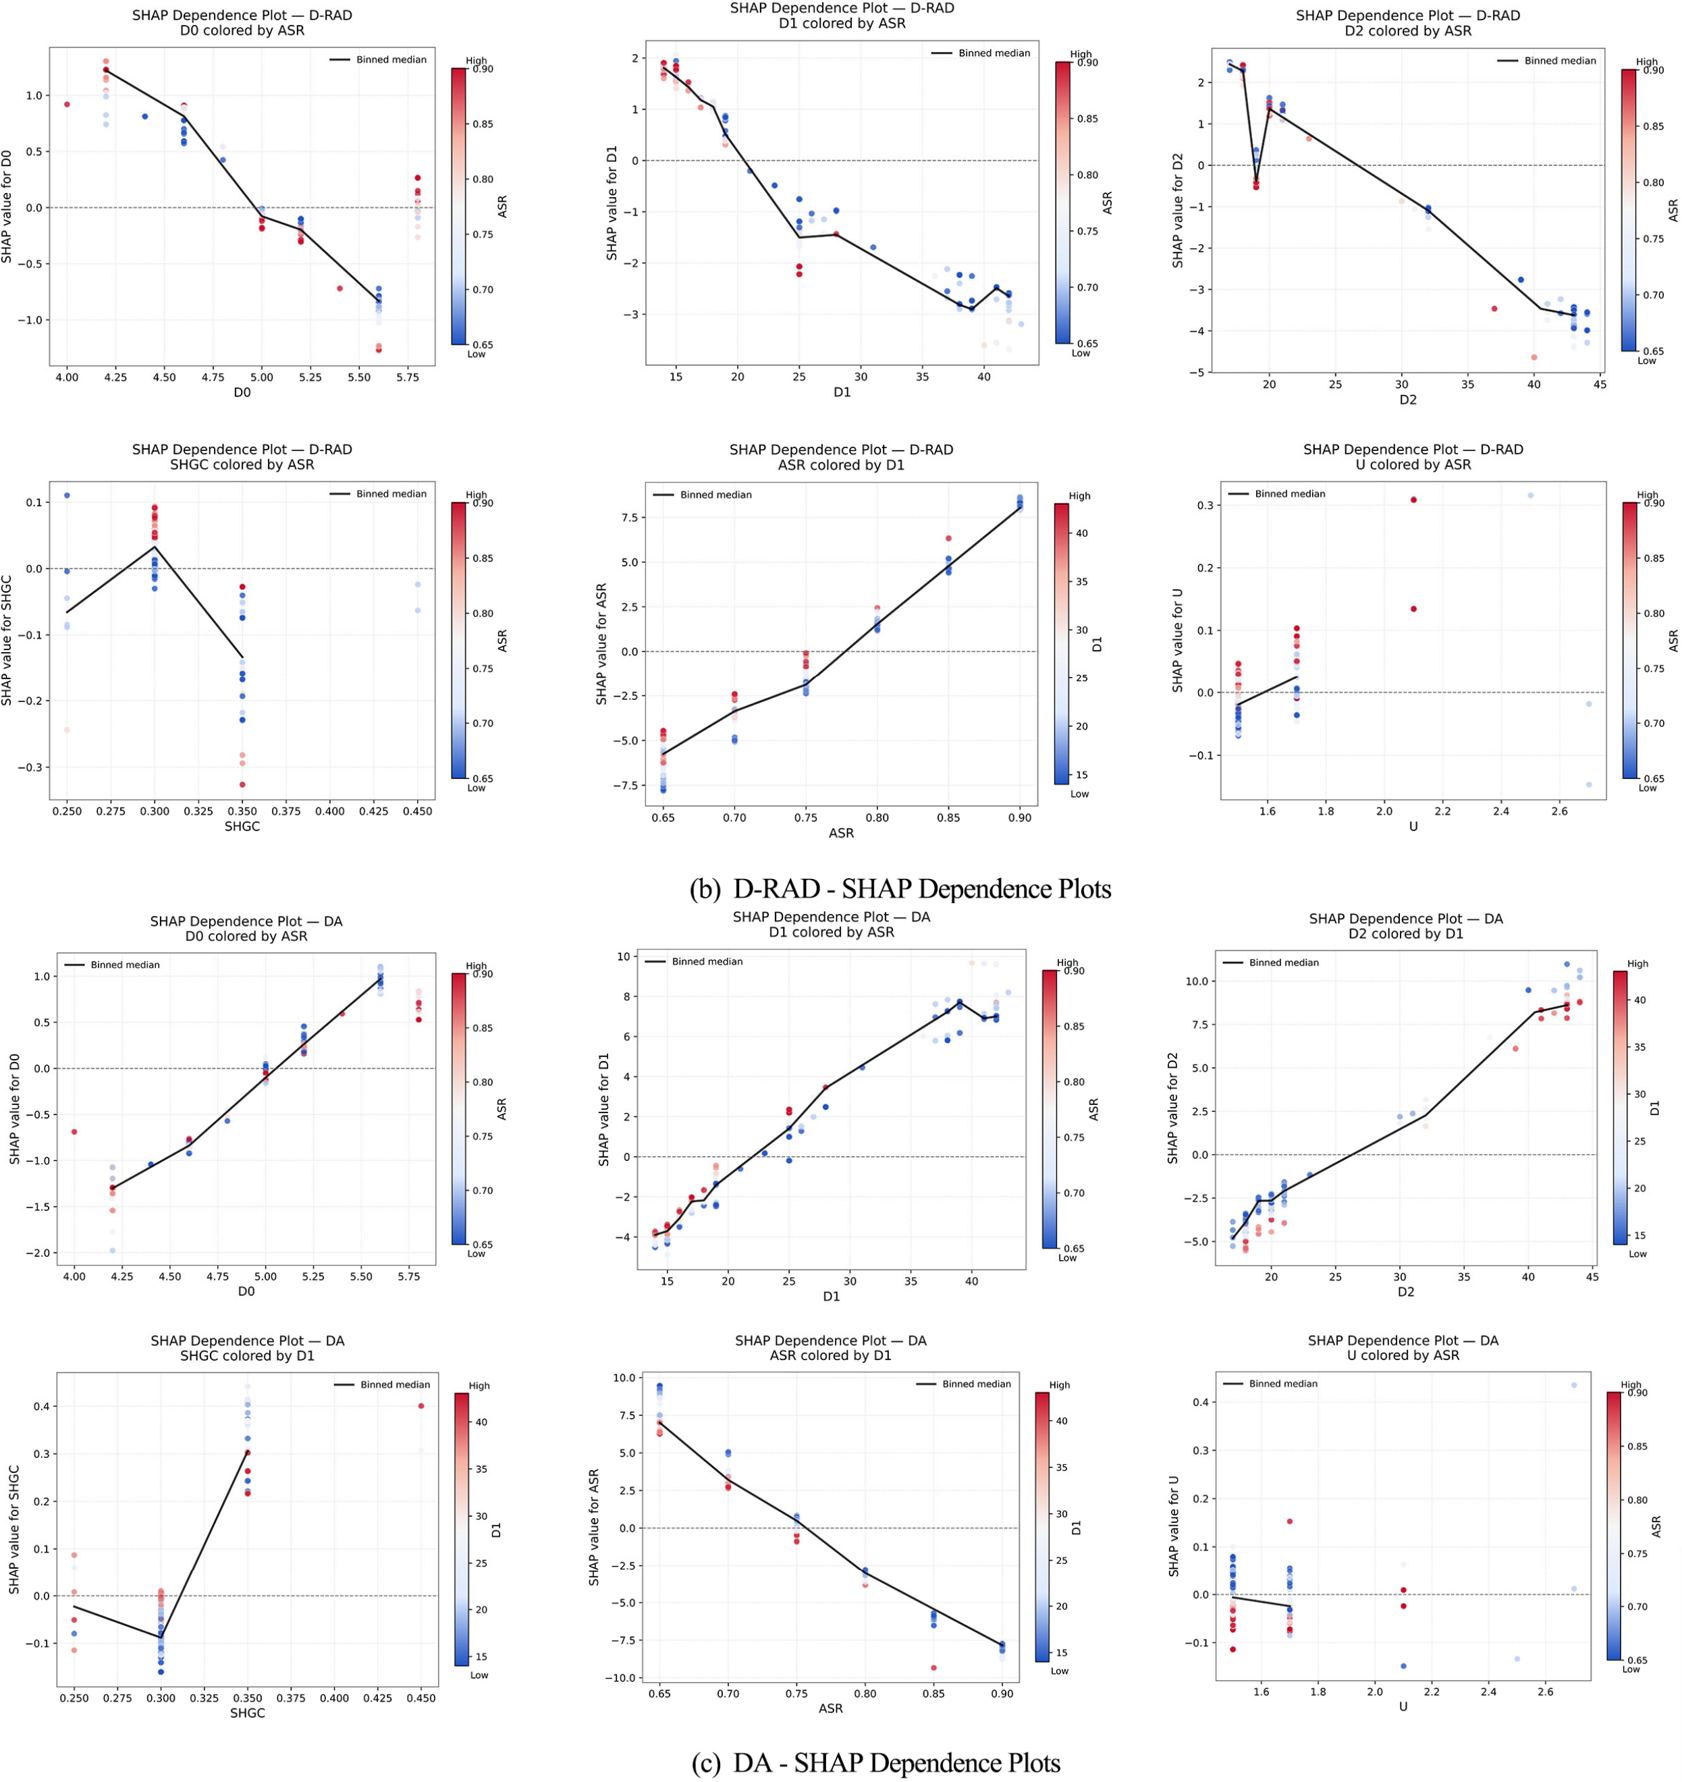
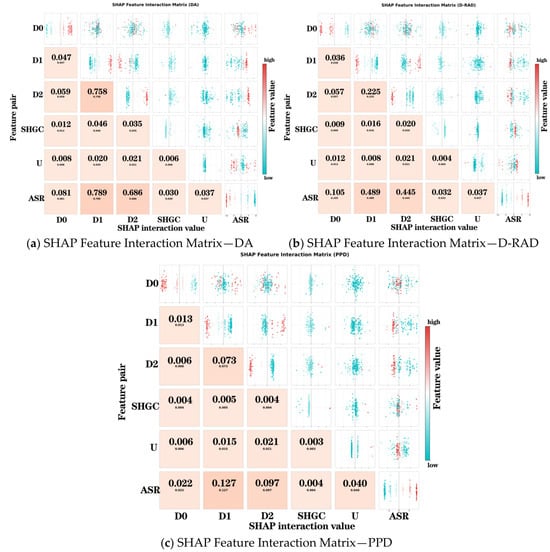
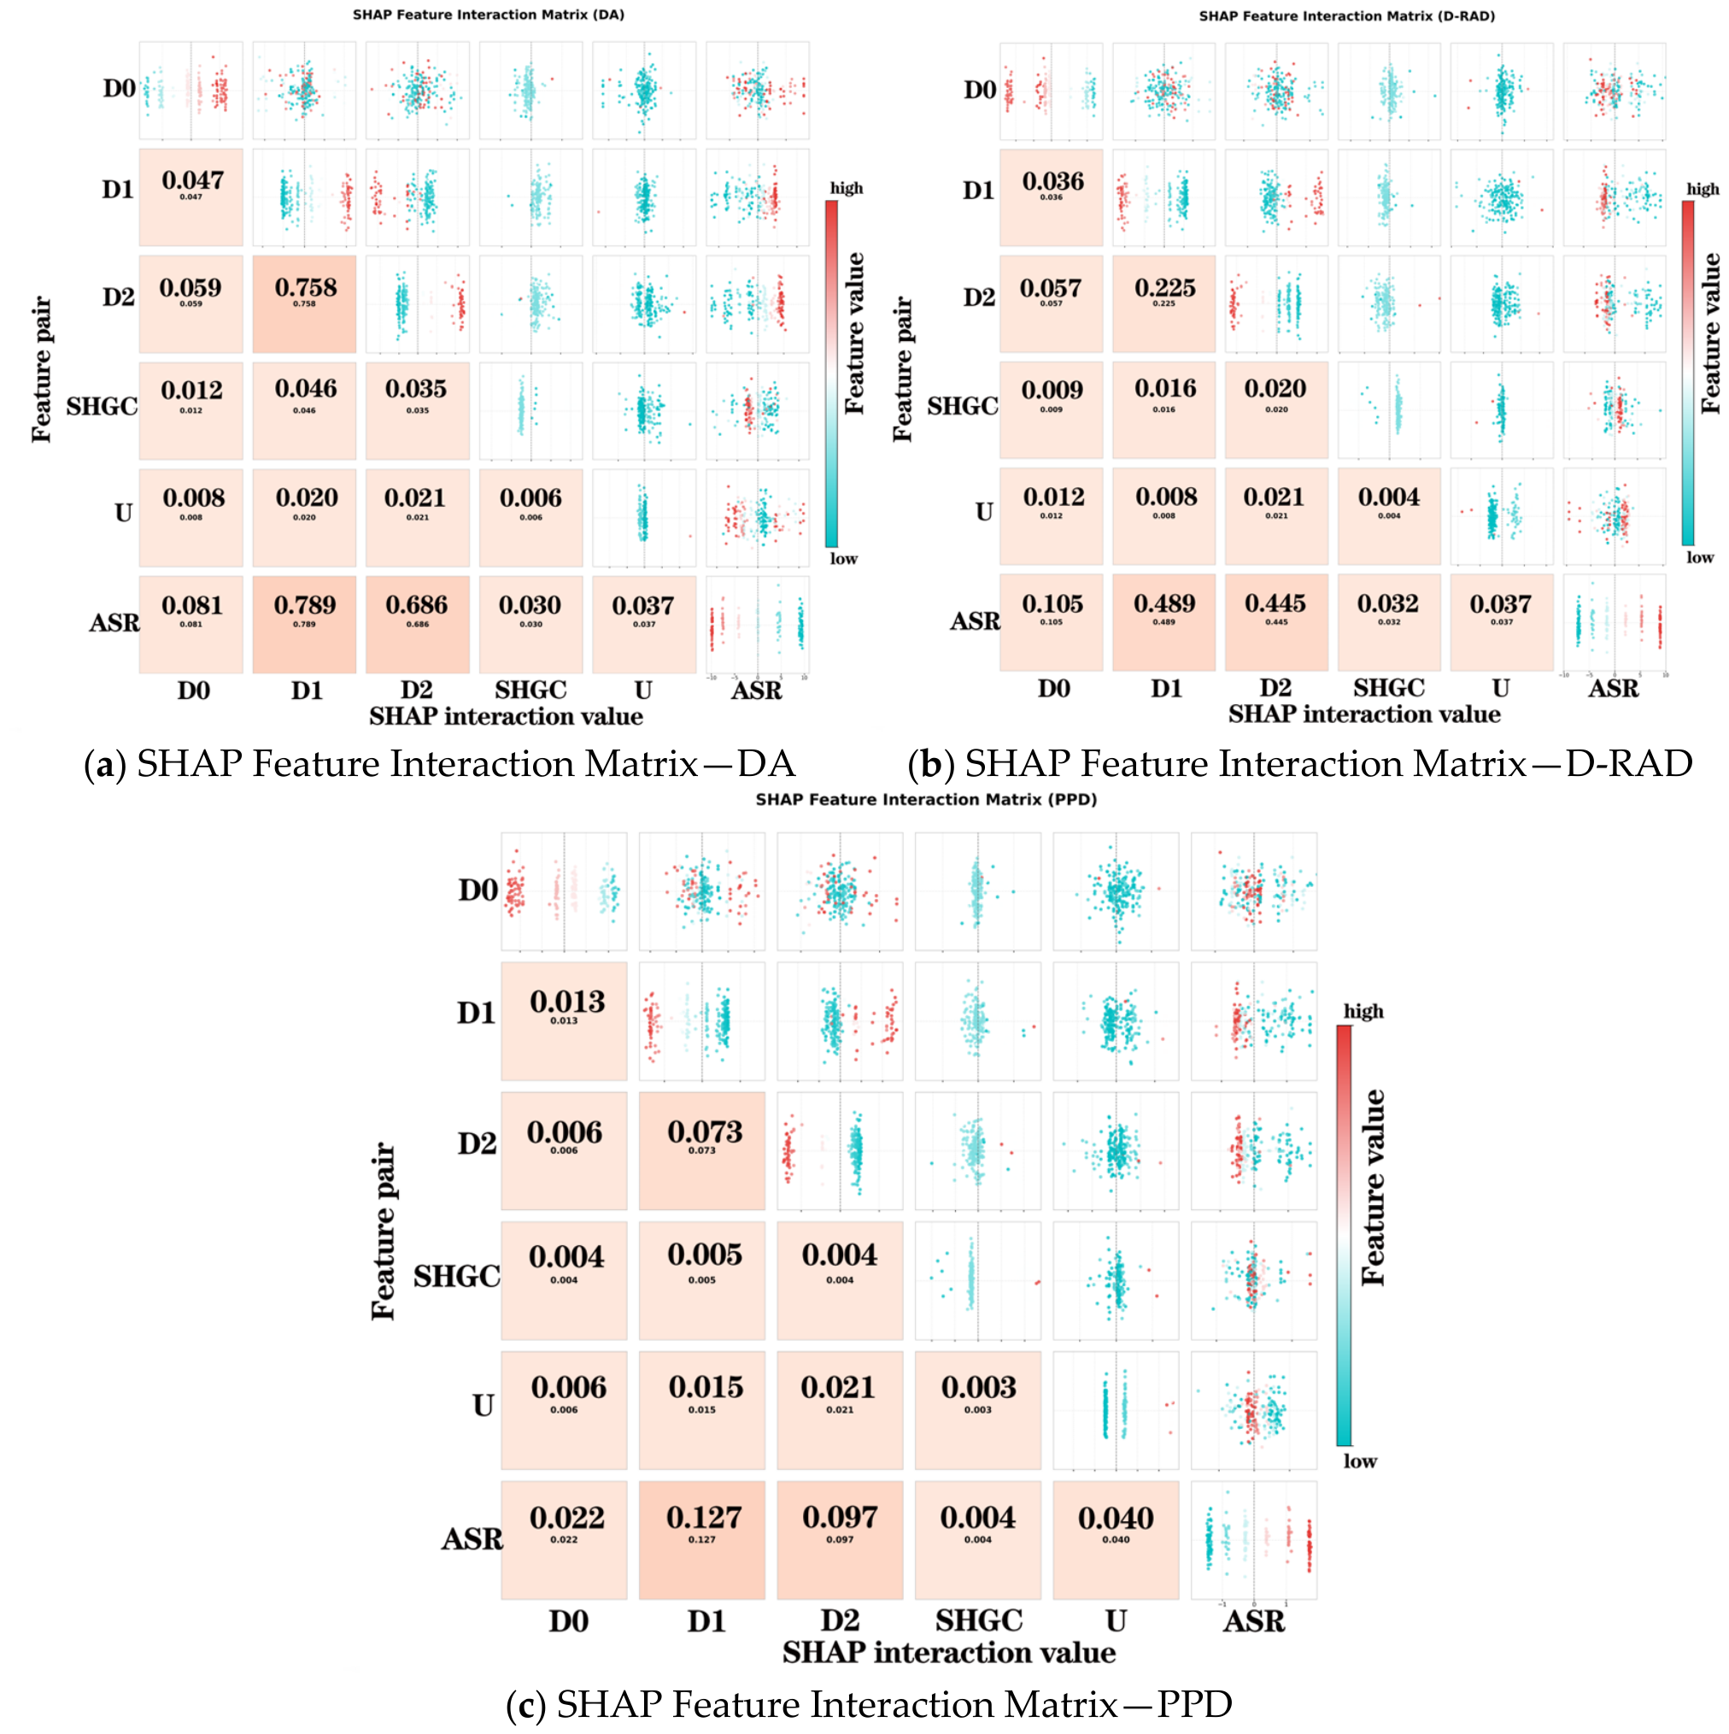
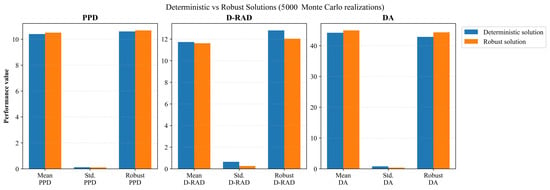
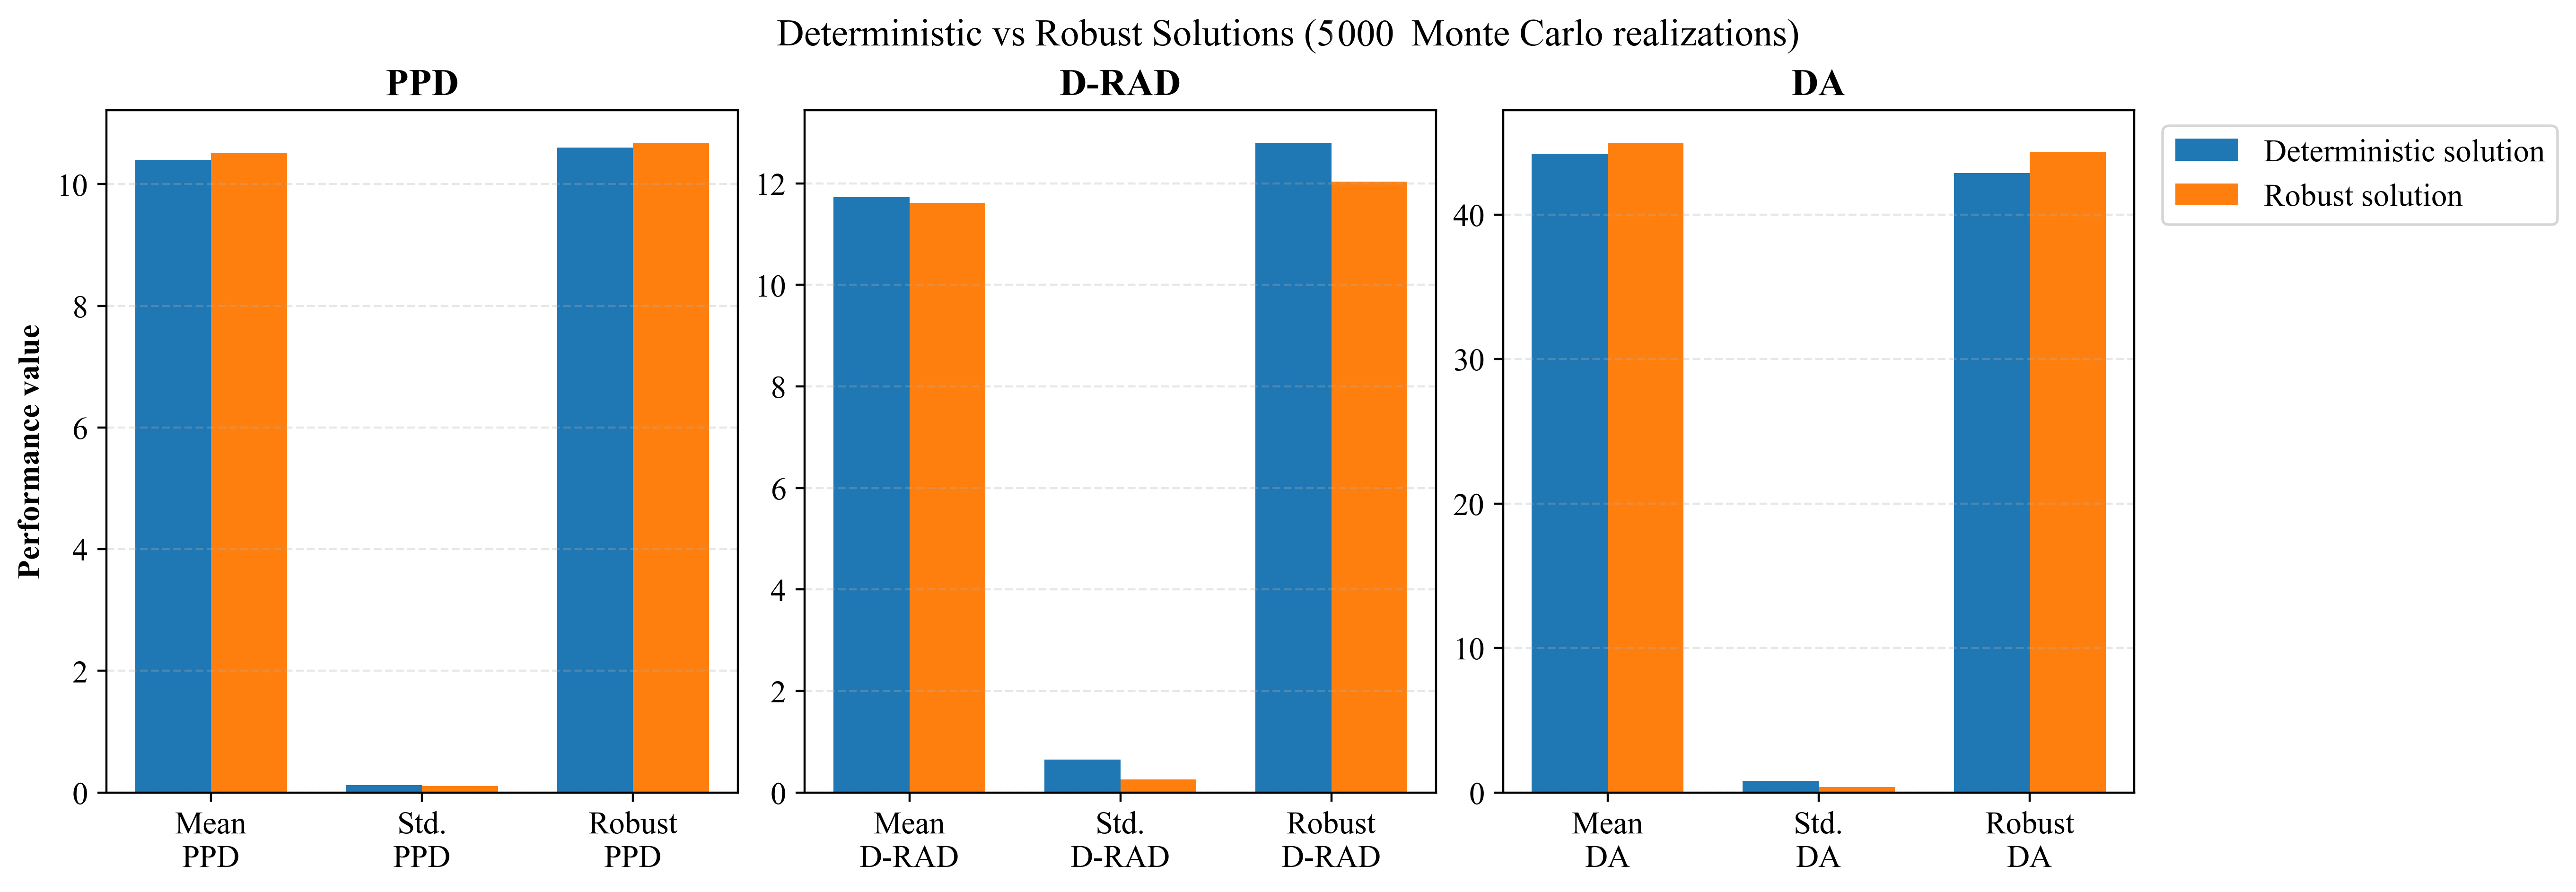
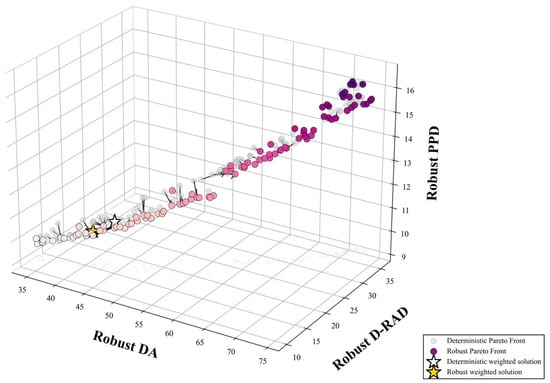
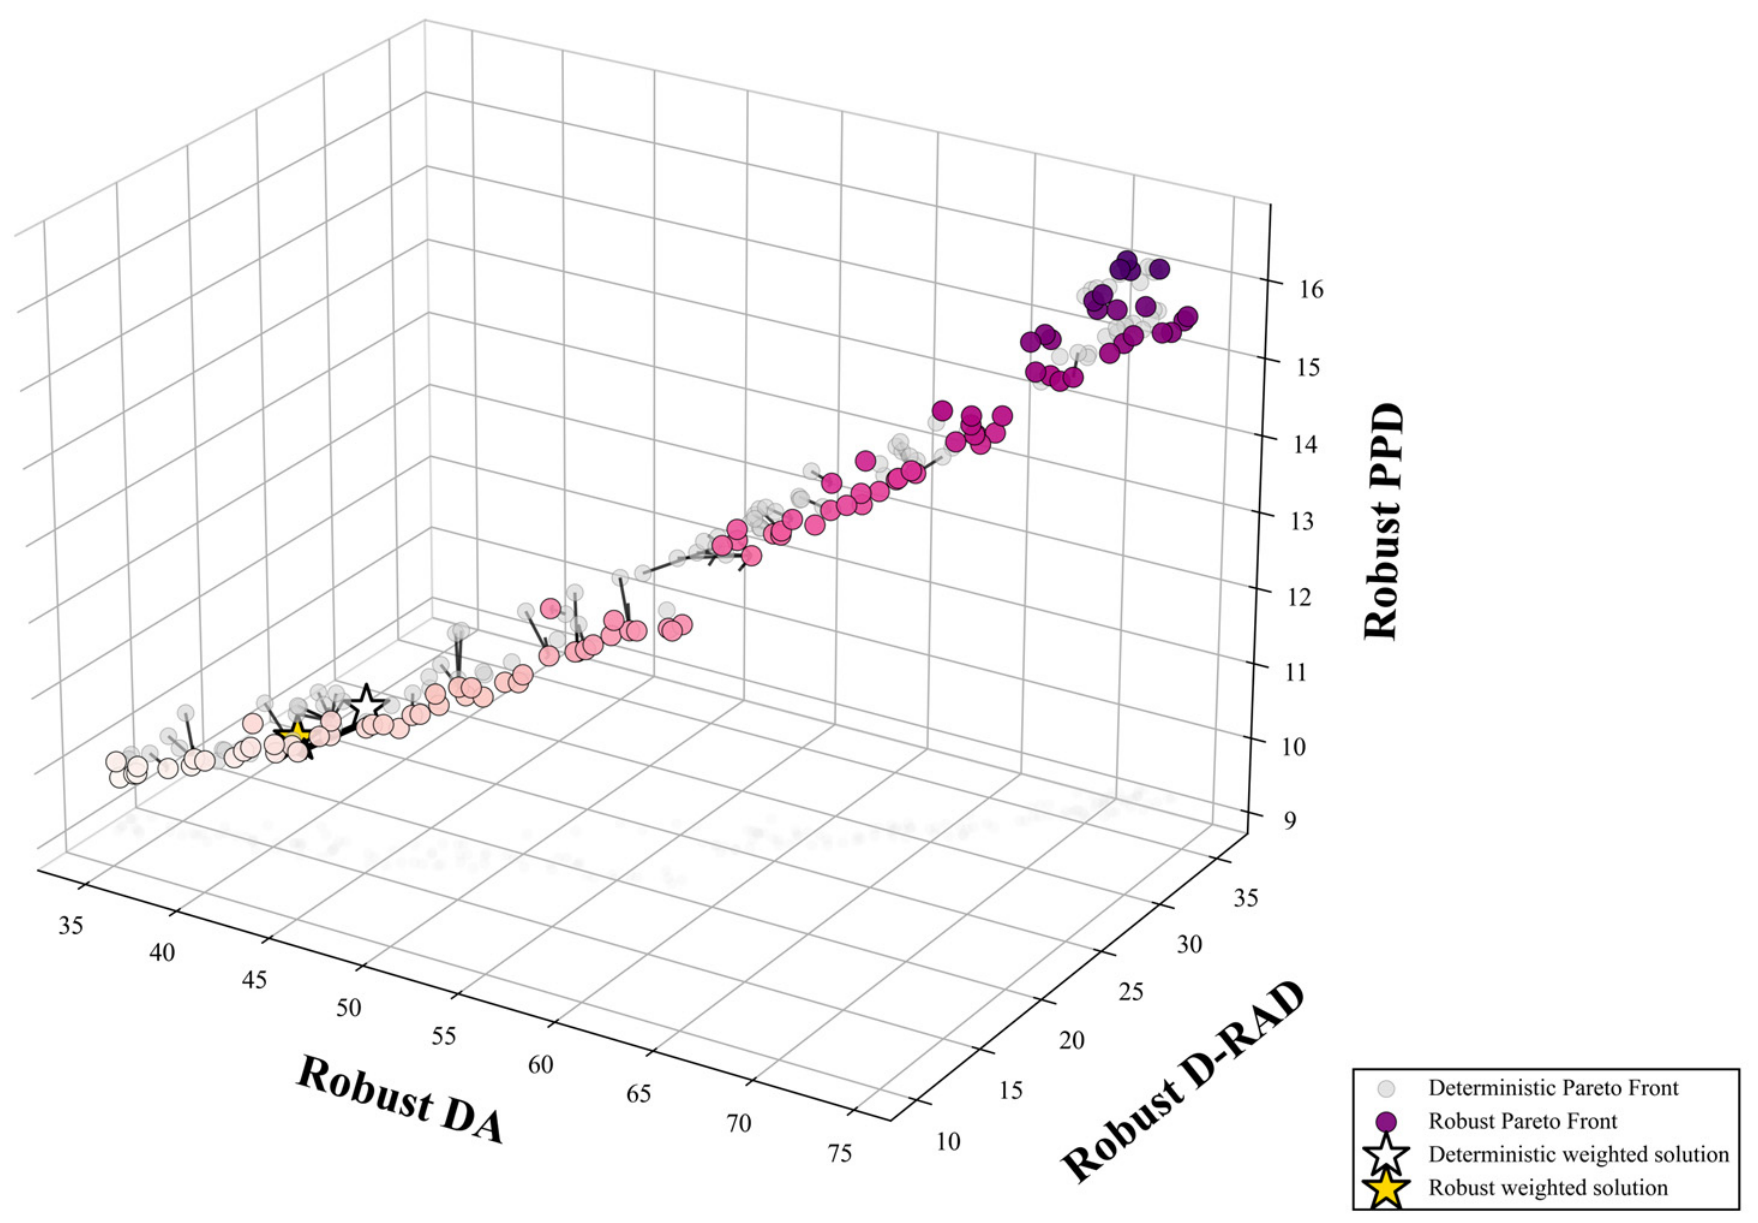
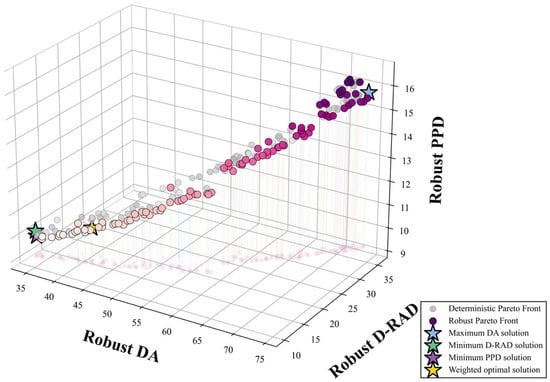
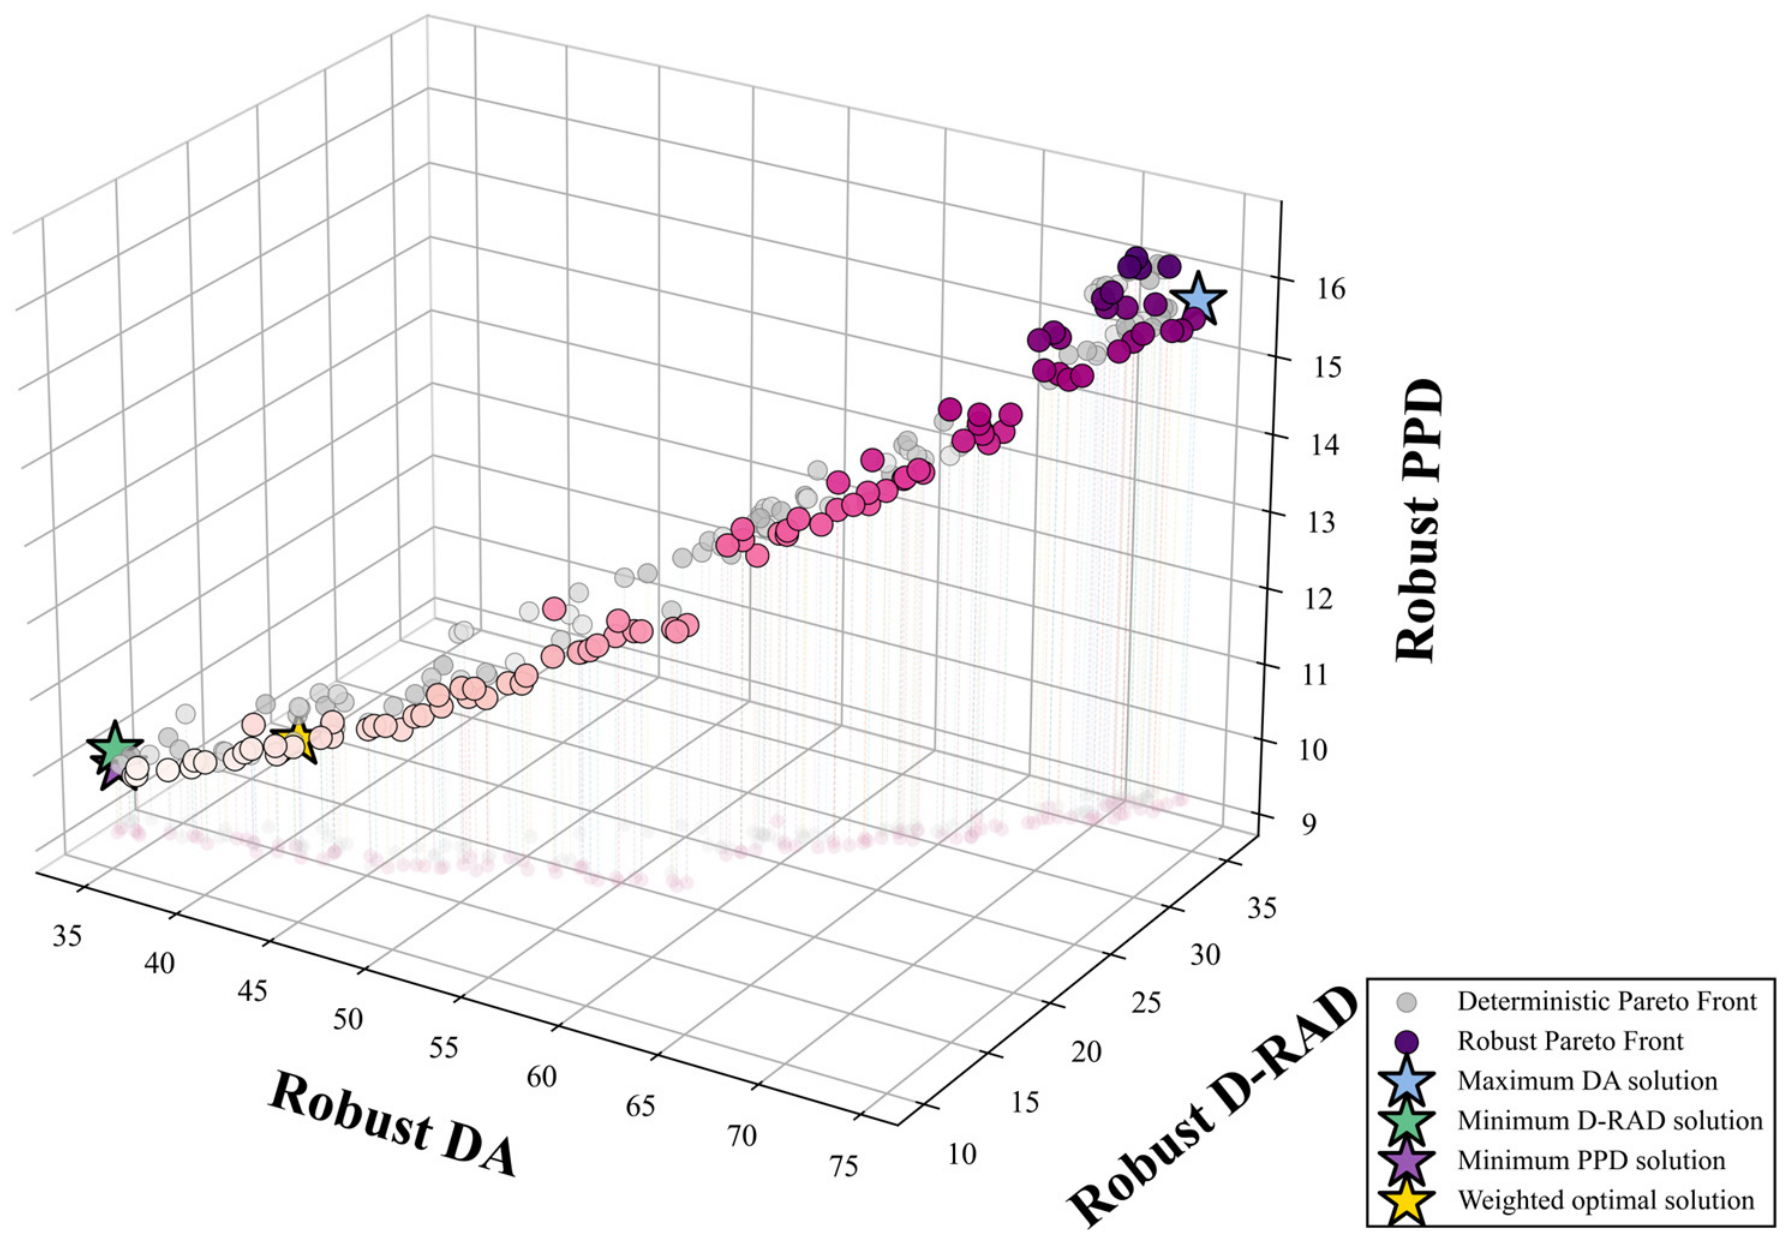
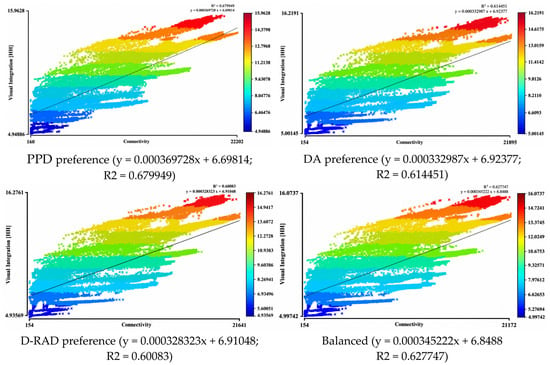
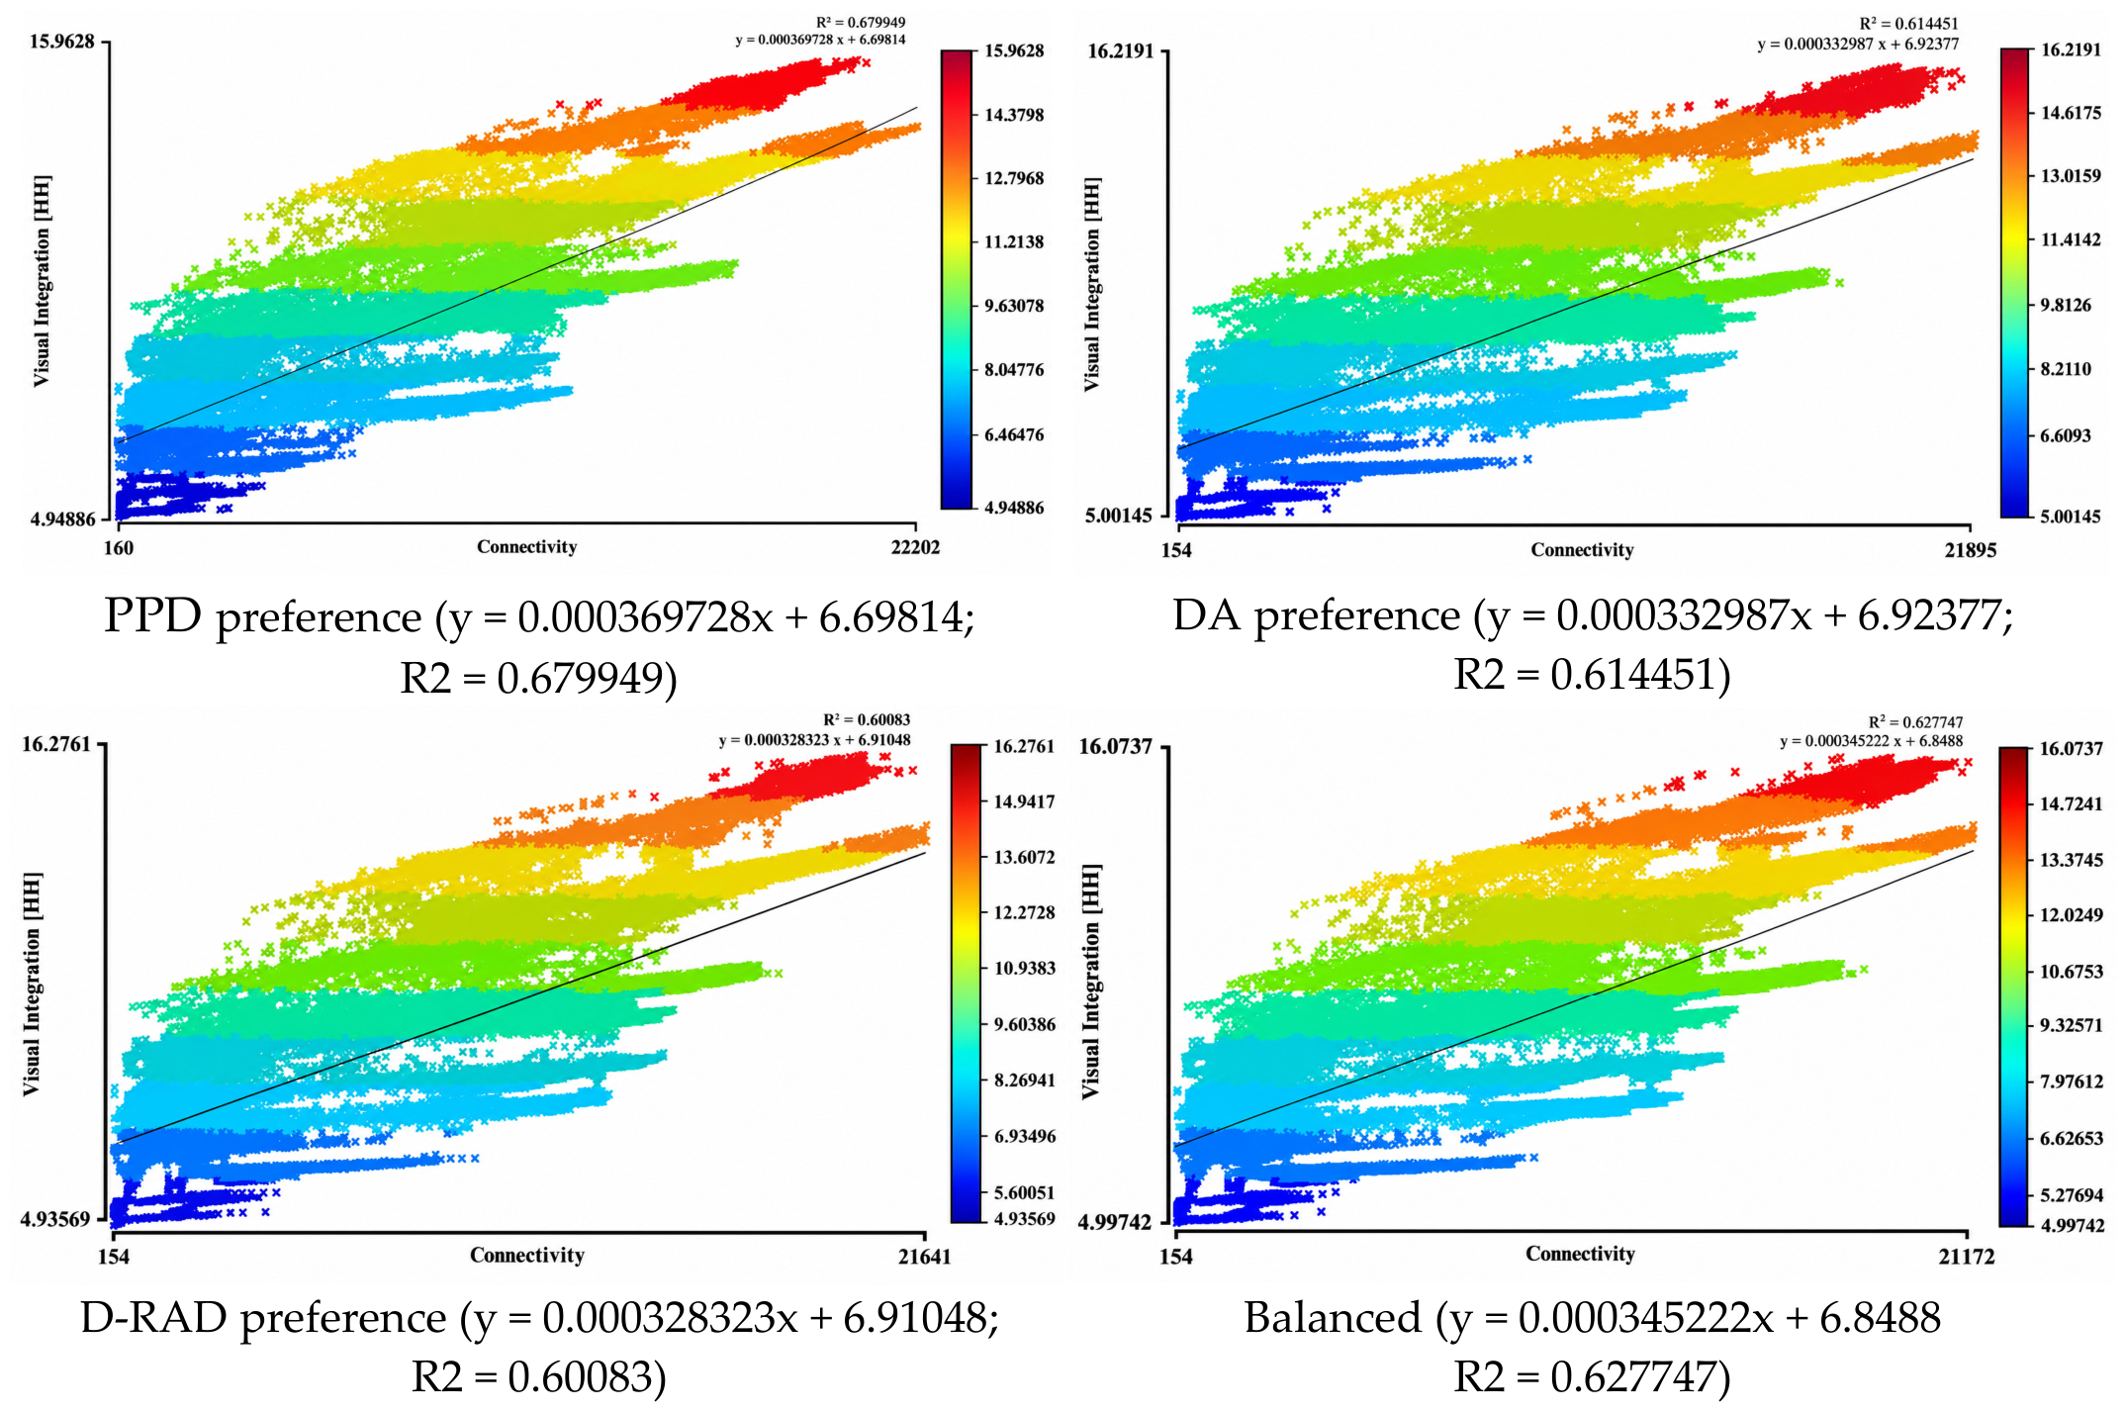
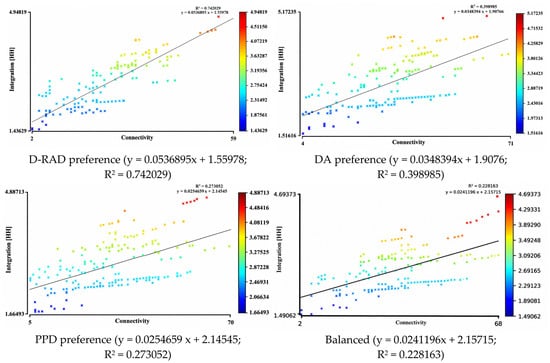
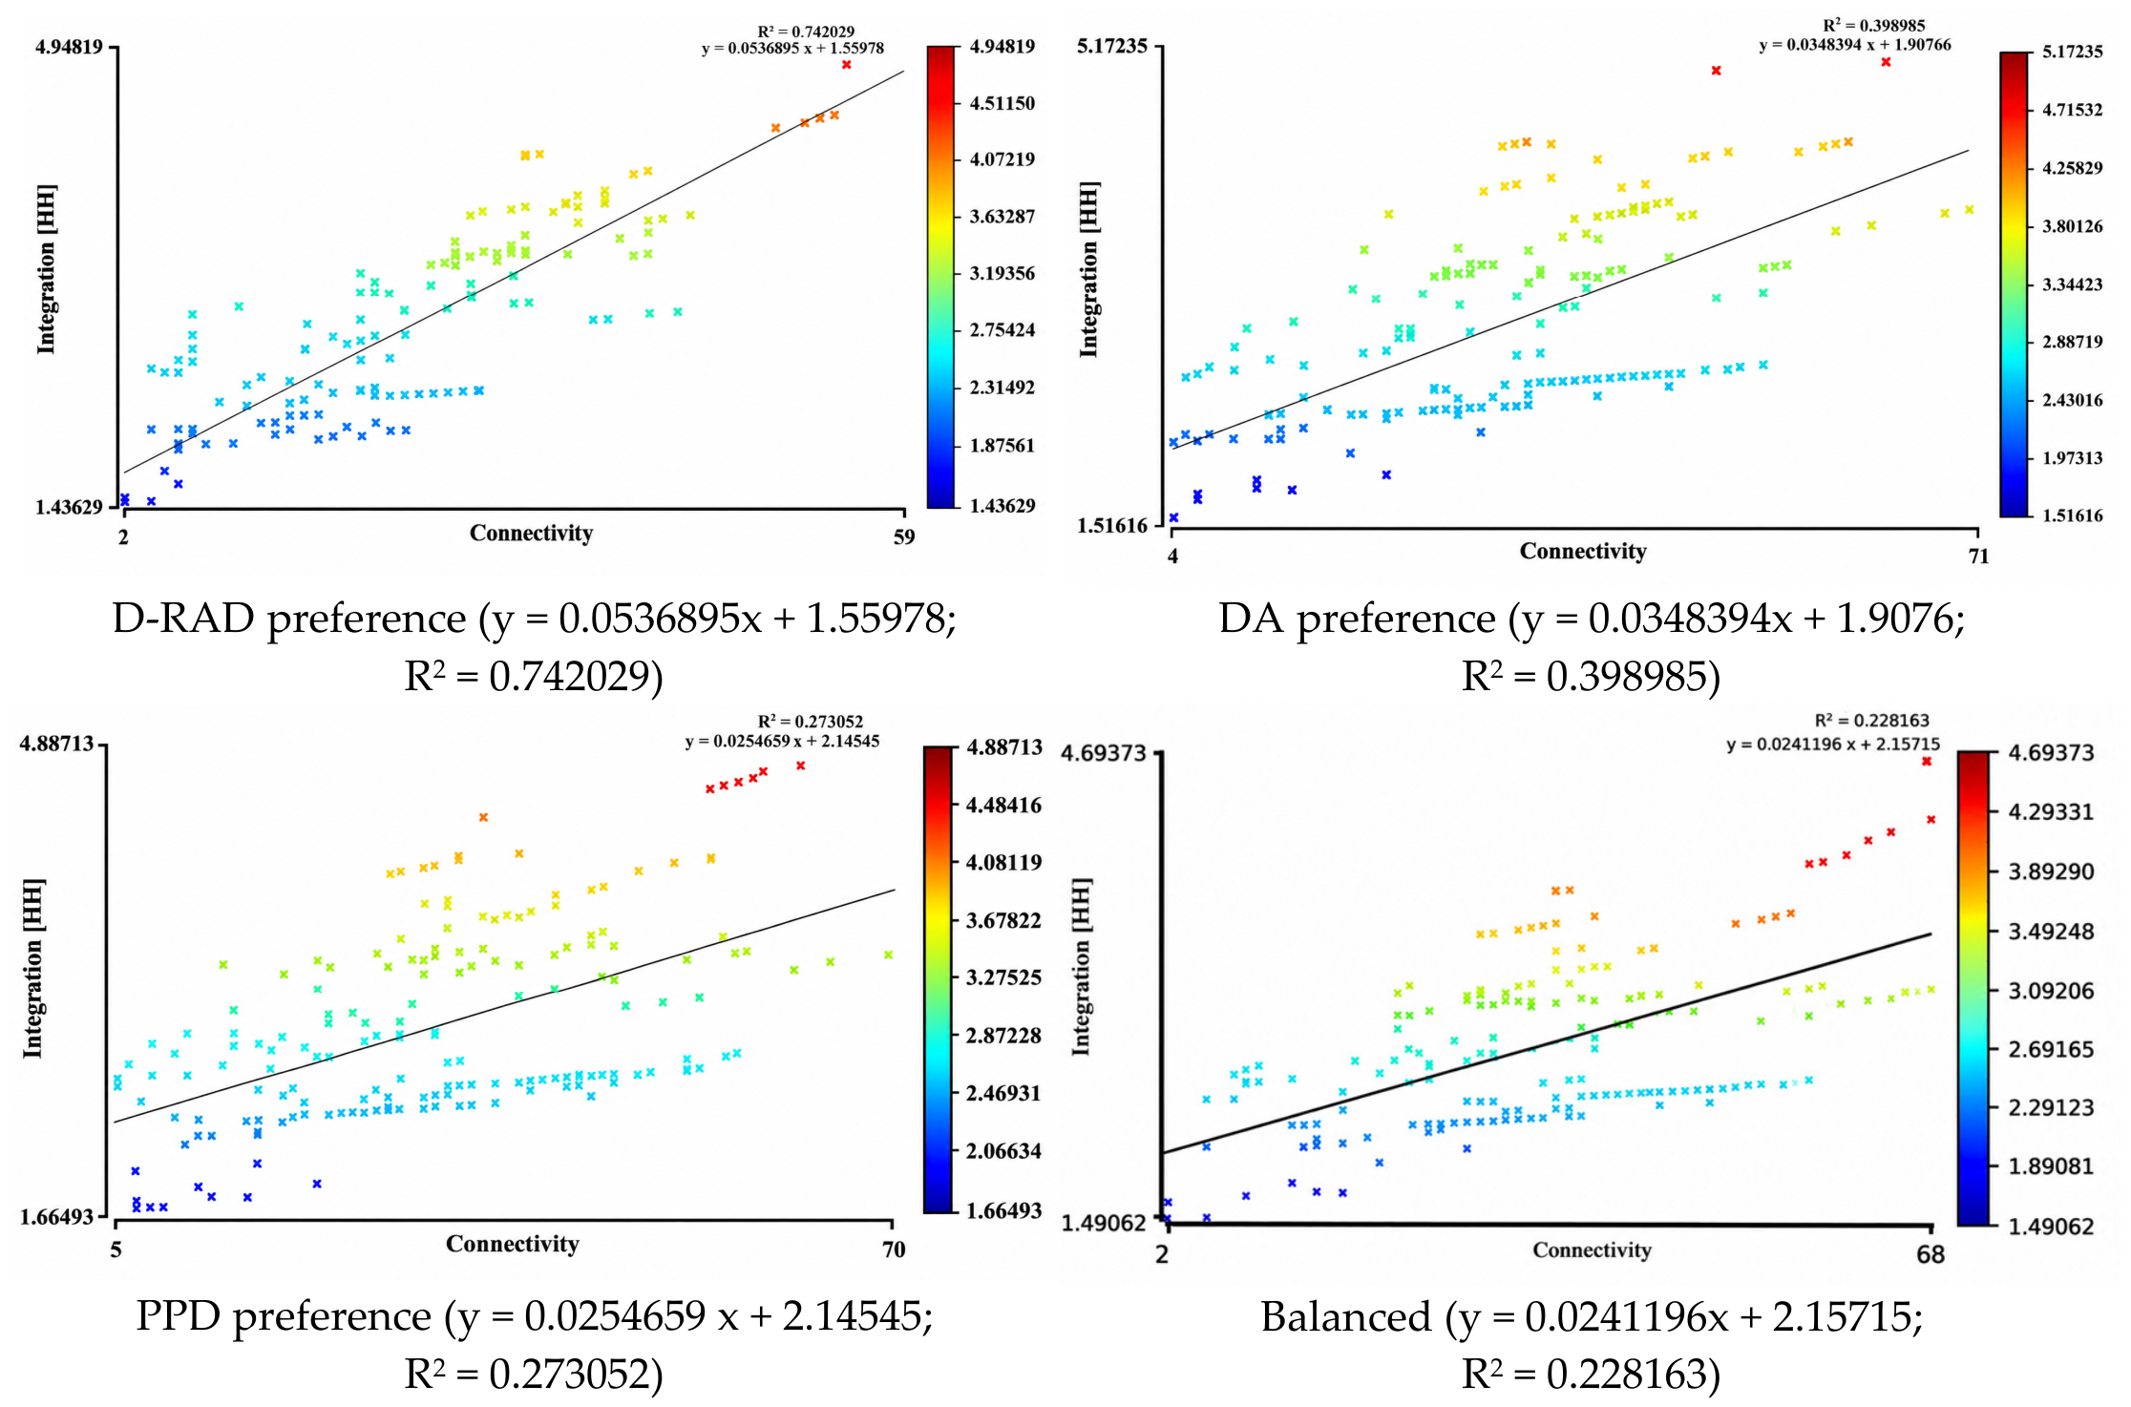

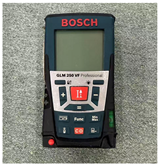
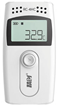
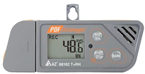
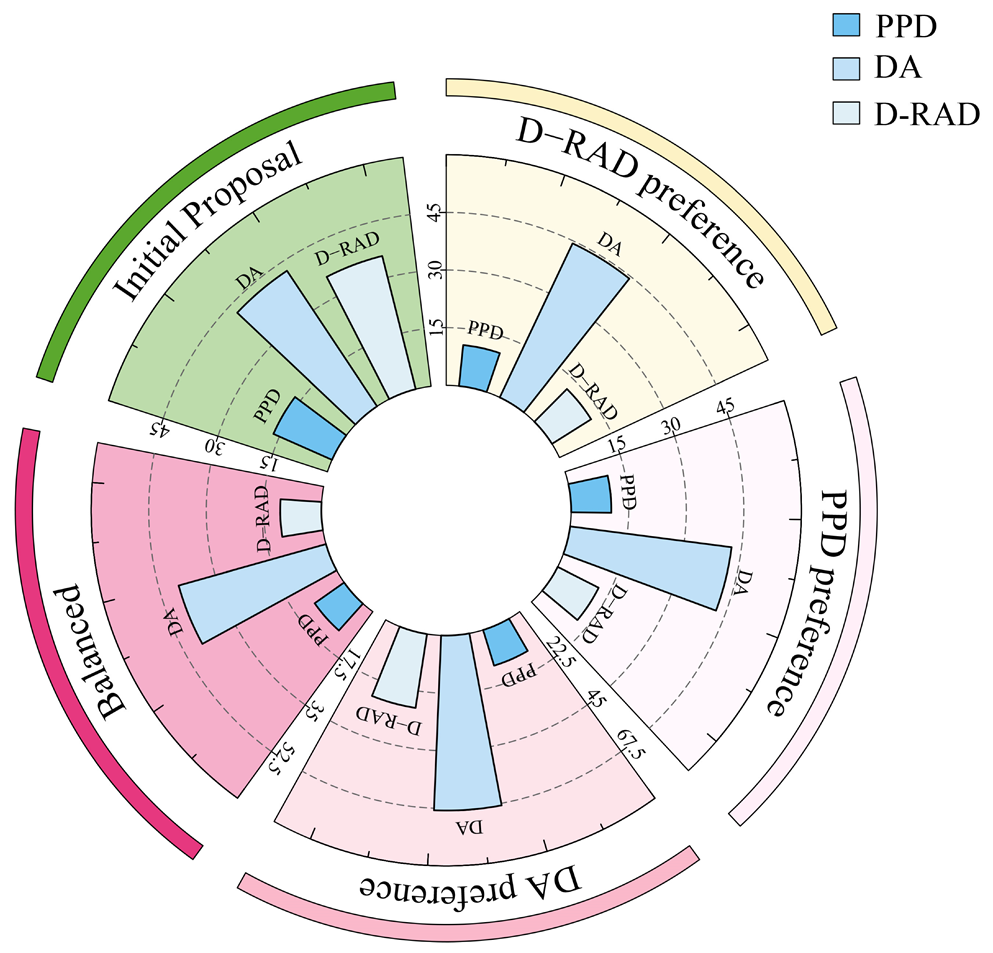
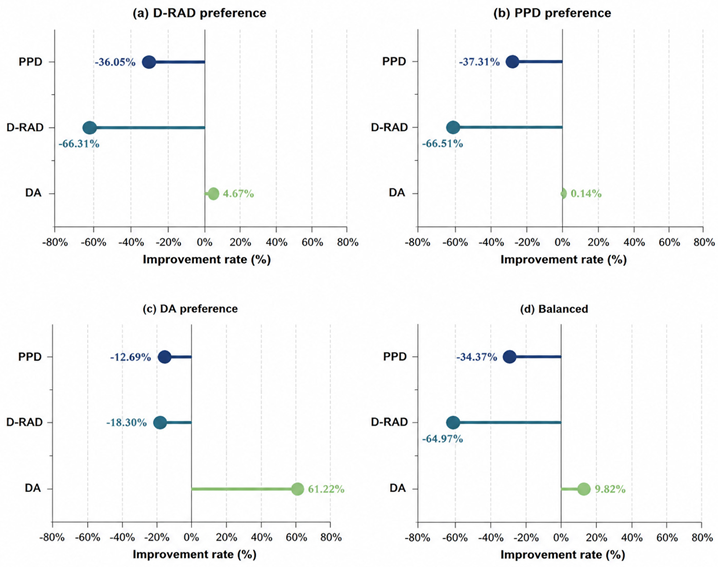
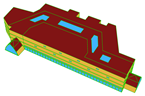
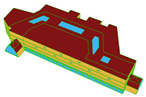
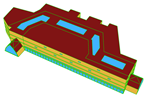
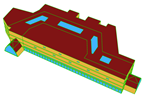
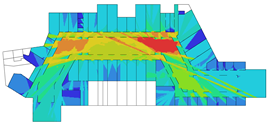
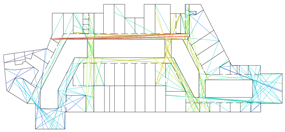
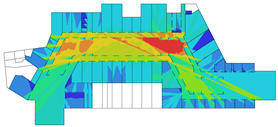
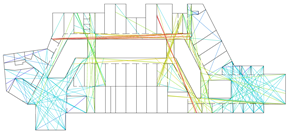
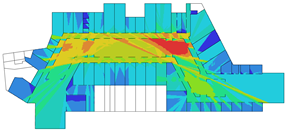
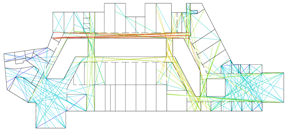
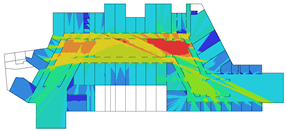
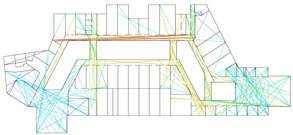
Disclaimer/Publisher’s Note: The statements, opinions and data contained in all publications are solely those of the individual author(s) and contributor(s) and not of MDPI and/or the editor(s). MDPI and/or the editor(s) disclaim responsibility for any injury to people or property resulting from any ideas, methods, instructions or products referred to in the content. |
© 2026 by the authors. Licensee MDPI, Basel, Switzerland. This article is an open access article distributed under the terms and conditions of the Creative Commons Attribution (CC BY) license.