


Abstract
Polymer-modified cementitious repair mortars improve adhesion and durability but usually increase cradle-to-gate (A1–A3) emissions. This study develops a performance-normalized embodied-carbon screening framework that compares repair materials on standardized functional units (1 m3, 1 kg dry mix, 1 m2 repair layer) and on declared repair functions. A database of 55 studies, 141 mixture records, and 243 endpoints was compiled, and 19 studies met predefined criteria for quantitative extraction. Two within-study case studies were analyzed, and emission factor and test-result uncertainties were propagated by Monte Carlo simulation. In epoxy-modified mortars (reconstructed inventory) exposed to sulfuric acid, modification reduced mass loss by 57.9–96.0% but increased emissions from 264 to 422–857 kg CO2e/m3; the 5% resin mixture had the lowest incremental carbon cost and the 20% mixture the lowest deterioration-rate-normalized GWP in >99% of simulations. In styrene–butadiene rubber mortars, the cationic latex reduced the chloride migration coefficient by 31.5% and, with a regional EPD, lowered the chloride-normalized GWP by 26%; this advantage is lost above a latex emission factor of 2.66 kg CO2e/kg. In a geopolymer benchmark, a declared desirability index ranked one of the same two mixtures first in all predefined scenarios. The framework supports screening rather than definitive ranking.
1. Introduction
Repair mortars are fundamental to restoring deteriorated concrete surfaces, protecting reinforcement, improving local load transfer, and extending the useful service life of existing infrastructure. Concrete is the principal material for infrastructure worldwide; global cement and concrete use continues to grow, particularly in rapidly developing regions [1]. However, concrete’s inherent brittleness and heterogeneous porous microstructure confer high permeability and crack sensitivity, making it vulnerable to environmental deterioration [2]. The resulting maintenance and replacement costs are substantial: in the United States, roughly 7.5% of 617,000 bridges have structural deficiencies, with an estimated cumulative repair demand of USD 125 billion [3].
In practice, the sustainability benefit of a repair intervention is not determined only by the embodied carbon of the repair material itself. A material with higher cradle-to-gate emissions may still reduce embodied carbon if it improves bond, lowers permeability, delays chloride or sulfate ingress, reduces shrinkage cracking, or extends the maintenance interval. This issue is especially relevant for polymer-modified systems because the polymer phase often contributes a relatively high material-level carbon intensity but also provides performance functions that ordinary cement-sand mortars may not achieve [4,5].
The construction sector is a major source of global energy use and greenhouse-gas emissions, and cement production is a dominant contributor to the embodied carbon of cementitious materials. Cement manufacturing is one of the most energy-intensive sectors, consuming approximately 12 EJ globally—about 3% of global energy consumption—and accounting for about 6% of global greenhouse-gas emissions [6]. The calcination process for clinker production accounts for a large portion of total emissions, while thermal energy and electricity use also contribute substantially [7]. The production of ordinary Portland cement, which contains more than 90% clinker, generates on average about 842 kg CO2 per tonne of clinker [8]. With annual global concrete production expected to continue rising, decarbonization of the cement and concrete sector remains an urgent sustainability priority [9].
At the same time, aging infrastructure creates a growing need for repair, overlay, and rehabilitation materials. Traditional cement-based repair materials may suffer from shrinkage, long curing times, unstable strength development, and poor bonding at the repair–substrate interface [10]. The environmental question is therefore not only how to reduce the carbon footprint of each cubic meter of repair mortar, but how to minimize the carbon required to deliver a specified repair function for a specified design period.
Polymer-modified cementitious materials can improve adhesion, flexibility, cohesion, crack bridging, water resistance, chemical resistance, and durability [11,12]. Polymer modification is regarded as an effective route to enhance durability and interfacial performance of cement-based materials because the adhesion and film-forming ability of polymers can increase cohesion among phases, improve interfacial bonding, and enhance tensile strength, toughness, and long-term durability [13]. Widely used synthetic polymers include styrene–butadiene rubber, waterborne polyurethane, polyacrylate, vinyl acetate–ethylene copolymer powder, waterborne epoxy, and polyvinyl alcohol [14].
The extracted literature dataset shows a broad formulation space that includes water-dilutable epoxy resins, styrene–acrylic and styrene–butadiene latex systems, vinyl acetate–ethylene copolymer powders, polyvinyl alcohol, hydrophobic silane/silicone modifiers, self-healing epoxy microcapsules, hybrid fiber/polymer gel mortars, and alternative binders such as one-part alkali-activated mortars and metakaolin–slag geopolymers [12,13,14,15,16,17,18,19,20,21,22,23,24,25,26,27,28,29].
This broad formulation space creates a methodological problem. Published studies report mixture proportions using inconsistent bases such as kg/m3, cement-to-sand ratios, polymer-to-cement ratios, water-to-binder ratios, percentage replacement, and orthogonal factor levels. Performance endpoints also differ across studies and include compressive strength, flexural strength, bond strength, setting time, flow value, capillary water absorption, chloride migration, carbonation resistance, sulfate resistance, shrinkage, mass loss, healing efficiency, and high-temperature residual strength. Without standardization, a mixture with high polymer content may appear environmentally unfavorable on a mass basis even if it provides substantial durability gains per repair layer or per unit service period.
Recent studies demonstrate that polymer-modified repair mortars can achieve significant performance improvements. For example, ion-exchange functionalized waterborne acrylate copolymer-modified mortar has been reported to improve interfacial shear strength, flexural bond strength, compressive strength, flexural strength, chloride migration resistance, and carbonation resistance [30]. A chloride-exposure study reported an increase in estimated service life from 14.9 years for a reference mortar to approximately 21–35 years for selected polymer-modified mortars [31]. These service-life values should not be generalized across all polymer-modified mortars, but they illustrate why durability benefits must be considered when evaluating repair-material sustainability. At the microstructural level, polymer-modified mortars disperse a polymer phase throughout the matrix, sealing pores and microcracks formed during hardening; beyond improved chemical resistance, polymers can also enhance workability at lower water-binder ratios, which may improve strength and durability [32].
Life-cycle assessment is standardized through ISO 14040 and ISO 14044 and is widely used to quantify environmental impacts in the construction sector [33,34]. However, repair-material life-cycle assessment has several methodological difficulties. First, system boundaries vary from cradle-to-gate production-only analysis to cradle-to-grave or consequential assessments that include maintenance and avoided replacement. Second, functional-unit selection strongly influences conclusions; one cubic meter of material does not necessarily represent equivalent repair service [35]. Third, durability data are often reported as laboratory mass loss, absorption, migration coefficient, or cycles to deterioration rather than as validated service life. Fourth, polymer products and admixtures frequently lack product-specific environmental declarations in experimental papers. Prior research has emphasized that the choice of functional unit can substantially alter the environmental ranking of mortars [36].
The broader performance-normalized carbon efficiency concept emphasizes service life, regional carbon factors, and performance-based functional units. Durability is a fundamental aspect of sustainability because reduced maintenance and restoration can reduce material demand, energy demand, downtime, and demolition waste [37]. Product-specific environmental product declarations for cementitious repair mortars are increasingly available, and this improves the feasibility of more robust performance-normalized carbon assessments [38,39].
This study addresses the above gap by combining database-driven extraction with a performance-normalized embodied-carbon screening framework. Unlike conventional comparisons that rank repair mortars only by kg CO2e/m3 or kg CO2e/kg, this study evaluates embodied carbon relative to declared repair functions, including strength, bond, repair-layer area, and laboratory durability improvement. The contribution is methodological and quantitative: it provides a transparent workflow for converting heterogeneous repair mortar data into standardized functional units and for evaluating embodied carbon together with governing mechanical and durability functions. Three elements distinguish the framework from existing functional-unit approaches (Section 2.4): (i) the durability-normalized indicators are calculated within each source study against its own control mixture, so that specimen size, curing, exposure, and test method are held constant; (ii) emission factor and test-result uncertainties are propagated jointly to estimate the probability that a ranking is retained; and (iii) the emission factor at which a polymer-modified mixture breaks even with its control is reported, which turns a missing product-specific environmental product declaration into an explicit decision threshold. The study is intentionally positioned as a screening embodied-carbon assessment, not as a definitive commercial product ranking or a full cradle-to-grave life-cycle assessment, because many polymer products in the published literature do not report product-specific environmental declarations and laboratory durability endpoints cannot be converted directly into field service life without validation.
2. Literature Background and Research Gaps
2.1. Repair Mortar Technologies
Modern repair mortars can be broadly classified into polymer-modified cementitious mortars, epoxy-based systems, alkali-activated/geopolymer systems, and unmodified cementitious systems. Polymer-modified cementitious mortars are attractive because they combine cementitious compatibility with improved adhesion, water retention, toughness, and permeability resistance. Epoxy-based systems can provide high adhesion and chemical resistance, but cost, thermal compatibility, vapor impermeability, and carbon intensity must be considered. Alkali-activated systems may reduce Portland cement content, but require careful control of activator content, shrinkage, efflorescence, curing, and early-age strength [14,22,26,27,28,29].
Previous research on repair materials has emphasized mechanical compatibility, substrate preparation, bond mechanisms, polymer–cement film formation, waterproofing, and long-term durability [40,41,42,43,44,45,46,47,48,49,50,51]. However, many studies focus on one or two performance indicators and do not connect the measured property improvement to environmental impact. This limits the ability of practitioners to select repair materials on a functionally equivalent basis. Table 1 summarizes the repair mortar technology classes and the functional-unit issues governing their environmental ranking.
Table 1.
Repair mortar technology classes and the functional-unit issue that controls their environmental ranking.
2.2. Polymer Types and Performance Mechanisms
Polymer modification affects cementitious mortars through polymer film formation, pore blocking, interfacial adhesion, improved cohesion, and crack-bridging mechanisms. Styrene–butadiene rubber, vinyl acetate–ethylene copolymer, acrylic emulsions, waterborne epoxy systems, polyurethane, and polyvinyl alcohol have all been reported to influence mechanical and transport behavior [23,24,25,27,52,53,54,55,56,57,58,59,60,61,62,63,64,65]. The direction and magnitude of property change depend on polymer type, polymer-to-cement ratio, water-to-binder ratio, curing condition, substrate moisture state, and compatibility with cement hydration.
Recent research has clarified mechanisms underlying polymer-induced performance enhancement. Ion-exchange reactions between waterborne acrylate copolymers and cement hydration products can form chemically bonded interpenetrating networks that densify the microstructure and strengthen interfacial adhesion [30].
A recurring result in the polymer-modified mortar literature is that higher polymer dosage does not automatically produce a better repair material. Small additions can substantially improve bond or durability, while further additions may introduce air, delay hydration, reduce compressive strength, increase carbon intensity, or cause diminishing returns. For this reason, the design target should be the minimum polymer dosage that satisfies the governing repair function rather than the maximum polymer content.
Research has shown that low polymer dosages may not form continuous polymer films, leaving the interfacial transition zone more connected and crack-sensitive under freeze–thaw cycling [31]. In contrast, selected mid-to-high polymer dosages can improve freeze–thaw resistance and transport blocking. The optimum dosage is therefore exposure-specific and should be linked to performance-normalized environmental indicators rather than to polymer content alone. Table 2 summarizes the polymer classes and suitable performance-normalized indicators.
Table 2.
Polymer classes and performance-normalized indicators suitable for repair mortar assessment.
2.3. Life-Cycle Assessment Limitations in Repair Materials
As outlined in the Introduction, four methodological difficulties limit life-cycle assessment of repair materials: variable system boundaries, the strong influence of the functional unit, the use of laboratory durability proxies instead of validated service life, and the lack of product-specific environmental declarations for polymer products [33,34,35].
The broader performance-normalized carbon efficiency framework emphasizes service life, regional carbon factors, and performance-based functional units. Those concepts are retained in this manuscript as background and methodology, while numerical conclusions are kept conservative and tied to traceable extracted mixture and performance data. This avoids overstating generic polymer rankings that would require product-specific environmental product declarations, validated durability models, and consistent field-service assumptions.
2.4. Research Gaps and Objectives
Most repair mortar life-cycle assessment studies compare materials on a mass or volume basis rather than on equivalent repair function. Polymer-modified systems are often penalized for higher initial carbon without quantifying durability, adhesion, or service-life benefits. Many published mixtures cannot be compared directly because their mix designs are reported using different bases and incomplete inventories. There is also no widely adopted functional-unit framework for integrating embodied carbon, repair thickness, mechanical performance, bond, and durability proxies in polymer-modified repair mortars.
Several established approaches already relate the carbon footprint of cementitious materials to their function. Binder- and CO2-intensity indices divide binder content or emissions by compressive strength [67]; mix-design studies compare carbon-mitigation strategies at equal strength class [68]; functional units that combine strength and service life have been shown to change the environmental ranking of concretes [35,37]; and environmental product declarations of commercial repair mortars report GWP per declared kilogram of product [38,39]. These approaches suit structural concrete, where compressive strength and a specified service life define equivalence. They are less suited to repair mortars, whose governing function is often bond, impermeability, or resistance to a specific aggressive agent, and whose durability evidence usually consists of short-term laboratory endpoints obtained with study-specific protocols. Table 3 compares these approaches with the framework proposed here; the novelty lies not in the functional-unit concept itself but in its within-study application to repair-specific durability endpoints, combined with probabilistic ranking and break-even emission factors.
Table 3.
Comparison of existing function-based carbon assessment approaches with the framework of this study.
The objectives of this study are to:
- Structure a literature-based database of polymer-modified and advanced cementitious repair mortars;
- Define standardized functional units for volume, dry-mix, repair-layer, and performance-normalized comparisons;
- Calculate cradle-to-gate embodied-carbon indicators using product-specific environmental product declarations or regional life-cycle inventory values where available;
- Demonstrate performance-normalized carbon analysis through two within-study case studies: epoxy-modified mortars under sulfuric acid exposure and SBR-modified repair mortars under chloride and freeze–thaw exposure;
- Quantify the effect of emission factor and test-result uncertainty on the indicators and rankings, together with repair-layer thickness effects; and
- Show how transparent multi-criteria desirability ranking, including weight and normalization sensitivity, can be applied to alternative-binder mixtures.
No mathematical optimization model (an objective function with constraints solved over a continuous design space) is formulated in this study. The terms “best-ranked” and “preferred” refer to the highest-ranked alternative among the tested mixtures under an explicitly declared decision rule.
3. Scope, System Boundary, and Database Construction
3.1. System Boundary and Assessment Position
The numerical examples use a screening cradle-to-gate material boundary. The analysis includes raw-material quantities multiplied by constituent emission factors but excludes transport to site, substrate preparation, mixing equipment, curing energy, installation losses, future maintenance, demolition, end-of-life treatment, and avoided replacement of the parent concrete element. In the modular notation of EN 15804 [69], the calculated values correspond to modules A1–A3 only. These stages are important for final comparative or consequential life-cycle assessment; however, they cannot be extracted consistently from the available experimental literature. Therefore, the results are interpreted as embodied-carbon screening indicators for material selection rather than complete life-cycle rankings. Statements about repair recurrence, maintenance, or avoided replacement would require modules B3–B5 and C1–C4; in this study they appear only as conditional break-even checks (Section 5.3 and Section 5.4 and Appendix B), not as life-cycle results.
3.2. Systematic Database-Construction Protocol
The database was constructed using a reproducible screening protocol. Searches were performed in publisher platforms and scholarly databases including ScienceDirect, SpringerLink, MDPI, Taylor & Francis, Google Scholar, Crossref/DOI look-up pages, and EPD program/operator databases. Search strings combined repair-material terms with polymer and sustainability terms, including: “polymer-modified repair mortar”, “cementitious repair mortar”, “waterborne epoxy cement mortar”, “SBR latex mortar”, “acrylic modified mortar”, “VAE redispersible powder mortar”, “PVA modified mortar”, “alkali-activated repair mortar”, “geopolymer repair mortar”, “sulfate resistance”, “acid resistance”, “bond strength”, “shrinkage”, “water absorption”, “life-cycle assessment”, “environmental product declaration”, and “global warming potential”.
Records were retained in the index when they reported at least one usable mixture proportion, modifier dosage, repair mortar functional endpoint, durability endpoint, or environmental factor. Records were excluded when they lacked mixture proportions, reported only qualitative discussion, focused on non-repair bulk concrete without transferable mortar information, duplicated another source, or used performance endpoints that could not be connected to a functional unit. Screening was performed in four stages: identification of candidate sources, title/abstract screening, full-text eligibility checking, and data extraction. The resulting index contains 55 studies. A study was selected for curated quantitative extraction only when it met all of the following criteria: (C1) a DOI-traceable, peer-reviewed source; (C2) numerical values, not only graphical results, for the quantities to be extracted; and (C3) at least one of (a) a complete or reconstructable mixture inventory, (b) a mechanical, bond, or durability endpoint reported for modified mixtures together with a control mixture tested under the same protocol, or (c) a material-level emission factor or binder information needed for carbon calculation. Eighteen studies satisfied C1–C3 in the original curation; the SBR mortar study used for the second case study [70], which belongs to the index, was added to the curated subset during the revision because it reports chloride migration and freeze–thaw endpoints together with a control mixture (Table 4). The other 36 indexed studies were used only for the qualitative synthesis in Section 2 and Section 5.6.
Table 4.
Curated studies with authors and DOI links used for the database-driven analysis.
For each retained source, extraction rules were applied consistently. Mixture quantities were recorded in their original form, units were preserved, and conversion eligibility was classified as direct 1 m3 inventory, reconstructable 1 m3 inventory, 1 kg dry-mix normalization, repair-layer scaling, performance-only extraction, or unsuitable for quantitative normalization. Extracted fields included study ID, authors, year, DOI, material system, modifier type and dosage, cement/binder/sand/aggregate/water quantities, functional unit, performance endpoint, exposure condition, data-source table or figure, emission factor status, and notes on assumptions. When product-specific environmental product declarations were unavailable, the factor was labeled as a proxy and retained only for sensitivity analysis.
The curated subset is purposive rather than exhaustive: it was assembled to demonstrate and test the normalization workflow, not to estimate an average carbon or performance effect of polymer modification. All 19 curated studies are open-access MDPI articles published between 2022 and 2026. This reflects criterion C2, because recent open-access articles more often provide complete numerical mixture tables, but it also introduces publisher and recency bias, so the subset should not be regarded as representative of the whole field. Two features limit the effect of this bias on the conclusions. First, every performance-normalized indicator is calculated within a study relative to that study’s own control mixture; no absolute performance values are pooled across studies. Second, the quantitative conclusions concern the behavior of the indicators and decision rules in two fully documented case studies, not the prevalence of any polymer family. The database-level counts (Figure 1 and Table 5) describe the extracted literature only.
Figure 1.
Distribution of extracted mixture rows by modifier category.
Table 5.
Most frequent performance endpoints in the extracted database.
3.3. Extracted Database Structure
The structured dataset contains 55 indexed studies, 141 mixture/inventory records, and 243 mechanical, bonding, durability, and mixture-design endpoints. Each curated row includes the study identifier, authors, publication year, DOI URL, material system, original functional unit, key mixture quantities, modifier type and dosage, data-source table/figure, normalization usefulness, and notes. The Supplementary Materials provide the input data, emission factors, and Python (version 3.13.2) scripts that reproduce all case-study calculations, the Monte Carlo analysis, the geopolymer ranking, and the figures; the extracted study index is available from the author on request. Figure 1 shows the distribution of extracted mixture rows by modifier category, and Table 4 lists the curated studies used in the analysis.
4. Standardized Functional-Unit and Carbon Methodology
4.1. Functional-Unit Conversion
Four functional-unit levels were used. The first is a volume basis of 1 m3 of fresh or hardened repair material, preferred when a study directly reports kg/m3 or when density can be reconstructed. The second is 1 kg of dry mix, useful for ratio-based mortars where density is absent. The third is a repair-area basis, defined as 1 m2 of repair layer with thickness t. The fourth is a performance-normalized functional unit, in which embodied carbon is divided by a strength, bond, healing, or durability function.
Standardizing the functional unit makes inventories and carbon values comparable, but it does not make performance data obtained with different specimen sizes, curing regimes, exposure durations, and test standards directly comparable. For this reason, performance values are never compared in absolute terms across studies. Each mechanical or durability indicator (Equations (4)–(9)) is computed relative to the control mixture of the same study, which was cast, cured, exposed, and tested with the same protocol, so that protocol-specific effects largely cancel in the ratio Pi/P0. Rankings are reported only among mixtures of the same study, and the test conditions of each case study are stated in Section 5.2 and Section 5.3. Cross-study statements in Section 5.6 are qualitative.
where mi,area is the mass of constituent i required for a repair layer (kg/m2), mi,m3 is the mass of constituent i per cubic meter (kg/m3), t is repair thickness in meters, GWPmix is the cradle-to-gate global warming potential per cubic meter (kg CO2e/m3), GWParea is the corresponding value per square meter of repair layer (kg CO2e/m2), and EFi is the emission factor of constituent i in kg CO2e/kg. Table 6 presents the emission factors used in the calculations, and Table A1 summarizes the functional-unit equations for spreadsheet implementation.
4.2. Performance-Normalized Indicators
For strength-governed repair functions, the simplest normalized indicators are carbon intensity per unit compressive strength or bond strength:
For deleterious durability metrics such as mass loss, penetration depth, water absorption, shrinkage, or chloride migration, lower values are better. The relative improvement of mixture i against the control mixture 0 is calculated as
where P is the deleterious performance metric. The incremental carbon required to obtain one percentage point of durability improvement is
A second durability-normalized screening indicator was used when the measured deleterious response can be interpreted as a proxy for deterioration rate:
The GWPdur indicator is not intended to represent a direct service-life prediction, because the relationship between accelerated laboratory mass loss and field deterioration requires long-term validation. Rather, it is used as a screening metric to estimate the embodied carbon associated with an equivalent laboratory deterioration burden, under the simplifying assumption that measured mass loss is proportional to deterioration rate.
For diffusion-controlled chloride ingress, the error-function solution of Fick’s second law gives a time to reach a critical chloride concentration at a given cover depth that is inversely proportional to the apparent diffusion coefficient, provided that the surface concentration, critical concentration, and cover depth are equal [71]. Under these assumptions, the ratio of the corrosion-initiation times of mixture i and control 0 is
where t is the initiation time, and D is the chloride migration (or diffusion) coefficient. Equation (9) neglects aging of the diffusion coefficient, differences in chloride binding, and cracking; it is therefore used as a conditional indicator only. When the migration coefficient is used as P in Equation (8), GWPdur is the material-stage GWP per unit of initiation time relative to the control, and modification is carbon-favorable when ti/t0 exceeds the carbon multiplier GWPi/GWP0.
4.3. Conservative Use of the PNCE Concept
A performance-normalized carbon efficiency (PNCE) index, in which embodied carbon is divided by a composite performance index combining strength, bond, service life, and durability, is useful as a design logic, but the present manuscript uses it conservatively. Multiplying several performance ratios can over-amplify differences when variables are correlated or estimated from different studies. Therefore, the main quantitative conclusions rely on single-function indicators and transparent multi-criteria desirability rather than universal polymer-category rankings.
4.4. Uncertainty Propagation
Input uncertainty was propagated by Monte Carlo simulation with 100,000 draws (random seed 2026). The cement factor followed a triangular distribution with mode and lower limit equal to the net A1–A3 value of the regional EPD (0.523 kg CO2e/kg [72]; the gross value including emissions from waste-derived fuels, 0.700 kg CO2e/kg, lies within the sampled range) and upper limit equal to the average clinker emission of 842 kg CO2/t [8] multiplied by a clinker factor of 0.95 for CEM I (0.800 kg CO2e/kg). The waterborne epoxy factor followed a triangular distribution with mode and lower limit equal to the product EPD proxy (2.75 kg CO2e/kg [73]) and upper limit equal to the conservative model EPD (4.12 kg CO2e/kg [66]); the SBR latex factor was treated in the same way, with mode and lower limit equal to a regional EPD of an SBR latex admixture (0.578 kg CO2e/kg [74]) and upper limit equal to the model EPD for dispersion-based products (4.97 kg CO2e/kg [75]). Database proxies for fly ash, aggregates, and water were sampled from lognormal distributions with a geometric standard deviation of 1.5, consistent with pedigree-based uncertainty factors for non-specific inventory data [76]. Measured responses were sampled from truncated normal distributions: acid mass loss with the specimen-level standard deviation reported for each mixture (n = 2), chloride migration coefficients with a coefficient of variation of 13%, equal to the inter-laboratory reproducibility of the non-steady-state migration method [77], and compressive strength with a coefficient of variation of 5%. For each draw, all indicators and the resulting rankings were recalculated. Results are reported as medians, 95% intervals (2.5th–97.5th percentiles), and the probability that each mixture is ranked first. These probabilities are conditional on the assumed input distributions; they measure the robustness of a ranking under these assumptions and are not general guarantees. A ranking retained in at least 95% of draws is described as robust, one retained in 50–95% of draws as conditional, and one retained in fewer than 50% as unresolved with the available data.
Table 6.
Hybrid EPD/regional-LCI emission factors used in the calculations and the distributions assigned in the Monte Carlo analysis.
5. Results
5.1. Database-Level Observations
The extracted dataset is dominated by mechanical strength, flexural strength, flow/workability, shrinkage, water absorption, and specialized durability endpoints. Epoxy/waterborne epoxy systems, styrene–butadiene or acrylic latex systems, VAE-modified mortars, PVA-modified mortars, hydrophobic silane/silicone systems, nano-SiO2/inorganic modifiers, and alkali-activated/geopolymer systems are all represented. This diversity confirms that a single performance index is not sufficient. A repair mortar designed for sulfate resistance should not be ranked only by compressive strength, and a self-healing mortar should not be ranked only by kg CO2e/m3. Table 5 summarizes the most frequent performance endpoints in the extracted database.
5.2. Case Study 1: Epoxy-Modified Mortar Under Sulfuric Acid Exposure
The water-soluble epoxy-resin study was selected as the first numerical case because it reports mixture proportions and acid-exposure durability data [15]. The resin (a water-dilutable dispersion with approximately 41% solids) was dosed at 5%, 10%, and 20% resin solids by mass of cement, and the water carried by the dispersion was deducted from the mixing water. The acid mass-loss data used here (W-0 to W-20) are from the short-term test series of [15], which was carried out on standard cement mortar prisms rather than on the concrete cubes of the long-term series: two specimens per mixture were exposed for 6 months to sulfuric acid at pH 2, dried, brushed free of corroded material, and weighed. The source reports the per-1 m3 inventory only for its concrete mixtures (300 kg/m3 cement, 51.3 kg/m3 fly ash, 492.9 kg/m3 sand, and 1369.1 kg/m3 gravel up to 16 mm). The inventory of the tested mortar was therefore reconstructed for an assumed standard mortar according to EN 196-1 [80] (cement:sand:water = 1:3:0.5 by mass) by absolute volume with 2% air, giving 501 kg/m3 cement, 1504 kg/m3 sand, and 251 kg/m3 water for W-0 and 59.8, 116.9, and 223.8 kg/m3 of dispersion for W-5, W-10, and W-20 (Table 7). Because the emission factor of the EPD proxy is declared per kilogram of water-based product [73], it is applied to the dispersion mass. The concrete inventory of [15] is retained as a sensitivity case. Figure 2 shows the cradle-to-gate GWP and the measured mass loss, and Table 7 presents the performance-normalized carbon results.
Table 7.
Inventory (kg/m3) and performance-normalized carbon results for the epoxy-modified mortars (reconstructed standard-mortar inventory, central emission factors).
Figure 2.
Epoxy-modified mortars: (a) cradle-to-gate GWP of the reconstructed standard-mortar inventory (bars: central EPD/LCI factors; points and whiskers: Monte Carlo median and 95% interval); (b) mass loss after 6 months of sulfuric acid exposure (mean ± standard deviation, n = 2) [15].
The earlier version of this analysis combined the concrete inventory of [15] with the mortar durability data. Because the mass-loss data were obtained on mortar, the mortar inventory is now used as the primary case, so that the carbon and durability values refer to the same material. The EN 196-1 proportions are an assumption, because the source describes the specimens as standard mortar without listing their proportions; the resulting inventory is therefore an assumed scenario, not the experimentally reported composition. With the concrete inventory, the absolute GWP values are about 38% lower (163–565 kg CO2e/m3), but all rankings are identical (Table A2). This is expected, because in both inventories the non-resin contributions change in proportion to the resin dosage and therefore affect all modified mixtures by the same fraction (Section 5.4).
The carbon-only ranking favors W-0 because it has no epoxy-resin contribution. However, W-0 also has the highest acid-exposure mass loss. Under the central EPD/LCI factor set, W-5 increases GWP by approximately 158 kg CO2e/m3 while reducing mass loss by 57.9%, giving the lowest incremental carbon cost of approximately 2.74 kg CO2e/m3 per percentage point of mass-loss reduction. W-10 reduces mass loss by 80.4% at an incremental cost of approximately 3.85 kg CO2e/m3 per percentage point. W-20 delivers the greatest measured durability benefit, reducing mass loss by 96.0%, but has the highest incremental carbon cost per percentage point (6.17) because of the large resin-product dosage.
When the deterioration-rate-normalized carbon indicator is used, the interpretation changes. Because W-20 has very low measured mass loss, its GWPdur value is the lowest among the four mixtures. This result demonstrates why repair-material assessment depends on the selected functional unit. If the decision rule is minimum initial embodied carbon, W-0 is preferred. If the decision rule is maximum durability gain per kg of additional carbon, W-5 is preferred. If the decision rule is to minimize a laboratory deterioration-rate proxy, W-20 is preferred. For balanced decisions, W-10 is a practical compromise because it captures most of the durability improvement of W-20 while avoiding roughly half of the incremental resin-related carbon burden. Mass loss under accelerated acid exposure is not proportional to field deterioration rate in general, so these results should not be interpreted as service-life evidence without exposure-specific validation. Figure 3 shows the uncertainty of both indicators (Section 5.4).
Figure 3.
Monte Carlo distributions (100,000 draws; boxes: interquartile range; whiskers: 95% interval) of (a) the incremental carbon efficiency ICE and (b) the deterioration-rate-normalized indicator GWPdur for the epoxy-modified mortars; diamonds show the deterministic values of Table 7.
5.3. Case Study 2: SBR-Modified Repair Mortar Under Chloride and Freeze–Thaw Exposure
The second case uses the SBR-modified repair mortars of Xu et al. [70], who compared latexes stabilized with anionic (MA), cationic (MB), and nonionic (MC) emulsifiers at SBR emulsion dosages of 10% (suffix -2) and 15% (suffix -3) by mass of cement. According to the mix table of the source, the mortars contain cement and sand in a mass ratio of 1:3 and have a total water-to-cement ratio of 0.45; the emulsion contains about 60% solids, and its water was deducted from the mixing water (added water: 45, 41, and 39 parts per 100 parts of cement). Strength was measured on 160 × 40 × 40 mm prisms, the chloride migration coefficient DRCM on Φ100 × 50 mm disks by a non-steady-state migration test, and freeze–thaw resistance on 70.7 mm cubes after 100 cycles between −20 °C and +20 °C. All specimens were cured at 20 ± 2 °C and a relative humidity of at least 95%, and at least three specimens were tested per group [70]. Chloride data are available for the 10% mixtures and freeze–thaw data for the 15% mixtures, so the two exposures are evaluated separately, each against the same control M0.
Because the source reports mixture ratios rather than masses per cubic meter, inventories were reconstructed by absolute volume with particle densities of 3100 (cement), 2650 (sand), and 1000 kg/m3 (water and polymer solids) and an assumed air content of 2% (Table 8). The text of the source states a cement-to-sand ratio of 1:2, whereas its mix table gives 1:3; the table was used, and the 1:2 ratio changes the break-even latex factor of the cationic mixture only from 2.66 to 2.71 kg CO2e/kg. The latex was assigned the regional EPD of an SBR latex admixture produced in Saudi Arabia (0.578 kg CO2e/kg [74]); the solids content of that product is not declared, so the conservative dispersion model EPD is used as the upper limit.
Table 8.
Reconstructed inventories (kg/m3), cradle-to-gate GWP, and strength-normalized carbon intensity of the SBR-modified mortars [70] (central emission factors).
At 10% emulsion dosage, latex addition increases the material-stage GWP from 271 to 291 kg CO2e/m3 (carbon multiplier 1.08), while compressive strength increases only slightly, from 38.5 to 40.0–41.2 MPa; the strength-normalized intensity CIfc therefore remains close to that of the control. The chloride migration coefficient decreases by 19.4% (anionic), 31.5% (cationic), and 29.7% (nonionic). The cationic mixture MB-2 gives the lowest incremental carbon cost (0.65 kg CO2e/m3 per percentage point, against 0.69 for MC-2 and 1.06 for MA-2) and, according to Equation (9), extends the corrosion-initiation period by a factor of 1.46, which clearly exceeds its carbon multiplier. Its chloride-normalized GWP is therefore 26% lower than that of the control (200 vs. 271 kg CO2e/m3; Table 9).
Table 9.
Durability-normalized indicators of the SBR-modified mortars: chloride migration (10% mixtures) and freeze–thaw strength loss after 100 cycles (15% mixtures), each relative to the control M0.
This advantage depends on the latex emission factor. Figure 4b shows that MB-2 remains below the control while the latex factor is below 2.66 kg CO2e/kg; the corresponding break-even factors are 2.46 kg CO2e/kg for the nonionic and 1.47 kg CO2e/kg for the anionic mixture. Under freeze–thaw exposure at 15% dosage, the compressive-strength loss after 100 cycles decreases from 16.0% to 7.2–9.2%, and the break-even latex factors are higher (2.88–4.66 kg CO2e/kg), again with the cationic mixture ranked first. The regional EPD value lies well below all break-even factors, whereas the conservative dispersion model EPD lies above them. The SBR case therefore shows a pattern different from that of the epoxy case: at a low polymer dosage the carbon penalty is small, and the durability gain is large, but whether modification is carbon-favorable depends on the product-specific latex factor, which the break-even factor makes explicit.
Figure 4.
SBR-modified repair mortars [70]: (a) chloride migration coefficient at 28 days; (b) chloride-normalized GWP (Equation (8) with DRCM as P) as a function of the latex emission factor. Dashed line: control M0; dots: break-even factors; shaded band: range between the latex EPD and the conservative dispersion model EPD.
5.4. Uncertainty Propagation, Emission Factor Sensitivity, and Repair-Thickness Effects
Mixing emission factors from different EPDs, databases, and regions changes the absolute GWP values but has a limited effect on the within-study rankings, and this can be shown analytically. In the reconstructed epoxy mortars, fly ash is absent, and adding resin displaces cement, sand, and water in fixed proportion to the dispersion mass (about 0.19, 0.57, and 0.69 kg per kg of dispersion). The non-resin terms therefore do not cancel exactly, but GWPi − GWP0 = mep,i·(EFep − 0.19·EFcem − 0.57·EFsand − 0.69·EFw), so that they offset the same fraction of the resin contribution for every mixture (3.7% with the central factors). Equation (7) thus becomes ICEi = mep,i·(EFep − 0.19·EFcem − …)/Di, and the ICE ranking is determined by the ratio mep,i/Di (1.032, 1.454, 2.331 kg/m3 per percentage point for W-5, W-10, and W-20) for any combination of emission factors for which the bracket is positive, which holds throughout the sampled ranges. For GWPdur, solving GWPdur,i = GWPdur,j for the epoxy factor gives a negative value for both adjacent pairs (W-20/W-10 and W-10/W-5), so no admissible factor reverses the order. In the SBR case, the ranking against the control depends on the latex factor, which is why the break-even factor is reported.
Table 10 and Figure 3 summarize the Monte Carlo results. Joint uncertainty widens the intervals of the epoxy indicators (for example, GWP of W-20: 880–1165 kg CO2e/m3; ICE of W-5: 2.60–4.06 kg CO2e/m3 per percentage point), but W-5 had the lowest ICE in 99.998% of draws, W-20 had the lowest GWPdur in 99.9%, and the complete GWPdur order W-20 < W-10 < W-5 < W-0 was retained in 99.6%. Separate runs show that the small residual overlap is caused by mass-loss variability (order retained in 99.6% of draws with emission factors fixed) rather than by emission factor uncertainty (100.0% with mass loss fixed), and the concrete inventory gives the same probabilities within 0.1 percentage point. Both epoxy rankings are therefore robust. In the SBR case, MB-2 was ranked first by ICE in 49.5% of draws and MC-2 in 39.8%, because the difference between their migration coefficients (5.12 vs. 5.25 × 10⁻¹² m2/s) is small compared with the 13% test reproducibility; this choice is unresolved with the available data. MB-2 satisfied the break-even condition ti/t0 ≥ GWPi/GWP0 in 71.9% of draws, and the control had the lowest chloride-normalized GWP in 17.7%, mainly in draws from the upper tail of the latex-factor distribution; the carbon benefit of SBR modification is therefore conditional on a low product-specific latex factor.
Table 10.
Monte Carlo results (100,000 draws): medians, 95% intervals, and probability of being ranked first under each decision rule.
In a deterministic check, the central waterborne epoxy EPD proxy (2.75 kg CO2e/kg product) was replaced with the conservative epoxy-resin model EPD value (4.12 kg CO2e/kg product). Under the conservative epoxy factor, W-5, W-10, and W-20 increase to 504, 734, and 1163 kg CO2e/m3, respectively, and their incremental carbon efficiencies become 4.15, 5.84, and 9.37 kg CO2e/m3 per percentage point. Therefore, W-5 remains the best option under the incremental-carbon decision rule, while W-20 remains the lowest GWPdur option when mass loss is treated as the deterioration-rate proxy, consistent with the analytical result above.
The repair-thickness check confirms that repair-layer GWP scales linearly with thickness but does not change the mixture ranking. For W-0, W-5, W-10, and W-20, the GWP per m2 is 2.64, 4.22, 5.73, and 8.57 kg CO2e/m2 at 10 mm; 6.60, 10.55, 14.34, and 21.42 kg CO2e/m2 at 25 mm; and 13.19, 21.11, 28.67, and 42.83 kg CO2e/m2 at 50 mm. The incremental carbon efficiency per percentage point of mass-loss reduction also scales linearly with thickness: for W-5 it is 0.027, 0.068, and 0.137 kg CO2e/m2 per percentage point at 10, 25, and 50 mm, respectively.
5.5. Metakaolin–Slag Geopolymer Benchmark
A third, purely multi-criteria benchmark was taken from the metakaolin–slag geopolymer mortar study [29], because it reports a complete orthogonal data set. The L16(45) design varied slag content (20–80%), sodium silicate modulus (1.0–1.6), alkali equivalent (6–12%), water-to-binder ratio (0.43–0.49), and sand-to-binder ratio (1.5–3.0), and reports fluidity, 28-day flexural and compressive strength, and 28-day drying shrinkage for all 16 mixtures (Table 4 of [29]; three specimens per mixture). The source reports a carbon intensity of 339 kg CO2e/t for its recommended geopolymer mortar against 820 kg CO2e/t for an ordinary cement mortar [29], but it does not report per-mixture inventories; the benchmark is therefore used here only to demonstrate a transparent and verifiable multi-criteria ranking, not as a carbon comparison. Each criterion k was transformed into an individual desirability dk between 0 and 1 following Derringer and Suich [81]. The greater the compressive and flexural strength, the better:
and the smaller the drying shrinkage, the better:
and fluidity y is target-the-best, with target T = 190 mm, which lies in the middle of the observed range and corresponds to a workable, non-segregating repair mortar:
where yk is the measured value and Lk and Uk are the lower and upper normalization bounds, taken in the base case as the minimum and maximum observed among the 16 mixtures (132 and 270 mm for fluidity, 3.6 and 11.0 MPa for flexural strength, 15.8 and 86.9 MPa for compressive strength, and 0.060% and 0.143% for shrinkage). The overall desirability is the weighted geometric mean
with equal weights wk = 0.25 in the base case. The geometric mean ensures that a mixture that fails one criterion completely (dk = 0) cannot be compensated by the others. Table 11 lists the eight highest-ranked mixtures with all individual desirabilities, so that the ranking can be verified directly from the source data.
Table 11.
Highest-ranked geopolymer mixtures [29] under the base-case desirability index (equal weights, geometric mean, min–max bounds, fluidity target 190 mm), with individual desirabilities dk.
In the base case, X13 (D = 0.821) and X7 (D = 0.795) are ranked first and second, followed by X4, X12, and X10 (Figure 5a). To test the subjective choices of the index, the ranking was recalculated with arithmetic instead of geometric aggregation, with fixed engineering normalization bounds (20–90 MPa, 3–12 MPa, 0.05–0.15%, and T ± 70 mm), with fluidity targets of 170 and 210 mm, and with the weight of each criterion doubled in turn (Table 12). In addition, 10,000 random weight vectors were drawn from a uniform Dirichlet distribution, so that all combinations of non-negative weights summing to one were equally likely (Figure 5b).
Figure 5.
Geopolymer benchmark [29]: (a) base-case desirability of the 16 mixtures; (b) median rank and 5th–95th percentile range under 10,000 random weight sets, with the probability P1 of being ranked first.
Table 12.
Sensitivity of the geopolymer ranking to the formulation of the desirability index.
X13 or X7 was ranked first in every scenario: X7 moves to first place only when shrinkage receives double weight or when the fluidity target is lowered to 170 mm. Under random weights, X13 was ranked first in 58.9% and X7 in 29.2% of the weight sets, and X7 remained in the top three in 99.3% (X13: 87.2%). Positions three to five (X4, X12, X10, and X3) change with the weights and are therefore conditional. The leading pair (X13 and X7) is thus stable with respect to the weights, normalization ranges, and aggregation rule in the scenarios tested, but which of the two is first depends on the weights (X13 first in 58.9% of random weight sets), and the order of the intermediate mixtures should be reported only together with the declared weights. Figure 6 shows the strength–shrinkage space of all 16 mixtures.
Figure 6.
Compressive versus flexural strength of the 16 geopolymer mixtures [29], colored by 28-day drying shrinkage; the three base-case top-ranked mixtures are labeled in bold.
5.6. Cross-Study Synthesis
Across the curated database, polymer modification generally improves functions that are not captured fully by compressive strength alone. The extracted review and experimental studies report improved bonding, water retention, crack bridging, permeability resistance, sulfate or acid resistance, waterproofing, self-healing response, and toughness for selected polymer systems. At the same time, excessive polymer addition can reduce or delay cement hydration, entrain air, increase setting time, lower compressive strength, or raise material carbon intensity. The design problem is therefore not to maximize polymer dosage, but to identify the minimum polymer content that satisfies the governing repair function.
Four recurring dosage–response patterns were observed. First, dosage–response relationships are often nonlinear: small polymer additions can improve bond or durability substantially, but further addition may yield diminishing returns [31]. Second, the best mixture depends on the governing performance endpoint. A mixture with the highest compressive strength may not be the best for bond or permeability. Third, alternative binders can reduce carbon intensity, but they require careful control of workability, shrinkage, activator content, and early-age strength. Fourth, performance-normalized carbon indicators can reverse the ranking produced by kg CO2e/m3 alone, especially when durability benefits are substantial.
6. Discussion
6.1. Implications for Sustainable Repair Design
The findings support a shift from material minimization to function minimization. Repair mortar should not be selected solely because it has the lowest kg CO2e/m3. The relevant screening question is how much embodied carbon is required to deliver a specified repair function. A conventional mortar may have lower initial embodied carbon, whereas a polymer-modified mortar may be justified in aggressive exposure when the measured improvement is significant and repair recurrence would otherwise be likely. This second statement lies outside the A1–A3 boundary of the present assessment. The break-even checks of Section 5.3 and Section 5.4 and Appendix B do not quantify avoided repairs; they state the minimum durability benefit, or the maximum polymer emission factor, required for a modified mixture to offset its higher material-stage emissions. They become life-cycle results only when combined with a validated service-life model and modules B and C of EN 15804 [69].
Durability is a fundamental aspect of sustainability because reduced maintenance and restoration can reduce material demand, energy demand, time demand, and demolition waste [37]. Selected polymer-modified mortars have been reported to improve freeze–thaw resistance, transport blocking, chloride resistance, and estimated service life [31]. These durability benefits could offset higher initial embodied carbon only when exposure severity, application quality, and validated deterioration models support a longer repair interval.
In the epoxy case study, the choice among W-5, W-10, and W-20 depends on the decision rule. For a low-exposure environment or short design life, the incremental benefit of W-20 may not justify its additional polymer carbon. For severe acid exposure where repair access is difficult, the deterioration-rate-normalized result suggests that a high resin dosage could become environmentally rational if a validated service-life model confirms that it prevents repeated repair; this is a conditional interpretation and not a result of the cradle-to-gate assessment. This is precisely why the functional unit and the decision rule must be declared explicitly.
In the SBR mortar case, a low latex dosage gave a large reduction in chloride migration for a small carbon penalty, and the emulsifier type affected the chloride indicators more than strength. Whether the modification is carbon-favorable, however, hinges on the latex emission factor. For practitioners, the break-even factor is more useful than a single ranking, because it can be compared directly with the GWP declared in a supplier EPD. The broad PNCE concept remains useful for future service-life-based assessment, but universal polymer rankings should be avoided until product-specific environmental product declarations, field-validated durability models, and uncertainty analyses are available.
6.2. Practical Screening Workflow
A practical performance-normalized carbon workflow for polymer-modified repair mortar selection can be summarized as follows. First, mixture proportions, polymer dosage, curing conditions, exposure regime, and performance endpoints should be extracted from each study or supplier dataset. Second, mixtures should be converted to a common functional unit, preferably 1 m3 when absolute quantities are reported, or otherwise 1 kg dry mix with a clearly stated density assumption. Third, emission factors should be assigned by constituent and classified as extracted, EPD-based, database-based, or assumed. Fourth, cradle-to-gate GWP and repair-layer GWP should be calculated for the selected thickness. Fifth, performance-normalized indicators should be calculated for the governing repair function, always relative to a control tested under the same protocol. Sixth, emission factor and test-result uncertainties should be propagated, and rank probabilities and break-even emission factors reported. Seventh, non-dominated Pareto solutions should be identified across carbon, strength, bond, shrinkage, workability, and durability metrics. Finally, the preferred mixture should be selected according to exposure class, repair accessibility, target service life, and carbon budget.
6.3. Data Limitations and Uncertainty
The extracted database includes heterogeneous specimen sizes, curing regimes, exposure durations, and testing standards. Many studies report ratios rather than complete kg/m3 inventories; some cannot be converted to absolute volume without density assumptions. Polymer products rarely have product-specific environmental declarations in the source experimental papers. In the calculation, publicly available environmental product declarations were used where a sufficiently close product class was available. No public product-specific environmental product declaration was identified for the water-soluble epoxy product used in the primary case study; therefore, a verified environmental product declaration for a comparable water-based two-part epoxy coating was used as the central proxy [73], and a European model environmental product declaration for epoxy-resin products was retained as a conservative sensitivity case [66].
The present numerical analysis is cradle-to-gate (A1–A3) and does not include transport, surface preparation, installation, curing, maintenance, or end-of-life. Mass loss, migration coefficients, and freeze–thaw strength loss are treated as durability proxies; they should not be converted directly into service life without validation, and Equation (9) is a conditional link for diffusion-controlled chloride ingress only. The mortar inventories of both case studies were reconstructed from reported ratios (the epoxy mortar from the EN 196-1 standard proportions); the epoxy mass-loss data rest on two specimens per mixture, and the solids content of the latex in the regional EPD is not declared. The curated studies are recent open-access articles from one publisher, so they illustrate the framework rather than represent the field. The performance-normalized carbon efficiency concept should also be used carefully because multiplicative performance ratios can exaggerate differences when the performance variables are correlated or partly estimated.
6.4. Uncertainty Controls and Validation Considerations
The key uncertainty controls are addressed explicitly. Screening factors were replaced where public environmental product declarations or regional life-cycle inventory data were available: cement and aggregate values were updated using regional/product declarations [72,79], and a waterborne epoxy environmental product declaration proxy replaced the earlier resin-solids screening factor [73]. Remaining non-product-specific inputs are labeled, assigned probability distributions, and propagated by Monte Carlo simulation together with the measured test variability (Section 4.4). Repair-layer scaling is included, and durability-to-service-life conversion is avoided unless validated by field data. The EPD references used in the carbon calculation report the program operator, declaration number when available, declared unit, A1–A3 GWP module, and validity period where stated by the declaration.
The Supplementary Materials include the input data, the emission factor table with the assigned distributions, and the Python scripts and results for the case-study calculations, thickness and emission factor sensitivity, break-even checks, Monte Carlo analysis, geopolymer ranking, and figures, together with a script that checks the regenerated values against those reported here. This traceability is necessary because many mixture records require normalization assumptions and several environmental factors remain product-class proxies rather than exact manufacturer-specific declarations.
7. Conclusions
A structured database was developed from the extracted literature, containing 55 indexed studies, 141 mixture/inventory records, and 243 performance endpoints relevant to polymer-modified and advanced cementitious repair mortars; 19 studies met the criteria for quantitative extraction.
A standardized functional-unit framework is essential because published repair mortar studies report mixtures using inconsistent bases such as kg/m3, cement-to-sand ratio, water-to-binder ratio, polymer-to-cement ratio, and percentage replacement. Performance-normalized indicators should be computed within each study against its own control, because test protocols differ between studies.
Carbon-only ranking can be misleading for repair materials. Performance-normalized metrics are needed to account for strength, bonding, shrinkage, self-healing, permeability, acid resistance, and other repair functions; however, laboratory durability improvements should be treated as proxies unless translated through validated service-life models.
In the epoxy-modified mortars exposed to sulfuric acid, W-5 provided the best incremental carbon efficiency per percentage point of mass-loss reduction, W-10 a balanced compromise, and W-20 the best deterioration-rate-normalized indicator. Both rankings were retained in more than 99% of Monte Carlo draws, were identical for the mortar and concrete inventories, and the ICE ranking was shown analytically to be practically independent of the emission factors.
In the SBR-modified repair mortars, the cationic latex gave the largest reduction in chloride migration coefficient (31.5%) and the largest freeze–thaw improvement. With a regional latex EPD, its chloride-normalized GWP was 26% lower than that of the control, but the benefit is conditional on the latex emission factor, with break-even values of 2.66 kg CO2e/kg for chloride and 4.66 kg CO2e/kg for freeze–thaw exposure.
In the metakaolin–slag geopolymer benchmark, a desirability index with declared normalization, weights, and aggregation ranked mixtures X13 and X7 first. One of the two was ranked first in all predefined scenarios and in 88.0% of 10,000 random weight sets (X13: 58.85%, X7: 29.18%); the leading pair is therefore stable, whereas which of the two is first, and the intermediate positions, depend on the declared weights.
Overall, the framework supports screening decisions rather than a definitive ranking of polymer-modified repair mortars. Final project-level selection should replace proxy factors with supplier-specific environmental product declarations, apply exposure-specific durability models, and consider transport, installation, maintenance, and end-of-life stages when those data are available.
Supplementary Materials
The following supporting information can be downloaded at: https://www.mdpi.com/article/10.3390/buildings16214380/s1.
Funding
This research received no external funding.
Data Availability Statement
The input data, emission factors, Python scripts, and results that reproduce all case-study calculations, the Monte Carlo analysis, the geopolymer ranking, and the figures are provided as Supplementary Materials. The extracted literature database (index of the 55 studies and extracted records) is available from the author upon reasonable request.
Acknowledgments
The author is thankful to the Deanship of Graduate Studies and Scientific Research at the University of Bisha for supporting this work through the Fast-Track Research Support Program.
Conflicts of Interest
The author declares no conflicts of interest.
Abbreviations
The following abbreviations and symbols are used in this manuscript:
| A1–A3 | Product stage modules (raw-material supply, transport, manufacturing) according to EN 15804 |
| CIfc, CIbond | Carbon intensity per unit compressive strength or bond strength (kg CO2e/m3 per MPa) |
| Di | Relative durability improvement of mixture i over the control (%) |
| DRCM | Chloride migration coefficient from the non-steady-state migration test (×10−12 m2/s) |
| EFi | Emission factor of constituent i (kg CO2e/kg) |
| EPD | Environmental product declaration |
| fc | Compressive strength (MPa) |
| GGBFS | Ground granulated blast-furnace slag |
| GSD | Geometric standard deviation |
| GWP | Global warming potential (kg CO2e) |
| GWPdur | Deterioration-rate-normalized GWP, Equation (8) (kg CO2e/m3) |
| ICE | Incremental carbon efficiency, Equation (7) (kg CO2e/m3 per percentage point) |
| LCA, LCI | Life-cycle assessment; life-cycle inventory |
| mi | Mass of constituent i (kg/m3 or kg/m2) |
| MA, MB, MC | SBR mortars with anionic, cationic, and nonionic emulsifiers, respectively |
| OPC | Ordinary Portland cement |
| Pi, P0 | Deleterious performance metric of mixture i and of the control |
| P/C | Polymer-to-cement ratio by mass |
| PNCE | Performance-normalized carbon efficiency |
| PU, PVA, VAE | Polyurethane; polyvinyl alcohol; vinyl acetate–ethylene |
| RDP | Redispersible polymer powder |
| SBR | Styrene–butadiene rubber |
| S/B, W/B, w/c | Sand-to-binder, water-to-binder, and water-to-cement ratios |
| t | Repair-layer thickness (m) |
| ti, t0 | Corrosion-initiation time of mixture i and of the control, Equation (9) |
| τbond | Bond strength (MPa) |
Appendix A. Functional-Unit Equations for Spreadsheet Implementation
Table A1.
Functional-unit equations used in the spreadsheet implementation.
Appendix B. Sensitivity and Break-Even Checks
Two checks support the epoxy case study: the choice of epoxy-product environmental product declaration proxy and of the inventory (reconstructed standard mortar or the concrete of [15]), and the service-life extension required to offset the higher initial material-stage global warming potential of the modified mixtures. The concrete inventory of [15] also contains a constant defoamer dosage (42.2 kg/m3) for which no product-specific EPD was identified; with an admixture EPD proxy (0.537 kg CO2e/kg [82]), it adds 22.7 kg CO2e/m3 to every concrete mixture and cancels in ICE. Table A2 presents the emission factor and inventory sensitivity results.
Table A2.
Sensitivity of GWP (kg CO2e/m3) and incremental carbon efficiency (kg CO2e/m3 per % point) to the epoxy EPD proxy and to the inventory used.
W-5 remains the best option when the decision rule is incremental carbon per percentage point of acid mass-loss reduction under both epoxy factors and both inventories. W-20 remains the best option only under the deterioration-rate-normalized indicator because its measured mass loss is very low. These rankings should not be interpreted as direct service-life rankings without field validation.
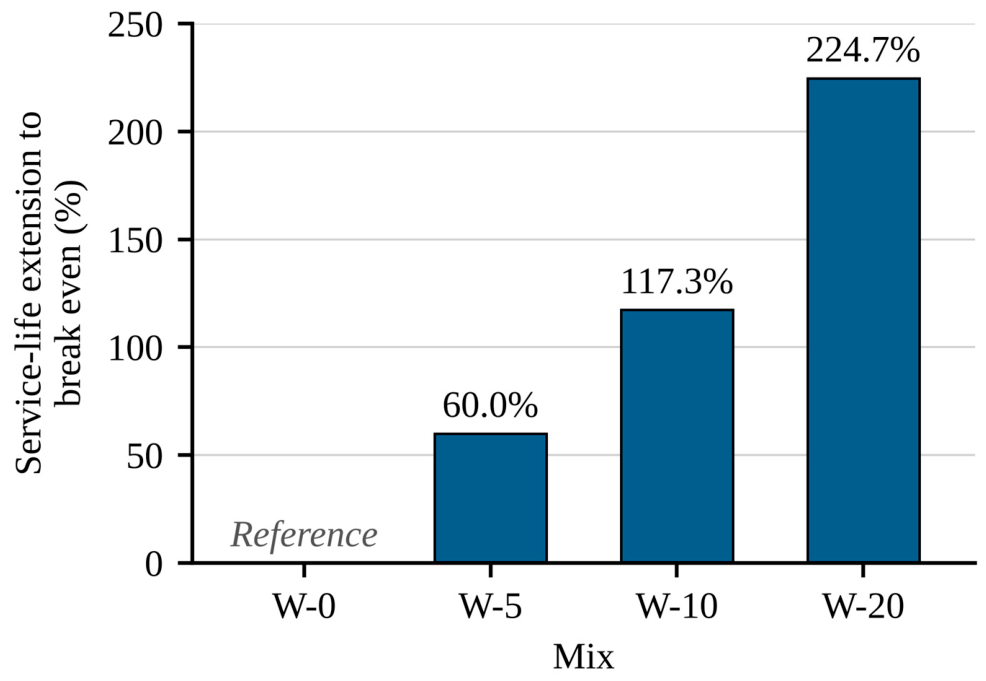
For example, W-5 has about 1.60 times the initial GWP of W-0, so it requires at least a 60.0% service-life extension to break even on material-stage carbon. The laboratory mass-loss ratio for W-5 is 0.421 of the reference value, which is consistent with the possibility of a larger durability benefit, but the relationship between acid mass loss and field service life must be validated before being used as a design-life multiplier. Table A3 summarizes the initial-carbon break-even check, and Figure A1 shows the required service-life extension for the modified mixtures.
Table A3.
Initial-carbon break-even check (reconstructed standard-mortar inventory, central emission factors).
Figure A1.
Initial-carbon break-even service-life extension required for the epoxy-modified mixtures.
References
- Meyer, C. The greening of the concrete industry. Cem. Concr. Compos. 2009, 31, 601–605. [Google Scholar] [CrossRef] [Scilit]
- Wu, M.; Johannesson, B.; Geiker, M. A review: Self-healing in cementitious materials and engineered cementitious composite as a self-healing material. Constr. Build. Mater. 2012, 28, 571–583. [Google Scholar] [CrossRef] [Scilit]
- American Society of Civil Engineers. 2021 Report Card for America’s Infrastructure; ASCE: Reston, VA, USA, 2021. [Google Scholar]
- Ohama, Y. Polymer-based admixtures. Cem. Concr. Compos. 1998, 20, 189–212. [Google Scholar] [CrossRef] [Scilit]
- Schulze, J.; Killermann, O. Long-term performance of redispersible powders in mortars. Cem. Concr. Res. 2001, 31, 357–362. [Google Scholar] [CrossRef] [Scilit]
- Lehne, J.; Preston, F. Making Concrete Change: Innovation in Low-Carbon Cement and Concrete; Chatham House: London, UK, 2018. [Google Scholar]
- Hasanbeigi, M.; Price, L.; Lin, E. Emerging energy-efficiency and CO2 emission-reduction technologies for cement and concrete production: A technical review. Renew. Sustain. Energy Rev. 2012, 16, 6220–6238. [Google Scholar] [CrossRef] [Scilit]
- Scrivener, K.L.; John, V.M.; Gartner, E.M. Eco-efficient cements: Potential economically viable solutions for a low-CO2 cement-based materials industry. Cem. Concr. Res. 2018, 114, 2–26. [Google Scholar] [CrossRef] [Scilit]
- United Nations Environment Programme. Sand and Sustainability: Finding New Solutions for Environmental Governance of Global Sand Resources; UNEP GRID-Geneva: Geneva, Switzerland, 2019. [Google Scholar]
- He, J.; Bu, X.; Bai, W.; Zheng, W.; Gao, Q.; Wang, Y. Preparation and properties of self-compacting alkali-activated slag repair mortar. Constr. Build. Mater. 2020, 252, 119034. [Google Scholar] [CrossRef] [Scilit]
- Ohama, Y. Handbook of Polymer-Modified Concrete and Mortars: Properties and Process Technology; Noyes Publications: Park Ridge, NJ, USA, 1995. [Google Scholar]
- Wang, L.; Wu, Y.; Guo, C.; Guo, Y.; Yue, G.; Li, Q. Study on properties and hydration mechanism of polymer-modified high-belite sulfoaluminate cement repair mortar. Buildings 2026, 16, 2352. [Google Scholar] [CrossRef] [Scilit]
- Jing, S.; Pang, B.; Chen, Y.; Wang, J.; Wang, P.; Song, S.; Lai, W. A review on polymer-modified cementitious materials for underwater repair: Workability, bonding, mechanical performance and durability. Buildings 2026, 16, 2751. [Google Scholar] [CrossRef] [Scilit]
- Yin, Y.; Mei, Y. Influence of polymers on the performance and protective effect of cement-based coating materials. Materials 2025, 18, 3321. [Google Scholar] [CrossRef] [Scilit] [PubMed]
- Kostrzewski, W.; Laks, I.; Sybis, M. Water-soluble epoxy resins as an innovative method of protecting concrete against sulfate corrosion. Materials 2026, 19, 364. [Google Scholar] [CrossRef] [Scilit] [PubMed]
- Szymanowski, J.; Sadowski, Ł. Analysis of the mechanical performance of high-strength nano-modified cement mortars for overlays. Buildings 2024, 14, 248. [Google Scholar] [CrossRef] [Scilit]
- Muhammad, N.Z.; Majid, M.Z.A.; Keyvanfar, A.; Shafaghat, A.; McCaffer, R.; Mirza, J.; Aliyu, M.M.; Sariyyu, M. Experimental investigation into waterproofing performance of cement mortar incorporating nano silicon. Buildings 2025, 15, 2227. [Google Scholar] [CrossRef] [Scilit]
- Pillai, G.D.M.; Balasubramanian, K.; Sivaraman, C.; Kumar, V.T.A.; Chidambaranathan, R.; Shanmugapuram, V.S. Applications of sustainable bio-degradable agro-waste (rice husk ash) in improving the flow and mechanical properties of ultra-high-strength mortar. Eng. Proc. 2026, 130, 1. [Google Scholar] [CrossRef] [Scilit]
- Li, Y.; Deng, Y. Low-temperature self-healing cement mortar enabled by novel composite microcapsules: Performance, mechanism, and optimization. Materials 2026, 19, 933. [Google Scholar] [CrossRef] [Scilit] [PubMed]
- Szewczak, A.; Łagód, G. Adhesion of modified epoxy resin to a concrete surface. Materials 2022, 15, 8961. [Google Scholar] [CrossRef] [Scilit] [PubMed]
- Çalbıyık, S.; Kabay, N.; Omur, T.; Ozkan, H. Role of modifiers on the properties of one-part alkali-activated rapid hardening repair mortar. Sustainability 2026, 18, 7047. [Google Scholar] [CrossRef] [Scilit]
- Guo, Y.; Li, W.; Wang, Y.; Yue, G.; Wang, L.; Xu, X.; Li, Q.; Chen, M. Compatibility and performance evaluation of early-strength admixtures in repair mortar containing recycled concrete powder and GGBFS. Buildings 2026, 16, 2421. [Google Scholar] [CrossRef] [Scilit]
- Li, Z.; Guo, C.; Xu, L.; Wang, R. Research on the optimization and regulation mechanism of waterproofing, impermeability, and water vapor transmission property of mortar based on different modifiers. Materials 2025, 18, 2363. [Google Scholar] [CrossRef] [Scilit] [PubMed]
- Song, H.; Wang, X.; Shang, H.; Fan, G.; Huang, Y. Polyvinyl alcohol-modified NHL-based mortars for the restoration of historical buildings. Materials 2026, 19, 1567. [Google Scholar] [CrossRef] [Scilit] [PubMed]
- Karozou, A.; Kesikidou, F.; Pavlidou, E.; Stefanidou, M. Applying alkali activator and hydrophobic agents in clay-based mortars for enhanced properties. Minerals 2024, 14, 1035. [Google Scholar] [CrossRef] [Scilit]
- Luo, Y.; Zhou, F.; Ma, S.; Gong, D.; Wang, Z.; Li, X.; Zhang, C. Synthesis of amphiphilic polyether-modified silicone oil polymers and the application of their micelles in enhancing the overall waterproofing and corrosion resistance of cement-based concrete materials. Polymers 2026, 18, 1153. [Google Scholar] [CrossRef] [Scilit] [PubMed]
- Zhang, P.; Zhang, X.; Dai, X.; Wei, S. Individual and synergistic effects of hybrid PVA-steel fiber on mechanical properties of nano-SiO2 modified epoxy resin gel mortar. Gels 2026, 12, 424. [Google Scholar] [CrossRef] [Scilit] [PubMed]
- Zeng, Z.; Yu, P.; Chen, Z.; Zhou, J.; Xin, H.; Yu, L.; Lin, A. High-temperature properties of magnesium ammonium phosphate cement modified with gold tailings. Materials 2026, 19, 2684. [Google Scholar] [CrossRef] [Scilit] [PubMed]
- Liang, P.; Zhu, L.; Yin, R.; Gao, R. Optimization of mix proportion and performance study of metakaolin-slag geopolymer mortar based on orthogonal experiment. Materials 2026, 19, 2004. [Google Scholar] [CrossRef] [Scilit] [PubMed]
- Zhou, Y.; Chang, W.; Chai, S.; Gao, S.; Jin, Z.; Wang, P.; Xie, B.; Guo, J.; Chen, X.; Cao, Y. A novel repair mortar with strong bonding and durability: Ion-exchange mechanism of waterborne acrylate copolymers. Constr. Build. Mater. 2025, 500, 144093. [Google Scholar] [CrossRef] [Scilit]
- Liu, Y.; Liang, X.; Wang, J.; Wang, Y.; Wang, H.; Li, X. Through-cracking risk and life-cycle performance of polymer-modified mortars under severe cold service conditions. J. Build. Eng. 2025, 116, 114740. [Google Scholar] [CrossRef] [Scilit]
- Pang, B.; Zhang, Y.; Liu, G. Study on the effect of waterborne epoxy resins on the performance and microstructure of cement paste. Constr. Build. Mater. 2018, 167, 831–845. [Google Scholar] [CrossRef] [Scilit]
- ISO 14040:2006; Environmental Management—Life Cycle Assessment—Principles and Framework. International Organization for Standardization: Geneva, Switzerland, 2006.
- ISO 14044:2006; Environmental Management—Life Cycle Assessment—Requirements and Guidelines. International Organization for Standardization: Geneva, Switzerland, 2006.
- Panesar, D.K.; Seto, K.E.; Churchill, C.J. Impact of the selection of functional unit on the life cycle assessment of green concrete. Int. J. Life Cycle Assess. 2017, 22, 1969–1986. [Google Scholar] [CrossRef] [Scilit]
- Brás, A.; Gomes, V. LCA implementation in the selection of thermal enhanced mortars for energetic rehabilitation of school buildings. Energy Build. 2015, 92, 1–9. [Google Scholar] [CrossRef] [Scilit]
- Van den Heede, P.; De Belie, N. Environmental impact and life cycle assessment (LCA) of traditional and ‘green’ concretes: Literature review and theoretical calculations. Cem. Concr. Compos. 2012, 34, 431–442. [Google Scholar] [CrossRef] [Scilit]
- EPD International. Environmental Product Declaration EPD-IES-0015437:001: Sika MonoTop® 4080; Declared Unit 1 kg Cementitious Repair Mortar; EPD International: Stockholm, Sweden, 2025. [Google Scholar]
- Sika. Environmental Product Declaration: Sika MonoTop®-4012; Declared Unit 1 kg Concrete Repair Mortar; Cradle-to-Gate with Options; BRE Global: Watford, UK, 2022; Available online: https://descargas.five.es/RCHC/PCIA/Sika/EPD-BRE-Sika-MonoTop-4012-en.pdf (accessed on 28 October 2026).
- Felekoglu, B. A comparative study on the bonding performance of an admixed repair mortar and high-strength flowable micro-concrete with substrate: Considerations on the physico-mechanical compatibility. J. Build. Eng. 2024, 98, 111113. [Google Scholar] [CrossRef] [Scilit]
- Garbacz, A.; Courard, L.; Bissonnette, B. A surface engineering approach applicable to concrete repair engineering. Bull. Pol. Acad. Sci. Tech. Sci. 2013, 61, 73–84. [Google Scholar] [CrossRef] [Scilit]
- Koutas, L.N.; Tetta, Z.; Bournas, D.A.; Triantafillou, T.C. Strengthening of concrete structures with textile reinforced mortars: State-of-the-art review. J. Compos. Constr. 2019, 23, 03118001. [Google Scholar] [CrossRef] [Scilit]
- Shi, C.; Li, M.; Ma, C.; He, T. Interfacial bonding properties of styrene-butadiene rubber and ethylene vinyl acetate emulsion-modified OPC-CAC-G repair mortar. Constr. Build. Mater. 2023, 370, 130747. [Google Scholar] [CrossRef] [Scilit]
- Nunes, V.A.; Borges, P.H.R.; Zanotti, C. Mechanical compatibility and adhesion between alkali-activated repair mortars and Portland cement concrete substrate. Constr. Build. Mater. 2019, 215, 569–581. [Google Scholar] [CrossRef] [Scilit]
- Song, X.; Song, X.; Liu, H.; Huang, H.; Anvarovna, K.G.; Ugli, N.A.D.; Huang, Y.; Hu, J.; Wei, J.; Yu, Q. Cement-based repair materials and the interface with concrete substrates: Characterization, evaluation and improvement. Polymers 2022, 14, 1485. [Google Scholar] [CrossRef] [Scilit] [PubMed]
- Han, S.; Wang, Y.; Wang, Q.; Han, L.; Han, G. Film-formation processes of polymer emulsions in polymer-cement waterproof coatings and their effect on coatings’ macroscopic properties. Constr. Build. Mater. 2024, 438, 137137. [Google Scholar] [CrossRef] [Scilit]
- Djouani, F.; Connan, C.; Delamar, M.; Chehimi, M.M.; Benzarti, K. Cement paste–epoxy adhesive interactions. Constr. Build. Mater. 2011, 25, 411–423. [Google Scholar] [CrossRef] [Scilit]
- Gujar, P.; Ishikawa, T.; Kawashima, S. Structural-to-interfacial fracture transition along epoxy-coated hydrating cement paste. Constr. Build. Mater. 2021, 310, 125128. [Google Scholar] [CrossRef] [Scilit]
- Zhang, F.; Ju, P.; Pan, M.; Zhang, D.; Huang, Y.; Li, G.; Li, X. Self-healing mechanisms in smart protective coatings: A review. Corros. Sci. 2018, 144, 74–88. [Google Scholar] [CrossRef] [Scilit]
- Xu, F.; Zhou, M.; Chen, J.; Ruan, S. Mechanical performance evaluation of polyester fiber and SBR latex compound-modified cement concrete road overlay material. Constr. Build. Mater. 2014, 63, 142–149. [Google Scholar] [CrossRef] [Scilit]
- Assaad, J.J.; Gerges, N. Styrene-butadiene rubber modified cementitious grouts for embedding anchors in humid environments. Tunn. Undergr. Space Technol. 2019, 84, 317–325. [Google Scholar] [CrossRef] [Scilit]
- Li, X.; Liu, R.; Li, S.; Zhang, C.; Li, J.; Cheng, B.; Liu, Y.; Ma, C.; Yan, J. Effect of SBR and XSBRL on water demand, mechanical strength and microstructure of cement paste. Constr. Build. Mater. 2022, 332, 127309. [Google Scholar] [CrossRef] [Scilit]
- Hari, R.; Mini, K.M. Mechanical and clogging characteristics of SBR modified pervious concrete reinforced with geogrids: A functional data analysis approach. Constr. Build. Mater. 2024, 412, 134780. [Google Scholar] [CrossRef] [Scilit]
- Shang, H.; Xiao, Z.; Wang, X.; Lu, Z.; Xu, S.; Dong, P. Study on modification of natural hydraulic lime historical building repair mortar. J. Build. Eng. 2024, 97, 110583. [Google Scholar] [CrossRef] [Scilit]
- Zhu, H.; Wang, P.; Zhang, G. Influence of vinyl acetate/ethylene copolymer powder on secondary efflorescence in Portland cement-based decorative mortar. J. Zhejiang Univ. Sci. A 2015, 16, 143–150. [Google Scholar] [CrossRef] [Scilit]
- Tian, Y.; Gao, P.; Wang, R.; Wang, L.; Zhong, J.; Li, J. Study on the influence of organic polymers on the physical and mechanical properties of cement-based materials. Earth Environ. Sci. 2020, 474, 072028. [Google Scholar] [CrossRef] [Scilit]
- Zhang, J.; Han, T.; Xiao, M.; Altaf, M.; Wang, R.; Feng, Y. Preparation of organic-inorganic styrene-acrylate emulsion and its improvement on the comprehensive performance of mortar. J. Build. Eng. 2026, 118, 115017. [Google Scholar] [CrossRef] [Scilit]
- Zhang, C.; Liu, J.; Zhang, S.; Kong, X. Mechanical properties of polymer modified mortars using polymer latexes with varied glass transition temperature and surface charges. Cem. Concr. Compos. 2024, 150, 105573. [Google Scholar] [CrossRef] [Scilit]
- Huang, W.; Zhang, H.; Xiao, Y.; Yang, Y.; Li, Y.; Yuan, Q. Mechanical properties of waterborne epoxy resin systems: A novel mortar-based evaluating method. Constr. Build. Mater. 2026, 506, 145049. [Google Scholar] [CrossRef] [Scilit]
- Zheng, H.; Duan, Y.; Xu, B.; Sun, Z.; Wang, P.; Pang, B.; Hou, D. Performance study of a tough and non-dispersible underwater concrete repair material based on organic-inorganic IPN structure with water-oil composite transition epoxies. Constr. Build. Mater. 2025, 485, 141964. [Google Scholar] [CrossRef] [Scilit]
- Zheng, H.; Duan, Y.; Pang, B.; Wang, M.; Wang, P.; Hou, D. Research on the durability of composite epoxy resin modified repair mortars based on water-oil gradient phase change: From macroscopic to nanoscopic scales. Constr. Build. Mater. 2024, 457, 139325. [Google Scholar] [CrossRef] [Scilit]
- Guo, S.; Zhang, X.; Chen, J.; Mou, B.; Shang, H.; Wang, P.; Zhang, L.; Ren, J. Mechanical and interface bonding properties of epoxy resin reinforced Portland cement repairing mortar. Constr. Build. Mater. 2020, 264, 120715. [Google Scholar] [CrossRef] [Scilit]
- Jiang, W.; Zhu, H.; Haruna, S.I.; Shao, J.; Yu, Y.; Wu, K. Mechanical properties and freeze-thaw resistance of polyurethane-based polymer mortar with crumb rubber powder. Constr. Build. Mater. 2022, 352, 129040. [Google Scholar] [CrossRef] [Scilit]
- Chen, Y.; Hu, J.; Wu, X.; Duan, S.; Wang, H.; Ma, T. Synthesis and evaluation of polyurethane as waterproof adhesion layer for steel bridge deck. Polymers 2024, 16, 3140. [Google Scholar] [CrossRef] [Scilit] [PubMed]
- Wang, P.; Jia, L.; Li, W.; Jin, Z.; Nadeem, B.M.; Zhao, H.; Ji, X. Microstructure and property study of polyvinyl alcohol modified high performance conductive cementitious anode materials. Constr. Build. Mater. 2025, 495, 143664. [Google Scholar] [CrossRef] [Scilit]
- Deutsche Bauchemie e.V.; Institut Bauen und Umwelt. European Model Environmental Product Declaration EPD-DBC-20220177-IBF1-EN: Products Based on Epoxy-Resin, Group 4; Declared Unit 1 kg Product; A1–A3 GWP-Total 4.12 kg CO2e/kg; Institut Bauen und Umwelt e.V.: Berlin, Germany, 2022. [Google Scholar]
- Damineli, B.L.; Kemeid, F.M.; Aguiar, P.S.; John, V.M. Measuring the eco-efficiency of cement use. Cem. Concr. Compos. 2010, 32, 555–562. [Google Scholar] [CrossRef] [Scilit]
- Habert, G.; Roussel, N. Study of two concrete mix-design strategies to reach carbon mitigation objectives. Cem. Concr. Compos. 2009, 31, 397–402. [Google Scholar] [CrossRef] [Scilit]
- EN 15804:2012+A2:2019; Sustainability of Construction Works—Environmental Product Declarations—Core Rules for the Product Category of Construction Products. European Committee for Standardization: Brussels, Belgium, 2019.
- Xu, A.; Wang, L.; Zheng, S.; Jia, H.; Wang, X.; Xu, Y.; Chen, H. Effect of emulsifier type on the properties of SBR-modified cement-based materials. Polymers 2026, 18, 1128. [Google Scholar] [CrossRef] [Scilit] [PubMed]
- fib—International Federation for Structural Concrete. Model Code for Service Life Design; fib Bulletin 34; International Federation for Structural Concrete (fib): Lausanne, Switzerland, 2006. [Google Scholar]
- Instytut Techniki Budowlanej. Environmental Product Declaration Type III ITB No. 703/2024: Cement CEM I 42,5R/N-NA (Chorula), Górażdże Cement S.A.; Program Operator ITB; Declared Unit 1 t; A1–A3 GWP Net Total 523 kg CO2e/t; Gross Total 700 kg CO2e/t; Issued 15.11.2024; Valid to 15.11.2029; Instytut Techniki Budowlanej: Warsaw, Poland, 2024. [Google Scholar]
- Sika Services AG. Environmental Product Declaration EPD-SIK-20240380-CBA1-EN: Sikafloor®-2510 W; Program Operator Institut Bauen und Umwelt e.V.; Declared Unit 1 kg Product with Packaging; A1–A3 GWP-Total 2.75 kg CO2e/kg; Issue Date 04.03.2025; Valid to 03.03.2030; Institut Bauen und Umwelt e.V.: Berlin, Germany, 2025; Available online: https://deu.sika.com/dam/dms/deaddconst01/3/EPD-Sikafloor-2510-W.pdf (accessed on 28 October 2026).
- Weber-Sodamco Saudi Arabia; EPD International AB. Environmental Product Declaration EPD-IES-0017048: Weberad 220 SBR; Declared Unit 1 kg (1 L) of Product; A1–A3 GWP-Total 0.578 kg CO2e; Geographical Scope Saudi Arabia; Valid Until 19.06.2030; EPD International AB: Stockholm, Sweden, 2025. [Google Scholar]
- Deutsche Bauchemie e.V.; EFCC; FEICA; IVK/Institut Bauen und Umwelt. Model Environmental Product Declaration EPD-DBC-20220149-IBF1-EN: Dispersion-Based Products, Group 4; Declared Unit 1 kg Product; A1–A3 GWP-total 4.97 kg CO2e/kg; Valid to 07.06.2027; Institut Bauen und Umwelt e.V.: Berlin, Germany, 2022. [Google Scholar]
- Weidema, B.P.; Wesnæs, M.S. Data quality management for life cycle inventories—An example of using data quality indicators. J. Clean. Prod. 1996, 4, 167–174. [Google Scholar] [CrossRef] [Scilit]
- Nordtest. NT BUILD 492: Concrete, Mortar and Cement-Based Repair Materials—Chloride Migration Coefficient from Non-Steady-State Migration Experiments; Nordtest: Espoo, Finland, 1999. [Google Scholar]
- Climatiq. Emission Factor: Epoxy Resin, Cradle-to-Gate; Emission Factor: Fly Ash Delivered to Plant; Emission Factor: Sand; Climatiq Data Platform: Berlin, Germany, 2024. [Google Scholar]
- Instytut Techniki Budowlanej. Environmental Product Declaration Type III ITB No. 674/2024: Natural Crushed and Gravel Aggregates and Recycled Crushed Aggregates Offered by Cemex Polska; Program Operator ITB; Declared Unit 1 t Aggregate; A1–A3 GWP-Total 3.28 kg CO2e/t for Natural Crushed Aggregate and 1.03 kg CO2e/t for Natural Gravel/Sand Proxy; Valid to 20.09.2029; Instytut Techniki Budowlanej: Warsaw, Poland, 2024. [Google Scholar]
- EN 196-1:2016; Methods of Testing Cement—Part 1: Determination of Strength. European Committee for Standardization: Brussels, Belgium, 2016.
- Derringer, G.; Suich, R. Simultaneous optimization of several response variables. J. Qual. Technol. 1980, 12, 214–219. [Google Scholar] [CrossRef] [Scilit]
- Sika Canada; CSA Group. Environmental Product Declaration No. 7773-3526: Sika Concrete Admixtures and Cement Additives; Declared Unit 1 kg of Product; A1–A3 GWP 0.537 kg CO2e/kg for the Air Entrainer Sika® Air-260 (Used as Defoamer Proxy); Issued 09.06.2022; Valid to 08.06.2027; CSA Group: Toronto, ON, Canada, 2022. [Google Scholar]
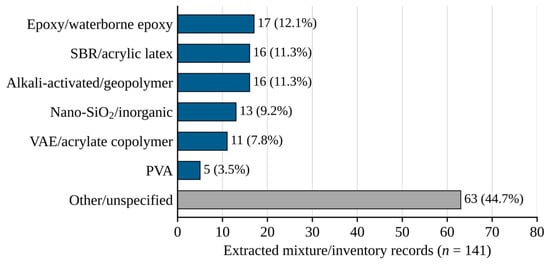
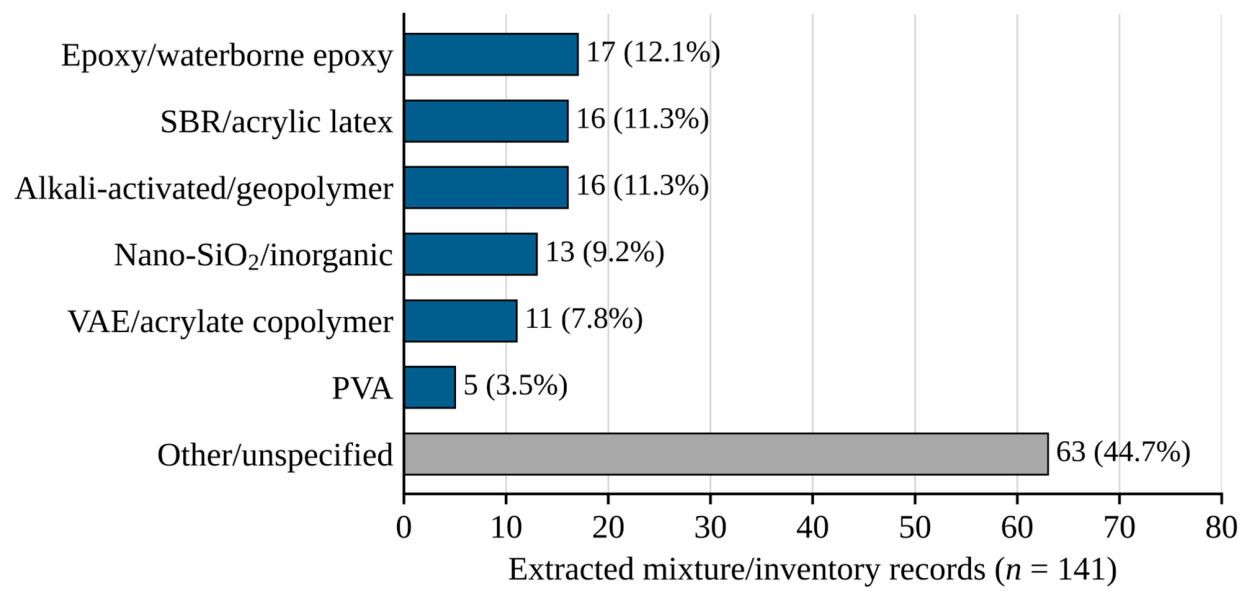
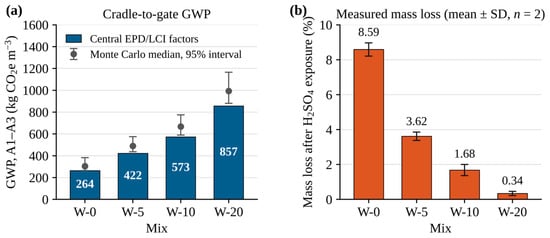
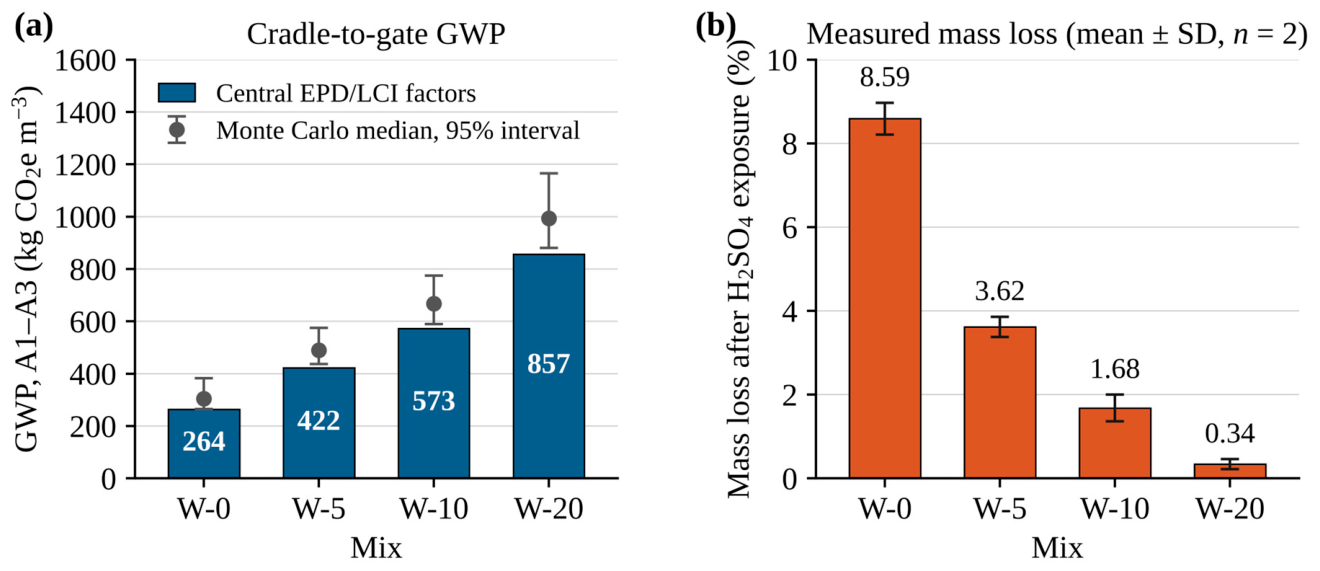
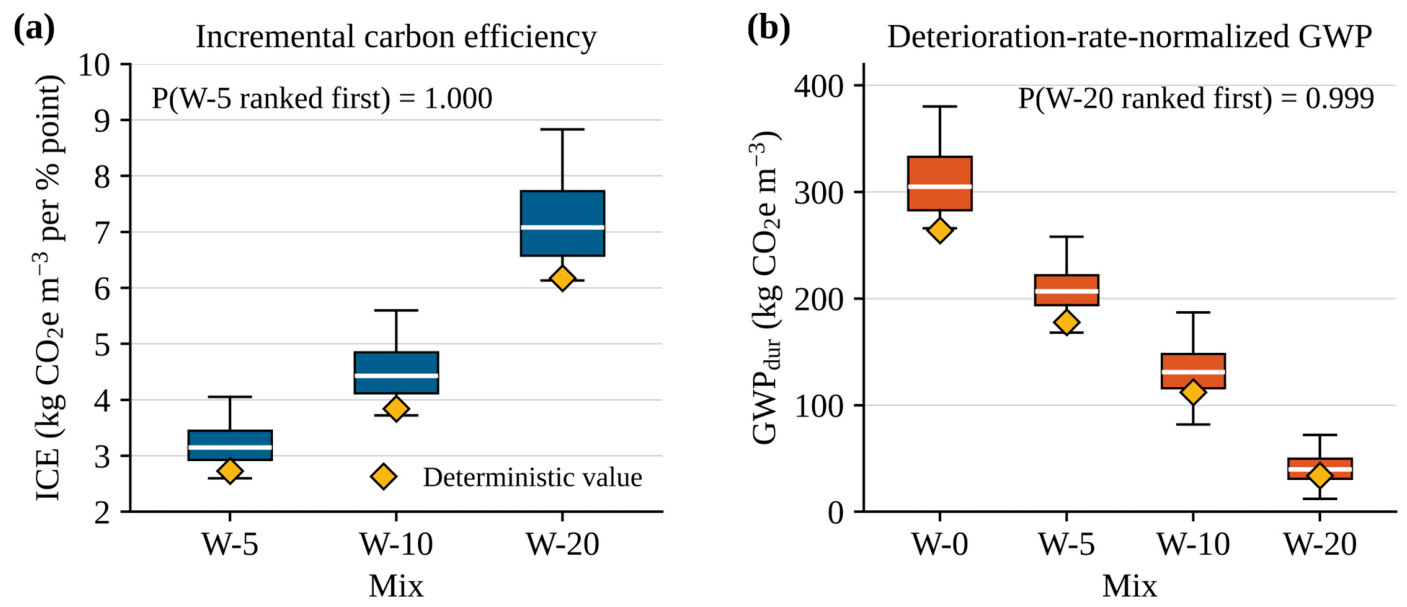
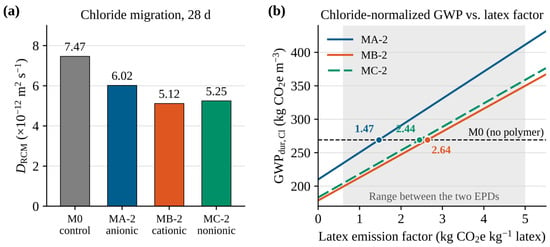
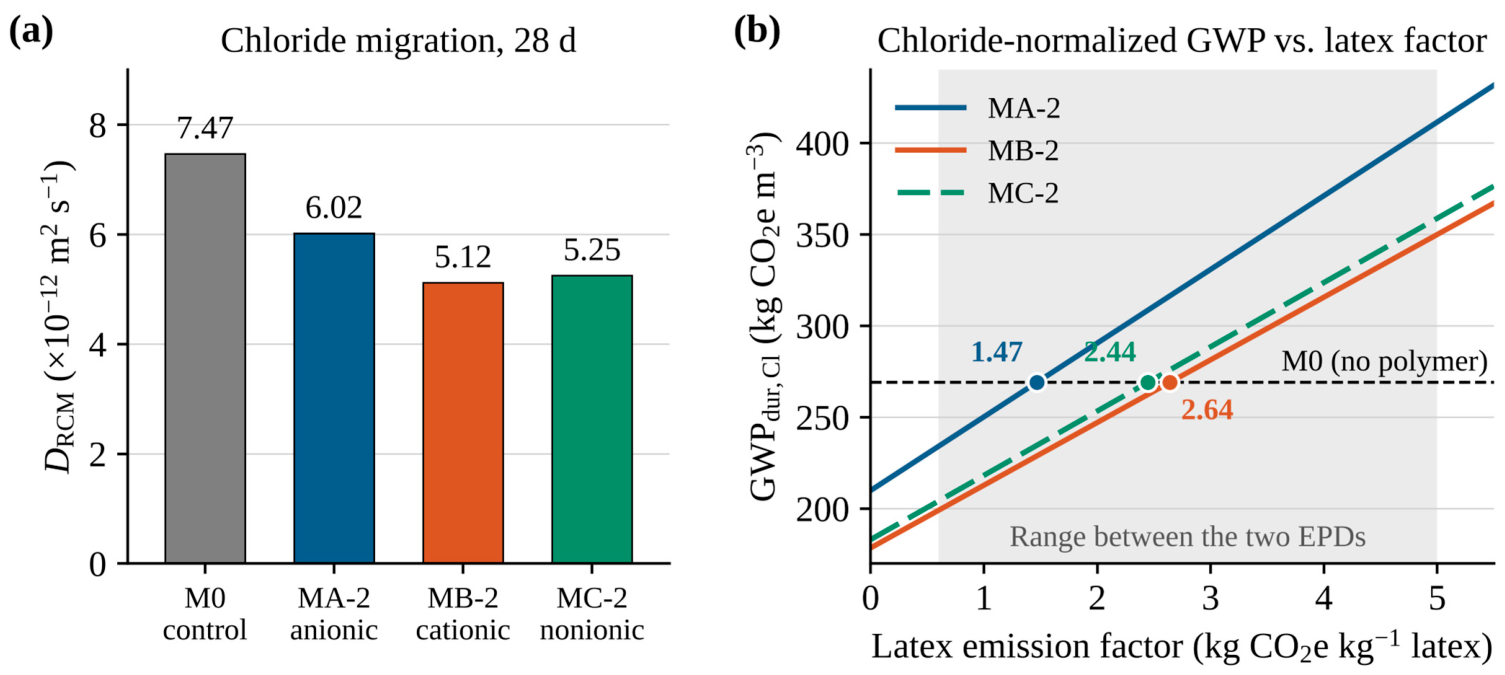
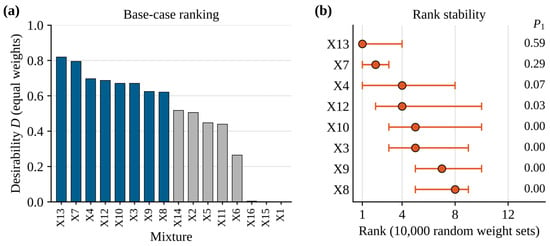
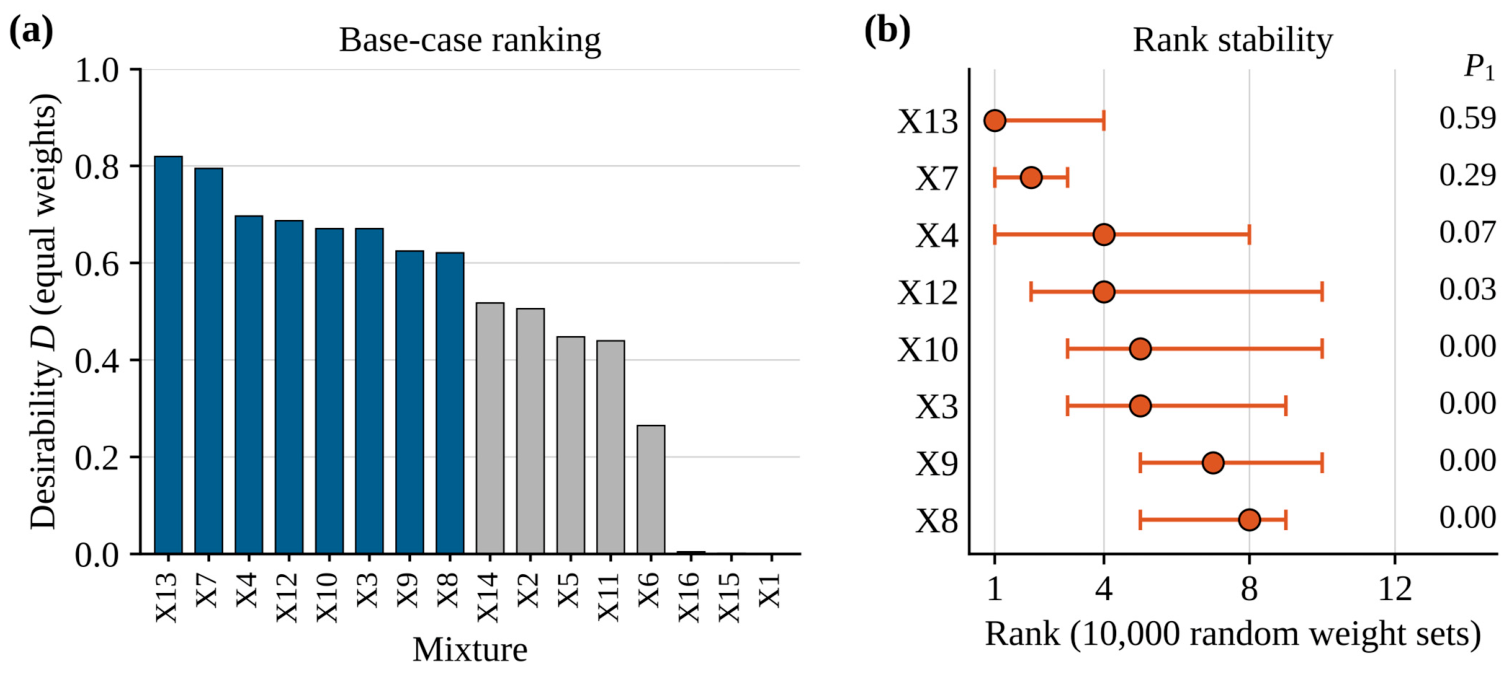
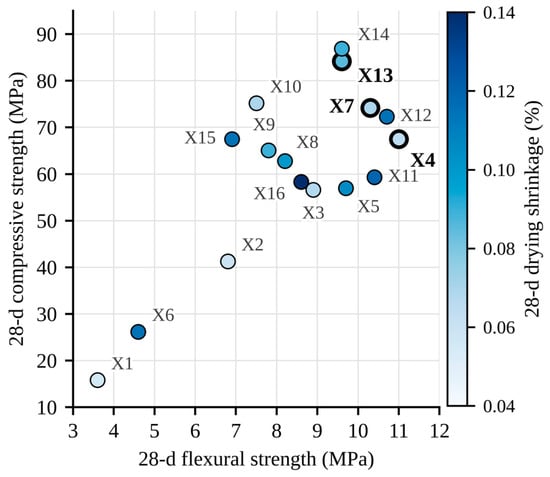
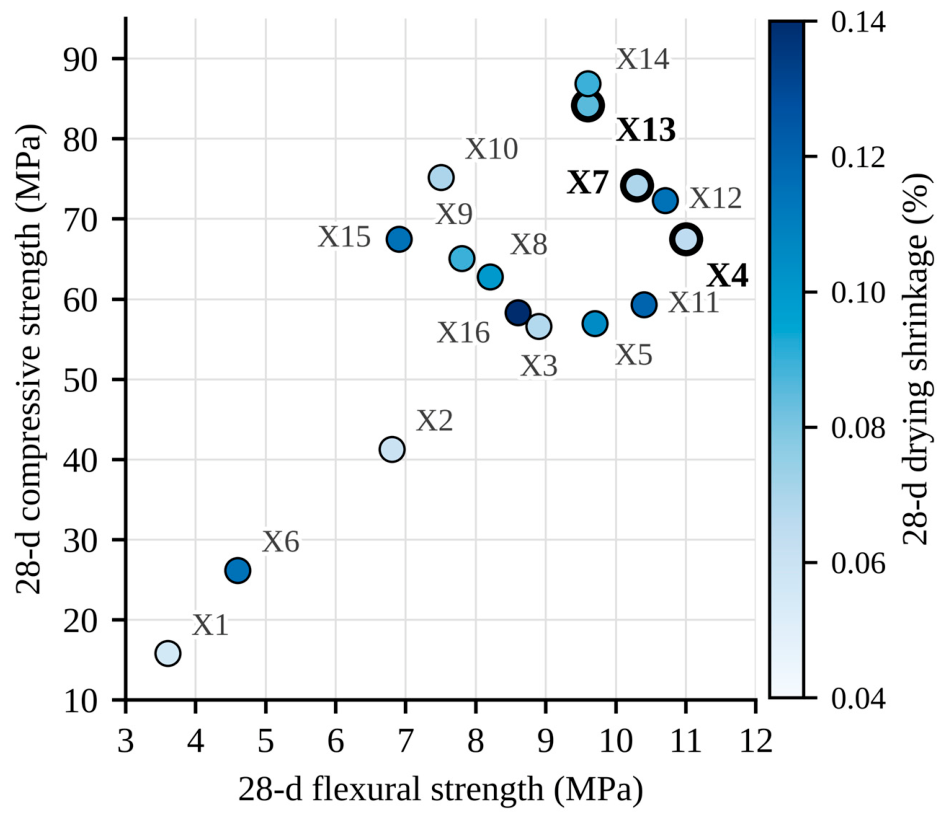

Disclaimer/Publisher’s Note: The statements, opinions and data contained in all publications are solely those of the individual author(s) and contributor(s) and not of MDPI and/or the editor(s). MDPI and/or the editor(s) disclaim responsibility for any injury to people or property resulting from any ideas, methods, instructions or products referred to in the content. |
© 2026 by the author. Licensee MDPI, Basel, Switzerland. This article is an open access article distributed under the terms and conditions of the Creative Commons Attribution (CC BY) license.