


Abstract
Sound-absorbing materials made from biomass are becoming the subject of interest for scientists who search for sustainable alternatives to conventional sound-absorbing materials. At the same time, experimental data on the time dependence of the sound-absorbing properties of such materials is rather scarce. In the current research, the time dependence of the acoustic performance of a biomass sound-absorbing material manufactured from the waste product of sweet passion fruit processing is studied. Four tests were performed under laboratory conditions over approximately 2.4 years. The normal-incidence sound absorption coefficient was measured using an impedance tube, and temporal variations were evaluated using the Acoustic Durability Index (ADI), defined as the ratio between the area under the sound absorption coefficient curve at each measurement campaign and the corresponding area at baseline. It is noted that the nature of changes in thickness and tested surfaces differed. It proves the fact that the response did not depend on time in the same way for the examined cases. The results serve as experimental proof of the alterations in the acoustic properties of the bio-absorber under investigation while being stored in the laboratory. In the case of only a few measurement procedures and one specimen per configuration, the described changes are considered descriptive and cannot be taken as evidence of any degradation processes.
1. Introduction
There has been an increased emphasis on sustainable construction that has brought about the emergence of environmental building materials that not only reduce carbon footprint but also minimize the use of non-renewable resources [1]. Among such building materials, bio-based sound absorbers stand out due to their natural production process, minimal energy required for manufacture, biodegradability, and their ability to value wastes produced by the agricultural and agro-industries [2]. Not only do they provide solutions to the environmental challenges associated with building construction but also support the concept of circular economy through the transformation of waste streams into valuable building products [3].
The last ten years have witnessed many studies proving that natural fibers and agricultural waste products, such as hemp, flax, kenaf, coconut fibers, rice straw, sugarcane bagasse, pineapple leaves, and fruit processing waste, can offer good absorption performance in comparison with mineral wool and other conventional absorbers [4,5,6,7,8]. Experiments, mathematical modeling, and, more recently, artificial intelligence techniques have greatly enhanced our understanding of the relationship between material structure, physical characteristics, and acoustic performance. In this way, there has been a very rapid development of the design and optimization of biomaterials, which have become increasingly interesting in architectural acoustics applications [9,10].
Nevertheless, most of the studies that have been carried out so far have focused entirely on the acoustic performance of fresh materials right after their manufacture. The sound absorption coefficients are mostly determined just after production or short conditioning processes. This type of research is important for characterizing the materials, but it does not provide any data on the process of acoustic performance change during the whole lifetime of the material. In real conditions of using acoustic absorbers, it should be noted that they are supposed to function for many decades under the influence of various factors of the environment such as changing temperatures, humidity, oxidation, biological influences, and aging. Hence, the absence of information about the long-term acoustic stability of the materials is one of the main obstacles to their wide usage [11].
The question of how the acoustic characteristics of bio-based absorbers vary over time is an important point in the evaluation of such sound-absorbing materials. While the acoustic characteristics of porous and bio-based materials have been studied quantitatively, evaluation of the acoustic characteristics of materials at one particular moment in time does not provide information about how those characteristics will change during storage and/or use [12]. Evaluation of acoustic performance over time requires measurements to be made at multiple time points, and there should be a common standard for comparing the SAC spectra of the absorbers obtained at different times [13]. Comparisons of SAC spectra may reveal any changes in the acoustic absorption and frequency characteristics of materials; however, the evaluation should take into consideration the methodology and measurement uncertainty [14]. The current paper evaluates changes in the SAC spectra of a bio-based absorber made from agro-industrial waste of sweet passion fruit throughout the course of four experiments lasting approximately 2.4 years.
Thus, the creation of durability-based assessment procedures is becoming more and more important not only for research but also for practical applications. Just like other durability indices used in structural engineering and material science, acoustic materials need performance metrics that would describe not only the acoustic efficiency of the materials, but also their durability [15,16].
In order to evaluate the time dependence of the acoustic performance of the material under investigation, the present study relies on the Acoustic Durability Index (ADI)—a quantitative measure reflecting the ratio of the relative retention of the sound absorption performance with respect to the baseline condition. Specifically, the ADI is computed as the ratio of the area below the curve of the sound absorption coefficient versus frequency within the frequency interval of interest for a given measurement campaign and the area at baseline. The analysis is based on a number of repeated measurements that were carried out within a span of about 2.4 years. The changes in broadband and frequency-dependent acoustic performance of the test materials, in addition to the ADI, are assessed in an attempt to differentiate between changes in the total absorption and changes in its frequency distribution.
The experimental study focuses on the bio-sound absorber obtained from sweet passion fruit agro-industrial waste. The sound absorption coefficient under normal incidence conditions was evaluated in four campaigns spanning a period of about 2.4 years, using the same measurement procedure. The repeated-measurement design allows making comparisons of the acoustic properties measured at various time points while being stored under the same laboratory conditions. However, the small number of measurement campaigns and the single physical sample used for each thickness, as well as the lack of data on relative humidity measured during each campaign, preclude any definitive conclusions regarding the nature of temporal variation observed. Hence, the results are considered to demonstrate the variability of the properties of the samples rather than evidence of the particular degradation mechanism.
The principal result of the present work consists of the quantification of temporal fluctuations in the acoustic performance of a bio-based sound absorber on the basis of repeated measurements and application of the ADI as a parameter to describe the relative changes in the broadband acoustic absorption capacity. Being integrated with exploratory analysis of temporal trends and frequency-related responses, the application of ADI allows one to create a foundation for comparison of the tested thicknesses and surfaces over the entire observation interval. In contrast to previous works describing acoustic performance of materials at the moment of fabrication only, the present study explicitly evaluates how the measured performance fluctuates over time. This results in a preliminary evaluation of performance consistency in the tested samples, while additional studies involving independent replication of the samples, increased frequency of measurements, and environmental documentation are required in order to evaluate the reliability of the observed trends and possibility of long-term performance prediction.
2. Materials and Methods
2.1. Material Characterization
The investigated material is the bio-sound absorber made of sweet passion fruit agro-industry waste; it was chosen within the scope of sustainable sound absorber studies, which deal with sustainable acoustic materials and their application for the effective valorization of renewable resources [17]. The selected material is considered a representative example of bio-based sound absorbers due to its potential for implementation in building acoustic applications and the lack of investigation of its acoustic characteristics during the aging process under real conditions (Figure 1).
Figure 1.
An investigation of an eco-friendly sound absorber made from the agro-industrial waste of sweet passion fruit (Passiflora ligularis Juss) was performed. (a) Sweet passion fruit; (b) sweet passion fruit without pulp and seeds; (c) samples of sound absorber made from the peel, thickness: 30 mm, 40 mm, and 50 mm.
The sweet passion fruits (Passiflora ligularis) used in this study were purchased from local farmers in the province of Imbabura, Ecuador. The fruits were extra-commercial grade, having individual weights between 90 and 100 g and a maturity of 75%. It is evident that the fruits were orange in coloration and fully mature. Fruits without any signs of damage due to insects or disease infection were used. In addition, fruits without any abnormalities in moisture content, foreign matter, or deterioration were chosen. At the supplier’s facility, fruits were subject to postharvest treatment by immersing them in difenoconazole in water at a ratio of 0.125 L per 100 L of water. After transport, fruits were stored for 4 to 5 days prior to extraction. The fruits were cut transversely into two halves, and the seeds and the pulp were separated. The peel was subjected to oven drying at 50 °C for 8 h while facing the inside upward. Drying was done the following day using the same temperature and humidity until the end of the drying process was achieved. Drying was done by measuring the weight before and after drying. Weight loss was about 15%.
The only part utilized in this research work was the white-colored section of the sweet passion fruit peel. The choice of this particular part was based on its soft and porous nature as well as high moisture content compared to other fiber-like substances. The yellow-orange-colored outer peel was left out of the acoustic samples. Samples were fabricated with thicknesses of 30, 40, and 50 mm. The obtained sweet passion fruit peels were manually cut into circles with a diameter of 34.9 mm, which was the inside diameter of the impedance tube sample holder. The disks were placed together to obtain the desired thickness of the sample by placing the inner side of one layer with the outer side of another layer.
The layers were joined with minimal quantities of adhesive solution containing distilled water and commercially available wood glue (DISMA) based on polyvinyl acetate (PVAc) at a volume ratio of 9:1. Adhesive was applied to the internal side of each layer with the help of a brush. The layers were assembled with minimal mechanical pressure, in order to maintain the natural structure of the material in the best way possible. The adhesive dried in ambient laboratory conditions. Obtained specimens had a nominal diameter of 34.9 mm and nominal thickness of 30, 40, and 50 mm. These specimens were further tested acoustically with the impedance tube method.
The acoustic characteristics of the material were studied by measuring the sound absorption coefficient (SAC). It is the key characteristic for determining the acoustic efficiency of sound absorbers. The SAC was measured using the technique of the transfer function measurement in the impedance tube (EN ISO 10534-2) [18]. This method was selected because it allowed us to measure the changes in the acoustic characteristics of the material over time [19,20,21].
The acoustic sound absorption coefficient was determined using the Spectronics ACUPRO impedance tube, which is Kundt’s system, with an inner diameter of 34.9 mm and an operating frequency range of 50–5700 Hz. The system was provided with a JBL 2426 J speaker and two ½ inch GRAS 46AO microphones mounted on the source side of the sample. The normal-incidence sound absorption coefficient was obtained by applying transfer function technique according to ISO 10534-2 [18] standards. All measurements were performed by means of ACUPRO 4.5 software and the DT9837A data acquisition interface. In each test setup, the software was configured to make 100 measurements.
Specimens in circular form, having a 34.9 mm diameter, corresponding to the inner diameter of the impedance tube holder, were cut manually from the prepared sample and placed straight into the specimen holder. The specimen was placed in such a way that it came in contact with the inner surfaces of the holder, without any additional edge sealing. Measurements were carried out under rigid backing conditions. Even though the diameter of the specimen was in correspondence with the inner diameter of the impedance holder, this alone does not confirm that there was no leakage in the mount, as the specimen diameter and the impedance tube holder inner diameter correspond.
This individual specimen was measured through different campaigns to monitor how its acoustic behavior changed over time, while preserving its identity in all measurements. Nevertheless, using only one individual specimen for a certain thickness and measurement side configuration precludes the possibility of determining the inter-individual variability and generalizing the trends that were observed. Repeated measurements reveal only the repeatability of measurements, but not inter-individual variability.
In particular, the first acoustic study was carried out in 2019, and then it was repeated three times within the next 2.4 years. SAC measurements were made four times, namely, on 13 August 2019, 17 July 2020, 25 June 2021, and 11 January 2022. During each measurement session, the same methodology was used.
2.2. Long-Term Acoustic Measurements
The objective of the long-term monitoring experiment was to measure the evolution of the acoustic response in aging conditions. Material samples were kept under normal environmental conditions between the measurement campaigns, avoiding any kind of artificial aging process like thermal cycling, UV light, or humidity variation. This strategy was followed in order to simulate realistic working conditions similar to indoor building applications.
In each experimental session, the SAC was measured within the investigated frequency range, providing a full acoustic response curve of the material under study at different aging stages. The experimental results were compared to the reference measurement carried out at the initial condition in order to evaluate the temporal evolution of the acoustic properties.
The dataset created as a result of monitoring during the 2.4 years was used to analyze both global and frequency-dependent degradation processes. The analysis included the assessment of potential changes in absorption efficiency, the modification of the SAC curve, and frequency characteristics corresponding to the acoustic properties of the material.
The use of repetitive measurement procedures throughout an extensive period is a key element of the research since short-term experimental investigations do not allow the study of slow degradation processes that affect the bio-based materials. Thus, biological degradation, moisture distribution changes, porous network restructuring, and internal morphological modifications might gradually impact the acoustic properties of the material. Only a long-term experimental procedure will enable the investigation of the acoustic durability of sustainable absorbers.
2.3. Acoustic Feature Extraction
In addition to the direct comparison of SAC curves, a set of acoustic parameters has been determined to quantify the effect of aging on material properties. The selection of parameters has been done with the aim of describing different properties of acoustic performance and detecting possible aging mechanisms. The first acoustic parameter was the ability of materials to absorb acoustic energy [22]. It was quantified via integral calculation of the SAC curve for the entire frequency range under consideration. The parameter describes global losses in acoustic efficiency and helps to compare different aging conditions.
Additionally, the evolution of the maximum absorption coefficient and the frequency of maximum absorption have been determined. The maximum absorption coefficient defines the maximal efficiency of materials as acoustic absorbers, while the frequency shows whether there is any change in the dominant absorption mechanism. The change in absorption frequencies may be caused by some modifications in internal material structure due to aging processes. Also, the effective absorption bandwidth has been calculated as another acoustic parameter to evaluate changes in the frequency range of acoustic performance. Any decrease in absorption bandwidth means loss in functional performance even if the maximum SAC value does not change [23].
In order to perform a full acoustic analysis of the long-term acoustic performance of the bio-based absorber, the sound absorption coefficient (SAC) spectra have been analyzed via an additional computation of frequency-independent acoustic characteristics [24]. Despite the fact that the SAC spectrum is the most comprehensive characteristic of acoustic performance, its interpretation across different aging stages may be influenced by the local changes in the absorption at particular frequencies [25]. Thus, several additional acoustic characteristics were obtained to evaluate the efficiency of absorption properties and detect possible degradation mechanisms influencing broadband acoustic performance [26].
The following three acoustic characteristics were chosen for the analysis: Noise Reduction Coefficient (NRC), Sound Absorption Average (SAA), and Area Under the SAC Curve (AUC). The reason for selecting these acoustic characteristics was their ability to give complementary information about acoustic performance: NRC is the traditional engineering characteristic of sound absorption efficiency, SAA is the statistically more advanced method of broadband absorption calculation, and AUC characterizes the total acoustic performance over the whole investigated frequency range.
The Noise Reduction Coefficient (NRC) represents the sound absorptivity rating, which has often been utilized in the field of building acoustics to give a rough estimate of the absorptivity of materials. As per the standard defined by ASTM C423, the Noise Reduction Coefficient is the average of the absorptivity of the material at frequencies 250, 500, 1000, and 2000 Hz obtained through tests in a reverberation room [27]. In the current work, however, the sound absorptivity of the samples was measured in an impedance tube at normal incidence. Any Noise Reduction Coefficient-like quantity thus obtained from the above-mentioned measurement data should be considered to be a rough approximation of the normal incidence absorptivity, not a Noise Reduction Coefficient as per ASTM C423. The parameter is calculated as:
where is the coefficient of sound absorption corresponding to the octave-band frequency (f).
Regarding the evaluation of acoustic aging, NRC data provide information about the material’s capacity to preserve its mid-frequency absorption ability. Any decrease in NRC value means deterioration of the acoustic performance of the material; constant NRC values throughout the measurement period imply that the material preserves its performance characteristics for typical architectural applications. Nevertheless, since NRC is measured at just four frequency points, it does not provide information about possible local changes in the spectrum of sound absorption.
The Sound Absorption Average (SAA) is a one-number figure used for evaluating sound absorption properties over a wider range of frequencies than the Noise Reduction Coefficient (NRC). As stated in ASTM C423, the SAA is defined as the arithmetic average of sound absorption coefficients at twelve one-third-octave-band frequencies from 200 to 2500 Hz obtained from the measurements done according to the specified reverberation room technique [28]. In the current work, however, the absorption coefficients have been evaluated for the normally incident sound waves using the impedance tube. Therefore, any SAA-type value determined from the mentioned measurements can only be regarded as an approximation of normal incidence absorption coefficients. This parameter is calculated as:
whereas denotes the value of sound absorption coefficient at each one-third-octave-band frequency.
As compared to the NRC, SAA gives a much more elaborate depiction of broadband performance of acoustics since it considers more frequency points. It thus becomes very useful in analyzing those materials that show varied sound absorption characteristics over a broad range of frequencies or those materials whose performance is variable due to structural changes [29].
In case of durability assessment over the long term, the SAA proves itself to be very useful since it minimizes the effect of individual variations in frequency and gives an average performance measure. Thus, the variations observed in the SAA value over a period of time can be considered as the result of global variation in the acoustic performance of the material.
Along with the acoustic parameters described above, the AUC parameter was used as an integral value that describes the overall acoustic absorption capacity within the measured frequency range [30].
The AUC parameter was determined from the numerical integration of the SAC spectrum:
where is the sound absorption coefficient as a function of frequency and and represent the limits of frequency within which the investigation is performed.
The definite integral was estimated using the trapezoidal rule for the discrete experimental data.:
where n is the number of frequency points used in the measurement.
Unlike NRC and SAA, which are determined from chosen frequency bands, AUC takes into account the whole absorption spectrum, thus reflecting the overall acoustic energy dissipation capacity [31]. This property makes AUC highly appropriate for long-term investigations since even small changes in frequencies or their localized fluctuations, which can be observed during aging, do not always mean deterioration of the acoustic properties of materials.
A drop in AUC reflects deterioration in the absorption capacity of materials, while its stability or increase means that acoustic functionality is preserved. For this reason, AUC was considered an essential parameter for the assessment of the cumulative effect of aging on the performance of absorbers.
The concurrent consideration of NRC, SAA, and AUC enables the comprehensive acoustic durability assessment through the combination of standardized engineering metrics and spectral descriptors. The NRC metric provides data that are directly useful in terms of real-world architecture use cases, the SAA gives a statistically reliable estimate of broadband absorption, and the AUC describes the entire progression of the SAC curve. These metrics serve as a foundation for further derivation of durability metrics, such as the Acoustic Durability Index (ADI).
2.4. Temporal Variation Analysis of Acoustic Features
The measurement of acoustic durability involves the identification and quantification of the changes in the acoustic descriptors through the aging process. For this reason, the time evolution of the acoustical properties was first evaluated in order to calculate the deviations of each acoustic descriptor from the initial acoustic condition of the material [32].
The experimental campaign conducted in 2019 is considered the reference state t0 corresponding to the initial acoustical performance of the bio-based absorber. All other measurements performed in 2020, 2021, and 2022 have been used for comparison with the reference state. In this way, it is possible to assess whether there is any retention or reduction in the acoustic performance without considering the value of the absolute acoustic properties.
For all combinations of absorber thickness and measurement sides, the time evolution of the main acoustical descriptors has been determined. Such combinations include the three material thicknesses (30, 40, and 50 mm) and the two measurement sides (Side 1 and Side 2).
The following acoustic criteria were used:
- Maximum sound absorption coefficient SACmax [33];
- Peak absorption frequency fpeak [34];
- Area under the sound absorption coefficient SAC AUC [35];
- Noise Reduction Coefficient NRC [36];
- Statistical Absorption Average SAA [37].
The change in maximum sound absorption coefficient is expressed as:
and expressed also as percentage variation:
where is the initial value measured in 2019 and is the value measured after the aging time (t).
The variation in characteristic absorption frequency was calculated as:
where fpeak(t) is the frequency that corresponds to the maximal absorption coefficient at the given aging stage. The introduction of this parameter allows finding out the changes in the acoustic behavior as a result of the alteration of the material structure, stiffness, or flow resistivity. The cumulative change in acoustic performance was determined based on the area under the SAC graph:
with the corresponding normalized variation:
As AUC is an expression of the cumulative absorption capacity throughout the entire frequency range analyzed, the changes over time in AUC give information about possible changes in acoustic efficiency of the absorber.
The changes in the normalized broadband acoustic characteristics were also determined:
where the variations in NRC and SAA give information about the stability of broadband absorption capacity under aging conditions.
The complete time series dataset has been collected for all the thickness–side combinations and for all the aging years, thus forming the matrix of acoustic degradation indexes. In this way, it is possible to analyze progressive trends, transient effects, and aging trends that depend on the material configuration.
To make the interpretation of the time evolution of acoustic performance easier, a table representation was produced: Acoustic Indicators Evolution shows the time evolution of normalized acoustic indexes (), (), (), (), and () for each material configuration. This representation helps in recognizing degradation trends, stabilization effects, or recovery effects.
The analysis of temporal variability is the experimental basis for calculating the Acoustic Durability Index (ADI). Although the current analysis covers only the development of acoustic descriptors, the proposed durability indices that are discussed in the next chapter represent a normalized assessment of acoustic reliability.
2.5. Acoustic Durability Index (ADI)
For the quantification of temporal effects on the acoustic properties of the material, an Acoustic Durability Index (ADI) was introduced using the percentage change in the area under the curve (AUC) of the SAC. The AUC refers to the frequency-integrated SAC within the selected frequency range. The ADI is the comparison between the AUC determined in each following measurement and the same parameter obtained during the initial test series.
The Acoustic Durability Index is defined as:
where
- AUC(t) is the area under the SAC curve calculated after aging duration (t);
- AUC(0) is the original AUC value calculated before aging.
The area under the curve of SAC was estimated in MATLAB v. 2023a through the use of the trapz function that performs numerical integration based on the trapezoidal rule of the SAC values within the frequency range studied. The area under the curve (AUC) obtained was employed as an integrated measure of acoustic absorption properties. The approach considers the effect of the absorption coefficients measured at various frequencies and can serve as a foundation for evaluating the acoustic performance before and after aging. The application of the AUC minimizes the impact of particular frequencies, although it may not account for all frequency-dependent changes.
The area under the curve (AUC) of the sound absorption coefficient curve was determined through the use of the trapezoidal numerical integration method within the frequency range of 100 to 5000 Hz. The integration limits were set the same for all the measurement campaigns to maintain uniformity in the computation of the Acoustic Durability Index (ADI). Hence, the ADI is the ratio of the integrated sound absorption coefficient in that frequency range at every measurement campaign to that of the first measurement campaign.
The percent change in acoustic performance is given by:
where is the loss percentage of acoustic efficiency in relation to the initial state.
(ADI = 1) signifies that the integrated acoustic absorbance response remains the same as that of the first reference measurement, while values greater or smaller than one signifies that the integrated response is larger or smaller than that of the reference measurement. However, a value less than one for ADI does not necessarily mean a decreasing trend over time. Figures greater than one show a slight improvement in the material absorption capability due to conditioning or experimental variation.
Use of the area under the curve (AUC) as the basis of ADI does not depend on a specific resonance frequency or peak absorption point.
2.6. Temporal Analysis and Exploratory Modeling of the Acoustic Durability Index
The temporal evolution of the bio-based sound absorbers was evaluated via Acoustic Durability Index (ADI(t)) that is calculated as the ratio of the area under the curve of sound absorption coefficient versus frequency at time (t) to the same area evaluated in the baseline campaign. Thus, ADI(0) = 1. The evaluation entailed the characterization of temporal trends along with the development of exploratory models of ADI evolution over the course of 2.4 years.
For each material configuration, the temporal trend of ADI was characterized by calculating the slope of ADI as the function of time and 95% confidence interval of the estimated slope [38]. The slope characterizes the temporal trend and provides information on the direction and strength of the trend. Due to the small number of measurements (four observations per configuration) and the presence of only one specimen per configuration, the slope evaluation was considered to be exploratory. Confidence intervals were interpreted taking into account the limited temporal sample size and could not be used for evaluation of stability of the materials or absence of degradation [39,40,41].
3. Results
3.1. Evolution of Sound Absorption Performance During 2.4 Years of Temporal Variations
The stability of the sound absorption efficiency of the bio composite under study was tested experimentally using a 2.4-year monitoring test that allowed for determining the sound absorption properties of the studied material during temporal variations [42,43,44,45,46]. Contrary to the studies on sustainable acoustic materials usually carried out in the fresh state or after short conditioning procedures, the current research analyzed the acoustic properties of the same specimen with respect to time, and thus provided information on the intrinsic sound absorption stability of the material [47,48,49].
For this purpose, the SAC was determined at four different aging steps: initial characterization on 13 August 2019 and three measurements after approximately one, two, and three years of temporal variations (on 17 July 2020, 25 June 2021, and 11 January 2022, correspondingly). Three different material thicknesses (30, 40, and 50 mm) and two test configurations (Side 1 and Side 2) were considered in order to establish whether the material orientation and thickness affect its sound absorption properties during aging (Figure 2).
Figure 2.
Temporal change in the sound absorption coefficient (SAC) of the bio-based sound absorbers made from sweet passion fruit waste. Six sub-figures that correspond to different configurations of the samples are shown here: (a) 30 mm, Side 1; (b) 30 mm, Side 2; (c) 40 mm, Side 1; (d) 40 mm, Side 2; (e) 50 mm, Side 1; and (f) 50 mm, Side 2.
The specimens were kept in the laboratory indoors under similar conditions, with a temperature that varied typically between 22 °C and 25 °C. Nevertheless, relative humidity was not constantly monitored or documented for every test session while the samples were being stored. This means that even though the samples were exposed to similar environmental conditions in the laboratory, the impact of variations in relative humidity levels on the sound absorption coefficient (SAC) could not be completely excluded from the experimental results. The sound absorption differences could be due to structural or mechanical modifications within the material that occur over time. However, in the current experimental investigation, no attempts were made to look into the causes of these changes. Thus, internal relaxation can be considered a plausible cause rather than the only one.
Yet another feature of the material studied is its asymmetrical nature. In this case, sweet passion fruit peel consists of two parts: one thin, fairly rigid, orange part, which has not been used in the experiment, and one white, porous part, from which the absorbent was made. Hence, there are two different surfaces of the material studied: one surface, which previously had been adjacent to the orange peel, and the other, which had been adjacent to the pulp. During the process of assembly, the layers have been stacked keeping the same orientation. Therefore, Side 1 corresponds to the arrangement in which the surface, which previously had been adjacent to the orange peel, is exposed to the wave directly, whereas Side 2 is the opposite, corresponding to when the wave falls on the surface, which previously had been adjacent to the pulp.
The 30 mm samples demonstrated good preservation of their acoustic properties during the whole period of observation. Curves for four campaigns for each side possessed the same structural form, with an initial rise in the value of the absorption coefficient in the low-frequency range, up to 400–630 Hz, and further broad behavior at medium–high frequencies. Differences between the campaigns occurred in the specific ranges of frequencies, and not as a constant decrease in SAC throughout the whole frequency range.
The preservation of the structural form of the curves suggests that the acoustic activity of the porous structure of the material is preserved over time [50]. For the fibrous and porous materials, the main mechanism of acoustic absorption lies in dissipation of acoustic energy due to viscous and thermoviscous effects, caused by movement of the air inside pores. Thus, a slight deformation of the local pore geometry is enough to create variations in SAC in specific bands [51].
Therefore, concerning the sample with 30 mm size, these variations could possibly be considered as resulting from a gradual stabilization of the structure of the material. The samples were stored in the laboratory in the temperature range 22–25 °C, but the lack of data on the relative humidity for each campaign does not allow one to exclude the influence of moisture-related processes. These variations could also be caused by mechanical relaxation and variations in porosity and binding system, but it is impossible to prove that based on the provided data.
These differences demonstrate that the acoustic response was not the same for the two surface samples investigated. The surface which corresponds to the external part of the peel and the surface which was in contact with the pulp can have different microscopic features. These factors could influence the airflow resistance on the surface and thus the interaction of the incident sound waves with the porosity [52]. However, since the surface morphology and airflow resistivity were not separately investigated in this work, the above explanation is only one of the possible interpretations of the findings. Thus, the differences could be associated with the variation in the acoustic boundary conditions for the surface samples under investigation, but there is no evidence of the orientation effect from the obtained results.
The 40 mm sample exhibited the observed temporal variations reported for the three thickness configurations; however, these results do not establish greater temporal stability relative to the other samples. The curves for Side 1 and Side 2 are quite similar for the different campaigns, mainly in the frequency range around 250–2000 Hz. Indeed, there is a main peak of absorption in the low–medium frequency range, and high frequencies show sufficiently absorbent behavior.
The small distance between the four campaigns implies that the 40 mm thickness is quite a robust configuration in terms of temporal evolution. This is quite surprising, considering the fact that it implies that increased thickness does not always imply increased sensitivity to deterioration. It means, on the contrary, that there might be an intermediate configuration where the acoustic path length inside the material is sufficiently long to allow proper dissipation, but is not too sensitive to local variations in the microstructure [53].
As previously stated, the variations in the absorption properties at individual frequencies do not necessarily mean any loss in performance. Porous materials are known to have the ability to change their characteristic impedance and flow resistivity with time. A reduction in SAC in a given band can therefore be accompanied by the maintenance, or even an increase, of absorption in another region of the spectrum.
The behavior of the 50 mm specimens is more complicated. In this case, the specimens show the largest values of absorption coefficients close to the unit at the frequencies from 400 to 630 Hz, demonstrating the good influence of the thickness increase on the dissipative properties of the material. Nevertheless, with time, the differences in the curves are becoming more visible in comparison with the 30 and 40 mm specimens, particularly in the frequency band of maximum absorption.
The behavior of the 50 mm specimens may be justified by the increased interaction between the acoustic wave and the porous volume of the material. The increased thickness makes the wave travel farther in the material and thus increases the opportunity for wave energy loss due to viscous friction and thermoviscous interactions. At the same time, such a feature of the material makes its overall behavior dependent on the structural changes in the material. Any changes in the fiber distribution, interlayer contacts or local density can affect the acoustic flow resistance [54].
The higher level of variability seen in the 50 mm layer need not necessarily be associated with faster degradation of structure. Rather, it emphasizes that the thick layer is acoustically more sensitive to any changes in microstructure. The persistence of high SAC at some frequencies and decrease at others also proves that this process is not a simple degradation of sound-absorbing capacity.
In summary, the comparison of 30, 40, and 50 mm in thickness brings out the difference in behavior in the three cases. The 50 mm thickness is the one that gives better results in terms of acoustic properties initially, though it displays maximum change in the curves with time; the 30 mm thickness gives the most stable results overall, with variation at certain points [55]. The results indicate differences in the temporal evolution of the ADI among the investigated thicknesses. However, these differences should be interpreted descriptively, as the experimental design does not include independent specimen replicates for each thickness.
This is even more important when one considers the bio-based nature of these materials. Higher performance does not necessarily mean higher acoustic stability with increased thickness. It is all about the balance in porosity, flow resistance, tortuosity, and pore size distribution. Any change in these factors will change the frequencies and the amplitudes of the absorption peaks.
In this case, the fact that the environmental exposure is indirect and the temperature is maintained at 22–25 °C renders this outcome especially fascinating, as this variation is a measure of the temporal evolution of the material when it was kept in a relatively shielded environment. It is more correct to discuss long-term acoustic stability and intrinsic evolution of the acoustic characteristics of the material instead of environmental deterioration in the classic sense.
Lastly, differences noted between Side 1 and Side 2 show that the surface arrangement ought to be taken into consideration in analyzing the acoustic performance of the tested material. The two sides refer to the outer part of the orange peel and the inner part that made contact with the pulp, respectively. They can vary in terms of surface properties. It is possible that they would have an effect on the way in which the incident sound waves interact with the porous material, possibly altering the acoustic energy absorption and transmission process. Nevertheless, since the surface properties were not independently analyzed and the measurements used a small number of physical samples, the differences observed between Side 1 and Side 2 do not indicate an orientation effect. More research is required to quantify such an effect, if any.
As a general conclusion, one can state that although the absorber extracted from sweet passion fruit peel still possesses acoustic efficiency during the entire time frame considered, the temporal behavior is strongly related to both the thickness and the orientation of the surface, but not to a simple linear reduction in the absorption coefficient. Indeed, the changes in the acoustic efficiency do not appear to be directly related to an intrinsic property such as the absorption coefficient, since the modifications are more likely frequency-related. This means that the dissipative capacity does not decline with time but rather changes its spectral response. Consequently, any assessment of the acoustic durability should be completed with global parameters such as NRC, SAA, area under the SAC curve, frequency shift, and absorption bandwidth.
3.2. Temporal Evolution of Acoustic Features
Although the examination of the whole SAC curves gives an overall qualitative picture about the acoustic stability of the bio-based acoustic absorber, a quantitative approach is needed in order to evaluate the acoustic properties of the material. In order to achieve this, the following global acoustic descriptors have been computed from the experimental data, namely the maximum sound absorption coefficient (SACmax), the peak absorption frequency, the area under the SAC curve (AUC), the Noise Reduction Coefficient (NRC), and the Statistical Absorption Average (SAA). These descriptors correspond to several acoustic parameters of the material, which help evaluate its stability over the overall period of storage under laboratory conditions.
Table 1 provides the values of SACmax (maximum absorption coefficient), fmax (frequency corresponding to maximum absorption), Frequency Span (bandwidth where SAC ≥ 0.5), AUC (area under absorption curve), MeanSAC (mean of the SAC), StdSAC (standard deviation of SAC), NRC (Noise Reduction Coefficient) and SAA (Sound Absorption Average). The data were compared for the three different thicknesses of 30, 40, and 50 mm and two different orientations—Side 1 and Side 2.
Table 1.
Variation in the main acoustic descriptors.
Frequency Span is defined as the width of the contiguous frequency band over which the sound absorption coefficient (SAC) is equal to or greater than 0.5, calculated as the difference between the upper and lower frequency limits of that band.
The analysis of the 30 mm samples shows an obvious retention of the maximum value of the absorption coefficient, especially on Side 1. The SACmax decreased from 0.762 in 2019 to 0.756 in 2020, became 0.736 in 2021, and rose again to 0.762 in 2022. As seen, the difference between the initial and final values of the SACmax is almost zero. Importantly, such results indicate that the decrease in 2021 is not an indication of irreversible destruction of the samples’ properties. The maximum value of the sound absorption coefficient was achieved during the following measurements, but the frequency at which such a maximum was observed changed from year to year. The specific observations are as follows: the frequency of the maximum increased from 2500 Hz in 2019 to 500 Hz in 2020, then it became 2500 Hz again in 2021, and finally, it turned out to be 4000 Hz in 2022. It is clear from the above data that the frequency corresponding to the maximum value of the absorbed sound energy was not stable during the campaigns.
However, for Side 2, the SACmax value lowers to 0.73, meaning a decrease by about 4.6%. In this situation, as well, the maximum frequency reveals strong variation, changing from 500 Hz in 2019 to 630 Hz in 2021 and even 5000 Hz in 2022. Observed differences between Side 1 and Side 2 may be associated with differences in their surface characteristics, including those arising from initial contact with the pulp. However, surface structure was not independently characterized, and the available measurements do not establish a causal relationship between surface characteristics and acoustic response. Unlike the surface facing the outer skin, it might have a different distribution of pores and resistance to flow, which could result in different conditions of acoustic wave coupling in air and material.
Moreover, analysis of the integral parameters makes it clear that for the 30 mm sample, the process should not be considered as a simple decay. For example, in Side 1, the AUC grows from 3119.6 to 3252.1, i.e., by +4.3% despite the fact that the final SACmax is almost equal to the initial one. The AUC, NRC, and SAA demonstrated dissimilar degrees of temporal variability. In the particular case examined, NRC and SAA reduced by about 10.1% and 2.6%, respectively. This variation must be analyzed in the context of the different frequency bands and methods used for the calculation of each index, since the AUC is an indicator of sound absorption coefficient within the entire frequency band studied, while the NRC and SAA are calculated based on absorption coefficients of certain frequencies. Therefore, the indices complement each other in describing the acoustic response obtained, but the variations exhibited by the indices do not prove the distribution of absorption in the frequency band.
It should be stated that the 40 mm samples demonstrate even more stable behavior. For instance, SACmax for Side 1 reduces from 0.7887 in 2019 to 0.7732 in 2022 and represents a rather moderate reduction by about 2%. In addition, the AUC reduces by 2.5%, while SAA does not change much from 0.6060 to 0.6057. Finally, the NRC demonstrates a slight reduction equal to 1.9%. Thus, it can be stated that broadband acoustic performance is significantly preserved. Importantly, the peak frequency of the material remains at 2500 Hz both in 2019 and 2022, despite its intermediate shift to 3150 Hz in 2020. The stability of the frequency at the end implies that there have been no major changes in the acoustical dominant structure of the material. The second side exhibits a more obvious decrease in SACmax, from 0.7884 to 0.7313, which represents 7.2%. Nevertheless, the AUC shows a smaller drop of 0.75%, whereas the SAA stays practically the same (−0.09%). The NRC has also shown a minor decrease of 4.0%. This result is very intriguing since it means that the reduction in the maximum level is not proportionate to the total loss of the absorption ability. The observed changes in the sound absorption coefficient curves indicate that the acoustic response varied across measurement campaigns. However, these observations do not establish a redistribution of acoustic energy across frequencies or demonstrate that the material’s overall acoustic performance remained constant.
The 50 mm setup demonstrates the greatest acoustic aging effects. Thus, in 2019, Side 1 achieved a maximum of 0.9767, which is almost complete absorption. These figures were stable in 2020 and 2021 and amounted to 0.9769 and 0.9420, but then SACmax was reduced to 0.8848 in 2022. Therefore, the total loss is about 9.4%. As for Side 2, SACmax showed a more dramatic decrease from 0.9406 to 0.8408 and a loss of approximately 10.6%.
However, much more fascinating is the comparison of these data with AUC. In the case of Side 1, even though SACmax is reduced, AUC remains practically unchanged—it is equal to 3285.7 and 3283.7. It proves that the reduction in the maximum does not mean an overall loss of absorption but mainly concerns the shift in the spectrum. On the other hand, for Side 2, AUC is decreasing by 4.4%. The same tendency is shown by the NRC and SAA values. So, Side 1 reduces its NRC to about 14.2% and SAA to about 6.0%, while Side 2 reduces these indicators to 7.7% and 3.9%, respectively.
Thus, the above comparison shows that a higher thickness leads to better initial results but is not necessarily linked with better temporal stability. The samples with the 50 mm thickness really have the largest initial values of SACmax, NRC, and SAA; however, they have the largest temporal changes as well. The 40 mm sample showed no marked changes in either peak-related or broadband acoustic parameters over the measurement period. However, these observations describe the behavior of the tested specimen and do not establish that the 40 mm configuration is generally more stable than the other thicknesses. The 30 mm samples can be positioned between these two categories of samples; they possess a good ability to keep their SACmax value while showing significant changes in the frequency domain.
This physical phenomenon is due to the fact that the absorption properties of the porous bio-based material depend on porosity, flow resistance, tortuosity, pore size, and the dissipative properties of the fibrous matrix. Under the documented laboratory storage conditions (22–25 °C), mechanical relaxation, fiber settlement, changes in internal contacts, and stabilization of the binding system may occur, although these processes were not directly measured in the present study. These processes can locally change the acoustic impedance and flow resistance leading to changing maximum absorption frequencies without losing dissipative properties [56].
In summary, the descriptors thus prove that the material exhibits excellent acoustic stability over a long period of time, although the temporal behavior depends strongly on the sample thickness and orientation [57]. SACmax, viewed separately, tends to overvalue the real deterioration process, especially when it comes to 30 and 40 mm thick specimens. The combined analysis of AUC, NRC, SAA, and peak frequency yields complementary information regarding the time-dependent variation in the obtained acoustic behavior. The discrepancies between the aforementioned parameters can be attributed to their different calculation procedures and frequency ranges, whereas the variation in the peak frequency characterizes the variation in the frequency at which the maximum absorption is achieved. Nevertheless, the obtained data cannot prove whether such variations cause the discrepancies or are related to the general deterioration in acoustic properties.
Table 2 describes the variations in the main acoustic descriptors compared to the initial conditions in 2019, which makes it possible to measure the development in the performance of the bio-based absorbers during the next 2.4 years in absolute and percentage values.
Table 2.
Evolution of the main acoustic descriptors of bio-based absorbers over a 2.4-year period relative to initial 2019 conditions, expressed in absolute and percentage variations.
Such an analysis can help determine whether the observed changes reflect an overall reduction in acoustic absorption or a redistribution of the acoustic response across the frequency range. All samples were stored under laboratory conditions at temperatures of 22–25 °C; however, relative humidity was not monitored during each measurement campaign. Therefore, the observed variations cannot be attributed exclusively to changes in the internal structure or its dissipative properties, as potential contributions from moisture-related effects and other sources of experimental variability cannot be ruled out.
In the case of the 30 mm samples, in 2020, there was a slight decrease in SACmax for Side 1, which amounts to −0.82% and reaches −3.50% in 2021, but in 2022, the value is −0.003%. The importance of such a trend lies in the fact that it is possible to assume that the reduction in 2021 is not a sign of an irreparable deterioration. There is a decrease in SACmax initially, but after some time, the value returns to the one characteristic of 2019. At the same time, the peak frequency changes considerably: −2000 Hz in 2020, 0 Hz in 2021, and +1500 Hz in 2022. It can be said that the material structure maintains the ability to absorb sound at high levels.
The variability in the AUC of Side 1 is always positive at +3.38%, +3.75%, and +4.25% for 2020, 2021, and 2022 respectively. It should be highlighted the relevance of the finding since it allows concluding that, despite the oscillation of the SACmax, the overall integrated absorption increases. It is therefore clear that the material manages to distribute the acoustic energy dissipation over a broader range of frequencies. The NRC varied very little in 2020 (+0.0025), slightly decreased in 2021 (−0.0088) and dropped significantly in 2022 (−0.0606). The same trend can be observed for SAA, which increased in 2020 and 2021 and decreased in 2022. Therefore, it can be stated that the 30 mm Side 1 demonstrates a significant stability of the overall absorptive capability, associated with the modification of the spectral distribution.
The Side 2 (30 mm) case presents a distinct trend that is also systematic. Specifically, the maximum value of the SAC decreases by 3.58% in 2020, 4.80% in 2021, and 4.63% in 2022. The maximum ADI value observed for Side 1 was not recovered during subsequent measurement campaigns. This observation describes the temporal evolution of the measured acoustic response but does not establish a greater susceptibility to aging for either measurement side. In addition, the area under the curve presents a decrease in the same year, by −4.08% in 2020 and −3.19% in 2021; in 2022 the decrease is much less significant: only −0.53%. Also, the NRC and SAA present negative trends, especially in 2022. This suggests that for Side 2 some spectral redistribution takes place along with a slight reduction in overall performance.
The behavior of the 40 mm samples proves the higher level of general stability of this system. In particular, Side 1 demonstrates that there was a decrease in SACmax on 5.02% in 2020, but it partly recovered in 2021 (−3.78%) and then decreased again, although only on 1.97%. However, the AUC is considerably stable in 2020 (−0.03%), but later drops by 3.56% in 2021 and by 2.55% in 2022. The last change in NRC is −0.0113, and in SAA practically equals zero (−0.00022).
Side 2 (40 mm), meanwhile, demonstrates a gradual decrease in SACmax: −3.61%, −4.55%, and −7.24% for the next 2.4 years, respectively. Nevertheless, AUC differs by −0.14%, +4.11%, and −0.75%, correspondingly. Consequently, in this case as well, the change in maximum value is significantly greater than that in the area under the curve. The data for 2021 are especially illustrative here: while the SACmax drops by more than 4.5%, the AUC rises by more than 4%. It should be noted that changes in the values of the acoustic parameters and frequency were found, proving that the acoustic response varied in time. Nevertheless, it is impossible to separate these variations from the variations in the absorption efficiency, as well as to identify any changes in the frequency distribution of the acoustic response.
The 50 mm arrangement demonstrates the largest variations. Side 1 demonstrates SACmax changes in 2020 (+0.02%) and 2021 (−3.52%), while in 2022 it drops by 9.41%. The drop is coupled with a very minor decline in AUC which equals 0.06%. This is the most surprising result out of all of the numbers in the table: the drop of nearly 10% in the absorption maximum results in no changes in the total area. This effect should be understood as a shift and smoothing out of the absorption maximum rather than the equivalent drop in the total energy dissipation.
Side 2 with 50 mm configuration demonstrates the biggest drop of SACmax in the whole set of data: −6.69%, −5.55%, and −10.61% for 2020, 2021, and 2022 respectively. Contrary to Side 1, AUC drops here as well, resulting in the overall loss of 4.40%. The decrease in NRC and SAA confirms that in this configuration, the loss of the maximum is also coupled with the moderate loss of broadband capabilities.
It is clear then that the comparison of thicknesses shows the nonlinear relation between thickness, initial characteristics, and stability over time. The material with the thickness of 50 mm, which is the material with the highest initial absorption ability, shows the highest SACmax variations. The tested 40 mm specimen showed limited observed temporal variations, while the 30 mm specimen exhibited differences between the two tested surface configurations. These observations are specific to the specimens investigated and do not establish general differences in temporal stability or orientation dependence between thicknesses.
In physical terms, this behavior is associated with the nature of the material, which is porous and fibrous. The absorption coefficient depends on acoustic impedance, flow resistance, and pore geometry; therefore, small settling processes in the fibrous matrix can change the frequency and amplitude of the maximum without causing any loss in general [58,59,60]. In thicker materials, the longer acoustic path increases the influence of the interaction between the wave and the porous structure [61].
Orientation influence is no less important. Side 1 and Side 2 correspond to structurally distinct surfaces, one corresponding to the side that used to be closer to the orange peel, another—to the side in contact with the pulp. Variations in the time evolution of SACmax have been noted in both measurement sides for some of the thicknesses studied. But then, these variations cannot be considered in relation to the variations in the surface characteristics or surface resistance to airflow as these have not been measured separately in the current study. From the findings available, there is no evidence to suggest that any one of the measurement sides is more prone to aging.
In general, analysis presented in Table 2 clearly indicates that acoustic performance degradation cannot be described solely by SACmax value. Considering SACmax, AUC, NRC, and SAA together make it evident that quite a large number of variations are caused by changes in frequency response distribution. Particularly, in 30 and 40 mm samples quite considerable variations in SACmax values occur along with much smaller variations in AUC values. On the other hand, 50 mm thickness samples tend to have both reduced maximum and absorption area. As a whole, this shows the importance of using multi-parametric criteria to characterize acoustic stability of the biomaterials.
3.3. Acoustic Durability Assessment Based on ADI
The analysis of the acoustic properties of the investigated bio-based absorber carried out in the previous chapters showed the stable sound absorption properties of the material for a period of 2.4 years of temporal variations. However, the use of traditional acoustic characteristics like the sound absorption coefficient or maximum value of absorption, for example, can characterize the aging process only partially. The complete estimation of acoustic aging should be made with the help of indicators reflecting all three factors: acoustic efficiency, frequency response stability, and future performance of the material.
In such scenario, the use of acoustic durability assessment technique that utilizes Acoustic Durability Index (ADI) is performed to provide a quantitative measurement of the loss of sound-absorbing properties of the material in comparison with the initial state. This technique gives a general idea about the changes in the acoustic performance of the material with time, which is supported by further measurements and modeling.
Table 3 gives the values of the Acoustic Durability Index (ADI) for the tested sweet passion fruit bio-based sound absorbers in each configuration.
Table 3.
Acoustic durability indicator determined for the sweet passion fruit bio-based sound absorbers over 2.4 years.
The initial state (13 August 2019) was taken into account as the reference state, where ADI was normalized to unity. Later on, the numbers were indicative of the development of acoustic performance from the initial state.
The Acoustic Durability Index (ADI) was developed to estimate the retention of the overall acoustic absorption performance in the aging process. Values close to 1.00 mean that the material maintained its initial acoustic performance, while lower values denote the degradation process.
Figure 3 shows the evolution over time of the Acoustic Durability Index (ADI) over a time interval of approximately three years (2019–2022) for six different samples of sweet passion fruit fiber-based sound-absorbing samples (30 mm, 40 mm, and 50 mm, Side 1, and Side 2). The Acoustic Durability Index (ADI) was introduced to estimate the retention of the overall acoustic absorption performance in the aging process. Values close to 1.00 show that the material maintains its original acoustic performance, while lower values indicate degradation.
Figure 3.
Acoustic Durability Index evolution.
ADI ratios greater than unity imply that the AUC determined from the sound absorption coefficient curve at the time of a particular campaign is larger than the respective AUC found during the first campaign. The ADI ratio is calculated as the ratio between the AUC at time (t) and the initial AUC. Therefore, ADI values greater than one are indicative of an increase in the overall AUC relative to the initial value, within the given frequency interval. In the current study, the largest ADI value obtained was 1.04, which implies that the AUC was approximately 4% higher than the initial value.
Such a difference should be understood as an indication of a variation in the AUC value rather than a proof of any physical shift in the sound absorption process. Specifically, the use of ADI alone cannot determine the factors that cause the variation in question, nor can it help determine whether the difference is caused by a physical change in the properties of the sample or by any other factor.
The three major results, which have been obtained through the analysis of the ADI curves, can be identified as follows:
- Excellent Absorption Durability: In all six cases, ADI indexes varied only within the interval between 0.96 and 1.04 during the whole aging period (2019–2022), which means that the panels maintained more than 94% of their initial absorption capacity.
- Differential Behavior Depending on Thickness: Panels of 30 mm thickness (both Side 1 and Side 2) had the highest and most stable ADI values and maintained them near 1 (0.98–1.01). There is a slight decrease in the 40 mm and 50 mm samples’ values; at the end of 2021 and the beginning of 2022, these values stabilized at 0.94–0.97 level.
- Symmetry of the Surfaces and Stability: The differences between Side 1 and Side 2 with the same thickness are absolutely insignificant in ADI and prove that high-frequency surface changes do not affect acoustic durability of the volume.
The stability of the ADI close to unity and the slight discrepancies between the thicknesses are clearly explained by the principles of the physics of porous bio composite materials:
- Invariance of the Porous Matrix and Tortuosity: Acoustic absorption in fibrous materials occurs through dissipation of sound energy through viscous friction and heat exchange between the oscillating air and the pore walls [62]. Since the ADI values remained above 0.9 during the observation period, it is evident that the acoustic absorption behavior was preserved in the storage conditions used in this study. Nonetheless, the open porosity and airflow resistance measurements did not capture the changes to microstructure directly; thus, it is not possible to make any observations about possible irreversible changes in the microstructure and its mechanical integrity, lack of collapse of the cells, etc.
- Hygrothermal Effects and Sample Thickness: The specimens with thicknesses of 40 and 50 mm contained a greater amount of plant-based material than the 30 mm specimens and may therefore have exhibited different responses to variations in ambient moisture. However, the relative humidity was not monitored systematically during the measurement campaigns, and its possible influence on the acoustic response cannot be quantified. All measurements were performed in the same laboratory under generally consistent indoor conditions, with temperatures reported to be approximately 22–25 °C. Nevertheless, the absence of campaign-specific humidity records prevents the exclusion of possible contributions from variations in ambient moisture. The somewhat larger decreases in ADI observed for some of the 40 and 50 mm configurations, compared with the 30 mm configurations, may be associated with differences related to specimen thickness or material composition. However, these explanations remain tentative: the available data do not establish a causal relationship between thickness, moisture-related effects, and changes in ADI [63].
- Resilience of Lignocellulose: While the mechanical and chemical properties of some artificial foams may deteriorate in specific environmental settings, the long-term stability of the treated lignocellulosic fibers in terms of their chemistry and physics cannot be verified based on current findings because no study has been conducted on their resistance to oxidation and UV degradation. The acoustic performance demonstrated by the material is a good reason to study its durability in environmental settings [64].
3.4. Temporal Variation in the Acoustic Durability Index and Exploratory Modeling
The temporal evolution of the Acoustic Durability Index (ADI) was examined for the six material configurations over the 2.4-year observation period. The analysis focused on the changes observed relative to the baseline campaign and on the direction and magnitude of the temporal variation in each configuration.
To characterize these variations quantitatively, the slope of ADI as a function of elapsed time was estimated for each configuration, together with its 95% confidence interval. The estimated slopes describe the average temporal variation over the observation period, while the confidence intervals indicate the uncertainty associated with the fitted trends. Given the limited number of measurement campaigns and the availability of a single specimen per configuration, these results were interpreted descriptively. In particular, an interval containing zero was not considered proof of acoustic stability, nor was a negative slope alone considered sufficient evidence of a systematic degradation process.
The temporal variation in the Acoustic Durability Index (ADI) was evaluated for the six material configurations over the 2.4-year observation period. The estimated slopes ranged from −0.02 to +0.02 ADI units/year, indicating different temporal patterns among the configurations (Table 4). The corresponding 95% confidence intervals included zero in all six cases, reflecting the uncertainty associated with estimating temporal trends from only four measurement campaigns. Consequently, the slope estimates should be interpreted descriptively rather than as evidence of statistically established degradation or long-term stability.
Table 4.
Estimated temporal slopes of the Acoustic Durability Index (ADI), corresponding 95% confidence intervals, and observed changes between the baseline and final measurement campaigns for the six material configurations.
The comparison between the baseline and final measurements provides a complementary assessment of the observed changes. Five configurations exhibited a decrease in ADI, whereas the 30 mm specimen tested on Side 1 showed an increase, with a final ADI of 1.04 (ΔADI = +0.04). Among the configurations exhibiting a decrease, the largest change was observed for the 50 mm specimen tested on Side 2, for which ADI decreased to 0.96 (ΔADI = −0.04). The 40 mm specimen tested on Side 1 also showed a reduction, reaching an ADI of 0.97 (ΔADI = −0.03). Smaller decreases were observed for the 30 mm specimen tested on Side 2 (ΔADI = −0.01), the 40 mm specimen tested on Side 2 (ΔADI = −0.01), and the 50 mm specimen tested on Side 1 (ΔADI = 0.00).
Overall, the results indicate that the measured acoustic performance evolved differently across the tested configurations. However, the magnitude and direction of the changes should be interpreted in the context of the limited temporal dataset and the use of a single specimen per configuration. In particular, small observed changes should not automatically be interpreted as evidence of negligible degradation, while larger decreases do not establish a systematic degradation mechanism. The findings therefore characterize the changes observed during the monitoring period but do not support definitive conclusions regarding long-term acoustic durability or service life.
As shown in Table 4, temporal slope estimates for each material configuration were obtained through least-squares linear regression using the data from the four measurement campaigns that were conducted. The 95% confidence intervals indicate the uncertainty associated with the slope estimate obtained from the regression procedure. Considering the small amount of data obtained from only one physical specimen per configuration, the estimates should be viewed as an initial description of the temporal behavior of the specimens examined. The confidence intervals do not take into consideration any variability between specimens or other possible uncertainties in the experiment. Therefore, the slope estimates should not be viewed as conclusive proof of stability or instability of the materials.
4. Limitations of the Study and Future Research
Several limitations should be considered when interpreting the results of this study. The experimental study involved three physical samples, each corresponding to different thicknesses (30 mm, 40 mm, and 50 mm). Tests were performed on both sides of the sample; thus, six combinations of thickness and surface were obtained. The surfaces of each sample were not independent samples; thus, the findings should be regarded as measurements of three physical samples. Though multiple acoustic measurements were conducted, it is important to point out that they are technical replicates instead of independent replicates of an experiment. In this way, the experimental setup does not make it possible to distinguish the variability between samples from the influence of thickness, surface orientation, and time evolution. The differences should thus be considered as the particularities of the given configuration, but not as the general behavior of the material. In order to investigate material variability, multiple independently prepared samples for every thickness and surface orientation should be included in the future experiments.
Yet another constraint pertains to the temporal resolution of the experimental dataset. The acoustic properties were measured in four measurement campaigns within an observation time of about 2.4 years. Since the Acoustic Durability Index (ADI) is normalized to the initial campaign, ADI(0) = 1 is not an independent measure of degradation but a reference value. Therefore, only three further measures are at hand to describe the temporal behavior of each configuration. Linear slopes and their 95% confidence intervals give a descriptive insight into the direction and magnitude of the temporal changes. However, all reported confidence intervals contain zero and the relatively small number of measurements constrains the precision of slope estimates considerably. These findings do not imply the lack of degradation and long-term material stability. Furthermore, the confidence intervals are conditional on the underlying regression model assumptions and do not take into account experimental variance.
As such, the comparison of the two models should be regarded as exploratory and not as an effort to confirm one of the models. A better fit to the observed ADIs does not in any way suggests that one is more realistic in capturing the underlying physical phenomena or that one is more predictive outside the range of observations. In this case, the predictions made using the two models are highly dependent on the parameters estimated and the choice of the function. The two models have been used to test various ways of describing the observed temporal trends and not to create a framework for predicting service life. No service life or retention period can be inferred from this study.
The analysis of changes with time is additionally limited by the measuring protocol. Technical replicates in the form of repeated acoustic measurements per campaign were not considered while estimating the number of independent observations with time. The repeatability of remounting specimens was not quantified; furthermore, there was no reference measurement performed during every campaign to estimate instrument drift. As a consequence, the contribution of variability caused by remounting and instrumental changes from one campaign to another was not evaluated. Thus, the minimal measurable change in the sound absorption coefficient or ADI was not determined. Small deviations, including ADI larger than unity, have to be analyzed with care since they cannot automatically be linked to an improvement or worsening of specimens’ properties. In the same way, differences in thickness and surface orientation cannot be evaluated since there was only one specimen per each thickness.
Another factor restricting our research is the environmental conditions. The measurements were done in a laboratory, where the storage temperature was kept at the level of 22–25 °C. The relative humidity of the environment during the tests was not monitored. Thus, we cannot quantitatively estimate the possible influence of the environmental factors on the acoustic properties of the investigated materials. It must be noted that laboratory storage is far from reproducing the wide range of hygrothermal conditions experienced by bio-acoustic materials when used in building structures. So the data obtained in this work only reflect the acoustic behavior of the investigated samples in the considered storage conditions.
The physical processes which may cause such alterations in the absorption properties of the samples have not been examined in detail. It is possible that fluctuations in the moisture content, porosity, interconnectedness of pores, tortuosity, airflow resistivity, dimensions of the specimens, and/or surface layer characteristics might influence acoustic attenuation in porous media. But the above-listed processes could be viewed as mere hypotheses in connection with the present work, as no corresponding physical/mechanical investigations have been undertaken. Acoustic measurements alone can neither confirm alteration in any of those properties, nor ascertain the contribution of each property into the alteration of ADI curves. Future studies will require a combined approach with the acoustic measurements together with measurements of mass, moisture content, dimensions, bulk density, porosity, airflow resistivity, and microstructure of the specimens.
In summary, this work presents an experimental investigation of the temporal characteristics of the sound-absorbing properties of the considered bio-based samples and exploratory analysis of possible mathematical expressions of their ADI behavior. The results are sample-, protocol-, and laboratory-storage-specific. Further investigations involving observations on different time intervals, samples, and quality of measurements will be necessary to determine the reproducibility of the observed changes, evaluate the consistency of the obtained models, and investigate the physics of acoustic aging process. This will enable more informed evaluation of acoustic durability of such samples under application conditions.
5. Conclusions
This study aimed to characterize temporal variations in the acoustic performance of a bio-based sound absorber produced from sweet passion fruit agro-industrial waste, based on repeated measurements conducted over approximately 2.4 years. Contrary to the previous research dedicated mostly to the initial acoustic evaluation of sustainable sound absorbers, this paper is devoted to the problem of maintaining acoustic performance for a long period of time and includes experimental measurement, acoustic feature extraction, durability characteristics, and the predictive modeling of degradation processes.
The evolution of the sound absorption coefficient at normal incidence showed that the considered biomaterial retains high acoustic performance over the whole period of observations for 2.4 years. Variations in the SAC curves for measurements conducted in 2019, 2020, 2021, and 2022 were observed in terms of variations in frequency bands at which peak values occur. These variations were not limited only to the low-frequency range, and included shifts in frequencies. Nevertheless, since no particular test was conducted to identify statistical differences in absorption curves, the latter do not have statistical significance. Although the AUCs did not change drastically throughout the various measurement periods, changes in the frequency distributions around the frequencies at which maximum sound absorption was achieved have been seen. These results show that there have been changes in the sound absorption spectrum; however, the results obtained have not shown the physical basis of these changes or how they are independent of total absorption capacity.
Analysis of the acoustic properties of the material during the course of 2.4 years showed that the properties are dependent on the configuration of the sample. In four out of the six configurations, the changes in the SACmax were approximately 5%, whereas the changes in the remaining two configurations were approximately 9.4% and 10.6%. It was clear that the changes in the AUC value were not consistent with those of SACmax, indicating the significance of separating the peak absorption from the overall acoustic absorption in the studied range of frequencies. Some of the thicker configurations showed higher values of changes in the acoustic indicators, but considering the small number of samples and the lack of independent samples for each thickness, it cannot be concluded whether this is due to thickness or any other reason. Finally, the NRC and SAA provided complementary indicators of broadband sound absorption performance, revealing configuration-dependent variations over the monitoring period rather than demonstrating uniform retention of acoustic properties.
One of the main results of this study concerns the use of the Acoustic Durability Index (ADI) in the evaluation of the retention of sound absorption capacity in aging. Although empirical reductions in ADI were observed for five configurations (up to −4%), no statistically significant decreasing trend could be established due to the limited number of measurement campaigns.
The study provides an input to the quantitative analysis of the temporal variation in acoustic performance through the use of the Acoustic Durability Index (ADI) for the measurement of the acoustic absorption characteristics. This approach allows for the comparison of the performance variations from one measurement campaign to another. Nonetheless, the results should be taken only as exploratory owing to the few measurement campaigns used and lack of replica specimens. More research is required to ascertain the reproducibility of the trends observed.
Further research should focus on extending the duration of observations, examining the impact of environmental factors such as temperature and relative humidity, as well as generalizing the approach to other types of bio-based materials and designs. It is also necessary to explore the sensitivity of the model trajectories to parameter constraints and model calibrations. Upon the successful validation based on the experimental data, this approach may lead to the improvement of acoustic durability assessment procedures.
Author Contributions
Conceptualization, V.P.-R. and G.C.; methodology, V.P.-R. and G.C.; software, V.P.-R. and G.C.; validation, G.C.; formal analysis, G.C.; investigation, V.P.-R. and G.C.; resources, V.P.-R. and G.C.; data curation, V.P.-R.; writing—original draft preparation, G.C.; writing—review and editing, V.P.-R. and G.C.; visualization, G.C.; supervision, V.P.-R. and G.C.; project administration, V.P.-R.; funding acquisition, V.P.-R. All authors have read and agreed to the published version of the manuscript.
Funding
This research was funded by the Universidad de Las Américas (UDLA) and was developed under the research project with reference 558.A.XVI.25.
Data Availability Statement
The data presented in this study are available from the corresponding author upon reasonable request, as they are part of an ongoing study. Requests for access should be directed to the corresponding authors and will be granted only with authorization from Universidad de Las Américas.
Conflicts of Interest
The authors declare no conflicts of interest.
References
- Madurwar, M.V.; Ralegaonkar, R.V.; Mandavgane, S.A. Application of agro-waste for sustainable construction materials: A review. Constr. Build. Mater. 2013, 38, 872–878. [Google Scholar] [CrossRef] [Scilit]
- Maraveas, C. Production of sustainable construction materials using agro-wastes. Materials 2020, 13, 262. [Google Scholar] [CrossRef] [Scilit]
- Provis, J.L.; Duxson, P.; van Deventer, J.S. The role of particle technology in developing sustainable construction materials. Adv. Powder Technol. 2010, 21, 2–7. [Google Scholar] [CrossRef] [Scilit]
- Bravo-Moncayo, L.; Argotti-Gómez, M.; Jara, O.; Puyana-Romero, V.; Ciaburro, G.; Guerrero, V.H. Thermo-acoustic properties of four natural fibers, Musa textilis, Furcraea andina, Cocos nucifera, and Schoenoplectus californicus, for building applications. Buildings 2024, 14, 2265. [Google Scholar] [CrossRef] [Scilit]
- Berardi, U.; Iannace, G. Acoustic characterization of natural fibers for sound absorption applications. Build. Environ. 2015, 94, 840–852. [Google Scholar] [CrossRef] [Scilit]
- Puyana-Romero, V.; Jaramillo Cevallos, W.A.; Ciaburro, G. Simulation of acoustic properties of plaster matrix composite material reinforced with corn stem fibers. Fibers 2023, 11, 26. [Google Scholar] [CrossRef] [Scilit]
- Ciaburro, G.; Puyana-Romero, V.; Iannace, G.; Jaramillo-Cevallos, W.A. Characterization and modeling of corn stalk fibers tied with clay using support vector regression algorithms. J. Nat. Fibers 2022, 19, 7141–7156. [Google Scholar] [CrossRef] [Scilit]
- Puyana-Romero, V.; Iannace, G.; Cajas-Camacho, L.G.; Garzón-Pico, C.; Ciaburro, G. Acoustic characterization and modeling of silicone-bonded cocoa crop waste using a model based on the gaussian support vector machine. Fibers 2022, 10, 25. [Google Scholar] [CrossRef] [Scilit]
- Ciaburro, G.; Puyana-Romero, V. Experimental study of an acoustic metamaterial combining ceramic fiber layers and honeycomb cores. J. Build. Eng. 2026, 120, 115368. [Google Scholar] [CrossRef] [Scilit]
- Ciaburro, G.; Puyana-Romero, V. Upcycled PVC-Based Metamaterials for Low-Frequency Sound Absorption: Experimental and Analytical Investigation of Honeycomb-Enhanced Architectures. Sustainability 2026, 18, 2342. [Google Scholar] [CrossRef] [Scilit]
- Nan, J.; Yu, L.; Du, M.; Meng, J.; Dong, Z.; Miao, M.; Zhi, C. Highly efficient underwater acoustic absorber designed by filled-microperforated plate-like structure: Aging and life prediction. Polym. Test. 2023, 128, 108229. [Google Scholar] [CrossRef] [Scilit]
- Wang, S.; Li, H.; Zou, S.; Liu, L.; Bai, C.; Zhang, G.; Fang, L. Experimental study on durability and acoustic absorption performance of biomass geopolymer-based insulation materials. Constr. Build. Mater. 2022, 361, 129575. [Google Scholar] [CrossRef] [Scilit]
- Ibrahim, N.; Jaafar, M.; Hassan, N.H.C.; Sanz, R.G. Acoustic enhancement and weathering durability of rice husk/PVC composites via microperforated design and nanocoating. J. Build. Eng. 2026, 119, 115253. [Google Scholar] [CrossRef] [Scilit]
- Yang, S.S.; Lee, J.W.; Kim, J.H.; Kang, Y.J. Effect of thermal aging on the transport and acoustic properties of partially reticulated polyurethane foams. J. Acoust. Soc. Am. 2022, 152, 2369–2381. [Google Scholar] [CrossRef] [Scilit]
- Vázquez, V.F.; Luong, J.; Bueno, M.; Terán, F.; Paje, S.E. Assessment of an action against environmental noise: Acoustic durability of a pavement surface with crumb rubber. Sci. Total Environ. 2016, 542, 223–230. [Google Scholar] [CrossRef] [Scilit]
- Vuye, C.; Bergiers, A.; Vanhooreweder, B. The acoustical durability of thin noise reducing asphalt layers. Coatings 2016, 6, 21. [Google Scholar] [CrossRef] [Scilit]
- Puyana-Romero, V.; Debut, A.; Vizuete, K.; Ciaburro, G. Exploring Passiflora ligularis Juss. Peel as a Natural Sound-Absorbing and Insulating Material. Sci. Rep. 2026, 16, 18208. [Google Scholar] [CrossRef] [Scilit]
- EN ISO 10534-2; Acoustics—Determination of Sound Absorption Coefficient and Impedance in Impedance Tubes—Part 2: Transfer-Function Method. ISO: Geneva, Switzerland, 2023.
- Zhang, J.; Shen, Y.; Jiang, B.; Li, Y. Sound absorption characterization of natural materials and sandwich structure composites. Aerospace 2018, 5, 75. [Google Scholar] [CrossRef] [Scilit]
- Chung, J.Y.; Blaser, D.A. Transfer function method of measuring in-duct acoustic properties. II. Experiment. J. Acoust. Soc. Am. 1980, 68, 914–921. [Google Scholar] [CrossRef] [Scilit]
- Ciaburro, G.; Iannace, G. Numerical simulation for the sound absorption properties of ceramic resonators. Fibers 2020, 8, 77. [Google Scholar] [CrossRef] [Scilit]
- Kalauni, K.; Pawar, S.J. A review on the taxonomy, factors associated with sound absorption and theoretical modeling of porous sound absorbing materials. J. Porous Mater. 2019, 26, 1795–1819. [Google Scholar] [CrossRef] [Scilit]
- Seddeq, H.S. Factors influencing acoustic performance of sound absorptive materials. Aust. J. Basic Appl. Sci. 2009, 3, 4610–4617. [Google Scholar]
- Arenas, J.P.; Crocker, M.J. Recent trends in porous sound-absorbing materials. Sound Vib. 2010, 44, 12–17. [Google Scholar]
- Del Rey, R.; Alba, J.; Arenas, J.P.; Sanchis, V.J. An empirical modelling of porous sound absorbing materials made of recycled foam. Appl. Acoust. 2012, 73, 604–609. [Google Scholar] [CrossRef] [Scilit]
- Arenas, J.P.; del Rey, R.; Alba, J.; Oltra, R. Sound-absorption properties of materials made of esparto grass fibers. Sustainability 2020, 12, 5533. [Google Scholar] [CrossRef] [Scilit]
- Tengku Izhar, T.N.; Deraman, L.M.; Ibrahim, W.N.; Lutpi, N.A. Investigation of noise reduction coefficient of organic material as indoor noise reduction panel. In Materials Science Forum; Trans Tech Publications Ltd.: Wollerau, Switzerland, 2015; Volume 803, pp. 317–324. [Google Scholar]
- Kang, C.W.; Choi, B.S.; Zhu, S.; Hashitsume, K.; Kolya, H. Innovative sound absorption technique: Step-shaped ceramic fiberboards with veneer attachment for walls. Int. J. Appl. Ceram. Technol. 2024, 21, 1286–1295. [Google Scholar] [CrossRef] [Scilit]
- Kolya, H.; Kang, C.W. Herbal waste as a renewable resource for sound absorption: An eco-conscious approach for wall panel. J. Build. Eng. 2024, 82, 108249. [Google Scholar] [CrossRef] [Scilit]
- Losa, M.; Leandri, P. A comprehensive model to predict acoustic absorption factor of porous mixes. Mater. Struct. 2012, 45, 923–940. [Google Scholar] [CrossRef] [Scilit]
- Taban, E.; Tajpoor, A.; Faridan, M.; Samaei, S.E.; Beheshti, M.H. Acoustic absorption characterization and prediction of natural coir fibers. Acoust. Aust. 2019, 47, 67–77. [Google Scholar] [CrossRef] [Scilit]
- Sinha, M.; Buckley, D.J. Acoustic properties of polymers. In Physical Properties of Polymers Handbook; Springer: New York, NY, USA, 2007; pp. 1021–1031. [Google Scholar]
- Galip, N.S.; Haron, Z.; Mohamed, R.N.; Darus, N.; Zamri, N.F.; Yahya, M.N.; Yahya, K.; Din, N.C.; Kassim, A.S.F.A.; Redzuan, I.H.; et al. Sound absorption properties of porous concrete layers for noise barrier. In Journal of Physics: Conference Series; IOP Publishing: Bristol, UK, 2024; Volume 2721, p. 012012. [Google Scholar]
- Marolf, A.; Neithalath, N.; Sell, E.; Wegner, K.; Weiss, J.; Olek, J. Influence of aggregate size and gradation on acoustic absorption of enhanced porosity concrete. ACI Mater. J.-Am. Concr. Inst. 2004, 101, 82–91. [Google Scholar] [CrossRef] [Scilit]
- Ciaburro, G.; Iannace, G. Membrane-type acoustic metamaterial using cork sheets and attached masses based on reused materials. Appl. Acoust. 2022, 189, 108605. [Google Scholar] [CrossRef] [Scilit]
- Hassanzadeh, S.; Hasani, H.; Zarrebini, M. Analysis and prediction of the noise reduction coefficient of lightly-needled Estabragh/polypropylene nonwovens using simplex lattice design. J. Text. Inst. 2014, 105, 256–263. [Google Scholar] [CrossRef] [Scilit]
- Davarpanah, A.; Hasani, H.; Soltani, P.; Ghane, M. Acoustic performance of sustainable lightweight panels made from recycled cotton yarn and carpet waste. Clean Technol. Environ. Policy 2026, 28, 1. [Google Scholar] [CrossRef] [Scilit]
- Sen, P.K. Estimates of the regression coefficient based on Kendall’s tau. J. Am. Stat. Assoc. 1968, 63, 1379–1389. [Google Scholar] [CrossRef]
- Dognini, C.; Basu, S.; Piana, E.; Gobbi, E. Variation of the acoustic characteristics of mycelium-based biomaterials with time. In Proceedings of the 29th International Congress on Sound and Vibration, Prague, Czech Republic, 9–13 July 2023; The International Institute of Acoustics and Vibration (IIAV): Auburn, AL, USA, 2023; ISSN 2329-3675. ISBN 9788011034238. [Google Scholar]
- Yang, S.S.; Kang, Y.J.; Lee, J.W.; Park, S.H. A Study on the Acoustic Durability of Sound-Absorbing Porous Materials. In Proceedings of the 29th International Congress on Sound and Vibration, Prague, Czech Republic, 9–13 July 2023. [Google Scholar]
- Stender, M.; Adams, C.; Wedler, M.; Grebel, A.; Hoffmann, N. Explainable machine learning determines effects on the sound absorption coefficient measured in the impedance tube. J. Acoust. Soc. Am. 2021, 149, 1932–1945. [Google Scholar] [CrossRef] [Scilit]
- Nowoświat, A.; Bochen, J.; Dulak, L.; Żuchowski, R. Study on sound absorption of road acoustic screens under simulated weathering. Arch. Acoust. 2018, 43, 323–337. [Google Scholar] [CrossRef] [Scilit]
- Alba, J.; del Rey, R.; Garcia-Peris, J. Durability of Recycled and Natural Fibrous Acoustic Materials Undergoing Long-Term Indoor Ageing. Case Stud. Constr. Mater. 2026, 25, e06339. [Google Scholar] [CrossRef] [Scilit]
- Nowoświat, A.; Bochen, J.; Dulak, L.; Żuchowski, R. Investigation studies involving sound absorbing parameters of roadside screen panels subjected to aging in simulated conditions. Appl. Acoust. 2016, 111, 8–15. [Google Scholar] [CrossRef] [Scilit]
- Lanoye, R.; Vermeir, G.; Lauriks, W.; Kruse, R.; Mellert, V. Measuring the free field acoustic impedance and absorption coefficient of sound absorbing materials with a combined particle velocity-pressure sensor. J. Acoust. Soc. Am. 2006, 119, 2826–2831. [Google Scholar] [CrossRef] [Scilit]
- Zheng, K.; Chao, Y.; Ming, W.; Jun, Y. Method for measuring the absorption coefficient of sound absorbing materials in situ. Acta Acust. 2022, 35, 162–168. [Google Scholar]
- Zhao, Y.; Xu, J.; Davy, J.L.; Liu, Z.; Fard, M. Prediction of random incidence sound absorption coefficients of porous materials. Appl. Acoust. 2022, 189, 108625. [Google Scholar] [CrossRef] [Scilit]
- Ren, S.J.; Ma, T.; Zhang, Y.N.; Deng, J.; Xiao, Y.; Zhai, X.W.; Zhang, Y.T.; Song, Z.Y.; Wang, C.P. Sound absorption characteristics of loose bituminous coal porous media with different metamorphic degrees. Fuel 2023, 332, 126091. [Google Scholar] [CrossRef] [Scilit]
- Iannace, G.; Ciaburro, G.; Guerriero, L.; Trematerra, A. Use of cork sheets for room acoustic correction. J. Green Build. 2020, 15, 45–55. [Google Scholar] [CrossRef] [Scilit]
- Cao, L.; Fu, Q.; Si, Y.; Ding, B.; Yu, J. Porous materials for sound absorption. Compos. Commun. 2018, 10, 25–35. [Google Scholar] [CrossRef] [Scilit]
- Tang, X.; Yan, X. Acoustic energy absorption properties of fibrous materials: A review. Compos. Part A Appl. Sci. Manuf. 2017, 101, 360–380. [Google Scholar] [CrossRef] [Scilit]
- Yang, M.; Sheng, P. Sound absorption structures: From porous media to acoustic metamaterials. Annu. Rev. Mater. Res. 2017, 47, 83–114. [Google Scholar] [CrossRef] [Scilit]
- Sgard, F.C.; Olny, X.; Atalla, N.; Castel, F. On the use of perforations to improve the sound absorption of porous materials. Appl. Acoust. 2005, 66, 625–651. [Google Scholar] [CrossRef] [Scilit]
- Rastegar, N.; Ershad-Langroudi, A.; Parsimehr, H.; Moradi, G. Sound-absorbing porous materials: A review on polyurethane-based foams. Iran. Polym. J. 2022, 31, 83–105. [Google Scholar] [CrossRef] [Scilit]
- Dunne, R.; Desai, D.; Sadiku, R. A review of the factors that influence sound absorption and the available empirical models for fibrous materials. Acoust. Aust. 2017, 45, 453–469. [Google Scholar] [CrossRef] [Scilit]
- Behar, A.; May, D.N. Durability of sound absorbing materials for highway noise barriers. J. Sound Vib. 1980, 71, 33–54. [Google Scholar] [CrossRef] [Scilit]
- Kou, C.; Jiang, J.; Fan, R.; Wang, D. Performance evaluation and long-term sound absorption of polyurethane porous elastic mixture for low-noise pavement. J. Adhes. Sci. Technol. 2026, 1–44. [Google Scholar] [CrossRef] [Scilit]
- Saha, K.; Sonawwanay, P.D.; Patel, V.; Solanki, M. A review on innovative measures for improving the sound absorption of acoustic materials for broader frequency ranges. Noise Vib. Worldw. 2026, 57, 151–183. [Google Scholar] [CrossRef] [Scilit]
- Lu, T.J.; Chen, F.; He, D. Sound absorption of cellular metals with semiopen cells. J. Acoust. Soc. Am. 2000, 108, 1697–1709. [Google Scholar] [CrossRef] [Scilit]
- Attenborough, K. Acoustical characteristics of porous materials. Phys. Rep. 1982, 82, 179–227. [Google Scholar] [CrossRef] [Scilit]
- Mamtaz, H.; Fouladi, M.H.; Al-Atabi, M.; Narayana Namasivayam, S. Acoustic absorption of natural fiber composites. J. Eng. 2016, 2016, 5836107. [Google Scholar] [CrossRef] [Scilit]
- Liang, M.; Wu, H.; Liu, J.; Shen, Y.; Wu, G. Improved sound absorption performance of synthetic fiber materials for industrial noise reduction: A review. J. Porous Mater. 2022, 29, 869–892. [Google Scholar] [CrossRef] [Scilit]
- He, X.; Zhang, H.; Qiu, L.; Mao, Z.; Shi, C. Hygrothermal performance of temperature-humidity controlling materials with different compositions. Energy Build. 2021, 236, 110792. [Google Scholar] [CrossRef] [Scilit]
- Azwa, Z.N.; Yousif, B.F.; Manalo, A.C.; Karunasena, W. A review on the degradability of polymeric composites based on natural fibres. Mater. Des. 2013, 47, 424–442. [Google Scholar] [CrossRef] [Scilit]
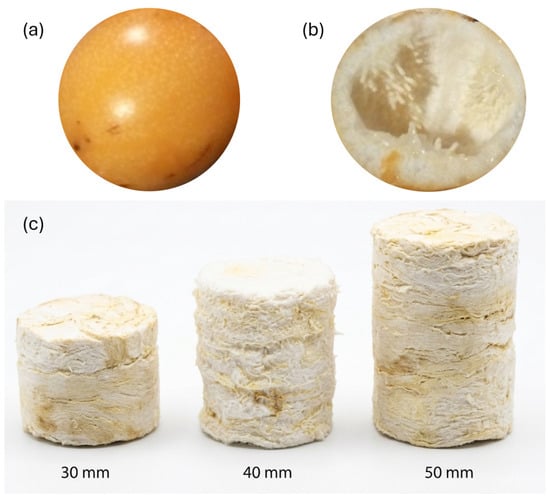
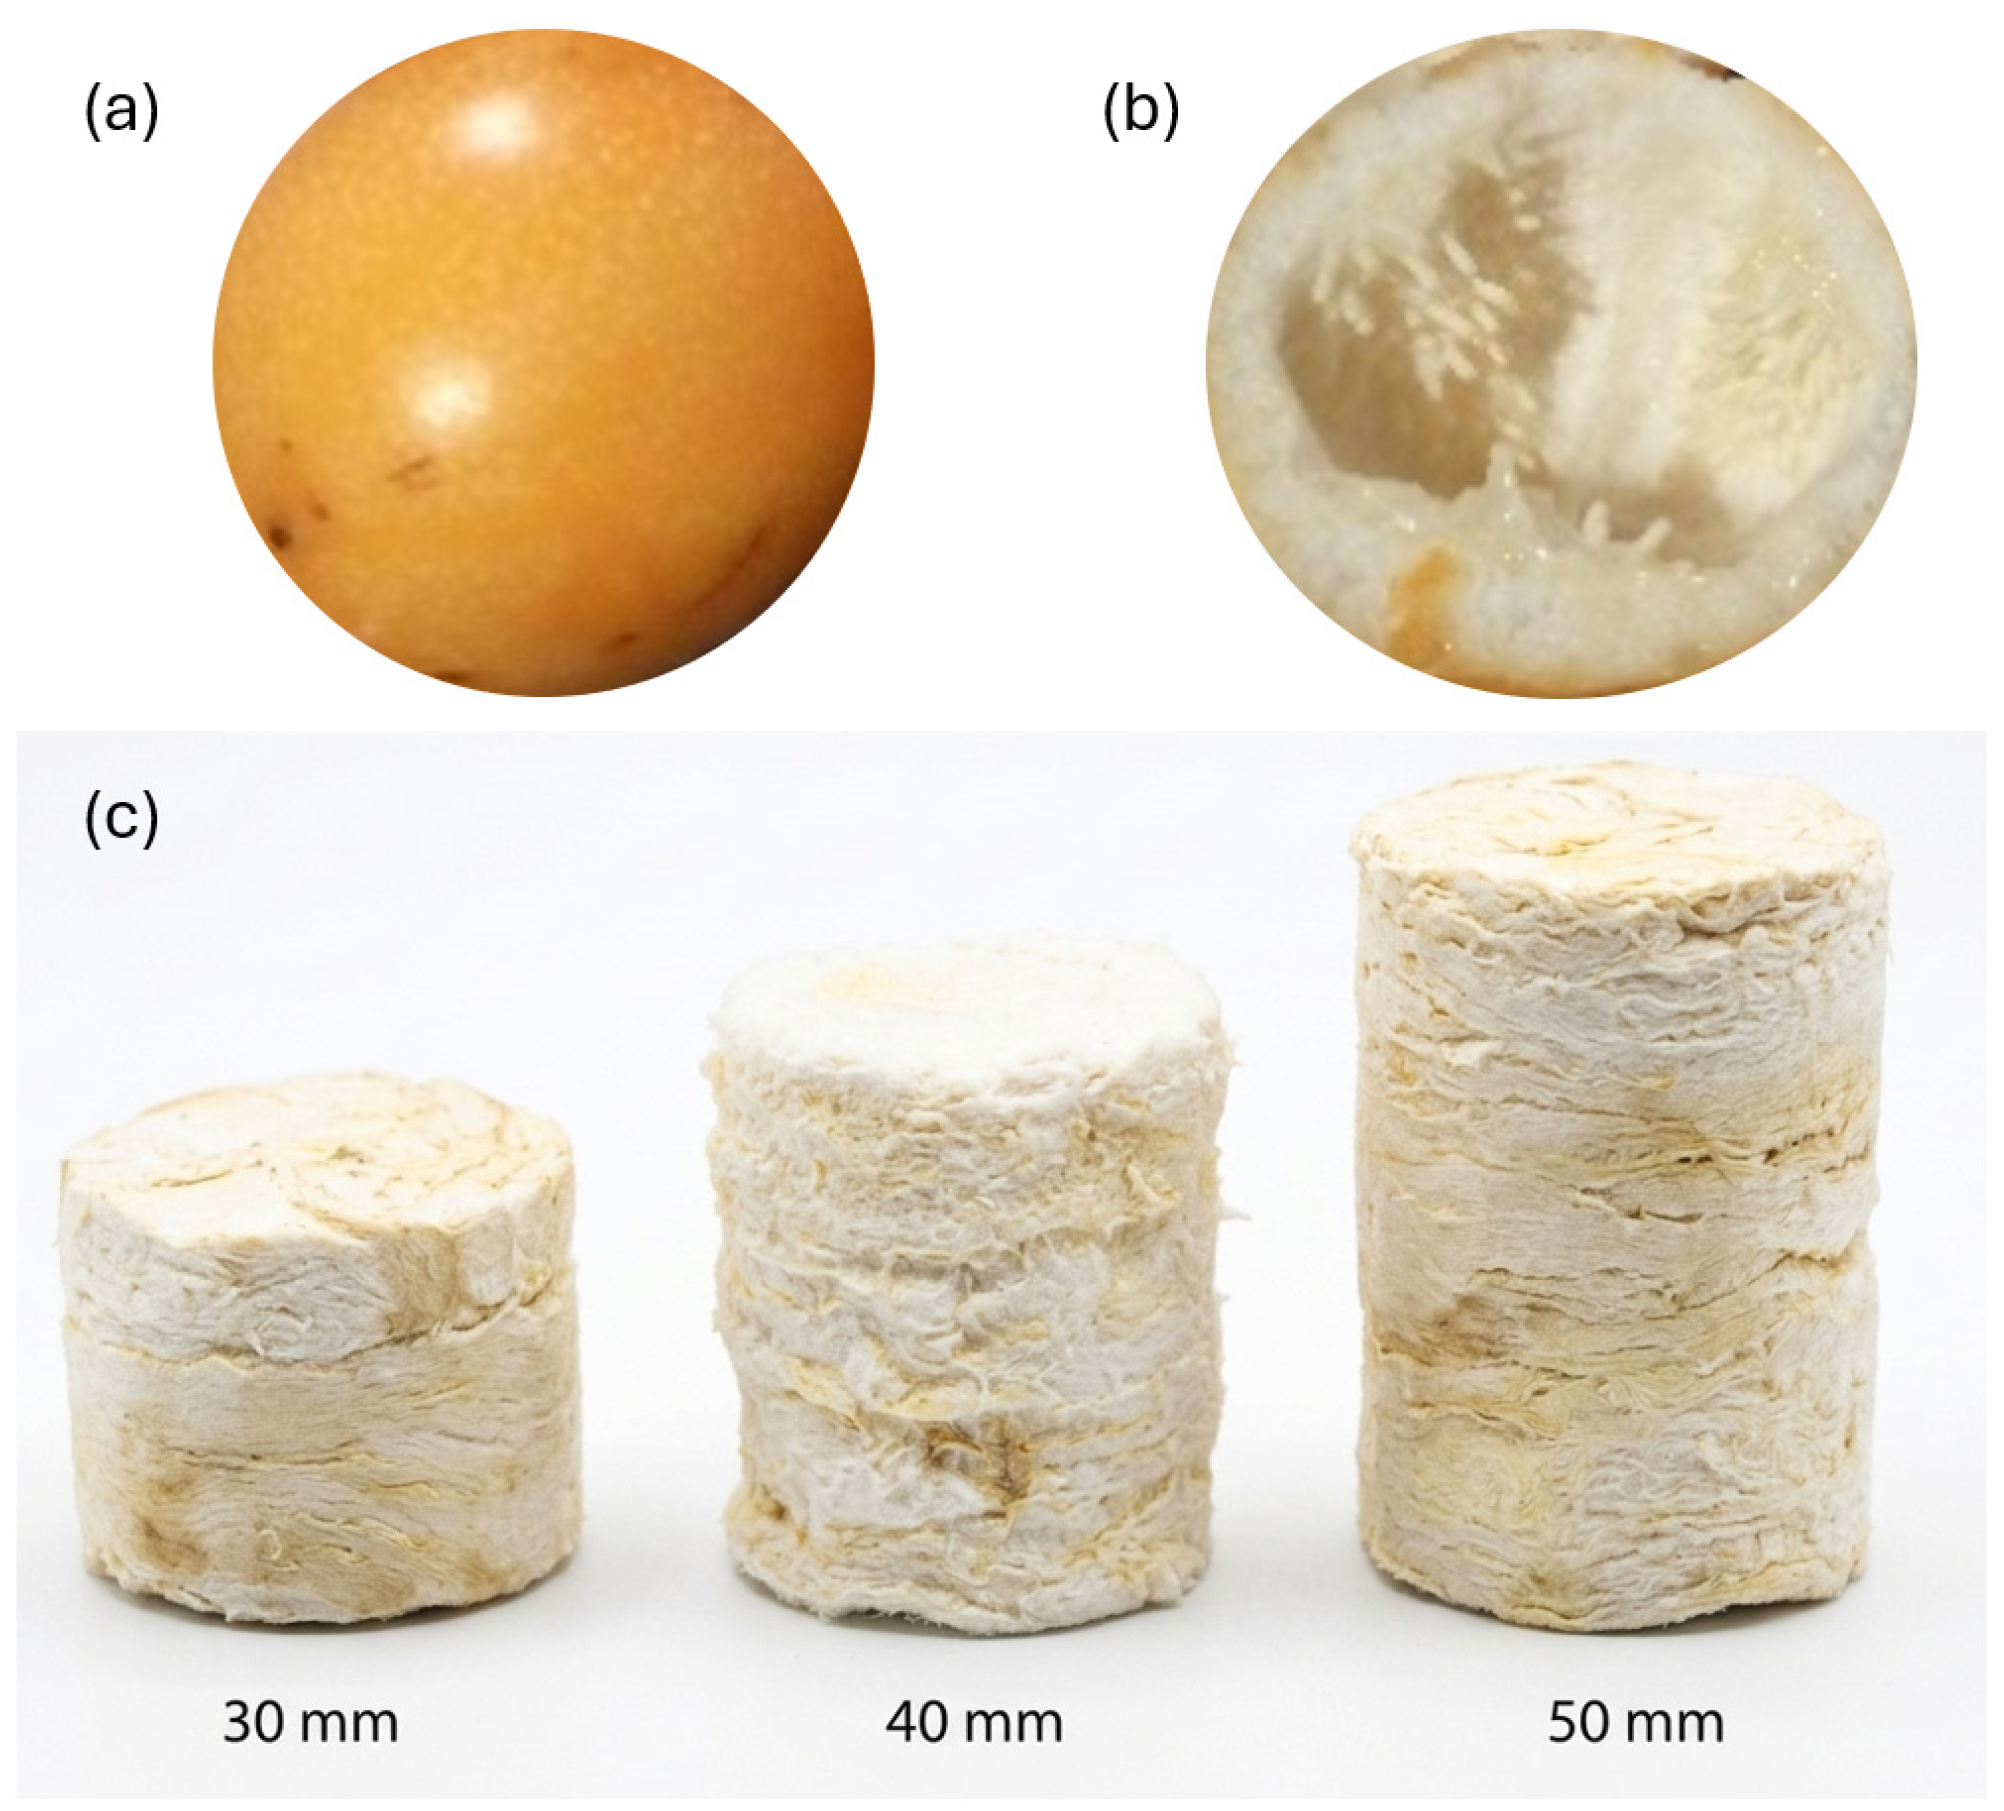
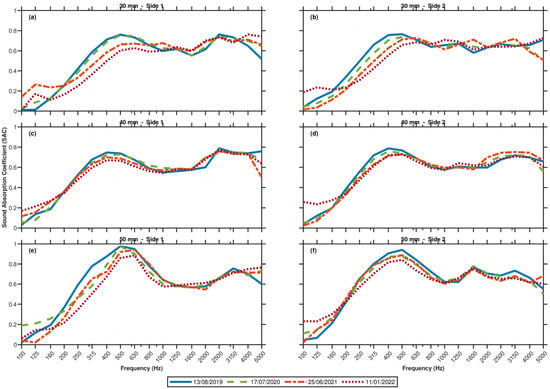
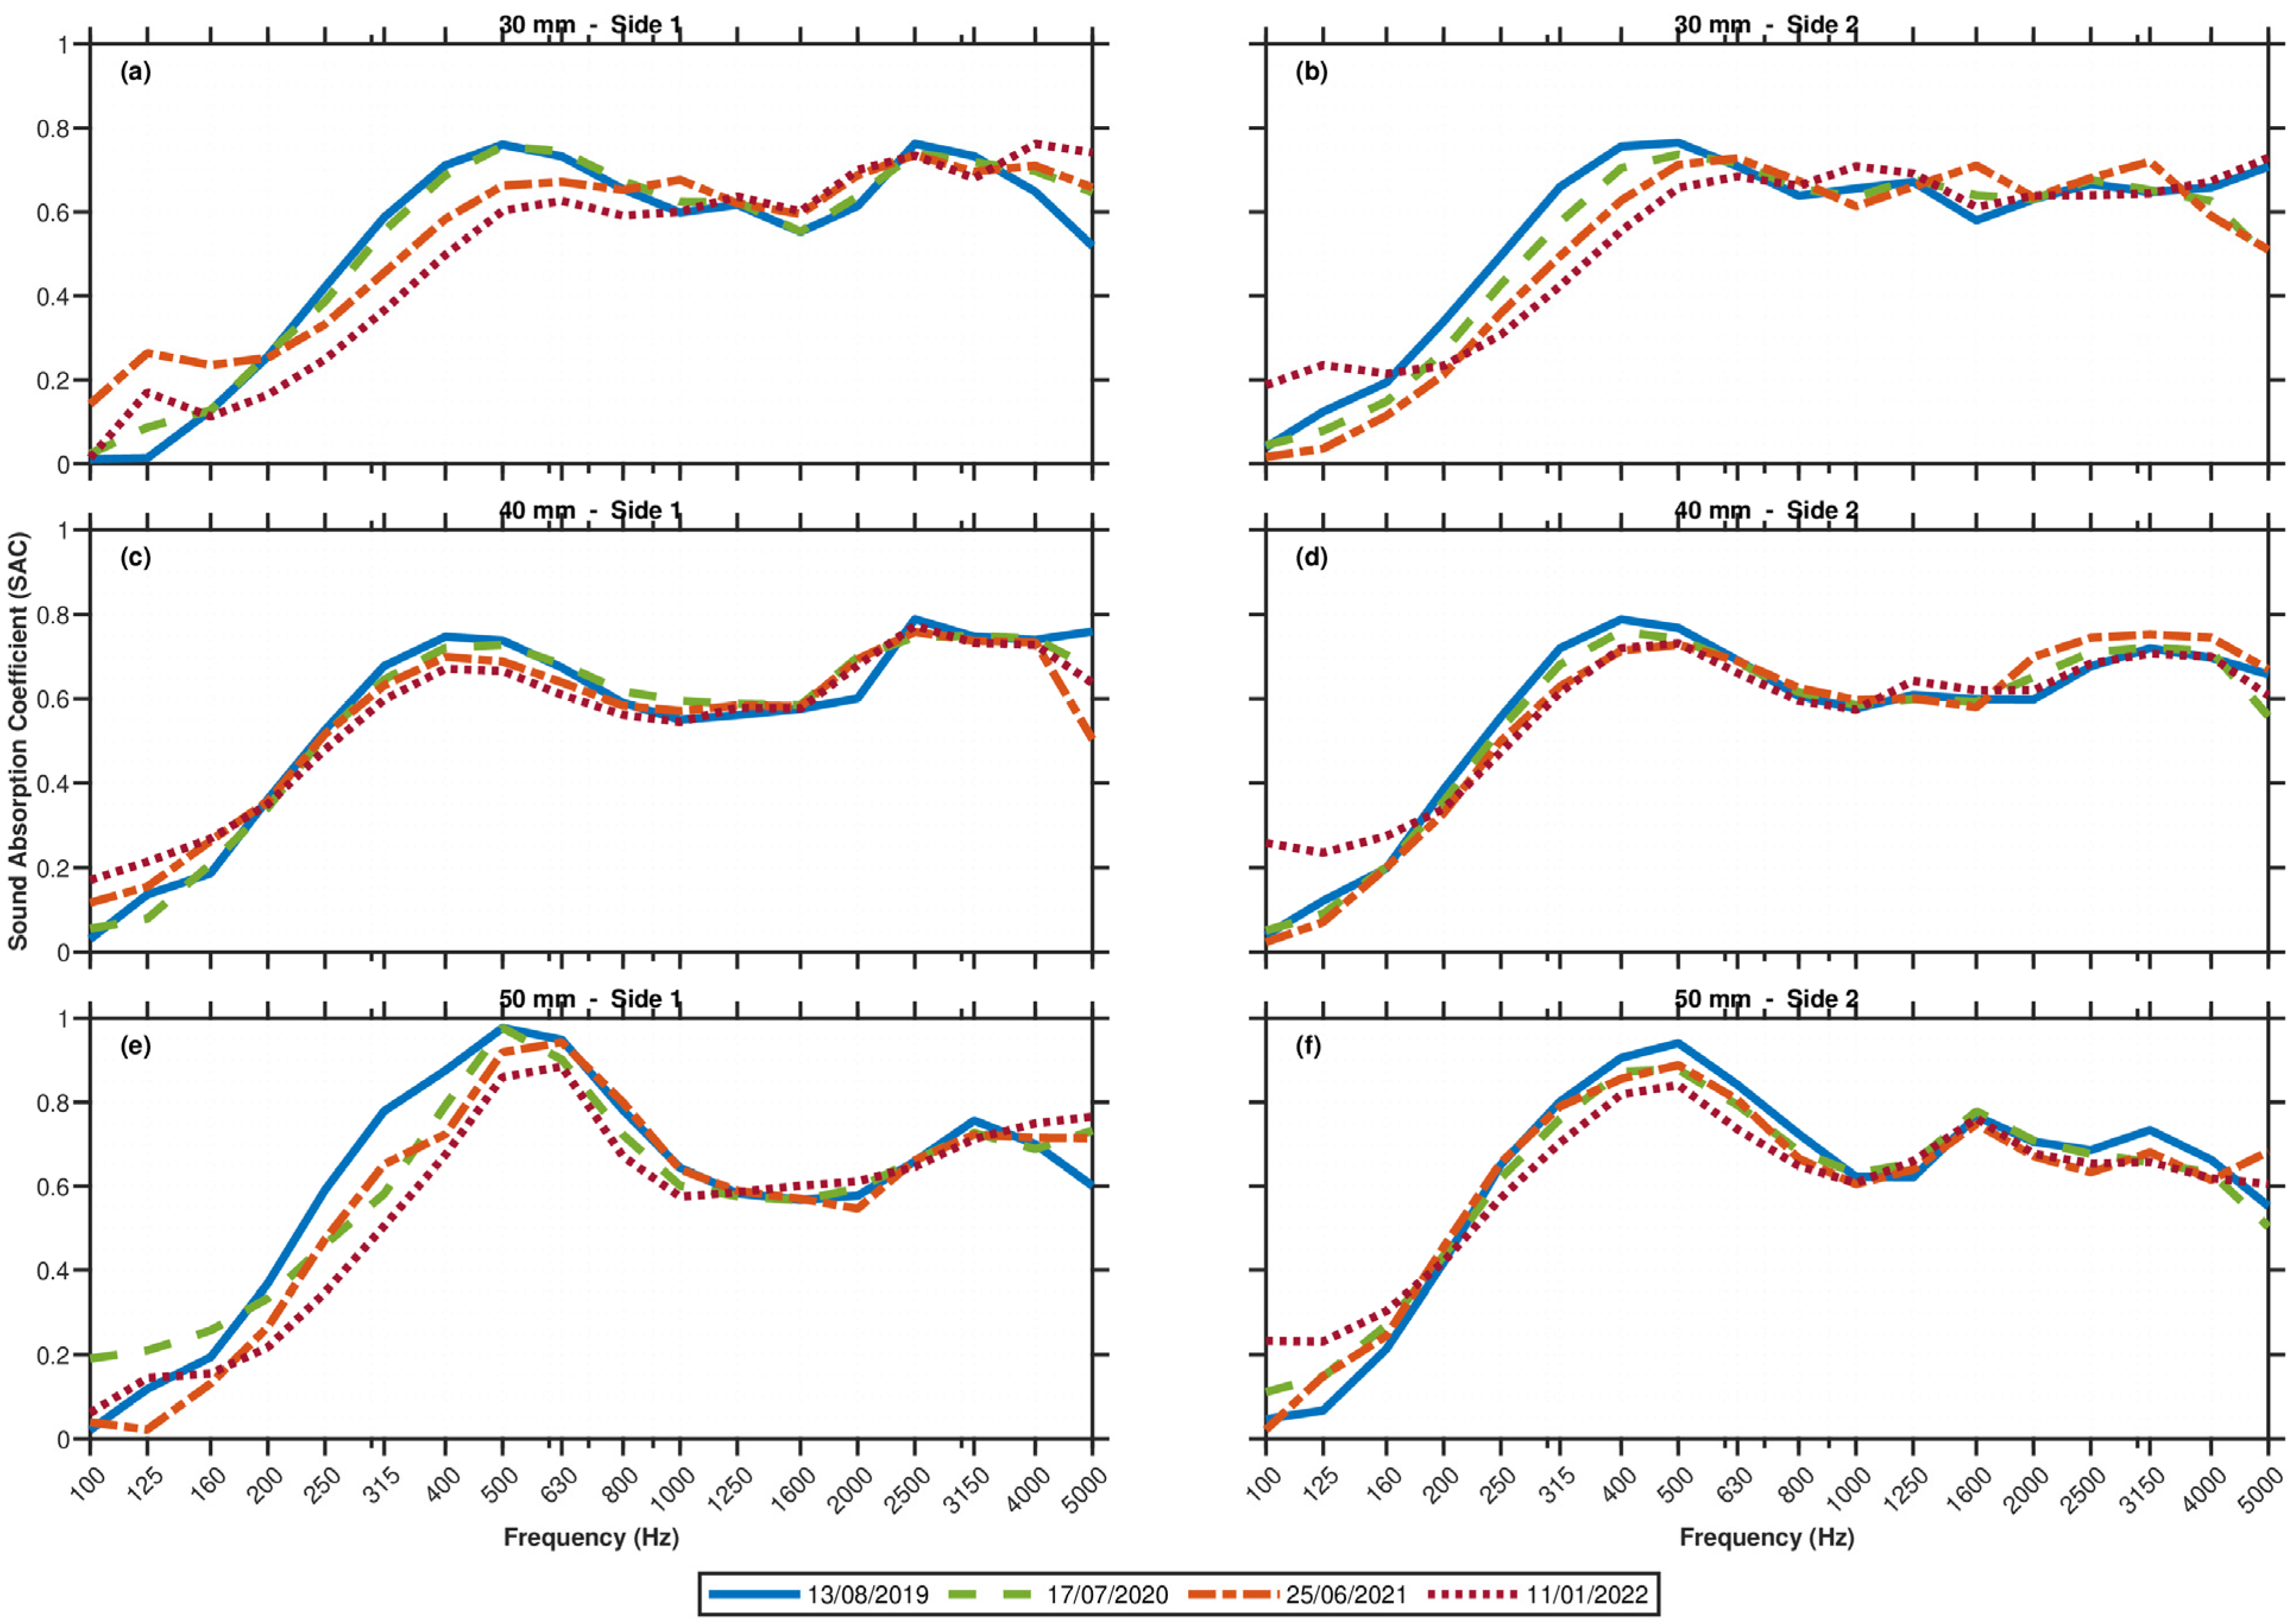
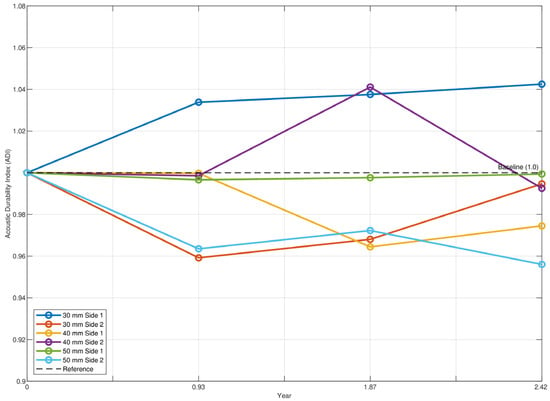
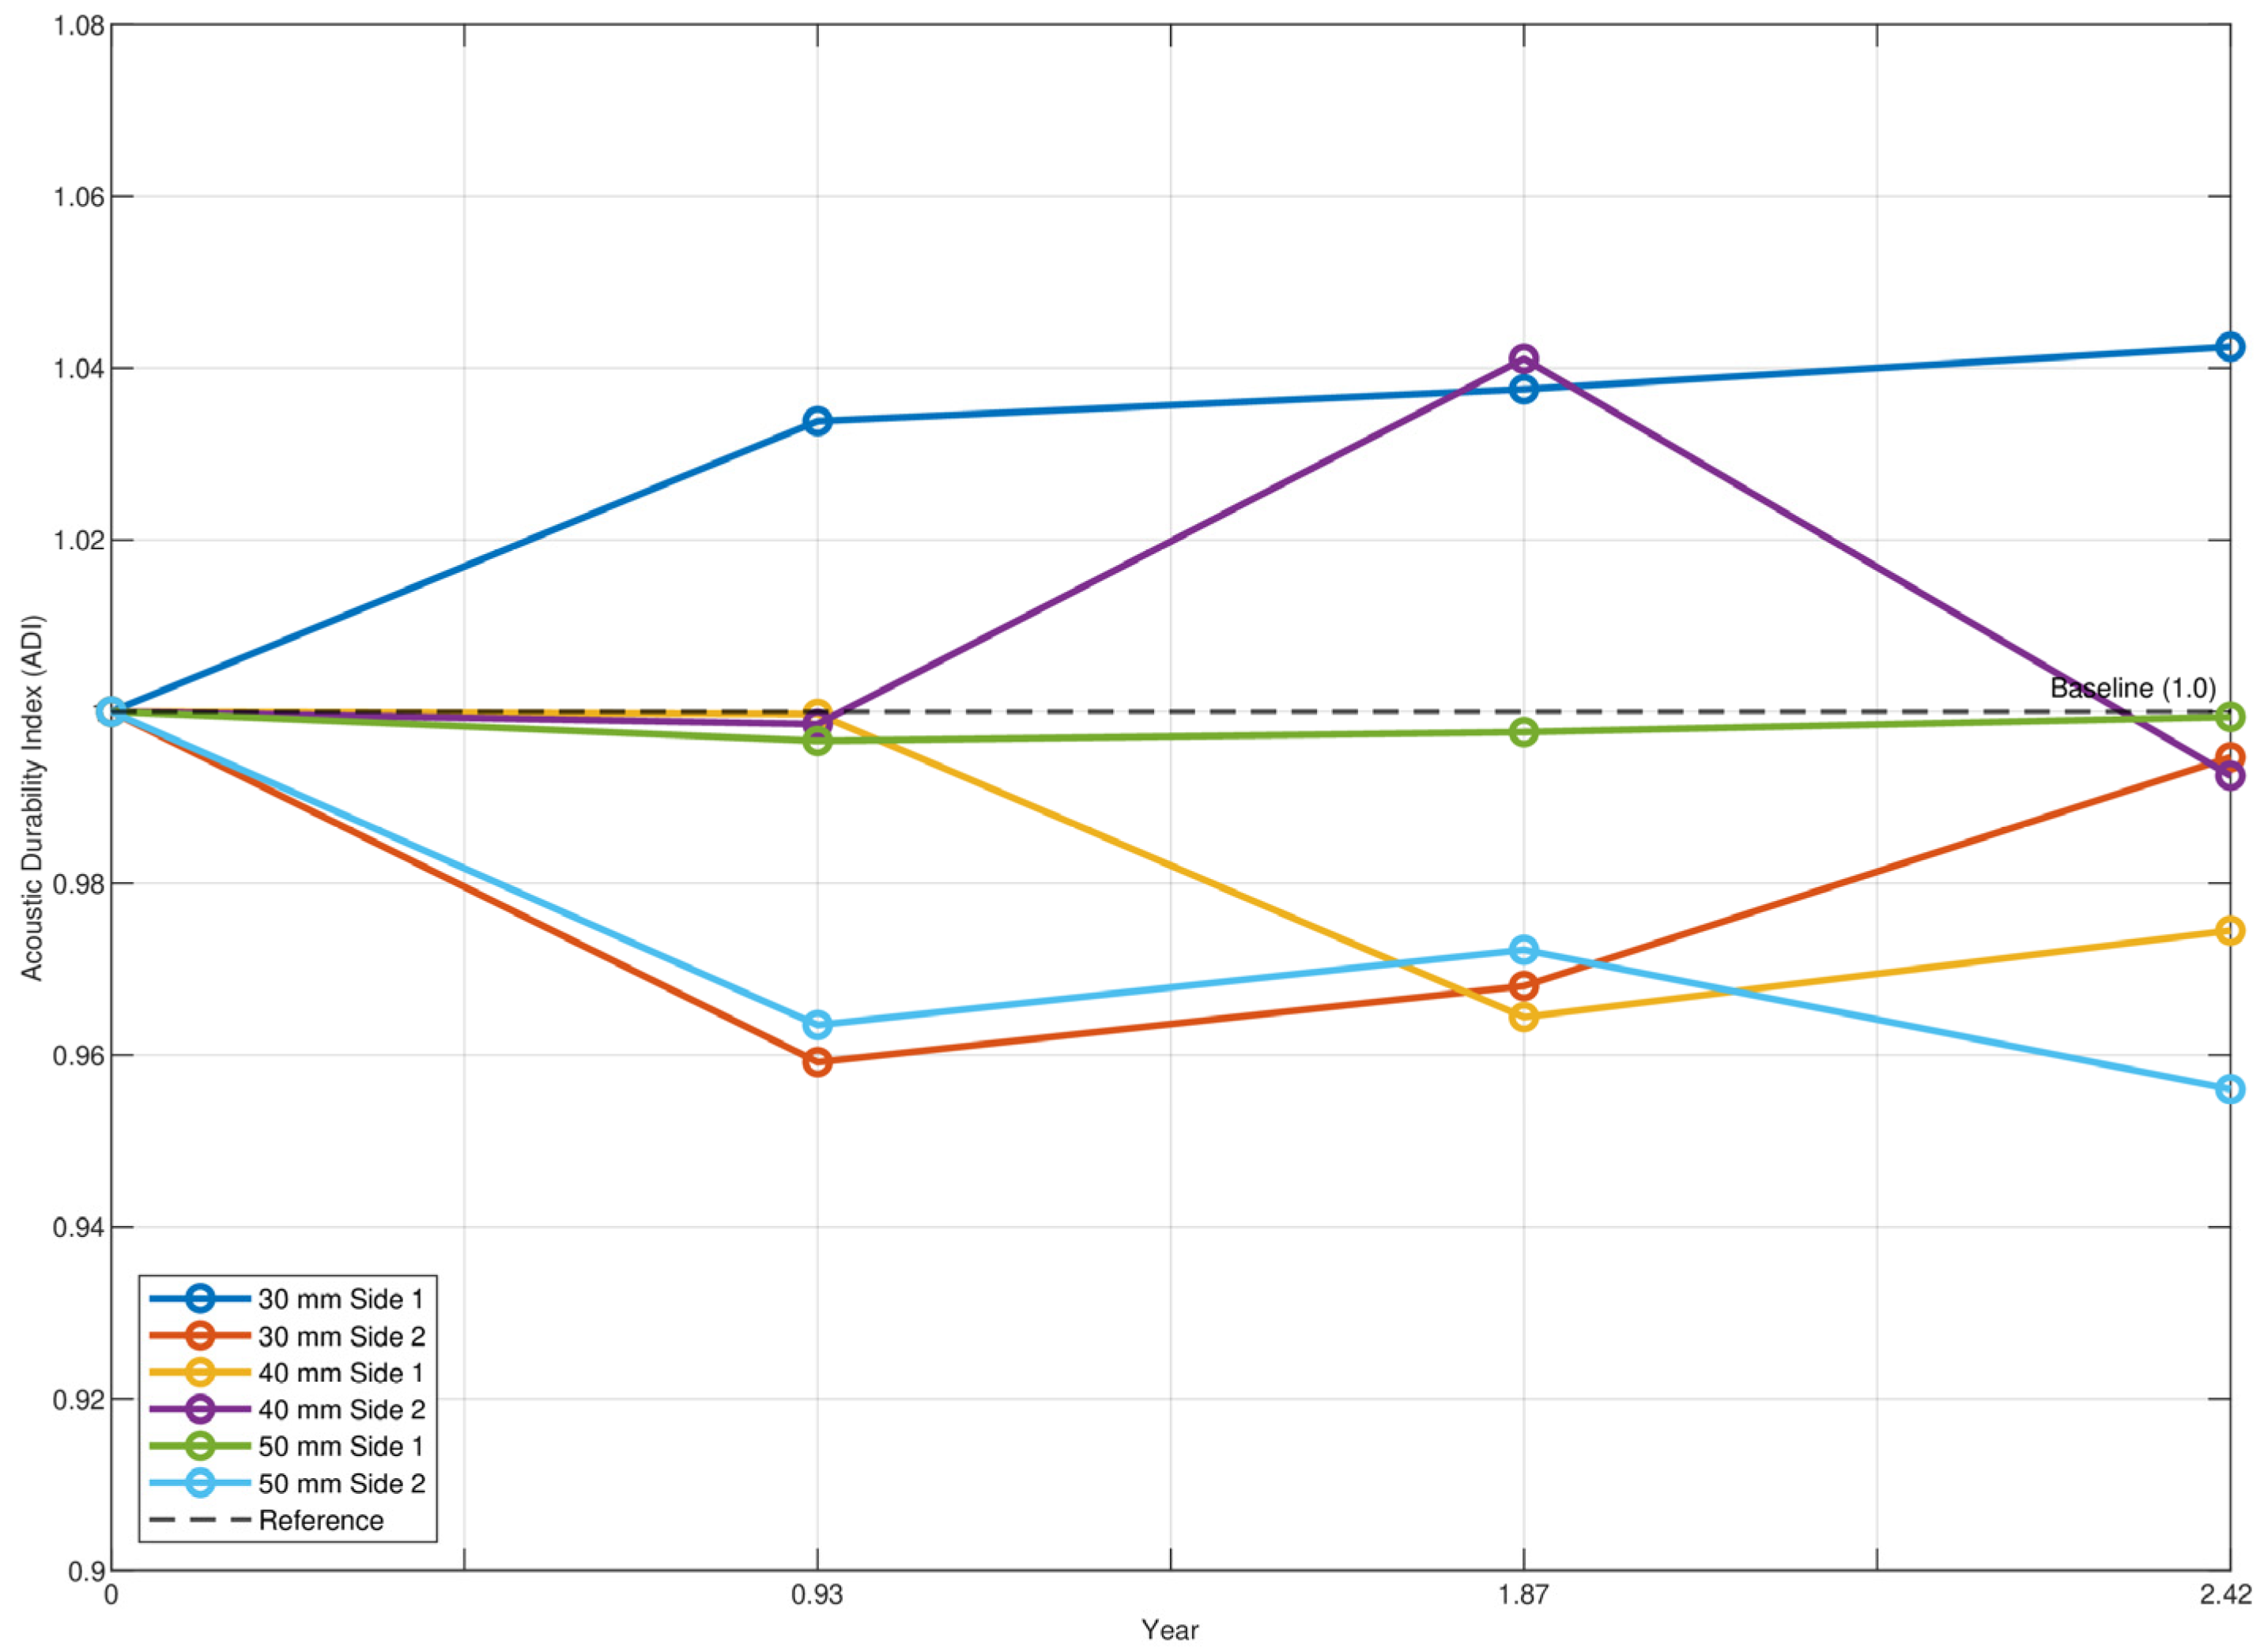

Disclaimer/Publisher’s Note: The statements, opinions and data contained in all publications are solely those of the individual author(s) and contributor(s) and not of MDPI and/or the editor(s). MDPI and/or the editor(s) disclaim responsibility for any injury to people or property resulting from any ideas, methods, instructions or products referred to in the content. |
© 2026 by the authors. Licensee MDPI, Basel, Switzerland. This article is an open access article distributed under the terms and conditions of the Creative Commons Attribution (CC BY) license.