


Abstract
As urban heat intensifies, street trees are used to moderate thermal conditions in built-up areas. Most previous studies have focused on pedestrian-level or horizontal cooling, leaving the vertical response of adjacent building facades less understood. We conducted 16 simulations of north–south and east–west street canyons. At a building height of 20 m, tree spacings of 13, 9, and 7 m were compared with tree-free references. Corresponding 9 m-spacing and tree-free cases extended the height comparison to 10 and 30 m. Facade temperature and wall–air heat exchange were evaluated from 08:00 to 18:00. For 20 m buildings with 9 m spacing, whole-facade cooling reached 0.89–1.05 °C and sensible heat release decreased by 7.97–16.16 W m−2. The 10–20 m wall bands above the canopy cooled by 0.77–1.22 °C. The south-facing 0–3 m wall in the east–west canyon nevertheless warmed by 0.67 °C. The heat-flux decomposition showed that a larger wall–air temperature difference increased heat release despite a smaller heat-transfer coefficient. Closer spacing strengthened whole-facade cooling, while lower-wall responses varied with building height and facade orientation. At fixed spacing, increasing building height enhanced cooling over the lower 10 m, most clearly in the east–west canyon.
1. Introduction
Climate change is increasing the frequency and intensity of extreme heat, placing growing thermal stress on urban populations and built environments [1]. Prolonged heat exposure increases heat-related health risks and has already contributed to substantial excess mortality in many regions [2]. Higher ambient temperatures also increase building cooling-energy use and peak electricity demand [3,4]. These combined health and energy pressures have made urban heat mitigation an important component of climate adaptation. Urban greening is widely used to moderate urban heat, and trees are particularly effective because their canopies reduce solar exposure while evapotranspiration cools the surrounding air [5,6,7]. Their cooling performance varies with canopy characteristics, planting configuration, meteorological conditions, and surrounding urban form [7,8]. These effects also extend to adjacent buildings, where trees can reduce solar gains and modify the microclimate around the envelope, with measurable effects on facade temperature and cooling demand [9,10,11,12].
Within urban street canyons, trees modify the thermal environment through several coupled processes. Their crowns reduce shortwave exposure and alter longwave exchange, while transpiration cools and humidifies the surrounding air [6,13]. At the same time, canopy drag changes mean airflow and turbulent exchange within the canyon [14]. The resulting thermal effect depends strongly on street geometry, because canyon aspect ratio influences solar access, heat storage, and ventilation [15,16,17]. Experimental and modelling studies have reported substantial differences in tree-induced cooling across crown sizes, planting densities, and street canyon geometries [18,19,20]. These interactions affect both pedestrian-level conditions and the thermal environment of adjacent building surfaces.
For buildings lining these streets, the facade is directly exposed to tree-induced changes in radiation and the surrounding microclimate. Field measurements have shown that tree shade can substantially reduce incident solar radiation and exterior wall temperature, with reductions of several degrees reported beneath mature canopies [21,22,23]. The magnitude and spatial extent of this cooling depend strongly on the relative geometry of trees and buildings. Tree–wall distance, crown dimensions, solar position, and facade orientation determine which parts of the wall are shaded and how long that shading persists [22,24,25]. Physical-scale experiments have also shown that tree location and arrangement can produce different thermal responses on opposing facades [26]. Numerical studies further indicate that foliage density and planting pattern influence facade solar gains and building cooling demand [10], while recent facade-scale modelling links tree–building heat exchange to tree height, canopy area, facade orientation, and building height [27].
Most studies of street-tree cooling have focused on near-ground air temperature, pedestrian thermal conditions, or the horizontal extent of cooling within the street canyon [5,7,8]. By comparison, the vertical response of adjacent building facades has received less attention. Scaled canyon experiments have reported cooling of lower walls together with warming in upper canyon regions under some combinations of tree configuration and canyon aspect ratio [18], while vertical wall temperature gradients also vary with canyon depth and sky conditions [16]. The extent of direct tree shade changes with crown geometry, solar position, and the relative height of trees and buildings [22,24,25]. It remains unclear how increasing tree-row density redistributes cooling along the facade and whether the same planting arrangement produces similar vertical responses between buildings of different heights. Because convective heat transfer varies with wall position and canyon geometry [28,29], local departures from the overall cooling pattern may also reflect tree-induced changes in near-wall temperature, airflow, and surface radiation [27,30].
The study represents an idealized urban secondary road with a 32 m road reserve and 4 m building setbacks on each side. Together, these give a facade separation of 40 m. A comparable street scale is reported for the Prague boulevard examined by Řezníček et al. [14]. Its approximately 40 m width and 20–30 m buildings correspond to H/W ratios of 0.50–0.75.
We used an urban microclimate modelling framework implemented in OpenFOAM 8 (The OpenFOAM Foundation, London, UK) to simulate idealized street canyons with two rows of street trees. Tree spacing effects were evaluated for 20 m-high buildings using spacings of 13, 9, and 7 m, while the 9 m spacing was retained to compare building heights of 10, 20, and 30 m. Both north–south and east–west canyons were considered under the same hot-summer meteorological conditions. The analysis focused on how tree-induced cooling varies with facade height and side, how denser tree rows reshape its vertical distribution, and how building height modifies the vertical response to the same planting configuration. Wall–air sensible heat exchange was examined to interpret local departures from the broader facade temperature pattern.
2. Materials and Methods
2.1. Street Canyon Geometry and Simulation Scenarios
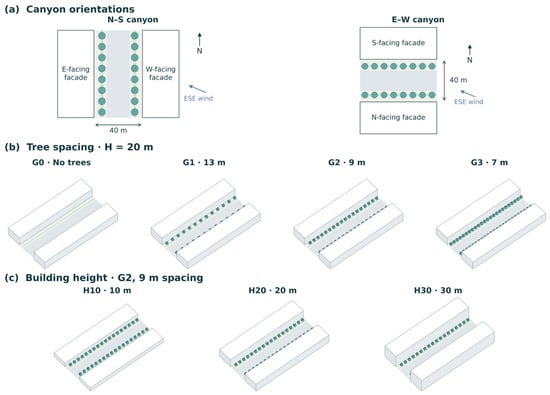
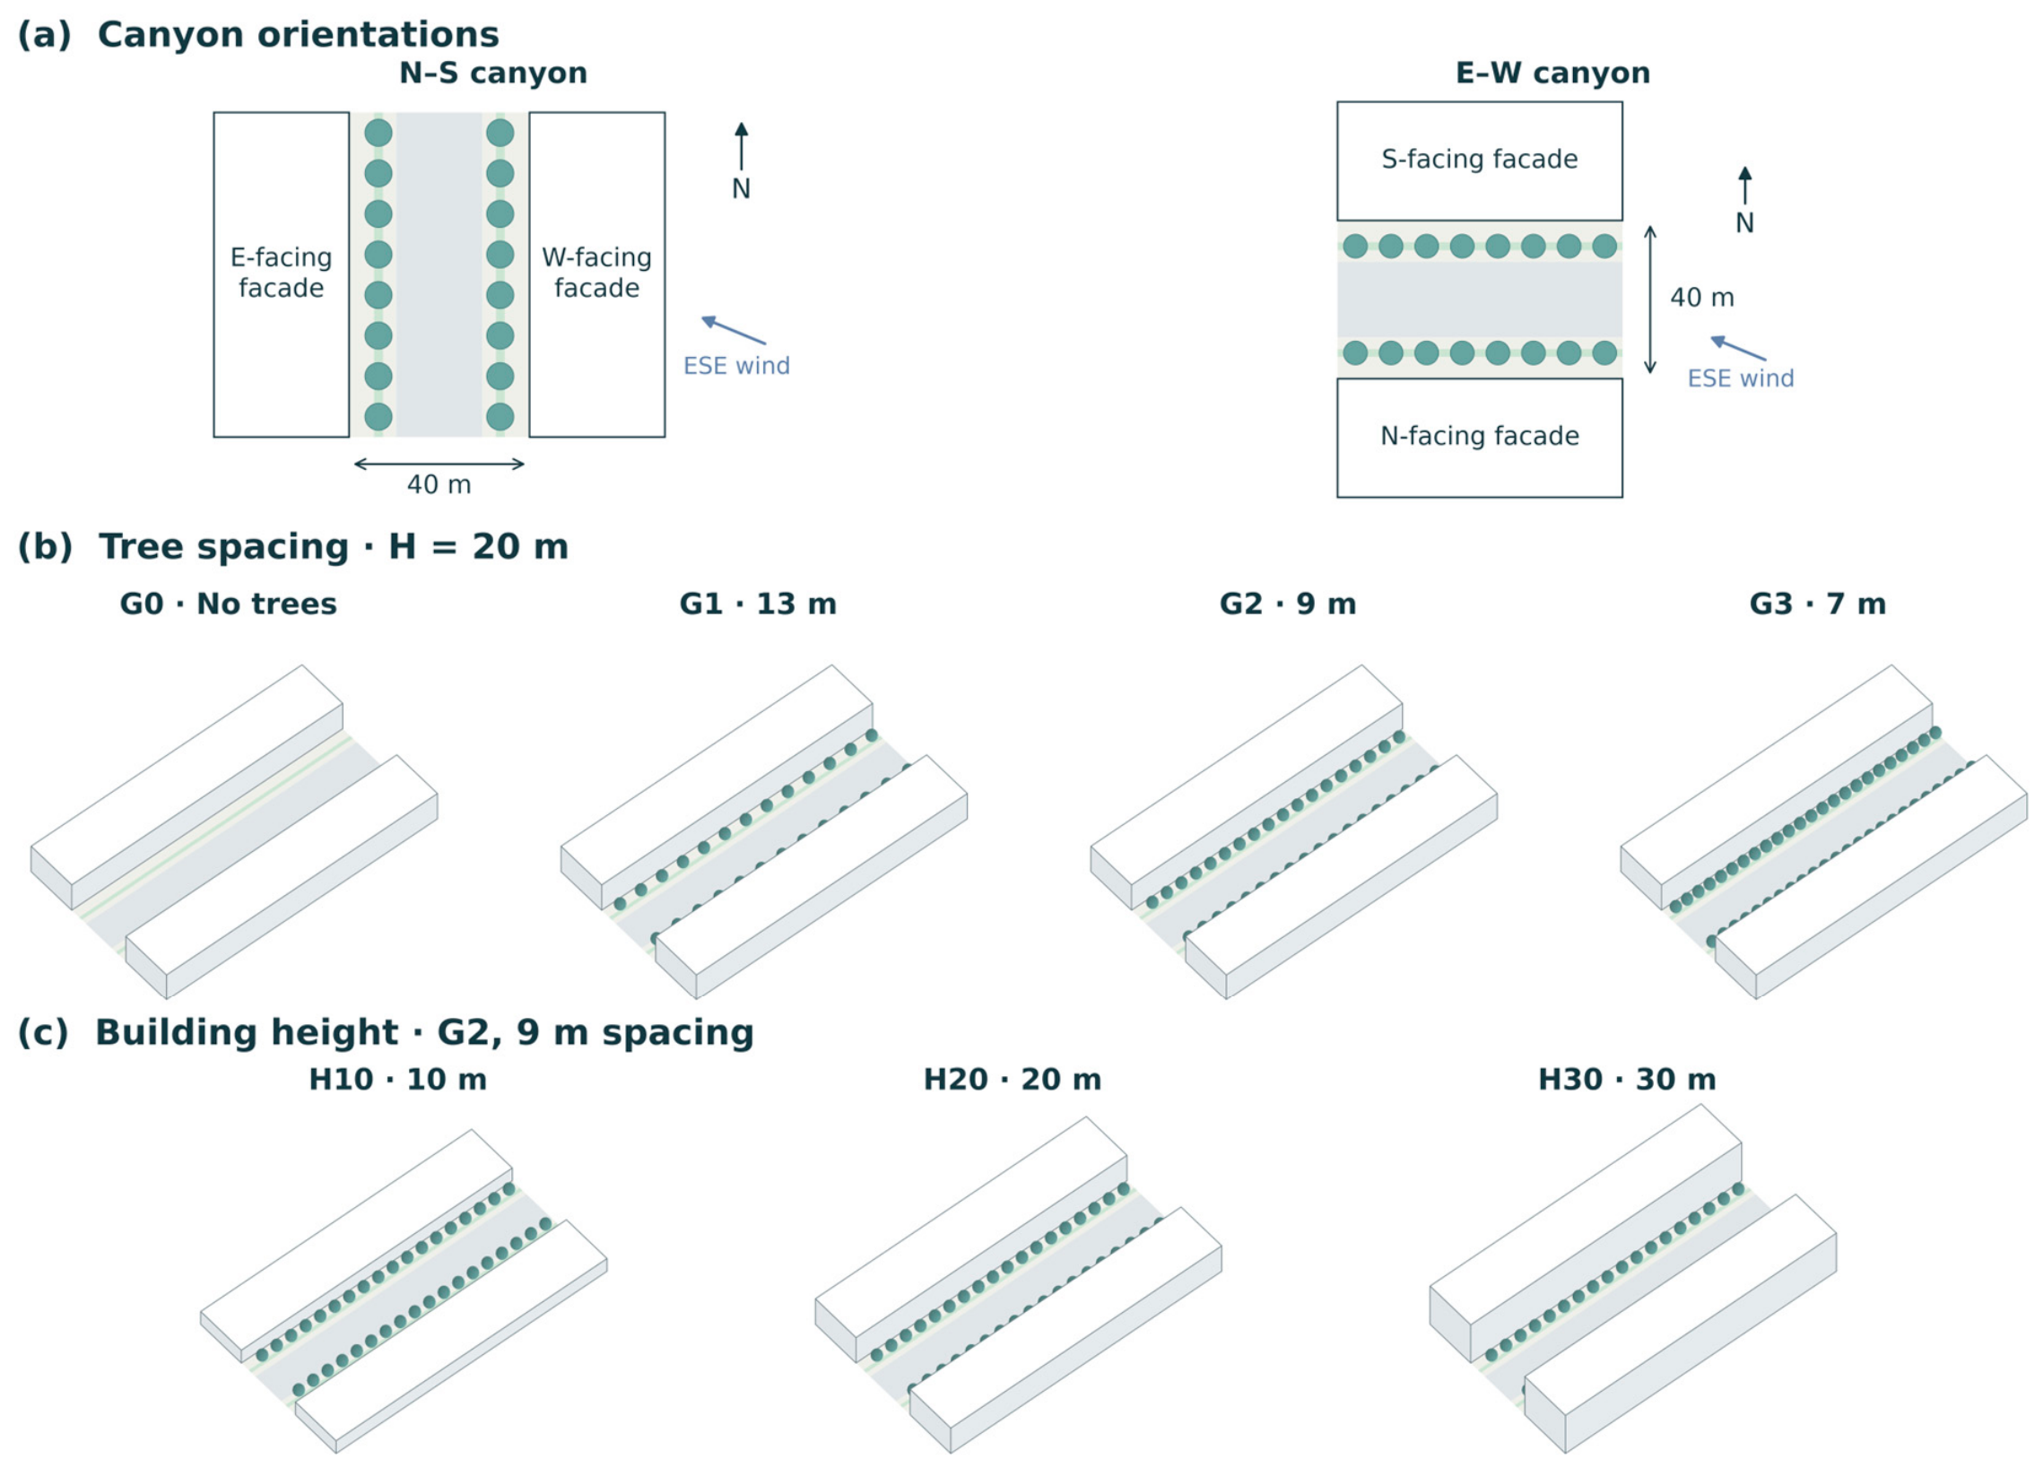
Two parallel buildings flanked a secondary road with a 32 m road reserve (red-line width). Each building was set back 4 m from the road boundary, giving a facade separation, W, of 40 m. Each building was 168 m long and 30 m deep, with heights of 10, 20, or 30 m, corresponding to H/W ratios of 0.25, 0.50, and 0.75. The same geometry was used for north–south (N–S) and east–west (E–W) canyons under identical meteorological forcing (Figure 1). Facades are referred to throughout by their outward-facing direction.
Figure 1.
Street canyon geometry and scenarios. (a) Central 72 m plan views of the N–S and E–W canyons; arrows indicate north, ESE inflow toward WNW, and the 40 m facade separation. (b) Axonometric views of G0–G3 at H20, with spacings of 13, 9, and 7 m for G1–G3. (c) H10, H20, and H30 at G2 spacing.
Two rows of street trees were arranged symmetrically along the canyon, with tree centers 6.5 m from the adjacent facades. The nominal crowns were 6 m in diameter and extended from 3 to 10 m above ground. Along-street spacings of 13, 9, and 7 m defined G1, G2, and G3, respectively, representing progressively denser tree rows. The tree-free reference (G0) retained the same grass strips and surface materials.
At H20, G1–G3 were compared with G0 to examine the effect of tree spacing. Building height effects were evaluated using G2 and the corresponding tree-free cases at H10, H20, and H30. The H10 case extended the comparison to a shallower canyon, with street width, tree size, and tree–wall distance held fixed. The canopy reached roof level at H10 and lay progressively lower relative to the roof at H20 and H30. Facade responses were compared within and above crown height over the central 72 m of the street to minimize the influence of the canyon ends.
2.2. Coupled Microclimate Model and Boundary Conditions
The simulations were performed using urbanMicroclimateFoam [31,32] in OpenFOAM 8, which couples airflow and atmospheric heat and moisture transport with transient heat transfer through buildings and ground surfaces. Turbulence was represented by the realizable k–ε model [33], with buoyancy effects included using the Boussinesq approximation. The thermal properties of the building wall, concrete, asphalt, and soil followed Zhu et al. [32]. The values used in the present simulations are summarized in Table 1 and were held constant across all scenarios.
Table 1.
Thermal and radiative properties of the solid materials.
Trees were represented as vegetated air cells using the simplifiedVegetation model [32]. Canopy drag was introduced as a momentum sink proportional to air density, leaf area density, the drag coefficient, and local wind speed multiplied by velocity. Leaf area density was set to 1 m2 m−3, a representative value for urban vegetation CFD studies [34]. The leaf drag coefficient was 0.2, as used in the vegetation model of Manickathan et al. [35]. Direct shortwave attenuation followed the Beer–Lambert law with an extinction coefficient of 0.78 [35]. The leaf energy balance used cellwise shortwave absorption and a canopy-volume-averaged longwave contribution.
The crowns represented generic, fully foliated street trees, with no species-specific calibration. Leaf area density was uniform within each crown and constant over the simulated day. Foliage properties and drag and extinction coefficients were held fixed across the spacing and building-height comparisons. Direct-beam transmission varied with the cumulative leaf area along each solar path through the crown.
Leaf temperature was obtained iteratively by balancing net radiation with sensible and latent heat exchange. Sensible heat exchange depended on the leaf–air temperature difference and aerodynamic resistance, which was calculated from local wind speed and a characteristic leaf length of 0.1 m. Transpiration depended on the difference between the saturated humidity ratio at leaf temperature and the surrounding-air humidity ratio, divided by the sum of aerodynamic and stomatal resistances. Stomatal resistance varied with radiation and vapor-pressure deficit, using a base resistance parameter of 150 s m−1. A single evaporating leaf side was assumed. The resulting sensible heat and water-vapor source terms entered the air energy and moisture equations and were updated during the fluid iterations.
Grass cover was retained in all scenarios, including the tree-free reference, using the same simpleGrass model and ground surface settings. Grass leaf temperature was also determined from an energy balance, and its heat and moisture exchange supplied source terms to the adjacent air cells. Direct and diffuse shortwave radiation were treated separately, and longwave exchange among urban surfaces was calculated using view factors.
Meteorological forcing followed the Nanjing hot-summer conditions adopted in Zhu et al. [32]. Thermal and solar inputs were based on the ASHRAE 0.4% summer design day for 21 July. Prevailing wind conditions were derived from July–September TMYx data. The reference wind speed was 2.6 m s−1 at 10 m from the east-southeast, with a logarithmic profile and a roughness length of 0.30 m. The geographic wind direction was fixed, giving acute angles of approximately 22.5° and 67.5° to the cross-street axes of the N–S and E–W canyons, respectively. The orientation comparison therefore combined changes in solar exposure and relative wind incidence.
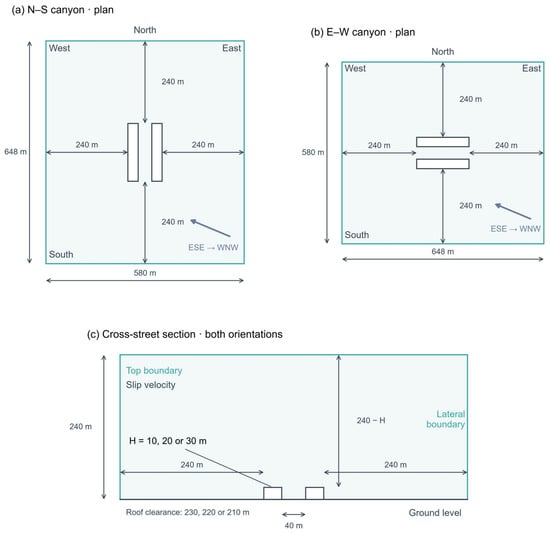
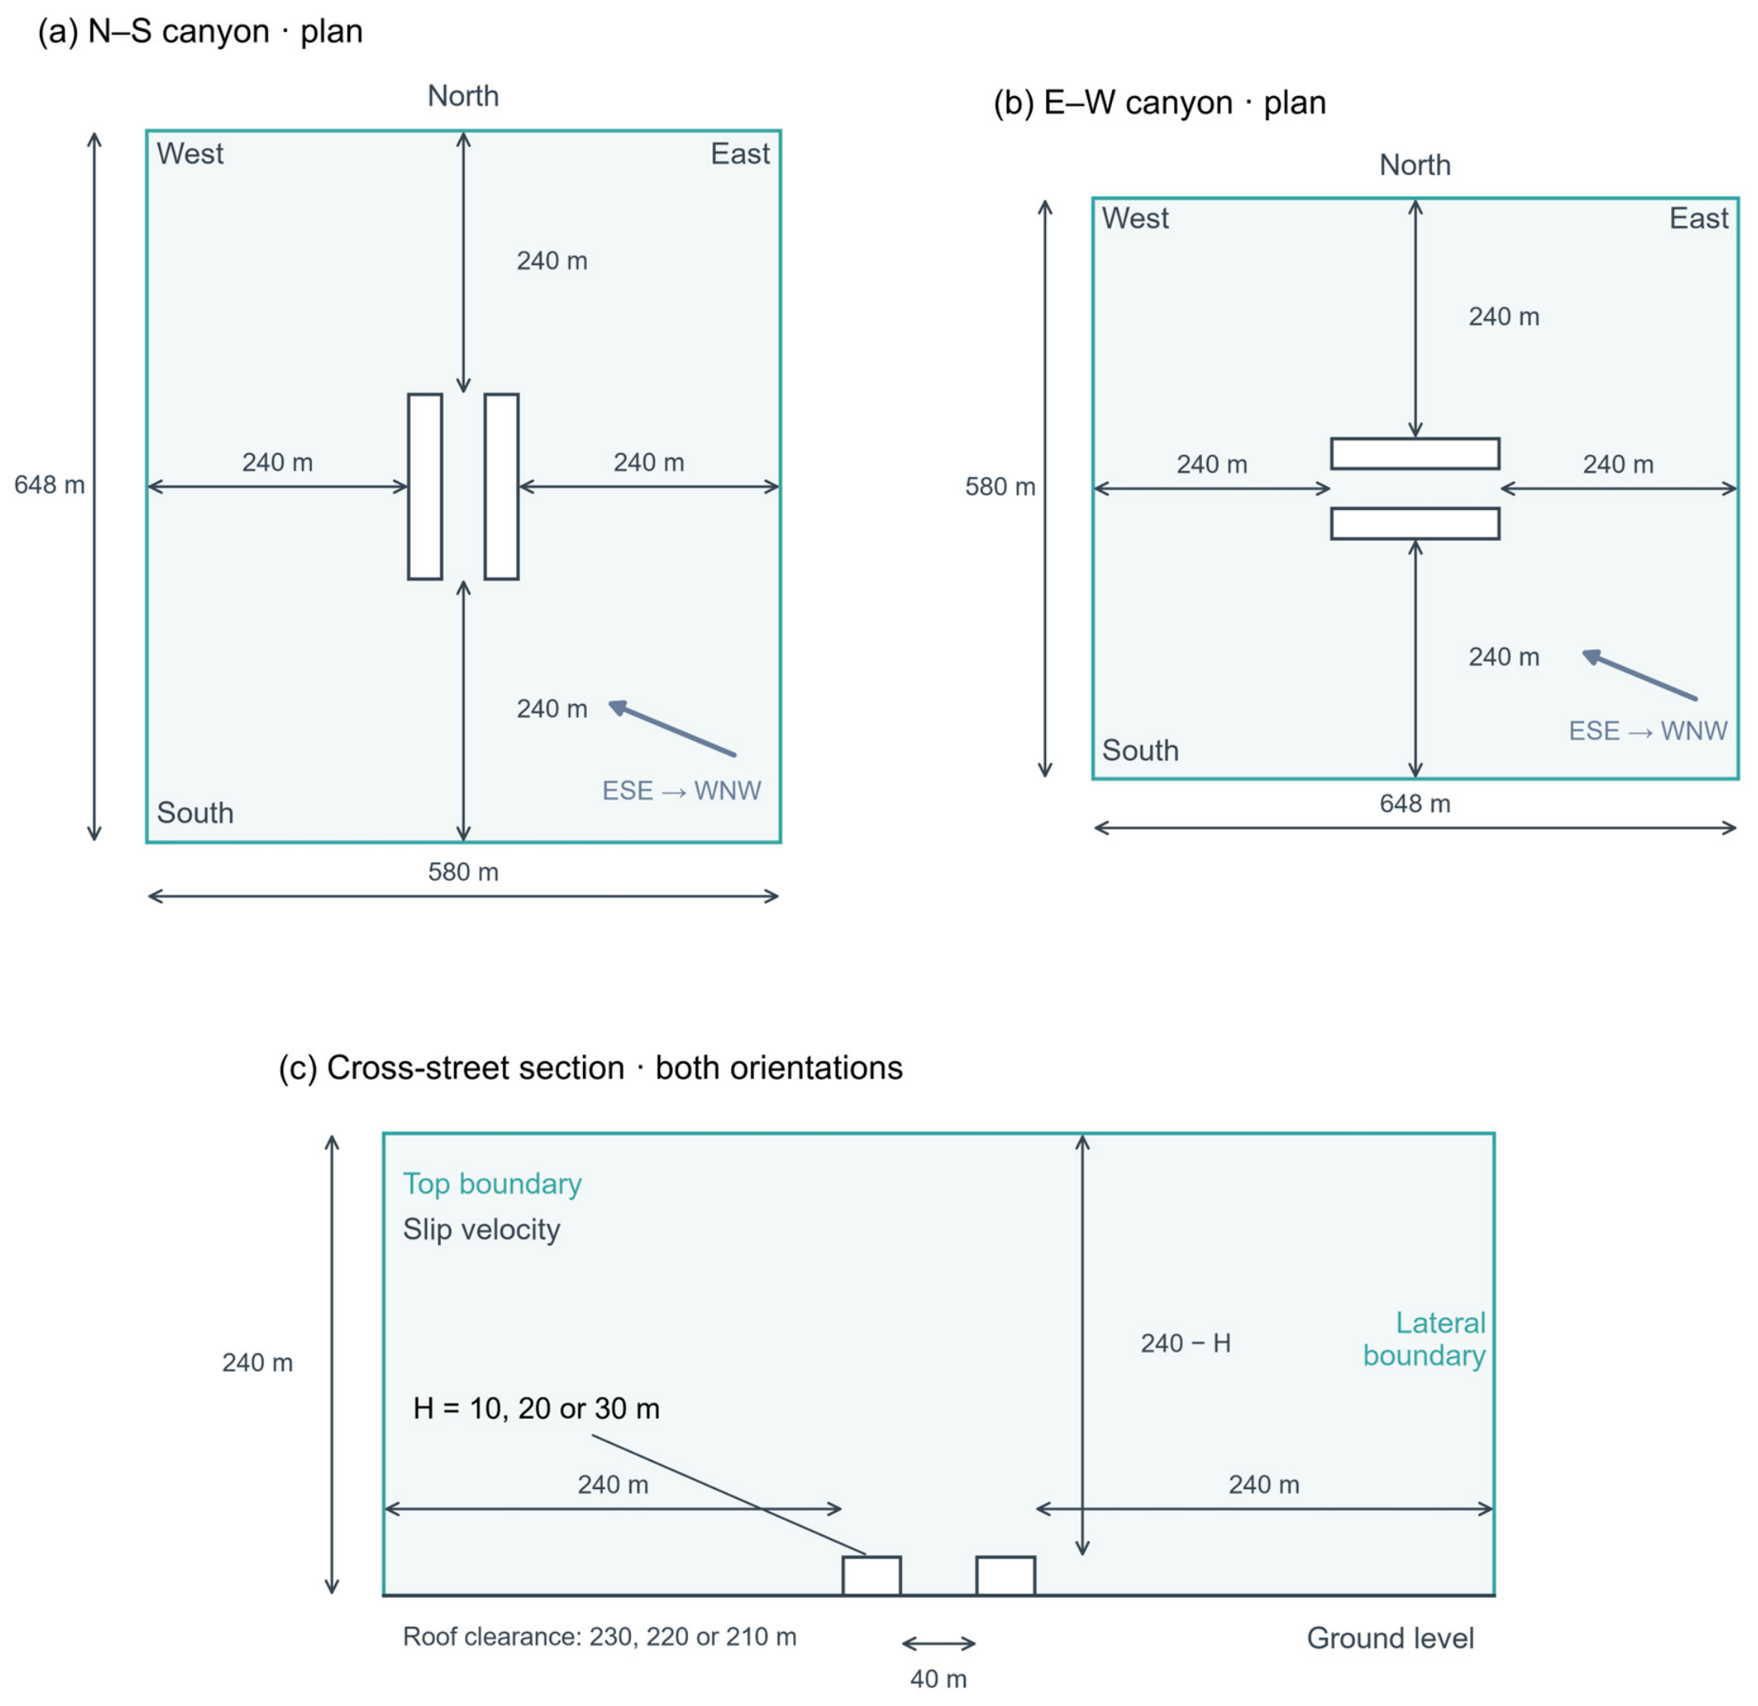
Figure 2 shows the atmospheric domain and building setbacks, and Table 2 summarizes the domain dimensions, boundary conditions, and turbulence settings. All four lateral boundaries, including the outflow sides, used the same custom velocity-profile condition, with no separate pressure-outlet boundary.
Figure 2.
Atmospheric computational domain: (a) N–S plan view; (b) E–W plan view; (c) cross-street section. Wind arrows indicate ESE inflow toward WNW; dimension arrows show domain extents and building clearances.
Table 2.
Computational domain, atmospheric boundary conditions, and turbulence settings.
Building and ground surfaces were thermally coupled to the air domain and assigned impermeable moisture boundary conditions. The ground domain extended to a depth of 2 m, with a fixed temperature of 293.2 K at its lower boundary. Interior building surfaces exchanged heat with prescribed indoor air at 301.15 K (28 °C) through a constant heat-transfer coefficient of 8 W m−2 K−1. The non-coupled lateral boundaries of both solid domains were assigned zero normal temperature gradients. All cases started from the same initial thermal state and were simulated from the beginning of the model day. Hourly outputs from 08:00 to 18:00 were used for analysis. Wall surface temperatures evolved through transient solid heat transfer under the prescribed indoor air condition. All cases used the same homogeneous, opaque wall construction and indoor boundary condition. The planar facades had a zero window-to-wall ratio and did not resolve surface texture, balconies, or window recesses.
The regions were coupled sequentially within each hourly interval [31]. The air equations were solved quasi-steadily using the current surface temperatures, with leaf temperature and vegetation source terms updated within the fluid iterations. Surface radiation was then updated, and transient heat transfer in the building and ground domains was advanced over the interval using smaller internal time steps. The coupled surface boundary conditions combined radiative input, heat exchange with the adjacent air, and conduction into the solid. Longwave exchange was refreshed during the solid calculation as surface temperatures evolved. Updated solid temperatures supplied the thermal boundary conditions for the next air solution. The air solution represented Reynolds-averaged flow with Boussinesq buoyancy, with turbulent momentum and heat transport represented by the turbulence closure and effective thermal diffusivity. The hourly fields describe successive mean flow states as thermal conditions changed.
Table 3 lists the numerical controls shared by all 16 production cases. The outer SIMPLE iteration used initial equation residuals as stopping criteria, with separate tolerances for the individual linear solves. Each hourly air stage ended when these residual criteria were met or the iteration limit was reached. Residual histories and iteration counts were inspected to identify how each hourly air stage ended. Solid convergence was checked at each internal substep using the Picard criteria in Table 3. Failed substeps were reverted and repeated with a smaller time step.
Table 3.
Iteration and time-step controls for the coupled calculations.
2.3. Facade Temperature and Wall–Air Heat Exchange
Facade temperatures were evaluated directly on the native wall faces within the central 72 m of the canyon, with all statistics weighted by face area. Boundary-adjacent air temperature was taken from the air cell immediately next to each wall face. A second air-temperature dataset was sampled on planes 1 m from the facades to characterize the broader near-facade thermal field. Additional planes at 0.5 and 2 m from the facades were used to examine wall-normal variation in the near-facade air response.
Wall-to-air sensible heat flux was calculated for each wall face using Equation (1):
where Ts and Ta are the facade surface and boundary-adjacent air temperatures, respectively, and h is the local convective heat-transfer coefficient obtained from the coupled wall boundary condition. Positive qH denotes heat transfer from the wall to the air. Conductive heat flux into the wall was derived from the temperature gradient within the solid, while effective external heat input was recovered from the surface energy balance. All fluxes were evaluated facewise before spatial and temporal averaging.
qH = h(Ts − Ta),
Saved shortwave and net longwave wall fluxes were mapped to the analyzed wall faces using the same area and daytime weights as the temperature analysis. Their sum was compared with the effective external input reconstructed from the mixed wall boundary condition. The reconstructed input was lower than the radiative sum in the E–W H20 south-facing 0–3 m band. Daytime mean differences (reconstructed minus radiative) were −2.18 W m−2 for G0 and −2.29 W m−2 for G2. Wind speed was calculated from the velocity magnitude on the 1 m wall-offset plane and averaged over the corresponding height band.
The local coefficient h represented heat transfer between the wall face and the center of the adjacent air cell. It was calculated in the coupled boundary condition as the effective air thermal conductivity multiplied by the inverse wall-normal cell-center distance. The effective conductivity included molecular and turbulent contributions; the latter was obtained from the air-side thermal wall function with a turbulent Prandtl number of 0.85. The coefficient varied with local turbulence and near-wall mesh geometry. For post-processing, the same coefficient was recovered from the stored mixed-boundary coefficients.
The reference air temperature and h are defined at the adjacent cell center, so their values depend on the near-wall discretization. Equation (2) partitions the heat-flux difference at that discretization; it does not assign grid-independent contributions to the underlying physical processes.
Tree-induced changes were calculated relative to the corresponding tree-free case at the same building height and canyon orientation. Temperature differences were defined as TG0 − TGi, so positive values indicate cooling. Sensible heat changes used the same reference-minus-tree convention, with positive values indicating reduced heat release from the wall to the air. To examine the source of changes in qH, the flux difference was separated into contributions from the convective heat-transfer coefficient and the wall–air temperature difference. Letting θ = Ts − Ta and ΔX = XG0 − XGi,
where the overbars denote the mean of the paired values at the same wall face and time. The two terms in Equation (2) were evaluated facewise before spatial and temporal averaging.
Daytime means were calculated from hourly outputs between 08:00 and 18:00 using trapezoidal integration. Facade responses were evaluated for the 0–3, 3–10, and 10–20 m height bands, corresponding to the region below the crowns, within the crown layer, and above the crowns. An additional 20–30 m band was included for H30. Building height comparisons also covered the lower 10 m of each facade so that the same height range was evaluated across H10, H20, and H30. The warming fraction was defined as the proportion of wall area with a negative daytime mean temperature difference relative to G0.
Air-temperature sections were extracted at 14:00 for the H20 G0/G2 cases. Transverse sections passed through the two central tree pairs and the intervening gap. Longitudinal sections followed each tree row and a plane 1 m from its facade over the central 72 m. All sections extended from ground level to 30 m. Temperatures were sampled from native air cells on a 0.5 m grid, and G0–G2 differences were calculated at the same locations. Section means were calculated using equally weighted grid points within each height band, excluding building areas.
2.4. Model Validation
The modelling framework was previously evaluated against measurements from an outdoor reduced-scale vegetated street canyon experiment in Angers, France [32]. The 1:5 scale facility represented a street canyon with an aspect ratio of 1.0 and included both vegetated and non-vegetated sections. Modelled air temperature, relative humidity, and wind speed were compared with hourly measurements collected under summer conditions. The previous evaluation yielded RMSE values of 0.786 °C for air temperature, 2.363 percentage points for relative humidity, and 0.316 m s−1 for wind speed (Table 4). The corresponding R2 values were 0.985 for air temperature and 0.984 for relative humidity. The same airflow, thermal, and vegetation framework was used here, with the geometry and planting configurations adapted to the present facade-focused analysis. Zhu et al. [32] also compared mean radiant temperature (MRT) with globe-derived estimates at three canyon locations. The 120 hourly pairs gave an RMSE of 3.82 °C (Table 4).
Table 4.
Validation metrics. The dash indicates that R2 is unavailable for wind speed.
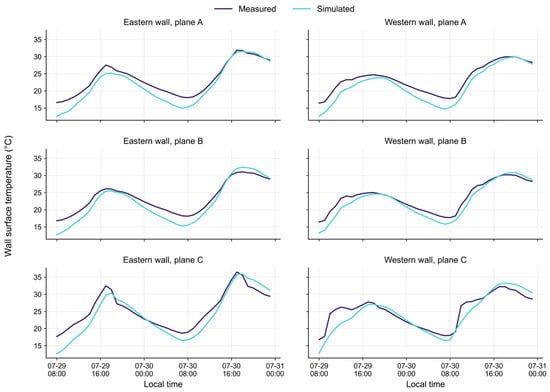
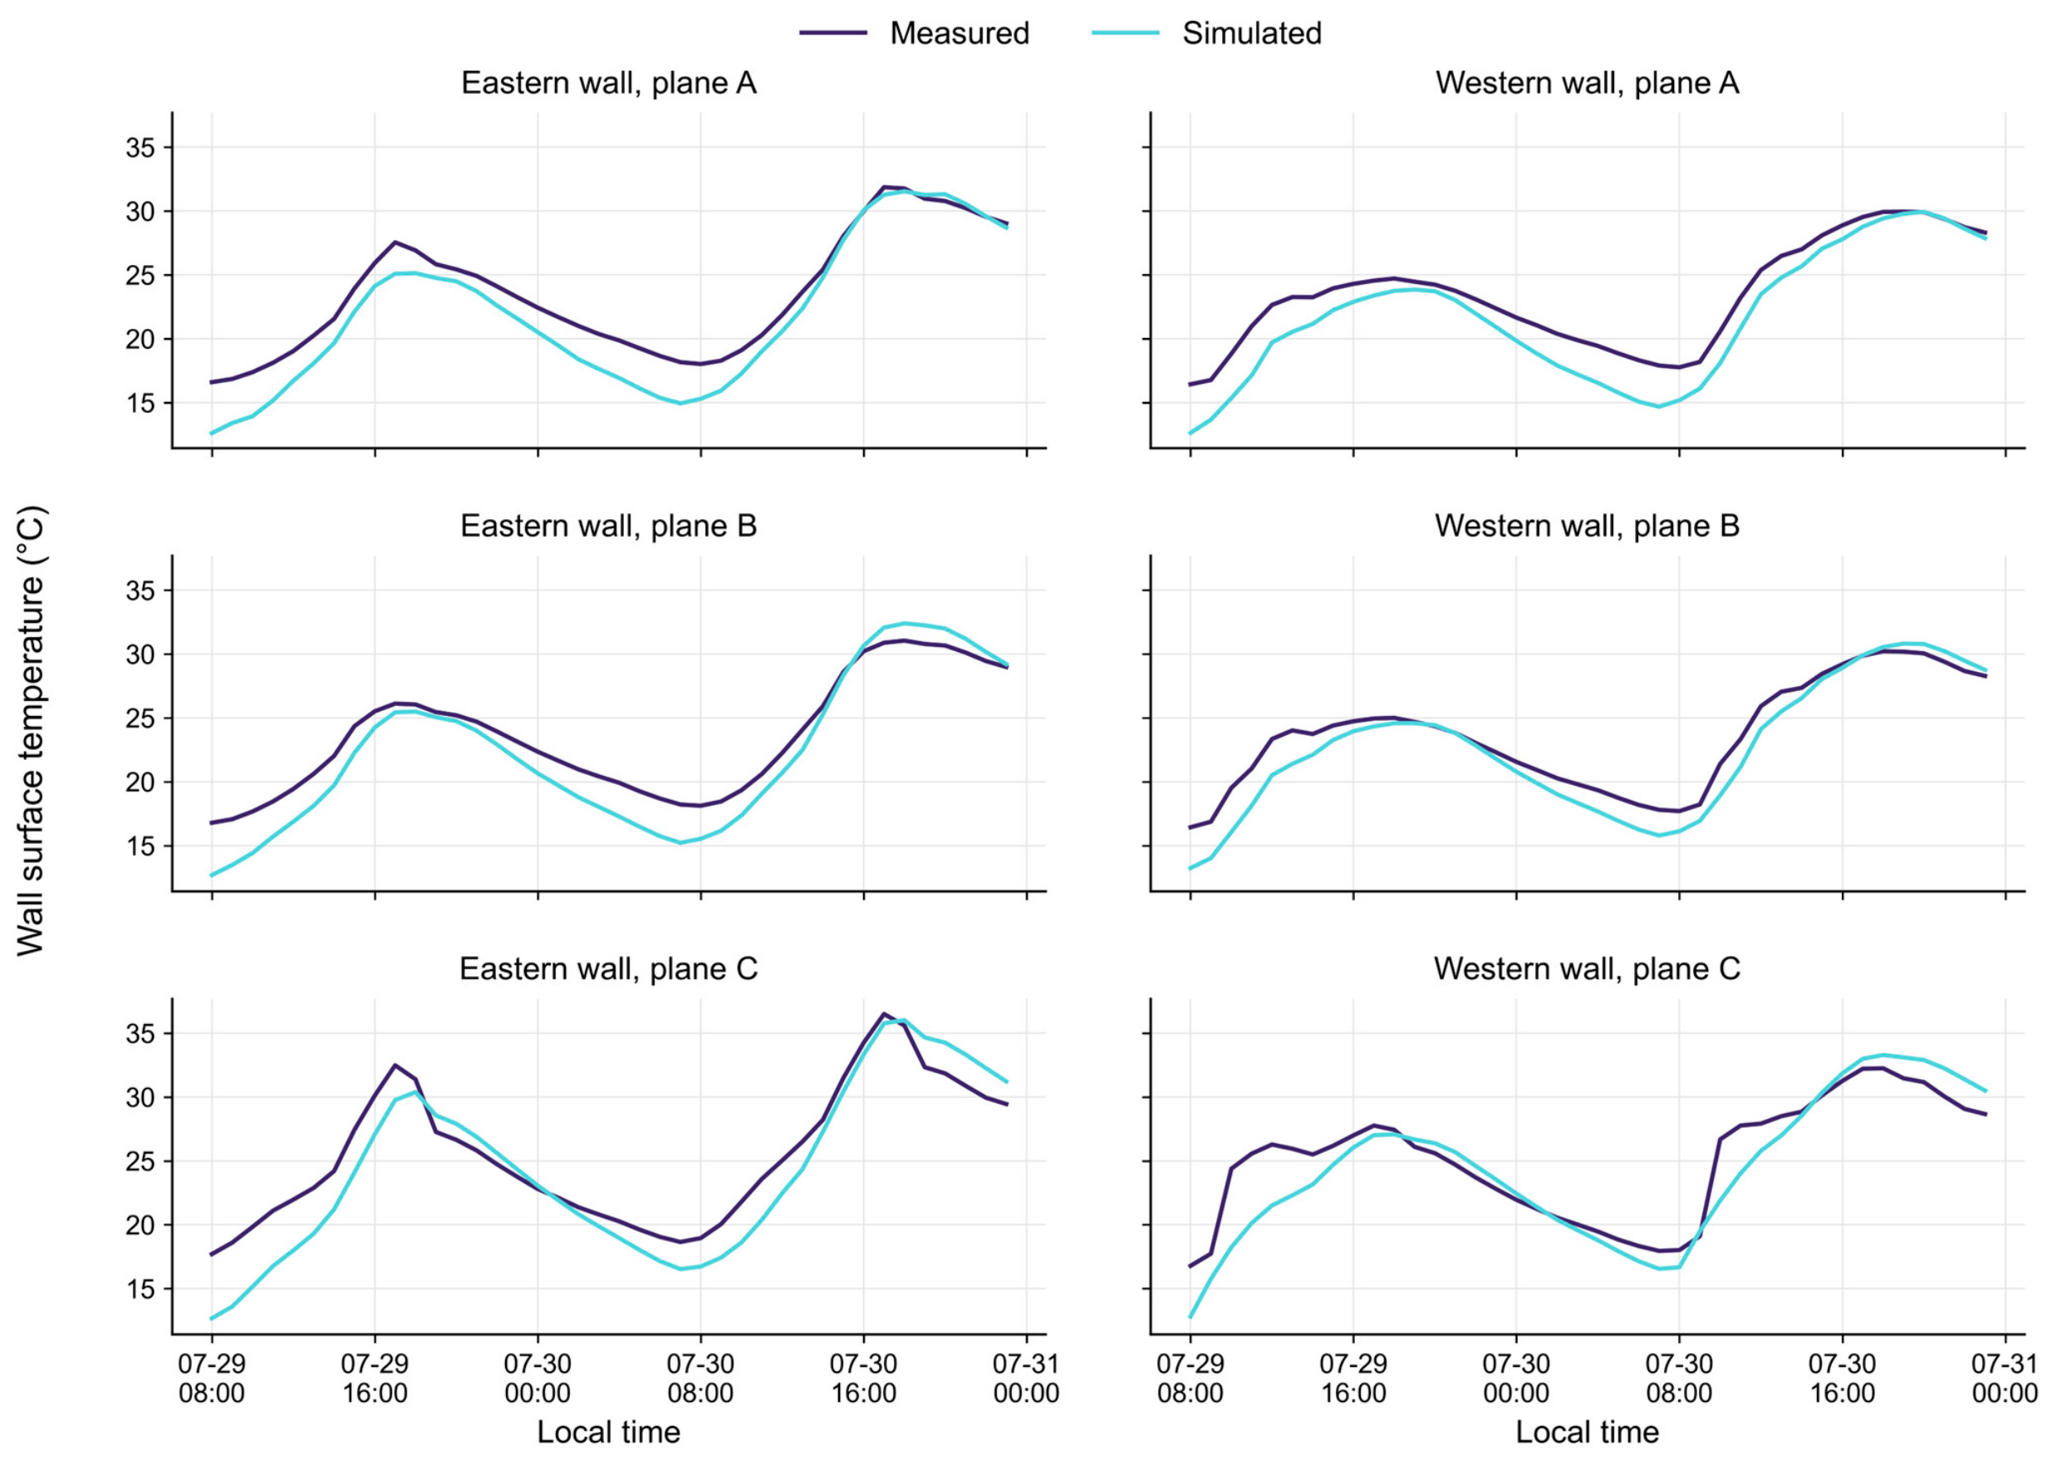
Wall surface temperatures were evaluated at six sensor locations in the Angers dataset [36]. The sensors were 1 m above ground on the eastern and western walls of sections A, B, and C in the reduced-scale facility. Local temperatures from the coupled solid-to-air boundary of the validation simulation were matched to hourly mean observations, without recalibration. The comparison covered 29 July 2020 at 08:00 to 30 July 2020 at 23:00, local time, giving 240 pairs over 40 h. Each observed hourly mean contained six valid ten-minute records.
The model reproduced the observed diurnal variation in wall temperature with reasonable overall agreement (Figure 3), although temperatures were generally underestimated. Across the 240 pairs, MAE, RMSE, MBE, and R2 were 1.73 °C, 2.11 °C, −1.34 °C, and 0.789, respectively (Table 4). RMSE was 2.20 °C on the eastern wall and 2.02 °C on the western wall. Discrepancies were larger during the first day’s comparison period, with an RMSE of 2.51 °C compared with 1.80 °C on the second day. A possible contributor to these discrepancies is the spatially uniform indoor-temperature boundary. The prescribed indoor temperature varied with time, but the same value was applied across the interior surface at each time. This simplification leaves local indoor temperature differences unresolved, potentially affecting heat conduction through the wall and its exterior surface temperature.
Figure 3.
Measured and simulated wall surface temperatures at six Angers sensors, 1 m above ground. Rows show sections A–C; columns show eastern and western wall positions. Hourly data cover 29 July 2020 at 08:00 to 30 July 2020 at 23:00 (local time).
2.5. Air Mesh Sensitivity
Air mesh sensitivity was examined for E–W H20 G2 using nominal spacings of 0.75, 1.0, and 1.5 m, corresponding to approximately 4.78, 2.11, and 0.65 million air cells. Geometry, material properties, meteorological forcing, solid meshes, and radiation settings were identical across the three meshes. Two-hour simulations were initialized from the reference states at 07:00, 12:00, and 15:00. The first hour was used for adjustment, and the temperature fields were compared at 09:00, 14:00, and 17:00, respectively.
Mesh sensitivity was assessed using facade temperature and near-wall air temperature over the central 72 m of the canyon and the full 0–20 m facade height, with a separate comparison for the 0–3 m bands on each side. Facade temperatures on the air side of the coupled wall interface were compared using area overlaps between native faces. Air temperatures were sampled at identical points 1 m from each facade, spaced at 1 m intervals in the vertical and along-street directions.
Differences from the 1 m reference were larger in the morning than in the afternoon (Table 5). For the 0.75 m mesh, mean absolute differences in facade and near-wall air temperatures were 0.230 and 0.116 °C at 09:00, 0.124 and 0.059 °C at 14:00, and 0.106 and 0.046 °C at 17:00. The fine mesh showed smaller facade-temperature differences than the coarse mesh at all three times. Air-temperature differences followed the same pattern at 14:00 and 17:00; at 09:00, they were 0.116 °C for the fine mesh and 0.091 °C for the coarse mesh. The 1 m mesh was selected for the scenario simulations as a balance between temperature sensitivity and computational cost.
Table 5.
Mesh sensitivity of facade and near-wall air temperatures for E–W H20 G2. Differences are tested minus the 1 m reference, pooled across both facades over the central 72 m and 0–20 m height.
The lower-wall differences were more spatially variable (Table S1). For the fine mesh, 0–3 m mean absolute differences were 0.281, 0.099, and 0.110 °C on the north-facing wall at 09:00, 14:00, and 17:00, respectively, and 0.210, 0.342, and 0.232 °C on the south-facing wall. Afternoon band-mean differences were within 0.040 °C on both sides, despite larger local differences. These comparisons quantify the sensitivity of G2 temperatures; uncertainty in the paired G0–G2 response was not directly evaluated.
3. Results
3.1. Vertical and Diurnal Facade Temperature Responses
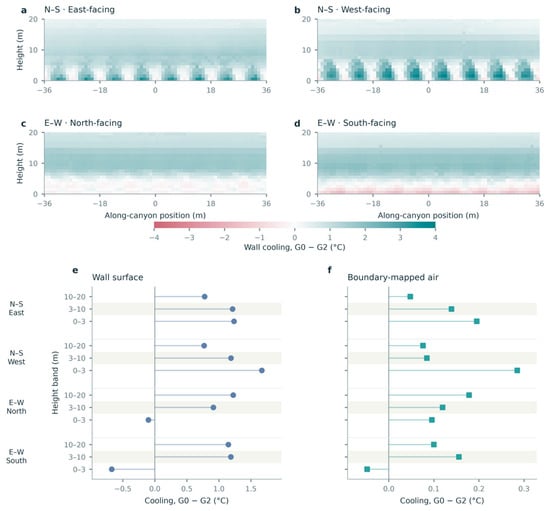
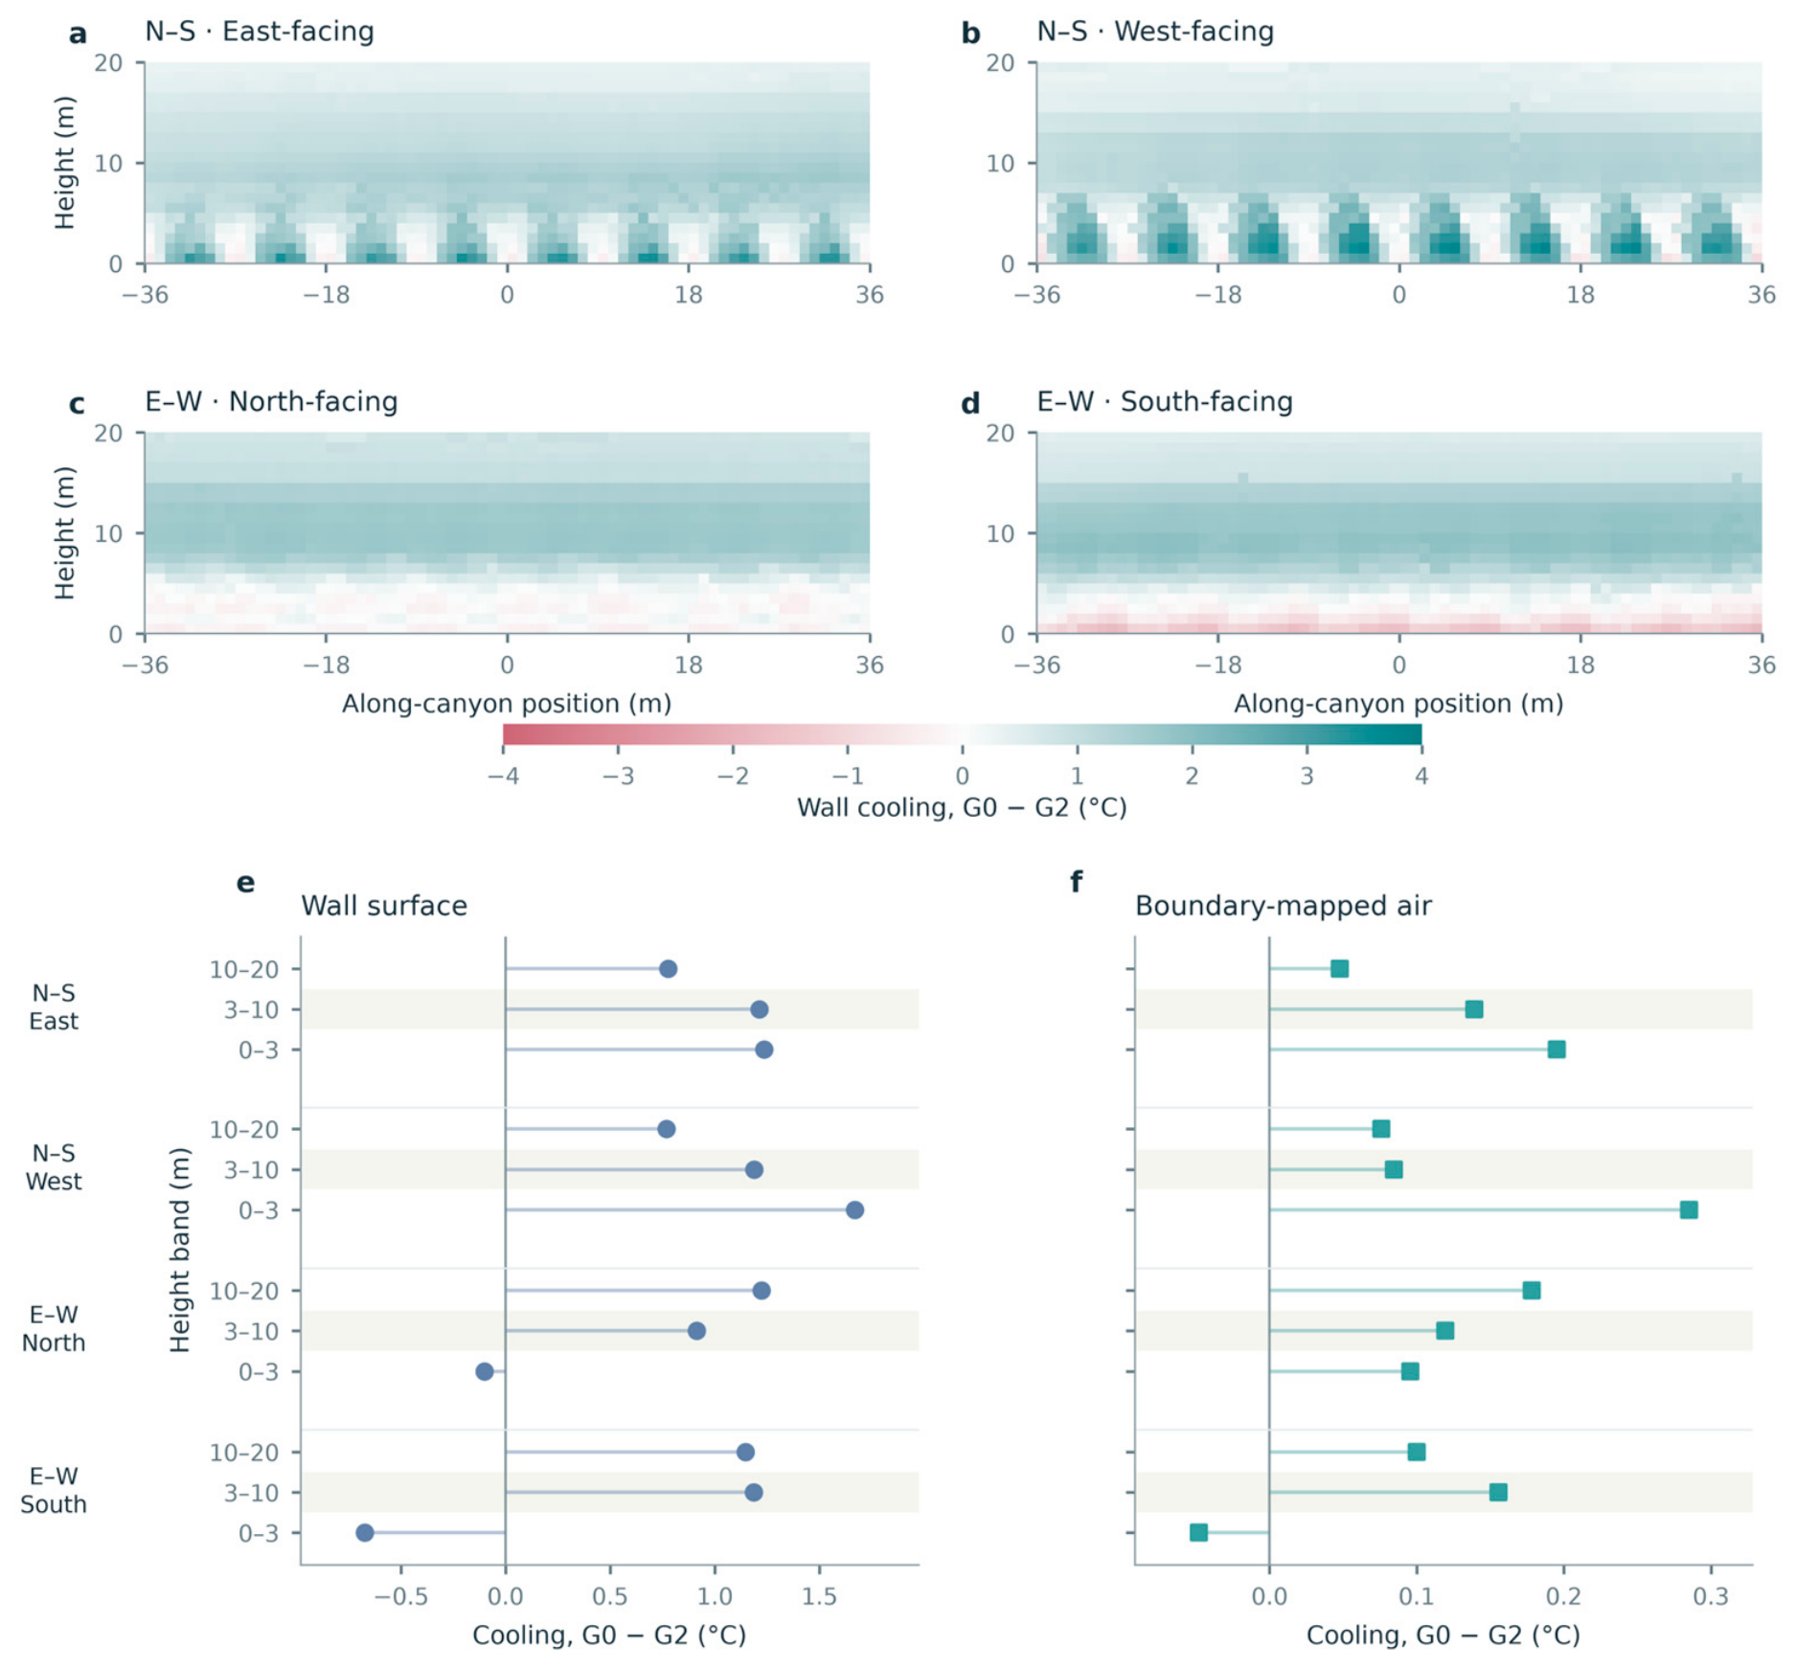
At H20 with 9 m tree spacing, opposing facades showed similar daytime whole-facade cooling: 1.00 and 1.05 °C in the N–S canyon and 0.92 and 0.89 °C in the E–W canyon (Figure 4). Cooling extended above the 10 m canopy top, reaching 0.77–0.78 °C over the 10–20 m wall bands in the N–S canyon and 1.15–1.22 °C in the E–W canyon. Sensible heat release from these upper wall bands also decreased by 11.01–15.02 W m−2. Near the base of the E–W canyon, the response differed from the whole-facade pattern. The south-facing 0–3 m band warmed by 0.67 °C, while the north-facing band remained closer to G0, with a mean increase of 0.10 °C. Both facades nevertheless cooled over their middle and upper levels, so the lower wall warming was not evident in the whole-facade averages.
Figure 4.
Daytime (08:00–18:00) temperature reductions, G0–G2, for H20 over the central 72 m. Wall-temperature maps: (a) N–S east-facing; (b) N–S west-facing; (c) E–W north-facing; (d) E–W south-facing. Height-band means: (e) wall; (f) boundary-adjacent air. Wall maps share a linear color scale from −4 to +4 °C.
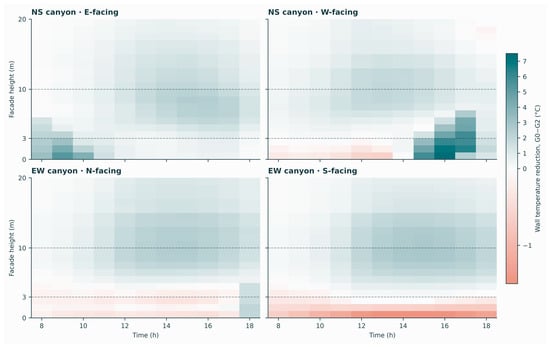
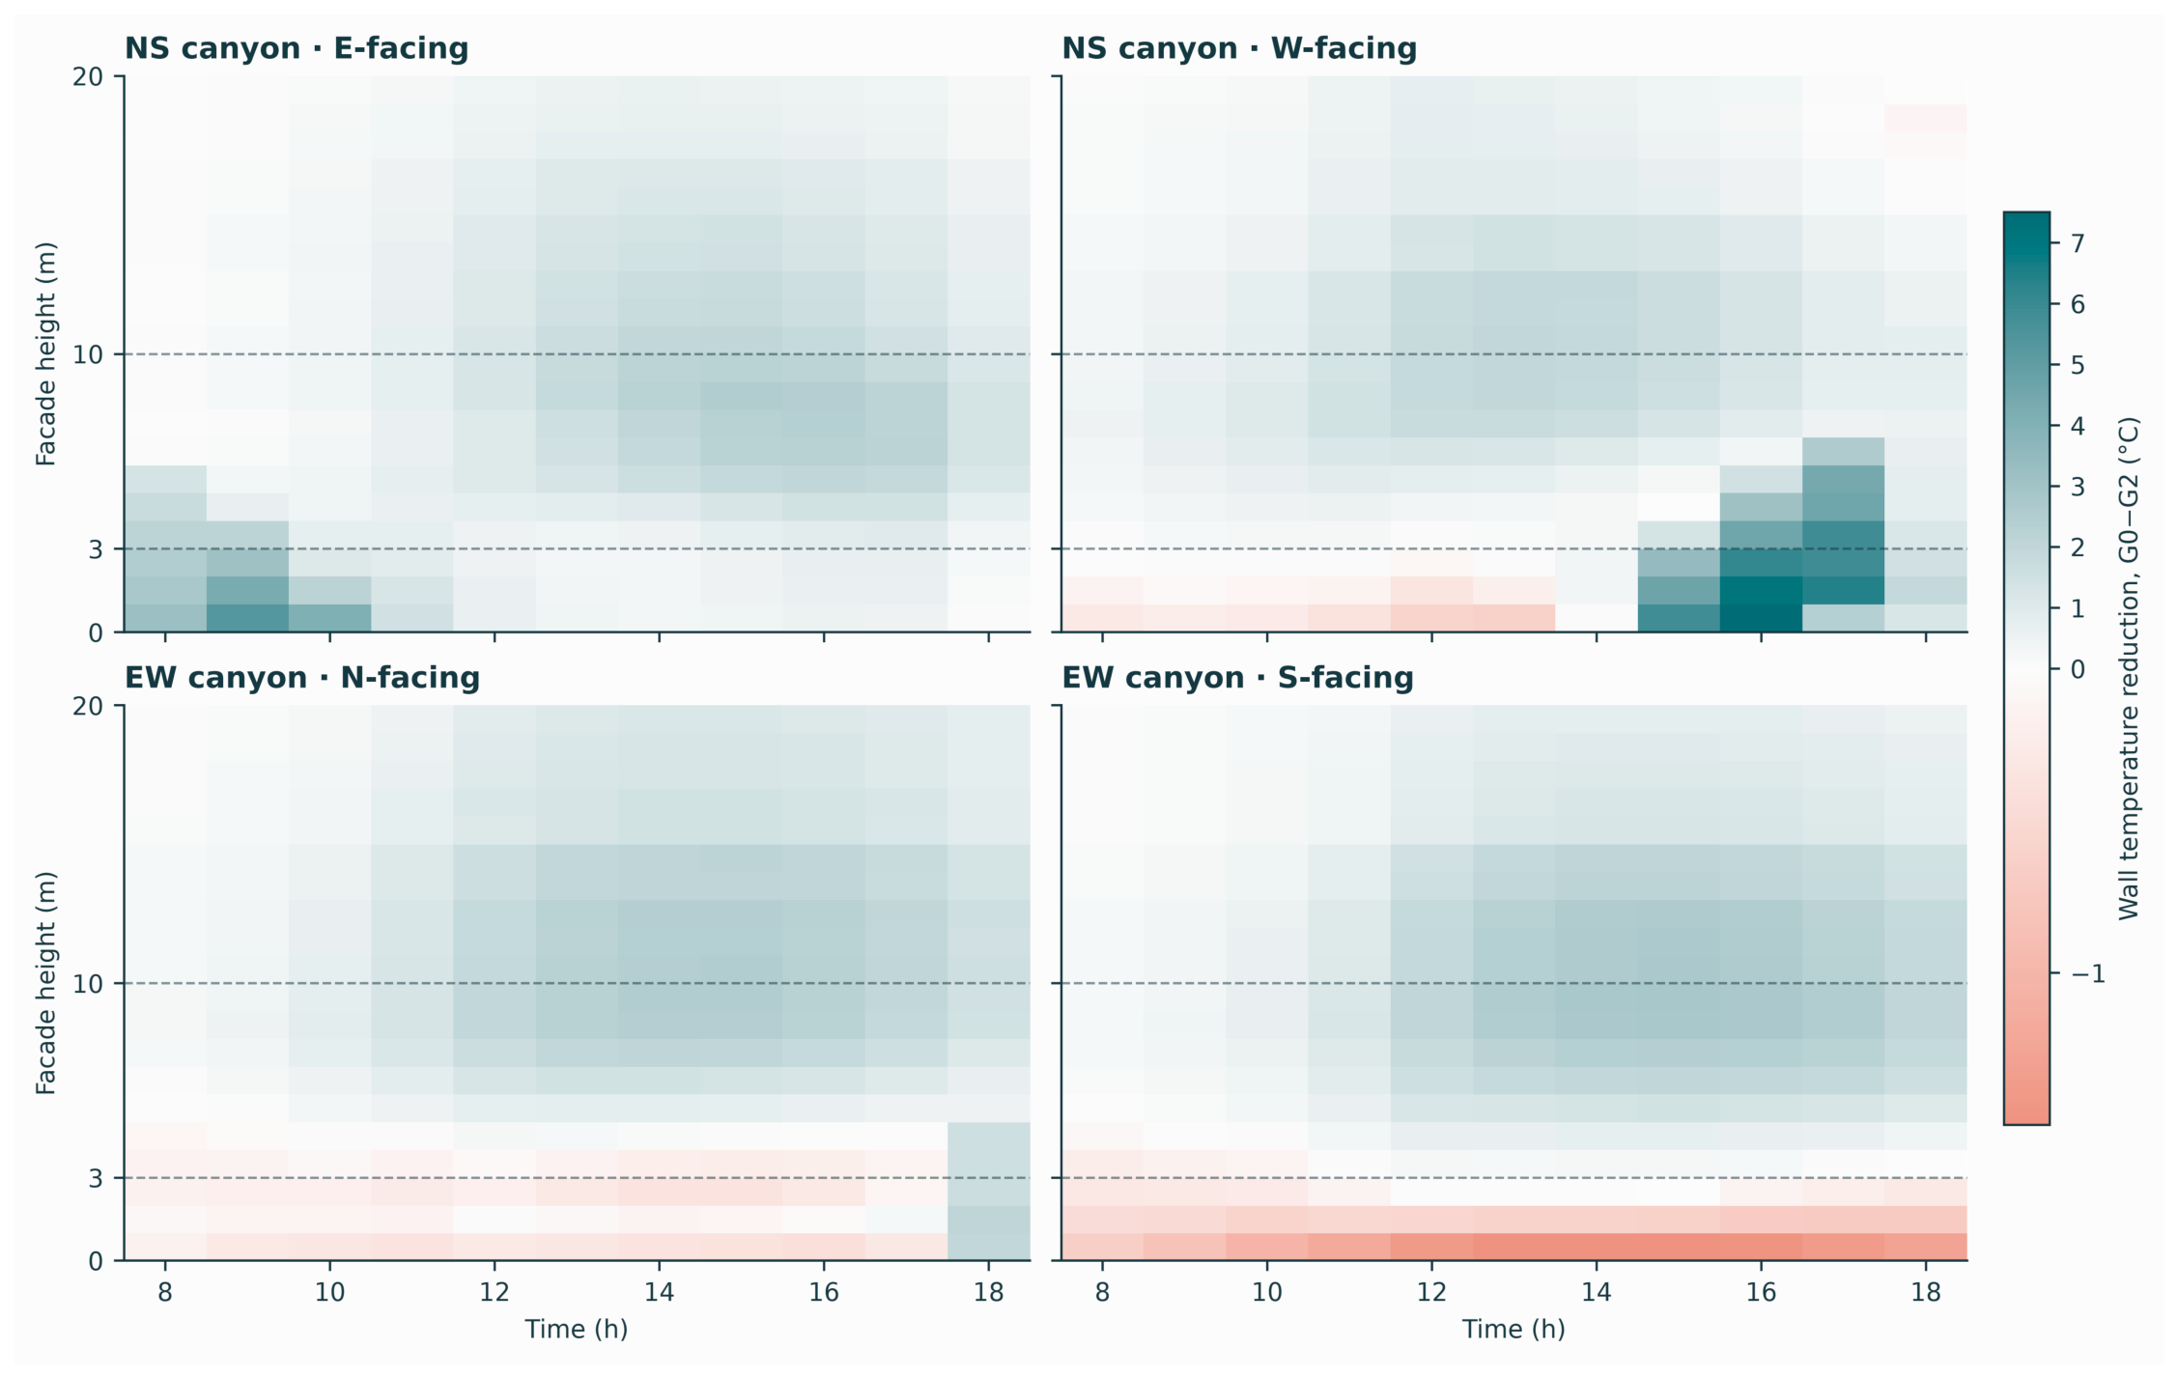
The lower wall response also differed over the course of the day (Figure 5). On the E–W south-facing facade, the 0–3 m band remained warmer than the tree-free case at every saved hour, with mean warming ranging from 0.48 to 0.76 °C. The north-facing lower wall showed a more variable response, shifting between slight warming and pronounced cooling during the day. Above 10 m, both E–W facades showed more persistent cooling. In the N–S canyon, the east- and west-facing lower walls reached their strongest cooling at different times, reflecting their different solar exposure over the day.
Figure 5.
Diurnal wall-temperature reductions, G0–G2, at H20 from 08:00 to 18:00. Values are means for 1 m height strips over the central 72 m. Horizontal lines mark the crown base (3 m) and canopy top (10 m).
3.2. Effects of Tree Spacing and Building Height on Facade Cooling
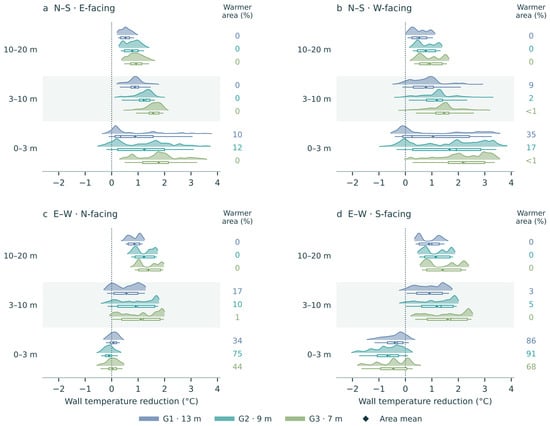
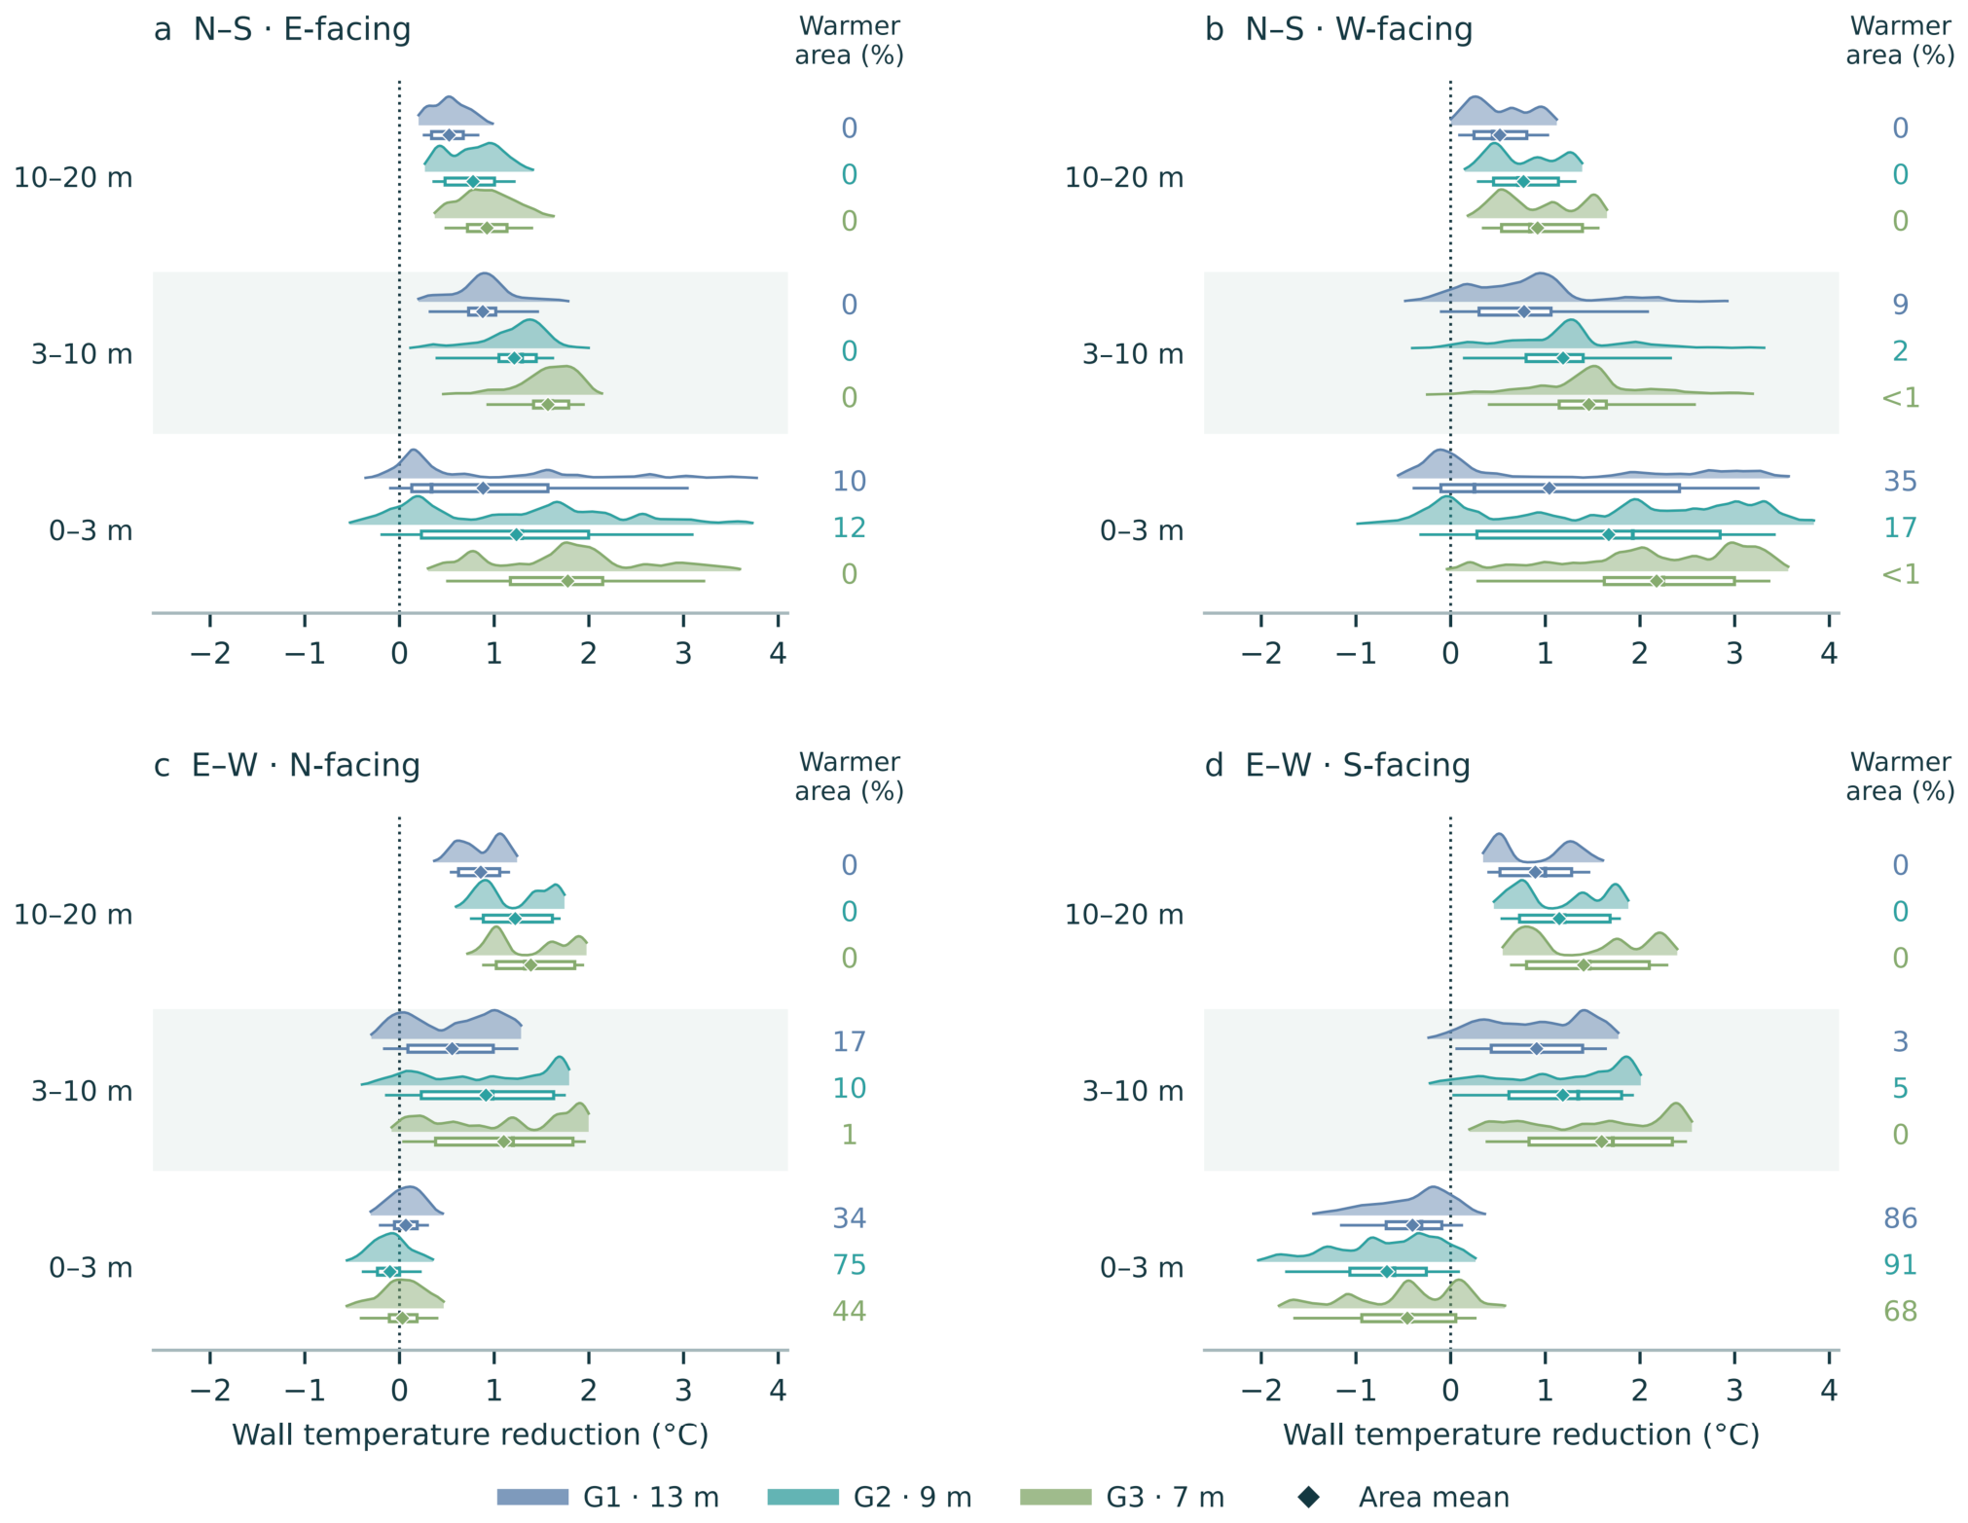
Closer tree spacing strengthened whole-facade cooling at H20 in both canyon orientations (Figure 6). Across the four facades, mean cooling increased from 0.63–0.70 °C at 13 m spacing to 1.08–1.30 °C at 7 m spacing. This increase was not uniform with height. On the E–W south-facing facade, the 0–3 m band remained warmer than the tree-free case at all three spacings, with 86%, 91%, and 68% of the band area showing daytime warming at 13, 9, and 7 m spacing, respectively. By contrast, daytime mean temperature was lower than G0 throughout the sampled 10–20 m wall area at all three spacings.
Figure 6.
Spatial distributions of daytime wall temperature reduction, G0–Gi, for H20 G1–G3 in the central 72 m: (a) N–S east-facing; (b) N–S west-facing; (c) E–W north-facing; (d) E–W south-facing. Each height band shows 13, 9, and 7 m spacing from top to bottom. Half violins show area-weighted densities; boxes span the 25th–75th percentiles, inner ticks mark medians, whiskers span the 5th–95th percentiles, and diamonds mark area means. The right-hand columns give the percentage of band area warmer than G0.
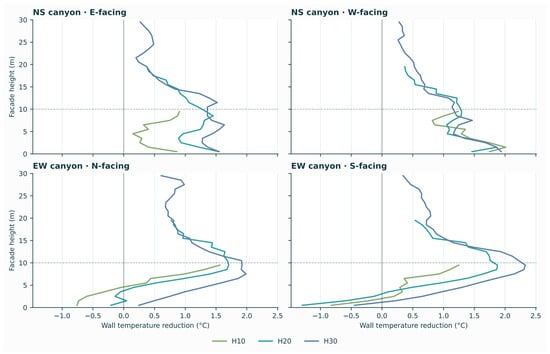
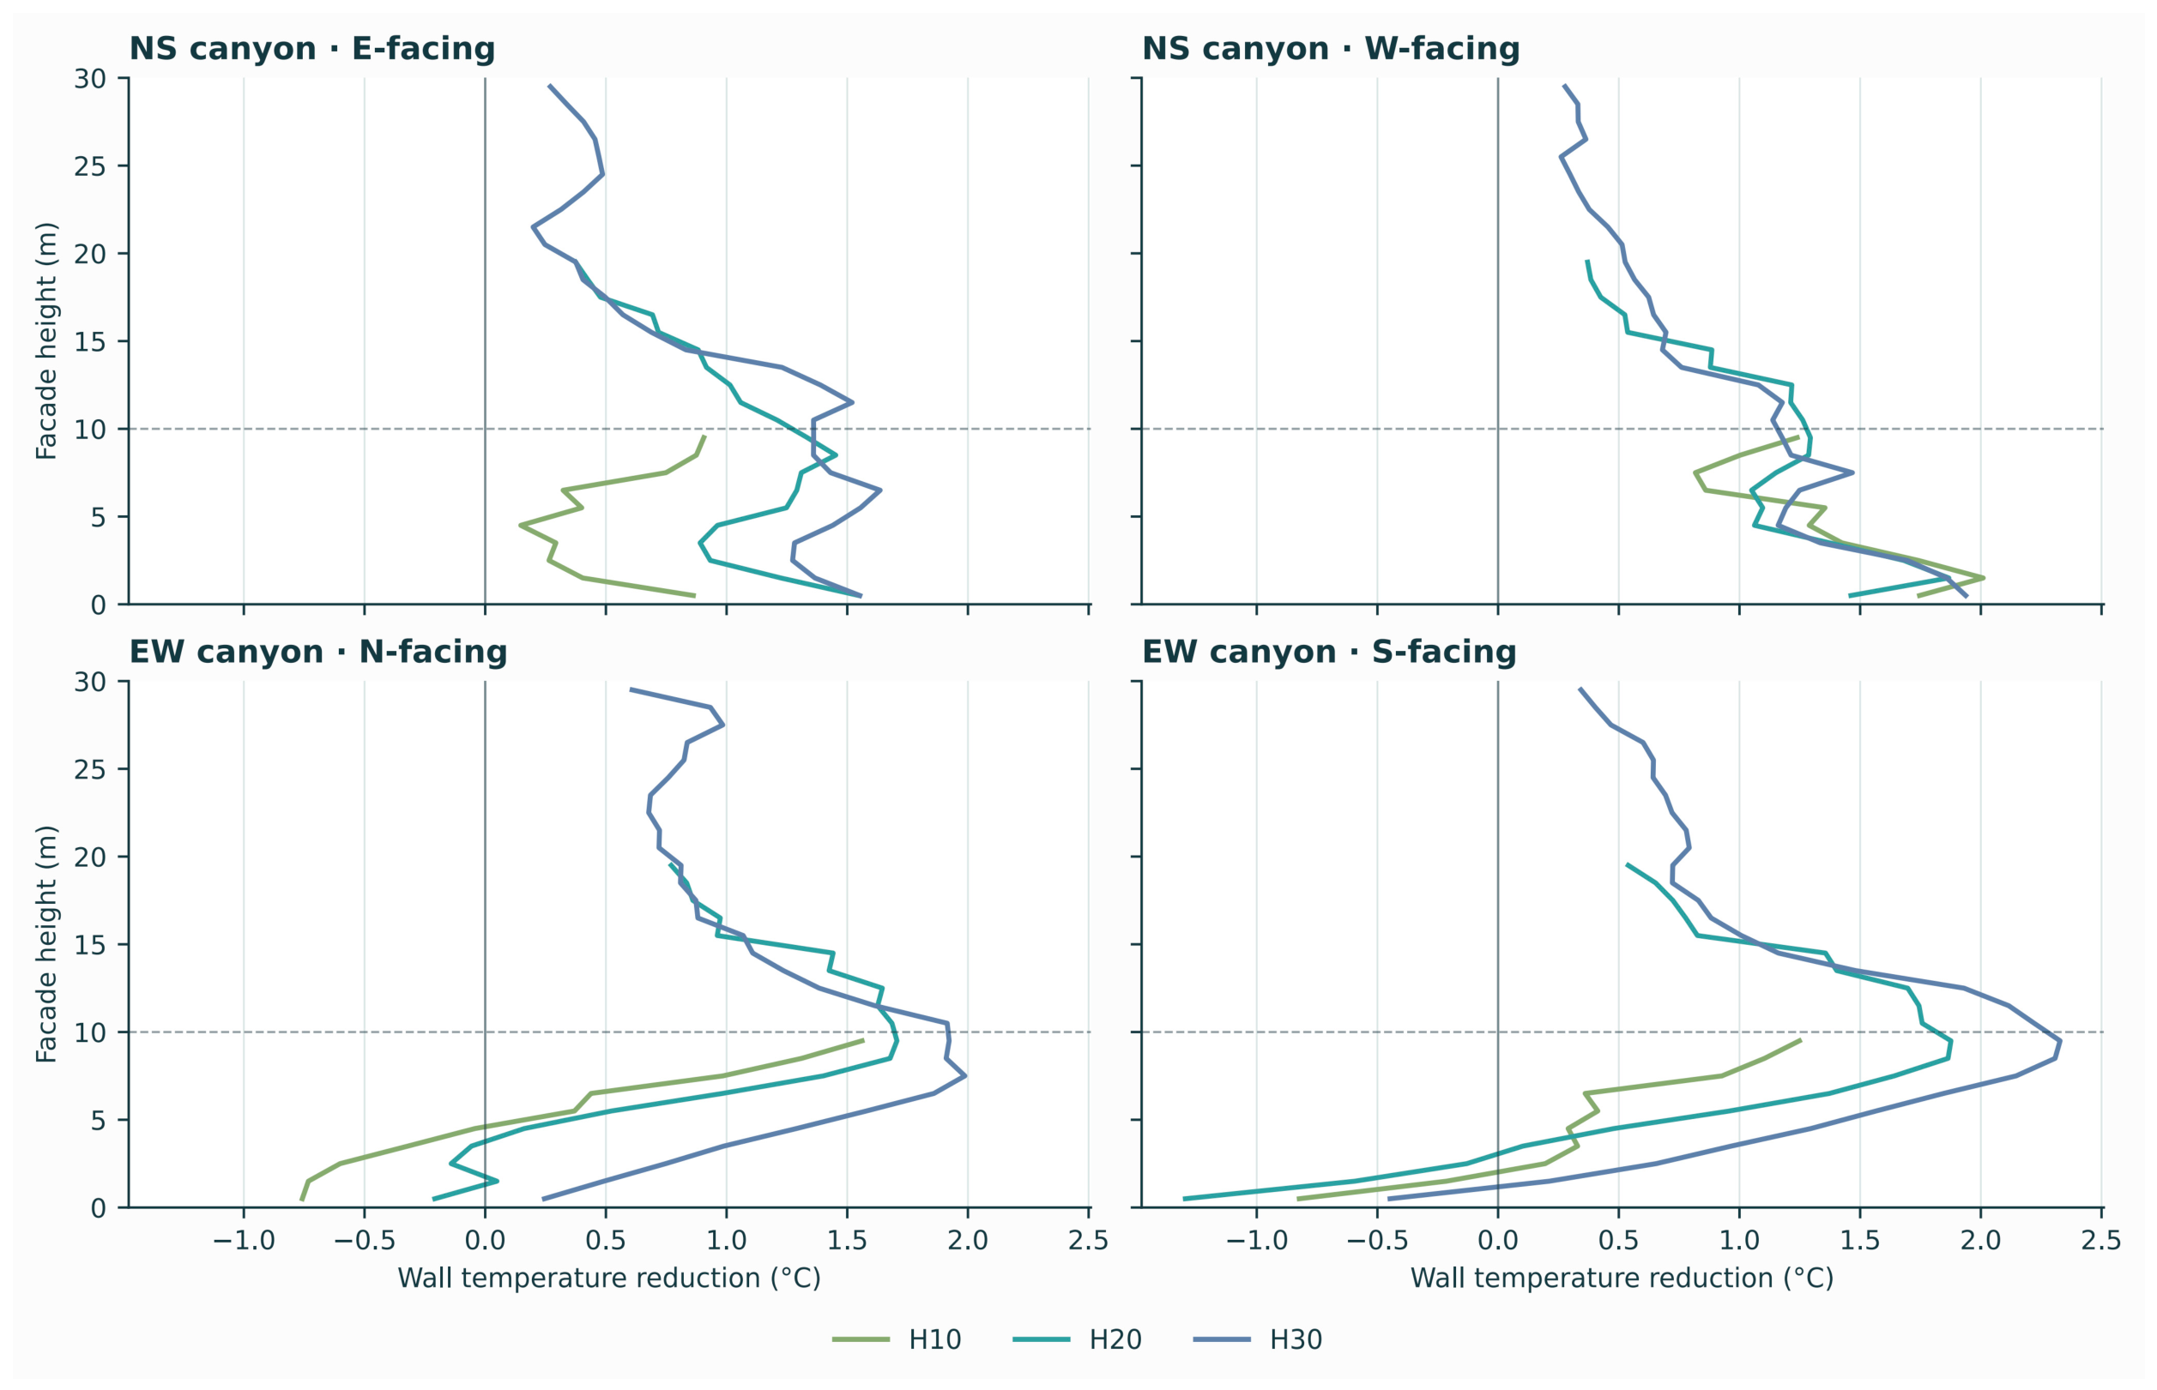
Building height generally strengthened tree-induced cooling over the lower 10 m of the facades, although the magnitude of this effect differed between canyon orientations (Figure 7). In the N–S canyon, cooling on the east-facing facade increased from 0.52 °C at H10 to 1.43 °C at H30, while the west-facing facade remained relatively stable at 1.33–1.43 °C. A clearer trend occurred in the E–W canyon, where cooling increased from 0.22–0.38 °C at H10 to 1.29–1.30 °C at H30 on the two opposing facades. In the lowest 0–3 m band, the north-facing response changed from 0.70 °C warming at H10 to 0.49 °C cooling at H30. The south-facing band changed from 0.28 °C warming to a small cooling response of 0.14 °C.
Figure 7.
Daytime wall-temperature reductions, G0–G2, for building heights of 10, 20, and 30 m. Profiles show area-weighted means for 1 m height strips over the central 72 m. The dashed line marks the 10 m canopy top.
3.3. Wall–Air Heat Exchange and Local Warming
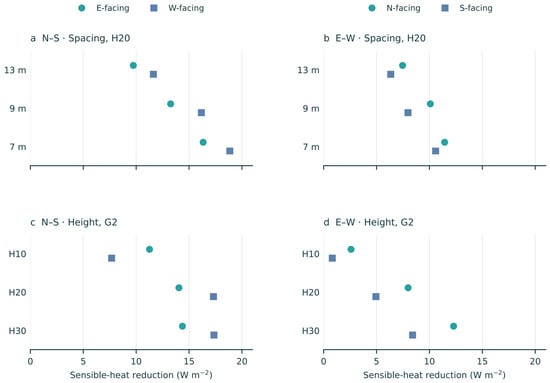
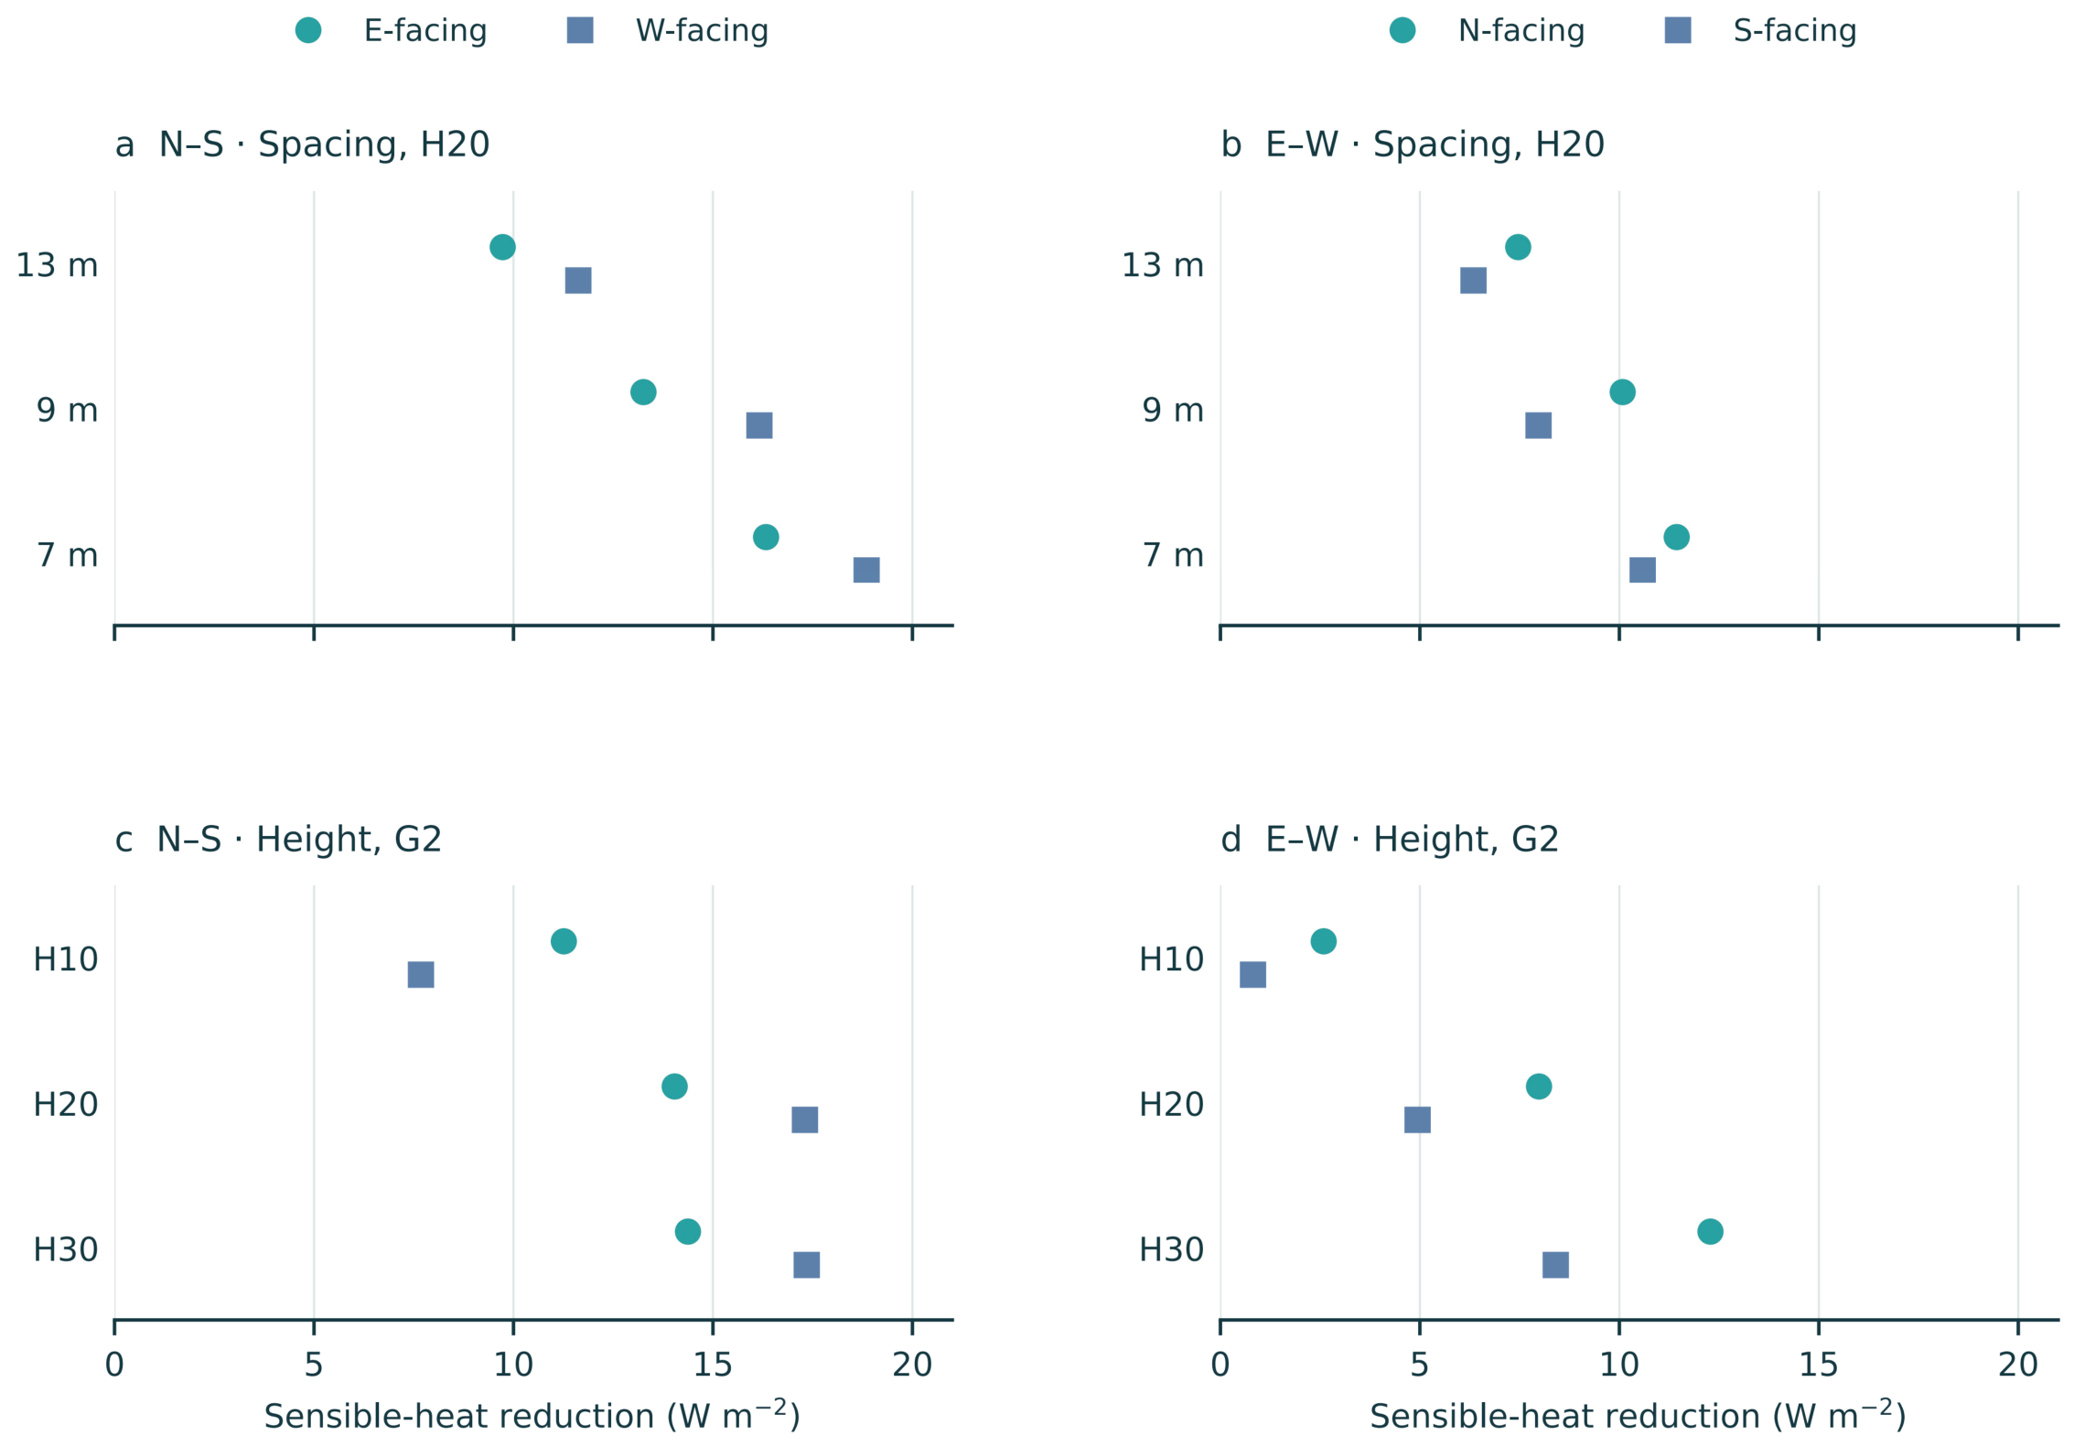
At H20, denser tree rows produced larger reductions in whole-facade sensible heat release (Figure 8). As spacing decreased from 13 to 7 m, reductions on the N–S facades rose from 9.73–11.63 to 16.33–18.85 W m−2. On the E–W facades, they rose from 6.34–7.46 to 10.59–11.44 W m−2. Taller buildings also produced greater reductions in sensible heat release over the lower 10 m of the facades. In the N–S canyon, the reduction increased markedly from H10 to H20 and then changed little at H30. In the E–W canyon, it increased more consistently with building height, from 0.82–2.59 W m−2 at H10 to 8.41–12.28 W m−2 at H30.
Figure 8.
Daytime reduction in wall-to-air sensible heat release, G0–Gi. Tree-spacing comparisons over complete 0–20 m facades at H20: (a) N–S; (b) E–W. Building-height comparisons over the lower 10 m at 9 m spacing: (c) N–S; (d) E–W. Each point is a mean weighted by face area and time over the central 72 m.
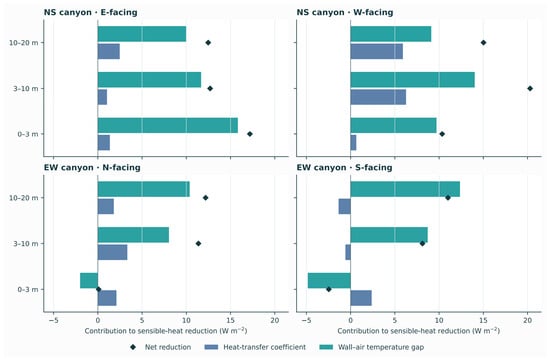
On the lower E–W walls, warming was accompanied by different changes in sensible heat release on the two sides. In H20 G2, the south-facing 0–3 m band warmed by 0.67 °C, and the boundary-adjacent air warmed by 0.05 °C. Sensible heat release from this band increased by 2.47 W m−2. On the north-facing side, the wall warmed by 0.10 °C while the boundary-adjacent air cooled by 0.10 °C, with little net change in sensible heat release.
On the south-facing lower wall, the temperature-difference term exceeded the opposing coefficient term; on the north-facing wall, the two nearly balanced (Figure 9). The south-facing temperature-difference term increased sensible heat release by 4.85 W m−2, while the coefficient term reduced it by 2.38 W m−2. The corresponding north-facing terms increased release by 2.00 W m−2 and reduced it by 2.09 W m−2. Above the crowns, reduced sensible heat release was mainly associated with a smaller wall–air temperature difference.
Figure 9.
H20 G0–G2 sensible heat reduction decomposed into heat-transfer coefficient and wall–air temperature-difference terms. Diamonds show their sum; negative values indicate increased heat release. Values are daytime (08:00–18:00), area-weighted means over the central 72 m.
Absolute lower-wall temperatures and fluxes are reported in Table 6. Tree planting generally reduced effective heat input to the H20 facades and heat conduction into the wall. The south-facing 0–3 m band was a clear exception: external heat input increased by 4.93 W m−2 and conductive heat gain by 2.46 W m−2. Within this band, warming coincided with reduced net longwave loss and a lower heat-transfer coefficient. Net longwave loss decreased from 29.19 W m−2 in G0 to 24.27 W m−2 in G2. Daytime mean shortwave flux was nearly unchanged, at 152.65 and 152.78 W m−2, respectively. The 32.7% reduction in wind speed at 1 m from the wall accompanied a smaller, 4.7% reduction in the wall heat-transfer coefficient.
Table 6.
Daytime absolute temperatures and heat fluxes for the E–W H20 0–3 m walls over the central 72 m. Negative net longwave input denotes radiative heat loss.
3.4. Near-Facade Air and Flow Patterns
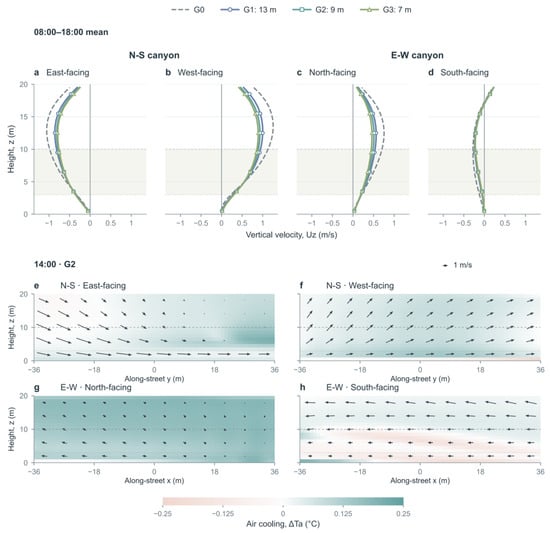
The near-facade air showed a much weaker and more asymmetric response than the wall surface. Under H20 G2, boundary-adjacent air cooled by only 0.10–0.15 °C, compared with 0.89–1.05 °C for the facades. The contrast between opposing sides was most pronounced in the E–W canyon. At 1 m from the walls, mean air cooling reached 0.112 °C beside the north-facing facade but was nearly absent beside the south-facing facade, even though the two wall surfaces cooled by similar amounts.
Tree planting consistently weakened vertical motion within the crown layer in both canyon orientations (Figure 10). Compared with G0, the G1–G3 profiles shifted toward zero on all four facade sides, while the prevailing upward or downward direction was largely maintained. Differences among the three tree spacings were relatively small compared with the contrast between the tree-free and planted cases. At 14:00, this weaker vertical motion coincided with strongly uneven near-facade cooling, particularly in the E–W canyon.
Figure 10.
H20 air response at a fixed 1 m wall offset over the central 72 m. Daytime vertical velocity profiles: (a) N–S east-facing; (b) N–S west-facing; (c) E–W north-facing; (d) E–W south-facing. At 14:00, G0–G2 air-temperature differences: (e) N–S east-facing; (f) N–S west-facing; (g) E–W north-facing; (h) E–W south-facing. Arrows show G2 wall-parallel velocity projected along the street and vertically. Shading or dashed lines mark the 3–10 m crown layer.
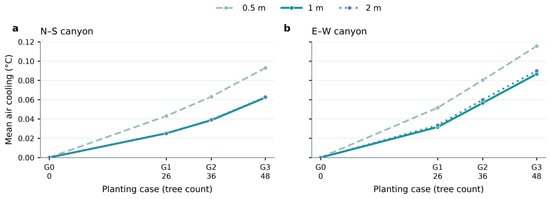
At H20, closer tree spacing increased mean near-facade air cooling at all three wall offsets in both canyon orientations (Figure 11). Across the planted cases, cooling was greater at 0.5 m than at 1 or 2 m from the wall. The 1 and 2 m responses were similar, particularly in the N–S canyon. The variation with wall distance also depended on building height (Figure S1).
Figure 11.
Tree-spacing effects on near-facade air cooling at H20. The N–S (a) and E–W (b) panels show G0–Gi air-temperature differences at 0.5, 1, and 2 m from the walls. Differences are averaged over both facade sides and the full building height. Values are daytime (08:00–18:00) means over the central 72 m.
3.5. Transverse and Longitudinal Air Temperature Distributions
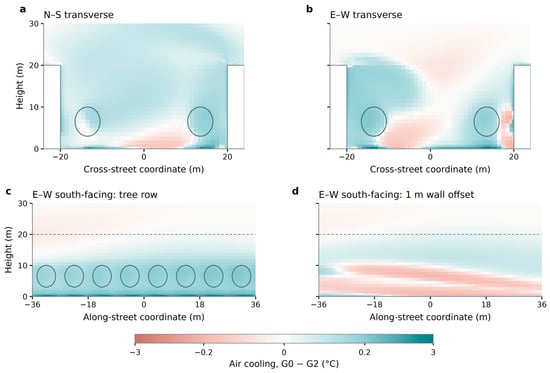
At 14:00, the G0–G2 transverse sections showed cooling around the tree rows in both canyon orientations (Figure 12a,b and Figure S2). The E–W section also contained localized warming near the lower wall despite cooling around the crowns. In the E–W south-facing longitudinal sections (Figure 12c,d), mean 0–3 m air cooling was 0.44 °C in the tree-row plane, whereas the plane 1 m from the facade warmed by 0.07 °C. Above the 10 m canopy top, the near-facade air returned to cooling. Longitudinal sections for all four facade sides are shown in Figure S3.
Figure 12.
H20 G0–G2 air-temperature sections at 14:00. Transverse sections through the central tree pair: (a) N–S; (b) E–W. E–W south-facing longitudinal sections over the central 72 m: (c) through the tree row; (d) 1 m from the facade. White blocks denote buildings, ellipses crowns, and dashed lines the 20 m roof. The shared symmetric logarithmic color scale spans ±3 °C and is linear within ±0.05 °C.
4. Discussion
4.1. Vertical Facade Cooling and Near-Wall Thermal Response
The present E–W canyon showed lower-wall warming and upper-wall cooling. Chen et al. [18] observed the opposite pattern in scaled experiments under some planting and aspect-ratio combinations, with cooling below and warming in upper canyon regions. The contrasting responses place local warming at different building levels, depending on the relative geometry of trees and buildings.
Wall temperature responds to the surface energy balance, whereas nearby air is also affected by local mixing and heat transport [37]. In Figure 12, the transition from tree-row cooling to near-wall warming illustrates how these responses can diverge over short distances. Localized vegetation cooling has also been reported in CFD simulations [38]. Field measurements show that vertical air-temperature gradients beneath trees vary with species and summer weather [39].
On the south-facing lower wall, the larger wall–air temperature difference outweighed the smaller heat-transfer coefficient, increasing sensible heat release (Section 3.3). Reduced net longwave loss accompanied the warming, while slower air near the wall coincided with weaker convective coupling. Daytime mean shortwave flux changed little, although shading could vary across wall positions and hours. Net longwave exchange includes incident radiation and temperature-dependent emission, and the heat-transfer coefficient depends on near-wall turbulence and mesh geometry. Their coupled changes therefore cannot be separated into independent percentages of warming caused by canopy trapping and wind reduction.
4.2. Effects of Tree Spacing and Building Height on Facade Performance
Closer spacing improved whole-facade cooling across the tested 7–13 m range, while lower-wall warming persisted on the E–W south-facing facade. At the fixed 9 m spacing, cooling over the lower 10 m of the facades generally increased with building height, particularly in the E–W canyon. The north-facing 0–3 m band changed from warming to cooling, while the south-facing band approached the tree-free temperature at H30. Tree size, spacing, and distance from the facades remained unchanged.
The low-wall energy budget also changed with building height (Table S2). Between H10 and H30, tree-associated shortwave reductions increased from 0.92 to 9.42 W m−2 on the north-facing 0–3 m wall and from 1.57 to 6.86 W m−2 on the south-facing wall. The corresponding increases in net longwave input weakened from 7.26 to 2.11 W m−2 and from 6.80 to 0.67 W m−2. Effective external input increased in G2 at H10 but decreased at H30 on both walls. This shift in heat input accompanied the stronger lower-wall cooling in the taller canyon.
As building height increased from 10 to 30 m, the canopy-to-building-height ratio decreased from 1.0 to 0.33, and H/W increased from 0.25 to 0.75. These geometric changes influence solar exposure and airflow within street canyons [16,18]. Taller buildings also added a facade area farther above the canopy. With 30 m buildings, cooling remained relatively strong over the lower 10 m of the facades but weakened toward the 20–30 m band. The full-height mean was therefore lower than the cooling calculated over the lower 10 m.
Facade details can modify local radiation and convection. Surface texture changes near-wall momentum and heat transfer, while balconies and window recesses add self-shading and alter radiative exposure. Kahsay et al. [40] found that facade appurtenances changed local and surface-averaged heat-transfer coefficients, depending on their form and wind direction. In street-canyon LES, Zheng et al. [41] found that windward balconies obstructed airflow into the lower canyon. Architectural shade could overlap with tree shade, reducing the additional shading from trees, while sheltered recesses could respond differently from exposed walls. Glazing would also change surface properties and heat transmission (Section 4.3).
Across the tested configurations, closer tree spacing favored whole-facade cooling. Increasing building height at fixed spacing also increased cooling over the lower 10 m, most clearly in E–W streets. For lower-floor interventions, this height dependence matters: the south-facing wall retained local warming in the H20 spacing comparison, even where whole-facade cooling improved.
4.3. Limitations
The simulations cover idealized parallel-building canyons with H/W ratios of 0.25–0.75, fixed tree size, and vegetation properties. Application to deeper canyons with H/W ≥ 1 or other building and vegetation forms requires further evaluation. Seasonal changes in canopy transmissivity [42] and variation in transpiration with soil moisture and local weather [43] could alter the magnitude and vertical distribution of cooling. Uniform leaf area density omits foliage layering and gaps associated with within-crown clumping. These features alter radiation penetration [44], so the approximation may overestimate shading along some solar paths and underestimate it along others. Leaf area density and canopy structure were not varied in this study, leaving their influence on the lower-wall response unquantified.
The single summer design day and fixed ESE wind constrain the climatic applicability of the findings. The N–S and E–W comparison combines solar exposure with relative wind incidence, which affects facade heat-transfer coefficients [30]. Other wind directions and solar trajectories could shift the magnitude, timing, and location of warming and change the relative performance of the orientations. The analysis covers 08:00–18:00; nighttime cooling and overnight heat release were not evaluated.
The quasi-steady RANS fields represent mean flow and heat exchange, with intermittent thermal plumes and turbulent fluctuations unresolved. Time-resolved calculations are needed to assess how these processes affect mean and peak wall–air heat exchange.
The fixed indoor temperature of 28 °C omits daily changes in room temperature and building operation. Different indoor temperatures would alter conduction through the wall and could affect exterior temperature and sensible heat release, including their tree-induced differences. The opaque-wall model also excludes the solar transmission and thermal response of glazing. The reported fluxes apply to the simulated opaque walls; effects of indoor temperature and window-to-wall ratio require separate evaluation.
The mesh comparisons cover one planted configuration at three times. Paired G0/G2 tests across building heights would be needed to quantify uncertainty in the small local differences and in the heat-flux decomposition. Responses near 0.10–0.14 °C are therefore treated as near-neutral outcomes, with their sign unresolved by the present tests. The Angers comparison evaluates wall temperature, while local heat-transfer coefficients and sensible heat fluxes remain without direct measurement validation.
Building height was varied only at 9 m tree spacing. This comparison changes H/W and canopy-to-roof geometry together, so it describes the combined effect of taller surroundings at fixed street width and tree geometry. Interactions with other spacings remain unexplored. The analysis addresses exterior facade temperature and wall–air heat exchange, with indoor thermal conditions and building energy demand outside its scope.
5. Conclusions
Street-tree cooling has been studied mainly near pedestrian levels, while its vertical effect on adjacent building facades remains less clear. This study used an urban microclimate modelling framework implemented in OpenFOAM to examine how tree spacing and building height shape this vertical response. With 20 m buildings and 9 m spacing, opposing facades showed similar daytime whole-facade cooling, ranging from 0.89 to 1.05 °C across the four facades. Cooling extended above the canopy, but the south-facing 0–3 m wall in the east–west canyon warmed by 0.67 °C.
Under the prescribed design-day forcing, closer tree spacing strengthened whole-facade cooling and reduced sensible heat release from the 20 m buildings. Reducing spacing from 13 to 7 m increased mean cooling from 0.63–0.70 °C to 1.08–1.30 °C, while warming persisted on the south-facing lower wall. At 9 m spacing, taller buildings generally enhanced cooling over the lower 10 m of the facades, particularly in the east–west canyon. The north-facing 0–3 m band changed from 0.70 °C warming to 0.49 °C cooling, while the south-facing band approached a near-neutral response.
On the south-facing lower wall examined in Section 3.3, the larger wall–air temperature difference outweighed the decrease in the heat-transfer coefficient, increasing sensible heat release. Cooling around the tree rows coexisted with warmer air closer to this wall. Closer spacing supports whole-facade cooling, and the height comparison suggests greater cooling over the lower 10 m in taller canyons, particularly in E–W streets.
Supplementary Materials
The following supporting information can be downloaded at: https://www.mdpi.com/article/10.3390/buildings16214343/s1, Figure S1: Near-facade air cooling across wall distance and building height; Figure S2: Transverse air-temperature differences through trees and the intervening gap; Figure S3: Longitudinal air-temperature differences beside all four facades; Table S1: Lower-wall mesh comparison; Table S2: Lower-wall energy-budget changes across building heights; Table S3–S7: Absolute facade temperatures and heat exchange, tree-spacing and building-height comparisons, sensible heat decomposition, and hourly lower-wall cooling.
Funding
This research was funded by the MOE (Ministry of Education in China) Project of Humanities and Social Sciences (grant No. 24YJCZH478), the Basic Research Program of Jiangsu Province (grant No. BK20250723), and the National Natural Science Foundation of China (grant No. 52508065).
Data Availability Statement
Key numerical results are provided in Tables S1–S7 of the Supplementary Materials. Further inquiries about the data and analysis can be directed to the corresponding author.
Conflicts of Interest
The author declares that there are no known competing financial interests or personal relationships that could have appeared to influence the work reported in this paper. The funders had no role in the design of the study; in the collection, analyses, or interpretation of data; in the writing of the manuscript; or in the decision to publish the results.
References
- IPCC. Summary for Policymakers. In Climate Change 2021: The Physical Science Basis. Contribution of Working Group I to the Sixth Assessment Report of the Intergovernmental Panel on Climate Change; Masson-Delmotte, V., Zhai, P., Pirani, A., Connors, S.L., Péan, C., Berger, S., Caud, N., Chen, Y., Goldfarb, L., Gomis, M.I., et al., Eds.; Cambridge University Press: Cambridge, UK; New York, NY, USA, 2021; pp. 3–32. [Google Scholar] [CrossRef] [Scilit]
- Vicedo-Cabrera, A.M.; Scovronick, N.; Sera, F.; Royé, D.; Schneider, R.; Tobias, A.; Astrom, C.; Guo, Y.; Honda, Y.; Hondula, D.M.; et al. The burden of heat-related mortality attributable to recent human-induced climate change. Nat. Clim. Change 2021, 11, 492–500. [Google Scholar] [CrossRef] [Scilit] [PubMed]
- Santamouris, M. On the energy impact of urban heat island and global warming on buildings. Energy Build. 2014, 82, 100–113. [Google Scholar] [CrossRef] [Scilit]
- Li, X.; Zhou, Y.; Yu, S.; Jia, G.; Li, H.; Li, W. Urban heat island impacts on building energy consumption: A review of approaches and findings. Energy 2019, 174, 407–419. [Google Scholar] [CrossRef] [Scilit]
- Bowler, D.E.; Buyung-Ali, L.; Knight, T.M.; Pullin, A.S. Urban greening to cool towns and cities: A systematic review of the empirical evidence. Landsc. Urban Plan. 2010, 97, 147–155. [Google Scholar] [CrossRef] [Scilit]
- Meili, N.; Manoli, G.; Burlando, P.; Carmeliet, J.; Chow, W.T.L.; Coutts, A.M.; Roth, M.; Velasco, E.; Vivoni, E.R.; Fatichi, S. Tree effects on urban microclimate: Diurnal, seasonal, and climatic temperature differences explained by separating radiation, evapotranspiration, and roughness effects. Urban For. Urban Green. 2021, 58, 126970. [Google Scholar] [CrossRef] [Scilit]
- Alonzo, M.; Ibsen, P.C.; Locke, D.H. Urban Trees and Cooling: A Review of the Recent Literature (2018 to 2024). Arboric. Urban For. 2025, 51, 420–444. [Google Scholar] [CrossRef] [Scilit]
- Wang, Y.; Bakker, F.; de Groot, R.; Wortche, H.; Leemans, R. Effects of urban trees on local outdoor microclimate: Synthesizing field measurements by numerical modelling. Urban Ecosyst. 2015, 18, 1305–1331. [Google Scholar] [CrossRef] [Scilit]
- Shahidan, M.F.; Jones, P.J.; Gwilliam, J.; Salleh, E. An evaluation of outdoor and building environment cooling achieved through combination modification of trees with ground materials. Build. Environ. 2012, 58, 245–257. [Google Scholar] [CrossRef] [Scilit]
- Tsoka, S.; Leduc, T.; Rodler, A. Assessing the effects of urban street trees on building cooling energy needs: The role of foliage density and planting pattern. Sustain. Cities Soc. 2021, 65, 102633. [Google Scholar] [CrossRef] [Scilit]
- Yang, C.; Xie, M.; Mendis, T. Evaluating the role of urban trees on building energy use: A global literature review. Landsc. Urban Plan. 2025, 264, 105475. [Google Scholar] [CrossRef] [Scilit]
- Meili, N.; Zheng, X.; Takane, Y.; Nakajima, K.; Yamaguchi, K.; Chi, D.; Zhu, Y.; Wang, J.; Qiu, Y.; Paschalis, A.; et al. Modeling the Effect of Trees on Energy Demand for Indoor Cooling and Dehumidification Across Cities and Climates. J. Adv. Model. Earth Syst. 2025, 17, e2024MS004590. [Google Scholar] [CrossRef] [Scilit]
- Grylls, T.; van Reeuwijk, M. Tree model with drag, transpiration, shading and deposition: Identification of cooling regimes and large-eddy simulation. Agric. For. Meteorol. 2021, 298–299, 108288. [Google Scholar] [CrossRef] [Scilit]
- Řezníček, H.; Geletič, J.; Belda, M.; Beneš, L.; Bureš, M.; Eben, K.; Fuka, V.; Krč, P.; Michálek, P.; Patiño, W.; et al. Analysis of the complex role of trees in street canyons using a large-eddy simulation model. Q. J. R. Meteorol. Soc. 2025, 151, e4954. [Google Scholar] [CrossRef] [Scilit]
- Oke, T.R. Street design and urban canopy layer climate. Energy Build. 1988, 11, 103–113. [Google Scholar] [CrossRef] [Scilit]
- Hang, J.; Wang, D.; Zeng, L.; Ren, L.; Shi, Y.; Zhang, X. Scaled outdoor experimental investigation of thermal environment and surface energy balance in deep and shallow street canyons under various sky conditions. Build. Environ. 2022, 225, 109618. [Google Scholar] [CrossRef] [Scilit]
- Shashua-Bar, L.; Hoffman, M.E. Geometry and orientation aspects in passive cooling of canyon streets with trees. Energy Build. 2003, 35, 61–68. [Google Scholar] [CrossRef] [Scilit]
- Chen, T.; Yang, H.; Chen, G.; Lam, C.K.C.; Hang, J.; Wang, X.; Liu, Y.; Ling, H. Integrated impacts of tree planting and aspect ratios on thermal environment in street canyons by scaled outdoor experiments. Sci. Total Environ. 2021, 764, 142920. [Google Scholar] [CrossRef] [Scilit] [PubMed]
- Chen, T.; Meili, N.; Fatichi, S.; Hang, J.; Tan, P.Y.; Yuan, C. Effects of tree plantings with varying street aspect ratios on the thermal environment using a mechanistic urban canopy model. Build. Environ. 2023, 246, 111006. [Google Scholar] [CrossRef] [Scilit]
- Morakinyo, T.E.; Lam, Y.F. Simulation study on the impact of tree-configuration, planting pattern and wind condition on street-canyon’s micro-climate and thermal comfort. Build. Environ. 2016, 103, 262–275. [Google Scholar] [CrossRef] [Scilit]
- Papadakis, G.; Tsamis, P.; Kyritsis, S. An experimental investigation of the effect of shading with plants for solar control of buildings. Energy Build. 2001, 33, 831–836. [Google Scholar] [CrossRef] [Scilit]
- Berry, R.; Livesley, S.J.; Aye, L. Tree canopy shade impacts on solar irradiance received by building walls and their surface temperature. Build. Environ. 2013, 69, 91–100. [Google Scholar] [CrossRef] [Scilit]
- Morakinyo, T.E.; Balogun, A.A.; Adegun, O.B. Comparing the effect of trees on thermal conditions of two typical urban buildings. Urban Clim. 2013, 3, 76–93. [Google Scholar] [CrossRef] [Scilit]
- Heisler, G.M. Effects of individual trees on the solar radiation climate of small buildings. Urban Ecol. 1986, 9, 337–359. [Google Scholar] [CrossRef] [Scilit]
- Zielonko-Jung, K.; Janiak, J. Trees as a solar control measure for southern-oriented street frontages. Analysis of a selected street model for a humid continental climate. Urban Ecosyst. 2022, 25, 111–119. [Google Scholar] [CrossRef] [Scilit]
- Zhao, Q.; Yang, J.; Wang, Z.-H.; Wentz, E. Assessing the Cooling Benefits of Tree Shade by an Outdoor Urban Physical Scale Model at Tempe, AZ. Urban Sci. 2018, 2, 4. [Google Scholar] [CrossRef] [Scilit]
- Deng, L.; Wu, J.; Guo, Y.; Wang, W.; Jiang, F.; Li, X. Virtual wall: Numerical model on interaction between trees and building façade to quantify heat exchange and microclimate in urban context. Urban Clim. 2024, 56, 102001. [Google Scholar] [CrossRef] [Scilit]
- Saneinejad, S.; Moonen, P.; Defraeye, T.; Carmeliet, J. Analysis of convective heat and mass transfer at the vertical walls of a street canyon. J. Wind Eng. Ind. Aerodyn. 2011, 99, 424–433. [Google Scholar] [CrossRef] [Scilit]
- Allegrini, J.; Dorer, V.; Carmeliet, J. Analysis of convective heat transfer at building façades in street canyons and its influence on the predictions of space cooling demand in buildings. J. Wind Eng. Ind. Aerodyn. 2012, 104–106, 464–473. [Google Scholar] [CrossRef] [Scilit]
- Ma, H.; Zhou, X. Analysis of forced convective heat transfer at the facades of street canyon: Effect of wind direction and tree planting. Energy Build. 2025, 344, 115918. [Google Scholar] [CrossRef] [Scilit]
- Kubilay, A.; Derome, D.; Carmeliet, J. Coupling of physical phenomena in urban microclimate: A model integrating air flow, wind-driven rain, radiation and transport in building materials. Urban Clim. 2018, 24, 398–418. [Google Scholar] [CrossRef] [Scilit]
- Zhu, S.; Si, B.; Lv, N.; Shi, X.; Qiu, B. Local cooling, thermal comfort, and street-canyon spillover from corner green spaces at urban intersections using CFD simulation. Build. Environ. 2026, 305, 115280. [Google Scholar] [CrossRef] [Scilit]
- Shih, T.-H.; Liou, W.W.; Shabbir, A.; Yang, Z.; Zhu, J. A new k–ε eddy viscosity model for high Reynolds number turbulent flows. Comput. Fluids 1995, 24, 227–238. [Google Scholar] [CrossRef] [Scilit]
- Buccolieri, R.; Santiago, J.-L.; Rivas, E.; Sanchez, B. Review on urban tree modelling in CFD simulations: Aerodynamic, deposition and thermal effects. Urban For. Urban Green. 2018, 31, 212–220. [Google Scholar] [CrossRef] [Scilit]
- Manickathan, L.; Defraeye, T.; Allegrini, J.; Derome, D.; Carmeliet, J. Parametric study of the influence of environmental factors and tree properties on the transpirative cooling effect of trees. Agric. For. Meteorol. 2018, 248, 259–274. [Google Scholar] [CrossRef] [Scilit]
- Herpin, S.; Mballo, S.; Manteau, M.; Lemesle, D.; Boukouya, A.; Dubuc, B.; Ledroit, L.; Cannavo, P.; Demotes-Mainard, S.; Bournet, P.-E. A reduced-scale canyon street to study tree climate benefits: Summer 2020 data with well-watered apple trees. Sci. Data 2024, 11, 1015. [Google Scholar] [CrossRef] [Scilit] [PubMed]
- Offerle, B.; Eliasson, I.; Grimmond, C.S.B.; Holmer, B. Surface heating in relation to air temperature, wind and turbulence in an urban street canyon. Bound.-Layer Meteorol. 2007, 122, 273–292. [Google Scholar] [CrossRef] [Scilit]
- Gromke, C.; Blocken, B.; Janssen, W.; Merema, B.; van Hooff, T.; Timmermans, H. CFD analysis of transpirational cooling by vegetation: Case study for specific meteorological conditions during a heat wave in Arnhem, Netherlands. Build. Environ. 2015, 83, 11–26. [Google Scholar] [CrossRef] [Scilit]
- Rahman, M.A.; Moser, A.; Gold, A.; Rötzer, T.; Pauleit, S. Vertical air temperature gradients under the shade of two contrasting urban tree species during different types of summer days. Sci. Total Environ. 2018, 633, 100–111. [Google Scholar] [CrossRef] [Scilit] [PubMed]
- Kahsay, M.T.; Bitsuamlak, G.T.; Tariku, F. CFD simulation of external CHTC on a high-rise building with and without façade appurtenances. Build. Environ. 2019, 165, 106350. [Google Scholar] [CrossRef] [Scilit]
- Zheng, X.; Montazeri, H.; Blocken, B. Impact of building façade geometrical details on pollutant dispersion in street canyons. Build. Environ. 2022, 212, 108746. [Google Scholar] [CrossRef] [Scilit]
- Konarska, J.; Lindberg, F.; Larsson, A.; Thorsson, S.; Holmer, B. Transmissivity of solar radiation through crowns of single urban trees—Application for outdoor thermal comfort modelling. Theor. Appl. Climatol. 2014, 117, 363–376. [Google Scholar] [CrossRef] [Scilit]
- Rahman, M.A.; Moser, A.; Rötzer, T.; Pauleit, S. Microclimatic differences and their influence on transpirational cooling of Tilia cordata in two contrasting street canyons in Munich, Germany. Agric. For. Meteorol. 2017, 232, 443–456. [Google Scholar] [CrossRef] [Scilit]
- Stenberg, P.; Mõttus, M.; Rautiainen, M.; Sievänen, R. Quantitative characterization of clumping in Scots pine crowns. Ann. Bot. 2014, 114, 689–694. [Google Scholar] [CrossRef] [Scilit] [PubMed]

Disclaimer/Publisher’s Note: The statements, opinions and data contained in all publications are solely those of the individual author(s) and contributor(s) and not of MDPI and/or the editor(s). MDPI and/or the editor(s) disclaim responsibility for any injury to people or property resulting from any ideas, methods, instructions or products referred to in the content. |
© 2026 by the author. Licensee MDPI, Basel, Switzerland. This article is an open access article distributed under the terms and conditions of the Creative Commons Attribution (CC BY) license.