


Abstract
Examining energy-related issues and comfort conditions in residential buildings is essential for achieving sustainable development. Accordingly, this study aims to optimize building envelope design parameters—including air-tightness values derived from empirical measurements—to strike a balance between energy consumption, thermal comfort, and visual comfort. A multi-stage, systematic methodology is proposed, featuring a hybrid artificial intelligence-based framework for prediction and optimization, grounded in building performance simulations. A BlowerDoor test was conducted on the residential building under study, and the results were integrated into a building performance model. Data generated through these simulations were used to compare the performance of various machine learning meta-models, including Artificial Neural Networks, Support Vector Regression (SVR), and XGBoost. The SVR model, which demonstrated the lowest error rate and highest reliability across most objectives, was selected as the meta-model for the optimization phase. This model served as the objective function for a multi-objective optimization process carried out using the Non-dominated Sorting Genetic Algorithm II (NSGA-II). The results of this surrogate-model-based optimization indicate a 21.69% reduction in energy consumption, alongside improvements of 17.2% in visual comfort and 20% in thermal comfort compared to the baseline state. Furthermore, the analysis reveals that air-tightness influences daylighting performance through its interaction with other parameters, such as the Window-to-Wall Ratio (WWR) and building orientation. Finally, the SHapley Additive exPlanations (SHAP) method was employed to determine the relative importance of the design parameters following the multi-objective optimization. The analysis results indicate that the order of influence of various parameters differs depending on the specific objective. While the window-to-wall ratio (WWR) and orientation are the primary factors for enhancing visual comfort, factors such as orientation, infiltration, and the thermal transmittance of building components are the most significant for improving energy efficiency and thermal comfort. Consequently, the integration of data-driven approaches—based on surrogate models—into building performance assessment can contribute significantly to the sustainability of residential buildings and offer a new research framework for future studies.
1. Introduction
The building sector accounts for a significant share of total energy consumption. Current regulatory standards mandate the design of buildings that are as energy-efficient as possible [1]. Energy demand in buildings has become a major concern within the construction sector, particularly in recent years. Europe aims to achieve climate neutrality by 2050. Energy production and use account for more than 75% of greenhouse gas (GHG) emissions in the European Union. Furthermore, the European Energy Performance of Buildings Directive (EPBD) aims to achieve a highly efficient and decarbonized building stock, recognizing that approximately 50% of final energy consumption is used for heating and cooling [2].
High-efficiency buildings feature well-insulated envelopes, minimized thermal bridges, and improved construction quality. High airtightness, in particular, is one of the most critical physical characteristics of high-performance buildings. Consequently, factors such as airtightness are becoming increasingly important regarding energy demand [3]. In the 1970s, as energy efficiency gained prominence, various measures were implemented to reduce air infiltration and leakage. Many countries established limits for airtightness values within their national regulations. The most widely used parameter for measuring airtightness is the air change rate per hour at a pressure difference of 50 Pa between the indoor and outdoor environments; this parameter is typically determined based on factors such as the ventilation strategy or building type [4]. Buildings are not highly airtight, a situation that creates challenges regarding energy efficiency and indoor air quality. Air infiltration is the entry of outdoor air through cracks in the building envelope or other openings, such as open windows and exterior doors [5]. If air tightness—or conversely, air leakage—is not properly controlled, it leads to high energy consumption for space heating and cooling [6,7].
Previous studies on air leakage have largely focused on buildings with standard layouts, such as residences, offices, and classrooms [8]. Literature indicates that air tightness has the most significant impact on energy consumption in cold climate regions. Its high impact in cold climates reflects the fact that heating energy consumption is relatively higher than cooling energy consumption. Furthermore, previous studies have estimated the energy impact of leakage on heating demand in temperate climate regions to be between 2 and 20 kWh/(m2·yr) [9]. Poza–Casado et al. [9] investigated the impact of uncontrolled airflow through the building envelope on the energy consumption of residential buildings in Spain. They determined that leakage had an energy impact ranging from 2.43 to 19.07 kWh/(m2·yr) regarding heating demand, whereas its impact on cooling demand was less significant.
Various simulation methods are employed to estimate the impact of air leakage on building energy consumption. Bhandari et al. [10] developed an approach based on a simple regression model for hourly leakage calculations. It was observed that when the proposed method was used, the energy savings rate for retrofitted buildings fell within 5% of the estimates obtained from an online calculator. Vera Alves et al. [3] compared four different approaches regarding air tightness using the TRNSYS energy simulation tool. The difference in estimated energy consumption among the models was found to range from 6.1% to 12.2%. In another study, Ren et al. [11] developed three different infiltration models to evaluate improvements in air infiltration modeling for residential energy efficiency. The study, which assessed eight residences, reveals differences of up to 37% in calculated average infiltration rates and up to 13% in modeled heating and cooling energy demand among these three models. Ren et al. [12] developed an integrated airflow model for AccuRate, a residential energy efficiency rating tool. The model proposed in the study confirms that infiltration rates in 10 houses could be reduced by an average of 52% by sealing major air leakage paths, resulting in an average 7% reduction in heating and cooling loads. Liu et al. [13] analyzed the impact of increased building airtightness on energy consumption and indoor temperature. Simulation results indicate that as the airtightness level improves during summer months, indoor temperature rises, while comfort levels decrease and air conditioning loads increase. These results confirm that air tightness significantly affects not only energy consumption [14] but also changes in indoor air quality [15,16] and occupant comfort [17,18].
Since the airtightness of the building envelope plays a significant role in indoor air quality (IAQ), it can help reduce the infiltration of outdoor pollutants such as PM2.5 [19,20], as well as mitigate CO2 accumulation and thermal discomfort in spaces lacking adequate mechanical ventilation [21]. Exposure to various air pollutants can pose serious health risks to building occupants. Furthermore, poor indoor air quality leads to respiratory symptoms, asthma exacerbations, and issues regarding occupant focus and attention [22]. In this context, the airtightness of the building envelope plays a pivotal role in determining indoor environmental conditions. Overall, ensuring the airtightness of the building envelope is crucial for occupant health and comfort, the effective performance of ventilation systems, and building energy efficiency.
In recent years, multi-objective optimization approaches—which evaluate the combined effects of building envelope design decisions on energy consumption, thermal comfort, and visual comfort—have gained increasing importance. In this context, the integration of machine learning-based surrogate models with simulation tools and optimization algorithms enables the generation of a larger number of design alternatives at a lower computational cost. Wu et al. [23] investigated the impacts of window and shading systems in office buildings on energy consumption, as well as visual and thermal comfort performance, using an evolutionary-based multi-objective optimization method. To quantify the influence of design parameters on optimization objectives, they combined machine learning models with SHapley Additive exPlanations (SHAP) analysis. The proposed method significantly improved energy consumption, thermal performance, and visual performance. Duan et al. [24] proposed a machine learning-based multi-objective optimization framework for the integrated design of windows and photovoltaic (PV) louvers in office buildings located in cold climates. They utilized a machine learning-based multi-objective optimization approach to optimize daylighting, net energy use intensity, and the percentage of thermal discomfort. Through SHapley Additive exPlanations (SHAP) analysis, they identified the relative importance of design parameters with respect to these performance metrics. Hosamo et al. [25] proposed a system that integrates Building Information Modeling (BIM), machine learning, and the NSGA-II algorithm to examine the impact of building envelope design parameters on energy consumption and to determine an optimal design. In another study, Duan et al. [26] presented a data-driven framework—based on XGBoost, SHAP, and NSGA-II—to examine the relationship between building envelope design parameters and performance objectives, specifically energy, thermal comfort, and daylighting, in residential buildings. In the multi-objective optimization conducted as part of this study, economic criteria were also evaluated alongside the other objectives.
The reviewed studies demonstrate the application of data-driven optimization approaches to address challenges related to building performance. However, existing research primarily focuses on design variables such as window geometry, facade-integrated shading elements, or the thermal properties of the building envelope. The integration of on-site measured air-tightness data with other building envelope parameters—and the subsequent analysis of its impact on energy consumption, thermal comfort, and visual comfort within a unified optimization framework—remains an under-researched area. The primary objective of this study is to develop a data-driven, multi-objective optimization framework that integrates on-site measured air-tightness data with other building envelope design parameters to balance energy consumption, thermal comfort, and visual comfort performance. To enhance the reliability of the model, a Blower Door Test (BDT) was conducted on a north-oriented residential building in Balıkesir, and the results were integrated into the building performance model. The methodology employed includes three distinct machine learning models, a surrogate model based on the Non-Dominated Sorting Genetic Algorithm II (NSGA-II) metaheuristic, and SHAP analysis to evaluate energy efficiency, thermal comfort, and visual comfort.
The study is structured as follows: Section 1 provides an overview of the context and background of the research. Section 2 details the general framework and implementation steps of the integrated methodology proposed in the study. Section 3 presents a comprehensive analysis and discussion of the findings. Section 4 summarizes the overall conclusions and offers recommendations for future research.
2. Materials and Methods
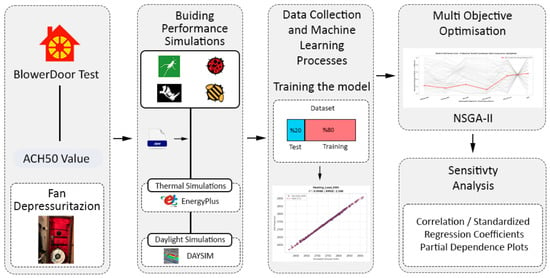
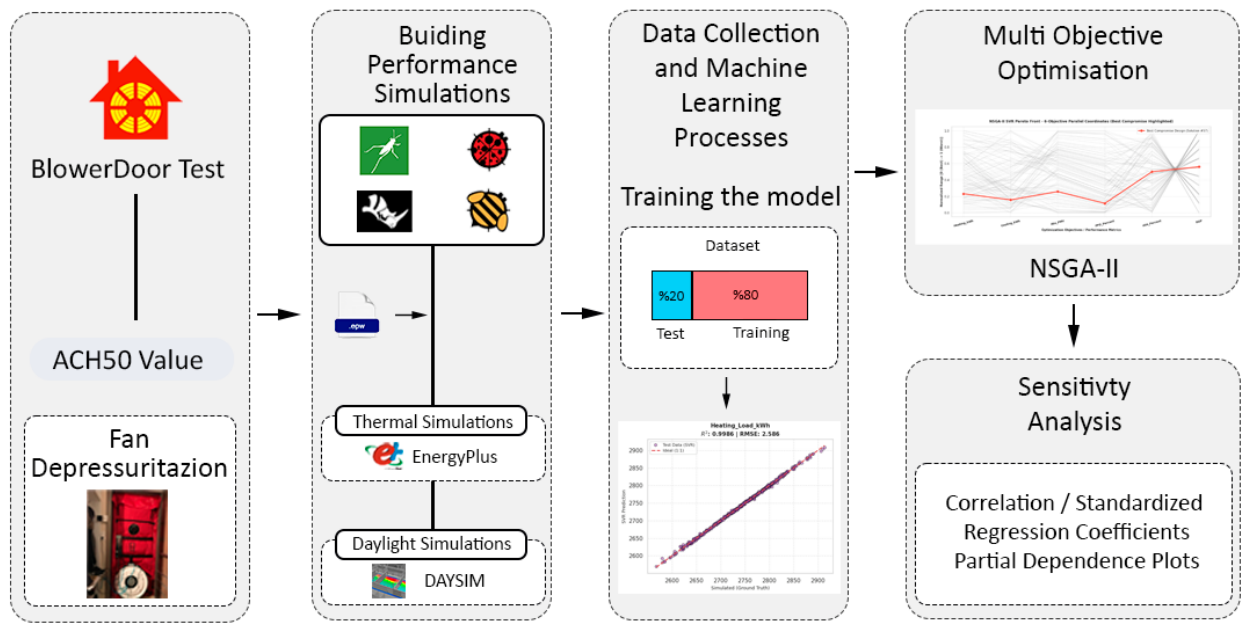
This study developed a multi-stage, systematic method to optimize the energy performance, as well as the visual and thermal comfort, of an existing residential building (Figure 1). The research focuses on a north-facing, single-occupancy residence located in Balıkesir. The first stage of the study involved determining the geometric and structural characteristics of the residence. In the second stage, a Blower Door test was conducted to assess the residence’s existing airtightness and to incorporate the results into a parametric energy model. Based on the Blower Door test, the airtightness performance was quantified as the air exchange rate (ACH50)—expressed in air changes per hour (h−1)—at a pressure difference of 50 Pascals. Parametric modeling of the residence was performed using Rhino/Grasshopper. This model was integrated into a Python environment, and building performance simulations were conducted based on the measured airtightness. To reduce the computational cost of optimization, an SVM-based surrogate model was created, and a Multi-Objective Optimization (MOO) process was executed. Furthermore, the relative impact of each parameter on energy consumption, thermal comfort, and visual comfort objectives was evaluated and compared using a feature selection algorithm (SHAP). The performance indicators employed in this study were selected to provide an integrated assessment of how building envelope design parameters influence energy efficiency and indoor environmental quality. Existing literature indicates that airtightness is a significant parameter affecting both energy consumption and indoor thermal performance. Consequently, heating and cooling energy consumption were used to evaluate energy performance, while the PPD (Predicted Percentage of Dissatisfied) and PMV (Predicted Mean Vote) metrics—developed by Fanger—were utilized to assess thermal comfort. Since parameters such as the thermal properties of building envelope components, the window-to-wall ratio, and building orientation can influence not only energy consumption and thermal comfort but also daylight availability and glare conditions, visual comfort performance was incorporated as an objective within the multi-objective optimization problem. Thus, the relevant indicators were evaluated collectively to strike a balance between competing objectives—aiming to reduce energy consumption while ensuring that thermal and visual performance are not compromised.
Figure 1.
Methodological flowchart of the study.
Table 1 presents the pseudocode for the proposed multi-stage, multi-objective optimization method. The pseudocode outlines the fundamental algorithmic steps, enabling researchers to understand processes such as modeling, simulation, and programming. It shares common characteristics with standard programming languages and is designed to facilitate easy reading of the algorithm by researchers [27].
Table 1.
The specific steps of the surogate model.
2.1. Climate of Balikesir and the Building Envelope
The study was conducted in Balıkesir, located in northwestern Türkiye, a region characterized by a mix of Mediterranean and continental climate features. The average annual temperature in Balıkesir is 14.9 °C, with a temperature of 4.8 °C during the coldest month. The highest temperature recorded was 43.2 °C in July. In this region, where winters are cold and summers are hot, the energy demand for heating and cooling is high [28]. Therefore, the performance of the building envelope in the region was evaluated as part of the study. In this study, we integrated the Typical Meteorological Year (TMY)-based EPW file, utilizing Balıkesir’s 2025 climate data, into Ladybug for energy simulations.
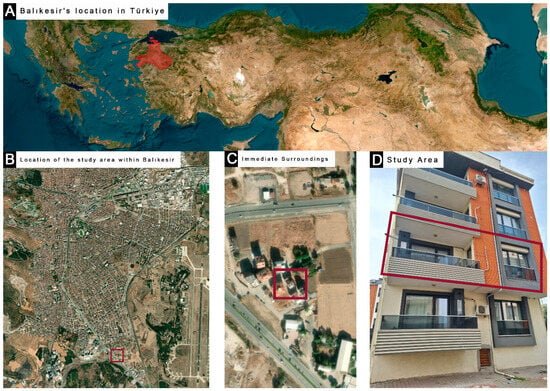
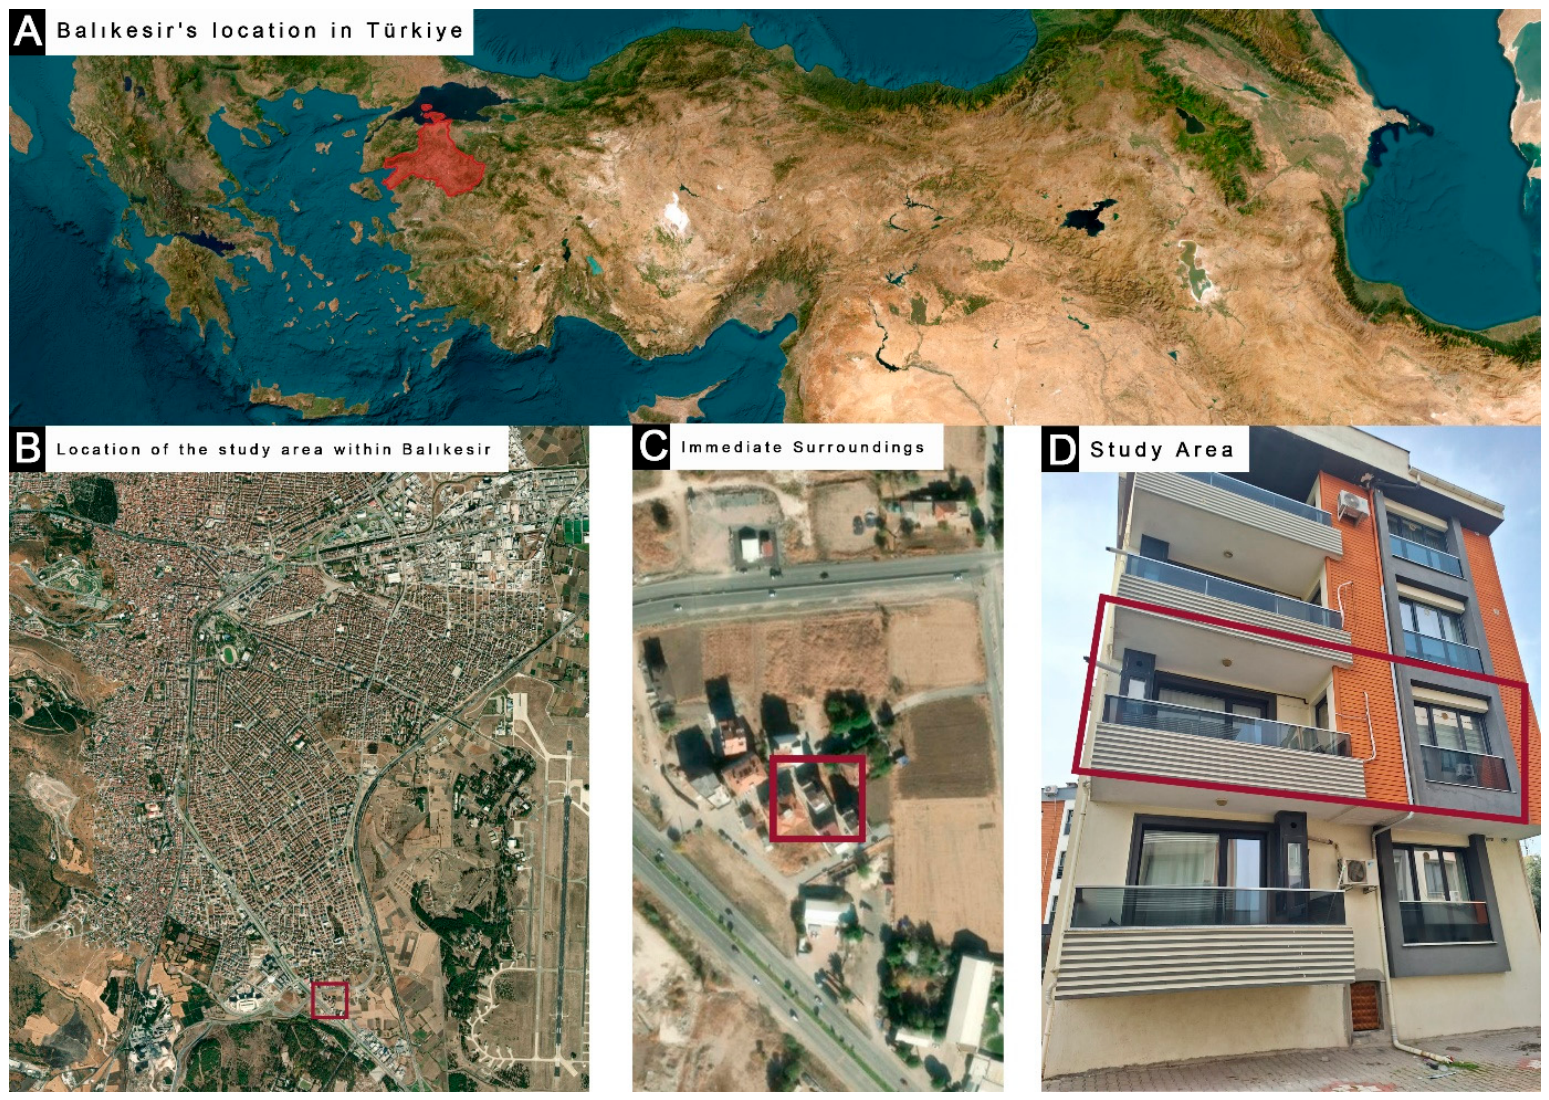
We conducted the field study in a north-facing apartment of a 4-story residential building in an urban development area in Balıkesir, surrounded by a few other buildings. The reason for this was to minimize the environmental impact on the apartment. The apartment in question is on the 2nd floor of an apartment building with multiple units per floor, and it has a usable area of 40 m2. While preparing the energy model of the apartment, we preserved the geometry and building envelope characteristics. Figure 2 shows the location (a) and the exterior view (b) of the apartment. Table 2 compiles information about the apartment.
Figure 2.
The building examined within the scope of the study and its details.
Table 2.
Properties of apartment.
2.2. BlowerDoor Test
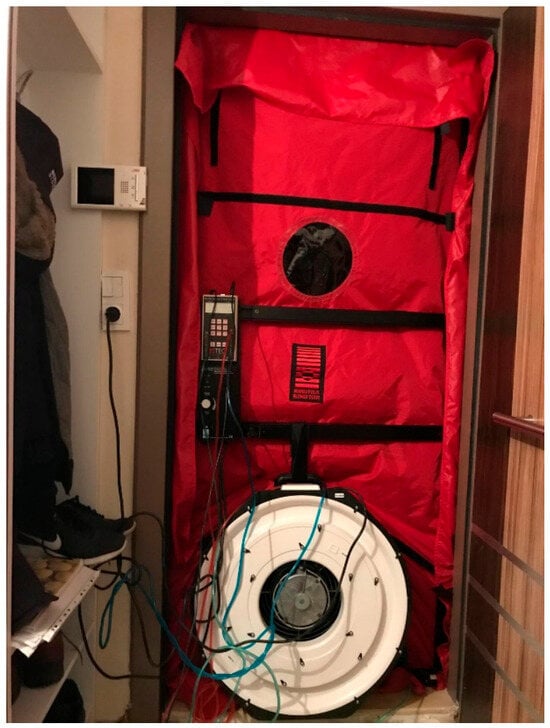
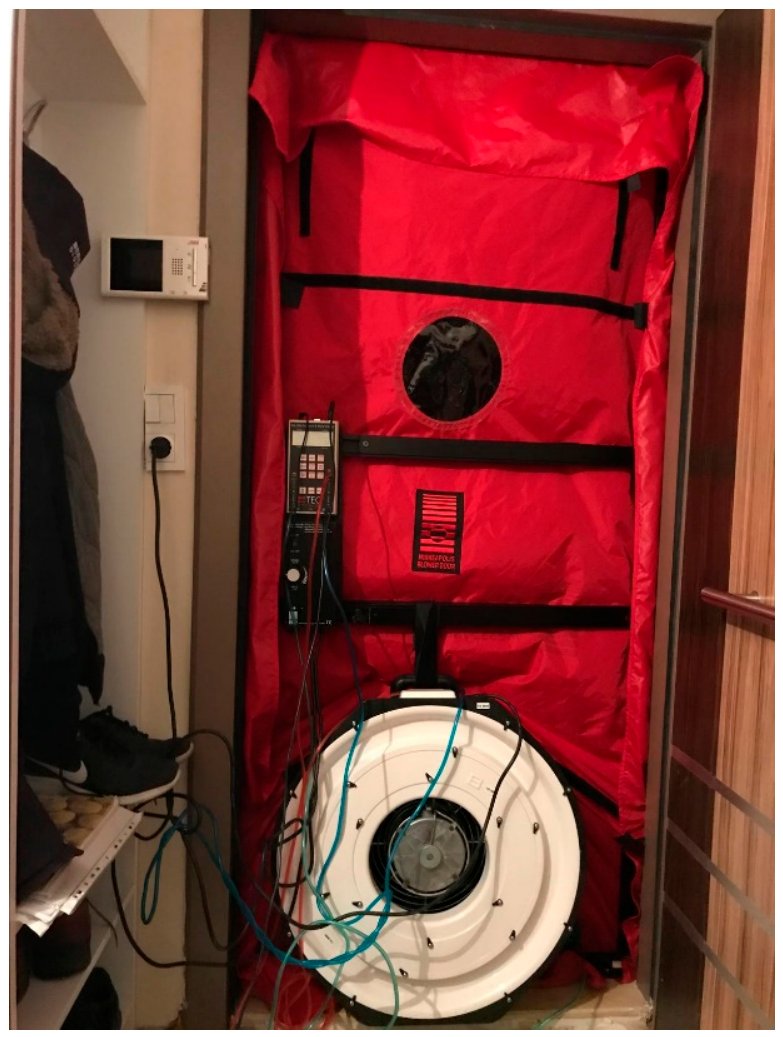
The Blower Door Test (BDT) is a method used to detect unwanted air leakage in the building envelope [29]. This method involves sealing the exterior door of the space to be tested with a membrane to prevent airflow and creating a 50 Pa pressure difference between the interior and exterior environments, thereby depressurizing the interior space [5,30,31]. The BDT procedure is based on the ASTM E779 standard [32]. According to this standard, while exterior doors, windows, and vents are closed during the BDT process, all interior doors remain open. Additionally, the dwelling’s heating system and mechanical ventilation units are deactivated during the measurement. The Energy Conservatory (TEC; Oakdale, Minnesota, USA) software records air leakage at 50 Pa pressure in terms of the air change rate per hour (h−1) [33]. Figure 3 shows an image of the BDT being performed on the dwelling.
Figure 3.
The BDT process in the residence.
The Blower Door Test (BDT) measurements yield the h−1 value, n50 (air change rate per hour), q50 (air leakage rate per unit of building envelope area), and w50 (air leakage rate per unit of usable floor area). Equations (1)–(3) formulate these values [34].
In this study, the n50 value obtained from the BDT serves as a primary input for the model. Python was used to integrate the dwelling’s n50 value into the energy simulations within the parametric model. Consequently, the energy simulation was calibrated using the dwelling’s n50 value, and its reliability was verified against field data. Furthermore, the study defined the n50 value parametrically as the airtightness parameter.
2.3. Building Simulation and Modeling
In this study, simulations for energy consumption, thermal comfort, and daylighting were conducted using a Python interface. The building components of the parametrically modeled residence were defined as shown in Table 1. Python performed the energy simulations for the residence using the EnergyPlus (version 26.2.0) engine. As a result of the EnergyPlus energy simulations, the total monthly heating and cooling loads for the residence in its current state were obtained in kWh. Equations (4) and (5) formulate the monthly heating load and cooling load, respectively.
Equation (6) formulates the total energy consumption used in the study.
QHVAC,annual = QH,annual + QC,annual
The Predicted Mean Vote (PMV) and Predicted Percentage Dissatisfied (PPD) approaches have been used to optimize thermal comfort. Fanger defined the PMV scale as ranging from cold (value of −3) to hot (value of +3). On this scale, ideal thermal comfort conditions are achieved when the PMV value is zero. PMV and PPD values are calculated using Equation (7) and Equation (8), respectively [35,36].
where M is Metabolic rate of occupant (W/m2 the body surface area); W is mechanical power by occupant, (W/m2); fcl, (surface area of body with clothes); tcl, is Clothing surface temperature (°C); ta is temperature of air (°C); tr is Mean radiant temperature (°C); Pa is partial pressure of water vapor (Pa).
While balancing the n50 parameter, the study also conducted daylight simulations to ensure that indoor daylight performance was not compromised. Using the parametric model developed, daylight simulations were performed via the software tool DAYSIM (version 3.1). A grid with a spacing of 0.6 × 0.6 m was established within the residential unit, and daylight data were collected at the intersection points of this grid on a work plane located 0.85 m above the floor. In these annual daylight simulations, the study utilized the Spatial Daylight Autonomy (sDA) metric. sDA represents the ratio of the area within a space that receives sufficient daylight throughout the year to the total area of the space. According to the BREEAM standard, this value must be greater than 0.55. In this context, the proportion of the space on the work plane that achieves an illuminance level of 300 lx throughout the year is significant [37]. Equation (9) provides the formula for sDA. Furthermore, to address glare control, the study aimed to minimize the Daylight Glare Probability (DGP). To ensure a high level of glare protection, this metric should be kept below 0.35 [38].
Et = target illuminance level, r% = time threshold, ADAEt > r% = the area that meets the Et value for at least r% of the year, A = total analysis area.
Model validation: The EnergyPlus model was evaluated against indoor temperature and relative humidity measurements collected using HOBO data loggers (Onset Computer Corporation, Bourne, MA, USA) during two separate 15-day periods: 21 April–5 May and a second period in December. For each period, the measured values were compared with the corresponding simulation results using the coefficient of determination (R2), Mean Bias Error (MBE), and Root Mean Square Error (RMSE) [39]. The use of measurements from different periods of the year for building model evaluation has also been reported in previous studies. Roberti et al. [40] calibrated an EnergyPlus model using summer measurements and validated it using winter measurements, while Palaić et al. [41] used separate winter and summer periods for calibration and validation.
2.4. Machine Learning-Based Optimization
In the optimization process, an ML-based surrogate model was developed to reduce computational costs. Using a parametric model, 2000 distinct simulations—covering energy, thermal comfort, and daylight—were performed for selected design parameters via Python. Data generated during these performance simulations were recorded. Recently, researchers have employed hybrid models that combine surrogate models with optimization algorithms to address multi-objective optimization problems [42,43,44]. The application of surrogate models and machine learning techniques contributes significantly to the field of building performance optimization [44,45,46]. Machine learning algorithms—specifically Support Vector Machine (SVM), Artificial Neural Network (ANN), and XGBoost—were utilized to predict the outcomes based on the collected data. Subsequently, the performance of these algorithms was compared using performance metrics, cross-validation, robustness testing, and independent test datasets.
The baseline parameters for the machine learning algorithms, as well as those optimized using Optuna, are presented in Table 3. The dataset was divided into a training set and a test set, with an 80/20 split [47,48]. The datasets used in the training and testing processes of the ANN, SVR, and XGBoost algorithms are not derived from actual measured data from a real building; rather, they are obtained using the EnergyPlus simulation tool. The results concerning prediction performance do not represent the actual performance of the building itself; instead, they demonstrate the alignment of the machine learning-based models with the simulation outputs. Within the Python programming environment, the Scikit-learn library (version 1.9.1) was used for Artificial Neural Network (ANN) and Support Vector Regression (SVR) models, while the XGBoost library (version 3.4.1) was used for the Extreme Gradient Boosting (XGBoost) model. These models were implemented in the Google Colab (Python 3.12) environment on a system equipped with an Intel Core i7-8750 processor and 8 GB of RAM.
Table 3.
Model parameters used in this study.
Algorithm evaluations were conducted using Optuna for hyperparameter optimization, 5-fold cross-validation (CV) for model validation, 5-repeated 5-fold CV for robustness analysis, and R2, RMSE, and MAE as performance metrics. This approach ensured the selection of the most effective model for the non-linear regression relationship between the objective function and the design variables [49,50,51]. This regression relationship serves as the fitness function within the NSGA-II heuristic algorithm, which is employed to solve the multi-objective optimization problem. NSGA-II, an evolutionary-based algorithm, establishes a balance among the parameters selected within the scope of the study. Through its Pareto-front solutions, NSGA-II facilitates the selection process within the design space [52,53]. In this context, an SVM-based surrogate model—demonstrating the highest performance—was utilized as the objective function for NSGA-II, thereby reducing computational time.
The Identifying design variables: This study considers the interaction with the indoor visual environment while balancing architectural design parameters that affect energy consumption and the airtightness of the building envelope. The parameters related to the building envelope were selected to simultaneously evaluate thermal comfort, energy performance, and daylighting. The effective use of daylight and the control of glare within the interior space formed the basis for assessing indoor visual conditions. Consequently, indoor visual conditions were not overlooked while balancing energy performance. The architectural design parameters (Table 4) addressed in the study were selected in alignment with the established objectives.
Table 4.
Design variables and their ranges.
In a multi-objective optimization process, an objective function must be established for each optimization goal. The Support Vector Machine (SVM) algorithm is employed to estimate each of these goals. A non-linear model, developed to represent the relationship between the design variables of the building facade and each optimization objective, serves as the objective function. This objective function can be expressed through the output function of the SVM algorithm. Since a reduction in indoor air leakage is directly proportional to a decrease in the Window-to-Wall Ratio (WWR), the study incorporates the performance metrics PMV, PPD, sDA, and DGP—ensuring that thermal and visual comfort are not compromised while balancing operational energy consumption. As the optimization problem is framed as a minimization task, 1/sDA is used as the objective function for sDA, and |PMV| is used as the objective function for PMV. The multi-objective optimization problem is defined as shown in Equation (13):
2.5. Identification of Influential Parameters
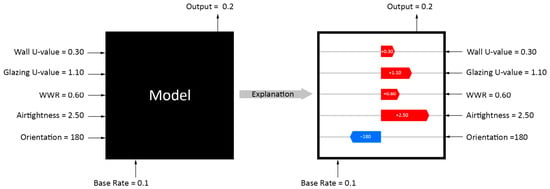
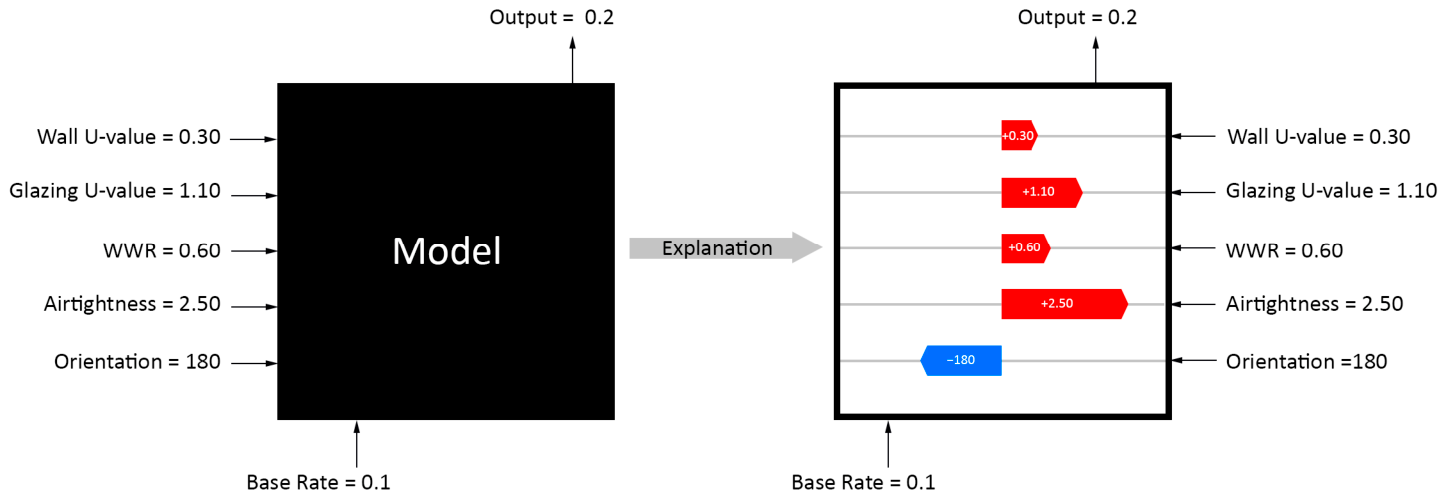
The SHAP (SHapley Additive ExPlanations) algorithm was used to identify and visualize influential parameters. SHAP employs a game-theoretic approach to interpret machine learning models [54,55]. Machine learning models often function as “black boxes”—taking certain features as input and producing predictions as output. Model interpretability plays a significant role in the field of artificial intelligence [56]. When researchers gain greater insight into how a machine learning model arrives at its final output, they are better equipped to interpret the problems at hand compared to using algorithms that act as opaque, “closed” boxes [57] (Figure 4).
Figure 4.
Approaches of explainable models and black-box models to problems.
Explainable AI tools can be used to provide clear and understandable interpretations regarding the model’s output. The Shapley value is calculated as shown in Equation (14):
Here, F represents the set of all features, S represents the subset of features excluding the i-th feature, and f(S ∪ {x_i}) − f(S) represents the difference between predictions that include and exclude the i-th feature.
3. Results and Discussion
3.1. Blower Door Test Results
In this study, we conducted Blower Door Tests (BDTs) at four different times—09:00, 12:00, 15:00, and 18:00—on 20 March 2026, in a north-facing apartment within a multi-unit building in Balıkesir, taking into account fluctuations in wind speed and air temperature throughout the day. As a result of the BDT, we determined the air change rate (n50) at a pressure of 50 Pa. Table 5 presents the n50 values obtained at these four different times. The values in the table indicate that the dwelling maintains a consistent airtightness profile based on the measurements taken at various times of the day.
Table 5.
BDT results for the dwelling.
In the evaluation process, we used the average of the n50 values (1.6225) obtained during the BDT procedure. Table 6 presents airtightness limit values for residential buildings in various countries. When considering the limit values in the table, the dwelling under investigation meets the requirements of the TS 825 [58], Bulgaria Passive House, Austria Passive House, and Czech Republic TNI 730330 standards [59,60]. Furthermore, the results obtained with low standard deviation throughout the BDT process enhance the reliability of the analysis performed.
Table 6.
Airtightness limit values in different countries [58,59,60].
3.2. Simulation Results
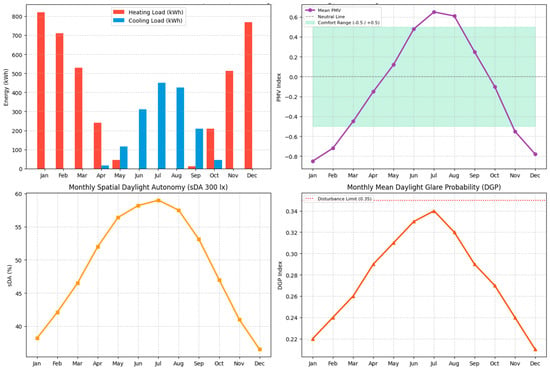
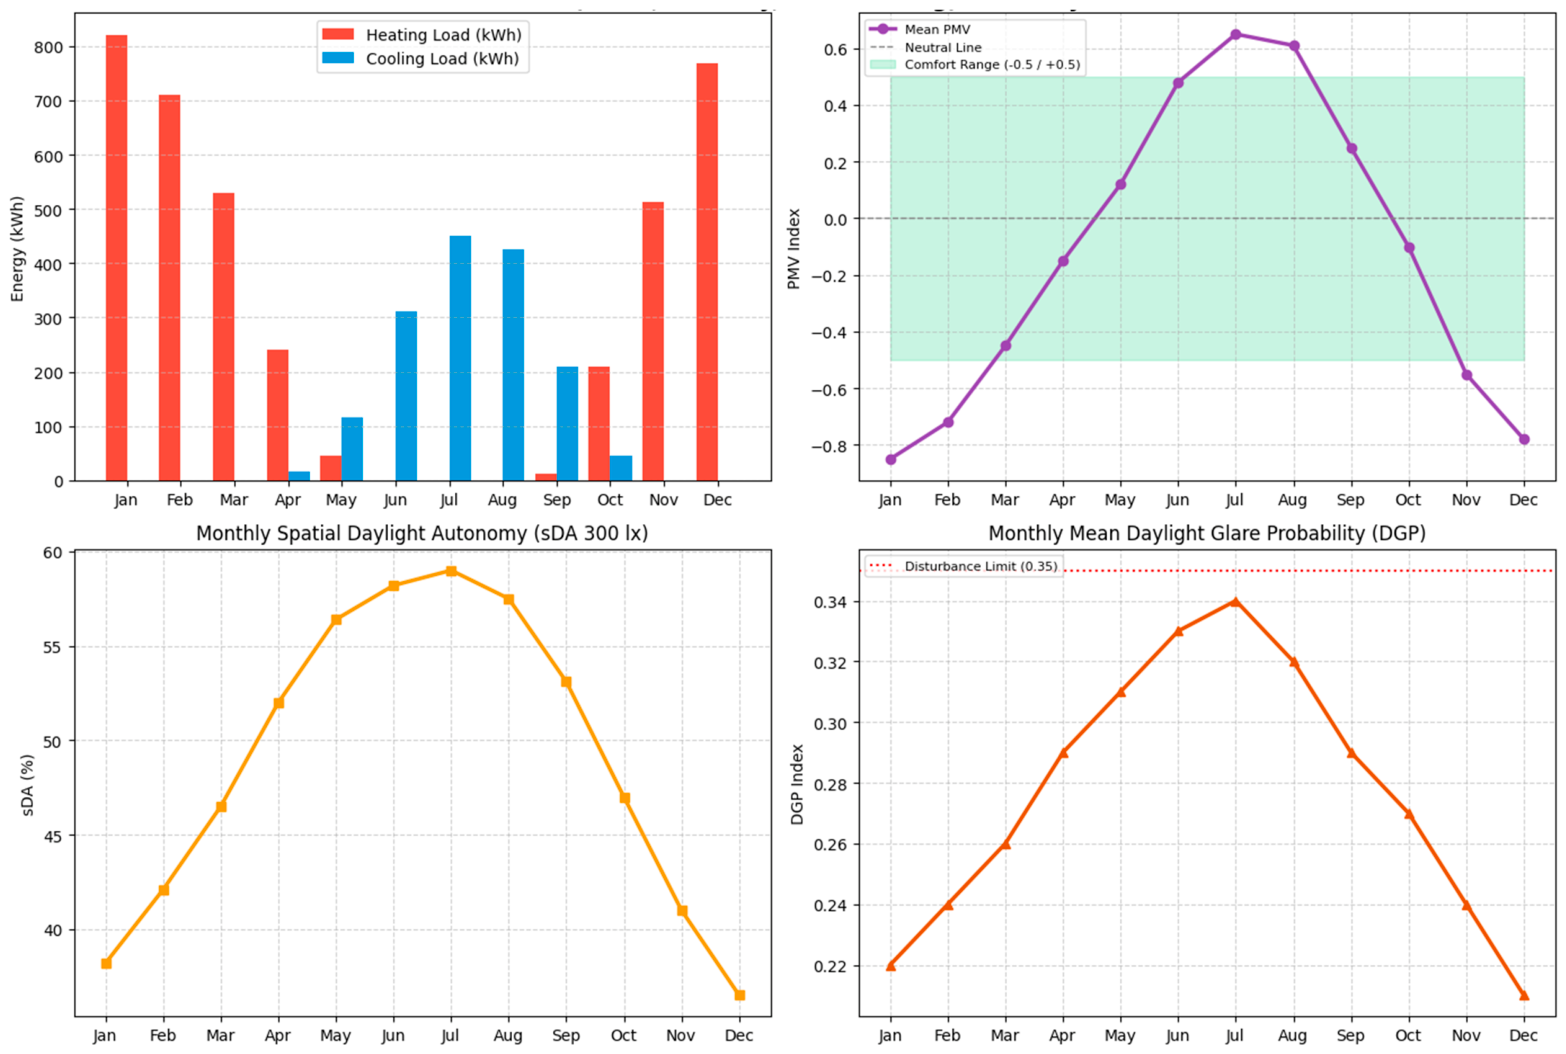
The results of code-based energy, thermal comfort, and daylight simulations conducted via Python are presented in Figure 5 and Table 7.
Figure 5.
Building performance simulation results for the existing condition.
Table 7.
Simulation results.
Energy performance: Table 7 displays the monthly heating and cooling energy results obtained from simulations performed using the EnergyPlus engine. An examination of the table reveals that the energy demand for heating peaks in January (820.4 kWh), while the energy demand for cooling peaks in July (450.2 kWh). Based on the annual total energy requirements, the total heating energy is 3850.2 kWh, and the total cooling energy is 1572.6 kWh. The fact that heating energy accounts for approximately 71% of the total annual energy requirement indicates that the heating load is the dominant factor for the residence under study. This dominance of heating-related energy consumption is a consequence of the residence’s north-facing orientation.
Thermal comfort performance: As shown in Figure 5 and Table 7, PMV values vary between −0.85 and +0.65 over a 12-month period. Correspondingly, PPD values range from 5.1% to 20.4%. The simulation results indicate that thermal discomfort in the residence occurs primarily during the summer and winter months. Specifically, the results highlight thermal dissatisfaction due to cold weather during the winter, and dissatisfaction due to hot weather during the summer. PMV values show an upward trend during the summer months, reaching their peak in August. An examination of the monthly average PMV values in the chart reveals that, during the winter months (December, January, and February), the PMV values range approximately from −0.72 to −0.85, falling outside the ±0.5 comfort range commonly used under the ASHRAE 55 standard [61]. In the summer months (June, July, and August), these values range approximately from +0.48 to +0.65; notably, the results for July and August fall outside the comfort range. Furthermore, it has been observed that thermal conditions are more favorable during the transitional seasons compared to the summer and winter months. Given the levels of discomfort observed during the summer and winter periods, it is essential that design variables related to the building envelope account for thermal comfort in addition to energy performance.
Visual Comfort Performance: Simulation results indicate that both the level of daylight utilization and the probability of glare undergo seasonal variations over a 12-month period. The sDA (spatial Daylight Autonomy) values were found to range from a minimum of 36.5% to a maximum of 59.0%, while DGP (Daylight Glare Probability) values varied between 0.21 and 0.34. The sDA values are relatively lower during the winter season compared to other periods, suggesting that natural lighting is insufficient during this time. In this same period, DGP values range from 0.21 to 0.24, indicating a lower probability of glare than in other seasons. Conversely, the situation during the summer months presents the opposite pattern. Daylight analyses conducted using Python yielded an sDA value of 55.5% for the north-facing residential unit. This meets the 55% threshold for sDA as per the BREEAM standard [37]. Overall, the simulation results show that the performance for all three objectives varies according to seasonal conditions. This necessitates an evaluation that accounts for the interdependencies among the performance indicators selected for multi-objective optimization.
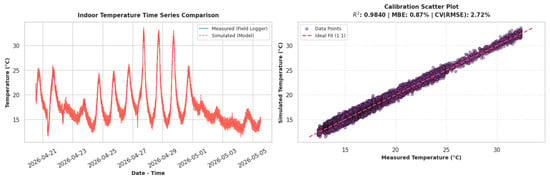
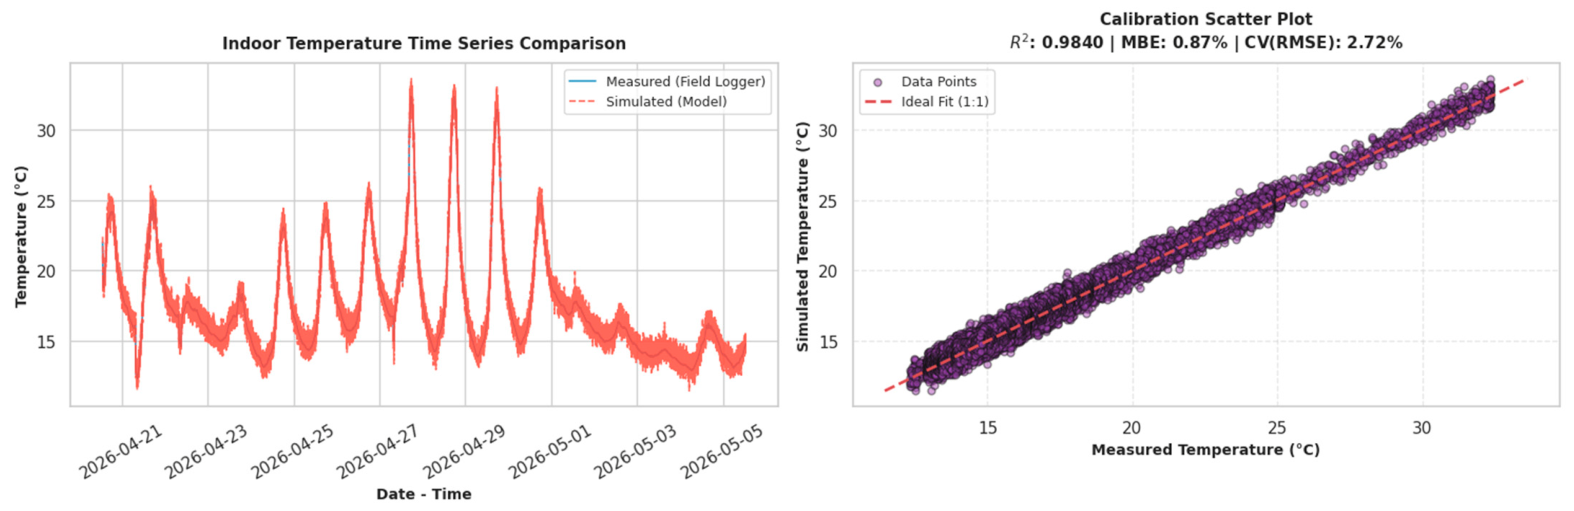
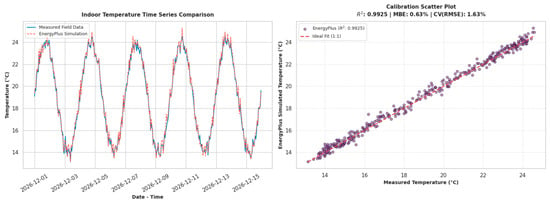
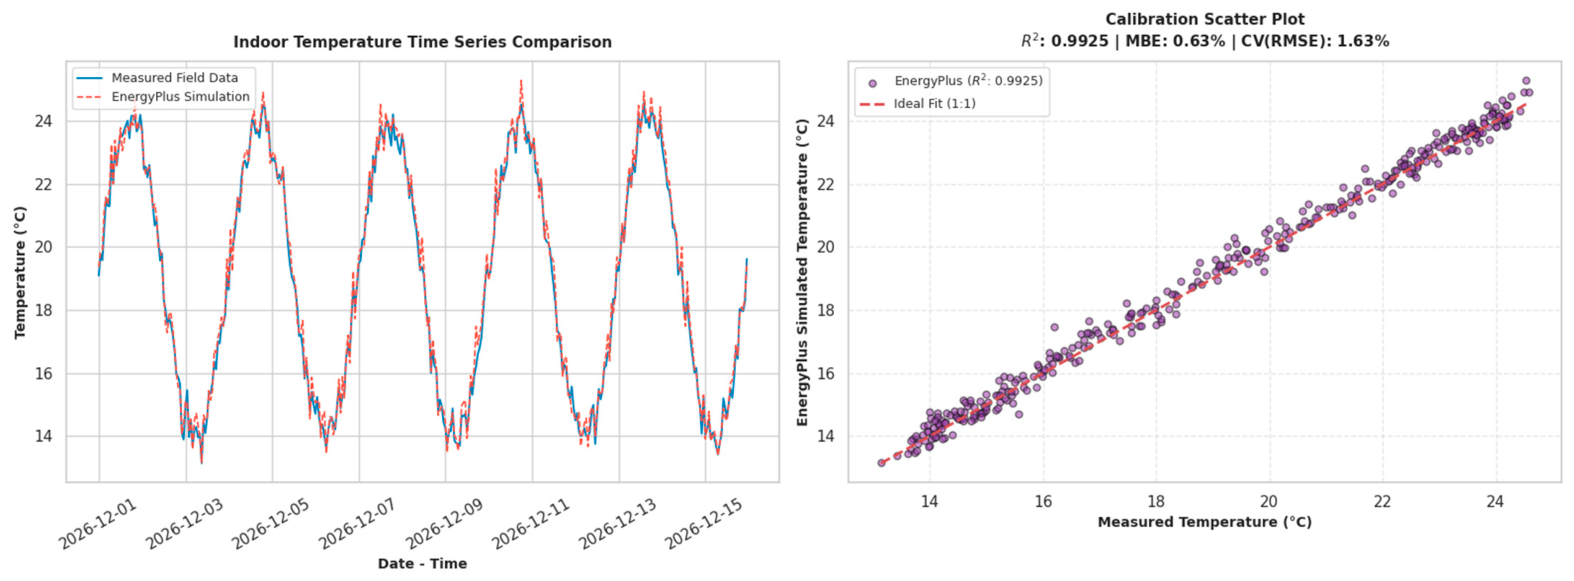
Model Validation: This process involves validating the simulation model for indoor air temperature by comparing it against actual data. The study demonstrates the validation of the simulation model for indoor air temperatures during April and May (Figure 6) and December (Figure 7). The performance simulation model developed in this study has been proven reliable according to ASHRAE Guideline 14, yielding an R2 value of 98.40%, an MBE of 0.87%, and a CV(RMSE) of 2.72% for the period covering April and May, and an R2 value of 99.25%, an MBE of 0.63%, and a CV(RMSE) of 1.63% for the period covering December.
Figure 6.
Validation of actual and simulated indoor temperature values for the months of April and May.
Figure 7.
Validation of actual and simulated indoor temperature values for the month of December.
3.3. AI-Based Optimization Results
To develop an ML-based surrogate model, 2000 performance simulations were conducted using various combinations of design variables, and both the design variables and the resulting performance metrics from these simulations were recorded. The machine learning algorithms employed in this study reduced the computational cost of the optimization process by providing predictions. The predictive accuracy of the surrogate model directly influences the reliability of the results obtained from the optimization [62]. Table 8 presents a comparison of the performance metrics for three different algorithms. An examination of the predictive performance of these algorithms across the various objectives reveals that all three achieve high R2 values (0.96–0.99). The fact that the lowest R2 values among the machine learning algorithms are associated with the sDA objective highlights the inherent difficulty in predicting this specific target. In this study, the machine learning-based surrogate models used as objective functions for optimization were not employed to predict performance data measured from an actual building. Instead of measured data from a real building, data obtained from EnergyPlus simulations were used as training and testing sets for the machine learning phase. Consequently, the statistical performance indicators used to evaluate the predictive capabilities of the ANN, SVR, and XGBoost algorithms reflect the success of these surrogate models in replicating the outputs generated by the EnergyPlus simulation engine. In multi-objective optimization processes, the continuous execution of simulation tools is typically time-consuming, and optimization algorithms often require the simultaneous evaluation of numerous criteria [46,63]. Therefore, machine learning-based surrogate models are utilized as objective functions within multi-objective optimization processes, as they provide high-accuracy predictive models that help overcome the drawbacks associated with high computational costs [25,64,65].
Table 8.
Comparison of performance metrics for three different algorithms.
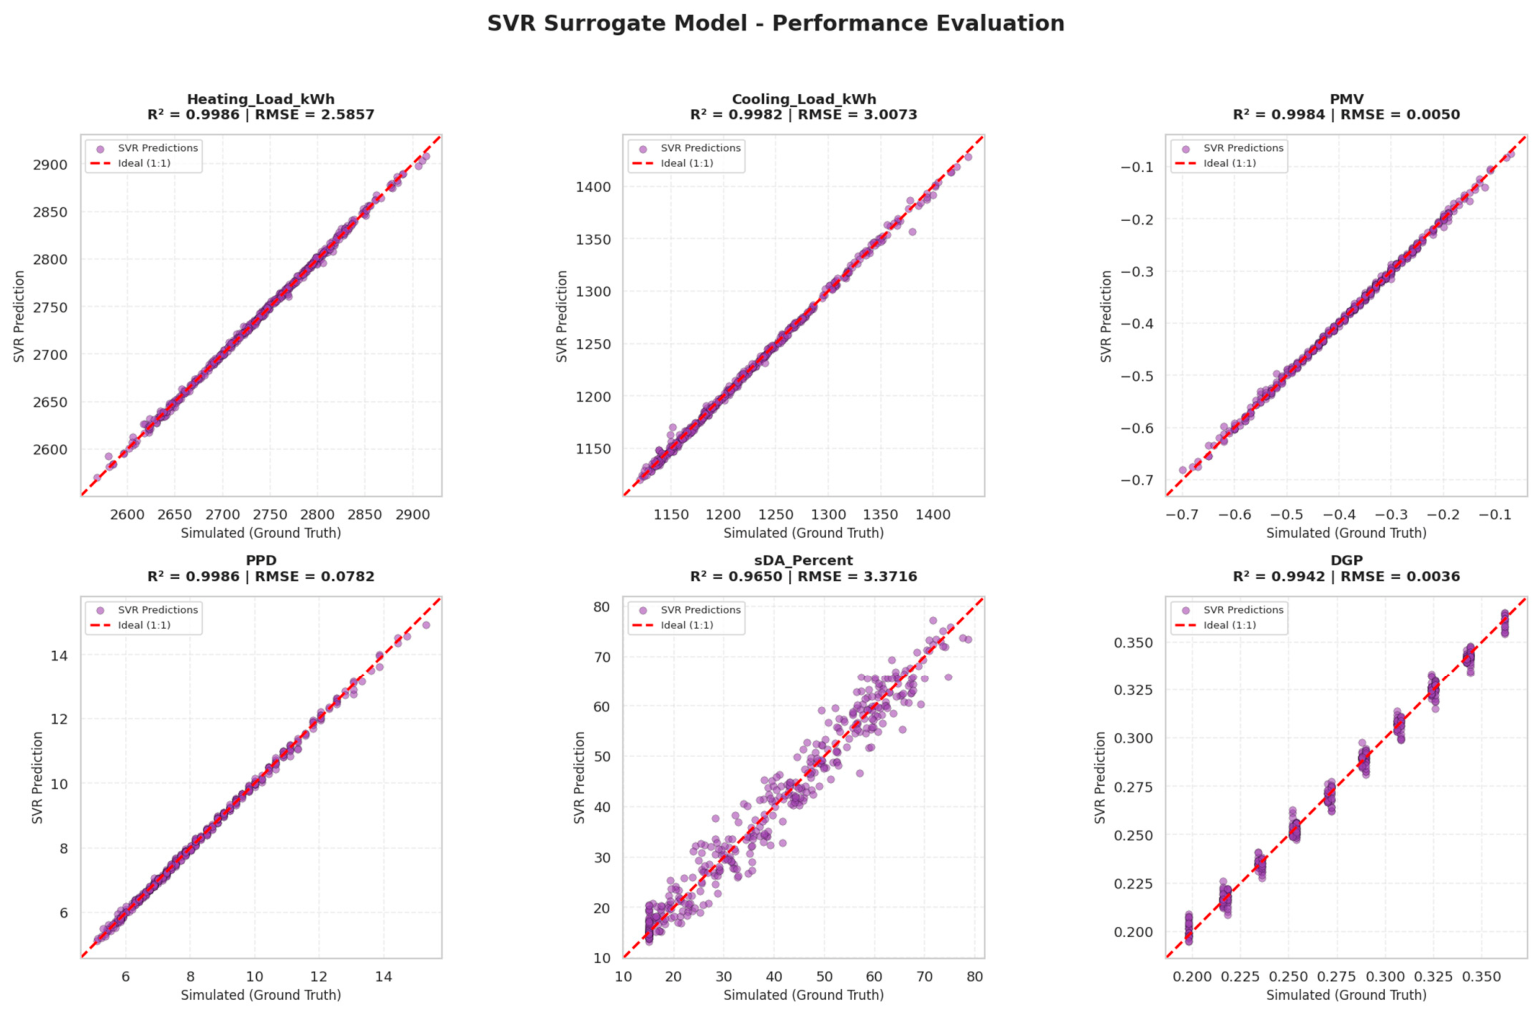
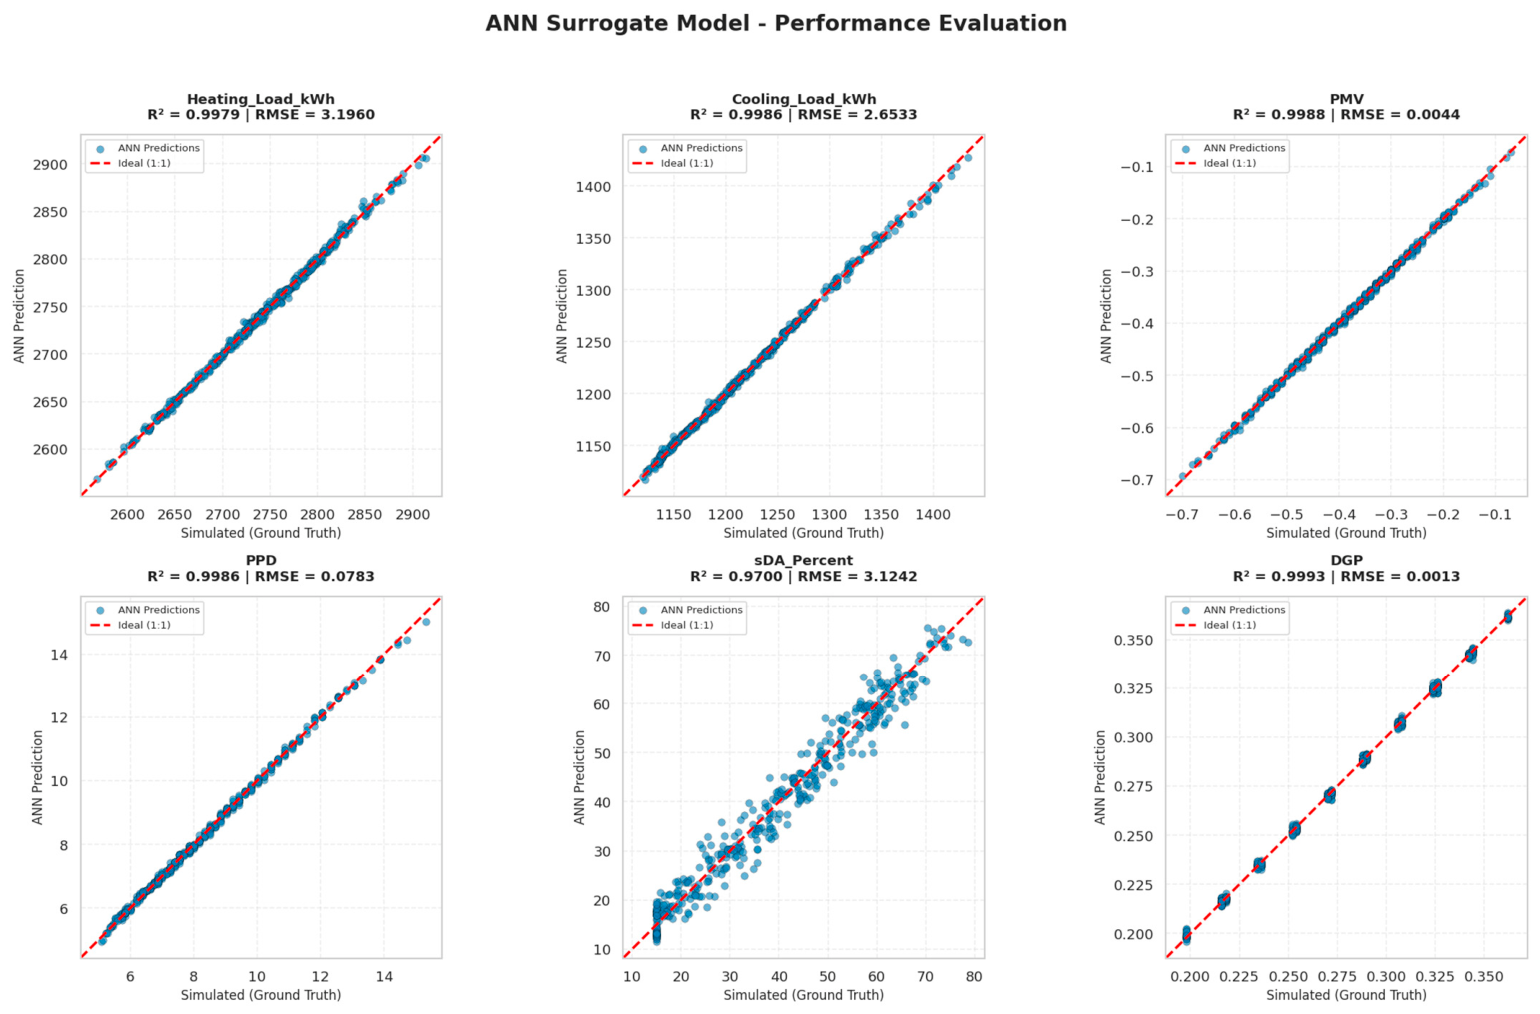
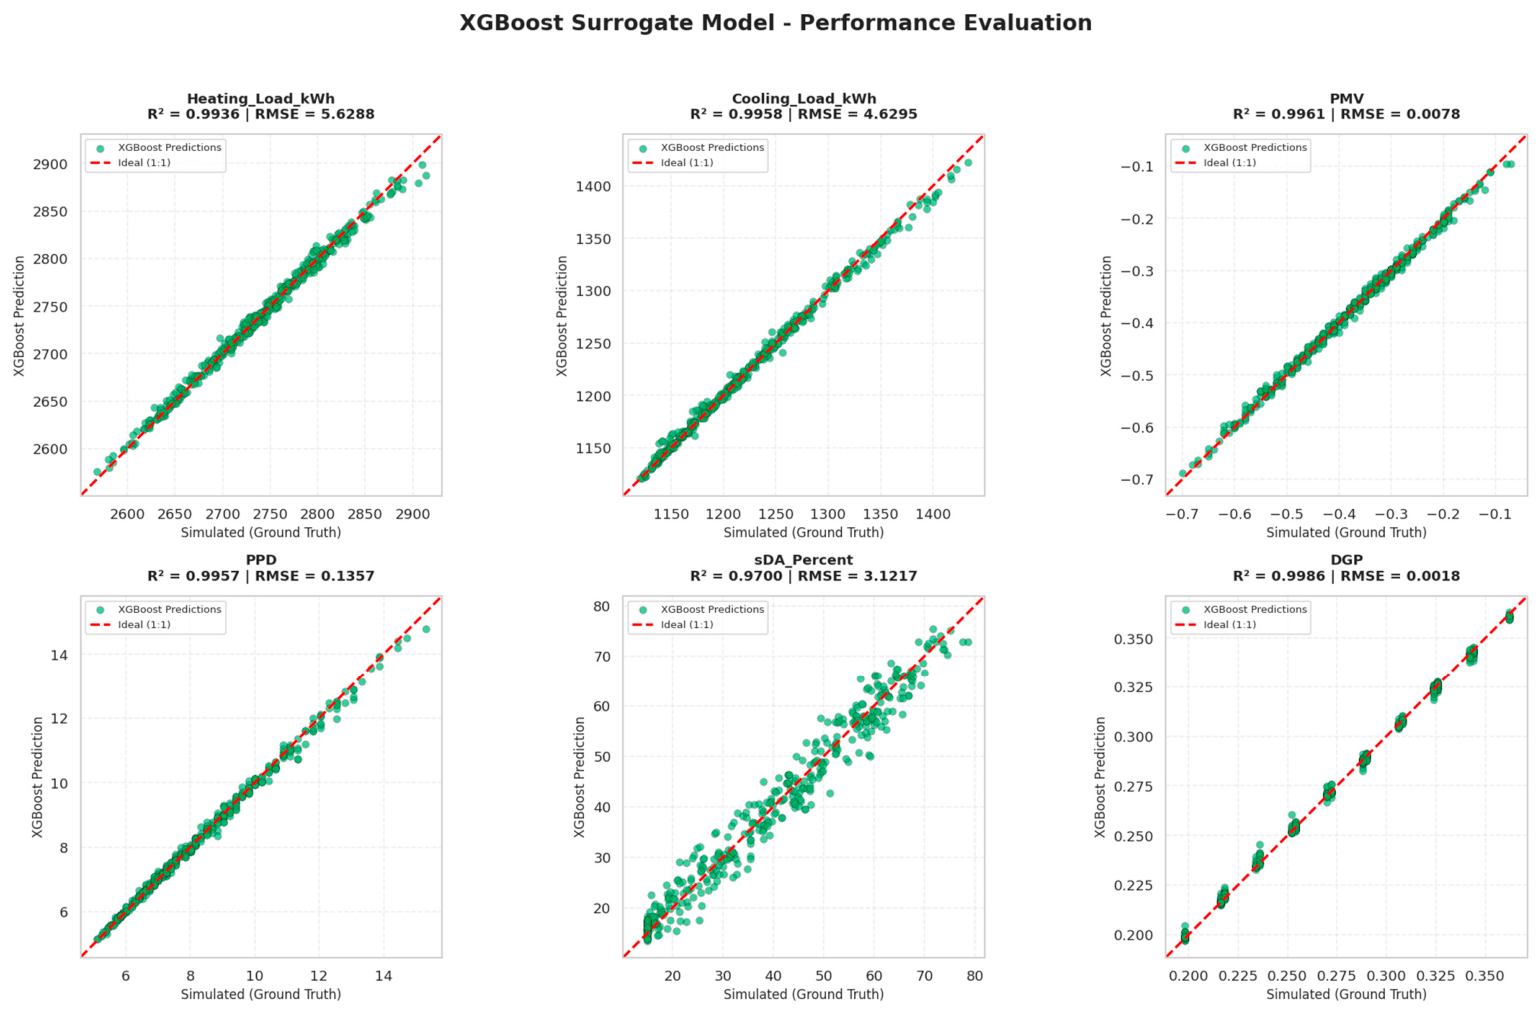
Figure 8, Figure 9 and Figure 10 present the predictive performance of the surrogate model. The figures show that the difference between the values predicted by machine learning models and the simulation values is very small. Consequently, the regression equation, by aligning with the actual conditions, effectively captures the relationship between the design parameters and the six distinct objectives [63,66]. An examination of the error metrics reveals that no single algorithm consistently outperformed the others across all objectives (Table 8). SVR yielded the lowest error values for heating load and PPD; ANN performed best for cooling load, DGP, and PMV; and XGBoost achieved the lowest error for sDA. Given that relying solely on these performance metrics is insufficient to determine the most effective algorithm, the study incorporates further analyses, including cross-validation, robustness testing, and evaluations using independent test datasets. These analyses encompass the optimization of 18 separate models—covering 3 different algorithms and 6 distinct objectives—with each model undergoing training and robustness assessments based on 20 Optuna trials and 5-fold cross-validation.
Figure 8.
Prediction performance of the SVM for different objectives.
Figure 9.
Prediction performance of the ANN for different objectives.
Figure 10.
Prediction performance of the XGBoost for different objectives.
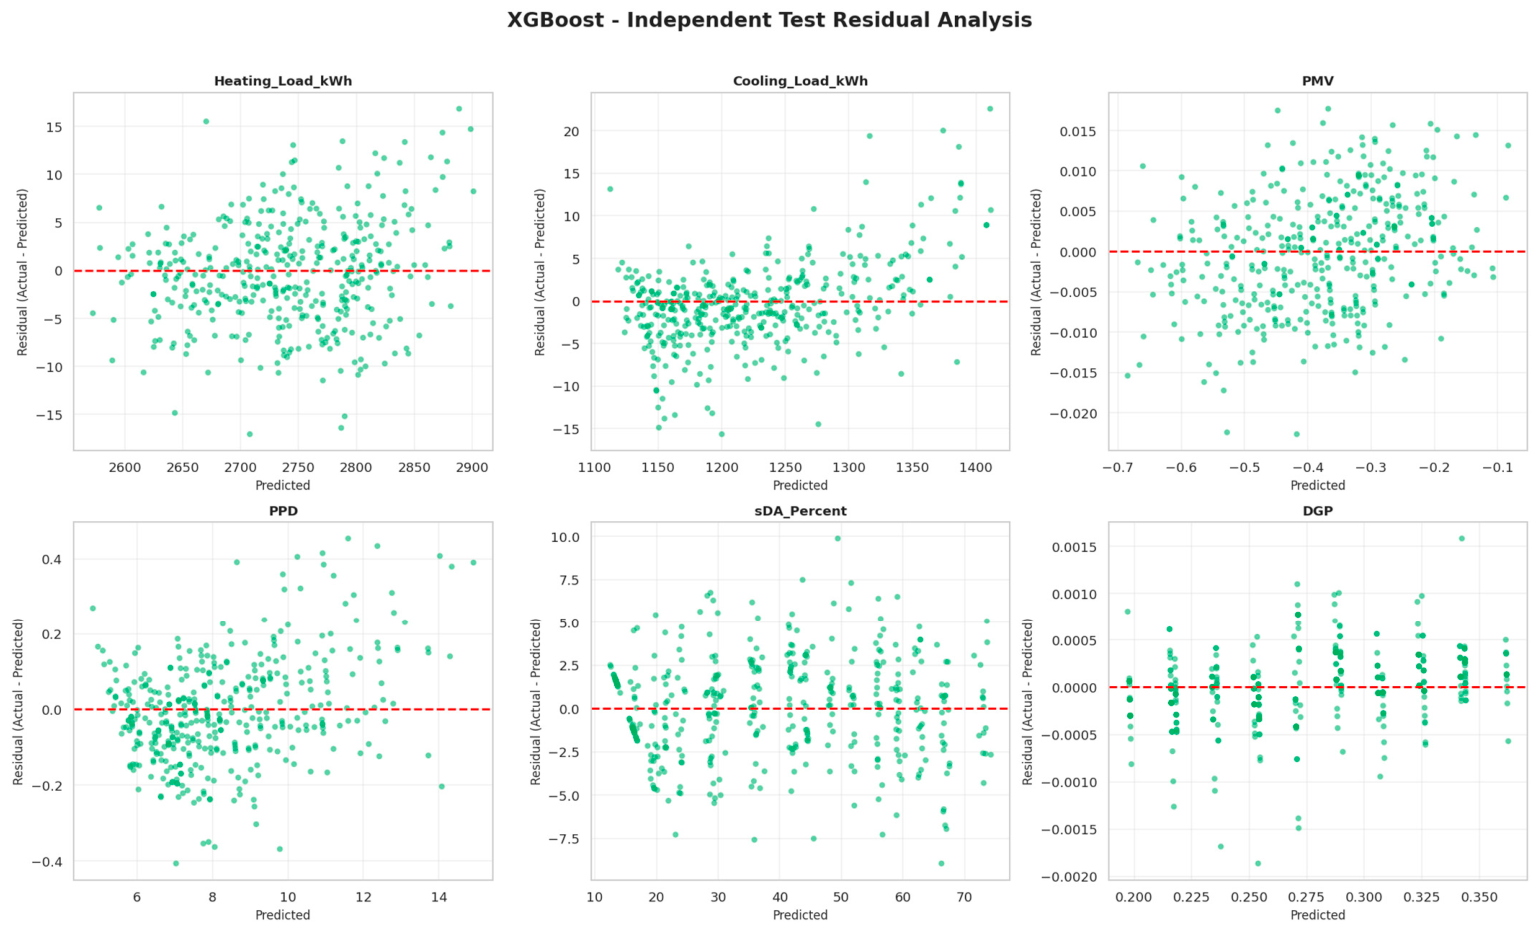
Cross-Validation (CV) is a technique that helps in estimating the robustness and performance of models. Primarily, it is used to predict how a model will perform in a production environment; thus, it serves as a crucial step in accounting for the potential variability of data in real-world scenarios [67]. Table 9 presents the results of algorithm selection based on repeated cross-validation. The SVR algorithm demonstrated the best performance for cooling load, heating load, PMV, and PPD objectives, while the XGBoost algorithm performed best for DGP and sDA objectives. Similarly, in the existing literature on building performance optimization, SVM-based algorithms have also shown high performance [25,68]. In this study, the ANN algorithm did not rank first for any of the objectives. Consequently, the SVR algorithm exhibited superior performance compared to the other algorithms. The final independent test results for this study are provided in Appendix A. The fact that the 5-fold CV, repeated cross-validation, and independent test results are closely aligned indicates that the models maintain consistent performance across different data splits. Furthermore, the individual validation and error plots for all algorithms also confirm these results (Appendix B).
Table 9.
The best algorithm selected via cross-validation on the training data.
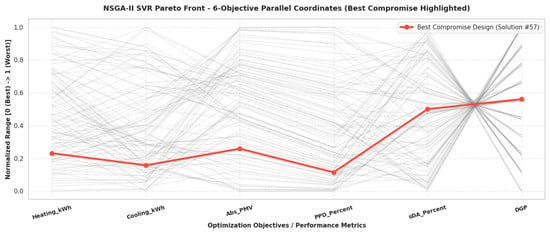
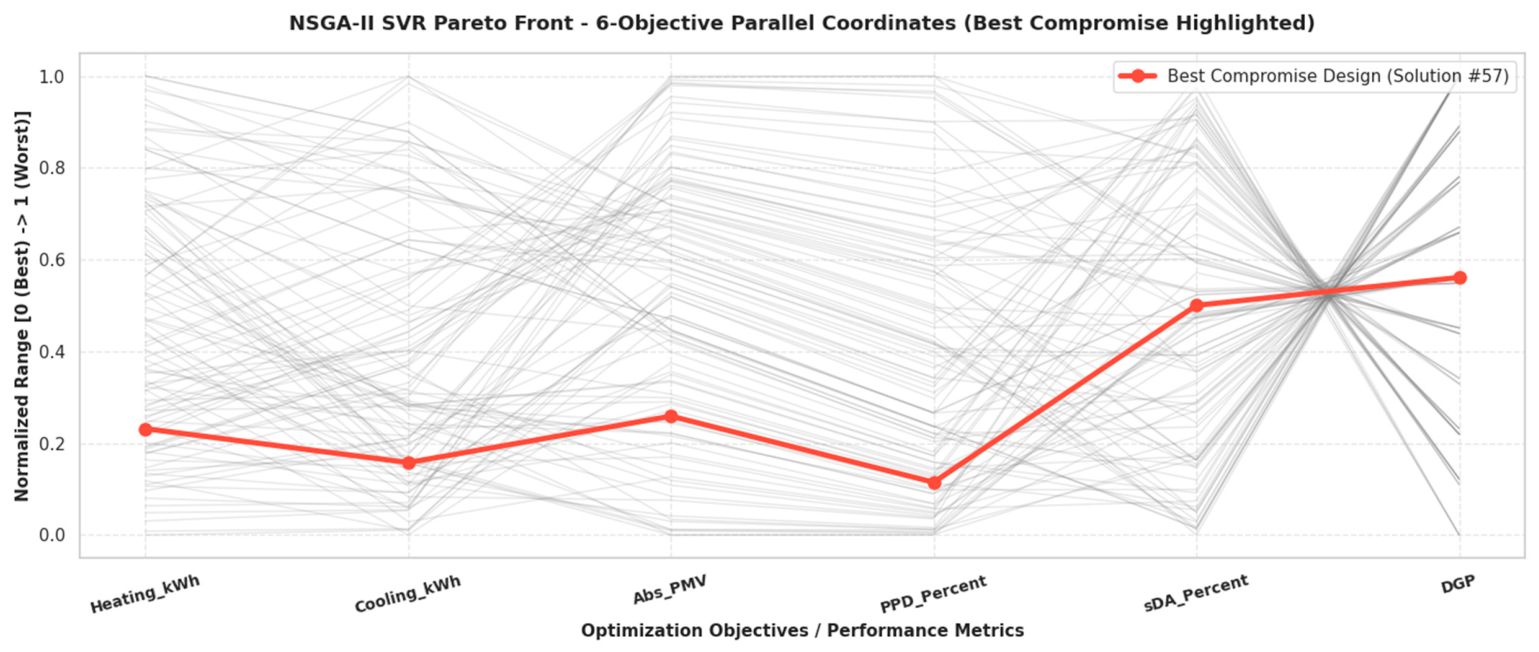
In buildings, there is a trade-off between energy performance and daylight performance. For this reason, this study adopts a Pareto-front-based multi-objective optimization (MOO) process that minimizes building energy consumption while maximizing indoor daylight and thermal performance. Figure 11 presents the 6-dimensional Pareto-front obtained from the optimization. An examination of the Pareto-front reveals that the selected alternatives achieve optimal performance across multiple indicators simultaneously, including daylight, visual comfort, thermal comfort, and energy performance. Among the proposed models, the best-performing option requires 2760.82 kWh for annual heating and 1389.33 kWh for cooling, with a PMV value of 0.431, a PPD of 8.88%, an sDA of 65%, and a DGP of 0.335.
Figure 11.
Optimum result obtained from multi-objective optimization.
Table 10 presents 10 different proposed models. These models demonstrate that lower thermal transmittance values for walls and windows lead to a reduction in total energy consumption. An examination of the window-to-wall ratio (WWR) reveals various alternatives ranging from 0.3 to 0.8. The study identifies n50 values within the range of 0.60–5.00 h−1 offering a variety of proposals with both favorable and less favorable n50 values. Regarding building orientation, it was found that proposals oriented primarily toward the south or southwest yield optimal results. Furthermore, significant differences are observed in terms of energy consumption, thermal comfort, and visual comfort performance.
Table 10.
Design solutions for the proposed models.
While some solutions offer advantages in terms of energy consumption (such as solution 6), others—through different combinations—yield better results regarding thermal or visual comfort. For instance, an examination of solution 1 reveals a design with a high transparency ratio, characterized by an 80% window-to-wall ratio and a glazing U-value of 2.385 W/m2K. Although the sDA (spatial Daylight Autonomy) value of 65% is favorable for daylighting, the total energy consumption of 4246.29 kWh represents a poor outcome in terms of energy performance. Meanwhile, the values of |PMV| = 0.431 and PPD = 8.88% indicate that the level of thermal comfort falls within an acceptable range. In terms of energy performance, solution 6 is the most favorable, whereas solution 2 exhibits the highest energy consumption; there is a difference of approximately 12.44% in energy consumption between these two options. Solution 7 provides the best thermal comfort, while solution 3 performs the worst in this regard. These findings highlight that low energy consumption alone does not guarantee optimal thermal comfort conditions. Regarding visual comfort, solutions 4 and 8 achieve the best results, boasting the highest sDA values. Ultimately, evaluating different objectives—such as energy consumption, thermal comfort, and visual comfort—independently during the building design process is not an appropriate approach. A design alternative that performs well for one objective may yield undesirable results for another, which underscores the importance of multi-objective optimization.
3.4. Sensitivity Analysis Results
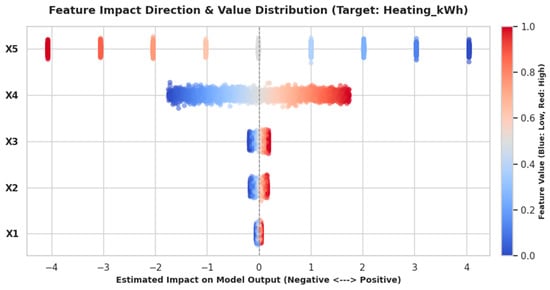
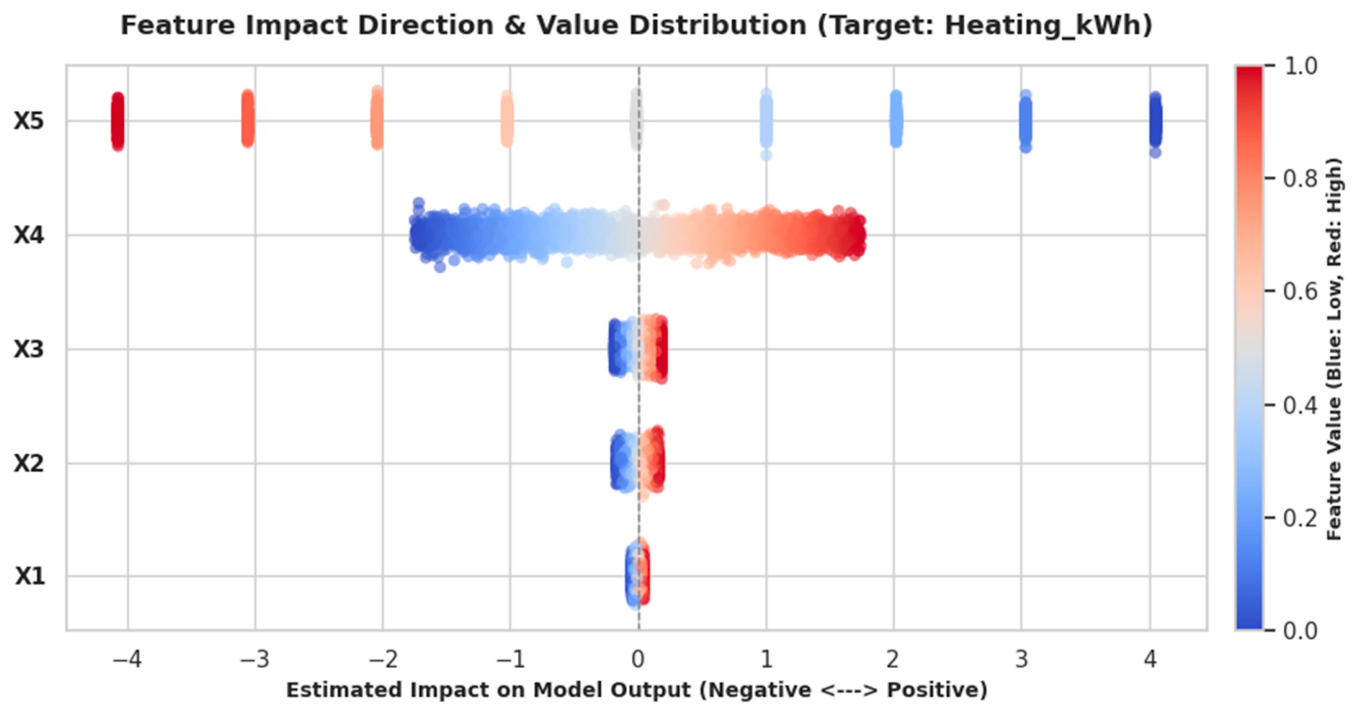
This study investigated the individual impact of each parameter on performance indicators using standardized regression coefficients and visualized these findings through partial dependence plots. The SHAP method was employed for feature selection and to ensure explainability; SHAP serves as a robust tool for elucidating the contributions of specific features to a model. Figure 12 illustrates the influence of various parameters on heating energy. The figure reveals that parameter X5 is the most significant factor affecting the heating load, exhibiting an inverse relationship with it. This is followed by parameter X4, which shows a positive correlation with the heating load. The results indicate that the airtightness of the building envelope is among the most influential parameters affecting the indoor heating load.
Figure 12.
Effect of parameters on heating load.
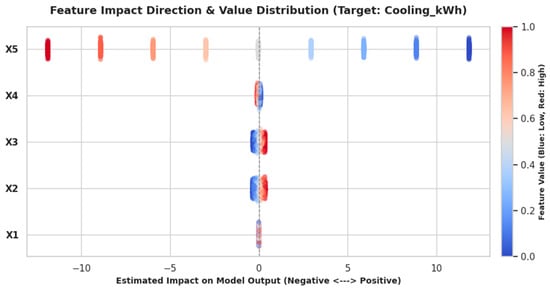
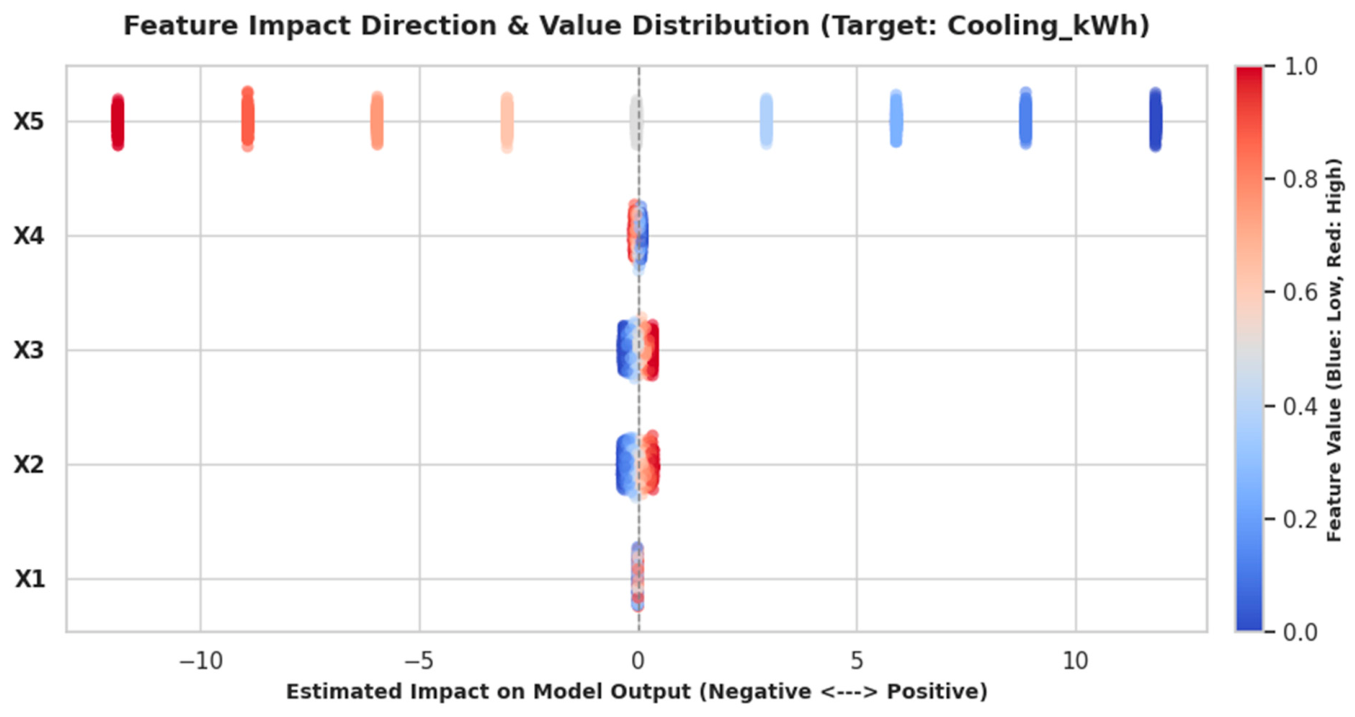
Figure 13 presents the effect of the parameters on cooling energy. According to the figure, it was determined that X5 is the most influential parameter regarding cooling load and that it is inversely proportional to the cooling load. This parameter is followed by parameters X2 and X3, both of which exhibit a negative relationship with the cooling load.
Figure 13.
Effect of parameters on cooling load.
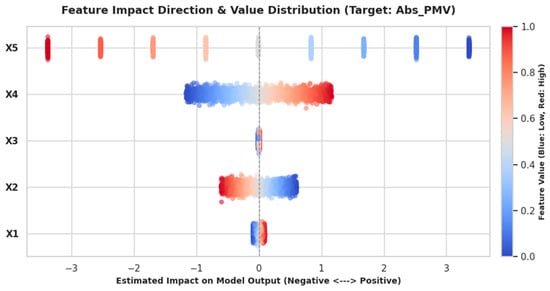
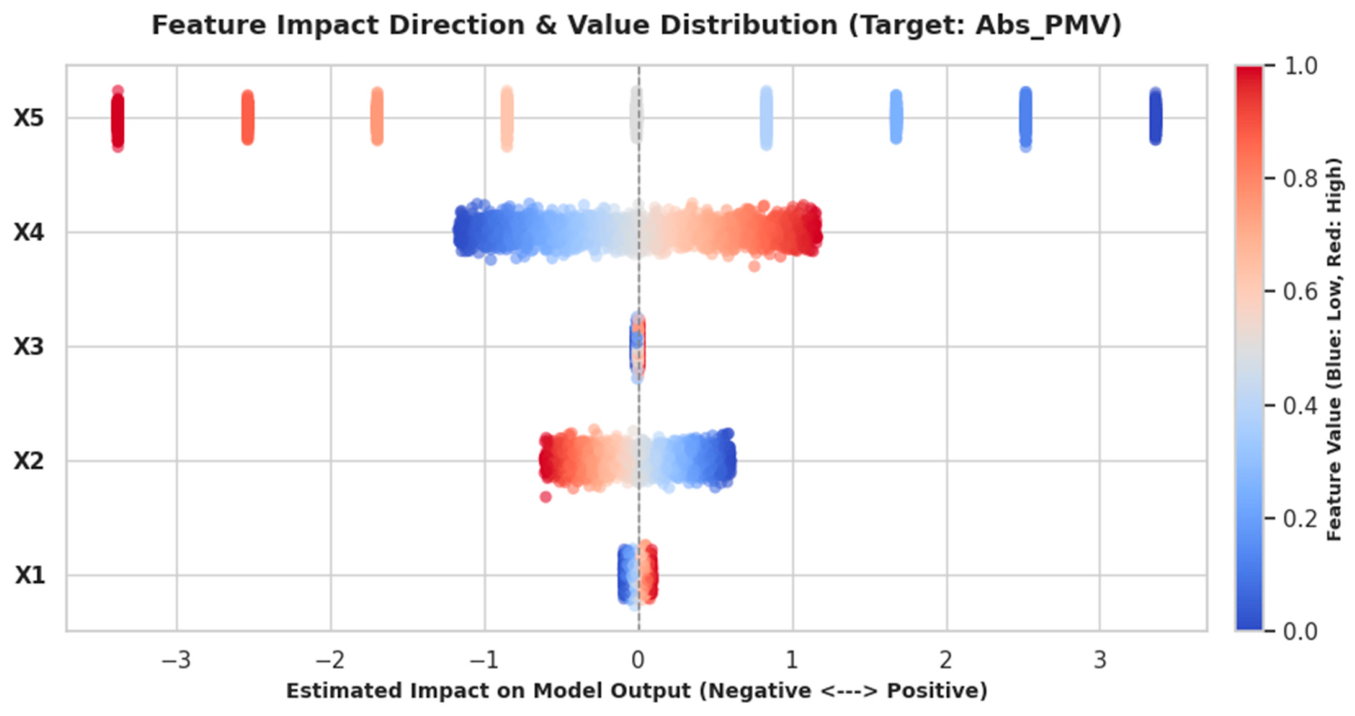
Figure 14 presents the effect of the parameters on PMV. According to the figure, it was determined that X5 is the most influential parameter regarding PMV and that it has an inverse relationship with PMV. The building envelope airtightness value was the second-most influential parameter affecting PMV; as the value of this parameter increases, PMV is negatively affected.
Figure 14.
Effect of parameters on PMV.
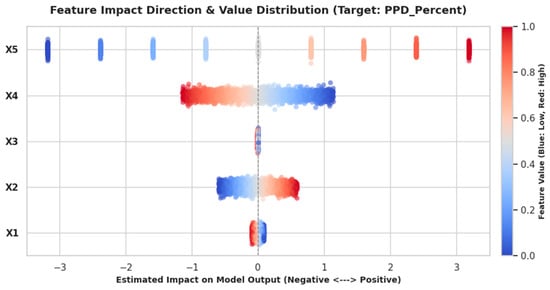
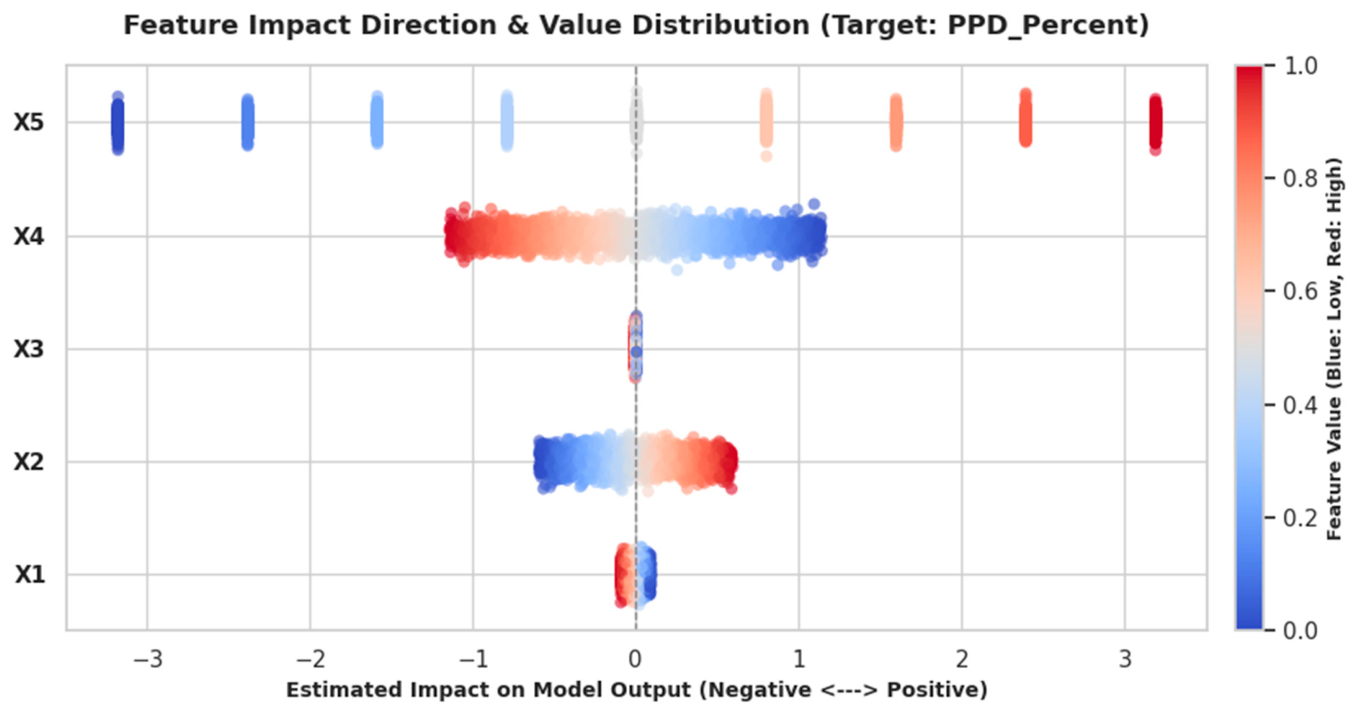
Figure 15 presents the effect of parameters on PPD. According to the figure, it was determined that the most effective parameter on PPD was X5 and that this parameter was directly proportional to PPD. Building envelope airtightness value was the 2nd most effective parameter on PPD. As the value of this parameter increases, PPD is negatively affected.
Figure 15.
Effect of parameters on PPD.
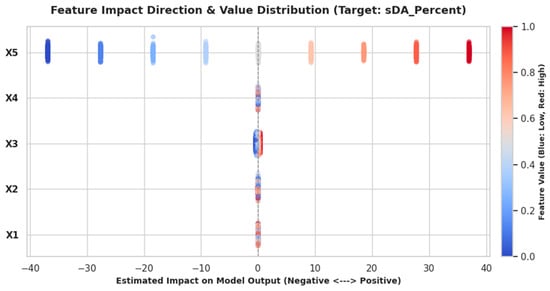
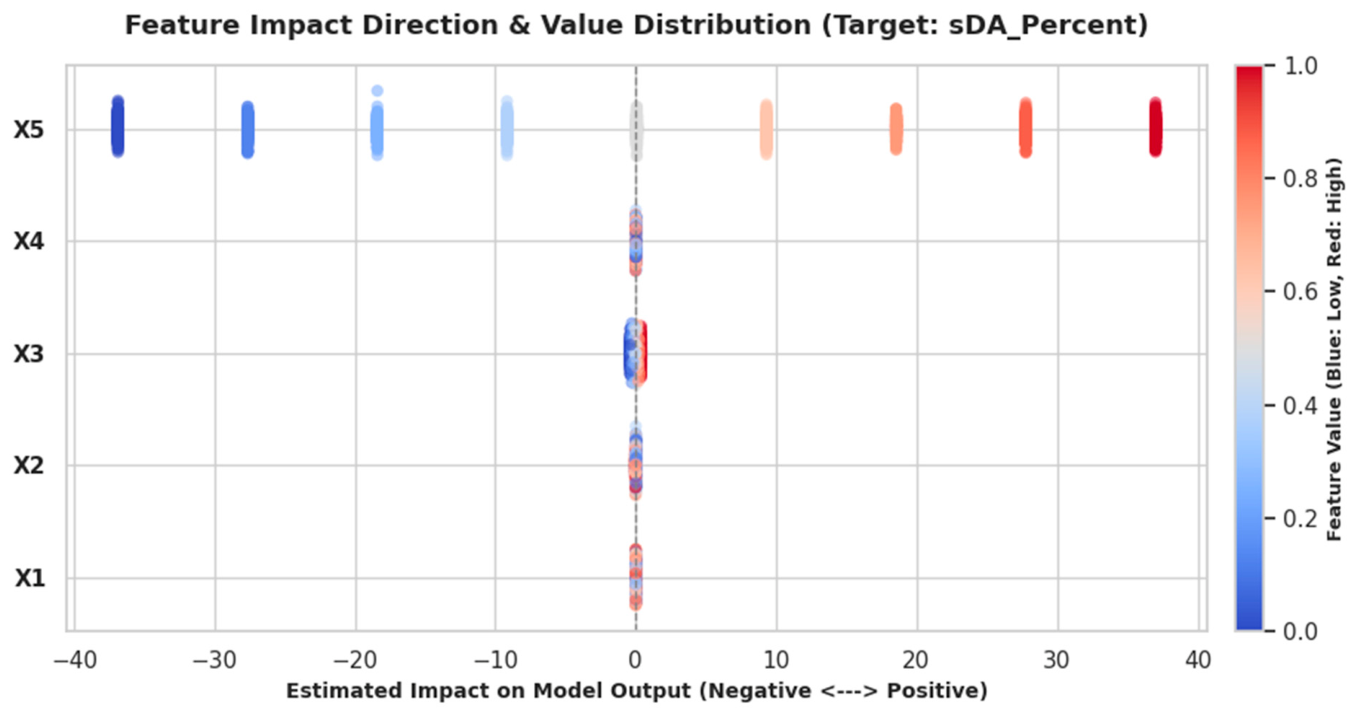
Figure 16 presents the effect of parameters on sDA. According to the figure, orientation is the most influential parameter regarding daylight access to the space. This is followed by WWR. It was determined that the airtightness of the building envelope has a minimal effect on indoor daylight performance.
Figure 16.
Effect of parameters on sDA.
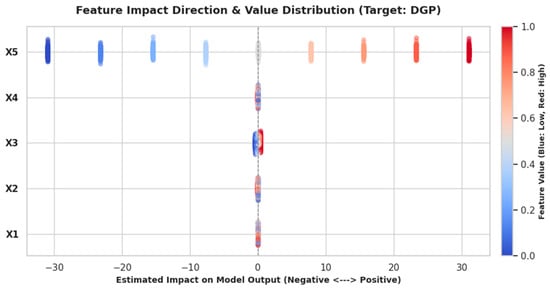
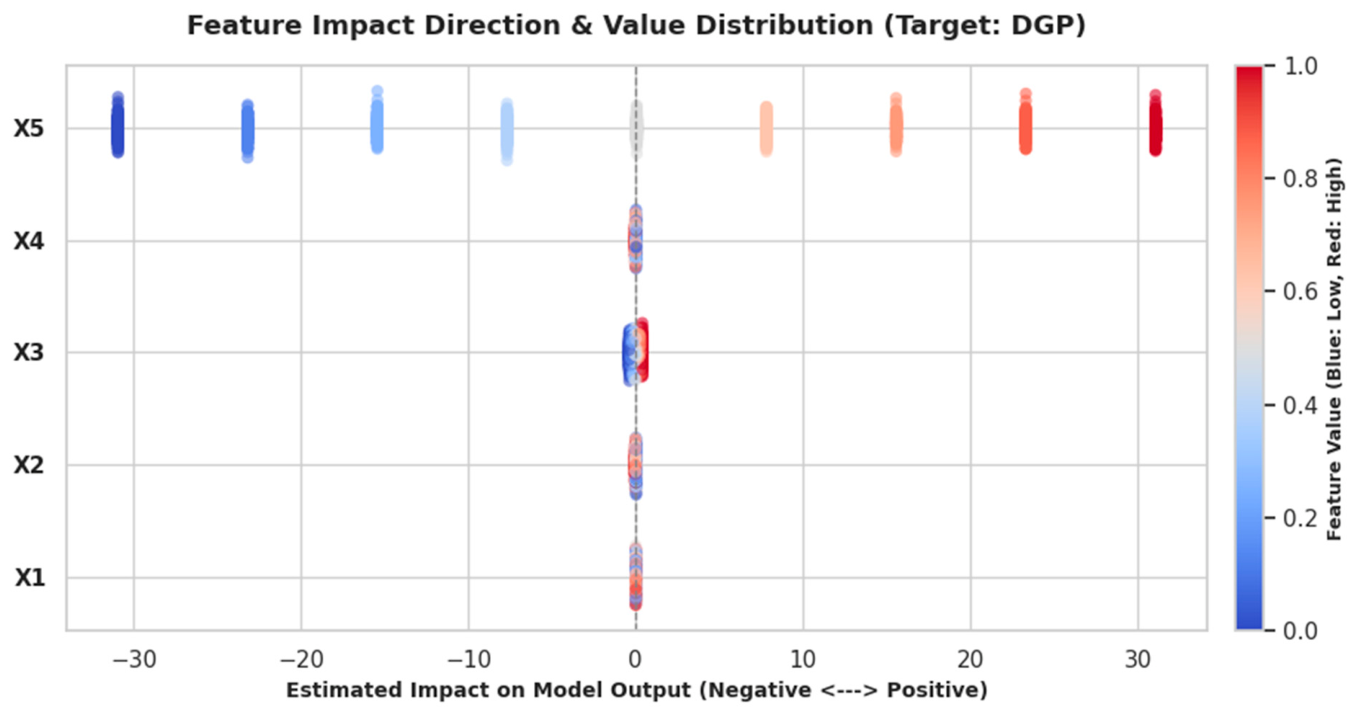
Figure 17 presents the effect of parameters on DGP. According to the figure, orientation is the most significant parameter affecting the probability of glare within the space. The second-most effective parameter for indoor glare control is the WWR.
Figure 17.
Effect of parameters on the DGP.
4. Conclusions and Recommendations
This study proposes a methodology that integrates air-tightness measurements—conducted in an actual residential dwelling—with building performance simulations, machine learning, and multi-objective optimization techniques. The proposed approach aims to generate balanced design solutions by simultaneously evaluating the impacts of building envelope design parameters on energy consumption, thermal comfort, and visual comfort. To achieve this, surrogate models—based on three different machine learning models (including Support Vector Machines and Artificial Neural Networks) and a metaheuristic algorithm (Non-dominated Sorting Genetic Algorithm II, or NSGA-II)—were employed to identify optimal combinations of building design variables. The selection of the most effective machine learning model was supported by analyses such as independent testing, validation, and the use of performance metrics frequently cited in the literature. The Support Vector Machine algorithm, which demonstrated effective and reliable predictive performance, was identified as the most suitable model and was subsequently used to generate the optimal solutions.
The multi-objective optimization, performed using NSGA-II, resulted in a 21.69% reduction in energy consumption, a 17.2% improvement in visual comfort, and a 20% improvement in thermal comfort compared to the baseline (existing) conditions. These findings underscore the importance of simultaneously considering energy efficiency and user comfort. Analyses conducted using the Shapley Additive Explanations (SHAP) method revealed that the relative influence of design parameters varies across different performance indicators. Consequently, this study highlights the significance of accounting for the distinct impacts of various parameters when optimizing for energy consumption, thermal comfort, and visual comfort within a multi-objective optimization framework. While parameters such as the Window-to-Wall Ratio (WWR) and building orientation are significant for visual comfort, variables related to infiltration and the thermal transmittance of building components are key to enhancing energy efficiency and thermal comfort. These results demonstrate that the same design parameters do not exert an equal influence on different performance objectives. In this context, a multi-objective optimization process provides a framework for evaluating the impacts of performance improvements across various goals, rather than focusing on a single performance indicator.
Based on these findings, shaping a design by simultaneously considering performance indicators that exist in a trade-off relationship enables more informed decision-making. Prioritizing one comfort criterion while neglecting others fails to achieve optimal indoor conditions. This study distinguishes itself from existing research by incorporating verified infiltration data and examining the relationship between thermal comfort and energy efficiency, while also accounting for daylighting and glare control. Alongside its original contributions, the study also presents certain limitations. The research focuses on a single residential building, which restricts the generalizability of the findings to other building typologies. Furthermore, the machine learning models employed in this study were trained and tested using output data generated by the EnergyPlus simulation engine, which constitutes another limitation. The high predictive accuracy of these machine learning models reflects a strong alignment with simulation outputs rather than with actual, real-world building performance. Consequently, the performance improvements achieved through multi-objective optimization—regarding energy consumption, thermal comfort, and visual comfort—should be interpreted as estimates derived from simulation-based modeling. The use of three distinct machine learning models alongside the NSGA-II algorithm in multi-objective optimization processes limits the ability to compare the performance of various modeling and optimization approaches. While this study confirms the reliability of the SVM and NSGA-II optimization algorithm in optimizing energy, thermal, and visual comfort performance, there remains a need for design optimization that addresses additional objectives, such as life-cycle costs. In this study, equal weighting coefficients were assigned to the objective functions within the optimization process; however, in multi-objective optimization problems, assigning different weights to specific objective functions could yield solutions tailored to user preferences. Furthermore, extending the scope to examine multiple buildings—rather than focusing solely on a single new residential building—would be a compelling direction for future research. Future studies could also develop models that produce more realistic results by creating a “digital twin” of a space, utilizing IoT-based sensors to collect real-time data on indoor pressure, temperature, and glare.
Author Contributions
Conceptualization, R.Ö.; Methodology, R.Ö. and B.B.Y.; Software, R.Ö. and B.B.Y.; Validation, R.Ö. and B.B.Y.; Investigation, R.Ö. and B.B.Y.; Data Curation, R.Ö.; Writing—Original Draft Preparation, R.Ö. and B.B.Y.; Writing—Review and Editing, R.Ö. and B.B.Y.; Visualization, R.Ö.; Project Administration, R.Ö. All authors have read and agreed to the published version of the manuscript.
Funding
This research received no external funding.
Data Availability Statement
The data presented in this study are available from the corresponding author upon reasonable request.
Acknowledgments
During the preparation of this manuscript, the authors used ChatGPT (GPT-6, OpenAI) solely for English language editing, grammatical corrections, and improvements in clarity and readability. The authors reviewed and edited the output and take full responsibility for the content of this publication.
Conflicts of Interest
The authors declare no conflicts of interest.
Appendix A
Table A1.
Final independent test results.
Appendix B
Figure A1.
SVR independent test residual analysis.
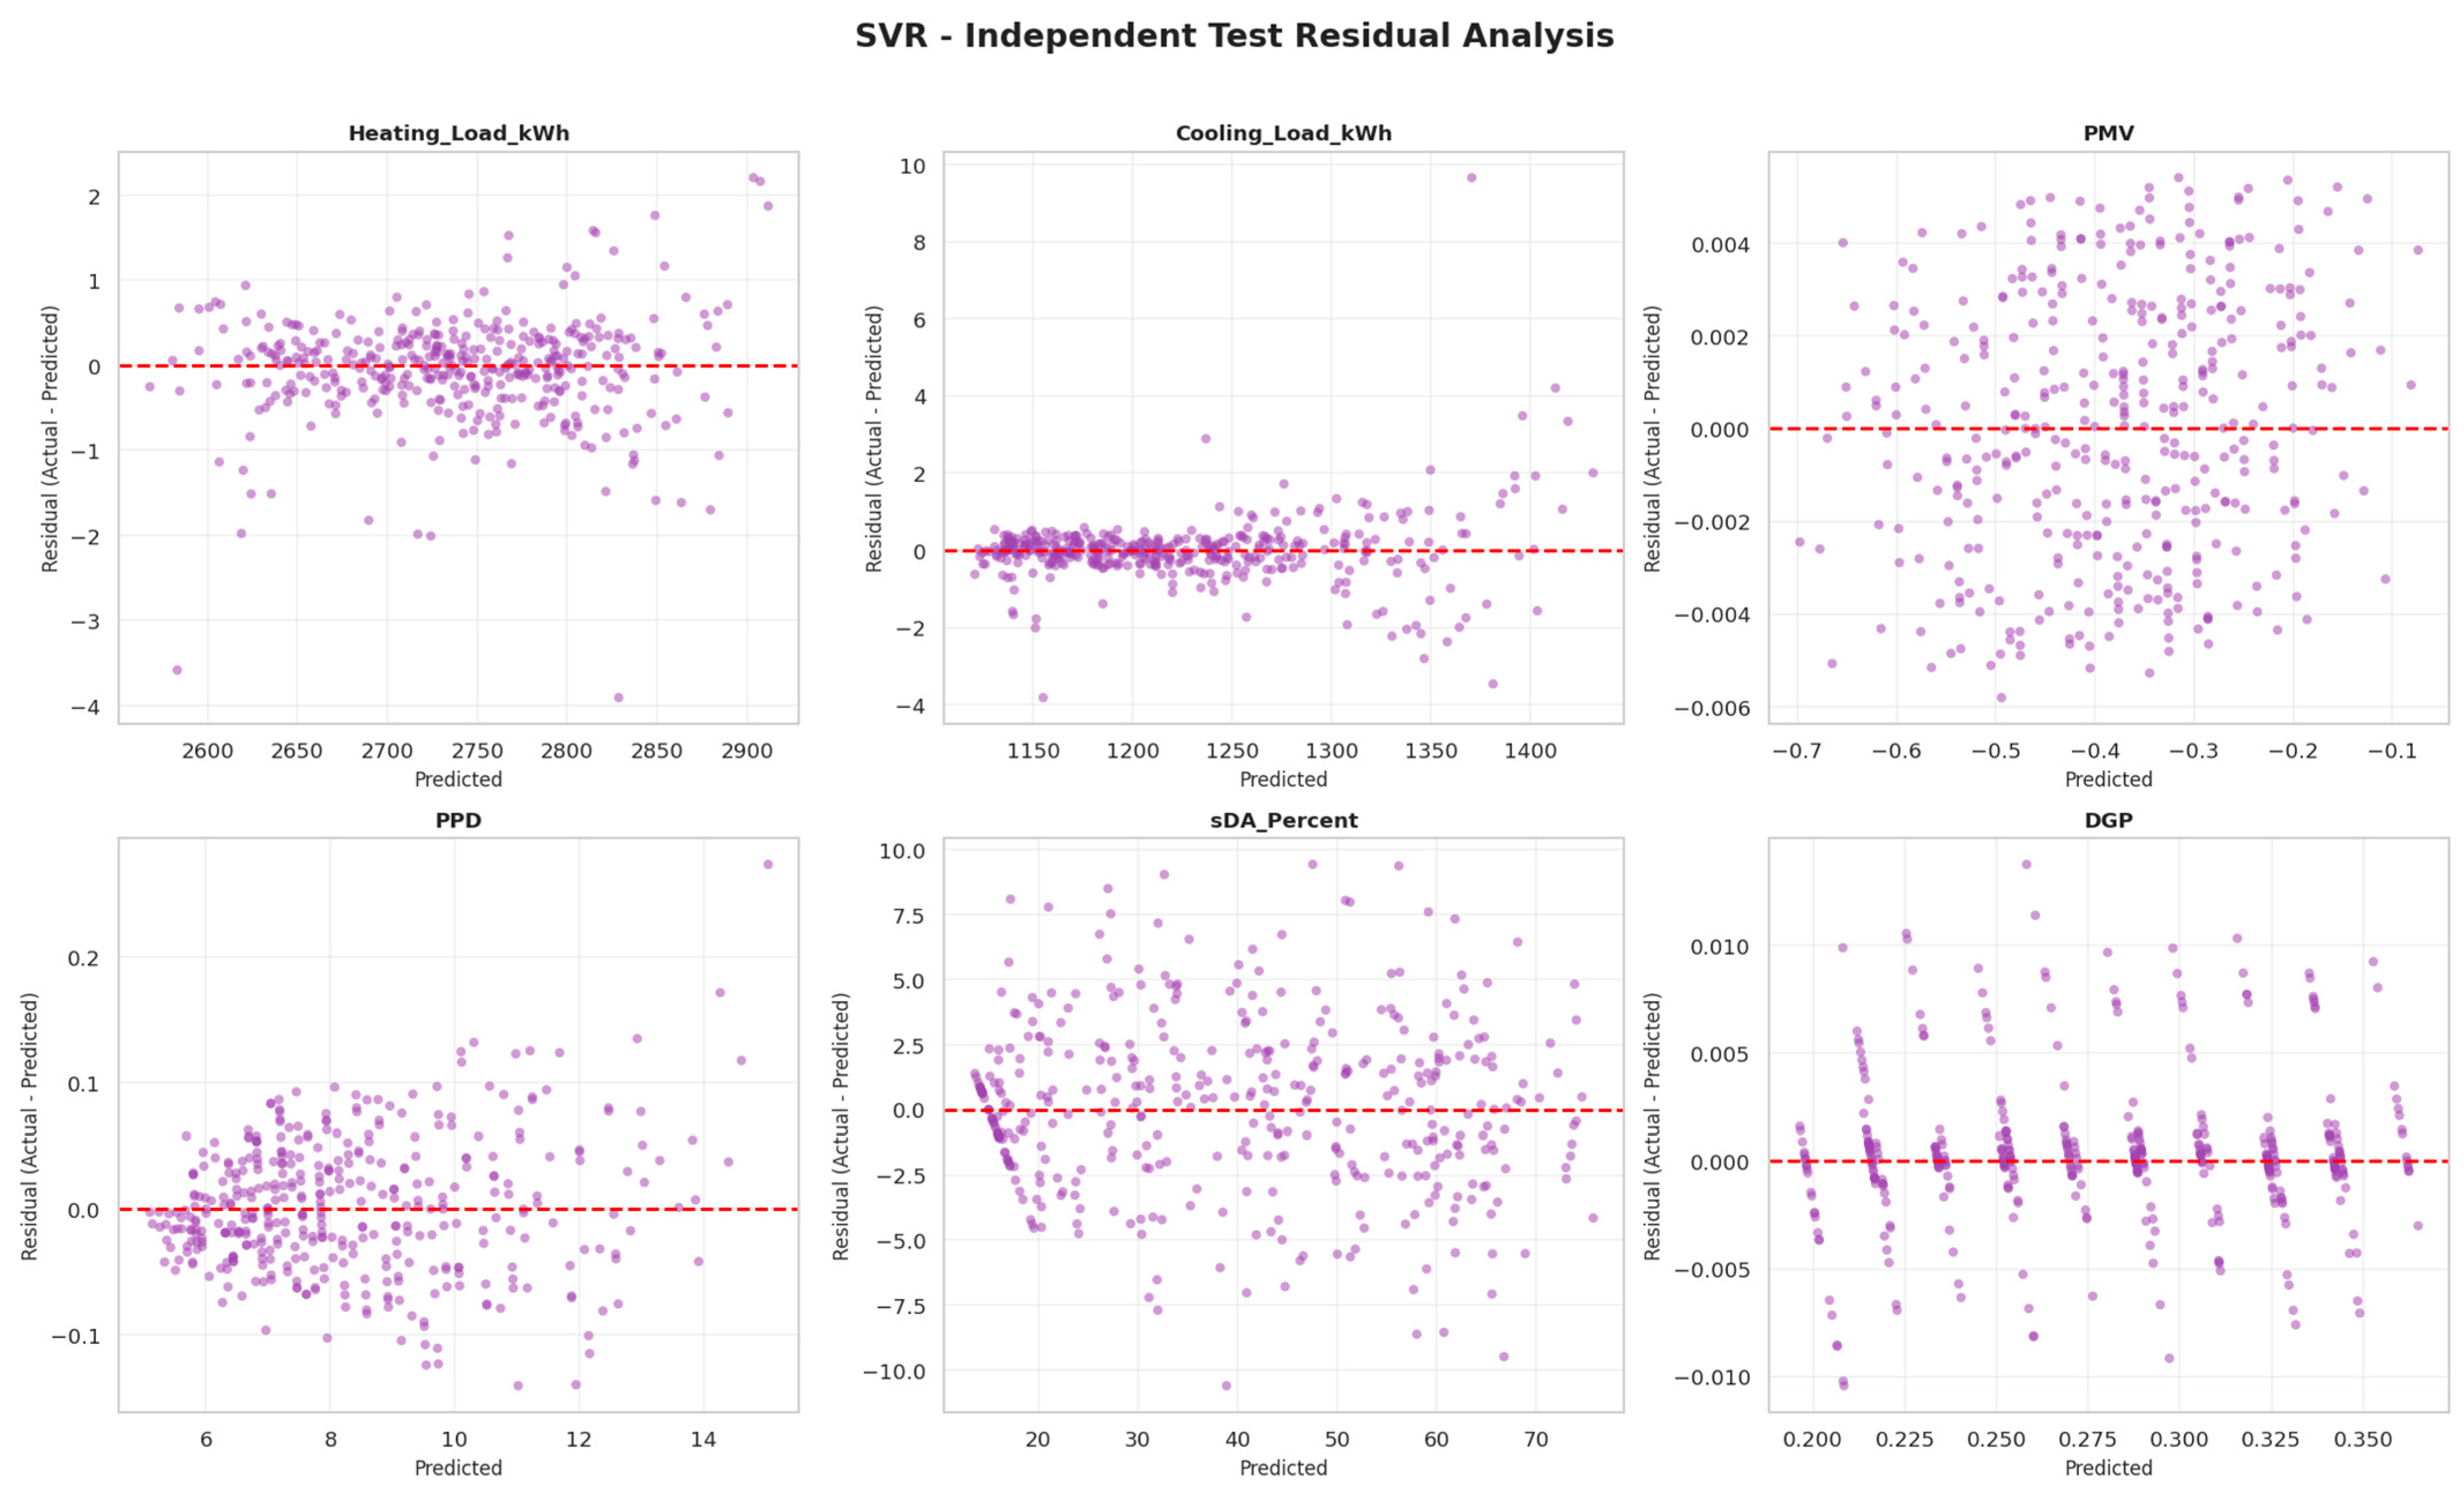
Figure A2.
ANN independent test residual analysis.
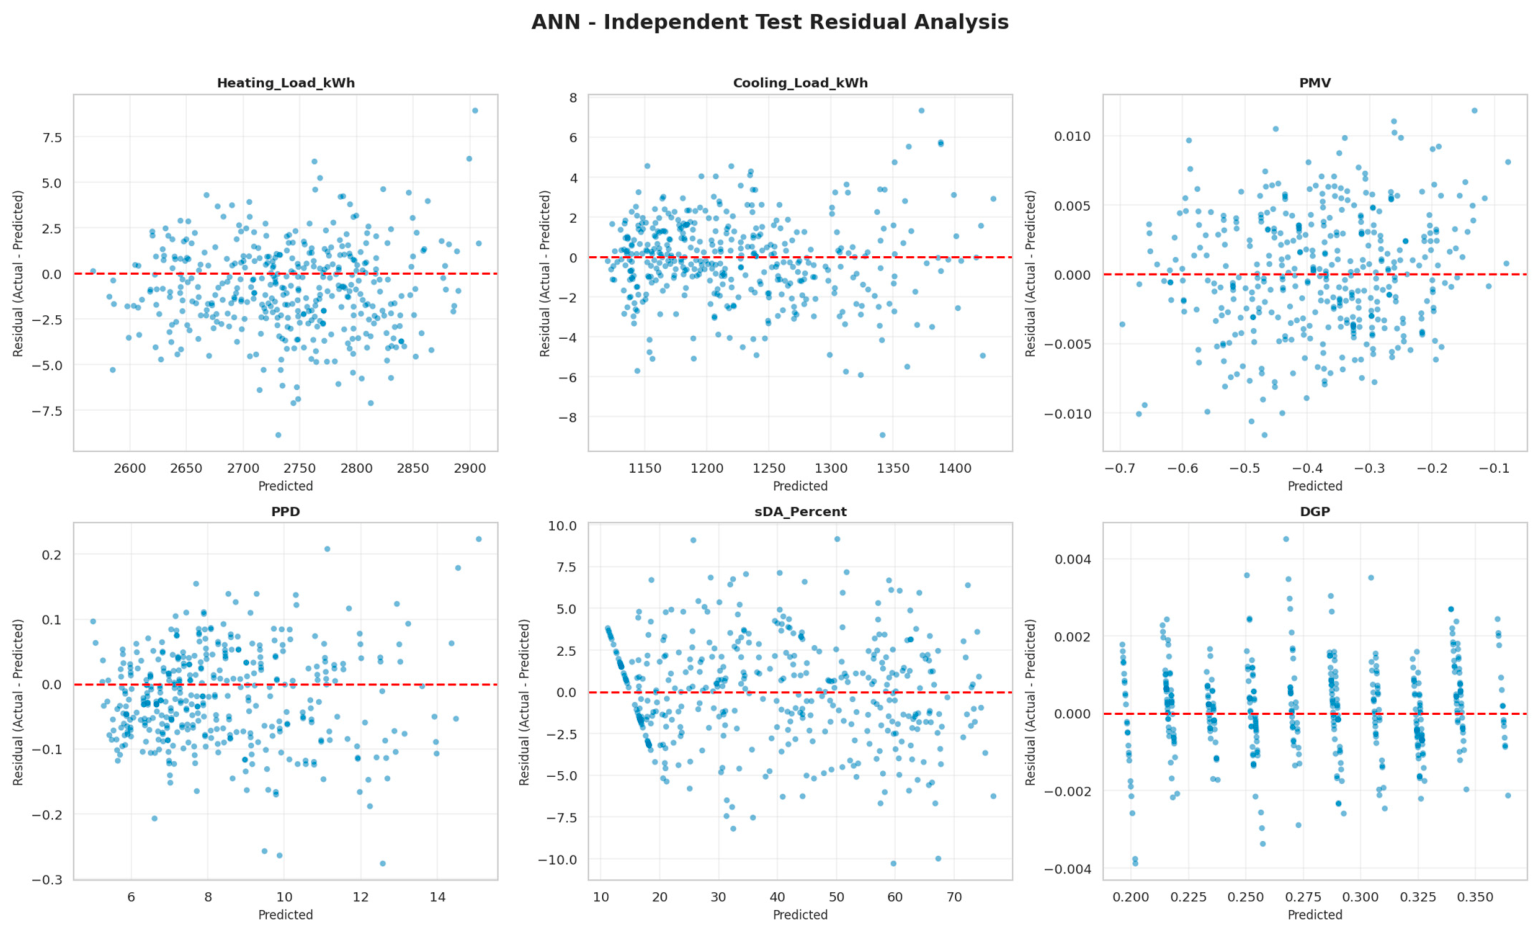
Figure A3.
XGBoost independent test residual analysis.
References
- Bak, J.; Yoon, S. Dwelling infiltration and heating energy demand in multifamily high-rise and low-energy buildings in Korea. Renew. Sustain. Energy Rev. 2021, 148, 111284. [Google Scholar] [CrossRef] [Scilit]
- Maduta, C.; Tsemekidi-Tzeinaraki, S.; Castellazzi, L.; Dagostino, D.; Melica, G.; Paci, D.; Bertoldi, P. Updates on the Energy Performance of Buildings Directive Implementation in the EU Member States; Publications Office of the European Union: Luxembourg, 2025. [Google Scholar] [CrossRef]
- Alves, V.; Romero Rincón, M.; Tudela, J.; Martínez Beltrán, P. Comparison of models for estimating air infiltration in dwellings and their impact on heating demand. Energy Effic. 2026, 19, 10. [Google Scholar] [CrossRef] [Scilit]
- Cardoso, V.E.M.; Pereira, P.F.; Ramos, N.M.M.; Almeida, R.M.S.F. The impacts of air leakage paths and airtightness levels on air change rates. Buildings 2020, 10, 55. [Google Scholar] [CrossRef] [Scilit]
- American Society of Heating, Refrigerating and Air-Conditioning Engineers (ASHRAE). ASHRAE Handbook–Fundamentals 2017, Chapter 16: Ventilation and Infiltration; American Society of Heating, Refrigerating and Air-Conditioning Engineers (ASHRAE): Atlanta, GA, USA, 2017. [Google Scholar]
- Iffa, E.; Kunwar, N.; Salonvaara, M.; Hun, D. Enhancing Commercial Building Energy Efficiency Through Automated Air Sealing; Springer: Berlin/Heidelberg, Germany, 2025; pp. 579–584. [Google Scholar] [CrossRef] [Scilit]
- González-Lezcano, R.A.; Contreras, G.S.; Iglesias Sanz, C.M.; Alambillaga, R.S.; López Fernández, E.J. Construction parameters that affect the air leaks of the envelope in dwellings in Madrid, Front. Built Environ. 2023, 9, 1220559. [Google Scholar] [CrossRef] [Scilit]
- Liu, X.; Liu, X.; Zhang, T.; Ooka, R.; Kikumoto, H. Comparison of winter air infiltration and its influences between large-space and normal-space buildings. Build. Environ. 2020, 184, 107183. [Google Scholar] [CrossRef] [Scilit]
- Poza-Casado, I.; Meiss, A.; Padilla-Marcos, M.Á.; Feijó-Muñoz, J. Airtightness and energy impact of air infiltration in residential buildings in Spain. Int. J. Vent. 2021, 20, 258–264. [Google Scholar] [CrossRef] [Scilit]
- Bhandari, M.; Hun, D.; Shrestha, S.; Pallin, S.; Lapsa, M. A simplified methodology to estimate energy savings in commercial buildings from improvements in airtightness. Energies 2018, 11, 3322. [Google Scholar] [CrossRef] [Scilit]
- Ren, Z.; Chen, D. Simulation of Air Infiltration of Australian Housing and its Impact on Energy Consumption. Energy Procedia 2015, 78, 2717–2723. [Google Scholar] [CrossRef] [Scilit]
- Ren, Z.; Chen, D. Estimation of air infiltration for Australian housing energy analysis. J. Build. Phys. 2015, 39, 69–96. [Google Scholar] [CrossRef] [Scilit]
- Liu, Y.; Li, B.; Yao, R.; Cao, X. Influence of Building Airtightness on Energy Consumption of Office Building in Chongqing. In Environmental Science and Engineering; Springer: Singapore, 2020; pp. 137–145. [Google Scholar] [CrossRef] [Scilit]
- Khemet, B.; Vyas, Y.; Todd, A. Case study comparing thermal energy demand intensity and peak power intensity in a renovated historic masonry school using measured and estimated enclosure airtightness. Results Eng. 2026, 32, 112005. [Google Scholar] [CrossRef] [Scilit]
- Wong, N.H.; Huang, B. Comparative study of the indoor air quality of naturally ventilated and air-conditioned bedrooms of residential buildings in Singapore. Build. Environ. 2004, 39, 1115–1123. [Google Scholar] [CrossRef] [Scilit]
- Lozinsky, C.H.; Casquero-Modrego, N.; Walker, I.S.; Less, B.D.; Graessle, Q.P.; Sohn, M.D. The impact of simplified window and exhaust fan assumptions on indoor air quality in multifamily buildings. Int. J. Vent. 2026, 25, 204–225. [Google Scholar] [CrossRef] [Scilit]
- Rodrigues, L.; Tubelo, R.; Vega Pasos, A.; Gonçalves, J.C.S.; Wood, C.; Gillott, M. Quantifying airtightness in Brazilian residential buildings with focus on its contribution to thermal comfort. Build. Res. Inf. 2021, 49, 639–660. [Google Scholar] [CrossRef] [Scilit]
- Kisilewicz, T.; Nowak-Dzieszko, K.; Rojewska-Warchał, M. Influence of building airtightness on the internal thermal comfort and air quality in the single family house. IOP Conf. Ser. Mater. Sci. Eng. 2019, 609, 032064. [Google Scholar] [CrossRef] [Scilit]
- Ji, W.; Zhao, B. Contribution of outdoor-originating particles, indoor-emitted particles and indoor secondary organic aerosol (SOA) to residential indoor PM2.5 concentration: A model-based estimation. Build. Environ. 2015, 90, 196–205. [Google Scholar] [CrossRef] [Scilit]
- Diapouli, E.; Chaloulakou, A.; Koutrakis, P. Estimating the concentration of indoor particles of outdoor origin: A review. J. Air Waste Manag. Assoc. 2013, 63, 1113–1129. [Google Scholar] [CrossRef] [Scilit] [PubMed]
- Fernández-Agüera, J.; Bros-Williamson, J.; Domínguez-Ruiz, V.; Domínguez-Amarillo, S. Airtightness of School Classrooms in Spain: Field Measurements and Retrofit Implications. Buildings 2026, 16, 2979. [Google Scholar] [CrossRef] [Scilit]
- Zhao, Z.; Zhang, Z.; Wang, Z.; Ferm, M.; Liang, Y.; Norbäck, D. Asthmatic symptoms among pupils in relation to winter indoor and outdoor air pollution in schools in Taiyuan, China. Environ. Health Perspect. 2008, 116, 90–97. [Google Scholar] [CrossRef] [Scilit] [PubMed]
- Wu, Z.; Xu, Y.; Wang, Z. Multi-objective optimization of energy, view, daylight and thermal comfort for building’s fenestration and shading system in hot-humid climates. PLoS ONE 2025, 20, e0325290. [Google Scholar] [CrossRef] [Scilit] [PubMed]
- Duan, H.; Dong, Y.; Ji, Q. Multi-objective optimization of windows and PV louvers on the south façade for cold-region office buildings using machine learning and NSGA-II. Build. Environ. 2026, 288, 113984. [Google Scholar] [CrossRef] [Scilit]
- Hosamo, H.H.; Tingstveit, M.S.; Nielsen, H.K.; Svennevig, P.R.; Svidt, K. Multiobjective optimization of building energy consumption and thermal comfort based on integrated BIM framework with machine learning-NSGA II. Energy Build. 2022, 277, 112479. [Google Scholar] [CrossRef] [Scilit]
- Duan, Y.; Hu, C.; Li, P.; Wei, Y.; Li, R.; Ding, X.; Yang, Y.; Qiao, J.; Zhang, T.; Gao, W. A data-driven interpretable framework for multi-objective optimization: Decoupling thermodynamic and economic constraints in cold-region rural dwelling retrofits. Energy 2026, 349, 140675. [Google Scholar] [CrossRef] [Scilit]
- Robertson, L.A. Pseudocode. In Encyclopedia of Information Systems; Elsevier: Amsterdam, The Netherlands, 2003; pp. 575–588. [Google Scholar] [CrossRef] [Scilit]
- Turkish State Meteorological Service. 2026. Available online: https://www.mgm.gov.tr/eng/forecast-cities.aspx (accessed on 9 October 2026).
- TS EN 13829: 2011-11; Thermal Performance of Buildings—Determination of Air Permeability of Buildings—Fan Pressurization Method. TSE: Ankara, Turkey, 2001.
- The Passive House Resource, Definition and Effects of Thermal Bridges. 2026. Available online: https://passipedia.org/basics/building_physics_-_basics/thermal_bridges/thermal_bridge_definition (accessed on 9 October 2026).
- ISO 4354; Wind Actions on Structures. International Organization for Standardization: Geneva, Switzerland, 2009.
- ASTM E779-19; Standard Test Method for Determining Air Leakage Rate by Fan Pressurization. ASTM International: West Conshohocken, PA, USA, 2019.
- ISO 9972:2015; Thermal Performance of Buildings—Determination of Air Permeability of Buildings—Fan Pressurization Method. International Organization for Standardization: Geneva, Switzerland, 2015.
- Passive House Resource, Airtightness in Old Buildings. 2026. Available online: https://passipedia.org/planning/refurbishment_with-_passive_house_components/thermal_envelope/airthigtness (accessed on 9 October 2026).
- Fanger, P.O. Thermal Comfort: Analysis and Applications in Environmental Engineering; Danish Technical Press: Copenhagen, Denmark, 1970. [Google Scholar]
- d’Ambrosio Alfano, F.R.; Ianniello, E.; Palella, B.I. PMV-PPD and acceptability in naturally ventilated schools. Build. Environ. 2013, 67, 129–137. [Google Scholar] [CrossRef] [Scilit]
- ClimateStudio. BREEAM Daylight 4a/c. Available online: https://climatestudiodocs.com/docs/daylightBREEAM4a.html (accessed on 20 September 2026).
- DIN EN 17037:2022; Daylight in Buildings; German Version EN 17037:2018+AC:2021+A1:2021. German Institute for Standardization: Berlin, Germany, 2022.
- Mustafaraj, G.; Marini, D.; Costa, A.; Keane, M. Model calibration for building energy efficiency simulation. Appl. Energy 2014, 130, 72–85. [Google Scholar] [CrossRef] [Scilit]
- Roberti, F.; Oberegger, U.F.; Gasparella, A. Calibrating historic building energy models to hourly indoor air and surface temperatures: Methodology and case study. Energy Build. 2015, 108, 236–243. [Google Scholar] [CrossRef] [Scilit]
- Palaić, D.; Štajduhar, I.; Ljubic, S.; Wolf, I. Development, Calibration, and Validation of a Simulation Model for Indoor Temperature Prediction and HVAC System Fault Detection. Buildings 2023, 13, 1388. [Google Scholar] [CrossRef] [Scilit]
- Zhan, J.; He, W.; Huang, J. Comfort, carbon emissions, and cost of building envelope and photovoltaic arrangement optimization through a two-stage model. Appl. Energy 2024, 356, 122423. [Google Scholar] [CrossRef] [Scilit]
- Shan, R.; Lai, W.; Tang, H.; Leng, X.; Gu, W. Residential Building Renovation Considering Energy, Carbon Emissions, and Cost: An Approach Integrating Machine Learning and Evolutionary Generation. Appl. Sci. 2025, 15, 1830. [Google Scholar] [CrossRef] [Scilit]
- Chegari, B.; Tabaa, M.; Simeu, E.; Moutaouakkil, F.; Medromi, H. Multi-objective optimization of building energy performance and indoor thermal comfort by combining artificial neural networks and metaheuristic algorithms. Energy Build. 2021, 239, 110839. [Google Scholar] [CrossRef] [Scilit]
- Xu, Y.; Zhang, G.; Yan, C.; Wang, G.; Jiang, Y.; Zhao, K. A two-stage multi-objective optimization method for envelope and energy generation systems of primary and secondary school teaching buildings in China. Build. Environ. 2021, 204, 108142. [Google Scholar] [CrossRef] [Scilit]
- Wu, C.; Pan, H.; Luo, Z.; Liu, C.; Huang, H. Multi-objective optimization of residential building energy consumption, daylighting, and thermal comfort based on BO-XGBoost-NSGA-II, Build. Environ. 2024, 254, 111386. [Google Scholar] [CrossRef] [Scilit]
- Khastar, S.; Bashirizadeh, F.; Jafari-Asl, J.; Safaeian Hamzehkolaei, N. Predicting the cooling and heating loads of energy efficient buildings: A hybrid machine learning approach. Clust. Comput. 2025, 28, 323. [Google Scholar] [CrossRef] [Scilit]
- Aghbalou, N.; Charki, A.; Errousso, H.; Filali, Y.; Alaoui, E.A.A. Building Energy Efficiency: Using Ensemble Learning to Forecast the Load on Heating, Ventilation, and Air Conditioning Systems. J. Eng. 2025, 2025, 4764874. [Google Scholar] [CrossRef] [Scilit]
- Cai, W.; Wen, X.; Li, C.; Shao, J.; Xu, J. Predicting the energy consumption in buildings using the optimized support vector regression model. Energy 2023, 273, 127188. [Google Scholar] [CrossRef] [Scilit]
- Zhang, G.; Ge, Y.; Pan, X.; Sadat Afsharzadeh, M.; Ghalandari, M. Optimization of energy consumption of a green building using PSO-SVM algorithm. Sustain. Energy Technol. Assess. 2022, 53, 102667. [Google Scholar] [CrossRef] [Scilit]
- Khajavi, H.; Rastgoo, A. Improving the prediction of heating energy consumed at residential buildings using a combination of support vector regression and meta-heuristic algorithms. Energy 2023, 272, 127069. [Google Scholar] [CrossRef] [Scilit]
- Vukadinović, A.; Radosavljević, J.; Đorđević, A.; Protić, M.; Petrović, N. Multi-objective optimization of energy performance for a detached residential building with a sunspace using the NSGA-II genetic algorithm. Sol. Energy 2021, 224, 1426–1444. [Google Scholar] [CrossRef] [Scilit]
- Firouzabad, M.R.; Jahangir, M.H. Multi-objective optimization of residential energy scheduling using NSGA-II: A scenario-based weighted evaluation of thermal comfort, cost and environmental performance. Energy Rep. 2026, 16, 109528. [Google Scholar] [CrossRef] [Scilit]
- Wang, M.; Li, Y.; Yuan, H.; Zhou, S.; Wang, Y.; Ikram, R.M.A.; Li, J. An XGBoost-SHAP approach to quantifying morphological impact on urban flooding susceptibility. Ecol. Indic. 2023, 156, 111137. [Google Scholar] [CrossRef] [Scilit]
- Özlük, R.; Yıldız, Y. The Use of The SHAP Algorithm in Building Energy Efficiency: A Bibliometric Analysis. KAPU Trak. Mimar. Tasar. Derg. 2025, 5, 129–140. [Google Scholar] [CrossRef] [Scilit]
- Li, Y.; Gao, F.; Yu, J.; Fei, T. Machine learning based thermal comfort prediction in office spaces: Integrating SMOTE and SHAP methods. Energy Build. 2025, 329, 115267. [Google Scholar] [CrossRef] [Scilit]
- Cui, X.; Lee, M.; Koo, C.; Hong, T. Energy consumption prediction and household feature analysis for different residential building types using machine learning and SHAP: Toward energy-efficient buildings. Energy Build. 2024, 309, 113997. [Google Scholar] [CrossRef] [Scilit]
- Turkish Standards Institution. Thermal Insulation Requirements for Buildings; Turkish Standards Institution: Ankara, Türkiye, 2013. [Google Scholar]
- Passive House Institute. Passive House—EnerPHit—PHI Low Energy Building; Version 10c (SI), Valid with PHPP Version 10; Passive House Institute: Darmstadt, Germany, 2023. [Google Scholar]
- TNI 73 0330:2010; Zjednodušené Výpočtové Hodnocení a Klasifikace Obytných Budov s Velmi Nízkou Potřebou Tepla na Vytápění—Bytové Domy. Úřad pro technickou normalizaci, metrologii a státní zkušebnictví (ÚNMZ): Prague, Czech Republic, 2010. (In Czech)
- ANSI/ASHRAE Standard 55-2017; Thermal Environmental Conditions for Human Occupancy. ASHRAE: Atlanta, GA, USA, 2017.
- Ünlütürk, M.S.; Özlük, R. Optimising Daylight Performance in Healthcare Buildings with a Computational Framework Under the Impact of the Climate Crisis. J. Daylighting 2026, 13, 333–346. [Google Scholar] [CrossRef] [Scilit]
- Afzal, S.; Shokri, A.; Ziapour, B.M.; Shakibi, H.; Sobhani, B. Building energy consumption prediction and optimization using different neural network-assisted models; comparison of different networks and optimization algorithms. Eng. Appl. Artif. Intell. 2024, 127, 107356. [Google Scholar] [CrossRef] [Scilit]
- Zhang, W.; Ma, Z.; Qiu, H.; Pan, Y.; Shi, Y.; Zhang, L. Machine learning-boosted multi-objective optimization of integrated shading systems: Enhancing daylight availability, glare protection, and energy savings. Build. Environ. 2025, 280, 113124. [Google Scholar] [CrossRef] [Scilit]
- Araújo, G.R.; Gomes, R.; Gomes, M.G.; Guedes, M.C.; Ferrão, P. Surrogate Models for Efficient Multi-Objective Optimization of Building Performance. Energies 2023, 16, 4030. [Google Scholar] [CrossRef] [Scilit]
- Del Ama Gonzalo, F.; Moreno Santamaría, B.; Montero Burgos, M.J. Assessment of Building Energy Simulation Tools to Predict Heating and Cooling Energy Consumption at Early Design Stages. Sustainability 2023, 15, 1920. [Google Scholar] [CrossRef] [Scilit]
- Allgaier, J.; Pryss, R. Cross-Validation Visualized: A Narrative Guide to Advanced Methods. Mach. Learn. Knowl. Extr. 2024, 6, 1378–1388. [Google Scholar] [CrossRef] [Scilit]
- Chou, J.S.; Bui, D.K. Modeling heating and cooling loads by artificial intelligence for energy-efficient building design. Energy Build. 2014, 82, 437–446. [Google Scholar] [CrossRef] [Scilit]

Disclaimer/Publisher’s Note: The statements, opinions and data contained in all publications are solely those of the individual author(s) and contributor(s) and not of MDPI and/or the editor(s). MDPI and/or the editor(s) disclaim responsibility for any injury to people or property resulting from any ideas, methods, instructions or products referred to in the content. |
© 2026 by the authors. Licensee MDPI, Basel, Switzerland. This article is an open access article distributed under the terms and conditions of the Creative Commons Attribution (CC BY) license.