


Abstract
Historical masonry minarets are particularly susceptible to earthquake-induced damage because their slender configuration is combined with the inherently low tensile capacity and limited ductility of masonry. Reliable characterization of their dynamic properties is therefore an important prerequisite for seismic evaluation and the planning of appropriate conservation measures. In this study, a data-driven methodology is developed to estimate the first and second natural frequencies of masonry minarets. A database comprising 1146 finite element models with different mechanical properties, representing 191 unique geometry groups, was developed through parametric modal analyses in Abaqus. The predictor set comprised total height H, lower and upper inner diameters D0 and Dtop, wall thickness t, base dimension B, and the stiffness–density-related parameter . Random Forest, XGBoost, LightGBM, and CatBoost models were evaluated using geometry-grouped nested five-fold cross-validation, while explicit equations were derived using linear and symbolic regression. CatBoost achieved the best overall machine-learning performance, with mean outer-test R2 values of 0.9597 and 0.9610 for f1 and f2, respectively. SHAP analyses identified total height and as the dominant predictors. Symbolic regression provided substantially more accurate explicit equations than linear regression and achieved predictive performance comparable to the best machine-learning-based models. An additional mechanically scaled geometry-only baseline achieved mean outer-test R2 values of 0.8222 and 0.8217 for the first and second frequencies, respectively, improving on ordinary additive linear regression while remaining less accurate than the more flexible models. The proposed framework provides an accurate, interpretable, and computationally efficient surrogate for predicting finite element-derived natural frequencies within the investigated parameter domain. However, the reported predictive performance reflects agreement with the numerical reference models, and experimental validation is required before applying the proposed models to existing masonry minarets.
1. Introduction
Towers and minarets belonging to the history of masonry culture represent significant parts of the cultural heritage, being not only architecturally different but also important from the historical and symbolic point of view. At the same time, they are well-known for being the most seismically susceptible structures. The vulnerability of such objects is explained mainly by the combination of slender geometry, low tensile strength, lack of ductility, differences in wall thicknesses, geometrical irregularities, and, finally, the initial design aimed at withstanding the forces of weight rather than seismically induced ones [1,2,3,4]. As a result, the cantilever-like behavior of the structures is expected when subjected to earthquake loading. It may be followed by brittle performance, localization of damage accumulation, and, ultimately, collapse [1,2,3,4]. Nevertheless, structural properties are not the only factors influencing the seismic behavior of masonry minarets. Material degradation, soil–structure interaction, foundation properties, and interaction with adjacent buildings can also significantly influence seismic behavior [5,6,7].
Significant progress has been made in terms of understanding the seismic performance and dynamic behavior of historical masonry towers and minarets. Computational analyses, including finite element models, were found to be helpful for assessing the vibration frequencies, stress concentration areas, displacement requirements, and potential damage modes associated with such structures [8,9,10,11,12,13]. At the same time, field Operational Modal Analysis (OMA) tests and model updating procedures provided researchers with sufficient information about the real-life dynamics of minaret-type structures [7,14,15,16,17,18,19]. These experimental investigations highlight the importance of field measurements for identifying the actual dynamic characteristics of masonry structures and evaluating the reliability of numerical models. Although finite element analyses provide a systematic framework for investigating the influence of geometric and material properties, their predictions may differ from experimentally measured frequencies due to uncertainties in material properties, boundary conditions, structural deterioration, and modeling simplifications. More broadly, the importance of independent experimental validation has also been demonstrated in recent finite element modeling studies [20]. Therefore, the predictive accuracy of data-driven models developed using numerical results should be distinguished from the physical accuracy of the underlying finite element models.
Shake table tests have also proved beneficial by offering a chance to observe the responses of minarets to earthquake motions [21]. In addition to this, the research dedicated to soil–structure interaction and structural shape showed that the presence of soft soil layers, foundation properties, and the presence or lack of adjacent buildings can significantly change the seismic performance and collapse mechanisms of masonry minarets [4,5,6,7,22]. On the other hand, base zones, transition zones, and balconies were also found to be vulnerable regions due to the high stresses and geometric discontinuity associated with such locations [3,23,24,25,26]. Finally, investigations related to strengthening and post-earthquake evaluations helped identify such critical zones where specific vulnerabilities must be considered [27,28,29,30,31].
Despite the state-of-the-art studies, a clear gap remains in the development of broad, systematic, and generalizable predictive frameworks that can account for the large number of physical parameters governing the dynamic behavior of masonry minarets [8,32]. A substantial part of the existing literature relies on detailed numerical or experimental investigations of a limited number of real structures. Although these studies are highly valuable for understanding structural behavior and failure mechanisms, their applicability to rapid prediction and generalized modelling remains limited. On the other hand, empirical relationships and data-driven models have been proposed for estimating the fundamental frequency or vibration period; however, most of these models are based on relatively small datasets, restricted parameter ranges, or specific structural typologies [33,34,35,36,37,38]. More recent studies have also extended the field toward frequency-based damage detection, AI-assisted diagnosis, and long-term structural health monitoring [39,40,41,42], while machine learning and optimization-based approaches have shown promise in seismic vulnerability assessment [43]. Nevertheless, for masonry minarets, there is still a lack of predictive models that are simultaneously accurate, interpretable, and developed from a large-scale parametric database capable of estimating both the first and second natural frequencies. In particular, the systematic comparison of machine learning methods and explicit-form regression equations on a common database, together with the interpretation of parameter effects through explainable artificial intelligence techniques, has not yet been sufficiently addressed. Therefore, the principal research gap lies in the absence of an integrated numerical modeling framework that combines predictive accuracy, computational efficiency, and interpretability within a systematically generated parametric database.
To address the existing gap, the present study aims to develop accurate and interpretable predictive models for estimating the first and second natural frequencies of masonry minarets using a large-scale parametric database. For this purpose, a database comprising 1146 finite element models with different mechanical properties (realizations), representing 191 unique geometry groups, was developed, and their dynamic characteristics were obtained through modal analysis. Based on this database, the predictive performance of Random Forest, XGBoost, LightGBM, and CatBoost was evaluated using a geometry-grouped nested cross-validation framework. In addition, explicit predictive equations were derived using linear and symbolic regression techniques. A mechanically scaled geometry-only regression baseline was also evaluated to distinguish the predictive benefit of nonlinear data-driven models from that obtainable through the known elastic-modulus-to-density frequency scaling. A SHAP-based interpretability framework was further employed to quantify the relative influence of the input parameters on the model predictions. In this manner, the study seeks not only to develop high-performing predictive tools, but also to provide a clearer and more systematic understanding of the governing parameters controlling the dynamic behavior of masonry minarets. The proposed framework is intended to provide computationally efficient surrogate predictions of finite element-derived natural frequencies within the investigated geometric and material parameter domain. Its present scope is limited to reproducing the dynamic characteristics of the numerical models, while independent experimental validation is required before extending the approach to the assessment of existing historical minarets.
2. Materials and Methods
In this section, the combination of Finite Element Analysis (FEA) with the use of prediction models based on data is presented as an efficient and robust approach towards estimating the natural frequencies of masonry minarets. First, several parametric models of masonry minarets with different geometrical and physical properties have been developed in the Abaqus software, and modal analyses were performed on each model so as to develop a database. The database includes the fundamental frequency parameters of the dynamic response of the minarets. Machine-learning, linear-regression, and symbolic-regression approaches were employed to develop predictive models and explicit equations for estimating finite element-derived natural frequencies within the investigated numerical parameter domain.
2.1. Finite Element Modeling and Data Generation
The parametric geometry of the masonry minarets was defined using five primary variables: total height (H), lower inner diameter (D0), upper inner diameter (Dtop), wall thickness (t), and square base dimension (B). The investigated geometric ranges were established based on representative dimensions of existing masonry minarets. The three-dimensional models included the base, transition region, shaft, balcony, and upper section. While the five primary geometric parameters were varied, the remaining geometric characteristics were kept constant throughout the numerical models to ensure consistency. Specifically, the base height was fixed at 4.0 m, the transition region height at 0.9 m, and the balcony height at 1.0 m, with a balcony projection of 0.60 m. The adopted geometric representation was intended to capture the overall mass and stiffness characteristics of the minarets rather than detailed architectural features. Accordingly, internal staircase configurations, the dimensions and locations of individual openings, and detailed balcony support and connection features were not independently parameterized. The balcony was represented through its simplified geometric dimensions, while the potential effects of local architectural details were not separately investigated. Furthermore, the generated geometries satisfied the geometric constraints Dtop ≤ D0 and D0 + 2t ≤ B.
Figure 1 below shows the schematic illustration of the geometrical parameters considered in this study along with the FEM and mesh discretization for an example minaret.
Figure 1.
Geometry definition and finite element model of a masonry minaret.
Masonry was idealized as a homogeneous, isotropic, and linear-elastic continuum using an equivalent macro-modeling approach. The masonry units and mortar joints were not modeled separately; instead, their overall mechanical behavior was represented through equivalent material properties. The elastic modulus (E) and mass density (ρ) were varied according to the material combinations considered in the database, whereas Poisson’s ratio was kept constant at 0.25 for all finite element models. This idealization was adopted to investigate the influence of geometric and material properties on the global modal characteristics of masonry minarets. The modal analyses were performed as undamped eigenvalue analyses; therefore, no viscous or modal damping coefficients were assigned. Accordingly, the reported frequencies represent undamped natural frequencies.
When conducting finite element analyses, the C3D10 element was selected because it is a ten-node tetrahedral solid element capable of simulating complex geometries for masonry minarets. This element allowed for more consistent meshing of minaret geometry models that have complex features such as curved surfaces and converging cross sections. Also, the 3D solid element formulation would allow for better modeling of mass and stiffness distribution. The boundary conditions applied to the models included the assumption that all degrees of freedom are constrained at the nodes of minaret models in contact with the ground surface. The structure is considered fixed at the foundation. The fixed-base assumption was adopted as a consistent reference idealization to isolate the effects of geometric and material variations on the natural frequencies across the parametric database. This assumption neglects foundation flexibility and soil–structure interaction, which may influence the dynamic characteristics of existing minarets. Accordingly, the developed surrogate models do not account for these effects and should be interpreted within the adopted boundary-condition assumptions. The modal analyses were performed directly on the unstressed initial configuration without a preceding gravity-load step. Consequently, gravity-induced initial stresses and their associated geometric stiffness effects were not considered in the eigenvalue analysis. However, the mass distribution of each minaret was accounted for through the assigned material density. This assumption provided a consistent basis for comparing the natural frequencies obtained from different geometric and material configurations.
For each finite element model, the frequencies were extracted in ascending order, with f1 and f2 assigned to the first and second frequencies, respectively. The corresponding deformation patterns indicated that the first two modes represented global lateral bending. Due to the approximately symmetric geometry of the minarets, these modes were associated with closely spaced natural frequencies in approximately orthogonal horizontal directions. Since the predominant bending directions may interchange between different geometric configurations, the modes were consistently identified according to their frequency order rather than a predefined X or Z direction. The physical characteristics of the first four vibration modes and their effective modal mass participation ratios are presented in Section 3.1. No separate mode-shape-based tracking was performed across different geometric configurations; therefore, f1 and f2 were defined by their frequency order and do not necessarily correspond to the same predominant bending direction throughout the dataset.
A mesh convergence assessment was conducted to investigate the sensitivity of the first two natural frequencies (f1 and f2) to finite element discretization. Three representative masonry minaret configurations were considered: a typical minaret, a thin-walled minaret with the minimum wall thickness of 0.14 m, and a highly slender minaret. For each configuration, modal analyses were performed using ten different mesh sizes ranging from 0.10 to 1.00 m, while the geometric characteristics, material properties, and boundary conditions were kept unchanged. The finest investigated mesh size of 0.10 m was adopted as the reference for calculating the relative frequency differences. The relative difference for each frequency was calculated as:
where fi(h) is the natural frequency obtained using mesh size h, and fi(href) is the corresponding frequency obtained using the reference mesh size of 0.10 m. Figure 2 presents the variations in the first two natural frequencies with mesh refinement for the three representative configurations.
Figure 2.
Mesh convergence assessment of the first two natural frequencies for three representative masonry minaret configurations: (a) typical minaret, (b) thin-walled minaret, and (c) slender minaret. The variations in f1 and f2 are presented for mesh sizes ranging from 0.10 to 1.00 m.
The results indicate that the first two natural frequencies progressively stabilize with mesh refinement for all three representative configurations. Further refinement from 0.15 to 0.10 m resulted in relative frequency differences not exceeding 0.17%, indicating a tendency toward numerical convergence. For the originally adopted mesh size of 0.30 m, the relative differences in f1 and f2 were 0.64% and 0.64% for the typical minaret, 1.52% and 1.39% for the thin-walled minaret, and 0.43% and 0.49% for the slender minaret, respectively. The maximum relative difference was therefore 1.52%, observed for the first natural frequency of the thin-walled configuration.
For the thin-walled configuration (t = 0.14 m), inspection of the finite element mesh confirmed that the adopted global mesh size of 0.30 m resulted in a single C3D10 element layer across the minimum wall thickness. This limited through-thickness discretization contributes to the higher mesh sensitivity observed for this configuration, with relative frequency differences of 1.52% and 1.39% for f1 and f2, respectively, compared with the 0.10 m reference mesh. Nevertheless, the 0.30 m mesh was retained as a practical compromise between computational efficiency and accuracy in estimating global natural frequencies across the 1146 finite element realizations. The adopted discretization is not considered fully mesh-independent throughout the investigated parameter domain, and more refined meshes are required for accurate local stress and strain predictions.
2.2. Parametric Dataset of Masonry Minarets
The parametric dataset was established to investigate the effects of geometric and material properties on the natural frequencies of masonry minarets. A total of 191 unique geometric configurations were considered, with each configuration characterized by five geometric parameters: total height (H), lower inner diameter (D0), upper inner diameter (Dtop), wall thickness (t), and square base dimension (B). For each geometry, six distinct combinations of elastic modulus (E) and mass density (ρ) were assigned, resulting in 1146 finite element model realizations. The material properties were assigned from discrete candidate values, with elastic modulus ranging from 500 to 6000 MPa in increments of 100 MPa and mass density ranging from 1200 to 2700 kg/m3 in increments of 100 kg/m3. Each geometric configuration was associated with six distinct combinations of E and ρ. These combinations were not identical across all geometric configurations, resulting in 634 different material-property pairs within the complete database. The elastic modulus (E) and mass density (ρ) were considered as separate material parameters, with six distinct E–ρ combinations assigned to each geometry. The resulting combinations exhibited negligible linear correlation (Pearson correlation coefficient, r = 0.013), indicating that the two properties were approximately uncorrelated within the investigated numerical dataset.
The material combinations varied among geometry groups rather than representing six identical material sets repeated throughout the database. The geometric parameters considered were the total height H(m), measured from the ground level to the top of the minaret; the lower inner diameter D0 (m); the upper inner diameter Dtop (m); the wall thickness t (m); and the base dimension B (m), defined as the side-to-side distance of the square base. The material parameters comprised the modulus of elasticity E(MPa) and density ρ (kg/m3). The output variables were the first and second natural frequencies, denoted as f1 and f2 (Hz), obtained from the finite element eigenvalue analyses. These frequencies corresponded to the two lowest global lateral bending modes and were identified according to their ascending frequency order. For the subsequent data-driven analyses, the material properties were represented through the derived parameter .
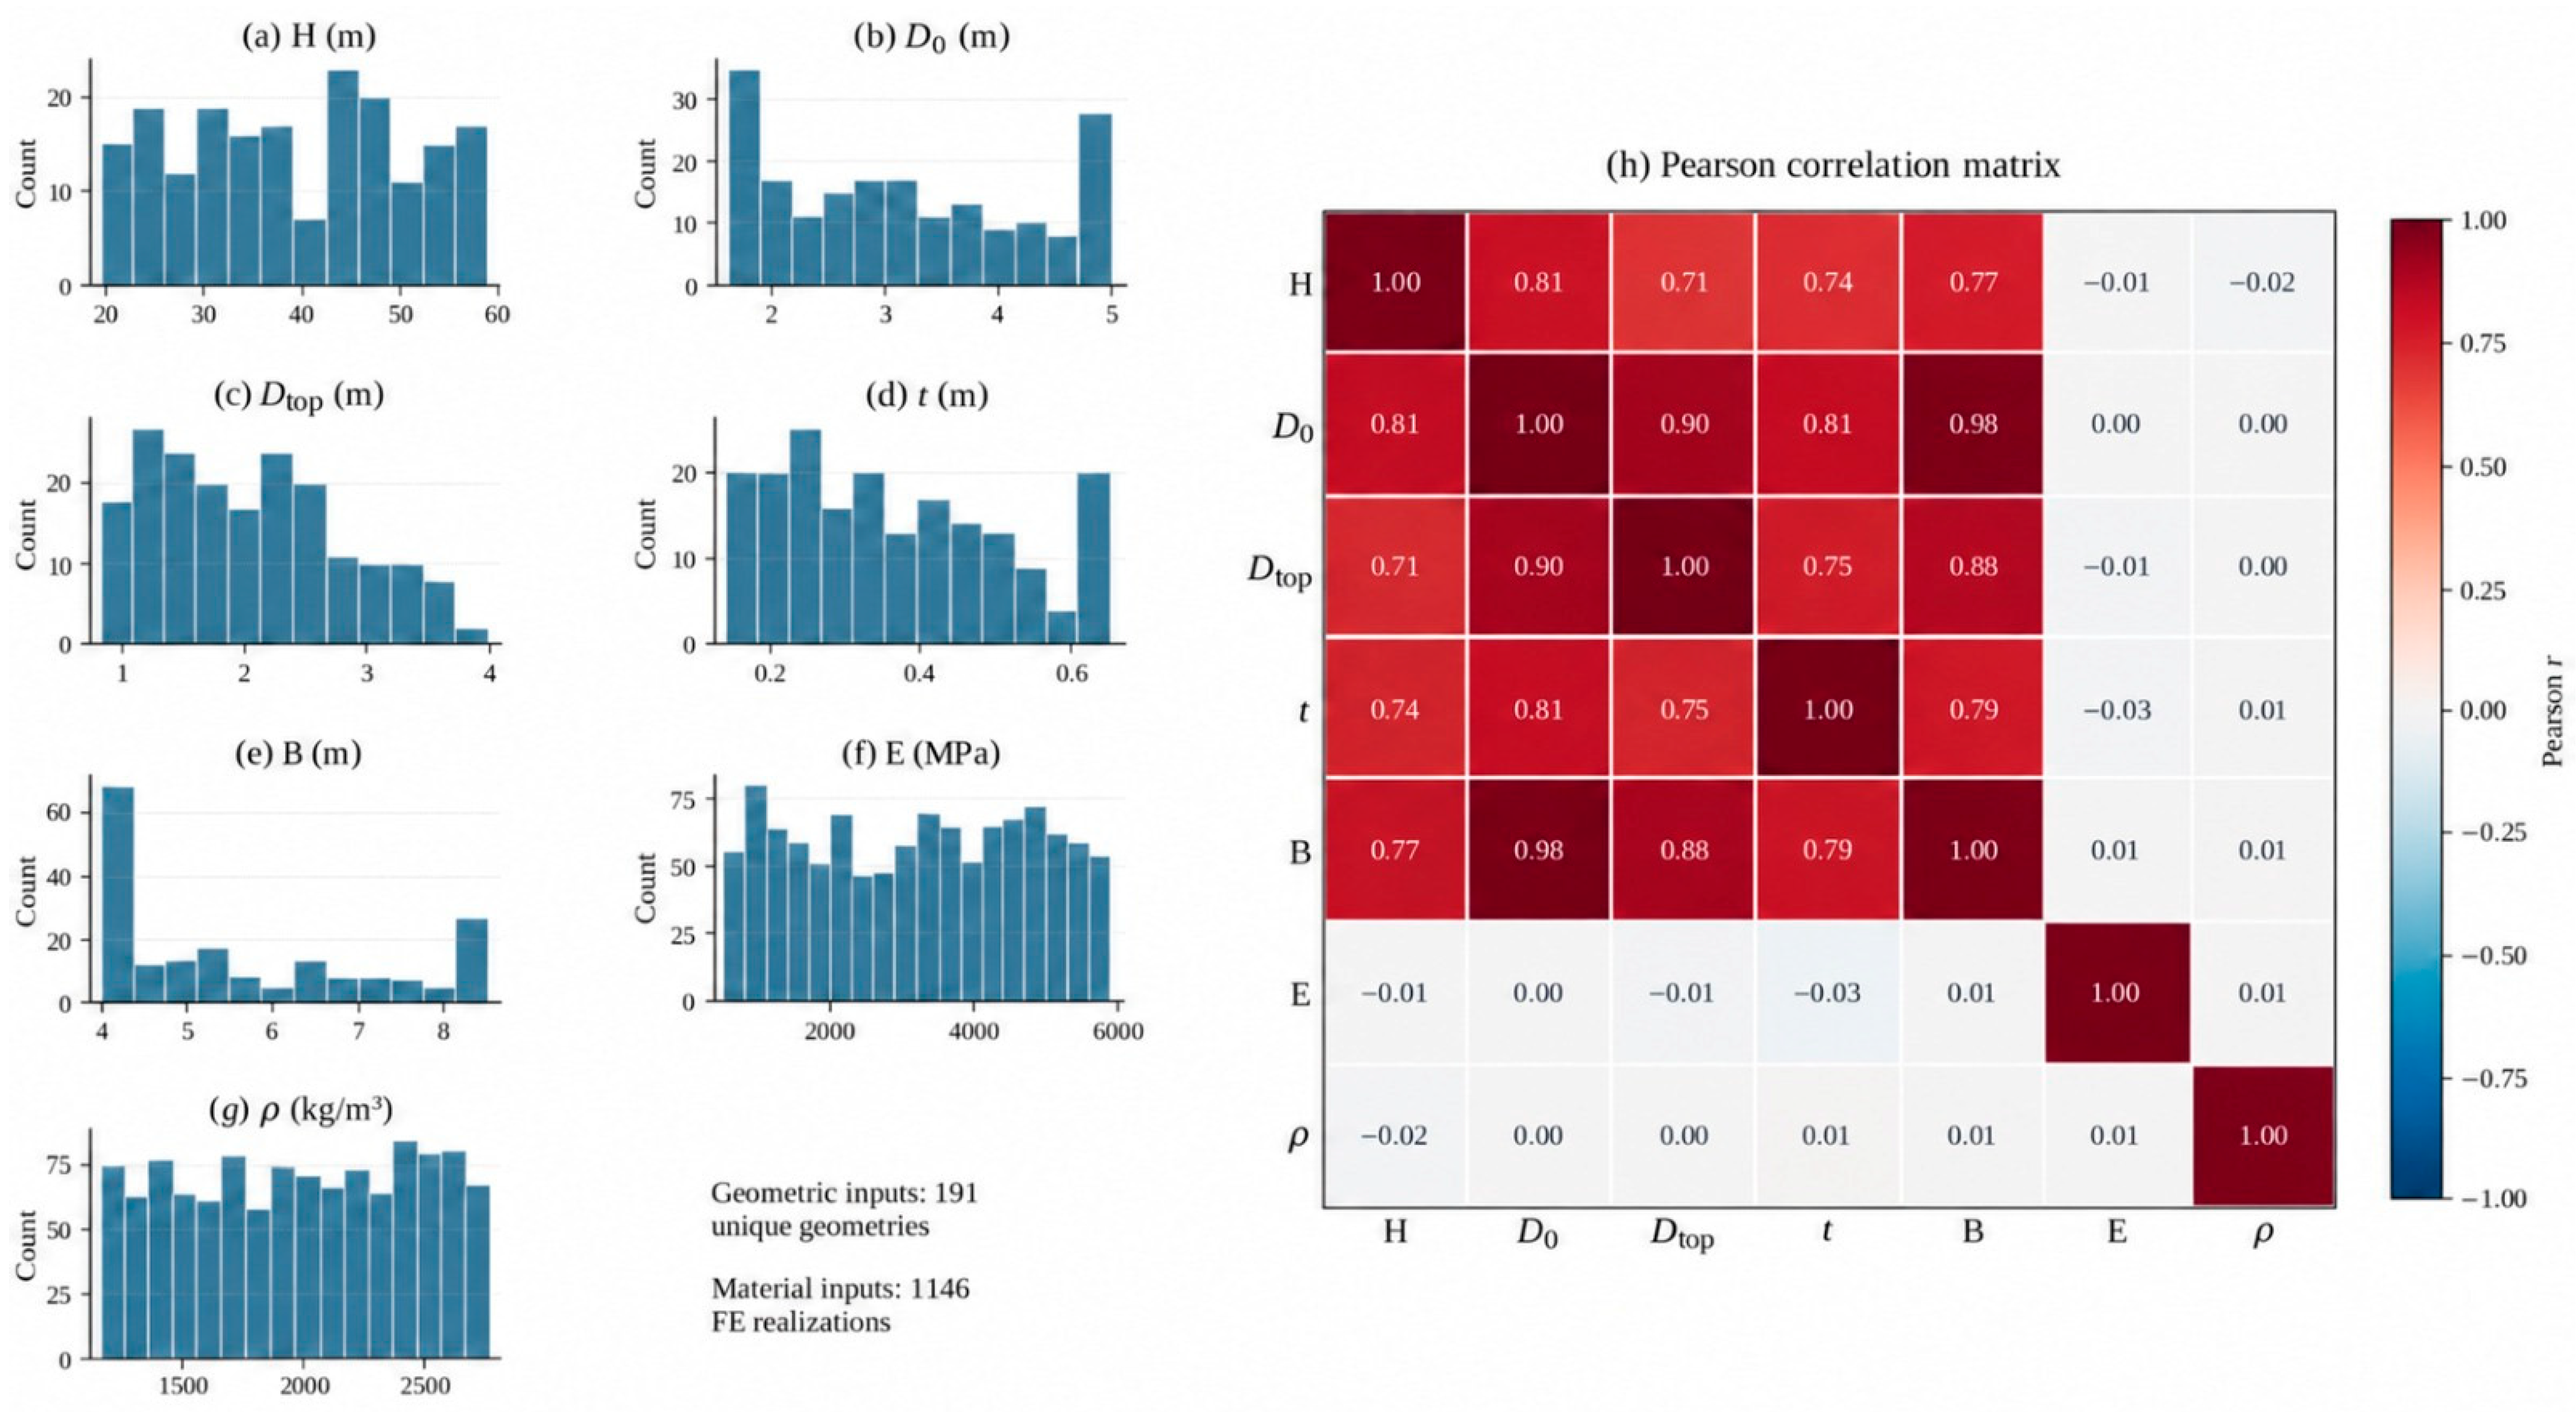
The input parameters used in the study and their corresponding ranges are listed in Table 1. The total height changes from 19.0 m to 60.0 m; the inner diameter of the base varies between 1.6 m and 5.0 m; the upper inner diameter changes from 0.82 m to 4.0 m; the thickness of the minaret walls is between 0.14 m and 0.65 m; the base dimension varies from 4.0 m to 8.5 m. As for the material parameters, the modulus of elasticity changes from 500 MPa to 6000 MPa, and the density from 1200 kg/m3 to 2700 kg/m3. These intervals represent not only the specific type of minaret but also a wide range of masonry minarets differing in size, rigidity, and weight. The selected ranges for total height, shaft diameter, elastic modulus, and mass density were defined with reference to representative values reported for historical masonry minarets in Türkiye [36], while the remaining geometric ranges were selected to cover broader parametric variations.
Table 1.
Selected geometric and material parameter ranges used for generating the finite element database.
The geometric parameter ranges were established based on representative dimensional characteristics of existing masonry minarets. The geometric configurations were generated through a constrained, rule-based random sampling procedure. Initial geometric parameters were established using prescribed ranges and relationships involving shaft height, slenderness ratio, tapering ratio, and wall thickness-to-diameter ratio. The resulting dimensions were adjusted according to the geometric constraints and admissible parameter ranges, rather than being generated through independent random sampling or a full-factorial design. The square base dimension (B) was determined from the lower inner diameter (D0) using the relationship B = min(8.5, max(4.0, 1.7D0)), with all dimensions expressed in meters. Accordingly, B was not independently sampled but was constrained to the range of 4.0–8.5 m. Only geometrically feasible configurations were retained in the final dataset, with all 191 configurations satisfying the conditions Dtop ≤ D0 and D0 + 2t ≤ B.
The selected ranges of the geometric parameters were defined to represent variations in height, cross-sectional dimensions, wall thickness, base size, and slenderness observed in real-world masonry minarets. These parameters directly influence the stiffness distribution, mass, and dynamic behavior of the structure. Therefore, considering them within representative ranges enables the evaluation of natural frequencies for a wide variety of minaret geometries rather than for a limited number of specific cases. In addition, the inclusion of the base dimension allows the influence of the lower structural configuration on the overall system stiffness to be examined. The material parameters were also selected to reflect realistic variations in masonry properties. The modulus of elasticity range of 500–6000 MPa represents different stiffness conditions, from weak or degraded masonry to stiffer material configurations. Similarly, the density range of 1200–2700 kg/m3 allows the effect of mass variation on natural frequency to be considered. Overall, the use of broad but realistic geometric and material ranges improves the representativeness of the database and supports the applicability of the proposed models to different masonry minaret typologies. It should be emphasized that the individual parameter ranges in Table 1 represent marginal bounds rather than an unrestricted combination of independent inputs. The 191 unique geometric configurations exhibit correlations among the geometric parameters and satisfy the feasibility conditions Dtop ≤ D0 and D0 + 2t ≤ B. In particular, the observed height-to-lower-diameter ratios, H/D0, range from 8.269 to 19.169. These observed limits and feasibility conditions help characterize the sampled geometric domain but do not, individually, guarantee that an arbitrary parameter combination is represented within the joint applicability domain. The complete geometric configurations are provided in the accompanying GitHub database. The distributions of the seven input parameters and their pairwise Pearson correlation coefficients are presented in Figure A1. The geometric parameters exhibit substantial correlations, particularly between D0 and B (r = 0.981), D0 and Dtop (r = 0.896), and H and D0 (r = 0.806). In contrast, E and ρ exhibit a weak linear correlation (r = 0.013). These results demonstrate that the numerical database contains a non-independent joint distribution of geometric parameters, which should be considered when interpreting the applicability domain of the developed predictive models.
The finite element analyses yielded first natural frequencies (f1) ranging from 0.13819 to 3.47240 Hz and second natural frequencies (f2) ranging from 0.13878 to 3.48700 Hz. These ranges characterize the numerical response domain used for developing and evaluating the surrogate models.
2.3. Data-Driven Modeling Framework
In the present study, alternative machine learning approaches were employed to estimate the first and second natural frequencies of masonry minarets using the database obtained from the parametric finite element analyses. Random Forest (RF), eXtreme Gradient Boosting (XGBoost), Light Gradient Boosting Machine (LightGBM), and Categorical Boosting (CatBoost) were selected because of their ability to capture nonlinear relationships and their demonstrated effectiveness in engineering prediction problems. The machine learning framework used six predictor variables: total height H, lower inner diameter D0, upper inner diameter Dtop, wall thickness t, base dimension B, and the derived material parameter . The elastic modulus E and density ρ were therefore not introduced separately into the machine learning-based models, and H was the only height-related predictor. For the machine learning, linear-regression, and symbolic-regression models, the derived predictor was calculated using E in MPa and ρ in kg/m3. Accordingly, the reported regression coefficients are calibrated to this numerical convention and should not be evaluated using E in Pa without the corresponding conversion. In contrast, the mechanically scaled geometry-only baseline used E in Pa, corresponding to values 1000 times those calculated with E in MPa.
To avoid information leakage between training and test subsets, geometry groups were defined using the five geometric parameters (H, D0, Dtop, t, and B). Each unique combination of these parameters was assigned a distinct geometry-group identifier, resulting in 191 groups. The six material realizations associated with each geometry were assigned to the same group, ensuring that identical geometries with different material properties could not appear simultaneously in the training and test subsets. Accordingly, the 1146 realizations were treated as 191 independent geometry groups for cross-validation purposes.
Model performance was assessed using geometry-grouped nested five-fold cross-validation [44,45,46,47,48]. The outer GroupKFold procedure ensured that all six material realizations belonging to the same geometry were assigned to the same test fold. The 191 geometry groups were distributed across five outer folds, with 39 groups (234 realizations) in the first fold and 38 groups (228 realizations) in each of the remaining four folds. Within each outer-training subset, hyperparameter optimization was performed using an inner five-fold GroupKFold procedure. Randomized search evaluated 25 hyperparameter combinations per machine learning algorithm, using R2 as the optimization criterion. The target frequencies were transformed using log(1 + f) during model fitting and subsequently converted back to Hz for prediction and performance evaluation. No information from the held-out outer-test groups was used during hyperparameter optimization. After completing the outer-fold evaluation, the algorithms were re-tuned using the complete database to obtain their final configurations. The geometry-group definitions and outer-fold assignments are provided in the accompanying GitHub repository.
The hyperparameter search spaces for the four algorithms are summarized in Table A1. A fixed budget of 25 randomly sampled parameter combinations per algorithm was adopted as a compromise between computational cost and hyperparameter exploration. The five outer and five inner geometry-grouped folds required 125 candidate evaluations per outer fold and algorithm, corresponding to 625 inner-validation model fits per algorithm and target frequency across the complete outer cross-validation procedure. The same search budget was applied to all four algorithms to maintain a consistent evaluation framework. Nevertheless, the search was not exhaustive, and potentially better hyperparameter configurations may exist within the investigated search spaces. The reported results should therefore be interpreted as the performance obtained under the specified search budget rather than as globally optimized performance.
In addition to the machine learning-based models, linear and symbolic regression techniques were employed to derive explicit frequency equations. Linear regression used the same six predictors (H, D0, Dtop, t, B, and ), without manually introduced interaction or ratio terms. Symbolic regression was performed using PySR (version 1.5.9), an evolutionary symbolic regression algorithm implemented in a Python 3.13.9 and Julia 1.11.9 environment, which searches for nonlinear mathematical expressions without prescribing a predefined functional form.
The symbolic search employed four binary operators (+, −, ×, /) and two unary operators (sqrt and log), with a maximum expression size of 15, maximum depth of 6, and a parsimony coefficient of 0.0001. Additional constraints limited the argument complexity of sqrt and log to 1, prohibited self-nesting of these operators, and restricted the denominator complexity of division to 9. The search employed the default mean squared error loss and was conducted with 12 populations over 500 iterations, without an additional early-stopping condition. Numerical constants were optimized within the PySR expression search using the corresponding training data. Candidate expressions were selected using PySR’s “best” criterion, balancing prediction accuracy and expression complexity. A base random seed of 42 was adopted, with fold-specific seeds.
To ensure unbiased evaluation, the complete symbolic expression discovery and coefficient optimization were repeated independently within each outer-training fold of the five-fold geometry-grouped cross-validation. No information from the corresponding held-out geometry groups was used during expression discovery or selection. The PySR search settings were kept fixed across the folds, without additional inner cross-validation for hyperparameter selection. After completing cross-validation, the final equations were independently re-fitted using the complete dataset of 1146 realizations. Thus, the reported cross-validation results represent performance on unseen geometry groups, whereas the final full-data expressions are provided as explicit predictive formulations. The complete symbolic-regression implementation, including the search settings, geometry-grouped cross-validation procedure, and fold-specific expression discovery, is provided in the GitHub repository (regression_formulas_group_cv.py), with methodological documentation available in SYMBOLIC_REGRESSION_PROTOCOL.md. The fixed version corresponding to the reported results is archived as GitHub Release v.1.0.1.
To provide a simple mechanically motivated benchmark, an additional geometry-only linear model was developed using the expected stiffness–density scaling of natural frequencies. For a fixed geometry, homogeneous isotropic linear-elastic material properties, a constant Poisson’s ratio, and negligible initial-stress stiffness, natural frequencies are proportional to the square root of the elastic-modulus-to-density ratio. Accordingly, the normalized target for each mode was defined as fi/ where E was converted from MPa to Pa and ρ was expressed in kg/m3.
The normalized frequencies of the six material realizations belonging to each unique geometry were first examined to verify this scaling. A separate ordinary least-squares regression was then fitted for each natural frequency using only the five geometrical parameters (H, D0, Dtop, t, and B). To give each unique geometry equal weight, the mean normalized frequency of its six material realizations was used as a single regression target. Predictions were transformed back to Hz using the corresponding values.
The baseline was evaluated using exactly the same five outer geometry-grouped folds as the machine learning-based models. Regression coefficients were estimated exclusively from the training geometry groups, while the corresponding held-out groups were used for performance evaluation. No additional geometric transformations or hyperparameter optimization were introduced. The final regression coefficients were estimated using all 191 geometries only after completion of the cross-validation assessment.
Here, fi represents the finite element-derived natural frequency (Hz), with i = 1 and 2 corresponding to the first and second natural frequencies, respectively. The tilde denotes a normalized quantity, whereas the hat indicates a predicted value. E is the elastic modulus, converted from MPa to Pa, and ρ is the mass density (kg/m3). The geometric parameters H, D0, Dtop, t, and B denote the total height, lower inner diameter, upper inner diameter, wall thickness, and square-base dimension, respectively, as previously defined in Section 2.2 and Table 1. The parameters β0,i–β5,i represent the regression intercept and coefficients, estimated independently for each natural frequency. The regression coefficients were fitted exclusively using the training geometry groups within each outer cross-validation fold.
The predictive performance of the developed models was evaluated using the coefficient of determination (R2), mean absolute error (MAE), root mean square error (RMSE), and symmetric mean absolute percentage error (SMAPE), which are commonly employed for evaluating data-driven prediction models [43,44,45,46,47,48]. The coefficient of determination quantifies the proportion of variability in the reference data explained by the model, whereas MAE represents the average magnitude of the prediction errors. RMSE gives greater weight to larger deviations, while SMAPE provides a scale-independent measure of relative prediction error. Fold-wise performance was reported as the mean ± standard deviation across the five held-out outer folds. To further quantify the uncertainty associated with the reported cross-validation performance, a geometry-group-based bootstrap analysis was conducted using the original held-out predictions. Within each of the five outer folds, geometry groups were resampled with replacement while retaining all six material realizations associated with each geometry. For each of 2000 bootstrap repetitions, R2, MAE, RMSE, and SMAPE were recalculated for each fold and subsequently averaged across the five folds. The 95% confidence intervals were obtained from the 2.5th and 97.5th percentiles of the bootstrap distributions. This analysis was performed without retraining the predictive models. In addition, pooled out-of-fold predictions from all outer folds were used to construct parity plots. The plots include the ideal 1:1 relationship and ±20% relative error bounds to provide a complementary graphical assessment of prediction accuracy.
SHAP analyses were performed using TreeExplainer to interpret the predictions of the final machine learning-based models refitted on the complete dataset. Accordingly, SHAP values reflect the transformed model-output scale rather than the natural frequencies expressed in Hz. All 1146 realizations were used as explanation samples. No separate background dataset was supplied; instead, the tree-path-dependent approach used the training-sample distributions recorded along the decision-tree paths as the reference distribution. No additional conditional dependence model or correlation-aware feature grouping was applied. Consequently, SHAP attributions may be influenced by correlations among the geometric predictors, and their relative magnitudes should be interpreted within the sampled parameter domain. The SHAP analyses describe the behavior of the final full-data models and do not represent independent physical validation or outer-test performance assessments. Fold-wise stability of the SHAP attributions was not separately quantified. Therefore, the reported explanations characterize the final models fitted to the complete numerical dataset and should not be interpreted as measures of attribution stability across different training partitions. It should be emphasized that the prediction errors reported in this study quantify the differences between the surrogate model predictions and the natural frequencies obtained from the finite element analyses. Therefore, the cross-validation metrics evaluate the ability of the developed models to reproduce the numerical reference data rather than their accuracy in predicting experimentally measured frequencies of existing minarets. The accuracy of the underlying finite element models with respect to actual structural behavior represents a separate source of uncertainty that cannot be quantified without independent experimental validation. Accordingly, the present evaluation is restricted to numerical surrogate performance within the modeling assumptions and parameter domain considered in this study. Although geometry-group-based bootstrap confidence intervals were provided for the predictive performance metrics, these estimates remain conditional on the adopted five-fold partition. Sensitivity to alternative training–test partitions, prediction intervals for individual structures, and automated out-of-domain detection were not investigated and remain subjects for future research.
The hyperparameter search spaces are reported in Table A1, while the final selected configurations obtained after full-data re-tuning are summarized in Table 2. The overall workflow of the proposed methodology for the dynamic characterization of masonry minarets, including the development of numerical models, dataset generation, and machine-learning-based prediction of natural frequencies, is illustrated in Figure 3.
Table 2.
Selected hyperparameters of the machine learning-based models obtained through group-based hyperparameter optimization.
Figure 3.
Workflow of the proposed methodology for the dynamic characterization of masonry minarets.
3. Results and Discussion
This section presents the numerical results and evaluates the predictive performance of the developed models using a database comprising 1146 finite element realizations representing 191 unique minaret geometries. First, the physical characteristics of the vibration modes are examined to establish the interpretation of the first two natural frequencies. Subsequently, the predictive performance of the machine learning algorithms is evaluated using geometry-grouped cross-validation, followed by SHAP-based interpretation of the input parameters. Finally, explicit frequency equations obtained through linear and symbolic regression are presented and compared.
3.1. Modal Characteristics of Masonry Minarets
To investigate the physical characteristics of the first two natural frequencies, the vibration modes of a representative masonry minaret were examined. Figure 4 presents the first four mode shapes obtained from the finite element modal analysis. The corresponding natural frequencies, effective modal mass participation ratios, and cumulative mass participation ratios in the two horizontal directions (X and Z) are summarized in Table 3.
Figure 4.
Representative first four vibration mode shapes of a masonry minaret obtained from finite element modal analysis.
Table 3.
Natural frequencies and cumulative mass participation ratios of the first four vibration modes of a representative masonry minaret.
As shown in Figure 4 and Table 3, the first two vibration modes correspond to global lateral bending in approximately orthogonal horizontal directions. The first mode, with a natural frequency of 0.254 Hz, exhibits predominant bending in the Z direction and an effective modal mass participation ratio of 52.05%. The second mode, with a frequency of 0.255 Hz, represents bending predominantly in the X direction, with a corresponding effective modal mass participation ratio of 51.98%. Similarly, the third and fourth modes, with frequencies of 1.393 and 1.394 Hz, respectively, represent higher-order lateral bending modes in the Z and X directions. The cumulative effective modal mass participation ratios of the first four modes reach 69.60% and 69.74% in the Z and X directions, respectively.
The close natural frequencies within each bending-mode pair can be attributed to the approximately symmetric geometry of the minarets, which results in similar mass and lateral stiffness distributions along the two horizontal directions. For an ideal structure with identical dynamic properties in two orthogonal horizontal directions, the corresponding bending frequencies may coincide. Small differences in the numerical models may arise from geometric details and finite element discretization.
The close relationship between the first two natural frequencies was also observed throughout the complete numerical database. The average relative frequency difference, calculated as (f2 − f1)/f1 × 100, was approximately 0.64%, with a maximum difference of 3.00%. Furthermore, 996 out of 1146 realizations (86.9%) exhibited relative frequency differences of 1% or less. These results indicate that the two lowest natural frequencies form closely spaced bending-mode pairs and provide a physical explanation for the nearly identical coefficients obtained in the corresponding linear regression equations (Equations (1) and (2)).
3.2. Performance of Machine Learning Models
The predictive performance of the four machine learning algorithms was evaluated following the geometry-grouped cross-validation procedure described in Section 2.3. The corresponding results for the first and second natural frequencies are presented below. For each outer iteration, training metrics were calculated from predictions obtained on the corresponding outer-training subset using the model selected and refitted after inner cross-validation. These in-sample metrics were reported to indicate model fitting behavior and potential generalization gaps, whereas the held-out outer-test metrics were used as the primary measures of predictive performance.
Table 4 presents the prediction results of the machine learning-based models for the first natural frequency. CatBoost achieved the best overall outer-test performance, with R2 = 0.9597 ± 0.0327, MAE = 0.0503 ± 0.0100 Hz, RMSE = 0.0883 ± 0.0233 Hz, and SMAPE = 6.03 ± 1.26%. XGBoost provided the second-highest mean outer-test R2 of 0.9518 ± 0.0411, followed by LightGBM with 0.9463 ± 0.0369. Random Forest yielded a lower outer-test R2 of 0.9205 ± 0.0366, together with comparatively larger errors. Despite the stricter separation of related geometries between training and testing, all models maintained strong predictive capability for previously unseen geometry groups. The pooled held-out predictions shown in Figure 5 further confirm the strong agreement obtained by the boosting-based models, particularly CatBoost and XGBoost.
Table 4.
Mean training and outer-test results of the machine learning-based models for estimating the first natural frequency using geometry-grouped nested five-fold cross-validation.
Figure 5.
Pooled held-out outer-fold predictions of the first natural frequency obtained using the alternative machine learning algorithms. The ideal 1:1 agreement is represented by the dashed line, whereas the dotted lines define the ±20% relative error limits.
The SHAP summary plots obtained for the first natural frequency are presented in Figure 6, while the corresponding global SHAP importance plots are presented in Figure 7. Across all four algorithms, total height H is consistently the most influential predictor, followed by . The remaining geometric variables exhibit smaller SHAP contributions within the sampled parameter domain. However, these smaller attributions should not be interpreted as evidence of physical insignificance, particularly because correlations among geometric predictors can influence how the model distributes feature contributions. The SHAP distributions also indicate a physically meaningful directional behavior: higher values of H are predominantly associated with negative contributions to the predicted frequency, whereas increasing , corresponding to greater stiffness relative to density, generally produces positive contributions. These trends are consistent with the expected dependence of modal frequencies on structural geometry and the stiffness-to-density ratio, providing a qualitative plausibility check of the numerical surrogate models rather than independent physical validation.
Figure 6.
SHAP summary plots for the first natural frequency (f1), expressed on the log1p-transformed output scale.
Figure 7.
Global SHAP importance for f1, expressed as mean absolute SHAP values on the log1p-transformed scale.
Table 5 summarizes the machine learning performance for the second natural frequency. CatBoost again provided the best overall outer-test performance, with R2 = 0.9610 ± 0.0304, MAE = 0.0506 ± 0.0101 Hz, RMSE = 0.0880 ± 0.0218 Hz, and SMAPE = 6.01 ± 1.21%. XGBoost achieved the second-highest mean outer-test R2, 0.9512 ± 0.0429, followed closely by LightGBM with 0.9488 ± 0.0368. Random Forest showed comparatively lower performance, with R2 = 0.9207 ± 0.0364. Thus, the relative ordering of the models remained similar for both target frequencies. Figure 8 shows that the pooled held-out predictions of CatBoost and XGBoost are concentrated more closely around the ideal 1:1 relationship, whereas Random Forest exhibits greater dispersion.
Table 5.
Mean training and outer-test performance of the machine learning-based models for predicting the second natural frequency f2 under geometry-group-based nested five-fold cross-validation.
Figure 8.
Pooled held-out outer-fold predictions of the second natural frequency obtained using the alternative machine learning algorithms. The dashed line represents perfect agreement, while the dotted lines mark the ±20% relative error limits.
The SHAP summary plots obtained for the second natural frequency are presented in Figure 9, while the corresponding global SHAP importance plots are shown in Figure 10. The overall importance pattern closely follows that obtained for f1. Total height H remains the dominant predictor in all models, followed consistently by , whereas the remaining geometric variables make comparatively smaller contributions. As for the first natural frequency, these relative importance values are conditional on the investigated numerical dataset and the adopted SHAP explanation framework, rather than direct measures of the independent physical influence of each parameter. Higher values of H are predominantly associated with negative SHAP contributions, while increasing produces positive contributions. This trend agrees with the expected mechanical response, as taller structures tend to exhibit lower natural frequencies, whereas a higher stiffness-to-density ratio generally leads to higher frequencies.
Figure 9.
SHAP summary plots for the second natural frequency (f2), expressed on the log1p-transformed output scale.
Figure 10.
Global SHAP importance for f2, expressed as mean absolute SHAP values on the log1p-transformed scale.
The geometry-group-based bootstrap analysis provided additional information on the uncertainty of the estimated predictive performance. For CatBoost, the 95% bootstrap confidence intervals for R2 were 0.9271–0.9784 and 0.9365–0.9781 for f1 and f2, respectively. The corresponding intervals for MAE were 0.0417–0.0612 Hz and 0.0413–0.0610 Hz. The confidence intervals for all evaluated machine learning algorithms are presented in Table A2. These intervals characterize the sensitivity of the cross-validation performance estimates to resampling of geometry groups within the original outer folds.
To investigate potential systematic prediction errors, the CatBoost held-out residuals were examined across quartiles of H/D0, Dtop/D0, t/D0, and . The corresponding mean signed residuals and MAE values are summarized in Table A3. The results reveal modest geometry-dependent biases, particularly across slenderness and tapering ratios, despite the overall high predictive accuracy. These findings indicate that local variations in prediction errors should be considered when interpreting the surrogate model performance.
Overall, the geometry-grouped validation results demonstrate that the developed machine learning algorithms can effectively reproduce finite element-derived natural frequencies for previously unseen geometric configurations within the investigated numerical database. CatBoost achieved the best overall machine learning performance for both f1 and f2, followed by XGBoost and LightGBM, while Random Forest exhibited comparatively larger prediction errors. SHAP analyses consistently identified total height and the stiffness–density-related parameter as the dominant predictors, with trends consistent with the expected dynamic behavior of slender masonry structures. Nevertheless, these results demonstrate predictive capability relative to the numerical reference models and should not be interpreted as independent validation of the physical accuracy of the finite element models or their applicability to existing minarets.
3.3. Regression-Based Frequency Equations
Apart from the machine learning-based models described above, explicit equations for estimating f1 and f2 were derived using linear and symbolic regression. The linear models employed additive contributions from H, D0, Dtop, t, B, and , without manually introduced interaction or ratio terms. Their final full-data formulations are given in Equations (1) and (2). Symbolic regression was used to identify compact nonlinear expressions directly from the database, resulting in Equations (3) and (4). During each outer cross-validation fold, the regression models, including symbolic expression discovery, were fitted exclusively using the corresponding training geometry groups. The final equations presented in Equations (1)–(4) were subsequently obtained by refitting the regression approaches on the complete dataset of 1146 realizations. Similarly, the SHAP plots in Figure 6, Figure 7, Figure 9 and Figure 10 were generated from the final machine learning-based models refitted on the complete dataset. Importantly, all reported R2, MAE, RMSE, and SMAPE values were obtained from held-out outer-fold predictions, rather than being recalculated using the final full-data models or equations.
The nearly identical coefficients obtained in Equations (1) and (2) can be explained by the close relationship between the first two natural frequencies. As demonstrated in Section 3.1, these frequencies correspond to global lateral bending modes in approximately orthogonal horizontal directions. The nearly symmetric mass and lateral stiffness characteristics of the minarets result in closely spaced natural frequencies, leading to similar dependencies on the governing geometric and material parameters.
The proposed equations are empirical and unit-specific relationships calibrated within the parameter domain investigated in this study. In Equations (1)–(4), H, D0, Dtop, t, and B are expressed in meters, E in MPa, ρ in kg/m3, and the resulting frequencies in Hz. The equations should therefore be considered applicable only to geometrically feasible configurations consistent with the joint parameter domain represented by the numerical database, rather than to arbitrary combinations of the individual parameter limits reported in Table 1. Predictions for configurations substantially different from those included in the database should be regarded as extrapolations and interpreted with caution. They should not be interpreted as dimensionally invariant physical laws. Furthermore, these equations were calibrated using numerically generated natural frequencies and should be regarded as surrogate representations of the adopted finite element models rather than experimentally validated relationships for existing masonry minarets. Their application to actual structures requires independent validation against measured dynamic characteristics.
The performance of the explicit regression approaches is summarized in Table 6, while their pooled held-out parity plots are presented in Figure 11. For f1, linear regression achieved a mean outer-test R2 of 0.7679 ± 0.0497, with MAE and RMSE values of 0.1713 ± 0.0129 Hz and 0.2403 ± 0.0447 Hz, respectively. For f2, the corresponding values were R2 = 0.7674 ± 0.0492, MAE = 0.1731 ± 0.0128 Hz, and RMSE = 0.2428 ± 0.0443 Hz. The comparatively large SMAPE values of 31.54 ± 5.13% and 31.66 ± 5.14% indicate that a simple additive linear formulation is insufficient to represent the full nonlinear dependence of the natural frequencies on the selected geometric and material predictors. This limitation is also evident in Figure 11a,b, particularly at higher frequency levels.
Table 6.
Outer-test results of the linear and symbolic regression models evaluated using geometry-grouped five-fold cross-validation. Results are presented as mean ± standard deviation over the five outer folds.
Figure 11.
Pooled outer-fold test predictions from the linear and symbolic regression models for the first and second natural frequencies: (a) linear regression for f1, (b) linear regression for f2, (c) symbolic regression for f1, and (d) symbolic regression for f2. The dashed line shows perfect 1:1 agreement, whereas the dotted lines define the ±20% relative error limits.
By contrast, symbolic regression substantially improved the predictive performance of the explicit formulations. For f1, the mean outer-test R2 increased to 0.9681 ± 0.0352, while MAE and RMSE decreased to 0.0494 ± 0.0085 Hz and 0.0770 ± 0.0243 Hz, respectively. The corresponding SMAPE was 6.39 ± 1.14%. For f2, symbolic regression achieved R2 = 0.9570 ± 0.0378, MAE = 0.0583 ± 0.0158 Hz, RMSE = 0.0916 ± 0.0318 Hz, and SMAPE = 7.41 ± 2.11%. These results demonstrate that symbolic regression captures the nonlinear structure of the database much more effectively than the simple linear baseline while retaining an explicit closed-form representation. Notably, the symbolic-regression equations achieved predictive accuracy comparable to the best-performing machine learning-based models.
The modal-frequency ordering was additionally examined by evaluating the final symbolic expressions (Equations (3) and (4)) for all 1146 finite element realizations. All finite element results satisfied f1 < f2, consistent with ascending frequency ordering. However, the independently fitted symbolic expressions predicted f1 > f2 for 486 realizations (42.41%), corresponding to 81 of the 191 unique geometries. This inconsistency is associated with the independent approximation of two closely spaced lateral bending frequencies without an explicit ordering constraint. Therefore, although the symbolic equations provide accurate individual frequency approximations, they do not guarantee physically consistent modal ordering when used together. This limitation should be considered when applying the equations, particularly when both modal frequencies are required simultaneously.
Finally, the comparison between the two approaches demonstrates that symbolic regression provides a substantially more accurate explicit representation of the numerical database than the simple linear baseline. Nevertheless, the linear equations remain useful as transparent reference models, whereas the symbolic equations offer a more favorable balance between predictive accuracy and interpretability. The symbolic formulations further indicate that the dependence of the natural frequencies on the governing geometric and material parameters is strongly nonlinear and cannot be represented adequately through a purely additive relationship. This conclusion is consistent with the parity plots in Figure 11, where the symbolic-regression predictions remain considerably closer to the ideal 1:1 relationship than those obtained using linear regression.
3.4. Mechanically Scaled Geometry-Only Baseline
The expected stiffness–density scaling was examined using all six material realizations belonging to each of the 191 unique geometry groups. After normalizing the finite element-derived modal frequencies by , the median within-group coefficients of variation were only 0.00079% and 0.00078% for the first and second natural frequencies, respectively. The corresponding maximum coefficients of variation were 0.0792% and 0.0511%. These results demonstrate that the finite element frequencies closely follow the expected material scaling within each geometric configuration under the adopted linear-elastic assumptions.
A simple geometry-only linear regression was subsequently fitted to the normalized frequencies using the five geometric descriptors and evaluated under the same geometry-grouped five-fold cross-validation as the other prediction models. As reported in Table 7, the mechanically scaled baseline achieved mean outer-test R2 values of 0.8222 and 0.8217 for f1 and f2, respectively. The corresponding mean MAE values were 0.1503 and 0.1523 Hz, while the SMAPE values were 24.31% and 24.45%. Figure 12 presents the pooled held-out parity plots, with individual outer folds distinguished by color.
Table 7.
Performance of the mechanically scaled geometry-only linear baseline under five-fold geometry-grouped cross-validation (mean ± standard deviation).
Figure 12.
Parity plots of the mechanically scaled geometry-only model for (a) f1 and (b) f2 using geometry-grouped five-fold cross-validation.
The mechanically scaled baseline improved on the original additive linear-regression equations, which achieved mean outer-test R2 values of 0.7679 and 0.7674 for f1 and f2, respectively. However, its predictive accuracy remained below that of CatBoost (0.9597 and 0.9610) and symbolic regression (0.9681 and 0.9570). Thus, although the expected relationship adequately represents the material dependence, a simple linear function of the geometric variables remains insufficient to capture the nonlinear geometry–frequency relationship over the investigated domain.
Furthermore, the unconstrained linear formulation produced negative frequency predictions for two held-out geometric configurations, corresponding to 12 realizations for each modal frequency. These nonphysical predictions were retained in the reported performance statistics and parity plots, highlighting an additional limitation of the simple baseline. Overall, the comparison clarifies the incremental predictive benefit of more flexible data-driven methods beyond a mechanically informed linear reference model. These findings refer to agreement with numerical finite element frequencies and do not constitute experimental validation of actual masonry minarets.
3.5. Limitations and Applicability
The present study involves several modeling assumptions that should be considered when interpreting its findings. The finite element models were developed using a simplified geometric representation comprising the base, transition region, shaft, balcony, and upper section, without explicitly investigating the influence of internal staircases, individual openings, or detailed balcony connections. Masonry was represented as a homogeneous, isotropic, and linear-elastic continuum, without explicitly considering masonry unit–mortar interactions, cracking, material degradation, or nonlinear damage mechanisms. Furthermore, fixed-base boundary conditions were adopted, and soil–structure interaction, foundation flexibility, and interactions with adjacent buildings were not considered. The modal analyses were also performed without gravity-induced initial stresses.
These simplifications provided a consistent basis for generating and comparing the numerical database but may affect the predicted dynamic characteristics of actual historical minarets. Moreover, the proposed models were developed exclusively using finite element-derived natural frequencies and were not independently validated against experimentally measured modal properties. Their applicability is therefore restricted to the adopted numerical assumptions and the joint geometric and material parameter domain represented by the database. Future investigations should incorporate experimentally calibrated finite element models, soil–structure interaction effects, and more detailed geometric and material representations to extend the framework toward practical assessment of existing masonry minarets.
4. Conclusions
This study proposes a unified framework that integrates parametric finite element analysis, machine learning techniques, and explicit regression formulations to estimate the first and second natural frequencies of masonry minarets. A database comprising 1146 finite element model realizations representing 191 unique geometry groups was used to develop and evaluate the proposed predictive models. Geometry-grouped validation was adopted to prevent related structural configurations from appearing simultaneously in the training and test subsets. The modal investigation confirmed that the first two natural frequencies (f1 and f2, respectively) correspond to closely spaced lateral bending modes associated with the approximately symmetric horizontal characteristics of the minarets. This behavior provides a physical explanation for the strong similarity between the predictive relationships developed for f1 and f2.
The machine learning results demonstrated a high level of predictive accuracy for both f1 and f2. Among the evaluated algorithms, CatBoost achieved the best overall performance, with mean outer-test R2 values of 0.9597 and 0.9610 for f1 and f2, respectively. XGBoost and LightGBM provided similarly strong performance, whereas Random Forest exhibited comparatively larger prediction errors. These findings demonstrate that boosting-based tree ensembles can effectively capture the nonlinear relationship between minaret geometry, material properties, and modal frequencies while maintaining generalization to previously unseen geometry groups.
The SHAP-based interpretation consistently identified total height H as the dominant predictor, followed by . Higher total height was predominantly associated with lower predicted frequencies, whereas increasing the stiffness–density-related parameter generally increased the predicted frequency. These trends are consistent with the expected physical behavior of slender masonry structures. The remaining geometric parameters exhibited comparatively smaller SHAP contributions within the investigated numerical domain. These results reflect model-specific attribution patterns and should not be interpreted as evidence that the corresponding geometric parameters are physically insignificant.
The comparison between the two explicit regression approaches showed that linear regression provides compact and easily interpretable equations but has limited capability to represent the nonlinear structure of the database. The linear models achieved mean outer-test R2 values of approximately 0.77 and SMAPE values of approximately 32%. In contrast, symbolic regression substantially improved the explicit formulations, achieving mean outer-test R2 values of 0.9681 and 0.9570 for f1 and f2, respectively, with SMAPE values below 8%. The symbolic formulations therefore provide an attractive compromise between the predictive capability of machine learning-based models and the direct interpretability of closed-form equations.
The additional mechanically scaled baseline confirmed the expected square-root dependence of natural frequencies on the elastic-modulus-to-density ratio across the six material realizations associated with each geometry. A simple linear regression of the normalized frequencies using geometric parameters alone achieved mean outer-test R2 values of 0.8222 and 0.8217 for the first and second natural frequencies, respectively. Although these results improved on ordinary additive linear regression, the model remained less accurate than CatBoost and symbolic regression. This finding indicates that known mechanical scaling effectively accounts for the material dependence, whereas the remaining nonlinear geometric effects benefit from more flexible prediction models.
Overall, the proposed framework provides an efficient and interpretable numerical surrogate for estimating the first two natural frequencies of masonry minarets without requiring repeated finite element simulations. The developed machine learning-based models and explicit regression equations demonstrated strong predictive performance relative to the finite element reference data within the investigated parameter domain. However, the reported prediction errors quantify the differences between surrogate predictions and numerical reference frequencies rather than the agreement between numerical predictions and experimentally measured structural responses. Therefore, the developed models should presently be regarded as numerical surrogate tools rather than experimentally validated methods for structural assessment or conservation decision-making.
While the proposed framework provides accurate numerical surrogate predictions within the investigated domain, its application to existing masonry minarets remains limited by the adopted modelling assumptions and the lack of independent experimental validation. Specifically, the numerical models do not explicitly account for internal staircases, individual openings, detailed balcony connections, or nonlinear damage mechanisms. Furthermore, f2 represents the second frequency of a closely spaced pair of approximately orthogonal lateral bending modes rather than a distinct higher-order bending mode. Future studies should investigate more detailed structural configurations and experimentally calibrated models to improve applicability to existing masonry minarets. Furthermore, the independently derived symbolic regression equations do not guarantee the ascending order of the first two modal frequencies, highlighting the need for ordering-constrained formulations in future developments.
Author Contributions
Conceptualization, A.E.S., P.U.E., N.M. and S.K.; methodology, A.E.S., P.U.E. and S.K.; software, R.G.; formal analysis, A.E.S.; data curation, A.E.S.; investigation, A.E.S.; writing—original draft preparation, A.E.S.; resources, A.E.S., P.U.E. and S.K.; writing—review and editing, P.U.E., R.G., Y.H.A., N.M. and S.K.; visualization, A.E.S. and Y.H.A.; supervision, P.U.E., N.M. and S.K.; project administration, S.K.; funding acquisition, N.M. All authors have read and agreed to the published version of the manuscript.
Funding
This work was supported by FCT/MCTES under the R&D Unit Institute for Sustainability and Innovation in Structural Engineering (ISISE), under the references UID/4029/2025 (https://doi.org/10.54499/UID/04029/2025), UID/PRR/04029/2025 (https://doi.org/10.54499/UID/PRR/04029/2025) and UID/PRR2/04029/2025 (https://doi.org/10.54499/UID/PRR2/04029/2025), and under the Associate Laboratory Advanced Production and Intelligent Systems ARISE under reference LA/P/0112/2020 (https://doi.org/10.54499/LA/P/0112/2020). This work is partly financed by national funds through FCT—Foundation for Science and Technology, under grant agreement [2023.08982.CEECIND/CP2841/CT0033] attributed to the last author (https://doi.org/10.54499/2023.08982.CEECIND/CP2841/CT0033).
Data Availability Statement
The numerical dataset and accompanying Python scripts used in this study are openly accessible through the GitHub repository: https://github.com/aliekbersever1/Masonry-Minaret-ML accessed on 25 October 2026. The repository includes the numerical database comprising 1146 finite element model realizations, the geometric and material parameter combinations, the geometry-group and outer-fold assignments, and the Python scripts used for geometry-grouped machine learning analysis, linear regression, symbolic regression, and the mechanically scaled geometry-only baseline. For the latter, the repository also provides the normalized-frequency diagnostics, fold-wise performance metrics, out-of-fold predictions, regression coefficients, and parity plots to support the reproducibility of the reported results.
Conflicts of Interest
The authors declare no conflict of interest.
Abbreviations
The following abbreviations are used in this manuscript:
| AI | Artificial Intelligence |
| CatBoost | Categorical Boosting |
| FEA | Finite Element Analysis |
| FEM | Finite Element Model |
| LightGBM | Light Gradient Boosting Machine |
| MAE | Mean Absolute Error |
| OMA | Operational Modal Analysis |
| RF | Random Forest |
| RMSE | Root Mean Square Error |
| SHAP | Shapley Additive Explanations |
| SMAPE | Symmetric Mean Absolute Percentage Error |
| XGBoost | eXtreme Gradient Boosting |
Appendix A. Input Parameter Distributions and Correlations
Table A1.
Hyperparameter search spaces considered for the four machine learning algorithms.
Table A2.
Geometry-group bootstrap 95% confidence intervals for outer-test performance metrics based on 2000 bootstrap repetitions.
Table A3.
CatBoost held-out residual summaries across quartiles of geometric and material ratios.
Figure A1.
Distributions of the seven input parameters (a–g) and their pairwise Pearson correlation coefficients (h). Geometric distributions represent 191 unique configurations, whereas material-property distributions represent 1146 finite element realizations. Correlations were calculated using the complete numerical database.
References
- Shakya, M.; Varum, H.; Vicente, R.; Costa, A. A new methodology for vulnerability assessment of slender masonry structures. In Proceedings of the Second European Conference on Earthquake Engineering and Seismology, Istanbul, Türkiye, 25–29 August 2014; p. 485. Available online: https://eaee.org/Media/Default/2ECCES/2ecces_eaee/485.pdf (accessed on 25 October 2026).
- Doğangün, A.; Acar, R.; Sezen, H.; Livaoğlu, R. Investigation of dynamic response of masonry minaret structures. Bull. Earthq. Eng. 2008, 6, 505–517. [Google Scholar] [CrossRef] [Scilit]
- Usta Evci, P. Assessment of seismic behavior of historic masonry minarets in Antalya, Turkey. Case Stud. Constr. Mater. 2021, 15, e00665. [Google Scholar] [CrossRef] [Scilit]
- Başar, T.B.; İlerisoy, Z.Y.; Başar, M. The effects of earthquake reality on historical minarets: Evaluations specific to the February 06, 2023 Kahramanmaraş earthquake. Cult. Herit. Sci. 2025, 6, 92–101. [Google Scholar] [CrossRef] [Scilit]
- Altıok, T.Y.; Demir, A. Collapse mechanism estimation of a historical masonry minaret considered soil-structure interaction. Earthq. Struct. 2021, 21, 161–172. [Google Scholar] [CrossRef]
- Hökelekli, E.; Al-Helwani, A. Effect of soil properties on the seismic damage assessment of historical masonry minaret soil interaction systems. Struct. Des. Tall Spec. Build. 2020, 29, e1694. [Google Scholar] [CrossRef] [Scilit]
- Shabani, A.; Feyzabadi, M.; Kioumarsi, M. Model updating of a masonry tower based on operational modal analysis: The role of soil-structure interaction. Case Stud. Constr. Mater. 2022, 16, e00957. [Google Scholar] [CrossRef] [Scilit]
- Peña, F.; Lourenço, P.B.; Mendes, N.; Oliveira, D.V. Numerical models for the seismic assessment of an old masonry tower. Eng. Struct. 2010, 32, 1466–1478. [Google Scholar] [CrossRef] [Scilit]
- Sever, A.E.; Aydin, Y.H.; Usta Evci, P. Seismic performance evaluation of the historical Yozgat clock tower. Ing. Sismica 2025, 42, 1–19. [Google Scholar] [CrossRef] [Scilit]
- Romero-Sánchez, E.; Requena-García-Cruz, M.V.; Morales-Esteban, A. Seismic performance of a masonry tower under non-linear methods. Structures 2025, 74, 108458. [Google Scholar] [CrossRef] [Scilit]
- Genç, A.F.; Ergün, M.; Günaydin, M.; Altunişik, A.C.; Ateş, Ş.; Okur, F.Y.; Mosallam, A.S. Dynamic analyses of experimentally-updated FE model of historical masonry clock towers using site-specific seismic characteristics and scaling parameters according to the 2018 Turkey building earthquake code. Eng. Fail. Anal. 2019, 105, 402–426. [Google Scholar] [CrossRef] [Scilit]
- Maraş, M.M.; Özmen, A.; Sayın, E.; Ayaz, Y. Seismic assessment of the historical Sütlü Minaret Mosque. Period. Polytech. Civ. Eng. 2022, 66, 445–459. [Google Scholar] [CrossRef] [Scilit]
- Erkek, H.; Yetkin, M.; Calayır, Y. Investigation of the earthquake behavior of the historical Adana great clock tower using FEM updated based on environmental vibration data. J. Constr. 2024, 23, 335–353. [Google Scholar] [CrossRef] [Scilit]
- Calayır, Y.; Yetkin, M.; Erkek, H. Finite element model updating of masonry minarets by using operational modal analysis method. Structures 2021, 34, 3501–3507. [Google Scholar] [CrossRef] [Scilit]
- Yetkin, M.; Erkek, H.; Calayır, Y. Comparison of measurements with and without reference in operational modal analysis method: A minaret example. J. Inst. Sci. Technol. 2021, 11, 2069–2078. [Google Scholar] [CrossRef] [Scilit]
- Gentile, C.; Saisi, A.; Cabboi, A. Structural identification of a masonry tower based on operational modal analysis. Int. J. Archit. Herit. 2015, 9, 98–110. [Google Scholar] [CrossRef] [Scilit]
- Chisari, C.; Zizi, M.; Lavino, A.; Freda, S.; De Matteis, G. Operational modal analysis and safety assessment of a historical masonry bell tower. Appl. Sci. 2024, 14, 10604. [Google Scholar] [CrossRef] [Scilit]
- Milani, G.; Clementi, F. Advanced seismic assessment of four masonry bell towers in Italy after operational modal analysis (OMA) identification. Int. J. Archit. Herit. 2021, 15, 157–186. [Google Scholar] [CrossRef] [Scilit]
- Standoli, G.; Giordano, E.; Milani, G.; Clementi, F. Model updating of historical belfries based on OMA identification techniques. Int. J. Archit. Herit. 2021, 15, 132–156. [Google Scholar] [CrossRef] [Scilit]
- Wang, C.; Du, Z.; Ma, Z. 4D CT–validated mesoscale finite-element modeling and coupled ITZ–fiber damage evolution in micro-steel-fiber-reinforced recycled aggregate concrete. Constr. Build. Mater. 2026, 513, 145443. [Google Scholar] [CrossRef] [Scilit]
- Tashkov, L.A.; Krstevska, L.S.; Safak, E.; Cakti, E.; Edincliler, A.; Erdik, M. Comparative study of large and medium scale mosque models tested on seismic shaking table. In Proceedings of the 15th World Conference on Earthquake Engineering, Lisbon, Portugal, 24–28 September 2012; Available online: https://www.iitk.ac.in/nicee/wcee/article/WCEE2012_0865.pdf (accessed on 25 October 2026).
- De Silva, F.; Pitilakis, D.; Ceroni, F.; Sica, S.; Silvestri, F. Experimental and numerical dynamic identification of a historic masonry bell tower accounting for different types of interaction. Soil Dyn. Earthq. Eng. 2018, 109, 235–250. [Google Scholar] [CrossRef] [Scilit]
- Cakir, F.; Uckan, E.; Shen, J.; Seker, B.S.; Akbas, B. Seismic damage evaluation of historical structures during Van earthquake. Eng. Fail. Anal. 2015, 58, 249–266. [Google Scholar] [CrossRef] [Scilit]
- Bayraktar, A.; Çalık, İ.; Türker, T. A simplified fundamental frequency formulation based on in-situ tests for masonry stone minarets. Exp. Tech. 2022, 46, 225–238. [Google Scholar] [CrossRef] [Scilit]
- Livaoğlu, R.; Baştürk, M.H.; Doğangün, A.; Serhatoğlu, C. Effect of geometric properties on dynamic behavior of historic masonry minaret. KSCE J. Civ. Eng. 2016, 20, 2392–2402. [Google Scholar] [CrossRef] [Scilit]
- Adam, M.A.; El-Salakawy, T.S.; Salama, M.A.; Mohamed, A.A. Assessment of structural condition of a historic masonry minaret in Egypt. Case Stud. Constr. Mater. 2020, 13, e00409. [Google Scholar] [CrossRef] [Scilit]
- El-Attar, A.G.; Saleh, A.M.; Zaghw, A.H. Conservation of a slender historical Mamluk-style minaret by passive control techniques. Struct. Control Health Monit. 2005, 12, 157–177. [Google Scholar] [CrossRef] [Scilit]
- Bayraktar, A.; Hökelekli, E. A cost-effective FRCM technique for seismic strengthening of minarets. Eng. Struct. 2021, 229, 111672. [Google Scholar] [CrossRef] [Scilit]
- Şentürk, İ.; Ergün, M.; Artar, M. Seismic behavior assessment of historical Alaeddin Bey Mosque and strengthening suggestions by CFRP fabric and steel plate. Eng. Fail. Anal. 2022, 137, 106242. [Google Scholar] [CrossRef] [Scilit]
- Dedeoğlu, İ.Ö.; Yetkin, M.; Calayır, Y.; Erkek, H. January 24, 2020 Sivrice-Elazig (Turkiye) earthquake: The seismic assessment of the earthquake territory, geotechnical findings and performance of masonry buildings. Iran. J. Sci. Technol. Trans. Civ. Eng. 2024, 48, 2393–2412. [Google Scholar] [CrossRef] [Scilit]
- Adalier, K.; Aydingun, O. Structural engineering aspects of the June 27, 1998 Adana–Ceyhan (Turkey) earthquake. Eng. Struct. 2001, 23, 343–355. [Google Scholar] [CrossRef] [Scilit]
- Feizolahbeigi, A.; Mendes, N. Evaluation of different types of advanced analysis for the study of the seismic behavior of masonry minarets. Structures 2025, 78, 109134. [Google Scholar] [CrossRef] [Scilit]
- Diaferio, M.; Foti, D.; Potenza, F. Prediction of the fundamental frequencies and modal shapes of historic masonry towers by empirical equations based on experimental data. Eng. Struct. 2018, 156, 433–442. [Google Scholar] [CrossRef] [Scilit]
- Serhatoğlu, C.; Livaoğlu, R. A fast and practical approximations for fundamental period of historical Ottoman minarets. Soil Dyn. Earthq. Eng. 2019, 120, 320–331. [Google Scholar] [CrossRef] [Scilit]
- Dabiri, H.; Clementi, J.; Marini, R.; Mugnozza, G.S.; Bozzano, F.; Mazzanti, P. Machine learning-based analysis of historical towers. Eng. Struct. 2024, 304, 117621. [Google Scholar] [CrossRef] [Scilit]
- Nguyen, Q.T.; Vu, V.T.; Livaoğlu, R. Artificial neural network-based robust technique for period prediction of Ottoman minarets in Türkiye. Structures 2024, 61, 106087. [Google Scholar] [CrossRef] [Scilit]
- Nguyen, Q.T.; Nguyen, K.C.; Livaoğlu, R. Fundamental frequency prediction of historic masonry towers based on artificial neural networks. Int. J. Archit. Herit. 2025, 19, 1937–1955. [Google Scholar] [CrossRef] [Scilit]
- Tran, C.; Nguyen, N.T.V.; Le, D.T.; Nguyen, Q.T.; Livaoğlu, R. Optimized supervised machine learning for accurate prediction of periods in Türkiye’s heritage minarets. Bull. Earthq. Eng. 2025. advance online publication. [Google Scholar] [CrossRef] [Scilit]
- Duman, C.; Hacıefendioğlu, K.; Gültop, T. Damage assessment in historical masonry minarets with supervised machine learning and deep learning methods. Int. J. Archit. Herit. 2026, 20, 57–76. [Google Scholar] [CrossRef] [Scilit]
- Demirtaş, B.; Türker, T.; Yanik, Y.; Dede, T. Frequency-based damage detection with ANN and seismic behaviour assessment of a historical masonry tower. Iran. J. Sci. Technol. Trans. Civ. Eng. 2026, 50, 621–646. [Google Scholar] [CrossRef] [Scilit]
- Yanik, Y.; Türker, T.; Öztürk, H.T.; Demirtaş, B.; Aymelek, A.; Yildirim, Ö.; Çalik, İ. Investigation of environmental effects through long-term vibration monitoring on the structural behavior and seismic performance assessment of the Hagia Sophia Bell Tower. Eng. Fail. Anal. 2025, 182, 110171. [Google Scholar] [CrossRef] [Scilit]
- Standoli, G.; Di Giosaffatte, M.; Schiavoni, M.; Roscini, F.; Clementi, F. Sustainable structural health assessment of heritage masonry towers using artificial intelligence and data-driven monitoring: Insights from the civic tower of Matelica. Eng. Appl. Artif. Intell. 2026, 163, 113097. [Google Scholar] [CrossRef] [Scilit]
- Kong, Q.; Liu, J.; Wu, X.; Yuan, C. Seismic fragility estimation based on machine learning and particle swarm optimization. Buildings 2024, 14, 1263. [Google Scholar] [CrossRef] [Scilit]
- Banimahd, S.A.; Giouvanidis, A.I.; Karimzadeh, S.; Lourenço, P.B. A multi-level approach to predict the seismic response of rigid rocking structures using artificial neural networks. Earthq. Eng. Struct. Dyn. 2024, 53, 2185–2208. [Google Scholar] [CrossRef] [Scilit]
- Mohammadi, A.; Karimzadeh, S.; Banimahd, S.A.; Ozsarac, V.; Lourenco, P.B. The potential of region-specific machine-learning-based ground motion models: Application to Turkey. Soil Dyn. Earthq. Eng. 2023, 172, 108008. [Google Scholar] [CrossRef] [Scilit]
- Mohammadi, A.; Karimzadeh, S.; Yaghmaei-Sabegh, S.; Ranjbari, M.; Lourenço, P.B. Utilising artificial neural networks for assessing seismic demands of buckling restrained braces due to pulse-like motions. Buildings 2023, 13, 2542. [Google Scholar] [CrossRef] [Scilit]
- Mohammadi, A.; Barros, J.A.; Sena-Cruz, J. An interpretable machine learning-based model for shear resistance prediction of CFRP-strengthened RC beams using experimental and synthetic dataset. Comp. Struct. 2025, 351, 118632. [Google Scholar] [CrossRef] [Scilit]
- Karimzadeh, S.; Mohammadi, A.; Salahuddin, U.; Carvalho, A.; Lourenço, P.B. Backbone ground motion model through simulated records and XGBoost machine learning algorithm: An application for the Azores plateau (Portugal). Earthq. Eng. Struct. Dyn. 2024, 53, 668–693. [Google Scholar] [CrossRef] [Scilit]
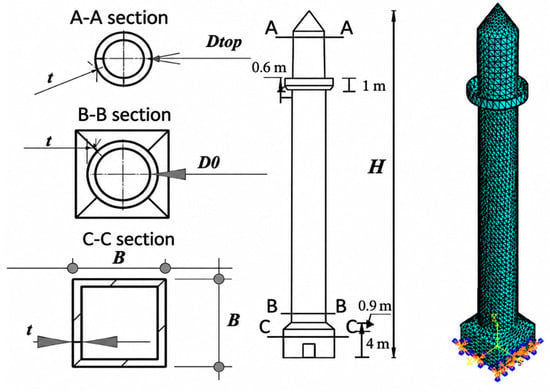
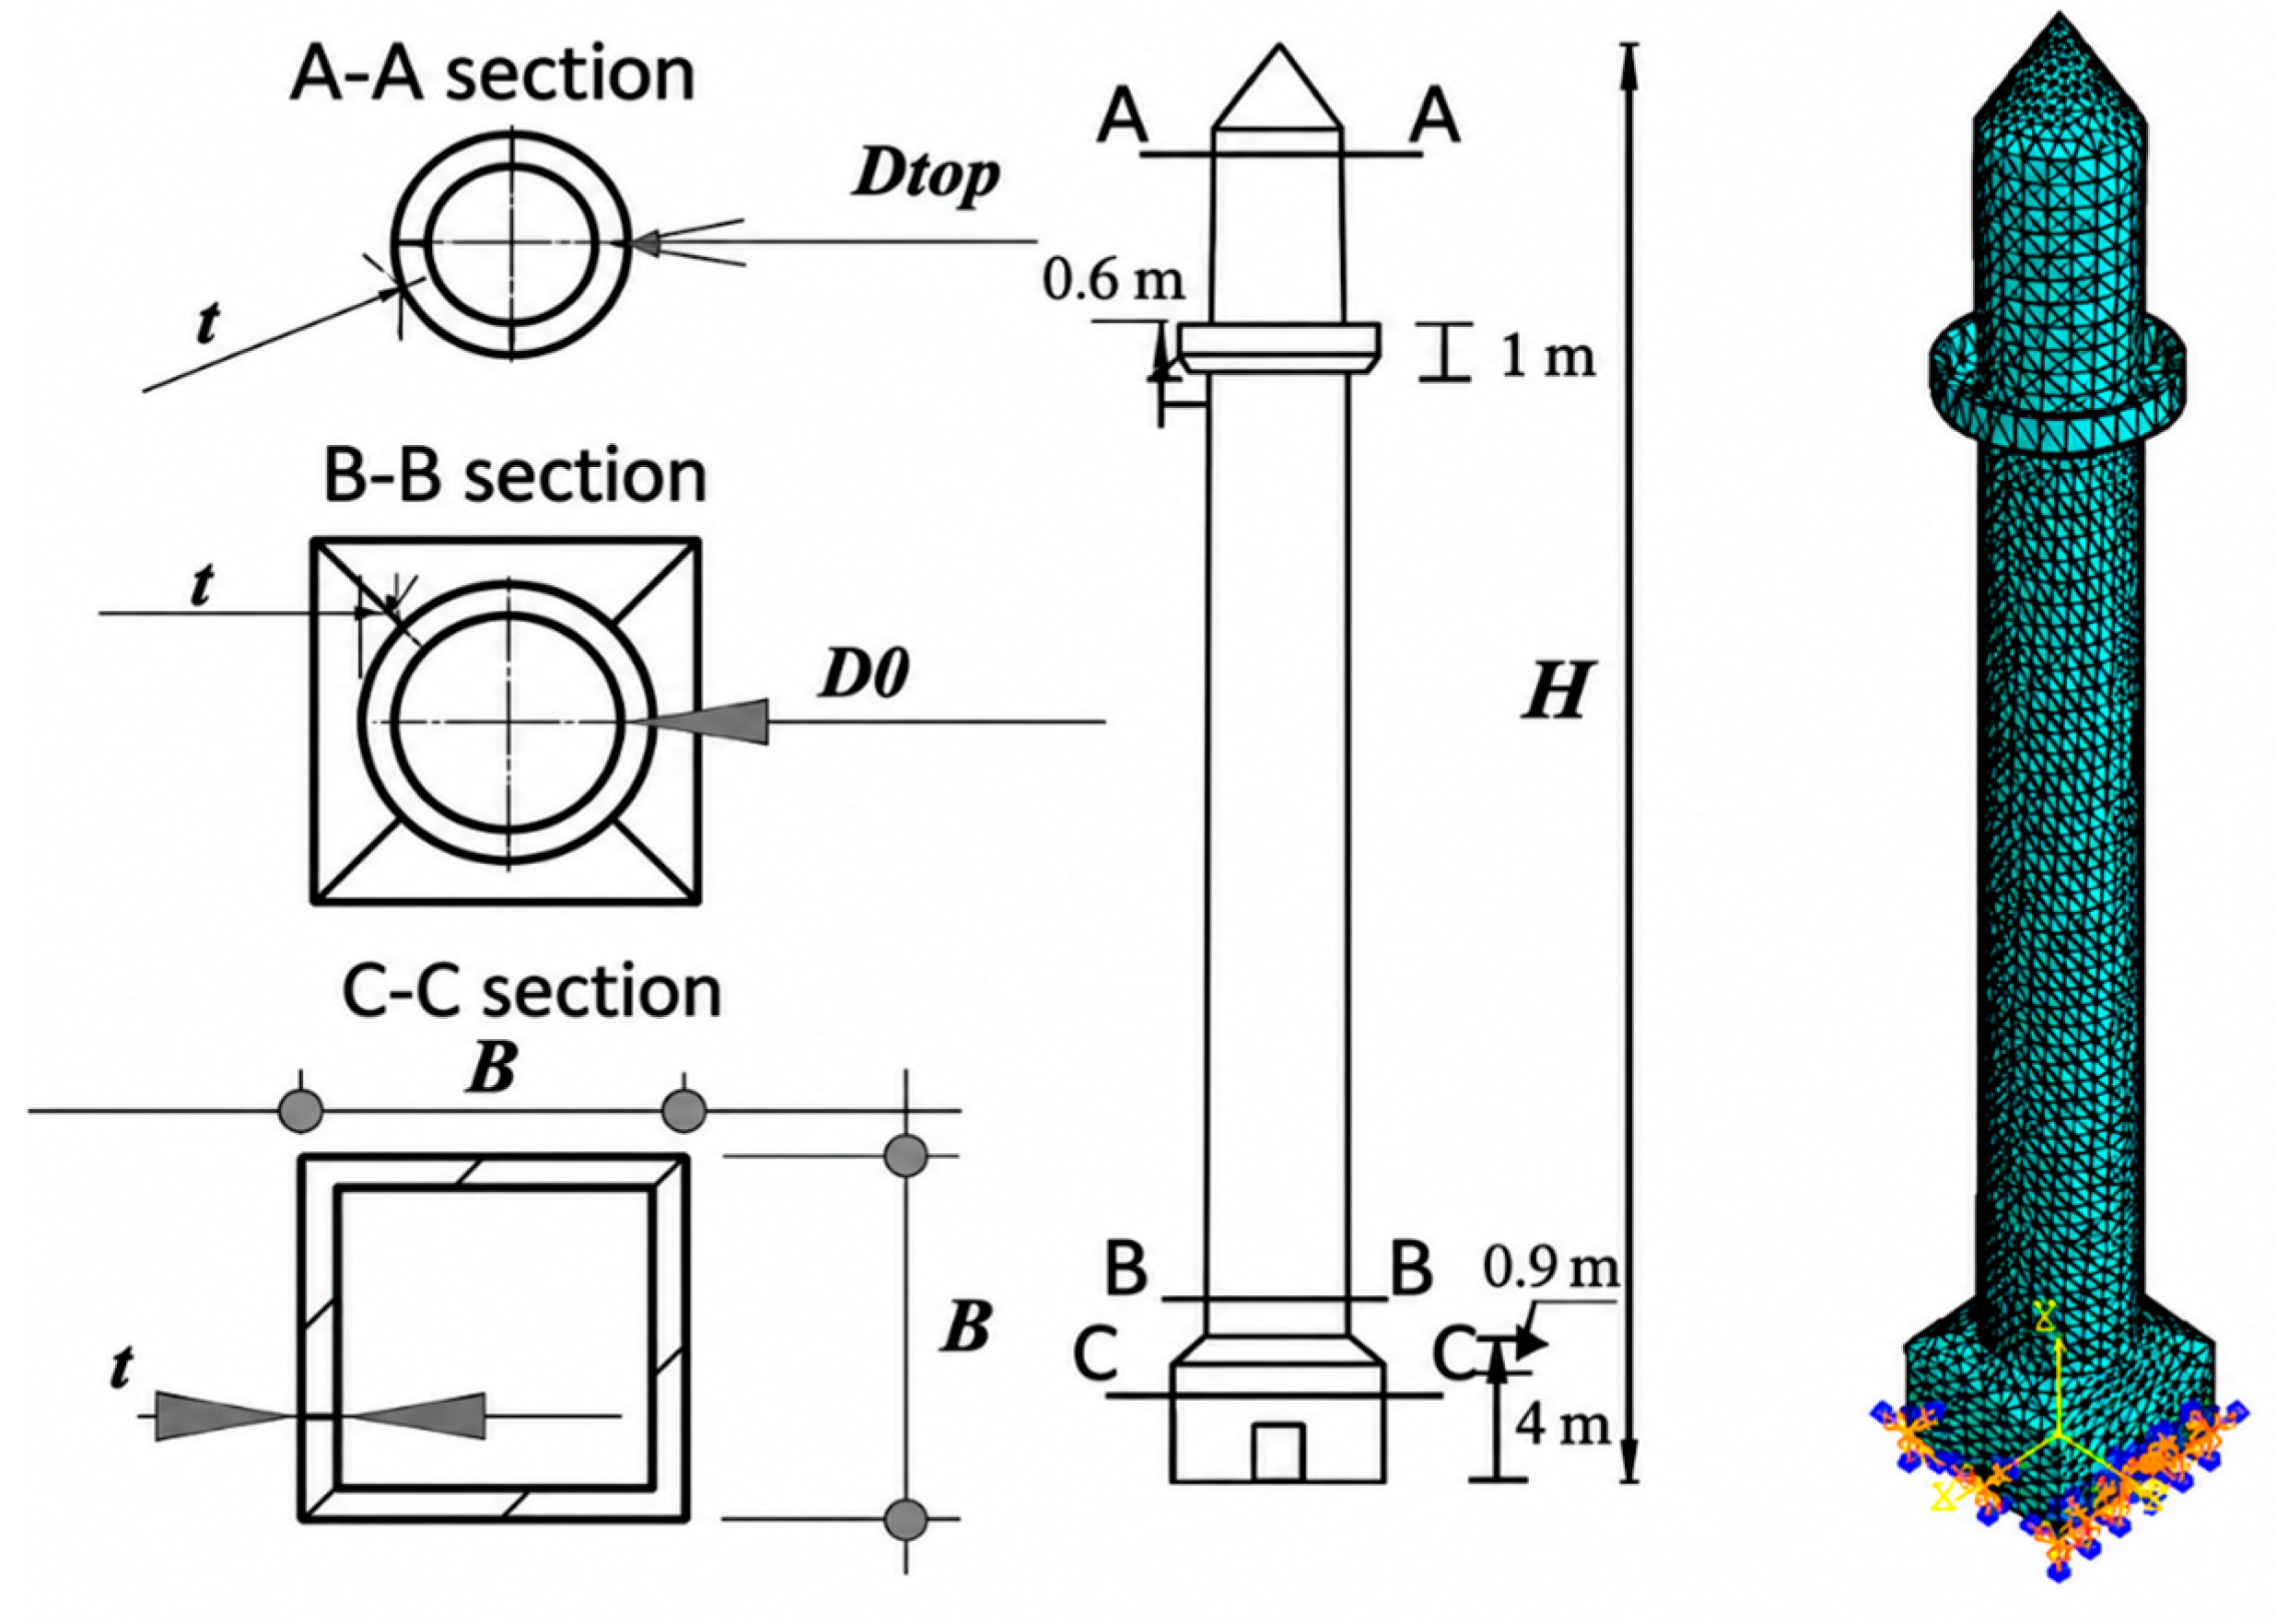
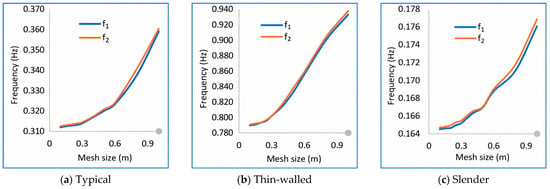
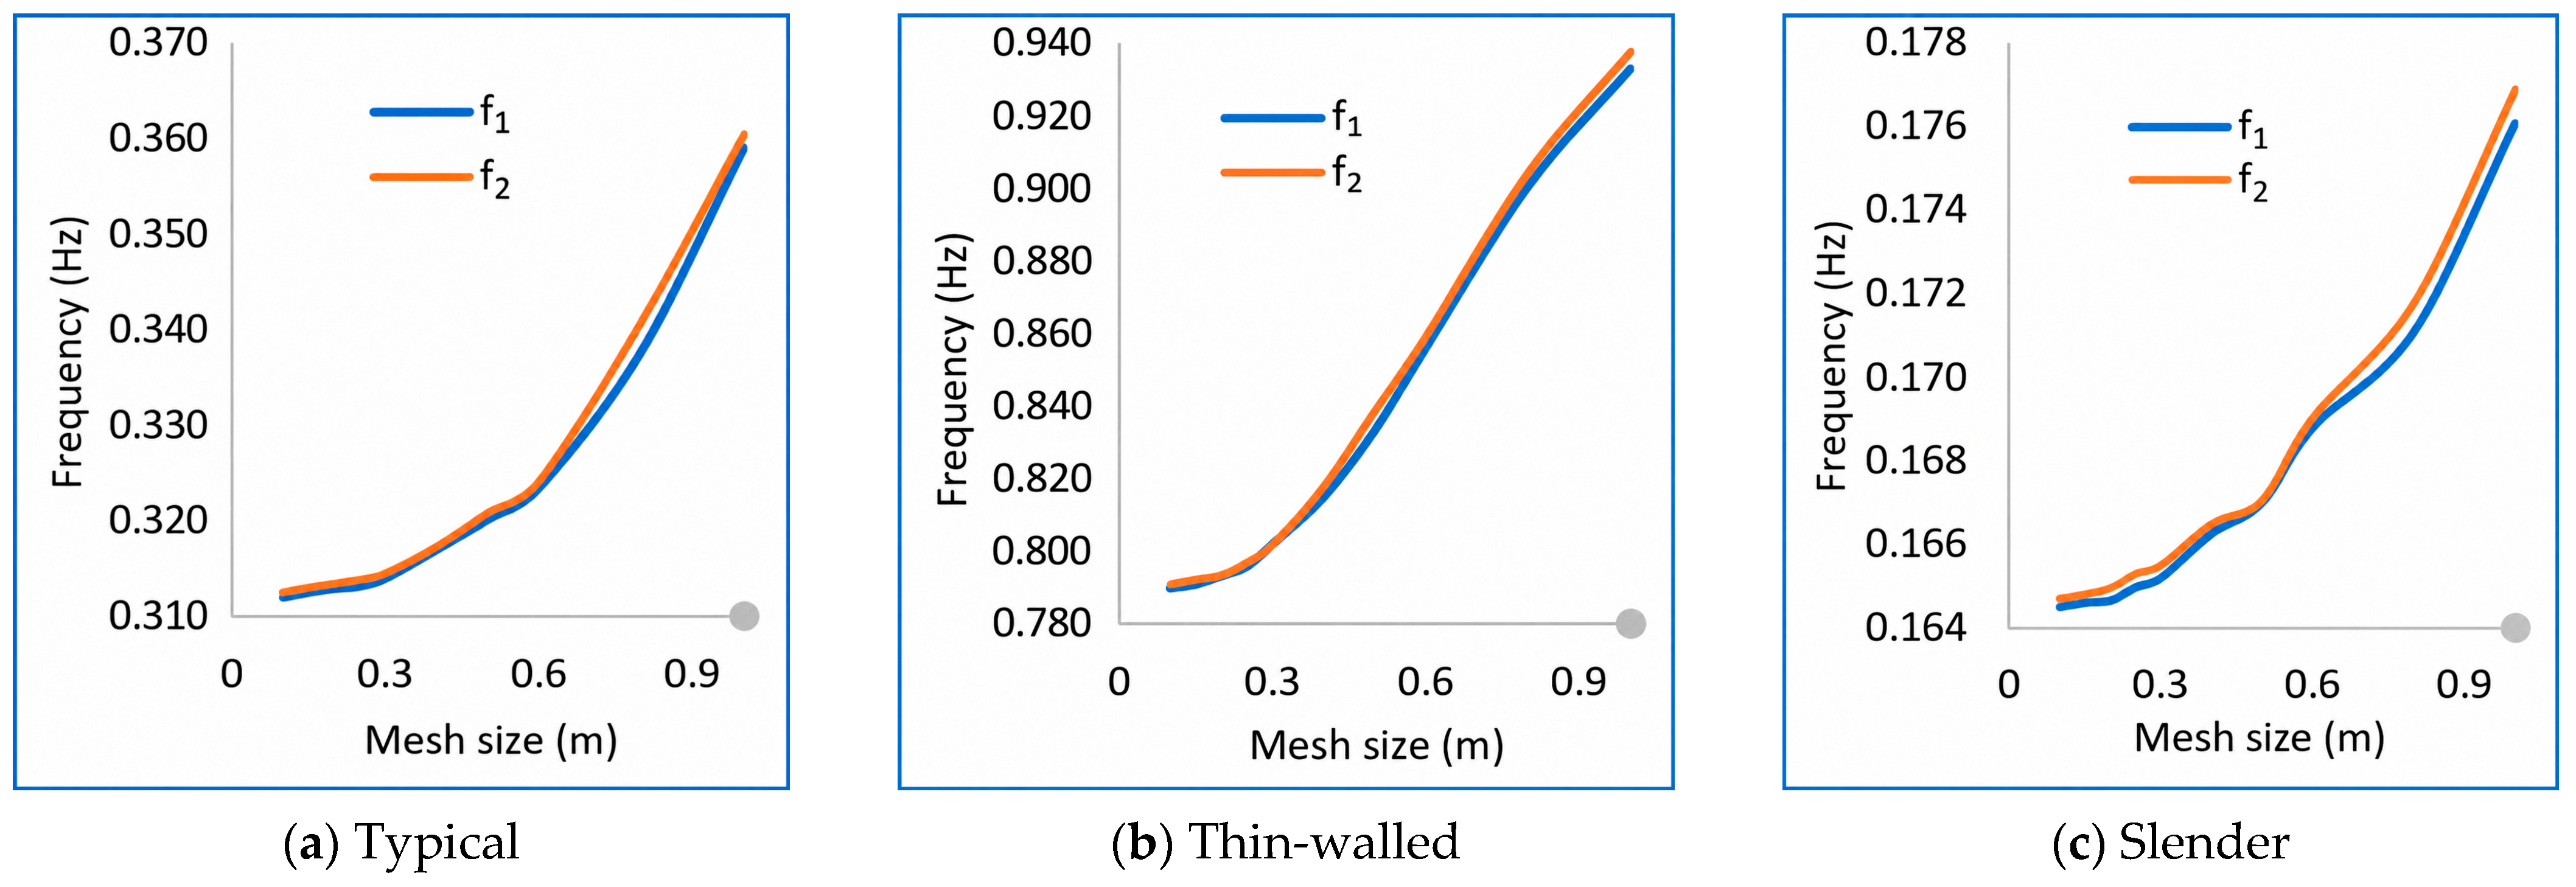
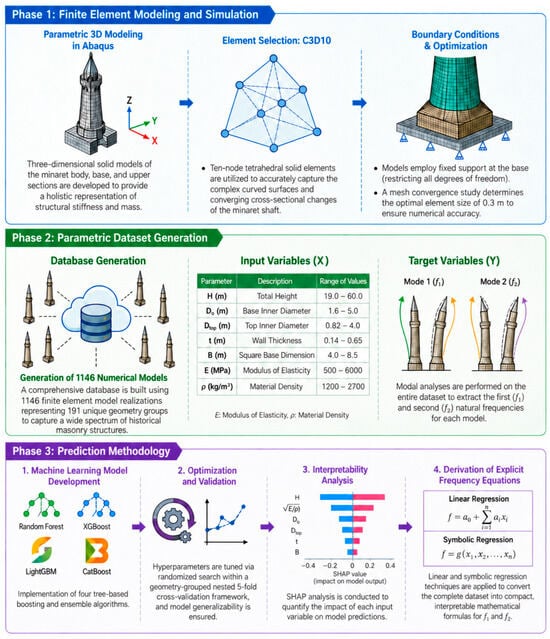
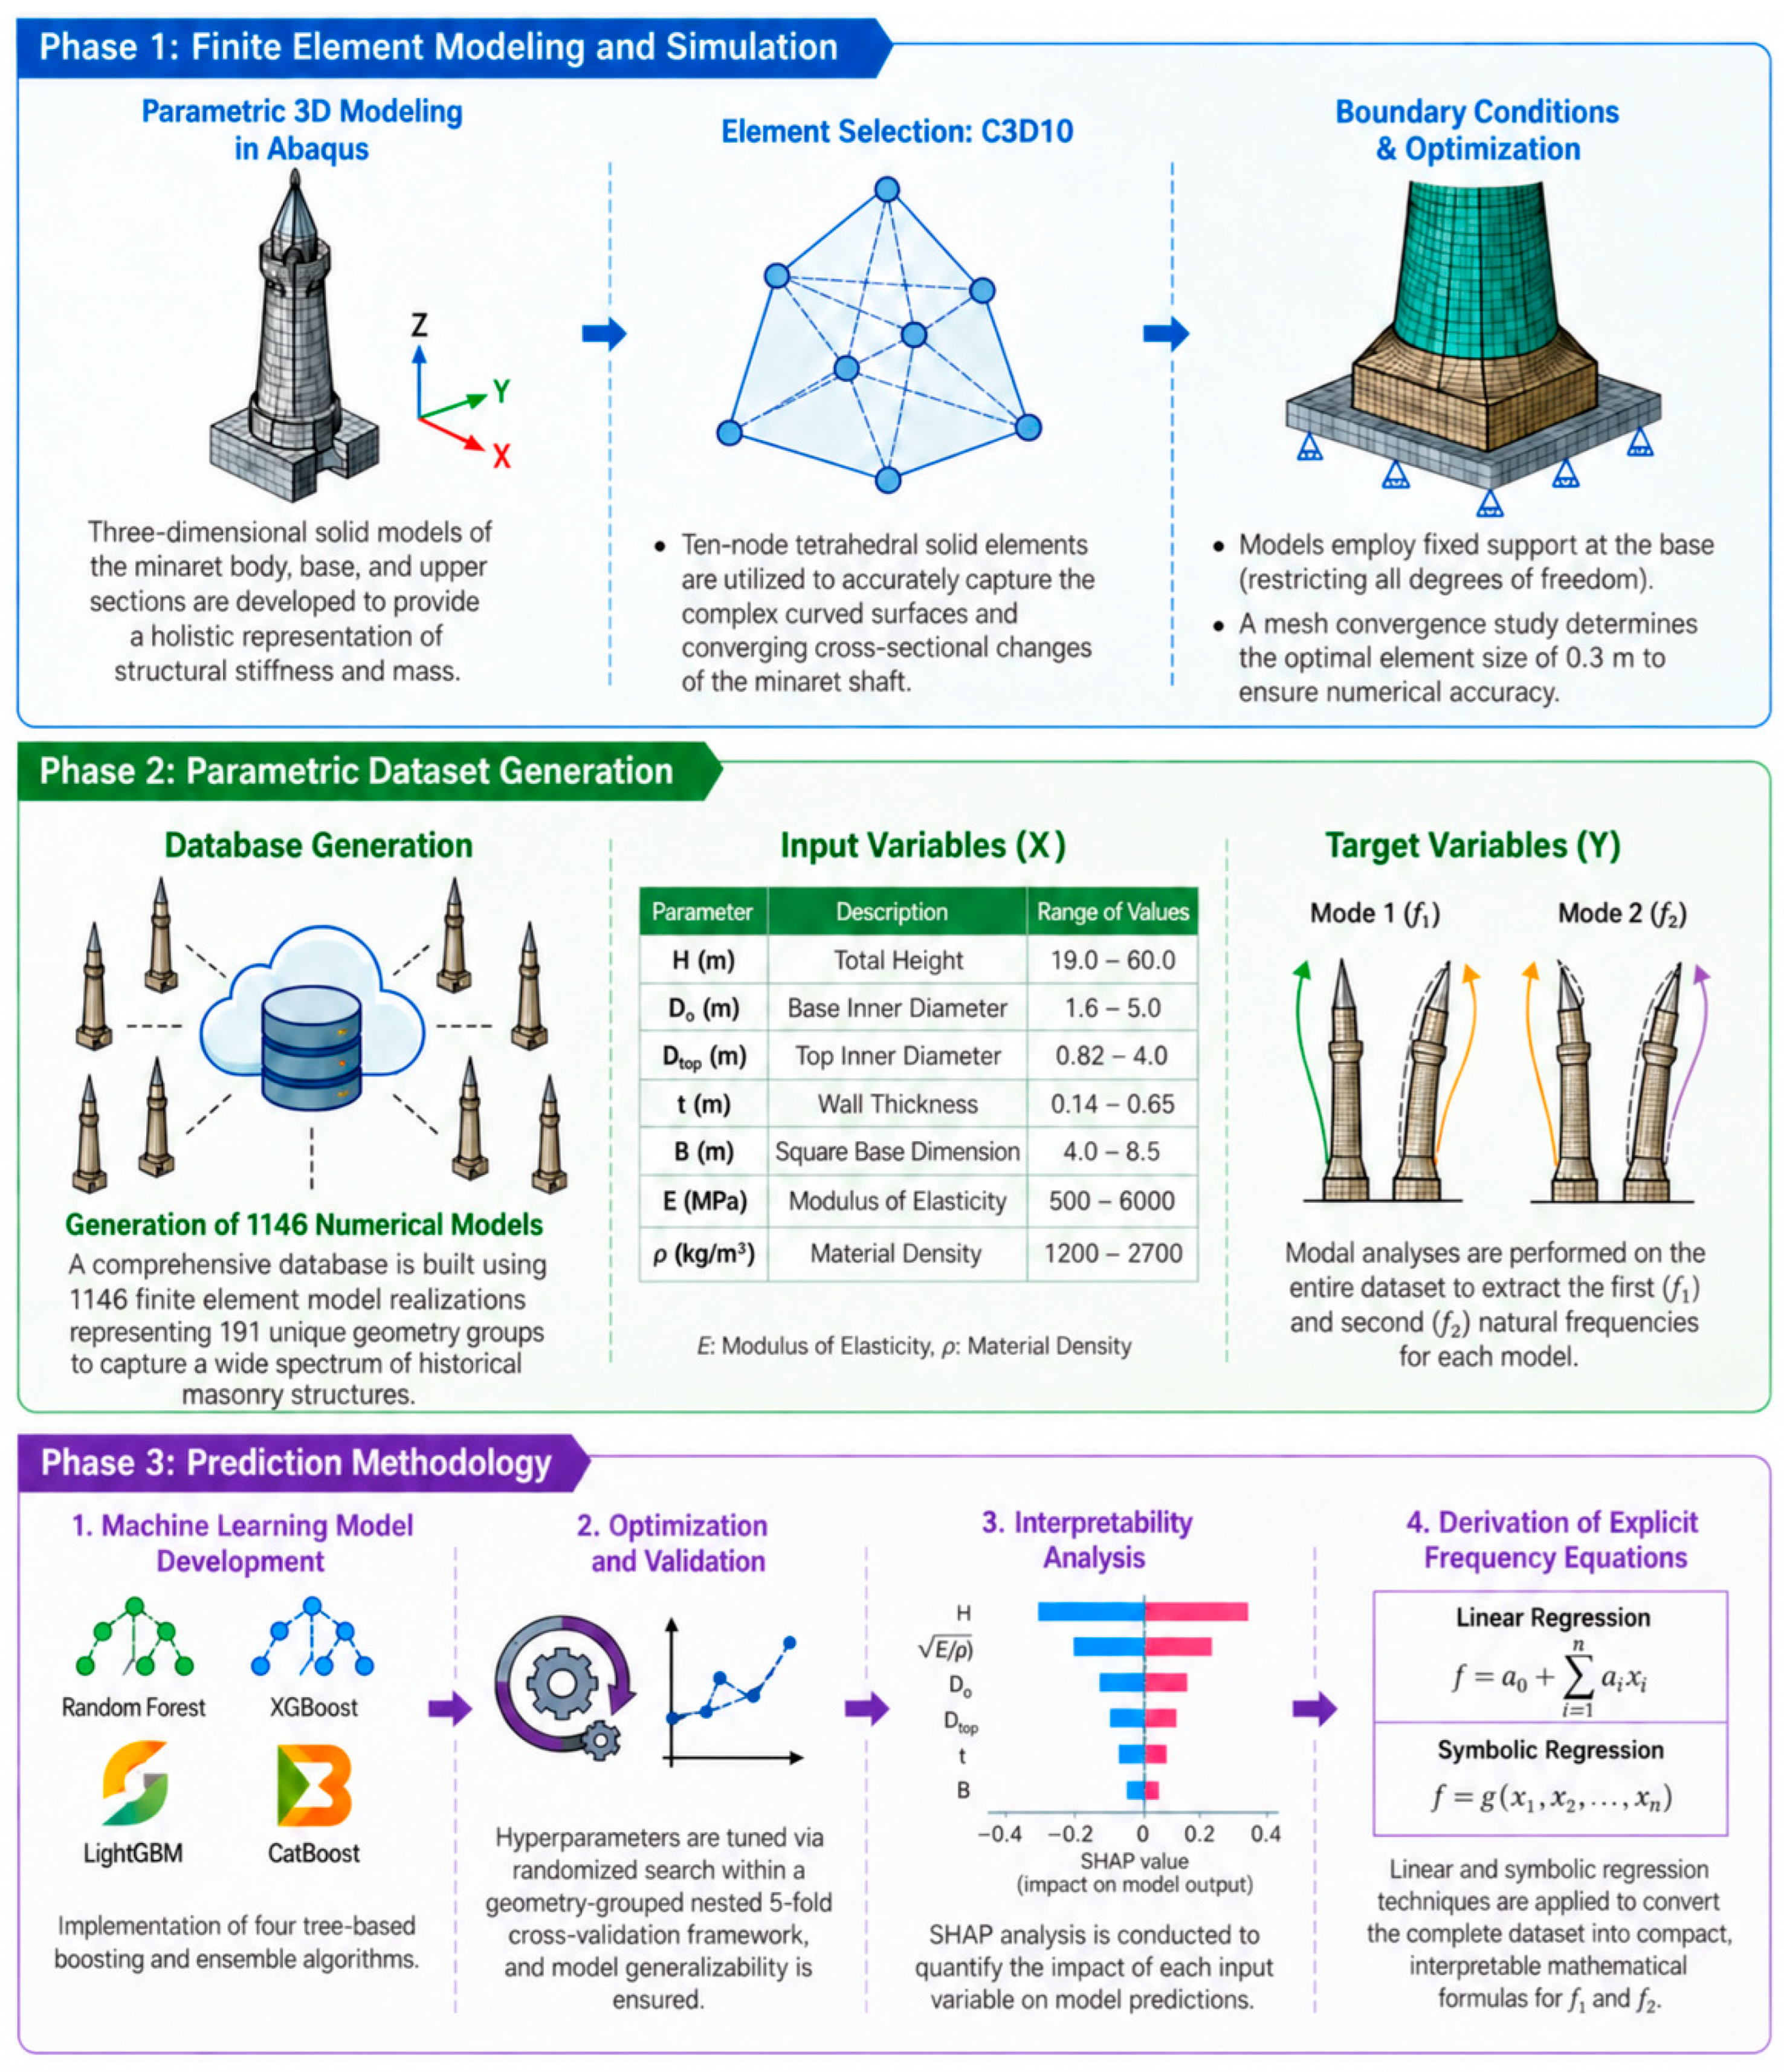
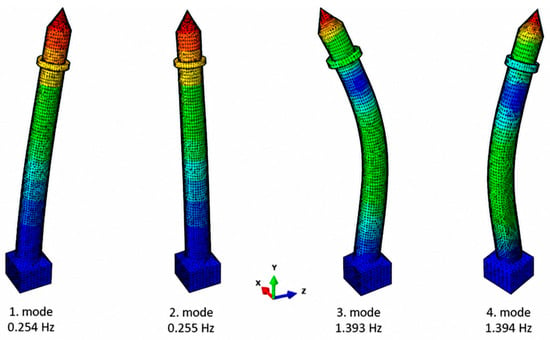
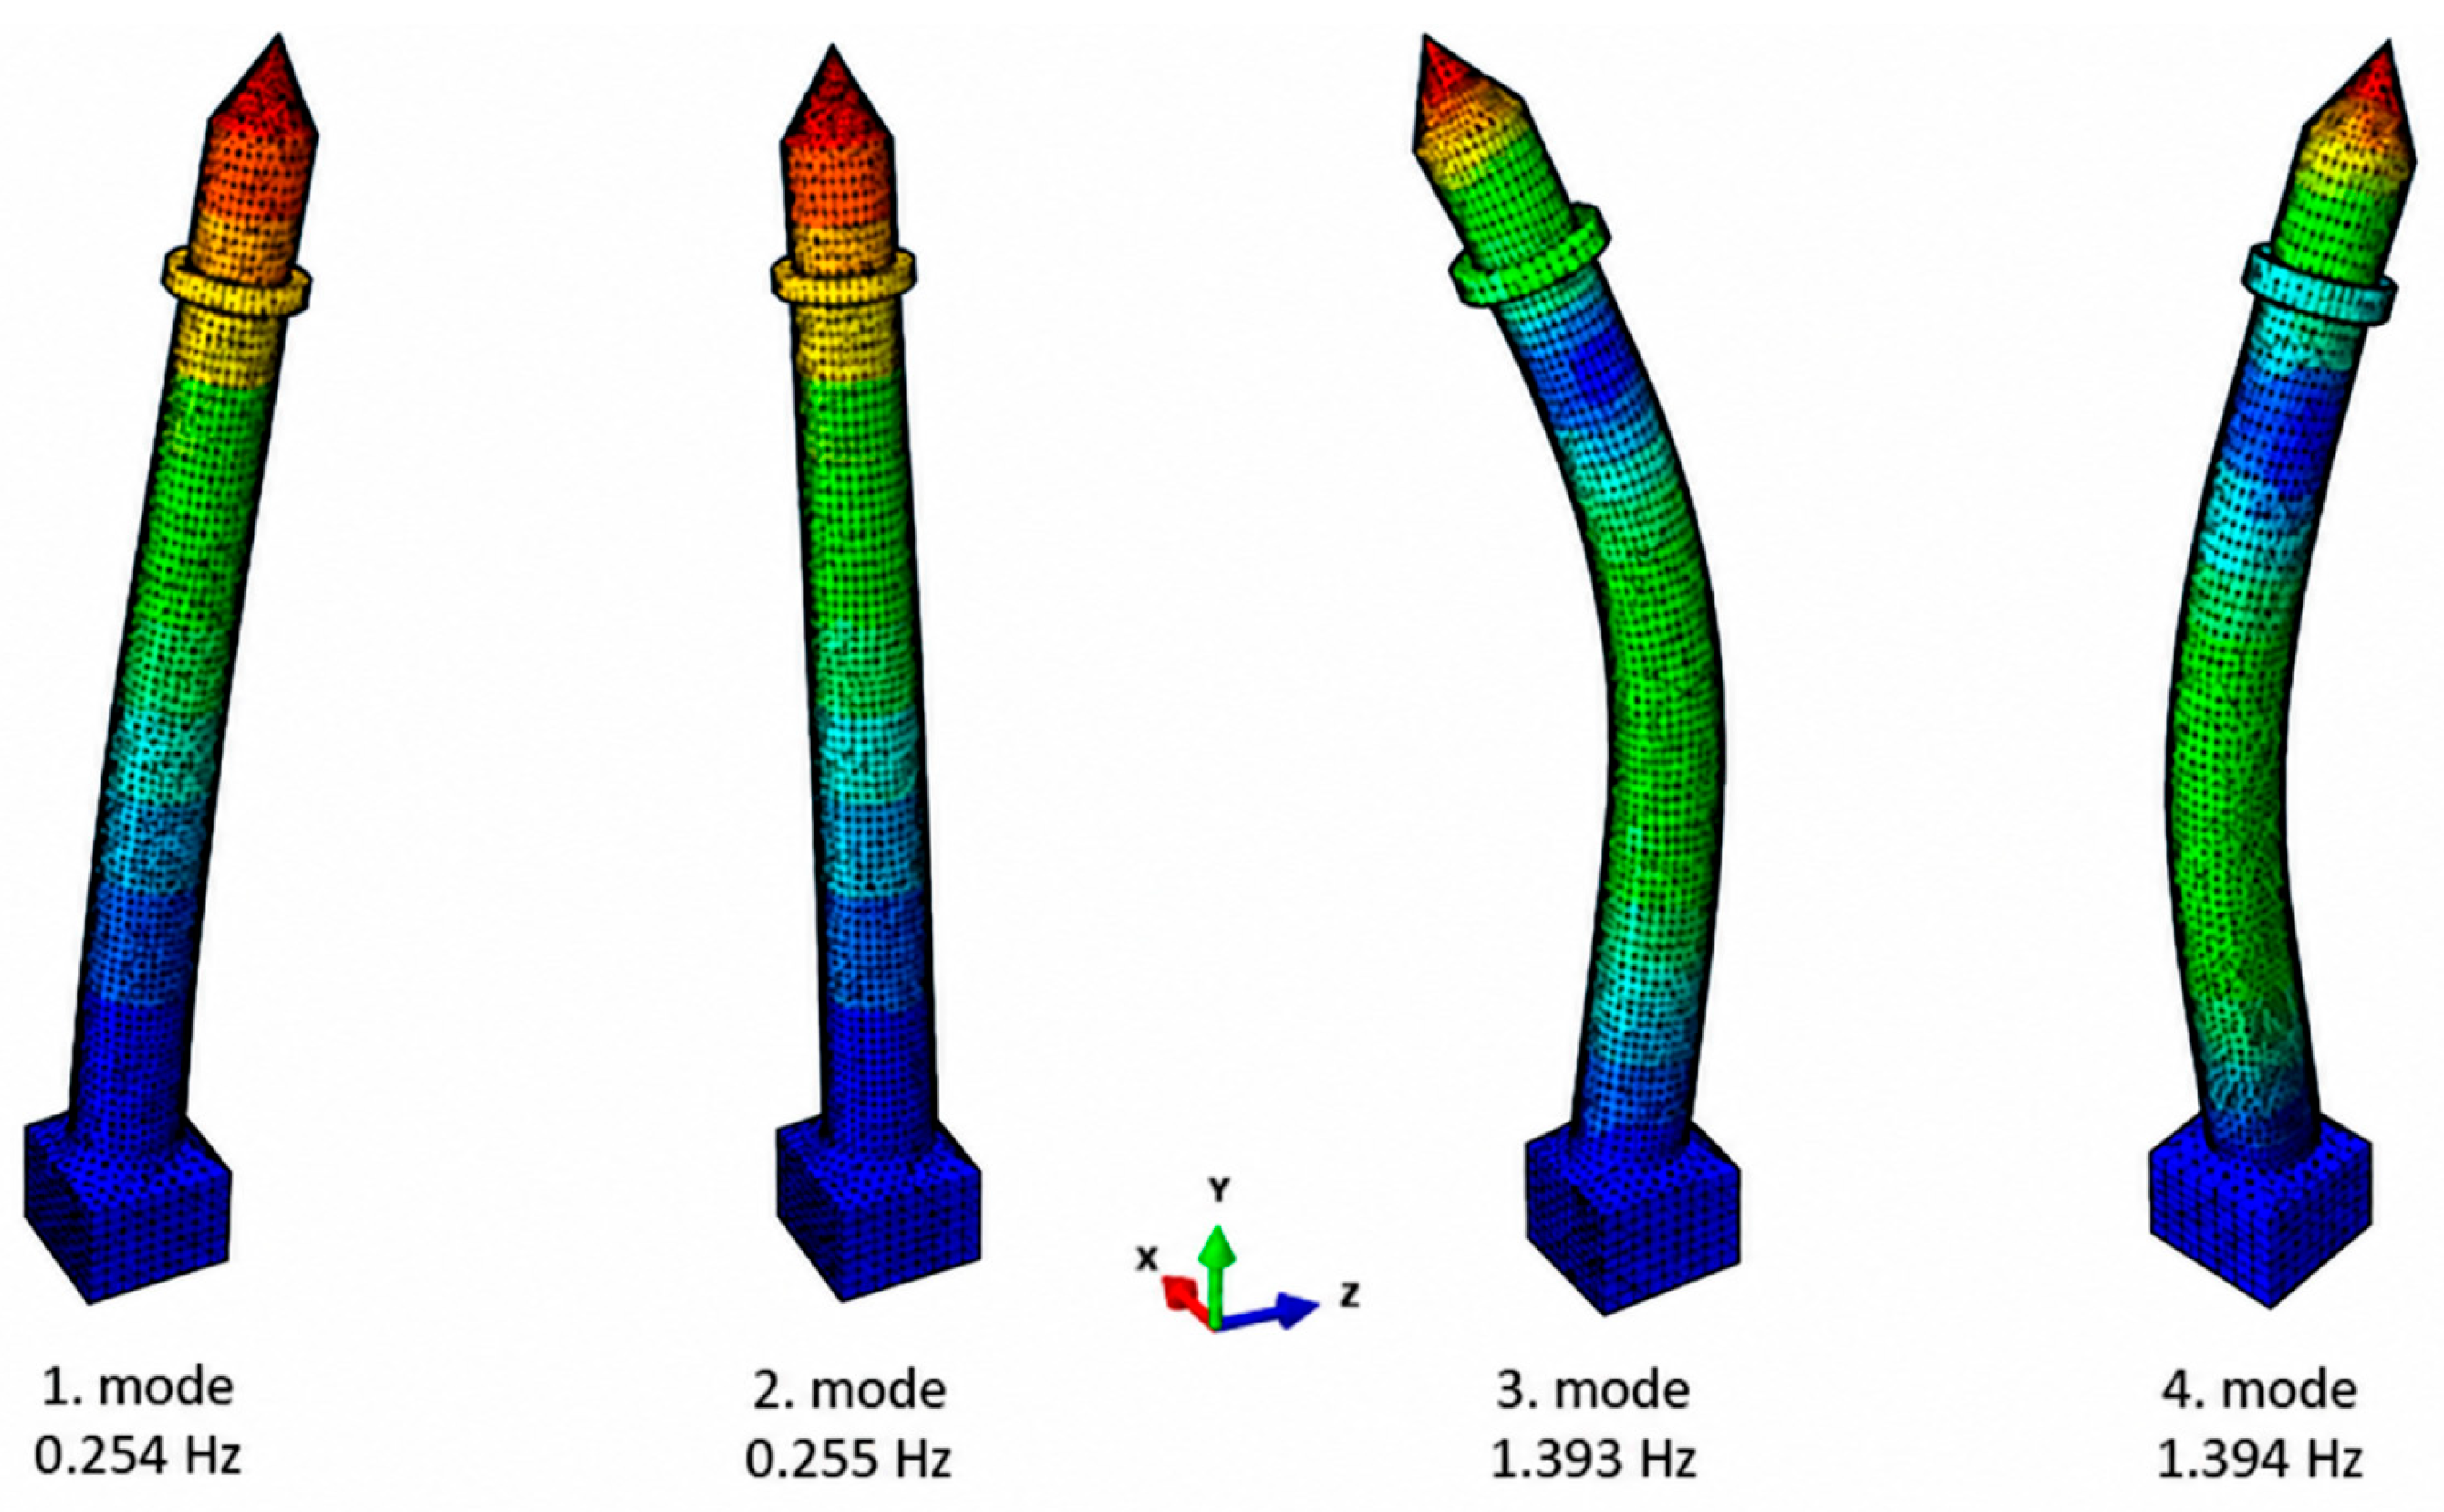
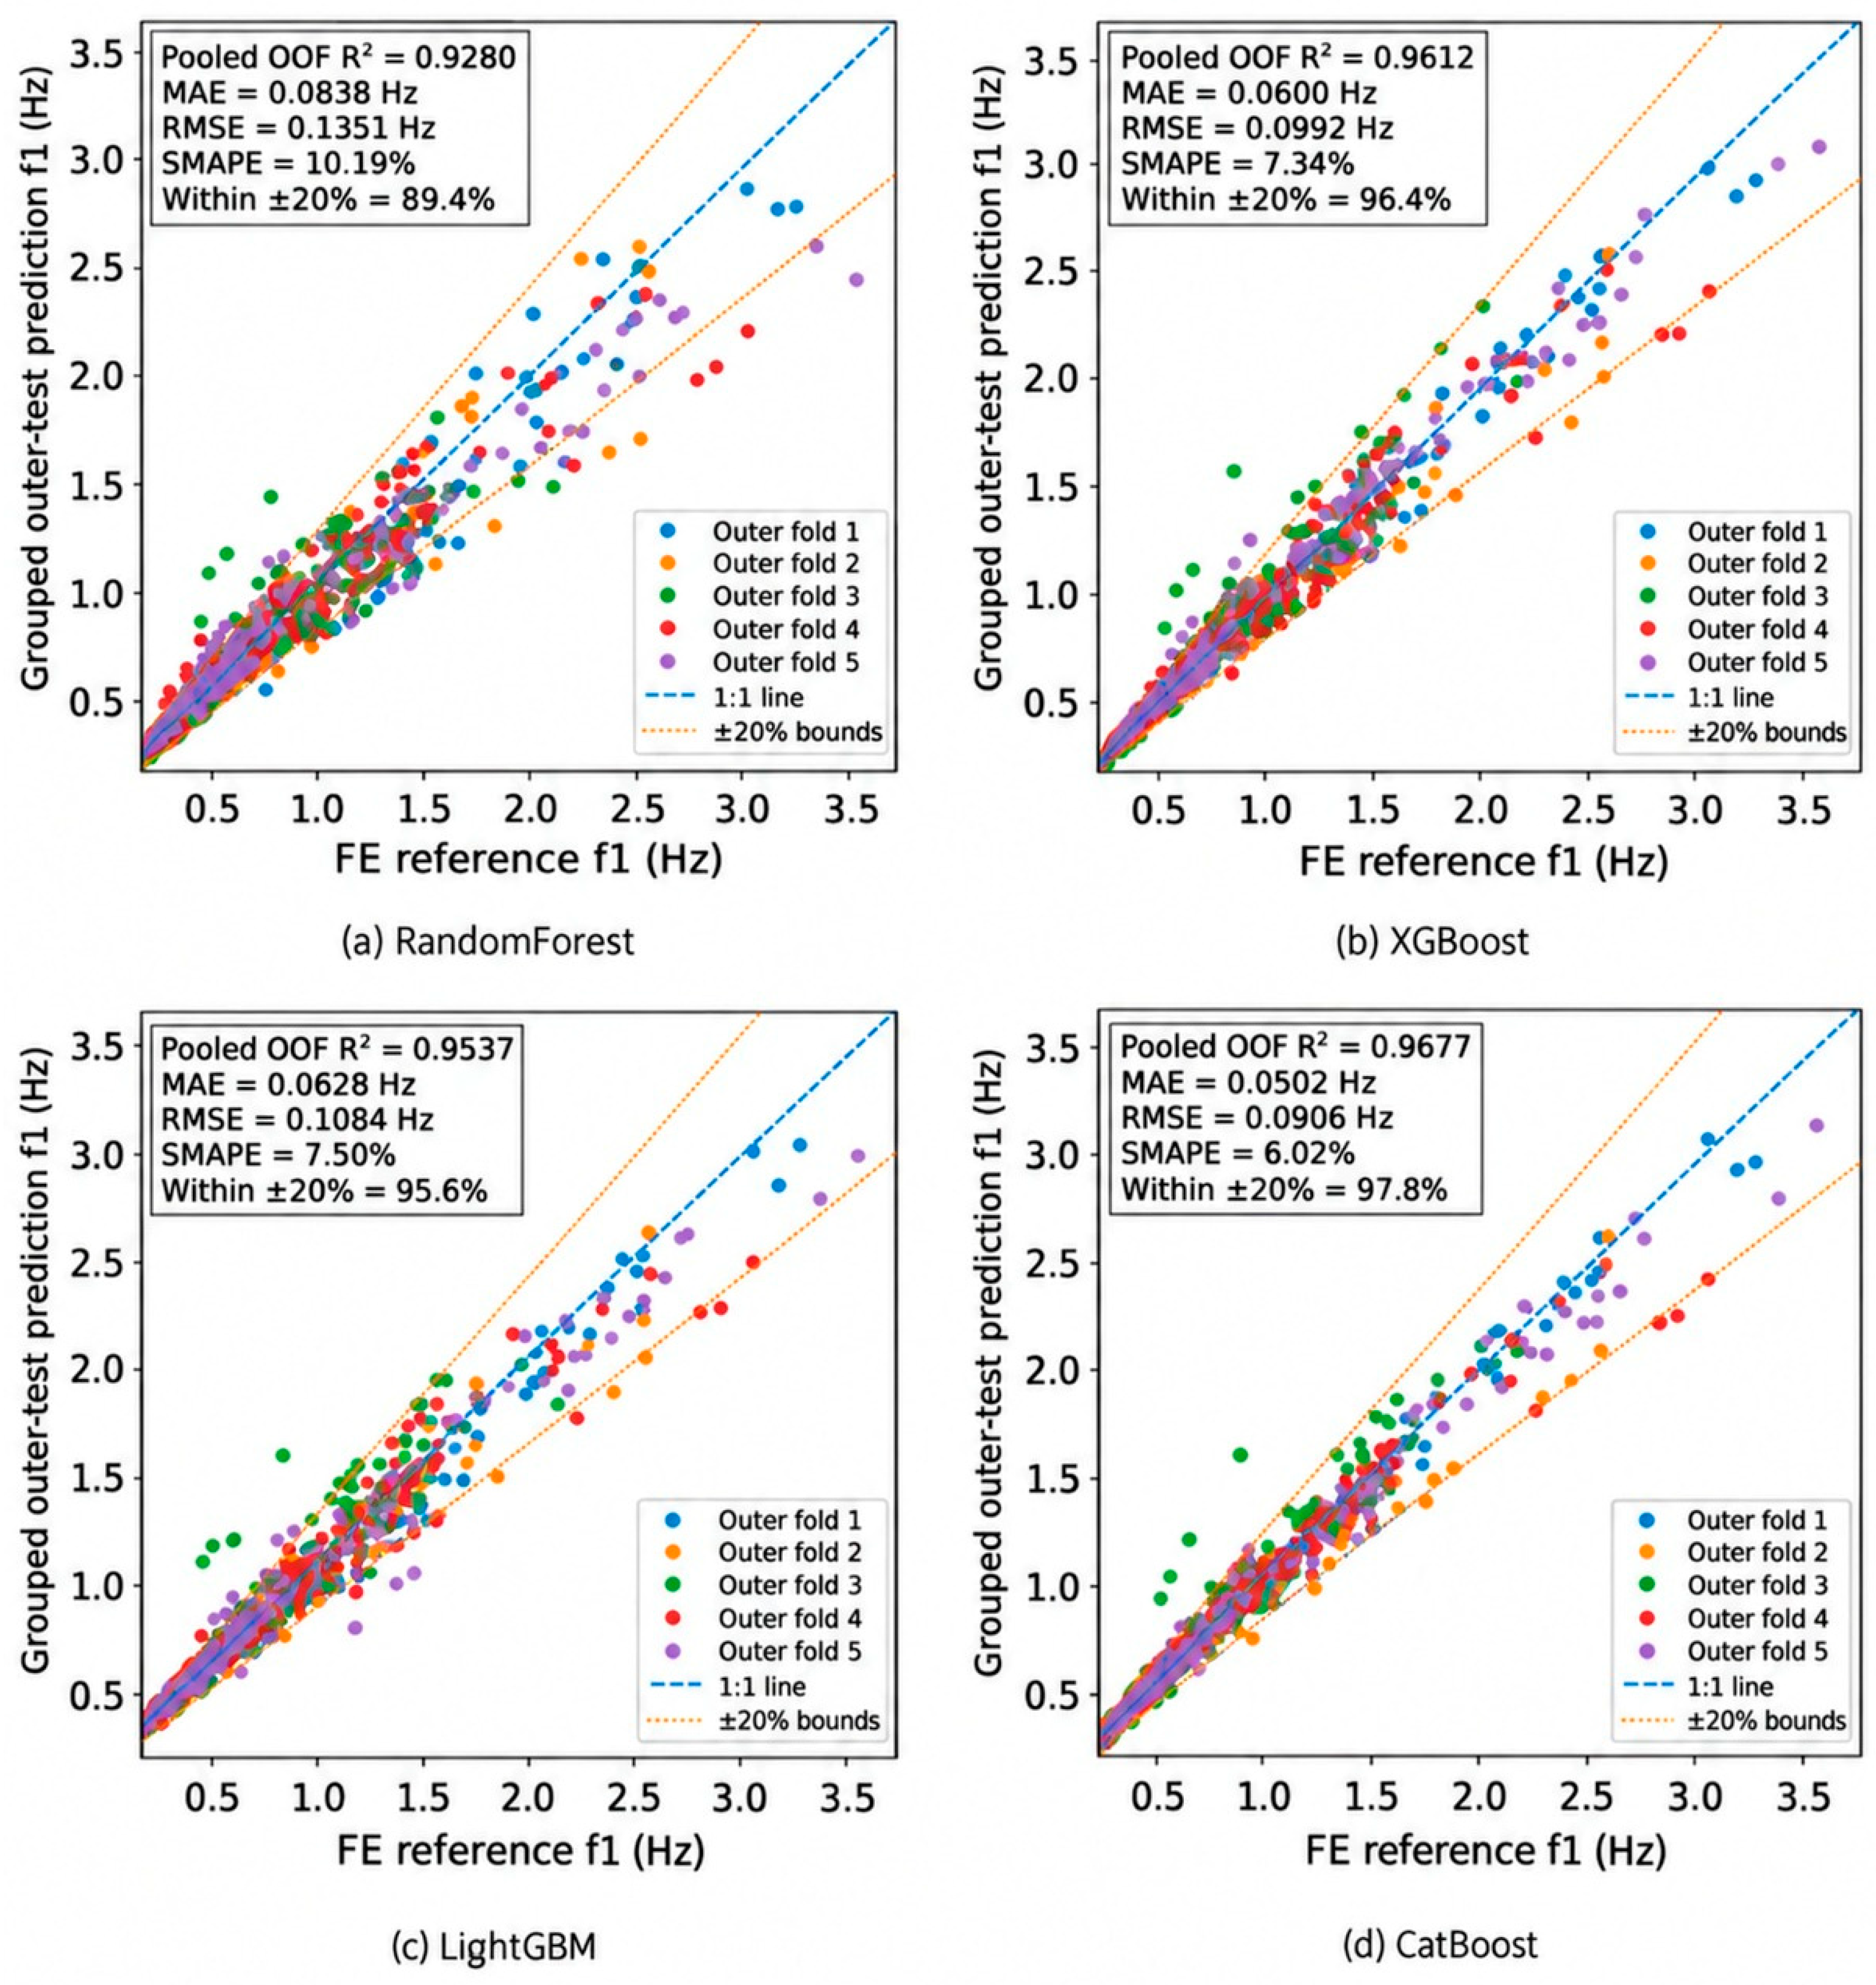
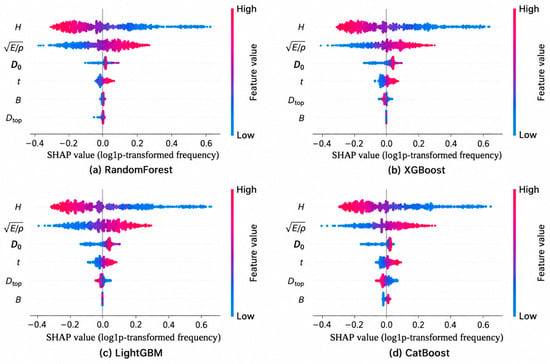
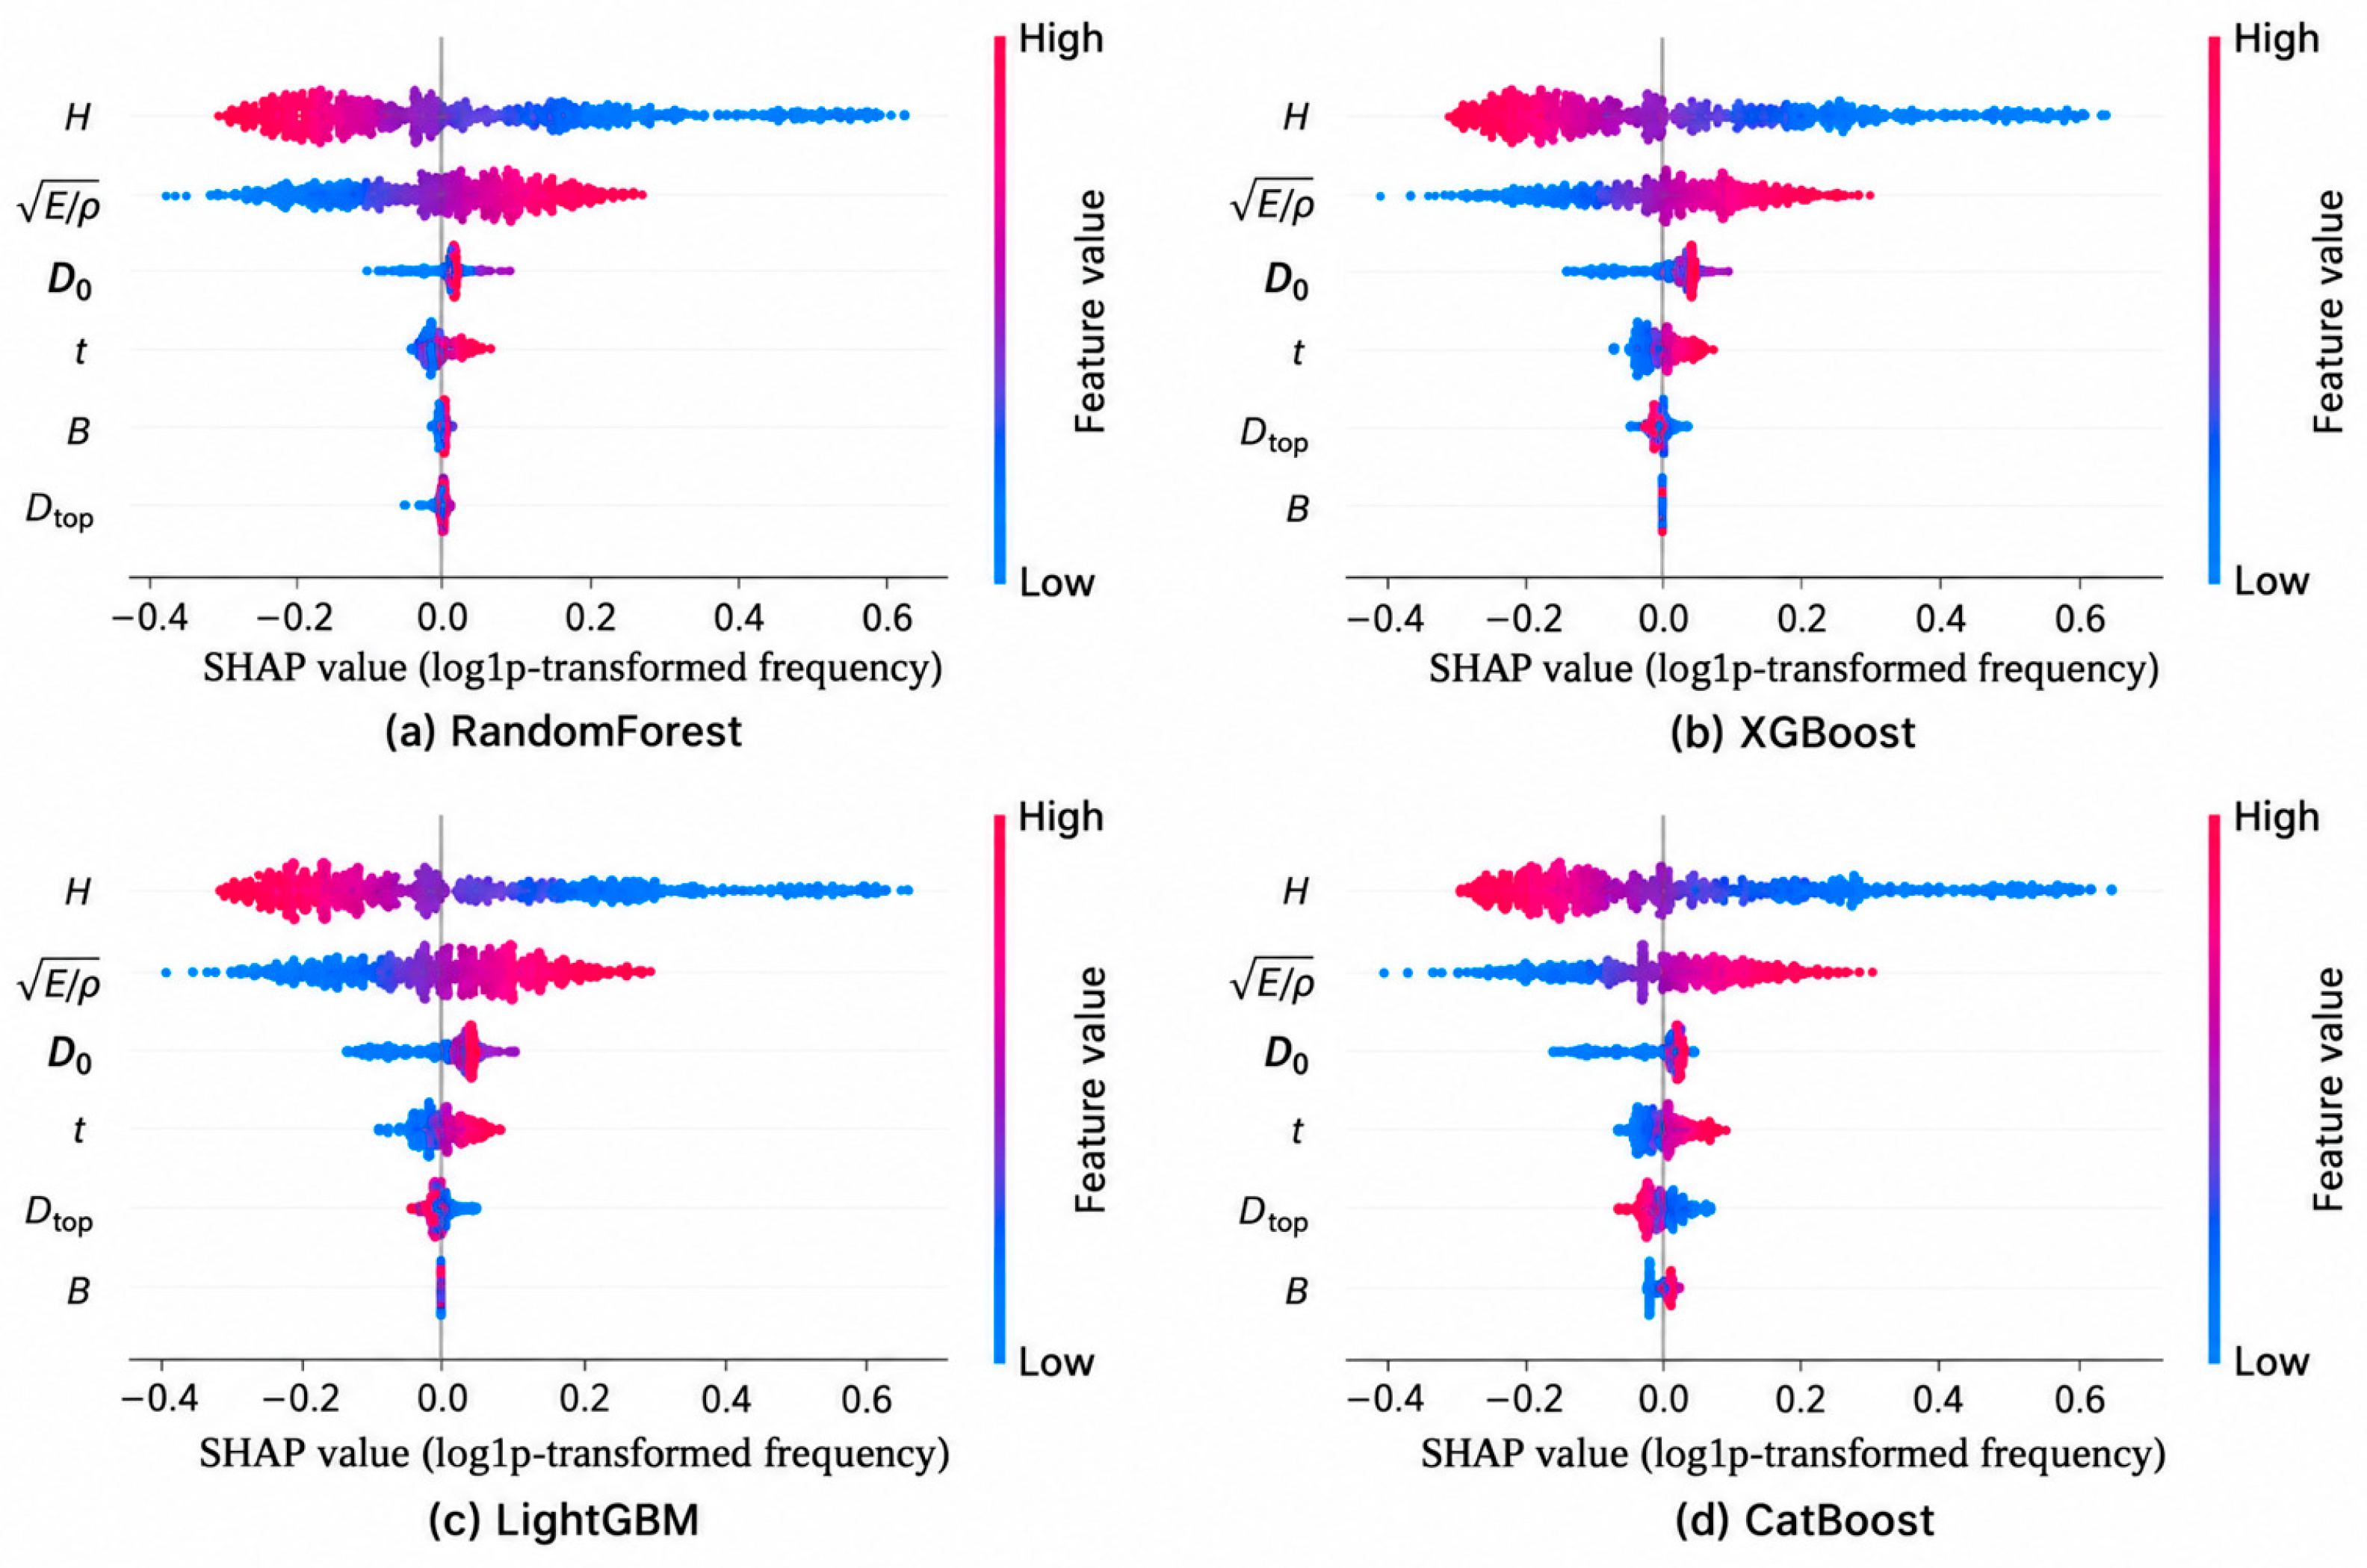
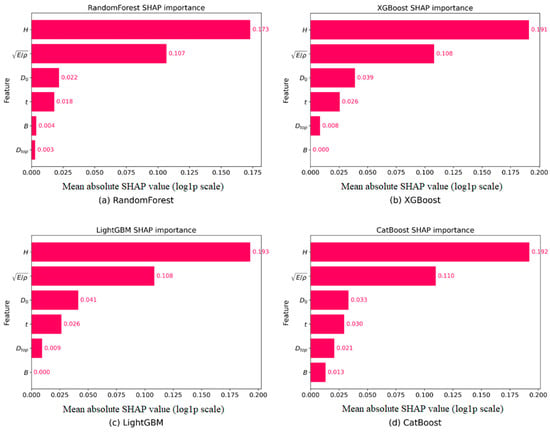
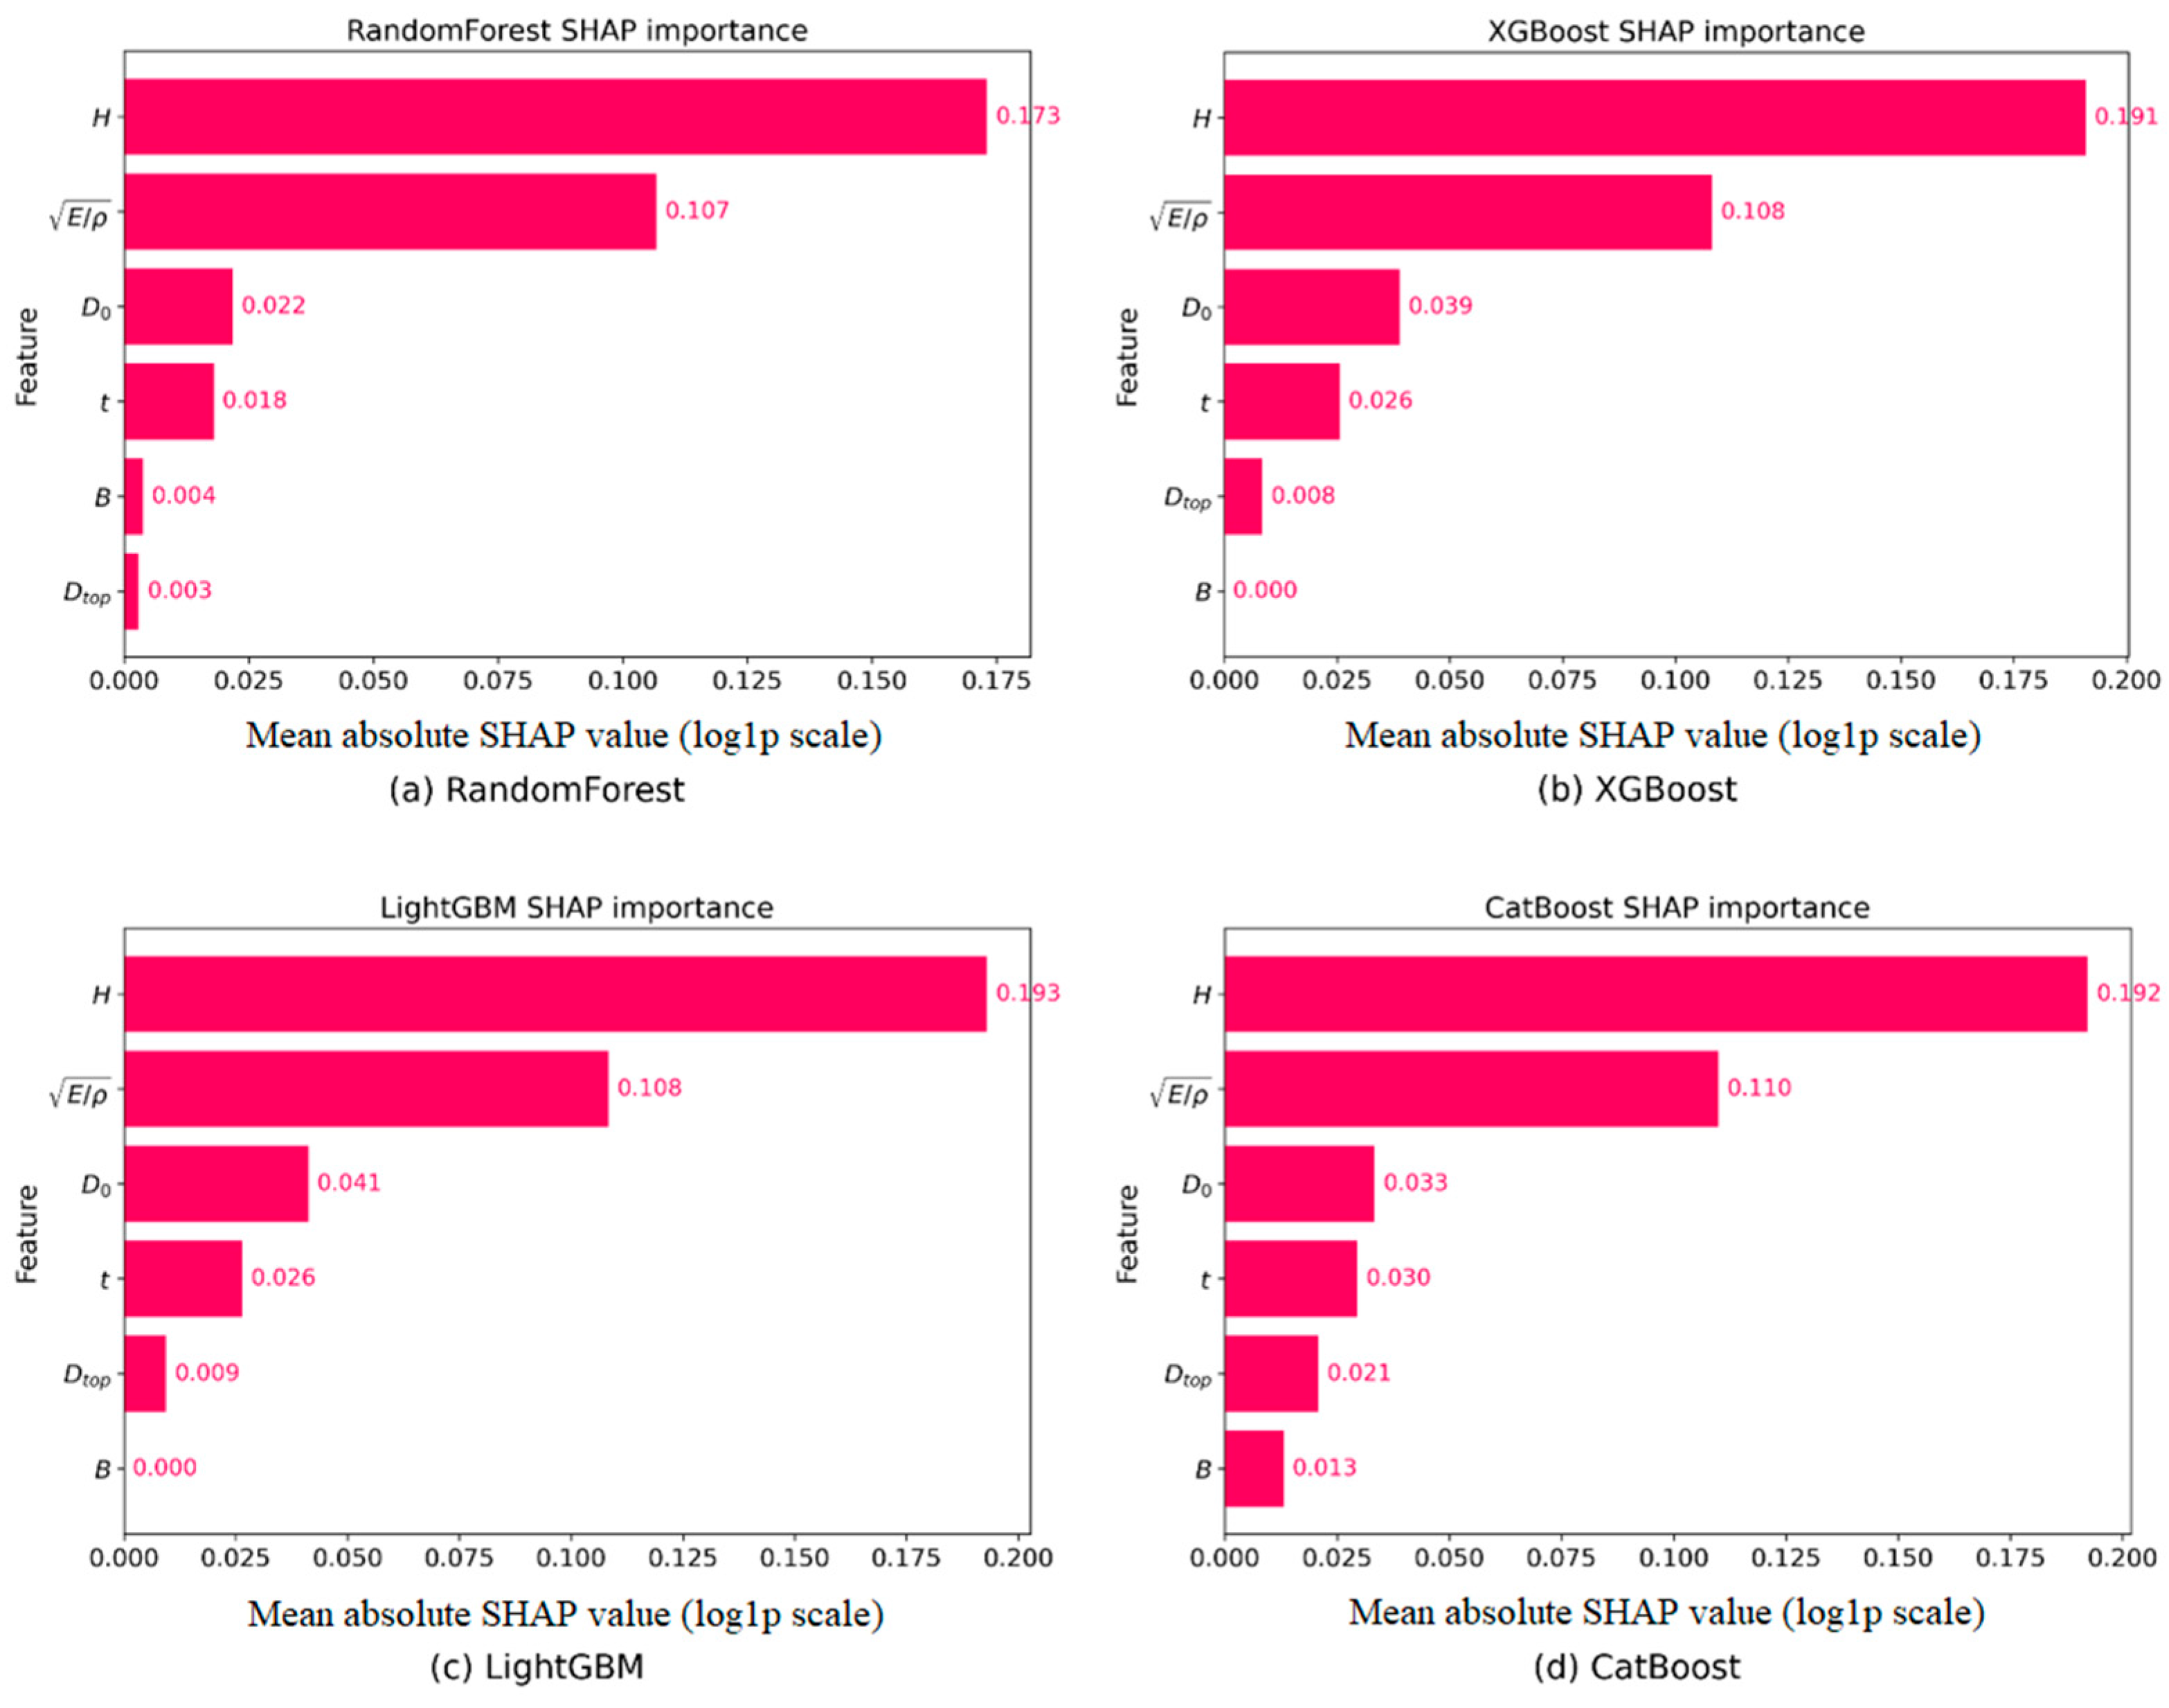
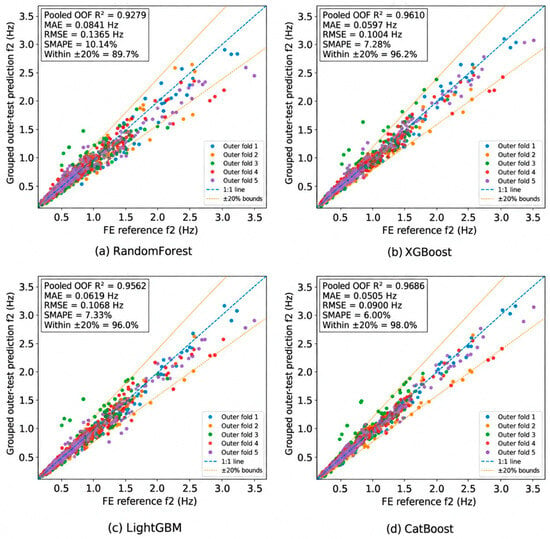
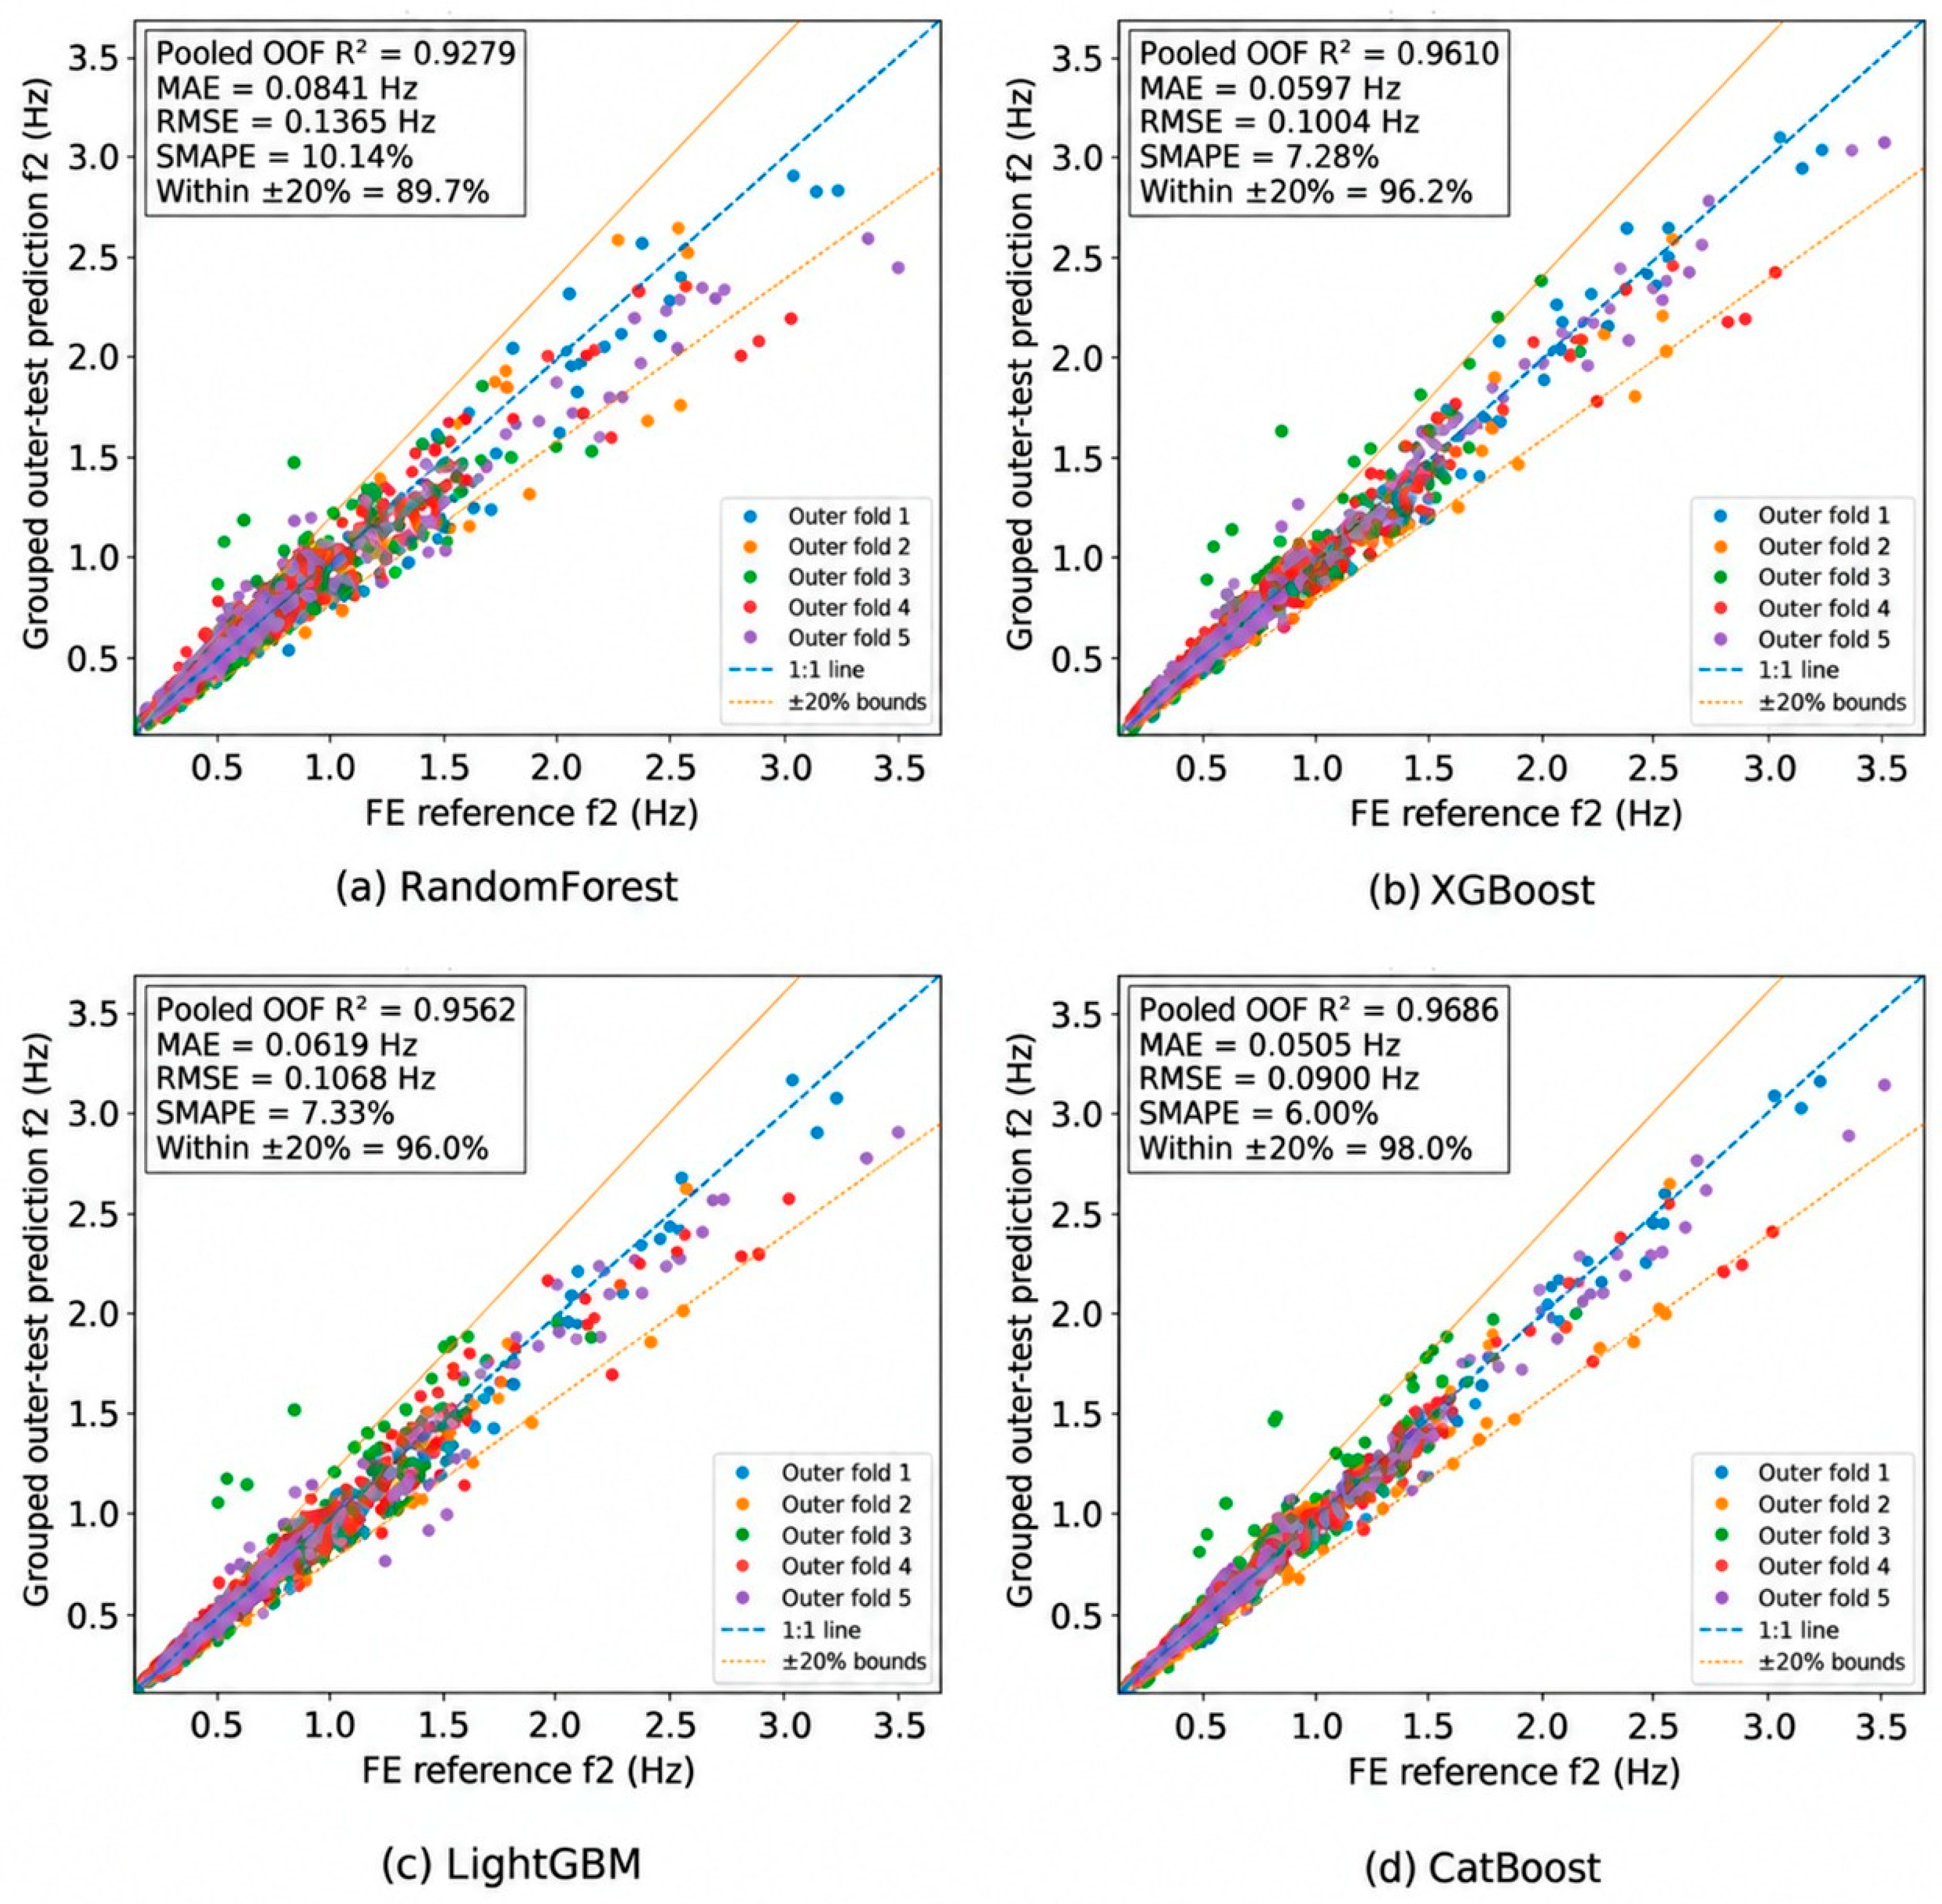
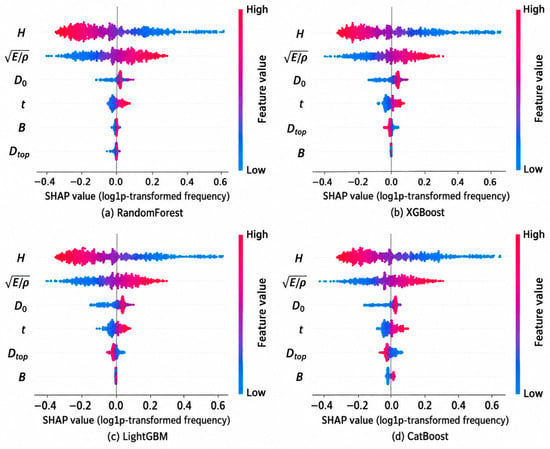
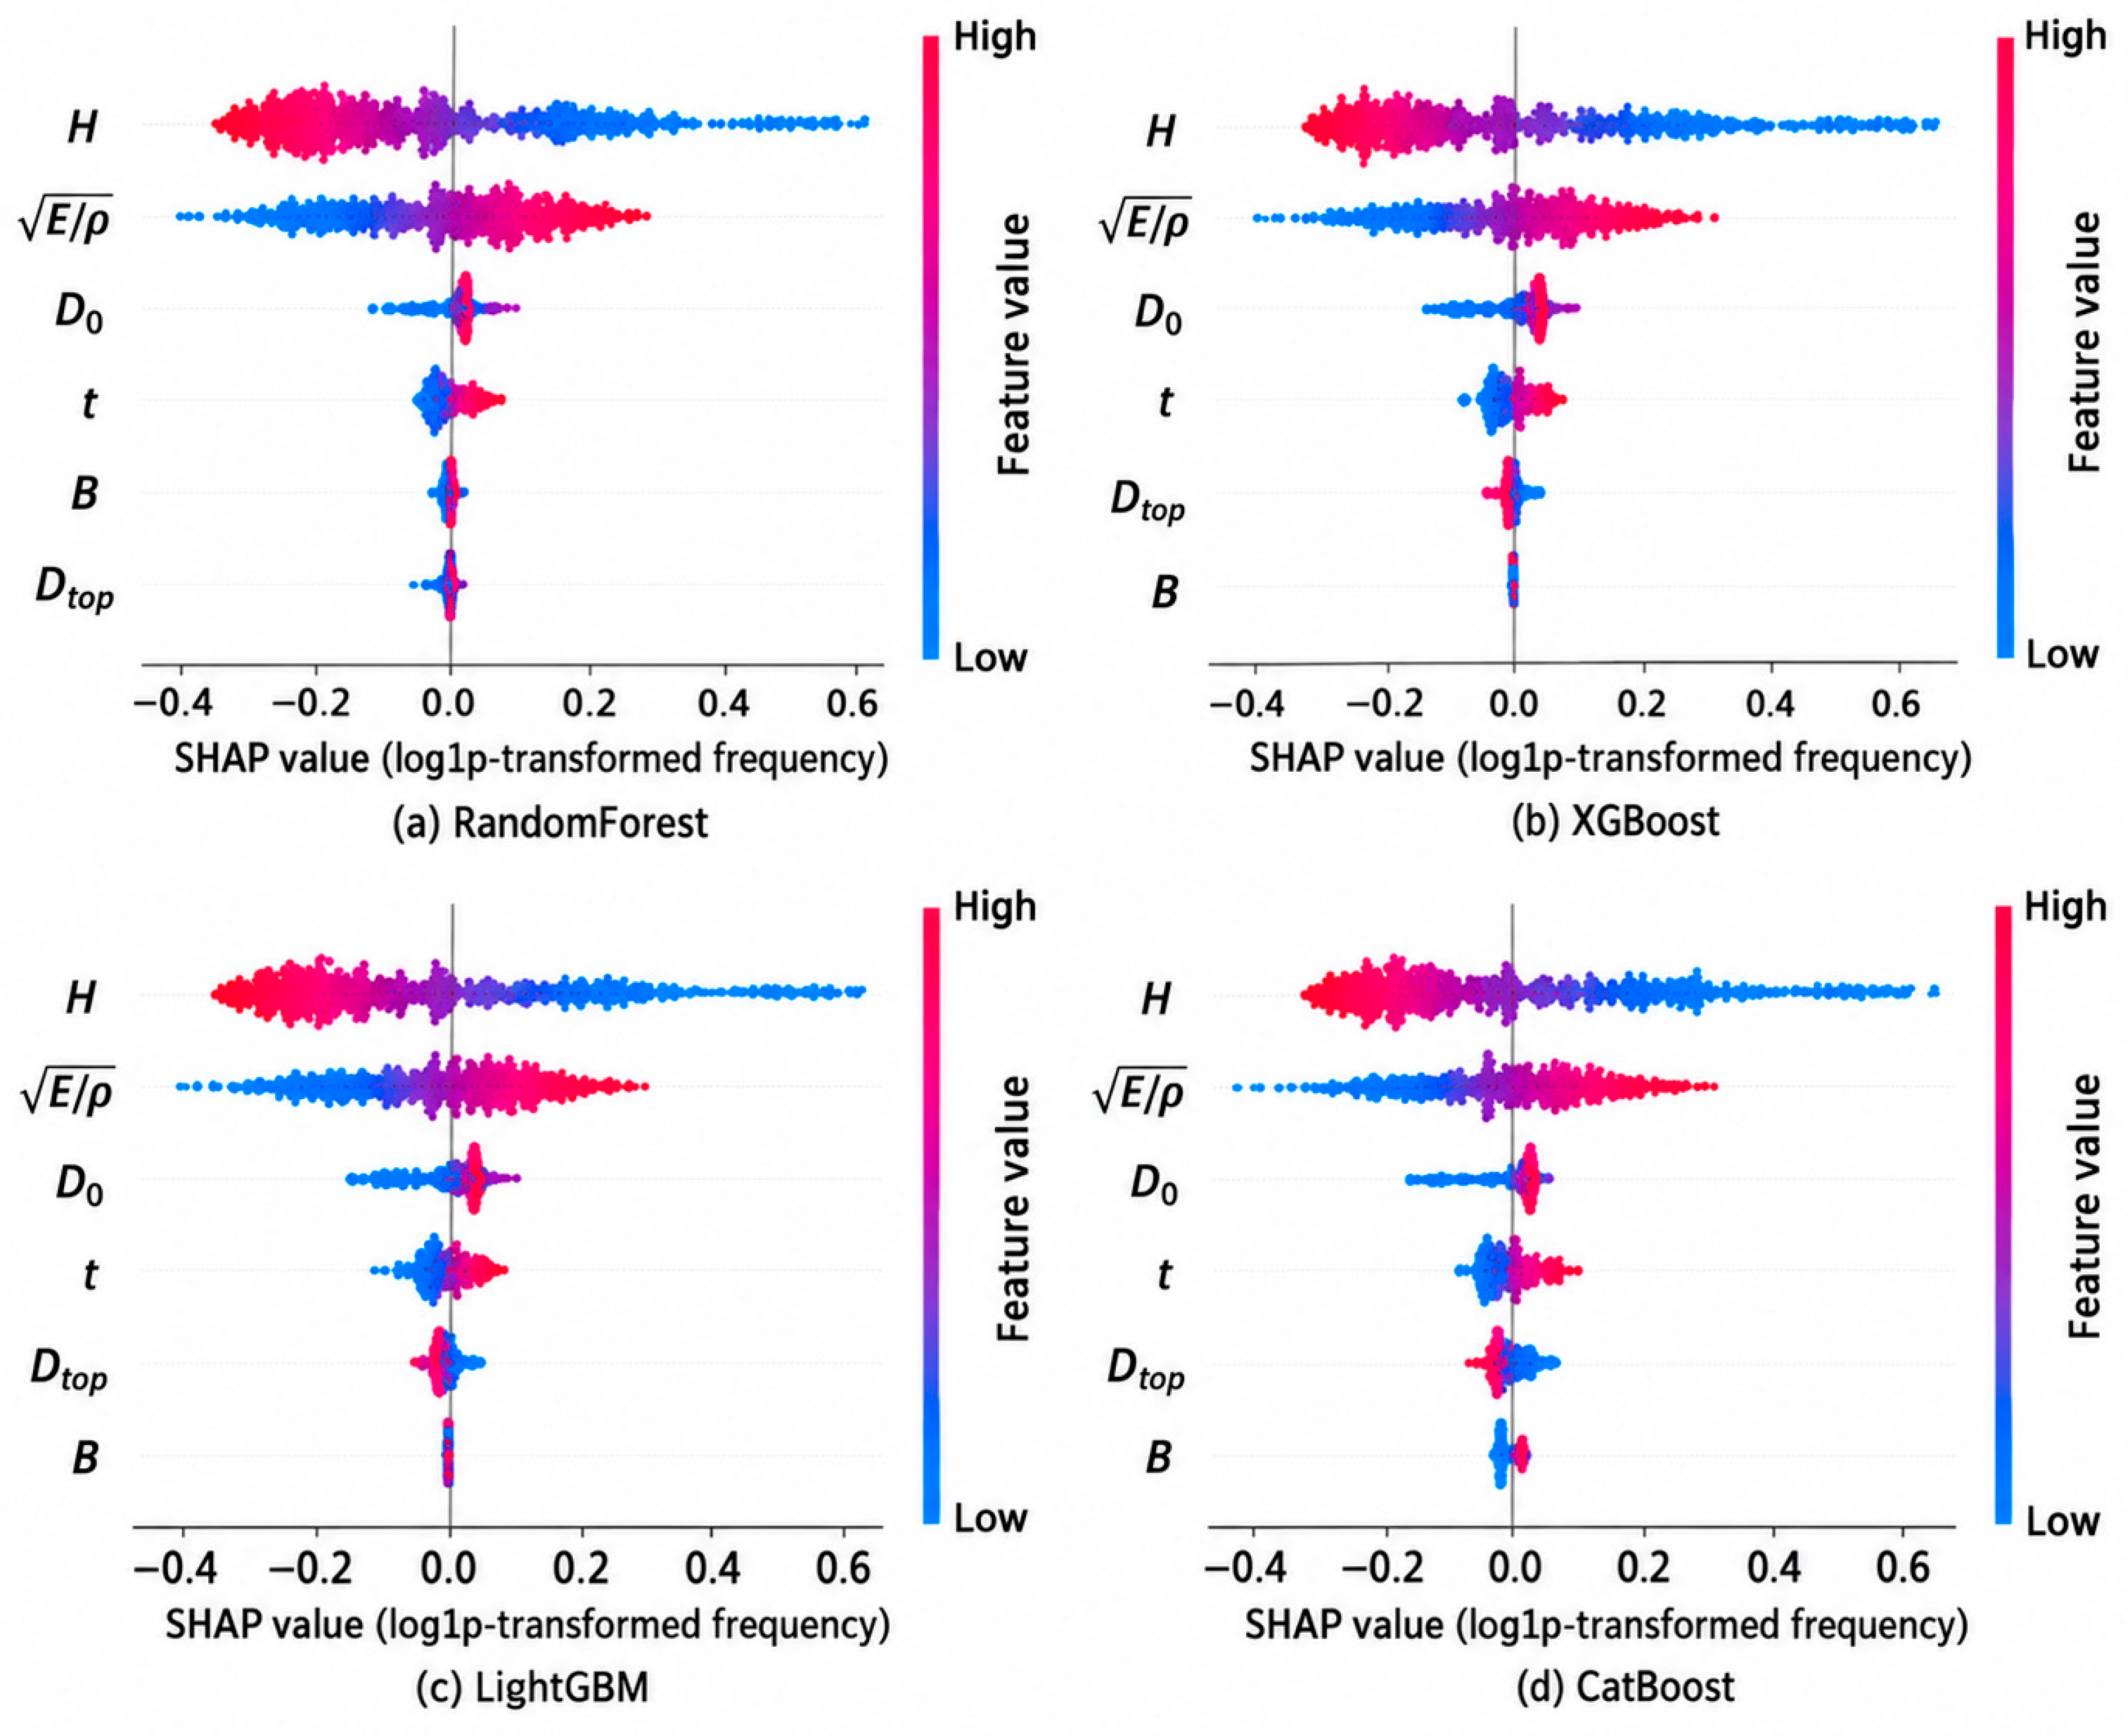
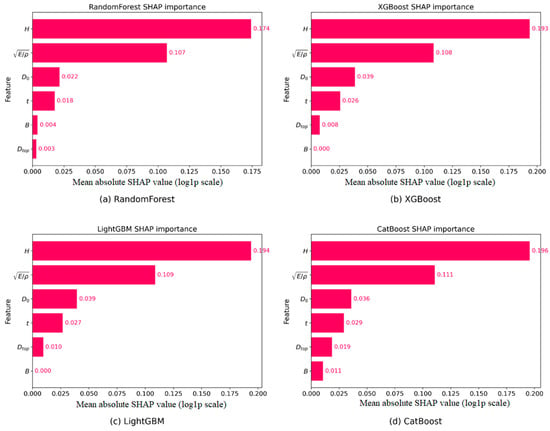
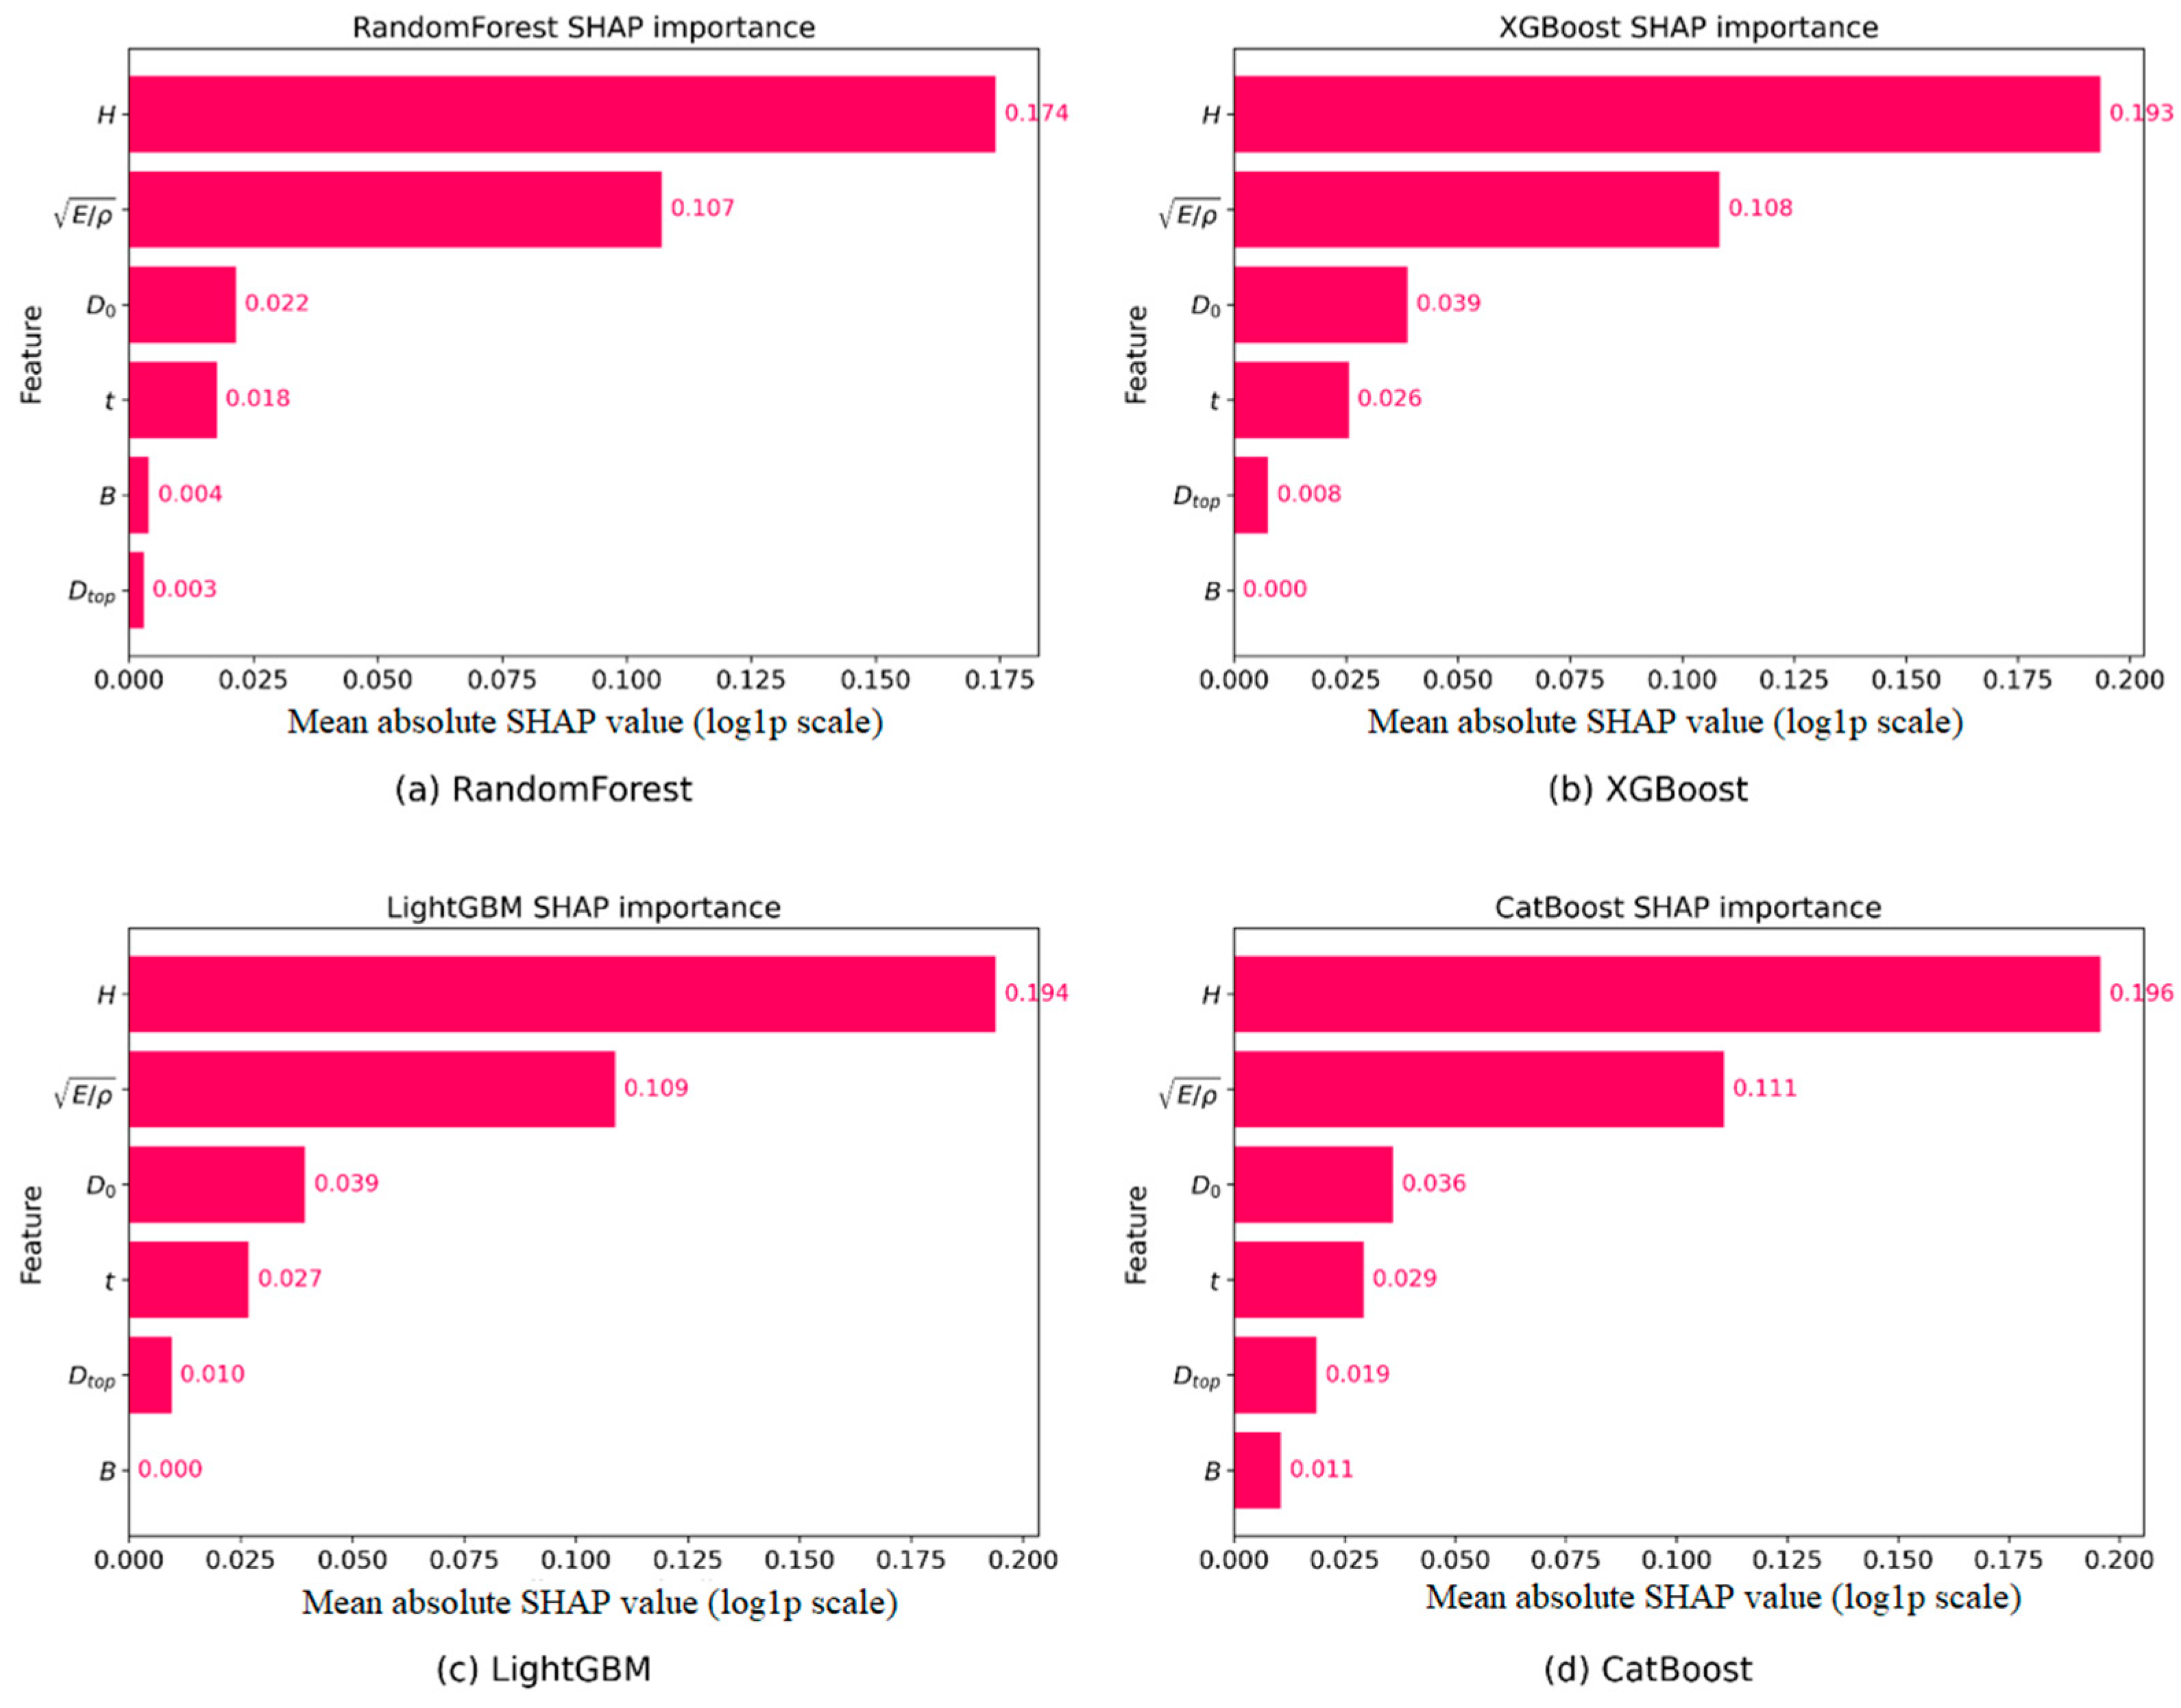
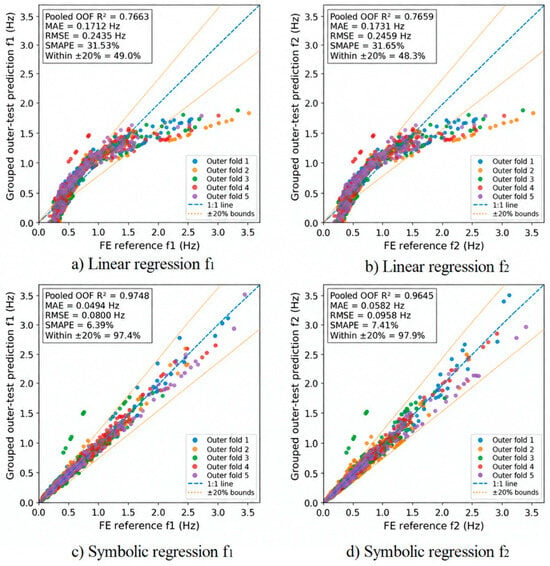
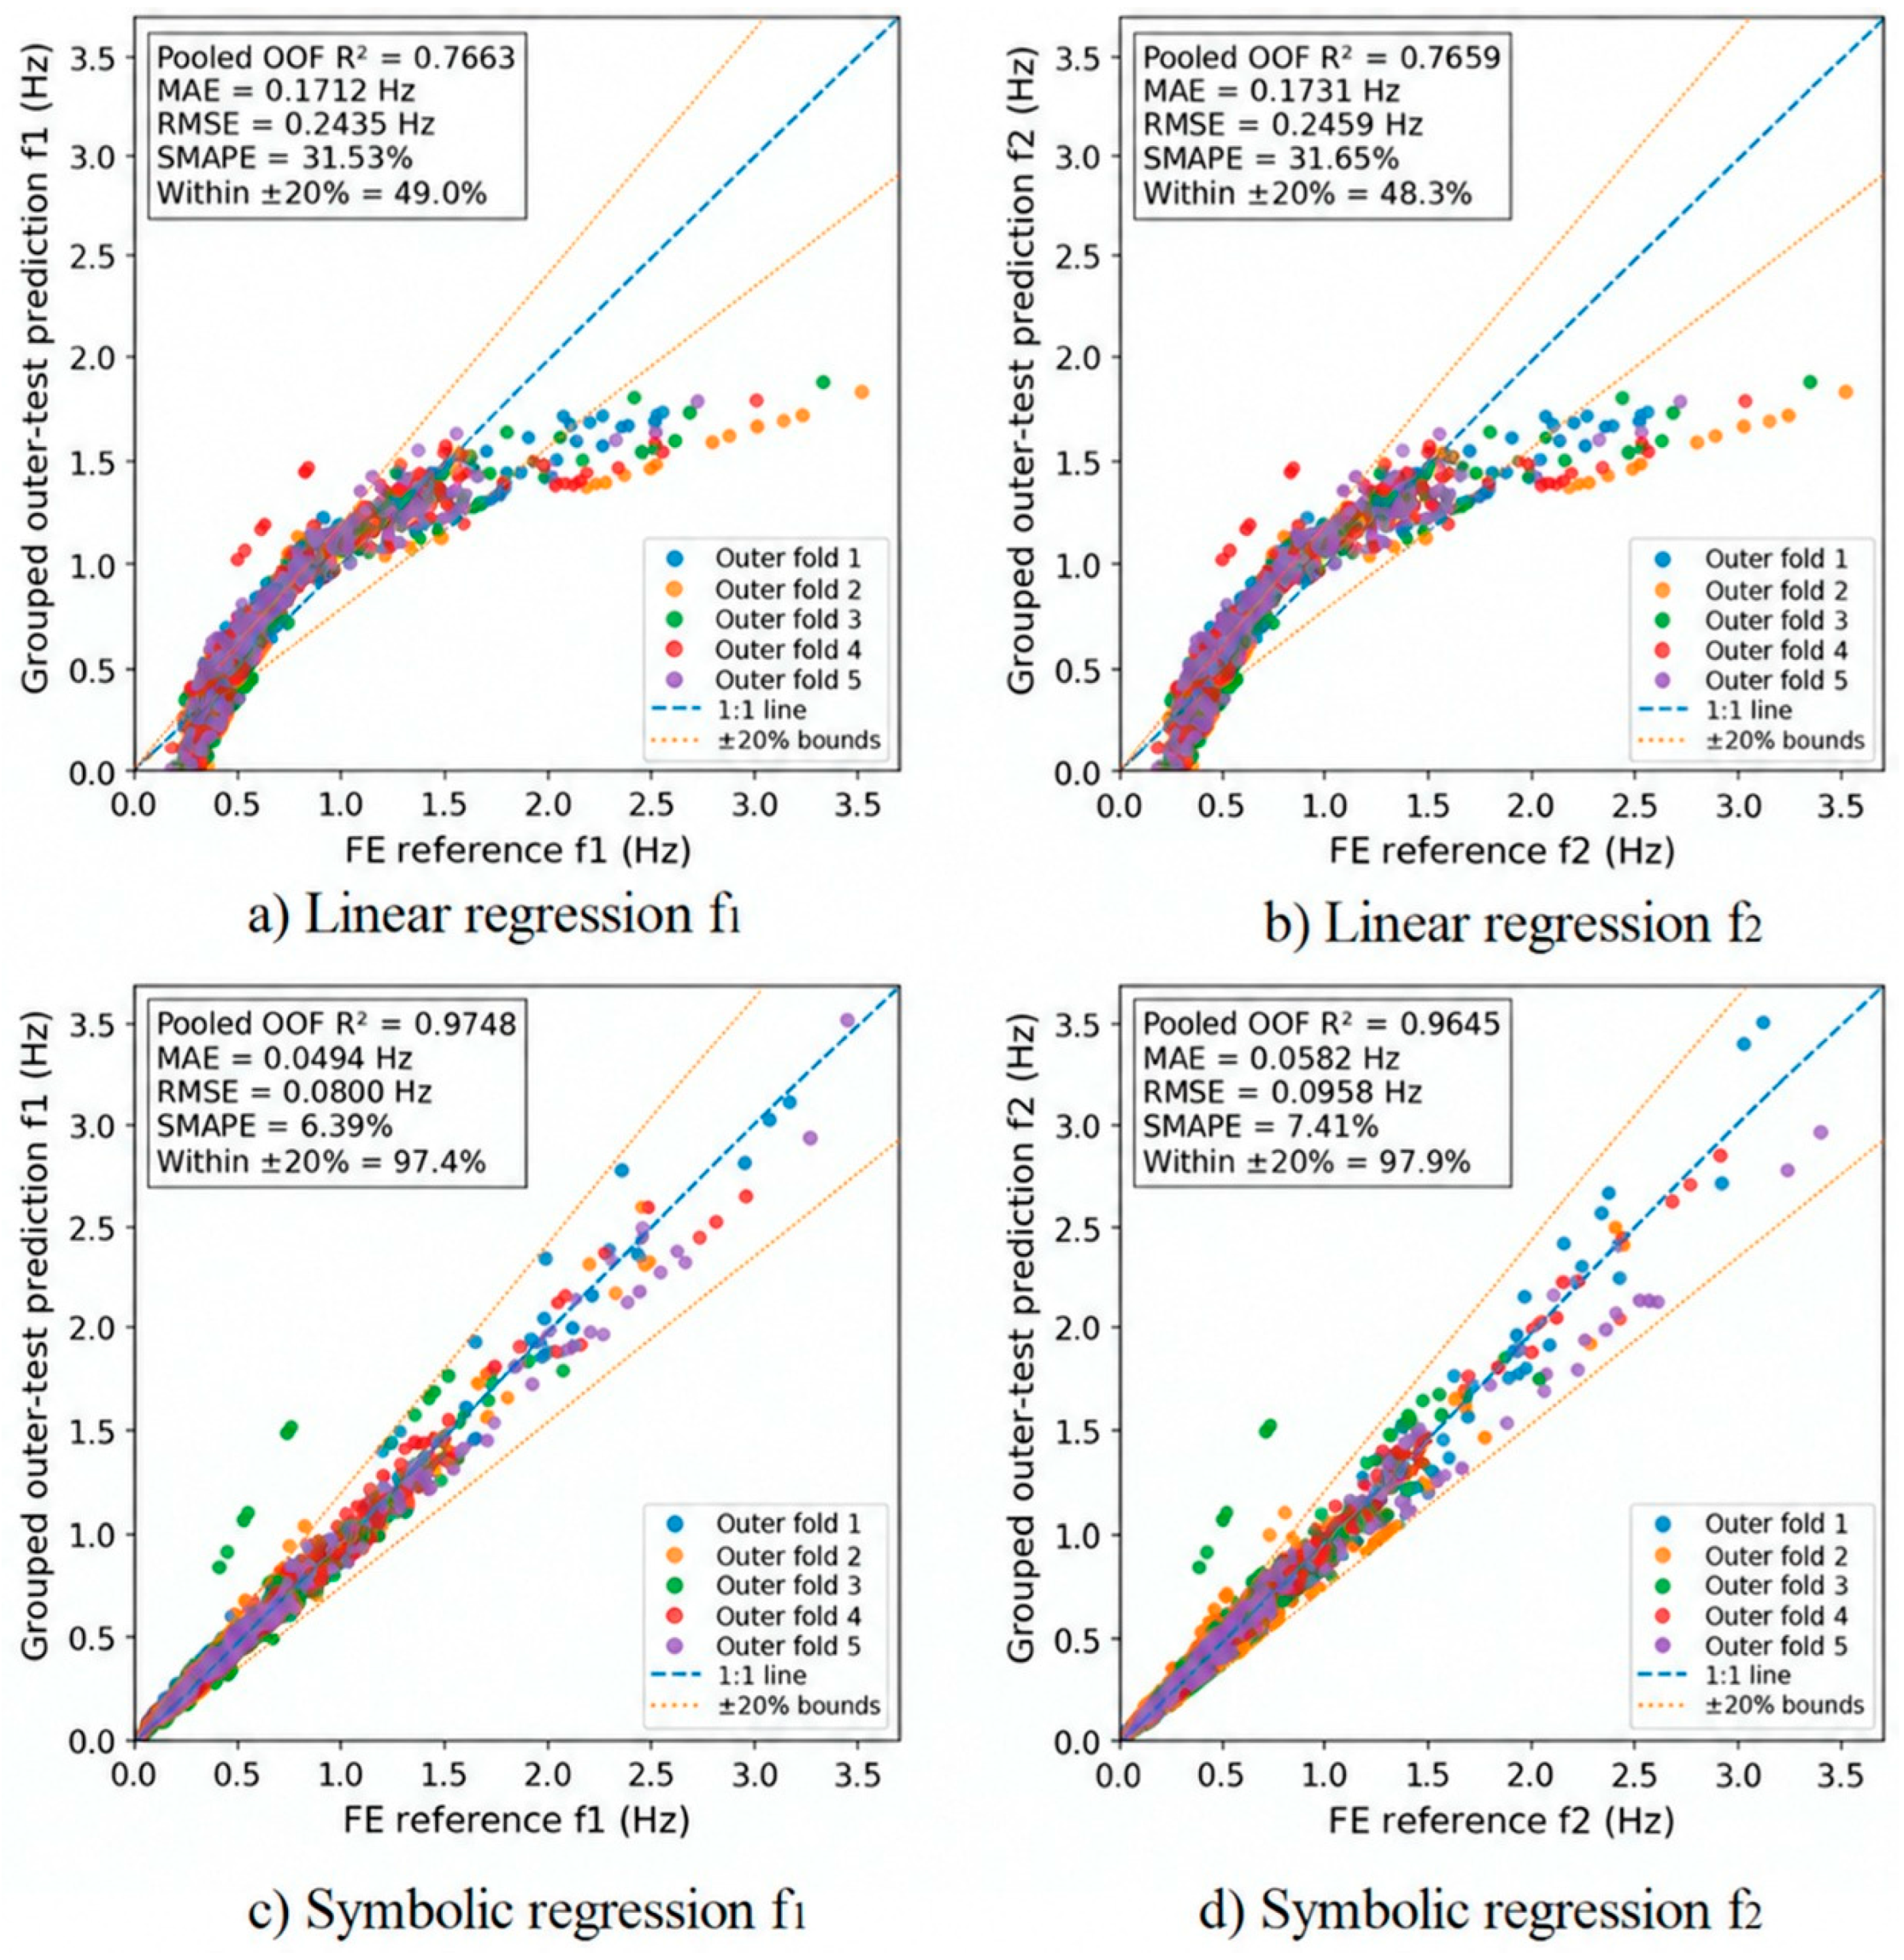
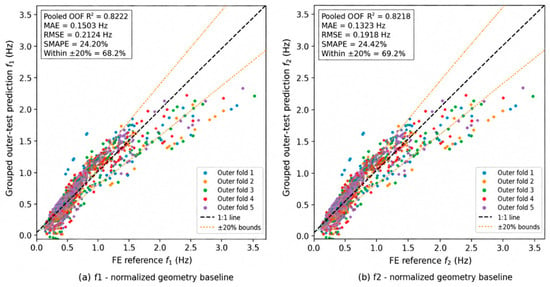
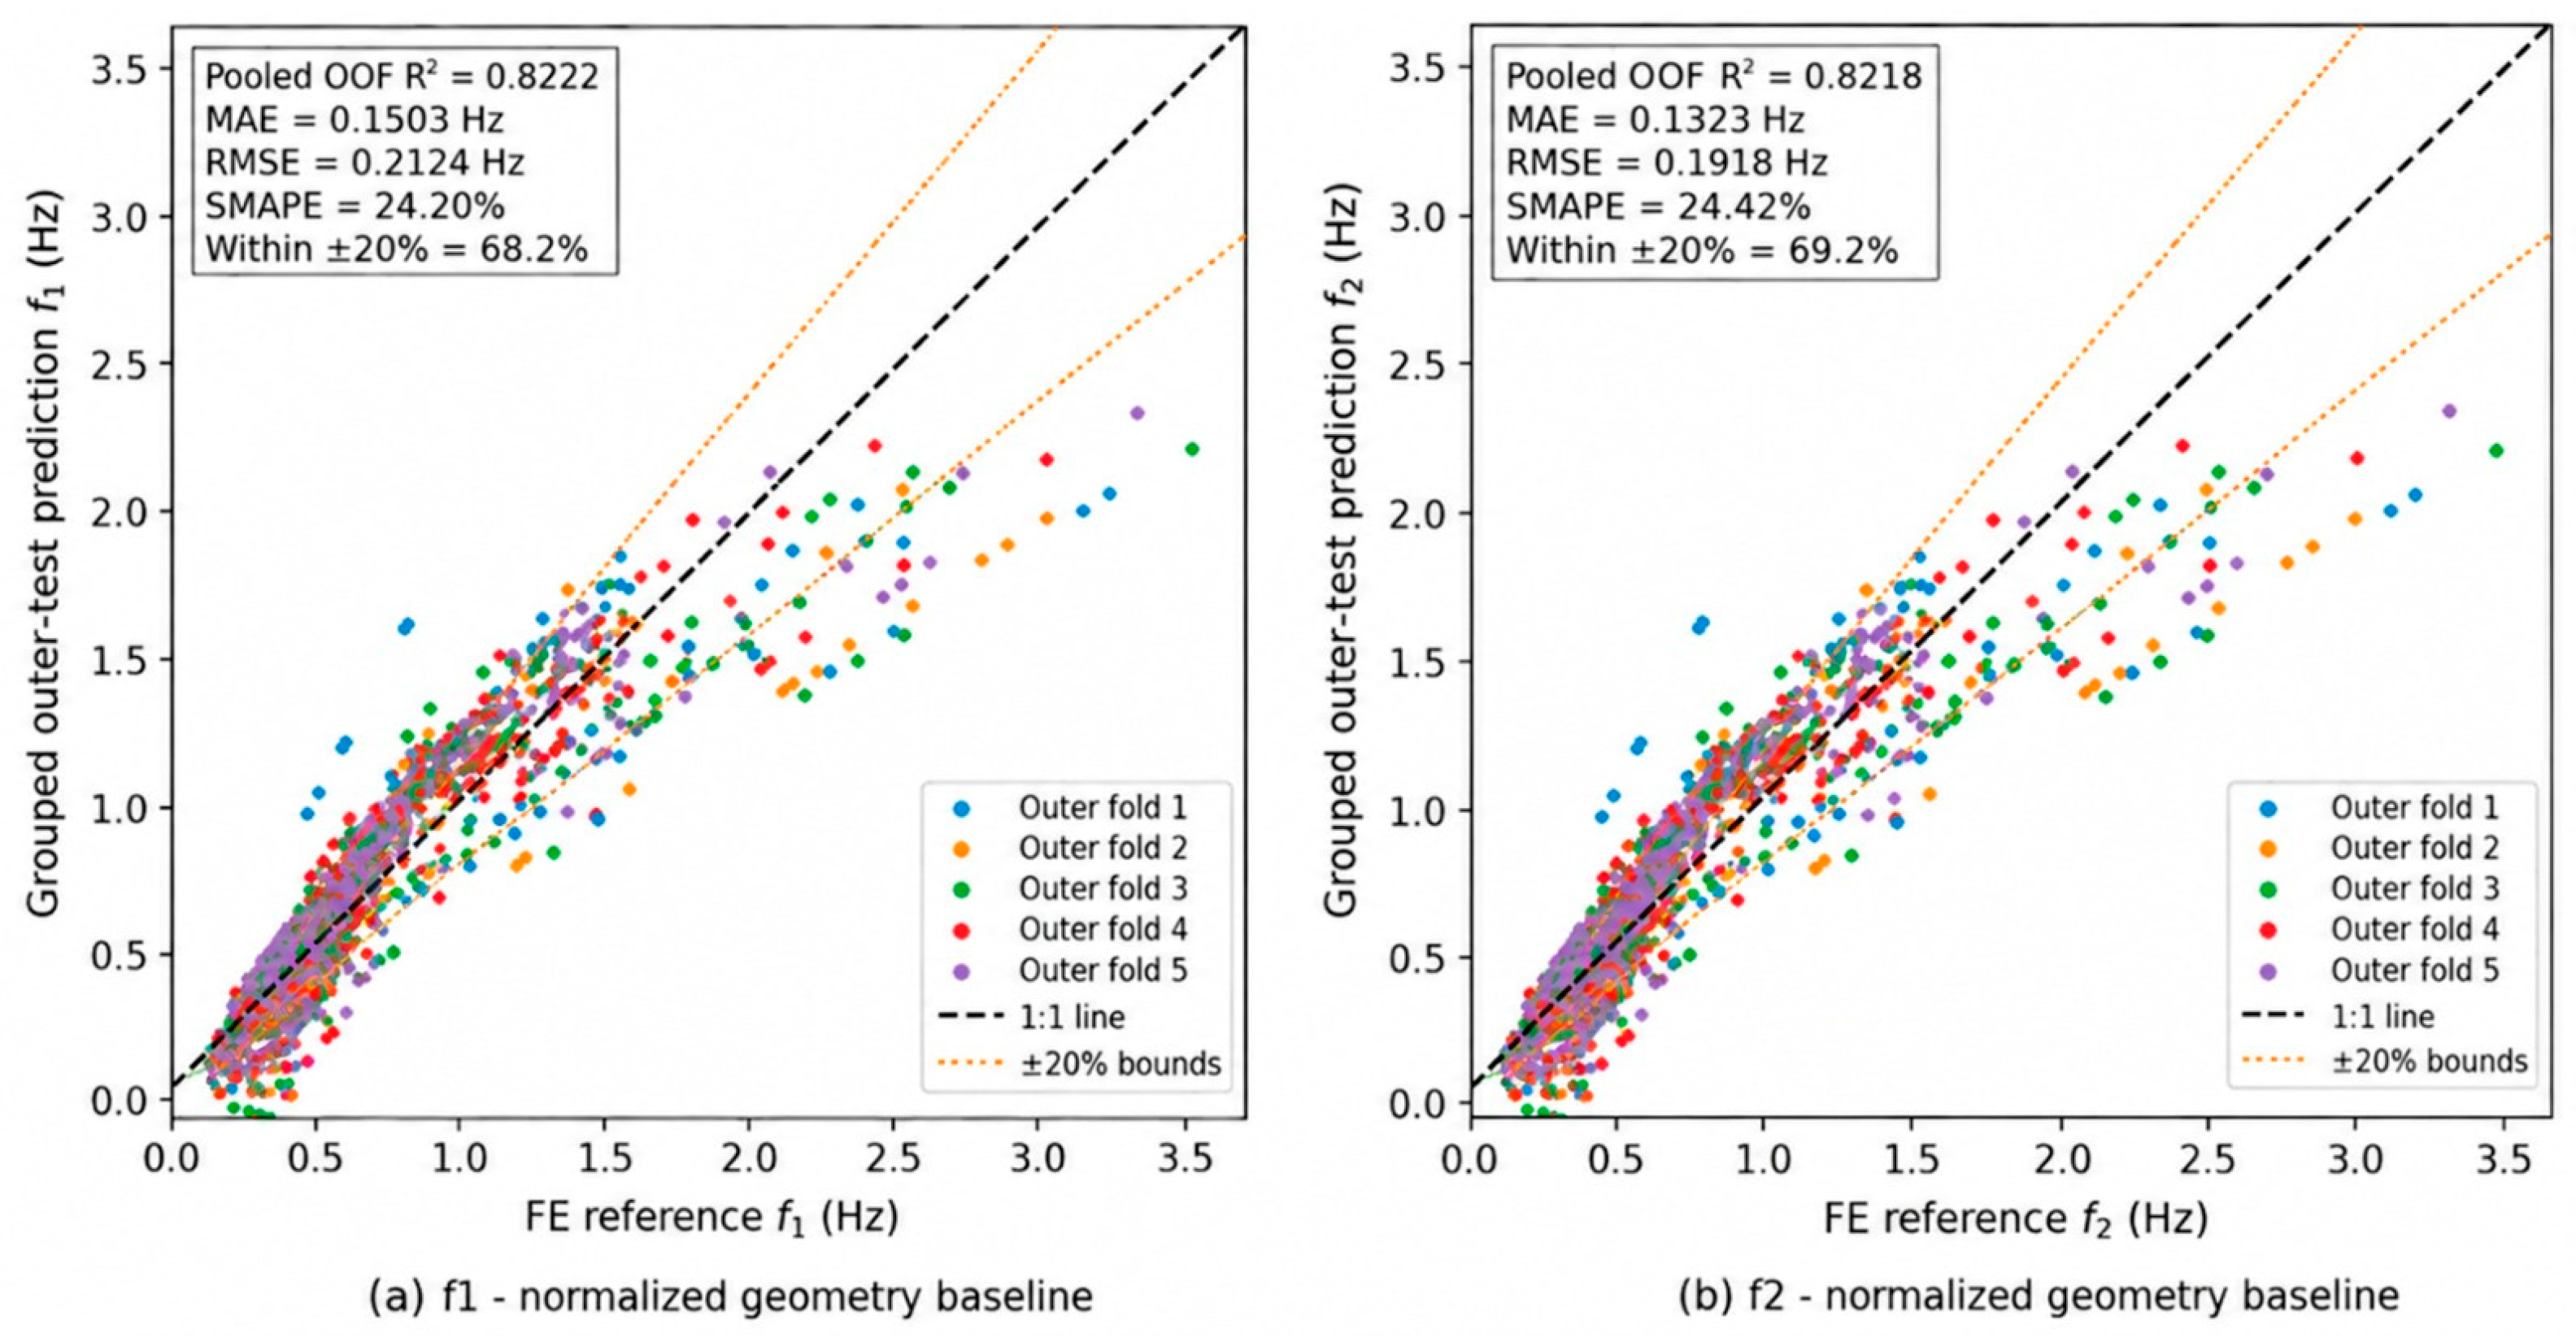

Disclaimer/Publisher’s Note: The statements, opinions and data contained in all publications are solely those of the individual author(s) and contributor(s) and not of MDPI and/or the editor(s). MDPI and/or the editor(s) disclaim responsibility for any injury to people or property resulting from any ideas, methods, instructions or products referred to in the content. |
© 2026 by the authors. Licensee MDPI, Basel, Switzerland. This article is an open access article distributed under the terms and conditions of the Creative Commons Attribution (CC BY) license.