


Abstract
This study asks how early-stage residential building form and envelope decisions affect the trade-off between annual operational energy and A1–A3 embodied impact in a hot-arid Saudi context. The motivation is the need for workflows that evaluate building geometry, window-to-wall ratio (WWR), orientation, and envelope assemblies together, rather than treating operational simulation and embodied-impact assessment as separate post-design procedures. A BIM-integrated parametric framework was developed by linking Rhino–Grasshopper massing, Honeybee–EnergyPlus operational energy simulation, Rhino.Inside.Revit quantity generation, Tally life-cycle assessment, Excel-based post-processing, and Wallacei NSGA-II optimization. The case study generated 5000 residential design alternatives for Riyadh, Saudi Arabia. After applying area and WWR filters to retain architecturally comparable alternatives, 45 solutions remained; Pareto analysis identified eight non-dominated entries that collapsed into two unique representative configurations. The lower-operational configuration reduced annual operational energy from 81,729 to 76,406 kWh/yr, corresponding to 6.5%, while increasing A1–A3 embodied impact from 299,966 to 303,751 kg CO2eq, corresponding to 1.3%. Regression analysis across all 5000 solutions showed that total floor area explained 92.6% of operational energy variation and 98.6% of embodied-impact variation. The findings demonstrate that the proposed framework supports transparent early-stage trade-off interpretation, while the results remain case-specific to the selected variables, assumptions, and LCA database.
1. Introduction
The building sector is one of the largest contributors to global carbon emissions and energy consumption, making it a critical focus in climate change mitigation efforts. According to the 2019 Global Status Report for Buildings and Construction, buildings and construction accounted for 36% of global final energy use and 39% of energy- and process-related CO2 emissions in 2018, of which 11% resulted from manufacturing building materials and products such as steel, cement, and glass [1,2]. These impacts stem from two main components: operational energy, consumed during the building’s use phase, and embodied energy, representing the primary energy required for material production and construction processes [3,4,5]. Together, they constitute the total life-cycle energy demand of a building. A central challenge in the building industry is the simultaneous reduction in operational energy demand and embodied energy, as improvements in one dimension may lead to trade-offs in the other [6,7,8]. Achieving genuinely sustainable solutions therefore requires addressing both dimensions concurrently [9]. To this end, various strategies such as increasing the use of renewable and low-carbon materials, or adopting environmentally responsible design systems have been proposed to reduce the sector’s overall footprint [10]. Another promising approach involves the selective integration of high-efficiency materials, applied only where they provide the greatest performance benefit without imposing unnecessary embodied costs. This strategy enables a balanced reduction in operational and embodied energy, minimizing total life-cycle impacts. Recent studies emphasize that co-optimizing material choice and envelope design can produce more favorable trade-offs between operational and embodied carbon, particularly when local climate and energy grid factors are considered [11].
The urgency of this issue is amplified by the global acceleration of climate change, which has prompted significant international action across multiple sectors, especially construction, given its disproportionate energy consumption. The building industry alone accounts for roughly one-third of total global energy use and remains a major source of CO2 emissions [12,13]. Addressing these challenges directly supports the United Nations’ Sustainable Development Goal 7, which aims to ensure universal access to affordable, reliable, and clean energy by 2030 while increasing the share of renewable energy in the global mix [14]. The building sector represents a major area for energy-efficiency improvement and carbon-mitigation efforts because it accounts for a substantial share of global energy demand and CO2 emissions. Recent global assessments report that buildings and construction remain a key driver of energy use and emissions, reinforcing the need for integrated design strategies that address both operational and embodied impacts [2,15].
Over the past decade, electricity consumption in Saudi Arabia has increased sharply due to rapid urbanization, industrial expansion, and the growing demand for housing. This trend is closely linked to the Saudi Vision 2030 initiative, which seeks to raise homeownership to 70% by 2030, enabling every Saudi family to own a home [16]. The accelerated pace of construction associated with this goal has greatly intensified national energy use, especially during the long, hot summers when air conditioning operates almost continuously to maintain indoor comfort. In Saudi Arabia, residential electricity demand remains substantial under hot-arid climatic conditions. Recent official household energy statistics report that electricity consumption in the residential sector reached 161,207 GWh in 2024. This current demand context reinforces the importance of early-stage residential design strategies that reduce operational energy while also considering material-related embodied impacts [17,18]. A major contributor to this high demand is the limited adoption of energy-efficient architectural practices. Previous research, citing reports from the Saudi Energy Efficiency Center, indicates that more than 70% of existing Saudi residential buildings do not have thermal insulation, contributing to high cooling-energy consumption [19].
Although Saudi Arabia has been expanding renewable energy targets, fossil fuels remain central to electricity generation. Recent energy data indicate that Saudi Arabia generated approximately 453 TWh of electricity in 2023, with 62% from natural gas, 38% from oil, and less than 1% from renewables [18,20]. This high internal consumption places pressure on the country’s export capacity and poses potential risks to economic stability, given that oil exports remain a primary revenue source [21]. These conditions highlight the urgent need for effective energy management strategies and the adoption of high-efficiency building technologies to curb rising energy use while ensuring environmental and economic sustainability.
Accordingly, this study develops and tests an integrated parametric multi-objective optimization framework for the simultaneous evaluation of building form, envelope configuration, operational energy, and A1–A3 embodied impact within the hot-arid context of Saudi Arabia. In such climates, the building envelope acts as the primary mediator between external environmental exposure and indoor performance, making it a critical locus for operational and upstream embodied-impact trade-off analysis. The proposed framework couples parametric massing variation with variable wall and window assemblies, allowing geometry and material selection to be explored simultaneously rather than sequentially. By linking operational simulation with A1–A3 embodied-impact assessment, this study investigates how early-stage design decisions shape the balance between operational and embodied performance. The contribution of this study is not limited to the direct integration of existing software tools. Rather, it lies in structuring a BIM-integrated workflow in which parametric massing, façade-generation logic, BIM-based quantity takeoff, assembly-level A1–A3 embodied-impact data, and operational energy simulation are synchronized within a single early-stage optimization process. The methodological advancement is the formulation of an early-stage optimization process in which geometric massing, façade openness, orientation, and envelope assembly selection are treated as coupled design variables, while operational energy outputs and BIM-derived A1–A3 embodied-impact quantities are evaluated for the same design population. This provides an analytical capability that is different from workflows in which embodied impact is calculated only after energy-oriented optimization or where material selection is examined independently from massing. The scientific insight generated by this formulation is not only the identification of non-dominated solutions, but also the interpretation of how architectural configuration and envelope composition structure operational and upstream embodied-impact trade-offs within a constrained hot-arid residential design space.
2. Literature Review
Building life-cycle impacts include operational energy during the use phase and embodied impacts associated with material extraction, manufacturing, construction, maintenance, replacement, and end-of-life processes such as deconstruction, transport, waste processing, recycling, and disposal. In this study, the embodied-impact assessment is intentionally limited to the A1–A3 product stage, which includes raw material supply, transport, and manufacturing. Therefore, the results should be interpreted as upstream embodied-impact estimates rather than complete cradle-to-grave life-cycle impacts. Previous studies have emphasized that although operational energy has historically dominated building life-cycle impacts, the relative importance of embodied impact increases as operational efficiency improves, low-energy building standards expand, and electricity grids decarbonize. Consequently, a comprehensive evaluation of both operational and embodied energy is essential to achieving meaningful reductions in life-cycle impacts [8,22,23,24].
Building geometry is a major parameter affecting energy performance, particularly in hot climates, because it influences solar exposure, envelope area, heat transfer, and cooling demand [25,26]. The form of a building determines its surface-to-volume (S/V) ratio, which in turn influences heat gain, solar exposure, and ventilation potential. Studies have shown that compact forms generally reduce cooling loads by minimizing exposed surface area, while irregular shapes often increase energy demand [27]. Similarly, orientation and aspect ratio strongly affect the amount and distribution of solar radiation, especially in regions with intense solar exposure such as the Arabian Peninsula. Research conducted in arid climates demonstrates that optimized geometric proportions can significantly lower cooling energy requirements by enhancing self-shading and reducing solar penetration [28,29]. The window-to-wall ratio (WWR) is a powerful design lever: excessive glazing allows large solar gains and thermal loads, while under-glazing limits daylighting. Studies optimizing WWR report that best performance is often found in moderate ranges, for example, 20–30% depending on orientation to strike a balance between daylighting gains and thermal penalties [30,31]. In a hot, semi-arid climate case study, an office building’s heating and cooling loads were minimized at moderate WWR values depending on orientation and glazing type [32]. Collectively, these findings underscore that geometry is a primary determinant of building energy use and must be optimized at the earliest design stage, and WWR emerges as a critical lever to fine-tune the trade-off between envelope transparency and thermal control.
In parallel, the choice of construction materials has a major impact on embodied energy and carbon emissions. Comparative life-cycle assessments have revealed significant differences in embodied impacts among material systems such as timber, concrete, and steel, illustrating the need for early design decisions that consider material-related energy costs [33]. Envelope design elements such as wall assemblies, glazing ratios, and shading devices influence both embodied and operational performance. For example, increasing insulation thickness or adopting high-performance glazing can reduce operational energy but may simultaneously elevate embodied impacts. These interactions emphasize the importance of a co-evaluation approach, in which materials and geometry are analyzed together to ensure that improvements in one aspect do not undermine gains in another [34].
Recent research has begun addressing this complexity through co-optimization frameworks that simultaneously evaluate embodied and operational energy. Related studies have shown that the optimal envelope configuration is highly location-dependent, as the balance between embodied and operational energy varies with climate and the carbon intensity of the local energy grid. Over-investing in high-embodied materials may yield diminishing returns in low-carbon contexts, whereas under-investing in material performance can result in excessive operational emissions [11]. Further evidence from hot-arid regions supports this climatic sensitivity: a study demonstrated that optimized envelope codes and material strategies can substantially reduce electricity consumption and CO2 emissions in Bahrain’s hot climate, highlighting the critical role of façade configuration and insulation levels [35]. Another study emphasized that in Saudi Arabia’s residential sector, building envelope design and material selection exert major influence on overall energy performance, underscoring the necessity of integrating embodied and operational considerations in early design stages [36]. These studies affirm that regional calibration is essential when optimizing building envelopes and materials to achieve context-specific sustainability outcomes.
The adoption of multi-objective optimization (MOO) in building performance simulation has become increasingly common as designers seek to balance multiple criteria such as operational energy, embodied energy, cost, and comfort. Among the various optimization techniques, evolutionary algorithms, particularly the Non-Dominated Sorting Genetic Algorithm II (NSGA-II), have proven highly effective for exploring complex, non-linear design spaces. NSGA-II-based workflows have been integrated into parametric modeling environments to generate and evaluate thousands of design alternatives automatically. For example, such methods have been applied to optimize building retrofit strategies by balancing energy efficiency and investment cost, demonstrating the capability of NSGA-II to identify Pareto-optimal solutions across diverse climate zones [37,38]. Parametric optimization frameworks developed in hot-arid regions, including Saudi Arabia, have also assessed trade-offs between embodied and operational carbon across various wall and glazing systems, reinforcing the importance of local climatic calibration [39]. More recently, multi-objective optimization approaches have been applied to envelope design considering both energy use and economic cost, as well as to building form optimization using genetic algorithms for enhanced energy performance [40,41].
Overall, NSGA-II-based multi-objective optimization provides a robust foundation for exploring life-cycle trade-offs in building design, aligning with the framework adopted in this research. In addition to physics-based simulation and evolutionary optimization, recent studies have increasingly explored data-driven and AI-based approaches for building energy performance assessment. These methods, including machine learning and surrogate modeling, can support rapid energy prediction and reduce computational time when trained on sufficiently large and representative datasets. However, their predictive reliability depends on data availability, input-variable coverage, training quality, and the similarity between the training data and the target design space. In contrast, the present study adopts a simulation-based approach because the objective is not only to predict energy use, but also to explicitly control and evaluate the effects of parametric geometry, building orientation, façade composition, and envelope assembly selection during early-stage design exploration. This physics-based workflow provides a transparent basis for linking design variables to operational energy and A1–A3 embodied-impact outputs, while future work may use the simulation results generated through this framework to train surrogate or AI-based models for faster design-space exploration.
Despite significant progress in simulation-based and multi-objective optimization research, a methodological gap remains in how early-stage building form, façade openness, envelope assembly selection, operational energy, and embodied impact are evaluated together. Previous studies can generally be grouped into three categories. The first group optimizes envelope parameters such as insulation, glazing, or WWR while keeping the overall building form largely fixed. The second group explores massing or geometric optimization for operational energy performance but treats embodied impact as a secondary or post-processing calculation. The third group applies BIM-based life-cycle assessment to quantify material impacts but does not necessarily connect this process to evolutionary optimization across a large parametric design population. Most existing studies therefore either prioritize operational energy, isolate material selection from form generation, or treat embodied impacts as fixed parameters or post hoc evaluations. The present study differs by coupling mutable residential massing, WWR, orientation, and wall/window assembly selection within one optimization population, while calculating both annual operational energy and BIM-derived A1–A3 embodied impact for each generated solution. The methodological novelty is therefore not the use of NSGA-II alone, but the coordinated formulation of design variables, simulation outputs, BIM-based quantity takeoff, and post-processed interpretation within a single early-stage framework. This study responds to that need by combining parametric massing variation, assembly-level embodied assessment, and post-processed multi-objective analysis in a unified workflow.
3. Methodology
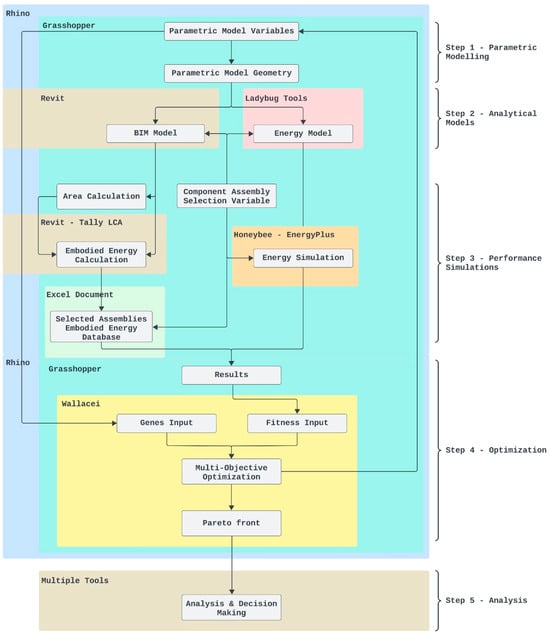
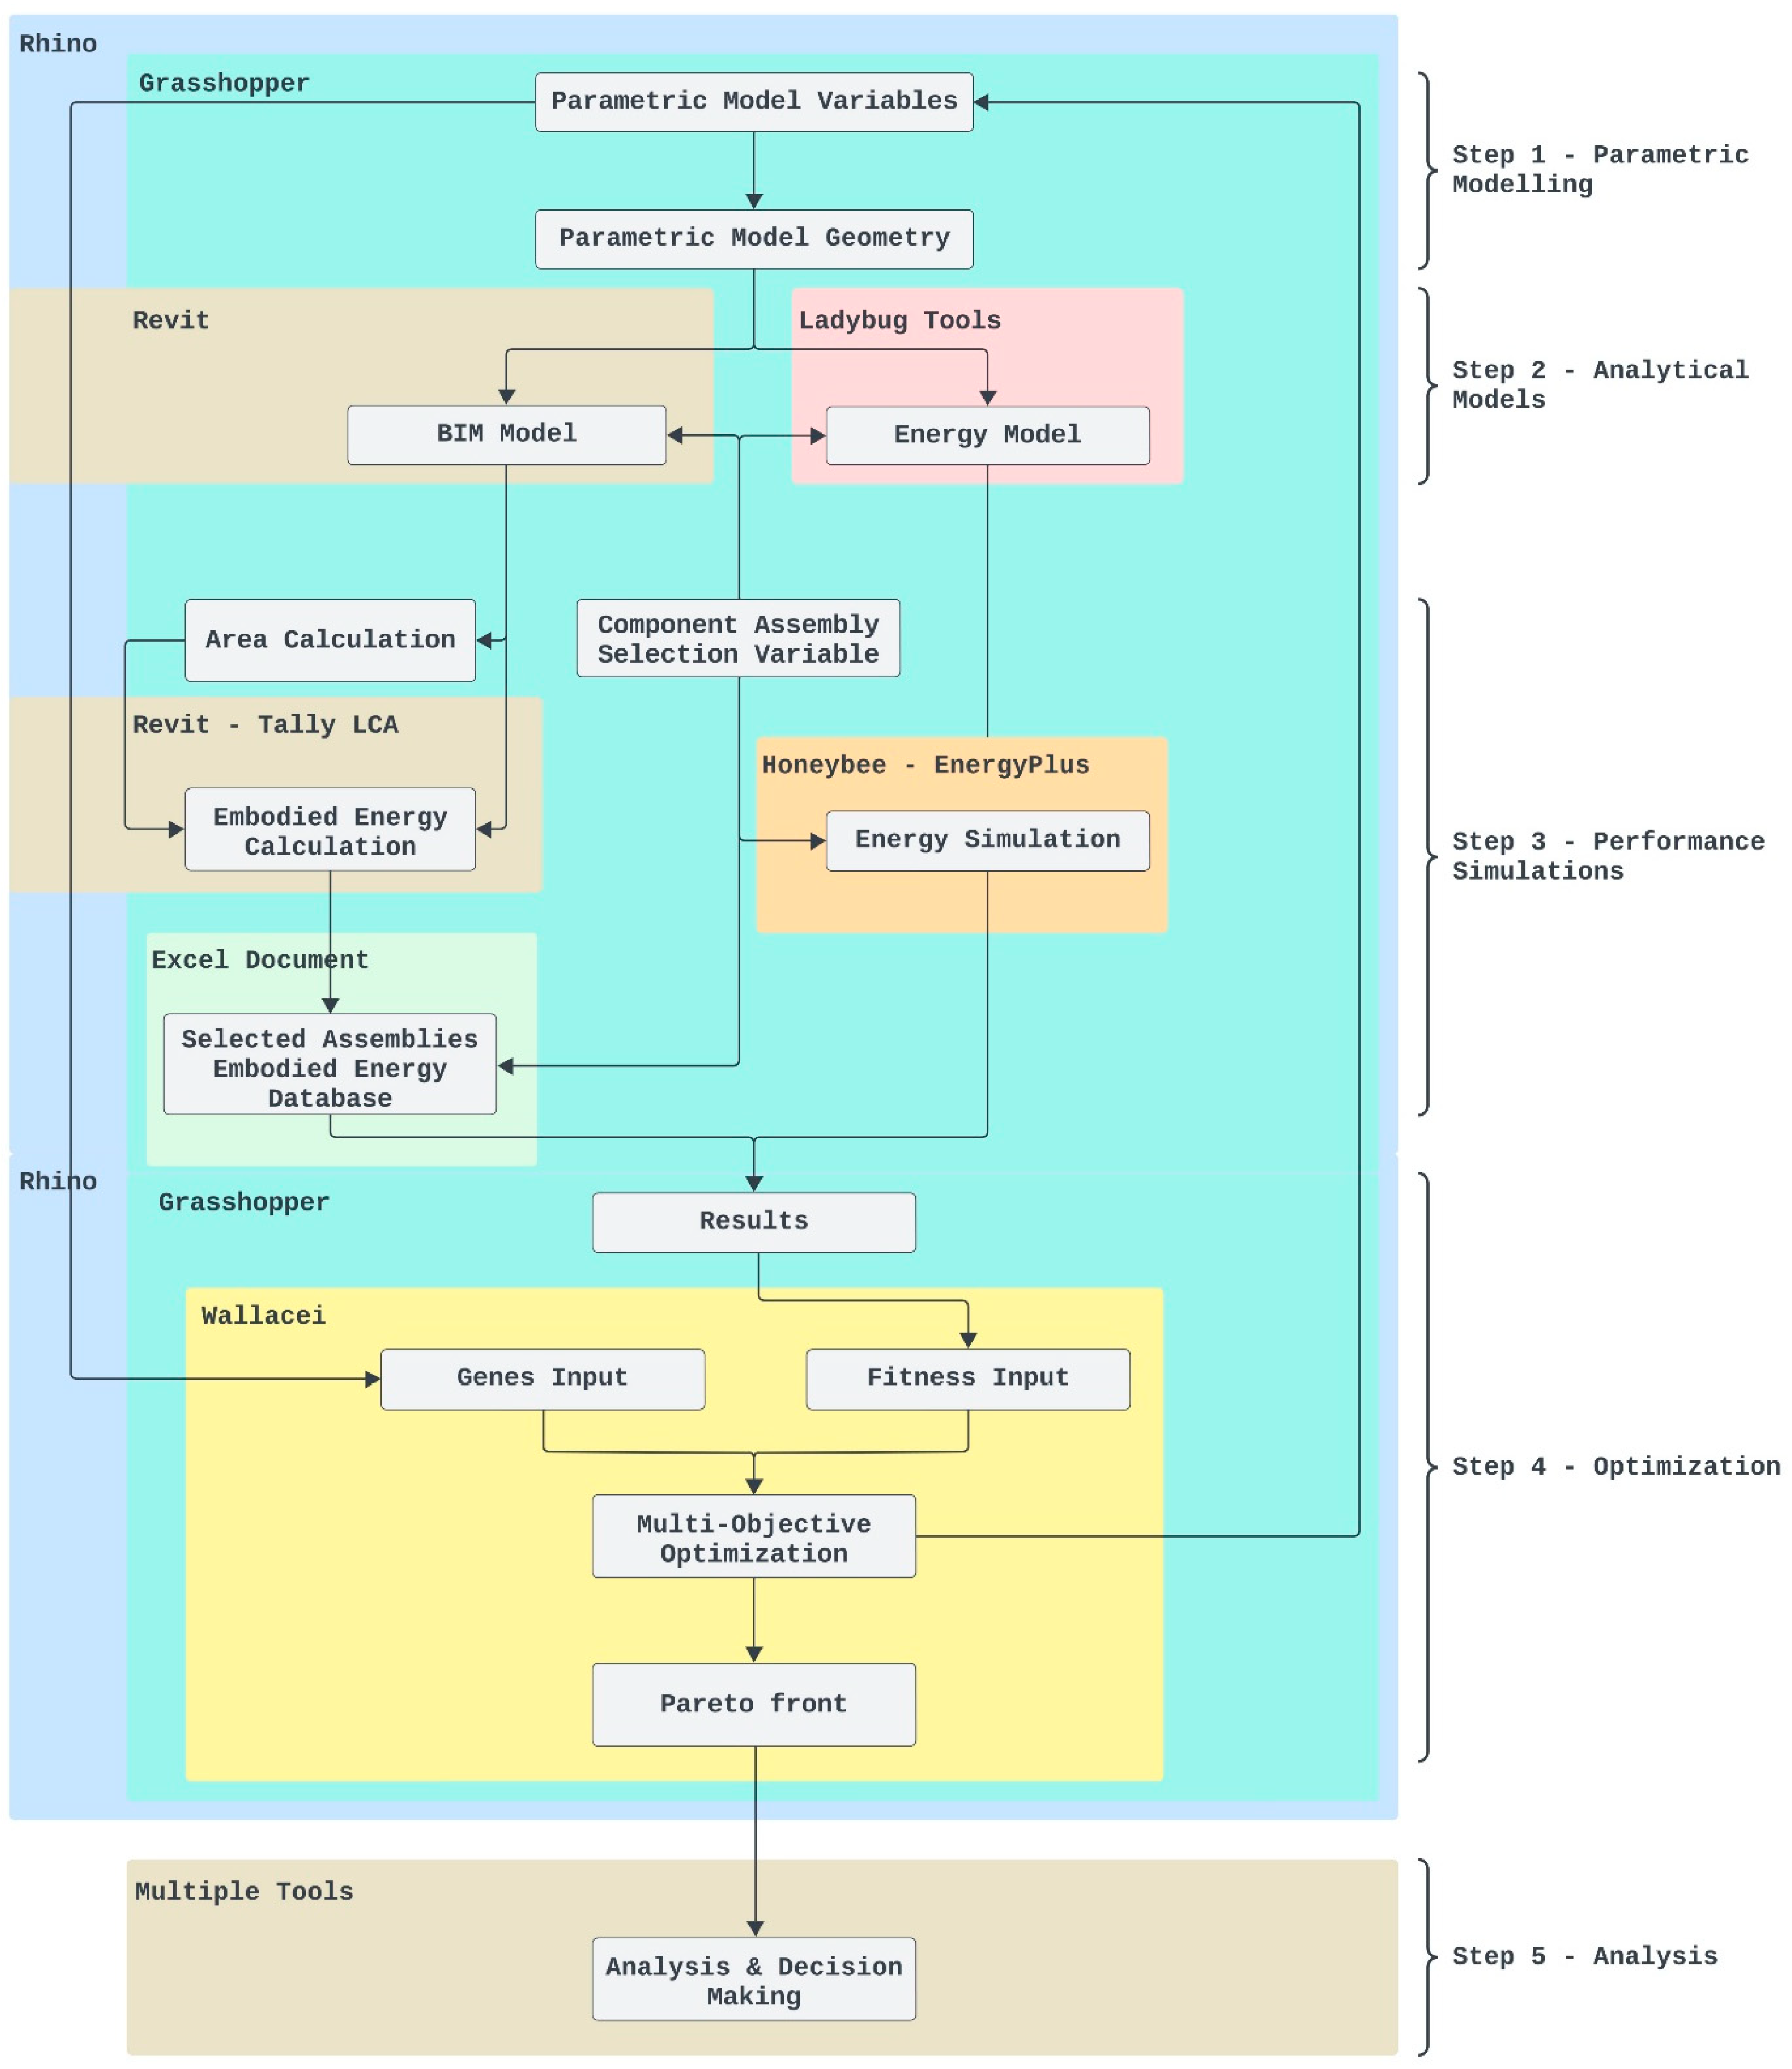
This study employs an integrated parametric multi-objective optimization framework to evaluate the trade-off between operational energy and embodied impact in residential building design under hot-arid climatic conditions. The framework combines parametric geometry generation, building energy simulation, embodied-impact assessment, and evolutionary optimization to support early-stage design exploration. As illustrated in Figure 1, the workflow connects geometric definition, performance evaluation, and multi-objective search within a single decision-making process.
Figure 1.
Integrated workflow of parametric modelling, analytical model generation, performance simulation, multi-objective optimization, and decision-making.
The workflow begins in Rhinoceros 3D and Grasshopper (Robert McNeel & Associates, Seattle, WA, USA), where the building form is generated parametrically and linked to two parallel analytical streams. The first stream evaluates operational performance through Honeybee (Ladybug Tools LLC, Fairfax, VA, USA), coupled with EnergyPlus (version 23.2; U.S. Department of Energy, Washington, DC, USA), while the second stream quantifies embodied impact through a BIM-based workflow using Rhino.Inside.Revit (Robert McNeel & Associates, Seattle, WA, USA), Autodesk Revit (Autodesk, Inc., San Francisco, CA, USA), Tally (Non-commercial Version 2023.09.13.01; KieranTimberlake, Philadelphia, PA, USA), and Microsoft Excel (Microsoft Corporation, Redmond, WA, USA). The results from both streams are returned to Grasshopper and processed by Wallacei, an evolutionary optimization engine based on NSGA-II, to identify non-dominated solutions and reveal the trade-off between operational and embodied objectives.
3.1. Parametric Model
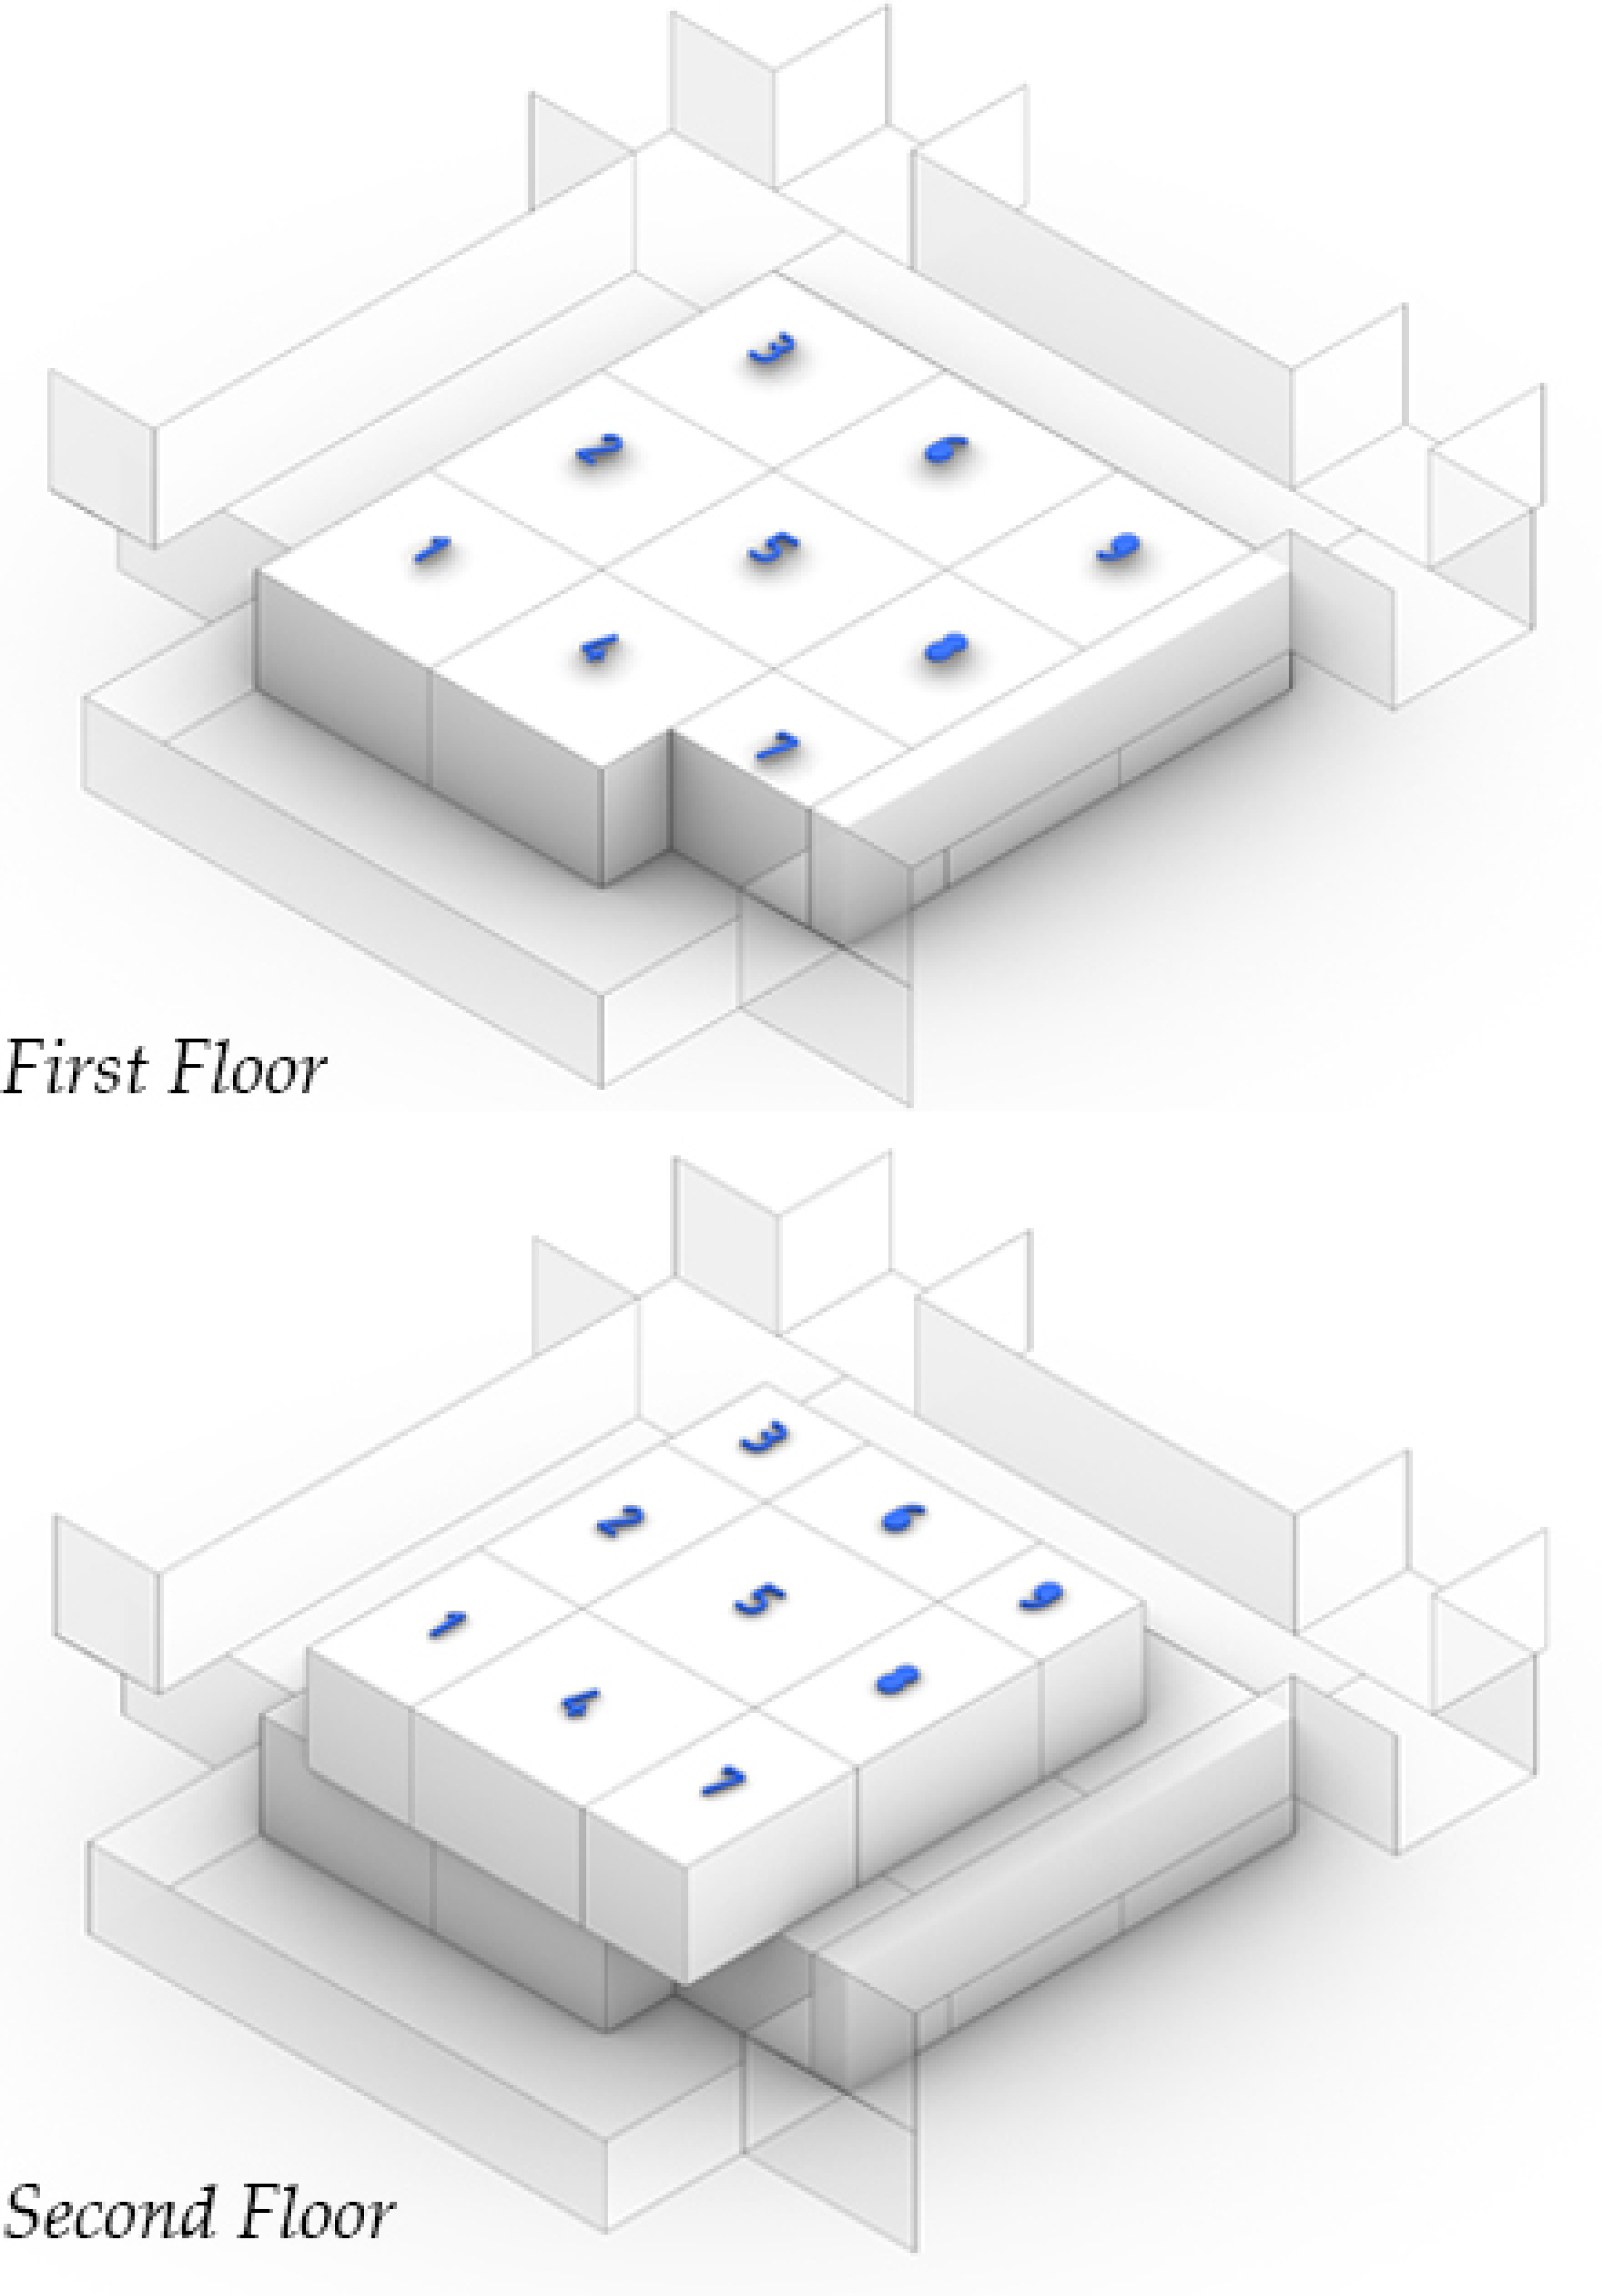
The parametric model is based on a nine-grid layout, where each cell measures 5 m × 5 m × 3 m, creating a modular massing system distributed across two floors. The ground floor consists of nine cells, and the first floor contains a corresponding set of nine cells, yielding a total potential building system of eighteen boxes. The model is applied to a 300 m2 plot (12 m × 25 m), representative of residential plots commonly used in Saudi housing developments [42]. To satisfy upper-level setback regulations, the first-floor cells are reduced by 2 m on all neighboring sides, resulting in a more compact upper-floor footprint.
The model was developed to satisfy three key requirements of the Saudi Building Code [43]. First, the built-up area of the ground floor must not exceed 70% of the plot area. This is achieved by allowing the removal of one or more ground-floor cells during optimization, which simultaneously creates exterior voids that function as courtyards or open spaces. Second, the setback configuration reflects Saudi residential practice: the ground floor is built to the neighboring property lines, while the street-facing façade maintains a front setback equal to one-fifth of the assumed street width. With a 15 m street width, this corresponds to a 3 m front setback. Third, the model enforces a minimum fenestration ratio of 8% of room floor area, with window size recalculated dynamically as geometry changes.
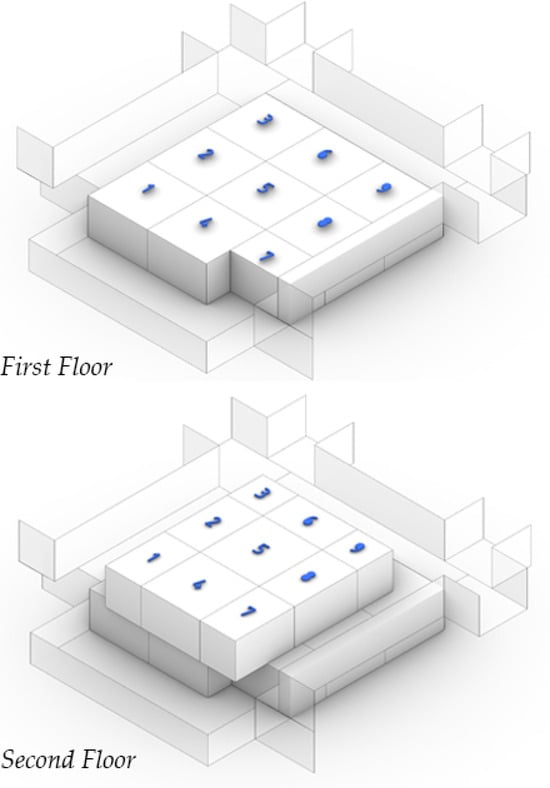
A key feature of the parametric system is the movement logic of the modular cells [44]. Figure 2 illustrates the numbered nine-cell arrangement on both floors, showing the modular system used to control cell activation and translation during optimization. The central grid cell (grid 5) acts as the reference point for all surrounding cells. No cell translates vertically; instead, the Z-axis serves as a binary activation parameter, where a value of 3 m activates the box, and a value of 0 removes it. The middle cells (2, 4, 6, and 8) move along a single axis, either X or Y depending on their position, while the corner cells (1, 3, 7, and 9) may move along both the X and Y axes. The first floor follows the same movement logic as the ground floor, ensuring geometric consistency across levels while preserving flexibility during optimization.
Figure 2.
Parametric massing model showing the modular box arrangement across the first and second floors within the code-compliant residential plot.
Window generation is also embedded directly into the parametric model. Once the massing is generated, the model separates the geometry into horizontal and vertical surfaces, and then categorizes the vertical façades by north, south, east, and west orientation. Window openings are created by scaling down the original wall surfaces, with scaling factors controlled by numerical sliders ranging from 5% to 95% of the parent façade dimensions. The lower bound prevents geometric collapse in the energy model, while the upper bound prevents windows from overlapping with wall edges in violation of EnergyPlus requirements. The geometric scaling factor was not treated as identical to WWR. If a window is generated by scaling the parent façade width and height by horizontal and vertical scale factors, the resulting window area is calculated as follows:
where Awindow,i is the window area on façade i, Awall,i is the parent wall area, sx,i is the horizontal scaling factor, and sz,i is the vertical scaling factor. When the same scale factor is applied in both directions, the resulting area ratio is therefore s2 rather than s. The WWRtotal used in the optimization was calculated after window generation as follows:
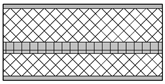
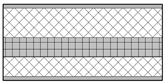
where the summations include all exterior façade surfaces included in the window-generation process. This distinction clarifies that geometric scaling controls window generation, while WWR is a calculated output derived from the resulting window and wall areas. This system makes WWR an active optimization variable rather than a fixed design assumption. The selected variables and their ranges were defined to represent early-stage architectural design decisions while maintaining computational validity across the optimization process. Cell activation and translation control the massing arrangement and building form, while orientation and WWR control solar exposure and façade openness. The 5–95% window-scaling range was used as a broad computational boundary rather than as a recommendation that all generated WWR values are equally appropriate for residential design. Similarly, the wall and window assemblies were selected as a limited but practical set of envelope alternatives representing common or applicable Saudi residential construction approaches, including insulated masonry, EIFS, insulated CMU, single glazing, and double glazing. This variable structure allowed the optimization to explore both geometric and material effects while avoiding an unrealistically broad or unconstructable design space.
Awindow,i = sx,i × sz,i × Awall,i
WWRtotal = ΣAwindow,i / ΣAwall,i
3.2. Analytical Model Generation
Two complementary analytical models are developed in parallel from the same parametric geometry: one for operational energy evaluation and one for embodied-impact evaluation. Because both models are derived directly from the evolving Grasshopper geometry, any change in form, glazing configuration, or material assignment is reflected consistently across both simulation domains.
3.2.1. Energy Model
The energy model is generated within Grasshopper using the Honeybee and Ladybug plugins, which convert the parametric building geometry into thermally zoned analytical spaces. The model uses custom-defined envelope assemblies rather than default material settings, ensuring that the same material logic governs both operational and embodied calculations. Window and shading configurations generated in the parametric model are incorporated directly into the analytical model to maintain consistency between geometry and energy simulation. To reduce computational cost, the building azimuth is adjusted internally within the simulation environment rather than by rotating the full geometry, allowing orientation to vary efficiently during optimization.
3.2.2. Life-Cycle Assessment Model
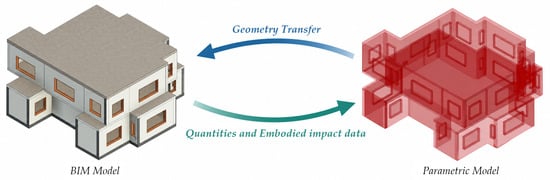
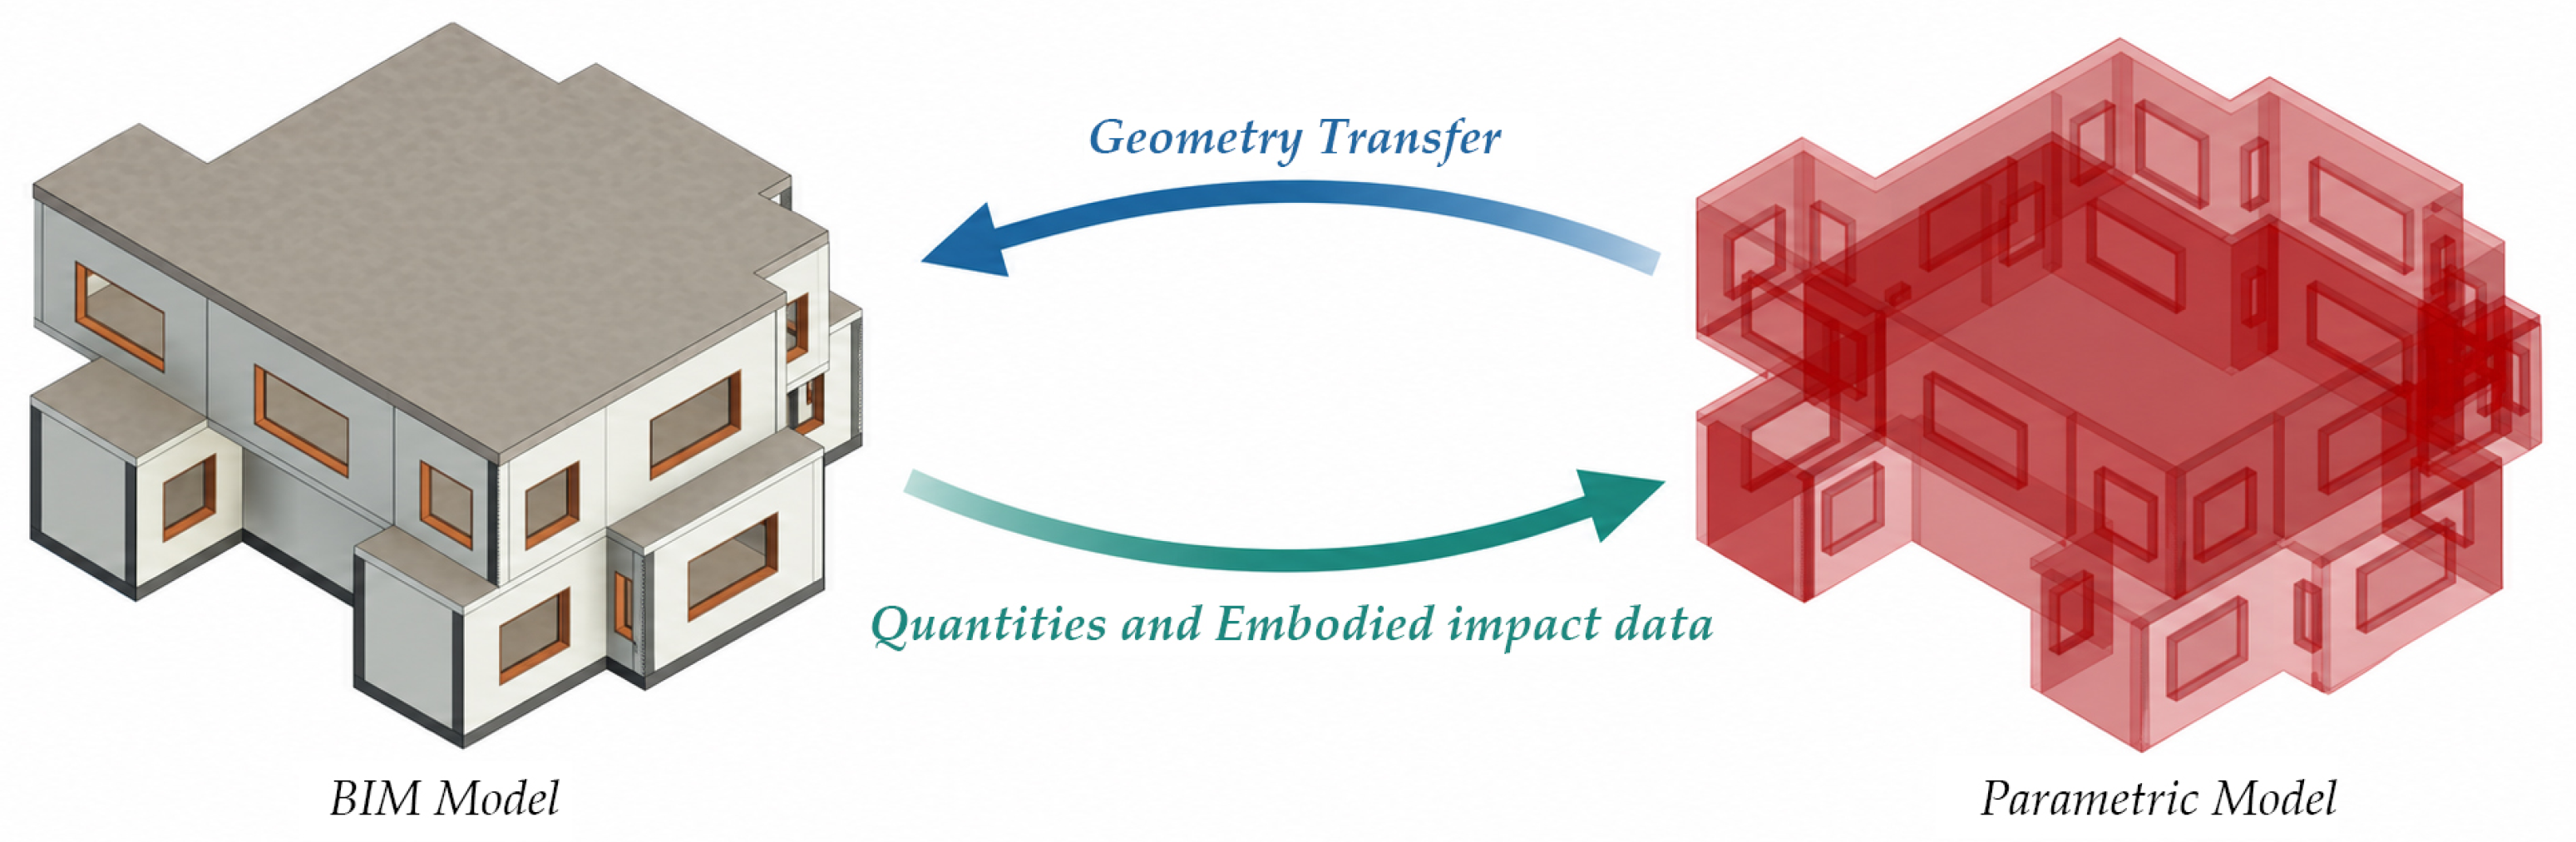
For embodied-impact evaluation, the same parametric geometry is transferred from Grasshopper to Revit in real time through Rhino.Inside.Revit (Figure 3), where it is converted into a BIM model for quantity takeoff and life-cycle assessment. Building elements are classified by type, and their geometric properties, including area and volume, are automatically quantified. The BIM model is then linked to Tally LCA, which calculates embodied impact for the defined construction assemblies. The resulting values are exported through Excel and reconnected to Grasshopper so that embodied performance can be evaluated simultaneously with operational performance during optimization.
Figure 3.
Analytical and data-exchange workflow linking Grasshopper, Honeybee–EnergyPlus, Rhino.Inside.Revit, Tally LCA, Excel, and Wallacei.
3.3. Performance Simulation
Operational energy performance was evaluated using the Honeybee–EnergyPlus simulation workflow. The annual operational objective included cooling, heating, and lighting energy demand, allowing the combined effect of architectural geometry, façade composition, glazing distribution, and envelope material configuration to be assessed within a single performance metric. To improve reproducibility, the main operational energy simulation assumptions are reported in Table 1. The simulations used the Riyadh-Khalid International Airport weather file and were run for a full annual period from 1 January to 31 December with six timesteps per hour. Most operational assumptions were kept at the default Honeybee/EnergyPlus program settings and were applied consistently across all design alternatives to ensure that performance differences resulted from changes in geometry, WWR, orientation, and envelope assemblies rather than from changing operational profiles. A daylight-responsive lighting control strategy was incorporated using a 300 lux illuminance threshold so that electric lighting demand was reduced when daylight availability exceeded the control threshold. The resulting annual cooling, heating, and lighting loads were then combined to define the total operational energy objective used in the optimization process.
Table 1.
Summary of the operational energy model assumptions, including weather file, simulation period, internal loads, ventilation, HVAC, thermostat, and daylight-control settings.
3.4. Embodied Impact Assessment
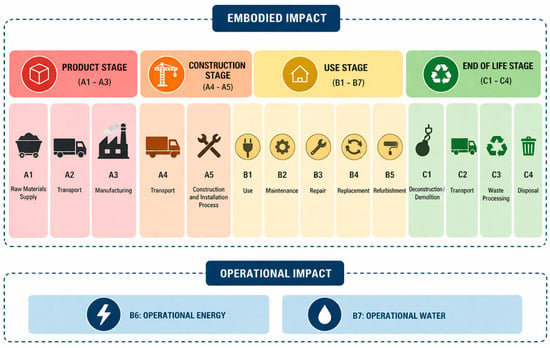
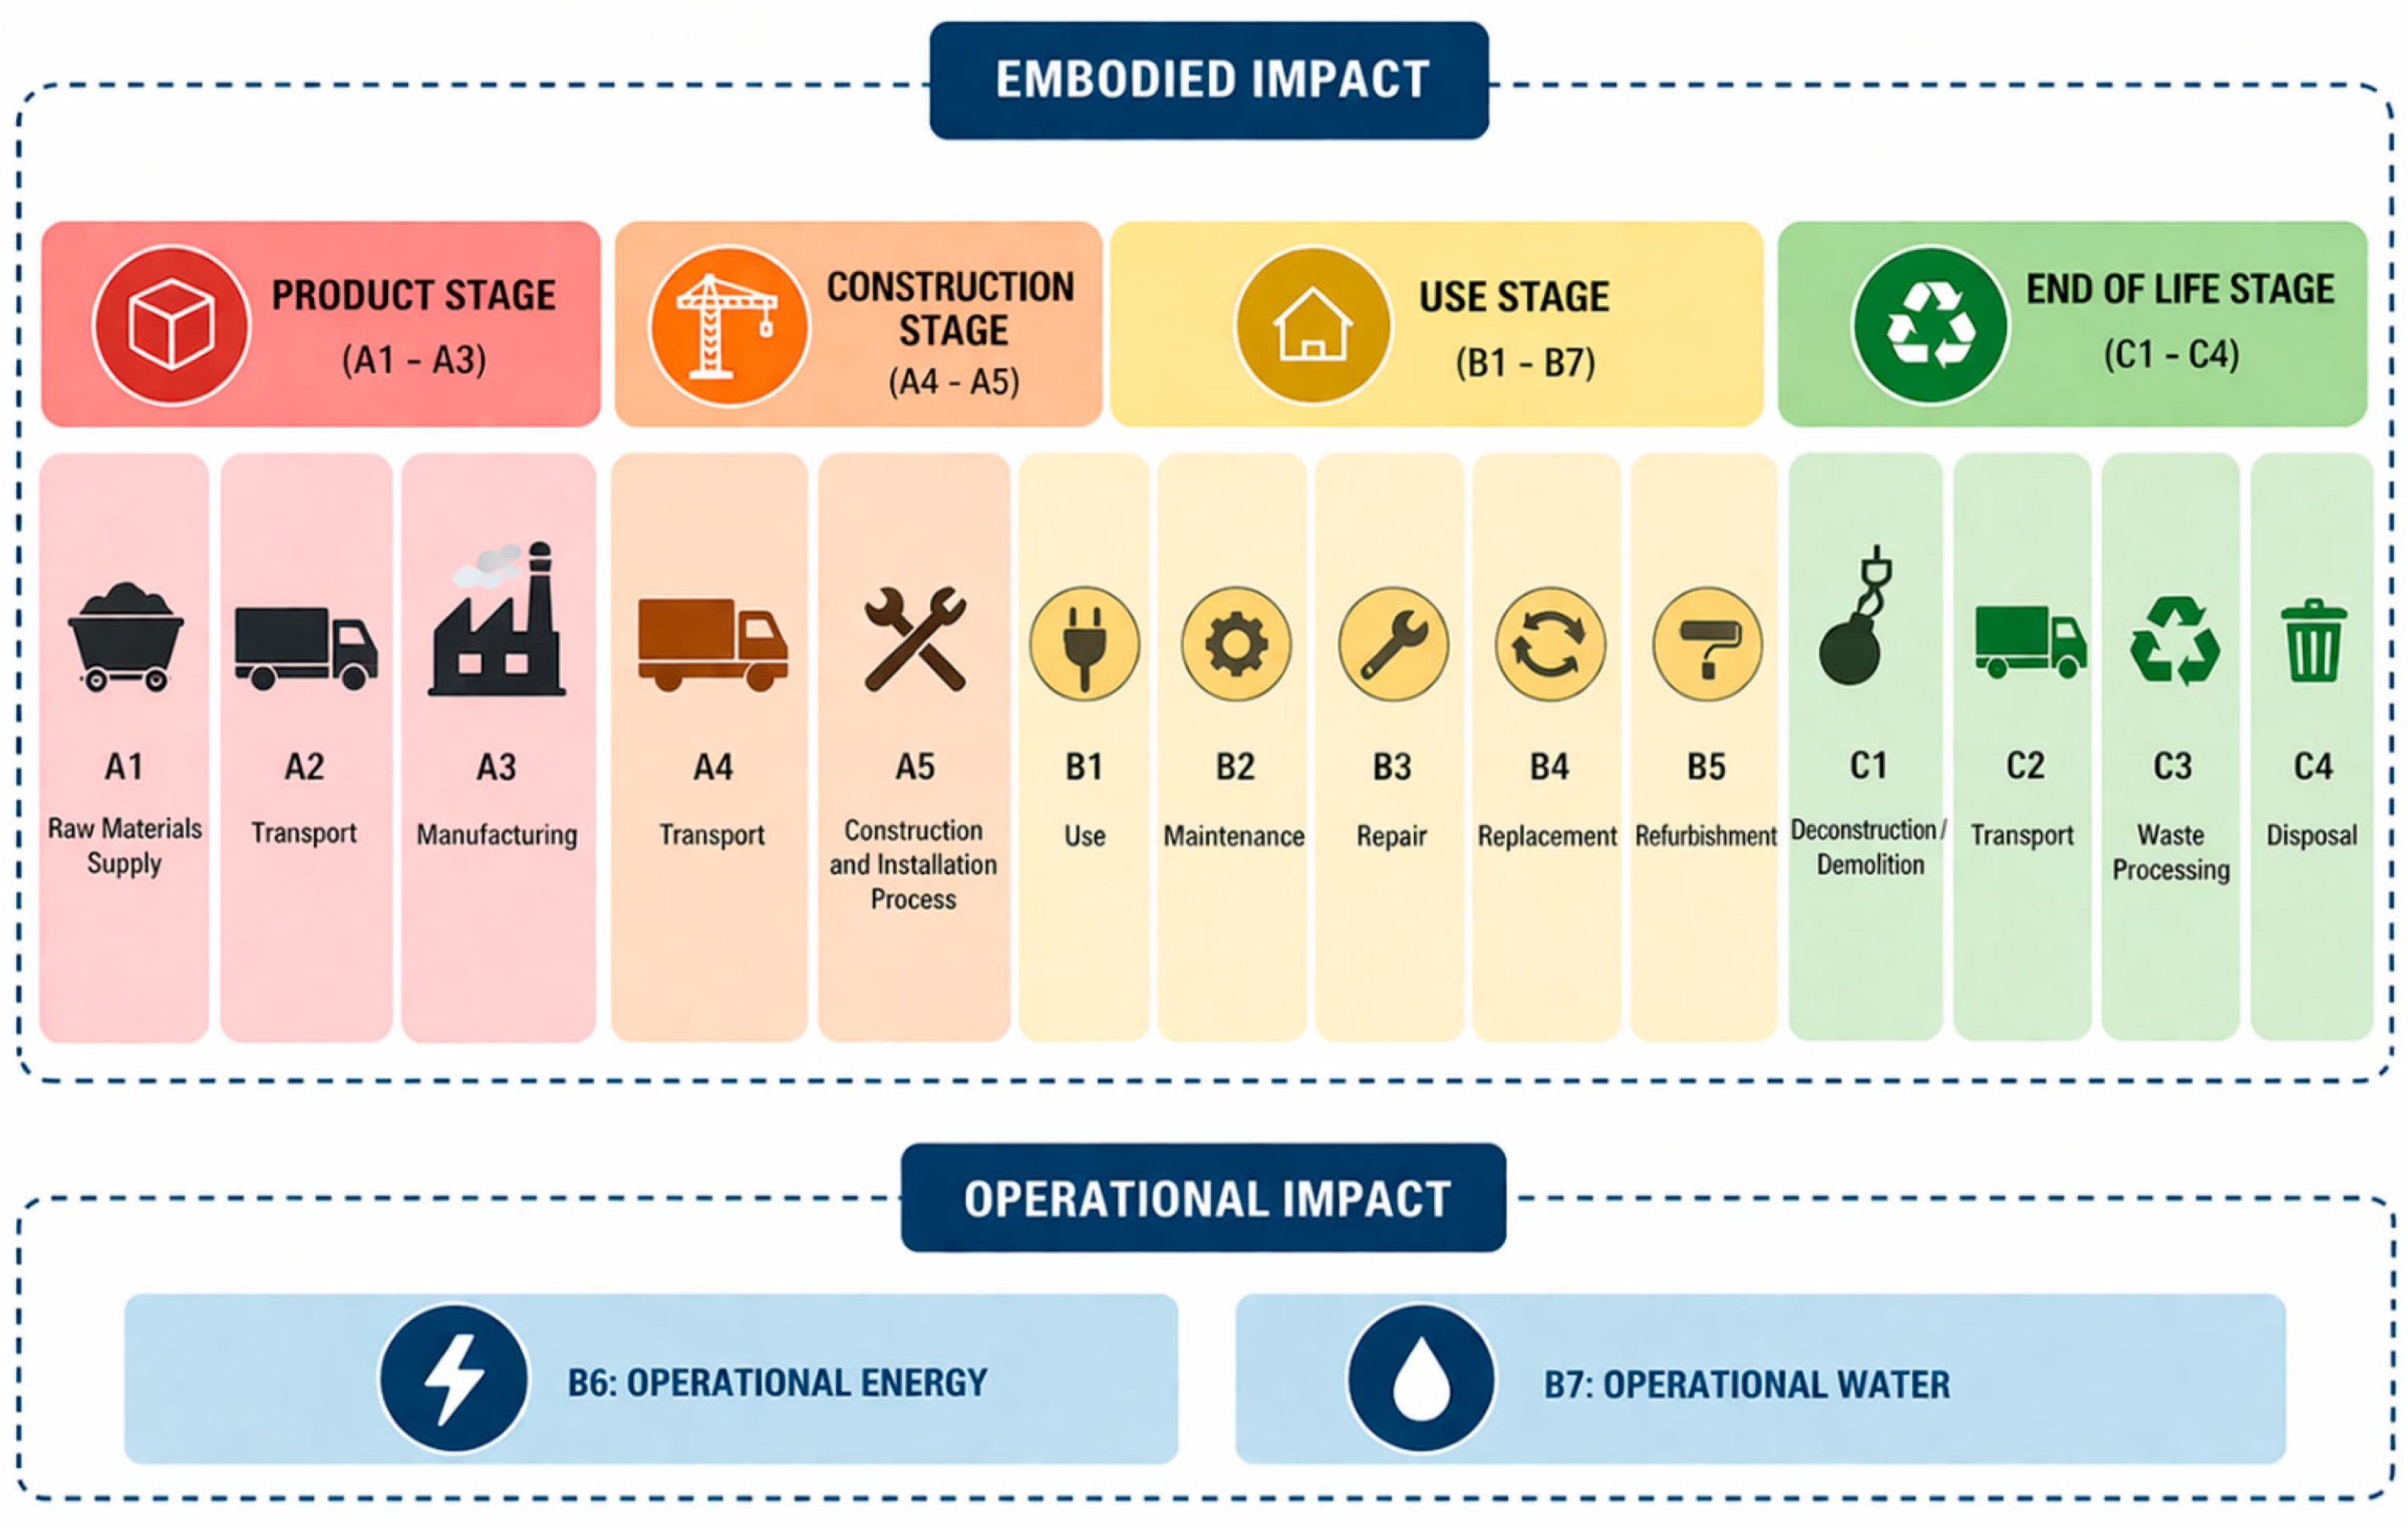
Embodied impact was assessed using the A1–A3 product stage (Figure 4) [45], corresponding to raw material supply, transport, and manufacturing. This boundary was selected because this study focuses on early-stage design decisions, where material selection and construction quantities are the most directly relevant variables. Wall and window assemblies were treated as variable envelope components, while other building elements, such as floors and roofs, retained fixed assembly definitions but updated in quantity according to geometric change (Table 2). This approach allowed embodied impact to remain sensitive to changes in architectural and geometrical configuration while keeping the life-cycle boundary and material database consistent across all optimization iterations. To improve methodological transparency, the main LCA modeling assumptions are summarized in Table 3. The embodied-impact values were generated using Tally Non-commercial Version 2023.09.13.01. Tally reports that its methodology is consistent with ISO 14040:2006 [46],14044:2006 [47], ISO 21930:2017 [48], ISO 21931-1:2010 [49], EN 15804:2012 [50], and EN 15978:2011 [51]. The Tally database combines material attributes, assembly details, and architectural specifications with environmental-impact data developed through KieranTimberlake and thinkstep, modeled in GaBi 8.5 using GaBi 2018 databases (thinkstep AG, Stuttgart, Germany). The data are intended to represent US conditions and the year 2017; where representative data are unavailable, technologically consistent proxy data are used. Therefore, the embodied-impact values in this study should be interpreted as comparative generic-dataset estimates rather than Saudi-specific Environmental Product Declaration values. BIM elements were mapped to Tally entries through Revit categories, families, and material assignments. Therefore, the embodied results should be interpreted as upstream product-stage impacts rather than complete cradle-to-grave life-cycle impacts.
Figure 4.
Building life-cycle stages based on EN 15978:2011, with the A1–A3 product stage highlighted as the embodied-impact system boundary adopted in this study.
Table 2.
Envelope, floor, and roof assembly options used in the optimization, with corresponding A1–A3 embodied-impact values.
Table 3.
Embodied-impact assessment assumptions used in the Tally-based LCA workflow.
3.5. Optimization Process
Multi-objective optimization was conducted using Wallacei, an evolutionary solver based on the Non-Dominated Sorting Genetic Algorithm II (NSGA-II). The optimization was run for 100 generations with 50 individuals per generation, producing a total of 5000 design solutions. Each solution was defined by a chromosome composed of geometric and envelope-related variables, including box activation and translation, façade glazing ratio, building orientation, and wall/window assembly selection. The main optimization settings are summarized in Table 4 to improve reproducibility. The population size and generation count were explicitly defined, while the remaining NSGA-II operators were retained using the Wallacei default settings. A fixed random seed was not manually assigned, and repeated independent optimization runs were not conducted. Therefore, the optimization results should be interpreted as the outcome of one controlled NSGA-II run rather than as a full stochastic robustness study. To provide a convergence check within the available optimization output, the generation-wise emergence of the filtered Pareto solutions was reviewed. The final two unique representative configurations appeared by the later generations, and no additional unique filtered Pareto configurations were added between the final generations of the run. This convergence check supports the stability of the reported final filtered set within the performed run, while the absence of repeated independent runs is acknowledged as a limitation.
Table 4.
Optimization settings.
Two primary objective functions were minimized simultaneously:
- Operational energy (annual cooling + heating + lighting energy, kWh/yr);
- Embodied impact (A1–A3 product-stage impact, kg CO2eq).
Both objectives were evaluated as absolute whole-building quantities because this study aimed to examine the annual operational demand and upstream embodied impact of complete residential design alternatives rather than normalized component-level performance. However, because building size strongly influences both objectives, the absolute objective values were not used alone to identify the final representative solutions. Instead, comparable building size was treated as a design-scope requirement during post-processing before final Pareto interpretation. In addition to these objectives, all generated solutions were required to satisfy the geometric and regulatory constraints embedded in the parametric model, including code-compliant plot occupation, setback conditions, and minimum fenestration requirements. Wallacei generated the complete solution population and returned the resulting fitness values for post-processing and trade-off analysis.
3.6. Post-Processing and Solution Selection
Because unrestricted optimization can favor solutions that are impractical from an architectural standpoint, a post-processing filter was applied before final Pareto analysis. First, only solutions achieving at least 95% of the maximum total floor area were retained. This threshold was selected as an architectural comparability filter to exclude undersized configurations and to focus the analysis on solutions close to the intended residential floor-area target. Recent studies on building-construction benchmarks and product-stage LCA of family houses further show that geometry, proportions, size, and the choice of absolute or normalized indicators can affect the interpretation of primary-energy and GWP results. Therefore, the post-processing filters used in this study were intended to maintain architectural comparability among the final alternatives and to avoid interpreting undersized or non-comparable configurations as superior solely because of reduced absolute quantities [52,53]. Second, a data-driven glazing threshold was applied by retaining only solutions above the 60th percentile of total WWR within the high-area subset. The WWR threshold was not intended to represent a regulatory daylight requirement or a daylight-performance metric. Rather, it was used as a façade-openness filter to exclude comparatively low-glazing configurations within the high-area subset so that the final comparison would remain aligned with the intended architectural design scope. To examine the influence of these methodological thresholds, a threshold-sensitivity check was performed using alternative area and WWR criteria, as summarized in Table 5. Together, the two filters reduced the influence of trivial low-area or low-openness solutions and allowed the comparison to focus on configurations that better matched the intended architectural design scope. Because these thresholds influence the final filtered solution set, the results are interpreted as outcomes of the selected area and WWR criteria rather than as universal properties of all possible residential configurations.
Table 5.
Threshold-sensitivity check.
4. Results
4.1. Global Search Space and Post-Processing
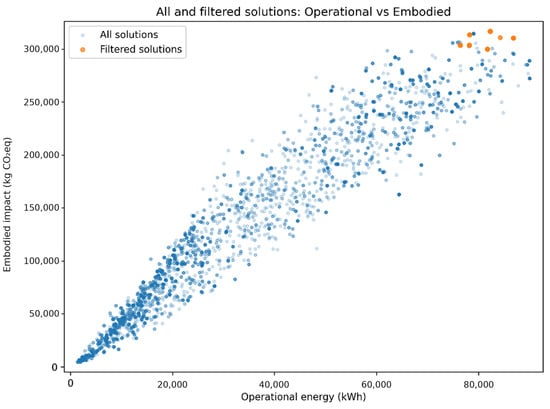
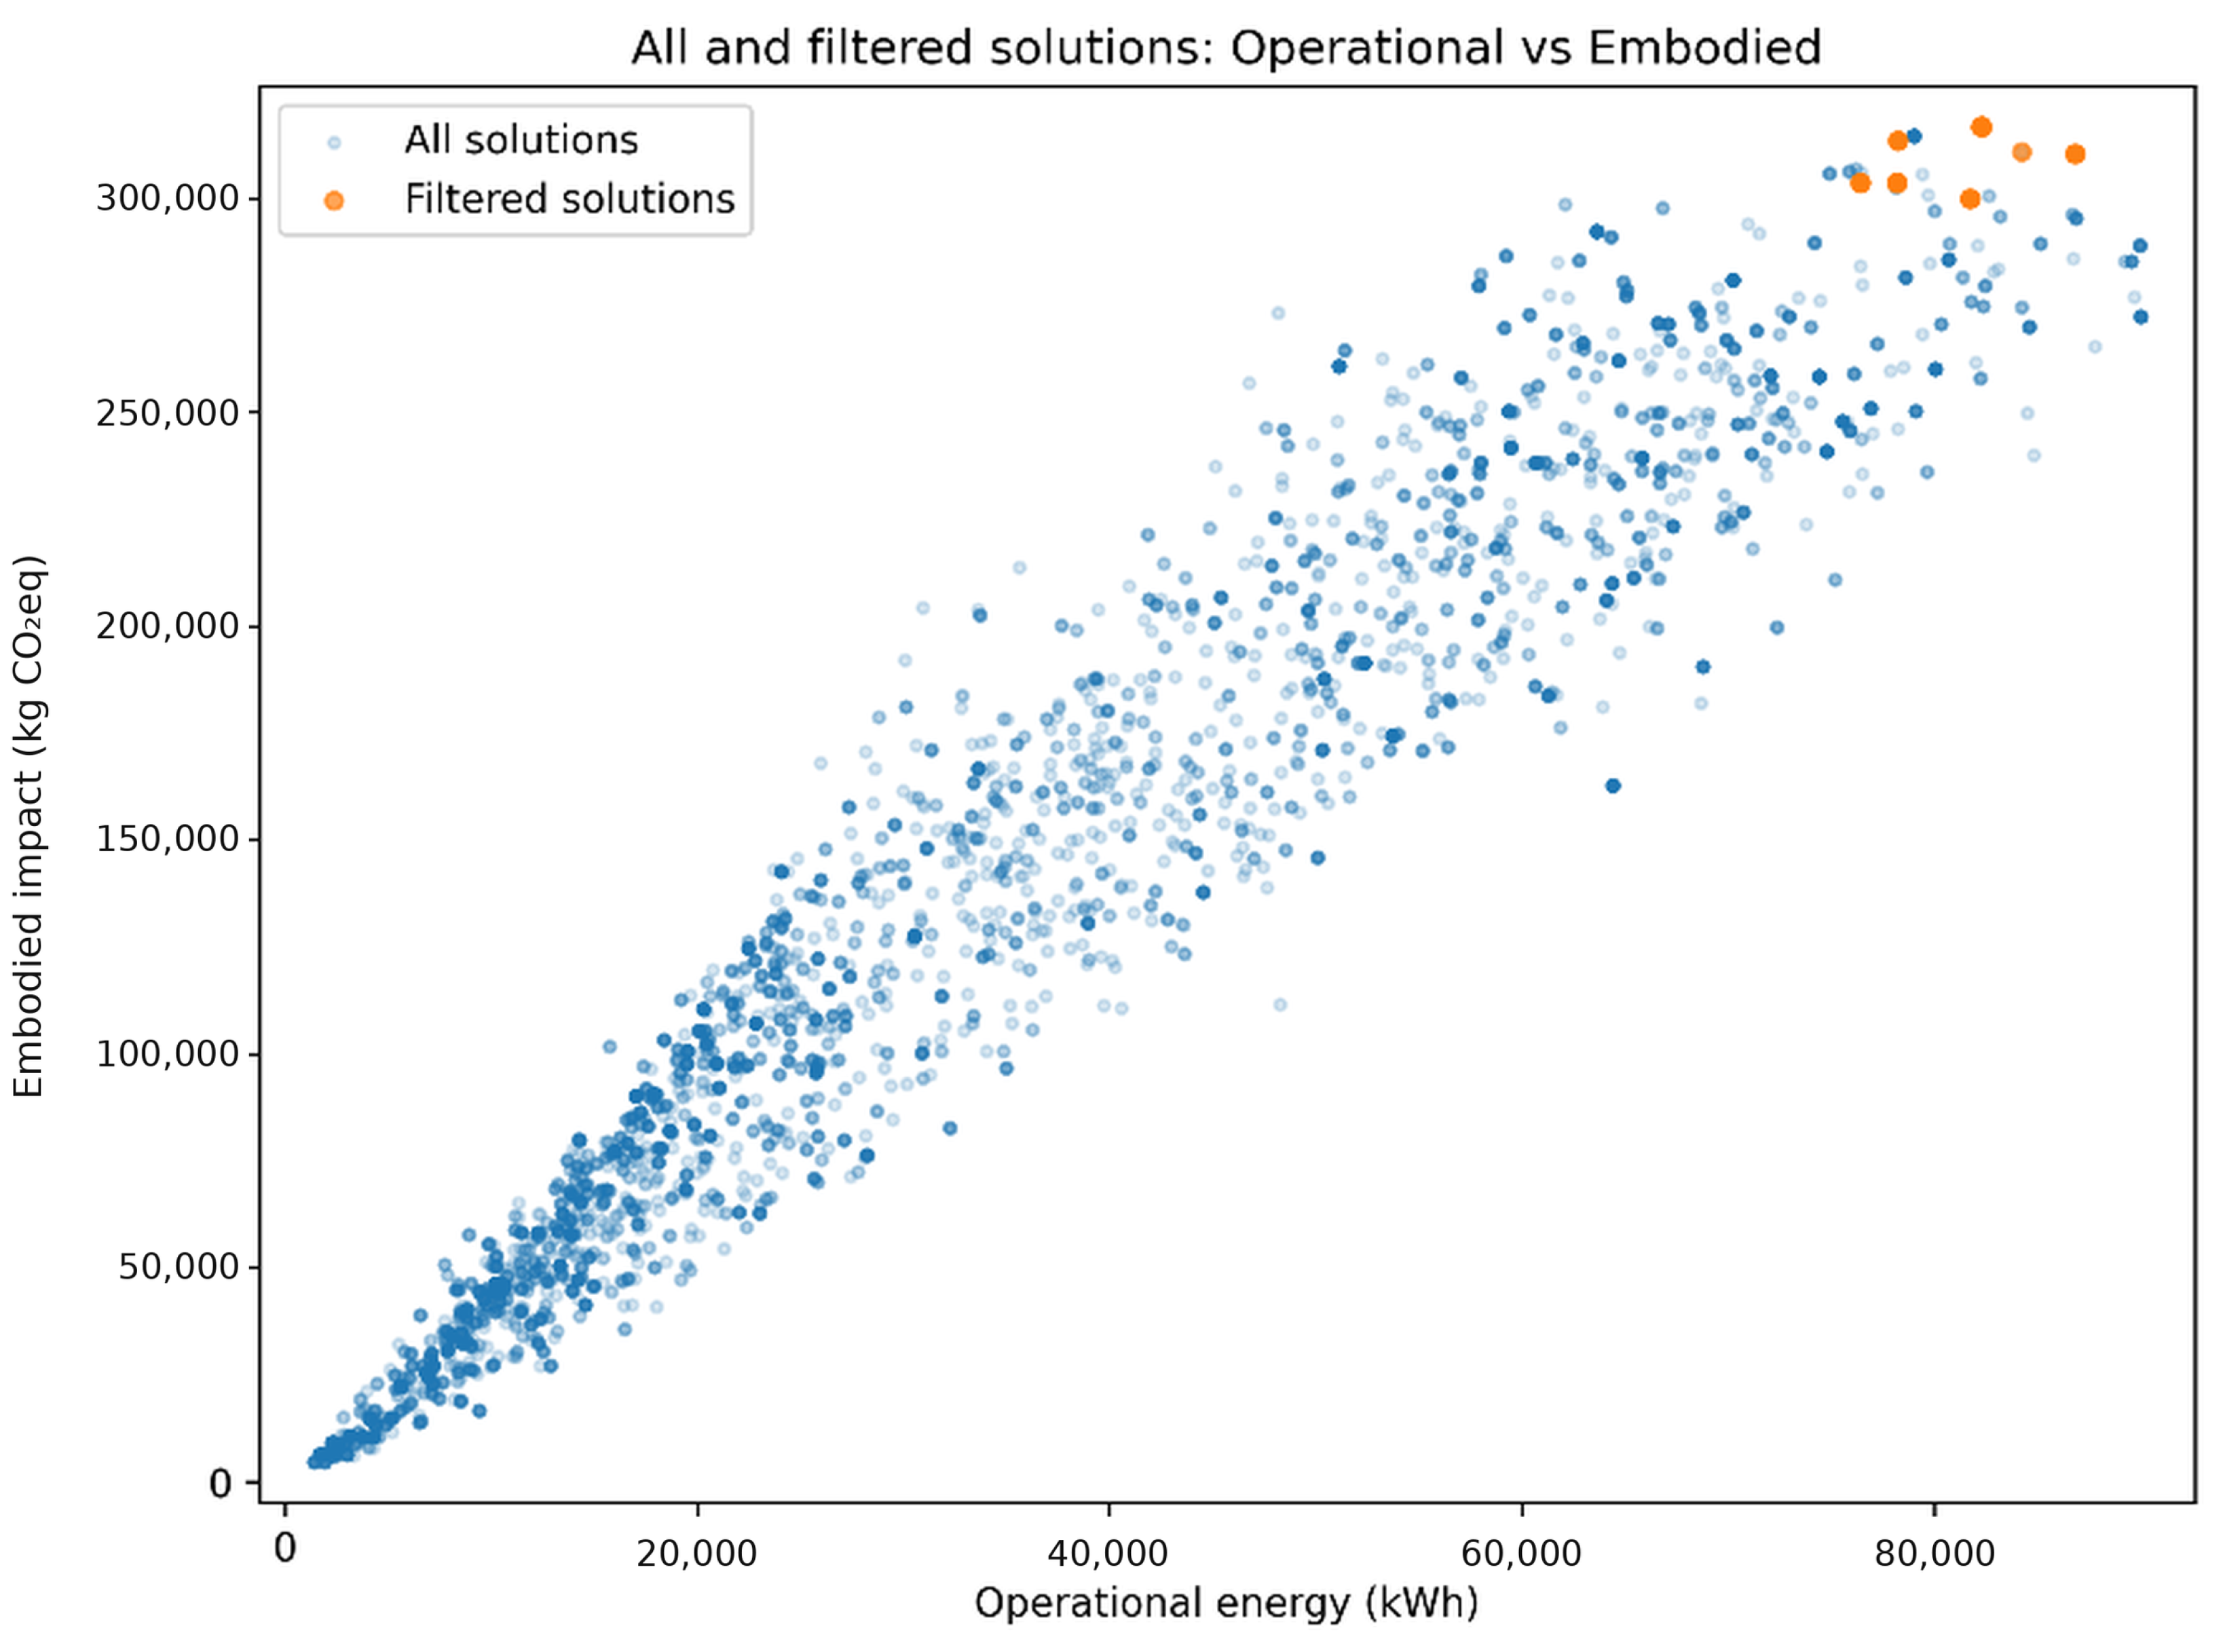
The Wallacei optimization generated 5000 candidate solutions, representing the combined effects of massing configuration, façade openness, and envelope material selection. The global relationship between operational energy and embodied impact is shown in Figure 5, which plots all solutions together with the subset retained after area and WWR filtering. The full solution space reveals a broad performance spectrum, indicating that the parametric framework successfully explored a wide range of building configurations rather than converging prematurely to a narrow design family.
Figure 5.
Relationship between annual operational energy and embodied impact for all 5000 generated solutions (blue circles) and the 45 solutions retained after area and window-to-wall ratio (WWR) filtering (orange circles). Differences in blue intensity result from marker transparency and overlapping points and do not represent additional variables or solution categories.
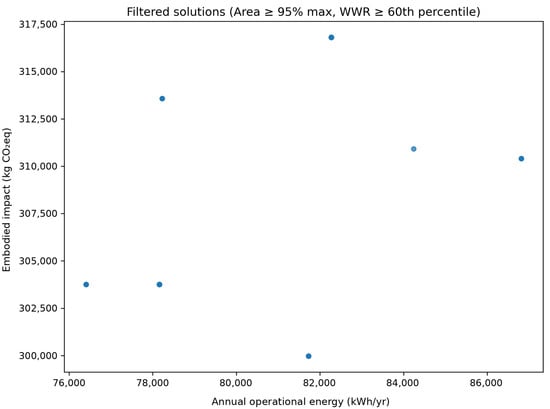
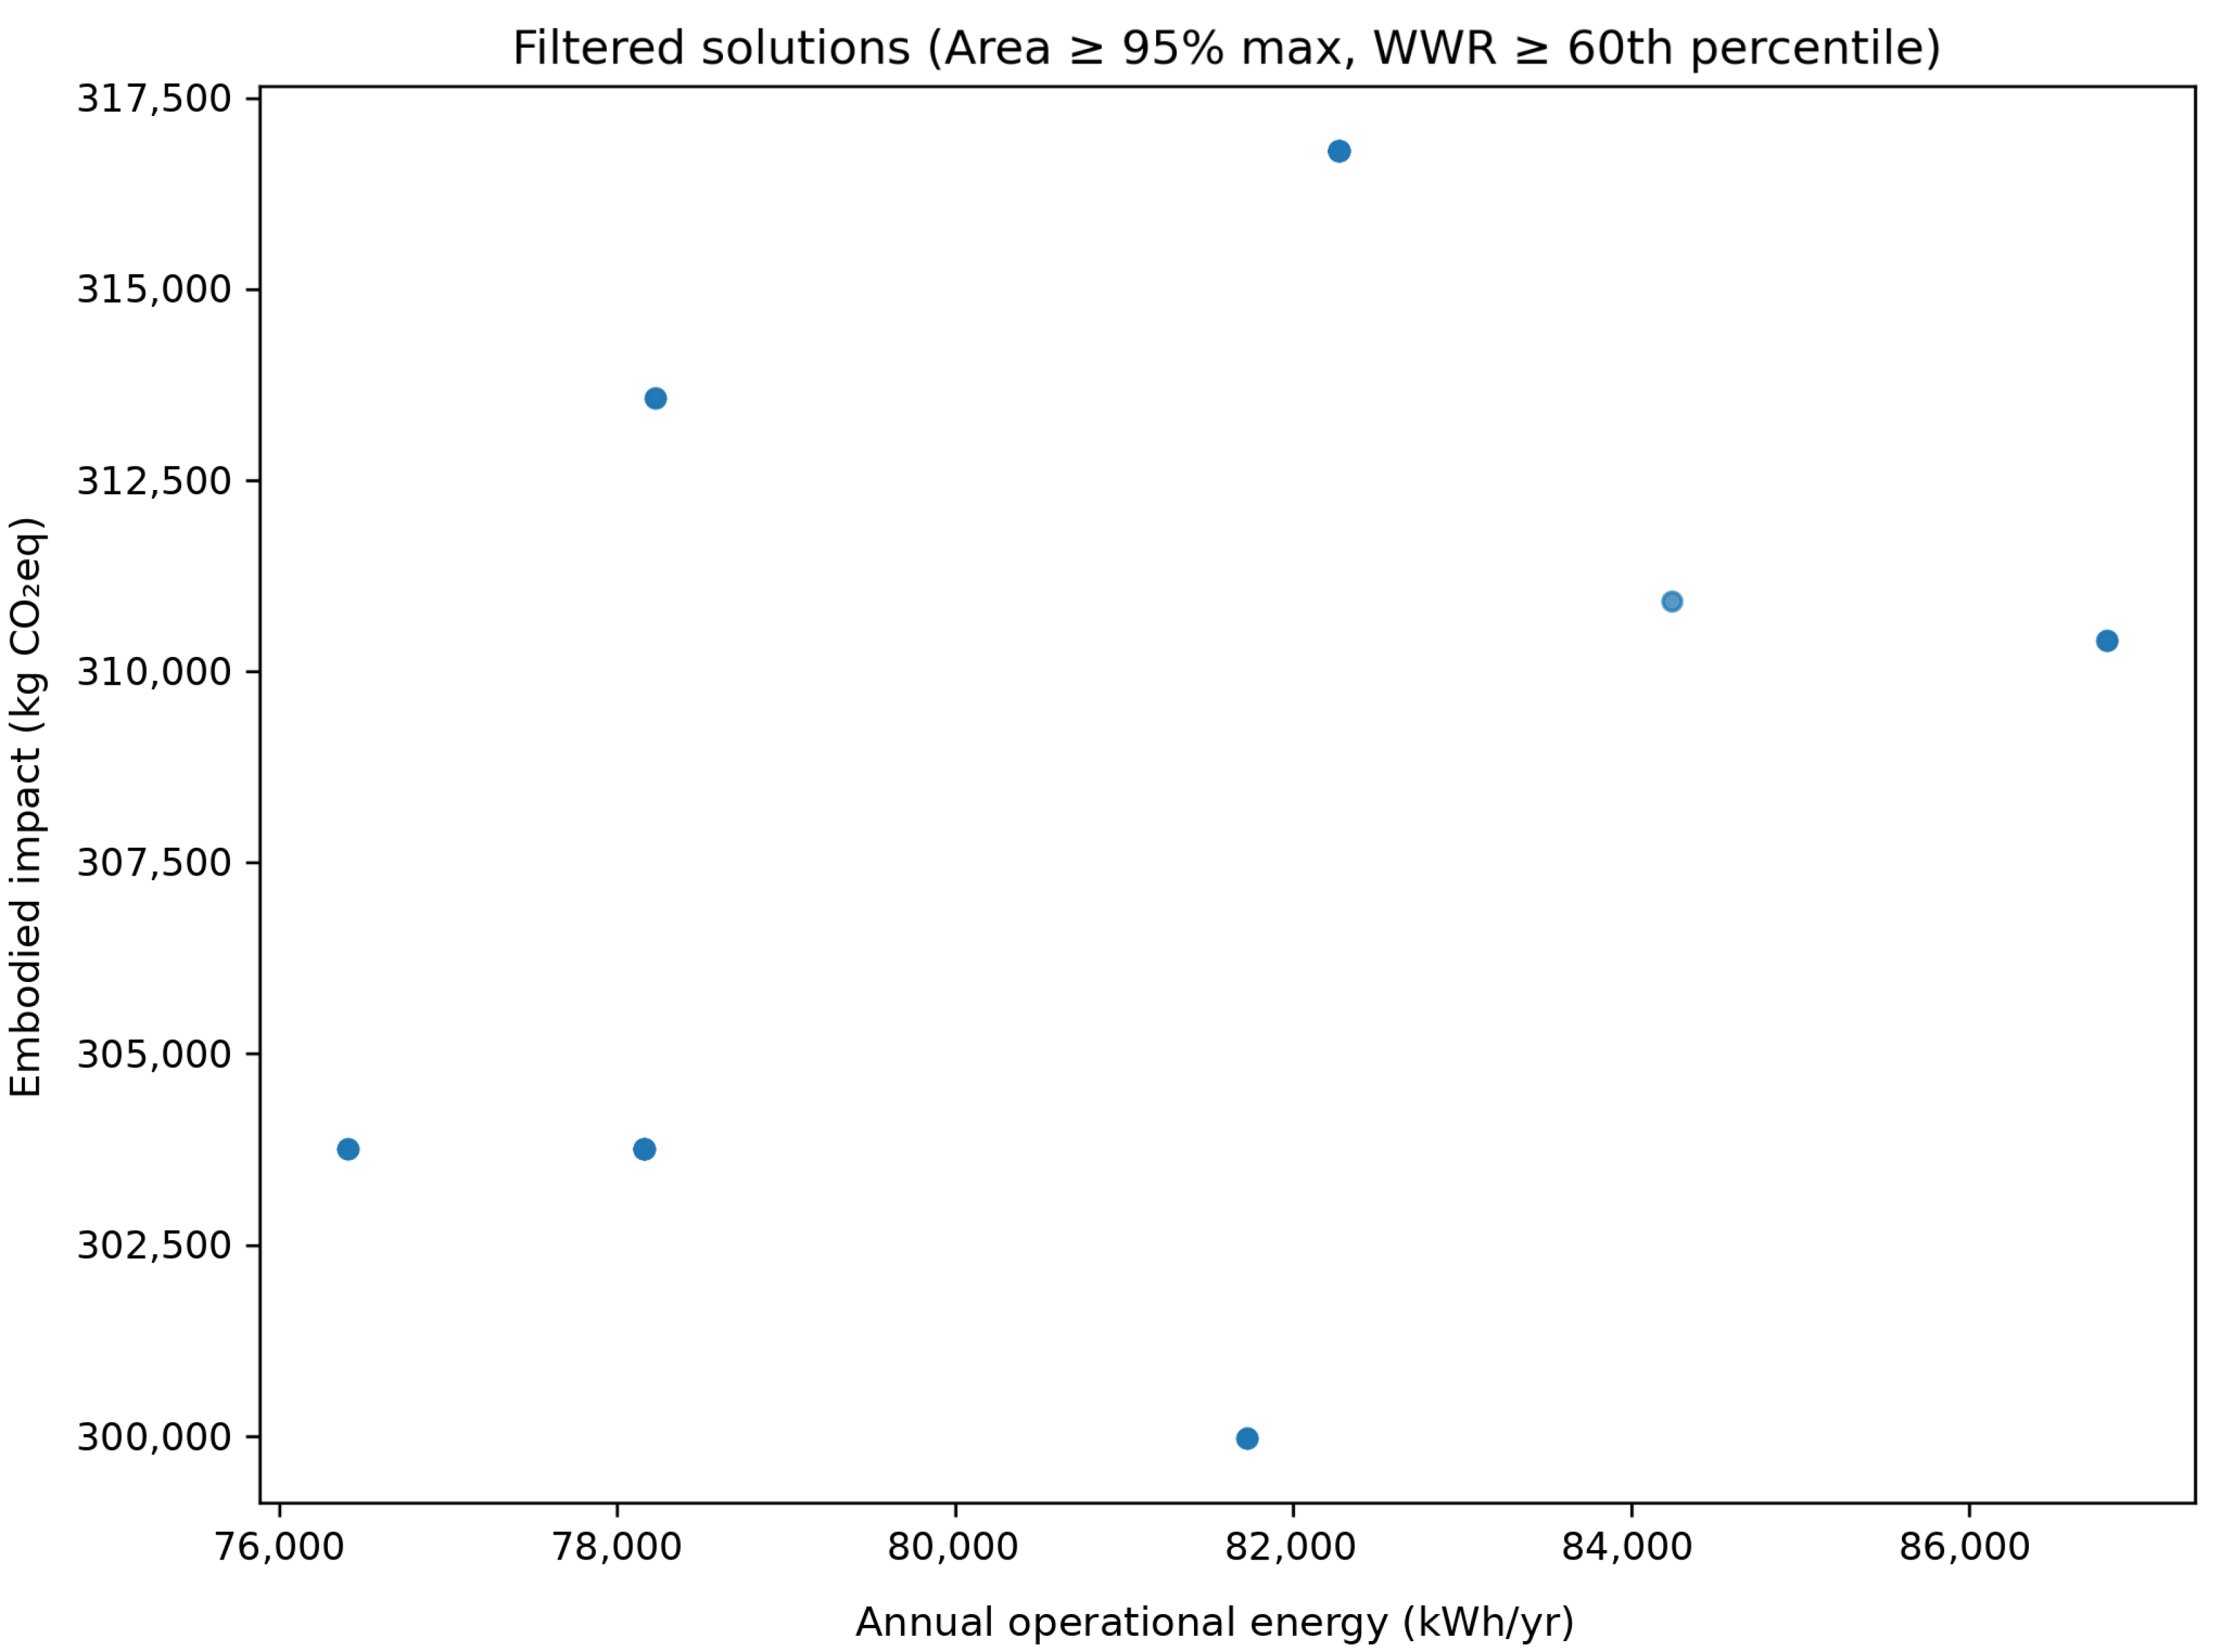
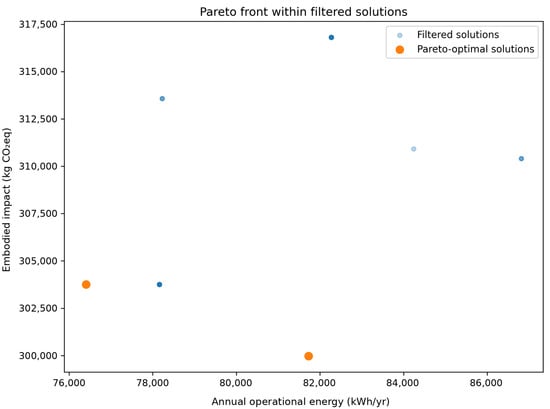
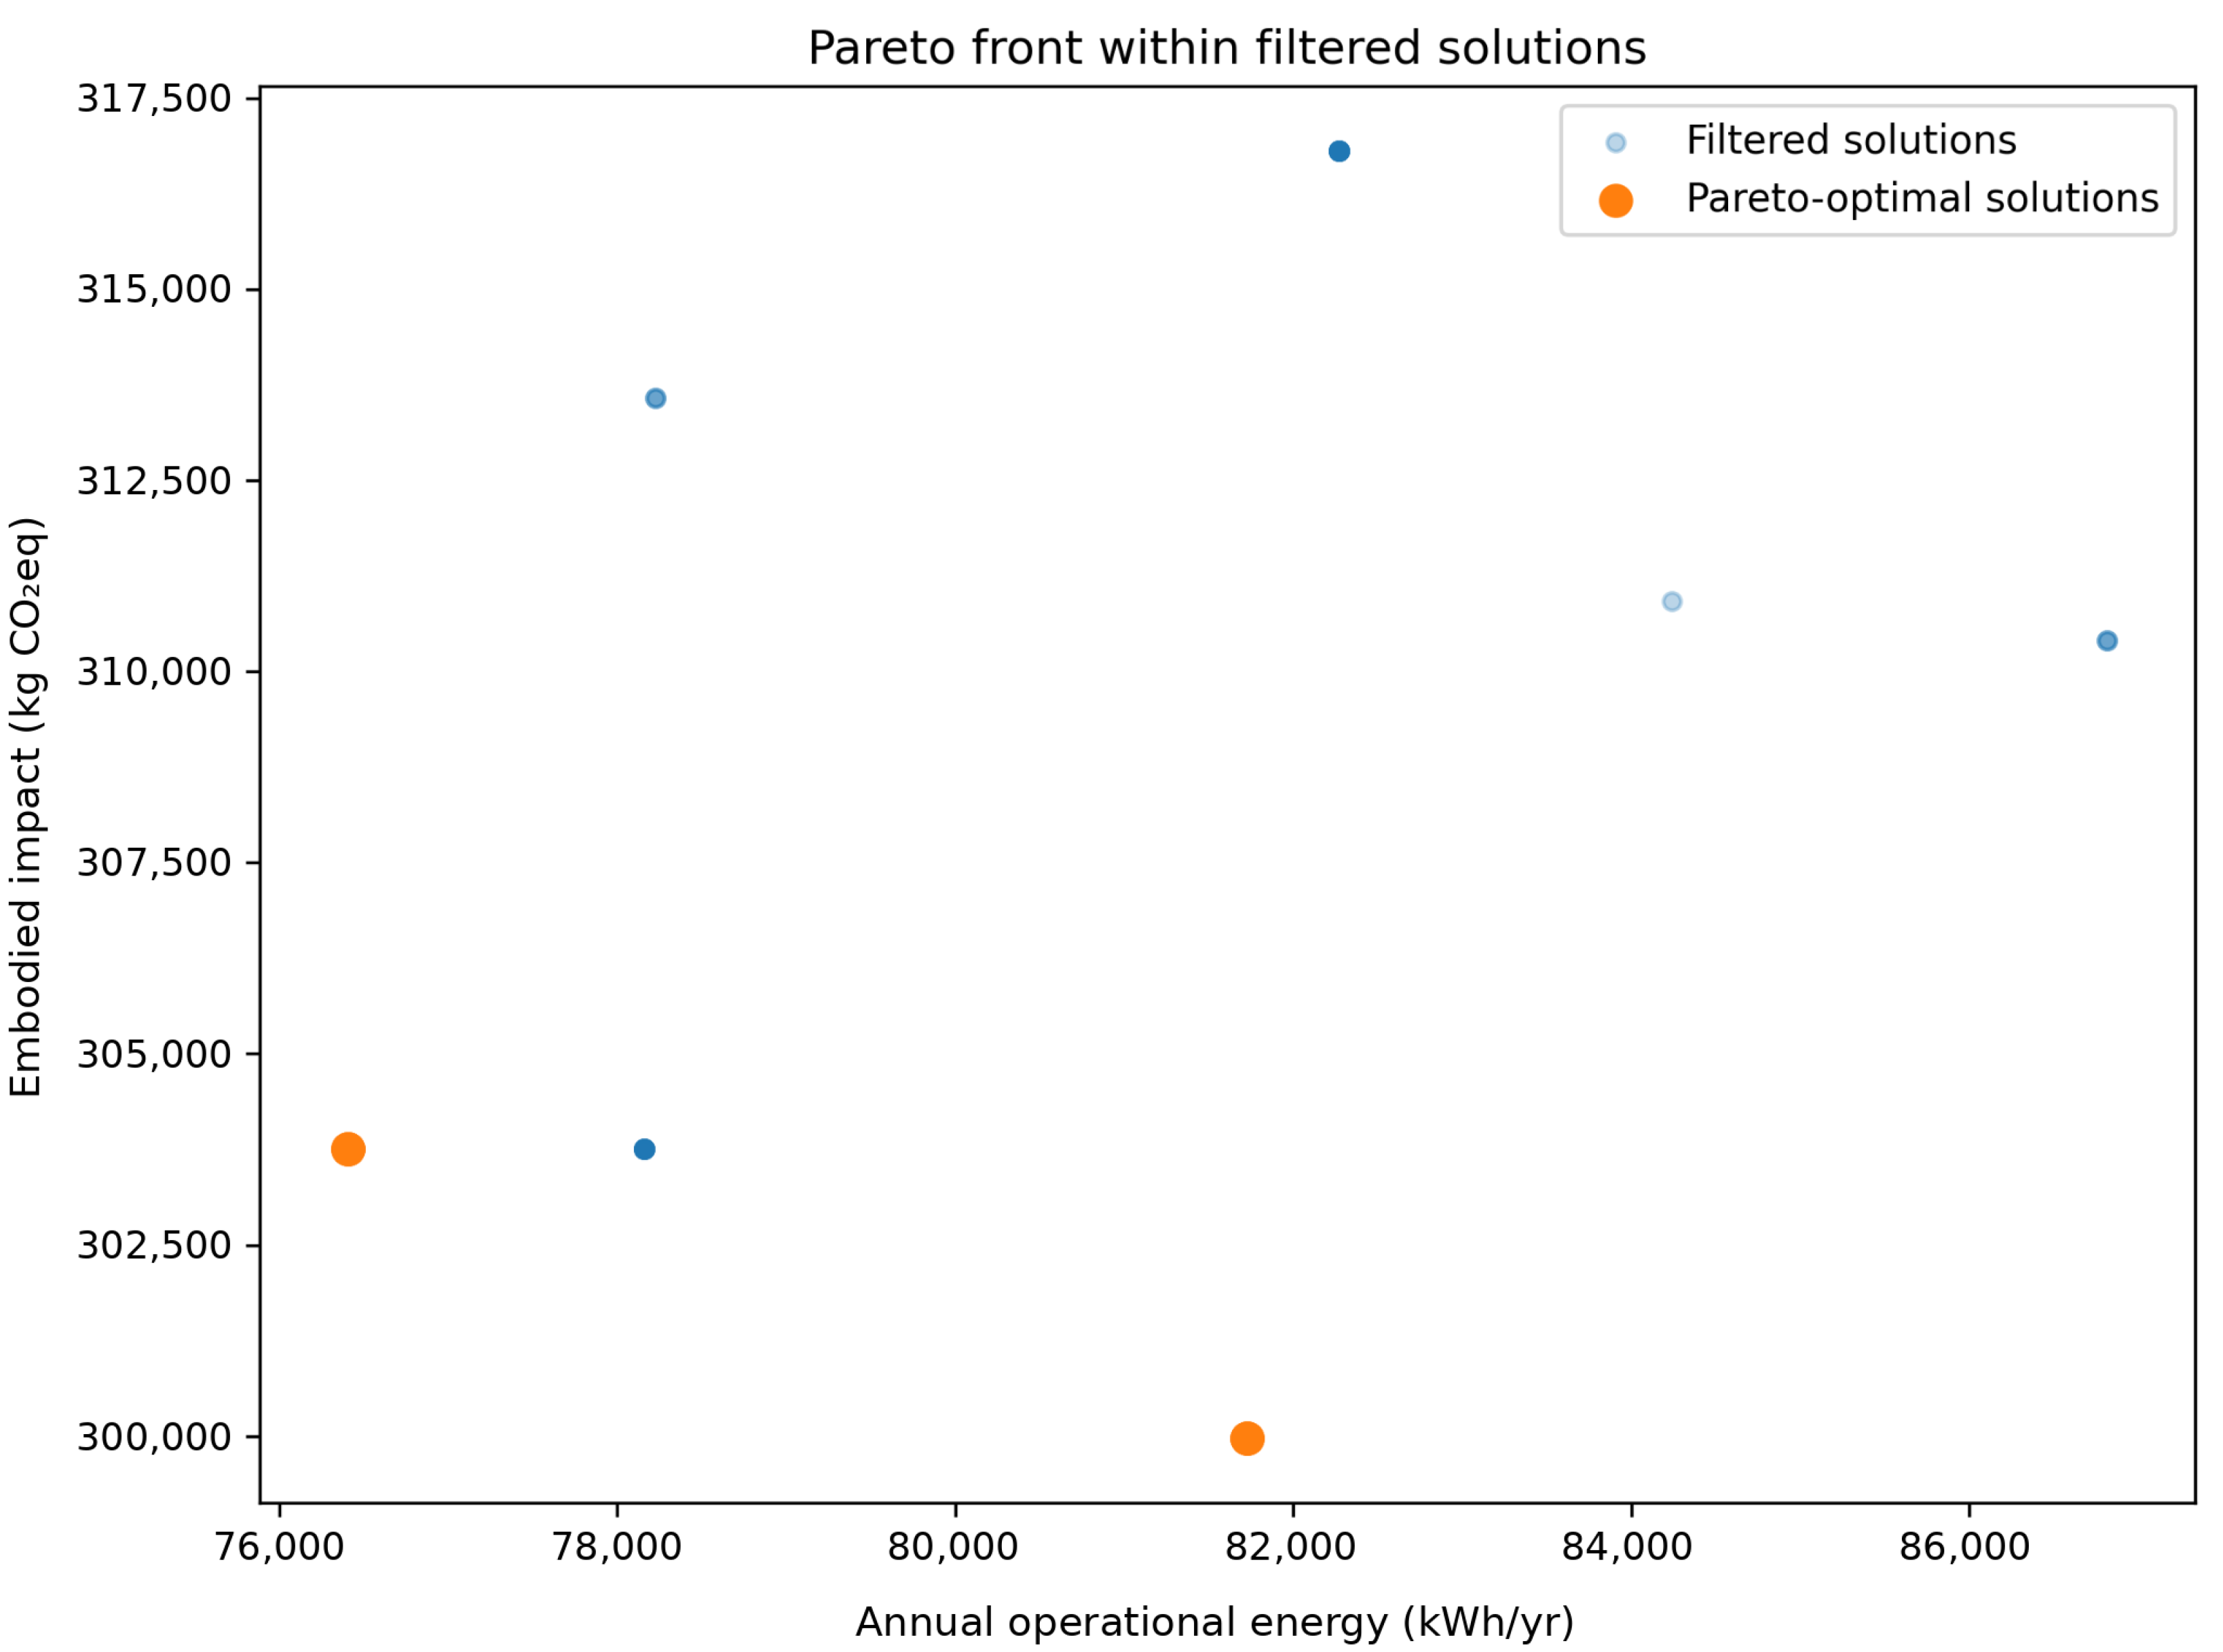
After applying the post-processing criteria, the candidate pool was reduced from 5000 to 77 solutions in the high-area band, and then to 45 solutions after the WWR filter. The filtered subset is shown separately in Figure 6, while the corresponding Pareto front is presented in Figure 7. This staged reduction was used to exclude undersized and low-WWR configurations and to focus the analysis on solutions that better matched the intended architectural design scope.
Figure 6.
Distribution of the 45 solutions retained after applying the floor-area (≥95% of the maximum) and window-to-wall ratio (WWR ≥60th percentile) filtering criteria. The plot shows annual operational energy and total A1–A3 embodied impact.
Figure 7.
Pareto-optimal solutions identified within the filtered solution set. Light blue circles represent the 45 filtered solutions, and orange circles represent the Pareto-optimal solutions. The plot shows annual operational energy and total A1–A3 embodied impact. Minor differences in blue intensity are visual rendering effects caused by marker transparency or overlap and do not indicate additional solution categories.
To further clarify the role of the post-processing thresholds, the filtering strategy is interpreted as a design-scope definition rather than as a performance optimum. The 95% area threshold was used to retain solutions close to the maximum residential floor-area target, while the 60th-percentile WWR threshold was used to remove configurations with comparatively low façade openness within that high-area subset. These criteria therefore shaped the population submitted to Pareto analysis and should be understood as part of the methodological framing of the case study. The resulting Pareto configurations are consequently interpreted within the selected area and WWR filtering criteria.
A threshold-sensitivity check was conducted to examine whether the observed Pareto structure was entirely dependent on the selected post-processing criteria. Alternative area thresholds of 90%, 92.5%, 95%, and 97.5% of maximum floor area were tested together with WWR thresholds at the 50th, 60th, and 70th percentiles within each high-area subset. The results showed that the number of retained solutions changed substantially across threshold combinations, confirming that the filtering strategy influences the size of the final analysis set. However, several nearby threshold combinations around the selected baseline produced a limited number of unique Pareto configurations, generally between two and three. Therefore, the sensitivity check supports a moderated interpretation: the selected thresholds did not produce a broad continuous Pareto front, but the exact number of unique configurations should be understood as dependent on the filtering criteria rather than as an intrinsic property of all possible design alternatives.
4.2. Pareto Structure and Representative Configurations
The Pareto analysis of the filtered subset identified eight non-dominated entries. However, these entries did not represent eight independent architectural alternatives. Instead, they collapsed into two unique representative configurations, each repeated four times with identical objective values. The duplicate entries were therefore removed from the interpretive comparison, and the results are discussed in terms of two unique objective-space configurations rather than eight independent Pareto alternatives. The sensitivity check reported in Section 4.1 indicates that nearby area and WWR thresholds generally produced a limited number of unique Pareto configurations, but the exact number of configurations varied across threshold combinations. Therefore, the two-configuration result is not presented as an inherent property of the full design space. Rather, it is interpreted as the final decision structure produced under the selected variable encoding, material library, area constraint, and WWR-based façade-openness filter. Accordingly, the comparison presented in the following subsections is based on the two unique representative configurations, G74-I2 and G86-I40, rather than on the full count of repeated Pareto entries.
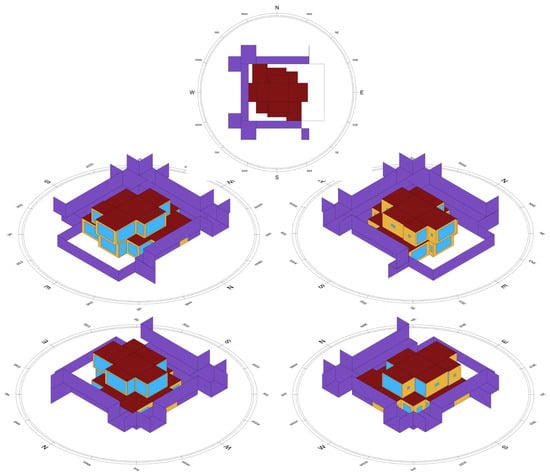
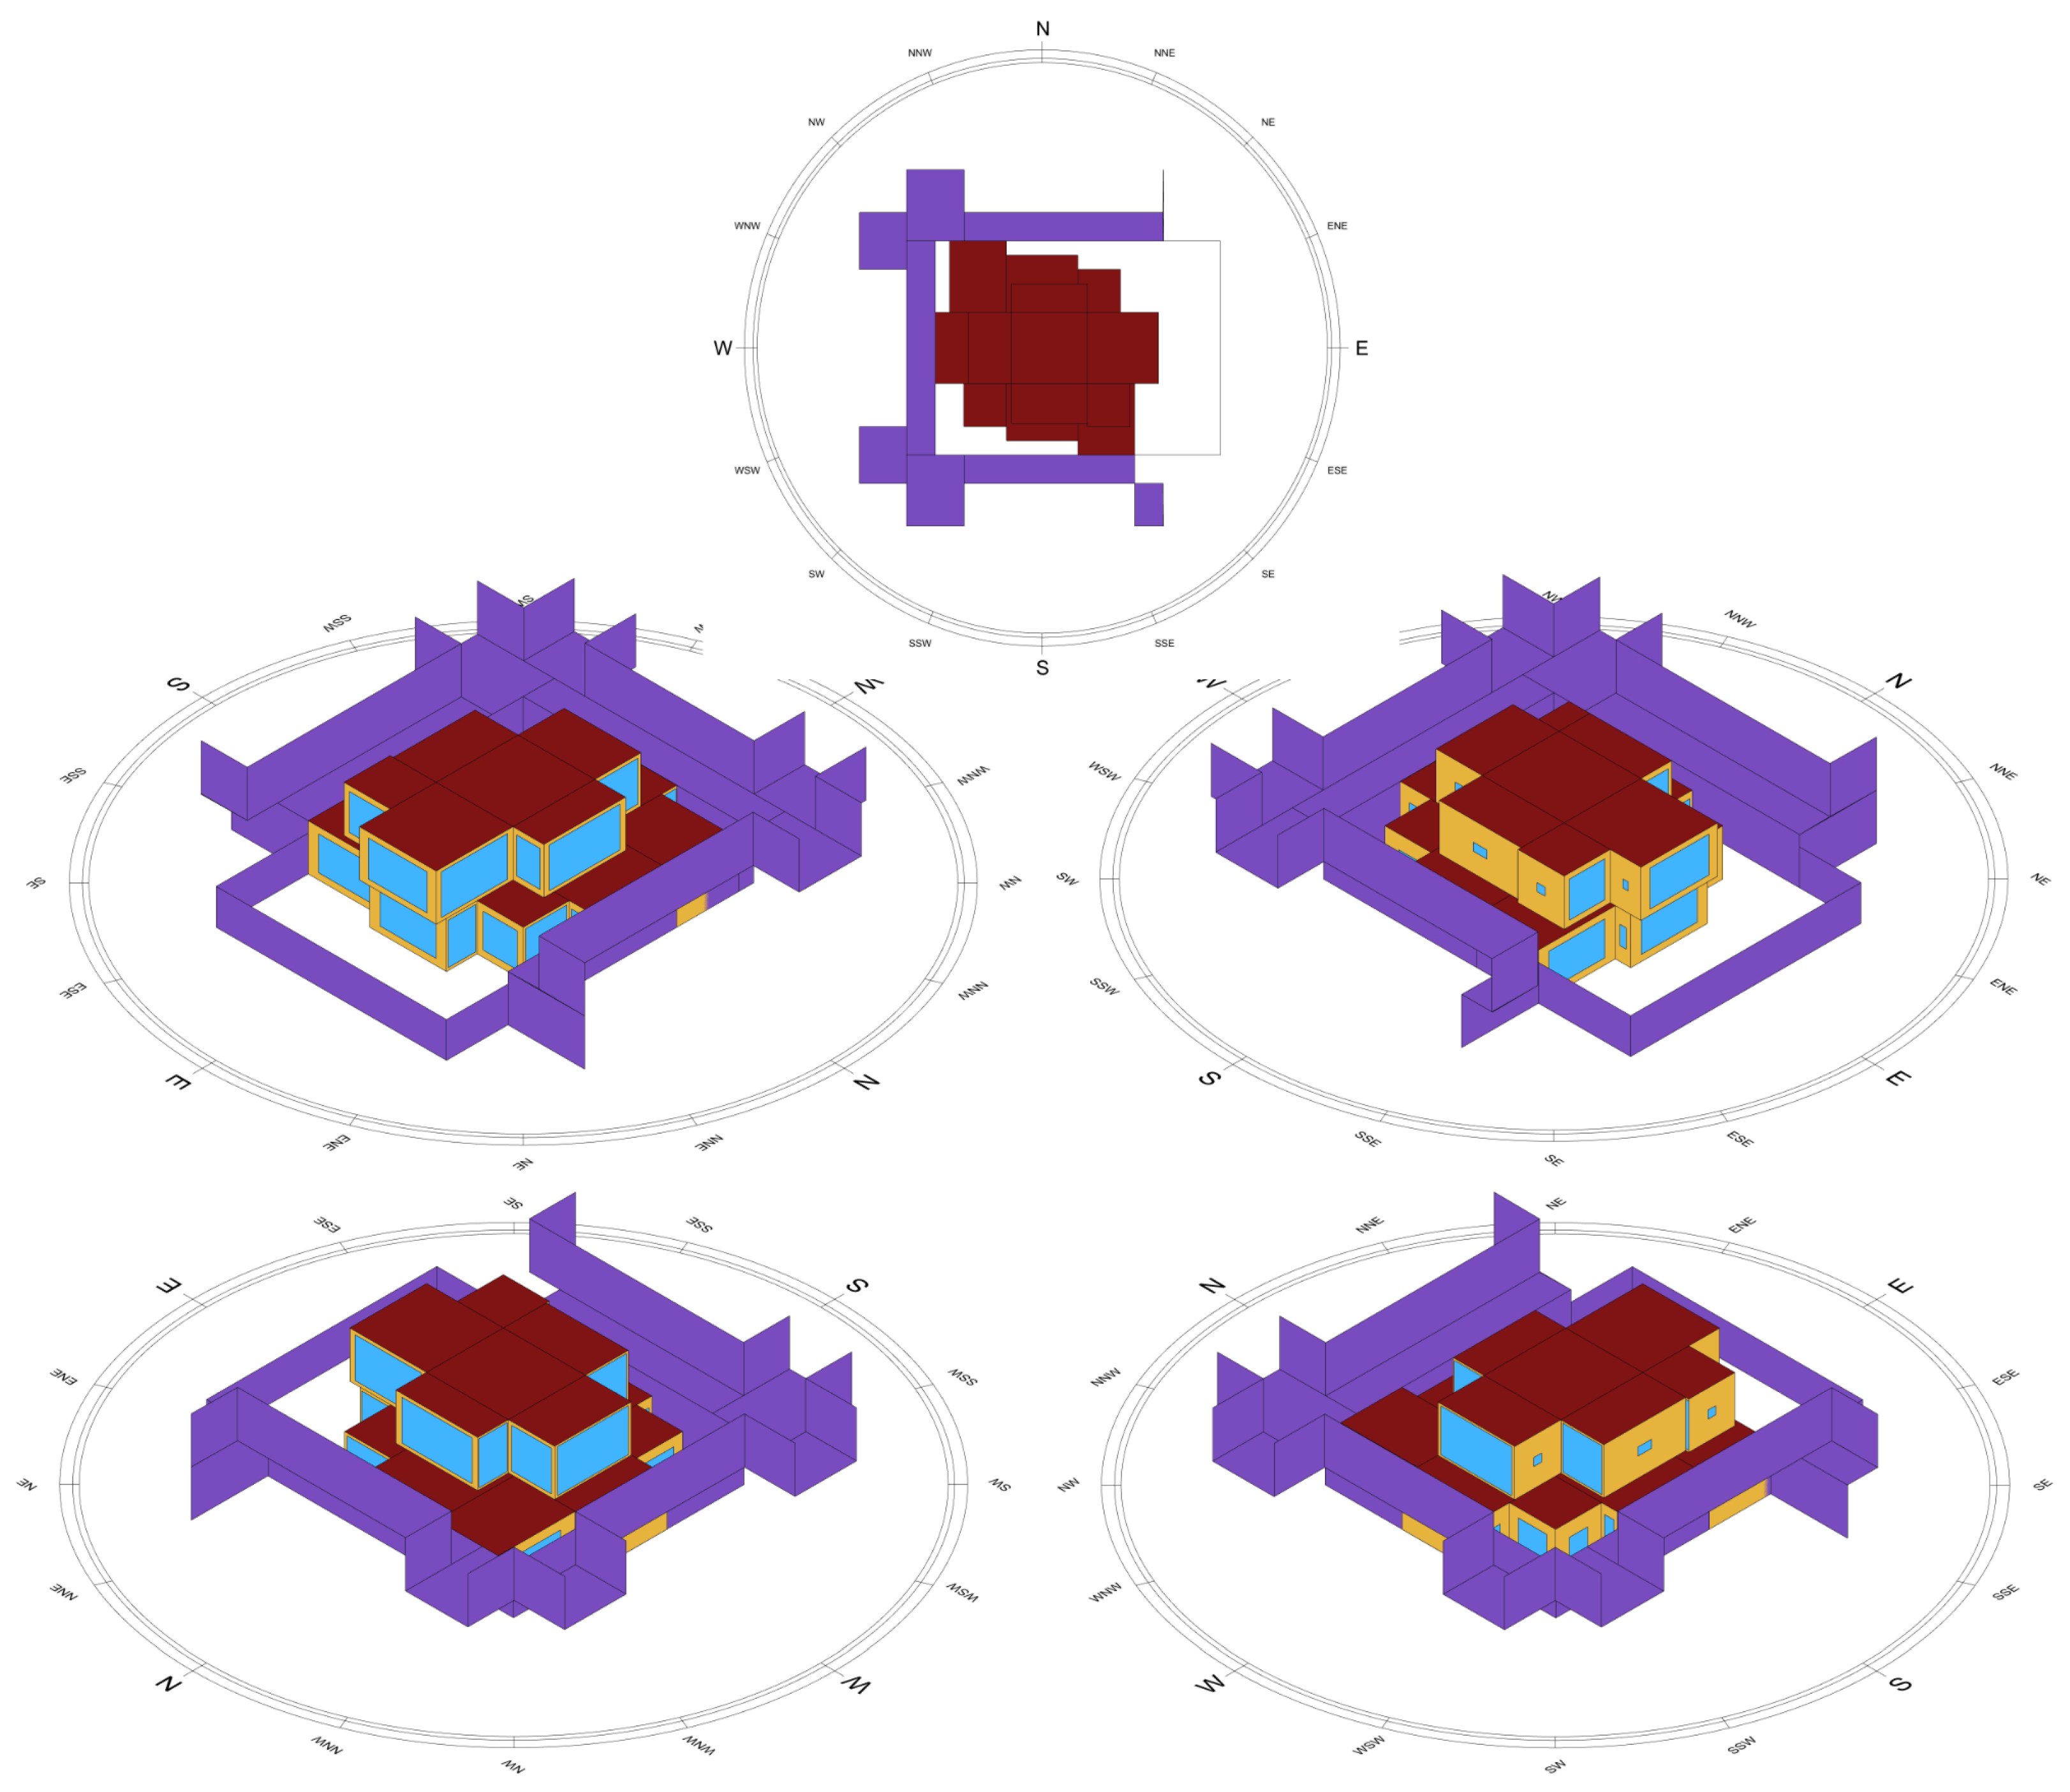
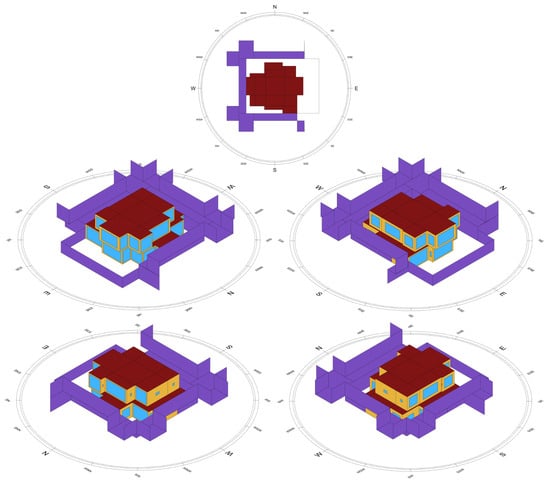
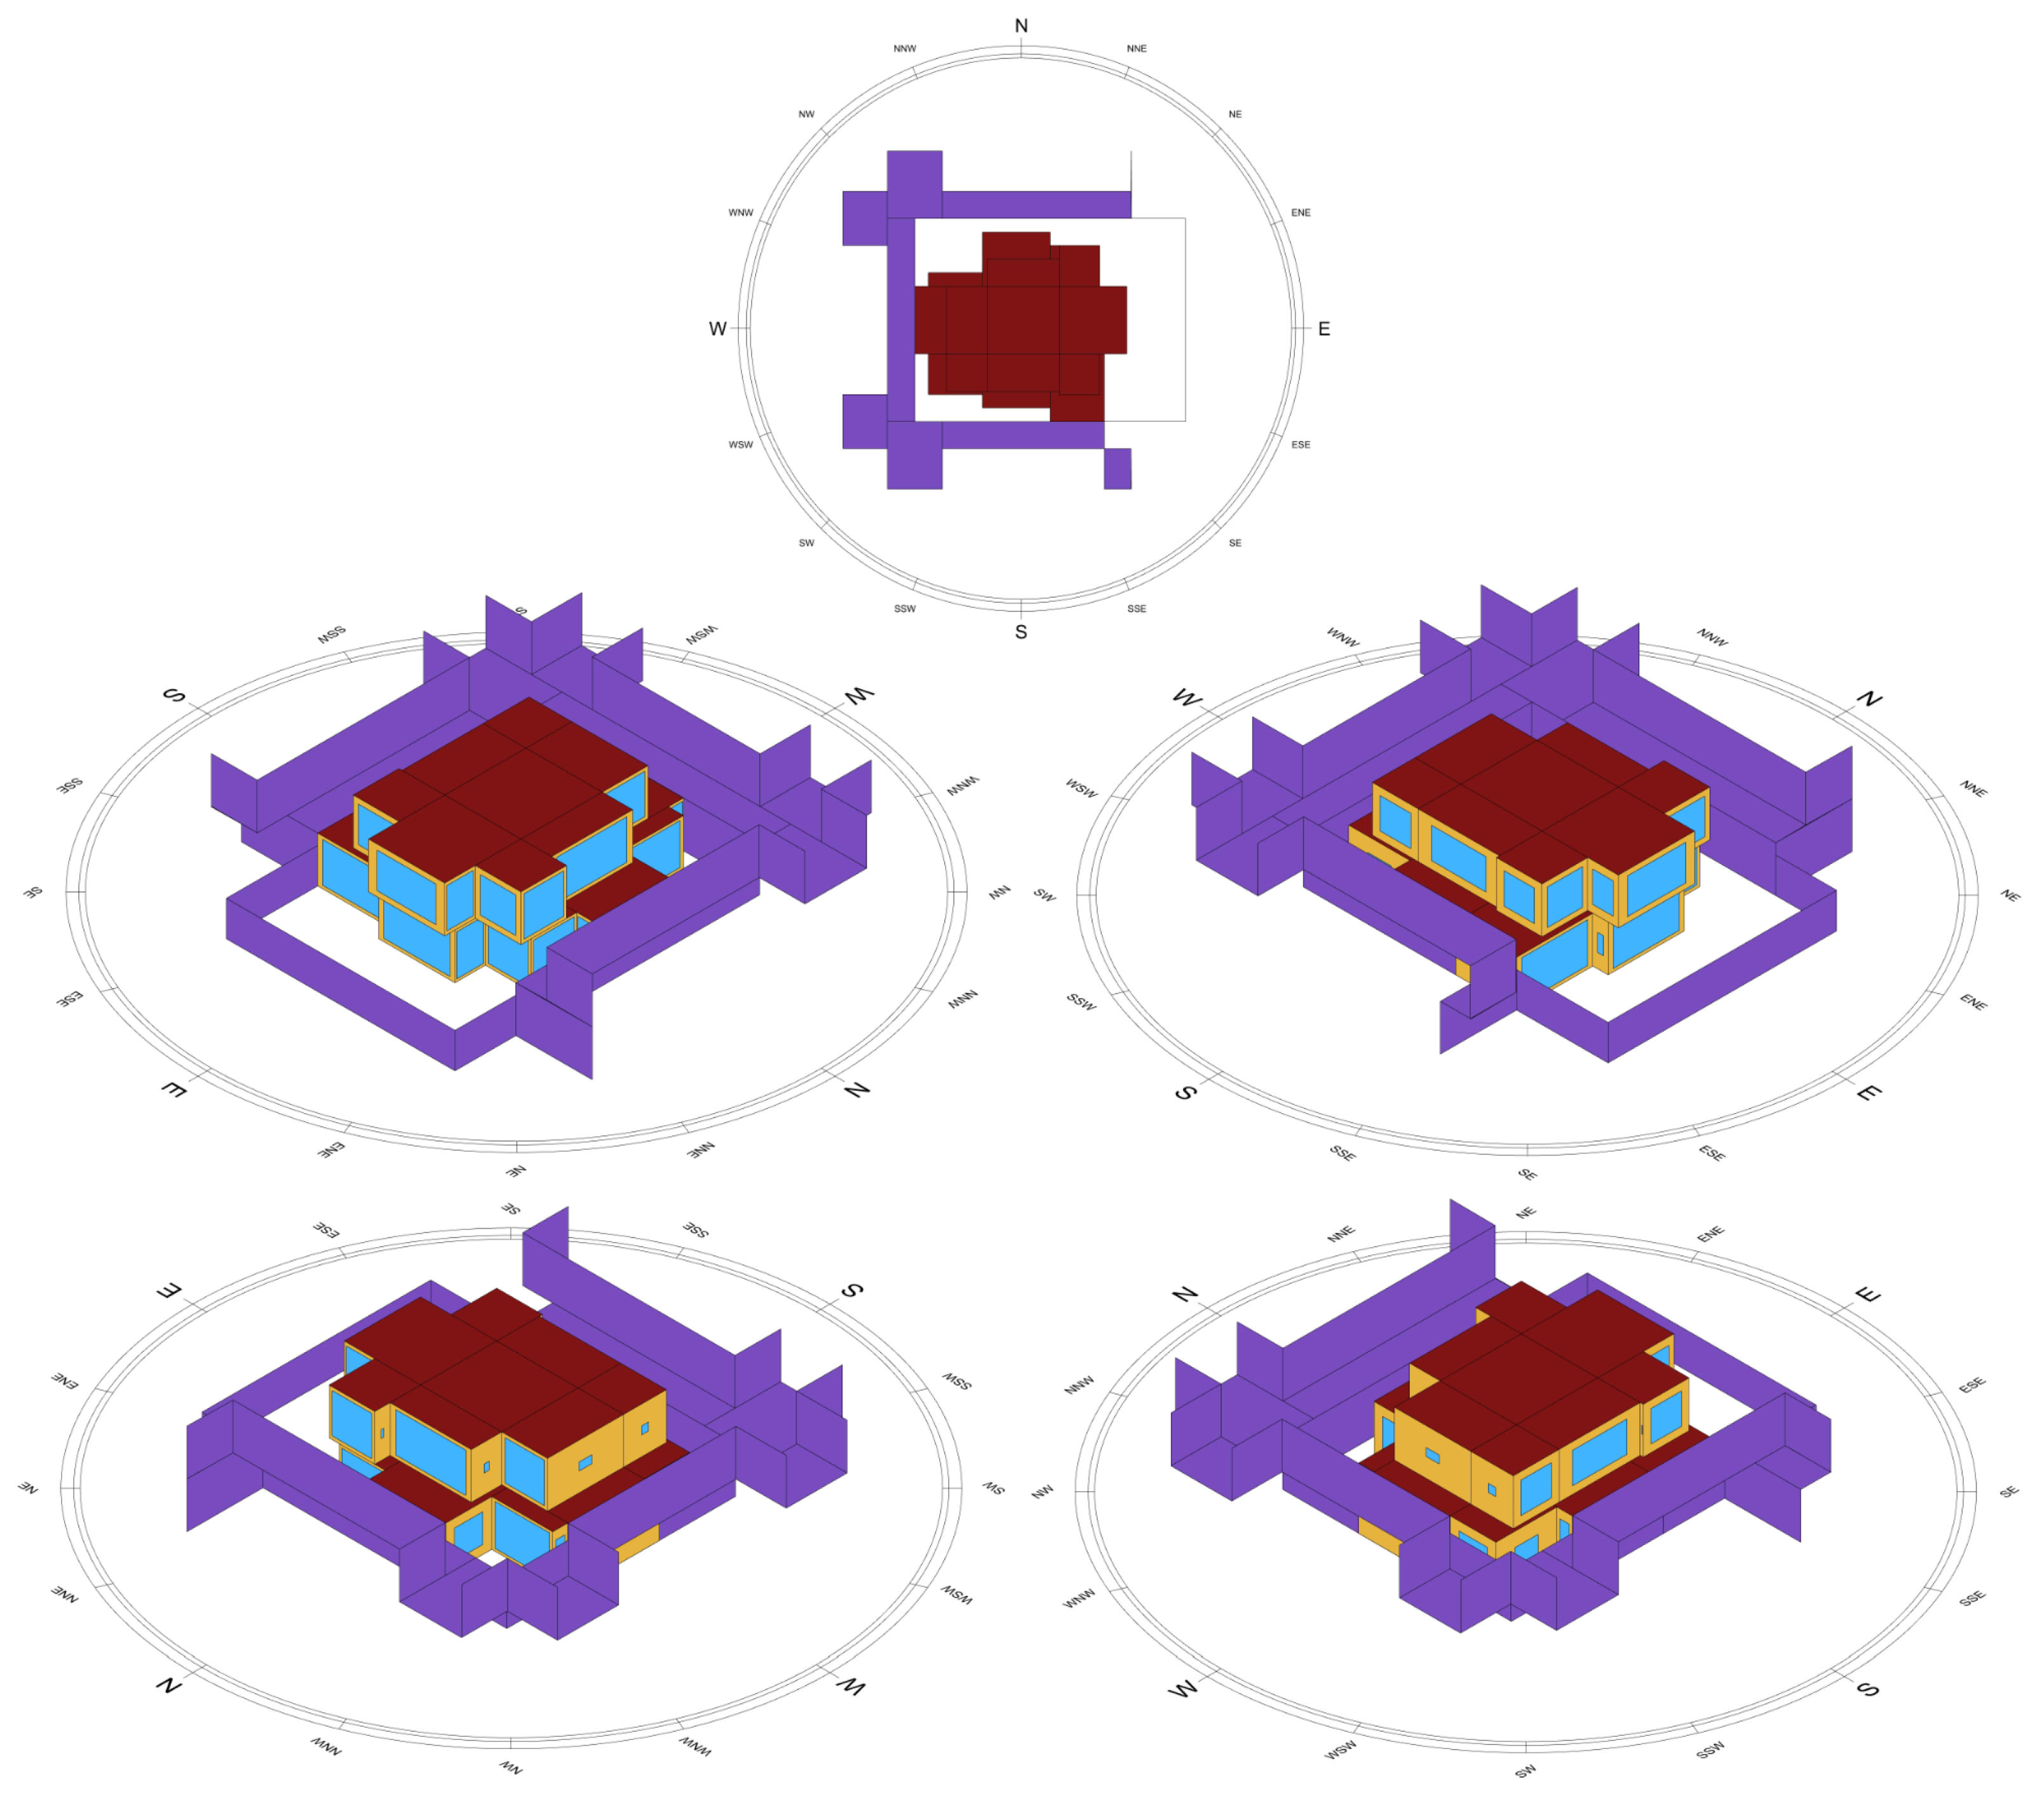
The first representative configuration, represented by G74-I2 (Figure 8), achieved the lowest operational energy among the Pareto solutions, with a total operational demand of 76,406 kWh and an embodied impact of 303,751 kg CO2eq. The second representative configuration, represented by G86-I40 (Figure 9), achieved the lowest embodied impact, with 299,966 kg CO2eq, but at the cost of higher operational energy, reaching 81,729 kWh. The relative spread between the two configurations was therefore much greater in operational performance than in embodied impact.
Figure 8.
Selected lower-operational representative configuration identified after area and WWR filtering, Pareto analysis, and duplicate removal. The configuration is not presented as a universal best solution, but as one of two unique representative configurations used to interpret the operational energy and A1–A3 embodied-impact trade-off within the modeled design space. Dark red represents roof surfaces, yellow indicates opaque exterior walls, blue represents glazing, and purple indicates the surrounding boundary and contextual geometry.
Figure 9.
Selected lower-A1–A3 embodied-impact representative configuration identified after area and WWR filtering, Pareto analysis, and duplicate removal. The configuration is not presented as a universal best solution, but as one of two unique representative configurations used to interpret the operational energy and A1–A3 embodied-impact trade-off within the modeled design space. Dark red represents roof surfaces, yellow indicates opaque exterior walls, blue represents glazing, and purple indicates the surrounding boundary and contextual geometry.
These results show that the Pareto front in this study is best understood not as a large set of continuously distinct solutions, but as two representative architectural configurations that define the main life-cycle trade-off within the filtered design space.
4.3. Operational Energy Behavior
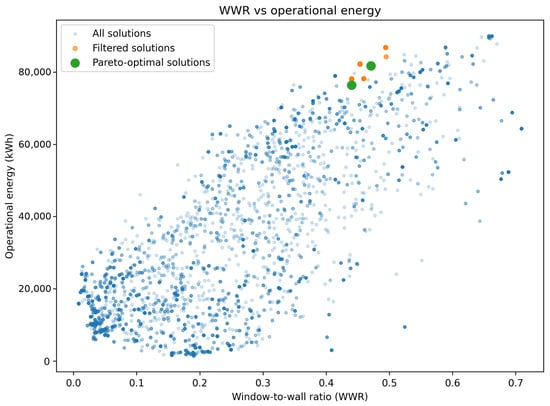
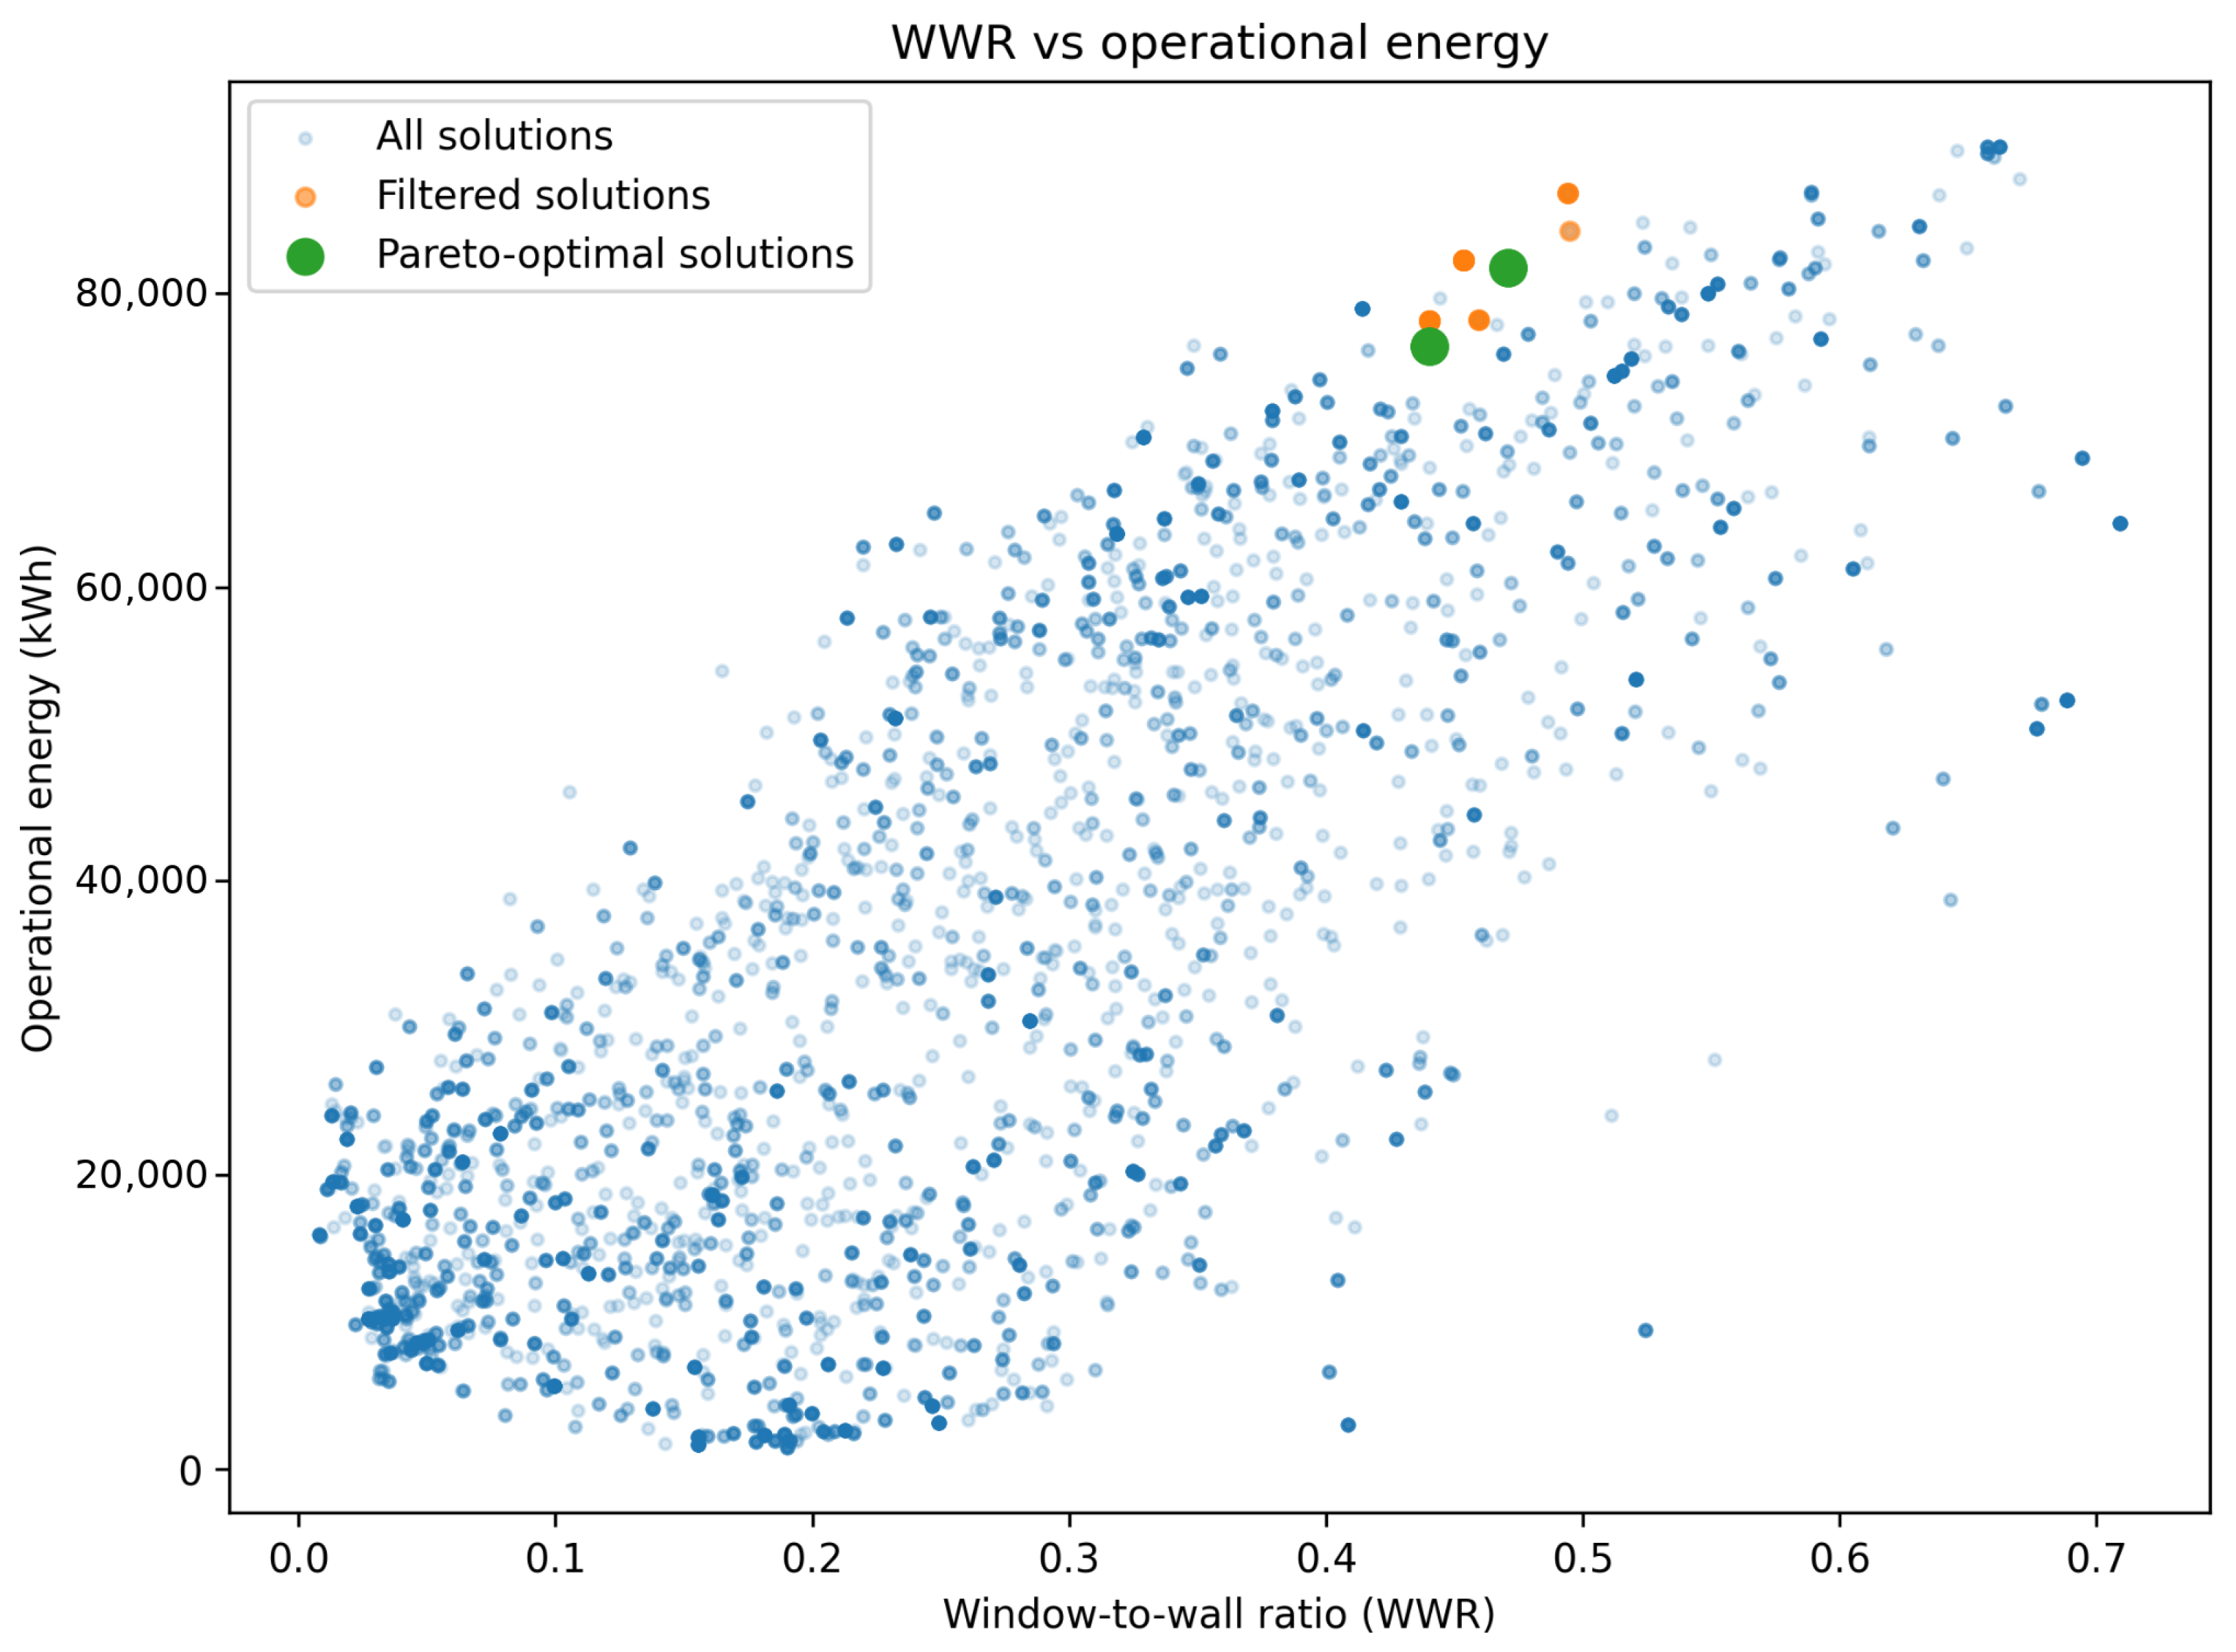
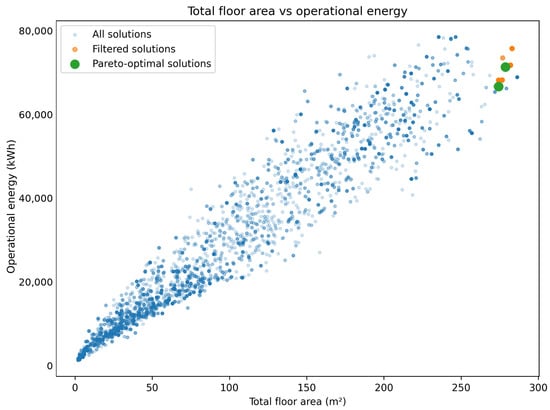
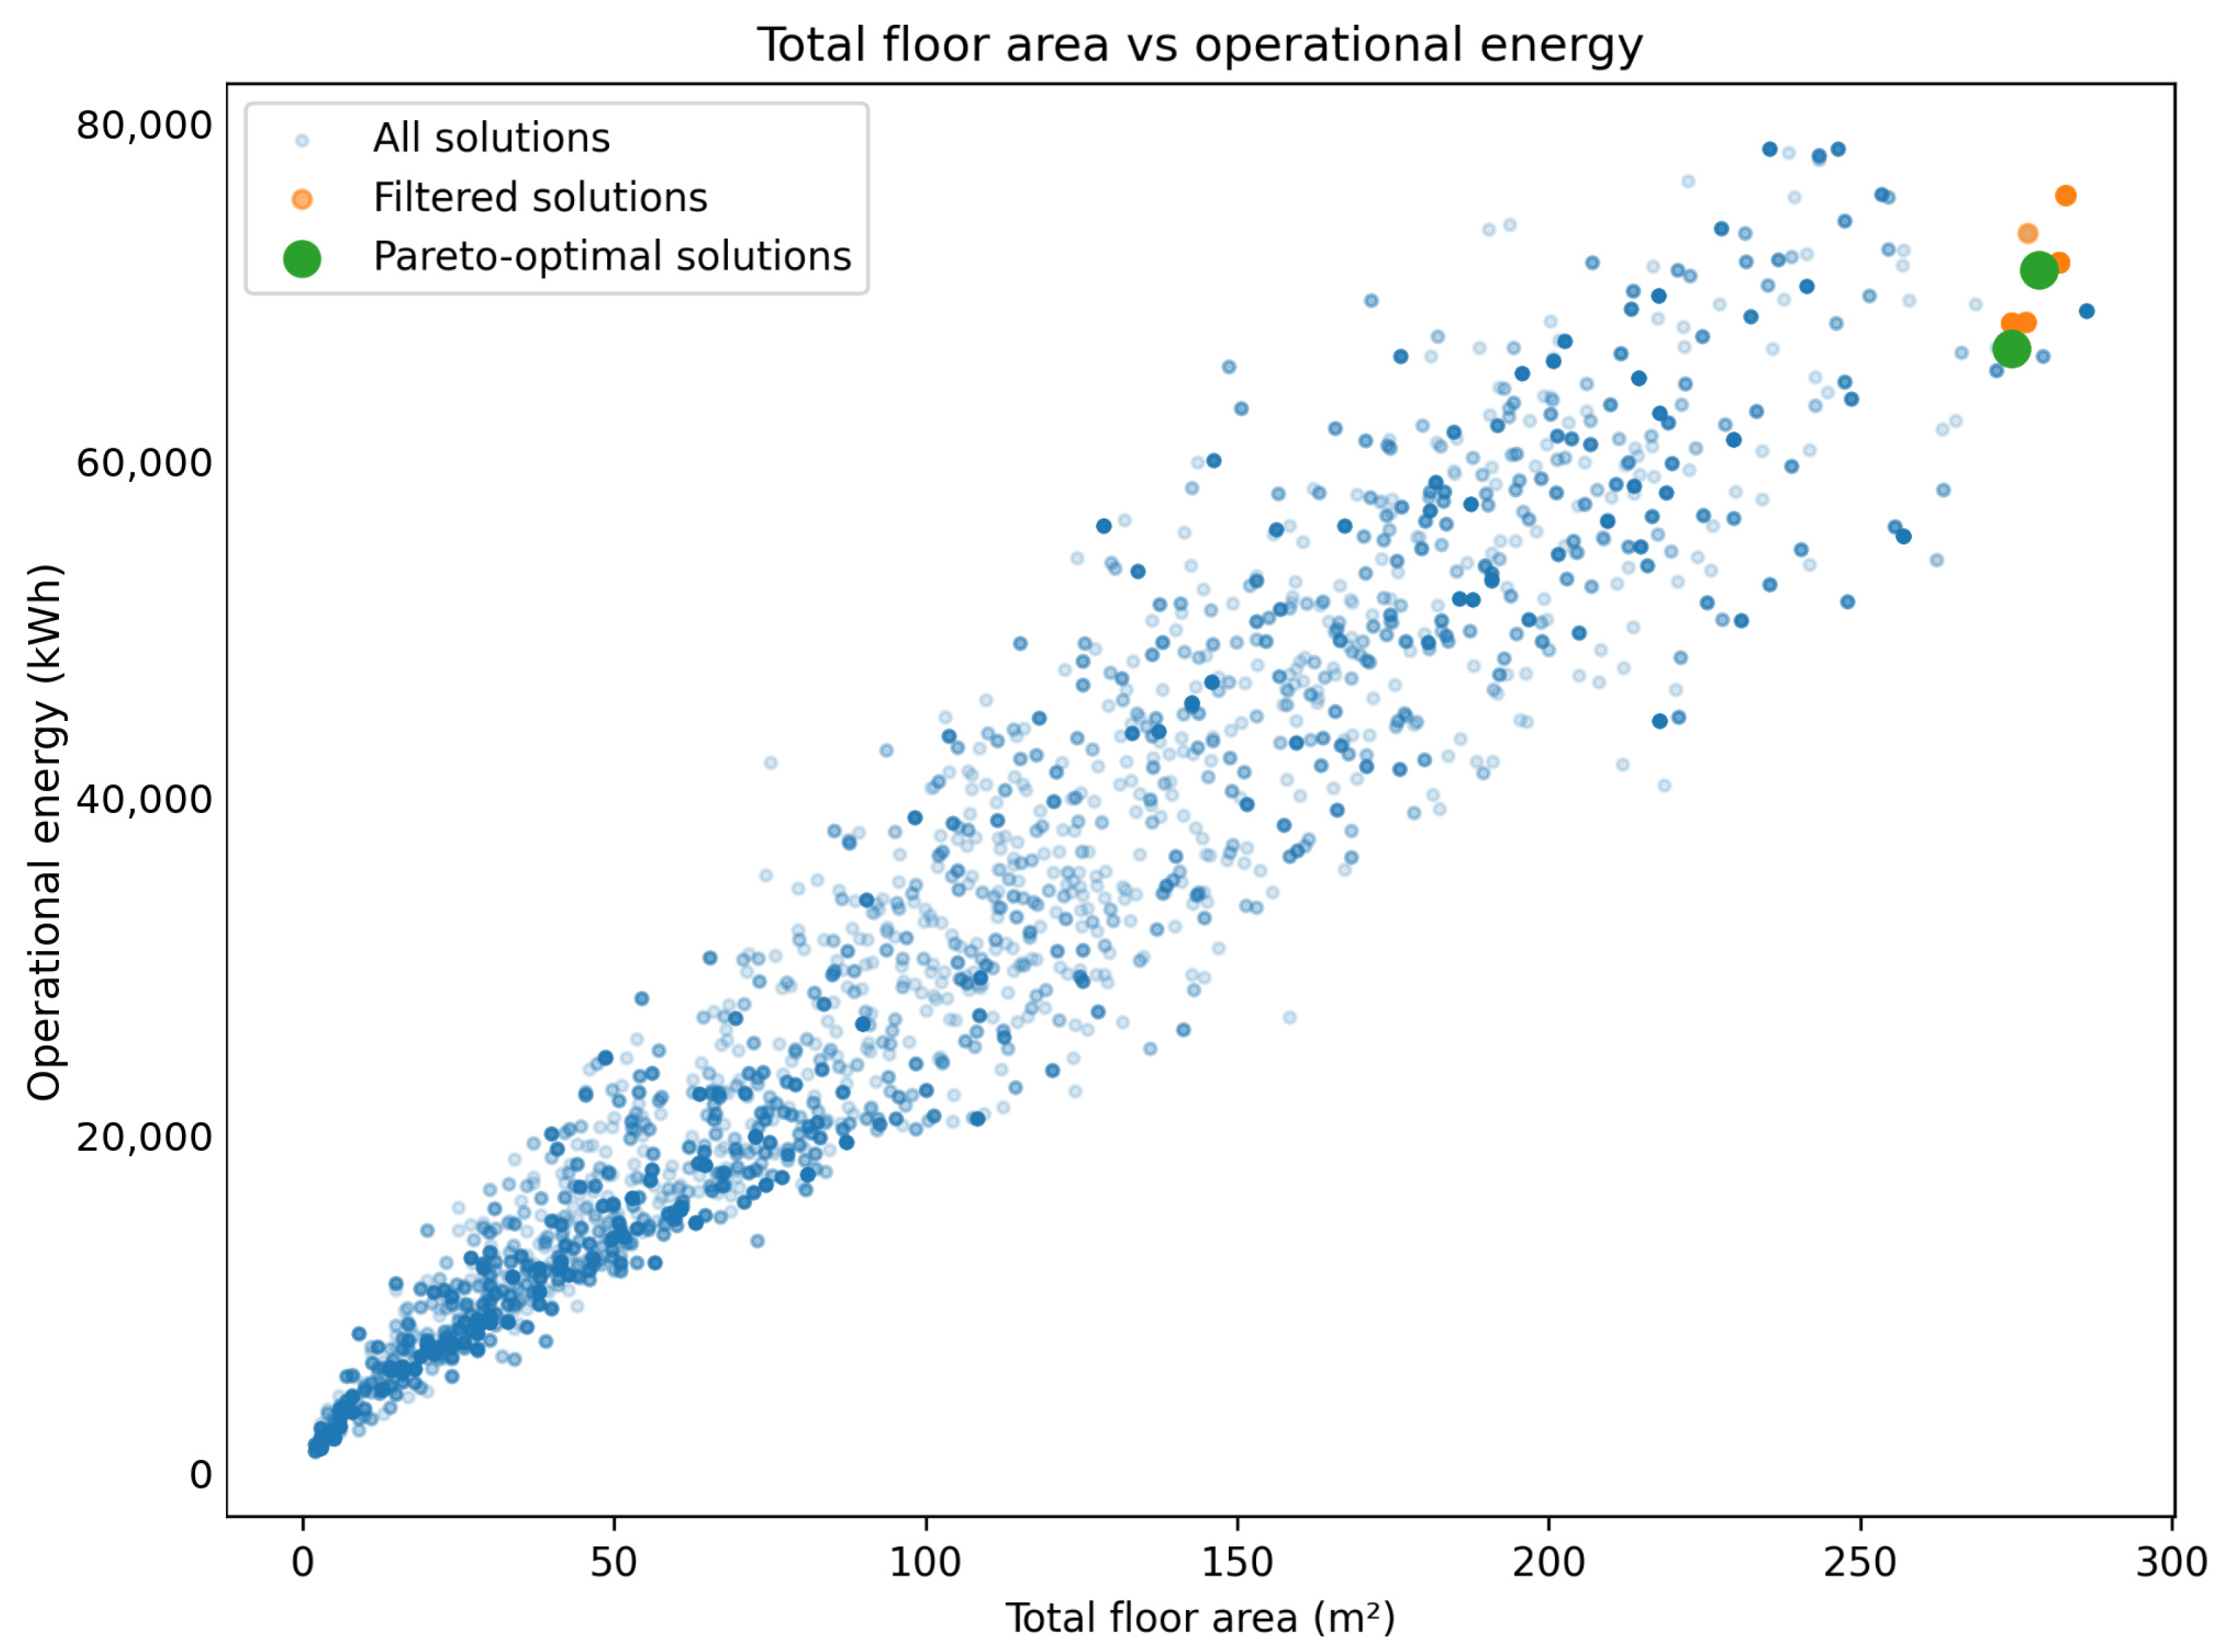
The relationship between WWR and operational energy for the full, filtered, and Pareto subsets is shown in Figure 10, while the relationship between total floor area and operational energy is presented in Figure 11. Across the full dataset, operational energy generally increased with total area, as expected; however, the substantial vertical spread in Figure 11 indicates that area alone did not determine operational performance. Instead, façade openness and envelope configuration played a significant role.
Figure 10.
Relationship between window-to-wall ratio and operational energy for the full, filtered, and Pareto-optimal solution sets. Blue circles represent all generated solutions, orange circles identify the filtered solutions, and green circles indicate Pareto-optimal solutions. Differences in blue intensity arise from marker transparency and overlapping points and do not represent additional variables or categories.
Figure 11.
Relationship between total floor area and operational energy for the full, filtered, and Pareto-optimal solution sets. Blue circles represent all generated solutions, orange circles represent the filtered solutions, and green circles represent the Pareto-optimal solutions. Differences in blue intensity are caused by marker transparency and overlapping points and do not indicate additional variables or categories.
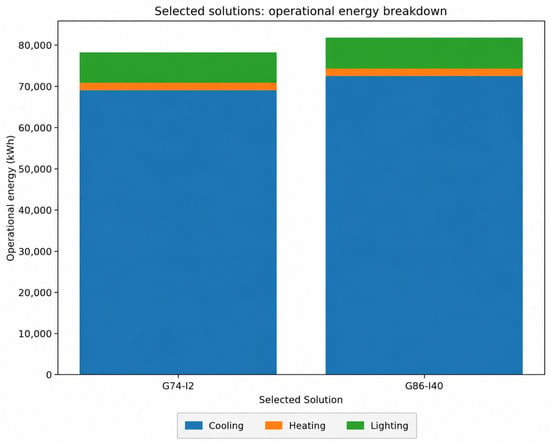
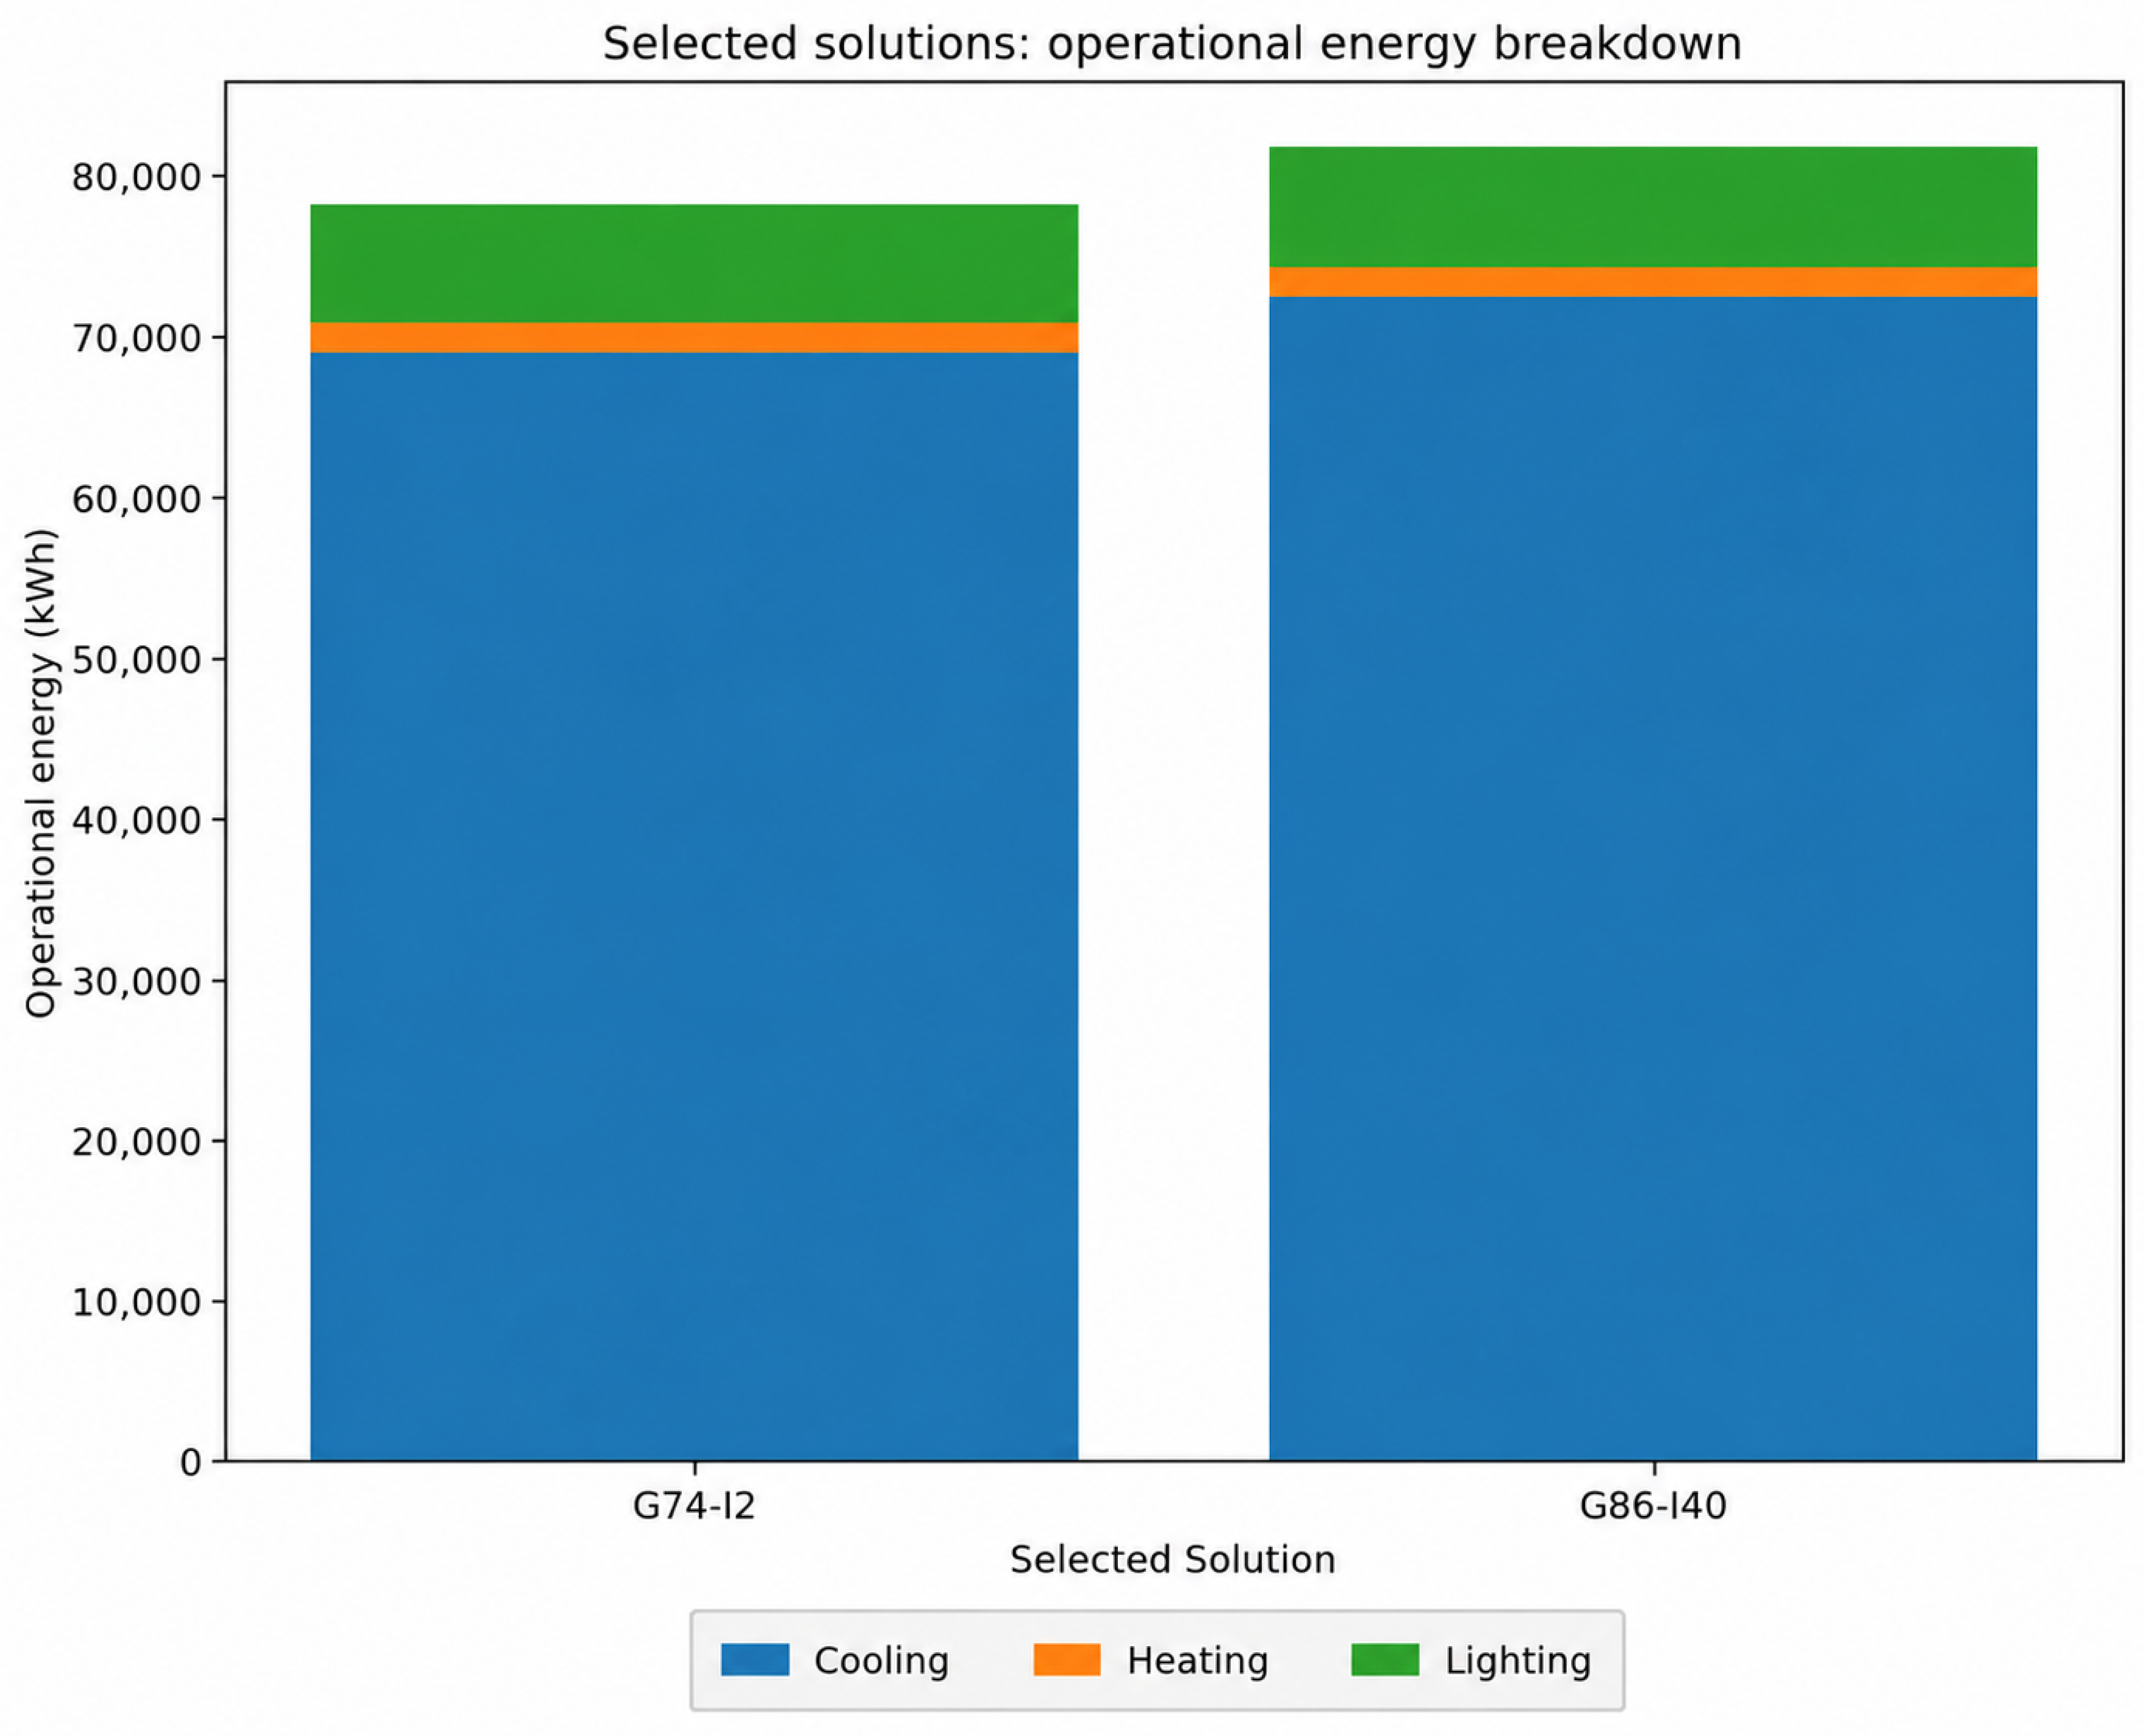
The operational energy breakdown of the two selected solutions is shown in Figure 12. In both cases, cooling demand clearly dominates annual operational energy, far exceeding both heating and lighting loads. This is consistent with the hot-arid climate of Riyadh, where cooling performance is the primary driver of annual building energy use. The lower-operational group (G74-I2) achieved better performance mainly through reduced cooling demand, while heating and lighting differences remained comparatively small.
Figure 12.
Cooling, heating, and lighting energy breakdown for the two selected representative solutions.
4.4. Envelope Characteristics of the Selected Solutions
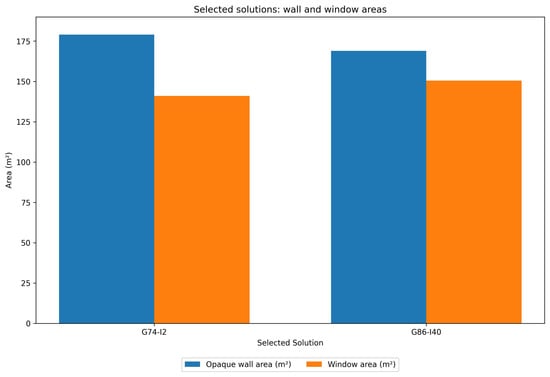
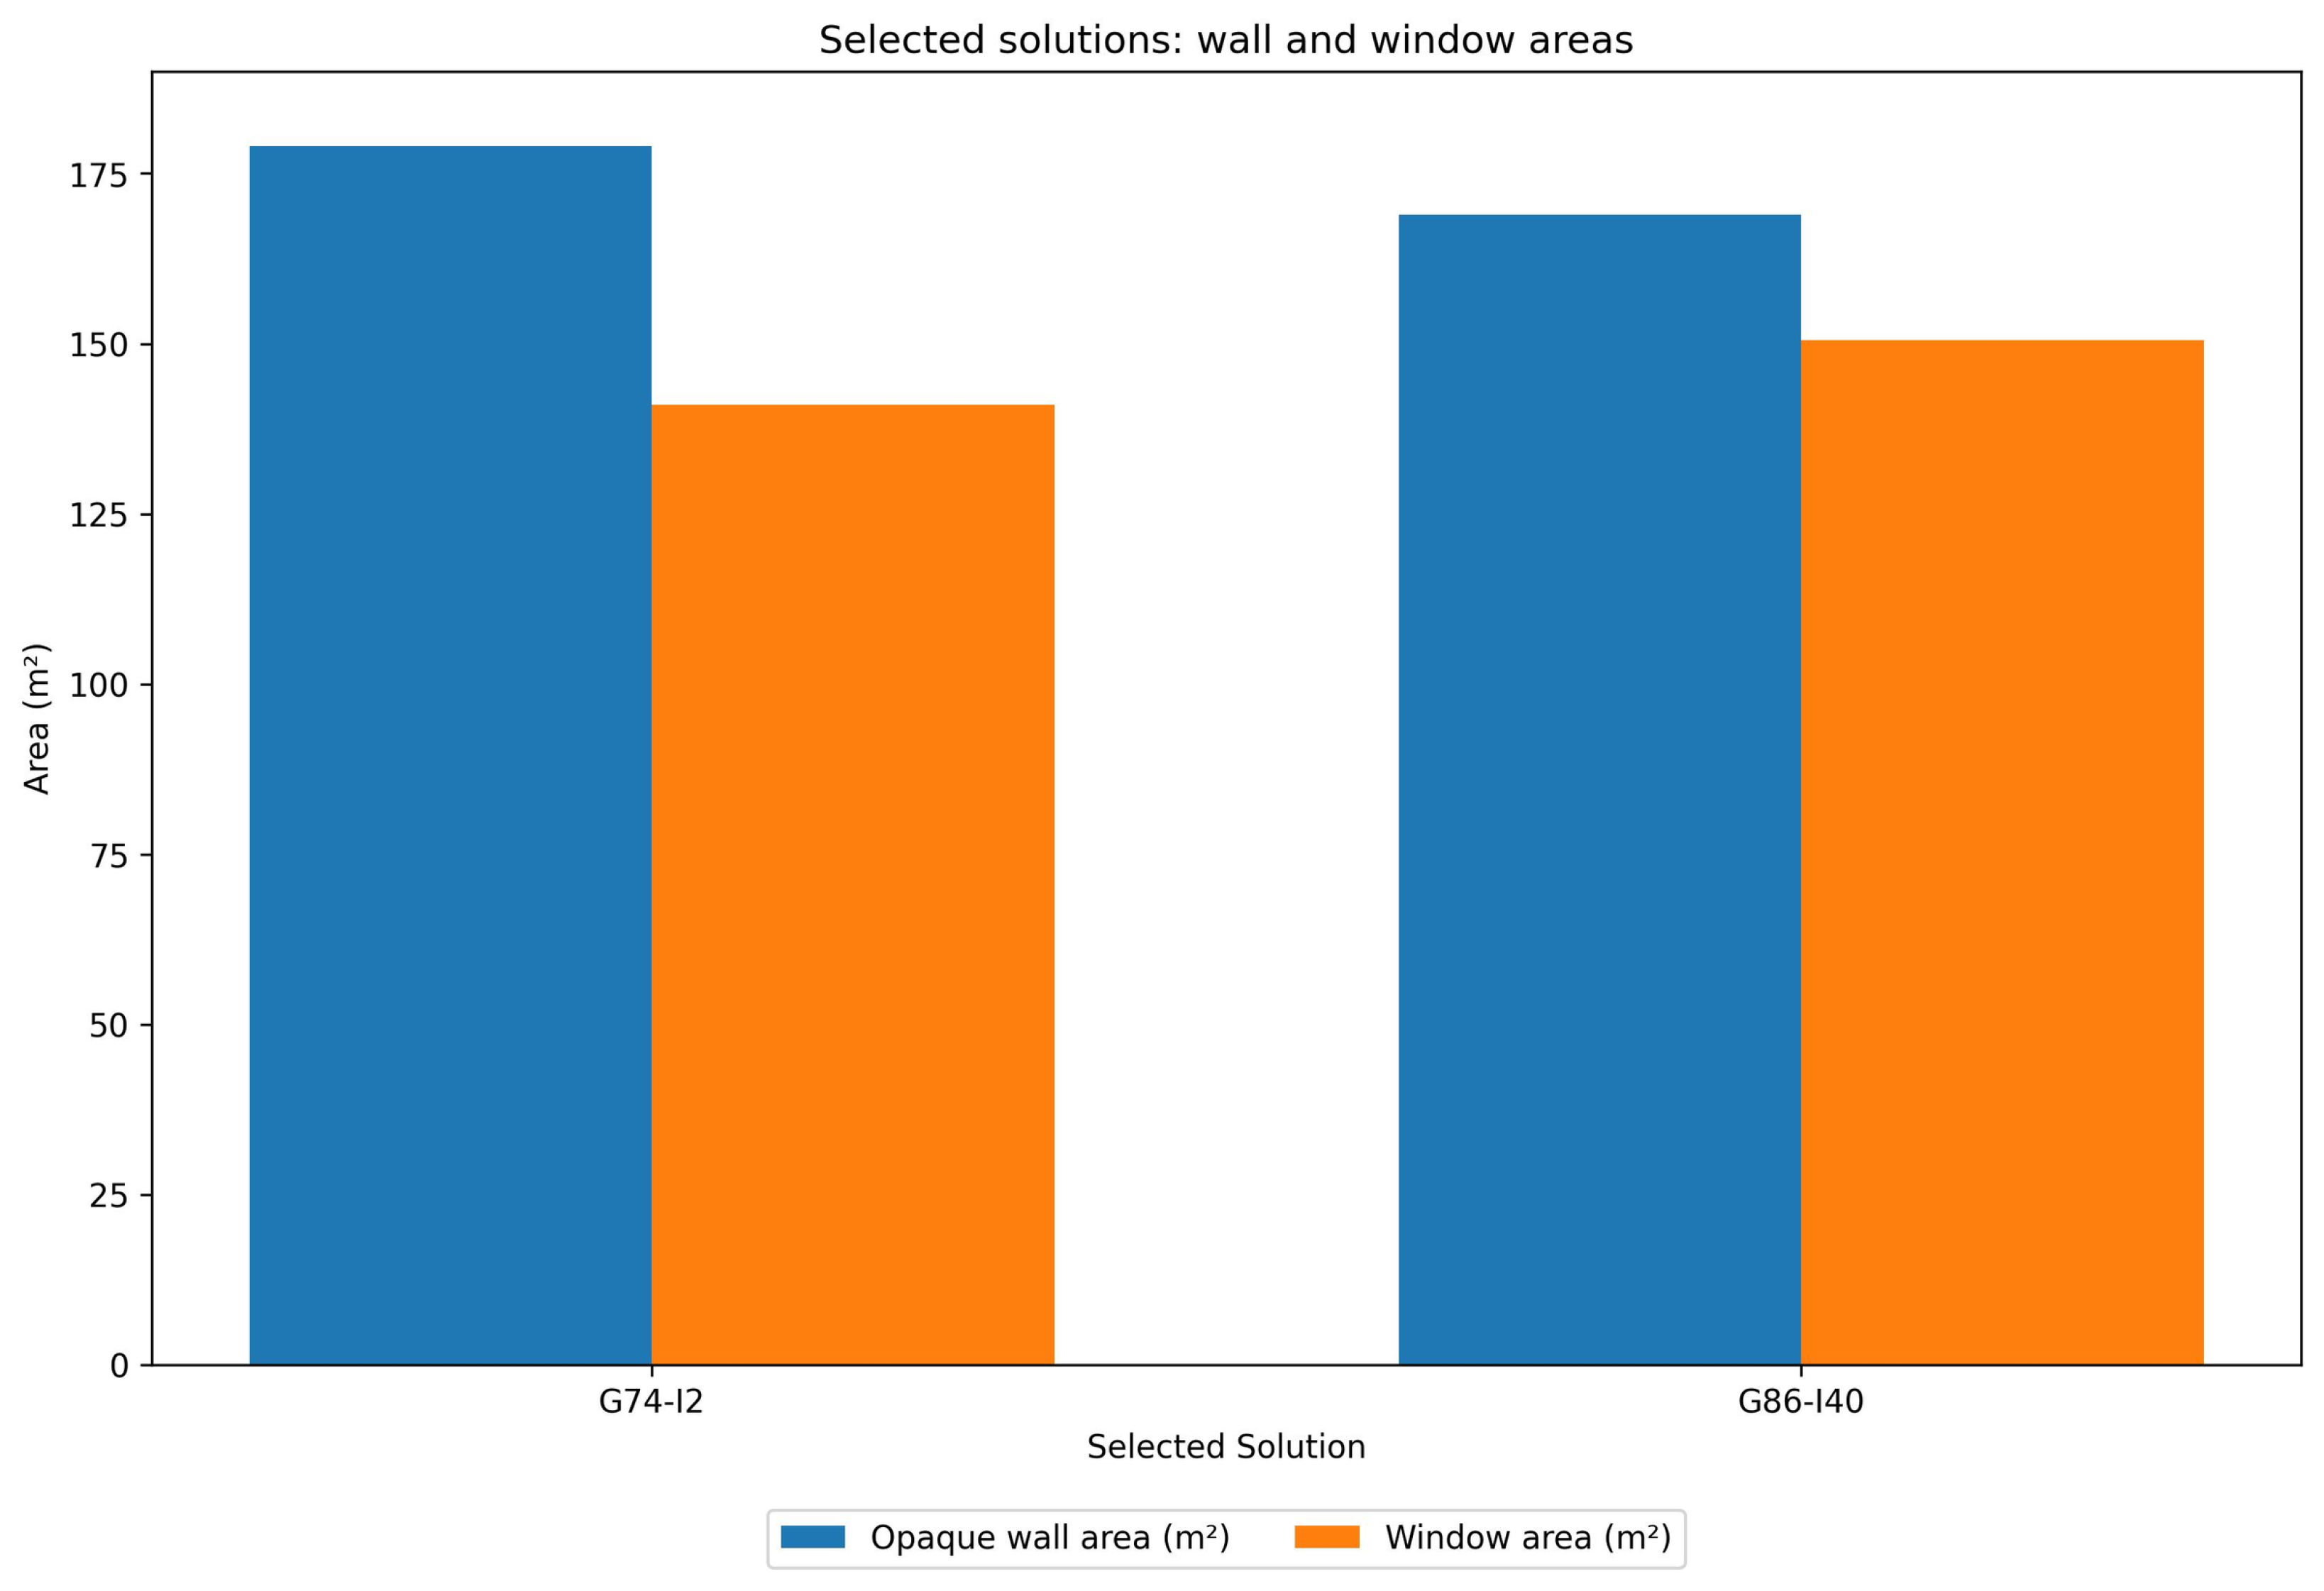
The envelope characteristics of the two selected solutions are compared in Figure 13. Although both solutions employed the same wall system (EIFS), the same window system (single glazing), and the same orientation, they differed in their architectural and geometrical configuration. These design differences produced distinct façade compositions, reflected in the distribution of opaque wall area and total window area. Accordingly, the performance variation between the two cases cannot be attributed to changes in azimuth or material substitution, but rather to differences in architectural form and façade organization.
Figure 13.
Comparison of opaque wall area and total window area for the two selected representative solutions.
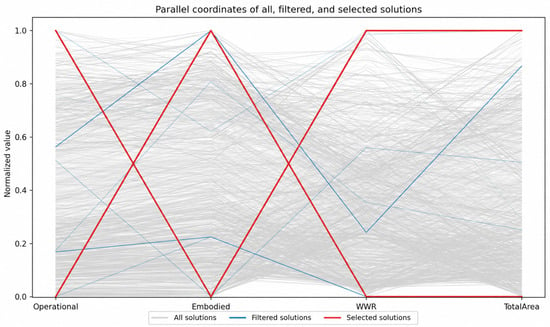
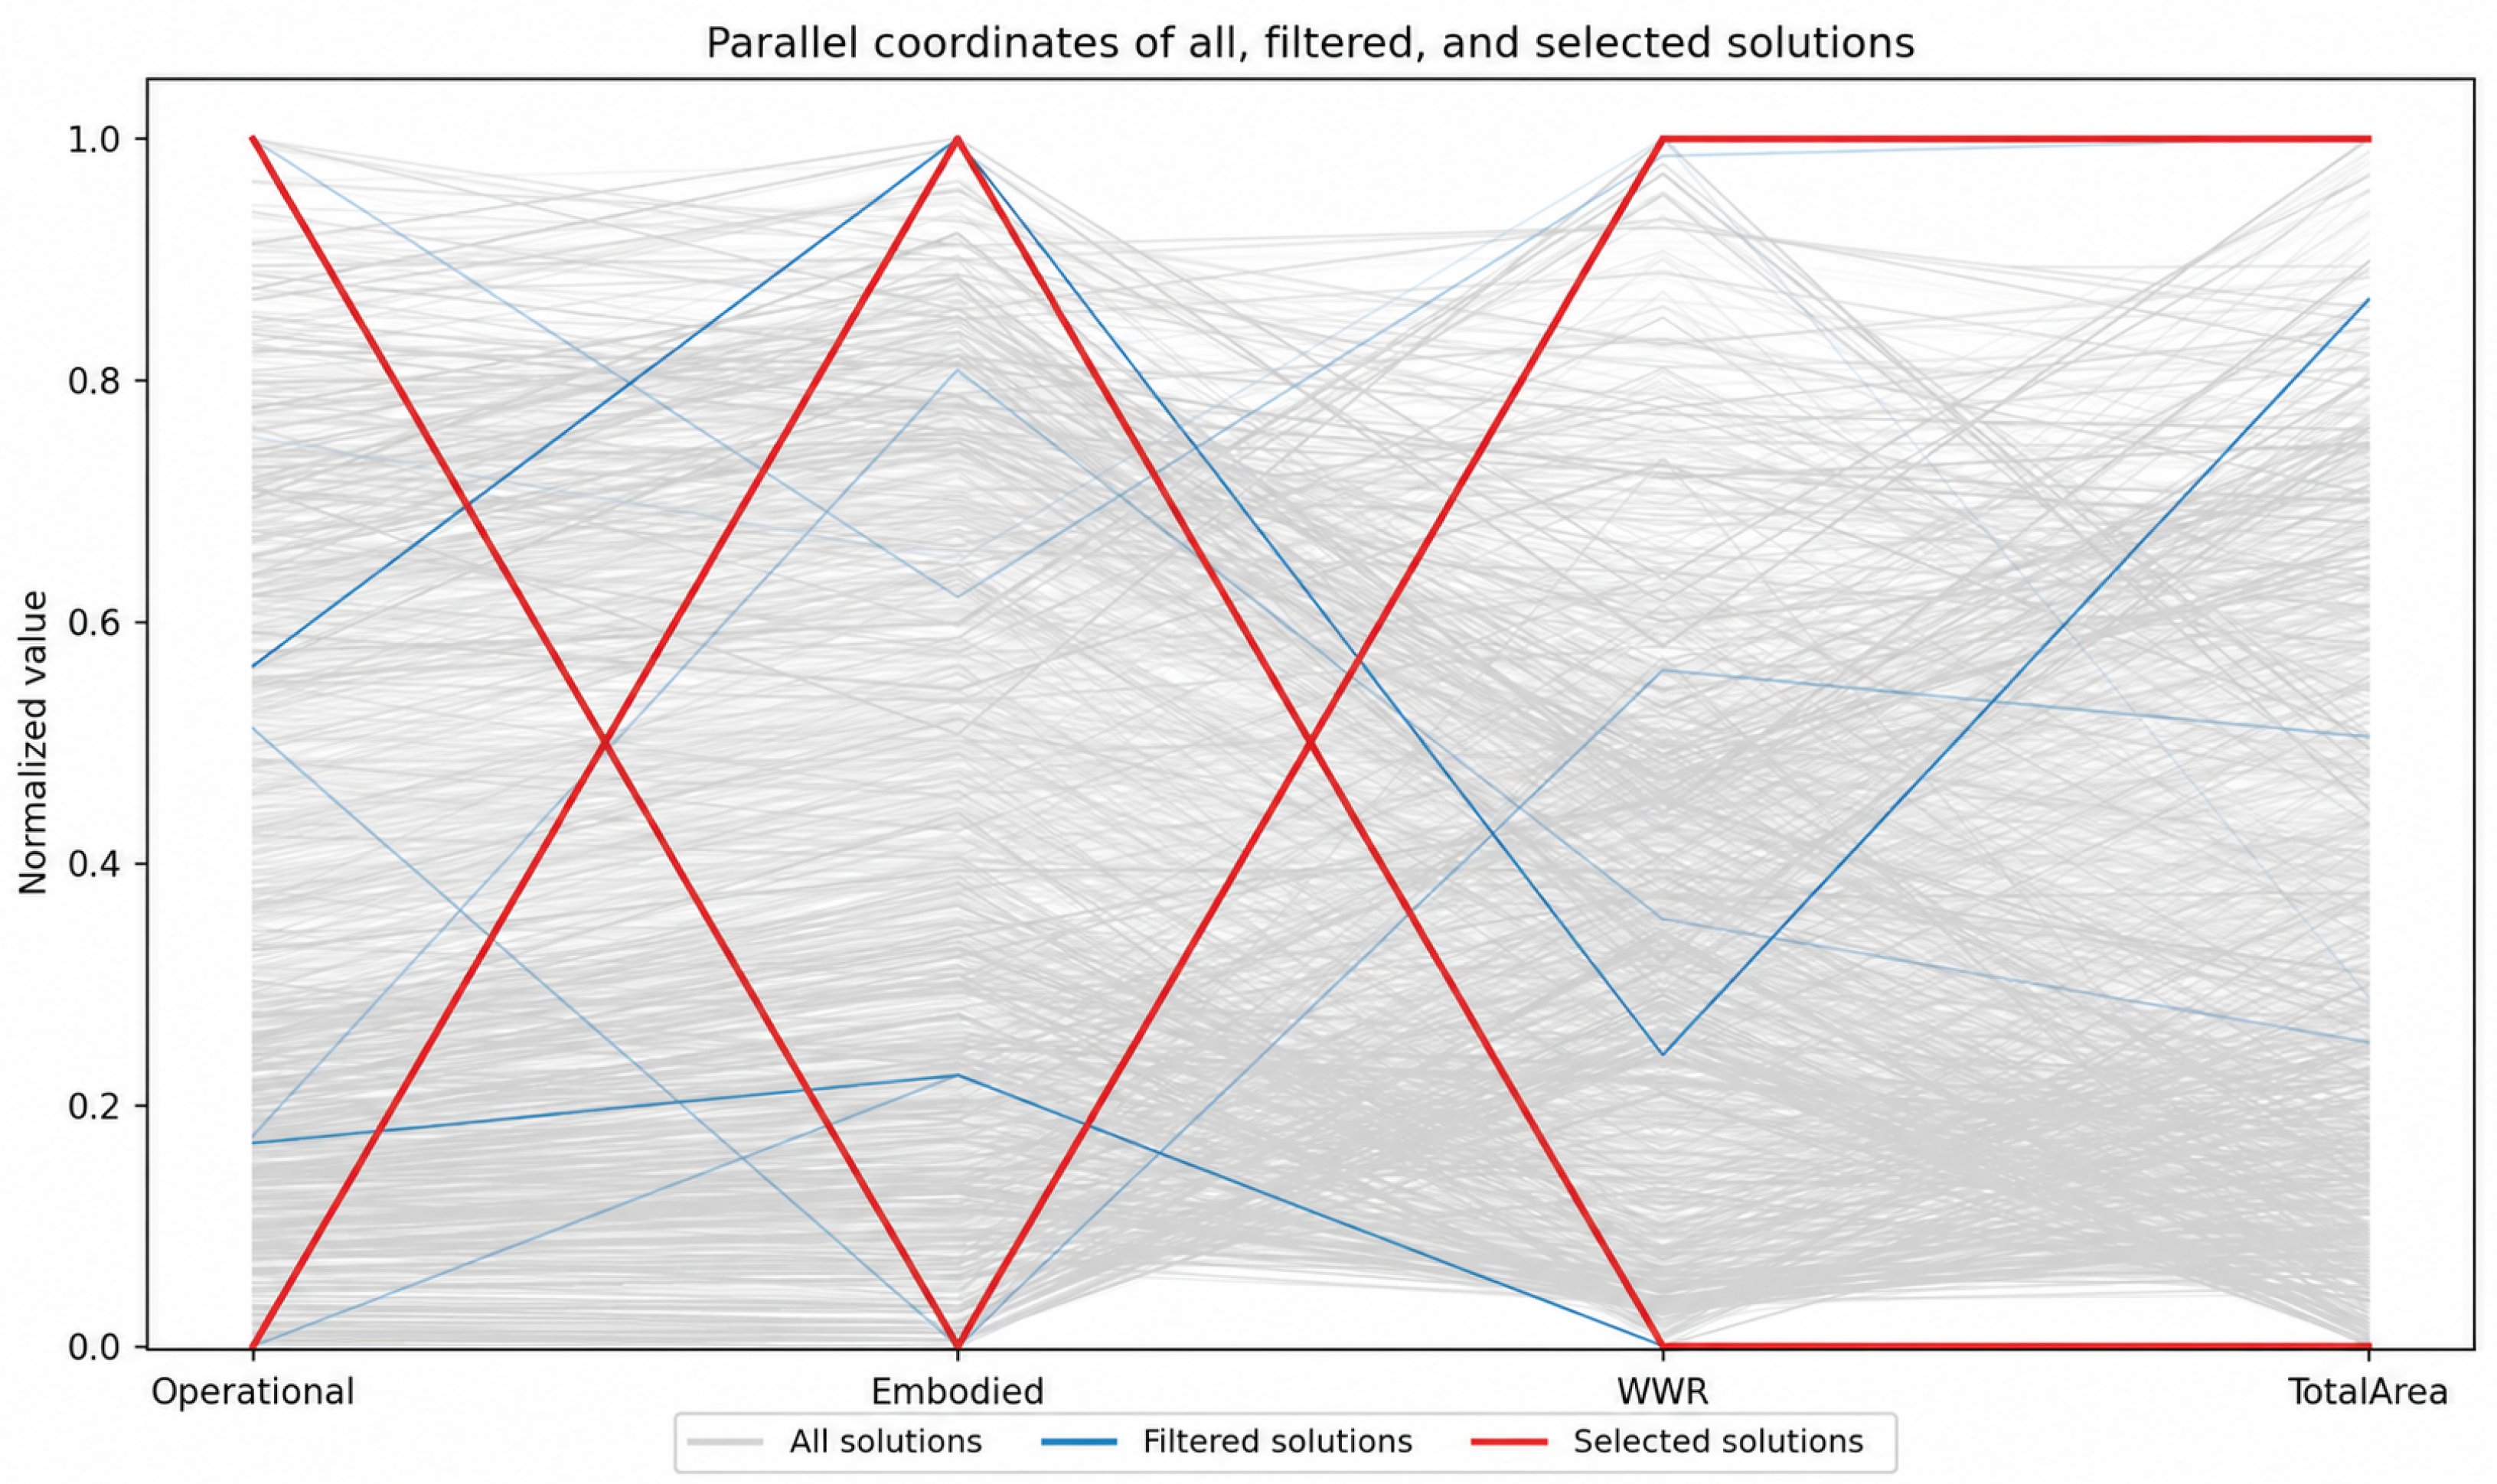
The parallel-coordinates plot in Figure 14 situates the selected solutions within the broader relationship among the full, filtered, and representative subsets. The selected solutions occupy the upper end of total floor area and WWR while remaining distinct in their operational and embodied trade-offs. This suggests that the selected configurations were not arbitrary outliers, but representative responses within the modeled and filtered design space.
Figure 14.
Parallel-coordinates plot of all, filtered, and selected solutions across operational energy, embodied impact, WWR, and total floor area.
4.5. Embodied Impact Behavior
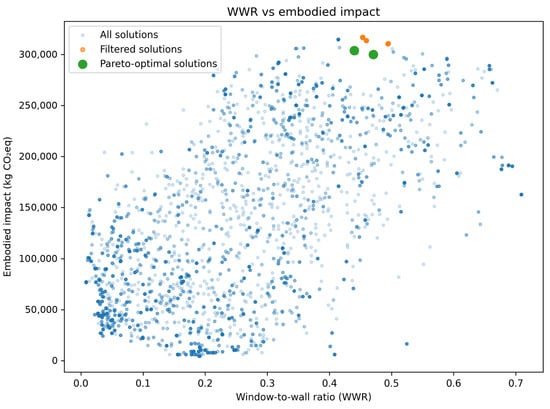
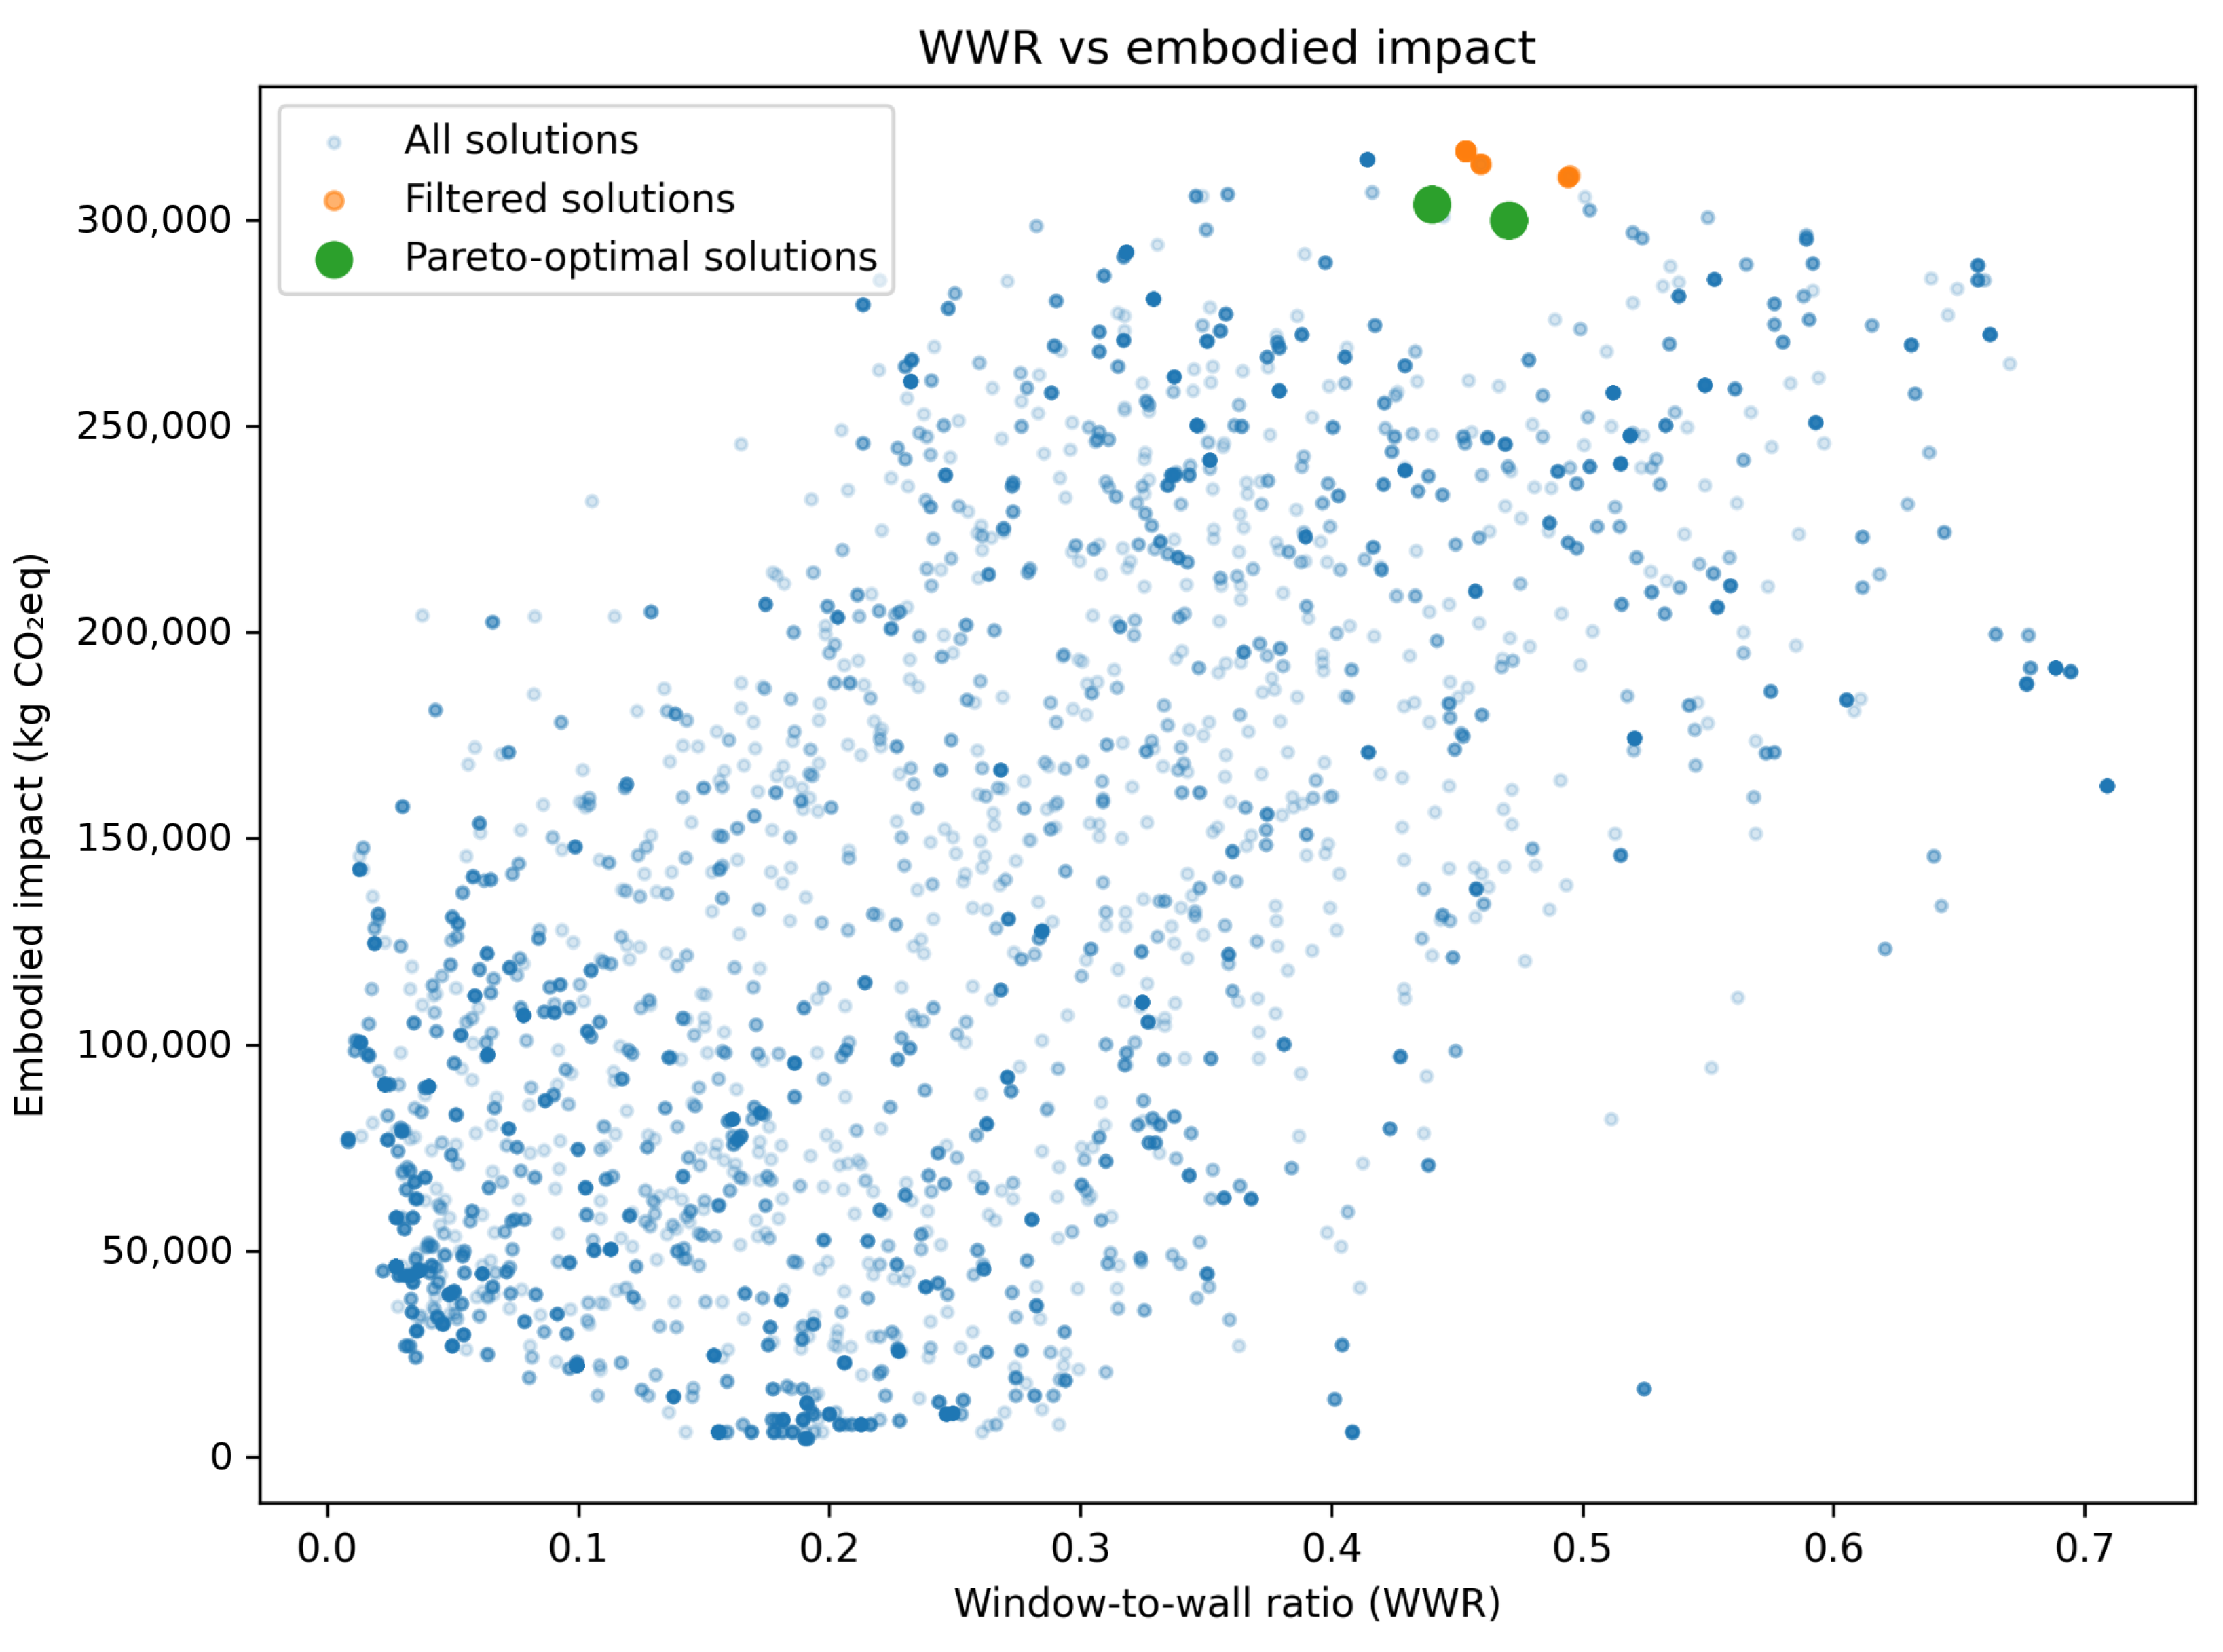
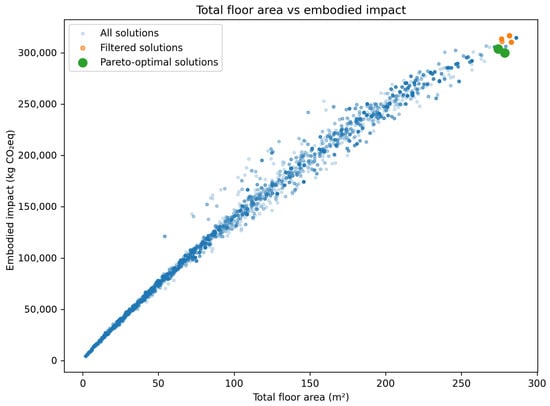
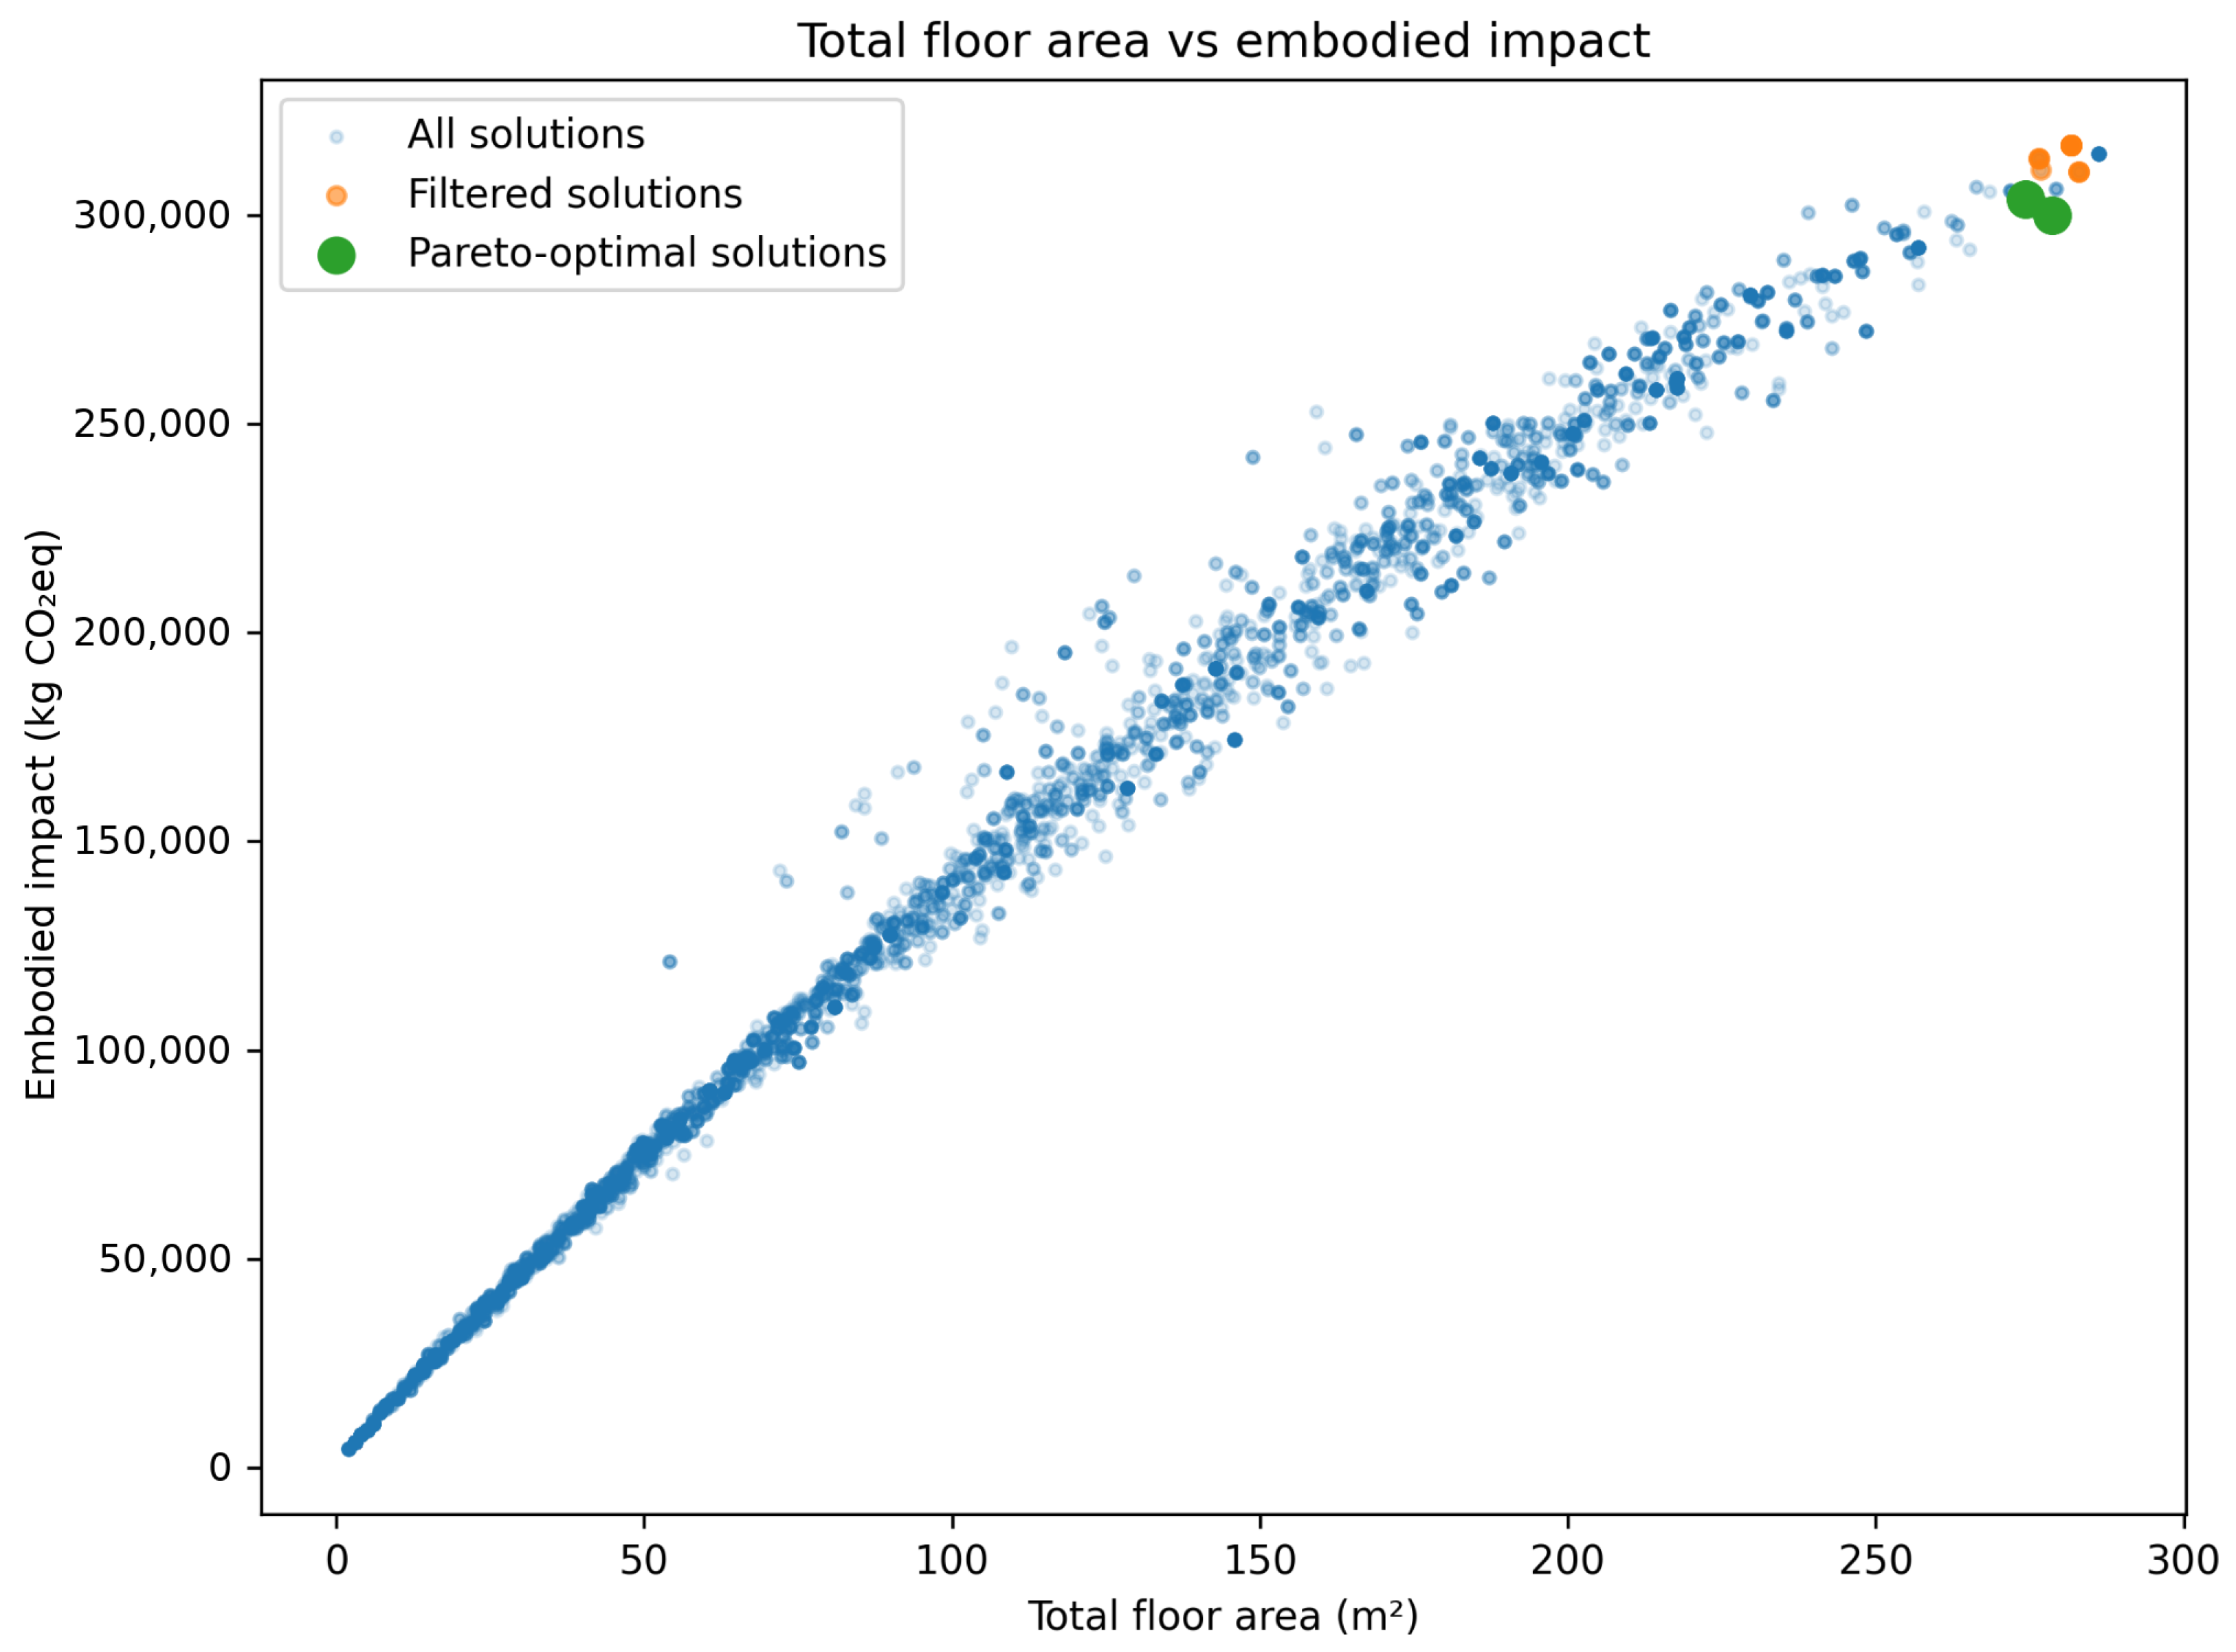
The relationship between WWR and embodied impact is shown in Figure 15, while Figure 16 presents the relationship between total floor area and embodied impact. In contrast to operational energy, embodied impact followed a much more regular pattern with respect to total floor area, approaching an almost linear increase across the complete solution space. This relationship was quantified using a simple linear regression between total floor area and A1–A3 embodied impact across the 5000 generated solutions. The result showed a strong linear association, with total floor area explaining approximately 98.6% of the variation in embodied impact (R2 = 0.986). After controlling for total floor area, adding WWR did not meaningfully improve the explanatory power of the model, with the combined area-and-WWR regression also producing an R2 of approximately 0.986. This indicates that the apparent linear pattern in Figure 16 is primarily driven by total constructed area rather than by WWR. However, this relationship should not be interpreted only as an emergent optimization outcome. It is also partly imposed by the modeling structure, because floor and roof assemblies were fixed across alternatives and their quantities increased directly with total floor area, while the variable wall and window assemblies had a narrower range of A1–A3 GWP values. Therefore, the near-linear embodied-impact pattern reflects both the optimization-generated variation in building size and the structural influence of the selected assembly definitions.
Figure 15.
Relationship between window-to-wall ratio (WWR) and A1–A3 embodied impact for the full, filtered, and Pareto-optimal solution sets. The association was quantified across the full 5000-solution dataset using simple linear regression (R2 = 0.392), indicating that WWR alone had a moderate relationship with embodied impact, mainly through its association with geometry and constructed area. Blue circles represent all generated solutions, orange circles represent filtered solutions, and green circles indicate Pareto-optimal solutions. Differences in blue intensity result from marker transparency and overlapping points and do not represent additional variables or categories.
Figure 16.
Relationship between total floor area and A1–A3 embodied impact for the full, filtered, and Pareto-optimal solution sets. The near-linear relationship was quantified across the full 5000-solution dataset using simple linear regression (R2 = 0.986). Blue circles represent all generated solutions, orange circles represent filtered solutions, and green circles indicate Pareto-optimal solutions. Differences in blue intensity result from marker transparency and overlapping points and do not represent additional variables or categories.
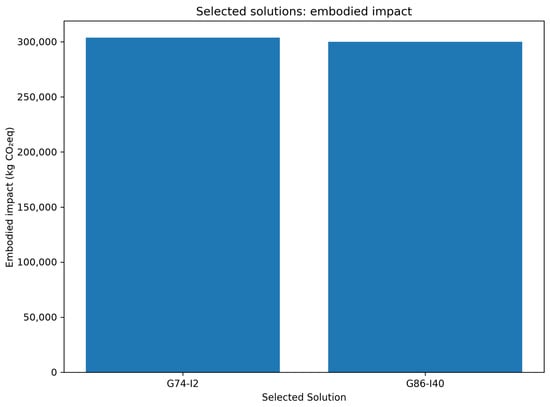
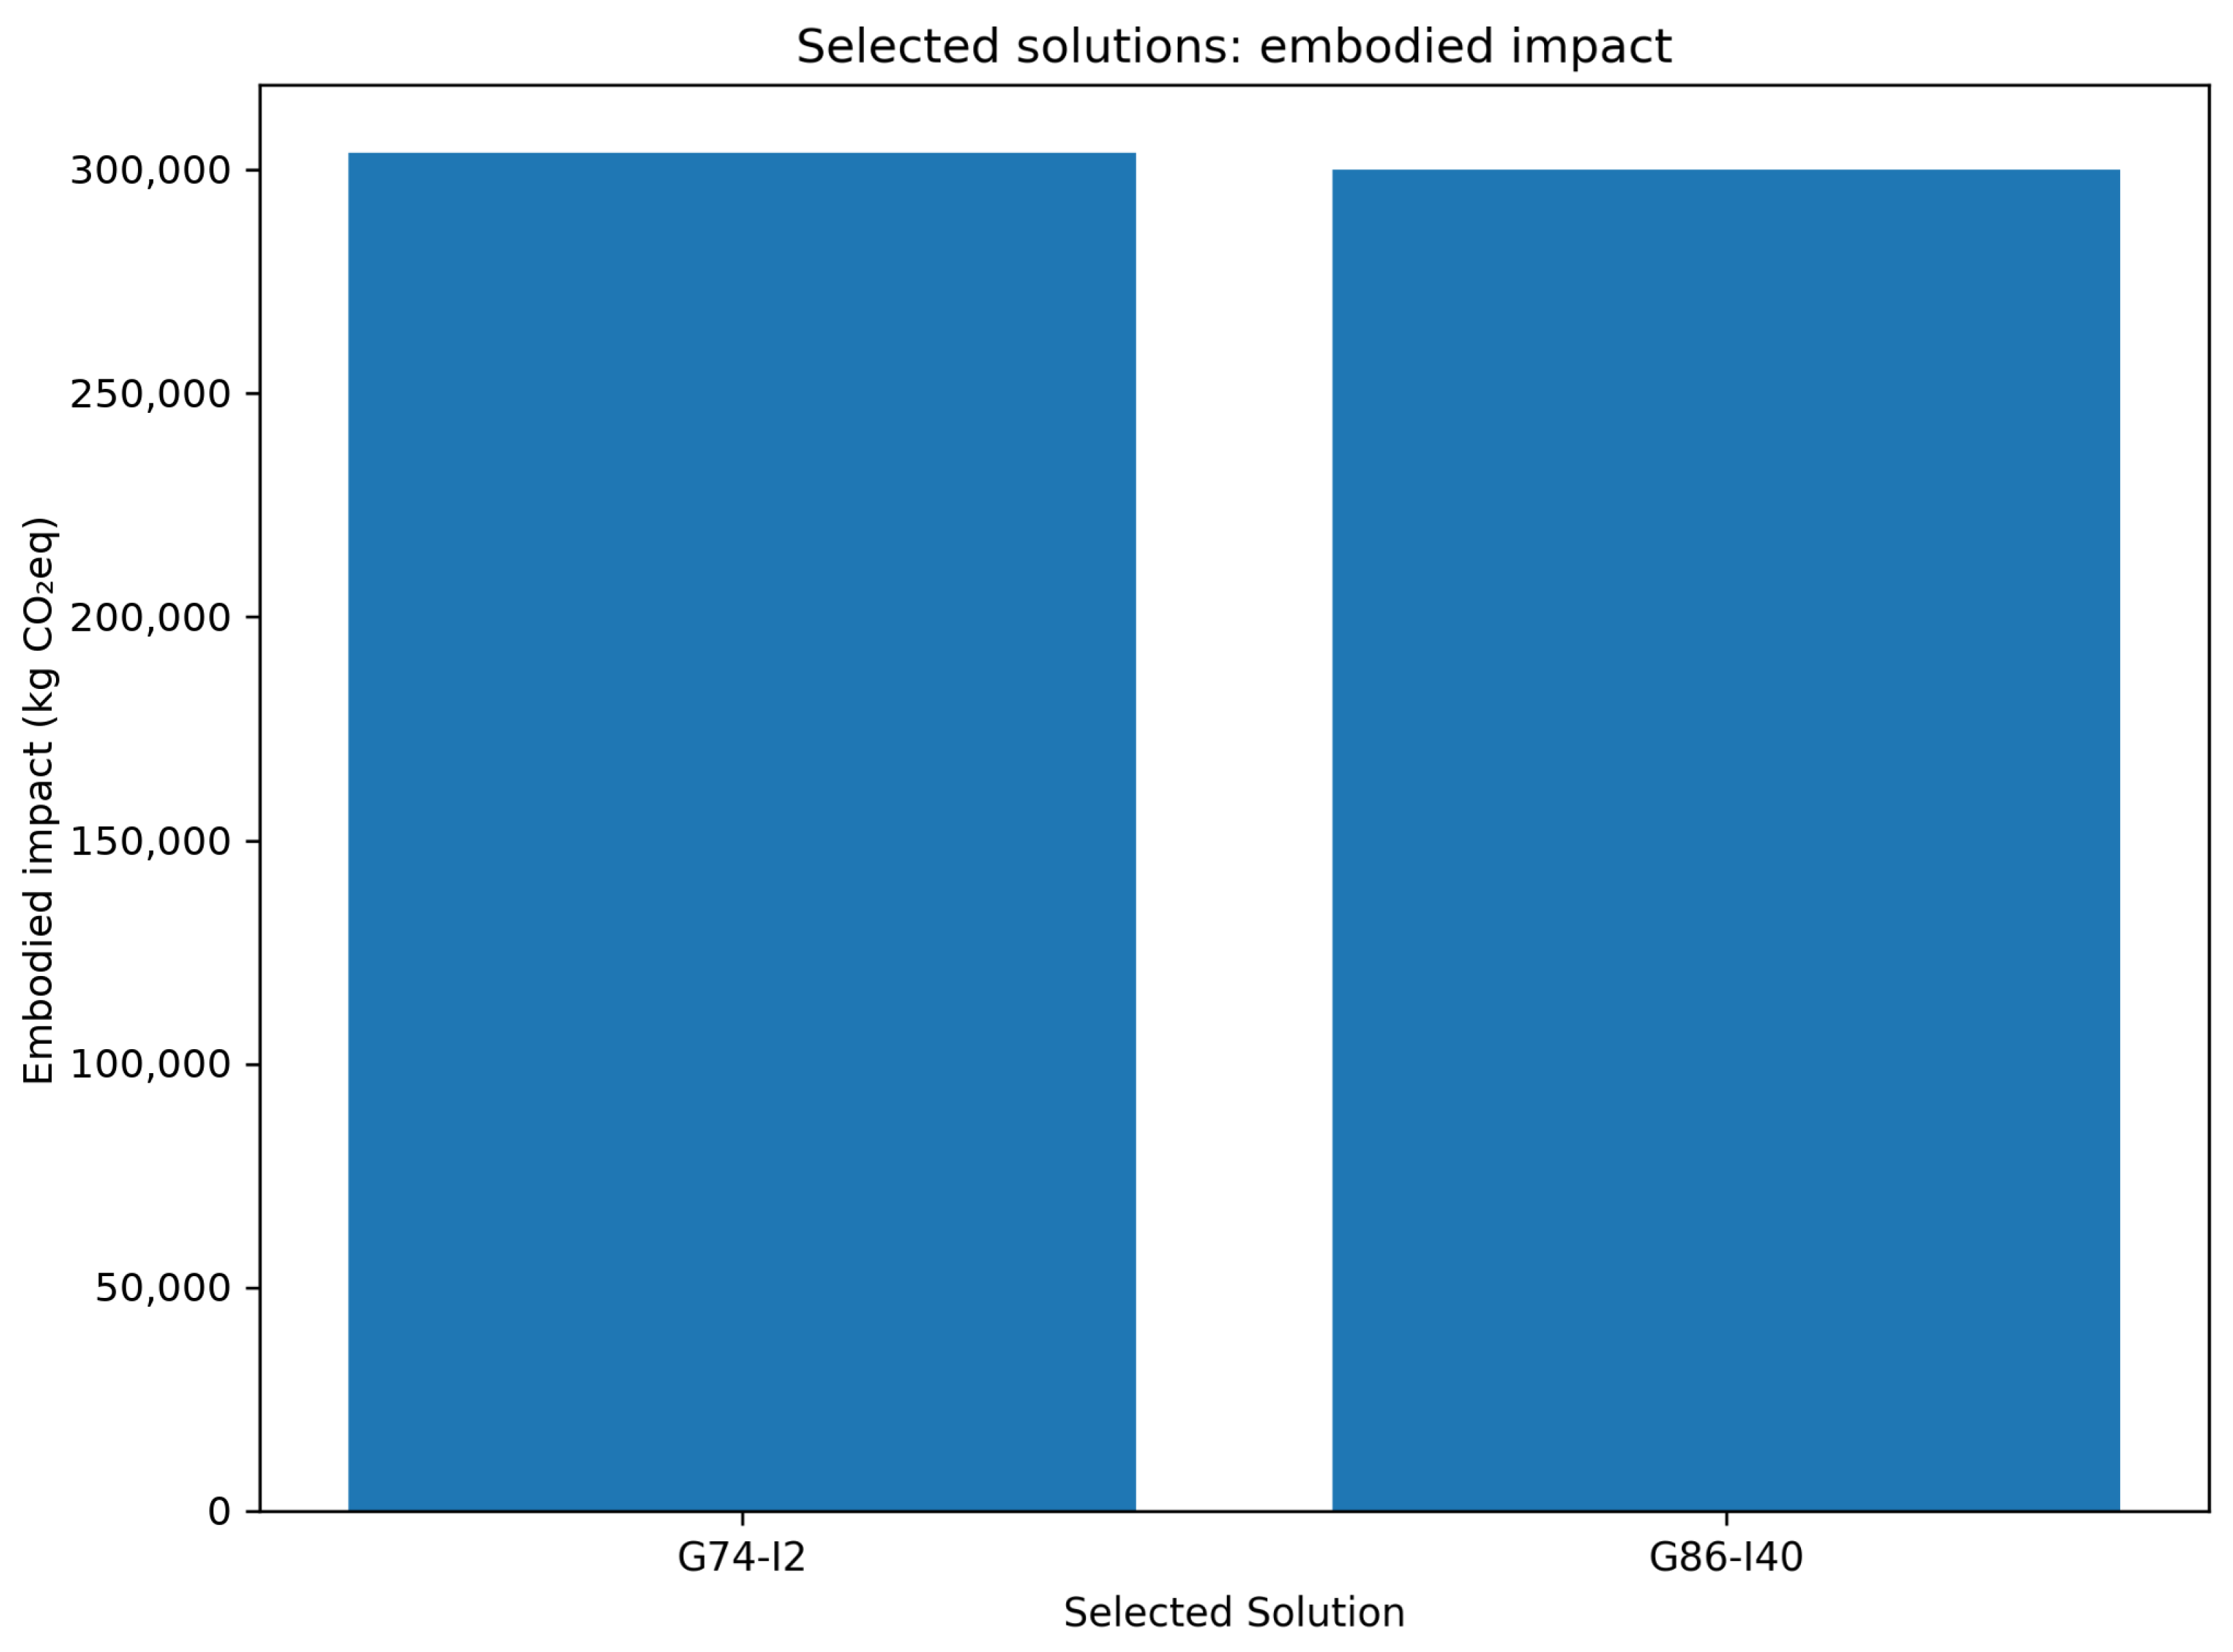
The selected solution comparison in Figure 17 confirms that the difference in embodied impact between the two representative groups was relatively modest. This result is consistent with the fact that both selected solutions retained the same material systems and comparable overall envelope quantities. Thus, although differences in architectural configuration and façade design were sufficient to produce meaningful changes in operational performance, their influence on embodied impact remained comparatively limited within the constrained design space.
Figure 17.
Embodied-impact comparison of the two selected representative solutions.
4.6. Mechanism of the Trade-Off in the Selected Solutions
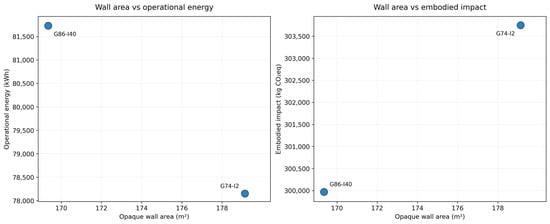
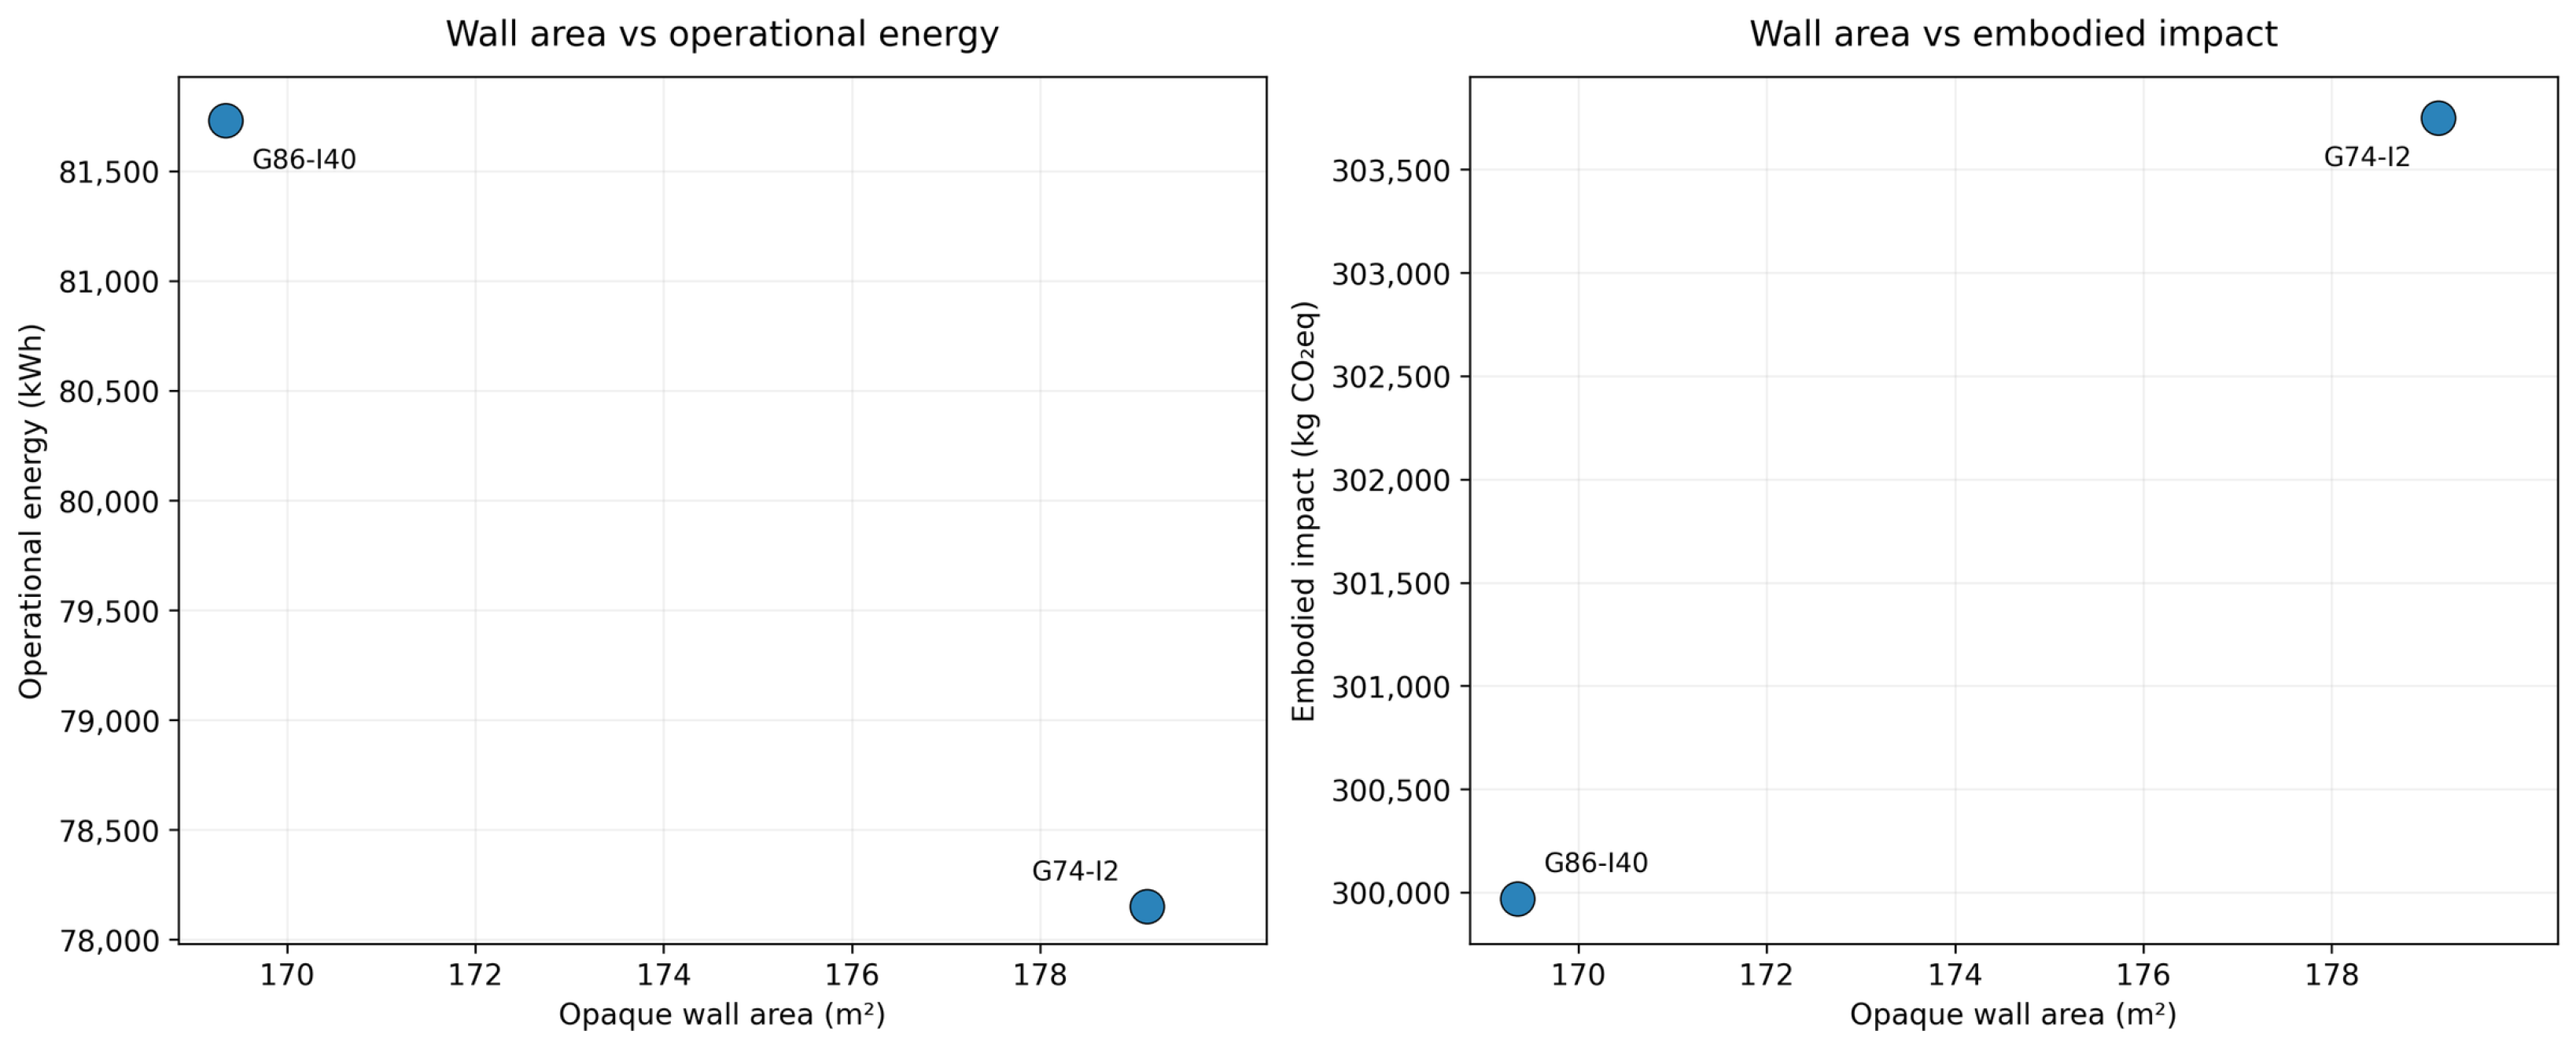
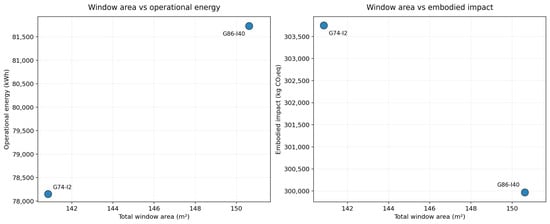
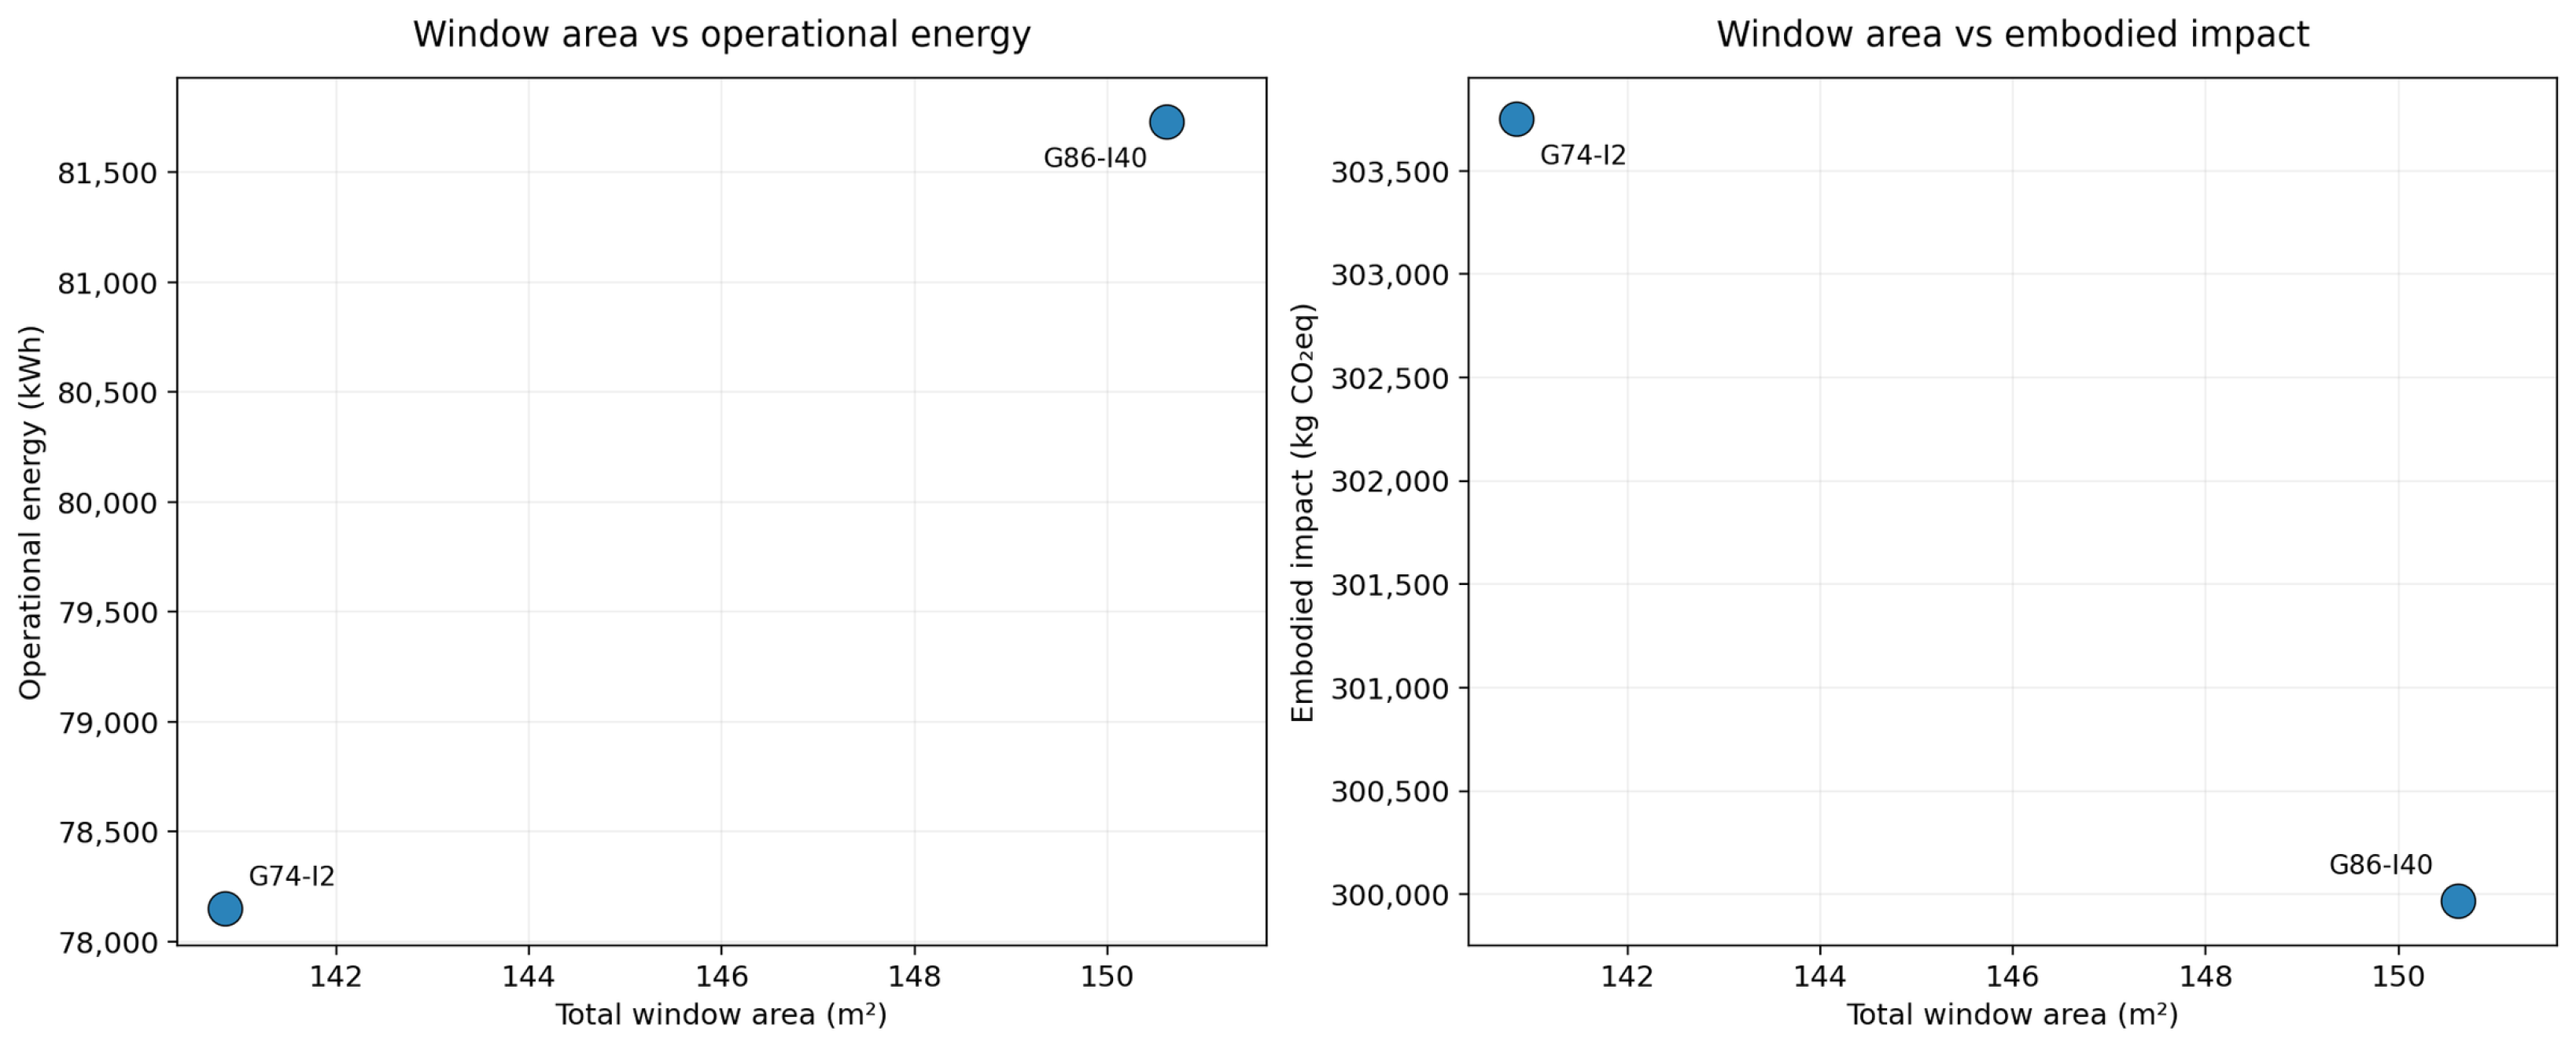
The mechanism underlying the two selected solutions is clarified in Figure 18 and Figure 19, which compare wall area and total window area against both operational and embodied performance. The lower-operational solution (G74-I2) retained a larger opaque wall area and a lower total window area, while the higher-operational solution (G86-I40) showed the reverse pattern. This redistribution of façade composition explains the observed trade-off: increasing glazing reduced opaque envelope quantities slightly, thereby lowering embodied impact, but also increased cooling-related operational demand.
Figure 18.
Relationship between opaque wall area and both operational energy and embodied impact for the two selected representative solutions.
Figure 19.
Relationship between total window area and both operational energy and embodied impact for the two selected representative solutions.
Although both solutions satisfy the same general area and glazing constraints, their architectural configurations differ enough to produce measurable performance divergence. Variations in massing arrangement and façade composition altered the balance between wall area and window area, which in turn changed cooling demand while only modestly affecting embodied impact. Accordingly, the principal trade-off identified in this study is best interpreted as an architectural-configuration trade-off, expressed through envelope composition, rather than as a material-system trade-off.
To avoid relying only on the two selected representative configurations, a post hoc regression analysis was conducted using the full set of 5000 generated solutions (Table 6). The exported fitness dataset included total floor area and WWR for all solutions; therefore, these variables were used to quantify their relationship with operational energy and A1–A3 embodied impact. The analysis showed that total floor area alone explained 92.6% of the variation in annual operational energy and 98.6% of the variation in embodied impact. WWR alone explained 58.1% of the variation in annual operational energy and 39.2% of the variation in embodied impact. When total floor area and WWR were included together, the model explained 96.6% of the variation in operational energy and 98.6% of the variation in embodied impact. Standardized regression coefficients indicated that total floor area had the stronger association with both objectives, while WWR had an additional positive association with operational energy but almost no additional explanatory effect for embodied impact after controlling for area. These results support a moderated interpretation: floor area and façade openness strongly structure the optimization outcomes, while the two representative configurations illustrate the final trade-off within the filtered design scope.
Table 6.
Post hoc regression summary using the full 5000-solution dataset.
5. Discussion
A central contribution of this study lies in showing how post-processed multi-objective optimization can clarify operational energy and A1–A3 embodied-impact trade-offs within a defined architectural design scope. After applying the area and WWR-based filters, the final Pareto set was reduced to two unique representative configurations. However, this result is not presented as an intrinsic or universal characteristic of the full design space. Rather, it is interpreted as the decision structure produced under the selected variable encoding, material library, area threshold, and WWR-based façade-openness criterion. The threshold-sensitivity check showed that nearby filtering assumptions generally produced a limited number of unique Pareto configurations, but the exact number varied across threshold combinations.
The operational energy results indicate that cooling demand is the principal determinant of annual performance, which is expected in the Riyadh climate. More importantly, the comparison of the selected solutions indicates that even when material systems are fixed, relatively small differences in architectural design and façade composition can significantly influence annual operational energy. This highlights the importance of building geometry and glazing distribution as key architectural design drivers in hot-arid residential buildings.
By contrast, embodied impact exhibited a much more stable behavior within the filtered solution space. Because both selected solutions used the same assemblies and had similar total envelope quantities, their embodied impacts differed only slightly. This suggests that, for the constrained design space examined here, the principal driver of embodied impact is material quantity, especially total floor, roof, and envelope area, rather than façade orientation or minor morphological variation. However, this interpretation must be read together with the modeling assumptions. The strong dependence of embodied impact on total floor area is partly expected because several high-impact assemblies, especially floor and roof components, were fixed in material definition and varied mainly by quantity. As a result, the embodied-impact result reflects both design-space exploration and the predefined structure of the LCA model. The optimization therefore identifies how embodied impact behaves under the selected assembly set, but it does not imply that floor area would dominate to the same degree under a broader material library or alternative structural systems.
Taken together, these findings indicate that within the constrained high-area, WWR design space, architectural and geometrical configuration is the dominant driver of operational variation, whereas embodied impact remains comparatively stable because the selected solutions retain similar assemblies and similar overall construction quantities. In this context, the early-stage life-cycle trade-off is governed less by broad material substitution and more by how architectural design decisions shape building form, façade composition, and the distribution of opaque and transparent surfaces. This finding reinforces the importance of architectural design as a primary determinant of energy behavior in hot-arid residential buildings. This finding should be interpreted within the scope of the present case study, but it suggests that constrained multi-objective optimization may reveal clustered performance behavior when geometric, material, and façade-openness variables are tightly bounded.
These findings should be interpreted within the methodological boundaries of this study. The two representative configurations are outcomes of a simulation-based optimization process using a simplified residential massing system, EnergyPlus-based operational energy simulation, A1–A3 product-stage embodied-impact assessment, and post-processing filters based on total floor area and WWR. Because the energy model was not calibrated against measured data, uncertainty analysis was not performed, the embodied assessment does not include construction, replacement, operational maintenance, or end-of-life stages, and detailed daylight-performance metrics were not evaluated, the identified configurations should not be generalized as universal optimal solutions for all hot-arid residential buildings. Rather, they should be understood as case-specific evidence of how architectural configuration and envelope composition influenced operational and upstream embodied-impact trade-offs within the modeled design space.
The selected lower-operational configuration should not be interpreted as a universal optimum because operational energy and A1–A3 embodied impact are expressed in different units and were not converted into a single common life-cycle indicator. No operational-carbon conversion factor, electricity-grid decarbonization scenario, reference study period, or formal multi-criteria decision method was applied in this study. Therefore, the manuscript no longer presents G74-I2 as a preferred life-cycle optimum. However, the relative comparison between the two representative configurations clarifies the trade-off within the modeled case. Compared with G86-I40, G74-I2 reduced annual operational energy by 5323 kWh, corresponding to approximately 6.5%, while increasing A1–A3 embodied impact by 3785 kg CO2eq, corresponding to approximately 1.3%. Therefore, G74-I2 is described more narrowly as the lower-operational configuration with a modest upstream embodied-impact increase, rather than as a universally more balanced or preferred life-cycle solution.
Both final representative configurations used single glazing, although double-glazing options were included in the variable space. This outcome should be interpreted within the specific optimization setup rather than as a general preference for single glazing in hot climates. In the filtered Pareto set, the selected configurations combined moderate WWR values, favorable geometric organization, and the same envelope assembly combination. Under the modeled operational energy assumptions and Tally-based A1–A3 GWP values, double glazing did not appear in the final filtered Pareto configurations because its potential operational benefit was not sufficient to offset its embodied-impact effect within the selected design space. Therefore, the results indicate the behavior of this case-specific optimization model and should not be generalized without testing broader glazing specifications, SHGC/U-value ranges, cost criteria, and calibrated cooling-load assumptions.
6. Conclusions
This study developed and tested an integrated parametric multi-objective optimization framework for the simultaneous evaluation of operational energy and embodied impact in hot-arid residential envelopes. By coupling Rhino–Grasshopper, Honeybee–EnergyPlus, Rhino.Inside.Revit, Tally LCA, and Wallacei within a unified workflow, this study demonstrates how early-stage geometry generation, material selection, and life-cycle assessment can be evaluated concurrently rather than sequentially.
The results demonstrated that the unrestricted search space contains broad variability, but that post-processing based on total floor area and WWR is necessary to isolate feasible alternatives under the imposed area and glazing constraints. After filtering, the Pareto front was reduced to eight non-dominated solutions, which effectively collapsed into two unique representative configurations. Detailed re-simulation showed that these groups were not differentiated by material system or orientation, but primarily by differences in architectural and geometrical configuration, reflected in opaque wall area, total window area, and the resulting cooling demand.
Among the two representative configurations, G74-I2 provided the lower annual operational demand, reducing operational energy by approximately 6.5% compared with G86-I40, while increasing A1–A3 embodied impact by approximately 1.3%. Because the two indicators were not converted into a common life-cycle unit, evaluated over a defined service-life horizon, or assessed using a formal multi-criteria decision method, this result is interpreted as a case-specific operational–upstream embodied-impact trade-off rather than as a preferred or universal life-cycle optimum. Within the modeled Saudi residential case, the results indicate that operational performance remained sensitive to architectural design and façade configuration, even when upstream embodied impact was assessed simultaneously.
More broadly, this study shows that early-stage optimization can support the interpretation of trade-offs between operational energy and A1–A3 embodied impact when geometry, glazing, and envelope assembly selection are evaluated within the same parametric workflow. However, the conclusions have been moderated to reflect the evidence provided by this study. The two final configurations are interpreted as unique representative configurations within the modeled and filtered design space, not as dominant performance groups that characterize all possible residential alternatives. Similarly, the lower-operational configuration is not presented as a preferred life-cycle optimum, because operational energy and embodied impact were not converted into a common unit or evaluated using a formal decision criterion. The broader methodological contribution is therefore framed as the development and demonstration of a BIM-integrated workflow for comparative early-stage design-space exploration, rather than as proof of a universally generalizable optimization outcome.
This study should be interpreted as a simulation-based early-stage optimization study rather than a calibrated predictive assessment of a specific constructed building. The operational energy model was developed using established simulation tools and consistent assumptions across all iterations, but it was not calibrated against measured building data. The embodied-impact assessment was limited to the A1–A3 product stage and therefore represents upstream material-related impacts rather than a full cradle-to-grave life-cycle assessment. No uncertainty analysis was performed, and detailed daylight-performance metrics were not evaluated beyond the WWR-based façade-openness filter and daylight-responsive lighting-control assumption. These limitations directly affect the generalizability of the two representative configurations identified in this study. Accordingly, the results should be interpreted as case-specific design-space behavior under the selected modeling assumptions, variable ranges, material database, and post-processing criteria. WWR was used as a façade-openness criterion during post-processing rather than as a substitute for detailed daylight-performance metrics. The post-processing thresholds used in this study were methodological filters intended to focus the analysis on high-area and WWR-adequate configurations. Different area or WWR thresholds may change the number of retained solutions and may produce variations in the final Pareto structure. Future work may therefore extend the framework by incorporating model calibration, daylight metrics, threshold-sensitivity analysis, uncertainty analysis, broader life-cycle stages, economic criteria, and additional comfort-related criteria.
Funding
This research received no external funding.
Data Availability Statement
The data that support the findings of this study are available from the corresponding author upon reasonable request.
Acknowledgments
The researchers would like to thank the Deanship of Graduate Studies and Scientific Research at Qassim University (www.qu.edu.sa, accessed on 24 October 2026) for financial support (QU-APC-2026). During the preparation of this manuscript, the author used ChatGPT (OpenAI, GPT-5.5) to support language refinement, grammar correction, and improvements to readability. The author critically reviewed and revised the manuscript following its use and confirm the originality and accuracy of the content presented. The author have reviewed the terms of use of the AI tool and confirm that its use complies with the publisher’s requirements and is suitable for publication. The author take full responsibility for the integrity, accuracy, and content of the published work.
Conflicts of Interest
The author declares no conflicts of interest.
References
- Sizirici, B.; Fseha, Y.; Cho, C.-S.; Yildiz, I.; Byon, Y.-J. A review of carbon footprint reduction in construction industry, from design to operation. Materials 2021, 14, 6094. [Google Scholar] [CrossRef] [Scilit]
- U. N. Environment. 2019 Global Status Report for Buildings and Construction Sector|UNEP-UN Environment Programme. Available online: https://www.unep.org/resources/publication/2019-global-status-report-buildings-and-construction-sector (accessed on 5 October 2026).
- Dixit, M.K.; Culp, C.H.; Lavy, S.; Fernandez-Solis, J. Recurrent embodied energy and its relationship with service life and life cycle energy: A review paper. Facilities 2014, 32, 160–181. [Google Scholar] [CrossRef] [Scilit]
- Praseeda, K.; Reddy, B.V.; Mani, M. Embodied and operational energy of urban residential buildings in India. Energy Build. 2016, 110, 211–219. [Google Scholar] [CrossRef] [Scilit]
- Dixit, M.K.; Culp, C.H.; Fernandez-Solis, J.L. Embodied Energy of Construction Materials: Integrating Human and Capital Energy into an IO-Based Hybrid Model. Environ. Sci. Technol. 2015, 49, 1936–1945. [Google Scholar] [CrossRef] [Scilit]
- Cabeza, L.F.; Boquera, L.; Chàfer, M.; Vérez, D. Embodied energy and embodied carbon of structural building materials: Worldwide progress and barriers through literature map analysis. Energy Build. 2021, 231, 110612. [Google Scholar] [CrossRef] [Scilit]
- Magrini, A.; Lentini, G.; Cuman, S.; Bodrato, A.; Marenco, L. From nearly zero energy buildings (NZEB) to positive energy buildings (PEB): The next challenge—The most recent European trends with some notes on the energy analysis of a forerunner PEB example. Dev. Built Environ. 2020, 3, 100019. [Google Scholar] [CrossRef] [Scilit]
- Cabeza, L.F.; Rincón, L.; Vilariño, V.; Pérez, G.; Castell, A. Life cycle assessment (LCA) and life cycle energy analysis (LCEA) of buildings and the building sector: A review. Renew. Sustain. Energy Rev. 2014, 29, 394–416. [Google Scholar] [CrossRef] [Scilit]
- Birjukovs, M.; Sinka, M.; Jakovics, A.; Bajare, D. Combined in situ and in silico validation of a material model for hempcrete. Constr. Build. Mater. 2022, 321, 126051. [Google Scholar] [CrossRef] [Scilit]
- Vamza, I.; Diaz, F.; Resnais, P.; Radziņa, A.; Blumberga, D. Life Cycle Assessment of Reprocessed Cross Laminated Timber in Latvia. Environ. Clim. Technol. 2021, 25, 58–70. [Google Scholar] [CrossRef] [Scilit]
- Echenagucia, T.M.; Moroseos, T.; Meek, C. On the tradeoffs between embodied and operational carbon in building envelope design: The impact of local climates and energy grids. Energy Build. 2023, 278, 112589. [Google Scholar] [CrossRef] [Scilit]
- Brambilla, A.; Salvalai, G.; Imperadori, M.; Sesana, M.M. Nearly zero energy building renovation: From energy efficiency to environmental efficiency, a pilot case study. Energy Build. 2018, 166, 271–283. [Google Scholar] [CrossRef] [Scilit]
- Ryzhov, A.; Ouerdane, H.; Gryazina, E.; Bischi, A.; Turitsyn, K. Model predictive control of indoor microclimate: Existing building stock comfort improvement. Energy Convers. Manag. 2019, 179, 219–228. [Google Scholar] [CrossRef] [Scilit]
- THE 17 GOALS|Sustainable Development. Available online: https://sdgs.un.org/goals#icons (accessed on 28 June 2024).
- Asif, M. Growth and sustainability trends in the buildings sector in the GCC region with particular reference to the KSA and UAE. Renew. Sustain. Energy Rev. 2016, 55, 1267–1273. [Google Scholar] [CrossRef] [Scilit]
- Saudi Vision 2030. Housing Program. Available online: http://www.vision2030.gov.sa/en/vision-2030/vrp/housing-program/ (accessed on 28 June 2024).
- Mansouri, N.Y.; Crookes, R.J.; Korakianitis, T. A projection of energy consumption and carbon dioxide emissions in the electricity sector for Saudi Arabia: The case for carbon capture and storage and solar photovoltaics. Energy Policy 2013, 63, 681–695. [Google Scholar] [CrossRef] [Scilit]
- U.S. Energy Information Administration. Country Analysis Brief: Saudi Arabia. Available online: https://www.eia.gov/international/content/analysis/countries_long/Saudi_Arabia/pdf/Saudi-Arabia.pdf?utm_source=chatgpt.com (accessed on 5 October 2026).
- General Authority for Statistics (GASTAT). Household Energy Statistics 2024. Available online: https://www.stats.gov.sa/ar/statistics-tabs (accessed on 15 October 2026).
- General Authority for Statistics (GASTAT). GASTAT: Electricity Consumption in the Residential Sector Reaches 161,207 GWh in 2024. Available online: https://stats.gov.sa/ar/w/news/125 (accessed on 15 October 2026).
- Al-Ajlan, S.; Al-Ibrahim, A.; Abdulkhaleq, M.; Alghamdi, F. Developing sustainable energy policies for electrical energy conservation in Saudi Arabia. Energy Policy 2006, 34, 1556–1565. [Google Scholar] [CrossRef] [Scilit]
- Röck, M.; Saade, M.R.M.; Balouktsi, M.; Rasmussen, F.N.; Birgisdottir, H.; Frischknecht, R.; Habert, G.; Lützkendorf, T.; Passer, A. Embodied GHG emissions of buildings–The hidden challenge for effective climate change mitigation. Appl. Energy 2020, 258, 114107. [Google Scholar] [CrossRef] [Scilit]
- Lützkendorf, T.; Balouktsi, M. Embodied carbon emissions in buildings: Explanations, interpretations, recommendations. Build. Cities 2022, 3, 964–973. [Google Scholar] [CrossRef] [Scilit]
- Liang, Y.; Li, C.; Liu, Z.; Wang, X.; Zeng, F.; Yuan, X.; Pan, Y. Decarbonization potentials of the embodied energy use and operational process in buildings: A review from the life-cycle perspective. Heliyon 2023, 9, e20190. [Google Scholar] [CrossRef] [Scilit]
- Latha, H.; Patil, S.; Kini, P.G. Influence of architectural space layout and building perimeter on the energy performance of buildings: A systematic literature review. Int. J. Energy Environ. Eng. 2023, 14, 431–474. [Google Scholar] [CrossRef] [Scilit]
- Baglivo, C.; Albanese, P.M.; Congedo, P.M. Relationship between shape and energy performance of buildings under long-term climate change. J. Build. Eng. 2024, 84, 108544. [Google Scholar] [CrossRef] [Scilit]
- Oh, M.; Jang, K.M.; Kim, Y. Empirical analysis of building energy consumption and urban form in a large city: A case of Seoul, South Korea. Energy Build. 2021, 245, 111046. [Google Scholar] [CrossRef] [Scilit]
- Almahmoud, E.; Elgheriani, L.; Almhafdy, A. Cooling Load Reduction in Courtyard Houses: Examining the Role of Courtyard Configuration in a Hot, Arid Climate. JES. J. Eng. Sci. 2024, 52, 728–738. [Google Scholar] [CrossRef] [Scilit]
- Mahmoud, A.R. The Influence of Buildings Proportions and Orientations on Energy Demand for Cooling in Hot Arid Climate. SVU-Int. J. Eng. Sci. Appl. 2022, 3, 8–20. [Google Scholar] [CrossRef] [Scilit]
- Liu, H.; Zhang, Z.; Ma, X.; Lu, W.; Li, D.; Kojima, S. Optimization Analysis of the Residential Window-to-Wall Ratio Based on Numerical Calculation of Energy Consumption in the Hot-Summer and Cold-Winter Zone of China. Sustainability 2021, 13, 6138. [Google Scholar] [CrossRef] [Scilit]
- Alwetaishi, M.; Benjeddou, O. Impact of window to wall ratio on energy loads in hot regions: A study of building energy performance. Energies 2021, 14, 1080. [Google Scholar] [CrossRef] [Scilit]
- Ahmed, A.E.; Suwaed, M.S.; Shakir, A.M.; Ghareeb, A. The impact of window orientation, glazing, and window-to-wall ratio on the heating and cooling energy of an office building: The case of hot and semi-arid climate. J. Eng. Res. 2025, 13, 409–422. [Google Scholar] [CrossRef] [Scilit]
- Schenk, D.; Amiri, A. Life cycle energy analysis of residential wooden buildings versus concrete and steel buildings: A review. Front. Built Environ. 2022, 8, 975071. [Google Scholar] [CrossRef] [Scilit]
- Kovacic, I.; Reisinger, J.; Honic, M. Life Cycle Assessment of embodied and operational energy for a passive housing block in Austria. Renew. Sustain. Energy Rev. 2018, 82, 1774–1786. [Google Scholar] [CrossRef] [Scilit]
- Radhi, H. Can envelope codes reduce electricity and CO2 emissions in different types of buildings in the hot climate of Bahrain? Energy 2009, 34, 205–215. [Google Scholar] [CrossRef] [Scilit]
- Alrashed, F.; Asif, M. Trends in Residential Energy Consumption in Saudi Arabia with Particular Reference to the Eastern Province. J. Sustain. Dev. Energy Water Environ. Syst. 2014, 2, 376–387. [Google Scholar] [CrossRef] [Scilit]
- Asadi, E.; da Silva, M.G.; Antunes, C.H.; Dias, L. A multi-objective optimization model for building retrofit strategies using TRNSYS simulations, GenOpt and MATLAB. Build. Environ. 2012, 56, 370–378. [Google Scholar] [CrossRef] [Scilit]
- Nguyen, A.-T.; Reiter, S.; Rigo, P. A review on simulation-based optimization methods applied to building performance analysis. Appl. Energy 2014, 113, 1043–1058. [Google Scholar] [CrossRef] [Scilit]
- Hamida, A.; Alsudairi, A.; Alshaibani, K.; Alshamrani, O. Parametric study of the impact of building envelope systems on embodied and operational carbon of residential buildings. Int. J. Build. Pathol. Adapt. 2022, 40, 753–774. [Google Scholar] [CrossRef] [Scilit]
- Tuhus-Dubrow, D.; Krarti, M. Genetic-algorithm based approach to optimize building envelope design for residential buildings. Build. Environ. 2010, 45, 1574–1581. [Google Scholar] [CrossRef] [Scilit]
- Benaddi, F.Z.; Boukhattem, L.; Tabares-Velasco, P.C. Multi-objective optimization of building envelope components based on economic, environmental, and thermal comfort criteria. Energy Build. 2024, 305, 113909. [Google Scholar] [CrossRef] [Scilit]
- Sakani. Sakani Official Website. Available online: https://sakani.sa/en (accessed on 6 October 2026).
- Saudi Council of Engineers. Guideline for the Saudi Residential Building Code. Available online: https://sbc.gov.sa/ar/BC/Lists/SBCTechnicalEvidence/Attachments/179/%D8%A7%D9%84%D8%AF%D9%84%D9%8A%D9%84%20%D8%A7%D9%84%D8%A7%D8%B3%D8%AA%D8%B1%D8%B4%D8%A7%D8%AF%D9%8A%20%D9%84%D9%84%D9%83%D9%88%D8%AF%20%D8%A7%D9%84%D8%B3%D8%B9%D9%88%D8%AF%D9%8A%20%D9%84%D9%84%D9%85%D8%A8%D8%A7%D9%86%D9%8A%20%D8%A7%D9%84%D8%B3%D9%83%D9%86%D9%8A%D8%A9%20%20SBC%201101-1102%20%D9%84%D9%84%D9%85%D9%82%D8%A7%D9%88%D9%84%D9%8A%D9%86.pdf (accessed on 6 October 2026).
- Alhazzaa, K.; Yan, W. Integrating Parametric Modeling, BIM, and Building Performance Analysis into Augmented Reality for Architectural Design and Education. In Proceedings of the 2023 7th International Conference on Virtual and Augmented Reality Simulations; ACM: Sydney, Australia, 2023; pp. 68–76. [Google Scholar] [CrossRef] [Scilit]
- EN 15978:2011; Building Environmental Performance Assessment Standard. iTeh Standards. iTeh Inc.: Neward, UK, 2011. Available online: https://standards.iteh.ai/catalog/standards/cen/62c22cef-5666-4719-91f9-c21cb6aa0ab3/en-15978-2011 (accessed on 26 January 2026).
- ISO 14040:2006; Environmental Management—Life Cycle Assessment—Principles and Framework. International Organization for Standardization (ISO): Geneva, Switzerland, 2006.
- ISO 14044:2006; Environmental Management—Life Cycle Assessment—Requirements and Guidelines. International Organization for Standardization (ISO): Geneva, Switzerland, 2006.
- ISO 21930:2017; Sustainability in Buildings and Civil Engineering Works—Core Rules for Environmental Product Declarations of Construction Products and Services. International Organization for Standardization (ISO): Geneva, Switzerland, 2017.
- ISO 21931-1:2010; Sustainability in Building Construction—Framework for Methods of Assessment of the Environmental Performance of Construction Works—Part 1: Buildings. International Organization for Standardization (ISO): Geneva, Switzerland, 2010.
- EN 15804:2012; Sustainability of Construction Works—Environmental Product Declarations—Core Rules for the Product Category of Construction Products. European Committee for Standardization (CEN): Brussels, Belgium, 2012.
- EN 15978:2011; Sustainability of Construction Works—Assessment of Environmental Performance of Buildings—Calculation Method. European Committee for Standardization (CEN): Brussels, Belgium, 2011.
- Rabenseifer, R.; Kalivodová, M.; Kononets, Y.; Mahas, N.; Minarovičová, K.; Provazník, R.; Bordun, M.; Shekhorkina, S.; Savytskyi, M.; Savytskyi, O.; et al. How much is needed? Discussion on benchmarks for primary energy input and global warming potential caused by building construction. Energies 2025, 18, 1166. [Google Scholar] [CrossRef] [Scilit]
- Rabenseifer, R.; Provazník, R.; Mahas, N.; Minarovičová, K.; Jamnický, M.; Ždímalová, M.; Khrapatova, I.; Semko, V. Simplified product-stage lca of family houses: The role of geometry, proportions, and size. Energies 2025, 19, 161. [Google Scholar] [CrossRef] [Scilit]

Disclaimer/Publisher’s Note: The statements, opinions and data contained in all publications are solely those of the individual author(s) and contributor(s) and not of MDPI and/or the editor(s). MDPI and/or the editor(s) disclaim responsibility for any injury to people or property resulting from any ideas, methods, instructions or products referred to in the content. |
© 2026 by the author. Licensee MDPI, Basel, Switzerland. This article is an open access article distributed under the terms and conditions of the Creative Commons Attribution (CC BY) license.