


Abstract
To address issues such as semantic weakening, symbolic transplantation, and insufficient consideration of passenger perception in the application of Liaoning coastal vernacular dwelling culture to light-rail passenger-compartment design, this study proposes a Kansei Engineering (KE)- and Fuzzy Analytic Hierarchy Process (FAHP)-guided Color, Material, and Finish (CMF) design-priority translation pathway for integrating regional architectural culture into passenger-compartment CMF design. Taking representative Liaoning coastal vernacular dwellings as cultural samples and the Dalian light-rail passenger compartment as the application case, characteristics were first identified through a literature review and sample analysis. A total of 117 participants evaluated 12 dwelling images using ten bipolar Kansei descriptor pairs on a seven-point Semantic Differential (SD) scale, and exploratory factor analysis was applied to identify the principal passenger-perception dimensions. Subsequently, 12 experts participated in the FAHP evaluation to determine the relative priorities of six CMF design elements: Color, Material, Texture, Gloss, Pattern, and Surface Treatment, followed by designer-led conceptual CMF design and user evaluation. Results yielded an exploratory three-factor representation comprising Spatial Order, Material Texture, and Stylistic Tension, which accounted for 56.89% of the total variance. Material, Texture, and Color received the three highest FAHP-derived global priorities. User evaluation involving 115 valid participants yielded mean scores between 5.48 and 5.86 across the five evaluation dimensions, all significantly higher than the neutral midpoint of the scale (p < 0.001). The proposed framework provides a traceable, expert-guided process for translating regional architectural characteristics into conceptual CMF design decisions while retaining passenger perception as a key evaluative component.
1. Introduction
Urban rail transit increasingly functions not only as transportation infrastructure, but also as a public environment through which place identity and regional culture are communicated. However, regional-cultural expression in rail-transit environments often remains constrained by homogenized design language, fragmented use of cultural elements, and the direct transplantation of traditional symbols, indicating a need for more systematic identification, interpretation, and spatial integration of cultural characteristics [1]. Recent studies of subway and railway environments have examined how users perceive and recognize culturally embedded design elements [2], suggesting that cultural representation and passenger perception should be considered as related but distinct aspects of regional-cultural design.
Vernacular dwellings embody the long-term interaction among regional environmental conditions, everyday life, and local construction traditions. Their courtyard layouts, architectural forms, construction techniques, and use of local materials reflect both environmental adaptation and the organization of daily activities. Courtyard spaces contribute to environmental regulation and activity organization [3], while contemporary interpretations of traditional architectural culture increasingly move beyond formal replication toward the selective extraction and reinterpretation of cultural characteristics [4]. Recent research on Liaoning coastal vernacular dwellings has identified regional characteristics in courtyard organization, architectural form, construction techniques, and material use [5]. These documented characteristics provide the architectural-cultural evidence for the present study and form the basis for the subsequent investigation of passenger perception.
CMF plays an important role in shaping users’ perceptions of visual style, material qualities, and affective imagery [6]. Previous studies have applied KE and perceptual analysis to vehicle and passenger-compartment design to investigate users’ affective responses and design preferences [7,8,9]. Controlled studies have further examined perceptual responses to specific CMF-related variables, including seat color, material, texture, surface characteristics, and lighting [10,11]. In parallel, FAHP and related multi-criteria decision-making methods have been used to assess the relative importance of vehicle-interior design factors and support design prioritization [12]. Related studies have also explored cultural expression in transport environments and the translation of regional architectural culture into contemporary design [13,14,15]. To clarify the methodological differences between the present study and representative related studies, a comparative overview is provided in Table 1.
Table 1.
Methodological comparison of representative related studies and the present study.
Despite these advances, existing studies often address cultural-feature identification, passenger perception, CMF evaluation, and design prioritization as separate research tasks. Few studies, however, have integrated regional cultural identification, passenger-perception dimensions, expert-guided CMF prioritization, and subsequent design translation within a single traceable process. To address this gap, this study proposes a Cultural–Passenger–Compartment translation framework for light-rail CMF design based on Liaoning coastal vernacular dwellings, with the Dalian light-rail passenger compartment serving as the application case. Architectural cultural characteristics are first identified through a literature review and sample analysis. Selected dwelling images are then evaluated by passengers using a seven-point SD scale, and exploratory factor analysis (EFA) is applied to identify the principal passenger-perception dimensions. The resulting passenger-perception dimensions are used as the criterion layer in the subsequent FAHP, in which experts assess the relative priorities of six passenger-compartment CMF elements. Finally, the designer integrates the expert-assessed priorities with the identified cultural characteristics to develop a conceptual CMF design, which is subsequently evaluated by users. The methodological contribution lies in structuring cultural-feature identification, passenger-derived perception, expert-guided CMF prioritization, and designer-led translation within a traceable design process.
2. Materials and Methods
2.1. Cultural–Passenger–Compartment Translation Framework
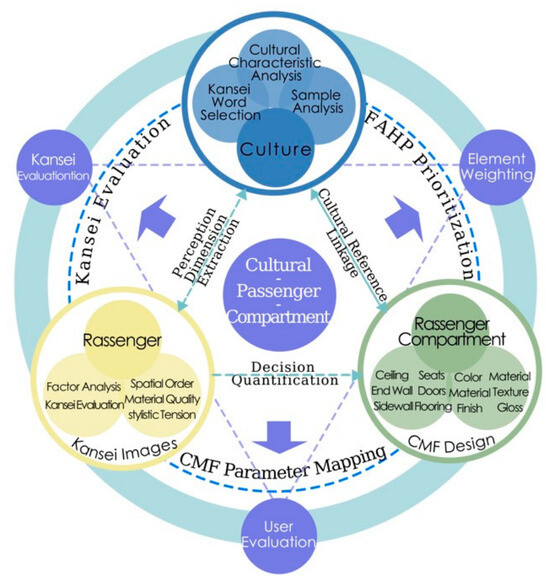
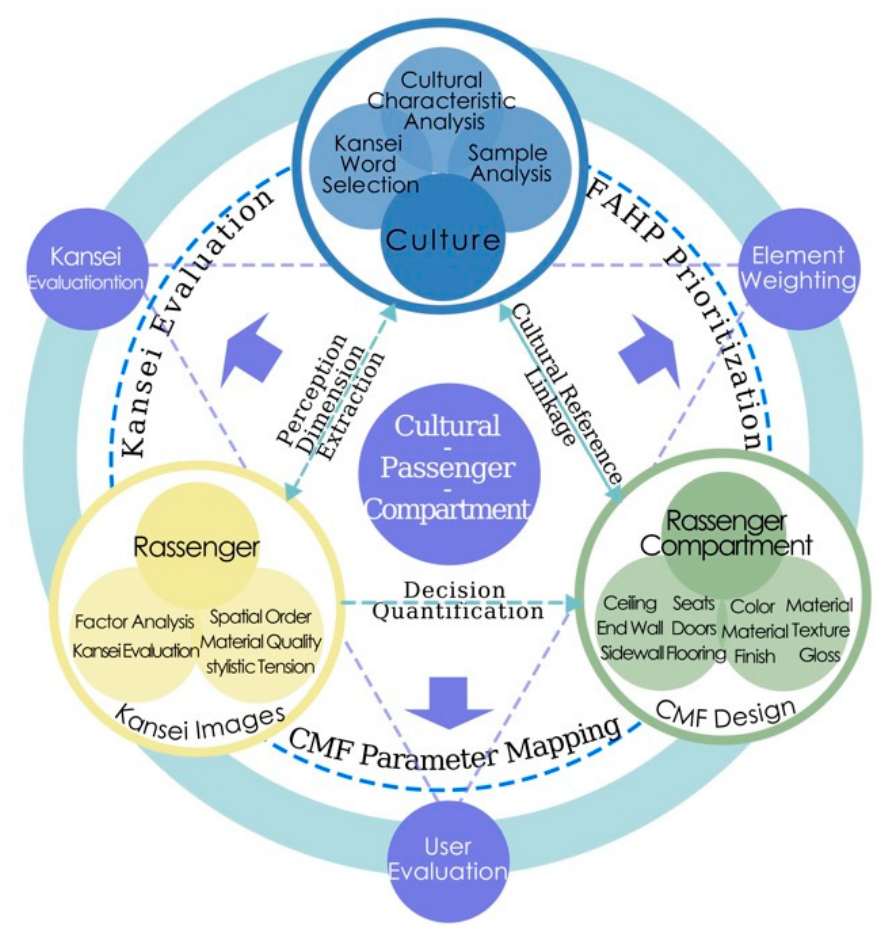
Kansei Engineering can establish connections between affective needs and design features through user perceptual evaluation and has been applied in vehicle design research [7]. Building on this foundation, this study develops a “Cultural–Passenger–Compartment” CMF translation framework for translating the cultural characteristics of Liaoning coastal vernacular dwellings into light-rail passenger-compartment design. The framework comprises three interconnected stages: cultural-feature identification and passenger-perception analysis, expert-based prioritization of CMF design elements, and designer-led translation into CMF design decisions, as shown in Figure 1.
Figure 1.
Cultural–Passenger–Compartment translation framework. The different colors are used to visually distinguish the Culture, Passenger, and Passenger Compartment domains. The dashed circular pathway indicates the Kansei evaluation, FAHP prioritization, and CMF parameter-mapping processes, while the arrows indicate the directional relationships among the main stages of the framework.
- •
- Culture–Passenger: Literature review and architectural-sample analysis were used to identify literature-documented characteristics of Liaoning coastal vernacular dwellings, including courtyard organization, building form, color relationships, material characteristics, decorative elements, and environmental adaptation. Representative dwelling images and screened Kansei descriptor pairs were then used in a Semantic Differential evaluation to obtain passengers’ perceptual responses and identify the principal passenger-perception dimensions.
- •
- Passenger–Compartment: Based on the passenger-perception dimensions, the passenger-compartment CMF design was decomposed into six elements: Color, Material, Texture, Gloss, Pattern, and Surface Treatment. Experts conducted fuzzy pairwise comparisons among indicators at the same hierarchical level, and FAHP was used to derive the local and global weights of the CMF elements under each criterion. These weights represent expert-assessed relative design priorities and provide guidance for subsequent designer-led CMF translation and design decision-making.
- •
- Compartment–Culture: Based on the expert-assessed FAHP priorities, the designer translated the prioritized CMF elements into specific decisions concerning hue, lightness, chroma, material category, texture scale, gloss level, pattern application, surface treatment, and application ratio. These parameter-level decisions were informed by the identified architectural cultural characteristics and conceptually adapted to the functional context and aesthetic requirements of different passenger-compartment interfaces, resulting in a conceptual CMF design proposal.
First, cultural characteristics of Liaoning coastal vernacular dwellings were identified through a literature review and sample analysis. Representative dwelling images and screened Kansei descriptors were then evaluated using a seven-point SD scale, and EFA was applied to examine the underlying structure of passenger perception.
Second, these dimensions formed the criterion layer of a three-level FAHP model, in which experts evaluated six passenger-compartment CMF elements to determine their relative priorities.
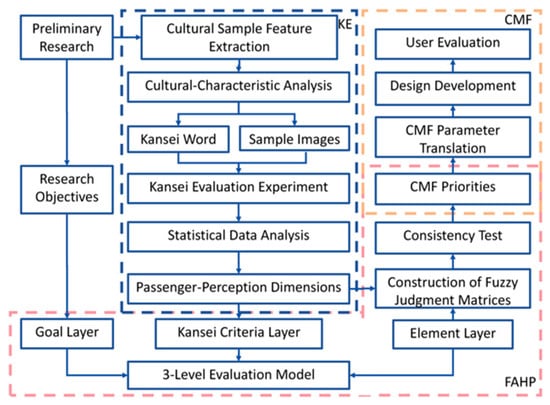
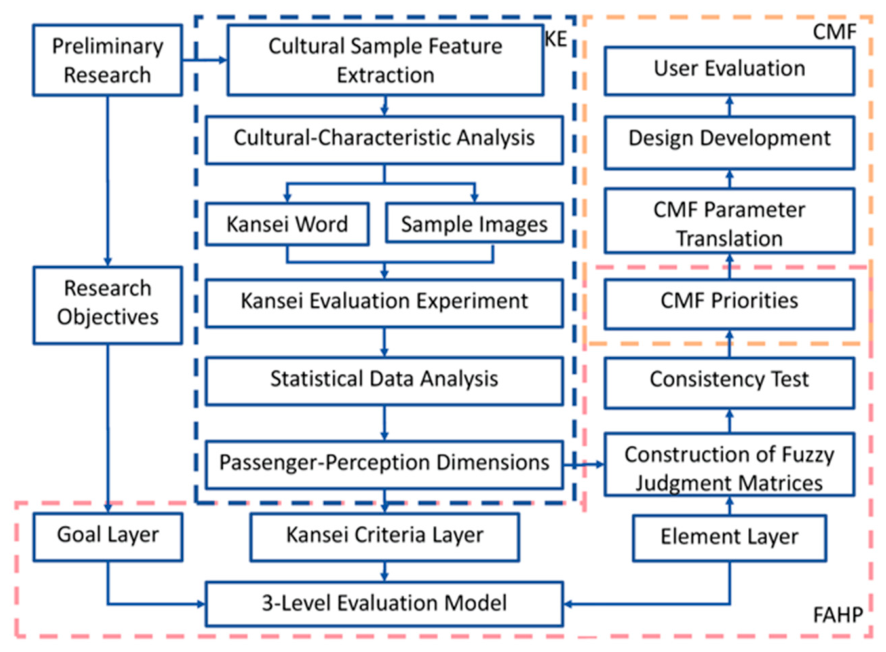
Finally, the designer combined the FAHP-derived priorities with the cultural findings to formulate CMF decisions concerning hue, lightness, chroma, material category, texture scale, gloss level, pattern application, surface treatment, and application ratio. The resulting conceptual CMF design was subsequently evaluated by users, as shown in Figure 2.
Figure 2.
Research framework for CMF translation design.
2.2. Cultural Sample Selection and Architectural Feature Analysis
Liaoning coastal vernacular dwellings were defined as the geographic scope of the cultural samples, while the Dalian light-rail passenger compartment served as the application case for the subsequent CMF translation. Previous studies have reported regional variations in courtyard organization, building form, construction methods, local materials, and decorative features [5,18,19,20,21]. These variations reflect differences in geographic conditions, building traditions, and regional cultural development.
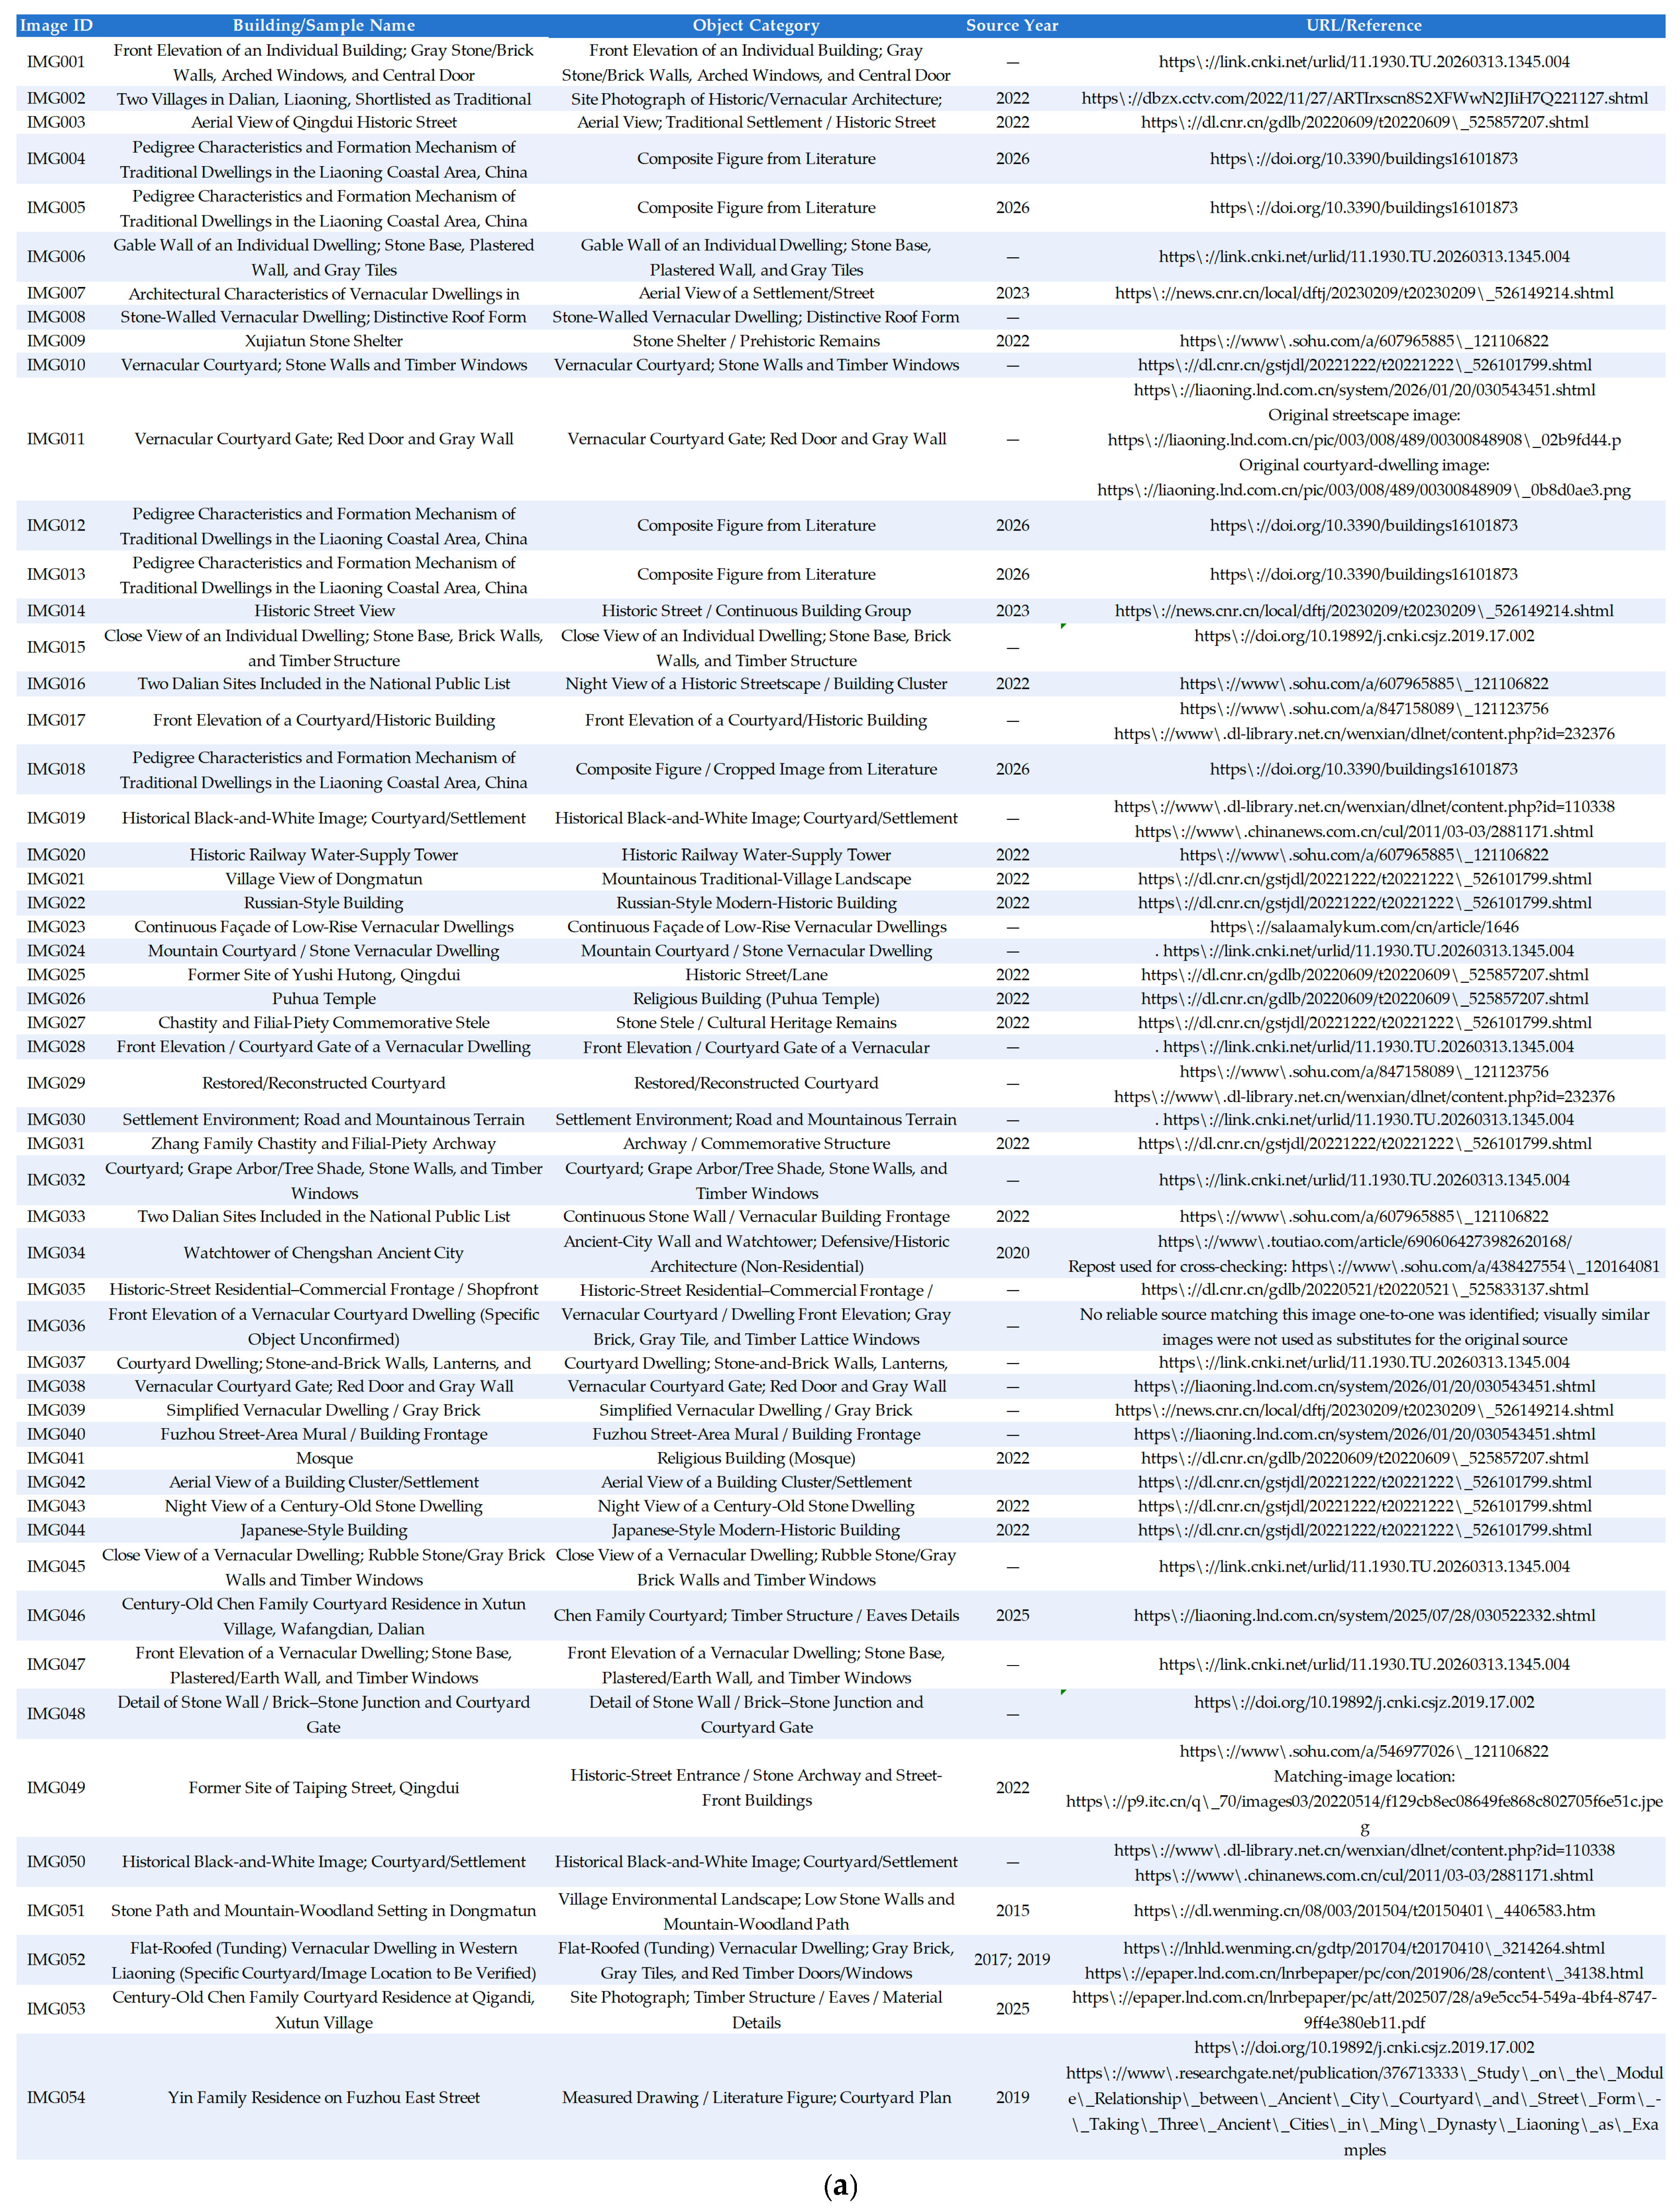
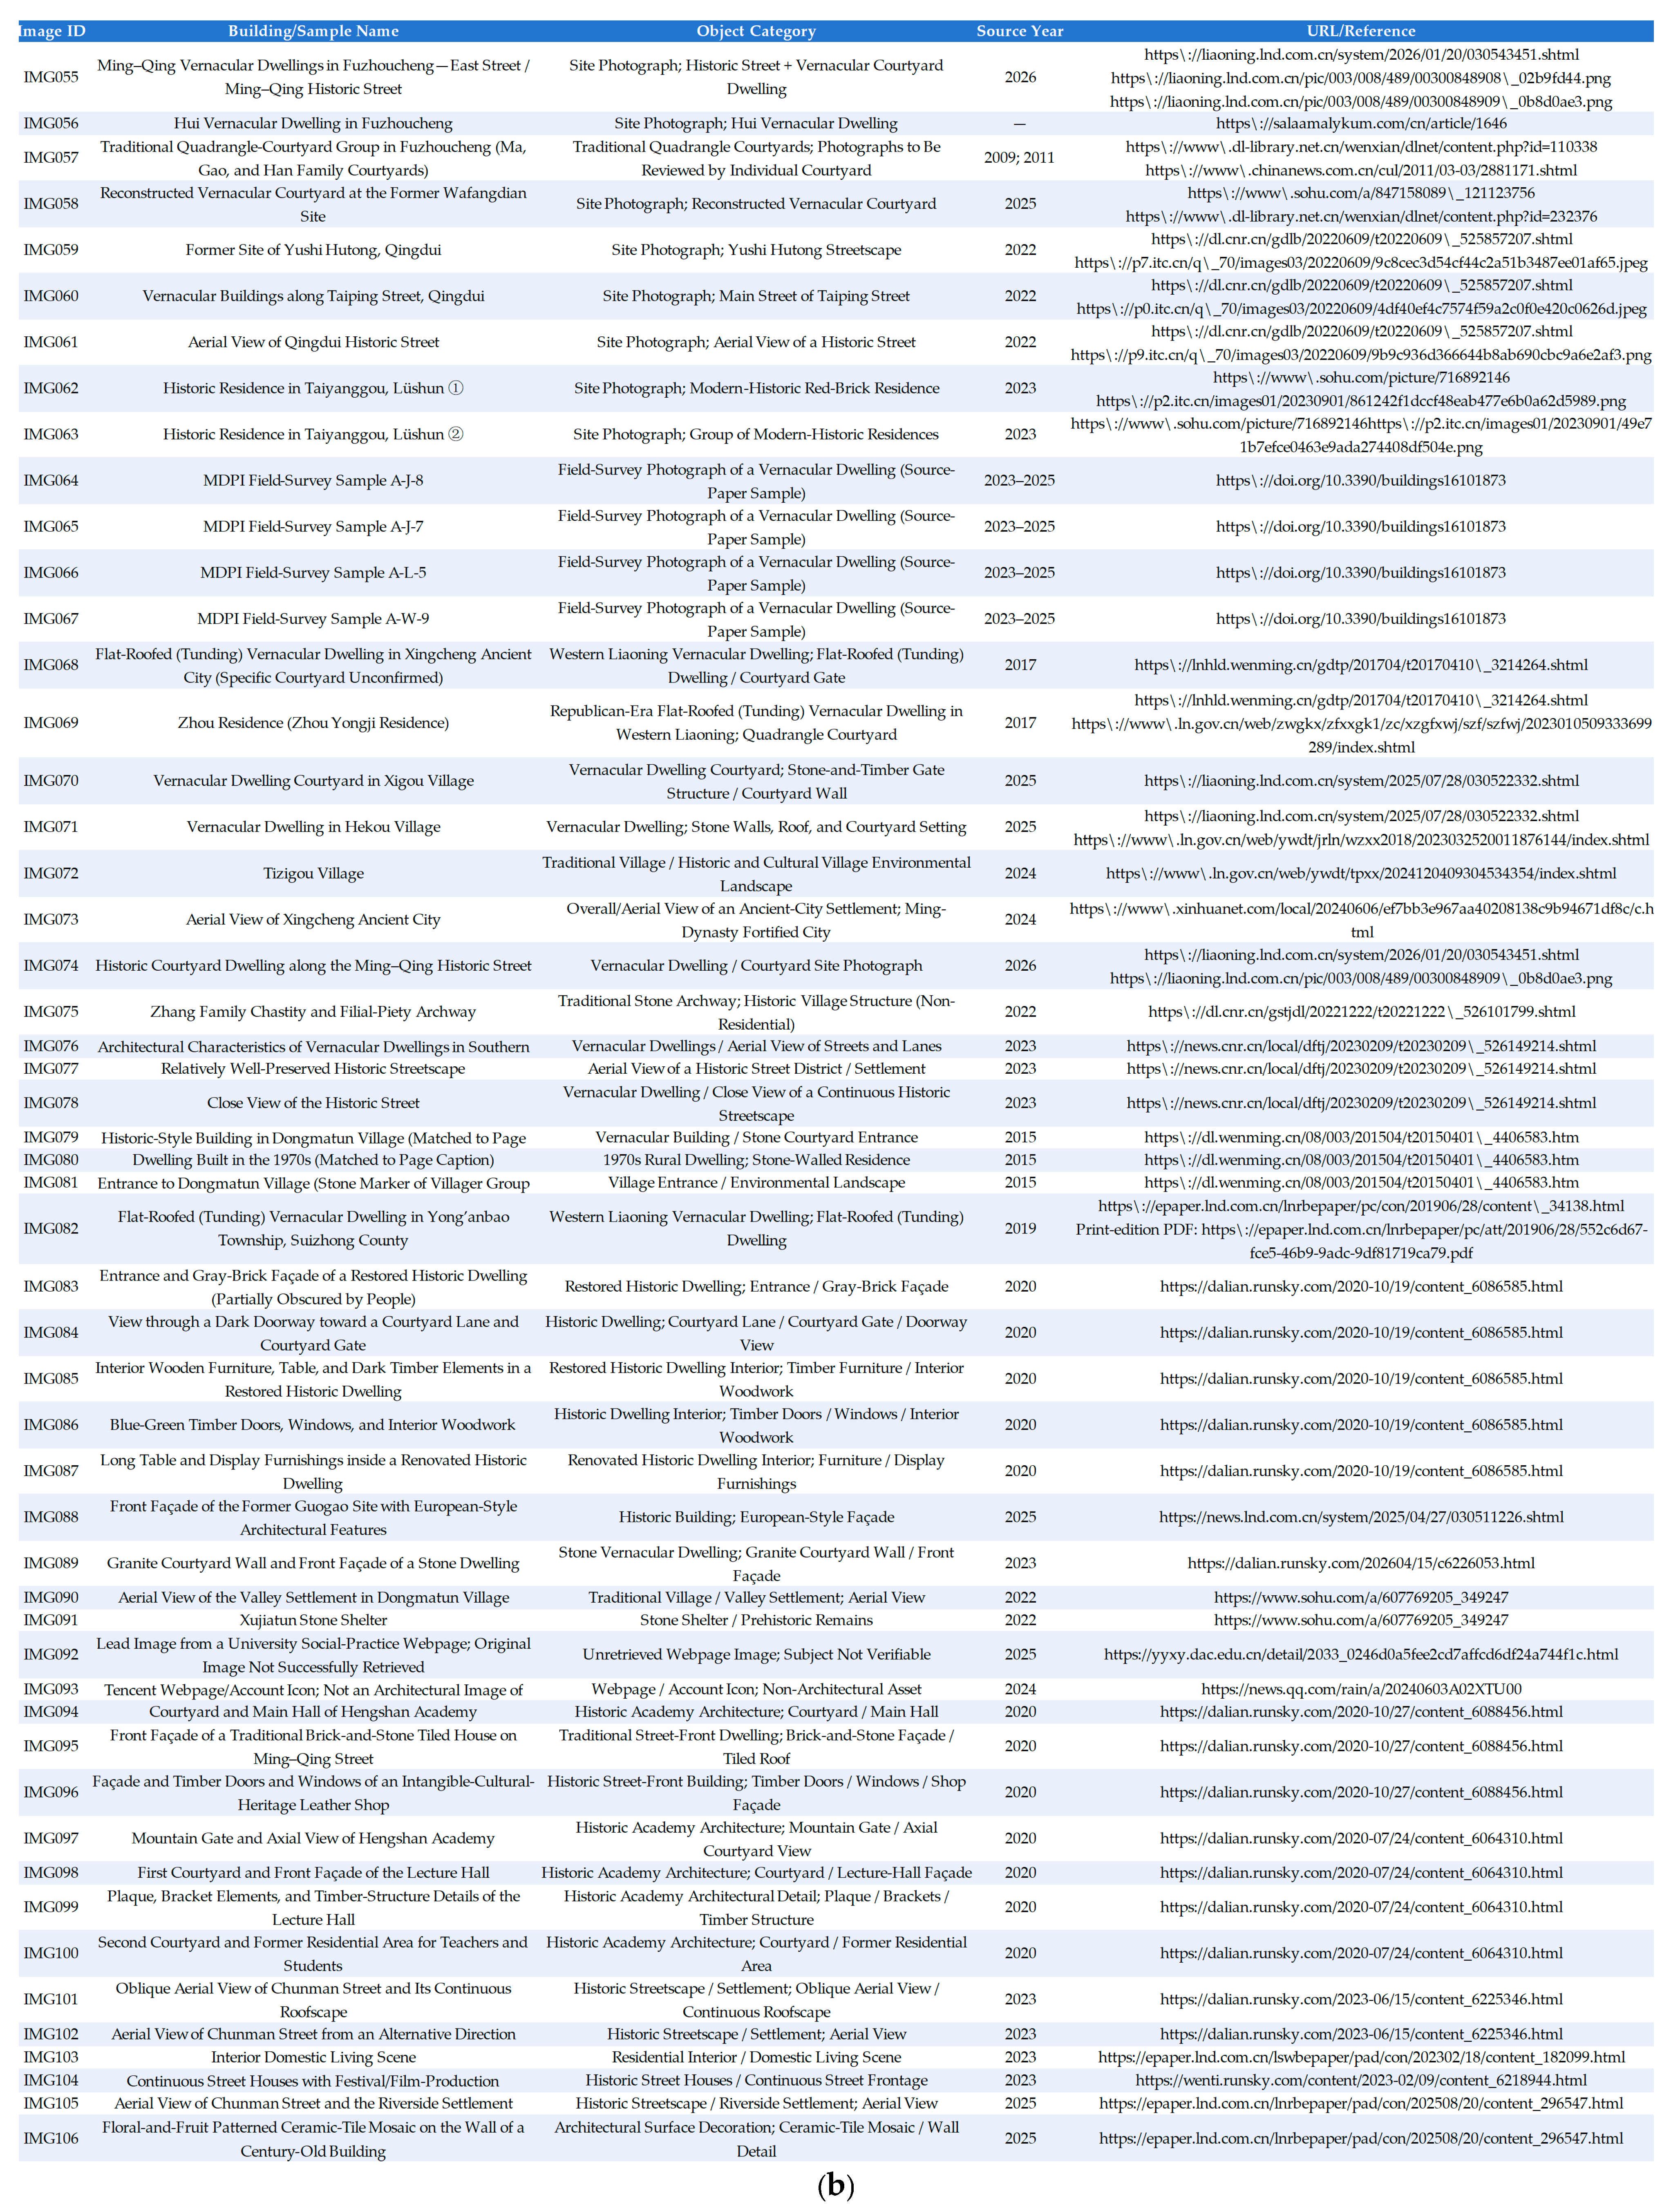
The geographic coverage, source types, temporal ranges, numbers of source records, and research roles are summarized in Table 2. An overview of the source and provenance registry for the collected visual materials is provided in Figure A1 and Figure A2 in Appendix A. The readable, item-level registry is provided in Supplementary Table S1.
Table 2.
Source composition and research roles for candidate cultural-sample identification.
For sample screening, vernacular dwellings were defined as residential buildings or courtyard compounds with a clear residential function and traceable evidence of their traditional status.
Visual images were treated as the basic unit for sample screening and Kansei evaluation, with source records and visual samples counted separately. The reconstructed sample registry contained 106 raw image records. One record without a retrievable image and one non-photographic or otherwise invalid webpage asset were excluded. One visual duplicate and four crop variants were then consolidated. The screening yielded 99 canonical candidate visual samples. Different views of the same building were retained when they provided complementary architectural information. The screening criteria are presented in Table 3.
Table 3.
Eligibility and final-selection criteria for candidate visual samples.
Final selection was guided by literature-documented characteristics of Liaoning coastal vernacular dwellings, including spatial organization, building form, roof configuration, structural elements, materials and textures, color relationships, doors and windows, and architectural components. Among visually similar candidates, preference was given to images with clearer provenance, more complete architectural subjects, and fewer visual distractions. Twelve images were selected for the Kansei evaluation, with their locations and source information summarized in Table 4. As some source images were subject to redistribution restrictions, the corresponding source links are provided in Figure A1 and Figure A2 in Appendix A to ensure traceability without reproducing the original images.
Table 4.
Locations, sources, and temporal information of the final Kansei visual samples.
To improve comparability, the 12 final visual samples were presented with a consistent aspect ratio and display size. Irrelevant visual distractions were minimized while preserving the principal architectural form, materials, and components.
2.3. Extraction of Passenger Kansei Perceptions
To examine the general structure of passenger perception across the selected Liaoning coastal vernacular-dwelling visual samples, KE was used to evaluate participants’ affective responses to the selected images. The aggregated participant-level Kansei ratings were analyzed to characterize general passenger-perception tendencies across the complete stimulus set [7,8].
The initial Kansei descriptors were collected from two sources. First, recent studies on Kansei Engineering in rail-transit and vehicle-interior design as well as studies on CMF-related perception and design were reviewed [9,10,11]. Second, open-ended interviews were conducted with eight participants to elicit additional perceptual expressions associated with the visual characteristics of vernacular dwellings. Descriptors obtained from both sources were then processed by duplicate removal, synonym consolidation, antonym pairing, part-of-speech normalization, and polarity standardization. This process yielded an initial pool of 40 candidate bipolar Kansei descriptor pairs. The complete candidate pool, semantic groupings, and treatment of each descriptor pair are reported in Table A1 in Appendix A.
The 40 candidate bipolar descriptor pairs were subsequently reviewed with reference to the literature-documented architectural and visual characteristics summarized in Table 5. Consultation was conducted with 12 experts whose professional backgrounds covered rail transit and industrial design, CMF and material design, and vernacular architecture and regional culture. All experts had at least three years of relevant research or professional experience. The candidate descriptors were evaluated according to four criteria: (1) semantic relevance to the literature-documented architectural and visual characteristics of the vernacular dwelling samples; (2) clarity and comprehensibility; (3) semantic distinctiveness from other candidate pairs; and (4) suitability as SD items for evaluating passengers’ visual responses to the visual samples. The expert review was conducted to clarify semantic boundaries, assess the relevance of candidate expressions, and identify representative descriptor pairs for subsequent screening.
Table 5.
Correspondence between architectural cultural characteristics and Kansei semantic cues.
Candidate descriptors with substantial semantic overlap were grouped based on semantic similarity, and a representative bipolar pair was retained for each group where appropriate. For example, Rough–Smooth, Rough–Delicate, Coarse–Delicate, and Unrefined–Refined represented closely related perceptions of surface texture and refinement, and Rough–Delicate was retained as the representative pair. The same procedure was applied to the remaining candidates. Semantically overlapping pairs were consolidated, whereas descriptors showing insufficient relevance to the literature-documented architectural and visual characteristics, limited semantic distinctiveness, or poor suitability for visual SD evaluation were excluded from the final descriptor set.
Following screening and semantic consolidation, 10 out of the 40 candidate bipolar pairs were retained for the final seven-point SD scale. Of the remaining 30 pairs, nine were consolidated into semantically overlapping retained pairs, while 21 were excluded because of insufficient relevance, limited semantic distinctiveness, or poor suitability for visual SD evaluation. The final 10 bipolar pairs were Enclosed–Open, Compact–Spacious, Regular–Free-form, Continuous–Fragmented, Heavy–Light, Rough–Delicate, Plain–Ornate, Simple–Complex, Restrained–Expressive, and Stable–Dynamic.
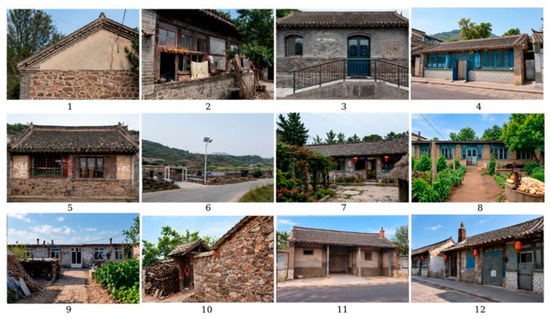
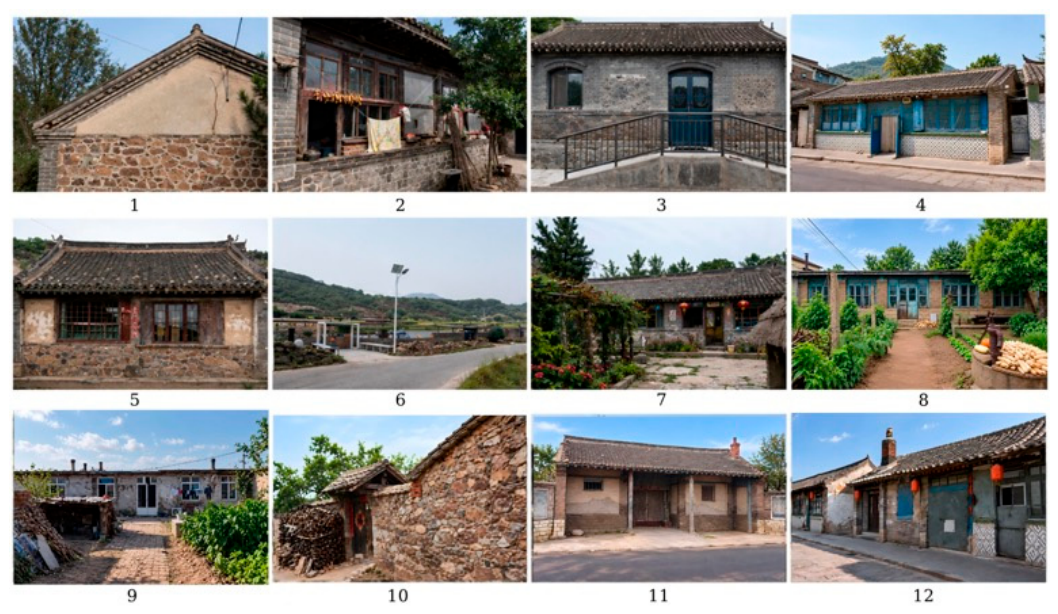
Representative images of traditional vernacular dwellings reflecting characteristics such as courtyard organization, structural forms, material textures, and architectural colors were selected. Because the images were obtained from existing documentary sources, their original photographic characteristics, including viewing angle and background context, could not be fully standardized. For questionnaire presentation, the 12 visual samples were displayed using a consistent presentation format and display size while preserving the principal architectural forms, materials, and components. The visual samples used in the Kansei evaluation are shown in Figure 3. A seven-point SD scale was employed, and participants with actual experience of using urban rail transit were invited to evaluate each standardized sample. A score of 1 indicated a strong perceptual tendency toward the adjective on the left, a score of 4 indicated no clear tendency, and a score of 7 indicated a strong tendency toward the adjective on the right. To reduce potential order effects, the dwelling images were presented in randomized order. All bipolar items were coded consistently from 1 for the left-hand adjective to 7 for the right-hand adjective.
Figure 3.
Traditional dwelling images used in the Kansei evaluation. Numbers 1–12 correspond to Sample Nos. 1–12 in Table 4.
A total of 152 passenger questionnaires were distributed, of which 117 valid responses were obtained, yielding a valid response rate of 76.97%. Among the passengers, 16 were aged 18–25 years (13.68%), 36 were aged 26–35 years (30.77%), 31 were aged 36–45 years (26.50%), and 34 were aged 46 years or older (29.06%).
Each participant evaluated all 12 visual samples using the same 10 bipolar Kansei descriptor pairs. Because the image-level ratings were repeated observations within participants, ratings for each descriptor were averaged across the 12 samples for each participant, yielding a participant-level matrix of 117 observations × 10 Kansei variables for EFA. The participant was retained as the unit of analysis, allowing the analysis to characterize general passenger-perception tendencies across the complete stimulus set without treating repeated ratings as independent observations. Averaging reduced image-specific variation, so the EFA should be interpreted as a participant-level representation of general perception across the stimulus set. Descriptive statistics are presented in Table 6.
Table 6.
Descriptive statistics of the participant-level Kansei variables.
To examine the stimulus-level variation not represented directly in the participant-level EFA, the original image-level ratings were additionally analyzed using cross-classified random-intercept linear mixed-effects models. Participant and dwelling image were specified as crossed grouping factors for each Kansei descriptor, allowing the total variance to be partitioned into participant-level, image-level, and residual components. Variance partition coefficients (VPCs) were calculated to quantify the relative contributions of participant-level, visual-sample-level, and residual variation, as shown in Table 7.
Table 7.
Variance partition coefficients from cross-classified mixed-effects models of the image-level Kansei ratings.
Across the 10 Kansei descriptors, participant-level VPCs ranged from 0.552 to 0.664, visual-sample-level VPCs ranged from 0.059 to 0.087, and residual VPCs ranged from 0.276 to 0.365.
As shown in Table 8, the Kansei variables exhibited a range of low-to-moderately strong correlations, indicating varying degrees of association among the descriptors. Several relatively strong associations were observed, including Enclosed–Open with Continuous–Fragmented (r = 0.707), Heavy–Light with Plain–Ornate (r = 0.705), Heavy–Light with Stable–Dynamic (r = 0.706), and Heavy–Light with Rough–Delicate (r = 0.621).
Table 8.
Inter-item correlation matrix of the participant-level Kansei variables.
Reliability analysis was conducted on the 10 bipolar Kansei descriptor pairs using the 117 valid questionnaires. The overall scale showed satisfactory internal consistency, with a Cronbach’s α of 0.809. The suitability of the data for factor analysis was further assessed using the Kaiser–Meyer–Olkin (KMO) measure and Bartlett’s test of sphericity [22]. As shown in Table 9, the KMO value was 0.824, and Bartlett’s test of sphericity was significant, χ2(45) = 518.442, p < 0.001, indicating that the correlation matrix was suitable for EFA.
Table 9.
Reliability and suitability tests for exploratory factor analysis.
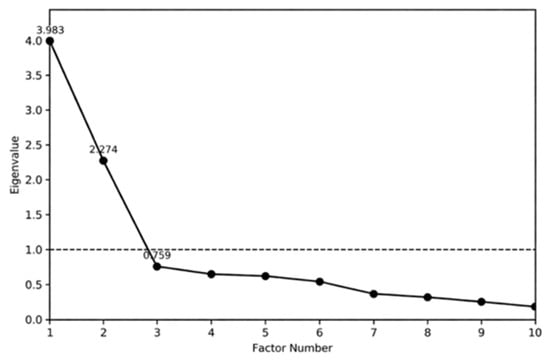
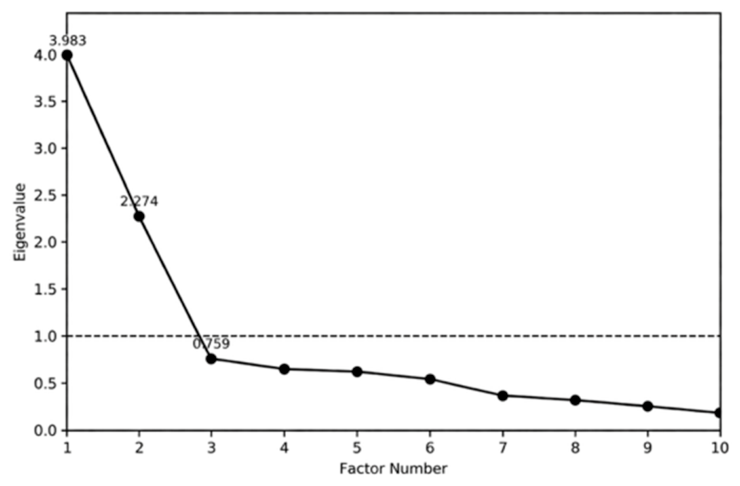
Exploratory factor analysis was subsequently conducted on the participant-level 117 × 10 matrix using principal axis factoring (PAF) as the extraction method, followed by Varimax rotation. Factor retention was evaluated using the Kaiser eigenvalue criterion, visual inspection of the scree plot, Horn’s parallel analysis, and comparison of the two-factor and three-factor PAF solutions [23]. The first three observed eigenvalues of the correlation matrix were 3.983, 2.274, and 0.759, respectively.
The first two eigenvalues exceeded the Kaiser criterion of 1.0, and the scree plot showed a marked decline across the first two factors, followed by a flatter pattern from the third factor onward (Figure 4). Horn’s parallel analysis was conducted using a common-factor procedure consistent with the PAF framework. The first three observed common-factor eigenvalues were 3.542, 1.744, and 0.153, compared with the corresponding 95th-percentile random eigenvalues of 0.757, 0.536, and 0.388, respectively.
Figure 4.
Scree plot of the participant-level Kansei variables. The dashed horizontal line indicates the Kaiser criterion (eigenvalue = 1.0).
All statistical analyses were conducted using IBM SPSS Statistics 29.0. Parallel analysis used 5000 randomly generated datasets and the 95th percentile criterion. The cross classified mixed effects models were estimated using restricted maximum likelihood (REML) with the MIXED procedure in IBM SPSS Statistics 29.0.
In this two-factor solution, the four descriptors related to spatial organization formed a distinct Spatial Order factor, whereas the remaining six descriptors formed a broader second factor combining material/surface perception and stylistic expression. The two-factor solution accounted for 53.79% of the variance, with Cronbach’s α values of 0.789 and 0.842. When a three-factor solution was specified, PAF produced an interpretable 4–3–3 item structure corresponding to Spatial Order, Material Texture, and Stylistic Tension, accounting for 56.89% of the total variance. Heavy–Light, Rough–Delicate, and Plain–Ornate loaded primarily on Material Texture, whereas Simple–Complex, Restrained–Expressive, and Stable–Dynamic loaded primarily on Stylistic Tension; the four spatial descriptors remained associated with Spatial Order. To further compare the two competing solutions, RMSR was examined for the PAF solutions. Maximum-likelihood exploratory factor analysis (ML-EFA) was additionally conducted as a sensitivity analysis to obtain RMSEA, TLI, and CFI. The comparative results are summarized in Table 10.
Table 10.
Comparison of the two- and three-factor solutions.
Parallel analysis favored the more parsimonious two-factor solution. Within this sample, the three-factor solution produced lower RMSR and RMSEA values and higher TLI and CFI values than the two-factor solution and provided greater differentiation between material/surface-related perception and broader stylistic expression. Considering these complementary findings, the three-factor structure was retained as an exploratory interpretive solution. The corresponding rotated factor loadings, communalities, and factor interpretations for the three-factor PAF solution are presented in Table 11.
Table 11.
Rotated factor loadings and communalities for the three-factor PAF solution.
Factor 1 was primarily defined by Enclosed–Open (0.809), Compact–Spacious (0.614), Regular–Free-form (0.630), and Continuous–Fragmented (0.708). These descriptors primarily reflect perceptions of spatial enclosure, scale, organization, and continuity and were therefore interpreted as the Spatial Order factor.
Factor 2 was primarily defined by Heavy–Light (0.626), Rough–Delicate (0.686), and Plain–Ornate (0.742). These descriptors reflect visually perceived material weight, surface texture and refinement, and the degree of surface or decorative elaboration. Accordingly, this factor was retained as Material Texture. In the present study, Material Texture therefore refers to material- and surface-level visual perception rather than tactile texture alone [24,25]. Although Plain–Ornate may also carry a stylistic connotation, its loading on Factor 2 was interpreted primarily in relation to the visual richness, refinement, and decorative treatment of material surfaces rather than the overall formal style of the architectural composition. Heavy–Light showed substantial loadings on both Material Texture (0.626) and Stylistic Tension (0.617), indicating residual overlap between material-related visual weight and broader stylistic expression. Its placement under Material Texture was therefore treated as an interpretive assignment based on its conceptual association with material-related visual perception.
Factor 3 was most strongly represented by Stable–Dynamic (0.758), whereas Simple–Complex (0.489) and Restrained–Expressive (0.480) showed more moderate loadings. Together, these descriptors reflect overall formal complexity, expressive intensity, and dynamism and were therefore interpreted as Stylistic Tension. In contrast to Material Texture, which concerns material- and surface-level visual characteristics, Stylistic Tension captures broader stylistic expression at the compositional level [26,27]. The relatively low communalities of Simple–Complex (0.340) and Restrained–Expressive (0.299), together with the factor-specific Cronbach’s α of 0.685, indicate weaker psychometric support for this factor. Stylistic Tension was therefore interpreted as an exploratory passenger-perception dimension because the three descriptors collectively characterize a compositional-level perceptual domain that is conceptually distinct from the material- and surface-related perceptions represented by Material Texture. In the two-factor solution, these two perceptual domains were combined into a broader factor, whereas the three-factor representation preserved this distinction.
At the participant level, the exploratory three-factor representation accounted for 56.89% of the total variance, with Spatial Order, Material Texture, and Stylistic Tension accounting for 21.45%, 18.72%, and 16.72%, respectively (Table 12).
Table 12.
Factor variance explanation.
2.4. FAHP-Based Prioritization of Passenger-Compartment CMF Design Elements
Based on the exploratory three-factor representation retained from the Kansei analysis—Spatial Order, Material Texture, and Stylistic Tension—FAHP was employed to determine the expert-assessed relative priorities of the CMF design elements for the light-rail passenger compartment [12]. The three dimensions served as the evaluation criteria, while the experts assessed the relative priority of the CMF elements under each dimension. The resulting FAHP weights therefore represent aggregated expert judgments of relative design priority.
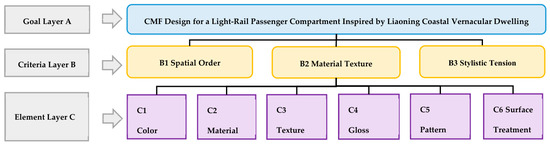
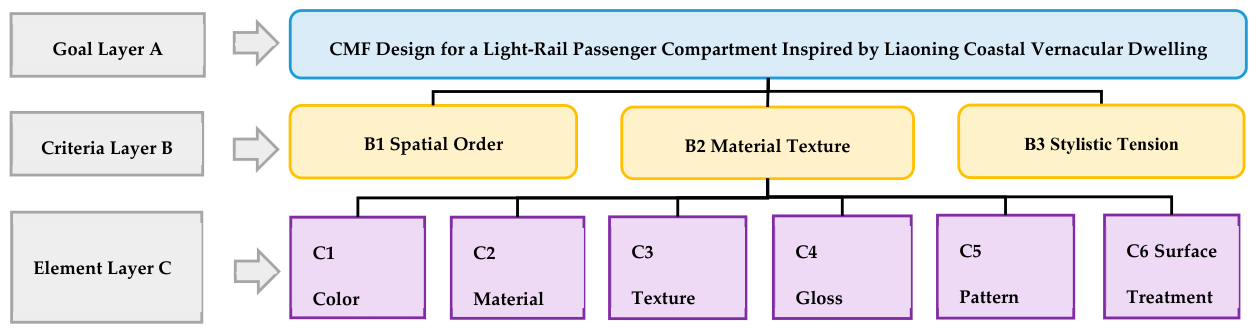
With CMF design for a light-rail passenger compartment inspired by Liaoning coastal vernacular dwelling culture defined as the goal layer (A), Spatial Order (B1), Material Texture (B2), and Stylistic Tension (B3) constituted the criterion layer, while Color (C1), Material (C2), Texture (C3), Gloss (C4), Pattern (C5), and Surface Treatment (C6) constituted the element layer. A three-level FAHP hierarchical evaluation model was therefore established, as shown in Figure 5.
Figure 5.
FAHP hierarchical evaluation model.The different frame colors distinguish the goal, criteria, and element layers and do not represent quantitative values or priority levels.
2.4.1. Weight Calculation
Twelve experts participated in the FAHP evaluation. Experts were selected based on their research or professional experience in fields directly related to the evaluation framework. According to their primary professional backgrounds, the panel comprised five experts in rail transit and industrial design, three experts in CMF and material design, and four experts in vernacular architecture and regional culture. All experts had more than three years of relevant research or professional experience. Before the evaluation, the research objectives, hierarchical structure, and definitions of all criteria and CMF design elements were explained to the experts to ensure a common understanding of the evaluation task.
Before fuzzy conversion and group aggregation, the consistency of each expert’s original Saaty judgment matrices was assessed using the CR [28]. A CR value below 0.10 was considered acceptable. Each expert completed one 3 × 3 criterion-level matrix and three 6 × 6 element-level matrices. All 48 individual matrices from the 12 experts satisfied this criterion, as shown in Table 13.
Table 13.
Individual consistency ratios of the 12 FAHP experts.
In addition to assessing the internal consistency of each expert’s judgment matrices, inter-expert agreement was evaluated using Kendall’s coefficient of concordance (W) [29]. Kendall’s W was calculated separately for the criterion layer and for the six CMF design elements under Spatial Order (B1), Material Texture (B2), and Stylistic Tension (B3).
As shown in Table 14, Kendall’s W was 0.674 for the criterion layer and 0.577, 0.627, and 0.577 for Spatial Order, Material Texture, and Stylistic Tension, respectively. All four concordance tests were statistically significant (p < 0.001), indicating meaningful inter-expert concordance.
Table 14.
Inter-expert agreement assessed using Kendall’s coefficient of concordance (W).
Pairwise comparisons were conducted using Saaty’s 1–9 scale, and the judgments were converted into triangular fuzzy numbers (TFNs) according to the conversion rules presented in Table 15 [30].
Table 15.
Conversion of Saaty’s 1–9 scale into triangular fuzzy numbers.
The TFNs were used to represent the uncertainty inherent in expert judgments. The fuzzy judgment matrix is defined in Equation (1):
where denotes the fuzzy judgment assigned by expert k to the relative importance of indicator i over indicator j. When i = j, . For i ≠ j, the fuzzy judgment is represented by a triangular fuzzy number, as defined in Equation (2):
where and denote the lower, modal, and upper values, respectively, of the triangular fuzzy number representing expert k’s judgment of the relative importance of indicator i over indicator j. The reciprocal fuzzy judgment is defined in Equation (3):
The accepted expert judgments were aggregated using the component-wise geometric mean [31]. For K experts, the aggregated fuzzy judgment for indicator i relative to indicator j was calculated using Equation (4):
where K = 12 denotes the number of experts, and denotes the aggregated fuzzy judgment of the expert group regarding the relative importance of indicator i over indicator j.
Based on the experts’ pairwise comparisons of the three criteria, a fuzzy judgment matrix for the criterion layer was constructed, as shown in Table 16. In addition to the criterion-level matrix, the aggregated fuzzy judgment matrices for the six CMF design elements under Spatial Order (B1), Material Texture (B2), and Stylistic Tension (B3) are presented in Table 17, Table 18 and Table 19.
Table 16.
Aggregated fuzzy judgment matrix for the criterion layer.
Table 17.
Aggregated fuzzy judgment matrix of CMF design elements under Spatial Order (B1).
Table 18.
Aggregated fuzzy judgment matrix of CMF design elements under Material Texture (B2).
Table 19.
Aggregated fuzzy judgment matrix of CMF design elements under Stylistic Tension (B3).
The weights were calculated using the fuzzy geometric mean method [32]. For the i-th row of the judgment matrix, the fuzzy geometric mean is calculated as shown in Equation (5):
The fuzzy geometric means were then summed to obtain as shown in Equation (6):
where and denote the lower, modal, and upper values, respectively, of the fuzzy geometric mean for indicator i. The fuzzy weight of the i-th indicator was subsequently calculated using Equation (7):
where denotes multiplication of triangular fuzzy numbers, and denotes the multiplicative inverse of the triangular fuzzy number .
2.4.2. Defuzzification and Normalization
To obtain crisp weights suitable for comparison and ranking, the fuzzy weights were defuzzified using the centroid method. Let the fuzzy weight of the i-th indicator be . Its defuzzified value is then calculated as . The defuzzified values were then normalized using Equation (8):
Using this procedure, the normalized weights of the three criteria and the local weights of the six CMF design elements under each criterion were obtained. Because the reported weights were rounded to three decimal places, minor deviations from 1.000 may occur.
As shown in Table 20, Material Texture (B2) received the highest normalized criterion weight (0.640), followed by Spatial Order (B1) (0.224) and Stylistic Tension (B3) (0.136). The same defuzzification and normalization procedures were then applied at the element level. The resulting fuzzy weights, defuzzified values, and normalized local weights of the six CMF design elements under each criterion are presented in Table 21.
Table 20.
Criterion-level FAHP weights after defuzzification and normalization.
Table 21.
Element-level FAHP local weights under the passenger-perception dimensions.
As shown in Table 21, the local priorities of the CMF elements varied across the three criteria. Under Spatial Order (B1), Color (C1) and Pattern (C5) received relatively high local weights. Under Material Texture (B2), Material (C2) and Texture (C3) ranked highest, whereas under Stylistic Tension (B3), Color (C1) and Pattern (C5) were prioritized. These local weights were subsequently combined with the criterion weights to calculate the global weights of the six CMF design elements.
2.4.3. Consistency Test
To assess the consistency of the aggregated expert judgment, the modal value mij of each triangular fuzzy judgment value was used to construct a crisp reciprocal judgment matrix. The maximum eigenvalue, is calculated as shown in Equation (9) [28]:
The consistency index (CI) is calculated as shown in Equation (10):
The consistency ratio (CR) is calculated as shown in Equation (11):
where A denotes the crisp reciprocal judgment matrix, W denotes the corresponding priority vector, n denotes the order of the matrix, and RI denotes the average random consistency index. For the 3 × 3 criterion-layer matrix, RI = 0.58, whereas for the 6 × 6 element-level matrices, RI = 1.24. A judgment matrix was considered acceptably consistent when CR < 0.10; otherwise, the corresponding pairwise comparisons required reassessment.
Using this procedure, consistency was evaluated for the criterion-layer matrix and the three element-level matrices. The resulting CR values were 0.000002 for the criterion layer, 0.058269 for Spatial Order (B1), 0.068621 for Material Texture (B2), and 0.062922 for Stylistic Tension (B3). All four CR values were below 0.10, indicating that the aggregated criterion-level and element-level judgment matrices satisfied the consistency requirement and were retained for the subsequent FAHP weighting analysis.
2.4.4. Global Weighting and Ranking of Design Elements
Let denote the normalized weight of criterion Bk, and let denote the local weight of CMF element Cj under criterion Bk. The global weight of Cj is calculated as shown in Equation (12):
where denotes the global weight of CMF element Cj. The six elements were ranked according to their resulting global weights. The global weights represent expert-assessed design priorities within the FAHP hierarchy.
As shown in Table 22, Material (C2) received the highest global weight (0.229), followed by Texture (C3) (0.204) and Color (C1) (0.182). These were followed by Surface Treatment (C6) (0.180), Pattern (C5) (0.113) and Gloss (C4) (0.092). The global weights of Color and Surface Treatment were relatively close.
Table 22.
Global weights of the CMF design elements.
These rankings guided the subsequent designer-led CMF translation, with greater emphasis placed on the higher-priority elements in material selection, texture organization, and color relationships.
2.4.5. Sensitivity Analysis
A criterion-weight sensitivity analysis was conducted to assess the stability of the global ranking of the six CMF design elements. Each criterion weight was independently varied by ±10% from its baseline value, while the remaining two weights were proportionally adjusted to maintain a total of 1.000. The element-level local weights were held constant, and the global weights were recalculated under six perturbation scenarios. An additional criterion-omission scenario was examined by setting the weight of Stylistic Tension (B3) to zero and proportionally renormalizing the weights of Spatial Order (B1) and Material Texture (B2), as shown in Table 23.
Table 23.
Criterion-weight sensitivity analysis of the global CMF-element priorities.
Material (C2) and Texture (C3) remained first and second across all scenarios, while Pattern (C5) and Gloss (C4) consistently remained fifth and sixth. Among the ±10% perturbation scenarios, Color (C1) and Surface Treatment (C6) exchanged the third and fourth positions under B1 − 10% and B2 + 10% and were tied under B3 − 10% at the reported three-decimal precision. In the additional B3-omission scenario, Material and Texture remained the two highest-ranked elements, while Surface Treatment and Color occupied the third and fourth positions, respectively. Overall, the principal priority pattern remained stable, whereas the ordering of the middle-ranked elements was more sensitive to changes in criterion weights and structure.
3. Cultural Imagery and FAHP-Guided CMF Translation
The local FAHP weights of the CMF design elements under each passenger-perception dimension were used to establish relative design priorities for the subsequent CMF translation. To ensure a consistent prioritization rule, the six elements were ranked in descending order by their normalized local weights, and the three highest-ranked elements were designated as primary translation carriers; the remaining three were retained as complementary design considerations. Rather than directly replicating external cultural symbols, the translation process sought to connect the identified cultural characteristics with appropriate CMF design attributes [33]. Guided by the FAHP-derived priorities, the designer subsequently translated the prioritized CMF elements into specific design decisions concerning hue, lightness, chroma, material category, texture direction, pattern density, gloss level, and surface-treatment techniques [34]. These parameter-level decisions represent designer-led interpretations informed by the cultural analysis and FAHP priorities.
Based on the FAHP results, the local weight reflects the expert-assessed relative priority of CMF design element Cj under passenger-perception dimension Bk. For the subsequent design translation, this local weight was used as the design-priority coefficient as shown in Equation (13):
where Rkj represents the relative design priority of CMF design element Cj under passenger-perception dimension Bk. A higher value of indicates a higher expert-assessed priority for considering the corresponding CMF element in the subsequent design translation. This coefficient serves as a prioritization guide rather than an empirical measure of a causal or predictive relationship between the CMF element and passenger perception.
- •
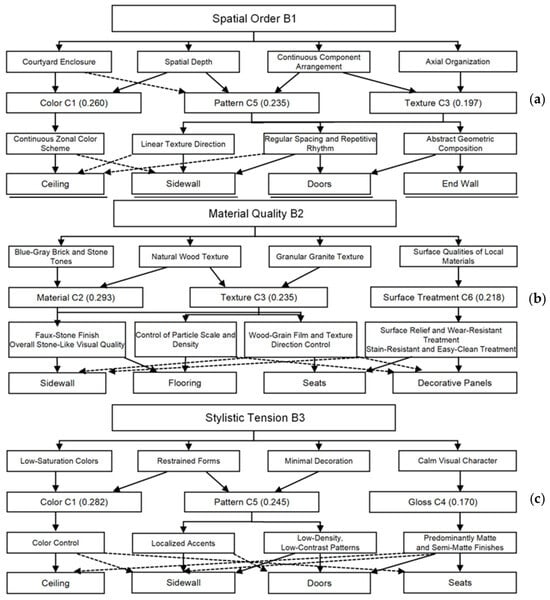
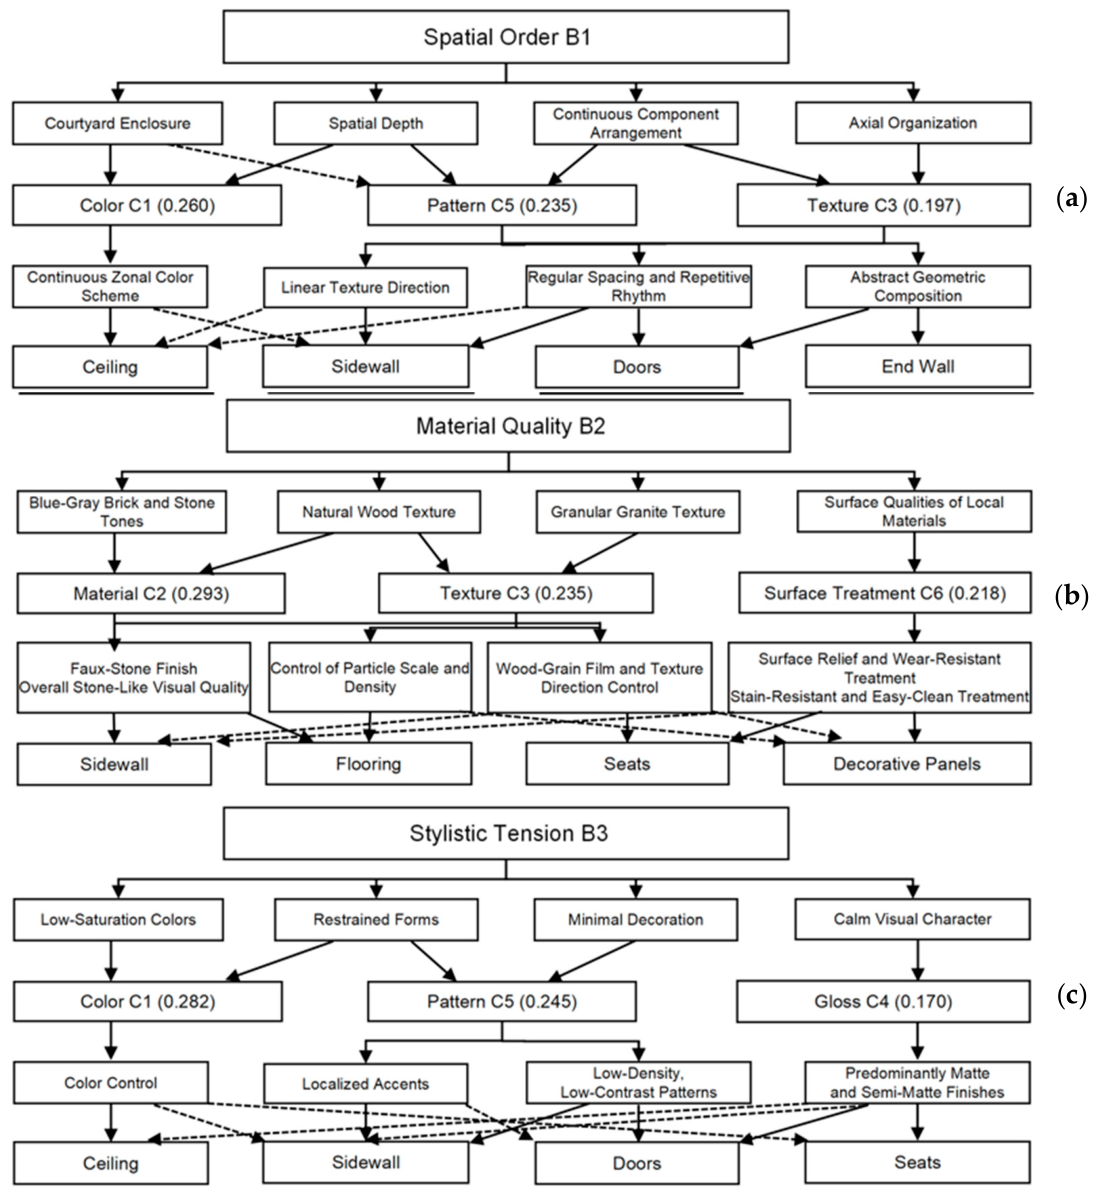
- FAHP-guided translation of Spatial Order, as shown in Figure 6a: Spatial Order was translated with reference to courtyard enclosure, axial organization, spatial depth, and component sequence. Color (C1, 0.260), Pattern (C5, 0.235), and Texture (C3, 0.197) were prioritized according to their local FAHP weights. These priorities informed the use of color zoning, differentiated lightness levels, continuous texture organization, and regular visual repetition to express continuity, order, and spatial hierarchy within the passenger compartment;Figure 6. FAHP-guided CMF translation for the three passenger-perception dimensions: (a) Spatial Order; (b) Material Texture; (c) Stylistic Tension.
- •
- FAHP-guided translation of Material Texture, as shown in Figure 6b: Material Texture was translated with reference to the natural colors, visual textures, and surface characteristics of local materials such as brick, stone, and wood. Material (C2, 0.293), Texture (C3, 0.235), and Surface Treatment (C6, 0.218) were prioritized. Accordingly, stone-like and wood-grain visual expressions, fabric textures, and embossed surface treatments were incorporated to develop the material and surface character of the CMF proposal;
- •
- FAHP-guided translation of Stylistic Tension, as shown in Figure 6c: Stylistic Tension was translated with reference to low-chroma color relationships, simplified decoration, restrained formal expression, and visual stability. Color (C1, 0.282), Pattern (C5, 0.245), and Gloss (C4, 0.170) were prioritized. These priorities informed the use of low-chroma color relationships, simplified pattern expressions, predominantly matte surfaces, and limited accent colors to create a restrained yet visually layered stylistic expression.
4. Conceptual CMF Design Scheme for the Light-Rail Passenger Compartment
The conceptual CMF design proposal was developed for the application context of the Dalian Metro Line 12 passenger compartment. The vehicle configuration was referenced to the Dalian Route 202 extension-line rapid-transit vehicle developed by CRRC Dalian for the former Route 202 rail-line extension project, which was subsequently renamed Dalian Metro Line 12 [35]. The reference vehicle is a standard B2-type vehicle with a maximum operating speed of 100 km/h and a lightweight integral load-bearing welded stainless-steel carbody [36]. The use of high-strength stainless steel was reported to address the humid and relatively saline coastal operating environment along the route and to enhance corrosion resistance.
Guided by the passenger-perception dimensions and expert-assessed FAHP priorities, selected characteristics of Liaoning coastal vernacular dwellings—including courtyard order, structural rhythm, brick-, stone-, and wood-related visual characteristics, and a restrained low-chroma aesthetic—were translated into conceptual CMF decisions for the passenger compartment. The FAHP results established the relative priorities of Color, Material, Texture, Gloss, Pattern, and Surface Treatment under the three passenger-perception dimensions and informed subsequent decisions concerning color zoning, material expression, texture organization, pattern application, gloss control, and surface treatment. The relationships among the FAHP-derived priorities, cultural references, design decisions, and applied interior interfaces are shown in Table 24.
Table 24.
Traceability between FAHP-derived CMF priorities and conceptual design decisions.
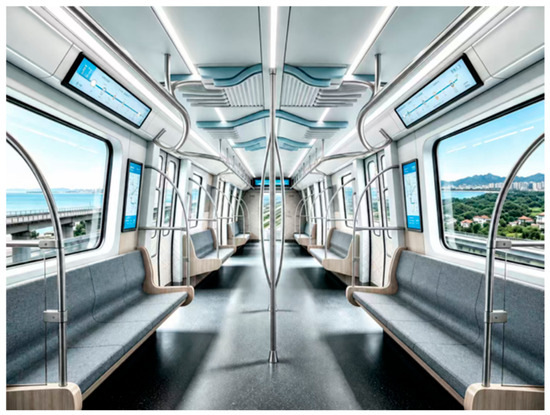
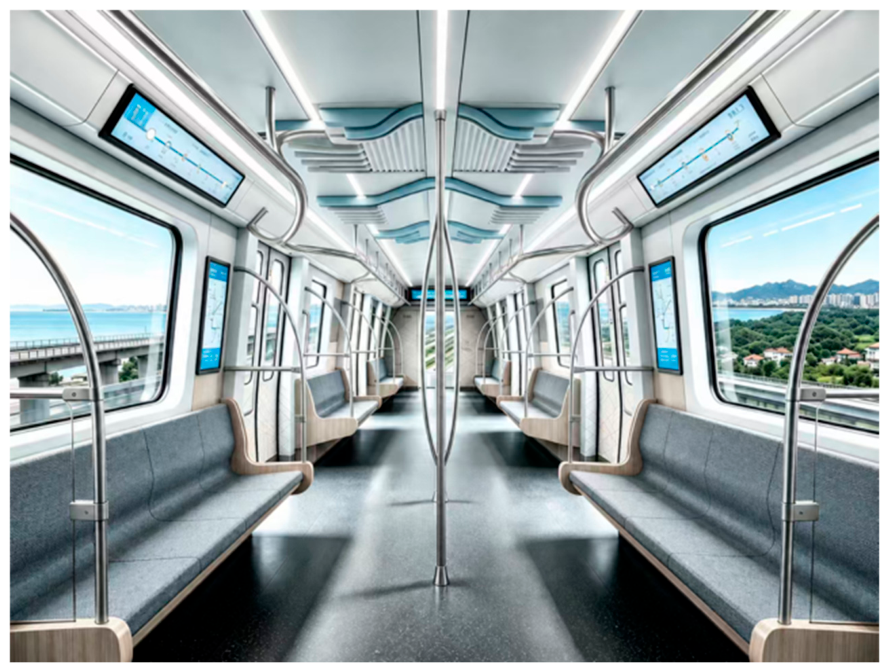
Based on these priority–decision relationships, the corresponding CMF applications were developed for the ceiling, sidewalls, doors, seats, flooring, and end walls. The resulting CMF design requirements were then used as the basis for preliminary visual exploration. Midjourney was employed during this stage to generate initial visual drafts reflecting the established color relationships, material expressions, textures, patterns, and overall stylistic direction. The generated drafts were reviewed by the designer, and the selected design direction was subsequently developed and modeled in Autodesk 3ds Max. V-Ray was used for material, lighting, and rendering settings. The rendered images were then manually refined in Adobe Photoshop for visual-detail adjustment and final presentation. The resulting conceptual CMF design is shown in Figure 7.
Figure 7.
Conceptual CMF design proposal for the Dalian Metro Line 12 light-rail passenger compartment.
The resulting scheme is presented as a conceptual design rather than a production-ready engineering solution. Candidate materials and finishes would require further specification and verification against applicable rail-vehicle requirements before practical implementation, including the fire-protection requirements specified in CJ/T 416—2012 [37].
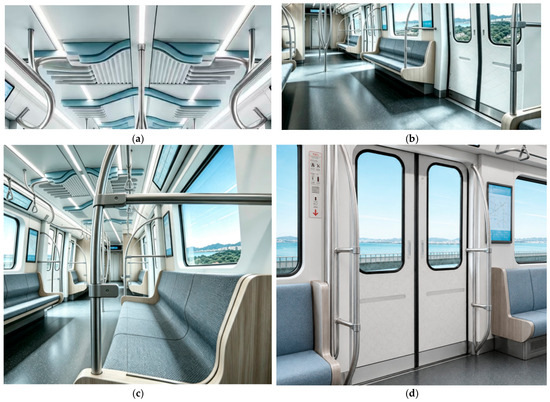
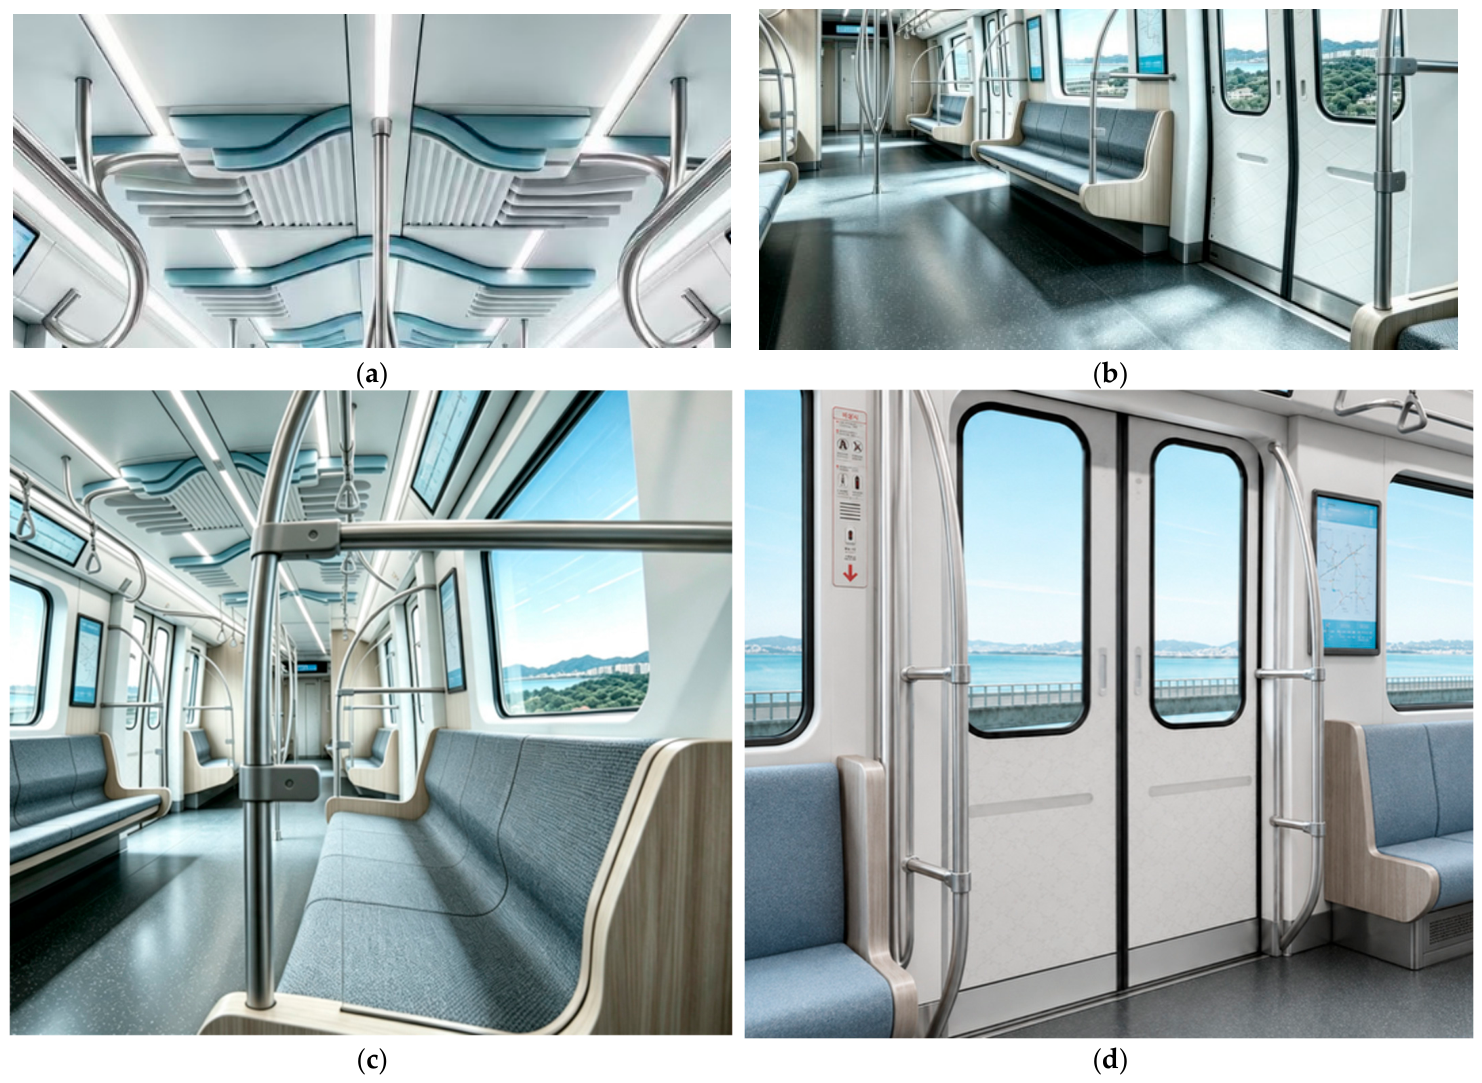
- •
- Spatial Order design of the ceiling and sidewalls, as shown in Figure 8a: Under Spatial Order, Color (C1, 0.260), Pattern (C5, 0.235), and Texture (C3, 0.197) received the highest local FAHP weights. Accordingly, the ceiling employs a continuous longitudinal composition, symmetrical layouts, regular spacing, and repetitive linear organization to express axial order and spatial continuity. A grayish-white base with low-chroma blue-gray accents provides differentiated lightness and restrained contrast, while continuous low-contrast textures on the sidewalls reinforce spatial enclosure and continuity;Figure 8. FAHP-guided CMF applications in the conceptual light-rail passenger-compartment design: (a) Spatial Order design of the ceiling and sidewalls; (b) Flooring and texture concept; (c) Material Texture design of the seats and decorative panels; (d) Stylistic Tension and cultural-pattern application to the doors and end walls.
- •
- Flooring and surface-treatment concept, as shown in Figure 8b: The flooring uses a dark-gray, fine-grained, stone-inspired texture to contrast with the lighter ceiling and sidewalls while maintaining low visual complexity. The treatment references the material characteristics of Liaoning coastal vernacular dwellings without directly reproducing traditional stone surfaces;
- •
- Material Texture design of the seats and decorative panels, as shown in Figure 8c: Under Material Texture, Material (C2, 0.293), Texture (C3, 0.235), and Surface Treatment (C6, 0.218) received the highest local FAHP weights. Low-chroma gray-blue fabric with fine woven textures is applied to the seats, while light wood-grain finishes and selective embossed treatments are used on seat-end and wall panels. These treatments reinterpret brick-, stone-, and wood-related visual characteristics through contemporary material and surface expressions;
- •
- Stylistic Tension and cultural-pattern design of the doors and end walls, as shown in Figure 8d: Under Stylistic Tension, Color (C1, 0.282), Pattern (C5, 0.245), and Gloss (C4, 0.170) received the highest local FAHP weights. The doors and end walls therefore employ a restrained low-chroma gray-blue palette, low-density abstract geometric patterns, and predominantly matte or low-gloss surfaces. Courtyard boundaries, axial relationships, and repeated architectural components are abstracted into fine-line geometric patterns to provide subtle regional visual cues.
5. User Evaluation of the Proposed CMF Design
To assess participants’ perceptions and acceptance of the proposed CMF design for the light-rail passenger compartment, a user evaluation was conducted using the final design renderings. Responses were screened before analysis. Questionnaires were excluded if they were incomplete, contained substantial missing responses, or showed clearly patterned responses indicating insufficient engagement, such as invariant responses across the evaluation items. After screening, 115 out of the 130 returned questionnaires were retained, corresponding to a valid response rate of 88.46%. The questionnaire was anonymous and participation was voluntary. Before beginning the survey, participants were informed of the study purpose, the anonymous nature of the questionnaire, and the use of the collected data. Consent was implied by their voluntary completion of the questionnaire.
Participants were recruited through online questionnaire distribution, networks of individuals with urban-rail travel experience, offline recruitment, and relevant university and professional networks. Group membership was determined according to self-reported educational, research, or occupational background. The final sample comprised 62 general passengers (53.91%), 26 design practitioners or researchers (22.61%), and 27 cultural-tourism or regional-culture practitioners or researchers (23.48%). Of the 115 participants, 49 were male (42.61%) and 66 were female (57.39%). In terms of age, 22 participants (19.13%) were aged 18–25 years, 35 (30.43%) were aged 26–35 years, 31 (26.96%) were aged 36–45 years, and 27 (23.48%) were aged 46 years or older. For Liaoning culture, 25.22% of participants reported low familiarity, 21.74% moderate familiarity, and 53.04% relatively high familiarity. The corresponding proportions for Liaoning coastal culture were 34.78%, 21.74%, and 43.48%, respectively.
The evaluation materials consisted of overall and detailed renderings of the passenger compartment, including the ceiling, sidewalls, doors, seats, and flooring. All images were presented using consistent aspect ratios, resolution, background presentation, and color representation to minimize differences in visual presentation.
The design-evaluation section comprised 14 items across five dimensions: Spatial Order (2 items), Material Texture (3 items), Stylistic Tension (3 items), Perceived Cultural Correspondence (3 items), and Visual Comfort (3 items), as shown in Table 25. The first three dimensions corresponded to the passenger-perception dimensions identified in the preceding Kansei analysis. Perceived Cultural Correspondence assessed the extent to which the proposed design was perceived to correspond with the cultural characteristics of Liaoning coastal vernacular dwellings, whereas Visual Comfort assessed the participants’ overall visual experience of the proposed design. The questionnaire employed a 7-point Likert scale, where 1 represented “strongly inconsistent”, 4 represented “neutral”, and 7 represented “strongly consistent” [38].
Table 25.
Items used in the final user-evaluation questionnaire.
Each evaluation dimension comprised two or three items. For each participant, the score for a given dimension was calculated as the arithmetic mean of the corresponding item scores. Let denote the score assigned by participant i to item r within dimension d, and md denote the number of items in dimension d. The participant-level composite score for dimension d was calculated as in Equation (14):
After the composite scores were obtained for all 115 participants, the mean score for each dimension was calculated as: . The standard deviation for each dimension was calculated as: . Here, represents the mean composite score for dimension d, and Sd represents the dispersion of the participants’ composite scores. Higher mean scores indicate more positive evaluations of the corresponding dimension.
The neutral midpoint of the 7-point Likert scale (4) was used as the reference value. The hypotheses were specified as H0: μd = 4 and H1: μd > 4. A one-sample t-test was conducted for each composite dimension score using: with df = 114. When > 4 and the one-tailed test yielded p < 0.05, the mean composite score was interpreted as significantly above the neutral midpoint. Parametric analysis of the composite scores was used when the relevant statistical assumptions were adequately satisfied [39].
Item-level performance was examined before the reliability and structural characteristics of the final user-evaluation questionnaire were assessed. As shown in Table 26, the mean, standard deviation, and corrected item–total correlation were calculated for each of the 14 evaluation items.
Table 26.
Item-level descriptive statistics and corrected item–total correlations.
The reliability and exploratory structural characteristics of the 14-item user-evaluation scale were then examined. Internal consistency was assessed using Cronbach’s α and mean inter-item correlations. The KMO measure and Bartlett’s test of sphericity were used to assess the suitability of the correlation matrix for component analysis. A theory-specified five-component PCA with Varimax rotation was subsequently conducted to examine whether the observed item structure was consistent with the predefined five dimensions [22].
Cronbach’s α ranged from 0.709 to 0.798 across the five dimensions, with an overall value of 0.807. Mean inter-item correlations ranged from 0.501 to 0.572. The KMO value was 0.757, and Bartlett’s test of sphericity was significant, χ2(91) = 500.582, p < 0.001, supporting the suitability of the 14-item correlation matrix for exploratory component analysis (Table 27).
Table 27.
Internal consistency and suitability for structural analysis of the user evaluation.
As shown in Table 28, all 14 items loaded most strongly on their intended components. The primary component loadings ranged from 0.768 to 0.851, and the communalities ranged from 0.659 to 0.777.
Table 28.
Rotated component loadings for the user evaluation.
The eigenvalues and explained variance of the theory-specified five-component PCA solution are summarized in Table 29.
Table 29.
Eigenvalues and explained variance of the theory-specified five-component PCA solution.
The theory-specified five-component solution accounted for 71.49% of the total variance. The eigenvalues of the five retained components were 4.020, 1.712, 1.573, 1.503, and 1.199, accounting for 28.71%, 12.23%, 11.24%, 10.74%, and 8.57% of the total variance, respectively. The five-component solution was specified a priori on the basis of the five theoretically defined evaluation dimensions. The PCA was used as an exploratory assessment of whether the observed item grouping was consistent with the predefined questionnaire structure.
As shown in Table 30, all five composite dimension scores were significantly above the neutral midpoint of 4 (all p < 0.001). Material Texture received the highest mean score (M = 5.864, SD = 0.641). Visual Comfort (M = 5.794, SD = 0.662) and Spatial Order (M = 5.713, SD = 0.682) followed. Perceived Cultural Correspondence received the lowest mean score (M = 5.475, SD = 0.777). Skewness ranged from −0.386 to −0.121 and excess kurtosis from −0.344 to 0.277, indicating only mild distributional asymmetry. The Wilcoxon signed-rank tests yielded the same inference for all five dimensions (all p < 0.001).
Table 30.
Composite-score statistics and robustness analyses.
To examine differences among participant groups, the five composite dimension scores were compared using Welch’s one-way ANOVA, accounting for unequal group sizes and potential heterogeneity of variance. Significant omnibus effects were followed by Games–Howell post hoc comparisons, as shown in Table 31.
Table 31.
Between-group comparisons of the user-evaluation dimensions.
Welch’s ANOVA showed no significant between-group differences in Spatial Order, Material Texture, Stylistic Tension, or Visual Comfort (all p > 0.05). A significant group effect was observed for Perceived Cultural Correspondence (Welch’s F = 6.543, p = 0.003). Games–Howell post hoc comparisons were therefore conducted for this dimension.
As shown in Table 32, the Perceived Cultural Correspondence scores were significantly higher in the cultural-tourism/regional-culture group than in the general-passenger group (mean difference = 0.619, 95% CI [0.209, 1.029], p = 0.002).
Table 32.
Games–Howell post hoc comparisons.
6. Discussion
Material and Texture received the highest global FAHP priorities, followed by Color. Their prominence may reflect the recurring use of brick, stone, wood, and natural surface qualities in the vernacular dwelling samples, and their applicability across multiple passenger-compartment interfaces. Recent CMF studies also show that color, material, and texture influence style imagery and perceptual responses [6]. The FAHP weights represent expert-assessed design priorities, whereas the CMF parameter choices remain designer-led.
Material Texture received the highest mean score, whereas Perceived Cultural Correspondence received the lowest. All five dimensions remained significantly above the neutral midpoint. The relatively lower cultural-correspondence score may reflect the restrained and abstract translation strategy, which maintained visual coherence but made regional cultural cues less explicit. Recent studies of subway environments have identified differences between intended cultural representation and passenger perception [15]. Because the Liaoning coastal vernacular theme was disclosed in the questionnaire, these scores represent perceived correspondence with a stated theme. The higher Perceived Cultural Correspondence scores in the cultural-tourism/regional-culture group compared with the general-passenger group further suggest that cultural-correspondence judgments may vary with participants’ professional or cultural background.
Several methodological limitations should be acknowledged. First, the 12 photographic stimuli were presented using a consistent format and display size, but their original photographic characteristics—including viewpoint, lighting, cropping, weather, background, and vegetation—could not be fully controlled. Participant-level averaging in the EFA emphasized general perceptual patterns across the visual-sample set and reduced image-specific variation. The resulting factors should be interpreted as participant-level perceptual patterns across the stimulus set. Mixed-effects analysis of the original image-level ratings showed greater participant-level than visual-sample-level variation. Visual-sample variance remained non-zero, indicating perceptual differences among the dwelling images.
Second, the three-factor Kansei solution provided an exploratory representation that distinguished material/surface perception from broader stylistic expression. Although parallel analysis favored the more parsimonious two-factor solution, the three-factor solution yielded lower RMSR and RMSEA values and higher TLI and CFI values in the present sample. The three-factor structure was retained as an exploratory interpretive solution to preserve this distinction. Stylistic Tension showed weaker psychometric support than the other two factors, and should remain provisional until replicated in an independent sample. Third, the cultural-characteristic analysis relied on literature- and image-based synthesis without a formal multi-coder procedure; inter-rater reliability was not assessed. The final user evaluation examined a single digitally rendered CMF scheme. The theory-specified five-component PCA showed that the observed item grouping was broadly consistent with the predefined evaluation structure, but it does not independently establish construct validity [40]. Anonymous data collection also prevented the verification of participant overlap across study stages and possible familiarity effects.
Future research should test the Kansei structure in larger independent samples. Larger participant and stimulus samples could support multilevel factor analysis of perceptual structures at both levels [41]. Controlled studies using standardized photographic or digitally reconstructed stimuli could compare CMF schemes derived from the two-factor and three-factor structures. Such comparisons could examine whether retaining Stylistic Tension produces meaningful differences in design translation and user evaluation while reducing the influence of irrelevant photographic characteristics. The five-dimensional evaluation structure should also be examined through confirmatory analysis in a separate sample. Unprompted cultural-recognition tasks could distinguish spontaneous recognition from judgments made after the disclosure of the regional theme. Validation should also extend beyond static renderings. Recent research on automotive interiors has examined the effects of surface texture and color on the visuo-tactile perception of synthetic leather for automotive seats [42]. VR-based studies in engineering product development have also evaluated immersive systems in relation to software, hardware, and user-related factors [43]. Future rail-interior studies could extend these approaches through immersive passenger-compartment evaluation, physical samples, full-scale mock-ups, and engineering tests for assessing the applicability of candidate materials and surface treatments under relevant rail-vehicle requirements.
7. Conclusions
This study proposed a Cultural–Passenger–Compartment translation framework for applying the cultural characteristics of Liaoning coastal vernacular dwellings to the CMF design of light-rail passenger compartments. Using representative dwelling images as cultural samples, KE and EFA yielded an exploratory participant-level three-factor representation of general perception across the visual-sample set, comprising Spatial Order, Material Texture, and Stylistic Tension. FAHP was then used to determine expert-assessed priorities among the six CMF elements, with Material, Texture, and Color receiving the three highest global priorities. These results, together with the identified cultural characteristics, informed a designer-led conceptual CMF scheme. User evaluation showed that scores across all five predefined evaluation dimensions were significantly above the neutral midpoint. Overall, the proposed framework provides a structured and traceable process linking cultural analysis, expert prioritization, designer interpretation, and user evaluation. Future studies should compare multiple design alternatives, test the framework with independent samples, and further examine the relationships between cultural characteristics and specific CMF parameters.
Supplementary Materials
The following supporting information can be downloaded at: https://www.mdpi.com/article/10.3390/buildings16214268/s1, Table S1: Source and provenance registry for the collected visual materials.
Author Contributions
Conceptualization and methodology, J.L. (Jingying Li) and J.L. (Ji Li); investigation, analysis, data curation, visualization, and writing—original draft, J.L. (Jingying Li); validation, all authors; writing—review and editing, J.L. (Ji Li) and B.H.; supervision and project administration, J.L. (Ji Li). All authors have read and agreed to the published version of the manuscript.
Funding
This research was funded by the Basic Research Projects of the Education Department of Liaoning Province in 2025 under the project “Research on the Inheritance and Innovation of Liaoning’s Red Heritage in Cultural and Creative Product Design from the Perspective of Artificial Intelligence” (grant number LJ112510150002). This research was also funded by China Association of Higher Education, 2026 Higher Education Scientific Research Planning Project “Research on the Dynamic Dissemination Model and Practical Mechanism of University Spiritual Culture from the Perspective of Cultural and Creative Product Development” Project ID: CA260703006, and received partial financial support from the Liaoyang Poultry and Livestock Machinery Research Institute.
Institutional Review Board Statement
The study procedures were assessed in accordance with the ethics review procedure of Dalian Jiaotong University. Formal ethics committee review was considered unnecessary because the study used anonymous and voluntary questionnaires, involved no intervention, collected no sensitive or personally identifiable information, and included only adult participants. Participants received information about the study before completing the questionnaire, and consent was indicated through their voluntary participation.
Informed Consent Statement
Informed consent was implied by the participants’ voluntary decision to proceed with and complete the questionnaire after they had been informed of the study purpose, the anonymous nature of the questionnaire, and the use of the collected data.
Data Availability Statement
Summary data supporting the findings of this study are presented in the article. The anonymized questionnaire data and related analysis results are available from the corresponding author upon reasonable request.
Conflicts of Interest
The authors declare no conflicts of interest.
Abbreviations
The following abbreviations are used in this manuscript:
| CMF | Color, Material, and Finish |
| KE | Kansei Engineering |
| FAHP | Fuzzy Analytic Hierarchy Process |
| SD | Semantic Differential |
| EFA | Exploratory Factor Analysis |
| PAF | Principal Axis Factoring |
| ML-EFA | Maximum-Likelihood Exploratory Factor Analysis |
| KMO | Kaiser–Meyer–Olkin |
| VPC | Variance Partition Coefficient |
| RMSR | Root Mean Square Residual |
| RMSEA | Root Mean Square Error of Approximation |
| TLI | Tucker–Lewis Index |
| CFI | Comparative Fit Index |
| PCA | Principal Component Analysis |
| ANOVA | Analysis of Variance |
| TFN | Triangular Fuzzy Number |
| CI | Consistency Index |
| RI | Random Index |
| CR | Consistency Ratio |
Appendix A
Table A1.
Initial bipolar Kansei descriptor pool, semantic classification, and final treatment.
Figure A1.
Overview of the literature-source registry used for cultural-sample identification and architectural-characteristic analysis [5,18,19,20].
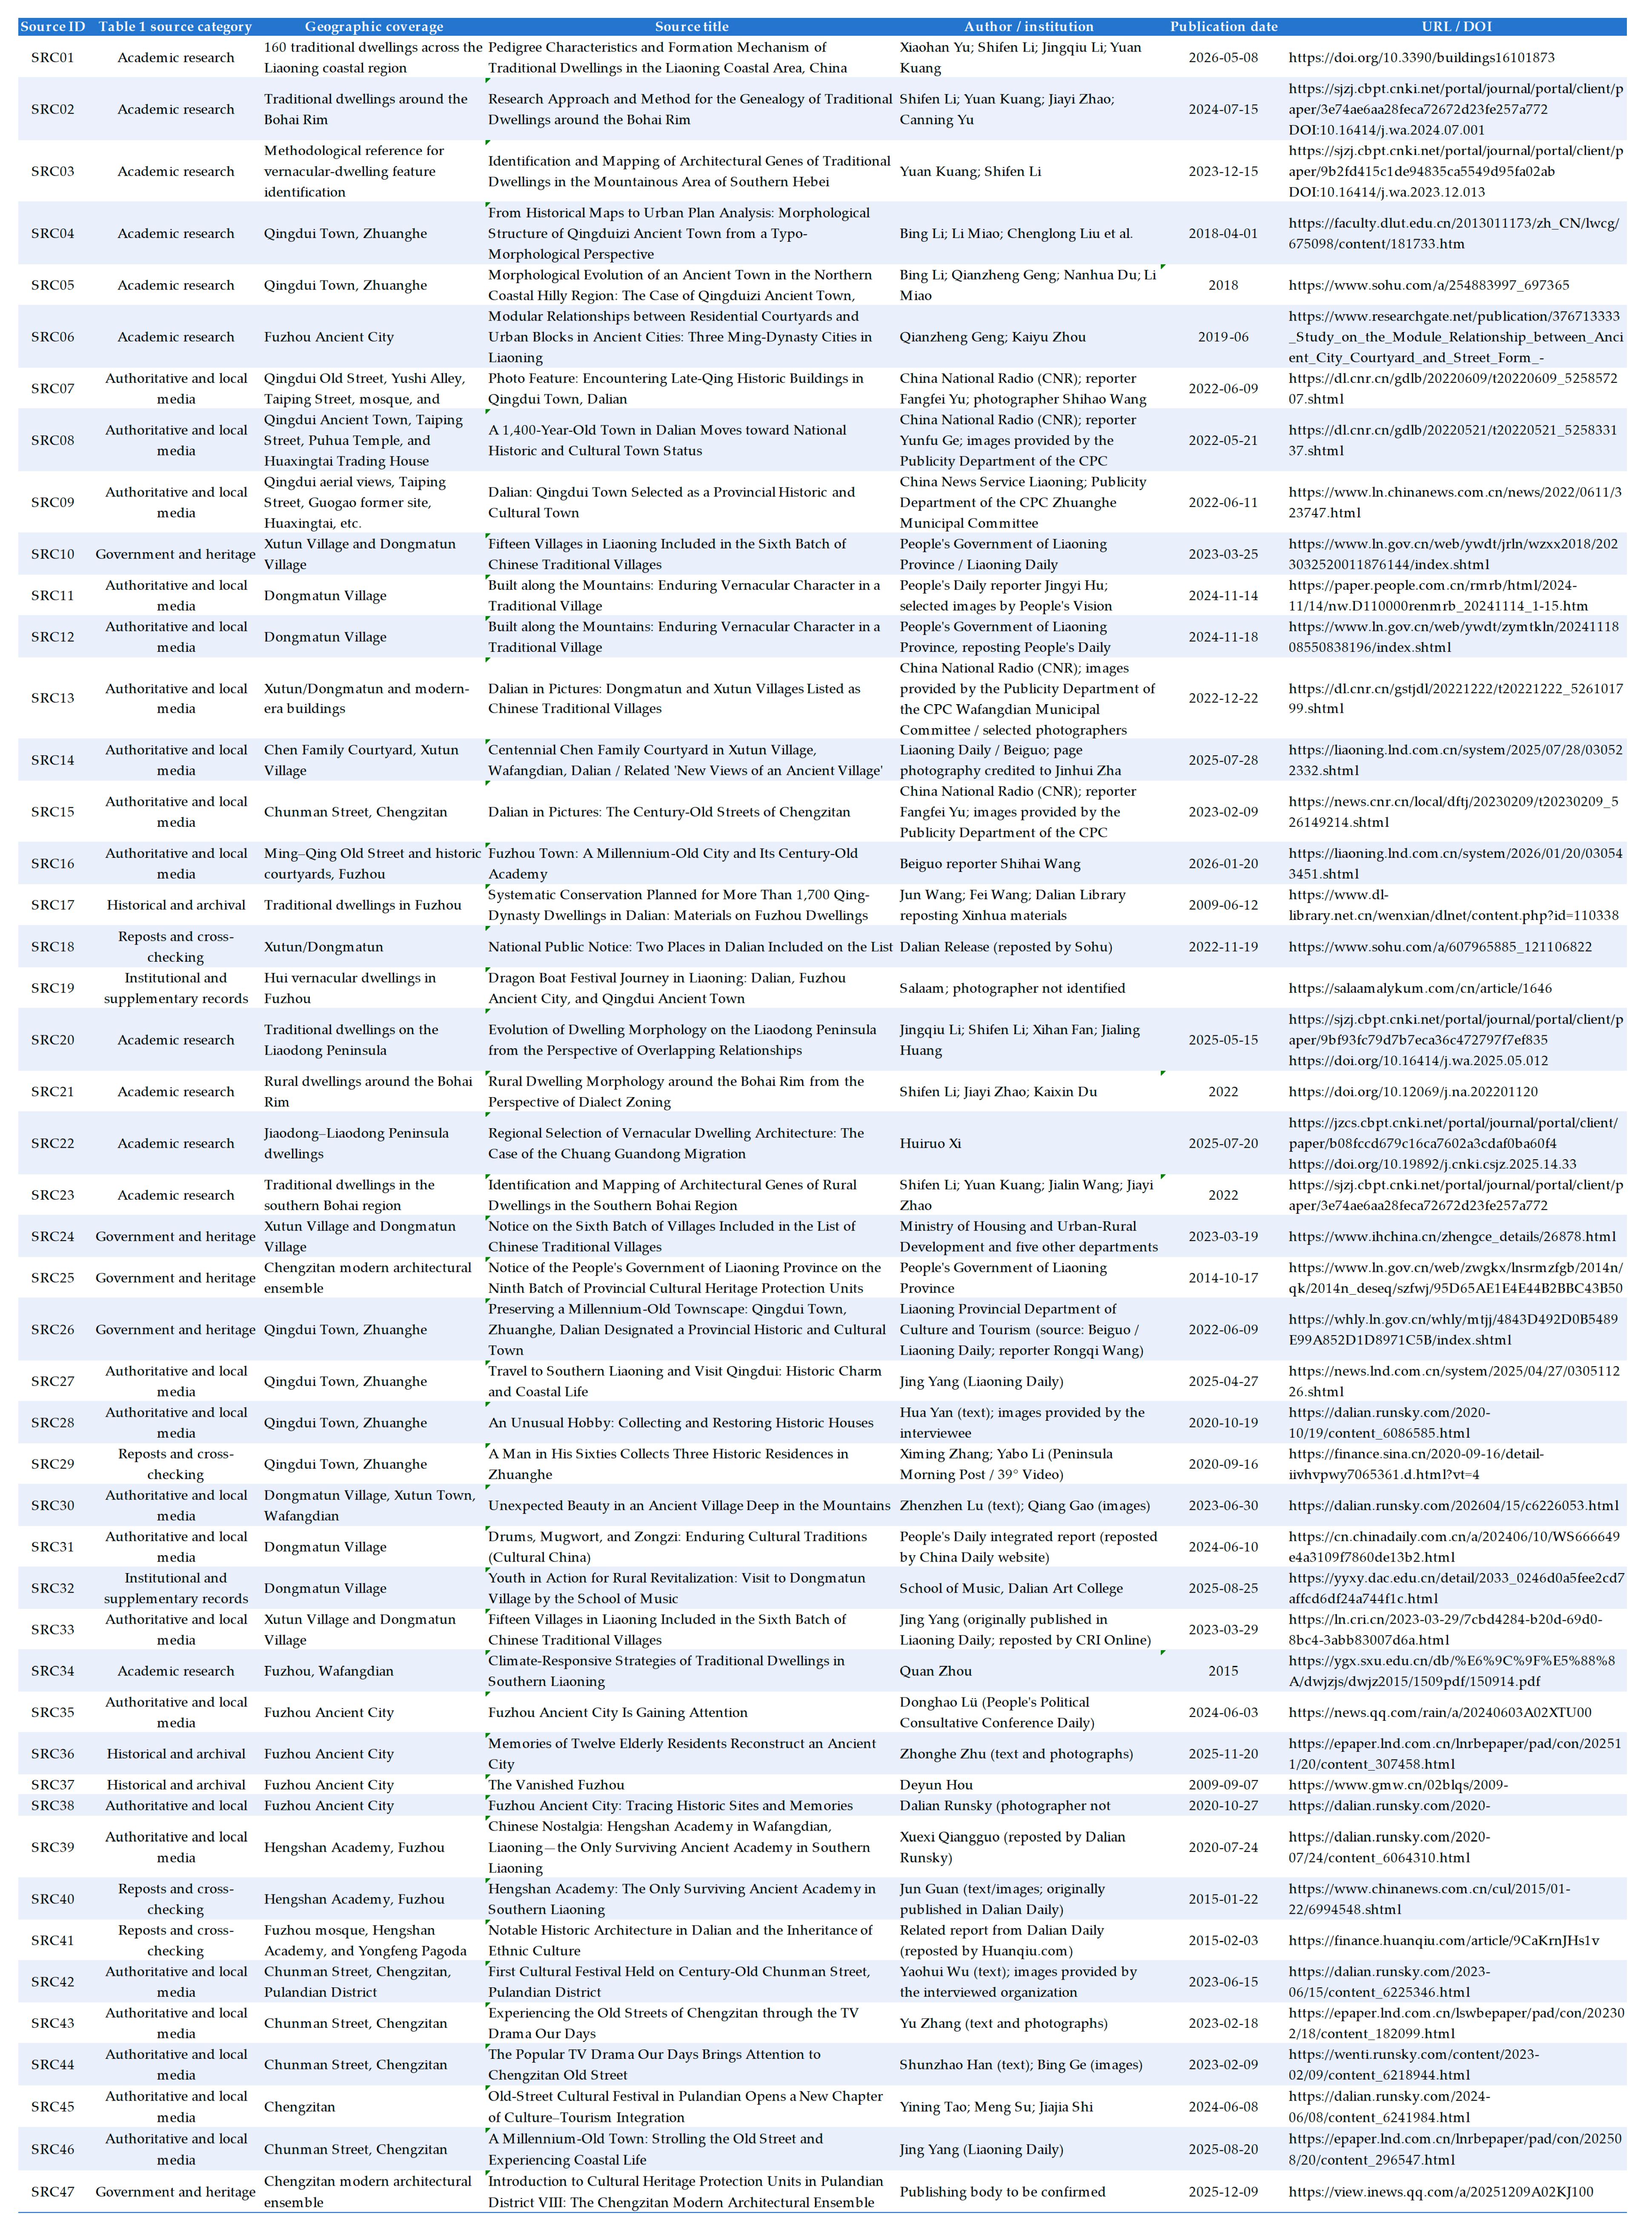
Figure A2.
Overview of the visual-sample collection and provenance registry used for candidate-image screening. (a) IMG 1–54. (b) IMG 55–106 [5,21].
References
- Xie, J.; Li, Z. Systematic construction and innovative practice of Jiangnan culture elements in metro space. Urban Mass Transit 2026, 29, 49–54+60. [Google Scholar] [CrossRef]
- Zhang, X.; Fu, Z.; Zhu, L.; Liu, Q.; Sheng, G. Do Culturally Embedded Wayfinding Systems Enhance Cultural Sustainability? Evidence from a Scenario-Based Experiment in a High-Speed Railway Station. Sustainability 2026, 18, 6714. [Google Scholar] [CrossRef] [Scilit]
- Rodriguez Sanchez, P.; Kapoor, S. Exploring courtyards as climate responsive solutions in vernacular architecture. J. Des. Built Environ. 2025, 25, 22–39. [Google Scholar] [CrossRef] [Scilit]
- Wu, X.; Zhu, M. Translation of Traditional Architectural Regional Culture from the Perspective of Place Identity—A Case Study of Ancient Buildings in Southern Fujian. China Natl. Exhib. 2024, 17, 93–95. (In Chinese) [Google Scholar]
- Yu, X.; Li, S.; Li, J.; Kuang, Y. Pedigree characteristics and formation mechanism of traditional dwellings in the Liaoning coastal area, China. Buildings 2026, 16, 1873. [Google Scholar] [CrossRef] [Scilit]
- Sun, B. The mapping between color-material-finish (CMF) and style imagery: A case study of Neo-Chinese armchairs. BioResources 2026, 21, 4340–4356. [Google Scholar] [CrossRef] [Scilit]
- Lu, W.; Ye, C.; Fang, Y.; Čok, V.; Petiot, J.-F. A systematic review of Kansei engineering in vehicle design. Digit. Eng. 2024, 3, 100022. [Google Scholar] [CrossRef] [Scilit]
- Yohanny, D.K.; Purwaningrum, L.; Mulyono, A. Application of Kansei engineering in various train compartment designs to determine the user’s affective response. IIUM Eng. J. 2025, 26, 466–479. [Google Scholar] [CrossRef] [Scilit]
- Song, W.; Xie, X.; Huang, W.; Yu, Q. The design of automotive interior for Chinese young consumers based on Kansei engineering and eye-tracking technology. Appl. Sci. 2023, 13, 10674. [Google Scholar] [CrossRef] [Scilit]
- Xie, X.-H.; Xu, Y.; Guo, S.; Zhu, H.; Yan, H. Evaluation and Decision of a Seat Color Design Scheme for a High-Speed Train Based on the Practical Color Coordinate System and Hybrid Kansei Engineering. Systems 2024, 12, 316. [Google Scholar] [CrossRef] [Scilit]
- Wehr, F.; Luccarelli, M. Environmentally Friendly Product Personality: The Role of Materials, Color, and Light in Car Interiors. Sustainability 2025, 17, 10129. [Google Scholar] [CrossRef] [Scilit]
- Liu, Z.; Chen, X.; Liang, X. Growable design of passenger vehicle interior space based on FAHP and FQFD. PLoS ONE 2024, 19, e0303233. [Google Scholar] [CrossRef] [Scilit] [PubMed]
- Ma, A.; Liu, X. Design for cultural identifiability in subway public spaces based on IPA analysis. Buildings 2026, 16, 1286. [Google Scholar] [CrossRef] [Scilit]
- Li, C.; Suhaily, S.S.; Zhou, Y. The influence of traditional regional architectural culture on Neo-Chinese style furniture design: A case study of the Lingnan region in China. Sci. Rep. 2025, 15, 38002. [Google Scholar] [CrossRef] [Scilit] [PubMed]
- Cheng, Z.; Guo, Y. The relationship between representational culture of decorative walls in subway stations and commuters’ spatial perception: A case study of Ping’anli Station in Beijing. Appl. Sci. 2026, 16, 1107. [Google Scholar] [CrossRef] [Scilit]
- Qi, Y.; Kim, K. Evaluation of electric car styling based on analytic hierarchy process and Kansei engineering: A study on mainstream Chinese electric car brands. Heliyon 2024, 10, e26999. [Google Scholar] [CrossRef] [Scilit] [PubMed]
- Tovillo, G.; Rapuano, M.; Milite, A.; Ruggiero, G. Perceived quality in the automotive industry: Do car exterior and interior color combinations have an impact? Appl. Syst. Innov. 2024, 7, 79. [Google Scholar] [CrossRef] [Scilit]
- Li, S.F.; Kuang, Y.; Zhao, J.Y.; Yu, C.N. Research approach and method for the genealogy of traditional dwellings around the Bohai Rim. World Archit. 2024, 14–21. [Google Scholar] [CrossRef]
- Li, J.Q.; Li, S.F.; Fan, X.X.; Huang, J.L. A study on the morphological evolution of dwellings in the Liaodong Peninsula from the perspective of relational superposition. World Archit. 2025, 27–34. [Google Scholar] [CrossRef]
- Li, S.F.; Zhao, J.Y.; Du, K.X. A study on the morphology of rural dwellings in the Circum-Bohai Sea region from the perspective of dialect division. New Archit. 2022, 1, 120–125. [Google Scholar] [CrossRef]
- Li, S.F.; Yu, X.H.; Li, J.Q. Genealogical zoning of traditional dwellings in coastal Liaoning from the perspective of cultural geography. Archit. J. 2026. online first. Available online: https://link.cnki.net/urlid/11.1930.TU.20260313.1345.004 (accessed on 26 September 2026). (In Chinese)
- Hair, J.F.; Black, W.C.; Babin, B.J.; Anderson, R.E. Multivariate Data Analysis, 8th ed.; Cengage: Andover, UK, 2019. [Google Scholar]
- Hayton, J.C.; Allen, D.G.; Scarpello, V. Factor Retention Decisions in Exploratory Factor Analysis: A Tutorial on Parallel Analysis. Organ. Res. Methods 2004, 7, 191–205. [Google Scholar] [CrossRef] [Scilit]
- Marlow, P.J.; Anderson, B.L. Interactions Between 3D Surface Shape and Material Perception. Annu. Rev. Vis. Sci. 2024, 10, 69–89. [Google Scholar] [CrossRef] [Scilit] [PubMed]
- Xiao, B.; Liao, C. Material perception connects vision, cognition and action. Nat. Rev. Psychol. 2025, 4, 687–701. [Google Scholar] [CrossRef] [Scilit]
- Chen, T.; Wang, L.; Huang, B.; Yu, J.; Wu, Y. Pursued spatial perception benefit considering attractiveness and cognitive load: Appropriate visual complexity of indoor commercial space. J. Build. Eng. 2024, 98, 111144. [Google Scholar] [CrossRef] [Scilit]
- Lee, J.H.; Ostwald, M.J. Mathematical beauty and Palladian architecture: Measuring and comparing visual complexity and diversity. Front. Archit. Res. 2024, 13, 729–740. [Google Scholar] [CrossRef] [Scilit]
- Saaty, T.L. The Analytic Hierarchy Process: Planning, Priority Setting, Resource Allocation; McGraw-Hill International Book Co.: New York, NY, USA, 1980. [Google Scholar]
- Kendall, M.G.; Babington Smith, B. The Problem of m Rankings. Ann. Math. Stat. 1939, 10, 275–287. [Google Scholar] [CrossRef] [Scilit]
- Van Laarhoven, P.J.M.; Pedrycz, W. A fuzzy extension of Saaty’s priority theory. Fuzzy Sets Syst. 1983, 11, 229–241. [Google Scholar] [CrossRef] [Scilit]
- Aczél, J.; Saaty, T.L. Procedures for synthesizing ratio judgements. J. Math. Psychol. 1983, 27, 93–102. [Google Scholar] [CrossRef] [Scilit]
- Buckley, J.J. Fuzzy hierarchical analysis. Fuzzy Sets Syst. 1985, 17, 233–247. [Google Scholar] [CrossRef] [Scilit]
- Yao, Y.; Zheng, J.; Ying, F.; Rao, Y.; Zhan, J.; Liu, X.; Jiang, J.; Li, Y.; Quan, S. Evaluating and translating cultural symbol design: An AHP-TOPSIS evaluation framework based on the Chaoshan five-element Gable Walls. Humanit. Soc. Sci. Commun. 2026, 13, 1233. [Google Scholar] [CrossRef] [Scilit]
- Wang, M.; Song, W.; Qiu, L. A Kansei engineering-based study on CMF (Color, Material, Finishing) trend samples for automotive interiors. Hunan Packag. 2025, 40, 137–141, 173. (In Chinese) [Google Scholar]
- Dalian Urban Construction Investment Group Co., Ltd. Prospectus for the First Tranche of Medium-Term Notes in 2025; Dalian Urban Construction Investment Group Co., Ltd.: Dalian, China, 2025. (In Chinese) [Google Scholar]
- China CNR Corporation Limited. Trial Operation of “CNR-Manufactured” Vehicles for the Dalian Route 202 Rail Extension Line. 2 January 2014. Available online: https://www.crrcgc.cc/dl/2013-12/30/article_D34EB6D43A1445D6AC47872CAB7C3E47.html (accessed on 26 September 2026). (In Chinese)
- CJ/T 416-2012; Fire Protection Requirements for Urban Rail Transit Vehicles. Ministry of Housing and Urban-Rural Development of the People’s Republic of China: Beijing, China, 2012. (In Chinese)
- Likert, R. A Technique for the Measurement of Attitudes; Archives of Psychology, No. 140; Columbia University: New York, NY, USA, 1932; pp. 1–55. [Google Scholar]
- Norman, G. Likert scales, levels of measurement and the “laws” of statistics. Adv. Health Sci. Educ. 2010, 15, 625–632. [Google Scholar] [CrossRef] [Scilit] [PubMed]
- Clark, L.A.; Watson, D. Constructing Validity: New Developments in Creating Objective Measuring Instruments. Psychol. Assess. 2019, 31, 1412–1427. [Google Scholar] [CrossRef] [Scilit] [PubMed]
- Huang, F.L.; Cornell, D.G. Using Multilevel Factor Analysis With Clustered Data: Investigating the Factor Structure of the Positive Values Scale. J. Psychoeduc. Assess. 2016, 34, 3–14. [Google Scholar] [CrossRef] [Scilit]
- Yuan, Y.; Yu, S.; Zhu, Z.; Jin, D.; Sun, Y. Effects of Surface Texture and Color on the Visuo-Tactile Perception of Polyurethane Synthetic Leather for Automotive Seats. J. Eye Mov. Res. 2026, 19, 68. [Google Scholar] [CrossRef] [Scilit] [PubMed]
- Abughalia, A.; Stechert, C. Usability of Virtual Reality Systems in Engineering Product Development: A Multi-Experiment Evaluation of Software, Hardware, and User Factors. Appl. Sci. 2026, 16, 5581. [Google Scholar] [CrossRef] [Scilit]

Disclaimer/Publisher’s Note: The statements, opinions and data contained in all publications are solely those of the individual author(s) and contributor(s) and not of MDPI and/or the editor(s). MDPI and/or the editor(s) disclaim responsibility for any injury to people or property resulting from any ideas, methods, instructions or products referred to in the content. |
© 2026 by the authors. Licensee MDPI, Basel, Switzerland. This article is an open access article distributed under the terms and conditions of the Creative Commons Attribution (CC BY) license.