


Abstract
Ventilation and dust removal systems in industrial buildings handle particulate-laden exhaust flows. Centrifugal fans are the primary gas-moving equipment in these systems, and straight plate blades are widely used in them. These blades resist particulate deposition and erosive wear. Their aerodynamics are governed by the inlet clearance between the stationary inlet nozzle and the rotating impeller. Design and simulation routinely idealize it as clearance-free. A 12-blade fan of this type was studied numerically. Four clearance conditions were quantified over the full flow range. This idealization overestimated the design point total pressure efficiency by 1%. Overlapped clearance dominated the aerodynamic performance. A clearance of 20 mm approached the original model. A clearance of 30 mm, in contrast, reduced the efficiency to 50% at high flow. The axial clearance itself lowered the total pressure efficiency. Its size, however, barely mattered. The three axial clearance models remained within 77–78% at the design flow rate. A circumferentially non-uniform clearance lowered the design point efficiency to 79% and the high-flow efficiency to 32%. Eddy viscosity accumulation and passage blockage show that leakage-induced backflow sets these limits. These results provide a basis for controlling inlet clearance tolerances during the design and assembly of the straight plate blade fans.
1. Introduction
Ventilation and dust removal are core building service functions in industrial buildings such as steel, cement, metallurgy, and energy plants. Sintering, clinker production, metallurgical heating, and combustion release large volumes of particulate-laden flue gas. This gas is captured by local exhaust ventilation and cleaned in dust collectors before release. Centrifugal fans are the primary gas-moving equipment in these systems. They convey dust-laden flue gas at high volumetric flow rates and against substantial system resistance [1]. Because of this duty, they consume a considerable share of the electricity used by building ventilation systems. Their aerodynamic performance therefore governs the capture efficiency of the exhaust system, the indoor environmental quality of the occupied space, and the energy consumption of the building’s services [2].
Centrifugal fans with straight plate blades are well suited to such streams. Compared with complexly profiled blades, they are simpler to manufacture and maintain. They are also less prone to particulate matter deposition and erosive wear. Kocsis et al. [3] developed a centrifugal fan with straight plate blades. They optimized its aerodynamic performance through CFD-aided design and experimental testing. In operation, the flow must turn from axial to radial within a short path. The internal flow is strongly three-dimensional and unsteady. Separation and backflow occur in the passage. The outlet flow is non-uniform. The impeller also interacts with the volute tongue. Such performance losses have been attributed in part to the junction region between the inlet nozzle exit and the impeller inlet [4,5].
Two approaches to improving performance have emerged. The first is geometric optimization of the rotating components. It includes bio-inspired blades, variable-chord blades, splitter blades, and double-inlet impeller designs. These modifications suppress separation and backflow. They also improve the axial and circumferential uniformity at the impeller exit. As a result, both the volumetric flow rate and the total pressure efficiency increase [6,7,8,9,10]. The second is geometric modification of the stationary components. Examples are volute tongue clearance, the volute profile, and the inlet nozzle shape. Such modifications suppress inlet flow distortion and improve flow stability [11,12,13,14,15,16]. However, these gains have been demonstrated almost exclusively for forward-curved and backward-curved fans. In centrifugal fans with straight plate blades, the blades allow almost no freedom in profile design. Improvements are therefore largely confined to the casing and the impeller inlet region.
Many of these problems share a common mechanism, namely clearance flow. To save weight and cost, the casings of industrial fans with straight plate blades have relatively low stiffness. Assembly stresses and thermal deformation cause appreciable casing deformation. This deformation introduces variability in the inlet clearance. Leakage-induced backflow then occurs at the clearance. It raises the volumetric flow rate through the impeller. At the same time, it perturbs the shroud-side flow and induces separation [17,18,19,20,21]. Zhang et al. [22] and Fritsche et al. [23] reported efficiency losses caused by inlet clearance. These losses reached 1–6% at the best efficiency point. In a volute-type blower, they reached 5.3–8.2%.
Existing studies have provided valuable insight into inlet clearance effects in centrifugal fans with curved blades, including backward-curved and forward-curved impellers. Corresponding evidence for industrial fans with straight plate blades remains comparatively limited. These fans are relevant to industrial ventilation and dust removal systems, where simple construction, maintainability, and the handling of particulate-laden flows are important considerations. However, the clearance sensitivities reported for curved-blade impellers cannot be assumed to transfer directly to this configuration. The present study therefore provides a systematic comparison of inlet clearance configurations in a straight plate blade centrifugal fan, covering the clearance-free idealization, overlap variations, axial gap variations, and inlet nozzle ovalization. The aim is to relate their differing performance effects to leakage flow and spatial flow distributions, thereby providing design and assembly guidance for the investigated fan.
The paper is organized as follows. Section 2 describes the geometric model and the numerical method. Section 3, Section 4, Section 5 and Section 6 examine the fan with and without an inlet clearance, overlapped clearance variability, axial clearance variability, and the circumferential non-uniformity of the inlet clearance caused by ovalization of the inlet nozzle. Section 7 summarizes the combined effects of these configurations and parameters on the aerodynamic performance.
2. Model and Numerical Method
2.1. Geometric Model
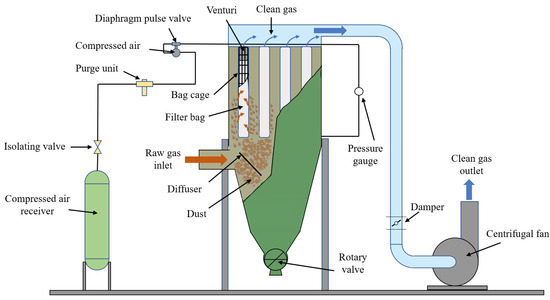
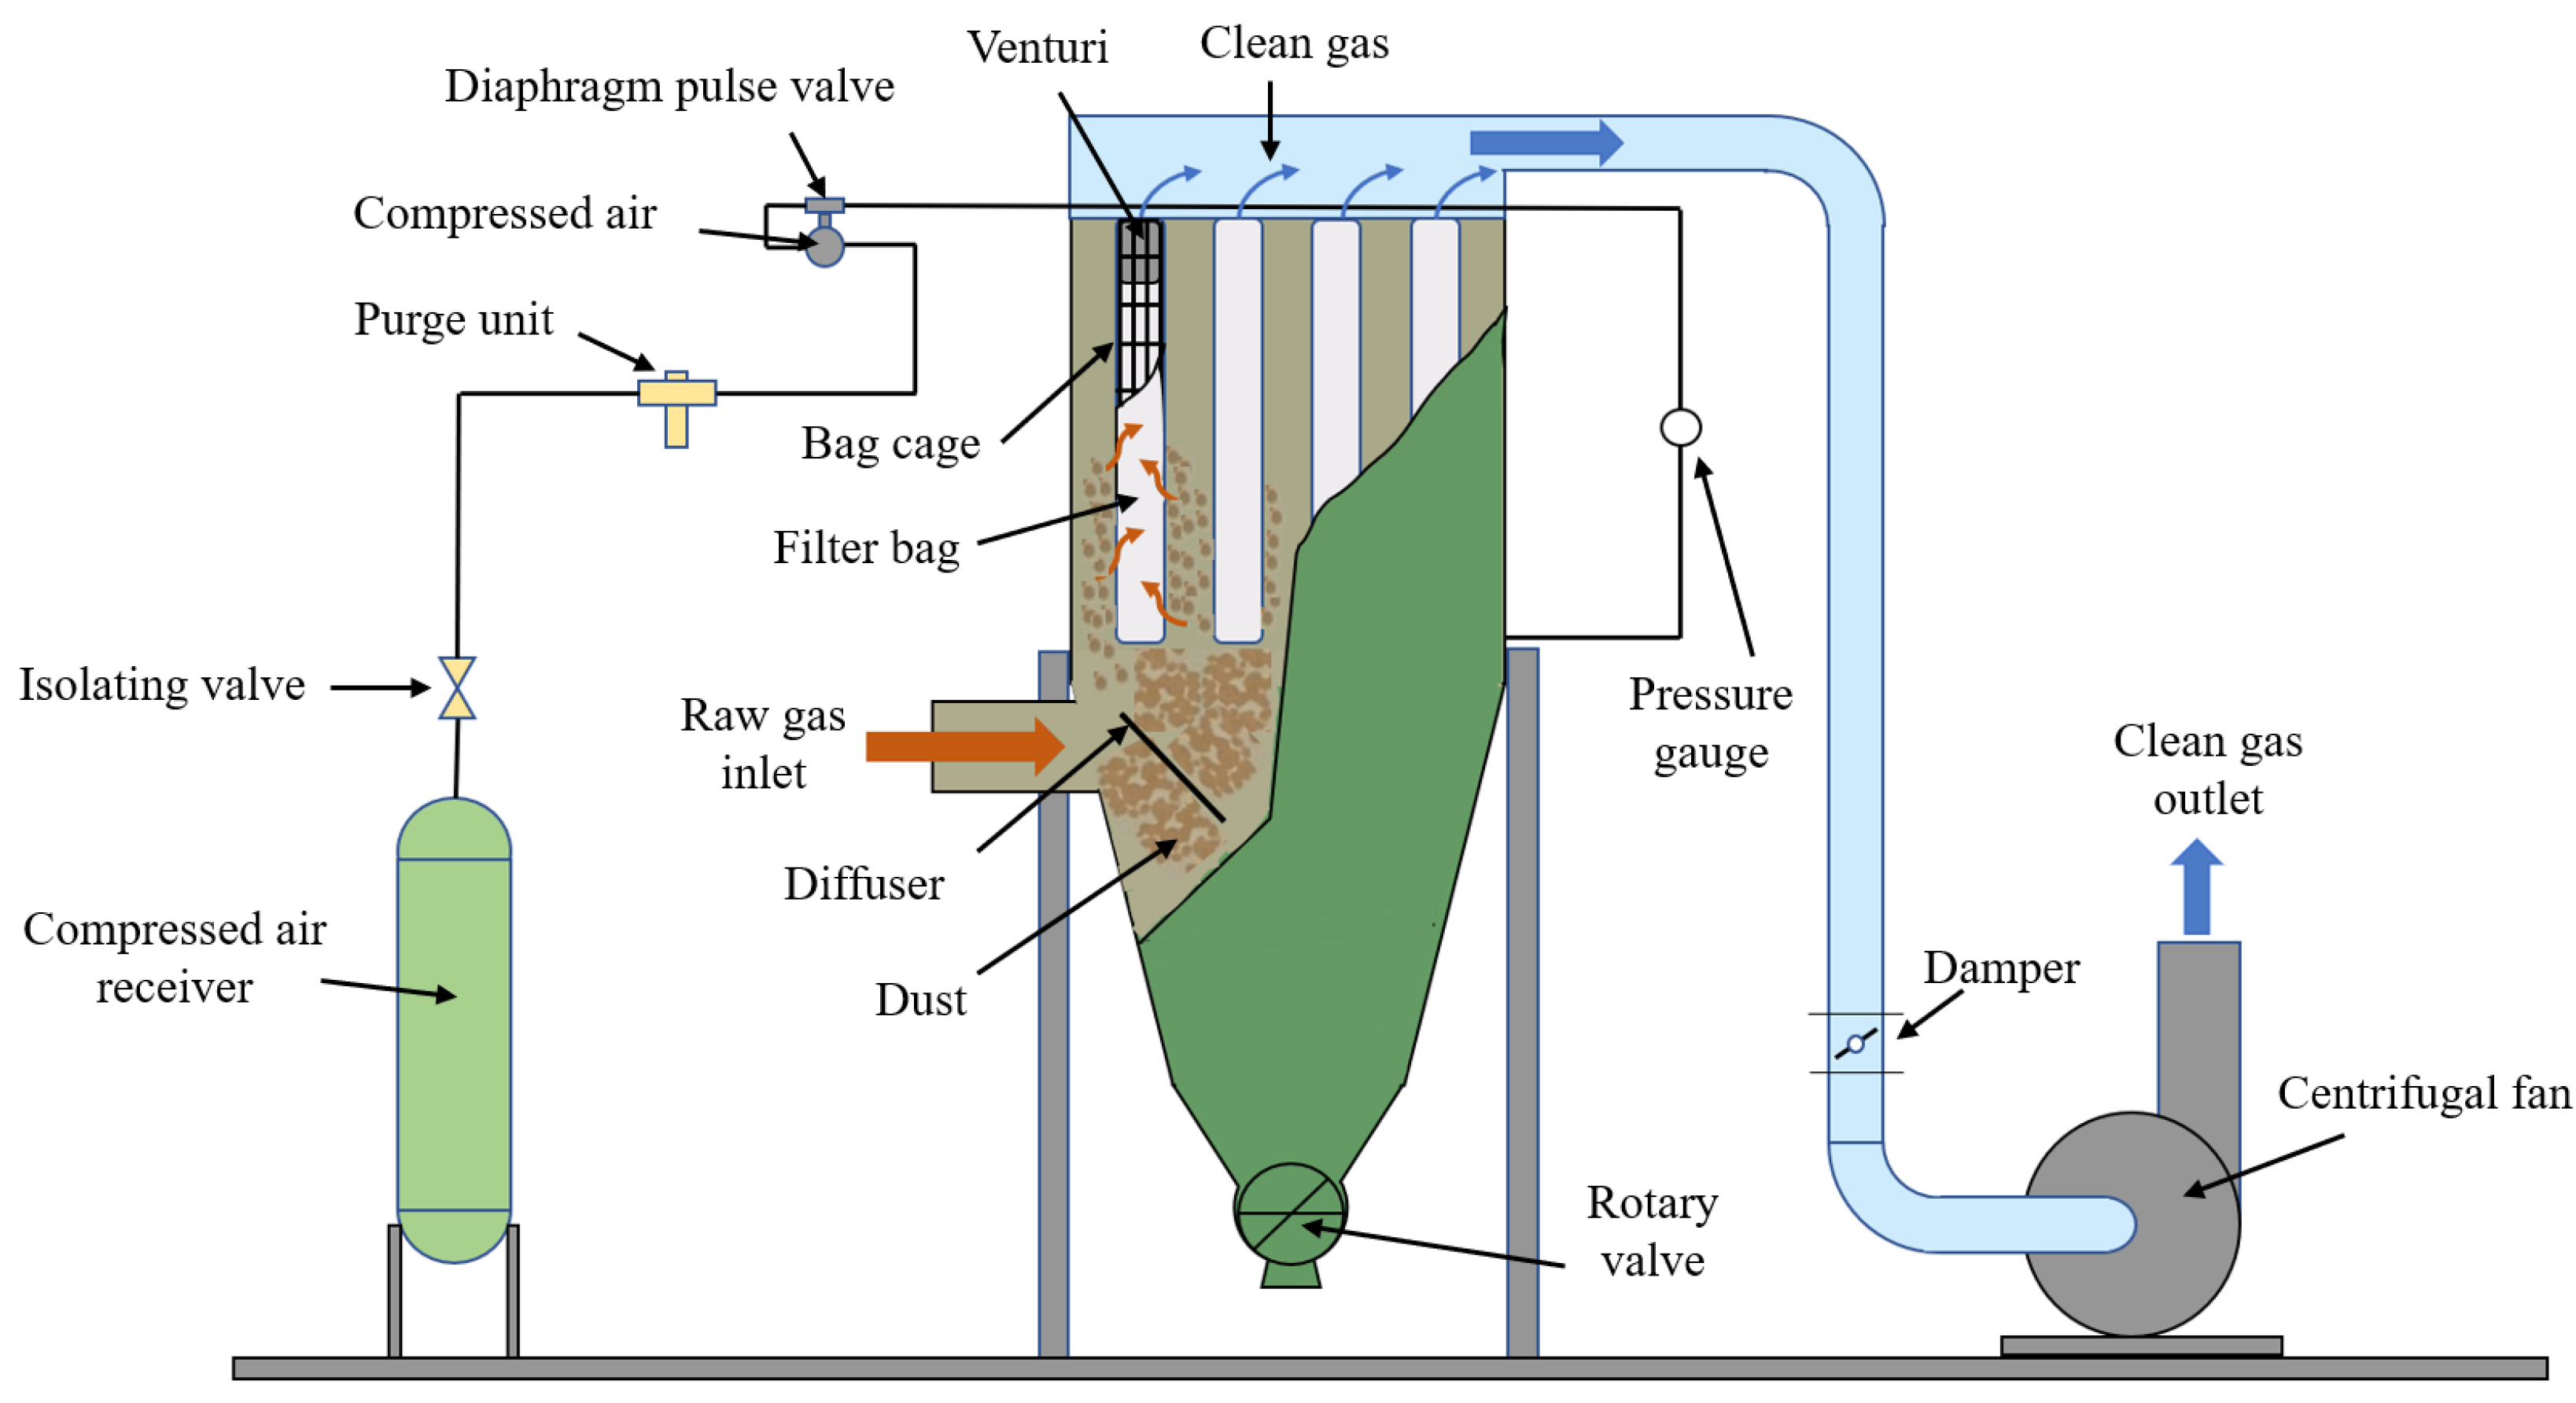
In large process industries such as steel, cement, and energy production, flue gas treatment systems handle highly dust-laden gases (Figure 1). Centrifugal fans are the primary gas-moving equipment in these systems. They generate the negative pressure that draws dust-laden gas from the source into the dust collector. They must maintain this flow continuously at high volumetric flow rates and against substantial system resistance. Their aerodynamic performance therefore governs the reliability of the entire purification system.
Figure 1.
Dust-laden flue gas treatment system.
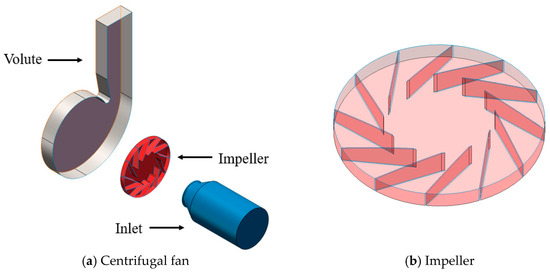
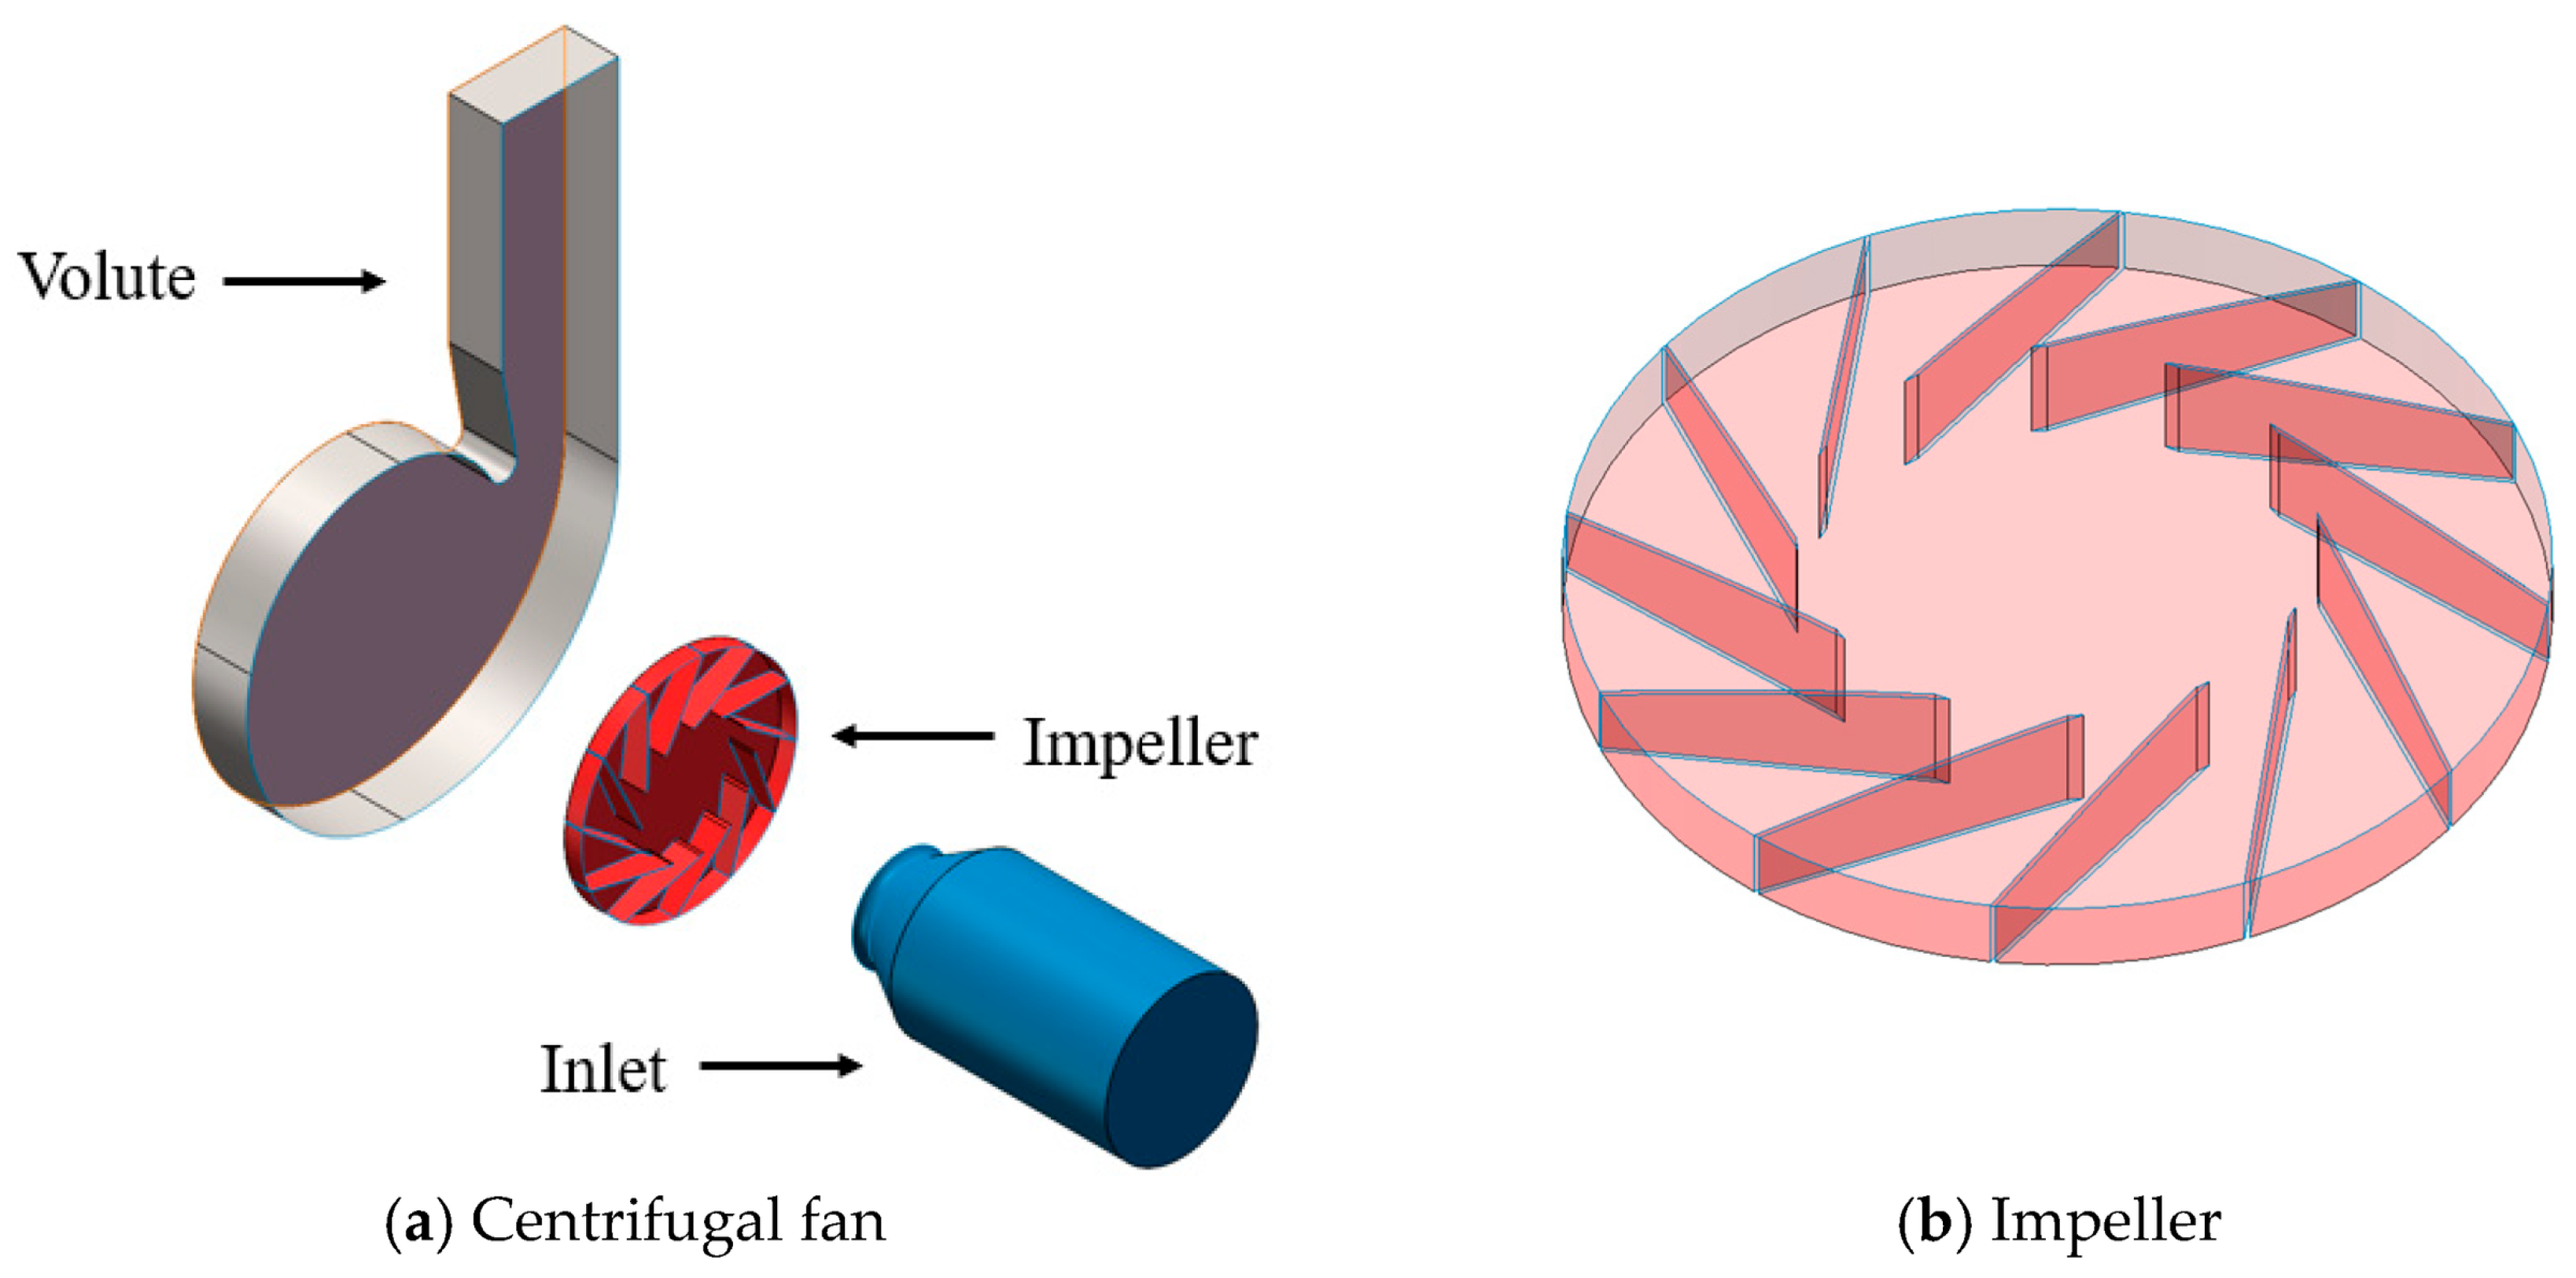
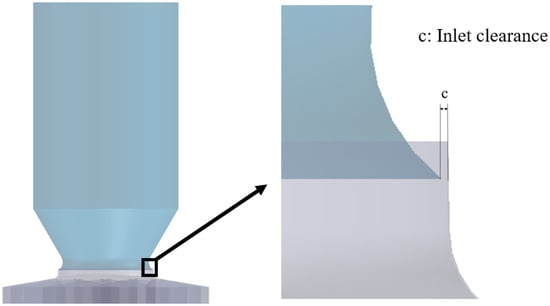
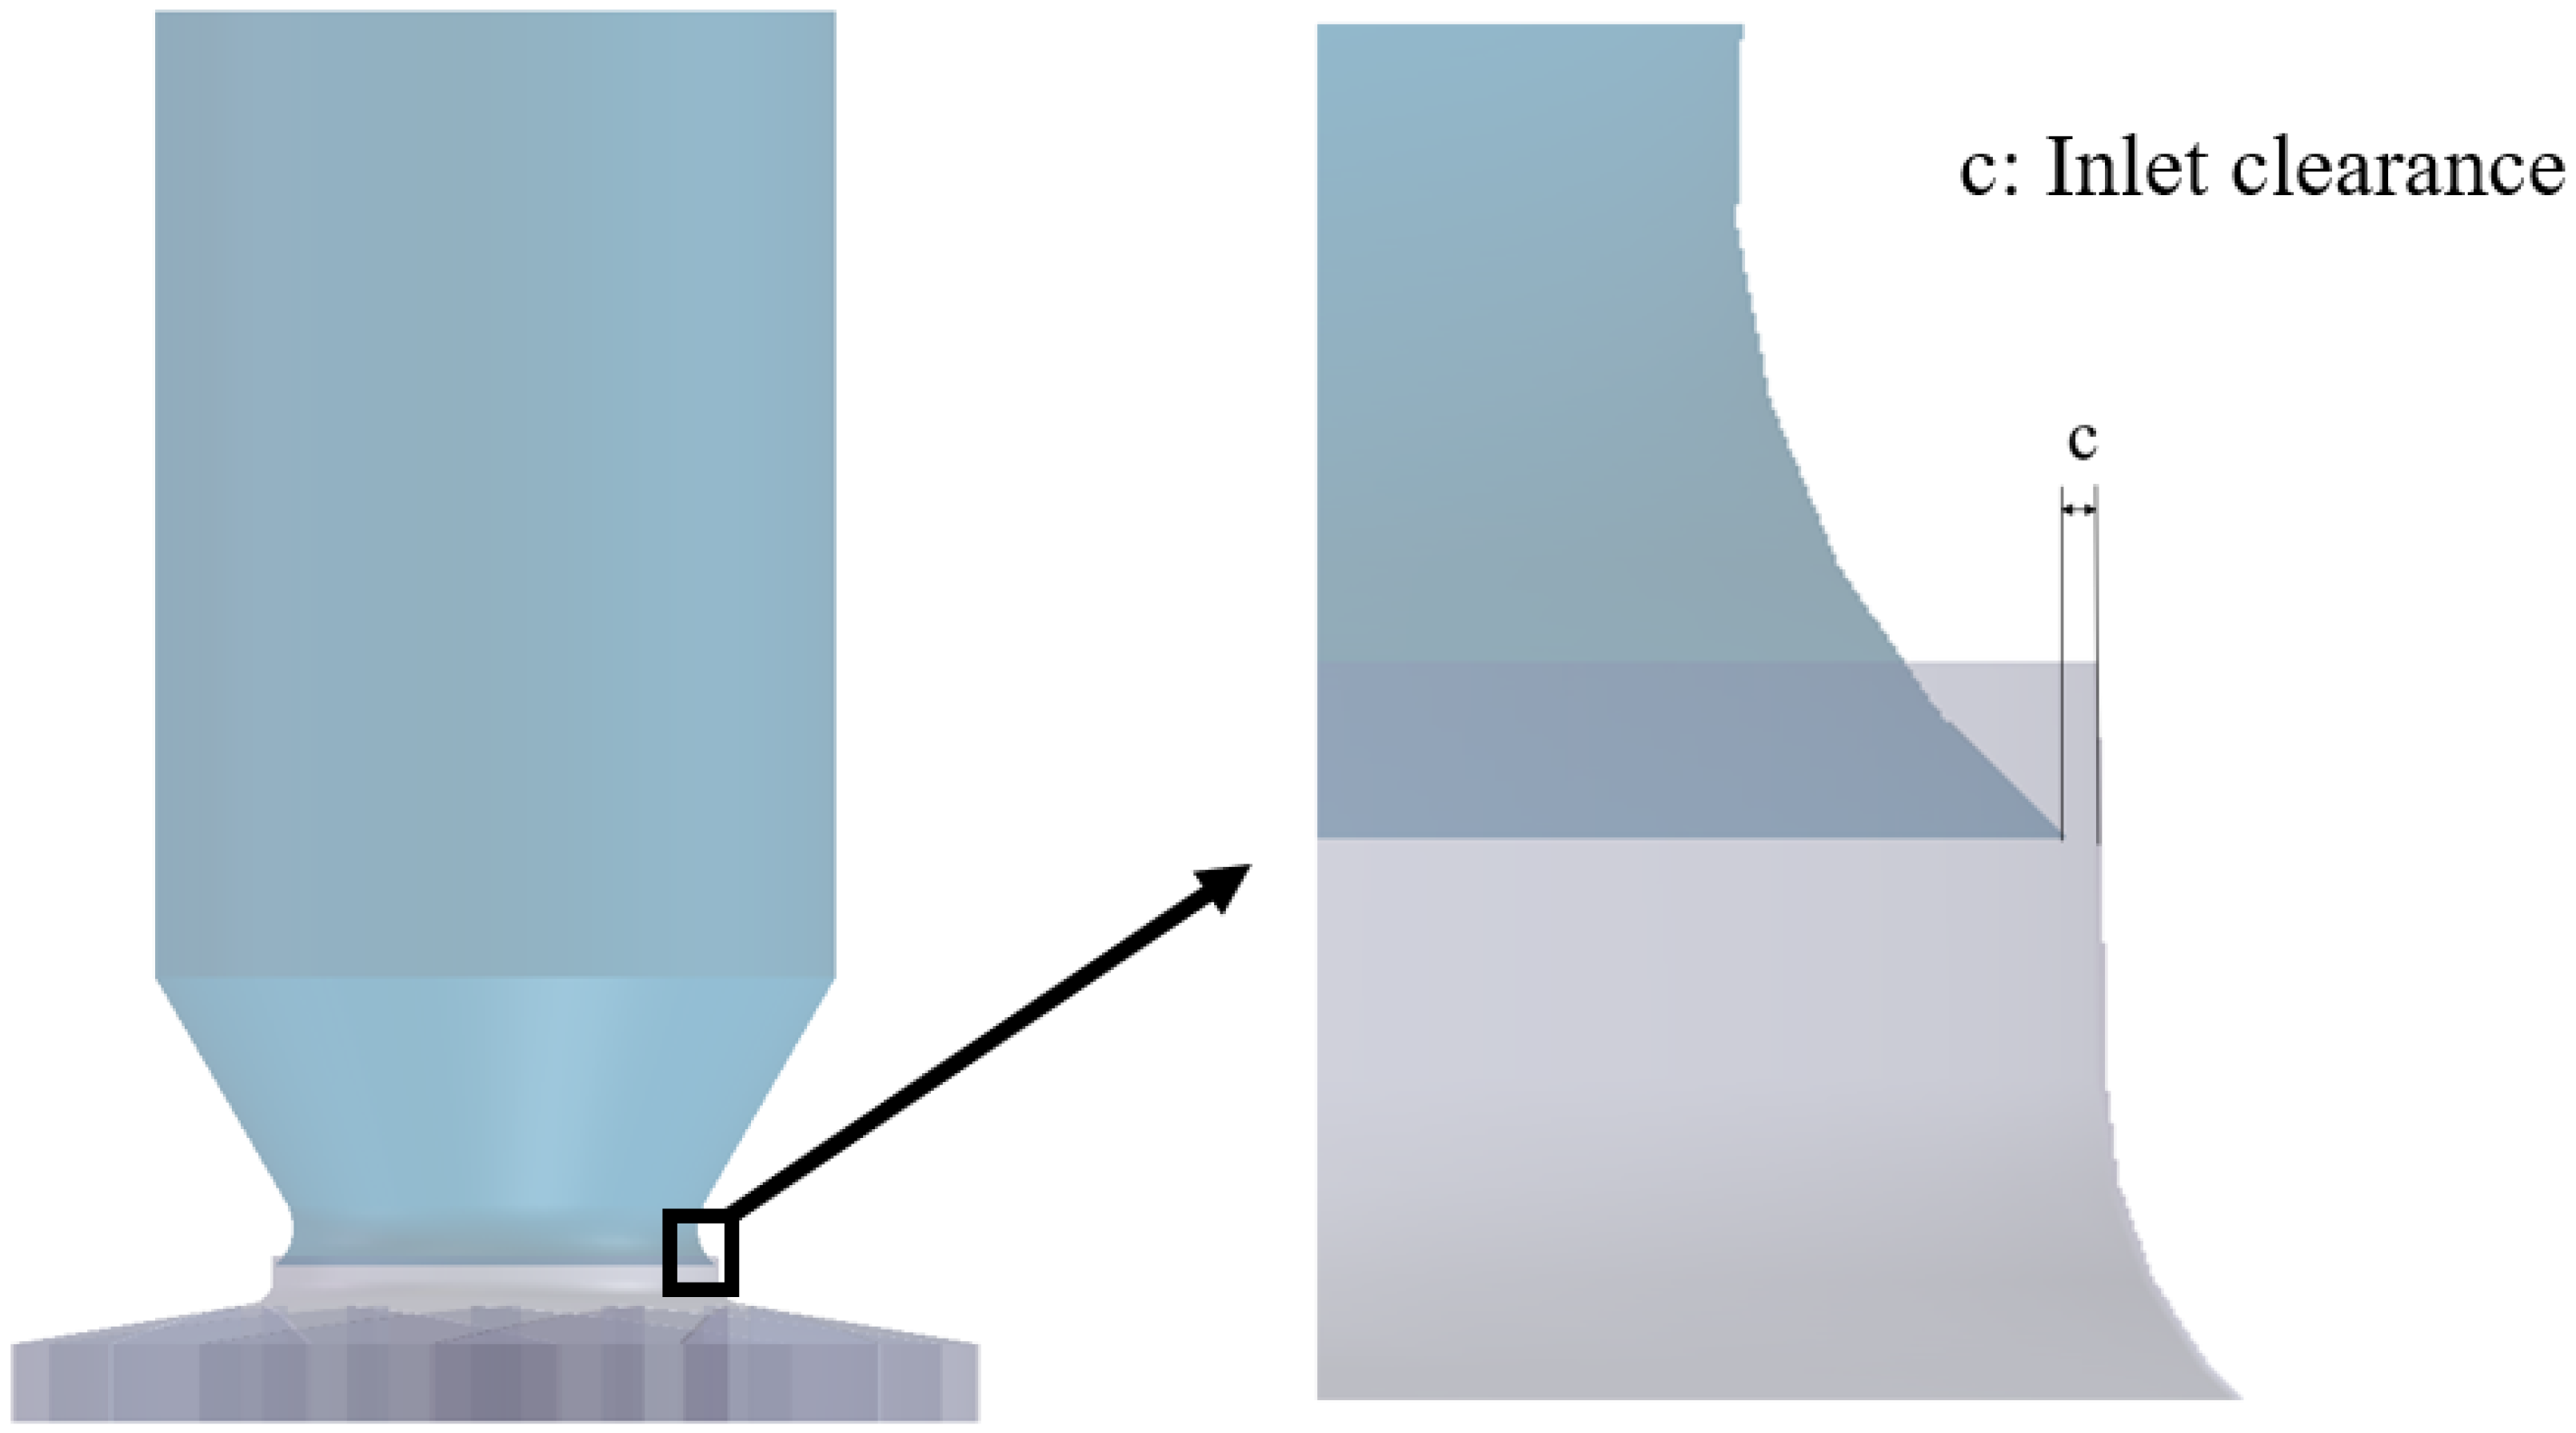
The centrifugal fan with straight plate blades (Figure 2) consists of an inlet nozzle, an impeller, and a volute. The volute extends the outlet downstream to ensure a stable flow field. Table 1 lists the basic parameters of the fan, whose rated speed is 2900 rpm. The specified radial installation clearance for the investigated centrifugal fan ranges from 1.5 to 4 mm. The impeller is the working component, and energy conversion takes place within it. Its geometric parameters determine the flow rate and pressure characteristics of the fan. The impeller has 12 straight plate blades. Its inlet diameter is D1 = 460 mm, and its exit diameter is D2 = 1000 mm. The inlet nozzle diameter at the mating plane is D3 = 456 mm. This value is slightly smaller than the impeller inlet diameter and gives a radial inlet clearance of c0 = 2 mm.
Figure 2.
Geometry of the prototype centrifugal fan.
Table 1.
Key design specifications of the prototype centrifugal fan.
2.2. Numerical Method and Mesh Independence
The aerodynamic performance and internal flow field of the fan were obtained by solving the three-dimensional incompressible Reynolds-averaged Navier–Stokes (RANS) equations.
where is the velocity vector, p is the pressure, and ρ is the density. E is the total energy per unit mass, is the viscous stress tensor and is the heat flux vector.
For the incompressible flow considered in this study, the total pressure efficiency is defined as the ratio of the useful aerodynamic power to the impeller input power:
where is the mass flow rate and ρ is the air density. T is the magnitude of the resisting torque about the rotation axis, and ω = 2πn/60 is the impeller angular velocity, where n is the rotational speed in rpm.
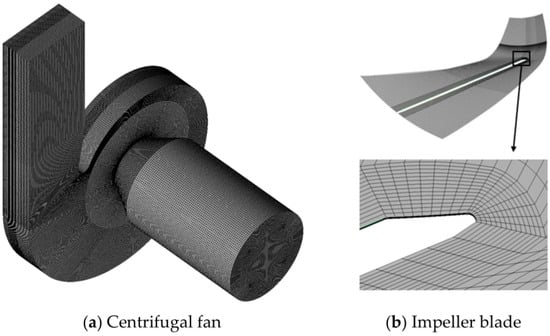
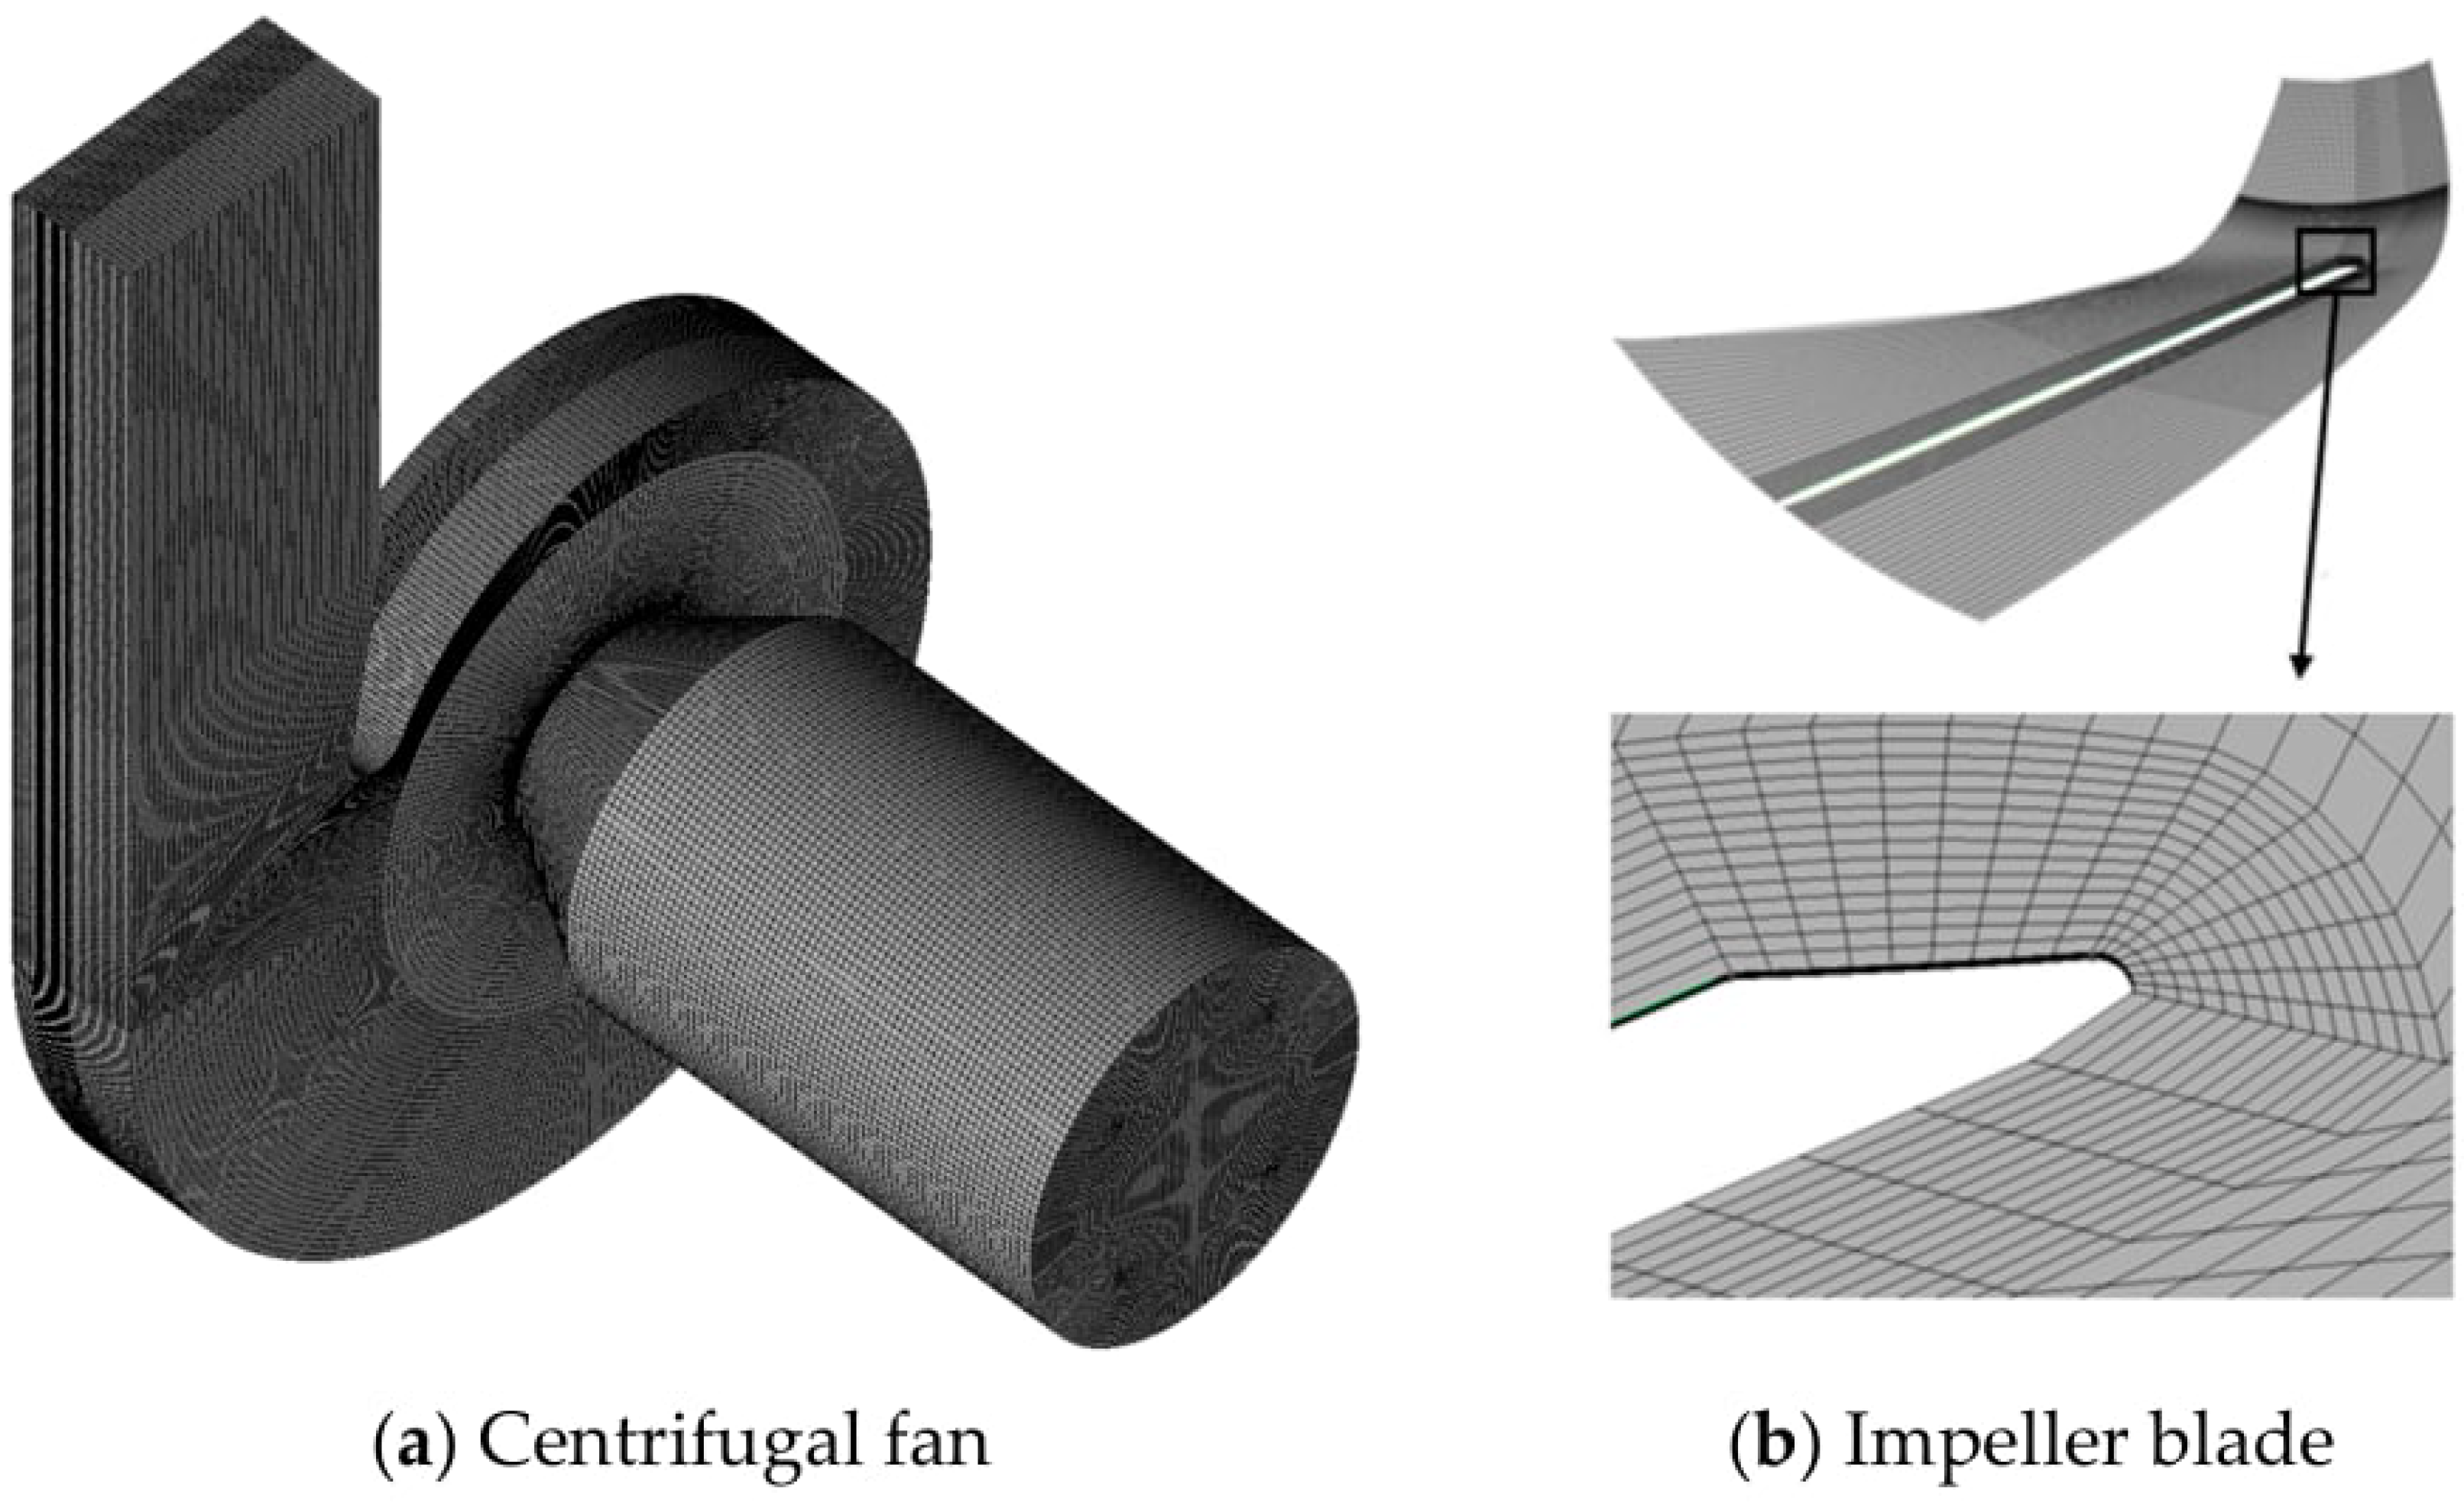
Meshing was performed in ANSYS ICEM to generate a structured hexahedral mesh for the centrifugal fan (Figure 3). ANSYS CFX was used to solve the three-dimensional incompressible RANS equations. Comparative studies of centrifugal fans have assessed the SST k–ω model against experimental flow field measurements [24,25]. Steady SST-based RANS has also been applied to investigate impeller–diffuser side-gap flows in centrifugal pumps with experimental comparisons [26]. The steady frozen rotor approach [27,28] was adopted to compare overall aerodynamic performance and spatial flow distributions among the inlet clearance configurations.
Figure 3.
Illustration of the computational mesh.
The inlet and volute regions were defined as a stationary domain. The impeller region was defined as a rotating domain. Data were transferred between the two domains through the frozen rotor approach. The inlet boundary condition was a total pressure of 101.325 kPa. A mass flow outlet was applied at the fan outlet. Convergence was judged by a normalized root mean square (RMS) residual below 10−6 and a stabilized monitored pressure at the impeller outlet.
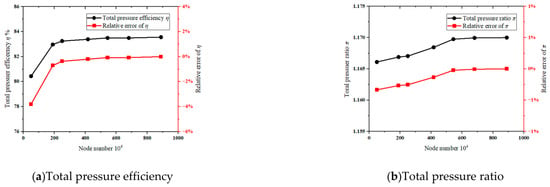
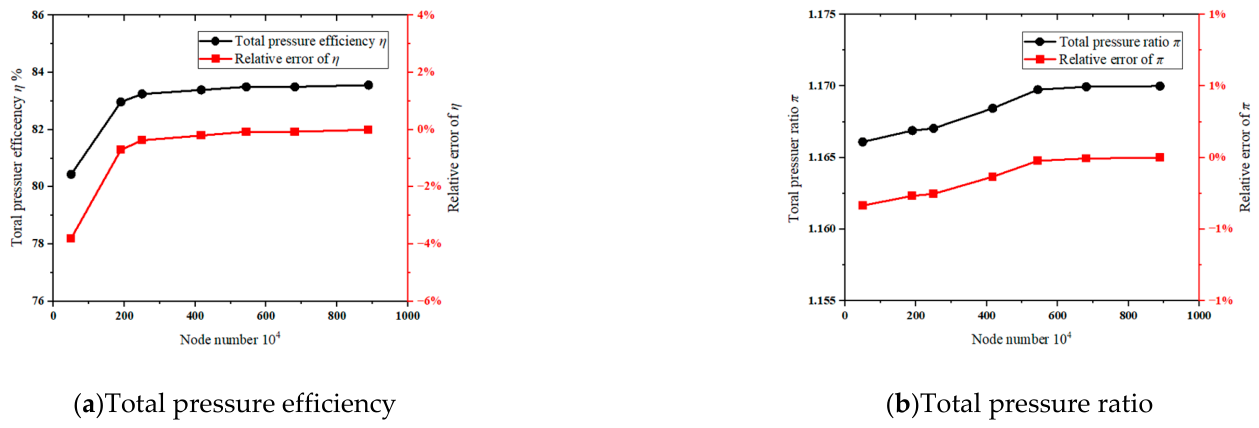
Figure 4 and Table 2 present the mesh independence study. The monitored quantities were the total pressure efficiency and the total pressure ratio. Both varied little once the cell count exceeded 5.44 million. This mesh size was therefore adopted to limit the computational cost. The inlet nozzle, impeller, and volute contain approximately 0.6 million, 3.4 million, and 1.44 million cells, respectively.
Figure 4.
Mesh independence study.
Table 2.
Results of the mesh independence study.
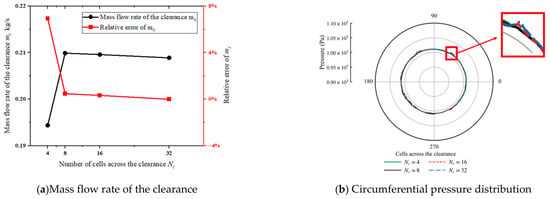
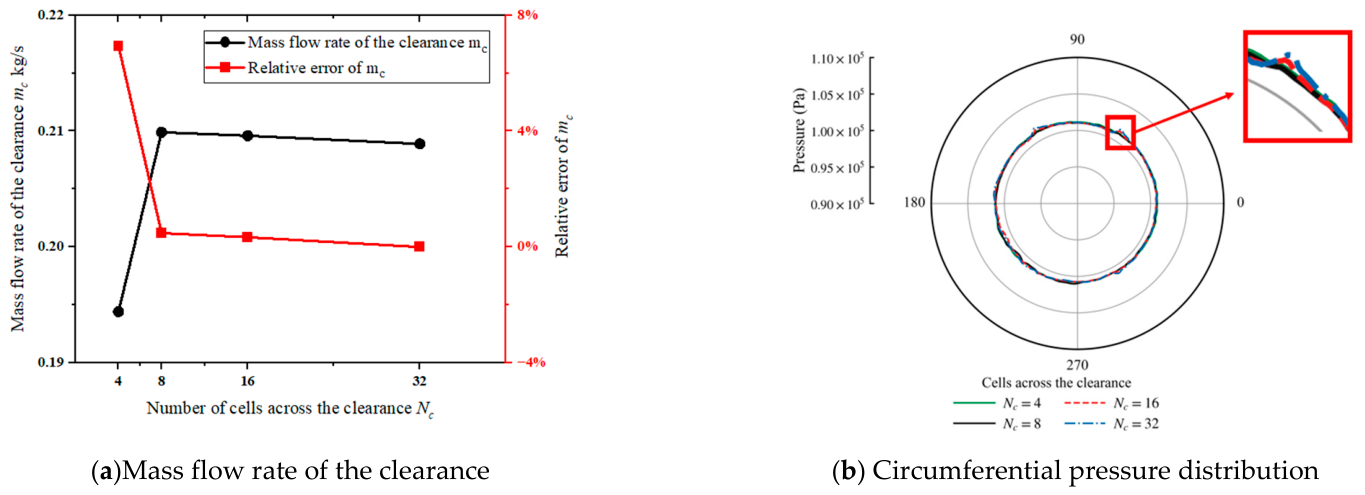
A dedicated mesh convergence assessment was performed for inlet clearance, supplementing the global mesh independence study. As shown in Figure 5 and Table 3, four mesh resolutions containing 4, 8, 16, and 32 layers across the clearance width were examined. The leakage mass flow rate was used as the primary assessment quantity, with relative differences calculated against the 32-layer result.
Figure 5.
Local mesh convergence assessment of the inlet clearance.
Table 3.
Results of the mesh independence study of inlet clearance.
The four-layer mesh showed appreciable sensitivity to refinement, whereas the eight cells’ result differed from the finest-mesh result by less than 1%. The circumferential pressure distributions also showed close agreement among the examined resolutions, with only small local differences visible in the enlarged view. Eight cells across the clearance were therefore selected to balance computational cost and mesh sensitivity for the quantities assessed.
3. Effect of Inlet Clearance on Aerodynamic Performance and Internal Flow Structure
3.1. Models with and Without Inlet Clearance
Figure 6 shows the original model. It was assembled with the overlapped clearance and a nominal inlet clearance c0 = 2 mm and a clearance flow area of 0.0029 m2. The inlet nozzle is stationary while the impeller rotates. A pressure difference therefore develops across the clearance. This difference drives leakage-induced backflow and incurs additional energy losses. This subsection compares the fan with and without inlet clearance. It quantifies the effect of leakage-induced backflow over the full flow range. The quantities examined are the total pressure efficiency and the internal flow field. It also assesses the deviation introduced by the clearance-free idealization. This deviation is measured relative to the original model.
Figure 6.
The original model.
3.2. Effect of Inlet Clearance on Aerodynamic Performance
The volumetric flow rate is normalized by the fan’s maximum flow rate, Qmax = 42,932 m3 h−1,
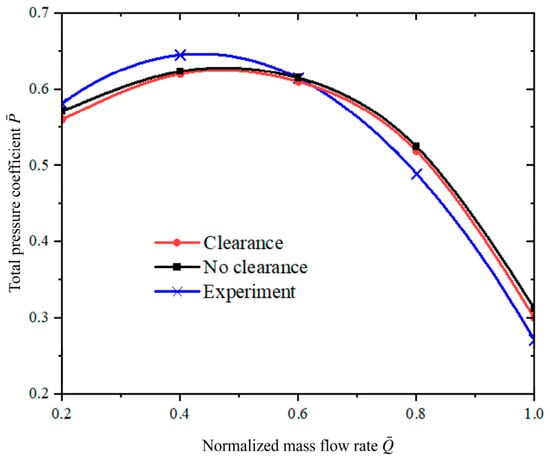
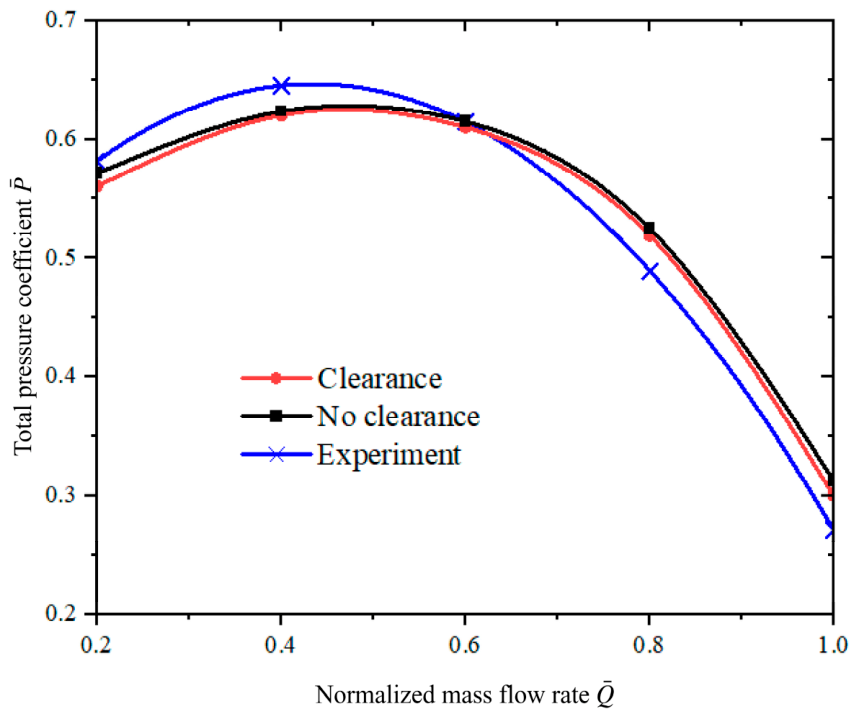
The experimental performance curves used for comparison were supplied by the manufacturer in dimensionless form. The underlying measurement records, instrument specifications, and detailed test procedures were unavailable; therefore, a measurement uncertainty assessment could not be performed.
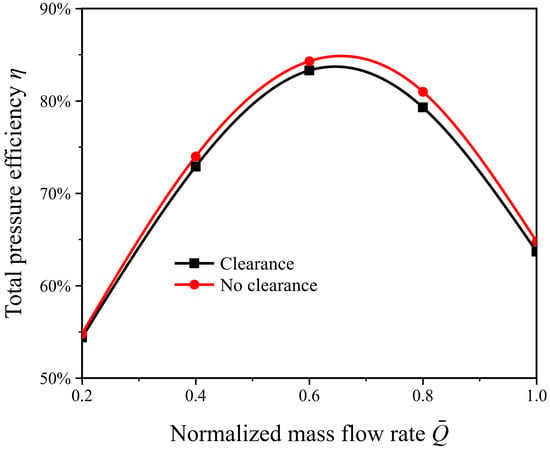
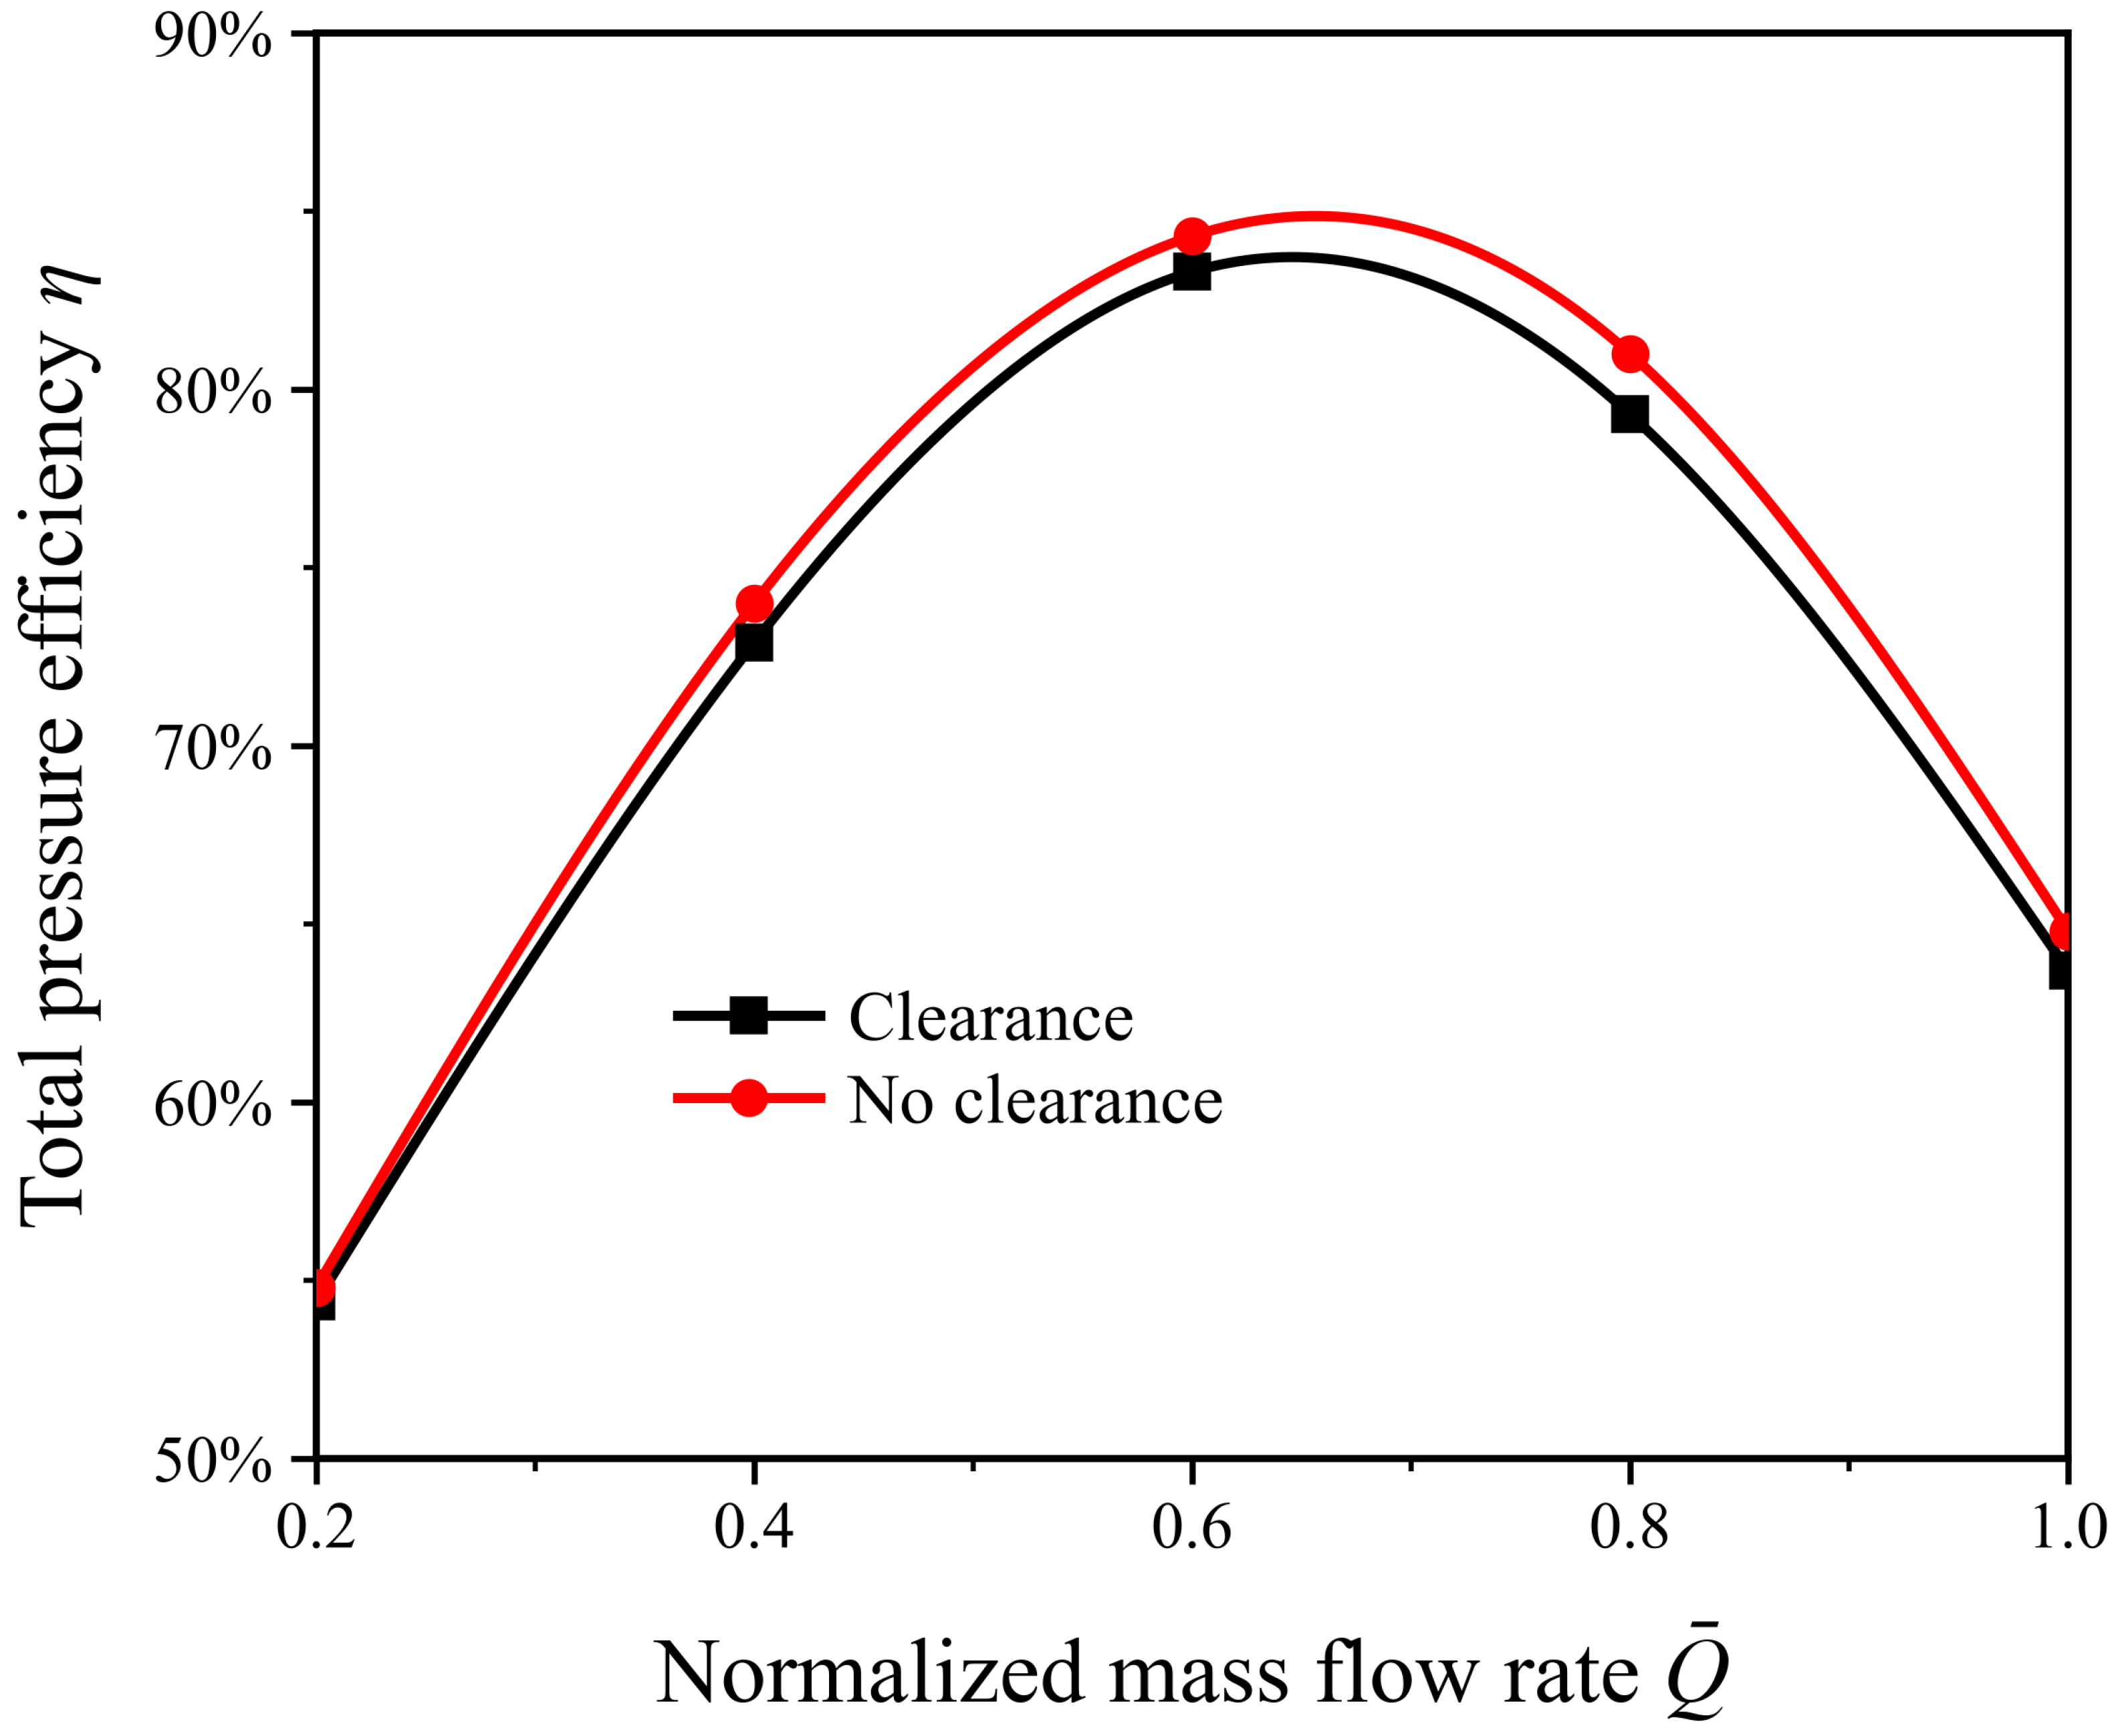
Three representative operating conditions are considered. These are 0.2 (low flow), 0.6 (design flow), and 1.0 (maximum flow). Figure 7 shows the total pressure efficiency as a function of the normalized flow rate. The flow rate is normalized by the maximum flow rate of the fan. Over the normalized flow range 0.2–1.0, the clearance-free model maintains a higher total pressure efficiency than the original model. Leakage-induced backflow and the resulting flow losses therefore reduce aerodynamic performance over the full flow range. At the design flow rate of 0.6, the peak total pressure efficiency of the original model is η0 = 83.5%. The clearance-free model reaches a maximum of η1 = 84.5%. The difference is 1%.
Figure 7.
Total pressure efficiency of the clearance-free and original models.
As shown in Figure 8, the predicted total pressure coefficient reproduces the experimental trend and agrees closely with the measurements near the design condition. The simulations slightly under-predict the experimental values at low flow rates but over-predict them at normalized flow rates of 0.8 and 1.0. Consequently, the predicted total pressure coefficient declines more gradually than the experimental curve in the high-flow region.
Figure 8.
Total pressure coefficient of the original and clearance-free models compared with experimental data.
3.3. Effect of Inlet Clearance on the Internal Flow Structure
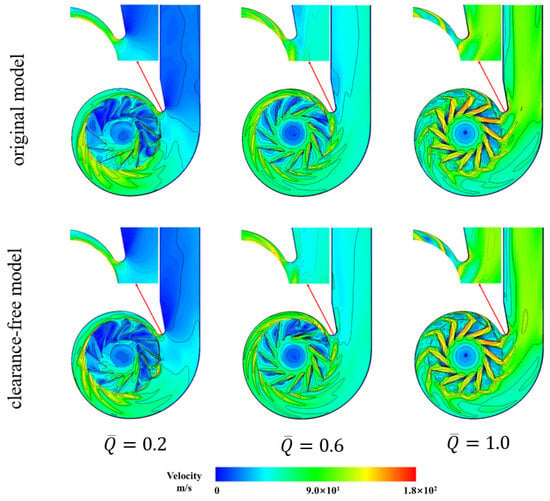
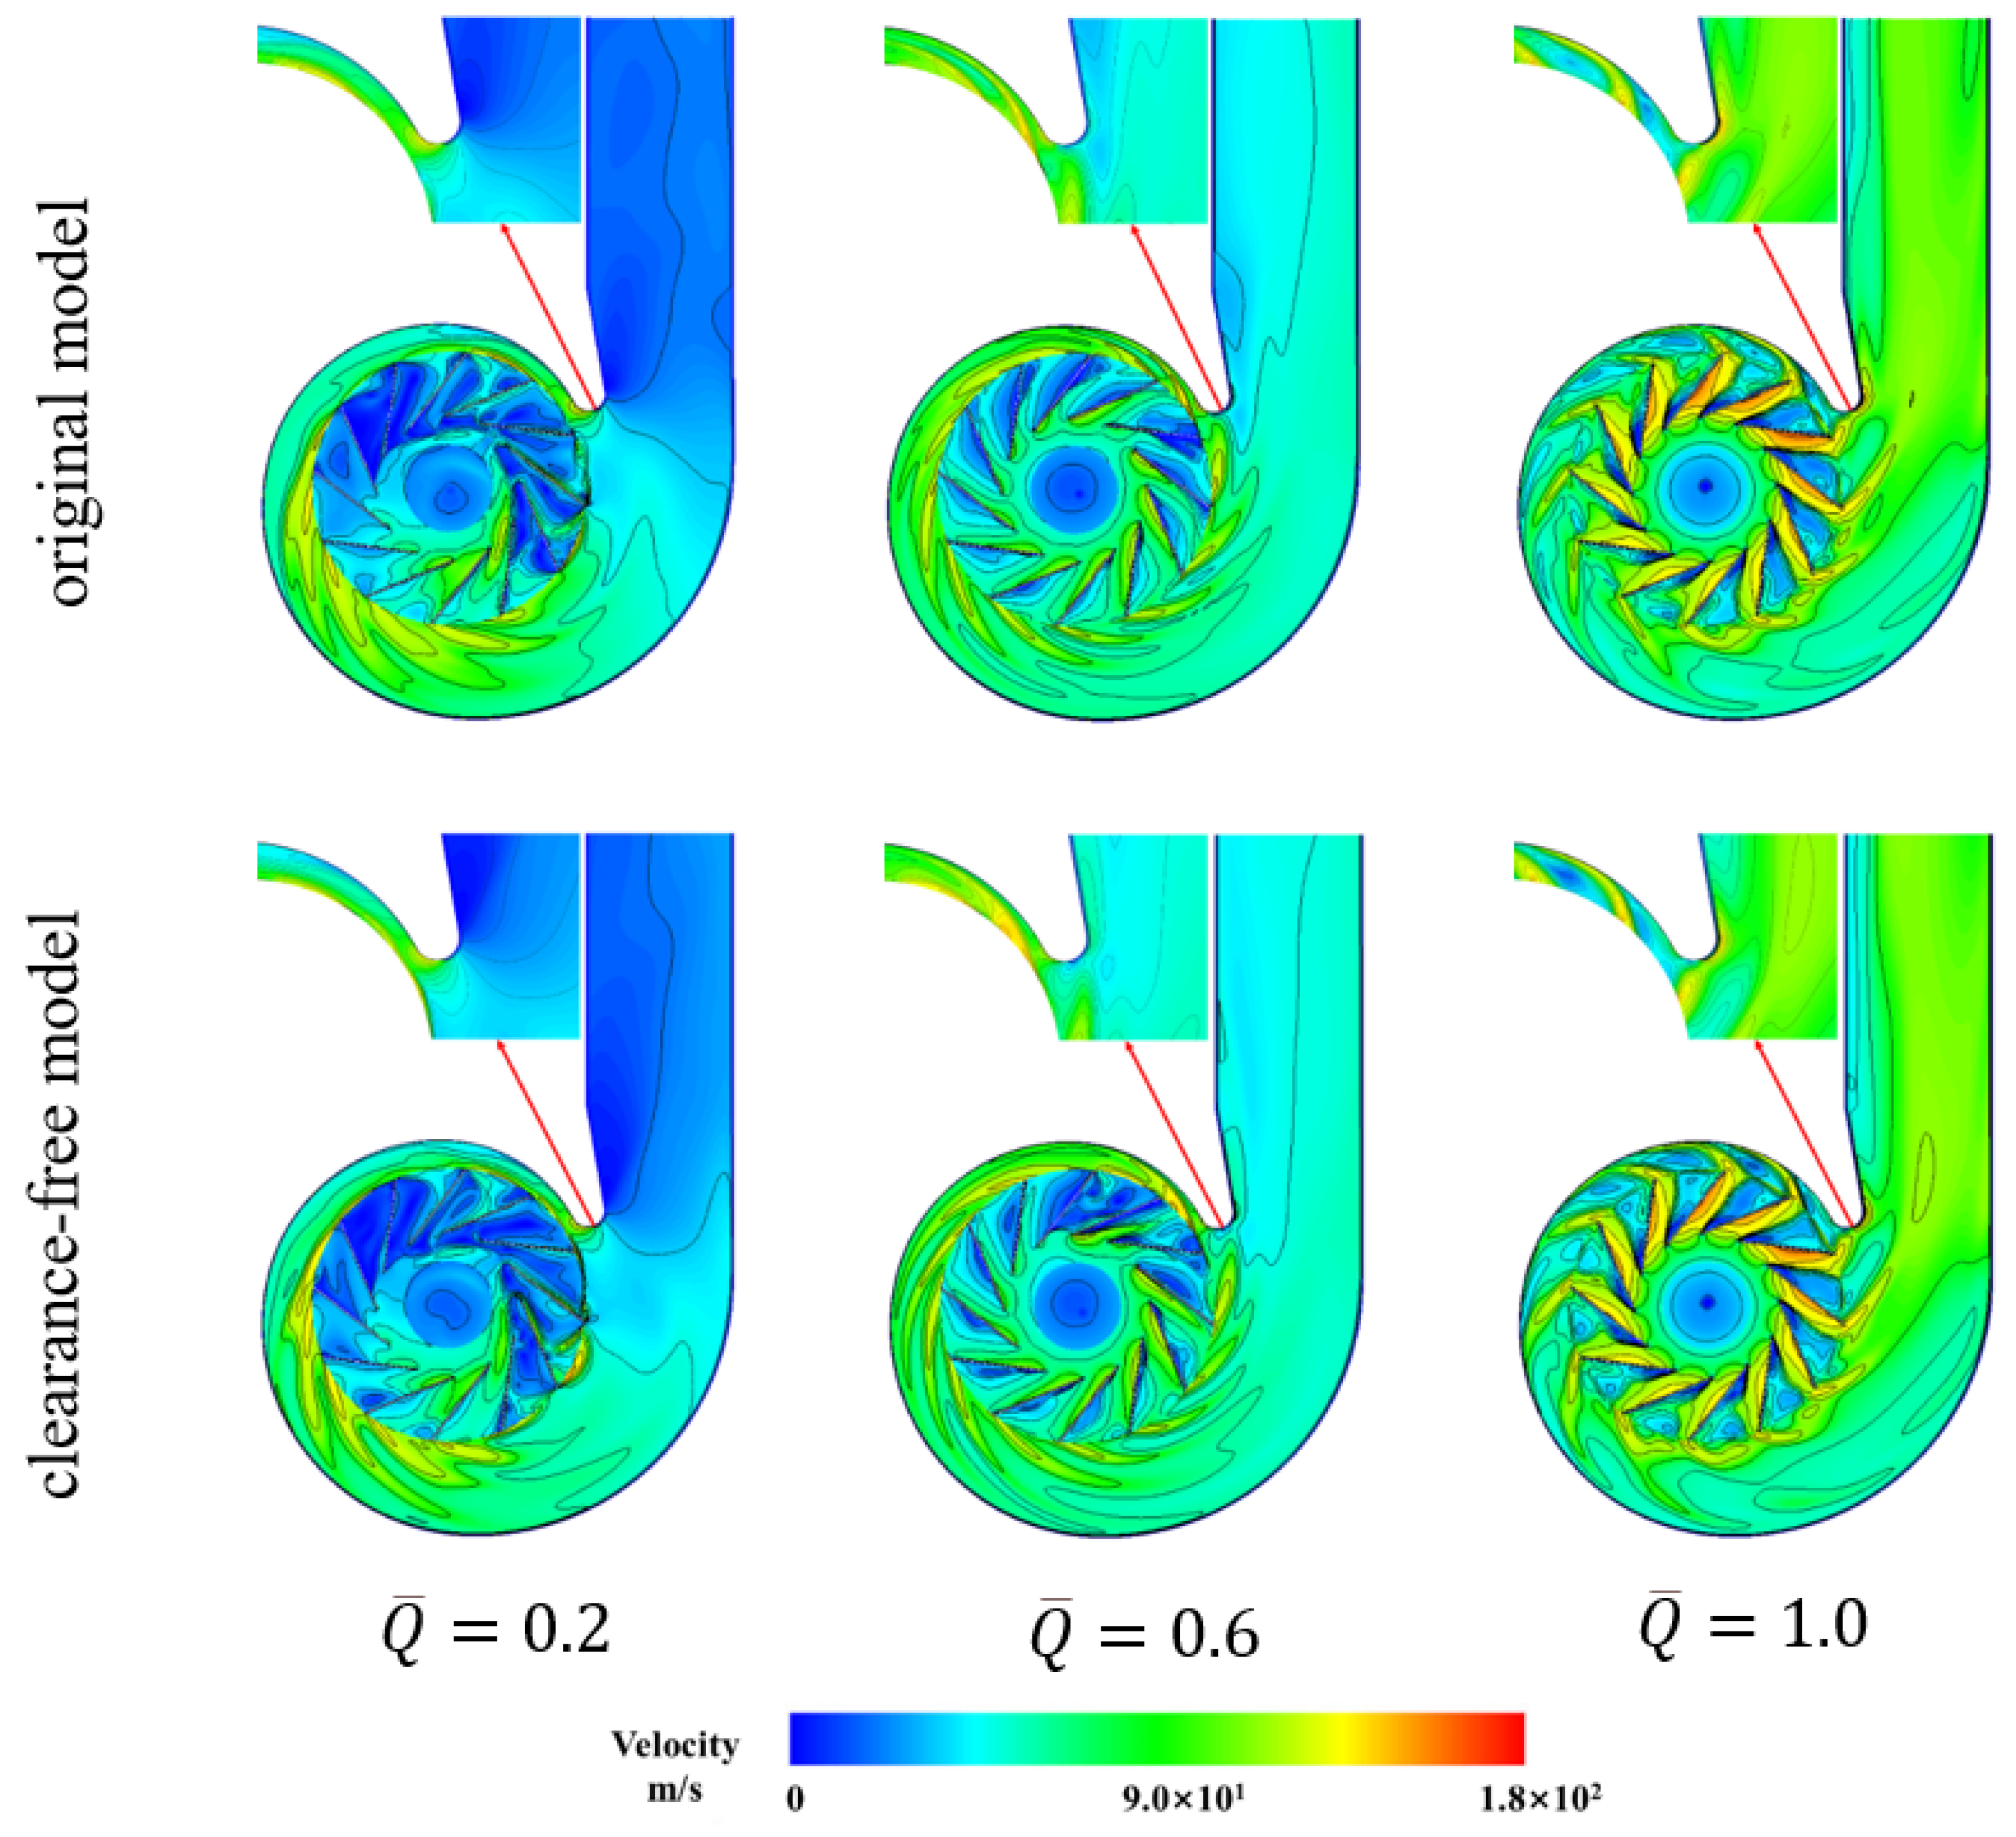
Figure 9 shows extensive low-velocity regions in the impeller passages of both the clearance-free and original models at low flow rates ( 0.2), indicating substantial passage blockage in the converged steady solutions. These low-velocity regions are consistent with the low total pressure efficiencies of both models. Under this low-flow condition, inlet clearance has little effect on overall aerodynamic performance.
Figure 9.
Velocity magnitude contours in the impeller passages with and without inlet clearance.
At the design flow rate ( 0.6), the flow accelerates smoothly in the impeller passages of the original model and the clearance-free model. Neither model exhibits appreciable large-scale separation. The overall flow structure differs little between them. This agrees with their similar aerodynamic performance at this condition. It further indicates that leakage-induced backflow has little effect on the impeller passages at the design flow rate. The losses are then largely confined to the clearance flow.
In the high-flow condition ( 1.0), pronounced high-velocity regions form near the impeller passage exit and the blade pressure surface. These regions form in both the original model and the clearance-free model. The high flow rate suppresses local leakage-induced backflow at the clearance. The impeller flow structures of the two models are therefore essentially indistinguishable. This is consistent with the small difference in their total pressure efficiency at this condition.
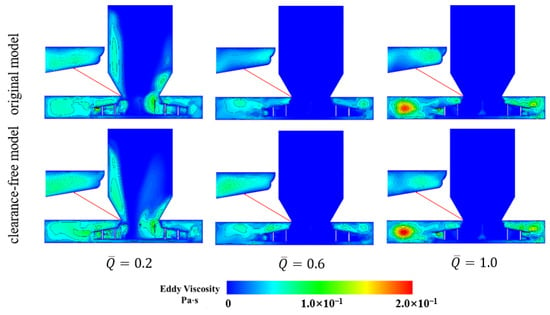
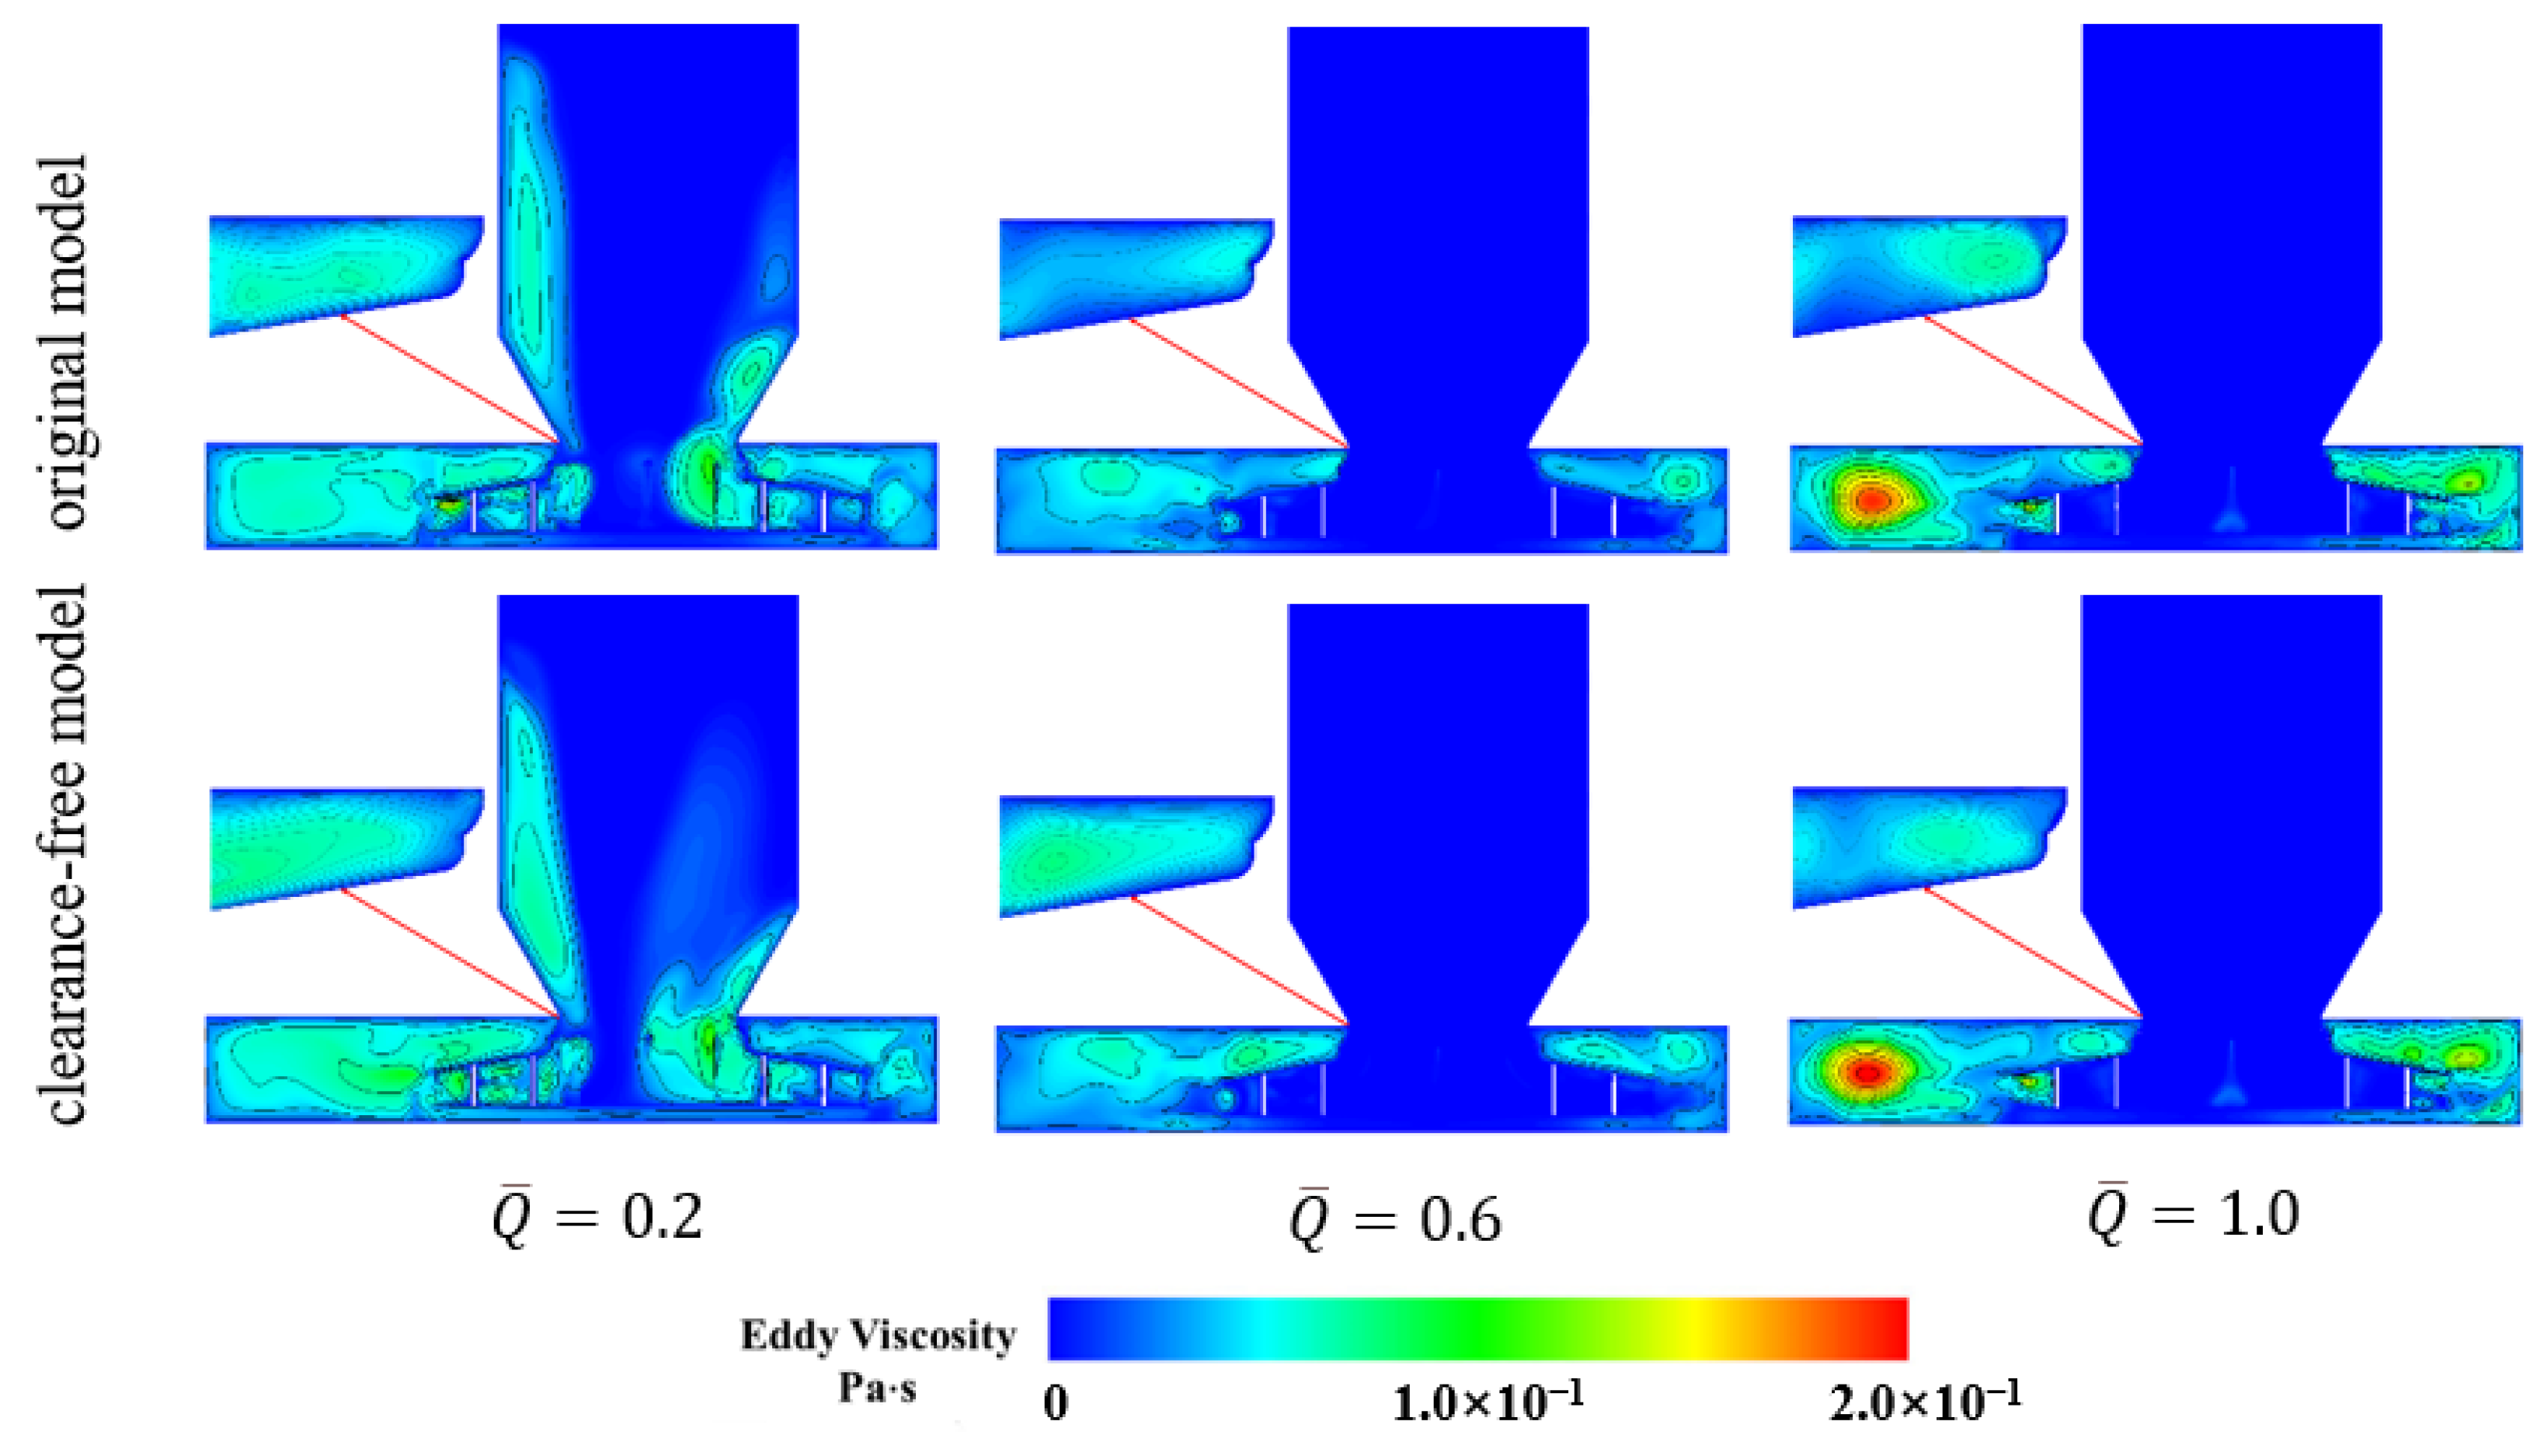
Figure 10 shows the eddy viscosity distribution at the low-flow condition ( 0.2). Eddy viscosity accumulates noticeably at the clearance opening of the original model. It also increases near the leading edge at the impeller inlet and along the suction surface. Leakage-induced backflow therefore produces an incipient disturbance that generates larger vortices.
Figure 10.
Eddy viscosity contours with and without inlet clearance.
At the design flow rate ( 0.6), magnified views near the volute and the clearance reveal well-defined regions of high eddy viscosity. These regions appear in both the original model and the clearance-free model. They indicate appreciable flow losses at these locations. The two models differ in where the regions lie. In the original model, the high-eddy viscosity region is displaced upstream to the clearance itself. In the corresponding region of the clearance-free model, the eddy viscosity is close to zero.
In the high-flow condition ( 1.0), the through-flow entering the impeller rises sharply. Leakage-induced backflow therefore contributes only a small fraction of it. The eddy viscosity fields within the volute are correspondingly similar in the original model and the clearance-free model. Both show pronounced accumulation over a large area.
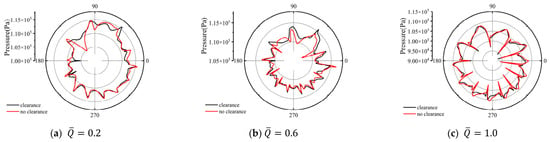
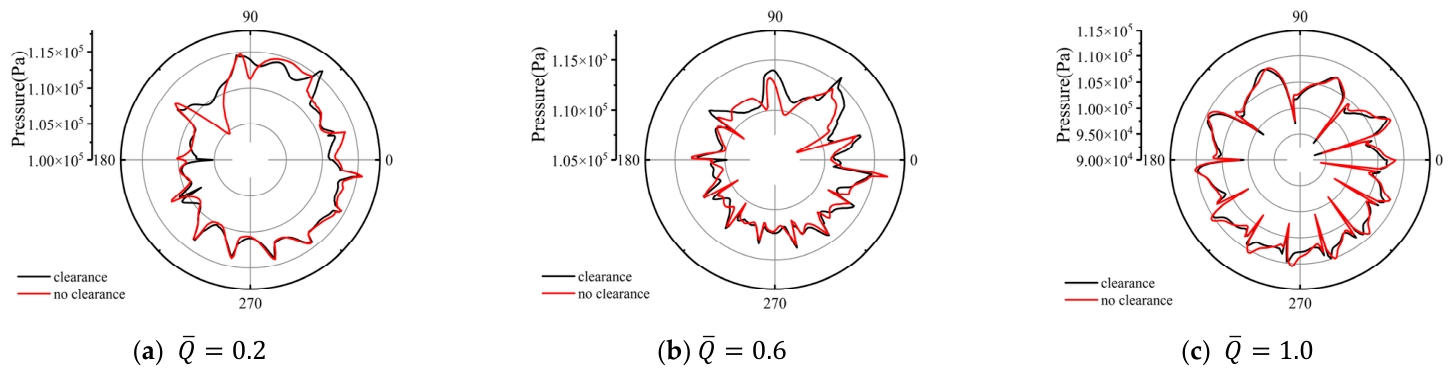
Figure 11 shows pronounced circumferential pressure non-uniformity in the low-flow condition. Together with the low-velocity regions in Figure 9, this indicates strongly non-uniform passage flow in the converged steady solution. The circumferential pressure variation is correspondingly large in both the original model and the clearance-free model. At the design flow rate ( 0.6), the circumferential pressure distribution of the clearance-free model is well-rounded and nearly symmetric. The original model instead exhibits pronounced pressure variation at azimuthal angles near the volute tongue. This indicates that leakage-induced backflow intensifies both the circumferential non-uniformity of the flow and the pressure variation. In the high-flow condition ( 1.0), the pressure variation at the exit of each blade passage is pronounced. The circumferentially averaged pressure is nearly the same in both models. The pressure profile of the original model, however, contracts inwards. The two models therefore differ in the shape of the profile rather than in its mean level.
Figure 11.
Polar plots of the pressure at the impeller exit with and without inlet clearance.
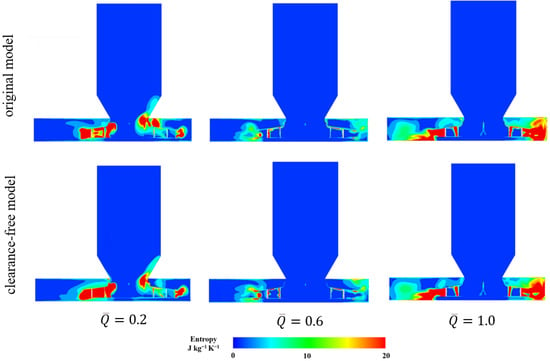
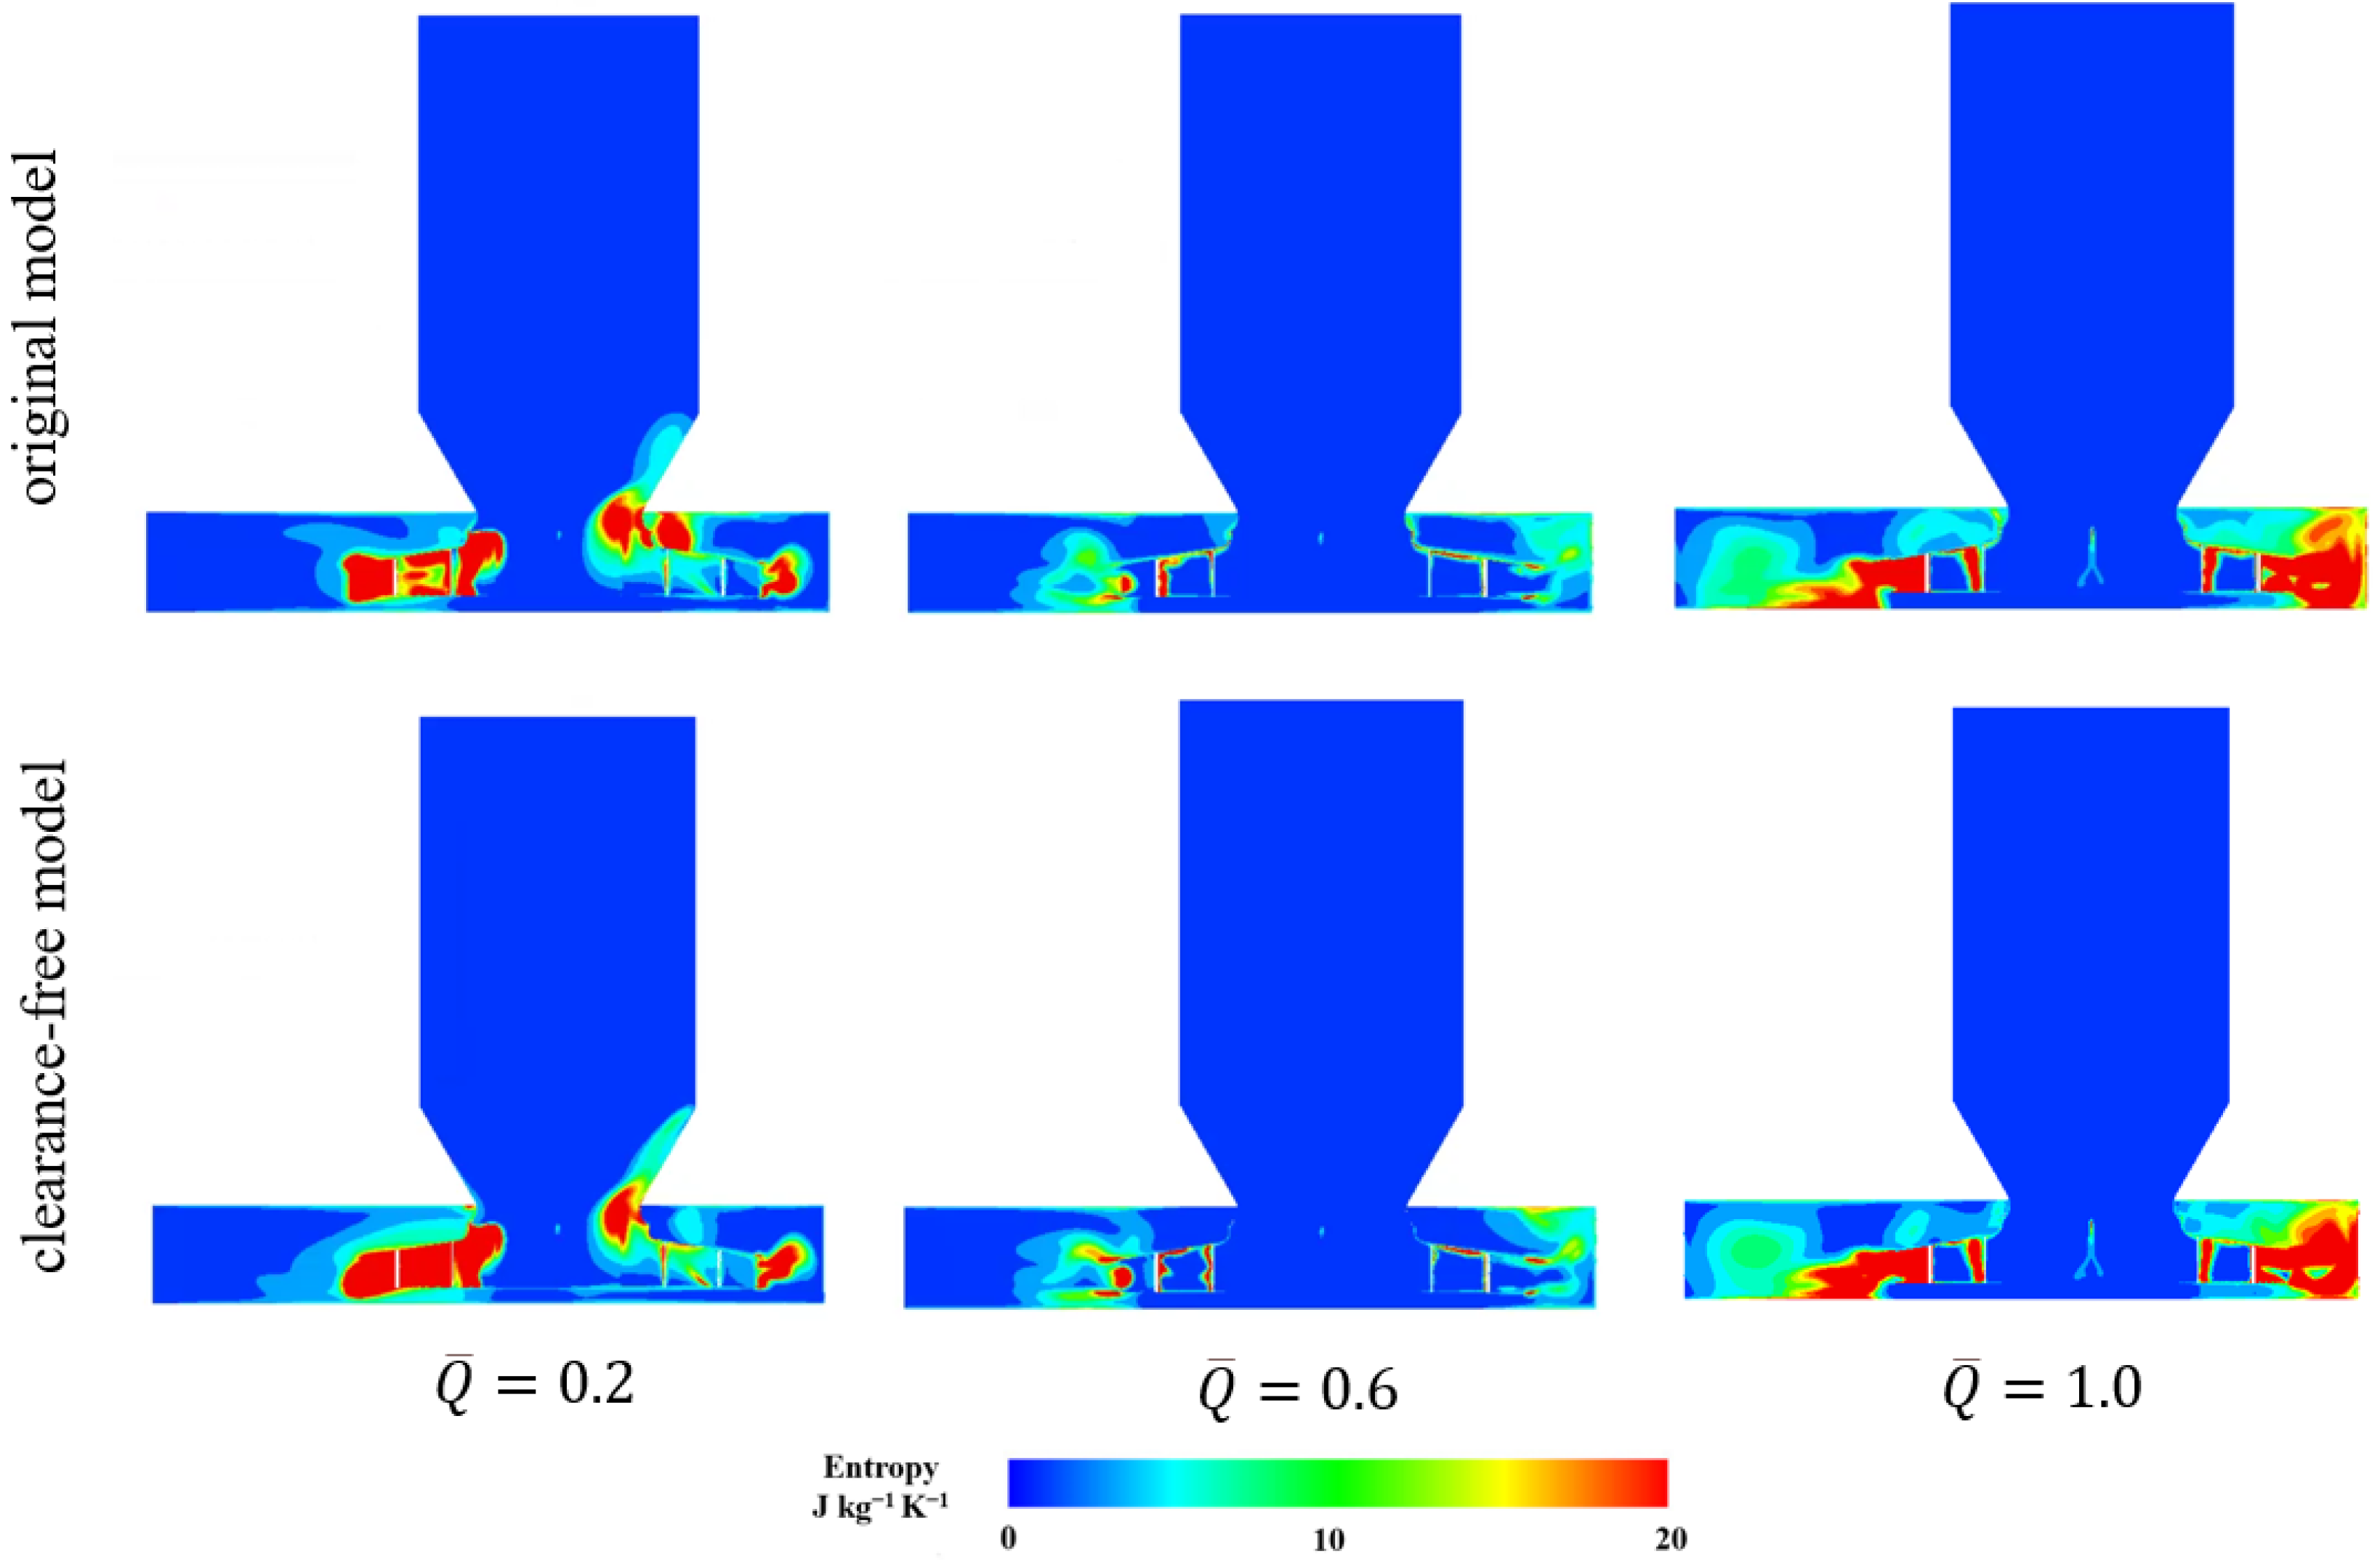
Figure 12 compares the specific entropy distributions of the original and clearance-free models at three operating conditions. In the low-flow condition ( 0.2), both models exhibit high-entropy regions near the nozzle–impeller connection and within the adjacent impeller passages. Their local shapes and upstream extensions differ, particularly on the right side of the connection. In the design flow condition ( 0.6), the inlet passage remains predominantly at low specific entropy, with localized differences near the connection and adjacent passages. In the high-flow condition ( 1.0), extensive high-entropy regions develop on both sides of the impeller–volute region, while the overall distributions remain similar. Locally elevated specific entropy is visible near the inlet clearance of the original model in all three conditions.
Figure 12.
Specific entropy distributions for the original and clearance-free models.
4. Effect of Overlapped Clearance Variability on the Aerodynamic Performance and Internal Flow Structure
4.1. Models of Overlapped Clearance
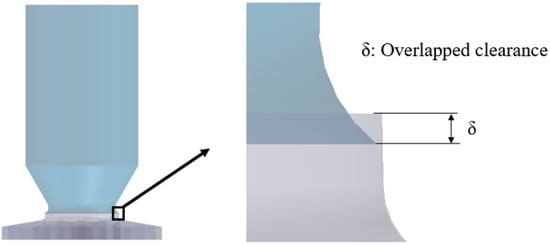
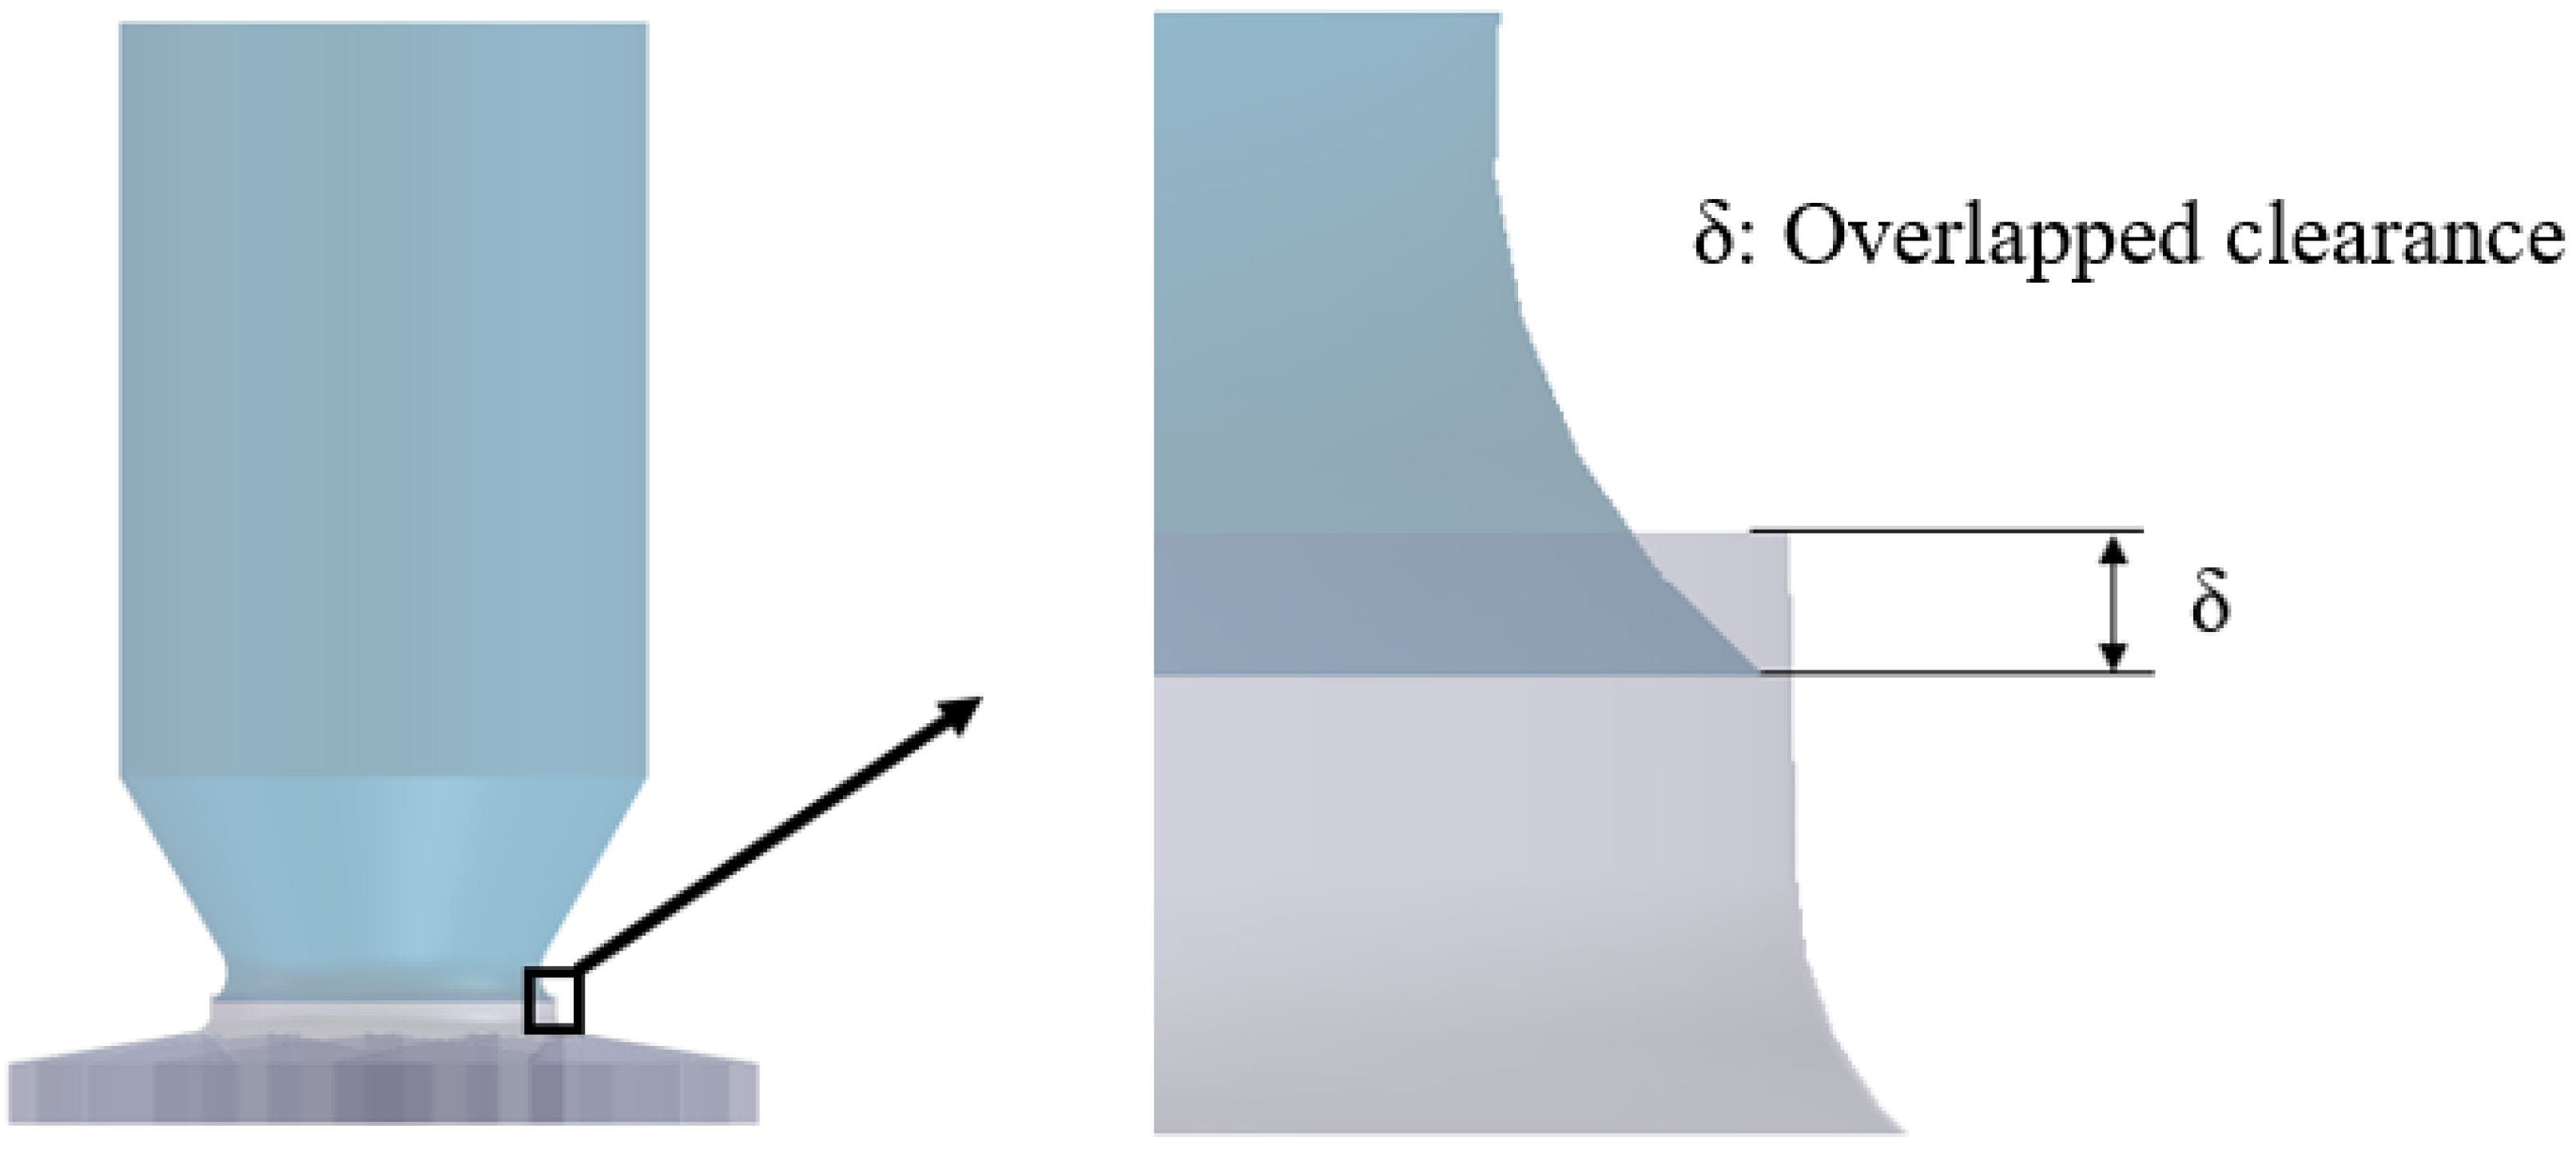
The aerodynamic performance of a fan depends on the geometry of the impeller inlet clearance. The effect of leakage-induced backflow at the impeller inlet depends on where the inlet nozzle is positioned. The inlet nozzle is commonly assembled with the impeller in an overlapped assembly. Figure 13 shows the overlapped clearance between the inlet nozzle and the impeller shroud.
Figure 13.
Geometry of overlapped clearance between the inlet nozzle and the impeller.
Table 4 summarizes the overlapped clearance δ, radial clearance c, and clearance flow area for each model, including the original configuration. Owing to the impeller’s geometry, c varies non-monotonically with δ. As δ increases from 10 to 12 and 20 mm, c changes from 4.26 to 2.00 and 2.75 mm, respectively. At δ = 30 mm, c increases to 7.17 mm, accompanied by a clearance flow area of 0.0102 m2. Among the modified configurations, the In-middle model has radial clearance and clearance flow area closest to those of the original model.
Table 4.
Dimensions of the overlapped clearances.
4.2. Effect of Overlapped Clearance on Aerodynamic Performance
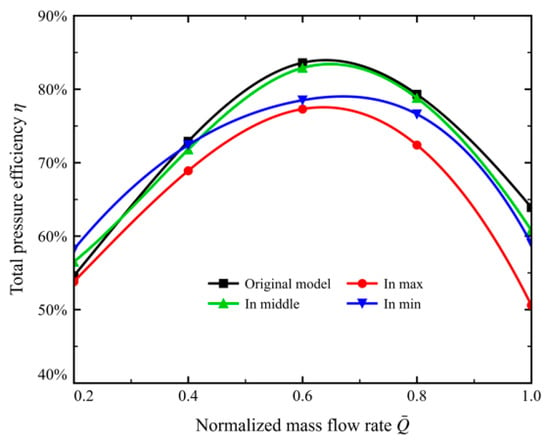
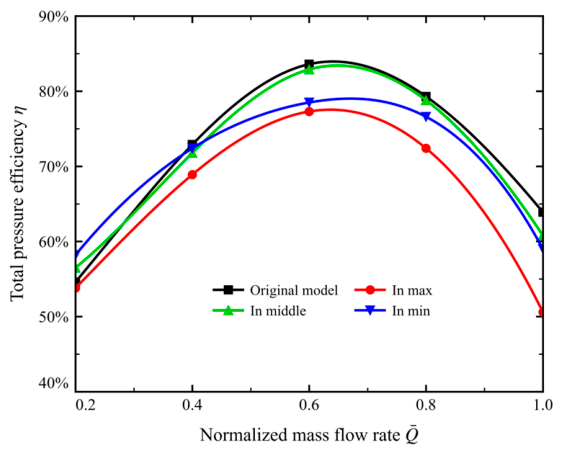
Figure 14 shows that the total pressure efficiency is highly sensitive to the size of the impeller-side clearance. At the design flow rate ( 0.6), the efficiency of the In-min configuration is 78.5%. That of the In-max configuration decreases to 77.2%. In the high-flow condition ( 1.0), the efficiency of the In-max configuration falls sharply to 50%, and the work output of the machine drops markedly. In contrast, the In-middle model and the original model remain close to each other across the flow range. They differ by 0.7 percentage points at the design flow rate ( 0.6). The In-min and In-max models both deviate substantially from these two models.
Figure 14.
Total pressure efficiency of the fan for the overlapped clearance models.
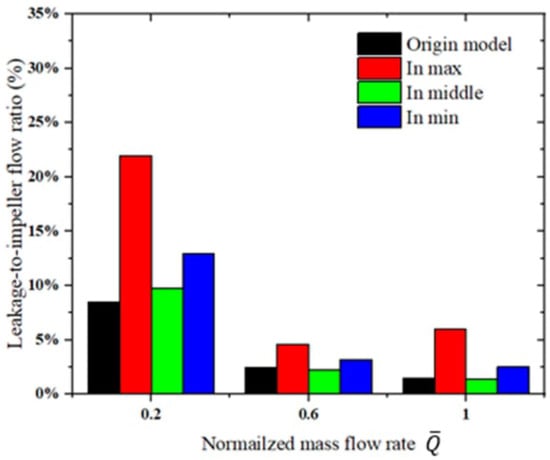
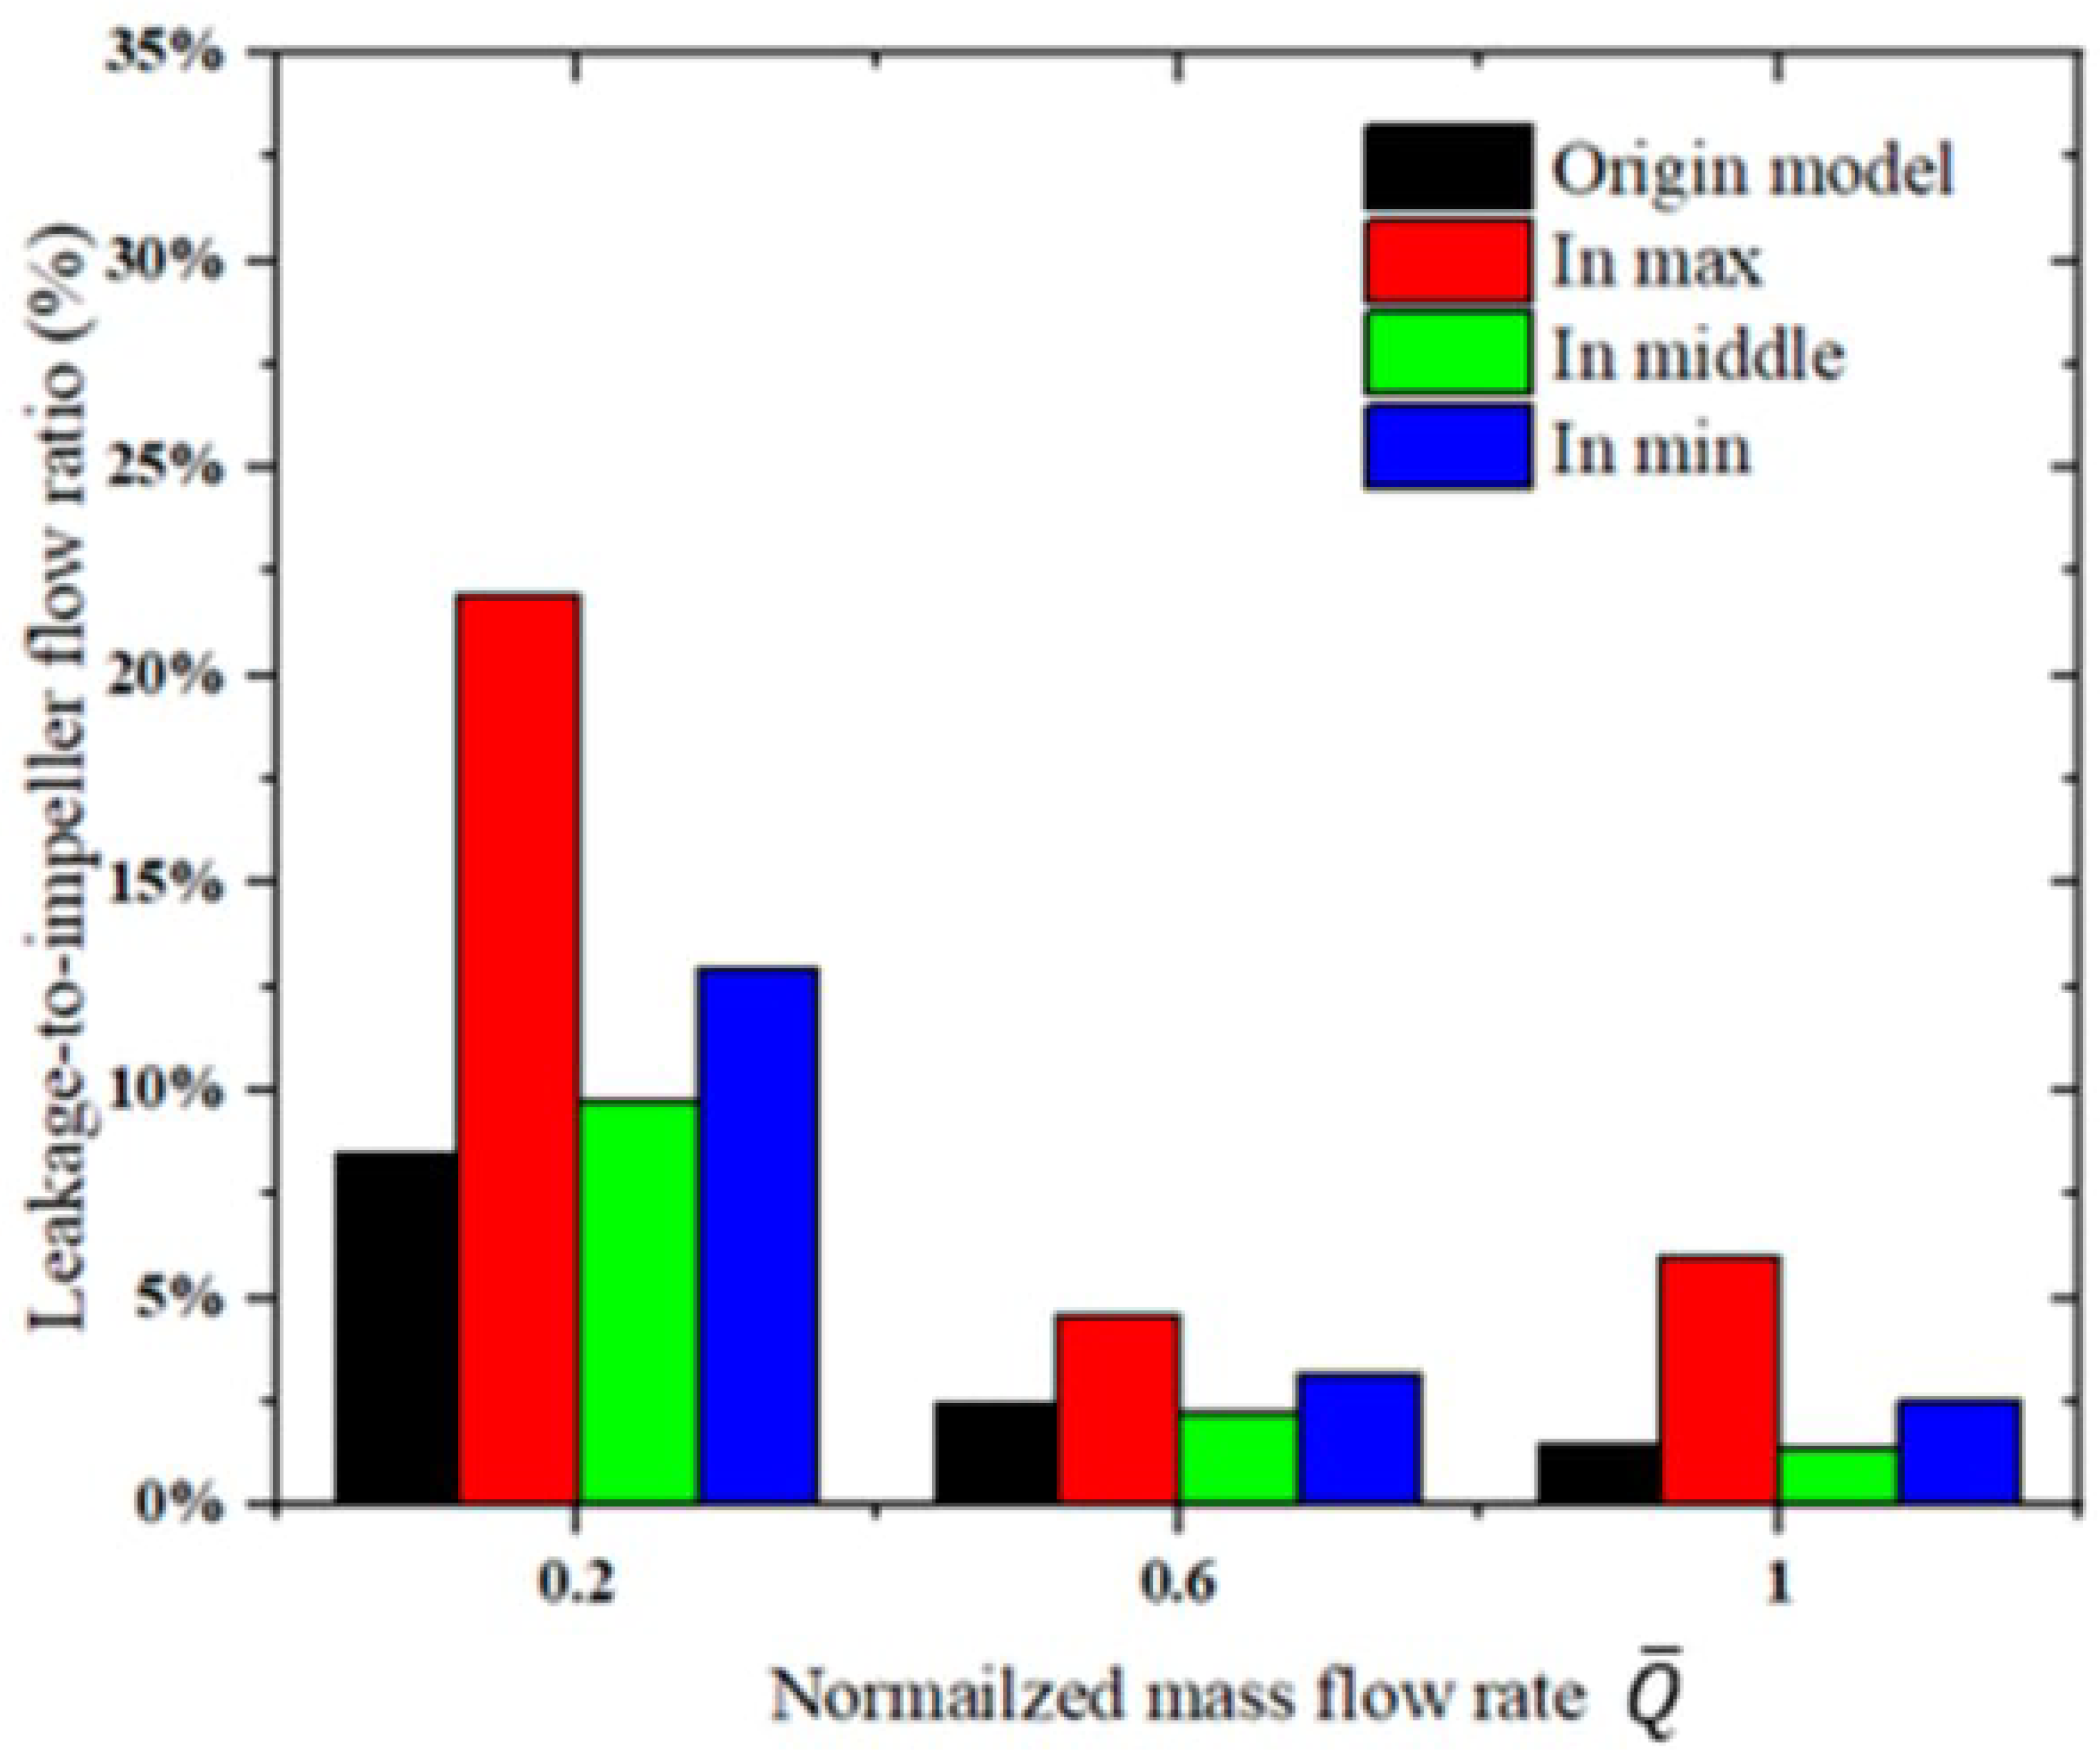
As shown in Figure 15, the leakage to impeller flow ratio shows a strong dependence on both the overlap configuration and operating condition. At the low flow rate ( 0.2), the In-max model exhibits the highest ratio of 21.95%, compared with 12.92%, 9.74%, and 8.45% for the In-min, In-middle, and original models, respectively. Clearance leakage therefore represents a substantial fraction of the impeller inflow, particularly in the In-max model. At the design and high-flow conditions, the In-middle model exhibits the lowest ratios of 2.22% and 1.38%, respectively. This is consistent with its higher total pressure efficiency than the In-max and In-min models under these conditions.
Figure 15.
Leakage to impeller mass flow ratios for the overlapped clearance models.
4.3. Effect of Overlapped Clearance on the Flow Structure
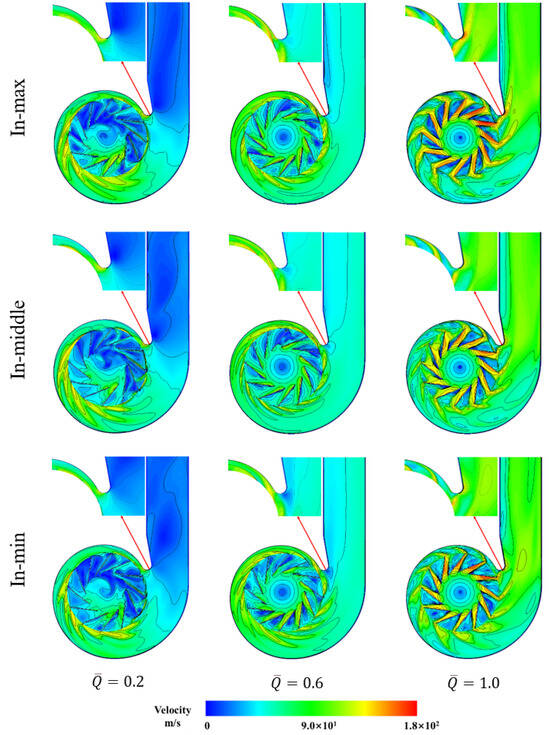
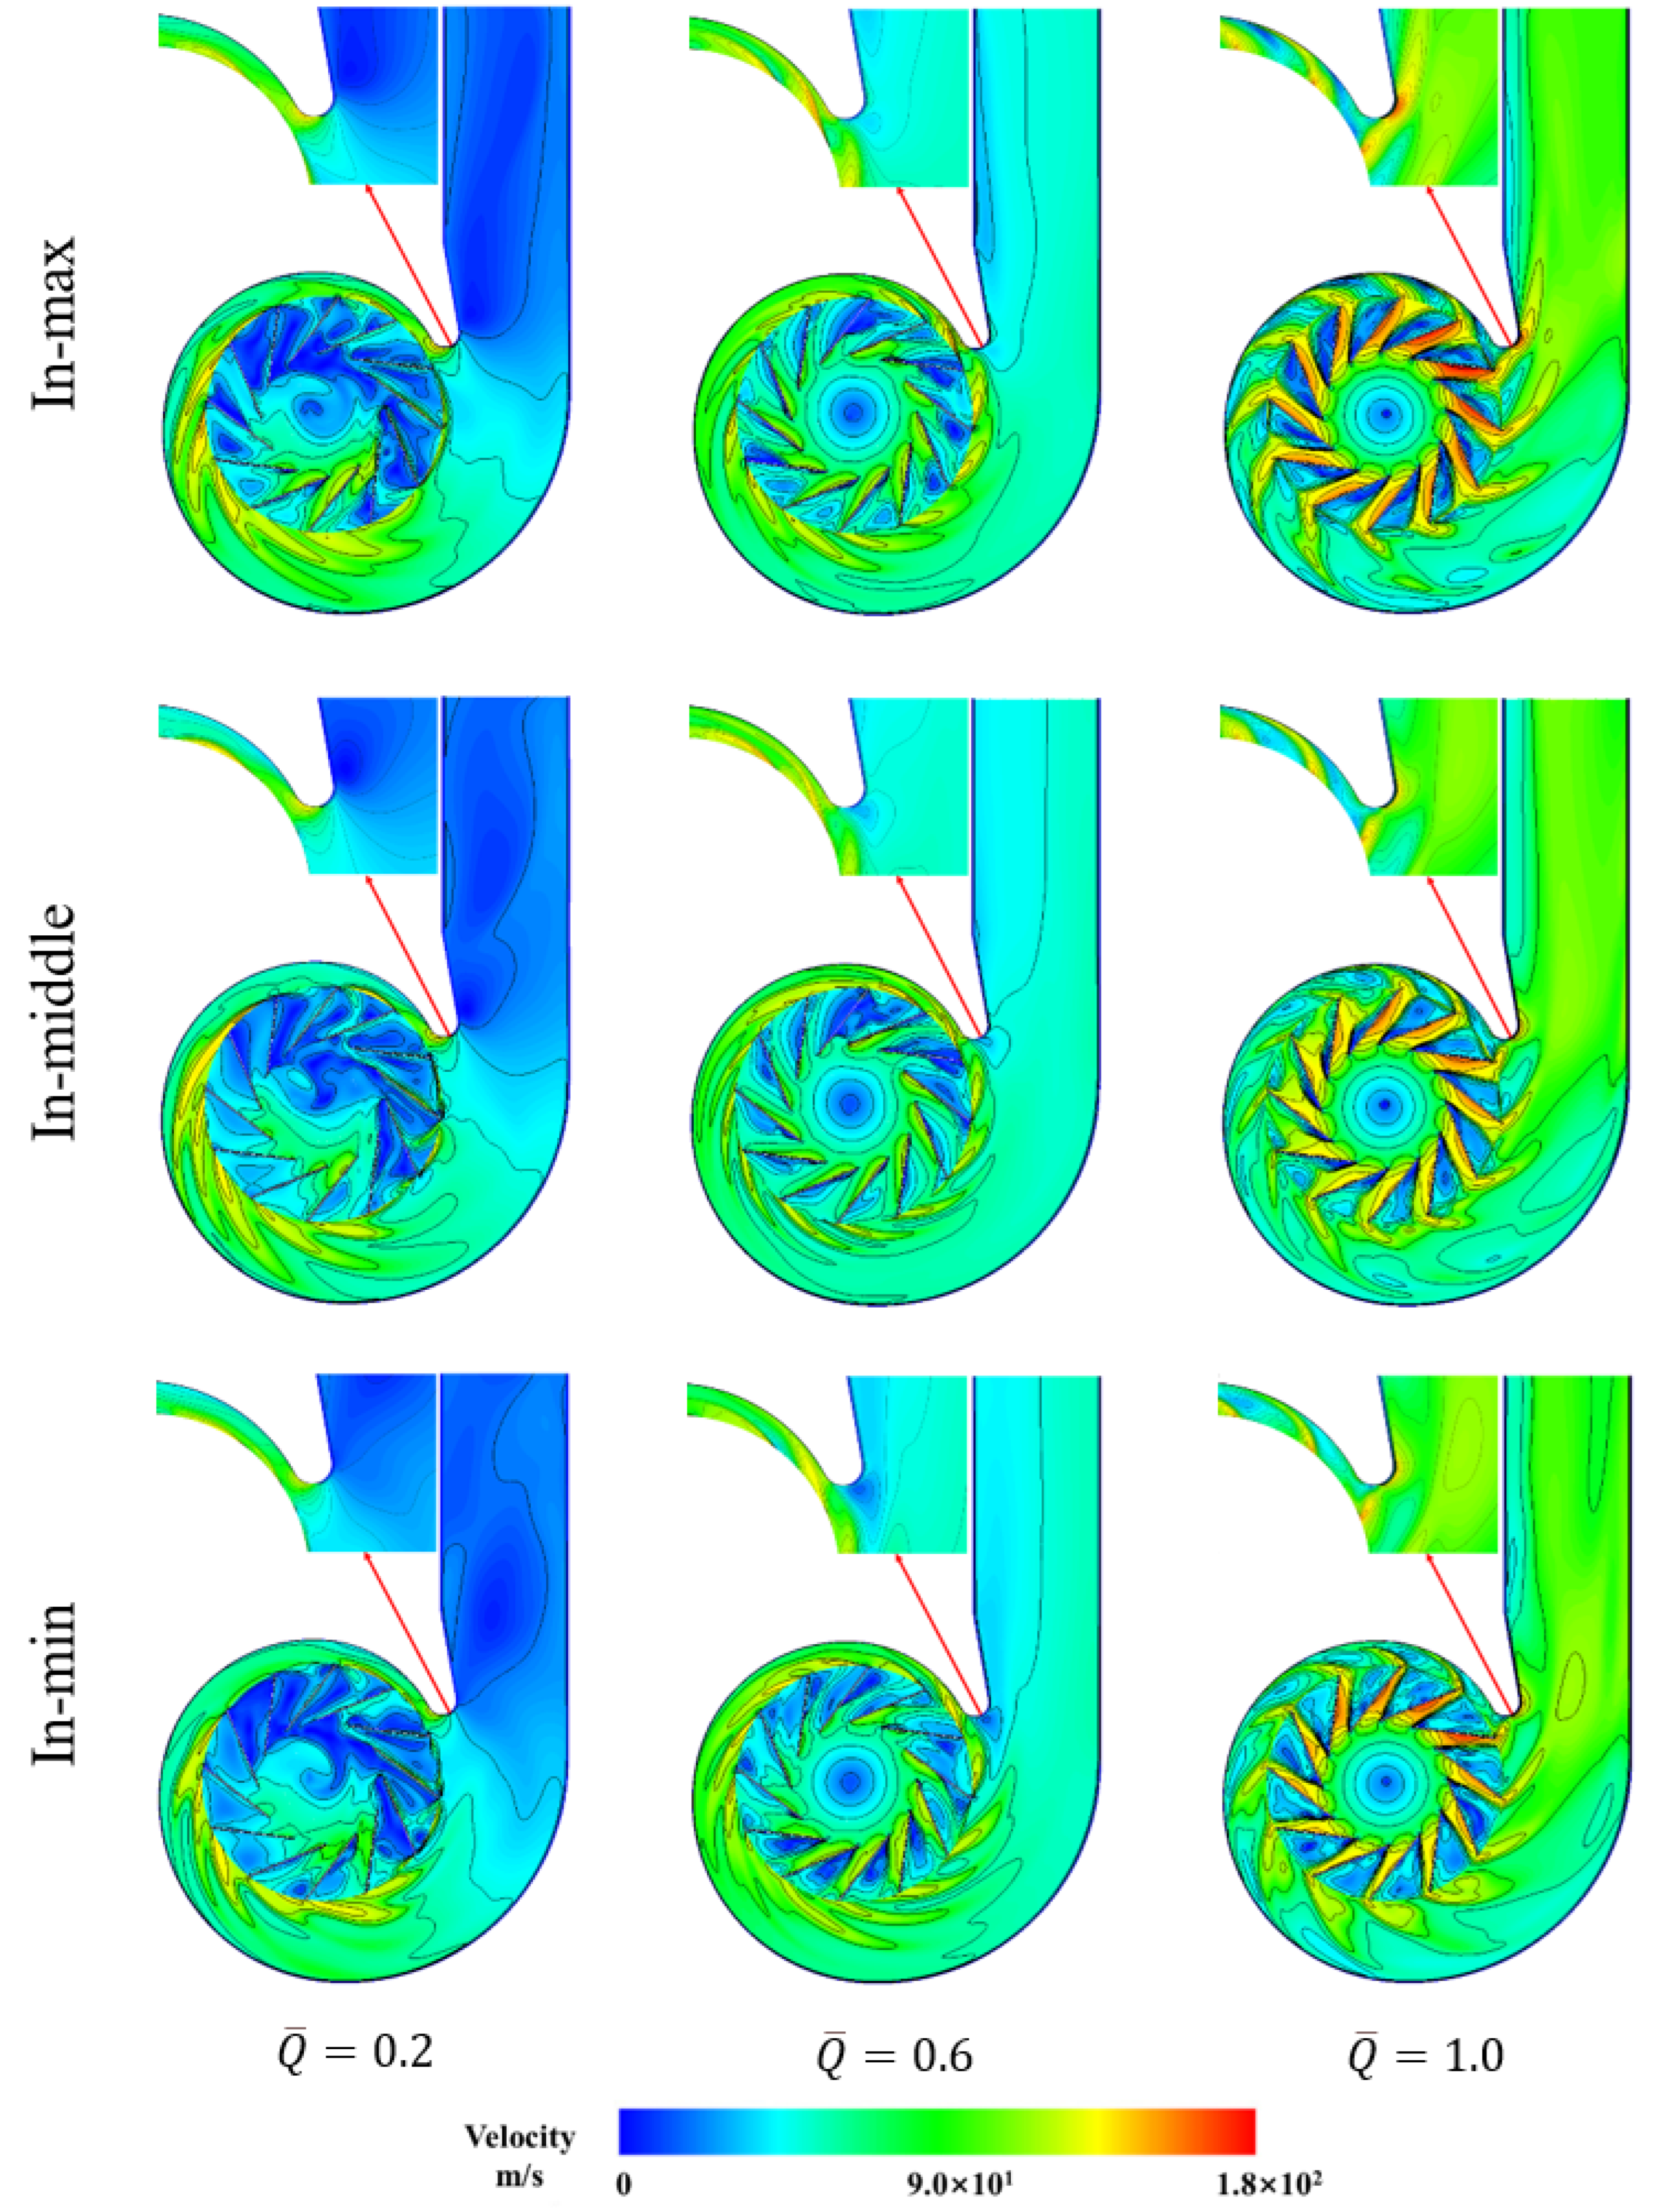
In the low-flow condition ( 0.2), all models exhibit extensive low-velocity regions within the impeller passages, indicating substantial passage blockage (Figure 16). These steady contours do not establish the existence of rotating stall cells.
Figure 16.
Velocity magnitude contours for the overlapped clearance models.
At the design flow rate ( 0.6), pronounced velocity gradients appear in the impeller passages of the In-max and In-min models. These gradients are consistent with enhanced shear and non-uniform passage flow associated with the interaction between clearance leakage and the main flow. This severe passage blockage weakens the momentum transfer capability of the blades. It also intensifies the jet–wake structure at the passage exit. Together, these effects account for the impaired circumferential work capability of the In-max and In-min models. They also account for the sharp drop in their total pressure efficiency. The In-middle model and the original model exhibit similar flow structures consistent with their aerodynamic performance curves.
In the high-flow condition ( 1.0), all three overlapped clearance models exhibit large-scale vortices. These vortices span the entire blade passage, and the flow losses increase. In the In-max model, a high-velocity jet forms inside of the passage. The outflow is also highly non-uniform among the passages. This explains the sharp drop in its efficiency at high flow rates.
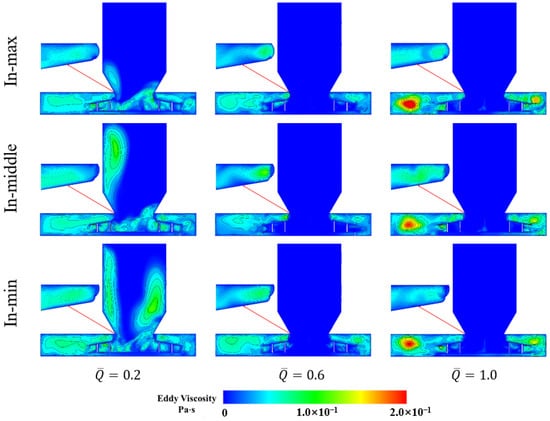
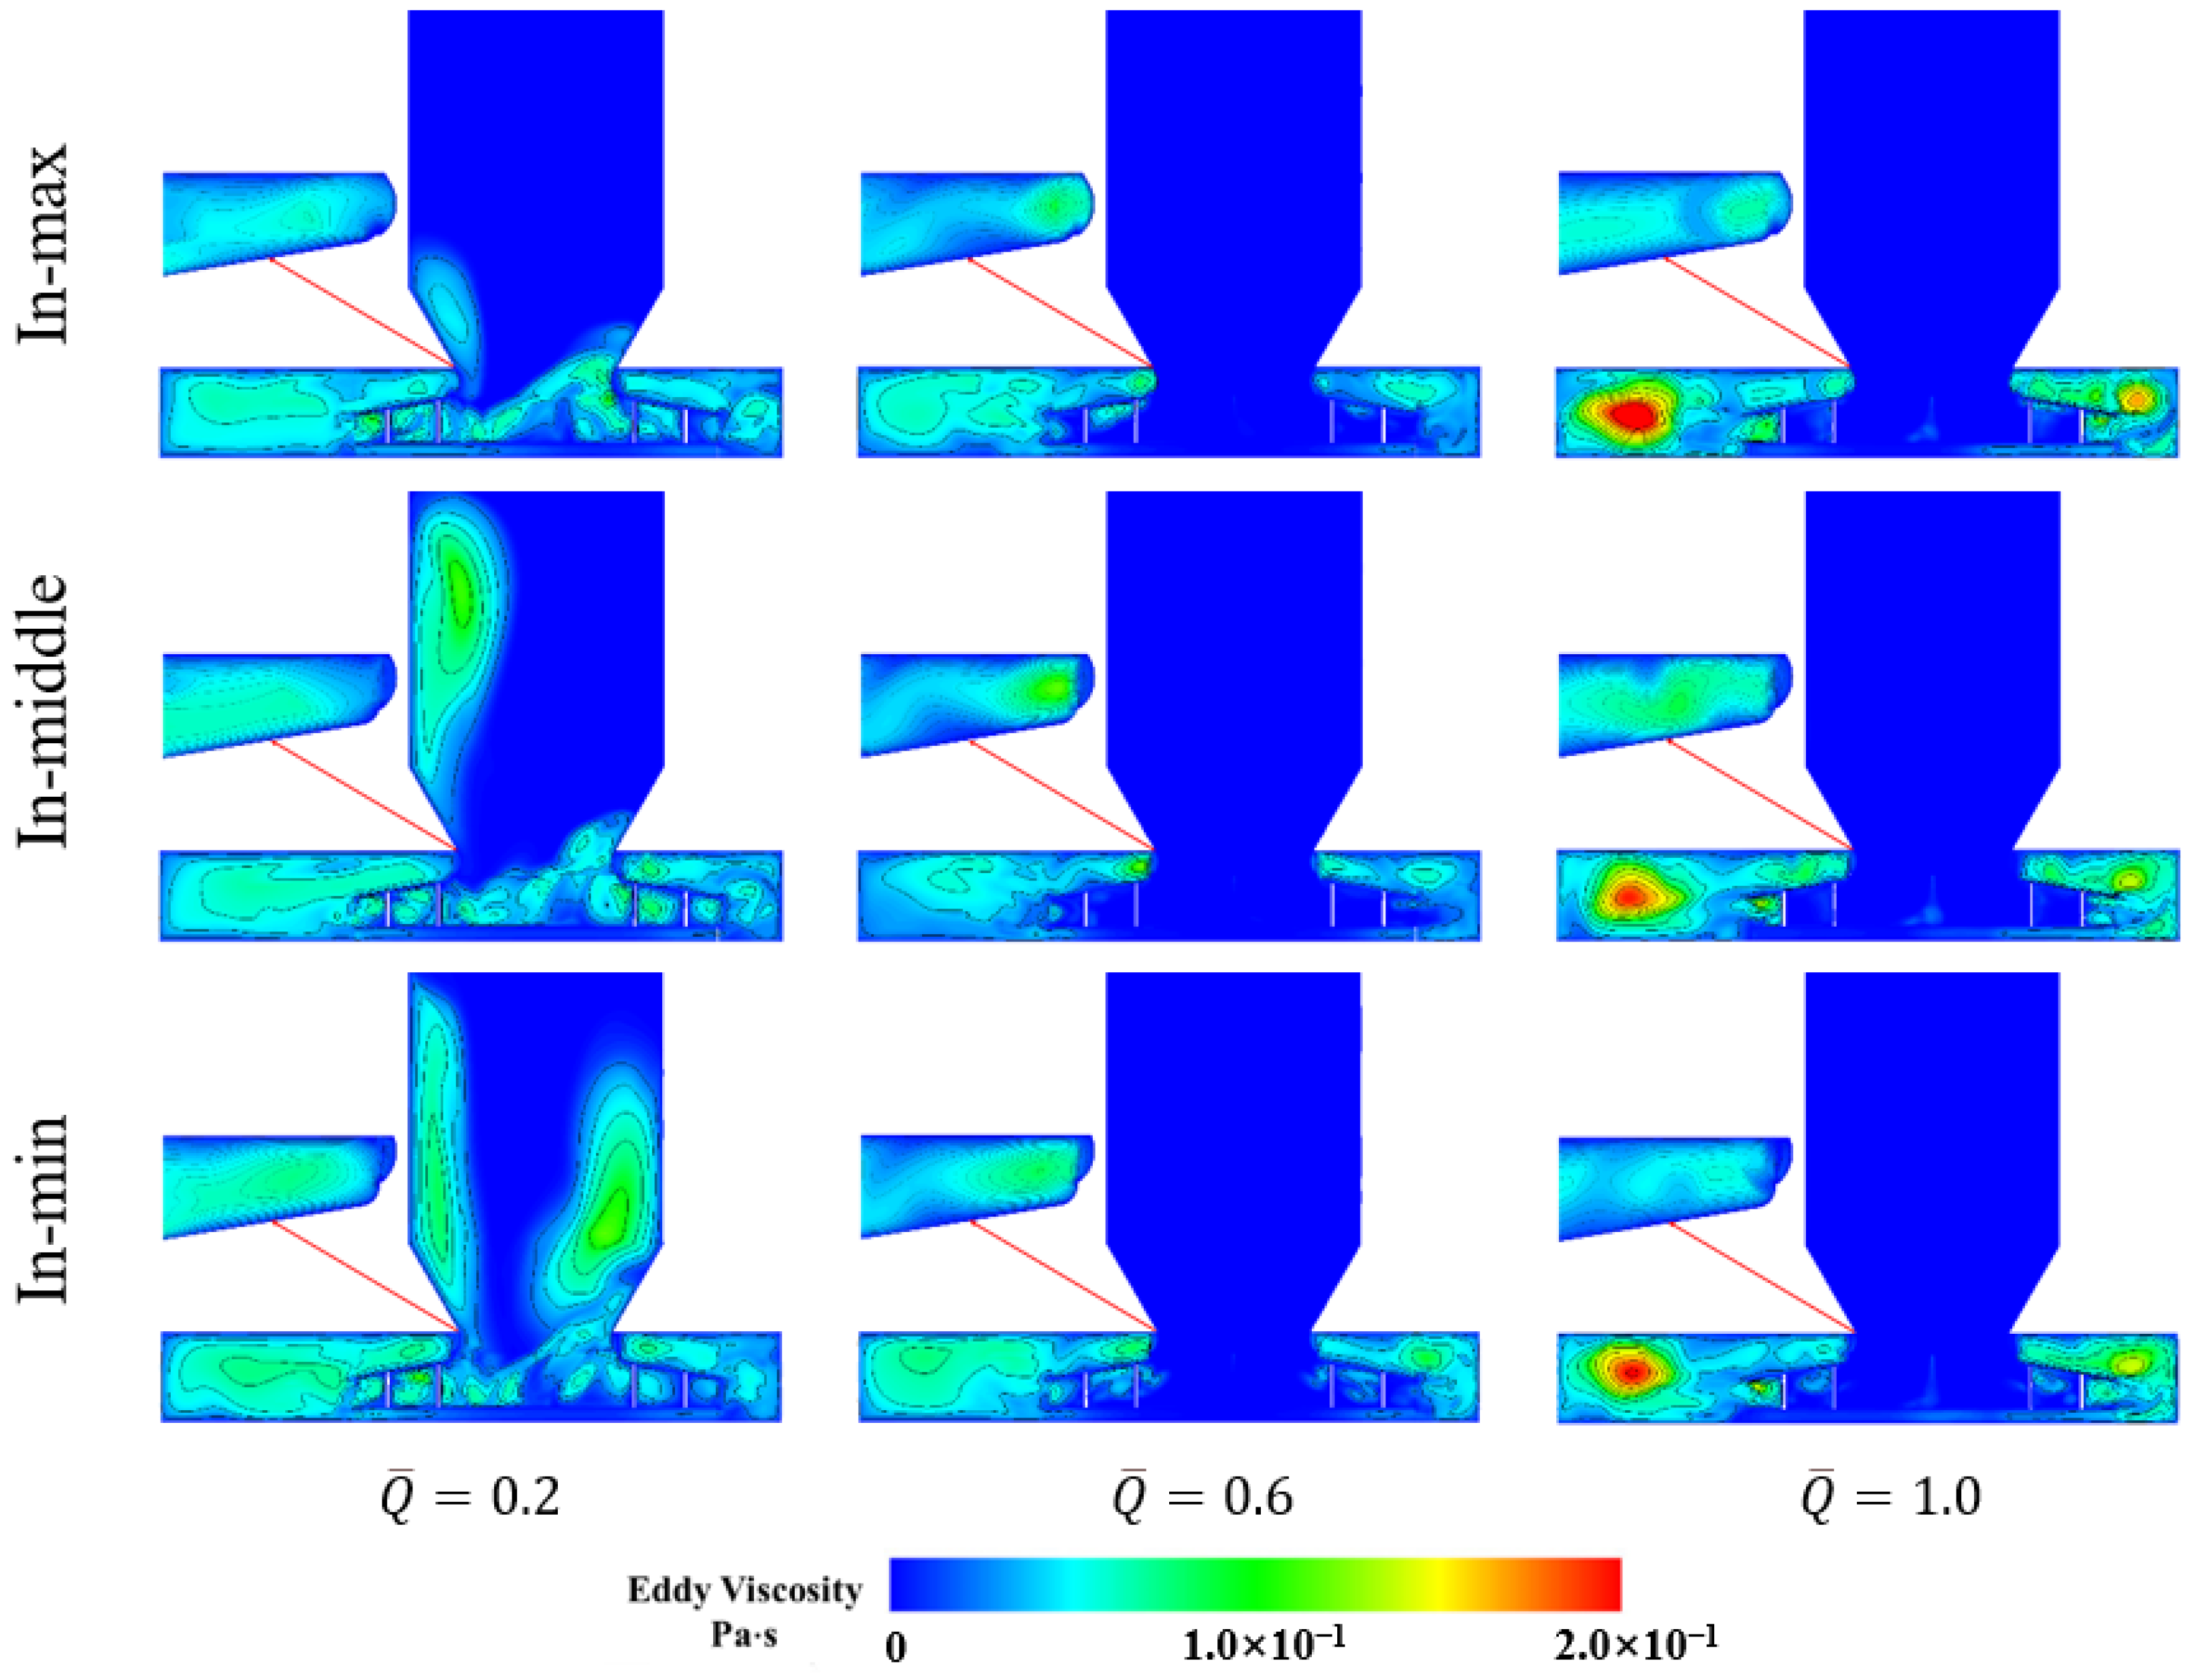
Figure 17 shows that the region of eddy viscosity accumulation inside of the impeller expands markedly in the low-flow condition (0.2). This expansion occurs in the overlapped clearance models relative to the original model. More pronounced regions of elevated eddy viscosity are also observed within the inlet nozzle of the In-min and In-middle models.
Figure 17.
Eddy viscosity contours for the overlapped clearance models.
At the design flow rate ( 0.6), clearance leakage produces regions of eddy viscosity accumulation. These regions appear both at the clearance and inside of the impeller passages of the overlapped clearance models. The In-middle model shows a weaker and more confined accumulation region at the clearance than the In-max and In-min models. It also shows a smaller accumulation region inside of the passage. Its flow loss is therefore the smallest. This is consistent with its aerodynamic performance curve.
In the high-flow condition ( 1.0), eddy viscosity accumulation is pronounced near the clearance and inside of the volute in the In-min and In-max models (Figure 17). The accumulation regions in the In-middle model, in contrast, resemble those of the original model. Clearance leakage therefore affects the aerodynamic performance of the In-middle model less than it does that of the In-min and In-max models.
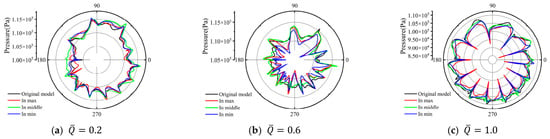
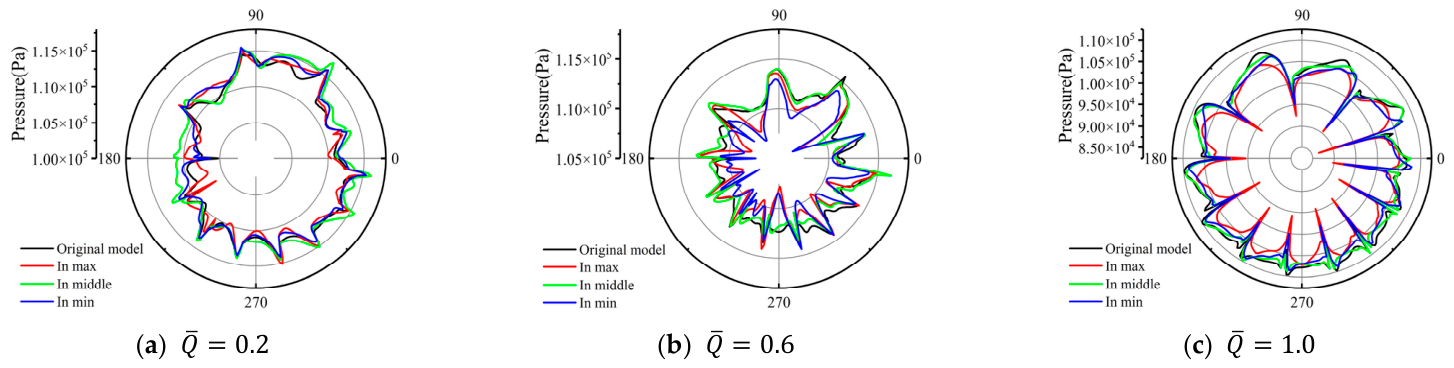
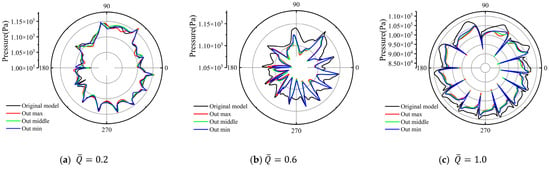
Figure 18 shows that the circumferential pressure profiles of the In-min, In-middle, and In-max models all resemble that of the original model in the low-flow condition (0.2). At the design flow rate (0.6), the pressure profile of the In-middle model closely follows that of the original model. The profiles of the In-min and In-max models, in contrast, contract markedly. This agrees with the total pressure efficiency at this condition. The In-middle model stays close to the original model, whereas the In-min and In-max models fall well below it. In the high-flow condition (1.0), the circumferential pressure profiles of the overlapped clearance models contract markedly inwards. This contraction explains their substantially lower total pressure efficiency relative to the original model.
Figure 18.
Polar plots of the pressure at the impeller exit for different overlapped clearances.
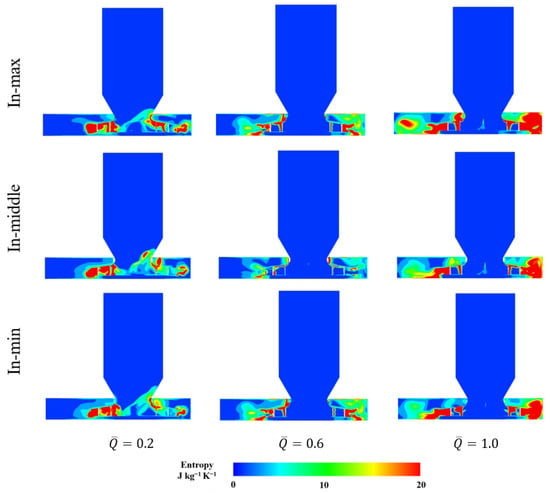
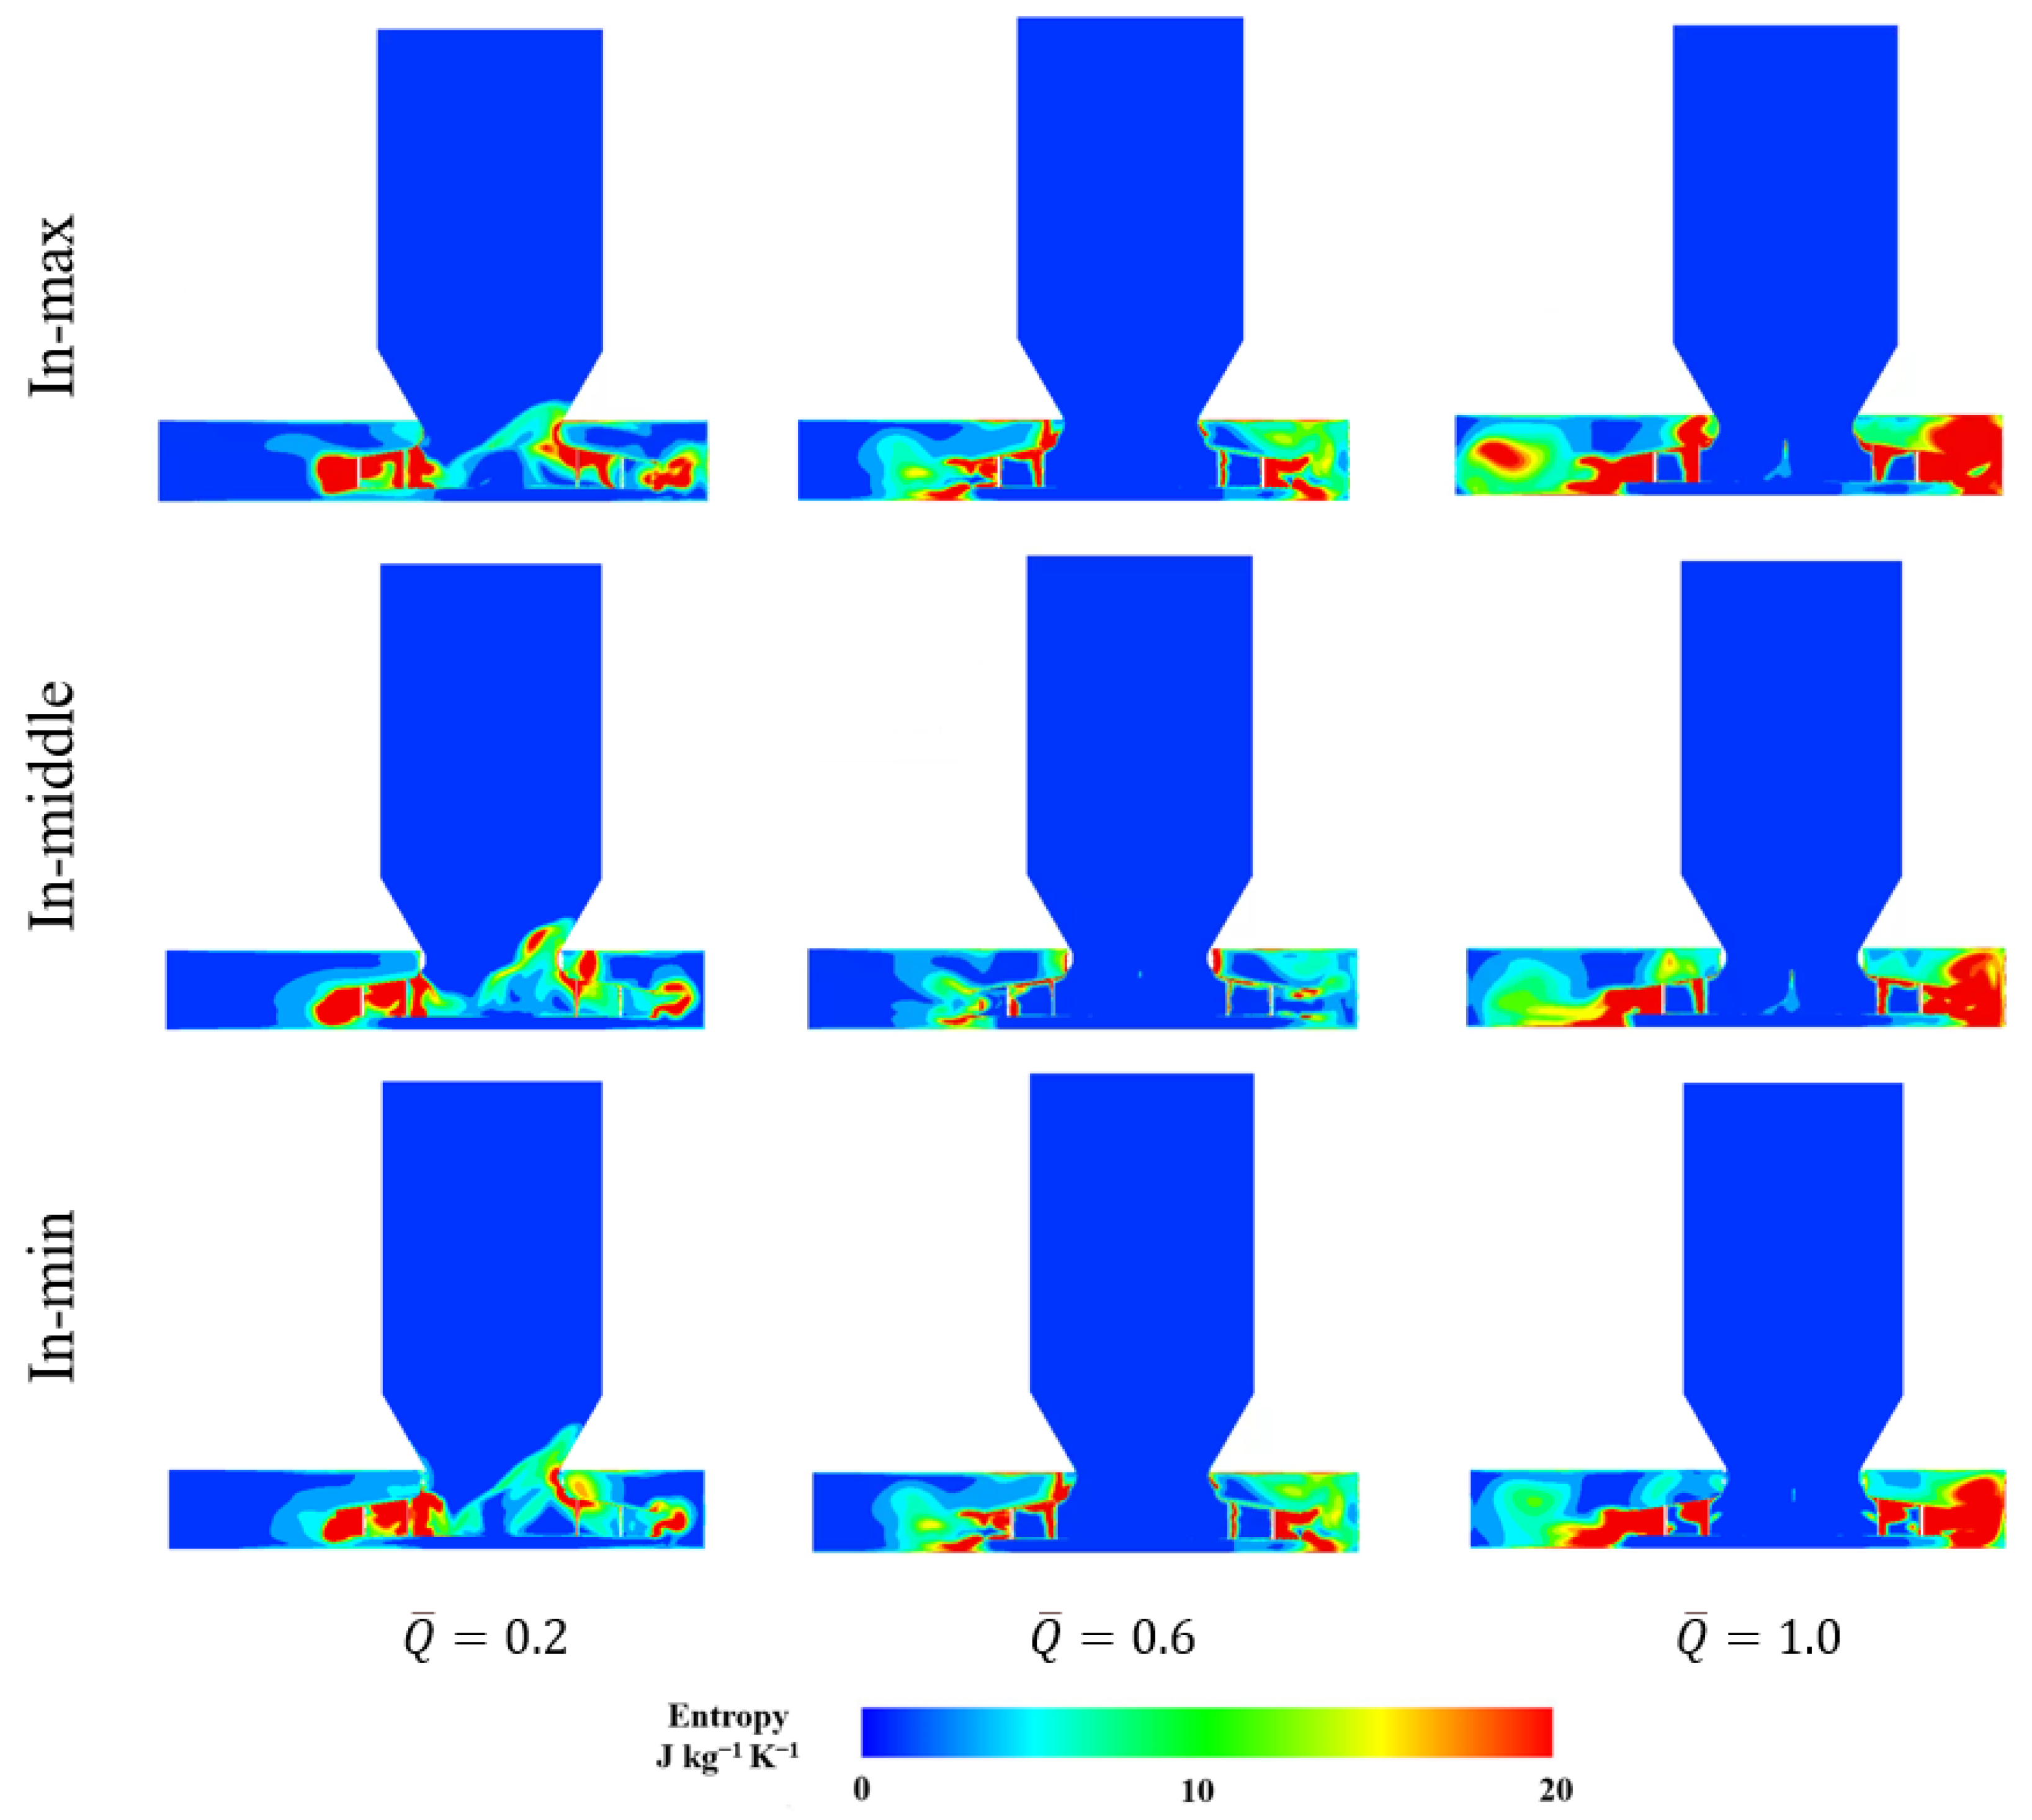
Figure 19 compares the specific entropy distributions of the In-max, In-middle, and In-min models at three operating conditions. At the low flow rate ( 0.2), all three models exhibit high-entropy regions near the nozzle–impeller connection and within the adjacent passages. The shape and extent of the band extending upstream from the right side of the connection differ among the models. At the design flow rate ( 0.6), upstream penetration is reduced, and the differences are concentrated near the connection and within the impeller–volute region. The In-middle model exhibits less extensive elevated entropy regions in parts of this region than the other two models. At the high flow rate ( 1.0), extensive high-entropy regions occur on both sides in all three configurations, although their local distributions differ. Locally elevated specific entropy remains visible near the clearance at all three flow rates.
Figure 19.
Specific entropy distributions for the overlapped clearance models.
5. Effect of Axial Clearance Variability on the Aerodynamic Performance and Flow Structure
5.1. Models of the Axial Clearance
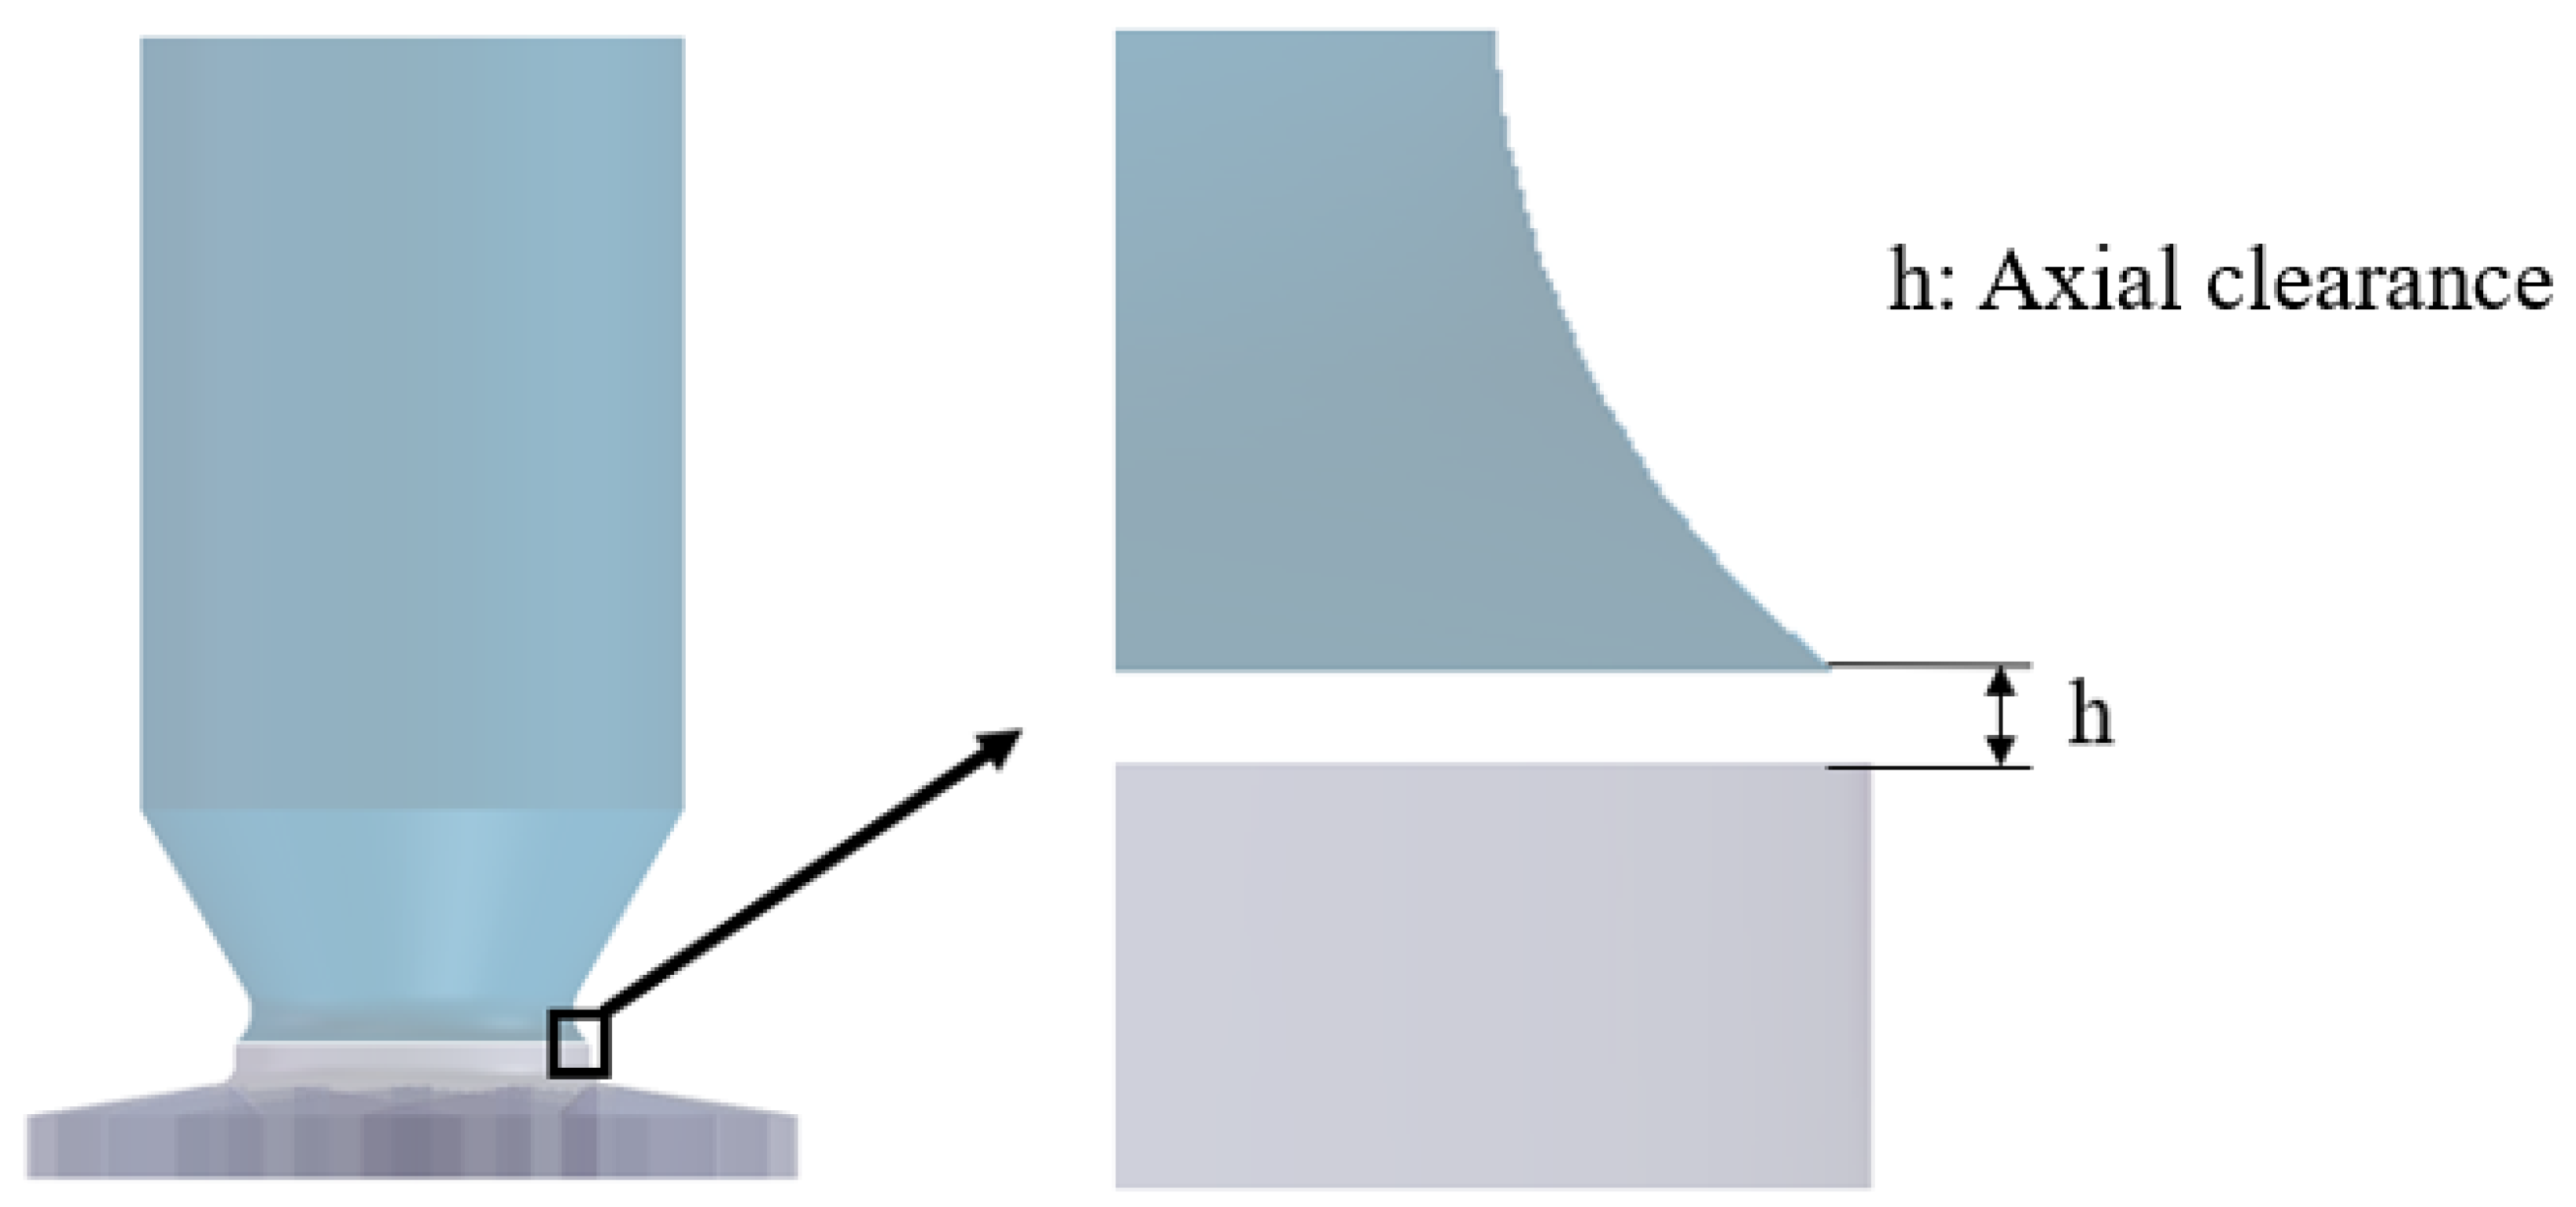
Figure 20 shows the axial clearance assembly. Depending on the practical assembly conditions, the inlet nozzle and the impeller can be mated with an axial clearance instead of the overlapped one. Table 5 lists the axial clearance dimensions. Three axial clearance models were studied to assess their effects on aerodynamic performance relative to the original model.
Figure 20.
Geometry of the axial clearance between the inlet nozzle and the impeller.
Table 5.
Dimensions of the axial clearances.
5.2. Effect of the Axial Clearance on the Aerodynamic Performance
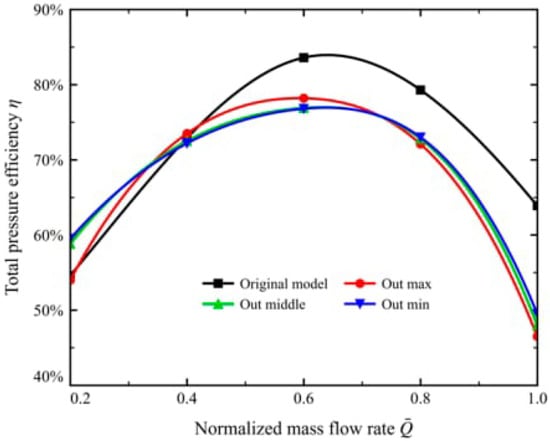
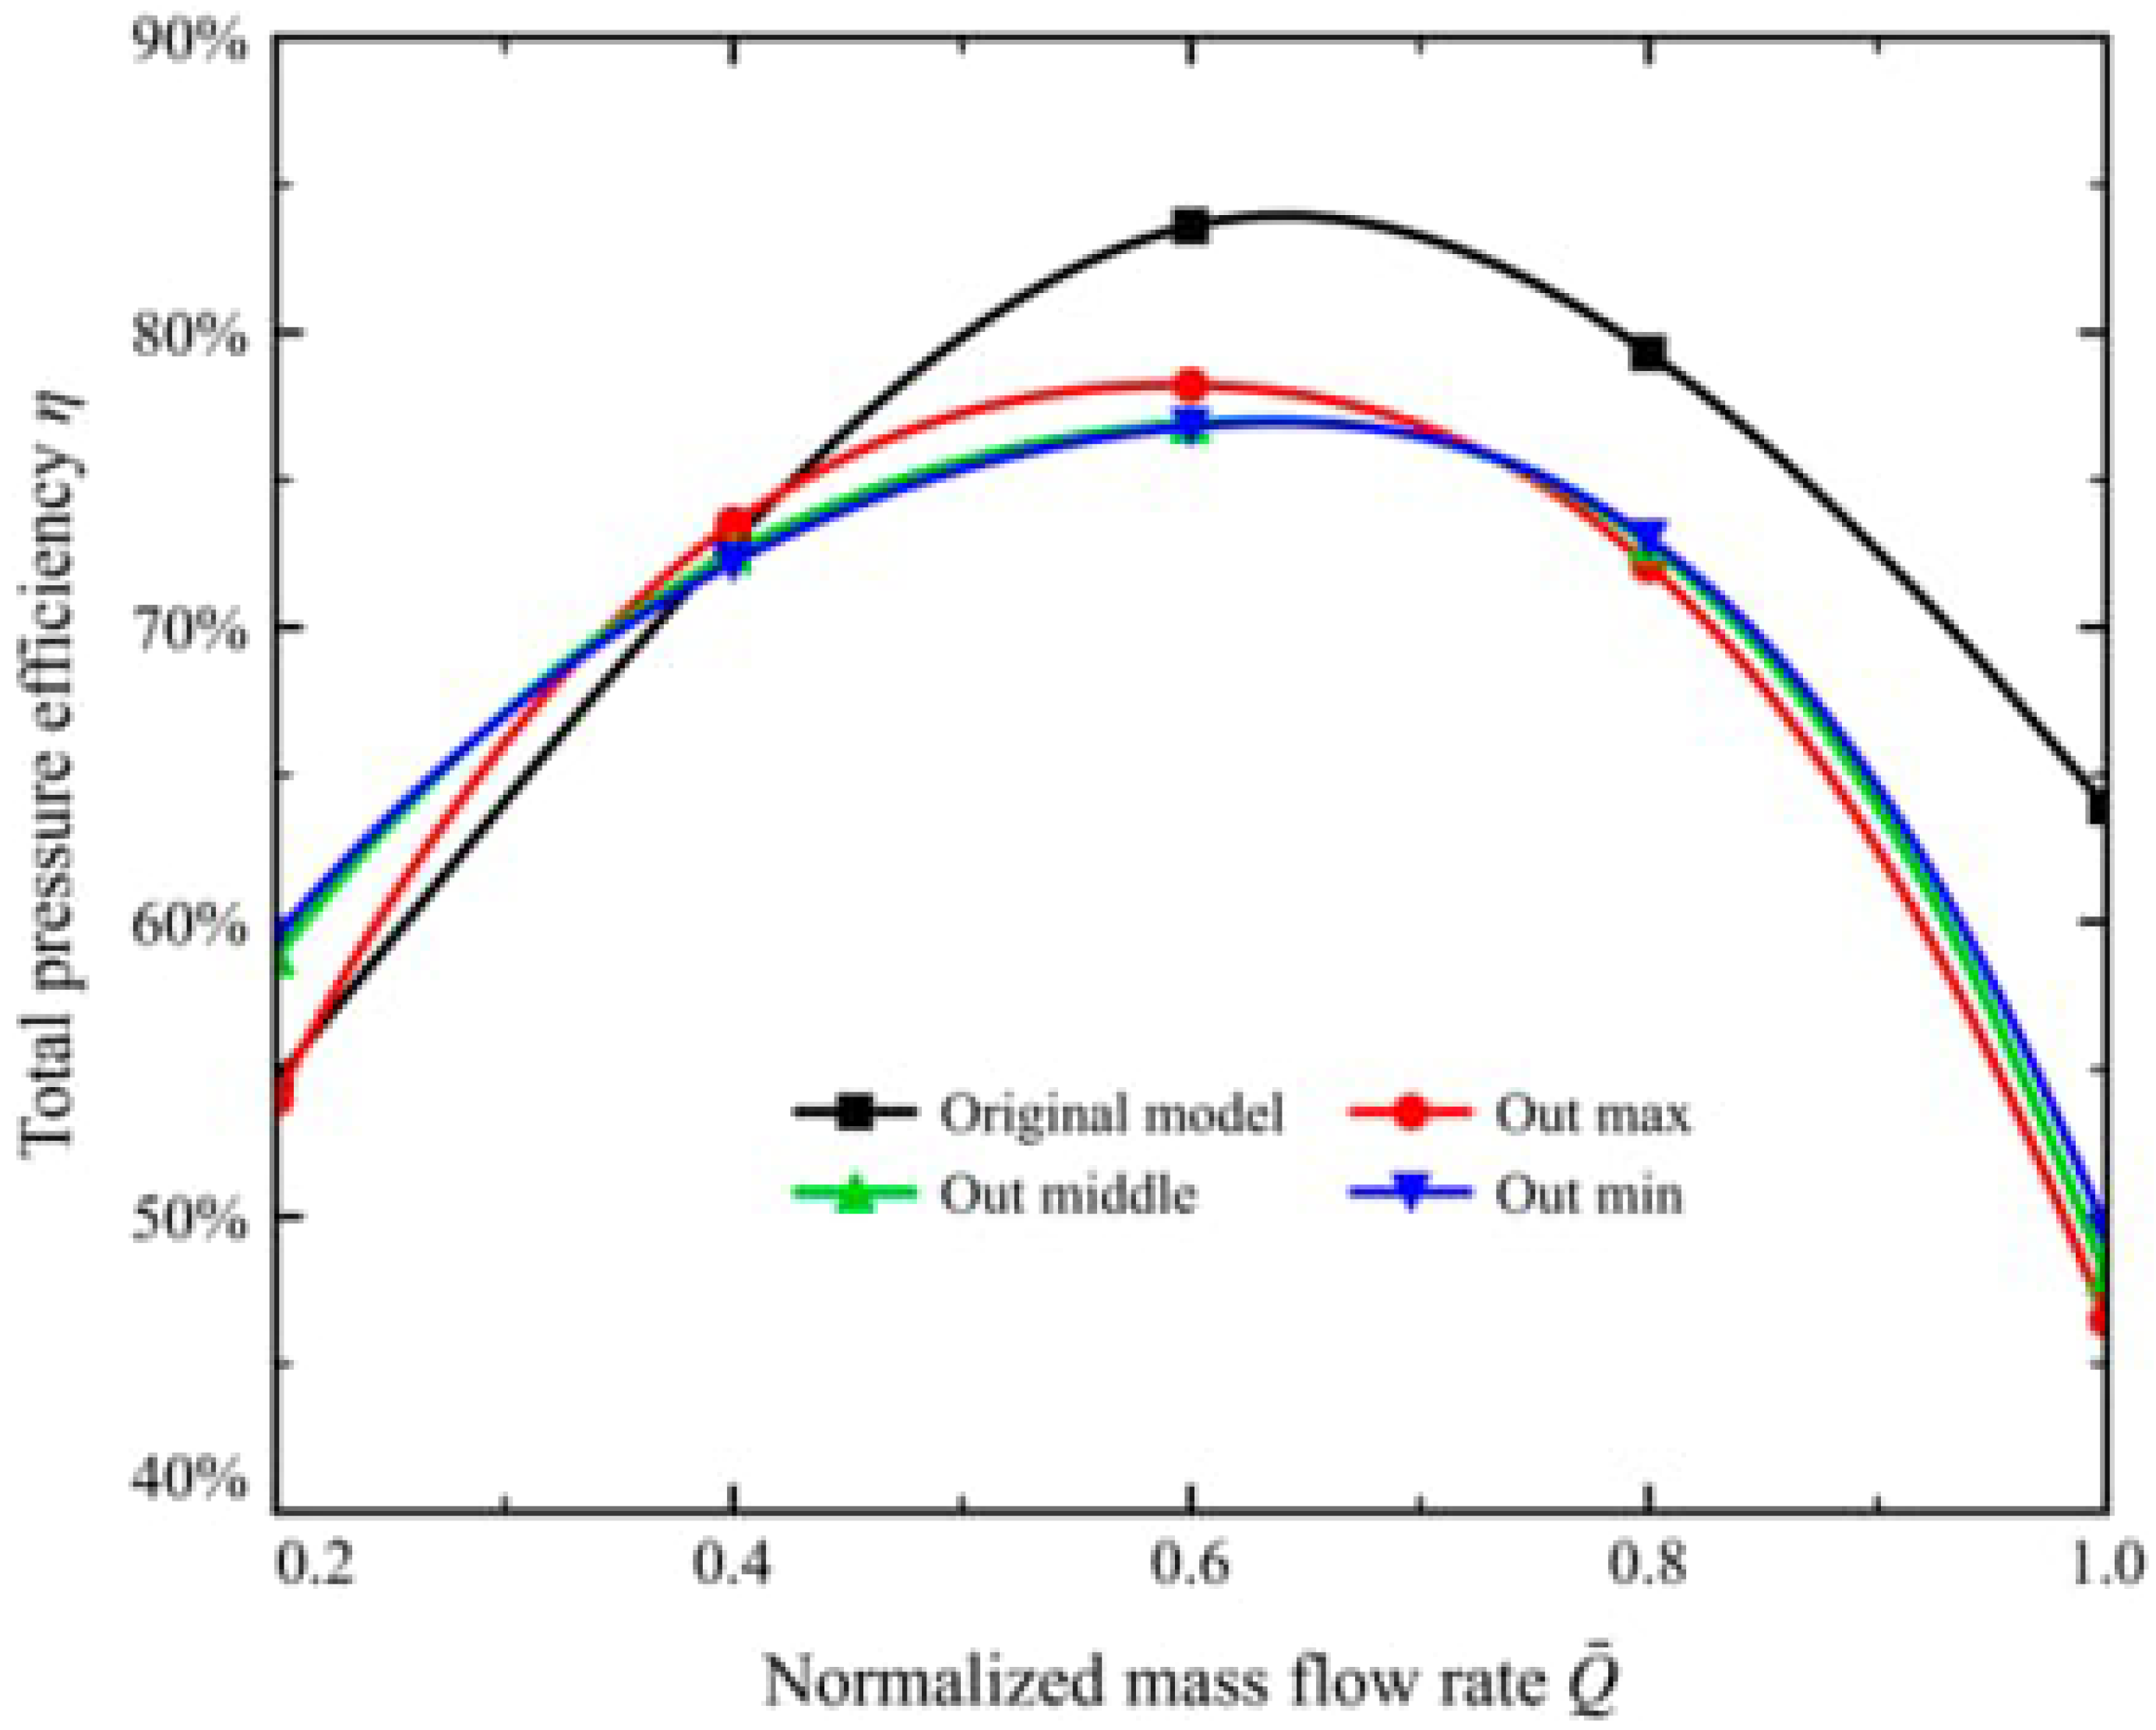
The axial clearance contrasts sharply with the overlapped clearance. The axial clearance itself lowers the total pressure efficiency, whereas its size leaves the efficiency curve almost unchanged. The total pressure efficiency curves of the Out-min, Out-middle, and Out-max models almost coincide (Figure 21). They remain within 77–78% at the design flow rate ( 0.6), and the trend as the flow rate increases is smooth and consistent. The size of the axial clearance therefore has little influence on the aerodynamic performance of the centrifugal fan.
Figure 21.
Total pressure efficiency of the fan for the axial clearance models.
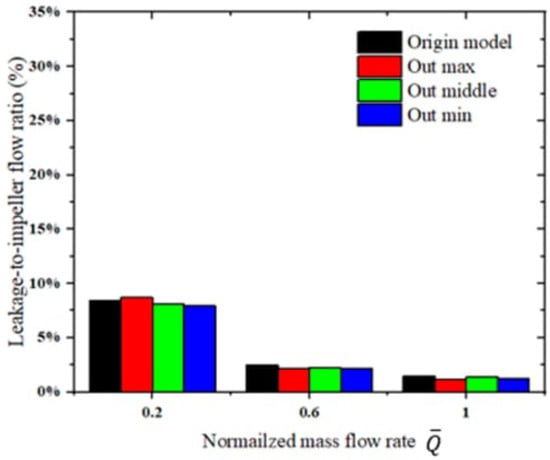
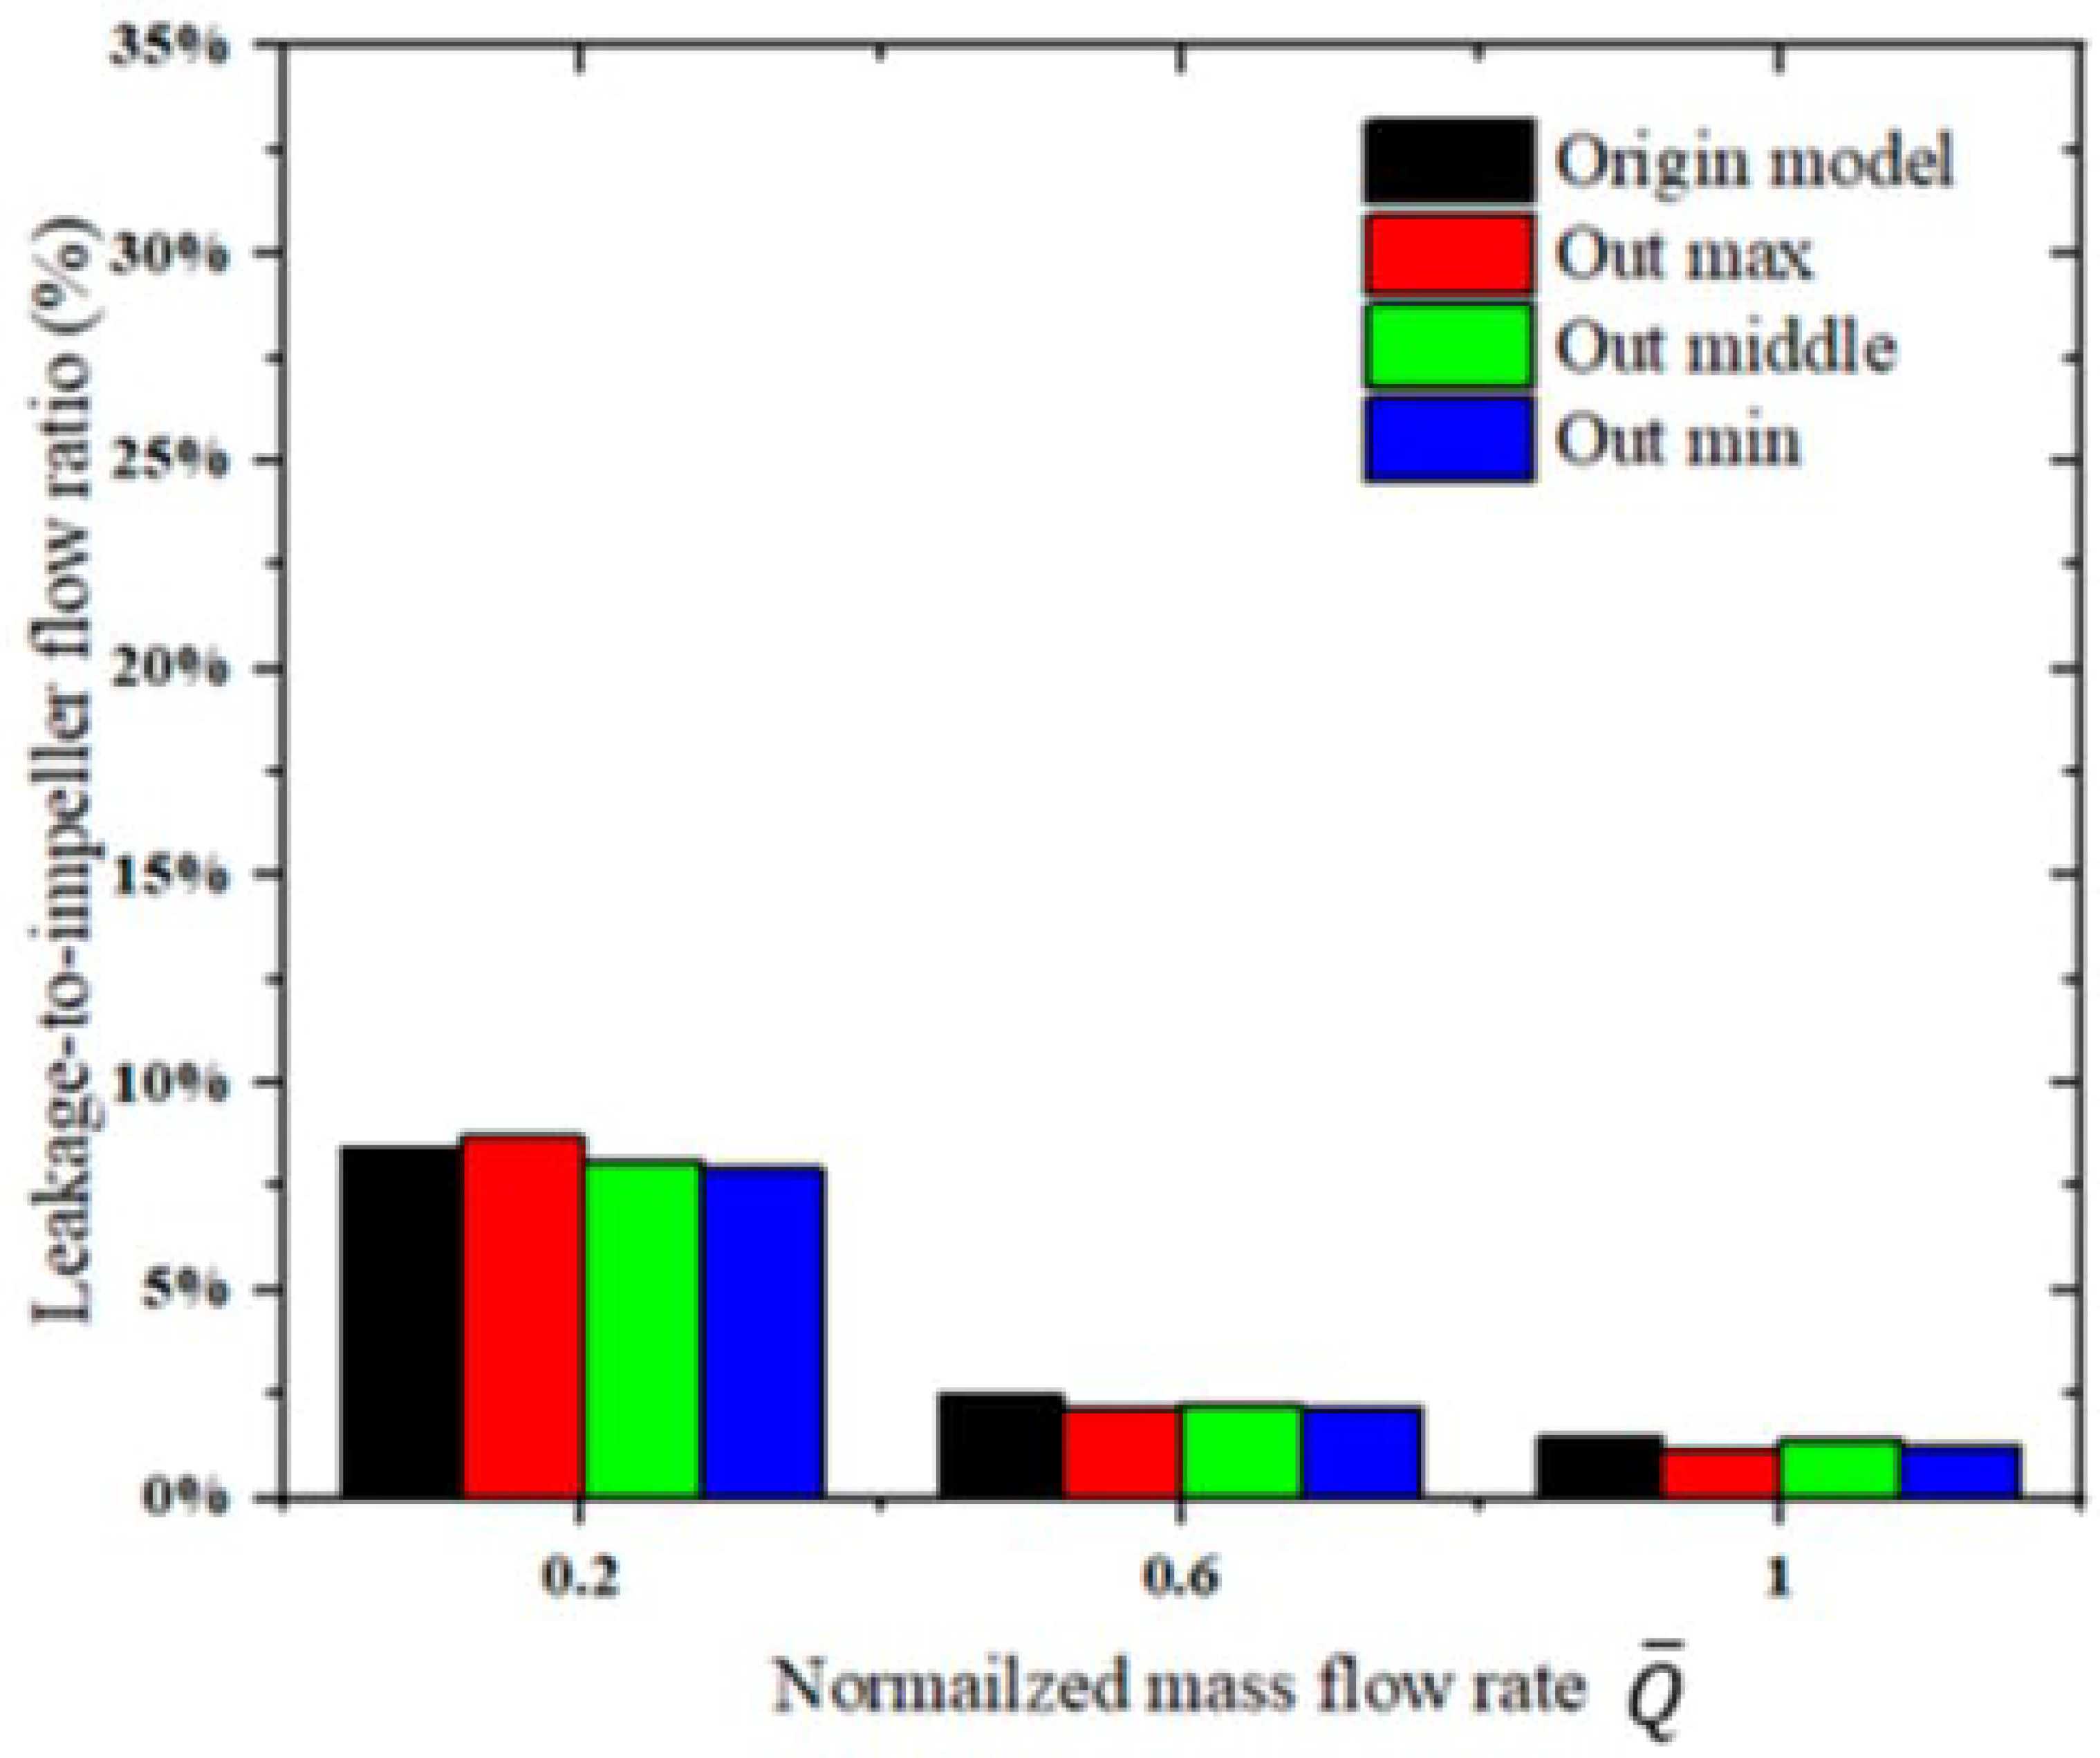
Figure 22 shows comparable leakage to impeller mass flow ratios for the Out-max, Out-middle, Out-min, and original models at each operating condition. The small differences among the Out models indicate limited sensitivity to axial clearance size within the investigated range. Their lower total pressure efficiencies, despite comparable leakage ratios, indicate that increased relative leakage is not the primary cause of performance deterioration.
Figure 22.
Leakage to impeller mass flow ratios for the axial clearance models.
5.3. Effect of the Axial Clearance on the Flow Structure
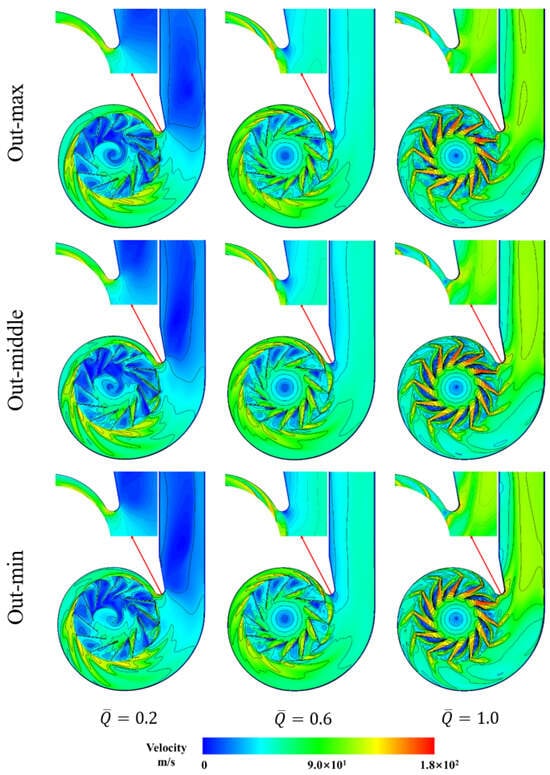
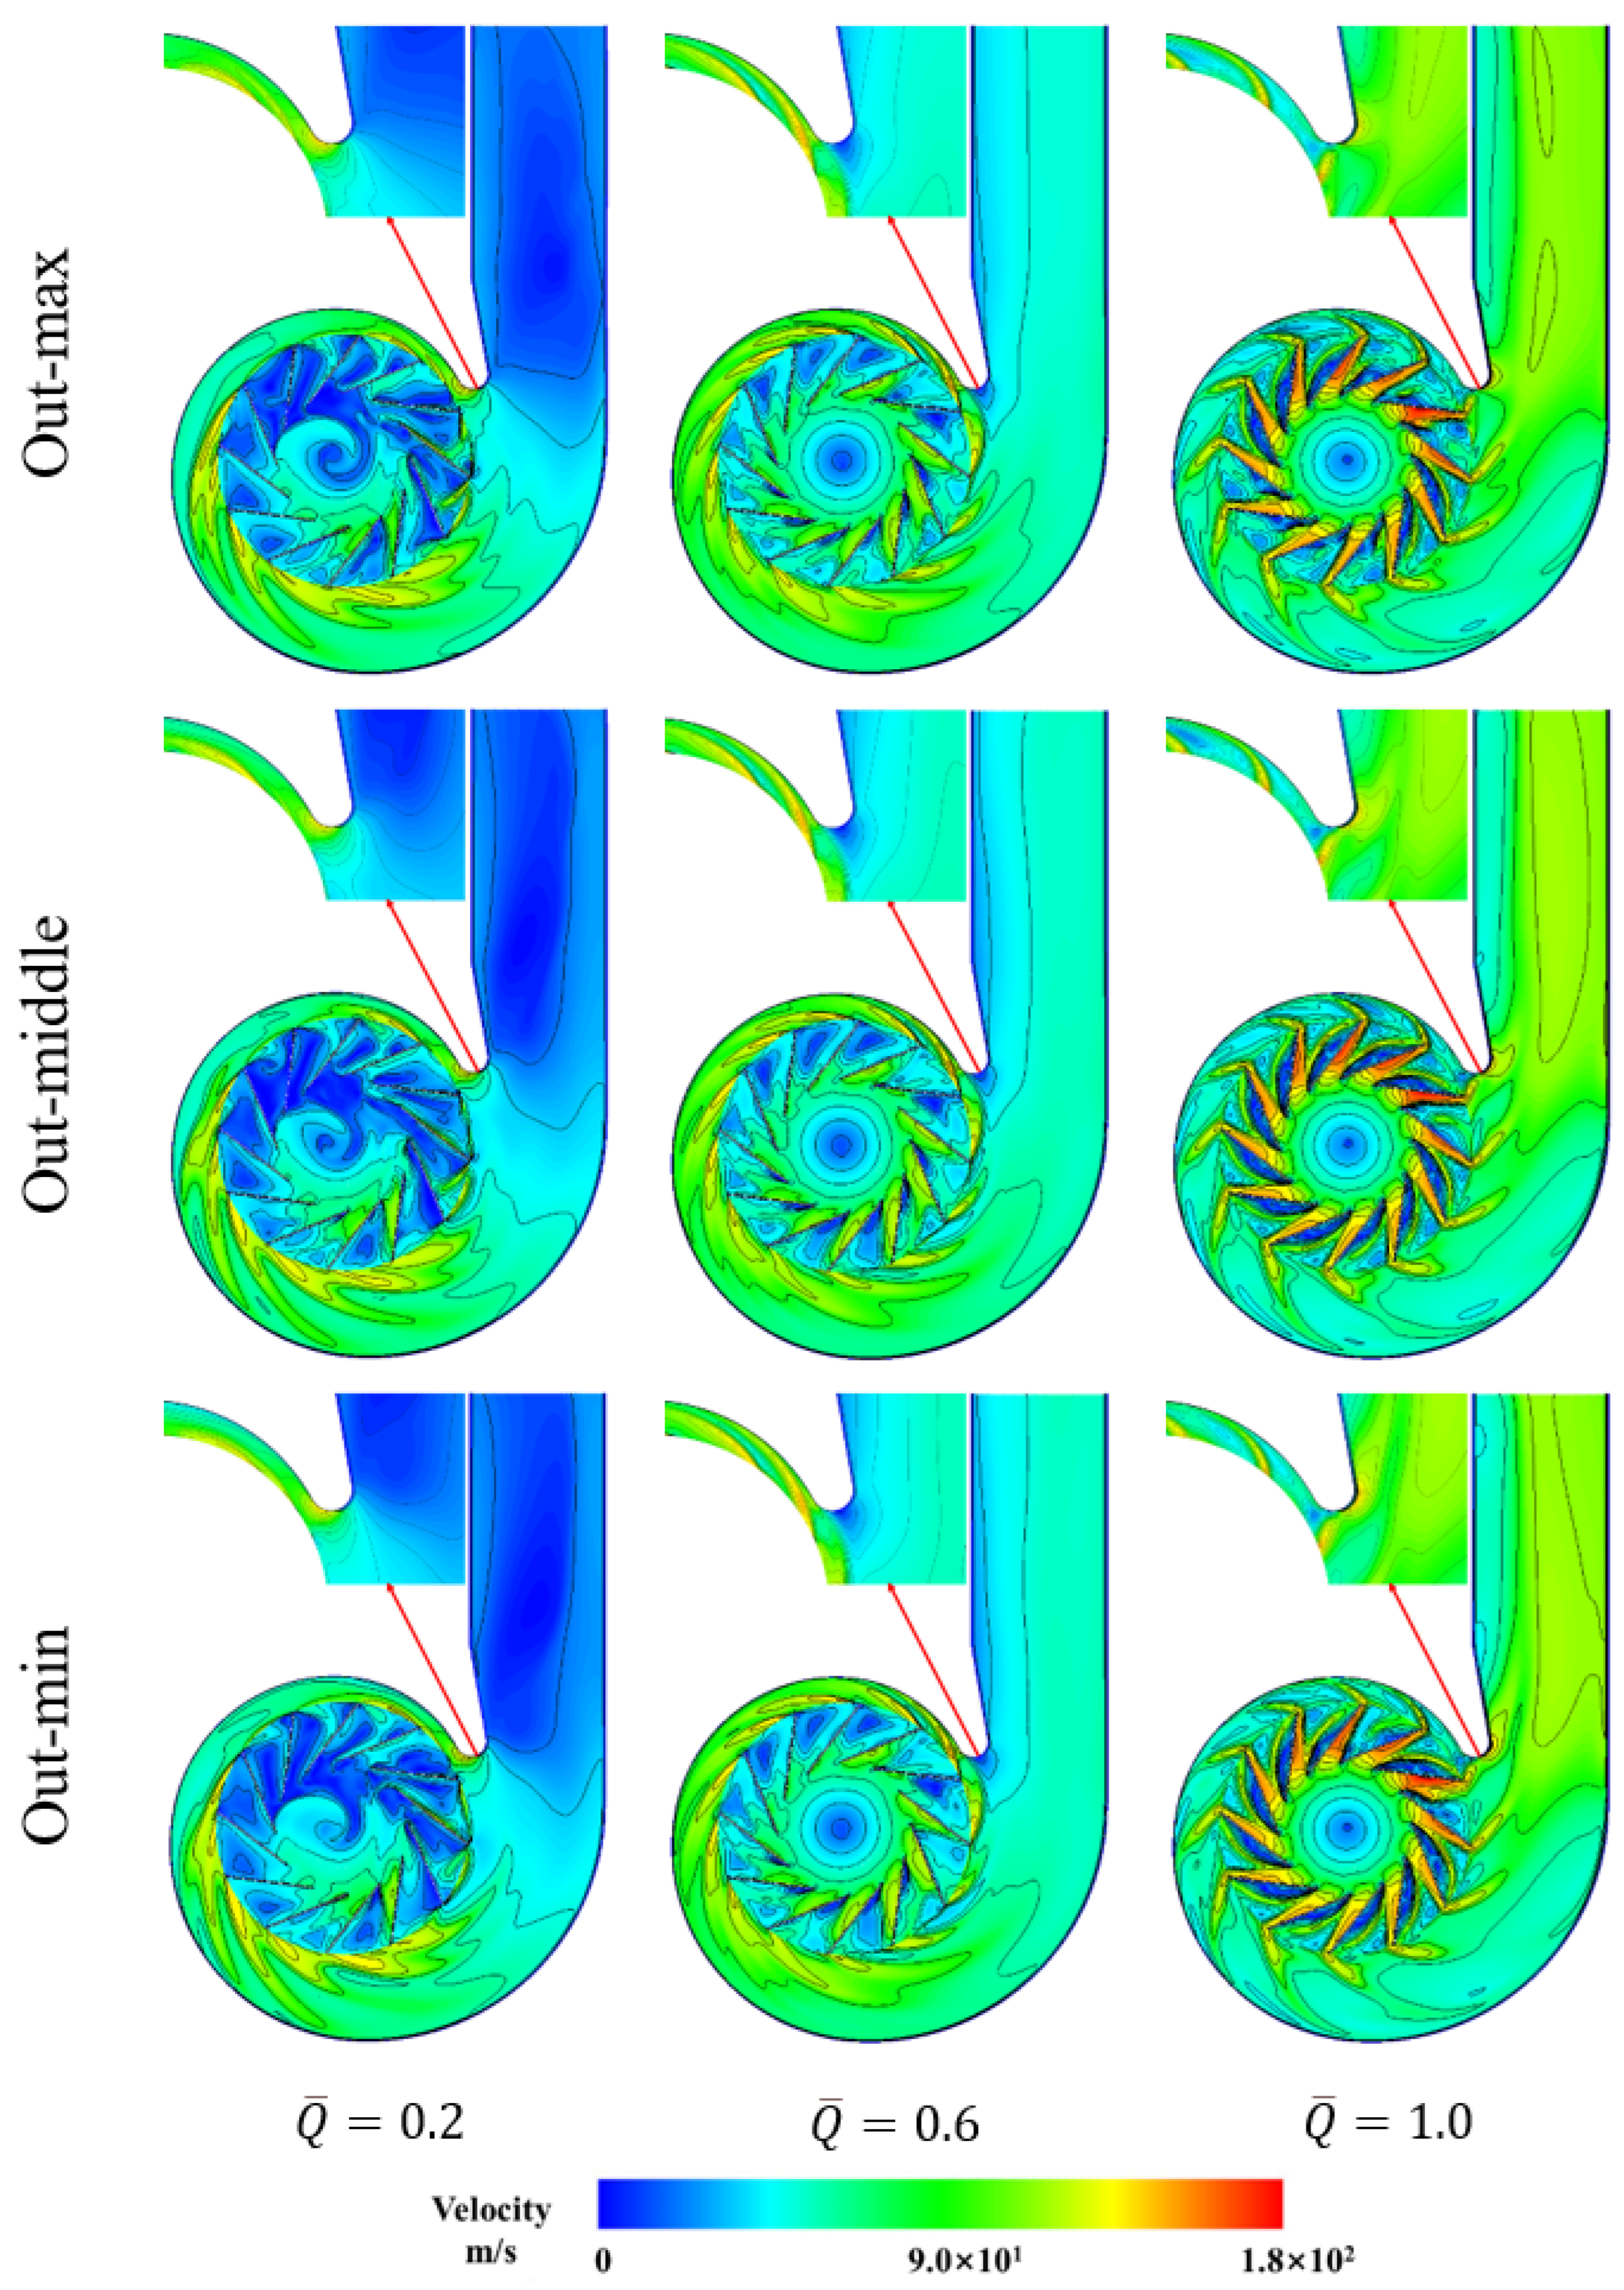
The three axial clearance models, Out-min, Out-middle, and Out-max, show almost identical velocity distributions in the impeller passage at all three flow conditions (Figure 23). In the low-flow condition ( 0.2), all three models exhibit pronounced low-velocity blockage regions. The extensive low-velocity regions indicate substantial passage blockage and are consistent with increased aerodynamic losses. The size of the axial clearance therefore has little effect on the aerodynamic performance in this condition.
Figure 23.
Velocity magnitude contours for the axial clearance models.
At the design flow rate ( 0.6) and in the high-flow condition ( 1.0), the passage velocity profile is less fully developed in the three axial clearance models than in the clearance-free model (Figure 23). The low-velocity region on the suction surface extends over the mid-to-rear section of the passage and reduces the effective flow area. This blockage accounts for the marked degradation in the aerodynamic performance of these models at both conditions.
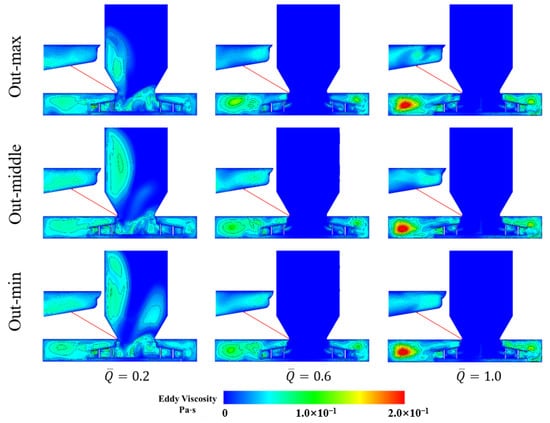
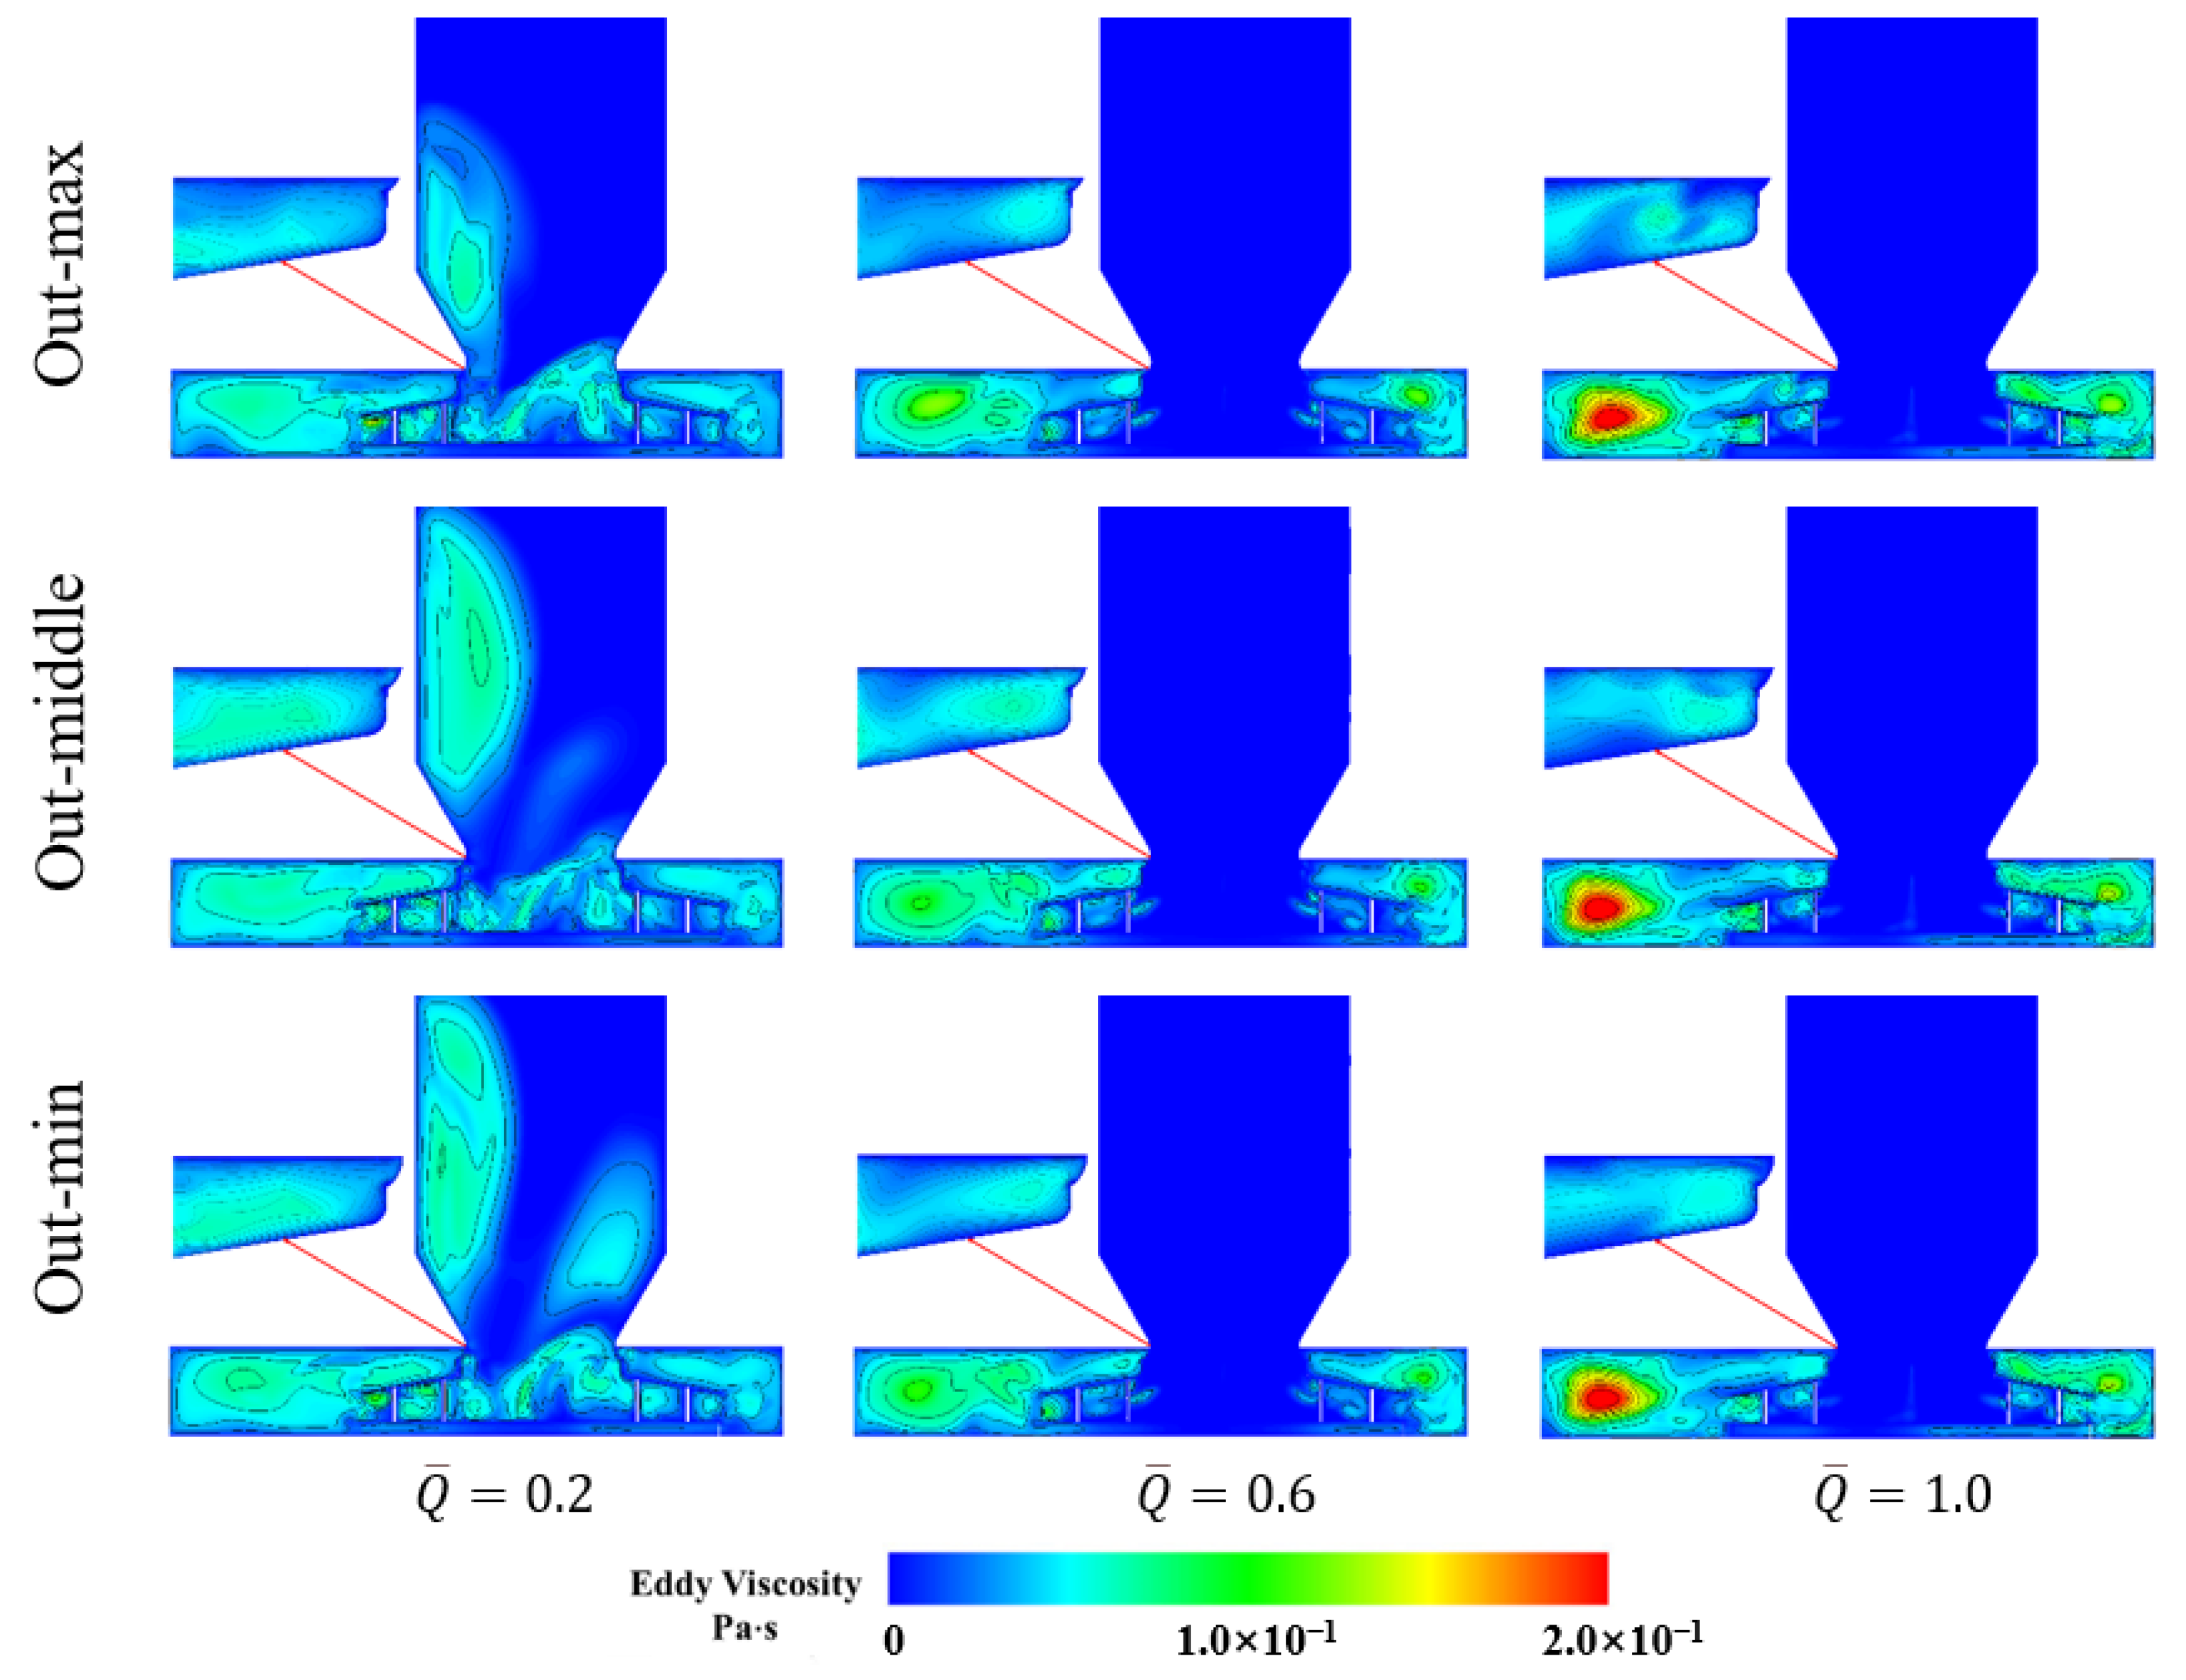
The eddy viscosity contours show only minor differences in the accumulation regions among the three models (Figure 24). In the high-flow condition ( 1.0), clearance leakage produces pronounced eddy viscosity accumulation inside of both the impeller passage and the volute in all three models. The resulting vortices sharply increase the flow losses in the impeller and the volute. The total pressure efficiency of the three axial clearance models therefore falls by at least 15% relative to the original model.
Figure 24.
Eddy viscosity contours for the axial clearance models.
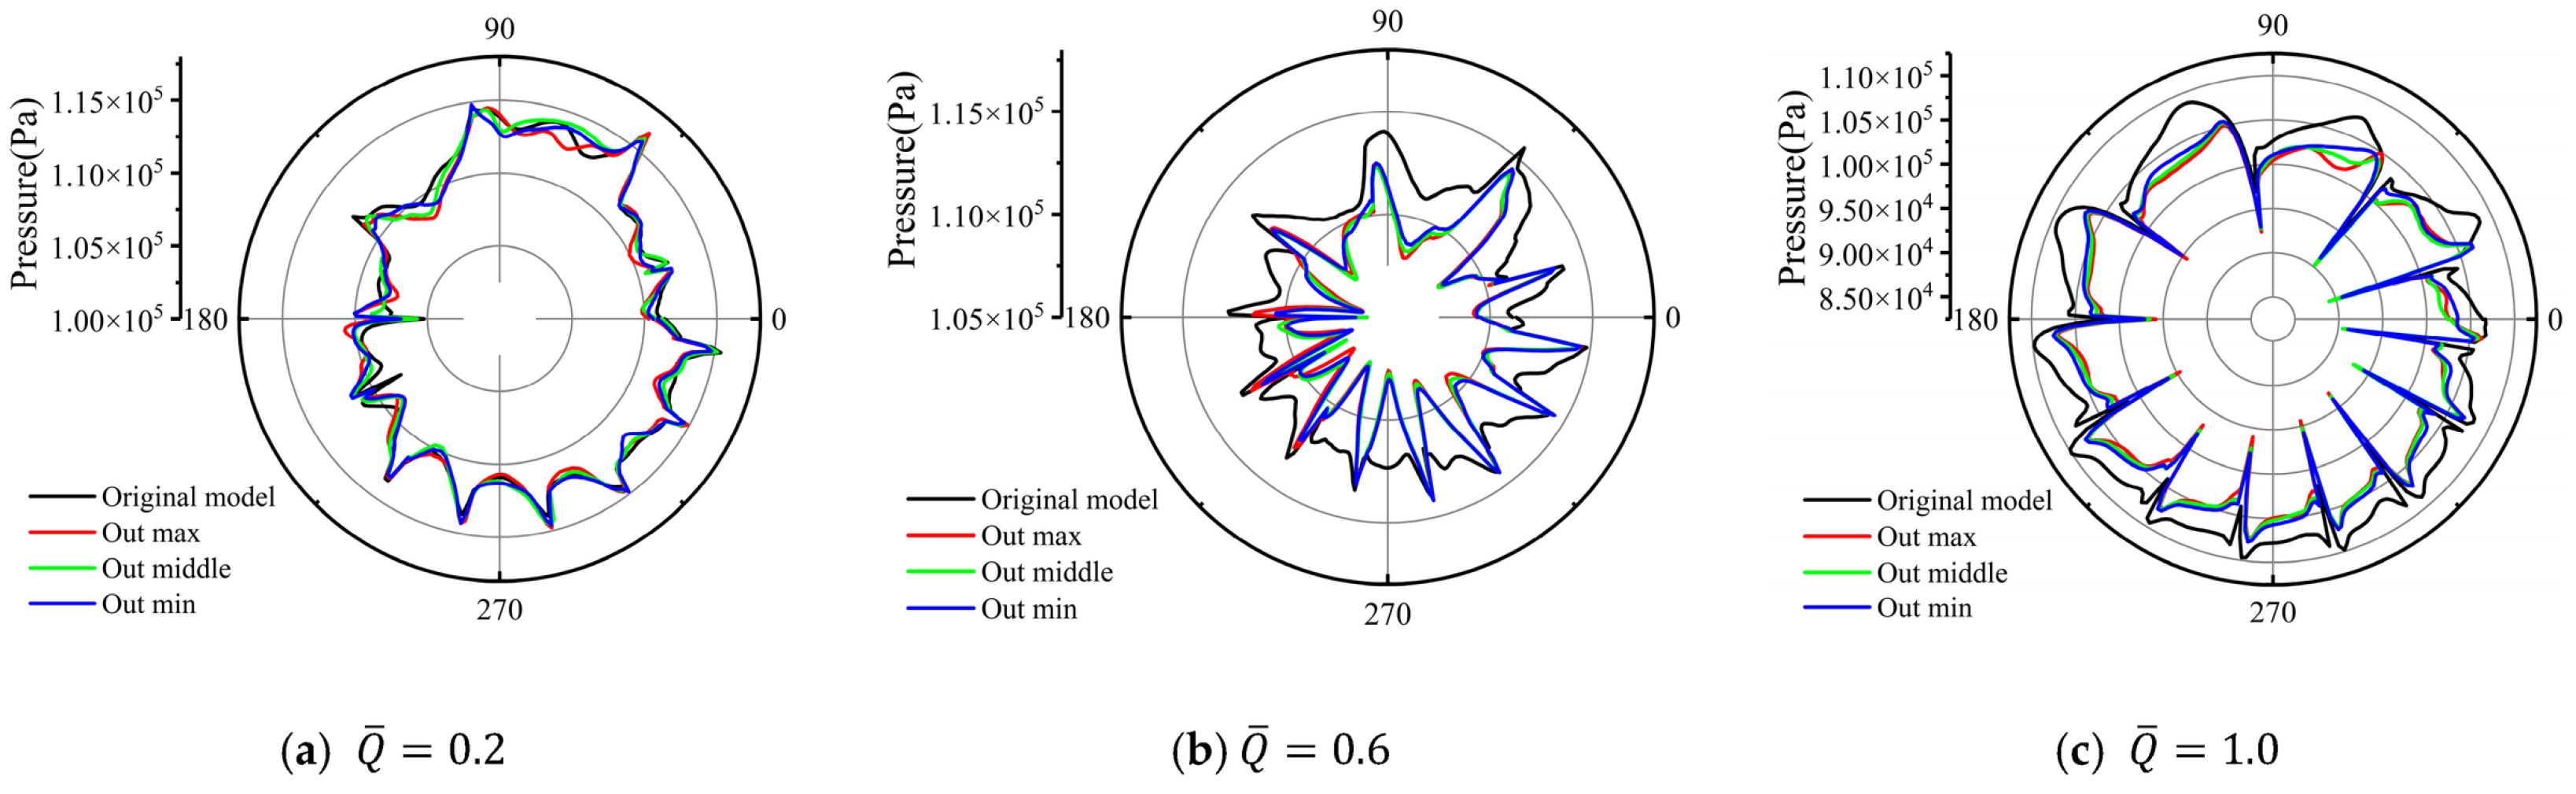
The polar pressure plots show that the curves of the three axial clearance models almost coincide at all three flow conditions (Figure 25). The overall pressure output is somewhat lower than that of the original model. The circumferential asymmetry and the amplitude of the pressure variation, however, differ only marginally among the three models. This indicates that the inlet distortion caused by a change in the axial clearance affects the impeller work in the same way. In the low-flow condition ( 0.2), the pressure profiles of the three models resemble that of the original model, while extensive low-velocity regions occur in all configurations. At the design flow rate ( 0.6), however, the pressure curves of the three models show a clear anomaly. Their trends follow that of the original model, but the pressure profile contracts markedly and the circumferential pressure variation becomes more pronounced. In the high-flow condition ( 1.0), the circumferential pressure profiles of the three models contract inwards, and their overall pressure output is lower than that of the original model. This accounts for the marked drop in the total pressure efficiency of the three models at both the design flow rate and in the high-flow condition.
Figure 25.
Polar plots of the pressure at the impeller exit for the axial clearance models.
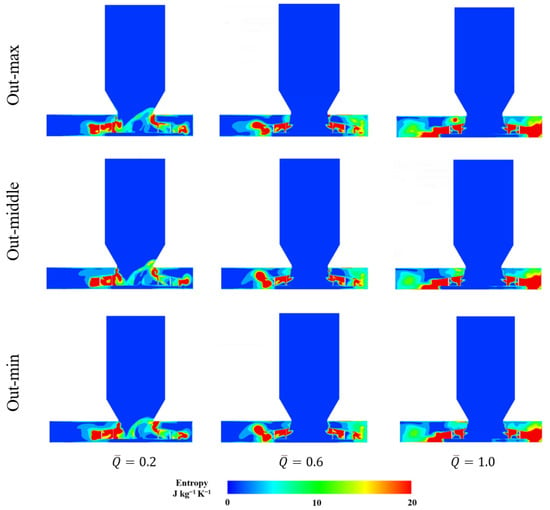
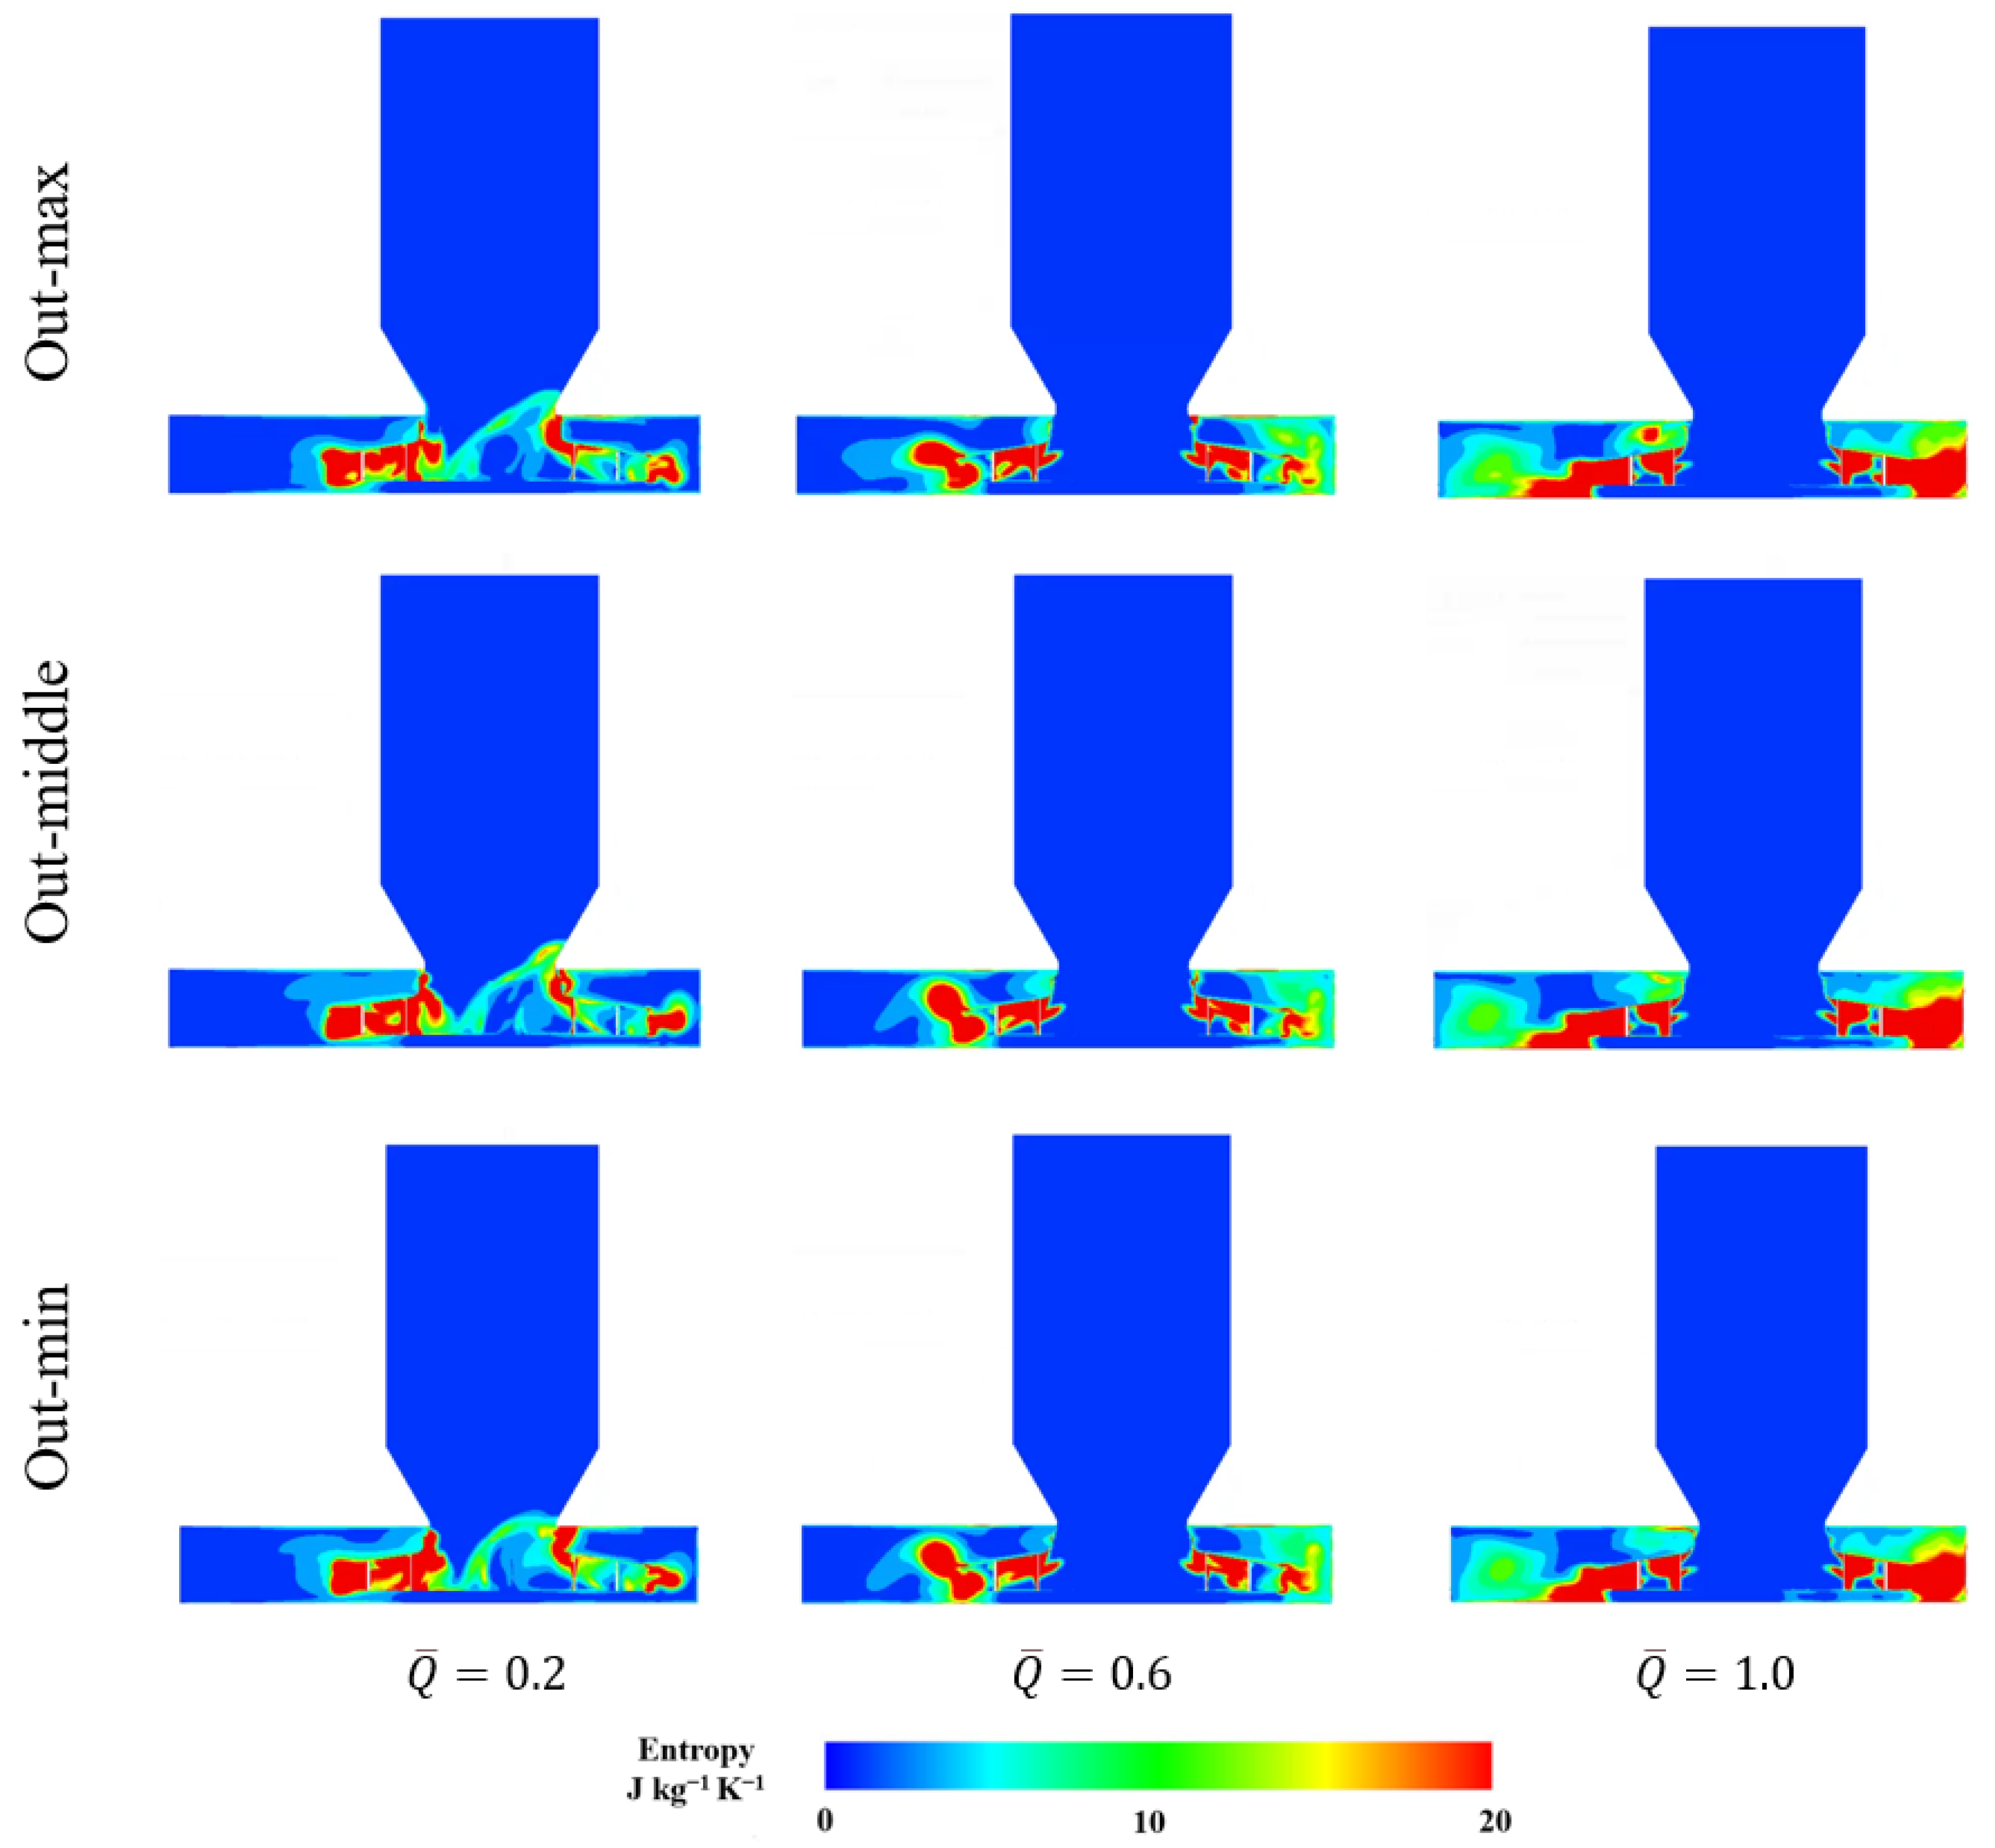
Figure 26 shows broadly similar specific entropy distributions for the Out-max, Out-middle, and Out-min models at each operating condition. In the low-flow condition ( 0.2), high-entropy regions occur near the nozzle–impeller connection and within the impeller–volute region, with an upstream extension on the right side of the connection. In the design flow condition ( 0.6), upstream penetration is reduced, and the high-entropy regions remain mainly downstream of the nozzle exit. In the high-flow condition ( 1.0), extensive high-entropy regions occupy similar locations on both sides in all three models. These similarities are consistent with their comparable efficiencies over the investigated axial clearance range.
Figure 26.
Specific entropy distributions for the axial clearance models.
6. Effect of the Circumferential Non-Uniformity of Inlet Clearance on the Aerodynamic Performance and Flow Structure
6.1. Models of Circumferentially Non-Uniform Inlet Clearance
Volute-type centrifugal fans are widely used in engineering practice. To save weight and reduce cost, their casings and inlet nozzles have relatively low stiffness. Assembly stress, thermal deformation, and wall flexibility therefore cause appreciable deformation. The inlet nozzle cross-section then departs from a circular shape and becomes elliptical. Inlet clearance becomes circumferentially non-uniform, which affects the aerodynamic performance and the internal flow field of the fan.
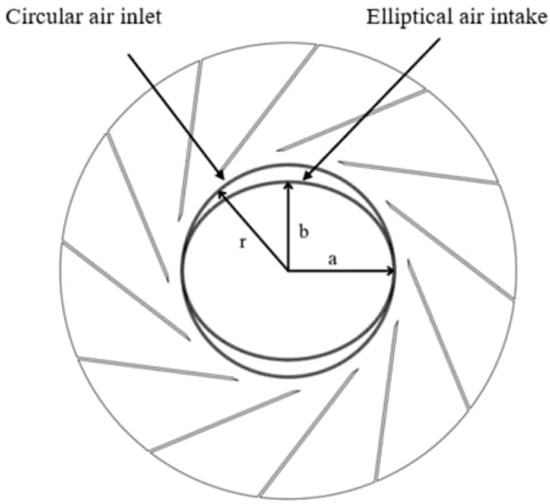
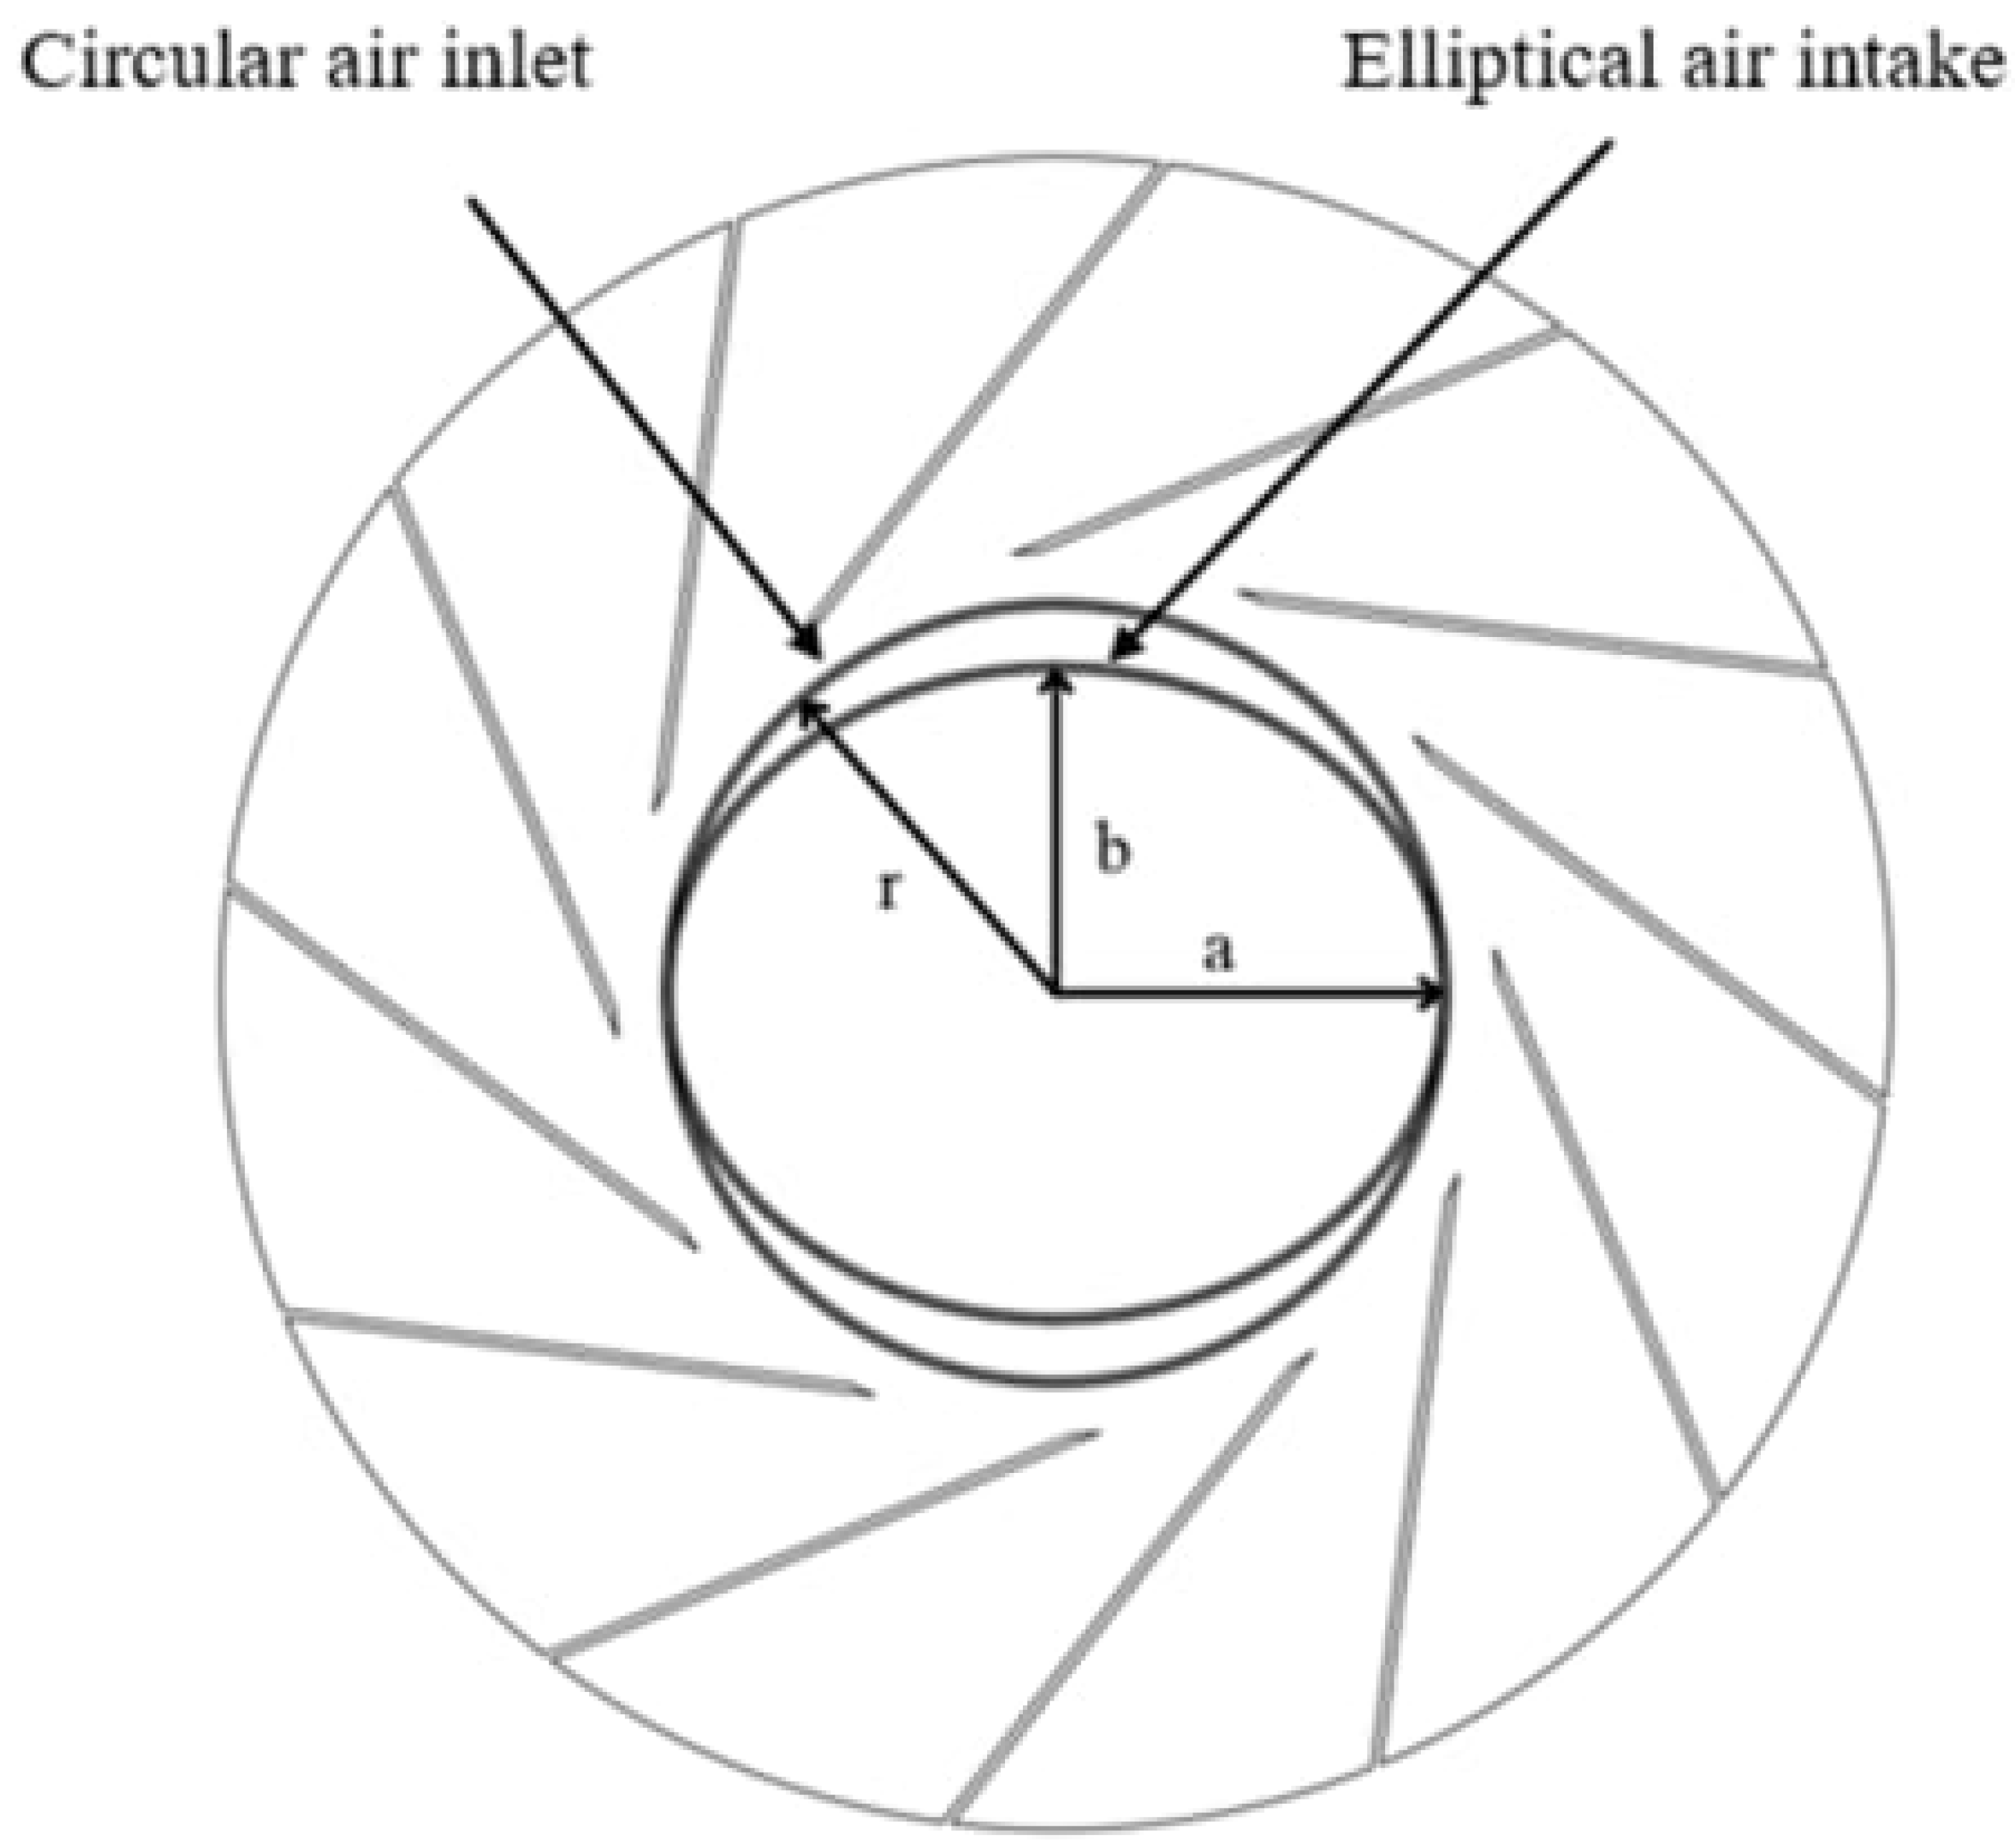
The inlet nozzle cross-section was simplified to an elliptical geometry. The minor axis was shortened to study the effect of circumferentially non-uniform inlet clearance on the aerodynamic performance and the flow field. Three ellipticities (b/a) were considered, 0.9, 0.85, and 0.8, where b and a denote the minor and major axes, respectively, and r denotes the radius of the original circular inlet (Figure 27). Ovalization also changes the radial inlet clearance. Because only the minor axis is shortened, the local clearance increases on the minor axis side, whereas the clearance on the major axis side stays close to the nominal value. The mean clearance therefore rises as the ellipticity decreases. The circumferential non-uniformity of the clearance is thus coupled with an increase in its mean value. In an elliptical inlet nozzle, the flow area is relatively open along the major axis but contracts sharply along the minor axis. The velocity distribution and the radial inflow incidence angle therefore become strongly non-uniform over the full range of azimuthal angles (0–360°) at the impeller inlet plane. This provides a geometric precondition for the development of secondary flows inside of the downstream impeller.
Figure 27.
Geometry of the elliptical inlet nozzle.
6.2. Effect of the Circumferential Non-Uniformity of Inlet Clearance on the Aerodynamic Performance
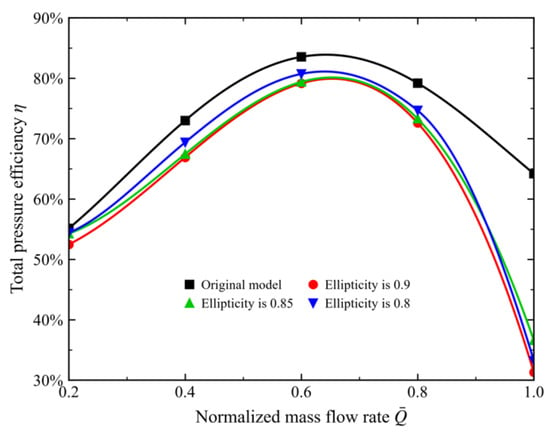
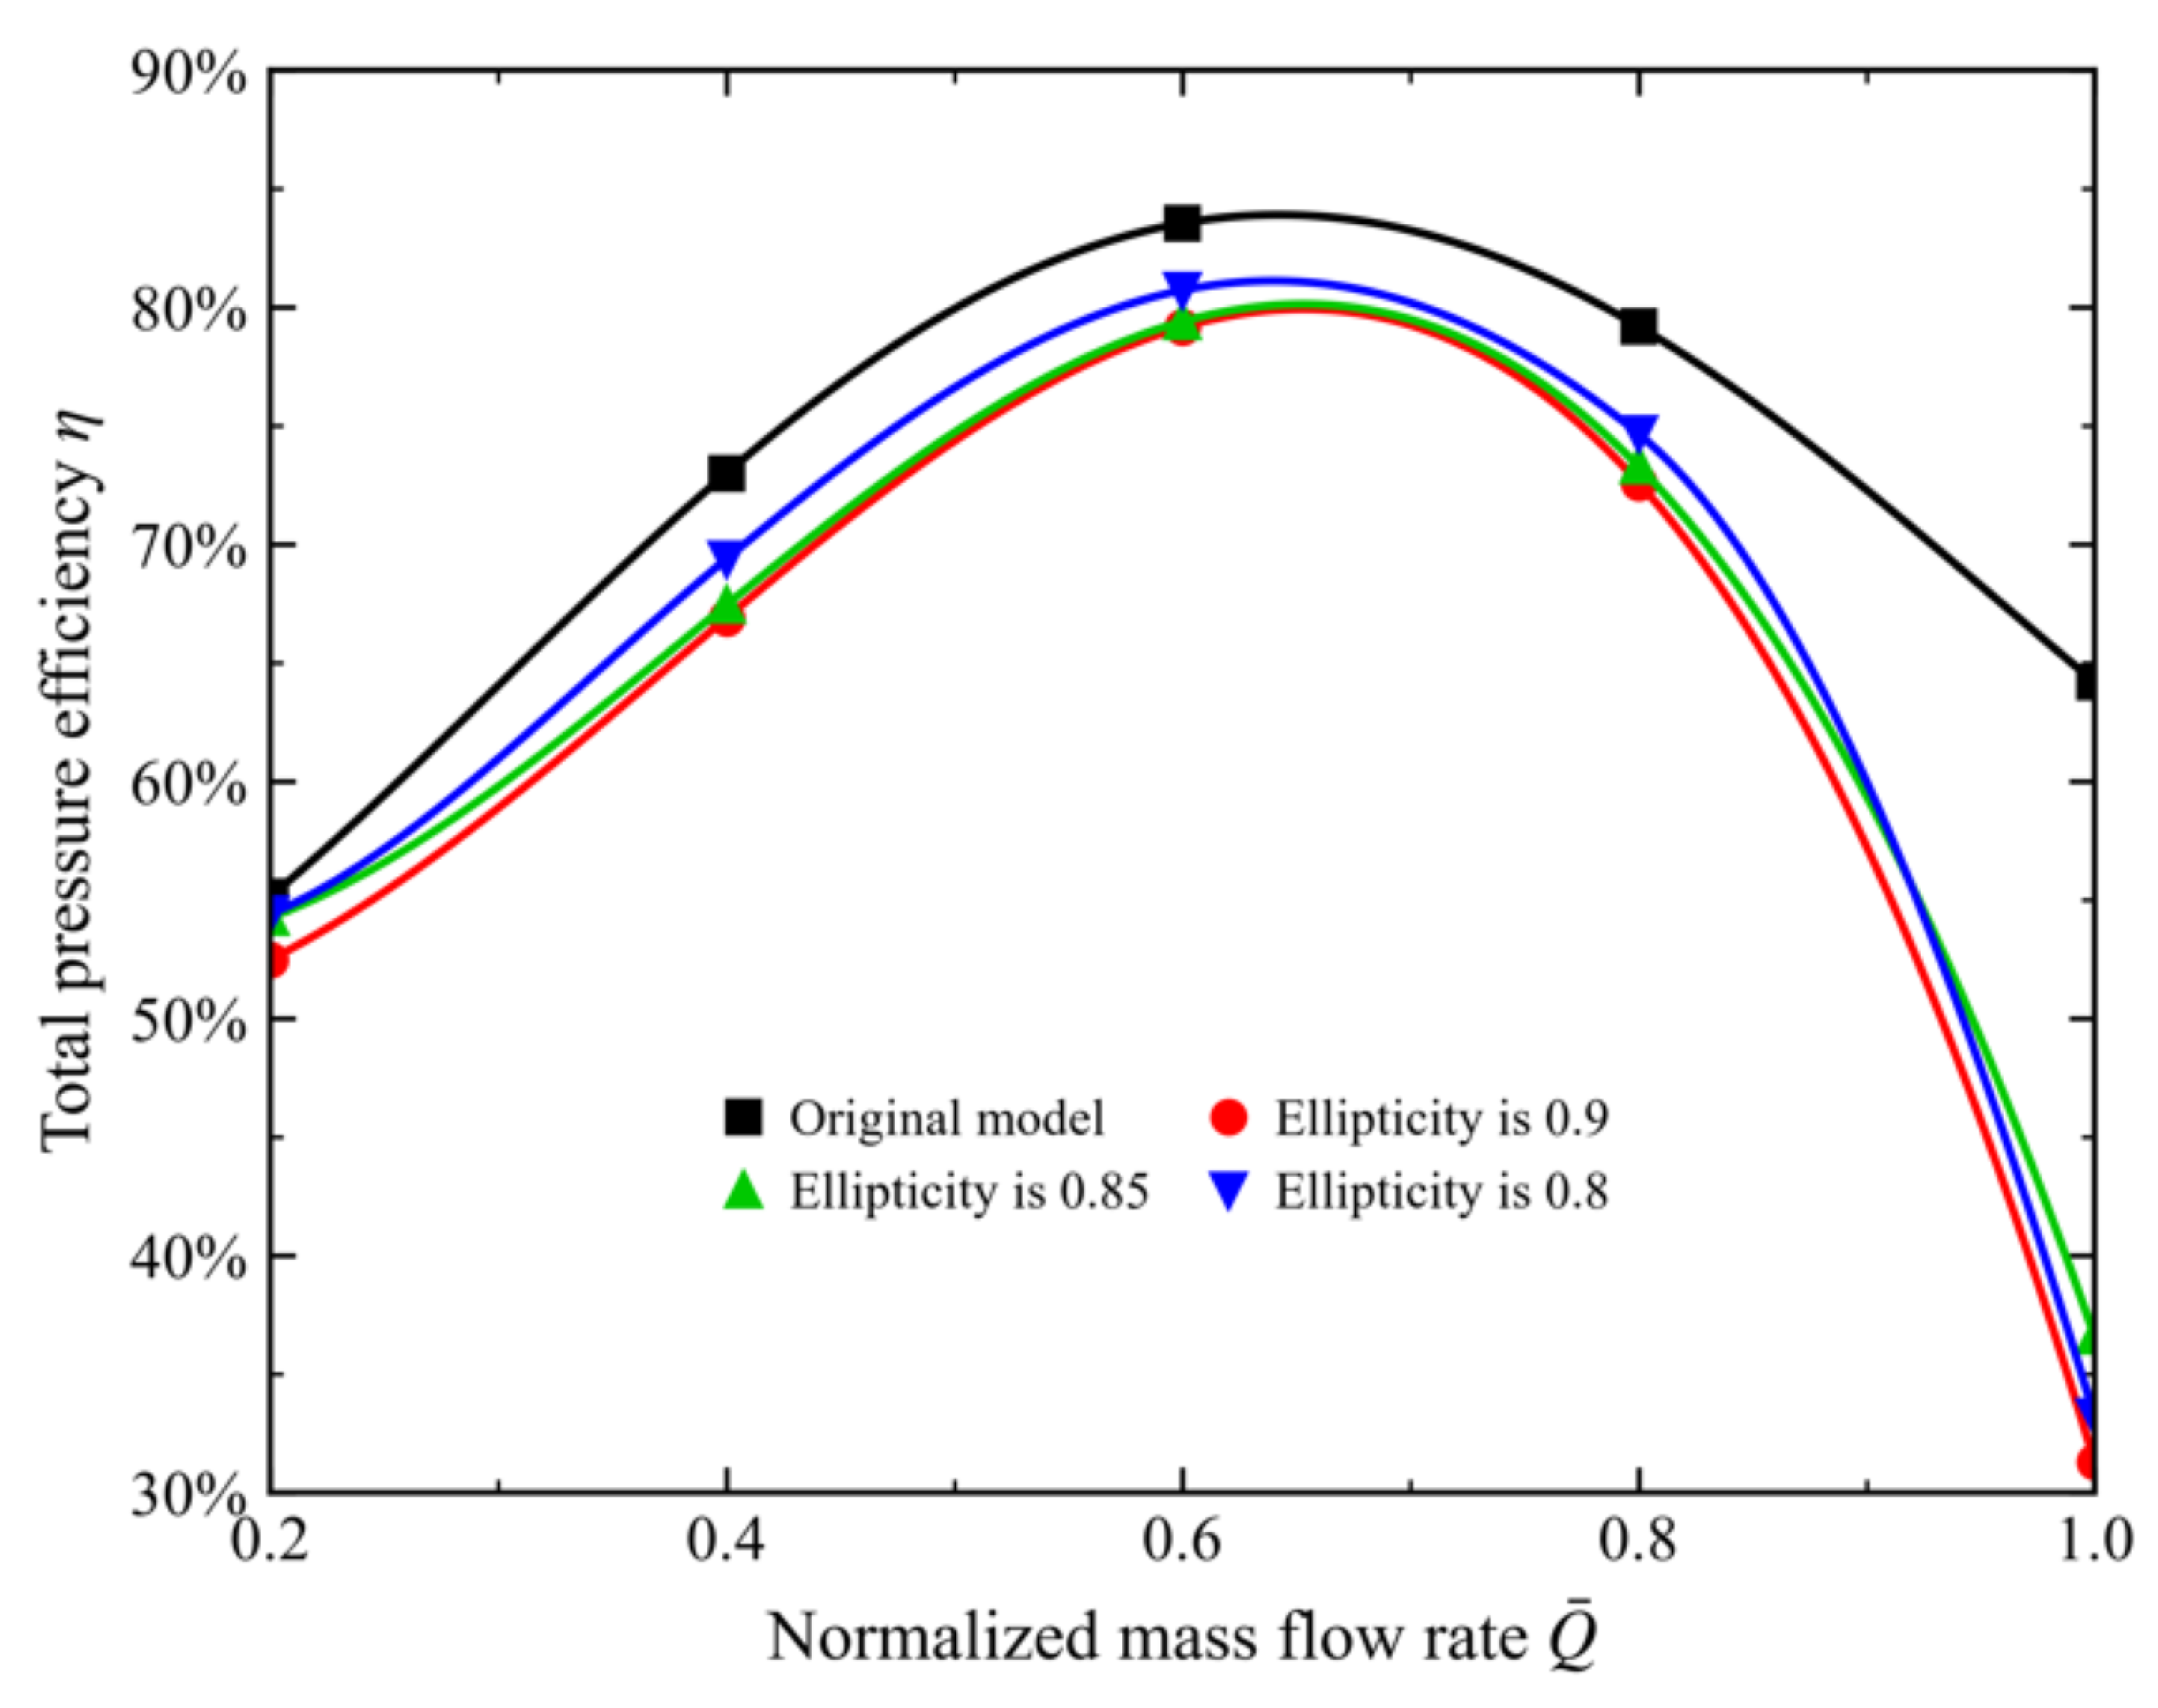
Over the normalized flow range 0.2–1.0, the original model consistently exhibits the highest work capability (Figure 28). Its peak total pressure efficiency is 83.5% at the design flow rate ( 0.6). Once the circumferential distribution of inlet clearance becomes non-uniform, the total pressure efficiency of the fan drops markedly. At the design flow rate, all three elliptical models exhibit lower total pressure efficiencies than the original model, with the ellipticity-0.8 model showing a smaller reduction than the ellipticity-0.9 and ellipticity-0.85 models. In the high-flow condition ( 1.0), the efficiency curves of the elliptical models decay sharply. The total pressure efficiency falls to 32% for the ellipticity 0.9 model and 37% for the ellipticity 0.85 model. Flow separation of high-momentum fluid inside of the asymmetric elliptical inlet nozzle is therefore amplified at high flow rates, which aggravates inlet distortion. In the design condition and at a normalized flow rate of 0.8, the ellipticity-0.8 model is more efficient than the other elliptical configurations. At a normalized flow rate of 1.0, however, its efficiency falls below that of the ellipticity-0.85 model. The relative performance ranking therefore changes with operating condition.
Figure 28.
Total pressure efficiency of the fan for the elliptical inlet nozzles.
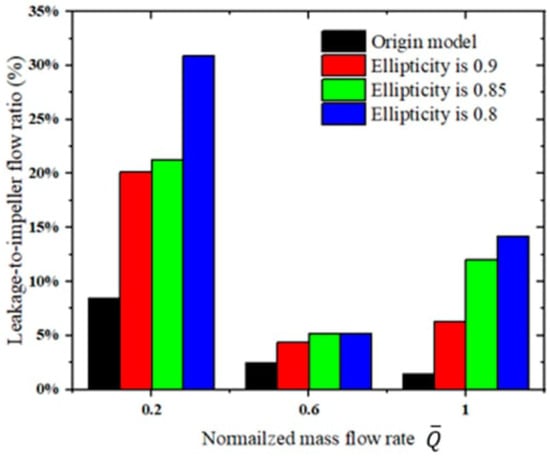
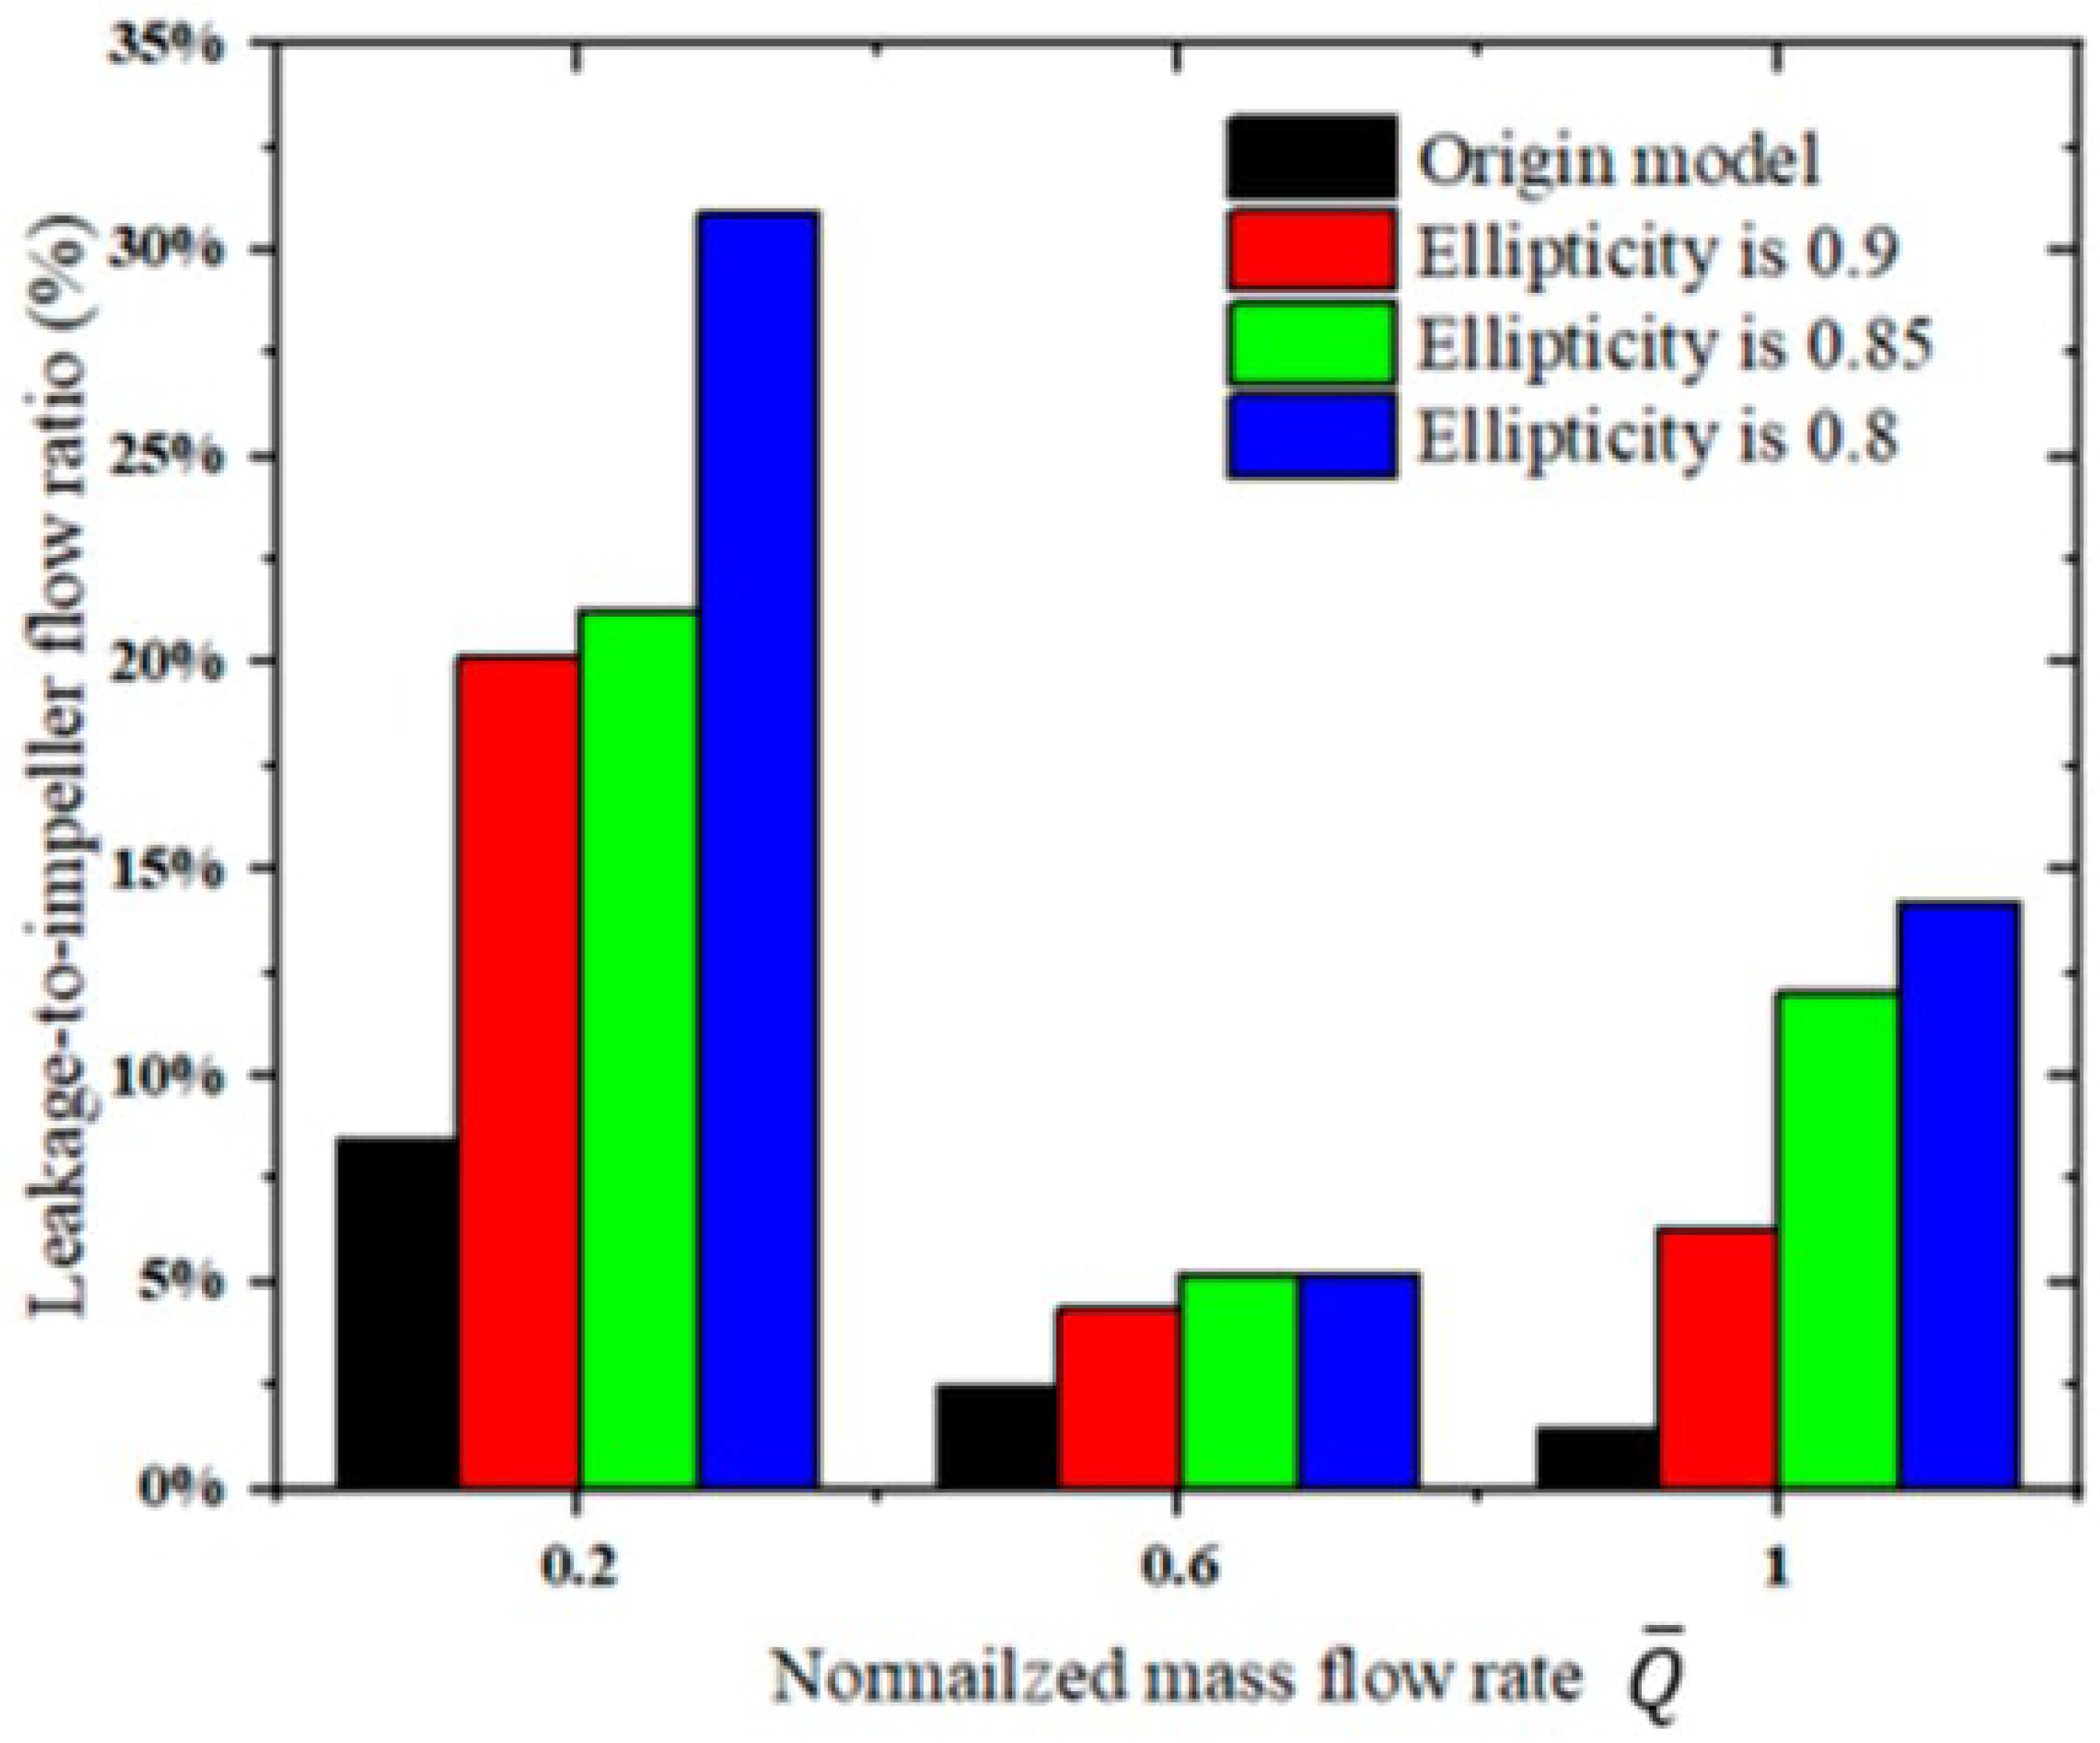
As shown in Figure 29, all elliptical inlet nozzle models exhibit higher leakage-to-impeller mass flow ratios than the original model. At the low flow rate ( 0.2), the ratio increases from 20.16% to 21.27% and 30.89% as ellipticity decreases from 0.9 to 0.85 and 0.8, respectively. In the design condition, these ratios decrease to 4.38%, 5.20%, and 5.17%, with little difference between the latter two models. At the high flow rate ( 1.0), the ratios increase again to 6.34%, 12.03%, and 14.22%, whereas the original model shows a continued decrease. These results demonstrate that ovalization increases the relative leakage flow, particularly at low and high flow rates.
Figure 29.
Leakage to impeller mass flow ratios for the elliptical inlet nozzle models.
6.3. Effect of the Circumferential Non-Uniformity of the Inlet Clearance on the Flow Structure
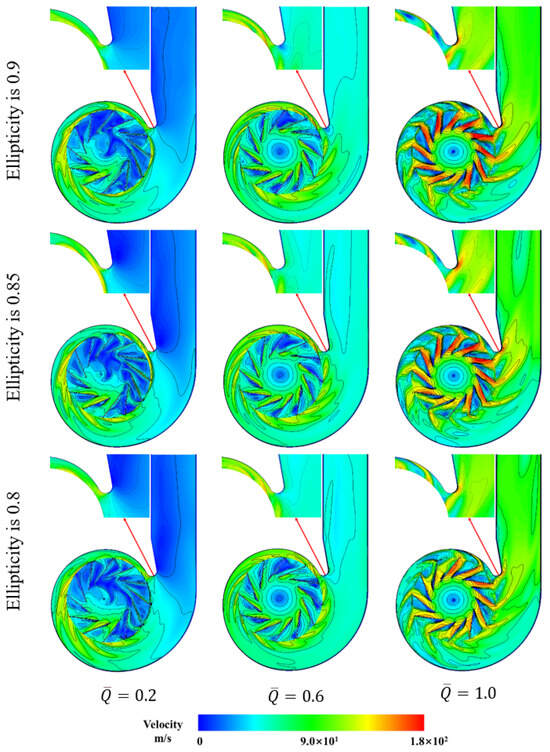
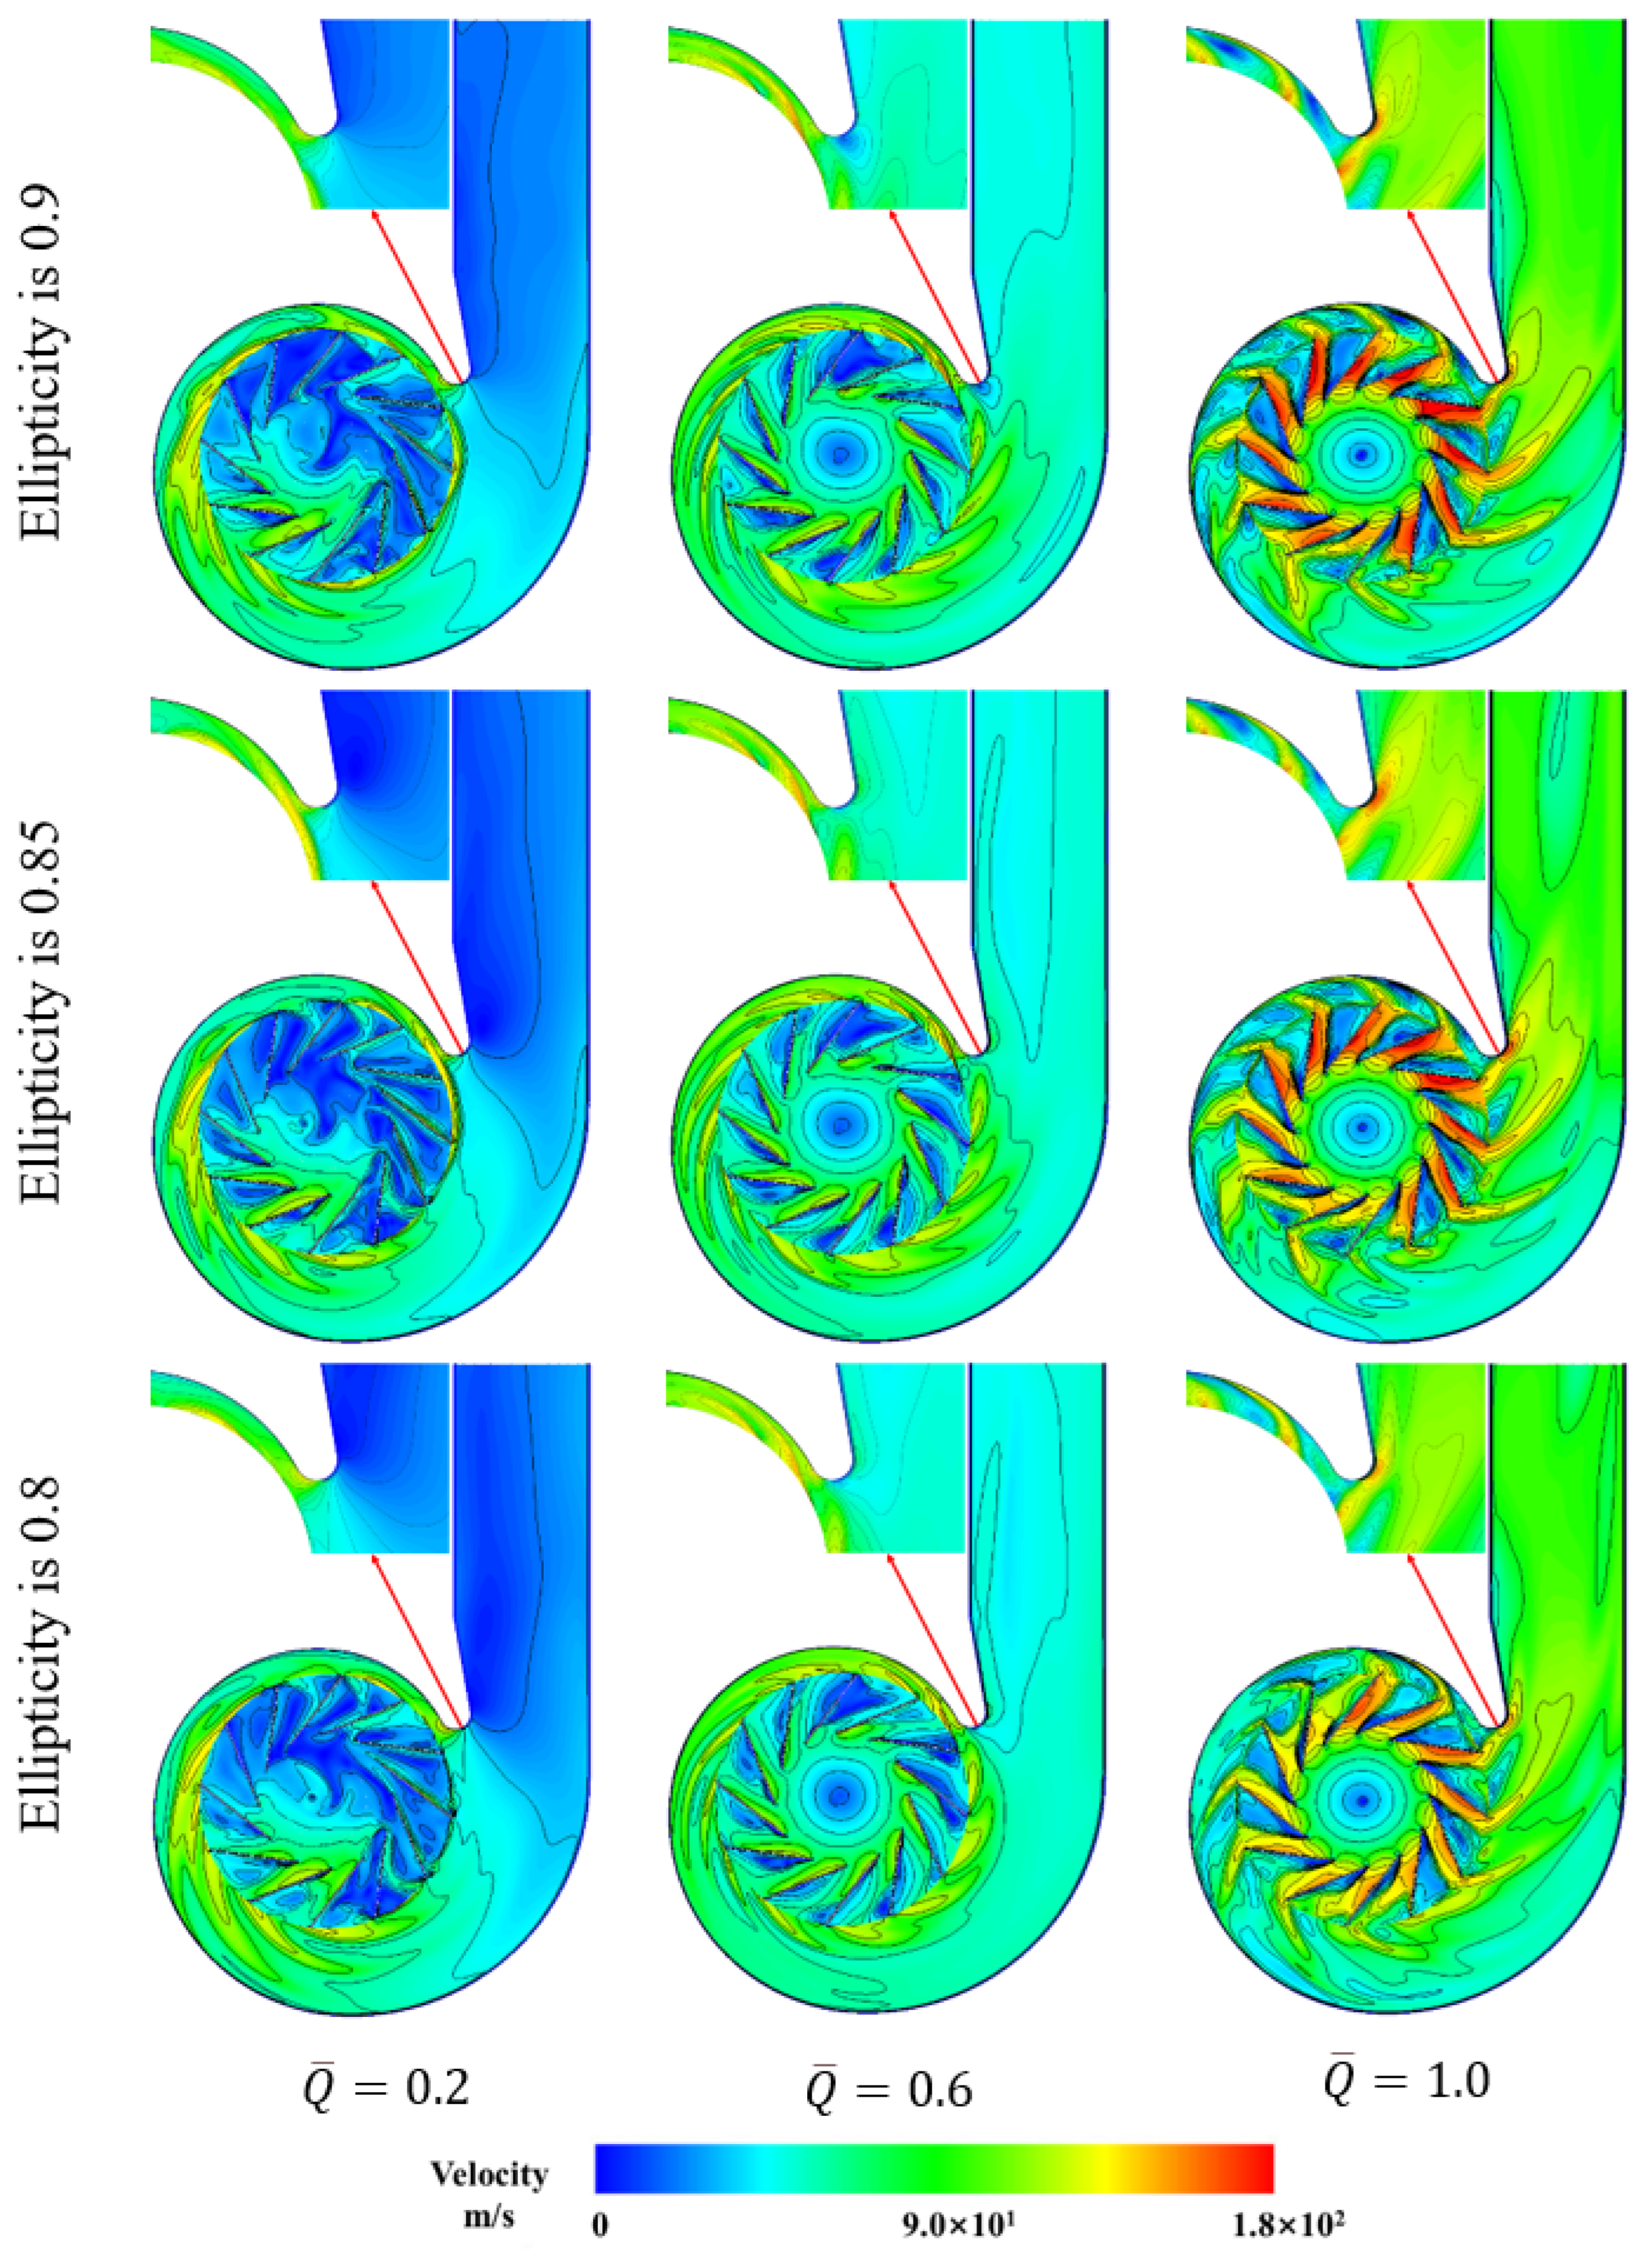
In the low-flow condition, all three elliptical configurations exhibit extensive low-velocity regions within the impeller passages, indicating substantial passage blockage (Figure 30).
Figure 30.
Velocity magnitude contours for the elliptical inlet nozzles.
At the design flow rate ( 0.6), the original model exhibits no extensive low-velocity blockage regions within the impeller passages. In contrast, the passages of the ellipticity 0.9, 0.85, and 0.8 models are largely filled with low-velocity fluid. The low-velocity region is smallest in the ellipticity 0.8 model, which is consistent with its higher efficiency among the three elliptical models. In the ellipticity 0.9 and 0.85 models, the region is more extensive. It therefore narrows the effective flow area and increases the flow loss.
In the high-flow condition ( 1.0), the impeller passages of the ellipticity 0.9 and 0.85 models show a pronounced reduction in effective flow area relative to the original model. This reduction is circumferentially asymmetric, which indicates that the through-flow is confined to a narrow, asymmetric part of the passage.
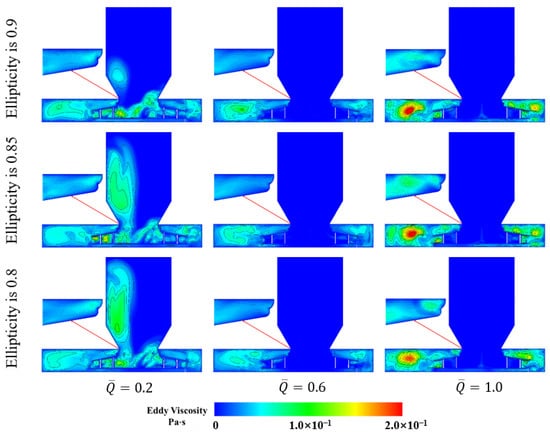
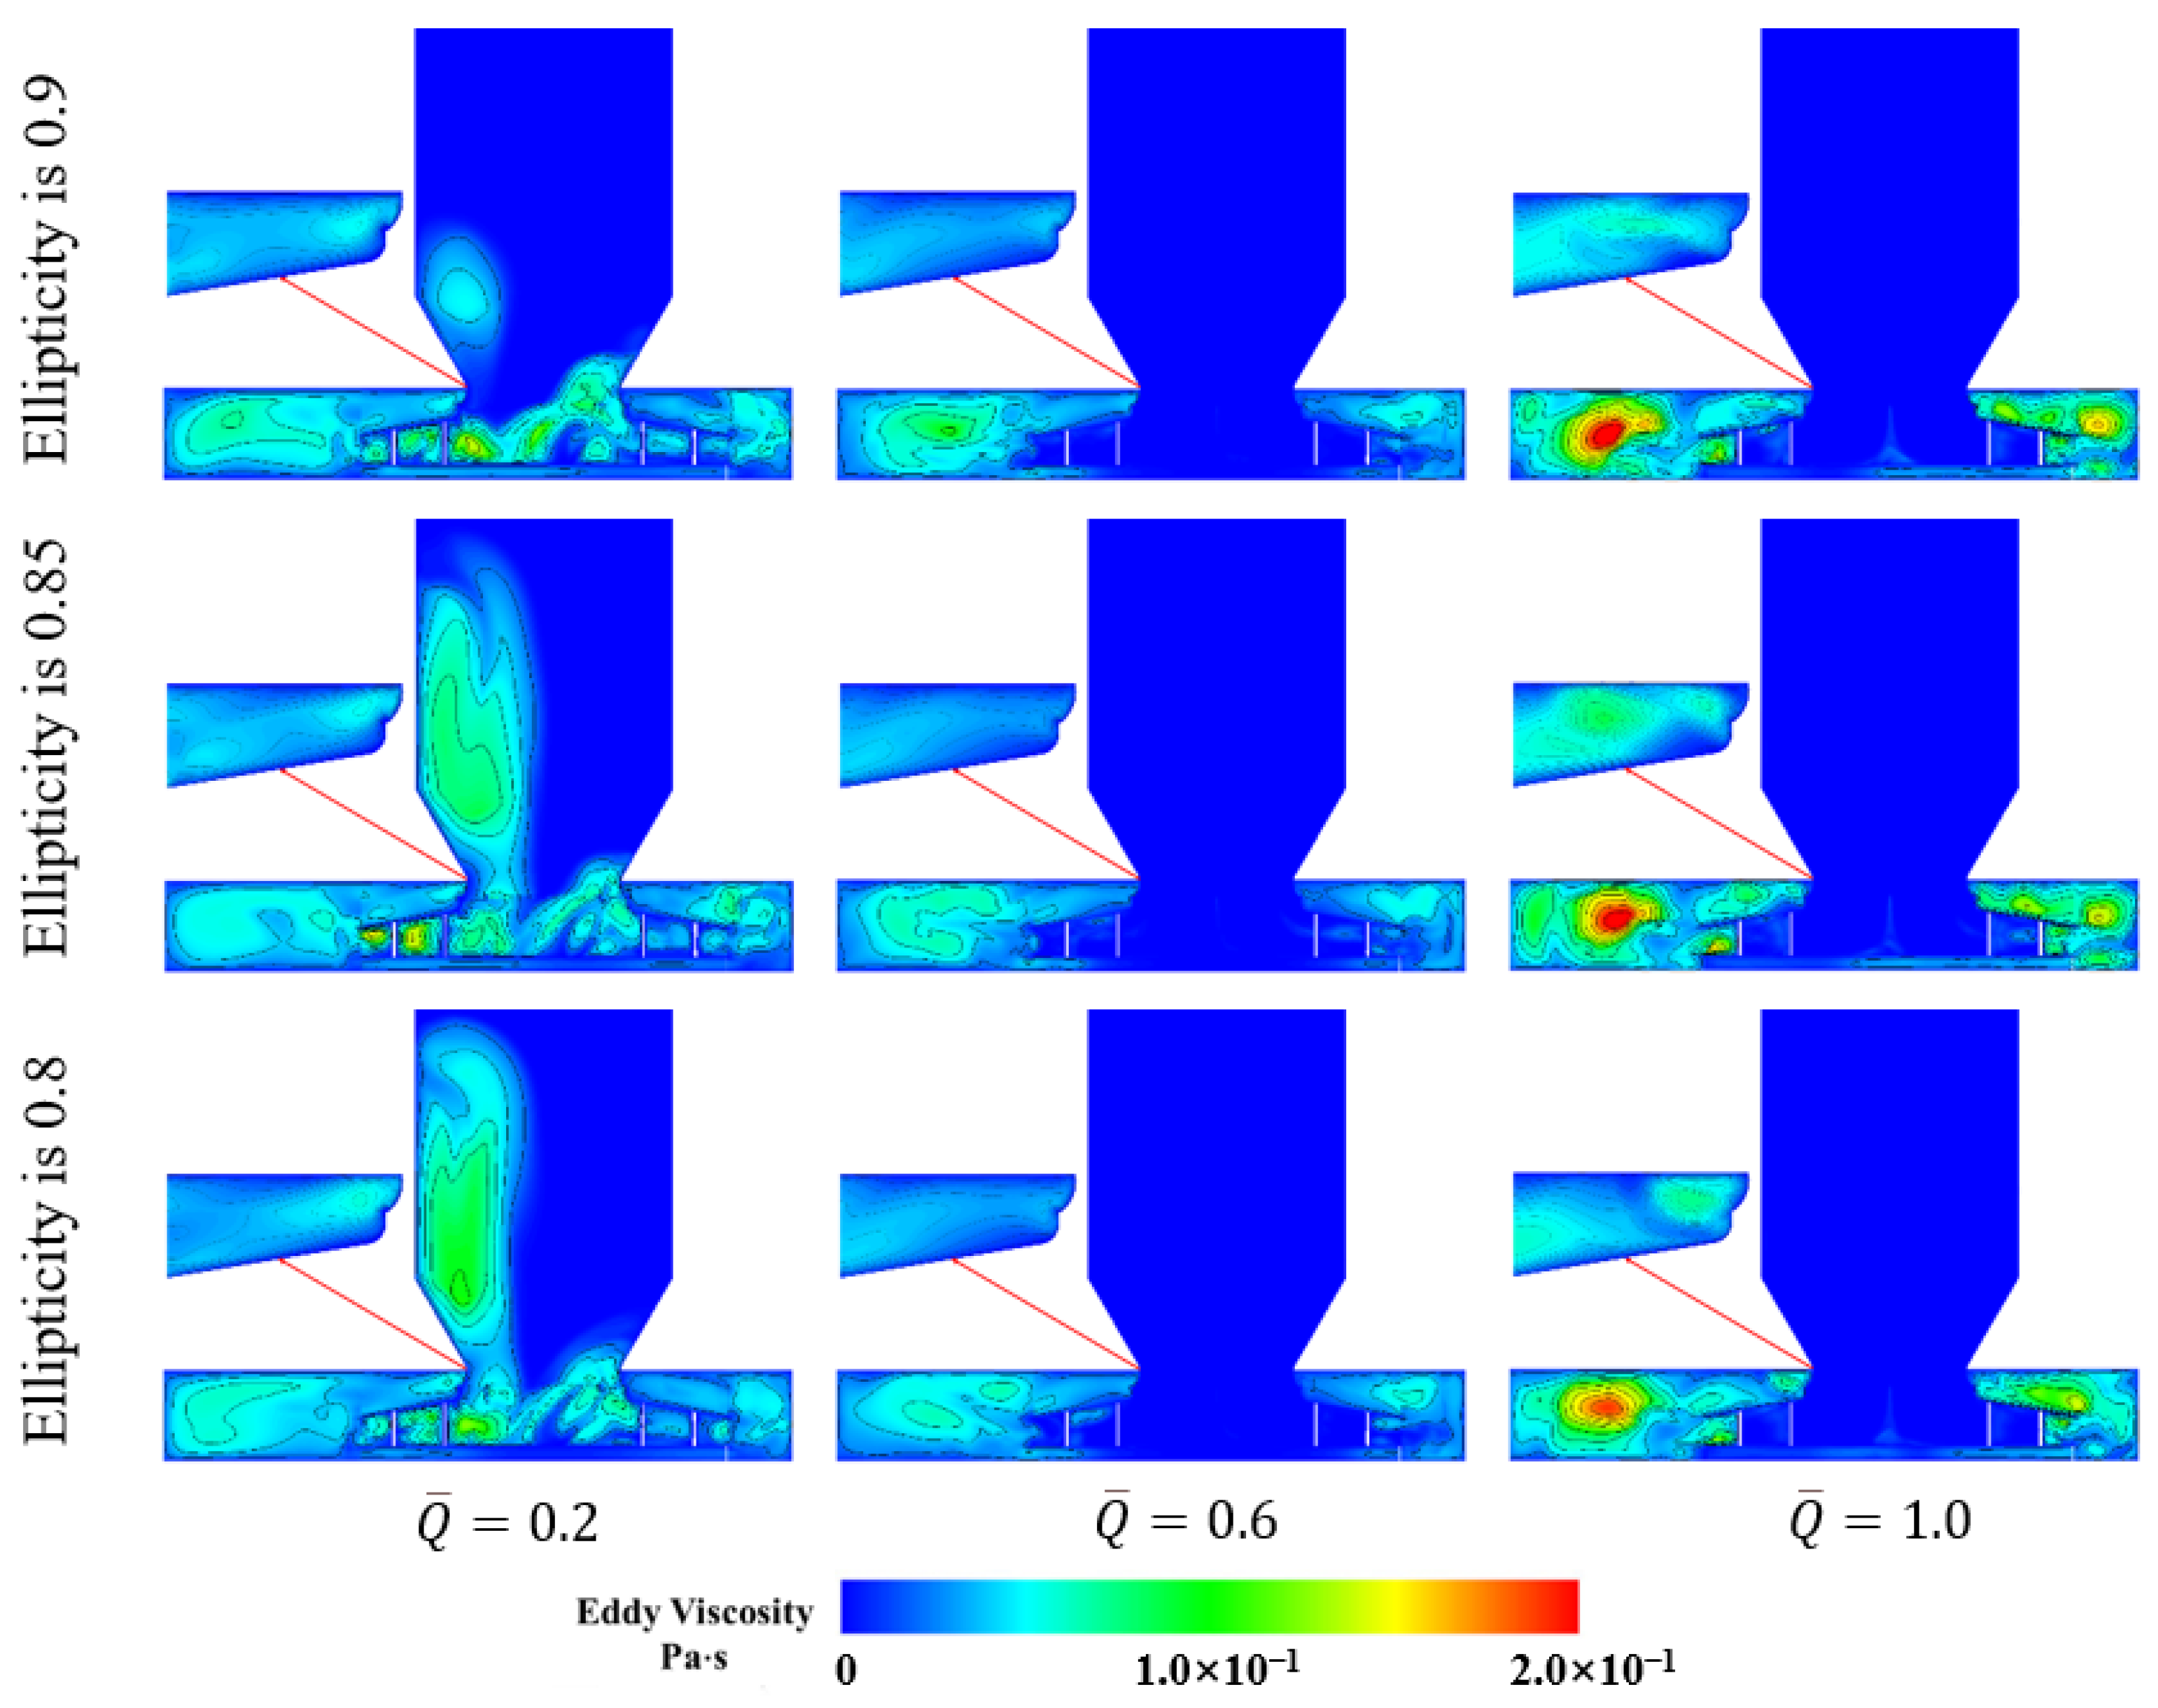
Figure 31 shows that in the low-flow condition ( 0.2), circumferentially non-uniform clearance markedly expands the region of eddy viscosity accumulation inside of the fan. The regions of elevated eddy viscosity are also more extensive than those observed in the original model.
Figure 31.
Eddy viscosity contours of the elliptical inlet nozzle models.
At the design flow rate ( 0.6), the inlet distortion distributes the flow unevenly among the impeller passages. All three elliptical models form regions of high eddy viscosity accumulation at the impeller exit and inside of the volute. This accumulation increases the flow loss.
In the high-flow condition ( 1.0), large regions of pronounced eddy viscosity accumulation appear at the impeller exit and inside of the volute. This may be attributed to the circumferential non-uniformity of the inlet nozzle. The altered inlet geometry may change the local blade incidence and promote separation and mixing within the impeller and the volute. The elevated eddy viscosity regions are consistent with these changes. Regions of high eddy viscosity appear in the ellipticity 0.9 and 0.85 models. This explains the sharp drop in their total pressure efficiency.
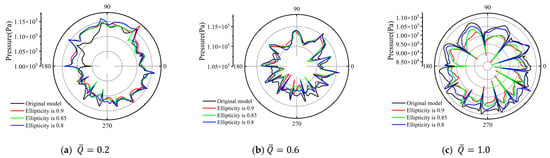
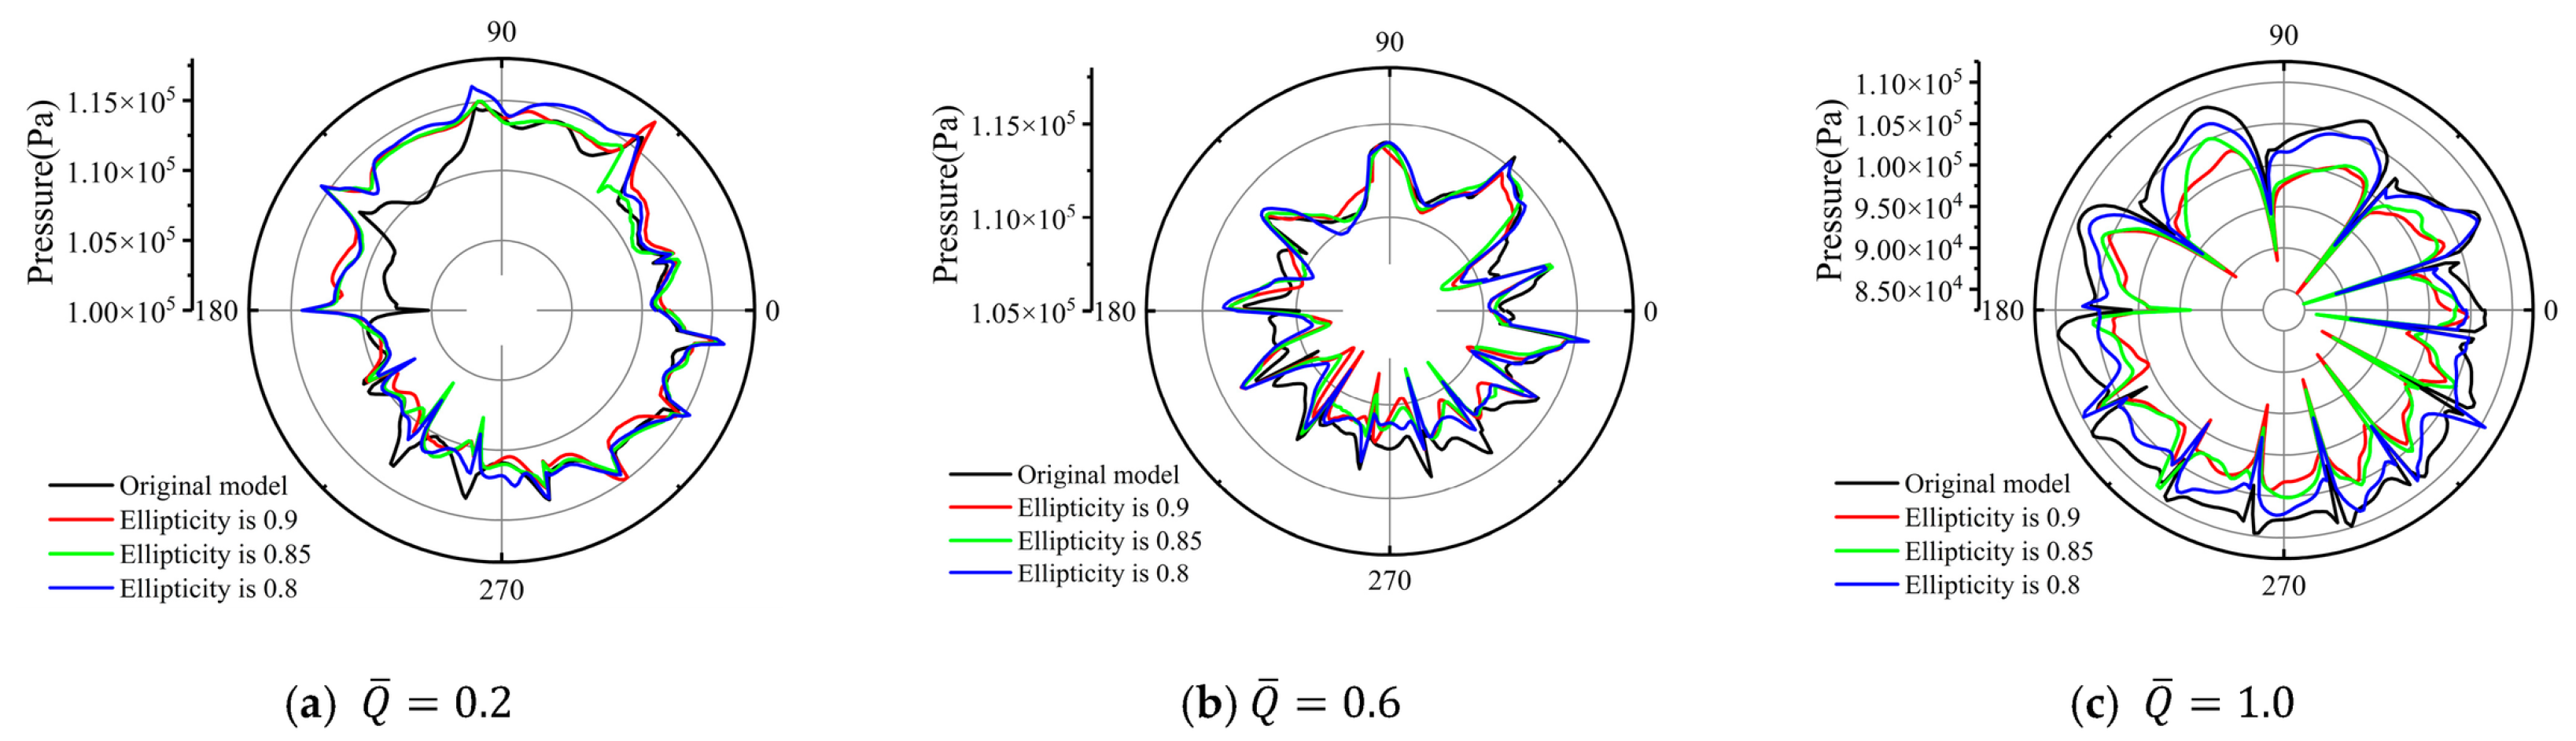
Figure 32 shows that in the low-flow condition ( 0.2) the pressure distribution is strongly asymmetric over the azimuthal angles. The pressure at the passage exit varies markedly. This asymmetry results from the circumferentially non-uniform inlet clearance. This pressure non-uniformity is consistent with the uneven distribution of low-velocity regions among the impeller passages in the steady solution.
Figure 32.
Polar plots of the pressure at the impeller exit for the elliptical inlet nozzles.
At the design flow rate ( 0.6), the original model shows a star-shaped pressure profile with evenly spaced, symmetric peaks. The number of peaks (12) equals the blade count. This pattern indicates a blade-pitch-related spatial variation in pressure. In the ellipticity 0.9, 0.85 and 0.8 models, in contrast, deep local depressions appear in the pressure profiles of the main passages aligned with the major and minor axes. These differences indicate greater passage to passage pressure non-uniformity. The pressure profiles therefore show that inlet distortion alters the circumferential distribution of outlet pressure. The pressure output of the impeller falls markedly.
In the high-flow condition ( 1.0), the passages are severely blocked, so the pressure profiles of the models with circumferentially non-uniform clearance collapse uniformly around the circumference. The pressure at the blade passage exit drops sharply. The blade loading also varies strongly from passage to passage. This circumferential imbalance in blade loading accounts for the sharp drop in the total pressure efficiency in this condition.
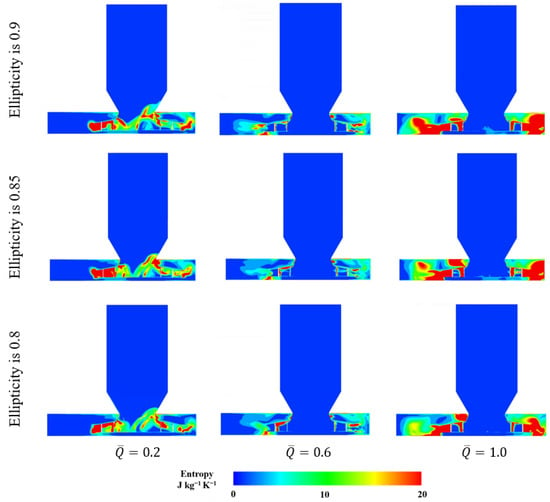
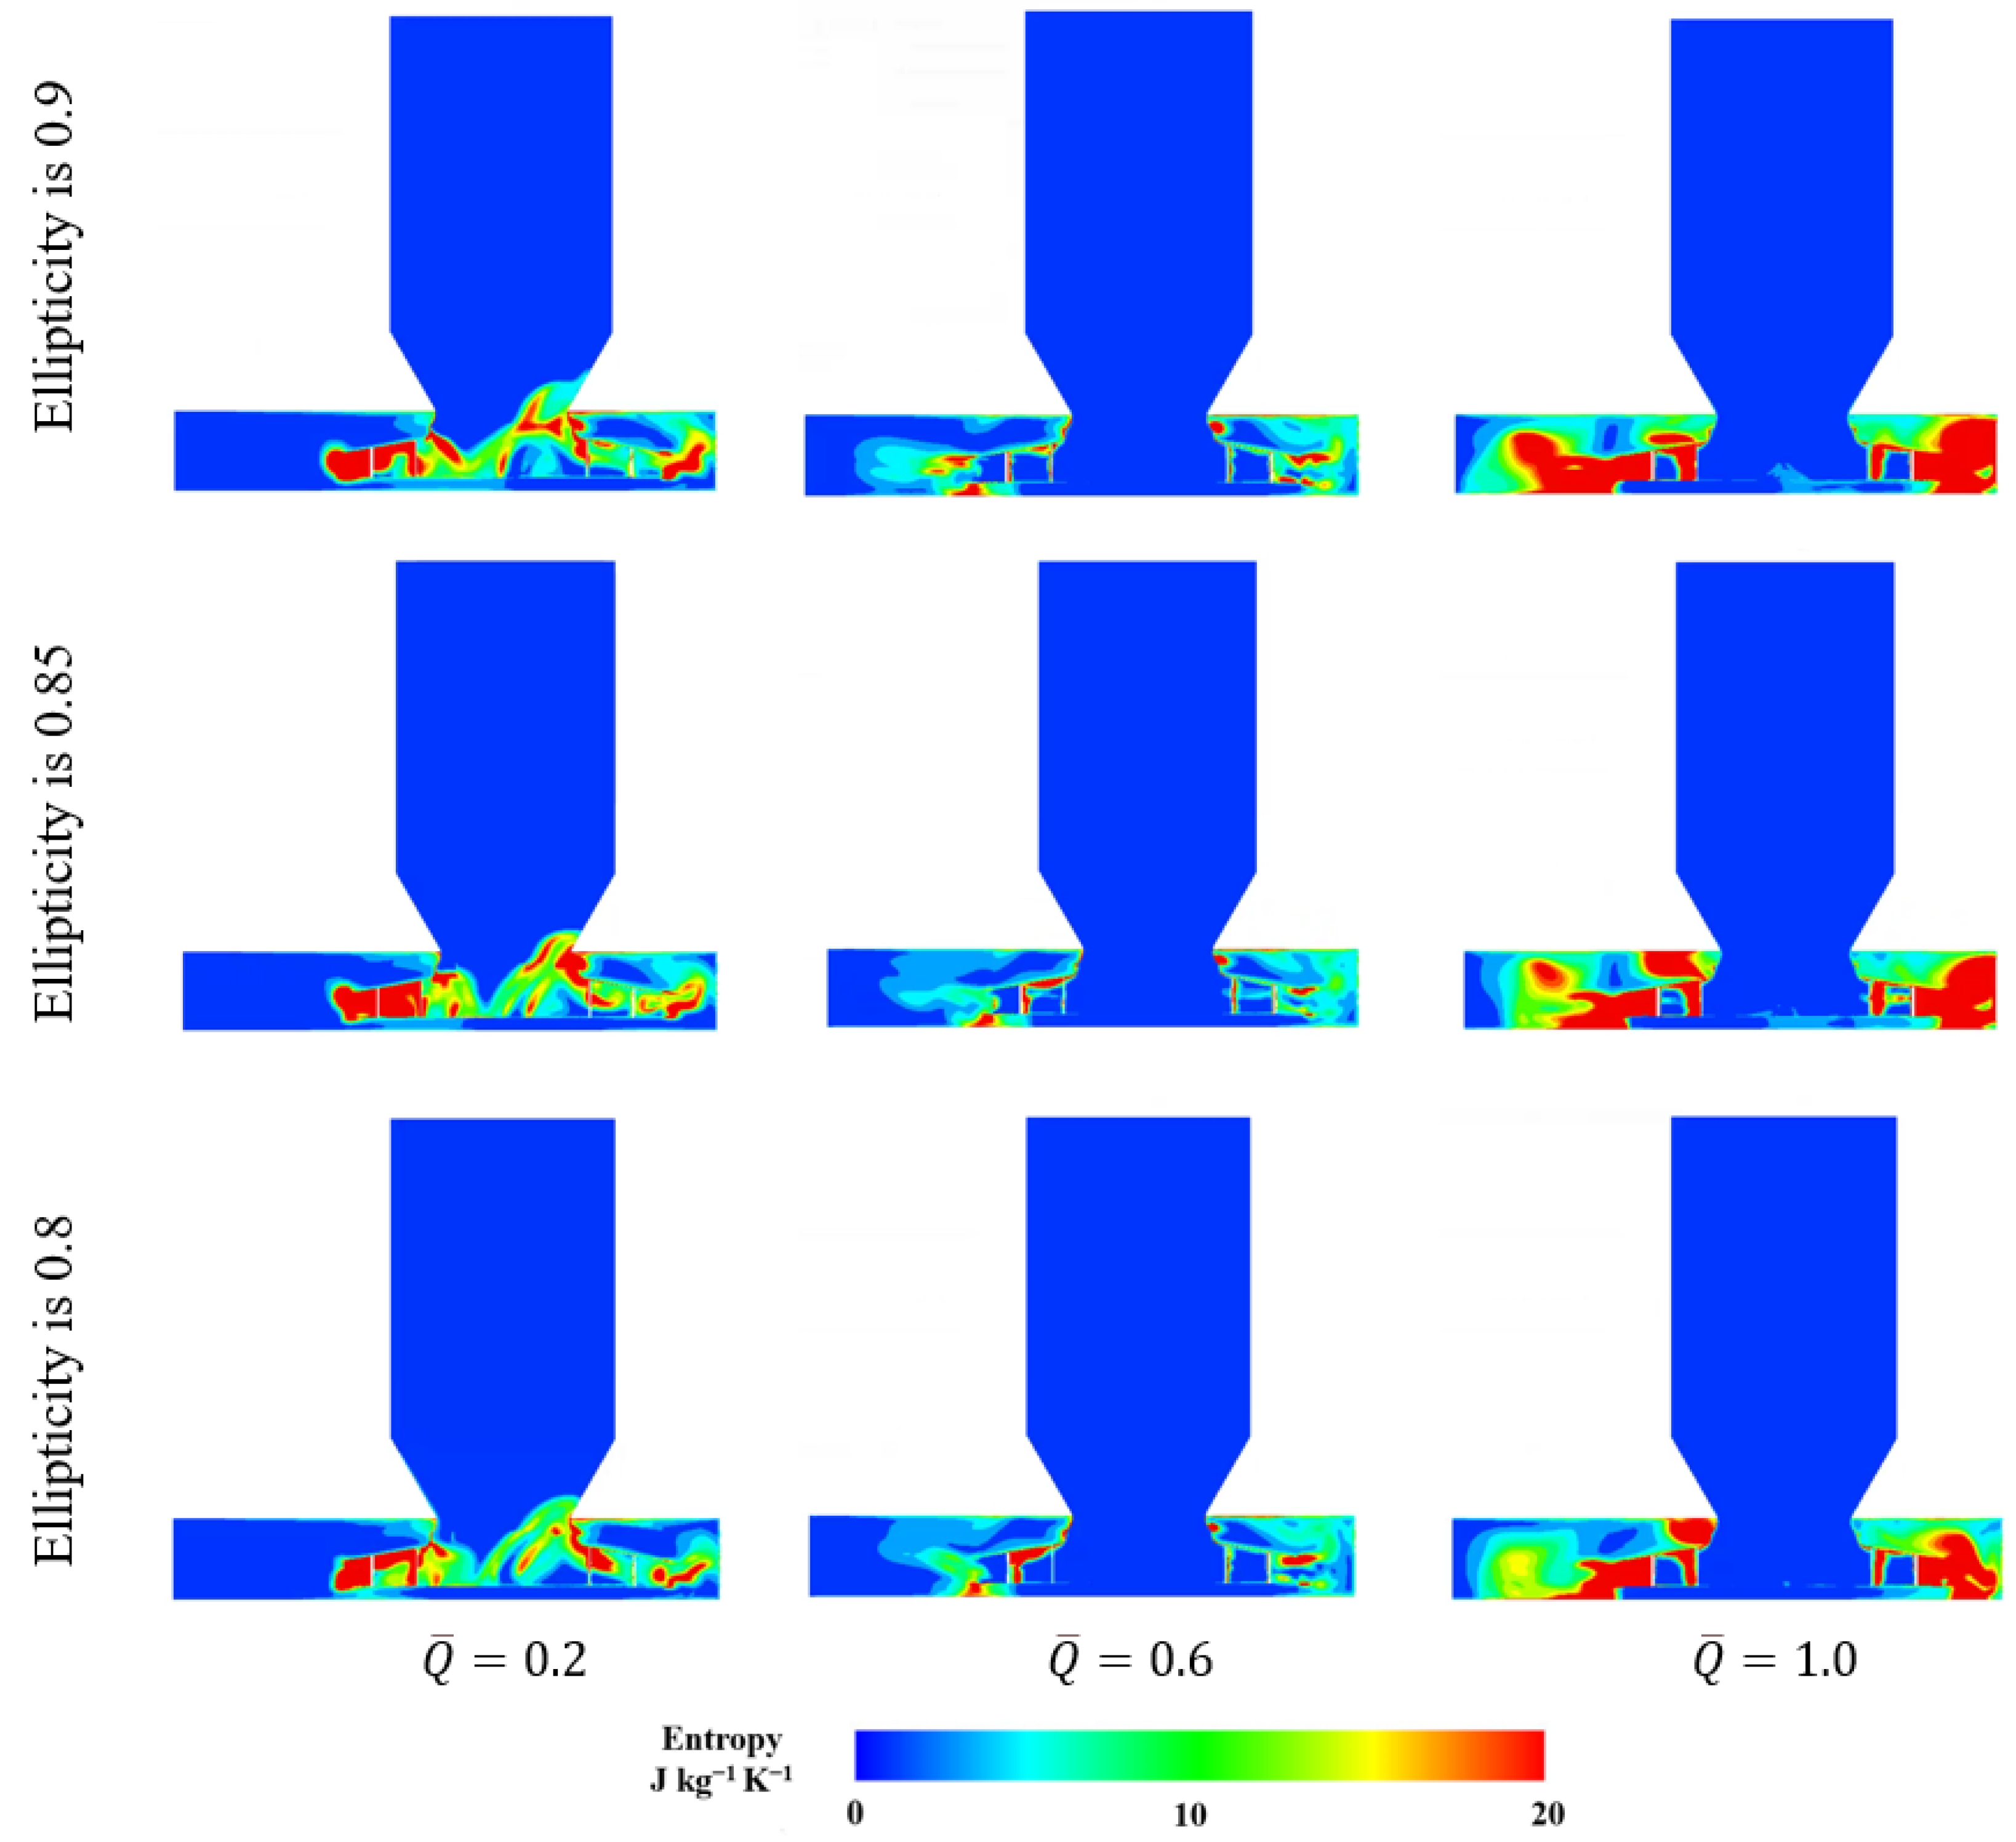
Figure 33 compares the specific entropy distributions of the three elliptical inlet nozzle models at three operating conditions. In the low-flow condition ( 0.2), high-entropy regions occur near the nozzle–impeller connection and within the adjacent passages, with configuration-dependent upstream extensions on the right. In the design flow condition ( 0.6), the main inlet passage remains at low specific entropy in all three models, while localized differences persist downstream. In the high-flow condition ( 1.0), the ellipticity-0.9 and ellipticity-0.85 models exhibit more extensive regions on the left side. The corresponding region in the ellipticity-0.8 model contains larger areas of intermediate specific entropy.
Figure 33.
Specific entropy distributions for the elliptical inlet nozzle models.
6.4. Comparison of Uniform and Non-Uniform Clearances at the Same Clearance Flow Area
To distinguish the influence of circumferential clearance non-uniformity from that of clearance flow area, an additional control model with circumferentially uniform clearance was constructed. Its clearance flow area was matched to that of the ellipticity-0.8 model. Comparing these two configurations provides a basis for assessing the effect of clearance distribution at the same clearance flow area. The original model was retained as a baseline.
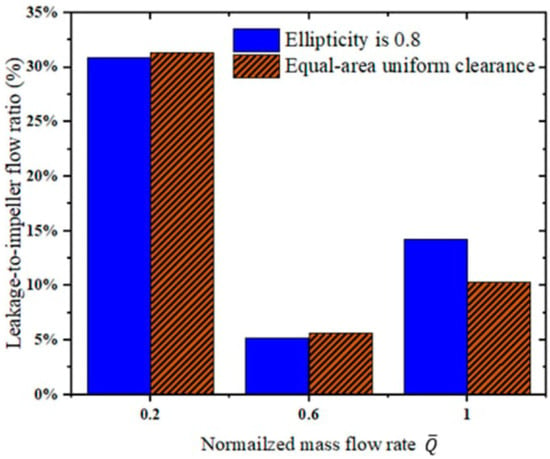
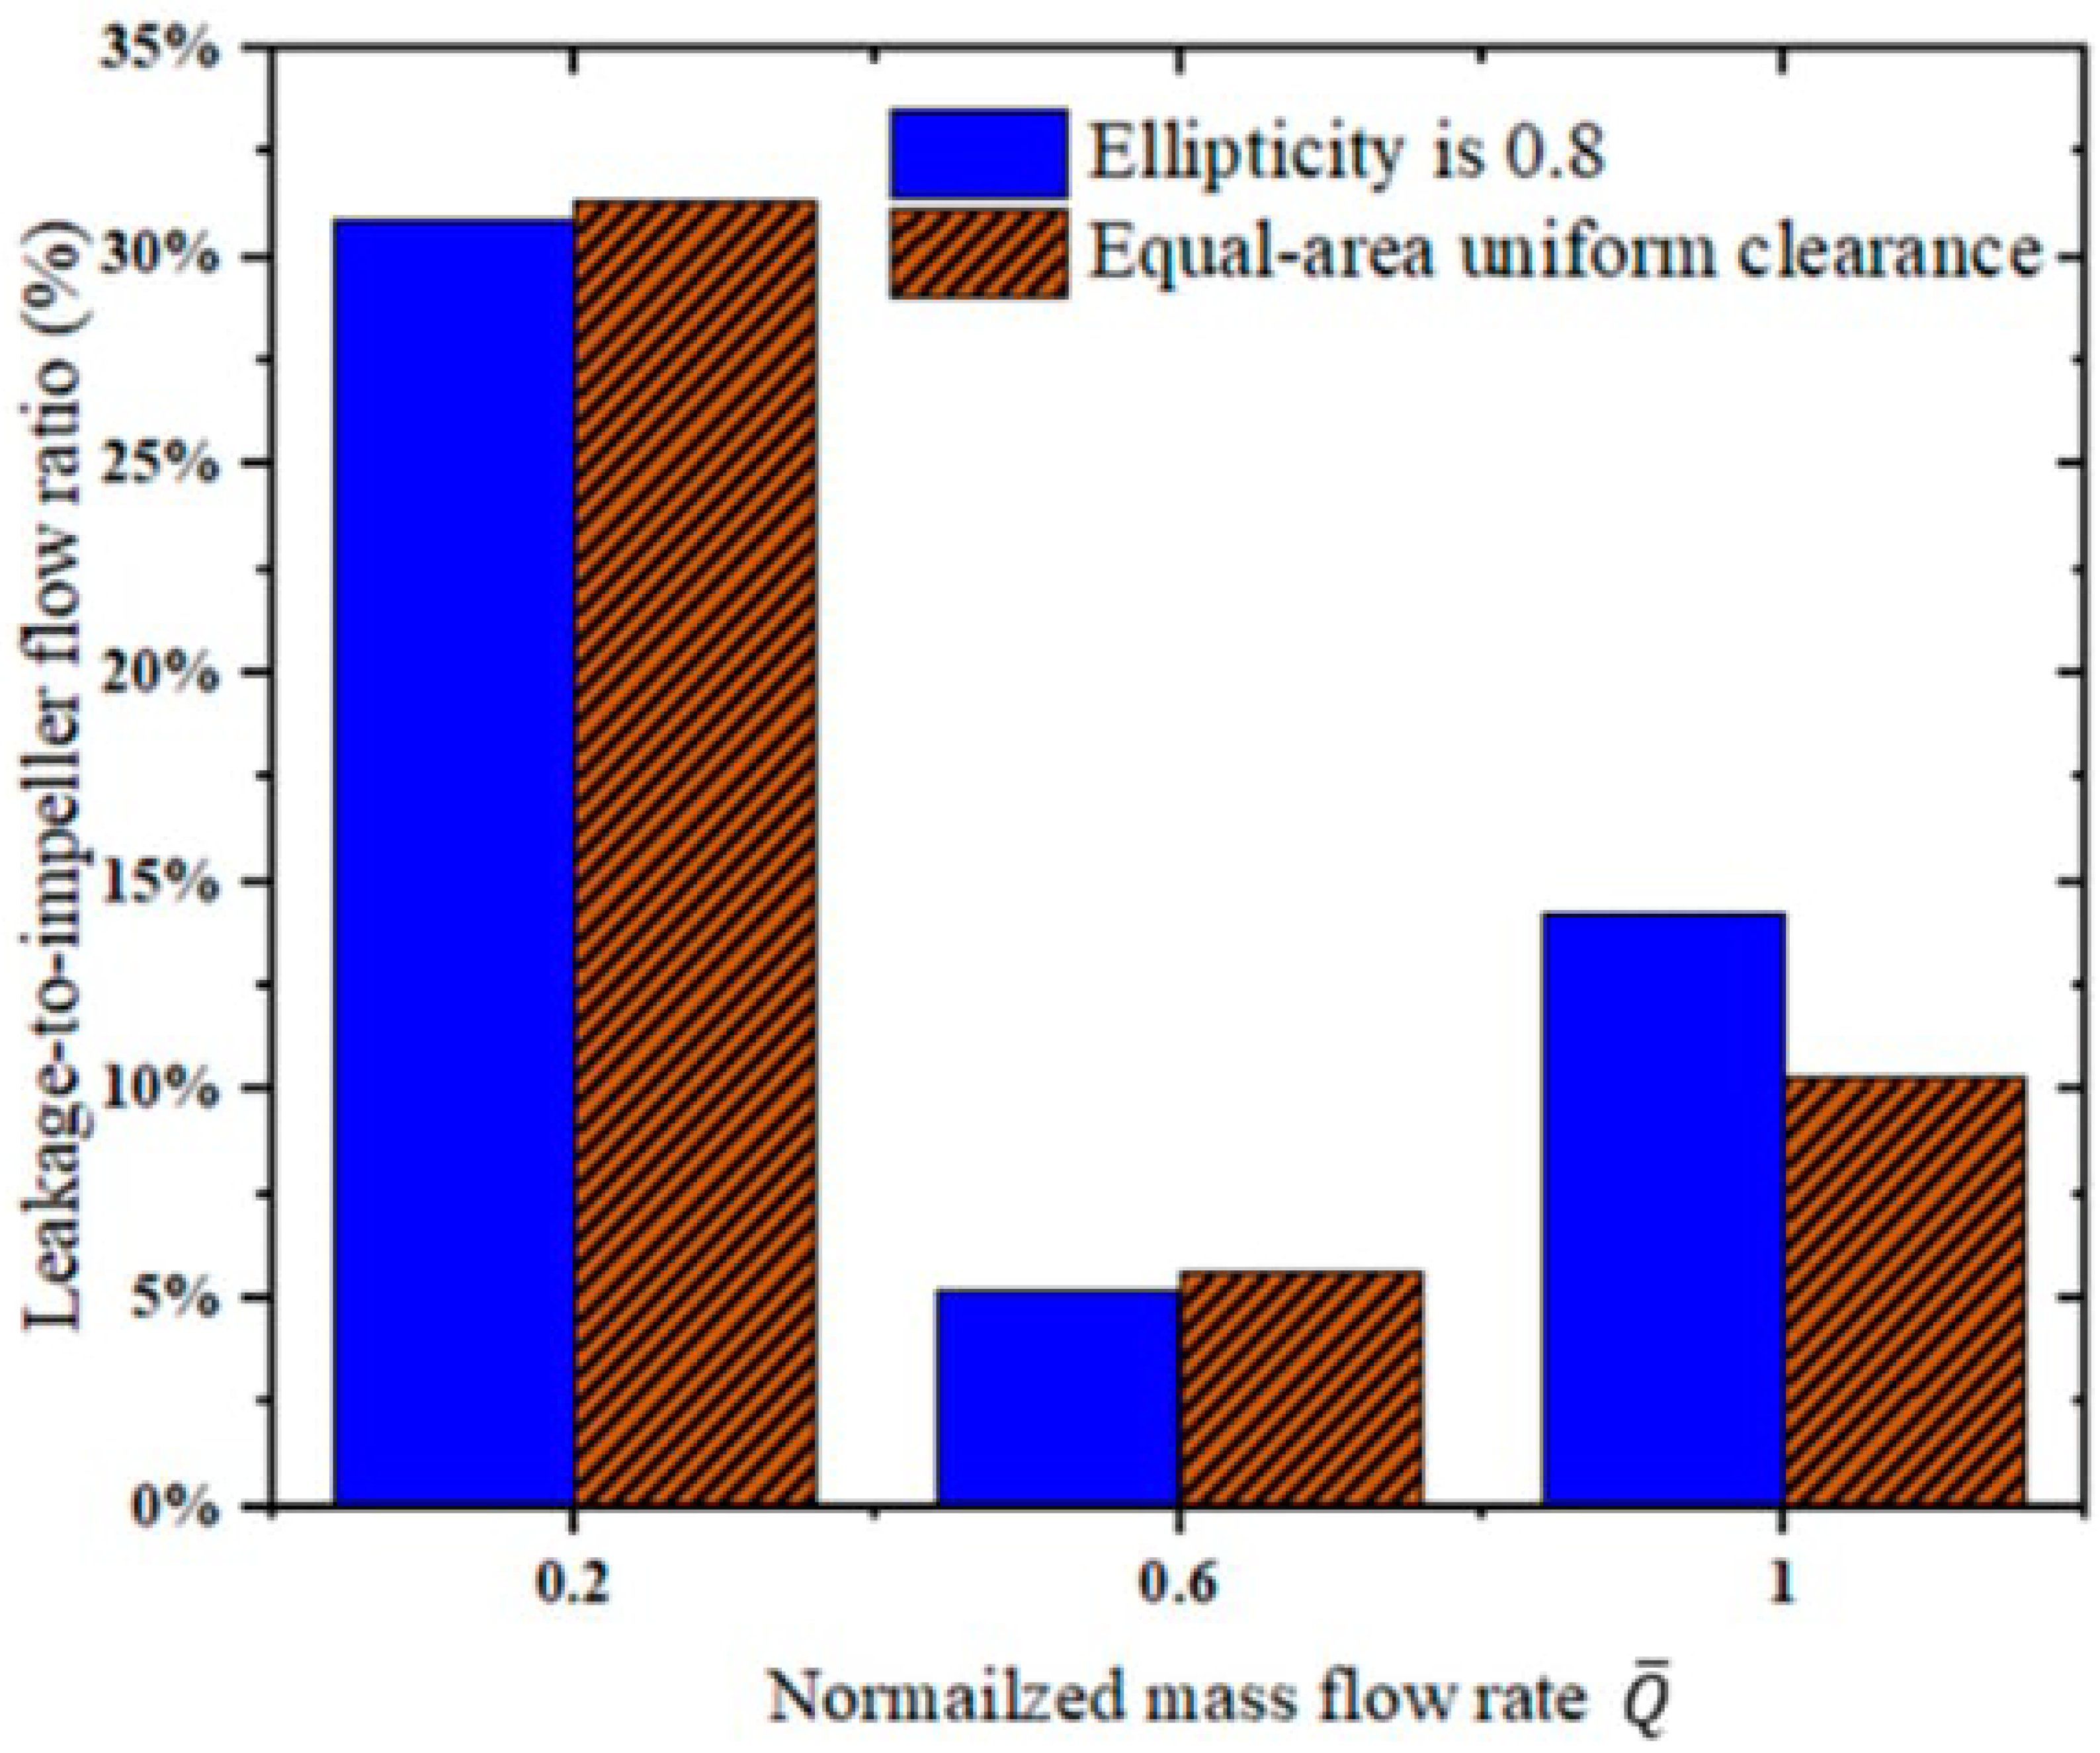
As shown in Table 6 and Figure 34, in the low-flow condition ( 0.2), the equal-area uniform clearance model achieves an efficiency of 52.15% compared with 54.64% for the ellipticity-0.8 model. In the design flow condition ( 0.6), their efficiencies differ by only 1.55 percentage points. However, the ellipticity-0.8 model exhibits a sharp efficiency decrease from 79.25% at the design condition to 32.41% at high flow, a reduction of 46.84 percentage points. The uniform clearance model reaches 43.71% in the high-flow condition ( 1.0), exceeding the elliptical model by 11.30 percentage points. Its leakage ratio is also lower, approximately 10.3% compared with 14.22%. These differences demonstrate that circumferential clearance non-uniformity aggravates performance deterioration at high flow rates.
Table 6.
Clearance characteristics and total pressure efficiencies of the ellipticity-0.8 and equal-area uniform clearance models.
Figure 34.
Leakage-to-impeller mass flow ratios for the ellipticity-0.8 and equal-area uniform clearance models.
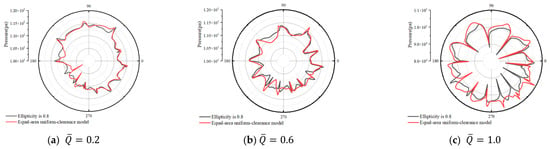
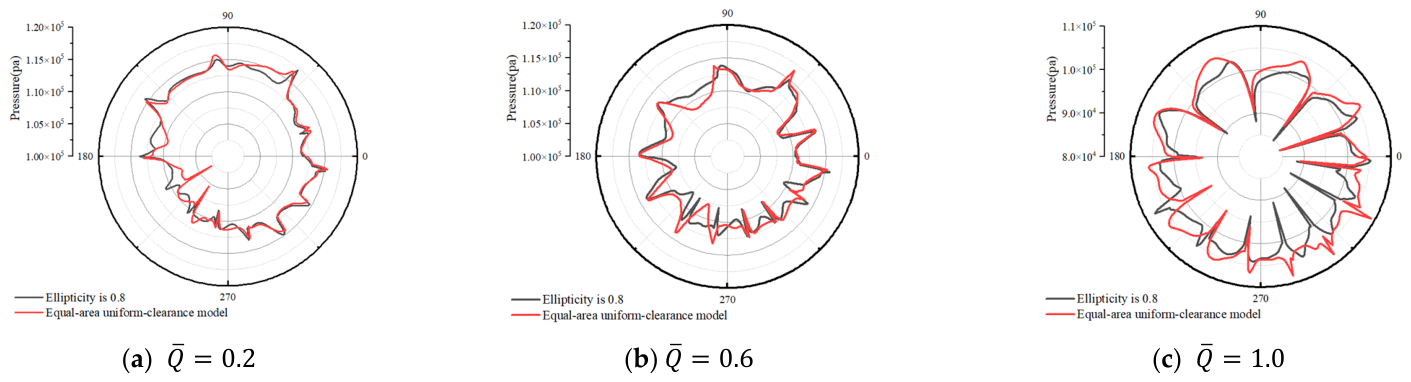
Figure 35 compares the circumferential pressure distributions at the impeller exit for the ellipticity-0.8 and equal-area uniform clearance models. In the low-flow condition ( 0.2), the profiles largely overlap, with differences confined mainly to local peaks and depressions. In the design flow condition ( 0.6), the overall pressure envelopes remain similar despite differences in the magnitudes and locations of individual peaks. Their design point efficiencies differ by 1.55 percentage points, a smaller difference than that observed at high flow. In the high-flow condition ( 1.0), the profiles diverge more markedly, with the uniform clearance model exhibiting higher pressures over several circumferential sectors. These larger pressure differences are consistent with the greater efficiency difference between the two configurations.
Figure 35.
Circumferential pressure distributions at the impeller exit for the ellipticity-0.8 and equal-area uniform clearance models.
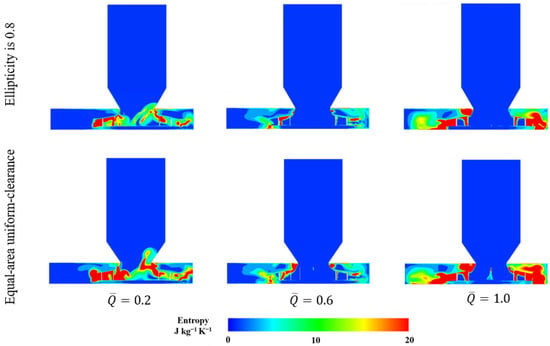
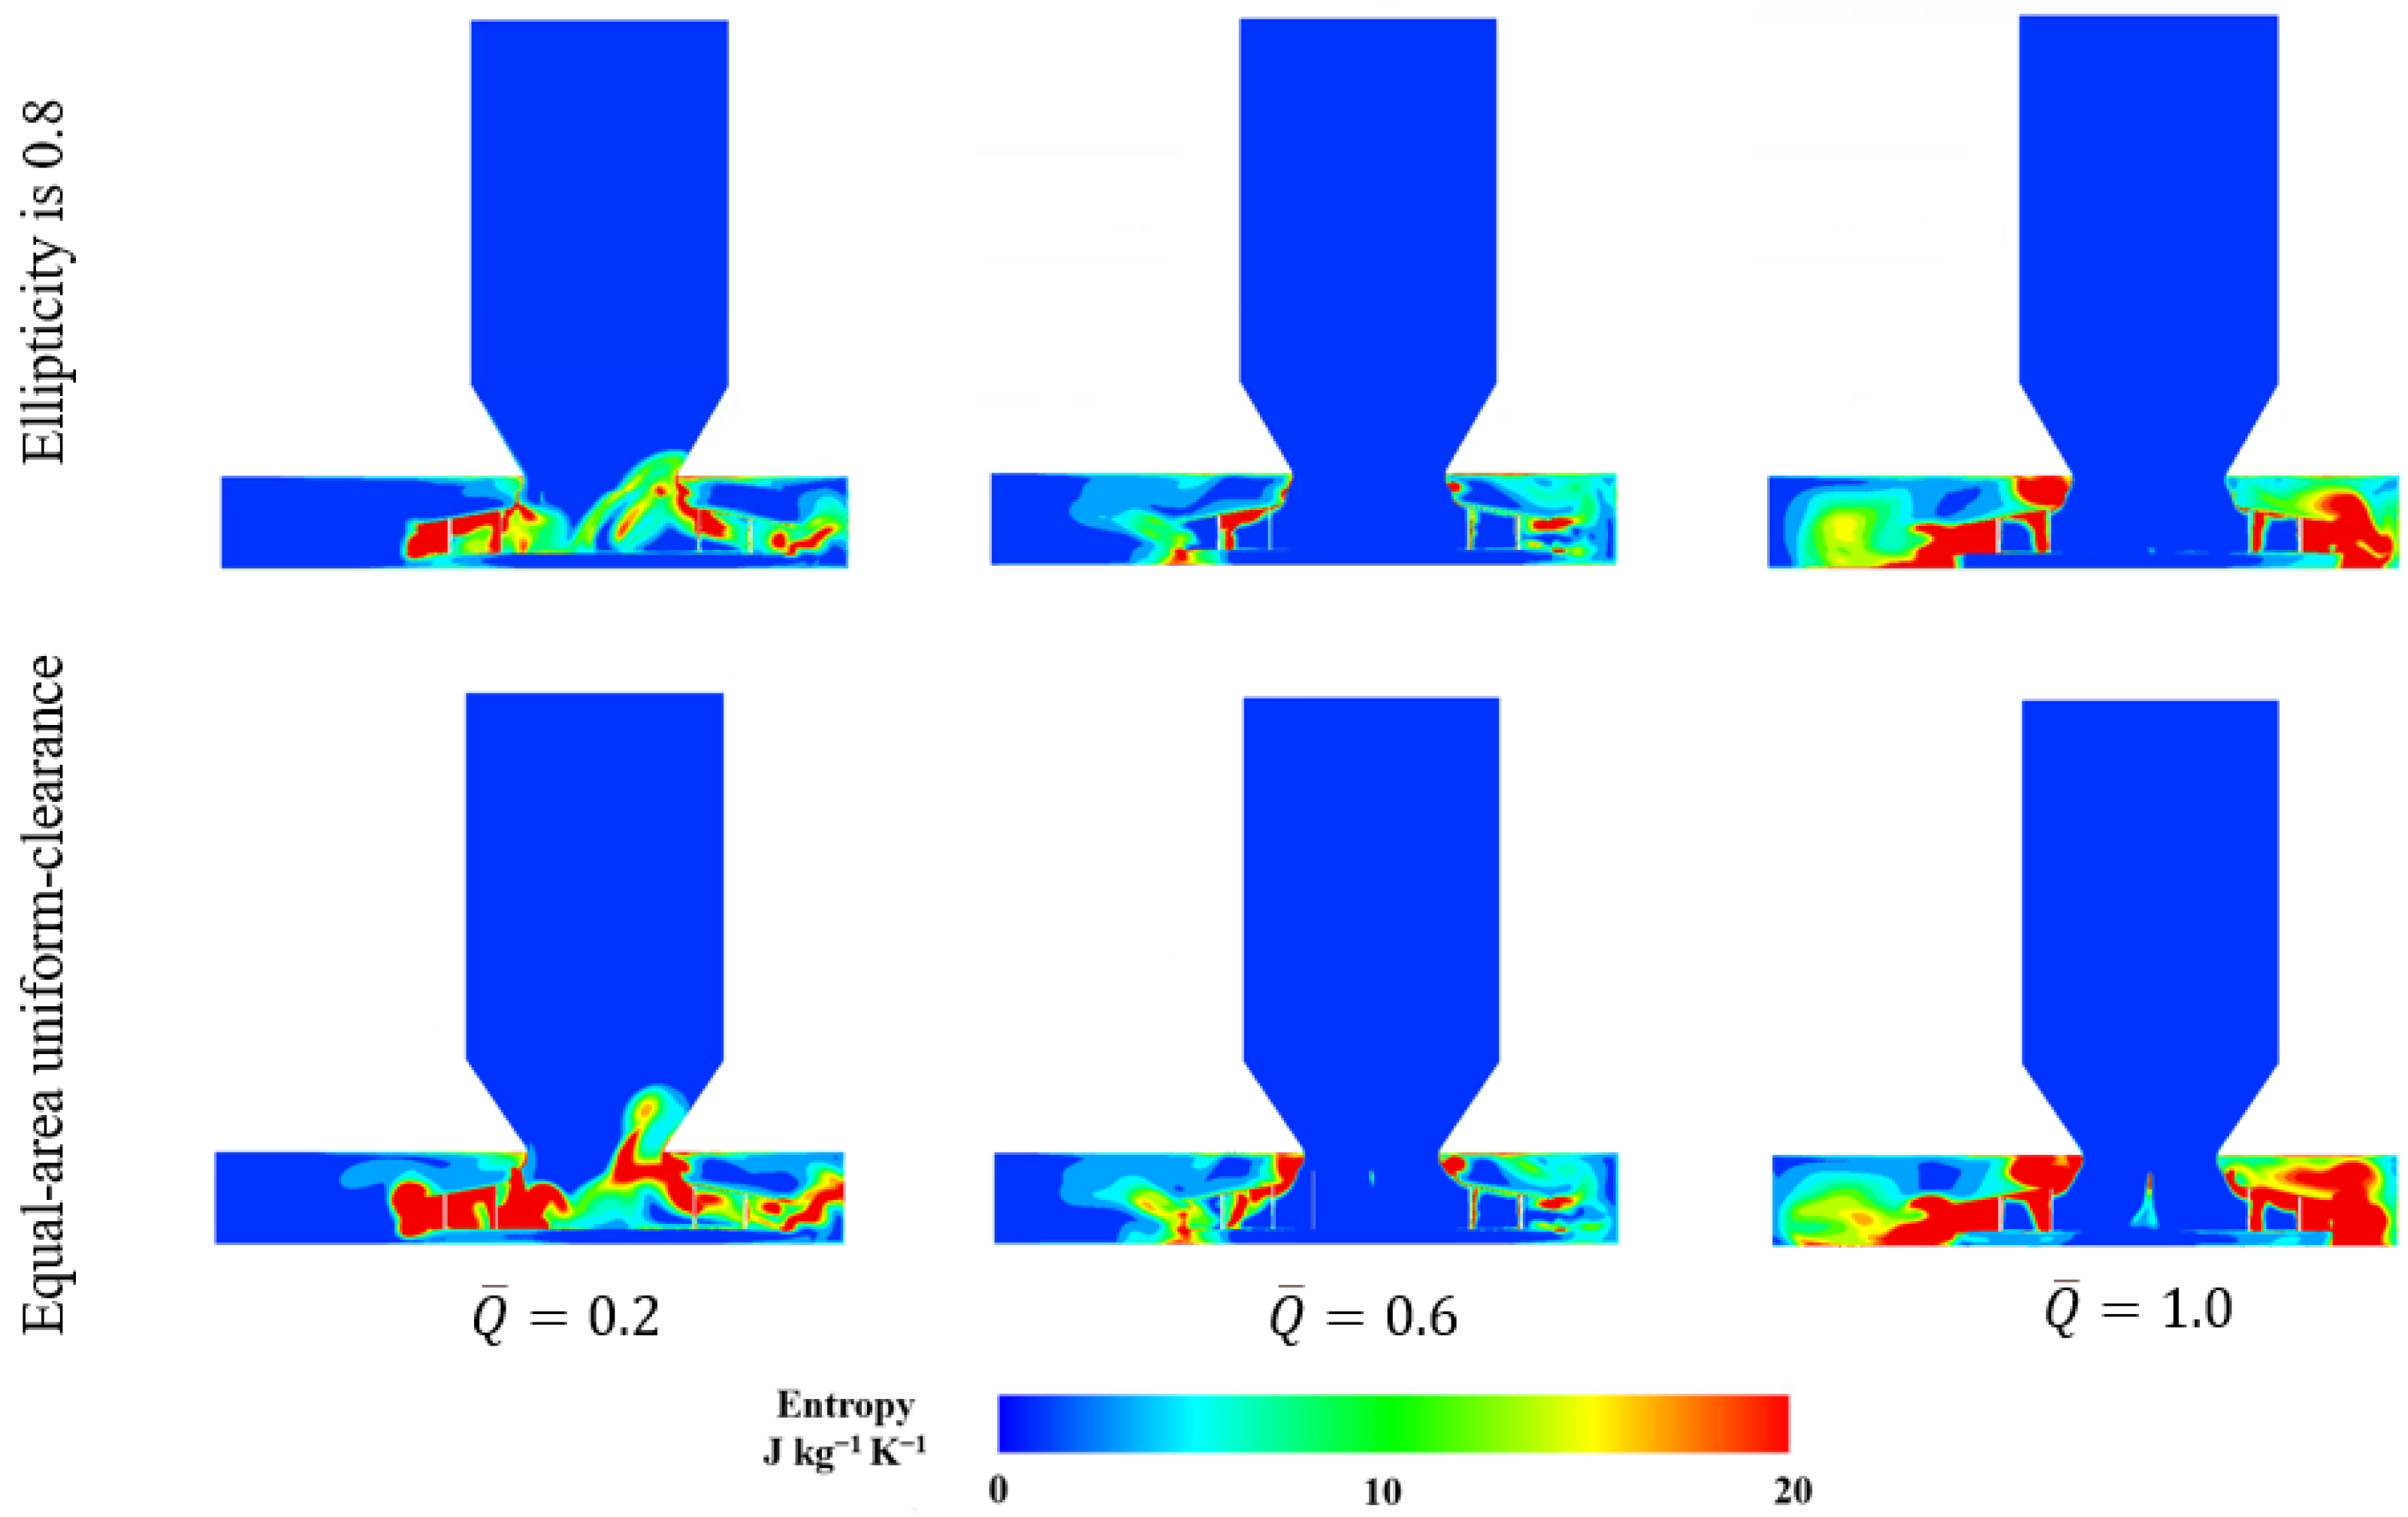
Figure 36 compares the specific entropy distributions of the ellipticity-0.8 and equal-area uniform clearance models. At low flow, both models exhibit high-entropy regions near the nozzle–impeller connection and within the impeller passages. The elliptical model shows an inclined high-entropy band extending from the right side of the connection. In the uniform clearance model, high-entropy fluid is more concentrated near this connection and also extends along the impeller passages on both sides. At the design condition, the main inlet passage remains at low specific entropy in both models. High-entropy regions are largely confined to the connection and portions of the impeller passages, with similar distributions consistent with their comparable design point efficiencies. At high flow, both models retain extensive high-entropy regions within the impeller–volute region. These contours reveal spatial differences in high-entropy fluid distribution, while the performance and leakage results indicate greater sensitivity of the elliptical configuration to high-flow operation.
Figure 36.
Specific entropy distributions for the ellipticity-0.8 and equal-area uniform clearance models.
For the investigated centrifugal fan with straight plate blades, the overlapped inlet nozzle assembly achieved higher total pressure efficiency than the axial gap arrangement under the tested conditions. An overlapped assembly is therefore recommended, together with maintenance of inlet nozzle circularity to limit leakage and inlet flow distortion.
7. Conclusions
This study systematically evaluates the aerodynamic performance of a typical centrifugal fan with straight plate blades over the full flow range. Four clearance conditions are considered: with and without an inlet clearance, overlapped clearance variability, axial clearance variability, and circumferential non-uniformity of the inlet clearance. Performance changes were examined using leakage ratios, velocity and eddy viscosity fields, circumferential pressure distributions, and specific entropy contours. The main conclusions are as follows:
- The clearance-free idealization overestimates the total pressure efficiency. At the design flow rate ( 0.6) it gives 84.5%, against 83.5% for the original model, a deviation of 1%. Over the full flow range, the clearance-free model shows a higher total pressure efficiency than the original model, and the difference widens progressively between normalized flow rates of 0.6 and 0.8. In the high-flow condition ( 1.0), however, the large volumetric flow rate suppresses local clearance leakage, so the aerodynamic performance of the two models becomes similar.
- Overlapped clearance variability strongly affects the aerodynamic performance of the fan. For overlapped clearance of 20 mm, the aerodynamic performance is closest to that of the original model. Overlapped clearance that is too small or too large, in contrast, degrades performance markedly. In the high-flow condition, excessively large overlapped clearance causes a sharp drop in the total pressure efficiency.
- Within the investigated axial clearance range of 10–30 mm, clearance size has little influence on the fan’s aerodynamic performance. The total pressure efficiency curves of the three axial clearance models nearly overlap, with design point efficiencies of 77–78% at the design flow rate ( 0.6). All three models exhibit lower efficiencies than the original model in the design and high-flow conditions.
- The effect of inlet nozzle ovalization depended on the operating condition, and elliptical inlet clearance was particularly sensitive to high flow. For the ellipticity-0.8 model, total pressure efficiency decreased from 79.25% at the design point to 32.41% at high flow. The equal-area uniform clearance model achieved a design point efficiency 1.55 percentage points higher than that of the ellipticity-0.8 model and reached 43.71% at high flow, 11.30 percentage points higher than that of the ellipticity-0.8 model. Its high-flow leakage ratio was also lower, approximately 10.3% compared with 14.22% for the ellipticity-0.8 model.
Author Contributions
Conceptualization, J.D. and W.W.; methodology, J.D.; software, J.D.; validation, J.D. and M.A.H.; formal analysis, J.D.; investigation, J.D.; resources, Y.S.; data curation, J.D.; writing—original draft preparation, J.D.; writing—review and editing, J.D., W.W., W.D., M.A.H., K.L., and Y.S.; visualization, J.D.; supervision, W.D. and K.L.; project administration, W.W. All authors have read and agreed to the published version of the manuscript.
Funding
This work was funded by the Guangdong Key Laboratory of Thermal Energy Storage Technology for Buildings (2025MBTYF0007), the Postdoctoral Innovation Project of Shandong Province (SDCX-ZG-202603159), and the Postgraduate Research & Practice Innovation Program of Jiangsu Province (26CXJH7464, 26CXJH7461).
Data Availability Statement
The original contributions reported in this study are fully documented in the article; for further information or inquiries, please contact the corresponding authors.
Conflicts of Interest
The authors declare no conflicts of interest.
Nomenclature
| Z1 | Number of blades |
| D1 | Impeller inlet diameter |
| D2 | Impeller outlet diameter |
| D3 | Inlet diameter |
| L1 | Blade inlet height |
| L2 | Blade outlet height |
| β | Blade inlet angle |
| γ | Blade outlet angle |
| a | Major axis of the elliptical inlet nozzle |
| b | Minor axis of the elliptical inlet nozzle |
| r | Radius of the original circular inlet |
| c | Inlet clearance |
| c0 | Inlet clearance of the original model |
| δ | Overlapped clearance |
| δ0 | Overlapped clearance of the original model |
| δmin | Overlapped clearance of the In-min model |
| δmiddle | Overlapped clearance of the In-middle model |
| δmax | Overlapped clearance of the In-max model |
| η | Total-pressure efficiency |
| Δη | Difference in total-pressure efficiency |
| η0 | Total-pressure efficiency of the original model |
| η1 | Total-pressure efficiency of the no clearance model |
| Mass flow rate | |
| mc | Clearance leakage mass flow rate |
| T | Resisting torque about the impeller rotation axis |
| ω | Impeller angular velocity |
| n | Impeller rotational speed |
| Nc | Number of cells across the clearance |
| h | Axial clearance |
| hmin | Axial clearance of the Out-min model |
| hmiddle | Axial clearance of the Out-middle model |
| hmax | Axial clearance of the Out-max model |
| Q | Volumetric flow rate |
| Qmax | Maximum volumetric flow rate |
| Normalized flow rate | |
| Total-pressure coefficient | |
| Δpt | Total-pressure rise across the fan |
| t | Time |
| Velocity vector | |
| Viscous stress tensor | |
| Heat flux vector | |
| p | Pressure |
| ρ | Density of the fluid |
| E | Total energy per unit mass |
| π | Total pressure ratio |
| CFD | Computational fluid dynamics |
| RANS | Reynolds-averaged Navier–Stokes |
| RMS | Root mean square |
| SST | Shear stress transport |
References
- Fortini, A.; Suman, A.; Zanini, N. An experimental and numerical study of the solid particle erosion damage in an industrial cement large-sized fan. Eng. Fail. Anal. 2023, 146, 107058. [Google Scholar] [CrossRef] [Scilit]
- Zhou, S.; Yang, K.; Zhang, W.; Zhang, K.; Wang, C.; Jin, W. Optimization of multi-blade centrifugal fan blade design for ventilation and air-conditioning system based on disturbance CST function. Appl. Sci. 2021, 11, 7784. [Google Scholar] [CrossRef] [Scilit]
- Kocsis, B.; Benedek, T.; Ferenczy, P.; Balla, E.; Daku, G.; Vad, J. Aerodynamic and acoustic studies on a radial fan family developed for increased specific flow rate of dust-laden gases. In Proceedings of the 15th European Conference on Turbomachinery Fluid Dynamics and Thermodynamics, Budapest, Hungary, 24–28 April 2023; ETC2023-126; Euroturbo: Naples, Italy, 2023. [Google Scholar] [CrossRef] [Scilit]
- Liu, H.; Jiang, B.; Wang, J.; Yang, X.; Xiao, Q. Numerical and experimental investigations on non-axisymmetric D-type inlet nozzle for a squirrel-cage fan. Eng. Appl. Comput. Fluid Mech. 2021, 15, 363–376. [Google Scholar] [CrossRef] [Scilit]
- Gholamian, M.; Mohan Rao, G.K.; Panitapu, B. Effect of axial gap between inlet nozzle and impeller on efficiency and flow pattern in centrifugal fans, numerical and experimental analysis. Case Stud. Therm. Eng. 2013, 1, 26–37. [Google Scholar] [CrossRef] [Scilit]
- Zhou, H.; Wang, W.; Jiang, B.; Wang, J. Analysis of internal flow characteristics of squirrel-cage fan with multi-directional air intake impeller. Int. J. Heat Fluid Flow 2024, 105, 109267. [Google Scholar] [CrossRef] [Scilit]
- Wu, J.; Li, Y.; Hu, X. Research on noise reduction of a multi-blade centrifugal fan based on splitter blades technology. Phys. Fluids 2025, 37, 084102. [Google Scholar] [CrossRef] [Scilit]
- Wang, J.; Liu, X.; Tian, C.; Xi, G. Aerodynamic performance improvement and noise control for the multi-blade centrifugal fan by using bio-inspired blades. Energy 2023, 263, 125829. [Google Scholar] [CrossRef] [Scilit]
- Lei, J.; Cui, Q.; Qin, G. Performance improvement and noise reduction analysis of multi-blade centrifugal fan imitating long-eared owl wing surface. Phys. Fluids 2023, 35, 125147. [Google Scholar] [CrossRef] [Scilit]
- Lei, J.; Cui, Q.; Qin, G. Performance improvement of multi-blade centrifugal fan based on impeller outlet flow control. Phys. Fluids 2024, 36, 095181. [Google Scholar] [CrossRef] [Scilit]
- Liang, Z.; Wada, M.E. Parameter optimisation of a centrifugal fan for rice combine harvesters based on airflow resistance coefficients and CFD simulations. Biosyst. Eng. 2025, 259, 104287. [Google Scholar] [CrossRef] [Scilit]
- Wei, Y.; Li, L.; Lun, Y.; Wang, Z.; Yang, H.; Zhang, W. Effect of volute-tongue clearance on the aerodynamic performance and noise of multi-wing centrifugal fan for air conditioning. J. Appl. Fluid Mech. 2023, 16, 1483–1498. [Google Scholar] [CrossRef] [Scilit]
- Sun, X.; Zheng, S.; Shen, L.; Qin, C.; Wang, J.; Zhou, L.; Mai, J.; Lu, M. Enhanced aerodynamic performance of irregular centrifugal fan casings through parametric and level-set topology optimization. Results Eng. 2025, 28, 107316. [Google Scholar] [CrossRef] [Scilit]
- Li, X.; Huang, N.; Han, W.; Tong, D.; Zhang, Y.; Zhang, J. Numerical investigation of the impact of intake pipelines on the performance and flow characteristics of a centrifugal compressor. J. Appl. Fluid Mech. 2025, 18, 1483–1501. [Google Scholar] [CrossRef] [Scilit]
- Chen, Z.; He, H.; Yang, H.; Wei, Y.; Zhang, W. Asymmetric flow in a double-suction centrifugal fan induced by an inclined impeller. Phys. Fluids 2024, 36, 017113. [Google Scholar] [CrossRef] [Scilit]
- Huang, J.-Y.; Zhang, K.; Li, H.-Y.; Wang, A.-R.; Yang, M. Numerical simulation of aerodynamic noise and noise reduction of range hood. Appl. Acoust. 2021, 175, 107806. [Google Scholar] [CrossRef] [Scilit]
- Li, J.; Qiang, X.; Teng, J.; Zhu, M.; Lu, S. Comparison of turbulence models for tip leakage flow of a large clearance compressor cascade with casing motion. Aerosp. Sci. Technol. 2025, 166, 110545. [Google Scholar] [CrossRef] [Scilit]
- Jia, X.; Nie, X.; Tu, B.; Cui, B. Flow characteristics of blade tip clearance in semi-open centrifugal pump in variable condition. Trans. Chin. Soc. Agric. Eng. 2015, 31, 91–96. [Google Scholar] [CrossRef]
- Cheng, K.; Chen, Y.; Meng, F.; Li, J. Effects of non-uniform tip clearance on the performance of a large axial-flow fan. J. Xi’an Jiaotong Univ. 2022, 56, 180–189. [Google Scholar] [CrossRef]
- Zhang, Y.; Chen, J.; Shu, Y.; Wang, Z.; Yang, H.; Wei, Y. Effects of inlet tip clearance on internal flow characteristic and aerodynamic performance of centrifugal compressor. J. Appl. Fluid Mech. 2025, 18, 274–289. [Google Scholar] [CrossRef] [Scilit]
- Ottersten, M.; Yao, H.-D.; Davidson, L. Inlet gap effect on aerodynamics and tonal noise generation of a voluteless centrifugal fan. J. Sound Vib. 2022, 540, 117304. [Google Scholar] [CrossRef] [Scilit]
- Zhang, X.; Gong, Y.; Chen, X.; Hu, L.; Xie, H.; Yang, H. Numerical investigation on the effects of gap circulating flow on blower performance under design and off-design conditions. Energies 2024, 17, 3617. [Google Scholar] [CrossRef] [Scilit]
- Fritsche, M.; Epple, P.; Delgado, A. Numerical and theoretical investigation of the gap flow in centrifugal fans for design and off-design conditions. J. Fluids Eng. 2023, 145, 031203. [Google Scholar] [CrossRef] [Scilit]
- Kirchhofer, M.; Krieger, M.; Hofer, D. A Comparative Study on Numerical Flow Simulations of a Centrifugal Electronic Cooling Fan Using Four Different Turbulence Models. Energies 2023, 16, 7864. [Google Scholar] [CrossRef] [Scilit]
- Yang, W.; Jiang, B.; Zhao, K.; Wang, J.; Li, B. Study on applicability of turbulence model in numerical simulation of multi-blade centrifugal fan. Fluid Mach. 2017, 45, 1–6+24. [Google Scholar] [CrossRef]
- Shim, H.S. Influence of impeller–diffuser side-gap flow with a simplified leakage model on the performance and internal flow of a centrifugal pump. Energies 2025, 18, 1278. [Google Scholar] [CrossRef] [Scilit]
- Hariharan, C.; Govardhan, M. Effect of inlet clearance gap on the performance of an industrial centrifugal blower with parallel wall volute. Int. J. Fluid Mach. Syst. 2013, 6, 113–120. [Google Scholar] [CrossRef] [Scilit][Green Version]
- Corsini, A.; Delibra, G.; Sheard, A.G. A critical review of computational methods and their application in industrial fan design. Int. Sch. Res. Not. 2013, 2013, 625175. [Google Scholar] [CrossRef] [Scilit]

Disclaimer/Publisher’s Note: The statements, opinions and data contained in all publications are solely those of the individual author(s) and contributor(s) and not of MDPI and/or the editor(s). MDPI and/or the editor(s) disclaim responsibility for any injury to people or property resulting from any ideas, methods, instructions or products referred to in the content. |
© 2026 by the authors. Licensee MDPI, Basel, Switzerland. This article is an open access article distributed under the terms and conditions of the Creative Commons Attribution (CC BY) license.