


Abstract
Room-average reverberation time (RT) is commonly used to assess acoustic conditions in existing sports halls. Still, it provides limited guidance on where additional measurements or retrofit investigations should be prioritised. This study develops and demonstrates an auditable acoustic performance decision framework using measurements from four school sports halls in Amman, Jordan. The framework separates five decision dimensions: benchmark-relative performance deficit, receiver-level and octave-band heterogeneity, spectral behaviour, first-order intervention burden, and evidence quality. Octave-band RT and descriptive unoccupied sound pressure-level data were available at three receiver positions from 125 to 8000 Hz. Mid-frequency RT (Tmf; 500, 1000, and 2000 Hz) was compared with the BB93 refurbishment benchmark, with leave-one-receiver-out sensitivity and data-quality checks used to test the stability of the diagnosis. All four halls exceeded Tmf = 2.0 s (2.50–3.11 s). Case 1 showed the largest deficit (~56%) and Tmf receiver variability (~25%); Cases 2 and 3 showed moderate deficits with low variability; and Case 4 combined the smallest mean deficit with the highest mean bandwise variability (~15%). The framework converts measurement data into explicit case-specific next actions for measurement and retrofit development while making evidence quality visible.
1. Introduction
Acoustic performance is an integral component of indoor environmental quality in sports facilities, where large room volumes, extensive hard finishes, and long source–receiver distances can prolong sound decay and compromise speech communication [1,2,3]. In physical education teaching, verbal instruction must remain intelligible while activity-related sound is often high. Measurements in school sports halls and larger multi-hall investigations have documented prolonged reverberation, spatially variable acoustic conditions, and difficulties in speech communication [4,5,6]. Recent occupational health evidence also indicates elevated risks of voice and hearing disorders among specialist physical education teachers [7]. An integrative review of educational-building acoustics likewise identifies acoustic conditions, occupant performance, and health as major research themes and calls for stronger evaluation and improvement methods [8]. From an architectural-engineering perspective, these outcomes represent building performance problems shaped by enclosure scale, geometry, material selection, and the distribution of acoustic absorption.
Building performance evaluation provides a useful framework for interpreting measured indoor conditions as evidence of how a building performs rather than as isolated test results. Indoor environmental quality is commonly understood as a multi-domain construct that includes acoustic conditions alongside thermal, visual, and indoor air quality performance [9,10,11]. A recent mixed-method systematic review further characterises IEQ as a multidisciplinary field and identifies cross-domain interactions as an area requiring greater integration [12]. Within that broader context, the present study treats acoustics as a domain-specific building performance module: it documents architectural context, quantifies the measured state, identifies benchmark-relative performance gaps, characterises receiver-level variability, and translates those observations into explicit retrofit follow-up decisions.
Reverberation time is the most widely reported descriptor in sports hall studies because it is comparatively simple to measure and directly reflects the balance between room volume and sound absorption. However, RT alone cannot fully represent acoustic building performance. Speech intelligibility also depends on source level, background noise, source–receiver geometry, early-to-late energy balance, and source orientation [13,14,15]. Ren, Liu [14] showed in two university classrooms that changing speaker orientation altered speech level by up to 3 dBA and the Speech Transmission Index (STI) by up to 0.11; acoustic treatment improved speech-intelligibility scores by 5–10%. Yang and Mak [15] likewise demonstrated, across secondary school and university classrooms, that signal to noise ratio (SNR), early decay time (EDT), and clarity (C80) provide complementary information when explaining speech intelligibility at different listening positions. Jurak, Kovač [4] measured 35 school sports halls in Slovenia and reported poor or only satisfactory speech intelligibility in 86% of the sample, while Del Brenna [16] found that fewer than half of 18 measured sports halls met the applicable regulation limits and that some halls failing RT limits nevertheless exhibited a comparatively better STI. Measurements in 29 sports halls have likewise combined T20 with sound strength and the STI, showing relationships among equivalent absorption, sound strength, and speech-related performance [5]. Broader architectural-acoustics synthesis argues that acoustic evidence should be incorporated into built-environment decision processes [17]. At the same time, a recent systematic review of educational spaces identifies reverberation time, background noise, SNR, speech transmission, and speech clarity as complementary acoustic performance descriptors linked to design enablers [18]. Recent multi-criteria acoustic-design research similarly treats reverberation, clarity, definition, and sound distribution as complementary performance dimensions rather than a single optimisation target [19]. Together, this evidence supports a performance diagnosis that retains RT but does not reduce the condition of the building to a single room-average value.
A further complication is that sports halls frequently violate the diffuse-field assumptions underlying simple Sabine-type prediction. Absorption is often concentrated at the ceiling while lower walls and floors remain reflective, allowing flutter echoes and position-dependent decay behaviour. Comparative modelling has shown that diffuse-field methods can deviate from measured sports hall responses when absorption is strongly non-uniform [20]. At the same time, scale-model work has demonstrated that profiled ceilings can alter low-frequency reverberation through scattering and geometry-dependent effects [21]. Large in situ datasets likewise emphasise that the location of absorbing surfaces matters, not only the total amount of absorption [6].
The benchmark itself also requires careful interpretation. Building Bulletin 93 (BB93) provides school acoustics performance criteria in the United Kingdom, including a refurbishment maximum for indoor sports halls. In contrast, ASA/ANSI S12.60-2019/Part 4 (R2024) is specifically directed at physical education teaching environments and includes criteria and guidance for reverberation and source background noise [22,23]. DIN 18041:2016 likewise treats sports halls as rooms in which speech communication over medium and large distances is important and explicitly covers sports halls and indoor swimming pools up to approximately 30,000 m3 [24]. The existence of multiple national criteria reflects different regulatory contexts and design philosophies rather than a single universal sports hall limit; Lüthi and Desarnaulds [6] similarly documented substantial variation across 12 standards and recommendations. Accordingly, any external benchmark used in a Jordanian case study must be identified as a comparison framework rather than a local statutory requirement.
Retrofit design therefore requires more than adding a nominal quantity of absorber. Absorption coefficients vary with frequency, specimen configuration, mounting depth, backing, perforation ratio, and construction [25,26,27,28]. ISO 354 measurements characterise test assemblies in a reverberation room and are valuable for comparison and design calculation, but they do not guarantee identical installed performance in a non-diffuse sports hall field [28]. Recent gymnasium renovation research has moved toward calibrated room acoustic models, comparison of alternative schemes, implementation, and post-renovation verification [29]. For preliminary diagnosis, however, transparent first-order calculations can still be useful when their assumptions and limitations are explicit and when they are not presented as validated predictions.
Evidence Base from Sports Hall Measurements and Standards
Field evidence from sports and physical education spaces consistently shows that reverberation problems are not isolated to one country or building type. Del Brenna [16] assessed 18 sports halls across 14 facilities using reverberation time, the Speech Transmission Index (STI), and weighted noise level, illustrating the value of combining decay, intelligibility, and noise descriptors. Lüthi and Desarnaulds [6] subsequently compared 12 standards/recommendations and assembled in situ data from 52 sports halls, while Wenmaekers, van Hout [5] measured 29 sports halls using T20, sound strength, the STI, room volume, and equivalent absorption. Taken together, these earlier investigations and more recent multi-hall studies [5,6] demonstrate that prolonged reverberation remains an important concern in sports facilities while highlighting the limitations of characterising acoustic conditions through room-average RT alone. Subsequent research has examined receiver-dependent reverberation behaviour [30] and extended retrofit assessment towards calibrated modelling and post-renovation verification [29]. These developments provide the basis for positioning the present study as a pre-retrofit diagnostic investigation rather than a complete acoustic characterisation or a validated retrofit intervention.
Spatial non-uniformity is particularly relevant when only a few receiver positions are available. Still, a limited receiver set should not be interpreted as a complete map of the room field. Recent room acoustic research has shown that frequency-dependent RT can vary with position and that source/receiver selection affects estimates of spatially averaged decay, especially at low frequencies [30]. Field measurements have documented flutter echoes in sports halls [5]. Acoustic modelling and scale-model investigations have also demonstrated the influence of non-diffuse sound propagation, absorption distribution, and profiled-ceiling geometry on acoustic behaviour [20,21]. The present analysis therefore treats spatial dispersion as an observed property of the P1–P3 measurements, not as a complete spatial characterisation of each hall.
The literature also shows that the consequences extend beyond a purely technical room acoustics problem. Ryan and van der Mars [31] describe the rationale for the physical education-specific ANSI/ASA S12.60 standard, which treats reverberation and background noise as distinct design concerns. In a representative sample of 858 teachers, Markelj, Kovač [7] found that specialist physical education teachers had elevated risks of hearing disorders and hoarseness relative to other teacher groups. More recently, Huang, Liang [32] combined measurements and questionnaires in six indoor badminton gyms with 527 participants and found that sound pressure level alone had limited explanatory power for perceived acoustic comfort. A complementary user-centred study in the same venue type used online review evidence to show that acoustic perception can be embedded in broader functional and experiential evaluations of indoor badminton venues rather than appearing only as explicit noise complaints [33]. These studies support a multi-layer interpretation in which reverberation, noise, spatial distribution, speech communication, and user response are related but not interchangeable outcomes.
Retrofit studies also suggest a progression in methodological strength. Alibaba and Ozdeniz [34] combined unoccupied measurements with room acoustic simulation for a multipurpose university hall, while Wang, Ma [29] coupled field measurements, calibrated ODEON simulation, scheme comparison, implementation, and post-renovation verification. The present study instead focuses on diagnostic assessment and retrofit prioritisation, with screening calculations intentionally separated from validated retrofit prediction.
Jordan provides an important regional context but remains comparatively under-documented. Hammad [35] reported the acoustic design and outcome of the Amman Sport Arena. Al-Arja [36] subsequently measured 20 indoor sports and gymnasium halls in Amman and reported reverberation times from 1.09 to 5.38 s together with activity noise levels of 80–110 dB(A), demonstrating that long reverberation and high activity noise are not isolated problems in the local building stock. The present study focuses on four school multi-sport halls measured while unoccupied—but retains position-level octave-band RT data that allow a transparent analysis of spectral behaviour and spatial variability.
Against this background, the research problem addressed in the present study is how a restricted set of measured acoustic data can be interpreted to identify transparent, case-specific follow-up actions before retrofit interventions are selected. The study demonstrates a structured diagnostic workflow rather than proposing a new acoustic performance indicator or claiming validated retrofit outcomes. Instead of aggregating the available evidence into a single score, the framework presents five decision dimensions: (1) benchmark-relative acoustic performance deficit; (2) observed receiver-level and octave-band variability; (3) low-, mid-, and high-frequency RT contrasts; (4) first-order intervention burden in absolute and floor-area-normalised terms; and (5) robustness and evidence quality considerations. These dimensions are not assumed to be statistically independent; rather, they provide different, partly related interpretations of the measured data and architectural context. Their combined interpretation supports differentiation of follow-up requirements that would not necessarily be apparent from room-average RT alone.
Three questions guide the analysis: (1) how do the four halls differ in benchmark-relative Tmf, spectral pattern, and receiver-level variability; (2) how robust are those case-level diagnoses to receiver omission and data quality considerations; and (3) what scale of first-order intervention burden is indicated when the measured acoustic deficit is interpreted together with architectural context? The workflow is designed to identify the most appropriate next step for each case, from measurement to frequency-resolved modelling and retrofit development.
2. Materials and Methods
This study is a multi-case diagnostic study of four indoor school multi-sport halls in Amman, Jordan. The halls span volumes from 817 to 20,736 m3 and differ in height, glazing proportion, and principal interior finishes, providing a heterogeneous architectural testbed for the decision framework. The analysis followed five stages: (1) documentation of building-scale and material characteristics; (2) analysis of RT and unoccupied octave-band sound pressure-level data at three receiver positions; (3) derivation of benchmark-relative, spectral, and receiver-level performance indicators; (4) robustness and data quality checks; and (5) first-order screening of retrofit intervention burden. The hall is the case-level unit of comparison. The three receiver positions are repeated measurement locations within each hall and are not treated as independent experimental replicates. Accordingly, the analysis is descriptive and diagnostic rather than inferential: it is intended to support case-specific performance assessment and follow-up design decisions, not population estimates for Jordanian sports halls.
2.1. Description of the Case Study Sports Halls
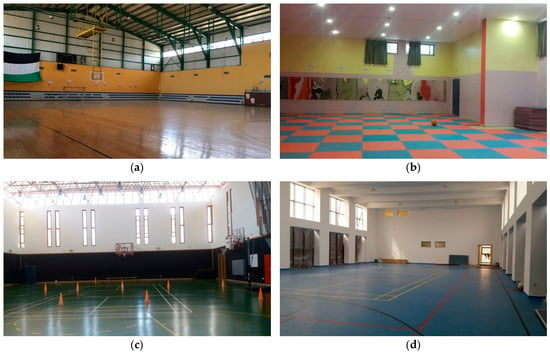
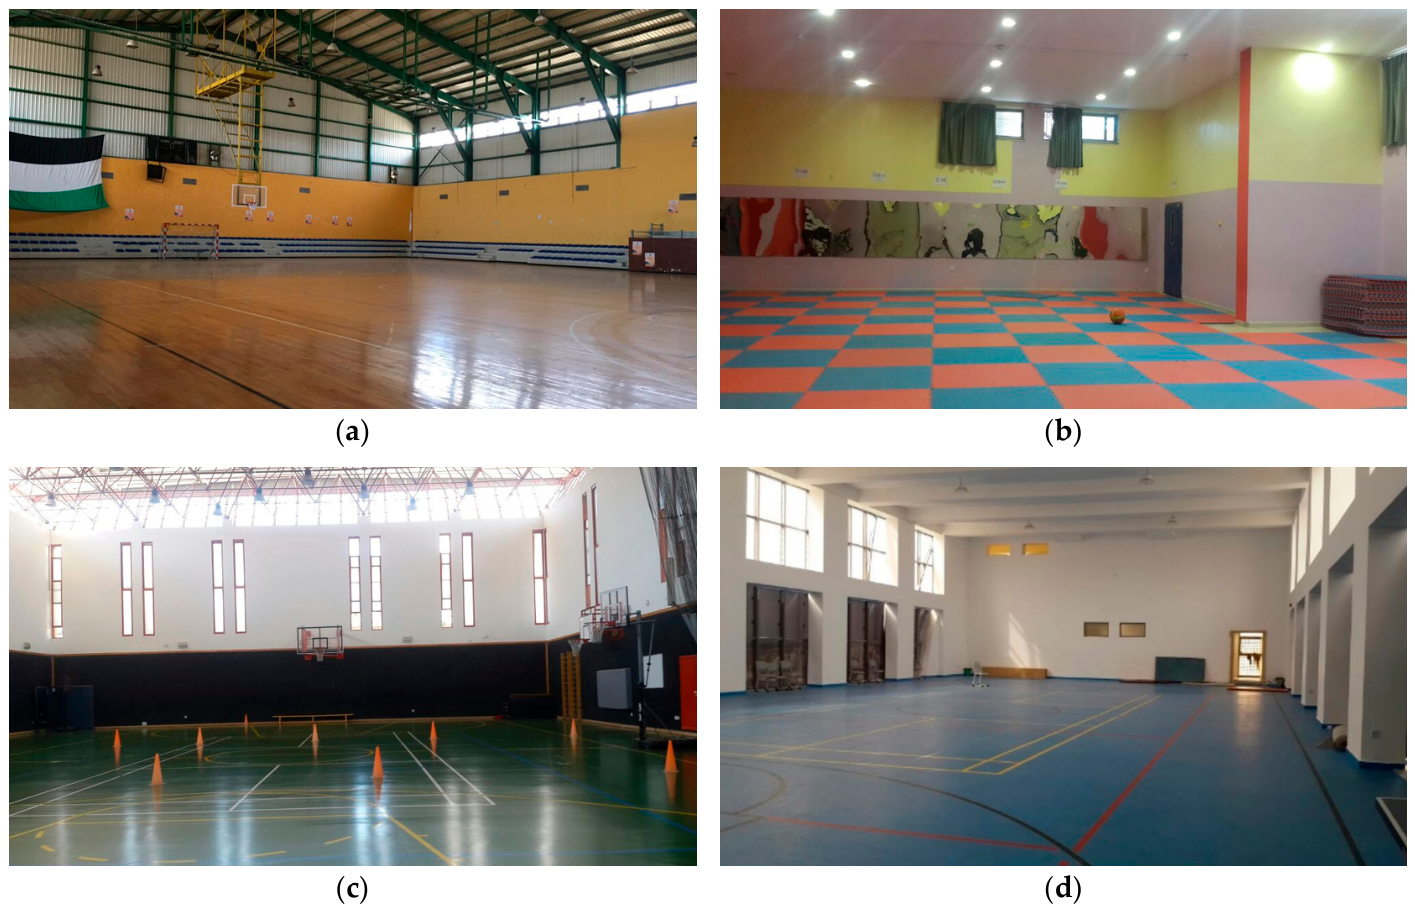
The four halls differed substantially in dimensions, volume, glazing proportion, and interior finish. Their principal architectural characteristics are summarised in Table 1, and Figure 1 illustrates the interior configuration of each case.
Table 1.
Architectural characteristics of the four case study sports halls.
Figure 1.
Interior views of the four indoor sports halls included in the field investigation: (a) Case 1, Tla’a Al-Ali; (b) Case 2, Al-Ridwan; (c) Case 3, Amman Academy; and (d) Case 4, Al Hasad.
2.2. Acoustic Performance Diagnostic Framework for Building Performance Assessment
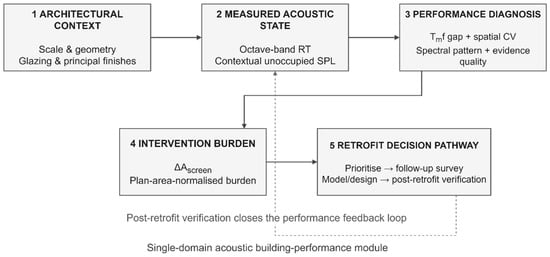
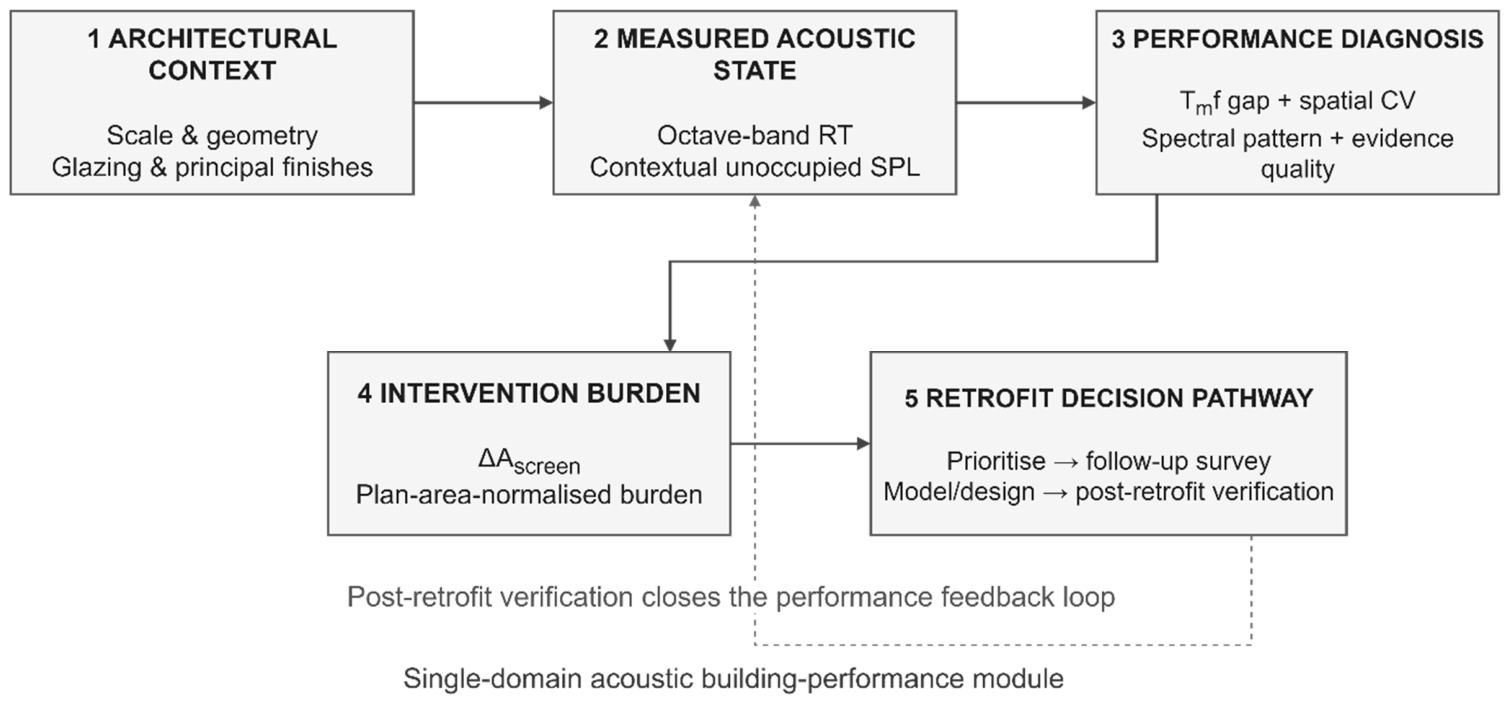
To connect room acoustic evidence with building performance decision making, the analysis was organised as a decision-oriented acoustic performance pathway (Figure 2). The first layer documents architectural context—room scale, geometry, glazing, and principal finishes—because these conditions define the enclosure in which acoustic performance emerges. The second layer retains the measured acoustic state (octave-band RT and descriptive unoccupied SPL). The third layer translates the measurements into distinct diagnostics: benchmark-relative Tmf deficit, observed receiver-level heterogeneity, spectral contrasts, and evidence quality/receiver sensitivity checks. The fourth layer estimates first-order intervention burden through ΔAscreen and plan-area normalisation. The final layer converts those diagnostics into a staged decision pathway: prioritise follow-up survey, then progress to frequency-resolved modelling or design, certified material specification, installation, and post-retrofit verification.
Figure 2.
Acoustic performance diagnostic pathway linking architectural context, measured acoustic state, performance deficit and receiver-level heterogeneity, intervention burden, and performance-based retrofit decision making. Solid arrows indicate the sequence of diagnostic stages, while the dashed line represents the post-retrofit verification feedback loop.
2.3. Acoustic Performance Criteria and Calculation Methods
Acoustic performance was evaluated using octave-band RT and unoccupied sound pressure-level records from 125 to 8000 Hz. The sound-level data are reported as descriptive octave-band SPLs and are not used for formal environmental noise assessment. This distinction is important: activity noise exposure in occupied sports halls can be substantially higher than unoccupied room levels and is governed by different assessment criteria [23,36].
Reverberation time is used as the principal acoustic indicator for the present preliminary assessment, but it does not provide a comprehensive description of room acoustic quality. Complementary parameters, including clarity (C50/C80), definition (D50), and sound strength (G), provide additional information on the temporal distribution of sound energy and the strength of the sound field [5,18,19]. However, the retained dataset does not contain the time-resolved room impulse responses required to derive clarity and definition reliably or the appropriately referenced and calibrated measurements necessary to calculate sound strength. Consequently, these parameters cannot be reconstructed reliably from the available octave-band RT and descriptive SPL records. This study therefore focuses on RT-based diagnostic screening while recognising the need for complementary acoustic measurements in subsequent investigations.
Reverberation time describes the decay of sound energy after the source is interrupted and is conventionally normalised to a 60 dB decay. The measured decay parameter is referred to as reverberation time (RT) throughout the study. ISO 3382-2:2008 specifies procedures, apparatus, measurement positions, data evaluation, and reporting for RT in ordinary rooms, but it does not prescribe a target RT [37]. For these existing school sports halls, BB93 is used as a traceable external refurbishment benchmark because it defines Tmf as the arithmetic mean of the 500, 1000, and 2000 Hz RT values and specifies a refurbishment limit of Tmf ≤ 2.0 s for indoor sports halls [22]. ASA/ANSI S12.60-2019/Part 4 (R2024) provides complementary physical education-specific guidance and is used here for contextual comparison rather than compliance assessment [23,31]. The investigated halls are assessed in their existing function as school sports facilities used for physical education and related activities; no change of use is proposed. The BB93 refurbishment threshold of Tmf ≤ 2.0 s is adopted as an external reference for preliminary reverberation-time diagnosis rather than as a universally optimal target or a statutory requirement in Jordan. Exceeding this benchmark indicates a reverberation-related performance deficit requiring further investigation, whereas meeting it alone would not demonstrate adequate speech intelligibility or acoustic suitability for every activity. For preliminary absorption screening, the relationship between reverberation time, room volume, and equivalent sound absorption area was expressed using the Sabine equation:
where
T = 0.161 V/A
T is the reverberation time in seconds.
V is the room volume in cubic metres.
A is the total equivalent absorption area of the room (m2 sabin).
Tmf = (RT500 + RT1000 + RT2000)/3
ΔAscreen = 0.161 V (1/Ttarget − 1/Tmf)
For each hall, Tmf was calculated as the arithmetic mean of the spatially averaged RT values at 500, 1000, and 2000 Hz (Equation (2)), consistent with the BB93 definition [22]. A first-order additional-absorption screening index was then obtained by rearranging the Sabine relation (Equation (3)), with Ttarget = 2.0 s [25,26]. This provides a transparent scale estimate of the extra equivalent absorption associated with reducing the single mid-frequency indicator from the measured Tmf to the adopted benchmark. The resulting ΔAscreen is a first-order, geometry-dependent screening indicator derived from the measured Tmf and hall volume, rather than an independently measured absorption requirement or a prediction of installed retrofit performance. Normalising this value by floor area facilitates comparisons between the investigated cases but does not eliminate the influence of room geometry, particularly height. Furthermore, the Sabine-based calculation assumes an approximately diffuse sound field and does not account for the frequency-dependent performance or mounting configuration of specific absorbing assemblies. Accordingly, ΔAscreen is used only for preliminary comparative screening, while the octave-band RT measurements remain the primary acoustic evidence.
2.4. Measurement Equipment and Field Procedure
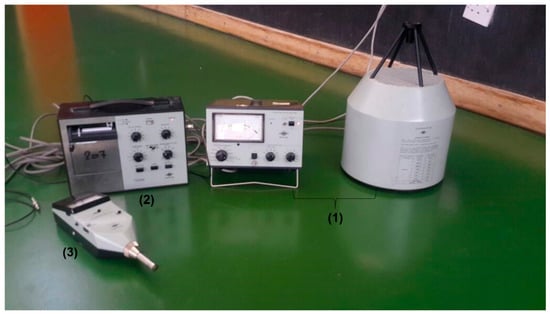
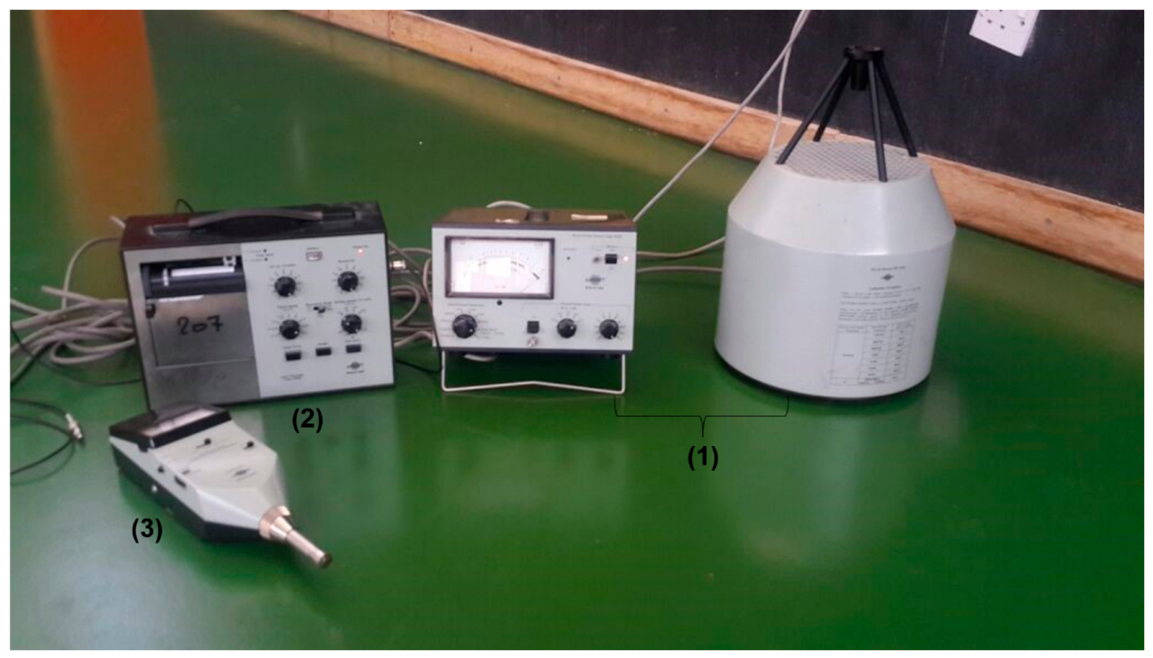
Measurements were conducted in one-octave bands from 125 to 8000 Hz. A Brüel & Kjær Type 4205 sound-power source, a Brüel & Kjær Type 2306 level recorder (Brüel & Kjær, Nærum, Denmark), and a sound-level meter/octave-band analyser were used to generate the test signal, record sound levels, and determine the octave-band acoustic response (Figure 3). Manufacturer documentation identifies the Type 4205 as a selectable wide-band/octave-band noise source suitable for measurements, including reverberation time [38].
Figure 3.
Measurement equipment: (1) Brüel & Kjær Type 4205 sound-power source; (2) Type 2306 level recorder; and (3) sound-level meter/octave-band analyser.
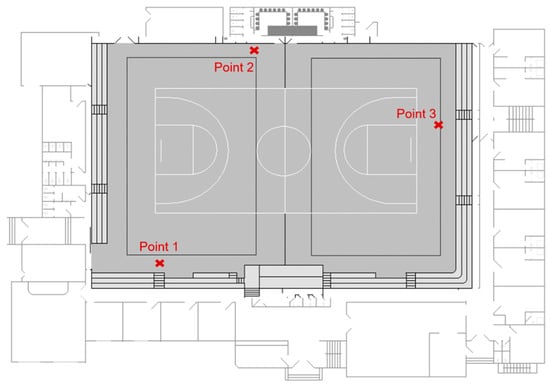
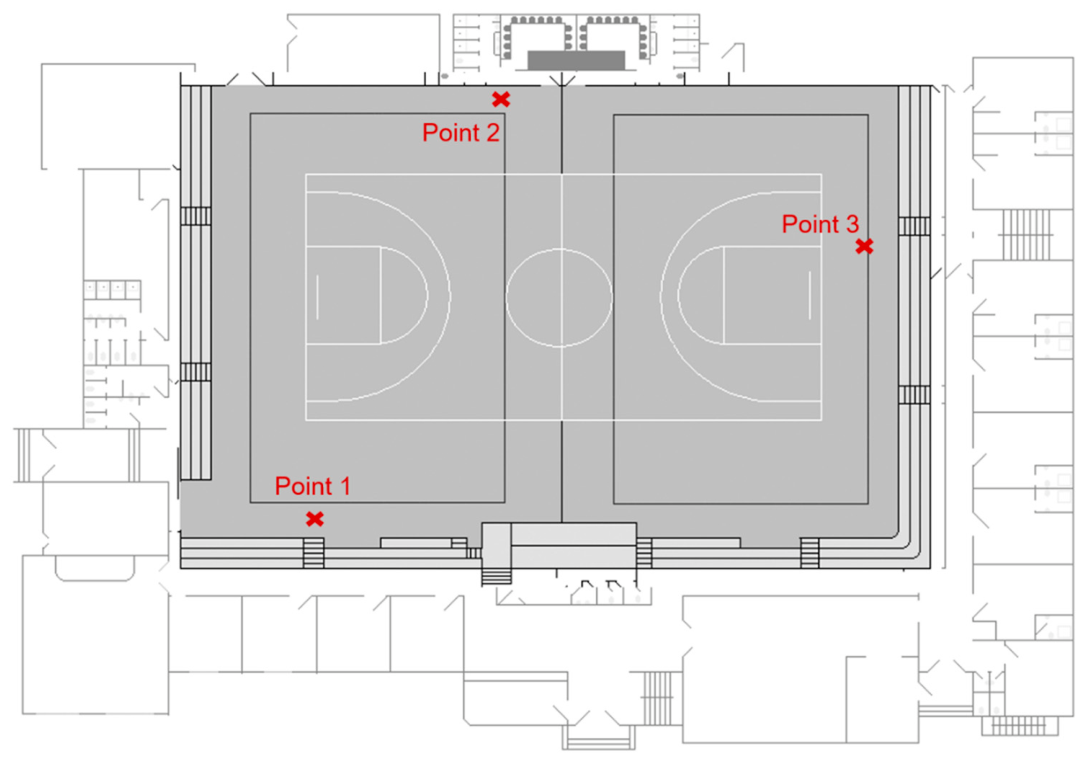
Field measurements were undertaken during school hours (08:00–14:00) while the halls were unoccupied. During the measurement procedure, the sound source was repositioned among three measurement locations. The retained acoustic dataset comprises measurements at three receiver positions (P1–P3) in each hall, with the microphone positioned 1.5 m above floor level. Reverberation time and unoccupied octave-band sound pressure levels were recorded across the 125–8000 Hz frequency range. The receiver positions were distributed across different parts of the hall, as illustrated in Figure 4, to obtain an initial comparison of receiver-dependent acoustic behaviour rather than repeated observations from one local area. The arrangement was intended for preliminary diagnostic assessment, not comprehensive spatial mapping. The measurement records do not preserve the complete source–receiver pairings, the number of independent measurement combinations, repeated decay counts, or dimensioned source and receiver coordinates. Consequently, the exact separation distances from reflecting surfaces and between sources and receivers cannot be verified, nor can full compliance with a specific ISO 3382-2:2008 measurement procedure be established. ISO 3382-2:2008 is therefore used as an international methodological reference for measurement and reporting [37], rather than as evidence of verified compliance or a statutory requirement in Jordan.
Figure 4.
Schematic representation of the three receiver locations used in the field measurements (not to scale).
2.5. Data Processing and Descriptive Variability
For each hall and octave band, the mean and sample standard deviation were calculated across P1–P3. A receiver-specific Tmf was then calculated from the 500, 1000, and 2000 Hz values, and hall Tmf was taken as the arithmetic mean of the three receiver-specific values. The resulting sample standard deviation describes variability among the three receiver positions; with only three receivers, it is treated as a descriptive dispersion indicator rather than a complete spatial-field characterisation, measurement uncertainty, or confidence interval. Throughout this study, receiver-level variability refers to differences among the recorded P1–P3 measurements. Because the complete source–receiver combinations were not retained, these differences cannot be attributed exclusively to receiver location; variations in source placement may also have contributed. The reported variability indicators are therefore interpreted descriptively rather than as isolated measures of receiver-position effects.
Additional descriptive indicators were derived from the data. Receiver-level Tmf range was retained to show the spread between the least and most reverberant measured positions, and the receiver-level coefficient of variation (CV = SD/Tmf × 100) expressed that spread relative to the hall mean. Benchmark exceedance was calculated as 100(Tmf/2.0 − 1). The first-order Sabine screening index followed Equation (3) and was normalised by hall floor area to express nominal intervention burden per unit plan area. This normalisation is not size-independent because V/floor area approximately reflects mean room height; it is therefore interpreted as an intervention-intensity proxy, not a pure severity index. Frequency-specific receiver-to-receiver non-uniformity was described using a bandwise CV at each octave band, with the mean of the seven bandwise CVs retained as a compact whole-spectrum descriptor. Two exploratory spectral contrasts were also calculated: ΔTmid–low = Tmf − mean(RT125, RT250) and ΔTmid–high = Tmf − mean(RT4000, RT8000). Positive values indicate a mid-frequency elevation relative to the corresponding low- or high-frequency region. These contrasts are descriptive rather than standardised acoustic indices. To enable comparison across the three diagnostic indicators, benchmark exceedance, receiver-level Tmf CV, and ΔA_screen/A_floor were each independently max-normalised by dividing the value for each hall by the maximum observed value for that indicator across the four halls. The resulting values range from 0 to 1 and are used solely for relative comparison within the dataset; they do not constitute a composite performance score.
2.6. Robustness and Data Quality Checks
Two sensitivity checks were used to assess whether the main diagnostic interpretation depended disproportionately on a single receiver. First, receiver-specific Tmf values were summarised by both their arithmetic mean and median. Second, a leave-one-receiver-out (LOO) Tmf was recalculated three times per hall using each possible pair of receiver-specific Tmf values; the resulting minimum–maximum LOO range indicates how much the hall-level Tmf changes when any one receiver is omitted. These checks are descriptive and do not create additional independent observations, but they provide a direct robustness test for the three-position dataset. Evidence quality was additionally assessed by auditing the availability of key measurement metadata, including environmental conditions, source geometry, repeat-decay counts, instrumentation class, calibration history, and RT estimator.
The data quality review also considered whether the retained measurement records included background noise levels paired with individual RT measurements, corresponding excitation levels, and time-resolved decay information. These records were insufficient to assess the available decay range relative to the noise floor or to quantify the influence of background noise on individual RT estimates. Consequently, no measurement-specific signal-to-noise ratios or noise-related corrections were calculated. This limitation was retained within the evidence quality assessment rather than converted into an additional quantitative diagnostic indicator.
3. Results
3.1. Field Measurements
RT was available at three receiver positions (P1–P3) in each hall at 125, 250, 500, 1000, 2000, 4000, and 8000 Hz. Table 2 reports the position-level RT dataset used in the analysis. Spatial means and standard deviations were calculated from these values for the derived analyses below. Case 1 has a pronounced mid-frequency peak, with one position at 4.00 s Tmf and the other two at approximately 2.70 and 2.63 s. Cases 2 and 3 are considerably more uniform, while Case 4 shows intermediate spatial spread and stronger low-frequency position dependence. These patterns are examined through the frequency-resolved and receiver-sensitivity analyses below.
Table 2.
Octave-band reverberation-time values (s) at the three receiver positions.
3.2. Frequency-Resolved RT Patterns and Receiver-Level Variability
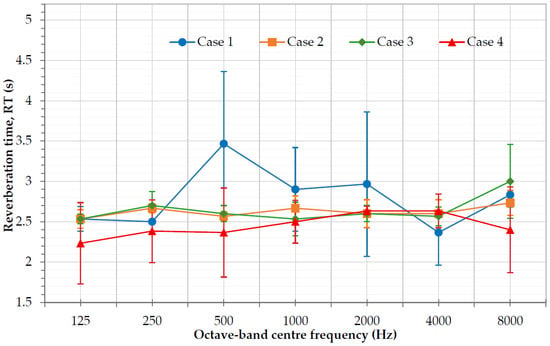
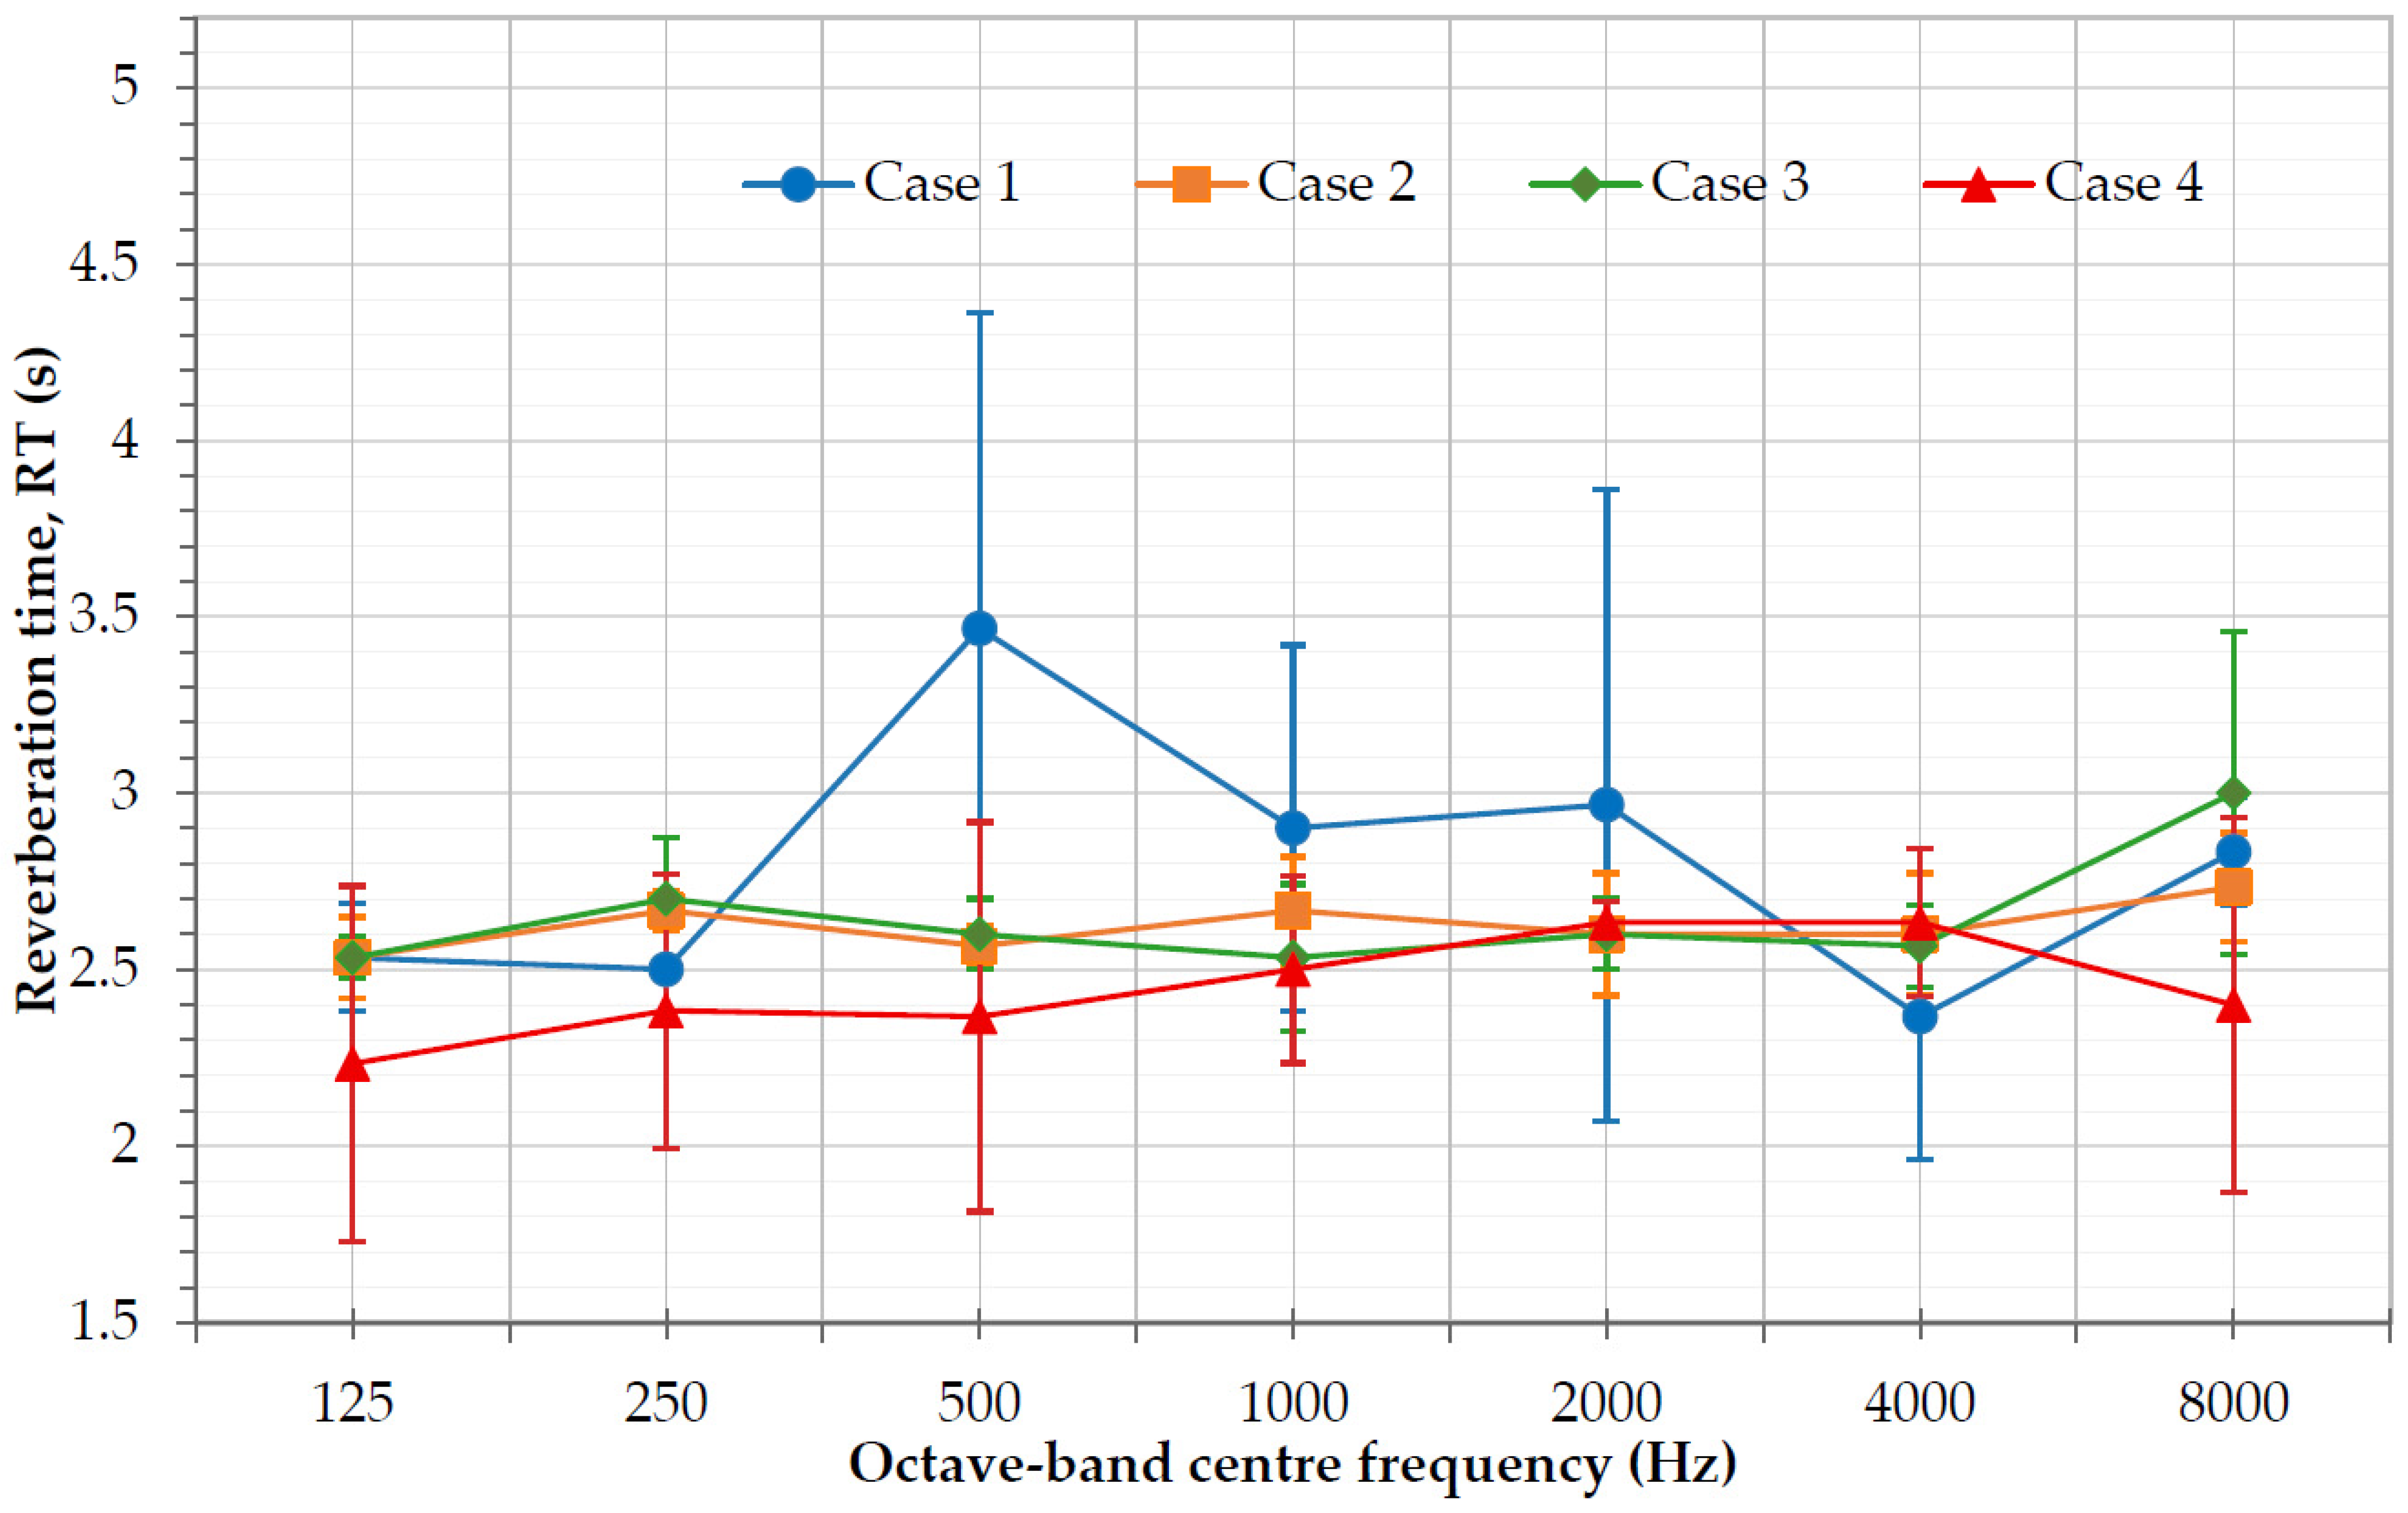
Figure 5 summarises the spatial mean RT spectrum with ±1 sample SD across the three receiver positions. Case 1 exhibits a mid-frequency elevation, with mean RT values of approximately 3.47 s at 500 Hz, 2.90 s at 1000 Hz, and 2.97 s at 2000 Hz. Its spatial SD reaches approximately 0.90 s at 500 and 2000 Hz. By contrast, Cases 2 and 3 remain close to 2.5–2.7 s through most of the speech frequency range and show much smaller spatial dispersion. Case 4 is lower on average but more variable at 125–500 Hz. The frequency-dependent spread supports the view that a single room-average RT does not fully describe these halls.
Figure 5.
Spatially averaged reverberation-time spectra with ±1 sample SD across the three receiver positions.
A simple descriptive spectral contrast further separates the four cases. In Case 1, the mean Tmf exceeds the average of the 4000 and 8000 Hz RT values by about 0.51 s and exceeds the 125–250 Hz mean by about 0.59 s. By contrast, Cases 2–4 have mid–high contrasts from approximately −0.21 to −0.02 s and mid–low contrasts from approximately −0.04 to 0.19 s. These contrasts are not standardised acoustic indices; they are reported only to demonstrate that the main problem in Case 1 is a distinct mid-frequency build-up rather than uniformly long decay across the entire measured spectrum. For retrofit development, this pattern indicates that follow-up measurements and treatment testing in Case 1 should resolve the 500–2000 Hz range explicitly while also checking the receiver spread at 4000 Hz rather than assuming a uniform broadband problem.
3.3. Benchmark-Relative Performance Deficit
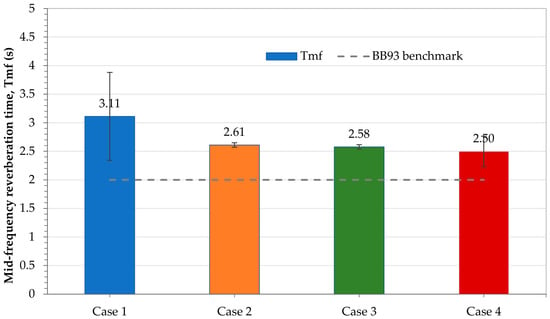
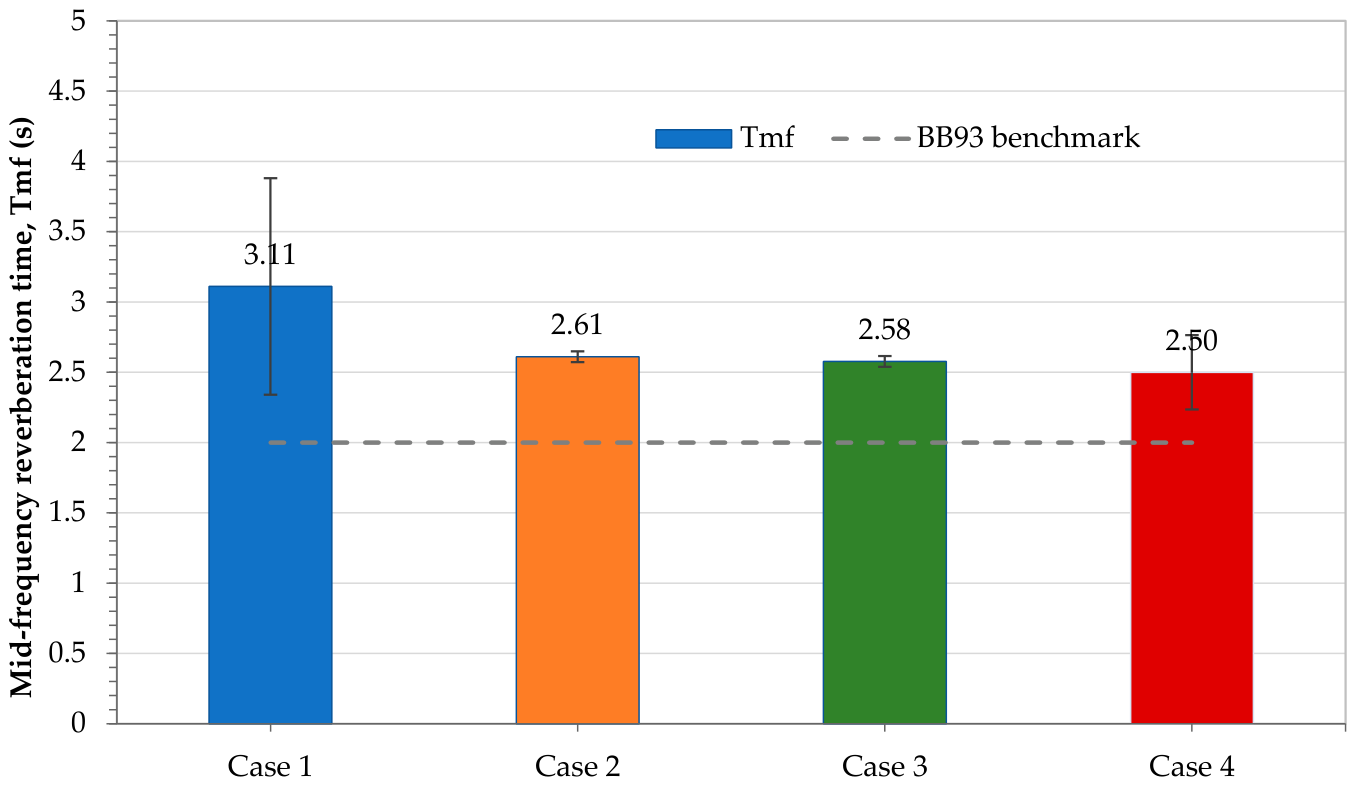
Figure 6 compares hall Tmf with the BB93 refurbishment benchmark. All four cases exceed 2.0 s, but the magnitude of the deficit is not uniform: Case 1 is approximately 56% above the benchmark, while Cases 2–4 are approximately 25–31% above it. The descriptive error bars are receiver-level SDs, not confidence intervals. The contrast between mean Tmf and receiver-level SD is important: Case 1 is both more reverberant and more variable across the three observed receivers than Cases 2 and 3, while Case 4 has a lower mean but greater receiver variability than those two cases. Mean benchmark exceedance and receiver-level dispersion should therefore be considered together when planning follow-up measurement density and potential treatment distribution.
Figure 6.
Measured mid-frequency reverberation time (Tmf) with ±1 sample SD across receivers, compared with the BB93 refurbishment benchmark of 2.0 s. Error bars are descriptive, not confidence intervals.
3.4. Unoccupied Octave-Band Sound Pressure-Level Profiles
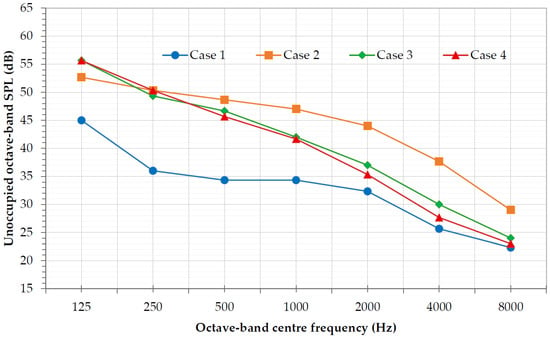
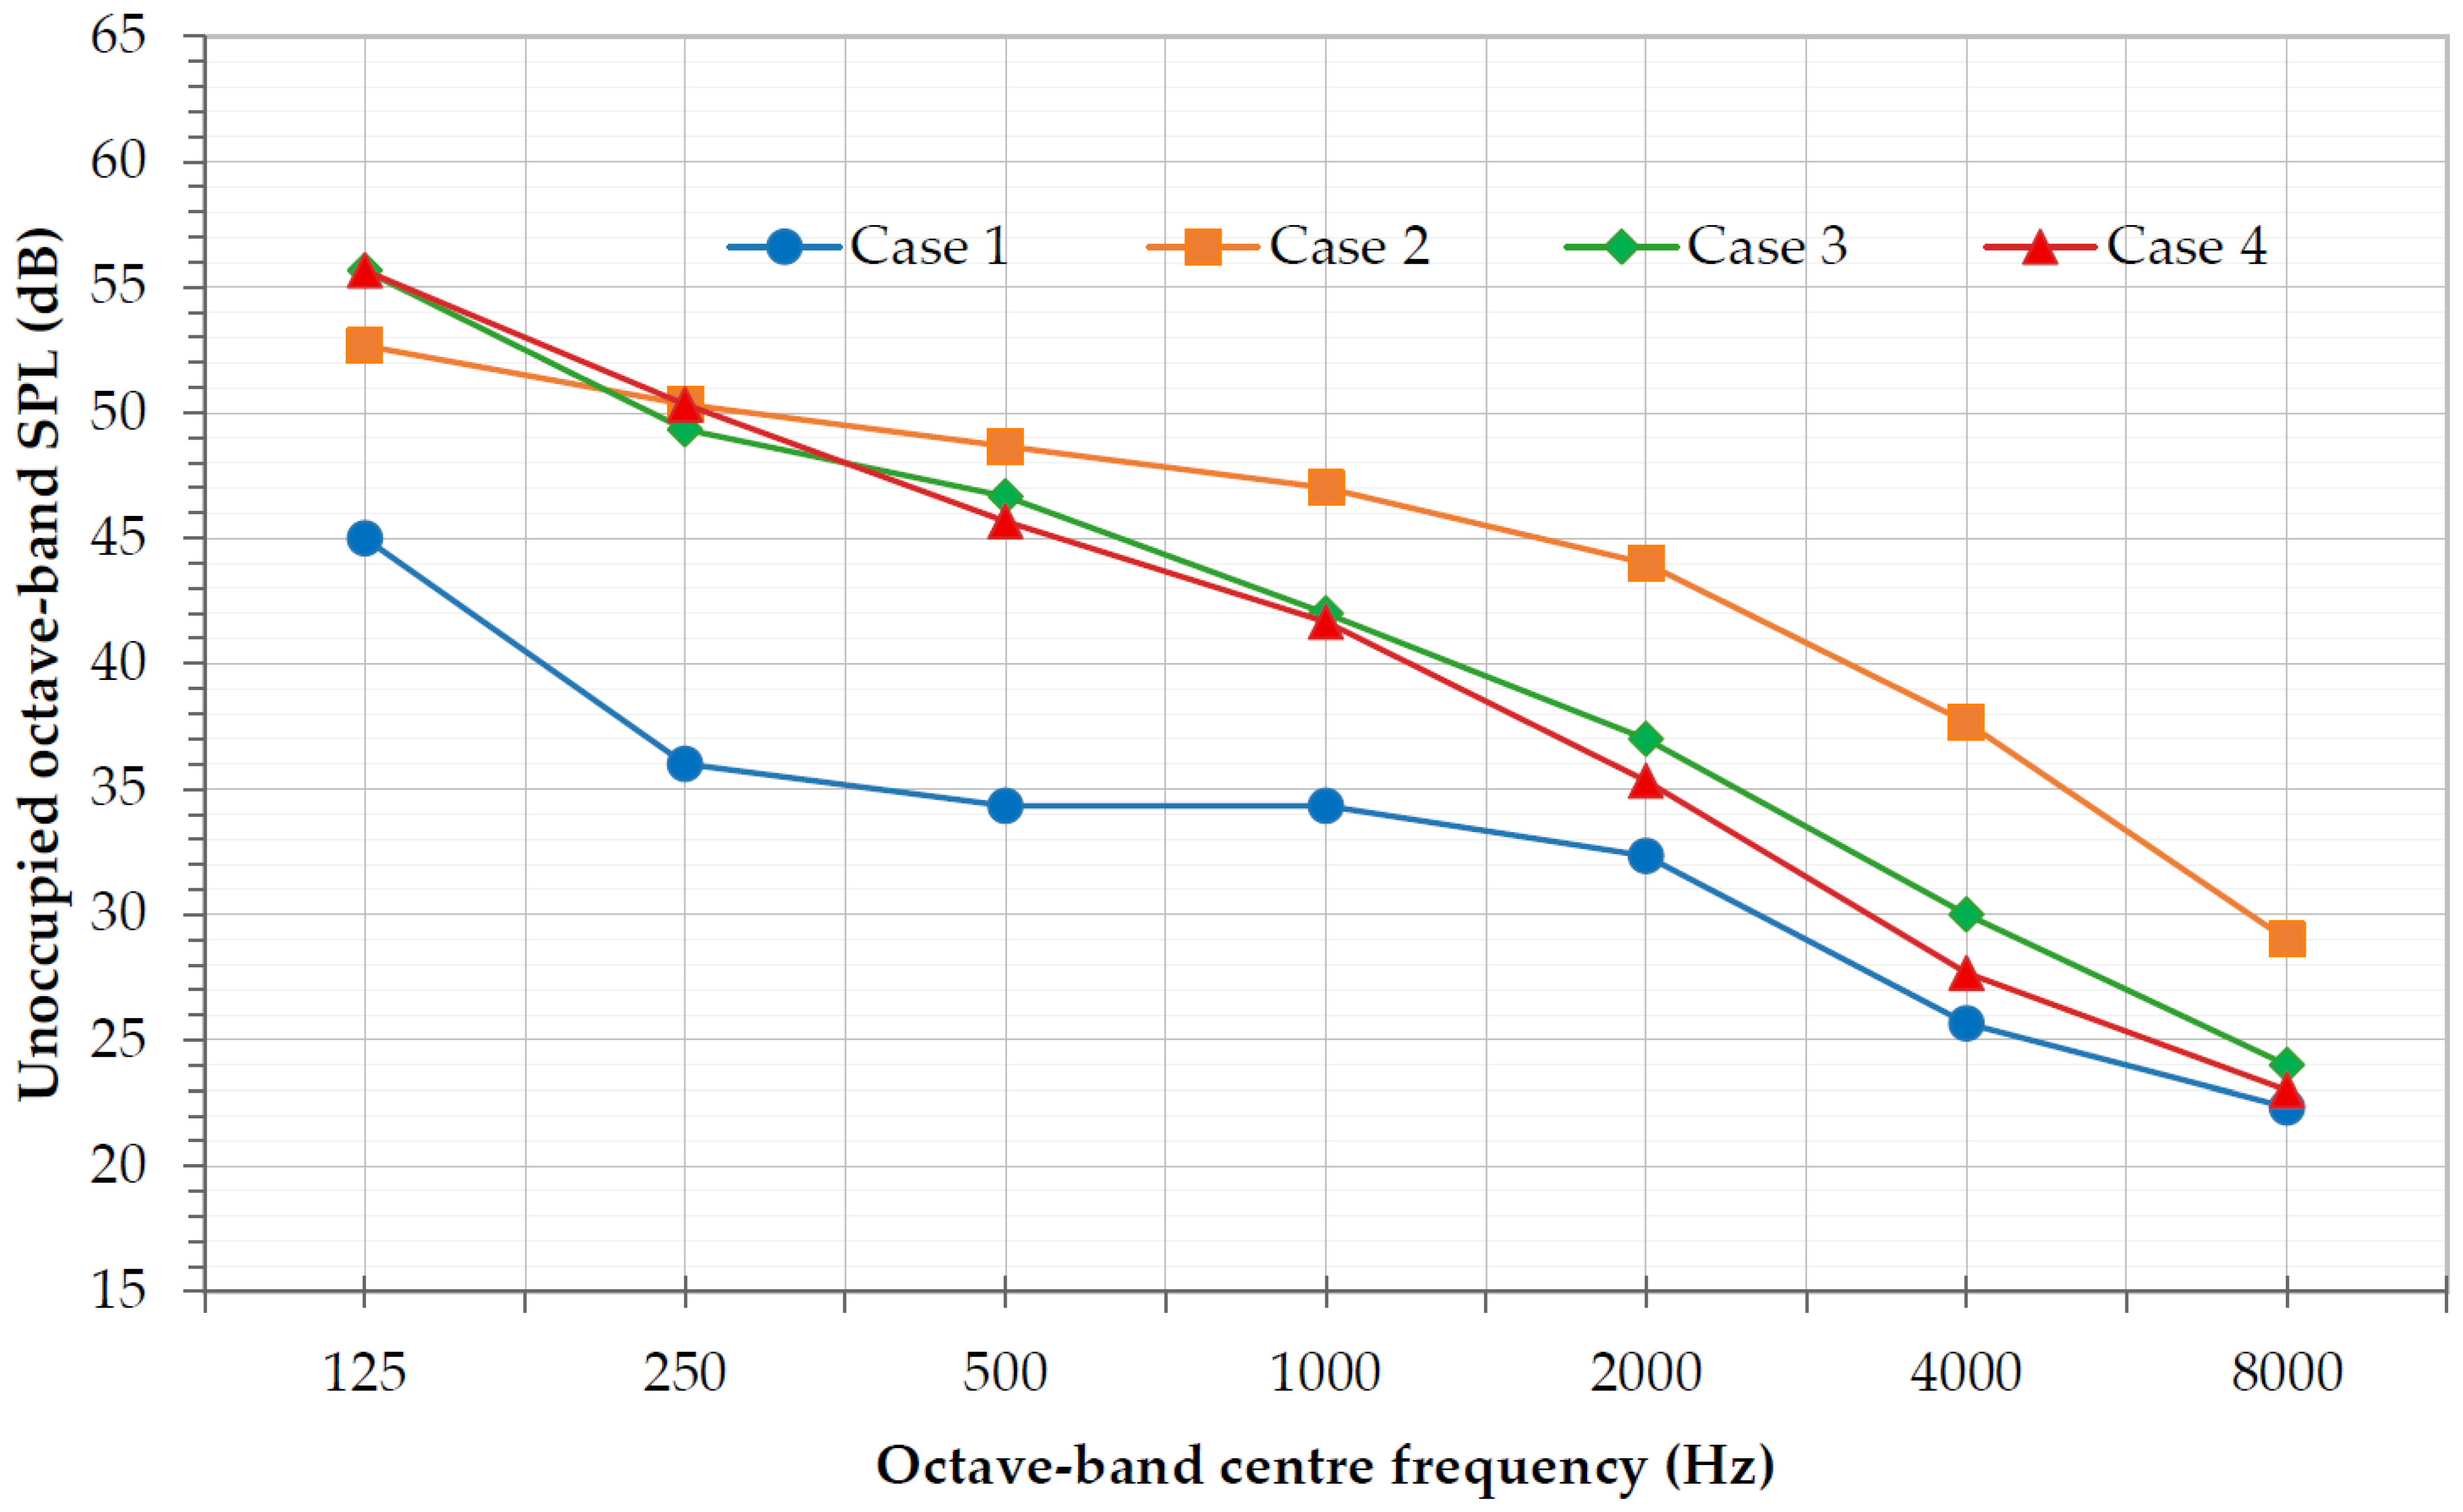
Unoccupied octave-band SPLs are presented in Figure 7 as descriptive contextual measurements. The recorded levels generally decrease towards higher frequencies. Cases 3 and 4 exhibit the highest arithmetic mean SPL values at 125 Hz (approximately 55.7 dB), followed by Case 2 (52.7 dB) and Case 1 (45.0 dB). These values reflect the receiver-level records associated with the respective halls. Because the available measurement metadata do not sufficiently document time averaging, the SPL data are not converted to LAeq, assessed against formal background noise criteria, or used directly to rank retrofit priorities.
Figure 7.
Spatially averaged unoccupied octave-band sound pressure-level spectra for the four sports halls.
Background noise is relevant to the present assessment in two distinct ways. During reverberation-time measurements, an elevated noise floor may limit the usable decay range and affect the reliability of the estimated RT. This concern is particularly relevant where the difference between excitation level and background noise is insufficient in a given frequency band, including low-frequency bands. During occupied activities, ambient and activity-related noise may also mask speech and reduce intelligibility. However, the retained dataset does not contain measurement-specific excitation levels, paired noise–floor records, or raw decay curves needed to quantify noise-related RT bias. Nor do the unoccupied SPL records establish representative speech-to-noise ratios during sports activities. Accordingly, the potential influence of background noise is identified as a limitation of the available evidence rather than incorporated as an unsupported quantitative decision dimension.
3.5. Retrofit Absorption Screening Indicators
For each hall, ΔAscreen was calculated from Tmf and volume using the adopted 2.0 s benchmark. Table 3 also reports receiver-level Tmf range, percentage performance deficit relative to the benchmark, and floor area-normalised intervention burden. These descriptors separate three building performance questions that are often conflated: how far the measured acoustic state lies from the adopted target, how spatially variable the observed response is, and how large a first-order absorption intervention would be relative to the hall footprint.
Table 3.
Derived mid-frequency variability, benchmark exceedance, and first-order absorption-screening indices.
Case 1 forms the distinct high-deficit case: its Tmf is 55.6% above the benchmark and its floor area-normalised ΔAscreen is 0.345 m2 sabin per m2 of floor area. Case 3 has a moderate absolute screening deficit (125.0 m2 sabin) and an intermediate normalised burden (0.198), whereas Cases 2 and 4 have lower plan area burdens (0.077 and 0.097). The floor area normalisation is useful for expressing intervention intensity per unit plan area. Still, it is not a size-independent acoustic index because it remains influenced by hall height and by the simplifying assumptions of the Sabine screening relationship.
Table 4 combines complementary descriptors of receiver-level and spectral behaviour. The receiver-level Tmf CV distinguishes relative mid-frequency variability, while the mean bandwise CV summarises receiver-to-receiver non-uniformity across 125–8000 Hz. The spectral contrasts show whether mid-frequency decay is elevated relative to the lower and upper ends of the measured spectrum. Case 1 has the highest Tmf CV (24.8%) and strong positive mid–low and mid–high contrasts. Case 4 is diagnostically different: its Tmf is the lowest in the sample, yet its mean bandwise CV is slightly the highest (about 15%), closely followed by Case 1 (~14.6%), driven by large receiver-to-receiver variation at 125, 250, 500, and 8000 Hz. The result shows that mean benchmark deficit and broadband receiver-level non-uniformity are distinct performance dimensions. For design follow-up, Case 4 therefore warrants denser spatial verification before treatment placement is fixed. In contrast, Case 1 requires both confirmation of the elevated mid-frequency mean and verification of its position dependence.
Table 4.
Dimensionless and spectral descriptors derived from the position-level RT data.
3.6. Integrated Acoustic Performance Diagnosis and Prioritisation
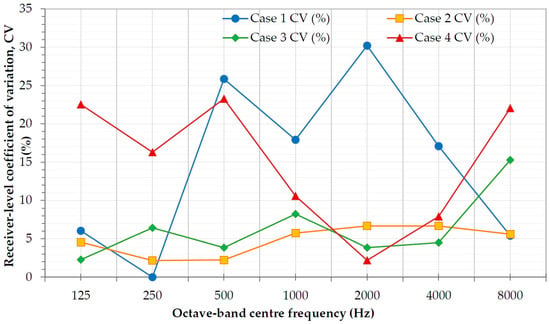
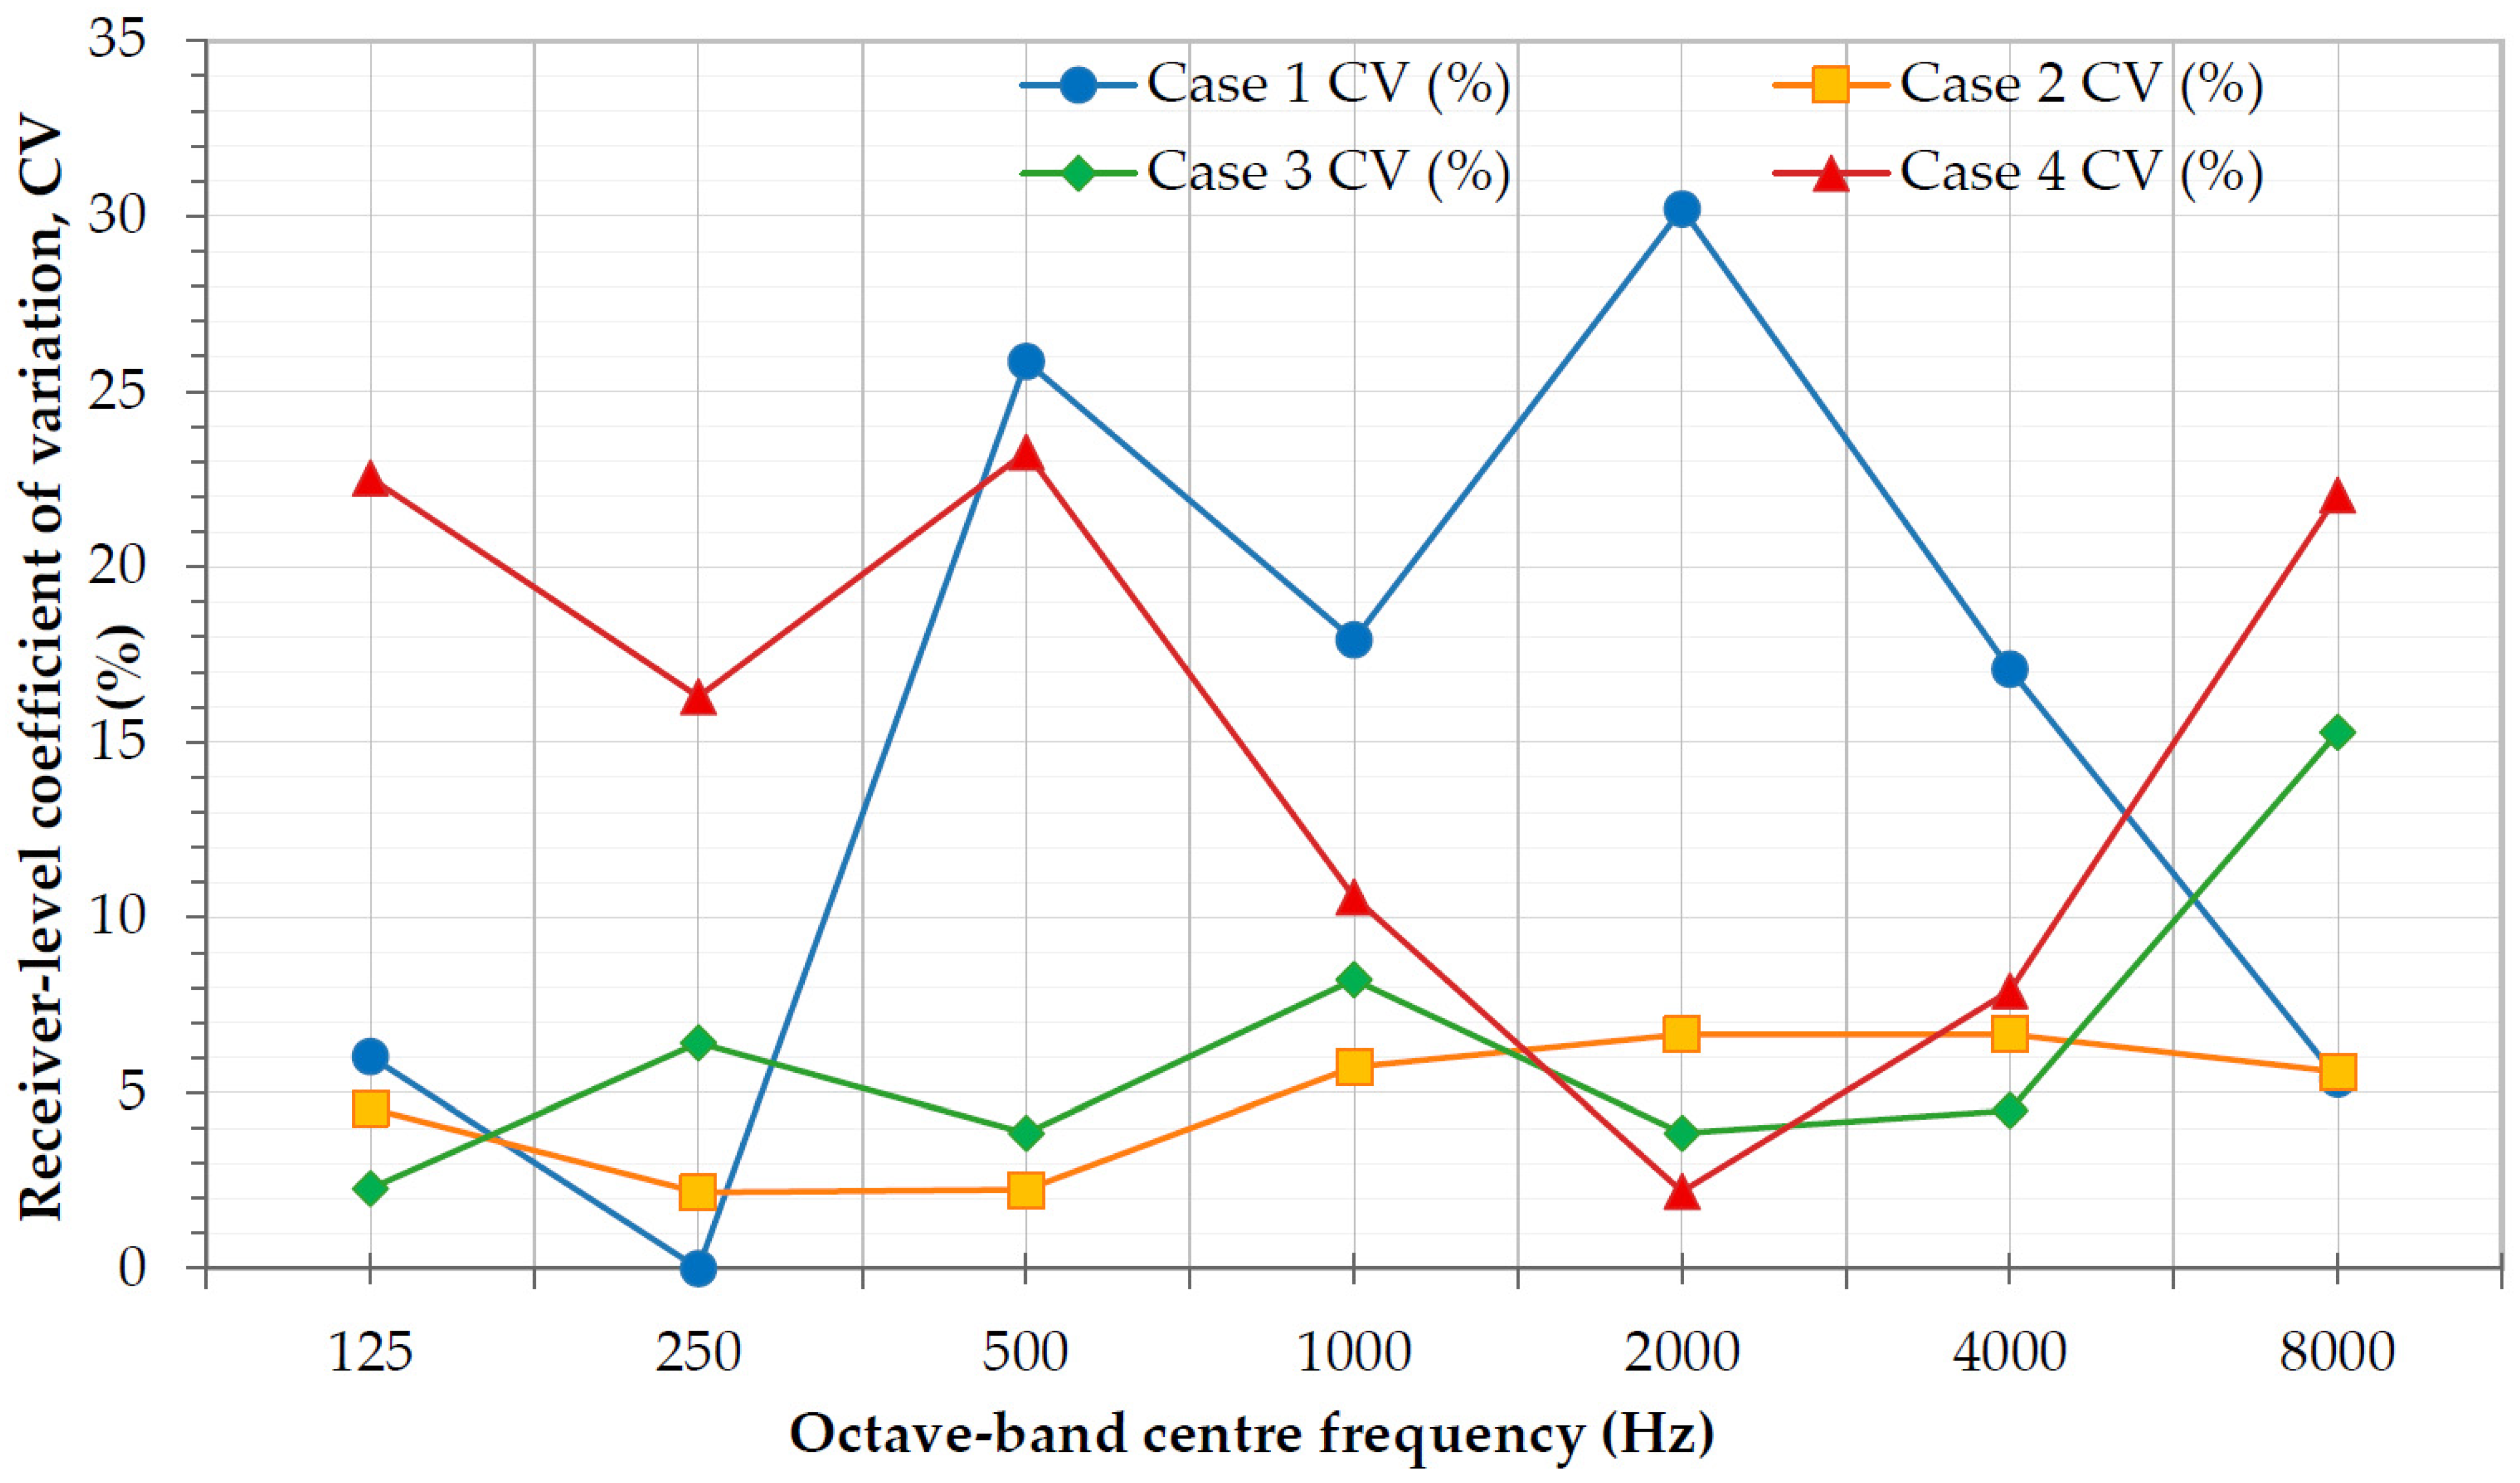
Figure 8 shows the bandwise CV across the three receiver positions for every case. The pattern is not captured by Tmf alone. Case 1 shows strong receiver variability at 500–2000 Hz, with CV values of about 25.9% at 500 Hz and 30.2% at 2000 Hz. Its 125–250 Hz and 8000 Hz responses are comparatively uniform, while 4000 Hz also shows notable variability (~17.1%). Case 4 shows a similarly broad frequency spread of receiver variability, with CV values above 16% at 125–250 Hz, 23.3% at 500 Hz, and 22.0% at 8000 Hz. Case 3 is generally uniform except at 8000 Hz, and Case 2 is the most uniform across the measured spectrum. These results add a frequency-resolved receiver-level dimension to the room-average RT diagnosis.
Figure 8.
Coefficient of variation of reverberation time across the three receiver positions at each octave band. Values are descriptive because n = 3 receiver positions per hall and should not be interpreted as a complete spatial-field map.
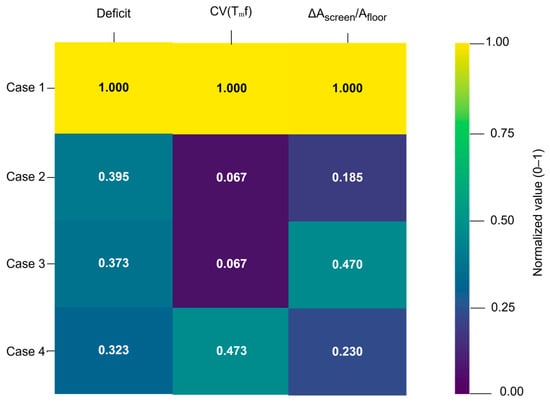
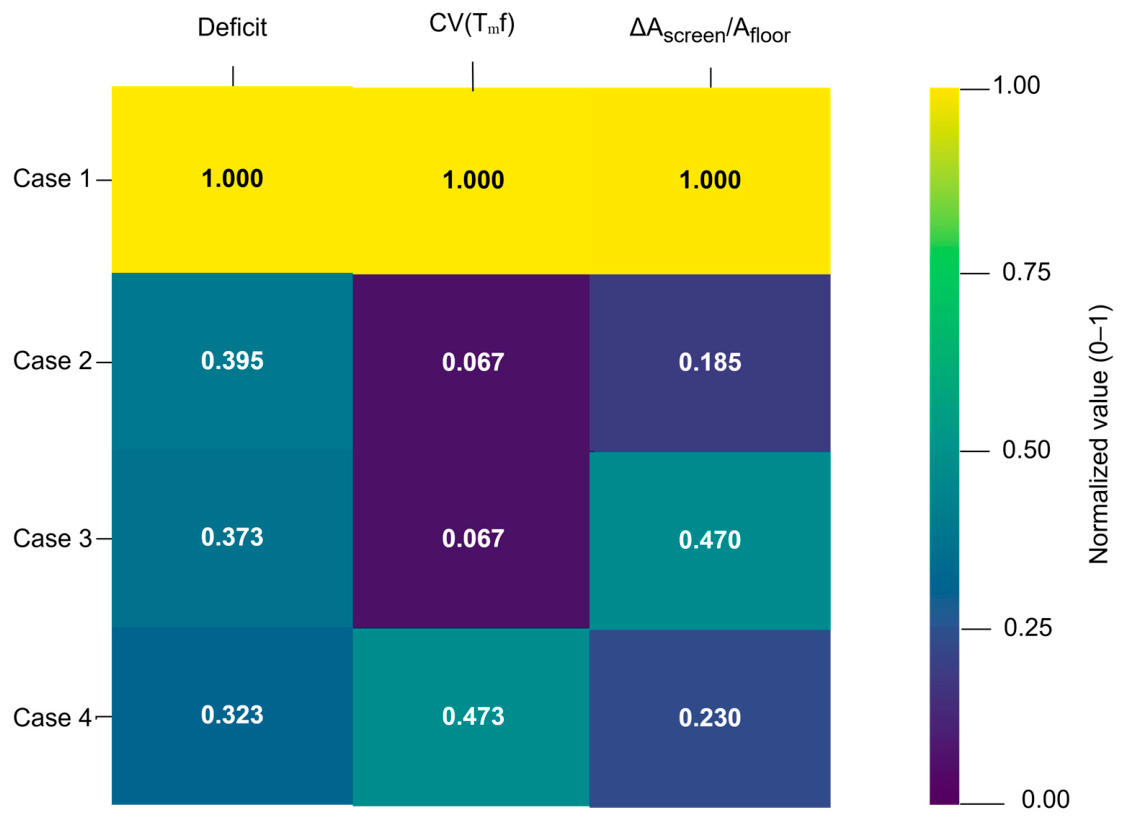
Figure 9 presents a normalised heatmap of the three screening dimensions: benchmark-relative Tmf deficit, receiver-level Tmf variability, and floor area-normalised intervention burden. Each indicator is scaled independently to the maximum observed value across the four cases, such that 1.0 represents the highest within-dataset value for that indicator. Case 1 has the highest relative deficit, receiver-level variability, and intervention burden per unit floor area. Cases 2 and 3 have similar moderate deficits and very low receiver-level variability, although Case 3 has a larger relative intervention burden. Case 4 combines the smallest benchmark deficit with substantially greater receiver-level variability than Cases 2 and 3. The heatmap therefore enables comparison of the three dimensions without combining them into a single composite score.
Figure 9.
Max-normalised diagnostic heatmap comparing benchmark-relative Tmf deficit, receiver-level Tmf variability, and floor area-normalised intervention burden across the four cases. Each indicator is scaled independently to its maximum observed value (1.0).
3.7. Robustness and Sensitivity Analysis
Table 5 presents the receiver-selection sensitivity of the hall-level mid-frequency reverberation-time indicator. The benchmark-exceedance conclusion is stable to receiver omission. Across all three leave-one-receiver-out combinations, Tmf remained above 2.0 s in every hall. Case 1 retained the largest benchmark deficit under every receiver omission, with a pairwise Tmf range of 2.67–3.35 s. Cases 2 and 3 were highly stable (2.60–2.63 s and 2.57–2.60 s), while Case 4 was more sensitive to receiver selection (2.40–2.65 s) and remained above the adopted benchmark. Median receiver-level Tmf values were 2.70, 2.63, 2.60, and 2.60 s for Cases 1–4, respectively. These results confirm that benchmark exceedance persists when any one of the recorded receiver positions is omitted. However, they do not establish that the estimated hall-average RT, relative case ranking, or spatial variability would remain unchanged under a different or more extensive receiver arrangement.
Table 5.
Receiver-selection sensitivity of the hall-level mid-frequency reverberation-time indicator.
The distinction between benchmark-exceedance stability and receiver-selection sensitivity is particularly important for Cases 1 and 4. In Case 1, the receiver-specific Tmf values are 4.00, 2.70, and 2.63 s, producing a hall mean of 3.11 s and a median of 2.70 s. Removing P1 reduces the two-receiver mean to approximately 2.67 s, whereas removing P3 increases it to 3.35 s. Although both estimates remain above the adopted benchmark, the magnitude of the estimated deficit is sensitive to receiver selection.
The relative ordering of the cases is also affected. With all receivers included, the descending Tmf ranking is Case 1 > Case 2 > Case 3 > Case 4. Omitting P3 from each case produces two-receiver means of 3.35, 2.60, 2.57, and 2.65 s, respectively, placing Case 4 second rather than fourth. This comparison is illustrative and does not imply equivalent P3 locations across the halls or a more representative alternative ranking. It demonstrates that receiver selection may affect the relative interpretation of the cases, even when benchmark exceedance remains unchanged.
The degree to which the three recorded receivers represent the full spatial distribution of reverberation time cannot be quantified without measurements at additional locations. The reported variability therefore describes only the sampled positions and may underestimate or overestimate the heterogeneity of the complete acoustic field. Adding five or seven receiver positions could reveal further spatial variation, but its effect cannot be quantified without additional measurements. Accordingly, the LOO results provide a limited robustness check within the available dataset rather than evidence of complete spatial representativeness.
4. Discussion
4.1. Architectural Context and Acoustic Performance
The four cases do not support a simple single-variable explanation of acoustic building performance. Case 1 is the largest hall and also has the highest Tmf, suggesting that enclosure scale may contribute to the observed pattern. Still, volume alone is insufficient: Case 3 is substantially larger than Cases 2 and 4 yet has a Tmf close to theirs. Glazing proportion is likewise not a reliable causal indicator in this sample; Case 4 has the highest glazing ratio (50%) but the lowest Tmf. Similarly, an exposed corrugated ceiling occurs in Cases 1 and 3, yet Case 3 is far less reverberant than Case 1. These contrasts are consistent with room acoustic theory and prior sports hall studies showing that geometry, total absorption, absorption distribution, and scattering act together rather than independently [6,20,21]. With only four purposively selected cases, these architectural variables are therefore treated as performance context rather than statistical predictors or causal explanations.
The recorded position-level data provide an additional perspective on acoustic performance. Case 1 combines a large mean reverberation deficit with substantial variation among the measured positions. Case 4 presents a different pattern: despite having the lowest mean Tmf, its mean bandwise CV (15.0%) is slightly higher than that of Case 1 (14.6%). This difference supports further frequency-resolved investigation but should not be interpreted as evidence that Case 4 is necessarily more spatially heterogeneous throughout the entire hall. This is consistent with evidence that RT estimates can vary with receiver position [30] and with sports hall measurements showing flutter-echo and non-diffuse behaviour [5]. Accordingly, the observed variation is interpreted diagnostically rather than causally.
Taken together, the cases resolve into three practical diagnostic patterns rather than a single ordered severity continuum: (i) a high-deficit, mid-frequency receiver-heterogeneity pattern represented by Case 1; (ii) a moderate-deficit, comparatively uniform receiver pattern represented by Cases 2 and 3; and (iii) a lower-mean-deficit but broadband receiver-heterogeneity pattern represented by Case 4. Their value is operational: each pattern implies a different emphasis for follow-up measurement, model calibration, and treatment testing.
Table 6 synthesises architectural context, the principal acoustic performance pattern, the plan area-normalised intervention burden, and the recommended next action for each case. The matrix is intentionally decision-oriented but remains descriptive: it translates measured differences into follow-up priorities without assigning causal weights to volume, glazing, or finish type.
Table 6.
Architectural context, acoustic performance pattern, intervention burden, and recommended next action for the four cases.
4.2. Acoustic Performance Within Building Performance and Retrofit Design
Within building performance evaluation, acoustic measurements become more useful when they are connected to architectural context and to an explicit design decision pathway. The present study therefore treats acoustics as one indoor environmental performance domain. It retains the frequency-resolved and receiver-level information required to decide whether the next step should be follow-up measurement, modelling, or treatment testing [10,19]. Recent architectural-acoustics synthesis argues that acoustic evidence should be embedded in built-environment decision processes [17]. In contrast, systematic review evidence identifies material selection, room volume, layout, noise, and occupancy among design enablers that interact with multiple acoustic performance indicators [18]. Data-driven work in educational buildings further shows how acoustic indicators can be integrated into design-evaluation workflows [39].
For retrofit, the design question is therefore not simply whether RT is excessive. It is how large the adopted benchmark deficit is, how consistently it appears across the observed receivers and frequency bands, what first-order intervention burden it implies, and what evidence is still missing before materials and layouts are specified. This decision framing connects measured indoor performance to a staged architectural intervention process rather than treating acoustics as an isolated test result. Future work can couple the acoustic module with measured energy use, thermal comfort, daylight/visual performance, indoor air quality, and occupant response. Such integration should be measured rather than assumed; controlled evidence indicates that thermal and acoustic conditions can interact in shaping overall comfort within identifiable environmental ranges [40,41].
4.3. Comparison with Regional and International Evidence
The measured Tmf range of 2.50–3.11 s lies within the broader 1.09–5.38 s reverberation-time range reported by Al-Arja [36] for 20 indoor sports and gymnasium halls in Amman. Del Brenna [16] examined RT, the STI, and weighted noise levels in 18 Finnish sports halls, while larger international investigations by Lüthi and Desarnaulds [6] and Wenmaekers, van Hout [5] provide additional evidence concerning reverberation, measurement variability, and the influence of absorption characteristics. Although differences in room types, measurement procedures, and acoustic indicators prevent direct numerical equivalence with the present Tmf values, these studies establish that prolonged reverberation and spatially dependent acoustic behaviour remain relevant concerns in sports facilities.
The choice of benchmark also affects interpretation. BB93 is retained here because the buildings are existing school sports halls and the refurbishment limit is explicit, but it is not a Jordanian legal requirement. DIN 18041:2016 and ASA/ANSI S12.60-2019/Part 4 (R2024) independently confirm that sports and physical education spaces warrant dedicated room acoustic treatment and speech communication criteria [23,24,31]. Lüthi and Desarnaulds [6] found substantial variation among 12 national standards and recommendations, so the present exceedance percentages should be read as benchmark-relative descriptors rather than universal compliance statements. This distinction is especially important because perceived comfort and occupational risk are not determined by RT alone. Huang, Liang [32] found limited explanatory power for SPL alone in badminton gyms; a complementary review-based venue study linked acoustic perception with broader user-experience dimensions [33], and Markelj, Kovač [7] reported elevated hearing disorder and hoarseness risks among specialist physical education teachers. Table 7 shows the positioning of the present study relative to selected sports hall acoustic evidence.
Table 7.
Positioning of the present study relative to selected sports hall acoustic evidence.
4.4. Diagnostic Contribution: Separating Deficit, Heterogeneity, Retrofit Burden, and Evidence Quality
The central contribution of the proposed framework is the structured interpretation of acoustic evidence for pre-retrofit decision making, rather than the introduction of a new acoustic indicator. The results demonstrate that benchmark deficit, observed receiver-level and spectral variability, estimated intervention burden, and evidence quality provide different, although partly related, information. When assessed using hall-average Tmf alone, the four cases are ranked according to benchmark exceedance, with Case 1 showing the greatest deficit and Case 4 the smallest. However, this ranking does not fully describe the nature of the subsequent investigations required.
Case 1 combines the greatest mean reverberation deficit with substantial receiver-level heterogeneity, supporting priority for a more comprehensive follow-up survey. Cases 2 and 3 have similar Tmf values (2.61 and 2.58 s) and low observed receiver variability, but different first-order floor-normalised absorption screening indices (approximately 0.077 and 0.198 m2 sabin/m2, respectively). These differences partly reflect room geometry, particularly height, and should not be interpreted as independent measures of retrofit complexity. Case 4 provides a different diagnostic pattern: despite having the lowest mean Tmf (2.50 s), it exhibits the highest mean bandwise receiver CV (15.0%), and its relative position in the mean-RT ranking changes under receiver omission. This supports additional spatial and frequency-specific verification before selecting treatment locations.
In the four investigated cases, the combined interpretation of acoustic indicators identified different follow-up requirements that were not apparent from ranking the halls by mean RT alone. The methodological contribution lies in explicitly linking the available measurements, derived indicators, evidence limitations, and case-specific recommendations (Table 6). These recommendations are preliminary diagnostic interpretations and have not been validated against implemented retrofit outcomes.
4.5. Implications for Performance-Based Acoustic Retrofit Design
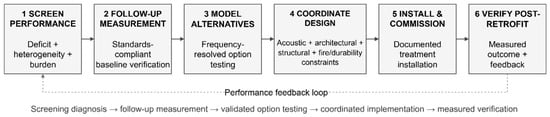
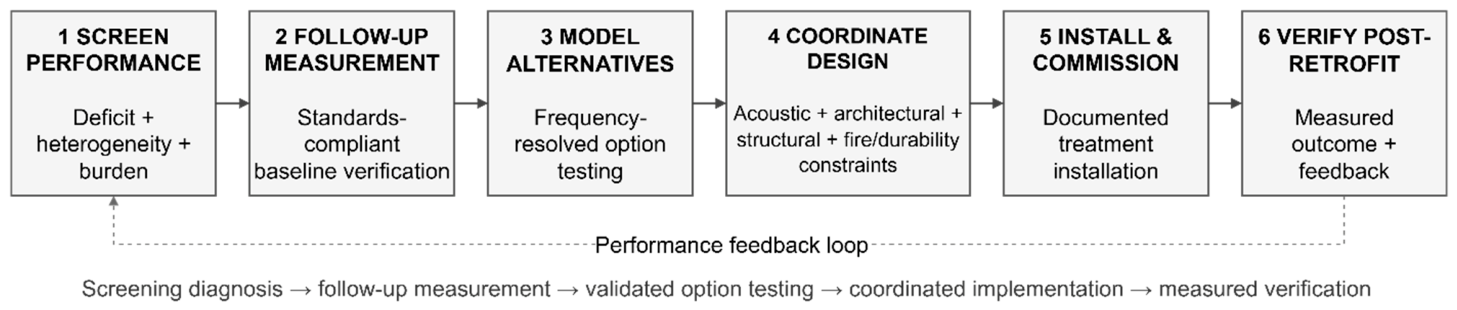
For case-specific retrofit prioritisation, Case 1 warrants priority for a follow-up standards-compliant acoustic survey: it is 55.6% above the adopted Tmf benchmark, has a receiver-level Tmf CV of 24.8%, and has a floor-normalised ΔAscreen of 0.345 m2 sabin/m2. Case 3 has a larger plan area intervention burden than Cases 2 and 4 despite a similar Tmf deficit, while Case 4 requires a different follow-up because its mean Tmf is the lowest. Still, its broadband receiver-variability pattern is the strongest. These distinctions demonstrate why a retrofit priority cannot be derived from Tmf alone. Figure 10 translates the findings into a staged performance-based pathway: screening diagnosis is followed by measurement, calibrated or frequency-resolved option testing, multidisciplinary design coordination, documented installation, and post-retrofit verification [6,29].
Figure 10.
Staged performance-based acoustic retrofit pathway from screening diagnosis to post-retrofit verification.
4.5.1. Installation-Dependent Absorption Performance and Retrofit Verification
The translation of preliminary absorption requirements into practical retrofit solutions depends on the properties and installation conditions of the selected acoustic assemblies. This is particularly relevant to the investigated halls, which include corrugated metal ceiling and upper-wall surfaces (Case 1), a corrugated ceiling with carpeted lower walls (Case 3), and predominantly plaster-finished surfaces with extensive glazing (Case 4).
Potential absorbing systems, such as perforated panels with porous backing, must be assessed in relation to their frequency-dependent absorption characteristics, mounting configuration, backing material, cavity depth, perforation ratio, and treatment distribution. Exposed edges, joints, and partial surface coverage may further influence installed performance relative to laboratory-tested assemblies [25,26,27,28]. Consequently, absorption coefficients obtained for laboratory specimens should not be assumed to represent the performance of assemblies installed under different boundary and mounting conditions.
In subsequent retrofit development, these differences should be addressed by selecting octave-band absorption data for assemblies with documented construction and mounting conditions, incorporating the actual treatment areas and proposed configurations into frequency-resolved room acoustic models, and comparing alternative cavity depths, backing materials, and treatment distributions. Where installation details remain uncertain, sensitivity analyses should be used to examine plausible performance variations rather than applying unsupported fixed correction factors. Model calibration should use suitably documented baseline acoustic measurements, while post-installation field measurements are required to verify the realised performance [6,29].
No acoustic treatment systems were installed or evaluated in the present study. Accordingly, the reported ΔAscreen values remain preliminary comparative estimates and are not presented as material-specific predictions of retrofit performance.
4.5.2. Electroacoustic Considerations for Speech Communication
Electroacoustic amplification represents a separate consideration for speech communication in these halls. Although appropriately designed sound reinforcement may improve speech audibility, it does not directly reduce room reverberation time. The available records do not establish the presence or performance of amplification systems in the investigated halls. Their suitability would therefore require separate assessment of background noise, source–receiver conditions, and speech-intelligibility performance under representative operating conditions.
4.6. Study Limitations
Several limitations bound the interpretation of the findings. First, the sample comprises four school sports halls located in Amman, Jordan. Although the cases differ in volume, glazing proportion, and interior finishes, this architectural variation does not establish representativeness across other geographical contexts, construction periods, or building-use profiles. The findings should therefore be interpreted as case-specific diagnostic evidence rather than population-level estimates.
Second, only three receiver positions were available per hall. The reported standard deviations and coefficients of variation describe variation among the recorded positions, not the complete spatial acoustic field or measurement uncertainty. The leave-one-receiver-out (LOO) analysis confirms that benchmark exceedance persists within the available receiver set. Still, the estimated mean RT and relative ordering of the cases remain sensitive to receiver selection. This is particularly relevant to Cases 1 and 4. Additional measurements would be required to assess spatial acoustic variability beyond the three sampled receiver positions.
Third, although the sound source was repositioned among three measurement locations, the records do not sufficiently document the complete source–receiver combinations, recommended separation distances, repeated decay measurements, environmental conditions, instrumentation specifications, calibration history, or RT estimation procedure. Consequently, full compliance with a specific ISO 3382-2 measurement procedure [37] cannot be verified. The available data are therefore used for preliminary acoustic diagnosis rather than standards compliance certification.
Fourth, measurements were conducted under unoccupied conditions, whereas occupancy would introduce additional absorption and activity-related noise. The retained octave-band SPL records provide descriptive acoustic information but do not include the paired excitation levels, measurement-specific noise floors, or raw decay characteristics required to quantify the influence of background noise on RT estimation. Representative speech-to-noise ratios during actual activities also cannot be established. Complementary acoustic indicators, including clarity, definition, sound strength, and speech intelligibility, were not available for this assessment.
The analytical screening introduces additional constraints. BB93 is used as an external refurbishment benchmark, not as a statutory requirement in Jordan. The ΔAscreen index is derived from the measured mid-frequency RT and hall volume using the Sabine relationship, and its floor area normalisation remains dependent on room geometry, particularly height. These estimates do not constitute unique frequency-resolved absorption requirements or validated predictions of installed treatment performance. Actual retrofit development requires assembly-specific absorption data, documented installation conditions, appropriate acoustic modelling, and post-installation verification.
Finally, the proposed diagnostic recommendations have not been prospectively evaluated using independent measurement campaigns or verified against completed retrofit interventions. Their stability under more comprehensive acoustic evidence, transferability to other building contexts, and practical effectiveness therefore remain to be established. Since only acoustic performance was investigated, the study should not be interpreted as a comprehensive multi-domain indoor environmental quality assessment.
5. Conclusions
This study develops and demonstrates an auditable acoustic performance decision framework for existing sports halls in which measured deficit, receiver-level heterogeneity, spectral behaviour, intervention burden, and evidence quality remain separate decision dimensions. Applied to measurements from four school multi-sport halls in Amman, the framework identified three operational patterns: a high-deficit pattern with pronounced mid-frequency receiver heterogeneity (Case 1), a moderate-deficit pattern with low receiver-to-receiver variability (Cases 2 and 3), and a smaller mean deficit with stronger broadband receiver heterogeneity (Case 4). All four halls exceeded the adopted BB93 refurbishment benchmark (Tmf = 2.50–3.11 s), and that conclusion persisted under every leave-one-receiver-out combination.
The decision framework adds information that room-average Tmf alone does not provide. The first-order ΔAscreen index ranged from 15.4 to 596.2 m2 sabin, with floor area-normalised burdens of 0.077–0.345 m2 sabin/m2, while the receiver and spectral indicators distinguished where measurement should be denser and which frequency ranges require explicit follow-up. In this form, measurement data become a transparent basis for deciding what to verify next rather than an endpoint in themselves.
The principal contribution is methodological: a transparent diagnostic pathway that relates measured acoustic conditions, receiver-level and spectral variability, geometry-dependent screening estimates, and evidence limitations to case-specific follow-up actions. The framework is intended to precede, rather than replace, comprehensive acoustic measurement, retrofit design, and post-installation verification. An important remaining research gap is the absence of prospective validation of the proposed recommendations. Future studies should examine a larger and more diverse set of sports halls across different geographical contexts, construction periods, and usage profiles, using denser and fully documented source–receiver arrangements. Complementary indicators derived from suitable room impulse responses, including clarity and definition, together with sound strength and speech-intelligibility assessments and documented background noise conditions, would allow the diagnostic recommendations to be tested against more comprehensive acoustic evidence. Subsequent investigations should compare framework-guided follow-up decisions with calibrated acoustic models, implemented treatments, and before-and-after measurements to establish their practical effectiveness. Further work may then examine integration with other measured building performance domains.
Author Contributions
Conceptualisation, M.A.; methodology, M.A. and S.A.; validation, M.A. and A.I.; formal analysis, M.A.; investigation, M.A. and S.A.; data curation, M.A. and S.A.; visualisation, M.A.; writing—original draft preparation, M.A.; writing—review and editing, M.A., S.A. and A.I.; project administration, A.I. All authors have read and agreed to the published version of the manuscript.
Funding
This research received no external funding.
Institutional Review Board Statement
Not applicable. This study involved acoustic measurements of unoccupied sports halls and did not involve human participants or personal data.
Informed Consent Statement
Not applicable.
Data Availability Statement
The original contributions presented in this study are included in the article. Further inquiries can be directed to the corresponding authors.
Conflicts of Interest
The authors declare no conflict of interest.
References
- Ibrahim, A.; Alsukkar, M.; Xu, Y.; Hermaputi, R.L.; Yin, S.; Xiao, Y. The potential of large language models for sustainable building performance: A review of applications, evaluation practices, and reliability. Energy Sustain. Dev. 2026, 95, 102104. [Google Scholar] [CrossRef] [Scilit]
- Alsukkar, M.; Ibrahim, A.; Eltaweel, A. Multi-Objective Optimization of Daylighting Systems for Energy Efficiency and Thermal-Visual Comfort in Buildings: A Review. Build. Environ. 2025, 288, 113921. [Google Scholar] [CrossRef] [Scilit]
- Ibrahim, A.; Alsukkar, M.; Wang, L.; Hermaputi, R.L.; Dong, Y.; Yin, S.; Xiao, Y.; Hu, P. Targeting integrated daylighting comfort in deep office by multi-objective optimisation using partial vertical deployment of adaptive corrugated shadings. Energy Built Environ. 2026, 7, 1556–1570. [Google Scholar] [CrossRef] [Scilit]
- Jurak, G.; Kovač, M.; Starc, G.; Leskošek, B. Acoustics in School Sport Halls and Its Implications for Physical Education. Croat. J. Educ./Hrvat. Časopis Za Odgoj. I Obraz. 2015, 17, 65–95. [Google Scholar] [CrossRef] [Scilit]
- Wenmaekers, R.H.; van Hout, N.; Moerman, E.; Schuurmans, A.; Tuinder, S. Acoustics in 29 sports halls measured. In Proceedings of the 30th International Congress on Sound and Vibration (ICSV30), Amsterdam, The Netherlands, 8–11 July 2024. [Google Scholar]
- Lüthi, G.; Desarnaulds, V. Reverberation time in sports halls: Analysis of a large database of in-situ measurements and simulations according to absorption positions. In Proceedings of the 10th Convention of the European Acoustics Association, Turin, Italy, 11–15 September 2023; pp. 115–122. [Google Scholar]
- Markelj, N.; Kovač, M.; Leskošek, B.; Jurak, G. Occupational health disorders among physical education teachers compared to classroom and subject specialist teachers. Front. Public Health 2024, 12, 1390424. [Google Scholar] [CrossRef] [Scilit] [PubMed]
- Zhang, D.; Wong, L.-T.; Mui, K.-W.; Tang, S.-K. Acoustic comfort in educational buildings: An integrative review and new directions for future research. Build. Environ. 2024, 262, 111849. [Google Scholar] [CrossRef] [Scilit]
- Li, P.; Froese, T.M.; Brager, G. Post-occupancy evaluation: State-of-the-art analysis and state-of-the-practice review. Build. Environ. 2018, 133, 187–202. [Google Scholar] [CrossRef] [Scilit]
- Zhao, Y.; Li, D. Multi-domain indoor environmental quality in buildings: A review of their interaction and combined effects on occupant satisfaction. Build. Environ. 2023, 228, 109844. [Google Scholar] [CrossRef] [Scilit]
- Dam-Krogh, E.P.; Rupp, R.F.; Clausen, G.; Toftum, J. Scoping review of post occupancy evaluation of office buildings with focus on indoor environmental quality and productivity. J. Build. Eng. 2024, 86, 108911. [Google Scholar] [CrossRef] [Scilit]
- Nunayon, S.S.; Zhong, L. A mixed-method systematic review of indoor environmental quality (IEQ) gaps and opportunities for future research. Sustain. Cities Soc. 2025, 130, 106535. [Google Scholar] [CrossRef] [Scilit]
- Puglisi, G.E.; Warzybok, A.; Astolfi, A.; Kollmeier, B. Effect of reverberation and noise type on speech intelligibility in real complex acoustic scenarios. Build. Environ. 2021, 204, 108137. [Google Scholar] [CrossRef] [Scilit]
- Ren, M.; Liu, L.; Liang, L.; Yu, G. Effect of speaker orientation and position on speech intelligibility in two small university classrooms with and without acoustic treatment. Build. Acoust. 2026, 33, 67–95. [Google Scholar] [CrossRef] [Scilit]
- Yang, D.; Mak, C.M. Effects of acoustical descriptors on speech intelligibility in Hong Kong classrooms. Appl. Acoust. 2021, 171, 107678. [Google Scholar] [CrossRef] [Scilit]
- Del Brenna, G. Noise Level in Indoor Sports Facilities and Factors Affecting the Acoustic Environment; Aalto University: Espoo, Finland, 2021. [Google Scholar]
- Shtrepi, L.; Aletta, F.; Aspöck, L.; Astolfi, A.; Fels, J.; Hornikx, M.; Jambrošić, K.; Jeong, C.-H.; Kahle, E.; Llorca-Bofí, J.; et al. Ten questions concerning architectural acoustics. Build. Environ. 2024, 265, 112012. [Google Scholar] [CrossRef] [Scilit]
- Razali, A.W.; Din, N.B.C.; Yahya, M.N.; Sulaiman, R. Conceptual framework of acoustic comfort design enablers for a classroom: A systematic review. J. Build. Eng. 2024, 95, 110160. [Google Scholar] [CrossRef] [Scilit]
- Jiang, S.; Wang, H.; Li, R.; Numtong, K. AI-Driven Multi-Criteria Decision-Making Framework for Acoustic Performance Prediction and Optimisation in Music Venue Design. Buildings 2026, 16, 3253. [Google Scholar] [CrossRef] [Scilit]
- Hornikx, M.; Hak, C.; Wenmaekers, R. Acoustic modelling of sports halls, two case studies. J. Build. Perform. Simul. 2015, 8, 26–38. [Google Scholar] [CrossRef] [Scilit]
- Wattez, Y.; Tenpierik, M.; Nijs, L. The influence of profiled ceilings on sports hall acoustics: Ground effect predictions and scale model measurements. Appl. Acoust. 2018, 130, 156–167. [Google Scholar] [CrossRef] [Scilit]
- Department for Education. Building Bulletin 93: Acoustic Design of Schools: Performance Standards; Department for Education: London, UK, 2015.
- Acoustical Society of America. ASA/ANSI S12.60-2019/Part 4 (R2024): Acoustical Performance Criteria, Design Requirements, and Guidelines for Schools, Part 4: Acoustic Standards for Physical Education Teaching Environments; Acoustical Society of America: Melville, NY, USA, 2024. [Google Scholar]
- DIN 18041:2016-03; Acoustic Quality in Rooms—Specifications and Instructions for the Room Acoustic Design. DIN: Berlin, Germany, 2016.
- Cavanaugh, W.J.; Tocci, G.C.; Wilkes, J.A. Architectural Acoustics: Principles and Practice; John Wiley & Sons: Hoboken, NJ, USA, 2009. [Google Scholar]
- Long, M. Architectural Acoustics Book, 2nd ed.; Academic Press: Cambridge, MA, USA, 2014. [Google Scholar]
- Huang, S.; Li, Y.; Zhu, J.; Tsai, D.P. Sound-absorbing materials. Phys. Rev. Appl. 2023, 20, 010501. [Google Scholar] [CrossRef] [Scilit]
- International Organization for Standardization. Acoustics: Measurement of Sound Absorption in a Reverberation Room; ISO: Geneva, Switzerland, 2003. [Google Scholar]
- Wang, X.; Ma, R.; Lu, S.; Dong, W.; Kim, M.-S.; Zuo, J.; Du, C.; Li, H. Research on Technical Strategies for Indoor Acoustic Renovation of Multipurpose Gymnasiums: Scheme Demonstration and Engineering Practice Based on Existing Sound-Absorbing Ceilings. Buildings 2025, 15, 4241. [Google Scholar] [CrossRef] [Scilit]
- Prinn, A.G.; Tuna, Ç.; Walther, A.; Habets, E.A. A study of the spatial non-uniformity of reverberation time at low frequencies. Appl. Acoust. 2025, 227, 110220. [Google Scholar] [CrossRef] [Scilit]
- Ryan, S.; van der Mars, H. “Can You Hear Me Now…?” What the New Physical Education Acoustic Standard Means to You and Your Students. J. Phys. Educ. Recreat. Dan. 2022, 93, 22–26. [Google Scholar] [CrossRef] [Scilit]
- Huang, K.; Liang, L.; Liu, L.; He, C. Assessment of the acoustic environment in popular indoor badminton gyms. Appl. Acoust. 2026, 242, 111048. [Google Scholar] [CrossRef] [Scilit]
- Huang, K.; Li, J.; He, C.; Liang, L.; Liao, Y. Grounded Theory-Derived Quality Assessment of Indoor Badminton Venues Based on Online Reviews: From Functional Experience to Acoustic Perception. Buildings 2026, 16, 2645. [Google Scholar] [CrossRef] [Scilit]
- Alibaba, H.Z.; Ozdeniz, M.B. Acoustical renovation of university multipurpose halls: The case of lala mustafa paşa hall. Sustainability 2019, 11, 1397. [Google Scholar] [CrossRef] [Scilit]
- Hammad, R. The acoustics of the Amman Sport Arena the design and result. Archit. Sci. Rev. 2000, 43, 183–189. [Google Scholar] [CrossRef] [Scilit]
- Al-Arja, O.A. Acoustic environment and noise exposure in fitness halls. Appl. Sci. 2020, 10, 6349. [Google Scholar] [CrossRef] [Scilit]
- ISO E. 3382-2:2008; Acoustics—Measurement of Room Acoustic Parameters—Part 2: Reverberation Time in Ordinary Rooms. International Organization for Standardization: Brussels, Belgium; Geneva, Switzerland, 2008.
- Brüel & Kjær. Product Data: Sound Power Source—Type 4205 (BP0264). Available online: https://www.bksv.com/media/doc/bp0264.pdf (accessed on 14 September 2026).
- Manesh, M.T.; Dehnavi, A.N.; Tahsildoost, M.; Alambeigi, P. Acoustic design evaluation in educational buildings using artificial intelligence. Build. Environ. 2024, 261, 111695. [Google Scholar] [CrossRef] [Scilit]
- Wen, X.; Meng, Q.; Yin, Y.; Yang, D.; Li, M.; Kang, J. Exploring the boundaries of indoor combined thermal-acoustic environmental effects on comfort perceptions. Build. Environ. 2025, 271, 112580. [Google Scholar] [CrossRef] [Scilit]
- Ibrahim, A.; Alsukkar, M.; Eltaweel, A.; Hermaputi, R.L. Multi-Objective Optimisation of Daylighting for an Office Space in a Very Hot Climate: A Comparison of Corrugated, Perforated, and Separated Shadings. Buildings 2026, 16, 2625. [Google Scholar] [CrossRef] [Scilit]

Disclaimer/Publisher’s Note: The statements, opinions and data contained in all publications are solely those of the individual author(s) and contributor(s) and not of MDPI and/or the editor(s). MDPI and/or the editor(s) disclaim responsibility for any injury to people or property resulting from any ideas, methods, instructions or products referred to in the content. |
© 2026 by the authors. Licensee MDPI, Basel, Switzerland. This article is an open access article distributed under the terms and conditions of the Creative Commons Attribution (CC BY) license.