


Abstract
Attached cranes on elevated construction platforms may experience amplified earthquake demands, although their seismic performance during nuclear containment construction is insufficiently characterized. A three-dimensional containment–platform–crane model was used for incremental dynamic analysis with 11 ground-motion records and four adopted deformation thresholds. For the reported 0.5 g case, the crane-tip peak displacement was 1.42 times the platform-top value. The median ground peak accelerations at the D4 deformation threshold were 0.275 g for Crane 2 and 0.399 g for Crane 5, a ratio of 1.45, indicating a substantial configuration-dependent difference under the analyzed excitation direction. A crane-group threshold table supports probability-based screening. For assessment using crane-base acceleration, 18 intensity measures were compared; the peak-based measure achieved r = 0.945 and conditional logarithmic dispersion achieved β = 0.260, compared with r = 0.912 and β = 0.327 for Sa_avg. These results support two complementary screening approaches, subject to the assumed stationary, unloaded crane configuration. Record provenance, connection idealizations, limited sampling, and unidirectional excitation constrain quantitative transfer to other projects. The D4 threshold denotes an adopted deformation-exceedance criterion rather than independently verified physical collapse.
1. Introduction
Temporary lifting equipment is essential to the construction of nuclear facilities, where an earthquake can interrupt access, damage equipment, and endanger personnel before the permanent structure is complete. Construction-stage safety therefore requires attention to both the main structure and the equipment attached to it. For cranes mounted on a flexible elevated platform, ground shaking is filtered by the supporting structure before reaching the crane base. A satisfactory assessment of the containment alone does not establish the seismic performance of the lifting system. Crane seismic-design principles and national guidance provide useful starting points [1,2,3], while reported earthquake-related crane accidents illustrate the practical consequences of equipment failure [4,5].
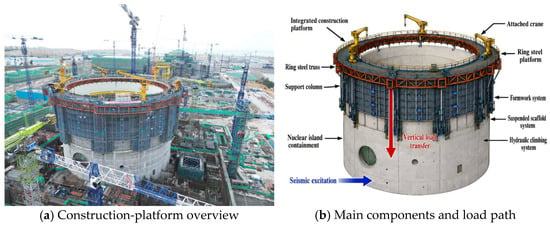
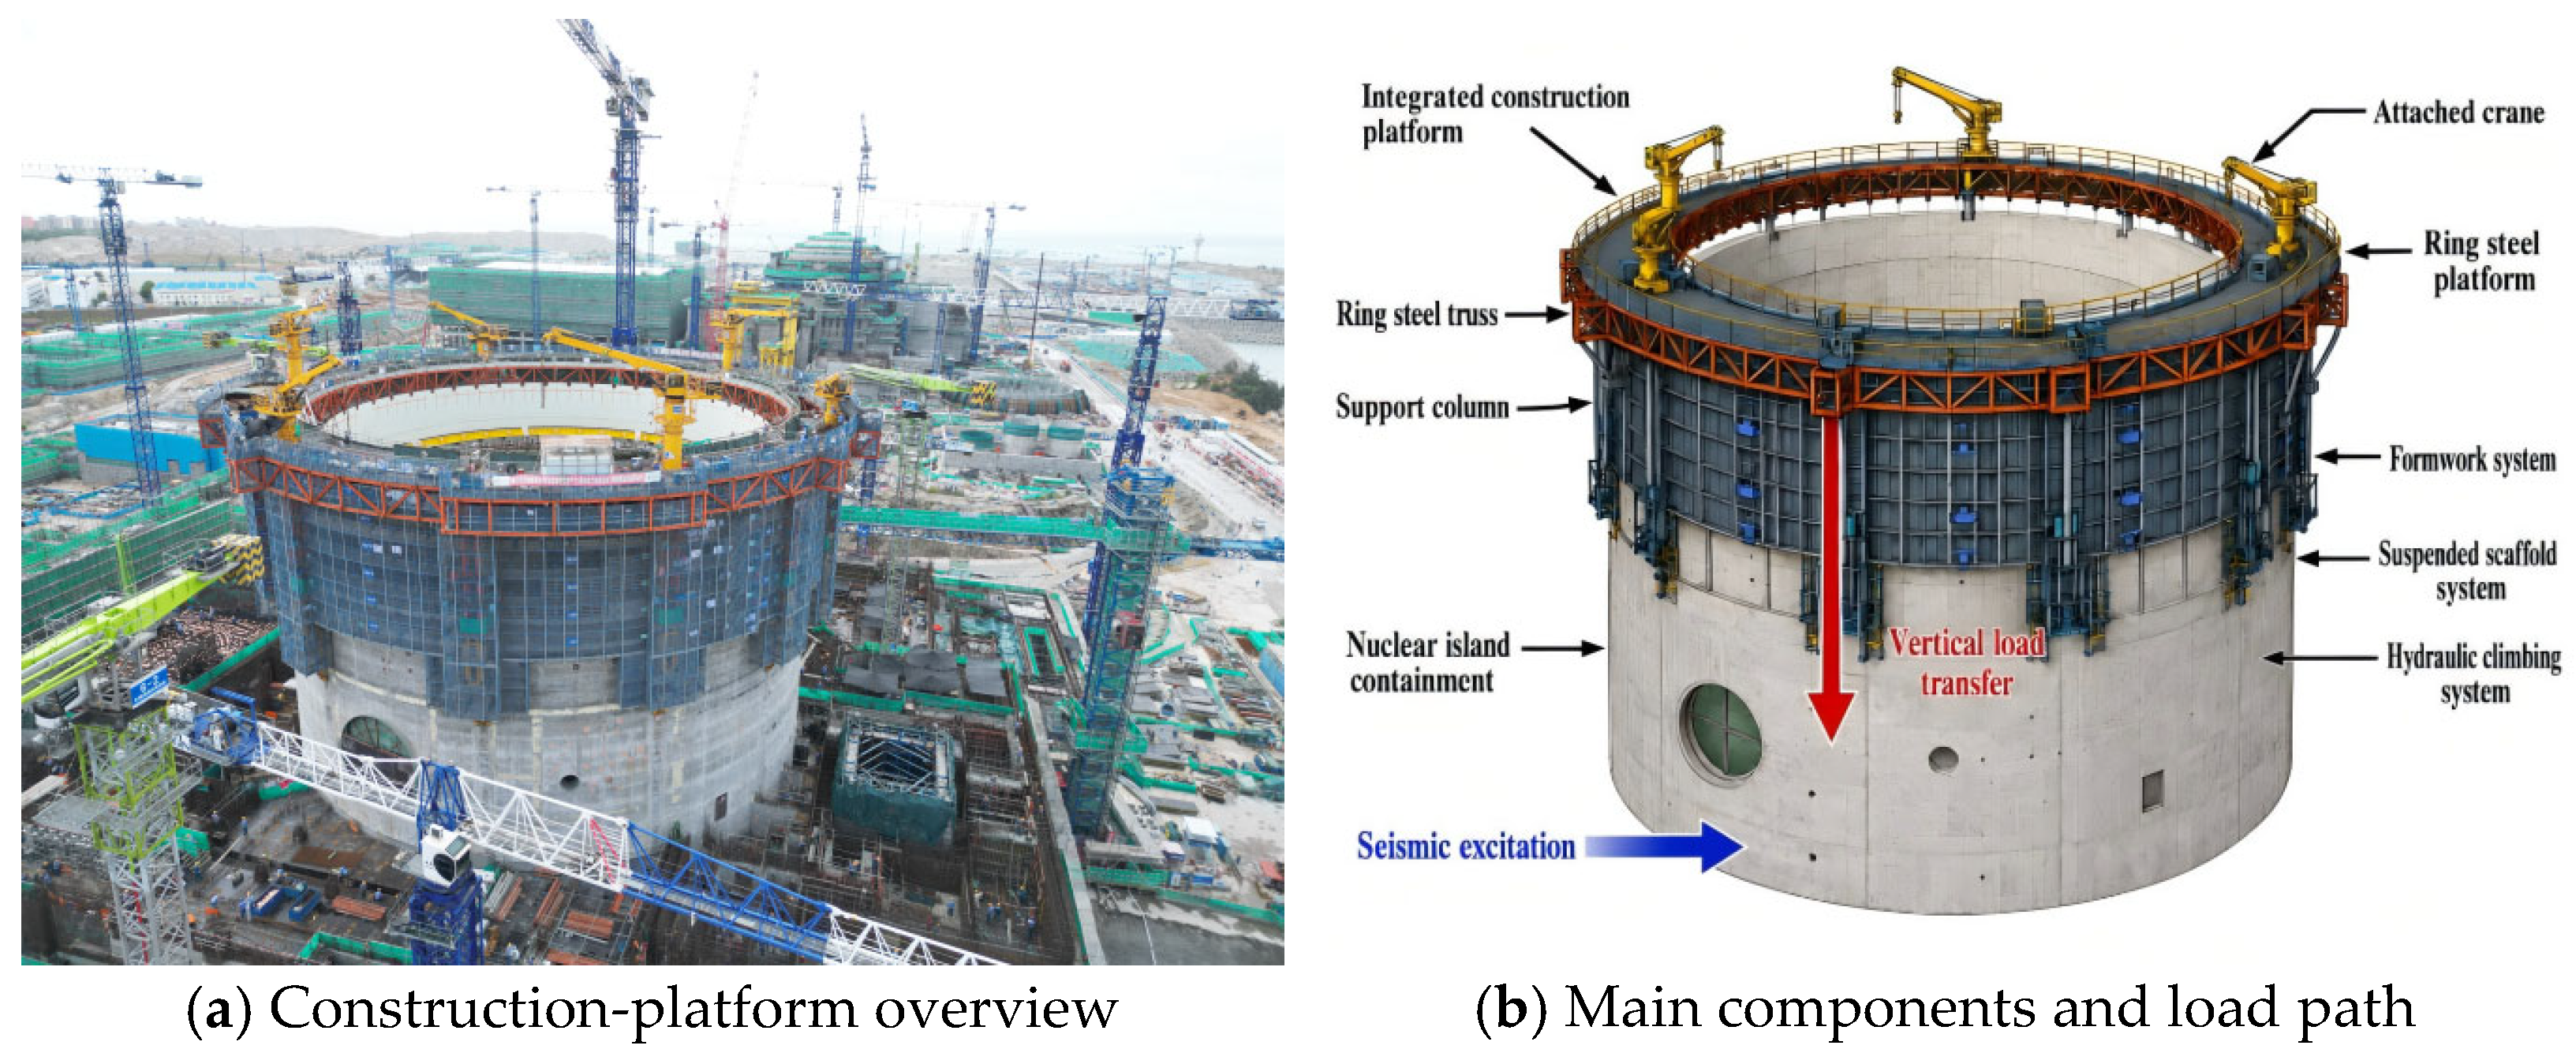
The engineering setting considered here is an integrated construction platform used for simultaneous construction of the inner and outer containment shells of an HPR1000 nuclear power plant in China. The equipment extends integral steel-platform technology developed for tall-building construction [6] to a circumferential platform serving a double-shell containment [7]. As illustrated in Figure 1, 12 attached cranes transfer lifting loads to the platform and then to the outer containment. Differences in stiffness, mass distribution, and attachment elevation create a coupled response problem that is distinct from the assessment of a crane on a rigid foundation.
Figure 1.
Integrated construction platform for nuclear containment construction: site overview and principal equipment components: (a) construction-platform overview; (b) main components and load path.
International research establishes a rigorous basis for probabilistic seismic assessment. Vamvatsikos and Cornell introduced incremental dynamic analysis (IDA) as a framework for tracing structural response over increasing excitation intensities [8]. Baker examined statistical fitting of analytical fragility functions and the efficiency of alternative analysis strategies [9]. The review by Zentner et al. discusses fragility approaches and their application in nuclear engineering [10]. Mai et al. show that the adequacy of a lognormal representation depends on the intensity measure, limit state, and estimation procedure [11]. These studies motivate explicit treatment of the conditioning intensity, the adopted failure criterion, and sampling limitations rather than treating a fitted curve as a complete description of seismic risk.
For nuclear structures, the choice of intensity measure is particularly important because ground-motion frequency content and structural filtering affect different response quantities. Nguyen et al. compared 23 intensity measures for nuclear power plant structures and found that their effectiveness depends on the response and ground-motion characteristics [12]. More recent work uses copula-based cloud analysis for containment fragility [13] and stripe-based nonlinear analysis for prestressed concrete containment structures, with explicit consideration of demand and capacity variability [14]. These contributions strengthen the assessment of permanent nuclear structures, but they do not provide directly transferable deformation limits or fragility functions for the temporary cranes considered here. Research on containment, auxiliary, and conventional-island structures similarly addresses different structural configurations and performance objectives [15,16,17].
Related studies of cranes attached to tall buildings have addressed wind-induced vibration, tornado vulnerability, and earthquake response [18,19,20]. They demonstrate the importance of considering the supporting structure and attachment configuration. Nevertheless, a circumferential construction platform on a relatively stiff containment differs from a high-rise core in geometry, support conditions, and local load paths. Studies of slender structures also identify the contribution of higher modes to attached or concentrated masses [21]. For the present system, the unresolved questions are how the coupled response is transmitted to individual cranes, how boom orientation and circumferential location are associated with damage, and how individual results can support group-level screening without assuming that the cranes fail independently.
This study addresses these questions through a case-specific numerical assessment. Its contribution is the integration of coupled-system response analysis, comparisons among crane orientations and locations, and two complementary assessment paths: ground-acceleration-based screening of the crane group and response-based assessment when crane-base measurements are available. The work does not introduce a new general fragility estimator, and its numerical thresholds are conditional on the adopted configuration and damage criteria. Section 2 describes the geometry, material models, idealizations, and modal characteristics. Section 3 defines the ground-motion input, deformation thresholds, and fragility framework. Section 4 analyzes response transmission, individual and group fragility, intensity-measure performance, and the limitations governing interpretation. Section 5 summarizes the main findings and their applicable scope.
2. Materials and Methods
2.1. Engineering Configuration and Reported Dimensions
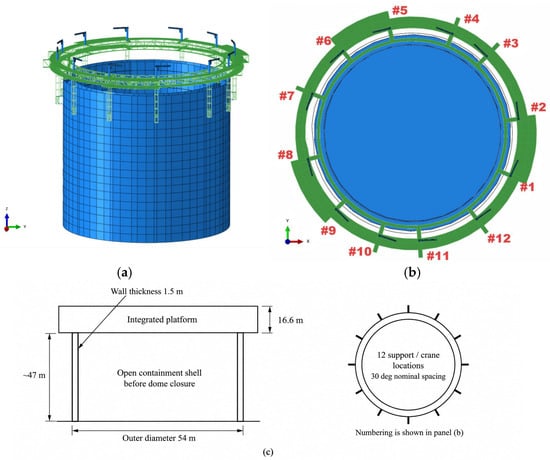
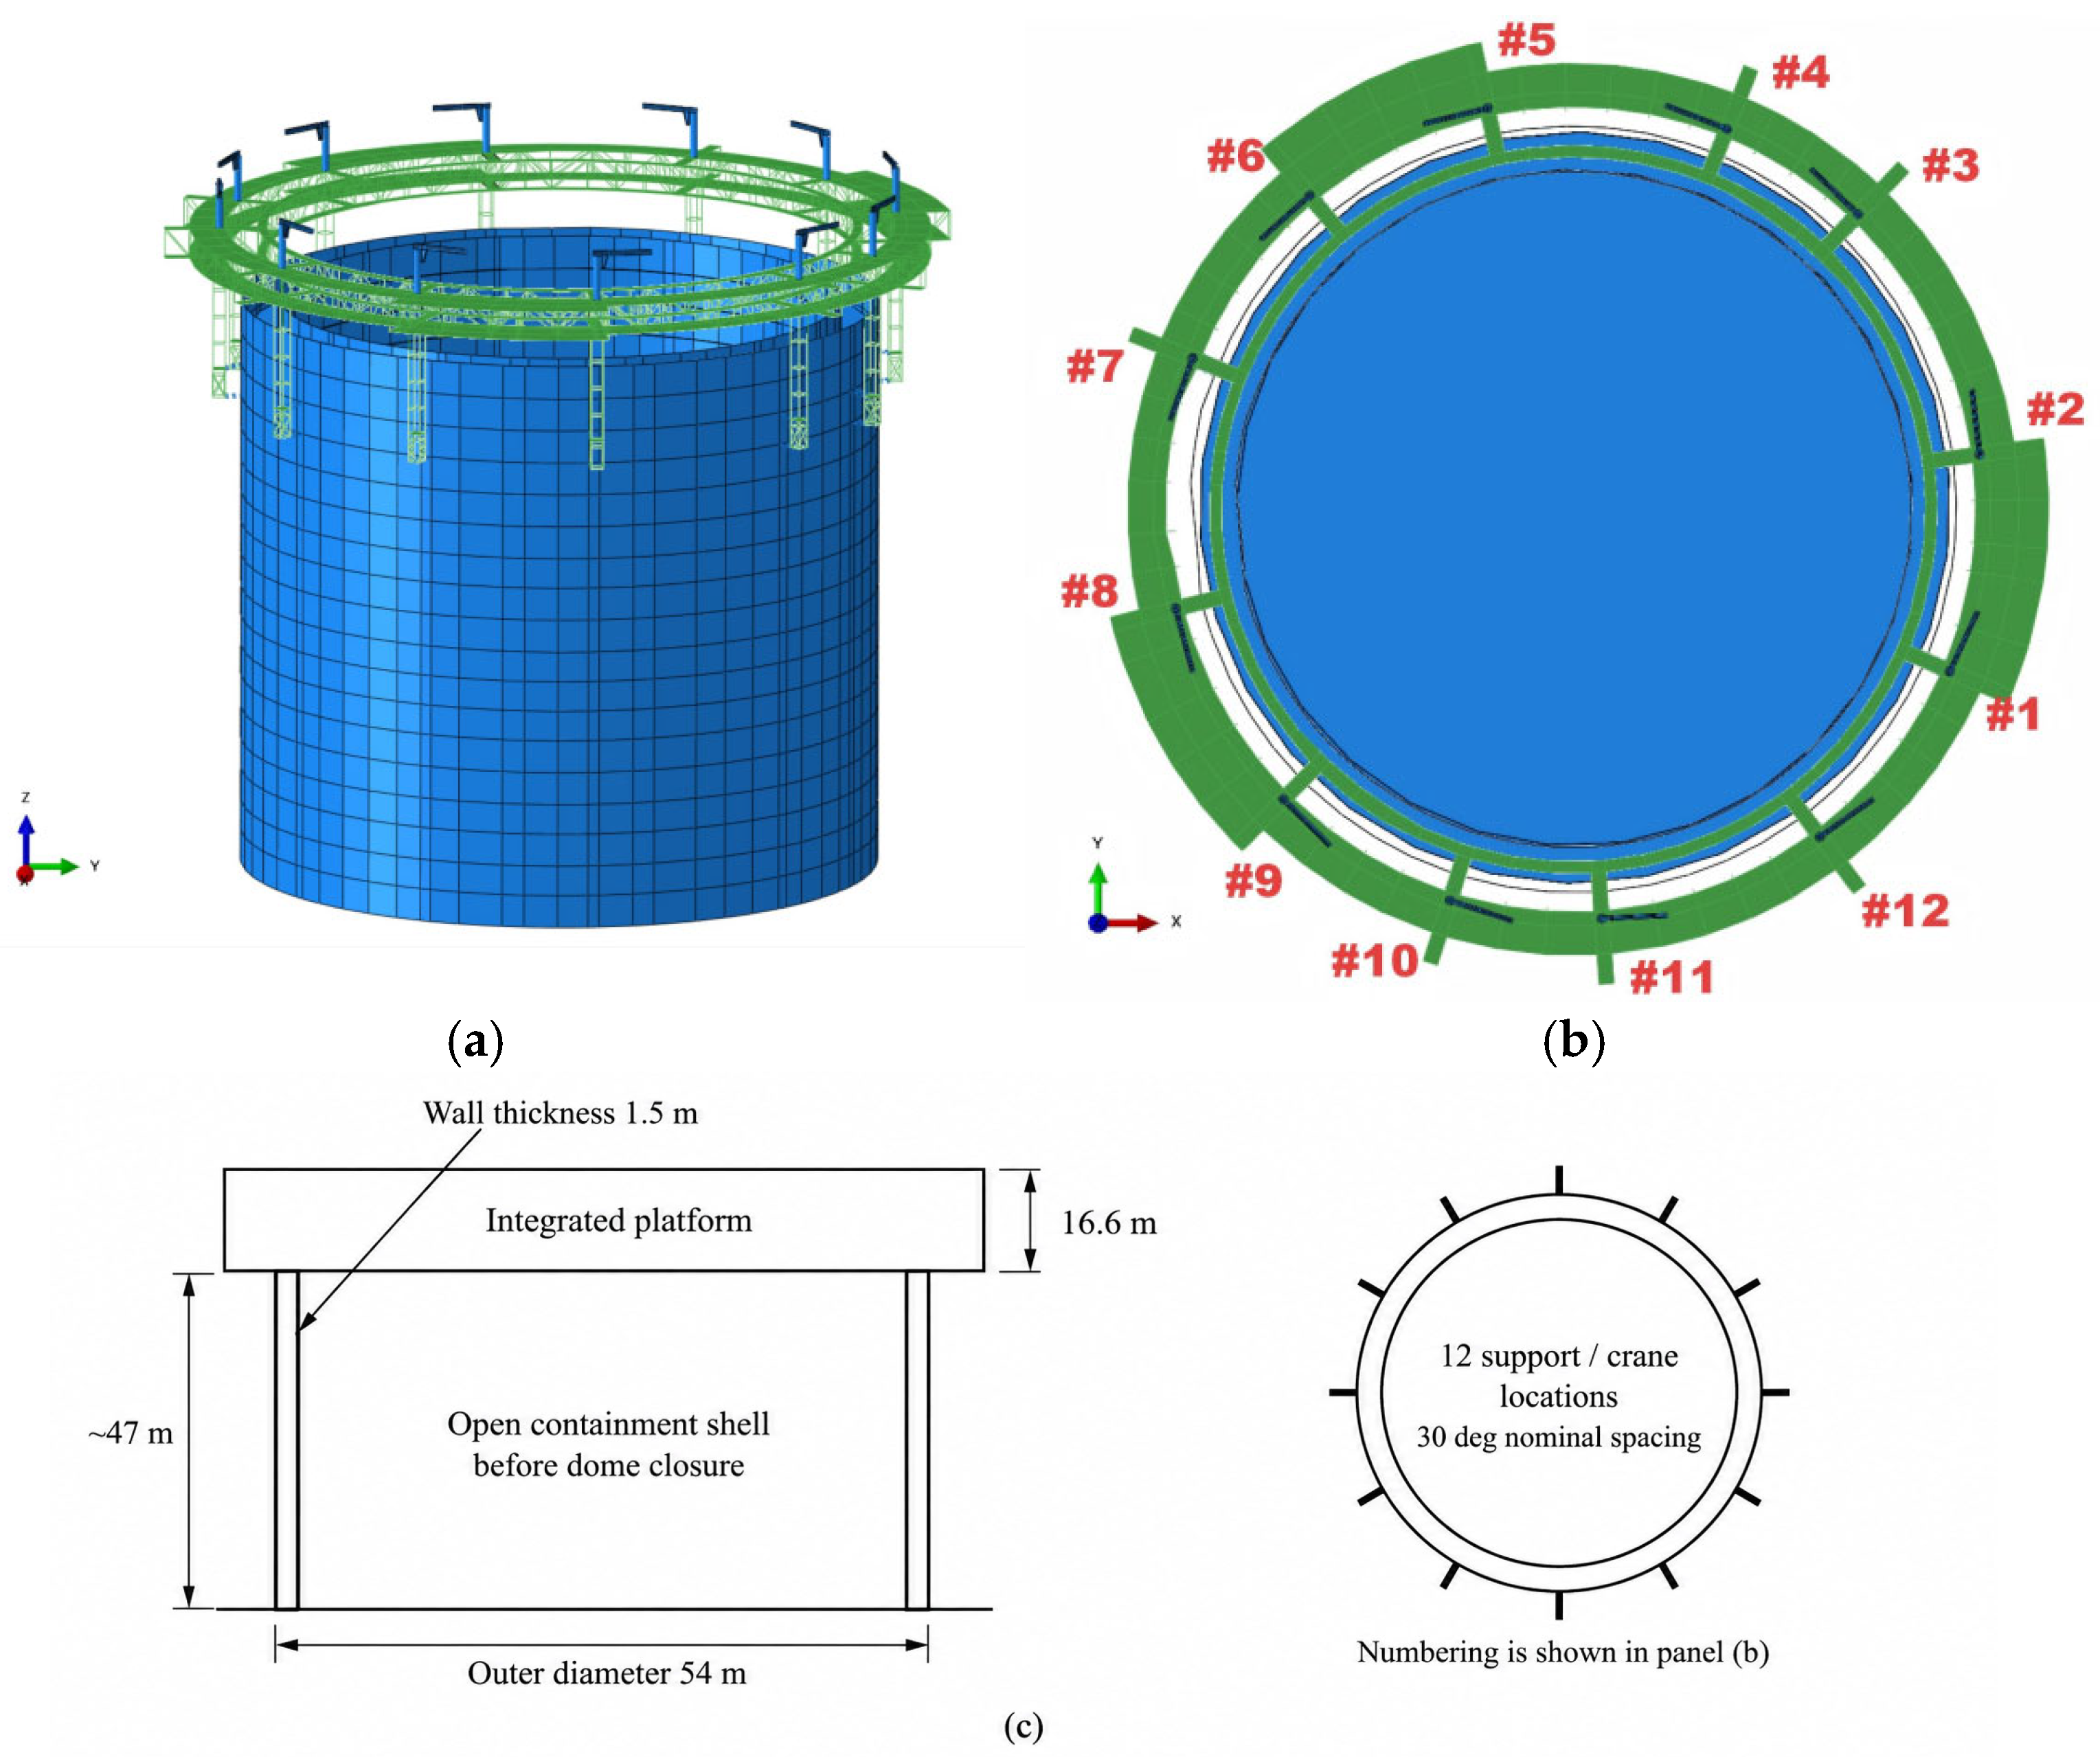
The integrated platform is an approximately 1400 t, 16.6 m high temporary steel system serving a double-shell reinforced-concrete containment. Its main load-carrying system is a spatial ring truss connected to the outer containment through 12 support locations. The reported outer-shell diameter is 54 m and its wall thickness is 1.5 m. The analyzed construction stage corresponds to a cylinder height of approximately 47 m before dome closure. This stage is selected to examine an elevated platform on an open cylindrical shell; it is not asserted to be the most unfavorable stage for every earthquake spectrum.
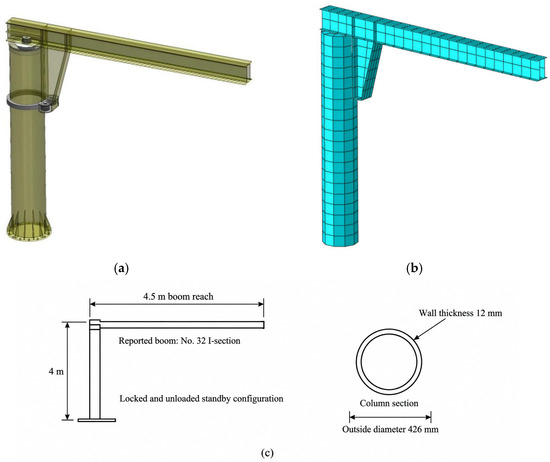
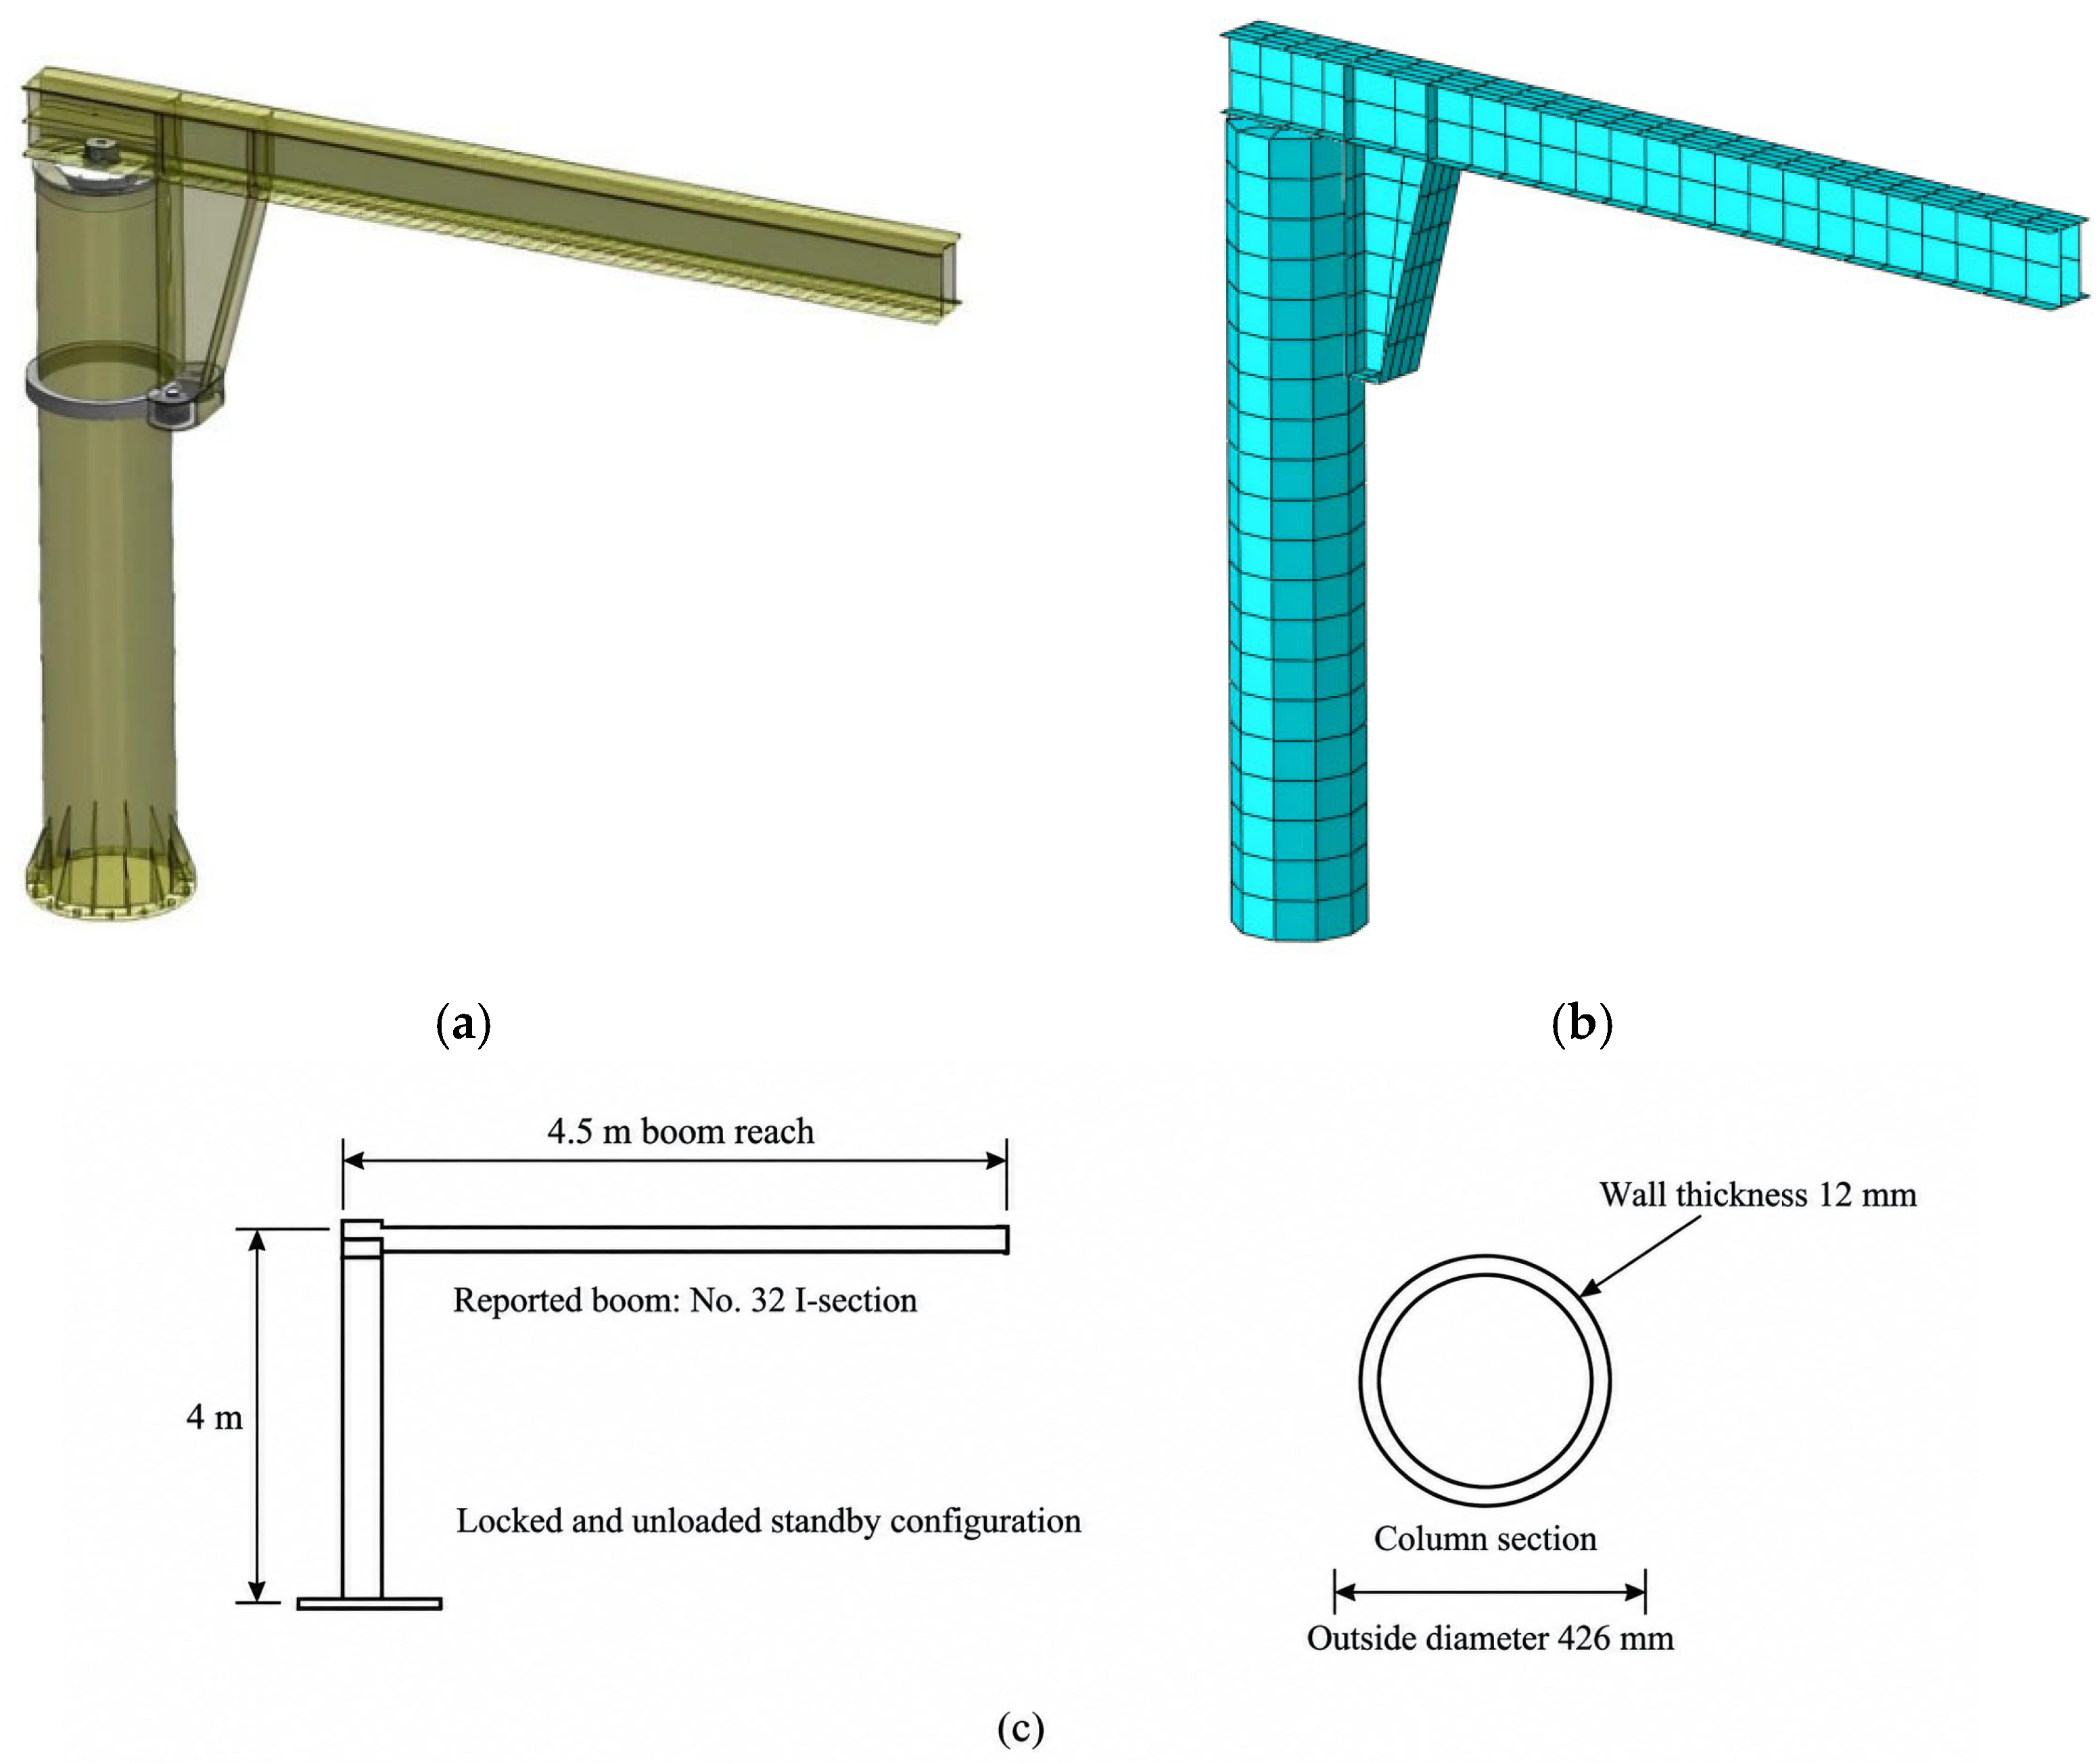
Twelve attached cantilever cranes are distributed around the platform, approximately above its principal columns. Each crane has a reported rated lifting capacity of 2 t, a 4.5 m slewing radius, a 4 m column, and a circular steel column section with an outside diameter of 426 mm and wall thickness of 12 mm. The boom is reported as a No. 32 I-section. The seismic analyses concern the unloaded standby configuration; the rated capacity describes the equipment and is not an applied suspended payload.
The dimensions are the project and equipment values reported for this case study, rather than parameters optimized by the fragility analysis. Figure 2c identifies the crane dimensions, and Figure 3c identifies the containment and platform dimensions. The schematics distinguish reported dimensions from an exact fabrication drawing and are not to scale. They do not prescribe unreported section details, inner-shell dimensions, bolt pretension, or reinforcement diameters. Changing the shell height, platform stiffness, or crane section changes the dynamic system and requires a separate assessment.
Figure 2.
Attached crane geometry and model: (a) crane geometry; (b) simplified crane finite-element model; (c) a dimension key based on reported equipment values. The rated lifting capacity is 2 t; no suspended payload is included in the analyzed standby case.
Figure 3.
Containment–platform–crane system: (a) coupled finite-element model; (b) plan view, global axes, and crane numbering; (c) reported dimensions for the open-shell. The schematic identifies component dimensions and does not prescribe detailed attachment elevations.
2.2. Coupled-System Modeling
2.2.1. Modeling Assumptions
The model represents the stationary construction configuration rather than platform climbing, lifting operations, or post-installation operation of the completed nuclear plant. The principal idealizations concern the crane locking mechanism, the support interfaces, the treatment of secondary masses, and the absence of foundation flexibility.
For the crane, the boom-to-column slewing mechanism is idealized as locked, and its base attachment is treated as rigid in the stated analysis description. Local bolt slip, bearing clearance, uplift, and anchorage failure are not explicitly modeled. A rigid interface can transmit support motion efficiently, but it also changes modal frequencies; it cannot be assumed to maximize every seismic response over all ground-motion spectra. The adopted idealization is therefore a modeling assumption rather than a demonstrated upper bound.
For the platform, the short-duration climbing state is excluded. The hanging system is represented through equivalent mass and loading on the lower truss chord because its contribution to primary stiffness is neglected. The secondary passage structure linking the shells is idealized as rigid. Local containment openings, penetrations, and their reinforcement details are omitted, and the reported reinforcement spacing is taken as 200 mm. These simplifications retain a global load path while limiting conclusions about local shell stresses.
The platform support attachment to the containment and the column–truss interface are distinct parts of the load path. The reported shell attachment contains 16 high-strength embedded bolts per support, with no explicit local slip or contact law. The existing model description does not establish a unique column–truss rotational restraint. This restraint is therefore treated as model-definition uncertainty rather than alternately classified as fully hinged and fully moment-resisting. The reported numerical results remain conditional on the underlying idealization, and a general upper-bound response is not inferred from the assumed attachment rigidity.
No suspended payload is included. Consequently, pendulum motion, hoisting-rope flexibility, payload–structure interaction, and operating slewing dynamics are outside the present scope. This unloaded configuration isolates the response of the crane and its supporting system but does not cover all operational conditions.
2.2.2. Material and Element Models
The reported nonlinear analyses were performed in Abaqus [22]. The outer and inner containment concretes are designated C50 and C60. Concrete damaged plasticity is used to represent cracking-related stiffness degradation and nonlinear compression, following the general model framework of Lee and Fenves [23]; the concrete stress–strain and damage relationships are based on GB 50010-2010, 2015 edition [24]. The reported plasticity parameters are a dilation angle of 38°, eccentricity of 0.1, deviatoric invariant ratio Kc of 0.667, and viscosity parameter of 0.005. These parameters describe the adopted numerical model; they have not been calibrated against tests on this project.
Reinforcement and structural steel use a bilinear kinematic-hardening idealization, with an elastic modulus of 2.0 × 10⁵ MPa and a post-yield tangent modulus equal to 1% of the elastic modulus. Steel yield strengths are assigned according to the relevant steel grades and GB 50017-2017 [25]. Material hardening and concrete damage provide nonlinear hysteretic response within the idealized components. The constitutive idealization does not explicitly represent bolt fracture, weld rupture, or degradation of an interface, which remain separate sources of modeling uncertainty.
The crane and containment are represented by four-node reduced-integration shell elements. Reinforcement is distributed through the containment shell sections. The platform truss members are represented by axial-force elements, with two-node connection elements used for idealized interfaces as reported in the model description. An axial truss element has no member bending degrees of freedom; its common-node connectivity must therefore not be described as proof of moment-resisting frame action. Any rotational restraint supplied through other members or constraints requires separate identification.
Plastic hinges are not assigned as discrete concentrated springs to the shell-modeled crane. Yielding and damage instead develop through the material constitutive response over the shell mesh. This distributed-plasticity description can identify yielding near the boom–column junction and column base, but local bolt fracture, weld rupture, and contact failure require additional component models. It also does not independently establish a collapse capacity for the physical crane.
2.2.3. Mesh Loads and Boundary Conditions
The reported nominal shell mesh size is approximately 1 m for the containment and 0.1–0.2 m for the crane, with the finer mesh used near geometric transitions. This mesh description identifies the resolution of the model; it is not a mesh-convergence demonstration. Local strain peaks may be mesh-sensitive, especially at idealized junctions, and should be interpreted with the deformation response and yielding distribution rather than as independently validated fracture predictions.
The containment base is fully fixed and the incomplete top is free. Gravity is included. The reported platform construction-load intensities are 5 and 10 kN/m2; the suspended working-deck load is 2.5 kN/m2 and is represented on the truss load path. These loads describe the construction platform and working deck rather than a payload suspended from the crane. Crane numbering and global axes are shown in Figure 3.
The fixed-base idealization excludes soil–structure interaction, foundation rocking, soil hysteresis, and radiation damping. No site soil class or measured Vs30 is established by the present model description. Selection of a reference response-spectrum shape should not be interpreted as identification of the project soil profile. A site-specific extension would require geotechnical properties, an appropriate foundation/input-motion model, and a consistent comparison with the fixed-base system.
2.2.4. Damping and Numerical Interpretation
Geometric nonlinearity and material nonlinearity are included in the stated time-history analysis. The reported elastic damping target is 3%, selected to represent the steel crane/platform system, and the response-spectrum comparisons use the same 3% damping ratio. The damping assumption is separate from the material hysteresis represented by the steel and concrete models.
Rayleigh damping is expressed as C = αM M + αK K, where M and K are the mass and stiffness matrices. Its modal damping ratio is ξ(ω) = αM/(2ω) + αKω/2. For equal target damping ξ0 at two circular frequencies ωa and ωb, the general coefficient relations are αM = 2ξ0ωaωb/(ωa + ωb) and αK = 2ξ0/(ωa + ωb). These relations explain the frequency dependence of the damping model; they are not newly calibrated coefficient values for this system. The stated 3% target does not imply 3% damping at every frequency or throughout a nonlinear response. Stiffness-proportional damping can become excessive outside its calibration band, so the resulting response is conditional on this damping idealization.
No additional explicit friction-damping, bolt-slip, or payload-damping elements are specified. Friction at real interfaces may dissipate energy, while slip or connection softening can increase relative displacement and shift modal frequencies. The net effect on crane fragility depends on the interaction between frequency shift, damping, and failure mode; it is not necessarily beneficial. These mechanisms are discussed further in Section 4.6.
2.2.5. Validation Scope and Independent Comparisons
The present model has no reported full-scale shaking-table validation or component-test calibration. Modal mass accounting and physically plausible deformation patterns are internal consistency checks; they do not constitute experimental validation or independent cross-validation. The nonlinear response shown in Section 4.3 is likewise a numerical result of the assumed model. Experimental comparison, mesh/time-step sensitivity, and connection/damping sensitivity are required to quantify model-form uncertainty.
A hierarchical approach is appropriate for future independent validation. Han and Tesfamariam [26] compared connection, wall, and assembled-building models with tests in a cross-laminated timber application. The transferable methodological point is that connection behavior and system response require separate checks. Their timber constitutive laws and calibrated parameters do not validate the steel crane considered here.
For the present application, connection-level comparisons should address rotational stiffness, slip, and hysteretic response. Crane-level tests or an independent documented benchmark should compare periods, mode shapes, and tip/base transfer response. Platform and coupled-system comparisons should then examine measured modes and response histories at multiple attachment locations. Period, stiffness, peak-response, and hysteretic-response errors should be quantified using a stated metric and independent data. Mesh and time-step studies test numerical convergence and are additional to these physical comparisons. No such independent comparison results are available in the present assessment.
2.3. Dynamic Characteristics
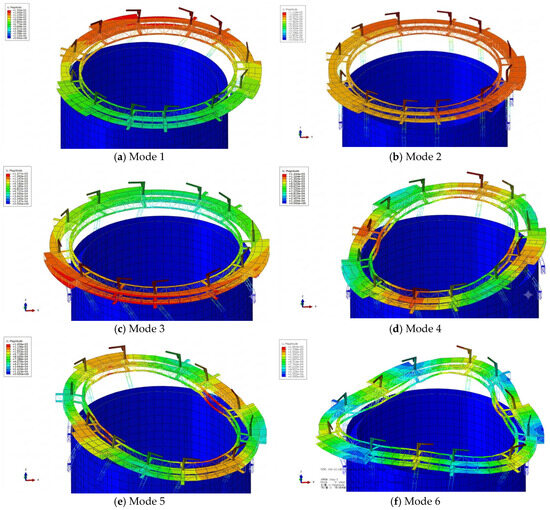
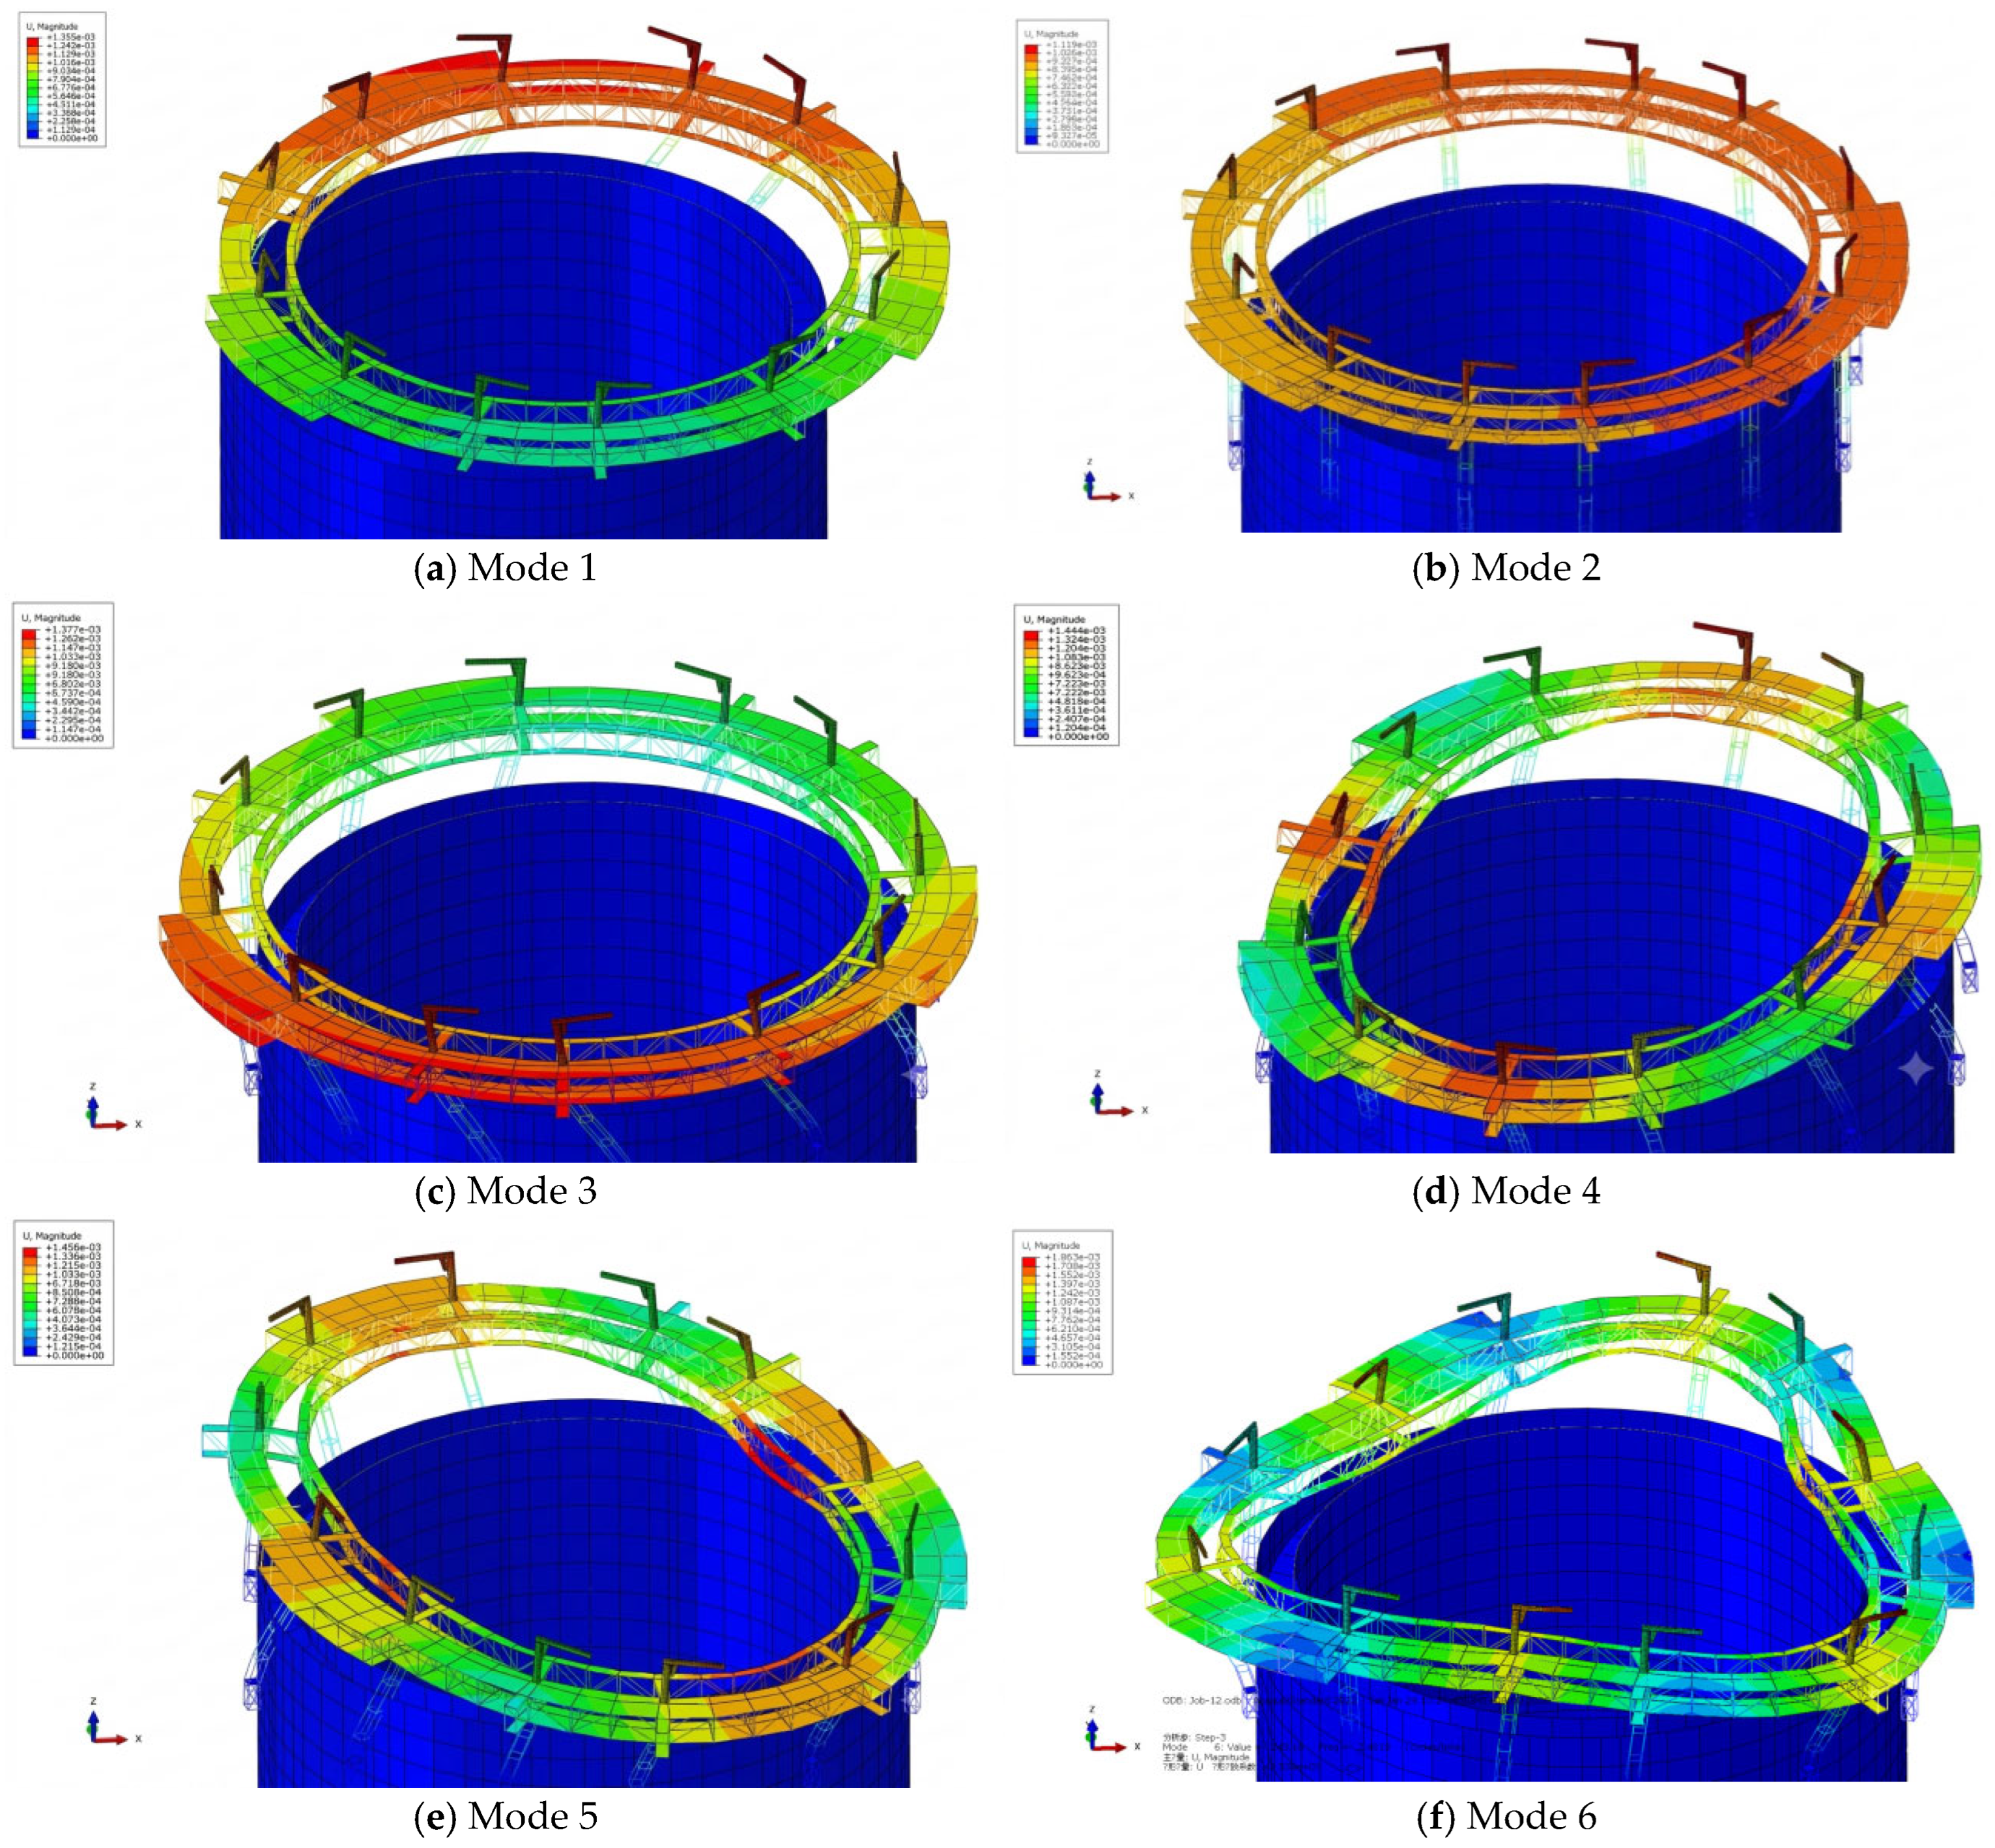
Modal analysis identifies the deformation patterns through which the support system can transmit and amplify excitation. Table 1 reports the first nine modes. The first three periods are 1.229, 1.216, and 1.190 s. In the global X direction, the corresponding effective modal mass ratios are 83.535%, 0.044%, and 12.769%, totaling 96.348%. The Y-direction total over these modes is 93.962%. These direction-specific sums should not be confused with adding translational and rotational mass percentages together.
Table 1.
Reported natural periods and direction-specific effective modal mass ratios.
Figure 4 shows that the containment deforms relatively little compared with the platform and cranes in the displayed coupled modes. In the first mode, the reported displacement at the illustrated crane tip is approximately 35% larger than that at its base. This is a relative mode-shape comparison, independent of the arbitrary eigenvector normalization, and is not a physical displacement under an earthquake. From the fourth mode onward, circumferential and radial deformation of the platform becomes more evident. The resulting attachment motions help explain differences in crane response.
Figure 4.
First six coupled-system mode shapes: (a) mode 1; (b) mode 2; (c) mode 3; (d) mode 4; (e) mode 5; (f) mode 6. Contour amplitudes are eigenvector-normalized displacements and are used to compare relative deformation patterns, not earthquake response amplitudes.
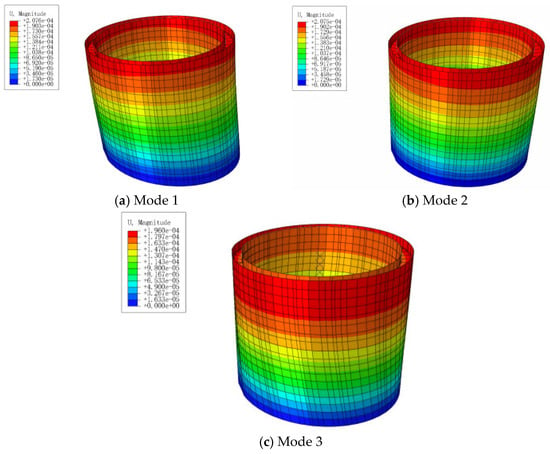
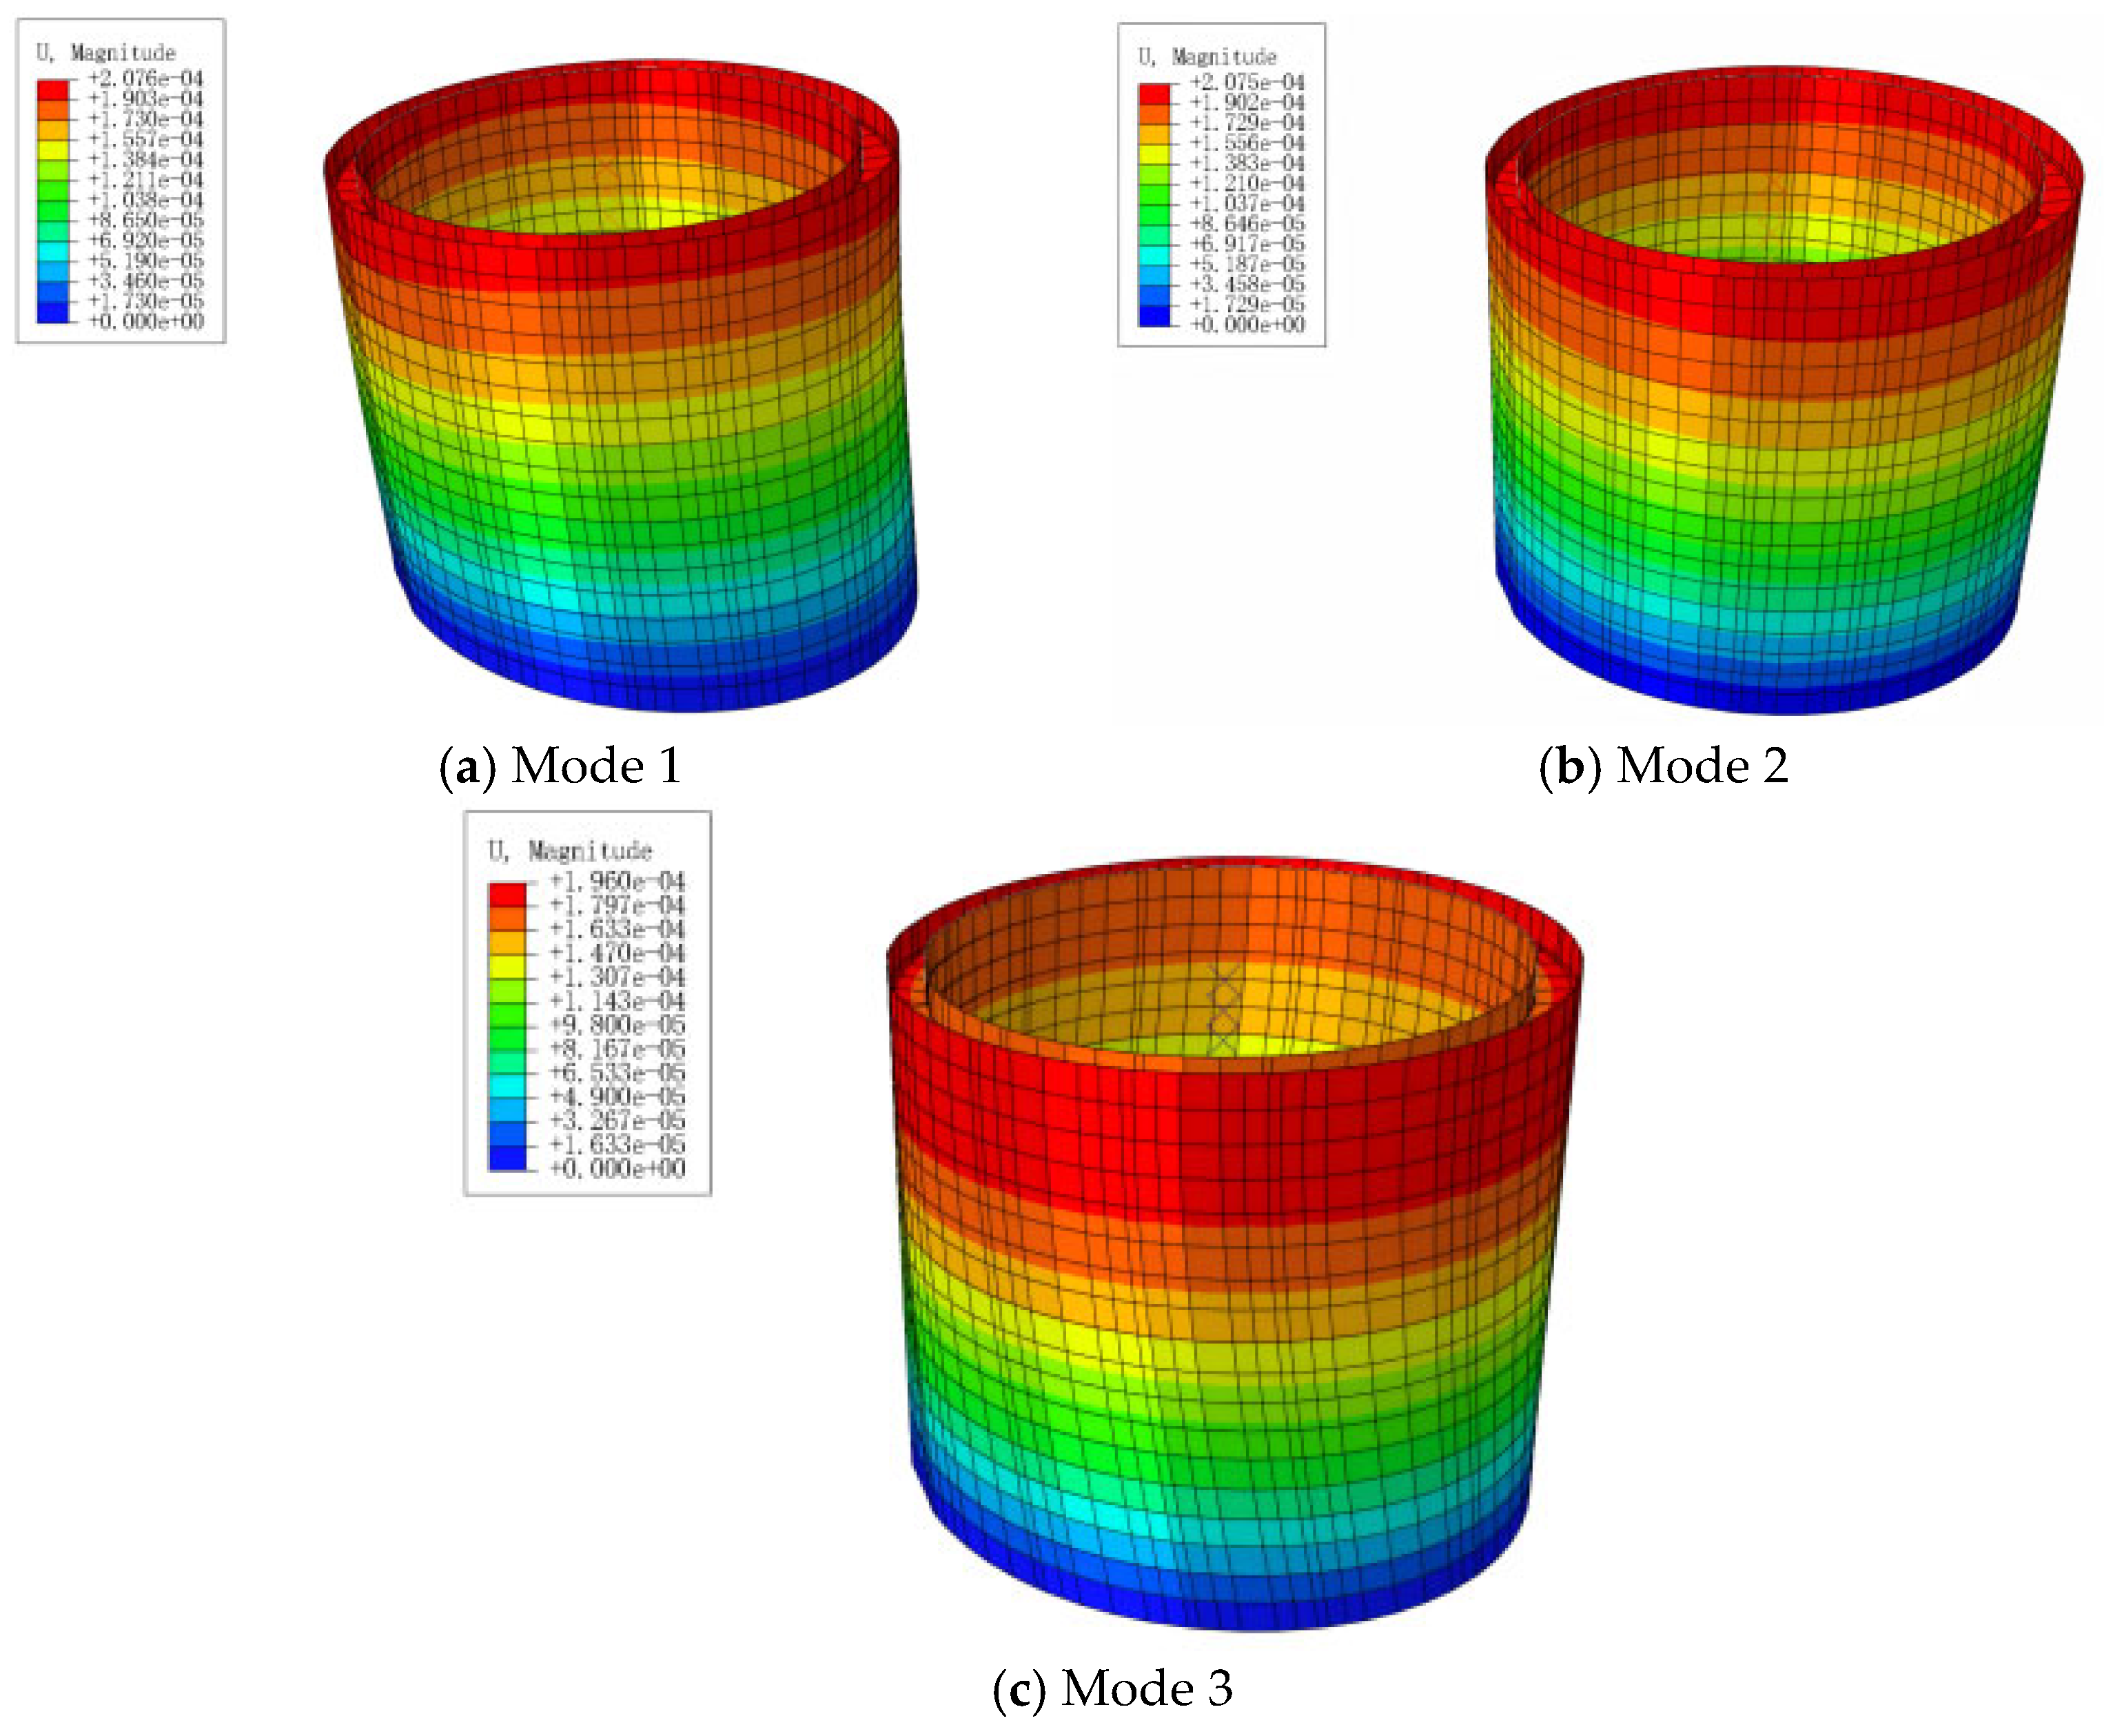
The isolated containment has a reported first-mode frequency of 7.64 Hz, corresponding to a period of approximately 0.131 s (Figure 5). Its period differs substantially from the coupled system period, indicating that adding the flexible platform and cranes changes the dominant response. Period separation alone does not rule out resonance with an input spectrum or eliminate higher-mode effects. The term whiplash effect is used here for the observed local response amplification associated with the stiffness contrast and flexible upper components.
Figure 5.
First three isolated-containment mode shapes: (a) mode 1; (b) mode 2; (c) mode 3. The reported first-mode frequency is 7.64 Hz (T ≈ 0.131 s); displayed amplitudes are normalized.
3. Seismic Input and Fragility Framework
3.1. Ground-Motion Records and Scaling
Eleven records identified in the PEER database are listed in Table 2 [27]. Their reported magnitudes range from 6.2 to 7.28, rupture distances from 0.34 to 205.26 km, and unscaled component PGAs from 0.004 to 0.404 g. The set spans multiple events, distances, and spectral shapes. Cape Mendocino is listed in 1992 and Landers in 1992, but they are distinct earthquake events; event name and station, rather than year alone, identify a record. The original PEER records and Abaqus input files were rechecked during revision, confirming that the analyses used the corresponding horizontal components. The filename strings retained in Table 2 are legacy identifiers from the original analysis summary and are not used to identify the applied-component orientation.
Table 2.
Ground-motion identifiers and reported unscaled component metadata.
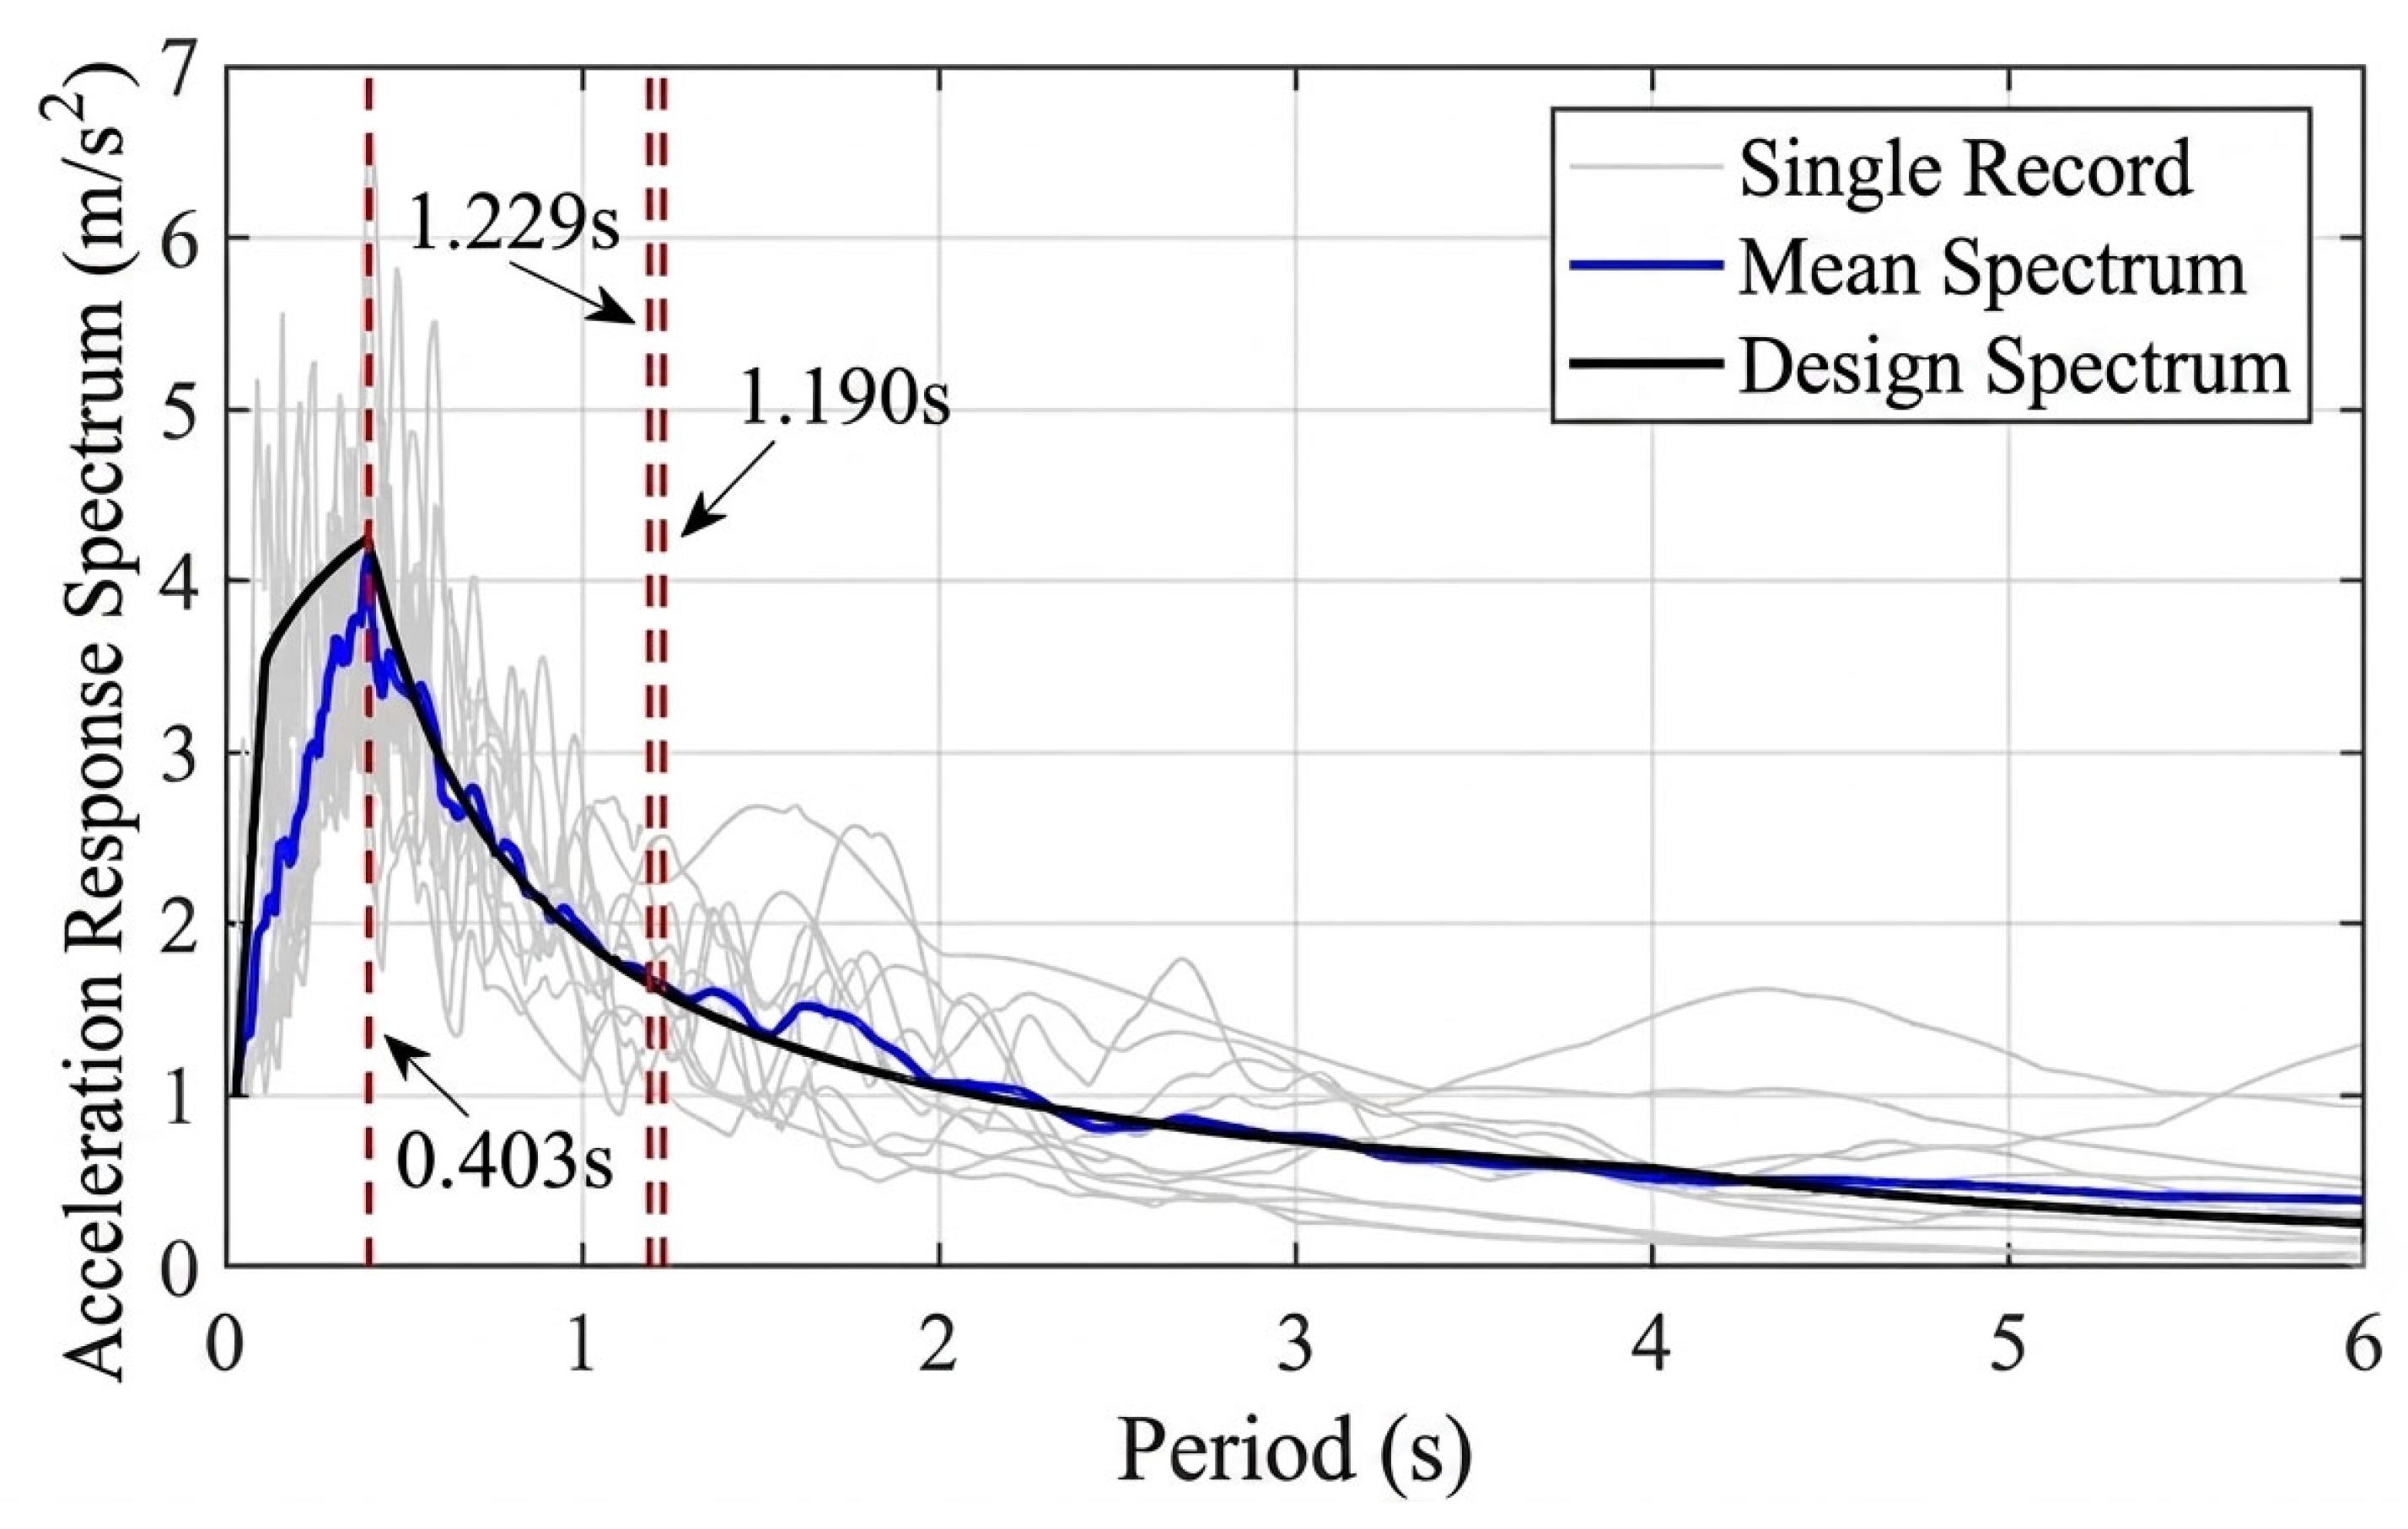
The reference spectral shape is the RG 1.60 nuclear design spectrum [28], considered alongside the nuclear seismic-design context of GB 50267-2019 [29]. It is used as a comparison target for the selected set, not as a project-specific uniform-hazard spectrum or evidence of a specified soil class. The first, third, and sixth modal periods reported in Table 1 are used as comparison checkpoints. Their X-direction mass contributions are 83.535%, 12.769%, and 0.009%, respectively; the sixth mode is a short-period checkpoint rather than a major effective-mass contributor.
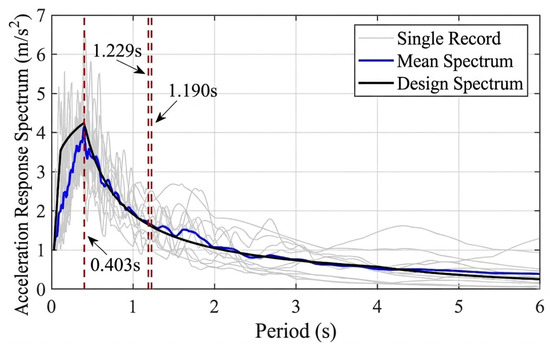
Figure 6 shows the reported 3%-damped response spectra after normalization to a common PGA. The reported mean-spectrum deviations at T1 = 1.229 s, T3 = 1.190 s, and T6 = 0.403 s are 3.44%, −4.11%, and −2.91%, respectively. The inspected period interval is 0.403–2.458 s, with the upper endpoint equal to 2T1. Agreement at these checkpoints supports the stated spectral comparison but does not establish uniform agreement at every period, representation of hazard at all intensities, or control of duration and pulse effects. Arithmetic mean spectra also do not eliminate record-to-record variability.
Figure 6.
Record response spectra and RG 1.60 reference comparison at 3% damping and common peak normalization. Dashed vertical lines identify T1, T3, and T6; individual curves show record-to-record spectral variability.
For an acceleration history ai(t) with unscaled peak Pi = max|ai(t)| and a target peak P, amplitude scaling is defined by ai,P(t) = λi(P)ai(t), where λi(P) = P/Pi, using consistent units. When P and Pi are both expressed in g, λi is dimensionless. The procedure changes amplitude while preserving the record time step, duration, and relative frequency content; it is not time-axis scaling or waveform spectral matching. The recorded magnitude does not determine whether the crane yields: the imposed intensity and resulting response do.
The reported analysis applies one horizontal acceleration component along the global X direction at the fixed containment base. The original PEER records and Abaqus input files were rechecked during revision, confirming that the corresponding horizontal components were used. The legacy identifiers retained in Table 2 should not be interpreted as the applied-component labels. The reported curves are therefore treated as case-specific unidirectional horizontal-input results for the selected waveform suite, rather than as site-specific hazard fragilities. A second horizontal component and vertical excitation are outside the present scope and are discussed in Section 4.6.
A single horizontal input direction was used to isolate the response of the stated crane layout. This is a scope choice, not a requirement of scalar fragility analysis: scalar intensity measures can also condition analyses with paired horizontal components. Near-equal translational periods do not prove direction-independent response of discrete cranes. The limitations of omitting the second horizontal and vertical components are discussed in Section 4.6.
3.2. Record-Set Size and Statistical Resolution
The 11-record set is a computational compromise for an exploratory nonlinear case study. Distinct earthquake events reduce repeated-event sampling, and mean-spectrum comparison checks one aspect of representativeness. Neither establishes statistical convergence of a fitted fragility function. Earlier IDA and fragility-fitting studies emphasize that estimation quality depends on the available response data, sampling strategy, and target limit state [8,9]. There is no universal minimum number that makes every damage probability reliable.
At an intensity for which 11 independent record-level binary exceedances are available, the empirical exceedance proportion changes in increments of 1/11 ≈ 0.091. Its binomial standard error is √[p(1 − p)/11], which reaches approximately 0.151 at p = 0.5. These values illustrate finite-sample resolution; they are not confidence intervals for the fitted lognormal curves, and dependence would further change uncertainty. Repeated amplitude levels from the same record and responses of 12 cranes under a common excitation must not be counted as independent earthquake realizations.
Accordingly, the results are reported as model-conditional estimates, with particular caution for low-probability tails. A stronger sufficiency assessment would expand the horizontal-motion set, resample at the earthquake-record level, and track the stability of median capacities, dispersions, and selected threshold PGAs. Bootstrap confidence bands and leave-one-record-out stability checks are appropriate follow-up analyses. No such convergence or confidence-band result is claimed here.
3.3. Choice of PGA and Analysis Intensities
Ground peak acceleration, denoted PGAg, is used for the principal fragility curves because it gives a transparent amplitude-scaling parameter and can support rapid site-level screening. It is readily related to a recorded site peak and the reported nuclear design-spectrum comparison. However, it does not encode duration or spectral ordinates and is not assumed to be the most efficient ground-motion intensity measure for every structural response [12].
The existing results include a 0.1–1.0 g intensity sequence in the damage-evolution diagrams, a 0.5 g response-transmission example, and a 1.0 g nonlinear-response example. The 0.5 and 1.0 g cases are diagnostic analysis levels, rather than assigned design-basis or return-period values. The sequence covers pronounced response changes and the adopted high-damage threshold in the reported model. Its 0.1 g spacing may under-resolve the lower thresholds; interpretation of threshold PGAs below 0.1 g depends on the actual analysis grid and fitting procedure, not on treating fitted values as additional simulations.
The median reported D4-threshold PGAs of Cranes 2 and 5 are 0.275 and 0.399 g, respectively. These are 50% conditional exceedance levels for the adopted deformation threshold, not prescribed input levels and not proof of compliance with a site-specific safe-shutdown earthquake. A design-basis assessment additionally requires the site hazard, acceptance criteria, and quantified modeling uncertainty.
3.4. Damage States and Deformation Measure
A deformation-based engineering demand parameter is adopted because the crane is a single-column cantilever system without conventional building storeys. It is the maximum horizontal relative displacement between the boom tip and column base, divided by the column height H = 4 m. The notation IDR is retained for comparison with the existing results, but it denotes a crane-relative deformation ratio rather than a conventional building interstorey drift ratio. If urel,x(t) and urel,y(t) are the two horizontal relative-displacement components, the resultant definition is IDR = maxt√[urel,x(t)2 + urel,y(t)2]/H. Time-coincident components must be combined before taking the maximum.
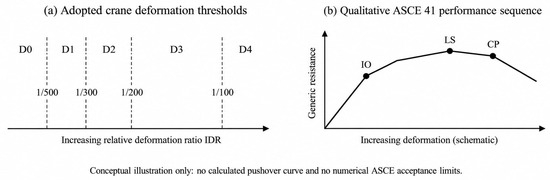
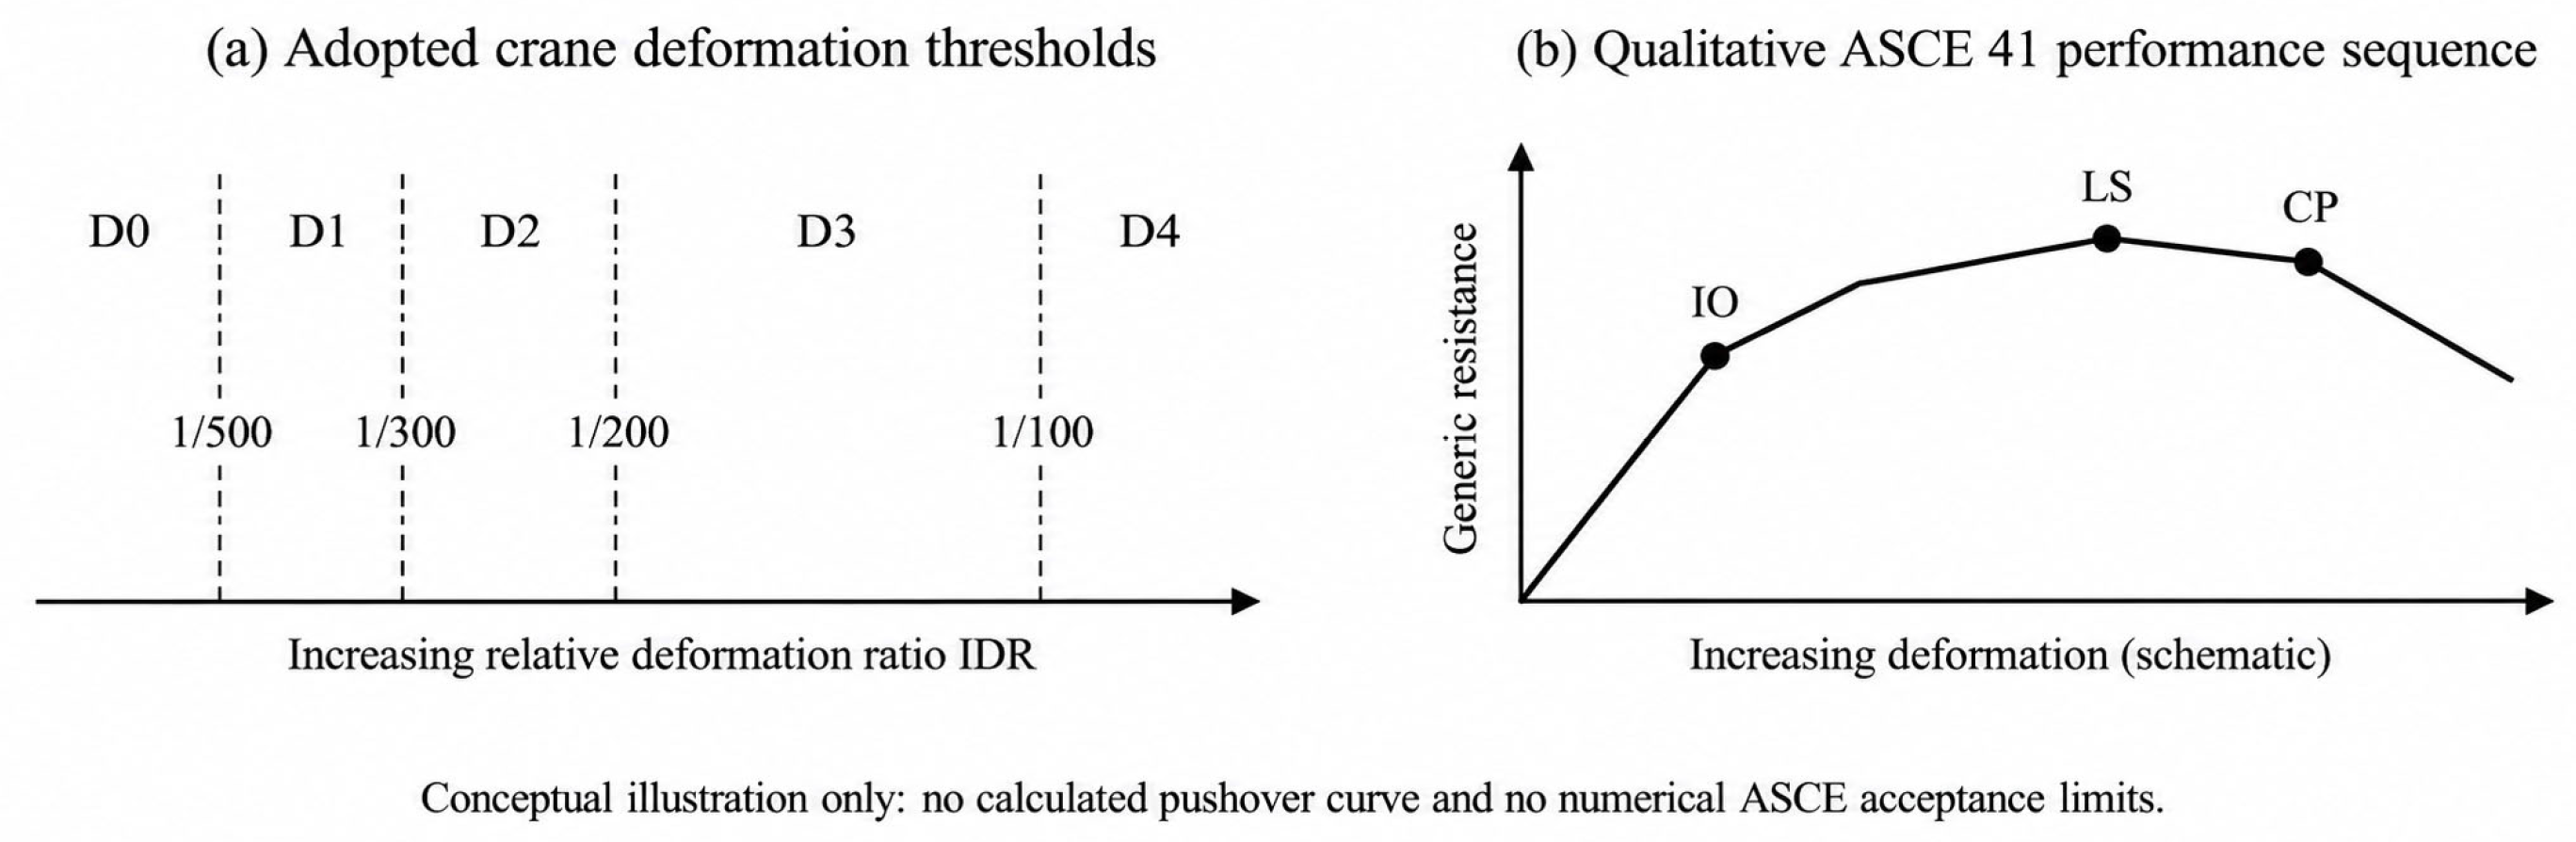
Four thresholds, 1/500, 1/300, 1/200, and 1/100, separate five states D0–D4 as summarized in Table 3. The thresholds were adopted by analogy with the attached-crane performance discussion in He et al. [19]. They are screening assumptions for this geometry, rather than experimentally calibrated fragility limits. The comparison with ASCE/SEI 41-23 [30] concerns the progression from limited damage to the life-safety and near-collapse objectives; the building standard does not prescribe these four ratios for the present crane.
Table 3.
Adopted deformation-based screening categories; threshold analogy after He et al. [19], with conceptual performance discussion informed by ASCE/SEI 41-23 [30].
Because boom-tip displacement includes column translation, column rotation, and boom flexure, applying a given ratio can be more restrictive than using column-top displacement alone. This observation does not validate transferring the same numerical thresholds between distinct cranes or between wind and earthquake loading. The sensitivity of fragility to alternative limit-state definitions remains an epistemic uncertainty.
ASCE/SEI 41-23 distinguishes structural performance levels such as Immediate Occupancy, Life Safety, and Collapse Prevention. Operational performance additionally involves nonstructural functionality; it is not an extra universal structural drift limit for cranes. Figure 7 provides an original conceptual illustration of the distinction between this study’s deformation thresholds and qualitative performance locations along a generic capacity curve. The figure is not a pushover analysis of the coupled model and supplies no new capacity data.
Figure 7.
Conceptual performance illustration. (a) Assumed crane deformation thresholds; (b) qualitative progression of Immediate Occupancy (IO), Life Safety (LS), and Collapse Prevention (CP) along a generic capacity curve. Panel (b) is informed by ASCE/SEI 41-23 and is not a reproduced standard figure or a calculated pushover curve of this system. Marker locations do not specify ASCE numerical acceptance criteria.
D4 is therefore treated as the highest adopted deformation threshold throughout the interpretation. Exceedance of 1/100 indicates entry into the adopted highest-damage category; it is not independently verified dynamic instability, loss of a load path, bolt fracture, or physical overturning. This qualification is essential when using the curves for emergency screening.
3.5. Reported Fragility Functions and Group Events
For damage threshold dsk, the conditional exceedance probability is represented by a lognormal fragility function [9,10]. The representation is a modeling choice rather than proof that demand and capacity are each lognormally distributed. Its suitability may vary with the damage state and intensity measure [11].
Here, Φ is the standard normal cumulative distribution function, C50,k is the median intensity associated with threshold k, and βk is its logarithmic dispersion. The parameter μ sometimes printed in the existing curve panels is ln(C50,k), with the intensity expressed numerically in g. Thus, exp(μ) gives the median PGA shown on those axes. βk describes the dispersion represented in the fitted data; without additional randomization of materials, connections, and capacity thresholds, it should not be called the total uncertainty of the physical system.
For each intensity and record, an exceedance indicator equals one if the crane deformation reaches the selected threshold and zero otherwise. Record-specific threshold-crossing intensities or empirical exceedance fractions provide the information used to fit a curve, depending on the implemented estimator. Interpolation, extrapolation below the smallest analyzed intensity, nonconverged runs, and records without a threshold crossing must be treated explicitly. No additional simulations are inferred from a smooth curve, and numerical nonconvergence alone is not evidence of physical collapse. The record-level fitting archive used to generate the legacy curves is not available in the material used for this revision; consequently, the curves are not independently refitted here and no new confidence intervals are reported.
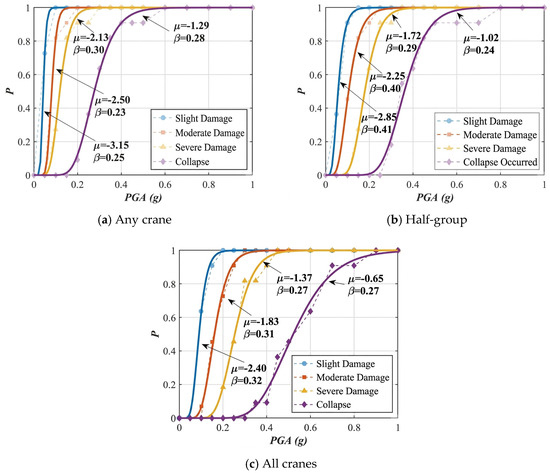
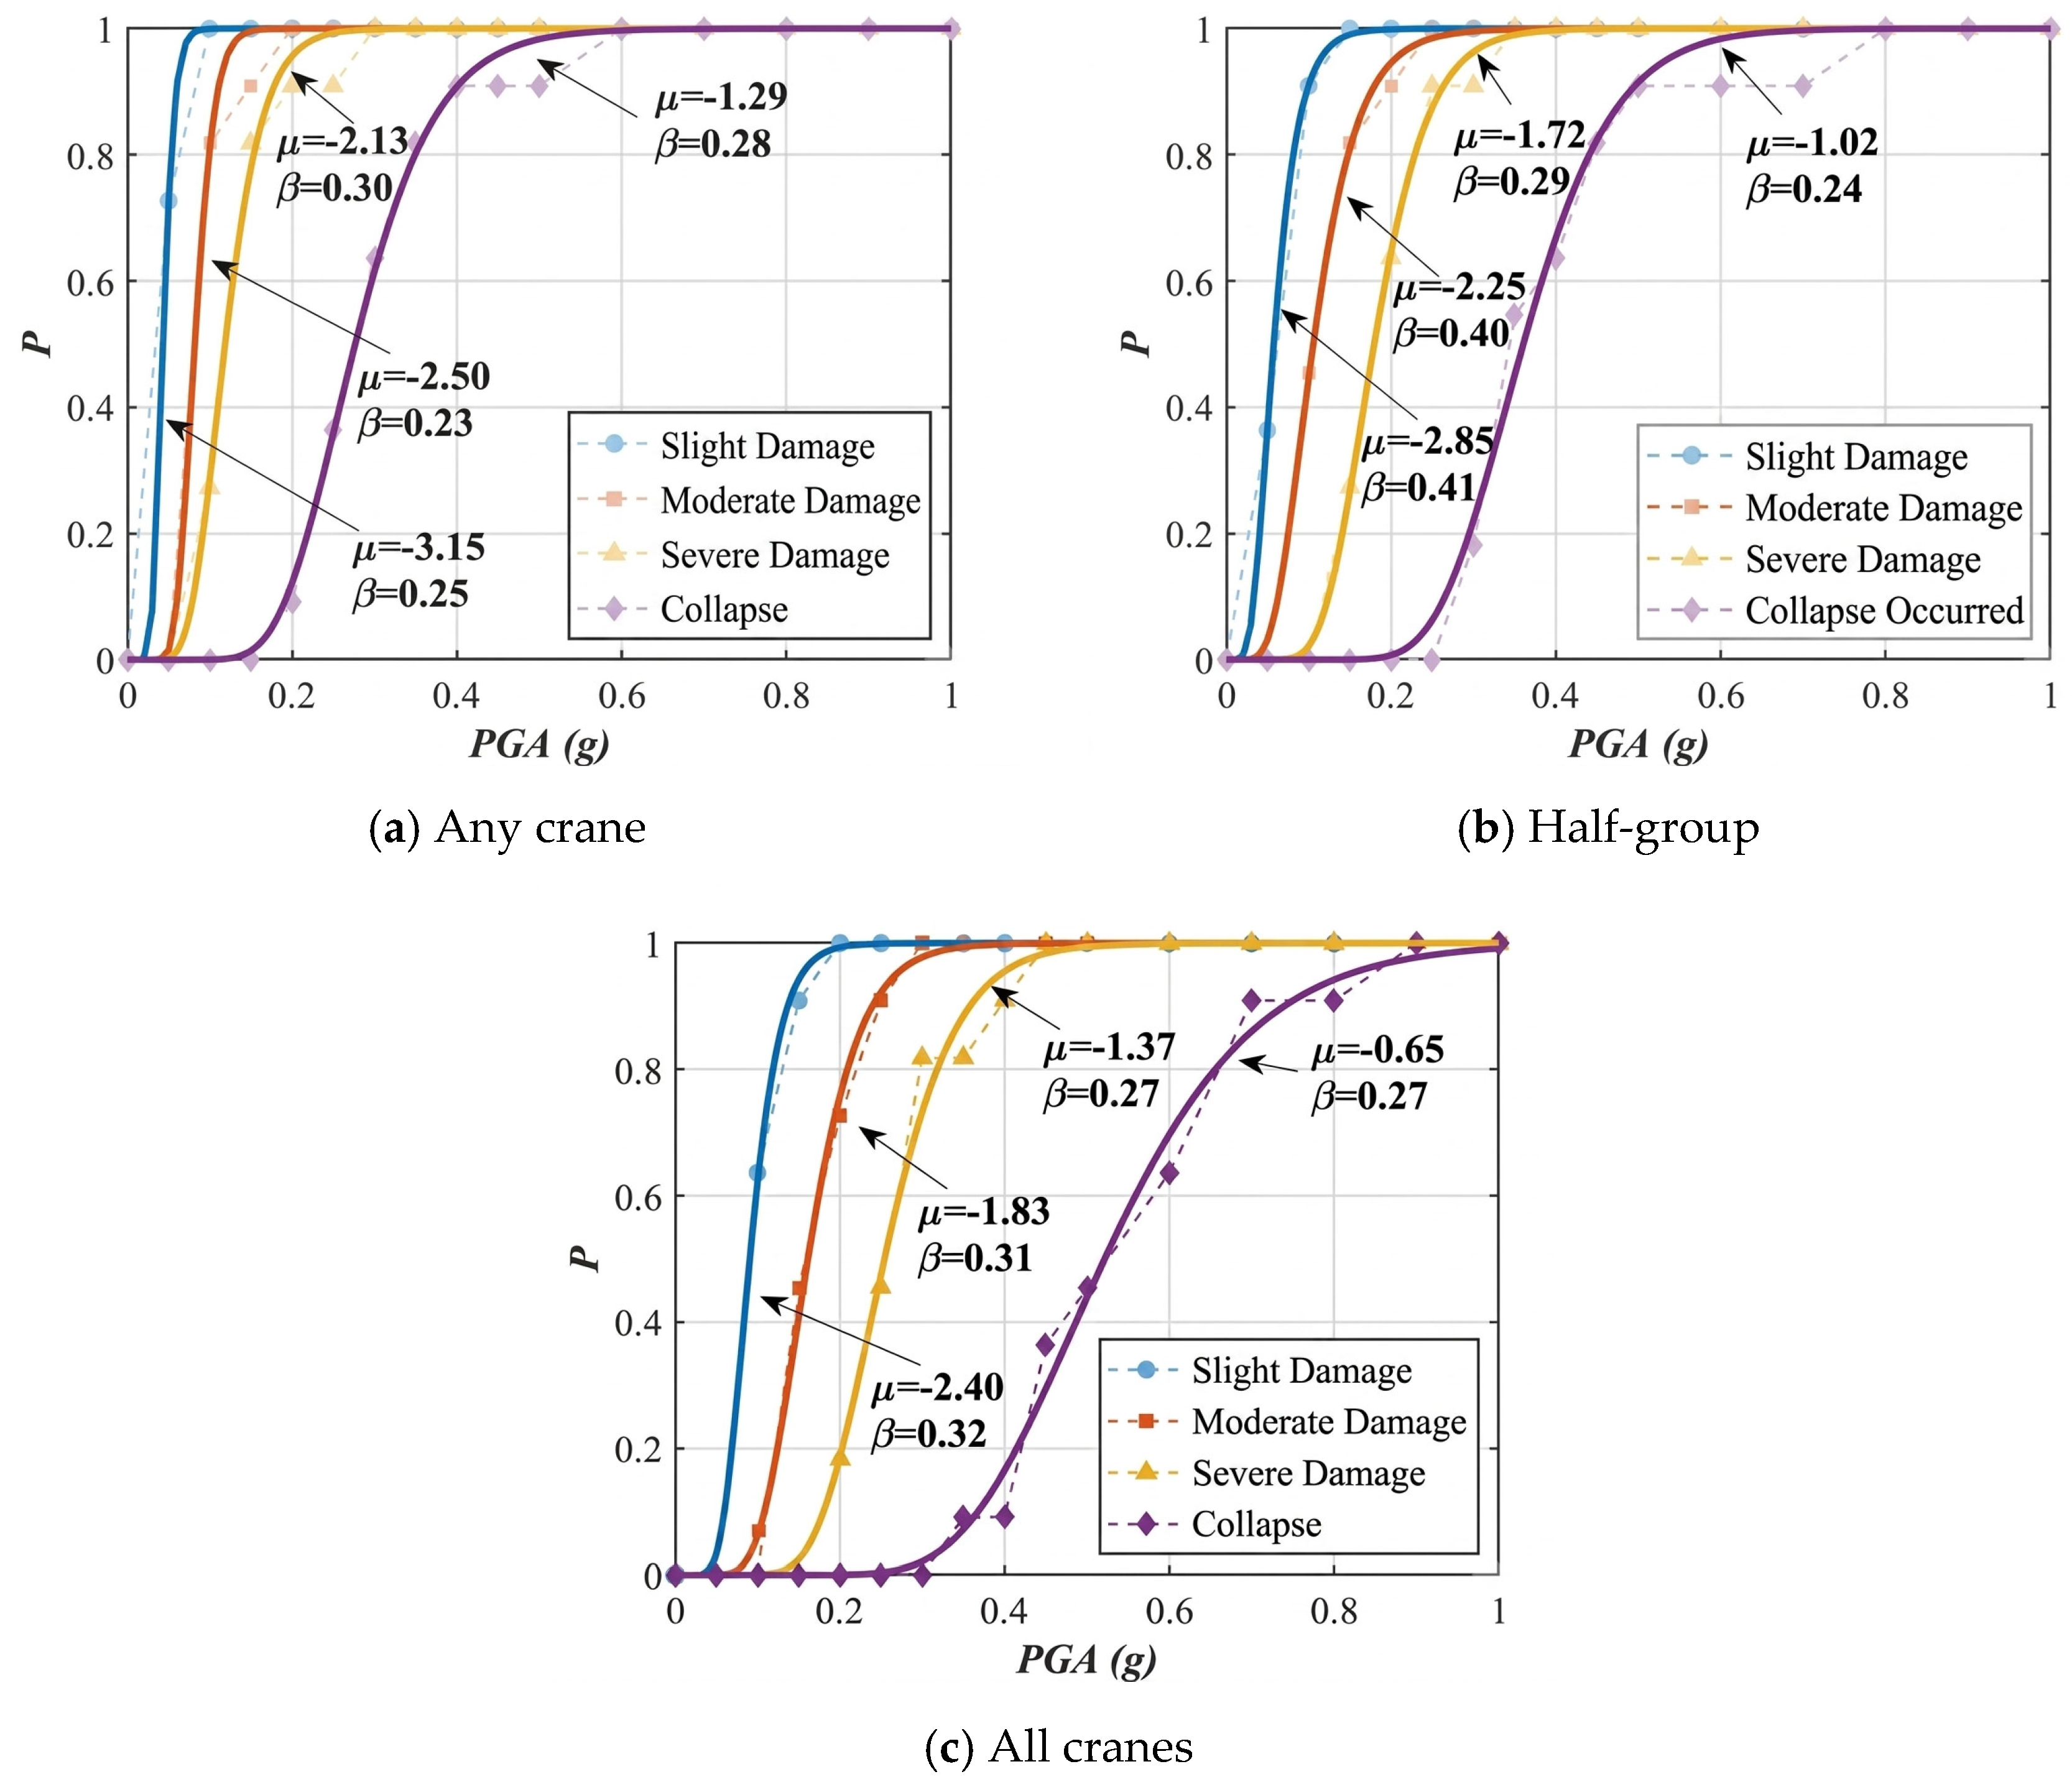
For the group assessment, Nk denotes the number of cranes reaching threshold k in one shared record/intensity realization. The any-crane event is Nk ≥ 1 and the all-crane event is Nk = 12. The originally reported intermediate event is retained as an archival “half-group” curve. The available analysis record does not distinguish unambiguously whether its count convention was Nk ≥ 6 or Nk ≥ 7; therefore, this intermediate curve is not used for quantitative operational recommendations in the revised manuscript. Group probabilities are not obtained by multiplying marginal survival probabilities under an unsupported independence assumption.
Appendix A transcribes the fitted μ and β annotations visible in the individual and group fragility panels and gives the corresponding medians exp(μ). These values document the reported curves rather than a new fit. Rounded annotations alone do not determine the original estimator, the record-level likelihood, or parameter confidence intervals. They are retained as reported comparative parameters, not as newly reproducible estimates from a reconstructed likelihood.
4. Results and Discussion
4.1. Response Transmission and Local Yielding
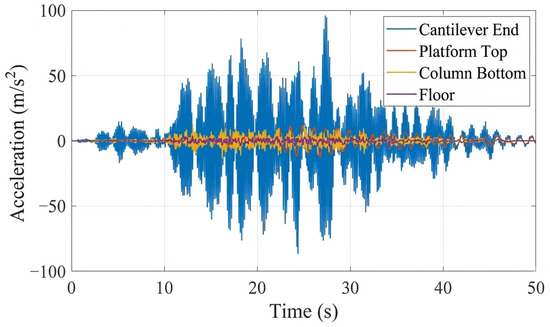
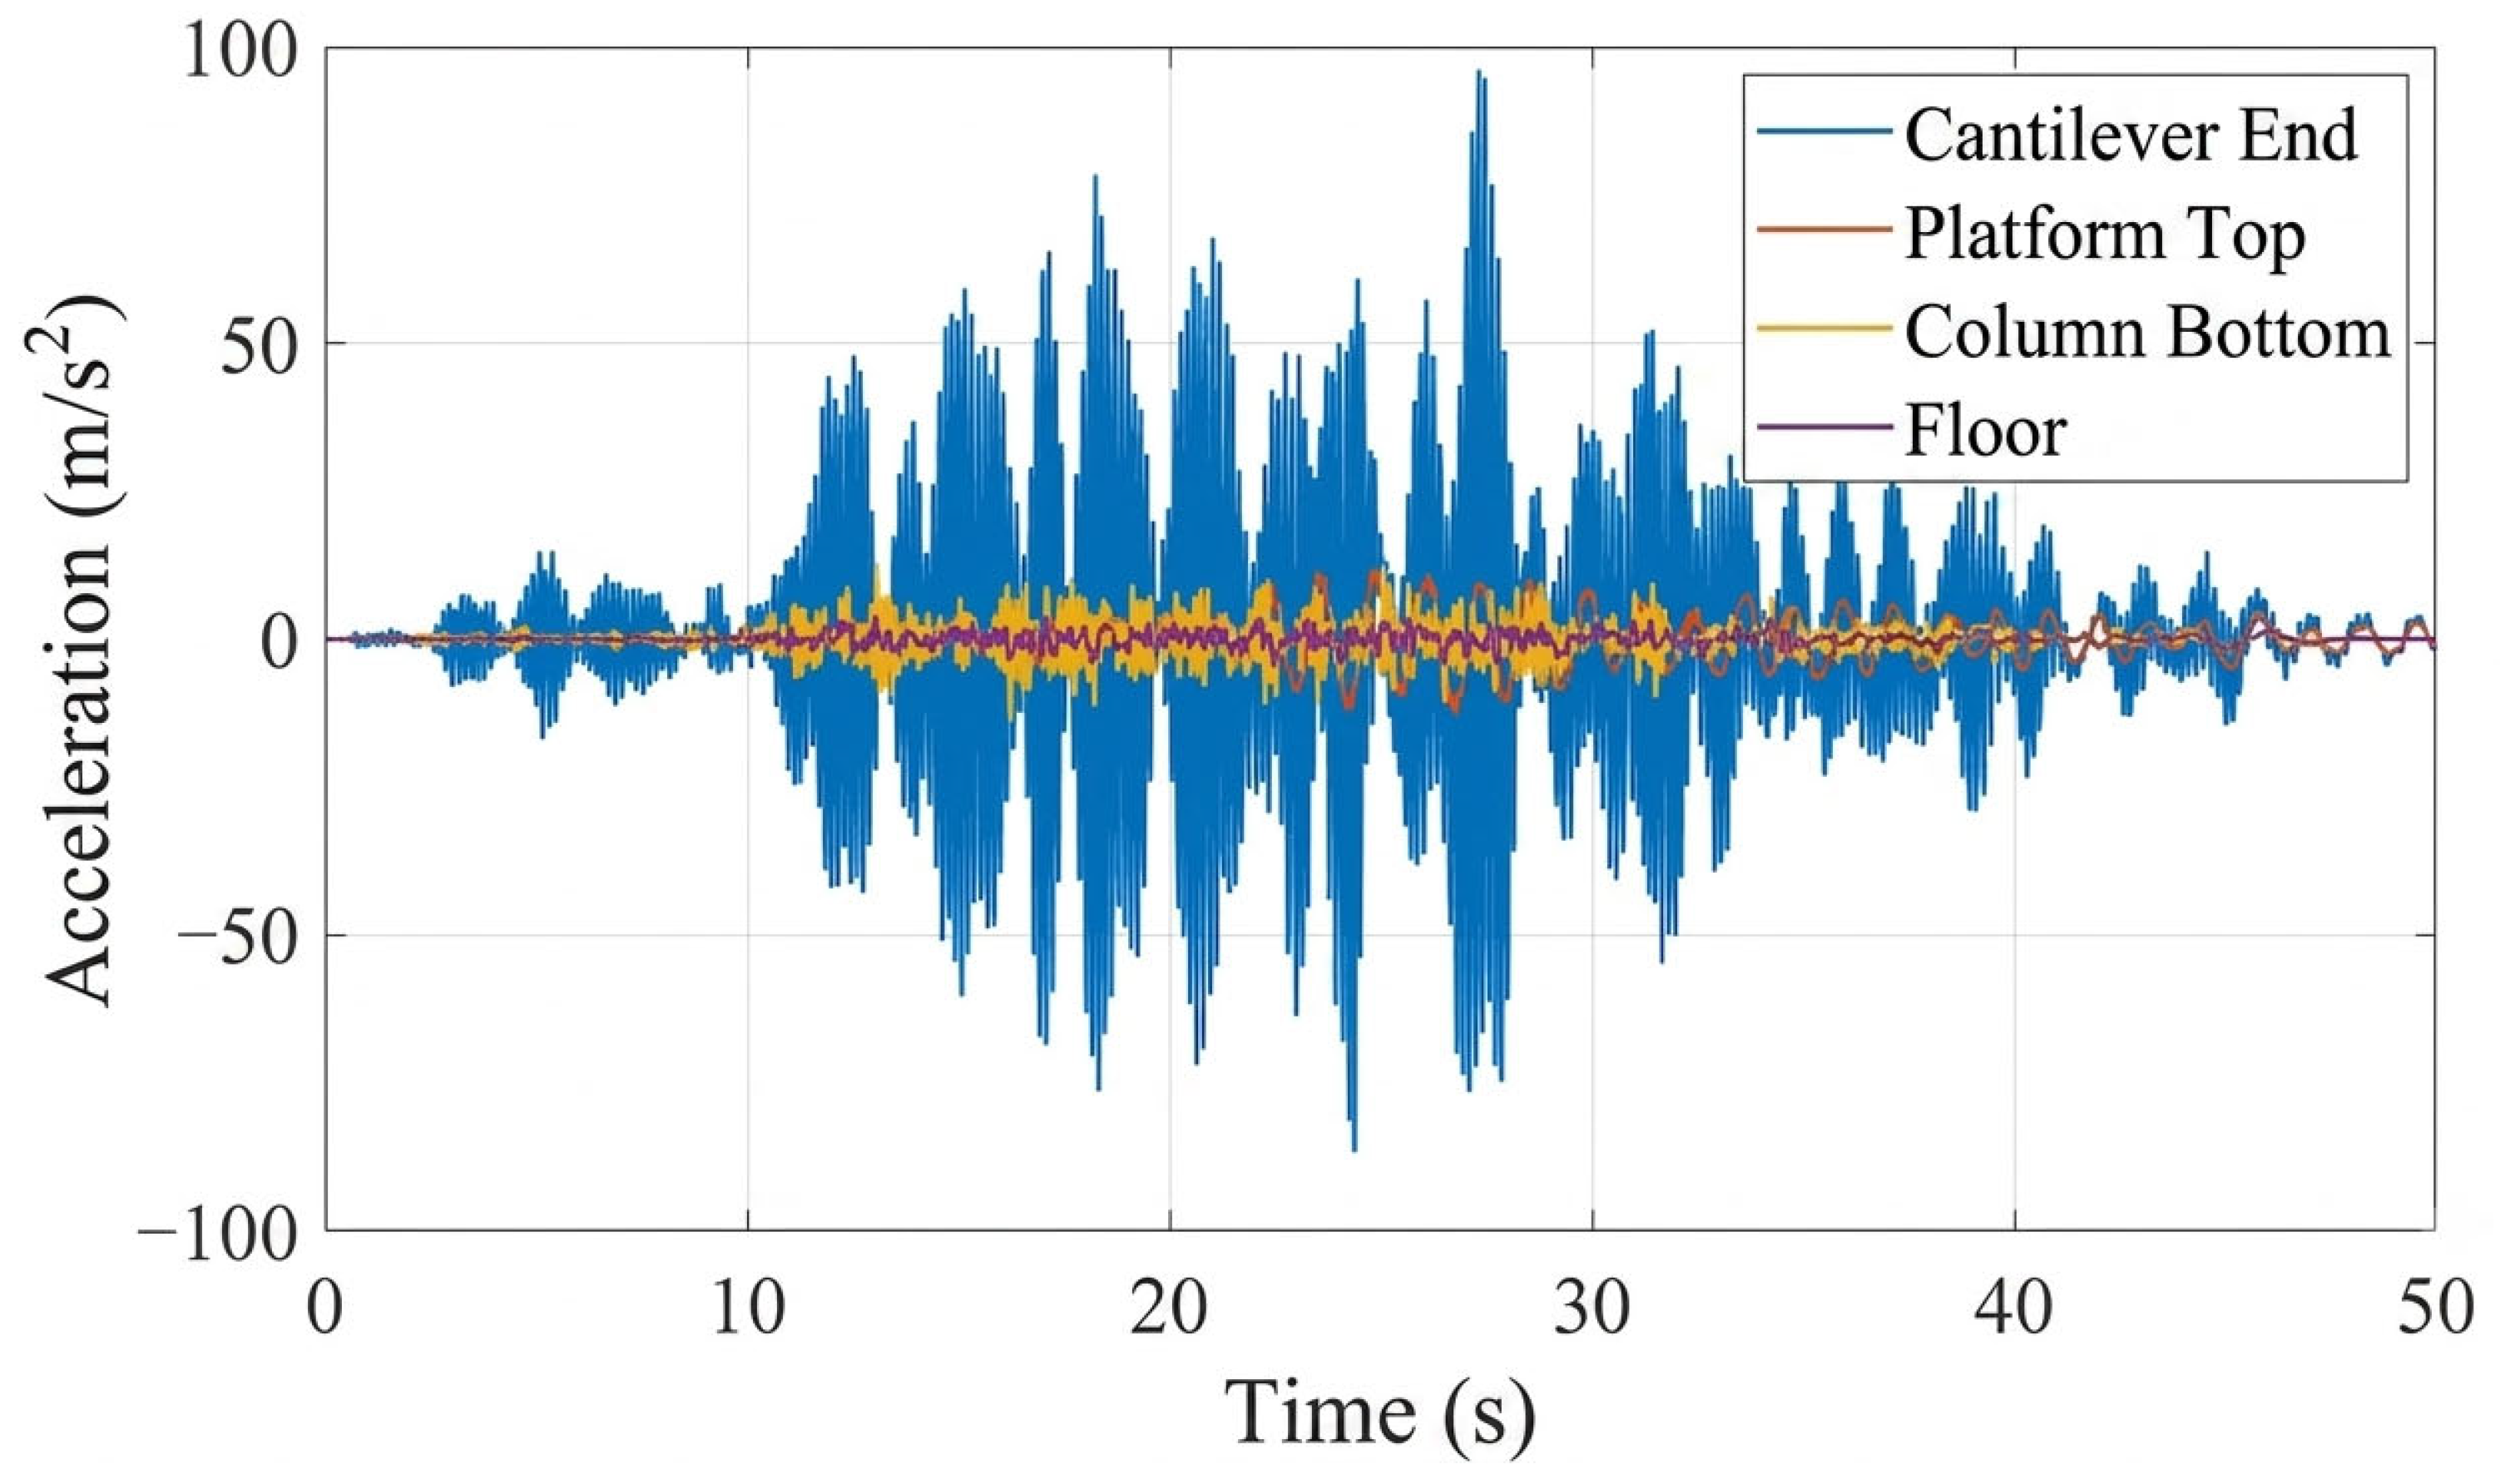
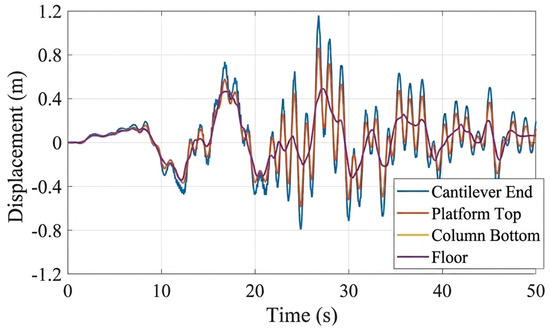
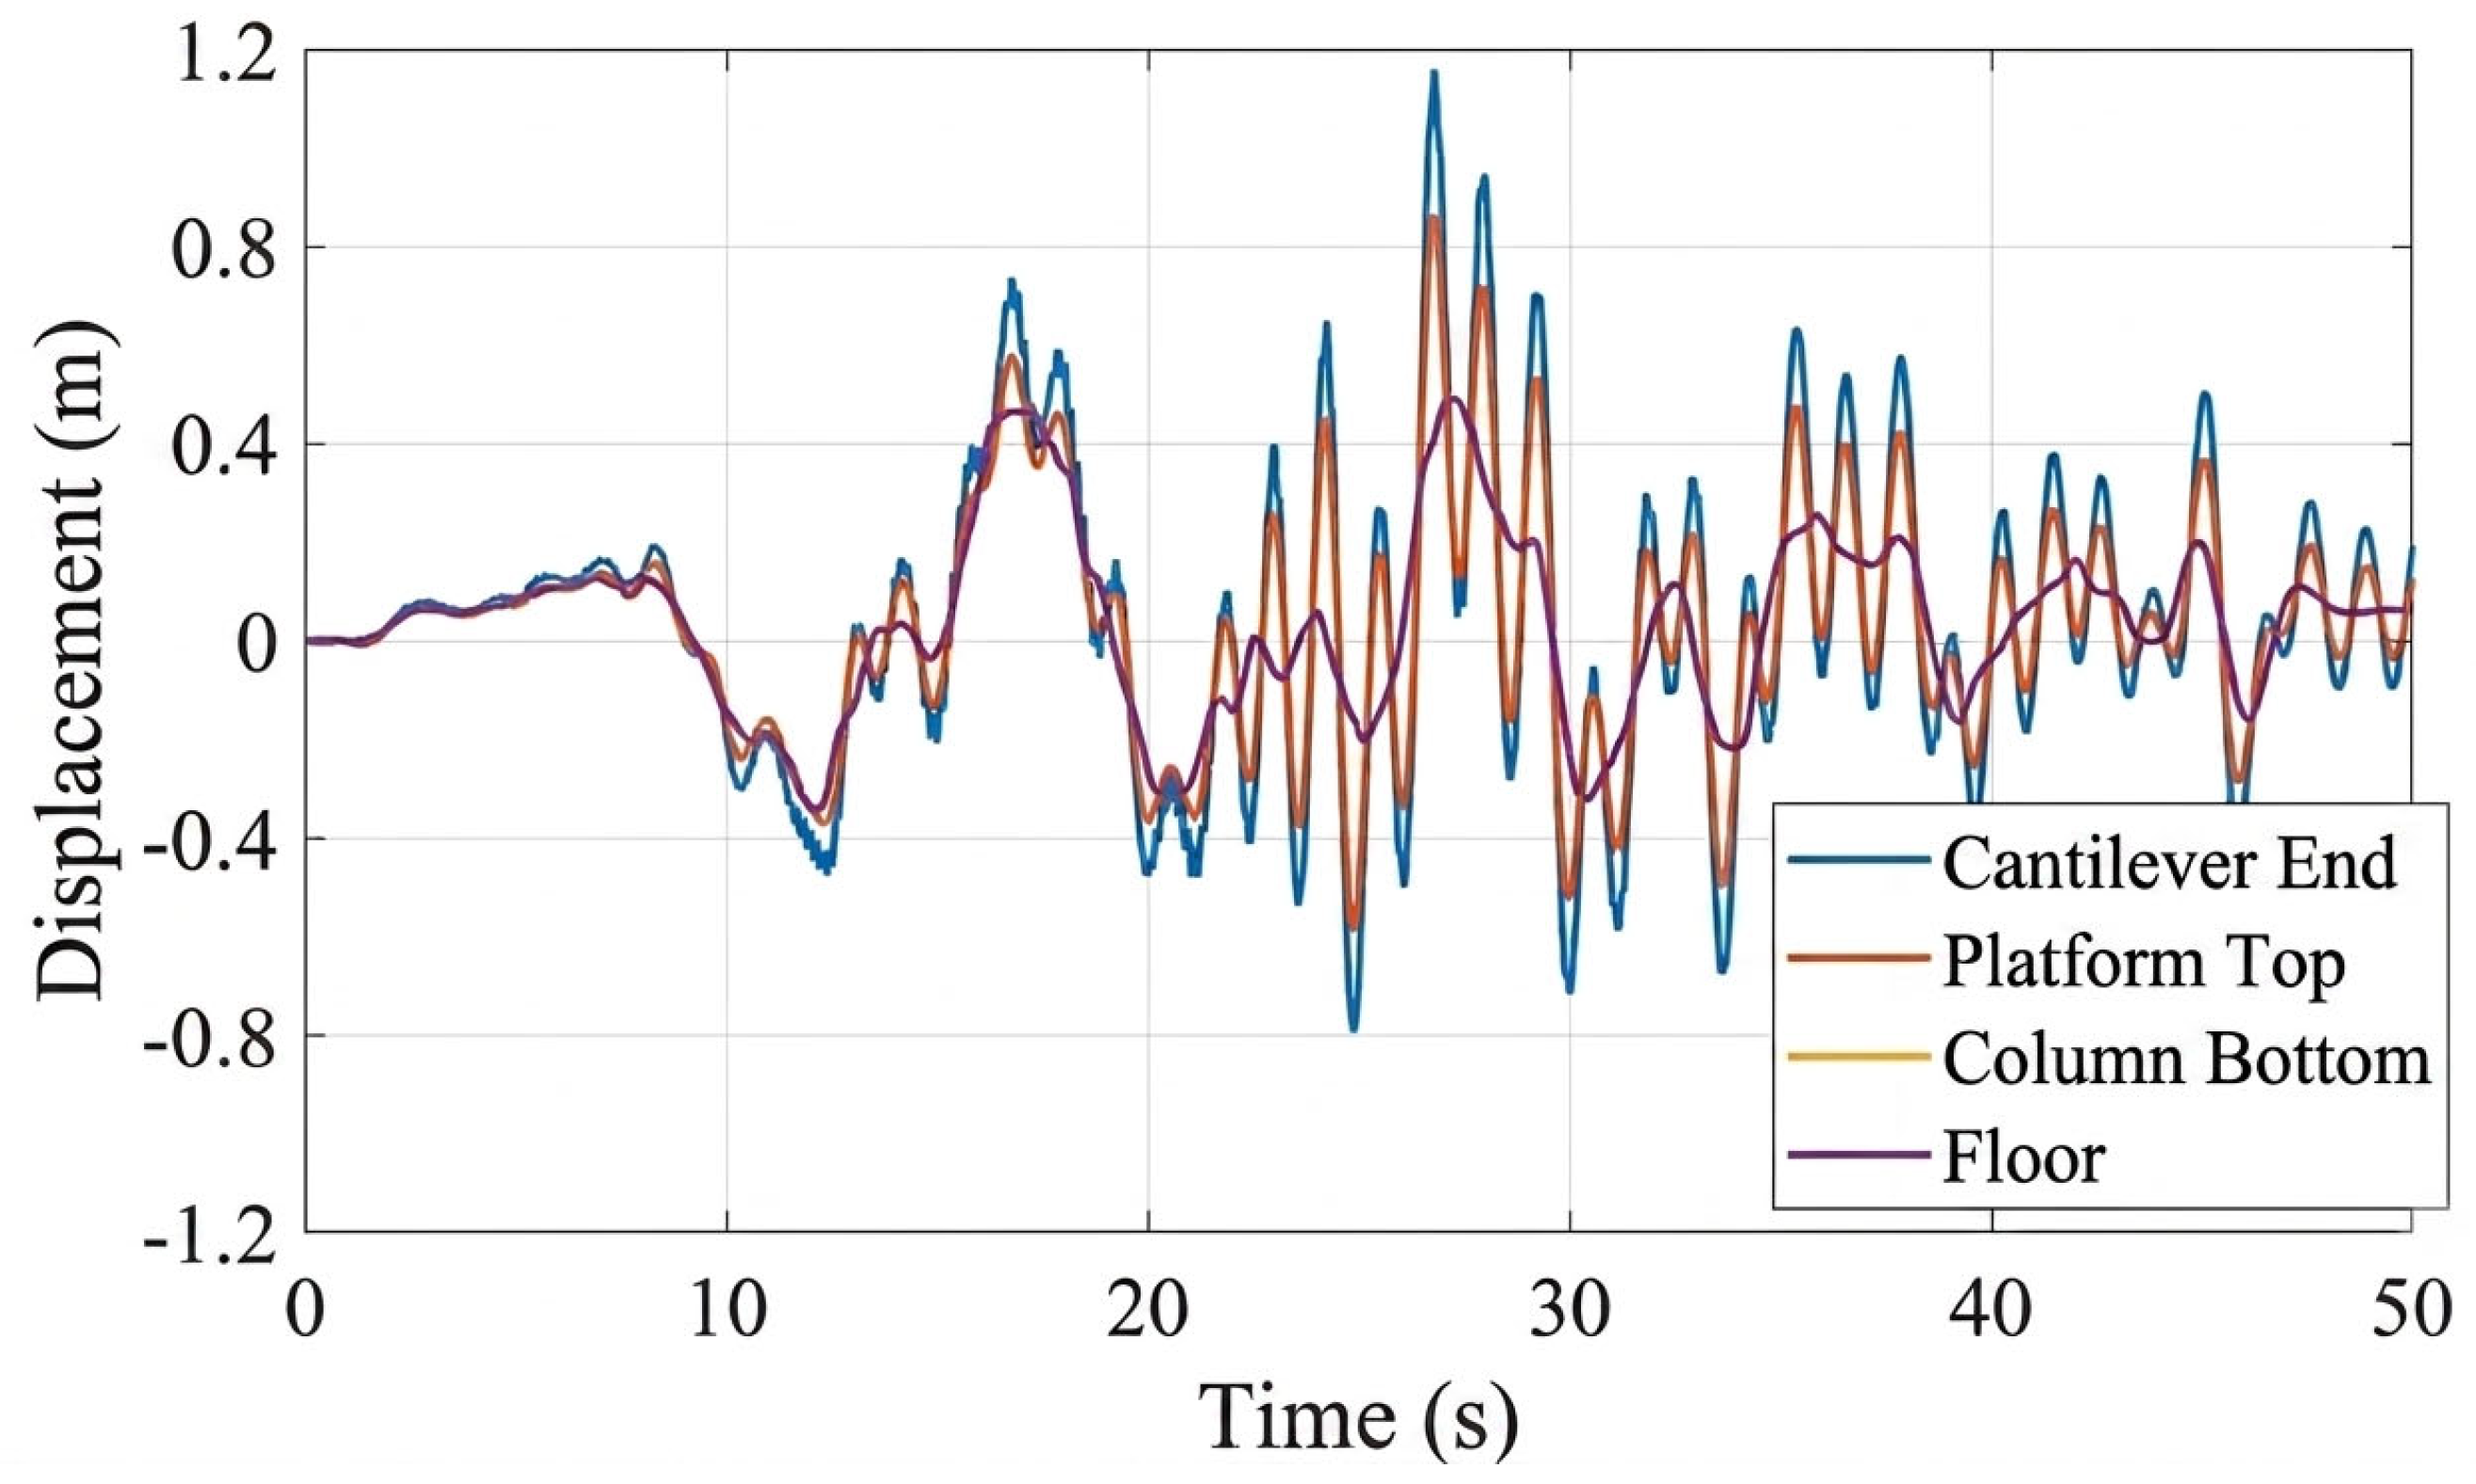
Figure 8 and Figure 9 compare acceleration and displacement histories for Record 5 scaled to PGAg = 0.5 g at the base, support level, platform top, and tip of Crane 2. The histories illustrate how a supporting structure changes both amplitude and phase. Peak acceleration at the crane tip is substantially larger than at the lower monitoring locations in this example. Similar lower-level traces indicate limited relative motion of the stiff containment, rather than an effect of its height alone.
Figure 8.
Acceleration histories at the reported monitoring locations for Record 5 scaled to PGAg = 0.5 g. The crane-tip response illustrates local amplification in the flexible upper subsystem.
Figure 9.
Displacement histories for the same record and intensity as Figure 8. Curves show absolute motion; damage is evaluated from the relative crane-tip/base deformation.
The reported crane-tip peak displacement is 1.42 times the platform-top peak and 2.54 times the support-level peak. These are ratios of separate absolute peak displacements for one record and intensity; they are not universal transfer factors or ratios of relative deformation. The relative tip-to-base response, rather than absolute movement alone, is used for damage classification.
The response amplification is consistent with a flexible upper subsystem attached to a stiffer lower structure. Its magnitude depends on modal participation, attachment motion, frequency content, and nonlinear stiffness changes. An energy-balance argument by itself does not demonstrate accumulation of a fixed amount of seismic energy at the crane, and no energy partition is inferred from the present plots.
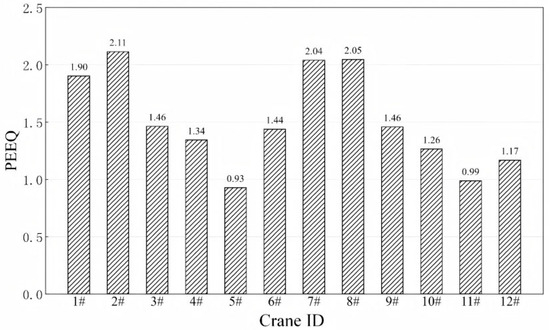
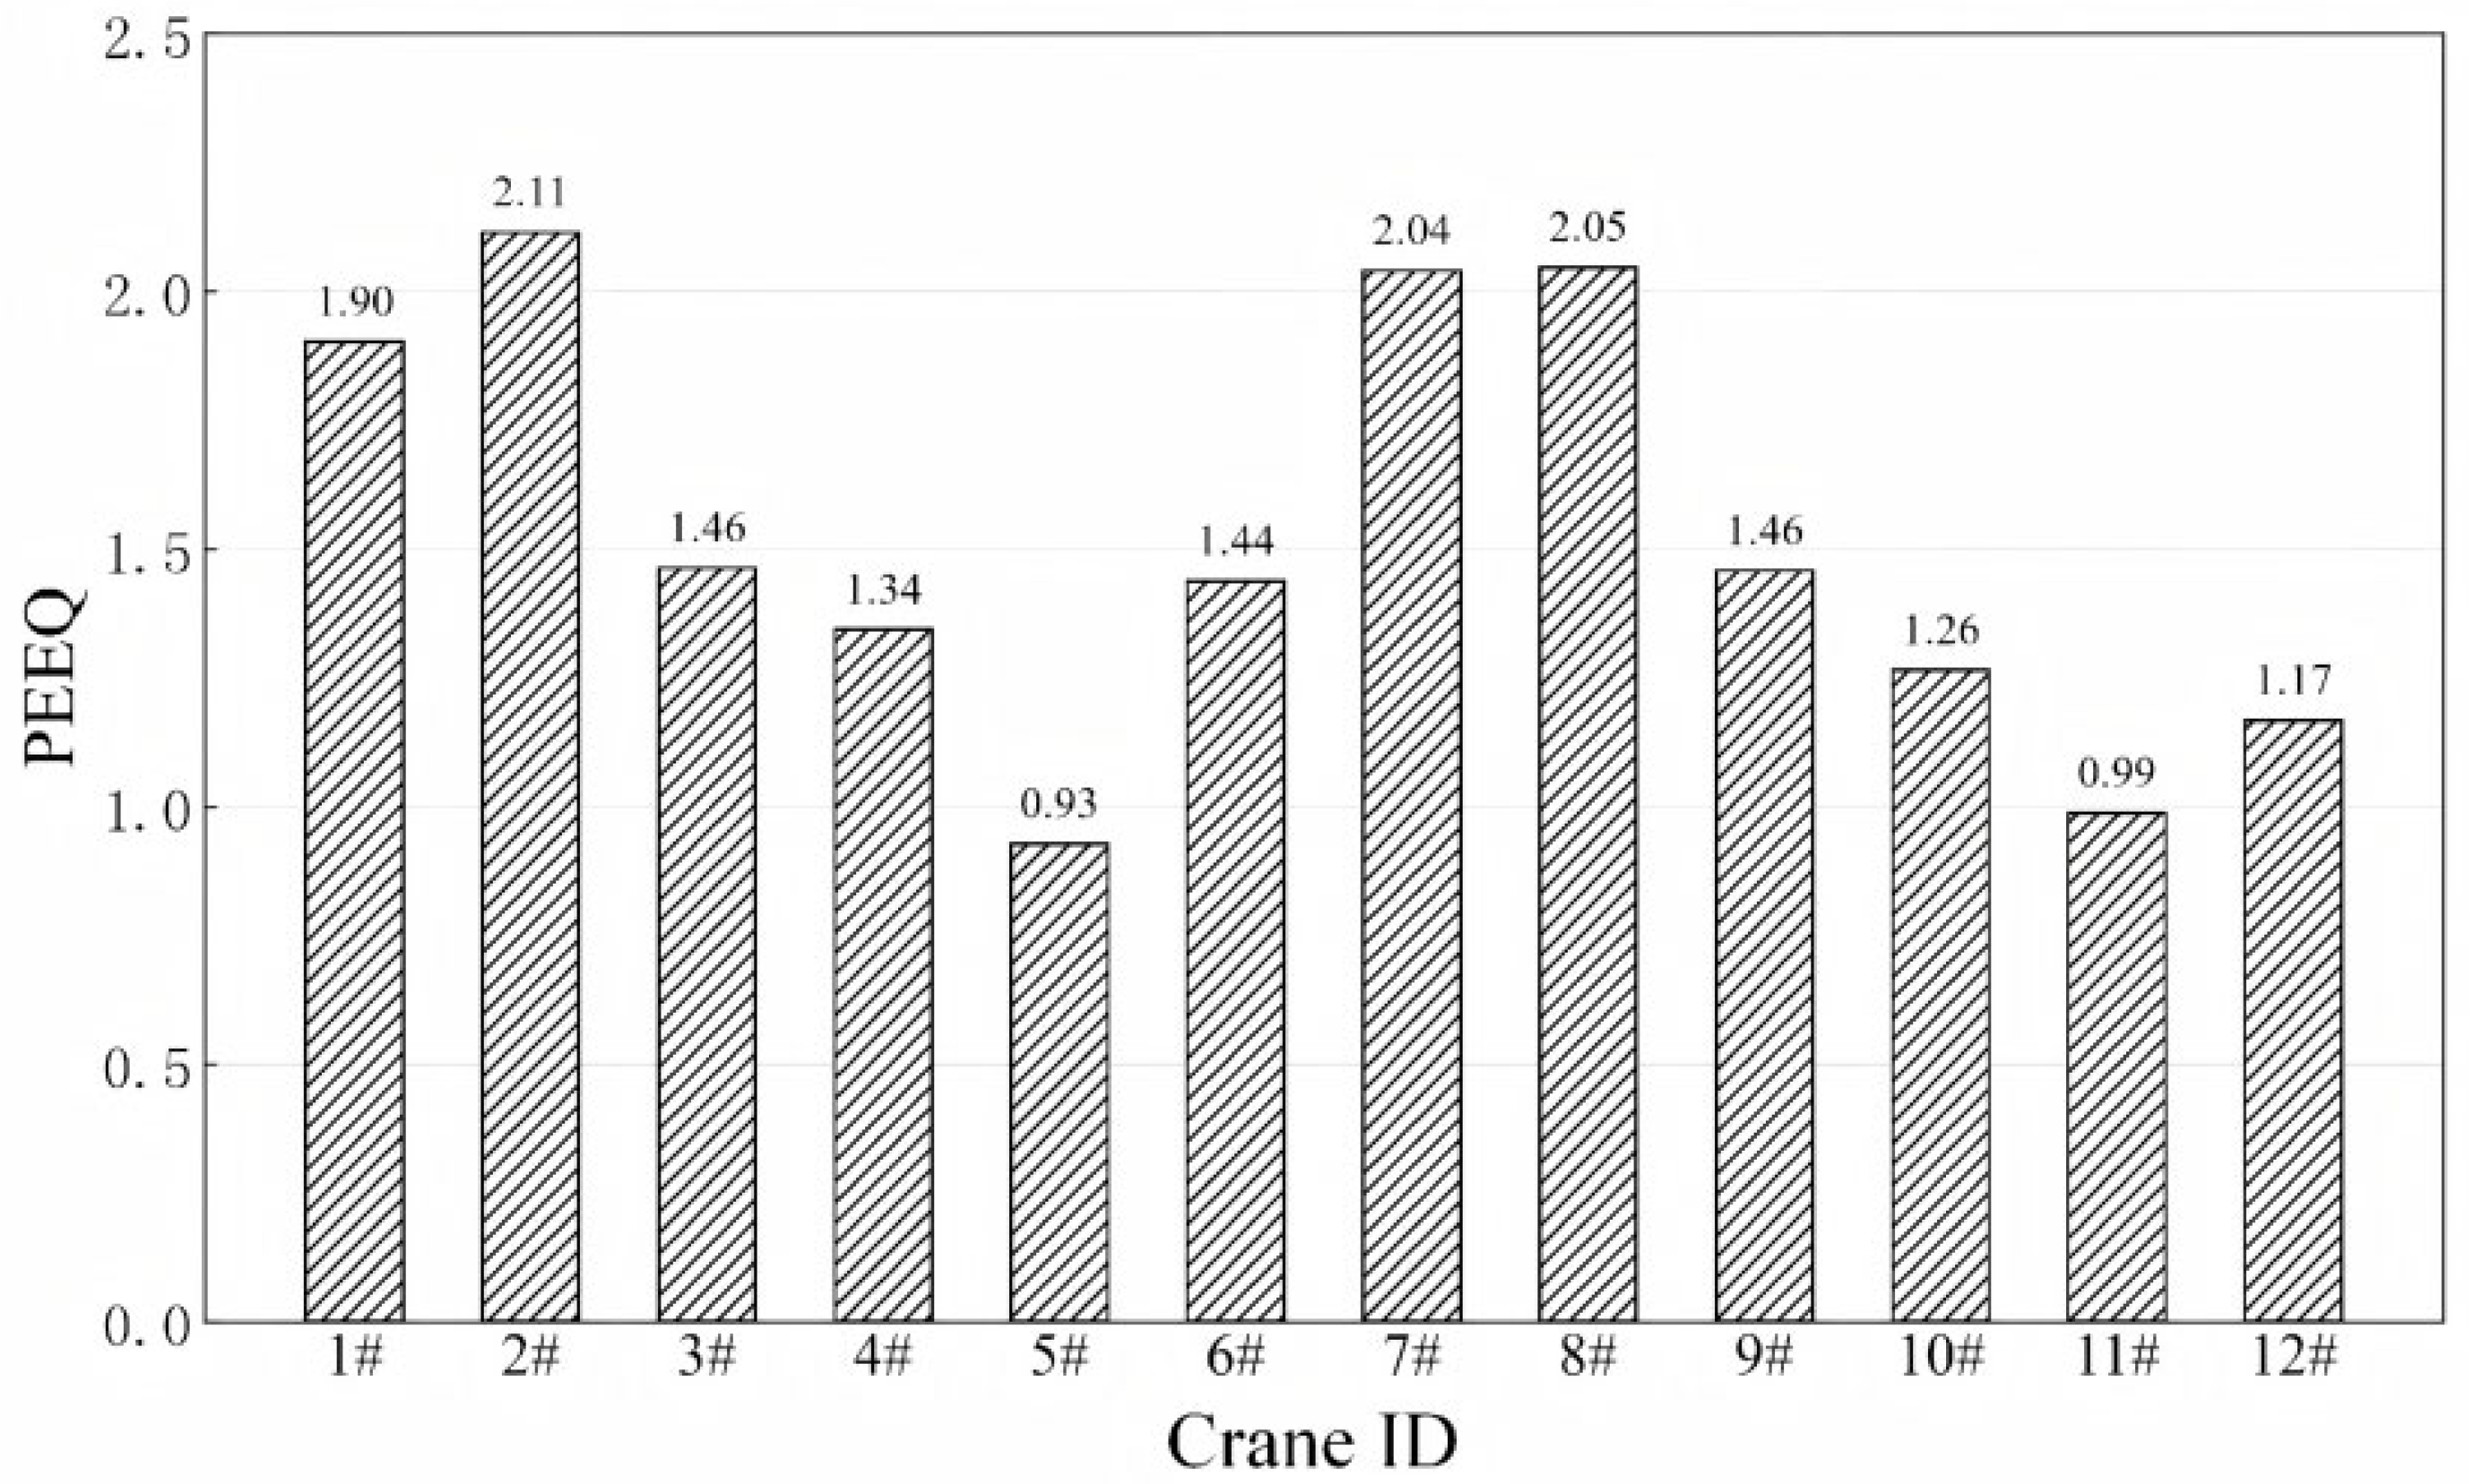
For the PGAg = 1.0 g example, Figure 10 compares peak equivalent plastic strain among the 12 cranes. Crane 2 has the largest reported peak and Crane 5 the smallest. These local strain measures describe differences within the same numerical setting. The statement that the highest deformation category has been reached refers to the adopted D4 criterion, rather than observed physical collapse.
Figure 10.
Reported peak PEEQ comparison among the 12 cranes for the PGAg = 1.0 g example. PEEQ is dimensionless and measures accumulated equivalent plastic strain; it is not a damage probability.
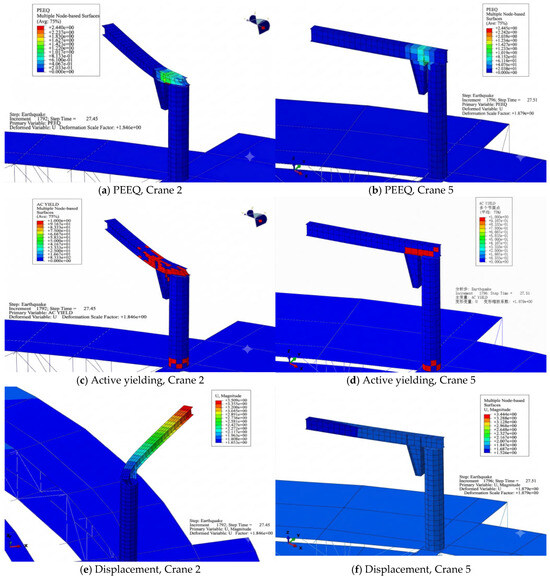
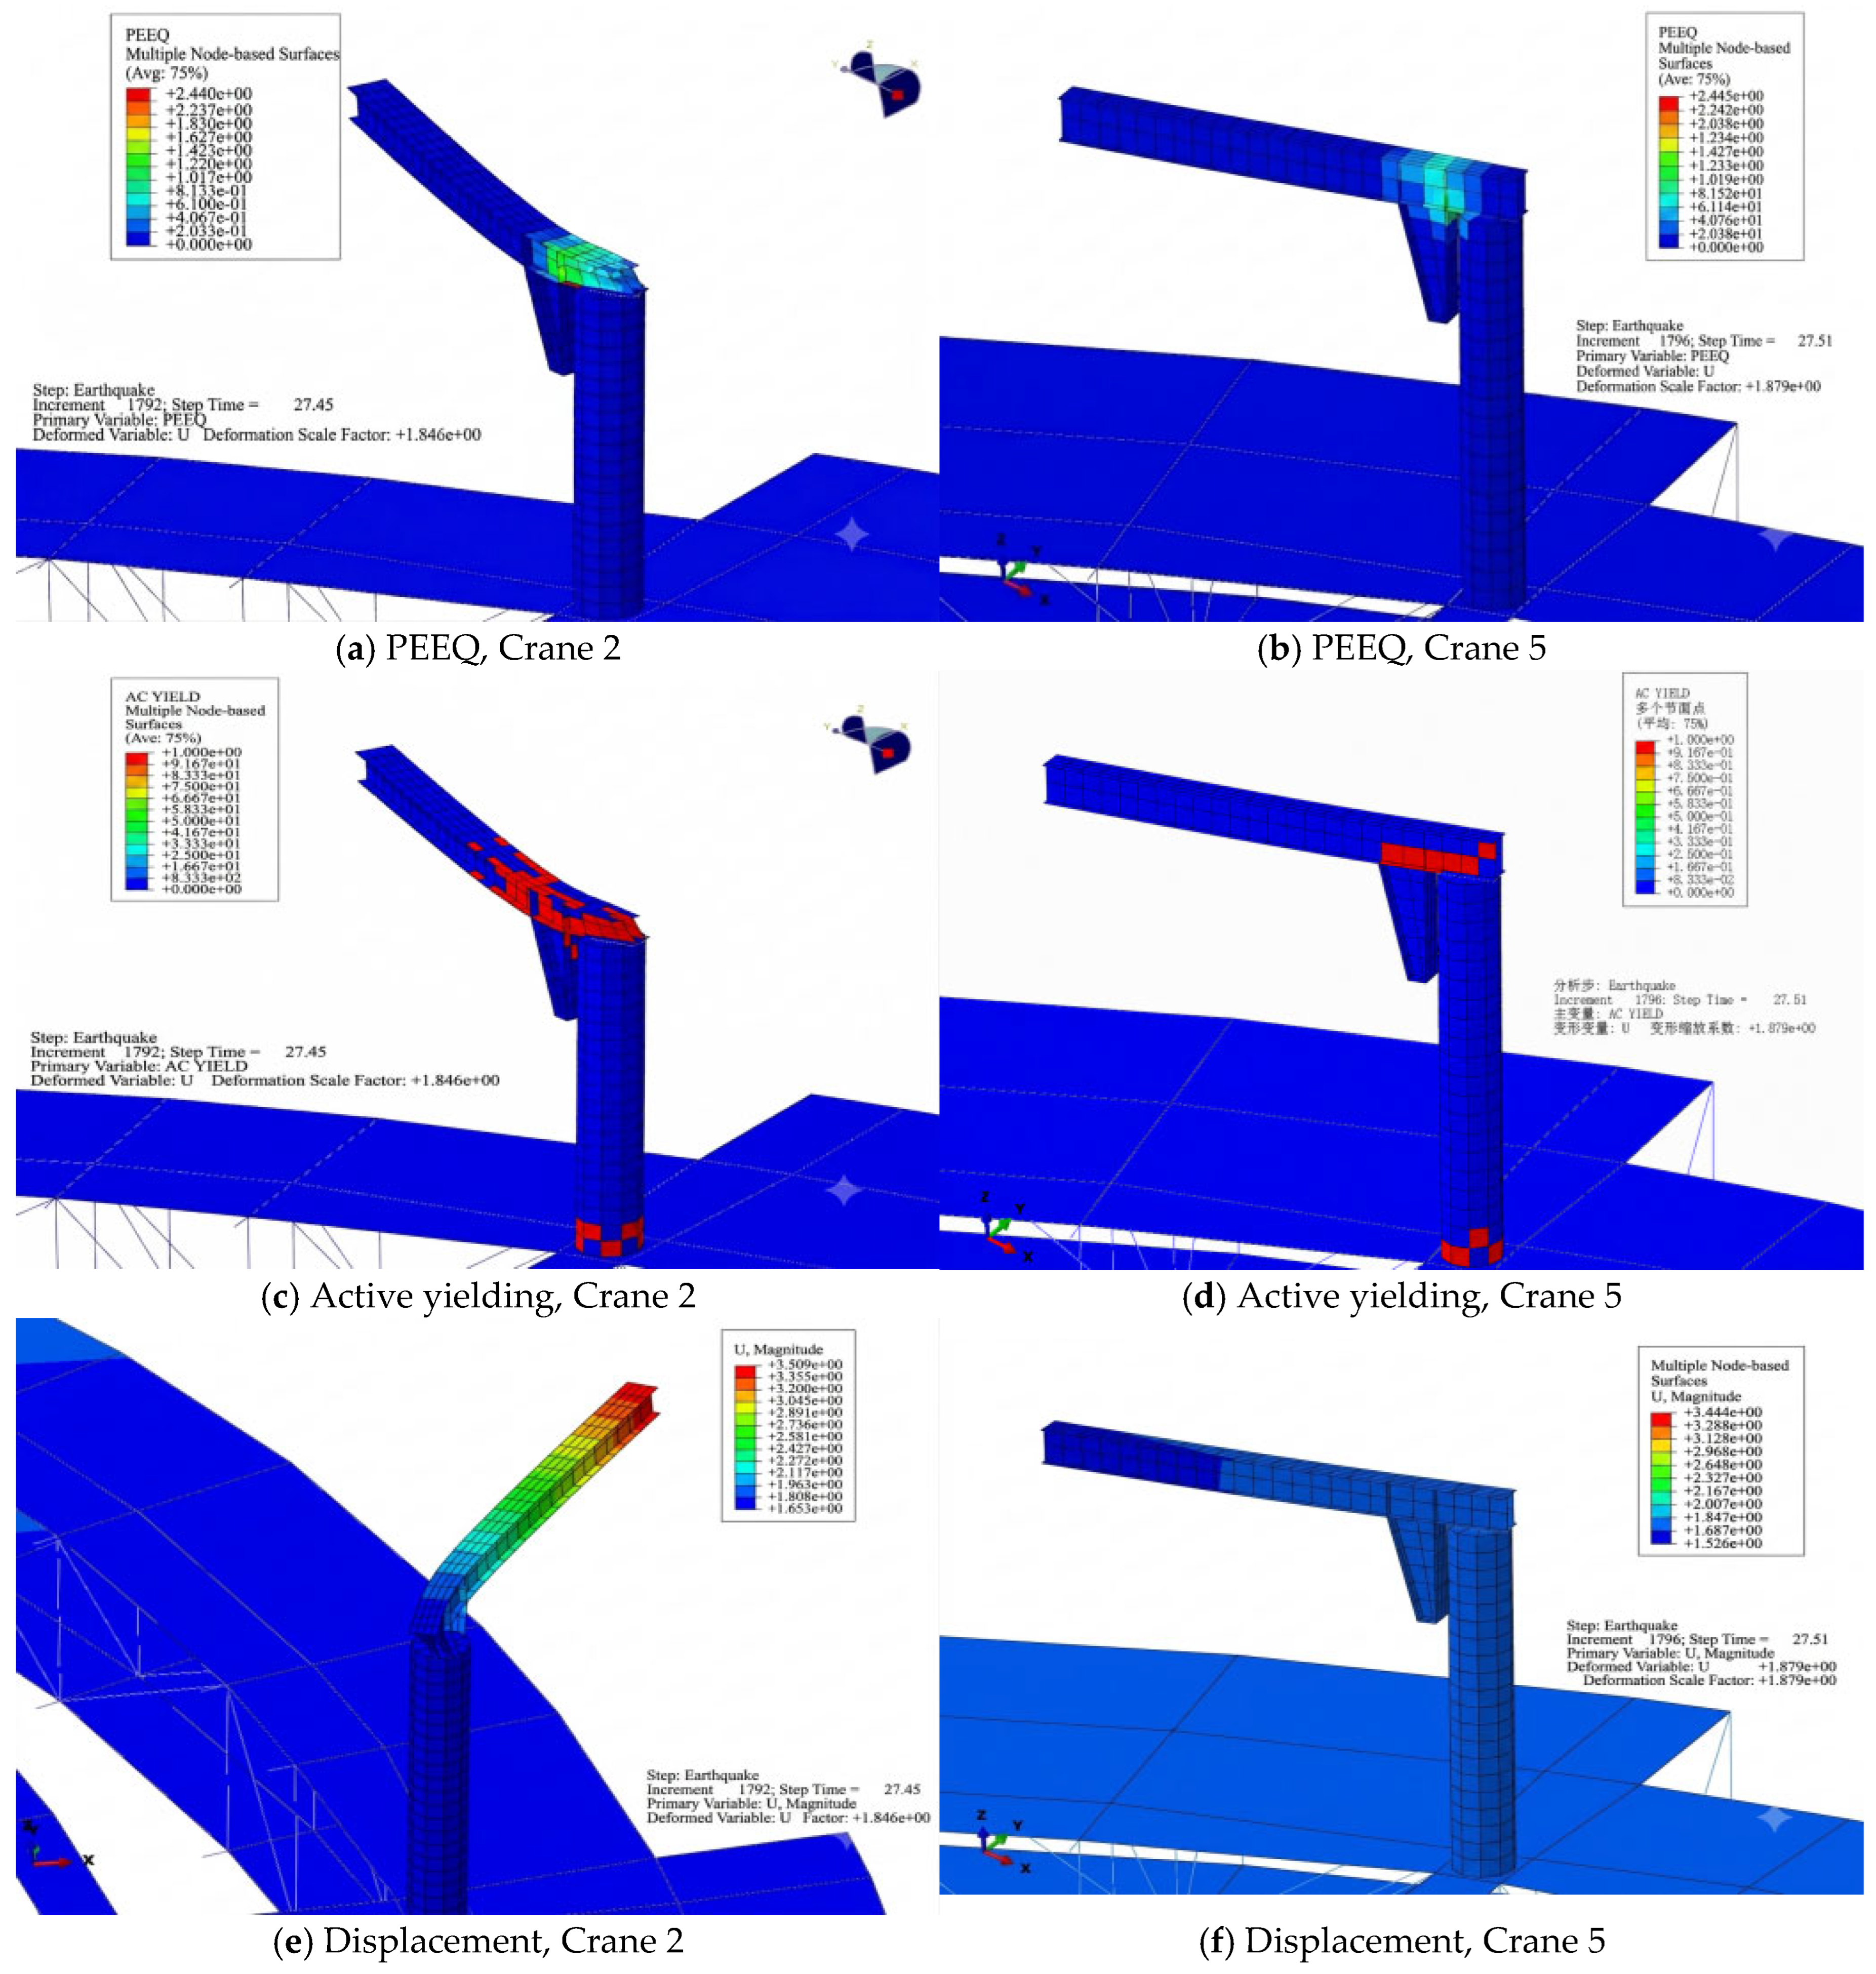
Figure 11 compares equivalent plastic strain (PEEQ), active yielding, and displacement for Cranes 2 and 5. PEEQ accumulates plastic deformation, whereas the active-yielding indicator identifies yielding at the displayed instant; the two fields need not coincide. The visible concentration is near the boom–column junction and adjacent boom region, with secondary yielding near the column base. The largest tip displacement should not be confused with the location of maximum plastic strain. The contour plots support a local-yielding interpretation of the modeled response but do not identify a validated fracture mechanism.
Figure 11.
Local nonlinear response of Cranes 2 and 5 in the PGAg = 1.0 g example: (a) PEEQ, crane 2; (b) PEEQ, crane 5; (c) active yielding, crane 2; (d) active yielding, crane 5; (e) displacement, crane 2; (f) displacement, crane 5. PEEQ accumulates plastic strain; active yielding is an instantaneous state; displacement contours show deformed geometry. Source deformation scale factors are retained. Local strain and maximum tip displacement have different physical meanings.
4.2. Individual-Crane Fragility
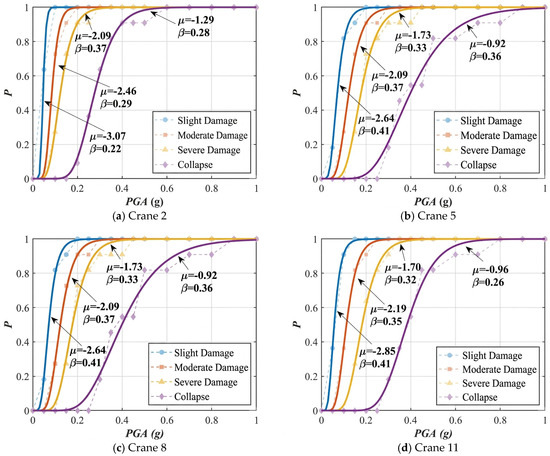
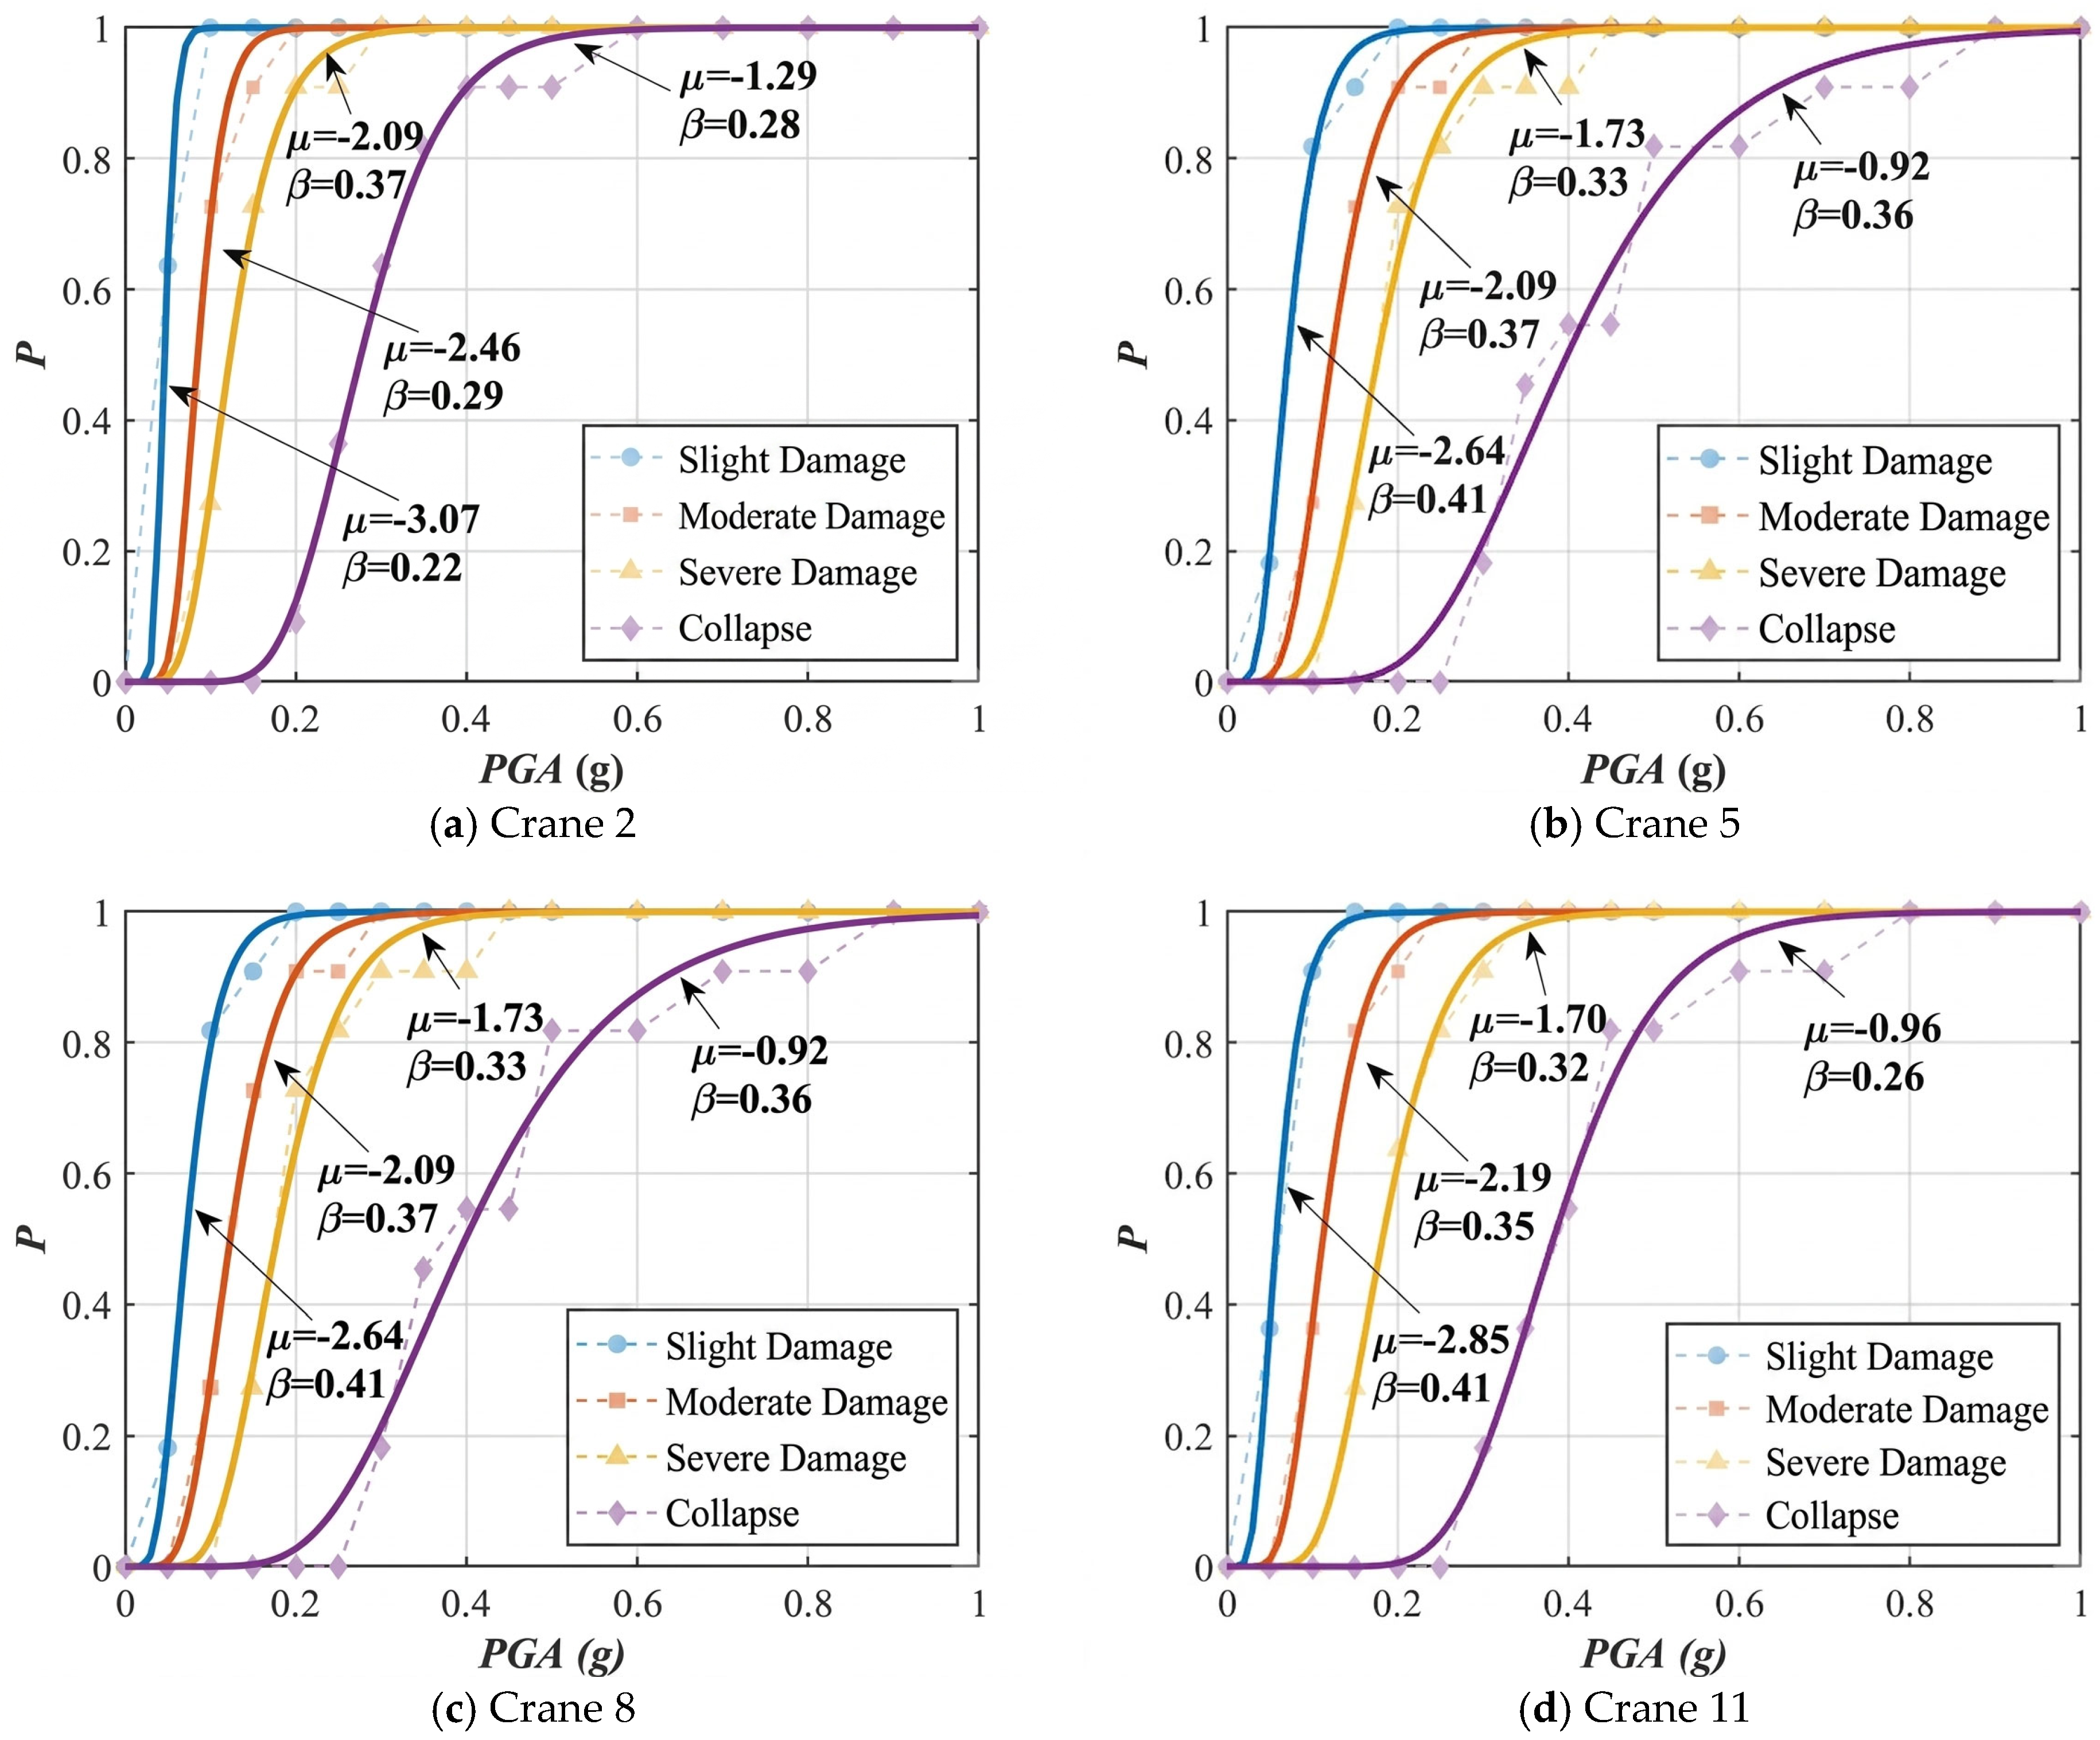
Figure 12 compares the fragility functions of Cranes 2, 5, 8, and 11 at approximately the extreme X and Y positions in Figure 3. The lower three damage-state curves are relatively close, whereas the D4 curve lies at higher PGAg. This indicates a relatively small intensity interval between initial and severe deformation damage, followed by a larger interval to the adopted D4 threshold. The separation does not establish an operational safety margin without corresponding acceptance criteria.
Figure 12.
Reported individual-crane fragility curves: (a) crane 2; (b) crane 5; (c) crane 8; (d) crane 11. The abscissa is PGAg in g; the ordinate is conditional exceedance probability. Curve annotations use μ = ln(C50) and logarithmic dispersion β. The highest category is D4 as defined in Table 3. The legacy raster legend label “Collapse” corresponds to D4 only and does not denote independently verified physical collapse.
Under the adopted X-direction excitation, Crane 2 has a boom orientation approximately transverse to the input and shows higher fragility than Crane 5 in the reported comparison. Location-dependent attachment motions provide a possible additional influence, but the present comparison does not independently quantify that influence. Orientation and location co-vary in the installed layout, so this comparison is evidence of association within the analyzed configuration rather than a controlled independent-parameter sensitivity study.
At 50% exceedance probability, the severe-damage threshold PGAs are 0.124 g for Crane 2 and 0.177 g for Crane 5; the D4 threshold medians are 0.275 and 0.399 g. The latter-to-former capacity ratios for Crane 5 relative to Crane 2 are 1.43 for severe damage and 1.45 for D4. These numerical differences identify a substantial configuration-dependent contrast between Cranes 2 and 5, but they do not isolate boom orientation from attachment location. Inspection prioritization should therefore consider the installed configuration as a whole, subject to confirmation of the input motions and connection idealizations.
A median greater than a reference acceleration does not establish that the probability at that reference is negligible: the probability also depends on β and on the validity of the limit state. Accordingly, no blanket claim of low D4 exceedance probability or compliance with the safe-shutdown earthquake is made. Site-specific seismic acceptance requires evaluation at the applicable spectrum and hazard level.
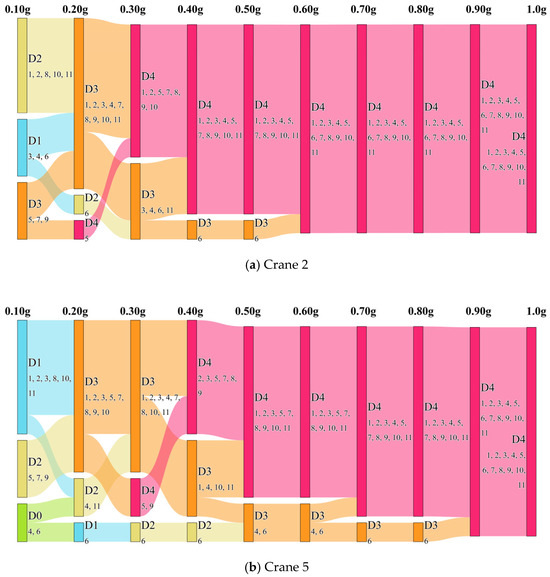
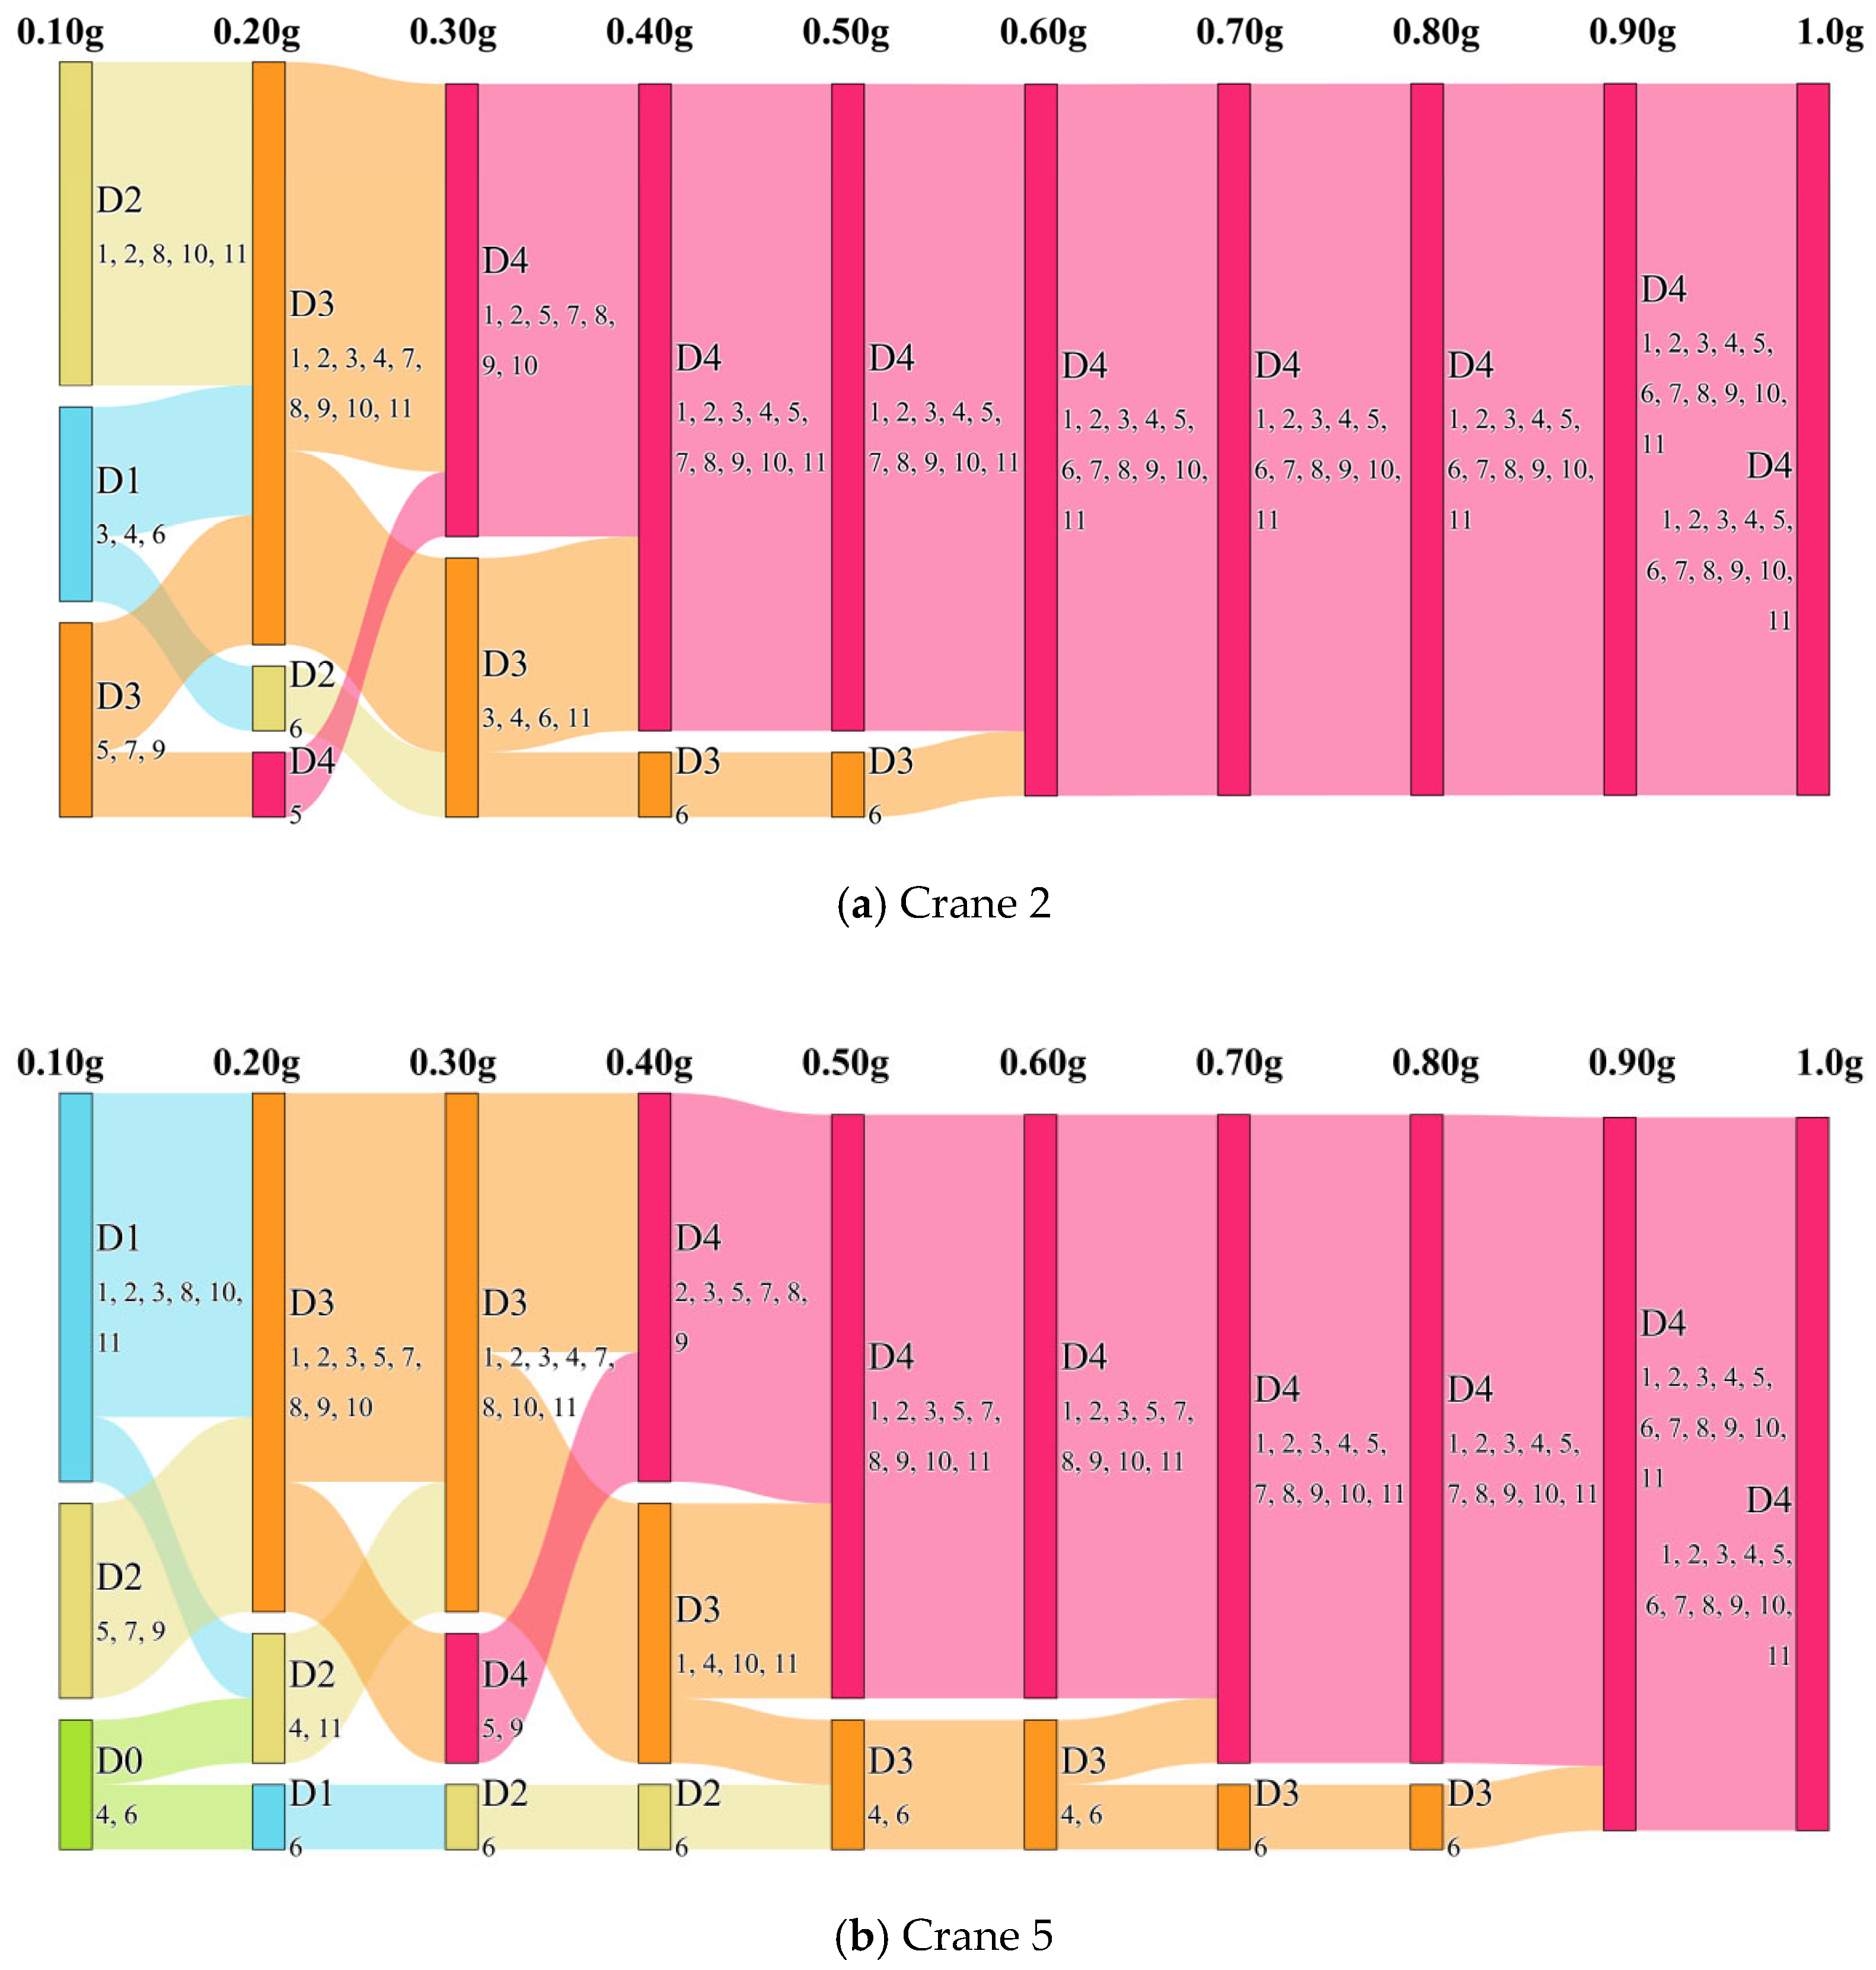
Figure 13 shows the reported damage categories over the 0.1–1.0 g sequence for Cranes 2 and 5. D0–D4 are defined in Table 3, and the embedded record numbers refer to Table 2. Record 6 produces relatively low damage in the shown comparison, while Record 5 reaches high-damage states earlier. These differences demonstrate record sensitivity and reinforce the need to examine sampling and spectral characteristics, rather than treating the mean spectrum as a complete control on damage.
Independent attribution of orientation and location would require matched configurations: rotating the same crane at a fixed node while retaining its mass, support, and input, and comparing different nodes with an identical boom orientation. A factorial comparison should also examine the interaction between the two factors and the influence of excitation direction. The installed-layout comparison is not a substitute for those analyses, and no separate effect size is inferred here.
4.3. Nonlinear Response Diagnostics
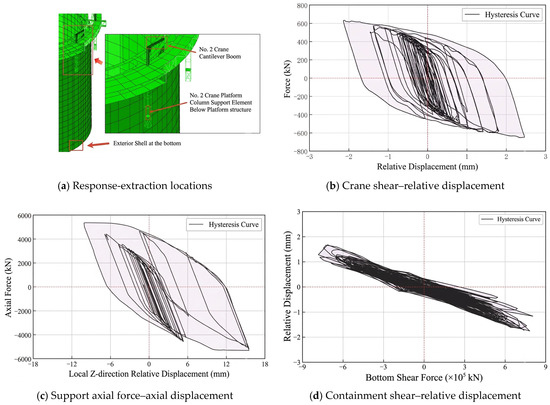
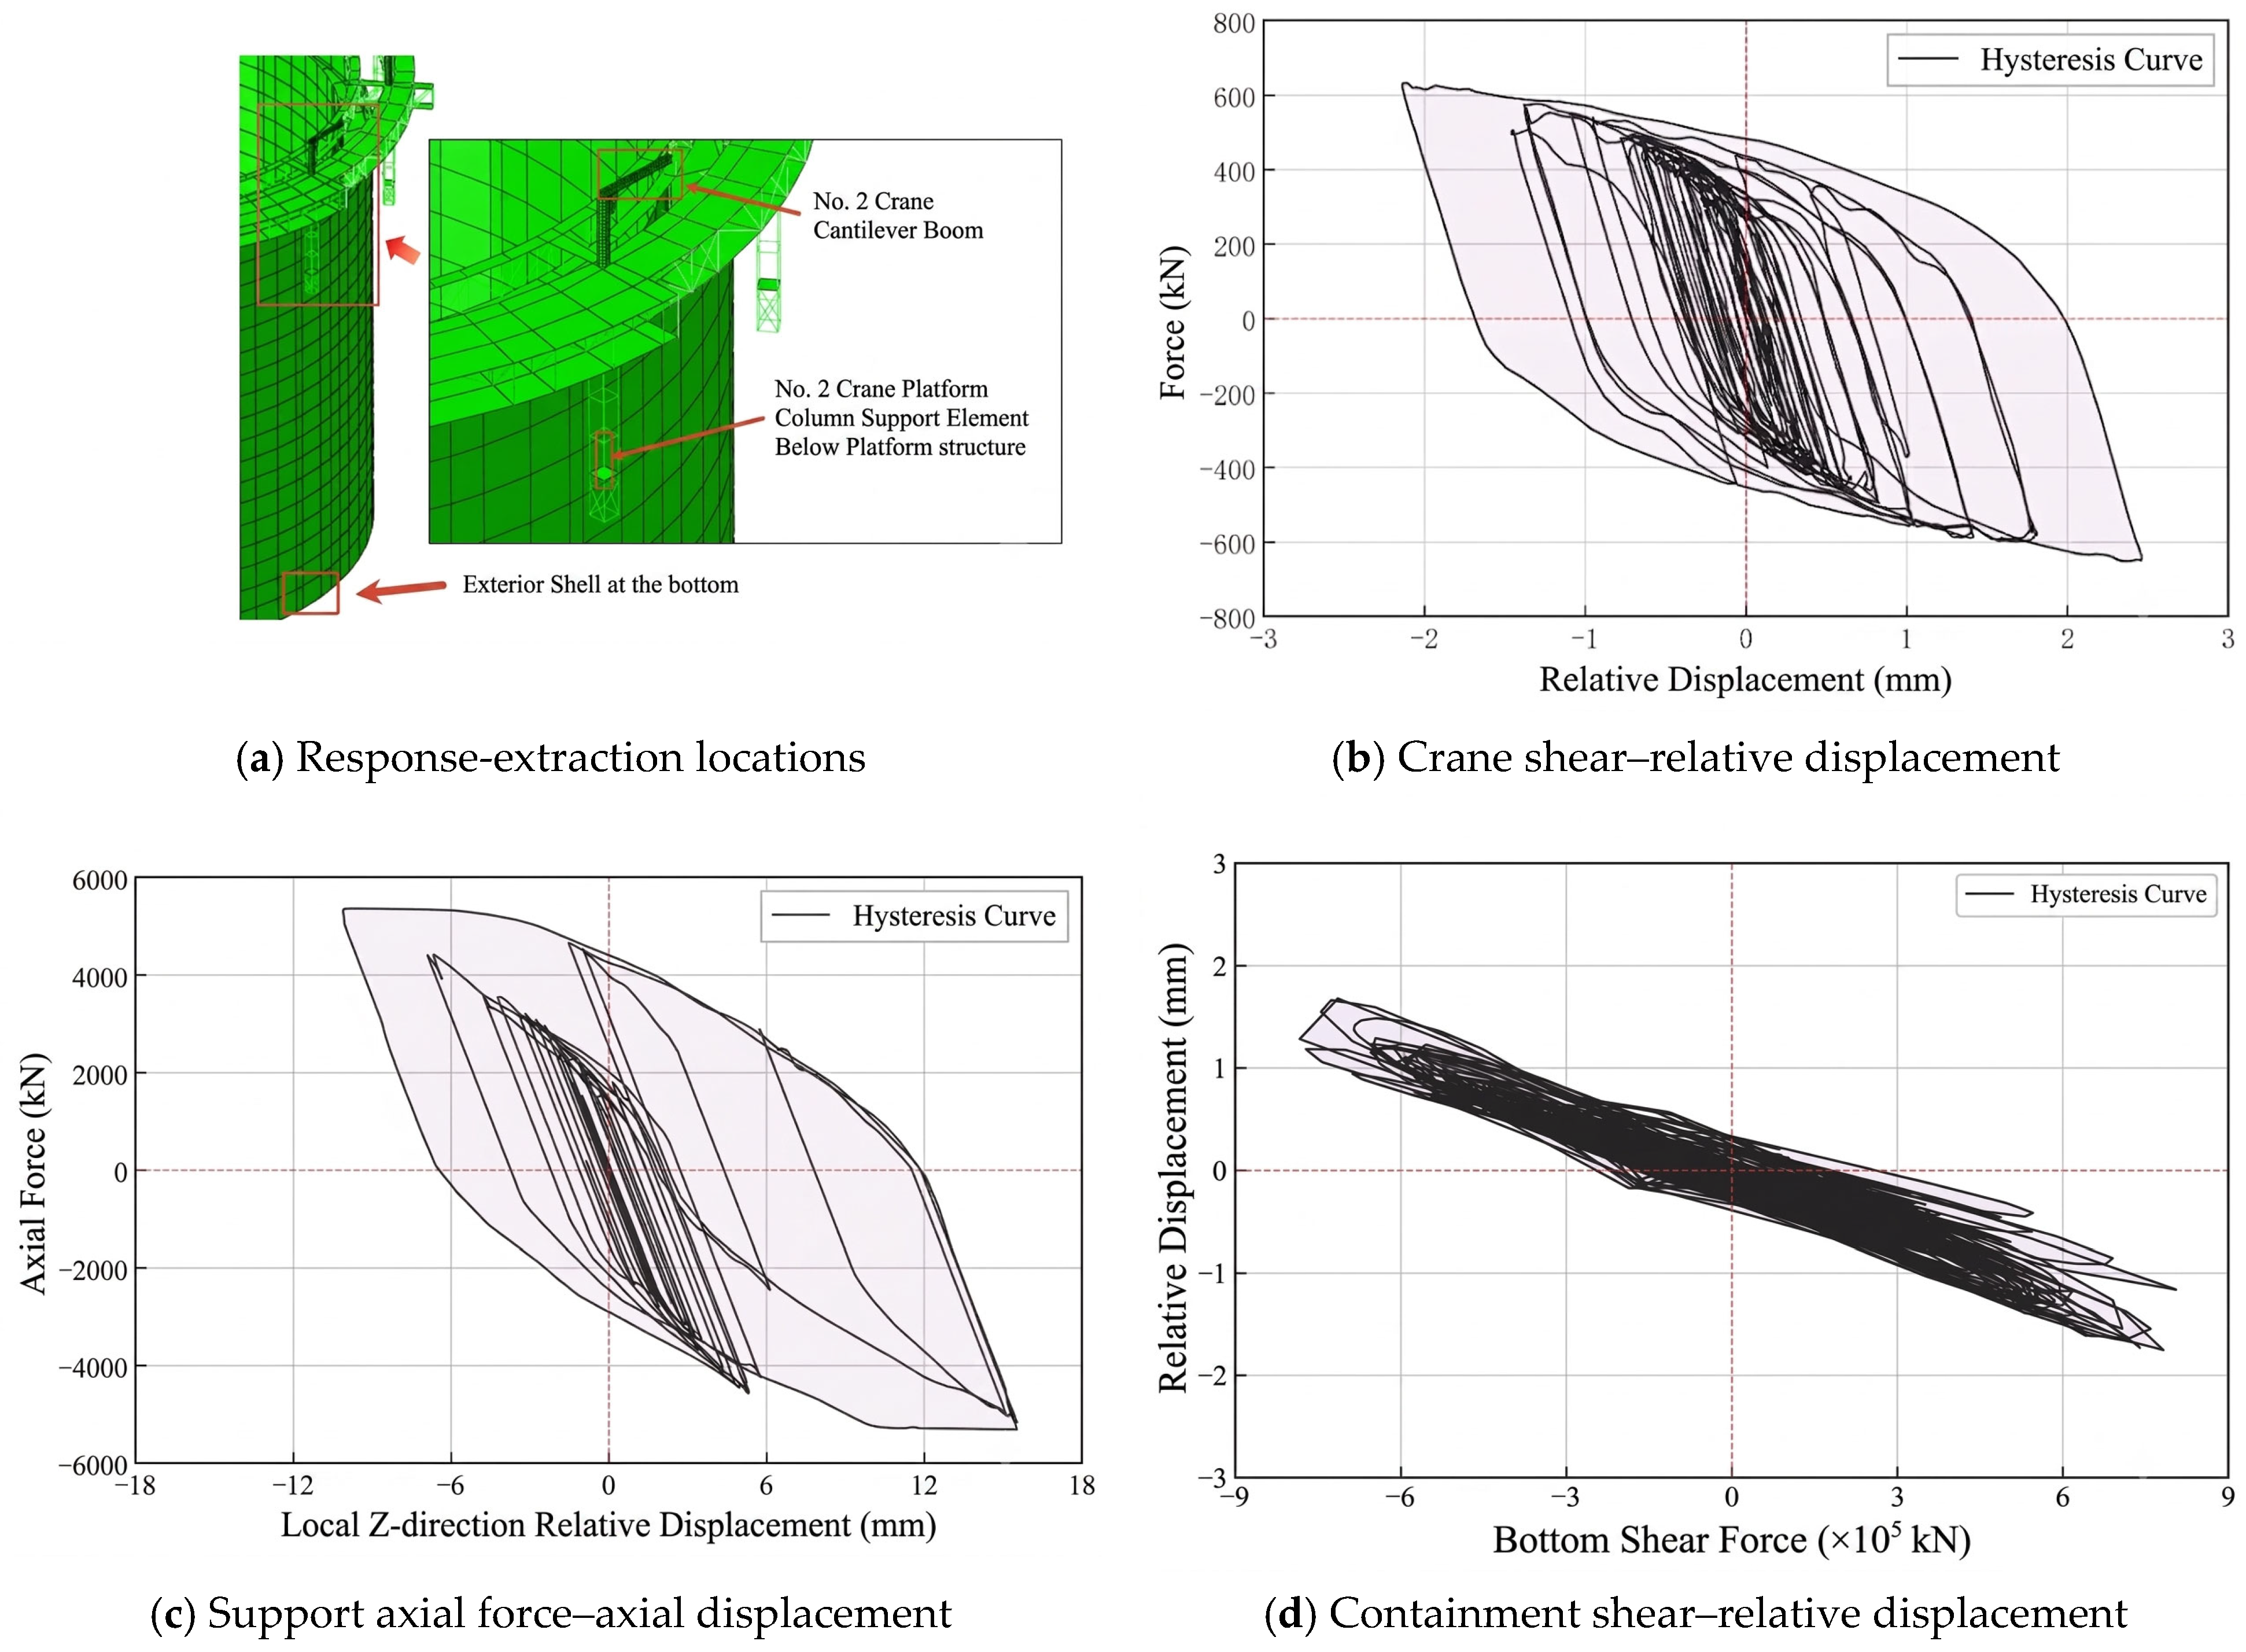
Figure 14 presents force–relative-displacement histories at PGAg = 1.0 g for the boom region of Crane 2, its underlying platform support, and the lower outer containment. The illustrated quantities are crane shear and local relative displacement, support axial force and local axial displacement, and containment base shear and relative displacement. They concern different generalized forces and displacements, so loop area and width should not be compared as if the axes represented identical physical quantities.
Figure 14.
Reported force–relative-displacement histories for the PGAg = 1.0 g example: (a) response-extraction locations; (b) crane shear-relative displacement; (c) support axial force-axial displacement; (d) containment shear-relative displacement. Different generalized forces/displacements are plotted at different locations, so loop areas cannot be compared directly as identical energy measures. These are numerical diagnostics, not independent experimental validation.
The crane shows pronounced hysteretic response, the support shows intermediate nonlinearity, and the containment curve is approximately linear over the displayed range. This is consistent with deformation concentrating in the flexible upper components of the assumed model. A broad loop is a consequence of the assigned constitutive and loading conditions; it provides a diagnostic of nonlinear response rather than independent validation of the material model or an experimental measure of dissipation.
4.4. Probability-Based Screening of Crane Groups
Figure 15 and Table 4 translate the numerical group assessment into conditional screening information. The any-crane and all-crane events have unambiguous count definitions. The originally reported intermediate (“half-group”) curve is retained for completeness but is not used for operational interpretation because its exact count convention is unresolved. PGAs corresponding to 10%, 50%, and 90% conditional exceedance are listed. These percentages describe probabilities of the defined damage event conditional on intensity, rather than annual hazard probabilities, confidence levels, or deterministic damage counts.
Figure 15.
Crane-group conditional exceedance curves for the any-crane and all-crane events, with the originally reported intermediate (“half-group”) curve retained for completeness: (a) any crane; (b) half-group; (c) all cranes. Printed μ values are logarithmic median PGAs, with the intensity expressed in g. The highest category is the D4 deformation threshold. The intermediate curve is not used for operational interpretation because its exact count convention is unresolved. The legacy raster legend label “Collapse” denotes D4 only.
Table 4.
Reported PGAg thresholds (g) at selected conditional exceedance probabilities.
For the unambiguous group events, an all-crane exceedance is necessarily an any-crane exceedance, so P(any) ≥ P(all) at a fixed intensity and the corresponding intensity threshold for the all-crane event should not be lower than that for the any-crane event at the same exceedance probability. The originally reported intermediate curve falls between these events but is retained only as archival information because its exact counting convention is unresolved. The D4 log-median annotations for the any-crane and all-crane events are approximately −1.29 and −0.65, corresponding to medians of approximately 0.275 and 0.522 g, respectively, consistent with Table 4 to the displayed precision.
A threshold can be used as an inspection trigger if the decision-maker selects an acceptable conditional probability in advance. For example, at PGAg = 0.05 g, the tabulated 10% threshold for slight damage to any crane (0.031 g) is exceeded, while that for moderate damage to any crane (0.061 g) is not. This does not mean that moderate damage is impossible. At PGAg = 0.20 g, the 10% threshold for D4 exceedance in any crane (0.194 g) is exceeded. Actual damage must be established by inspection or monitoring.
The tabulated values are model-dependent fitted thresholds. Values below the 0.1 g level displayed in the evolution diagrams have more limited demonstrated data support and should not be treated as independent low-intensity simulation results. The table illustrates probability-based screening; it does not estimate economic loss, identify which specific cranes are damaged, or replace inspections. The intermediate-event curve is retained only for completeness because its count convention is unresolved. Application to another construction height, crane arrangement, attachment detail, or site requires an assessment consistent with that configuration and hazard.
4.5. Assessment Using Crane-Base Motion
Ground shaking and crane-base motion serve different assessment tasks. PGAg conditions the group fragility analysis in Section 3 and Section 4.4. In this section, the intensity measures are calculated from the acceleration response at the crane base, which already contains the filtering effects of the containment and platform. Such measurements provide more direct information about the excitation of the crane, but they do not eliminate uncertainty in crane properties, damage limits, or measurement quality.
4.5.1. Candidate Intensity Measures and Local Components
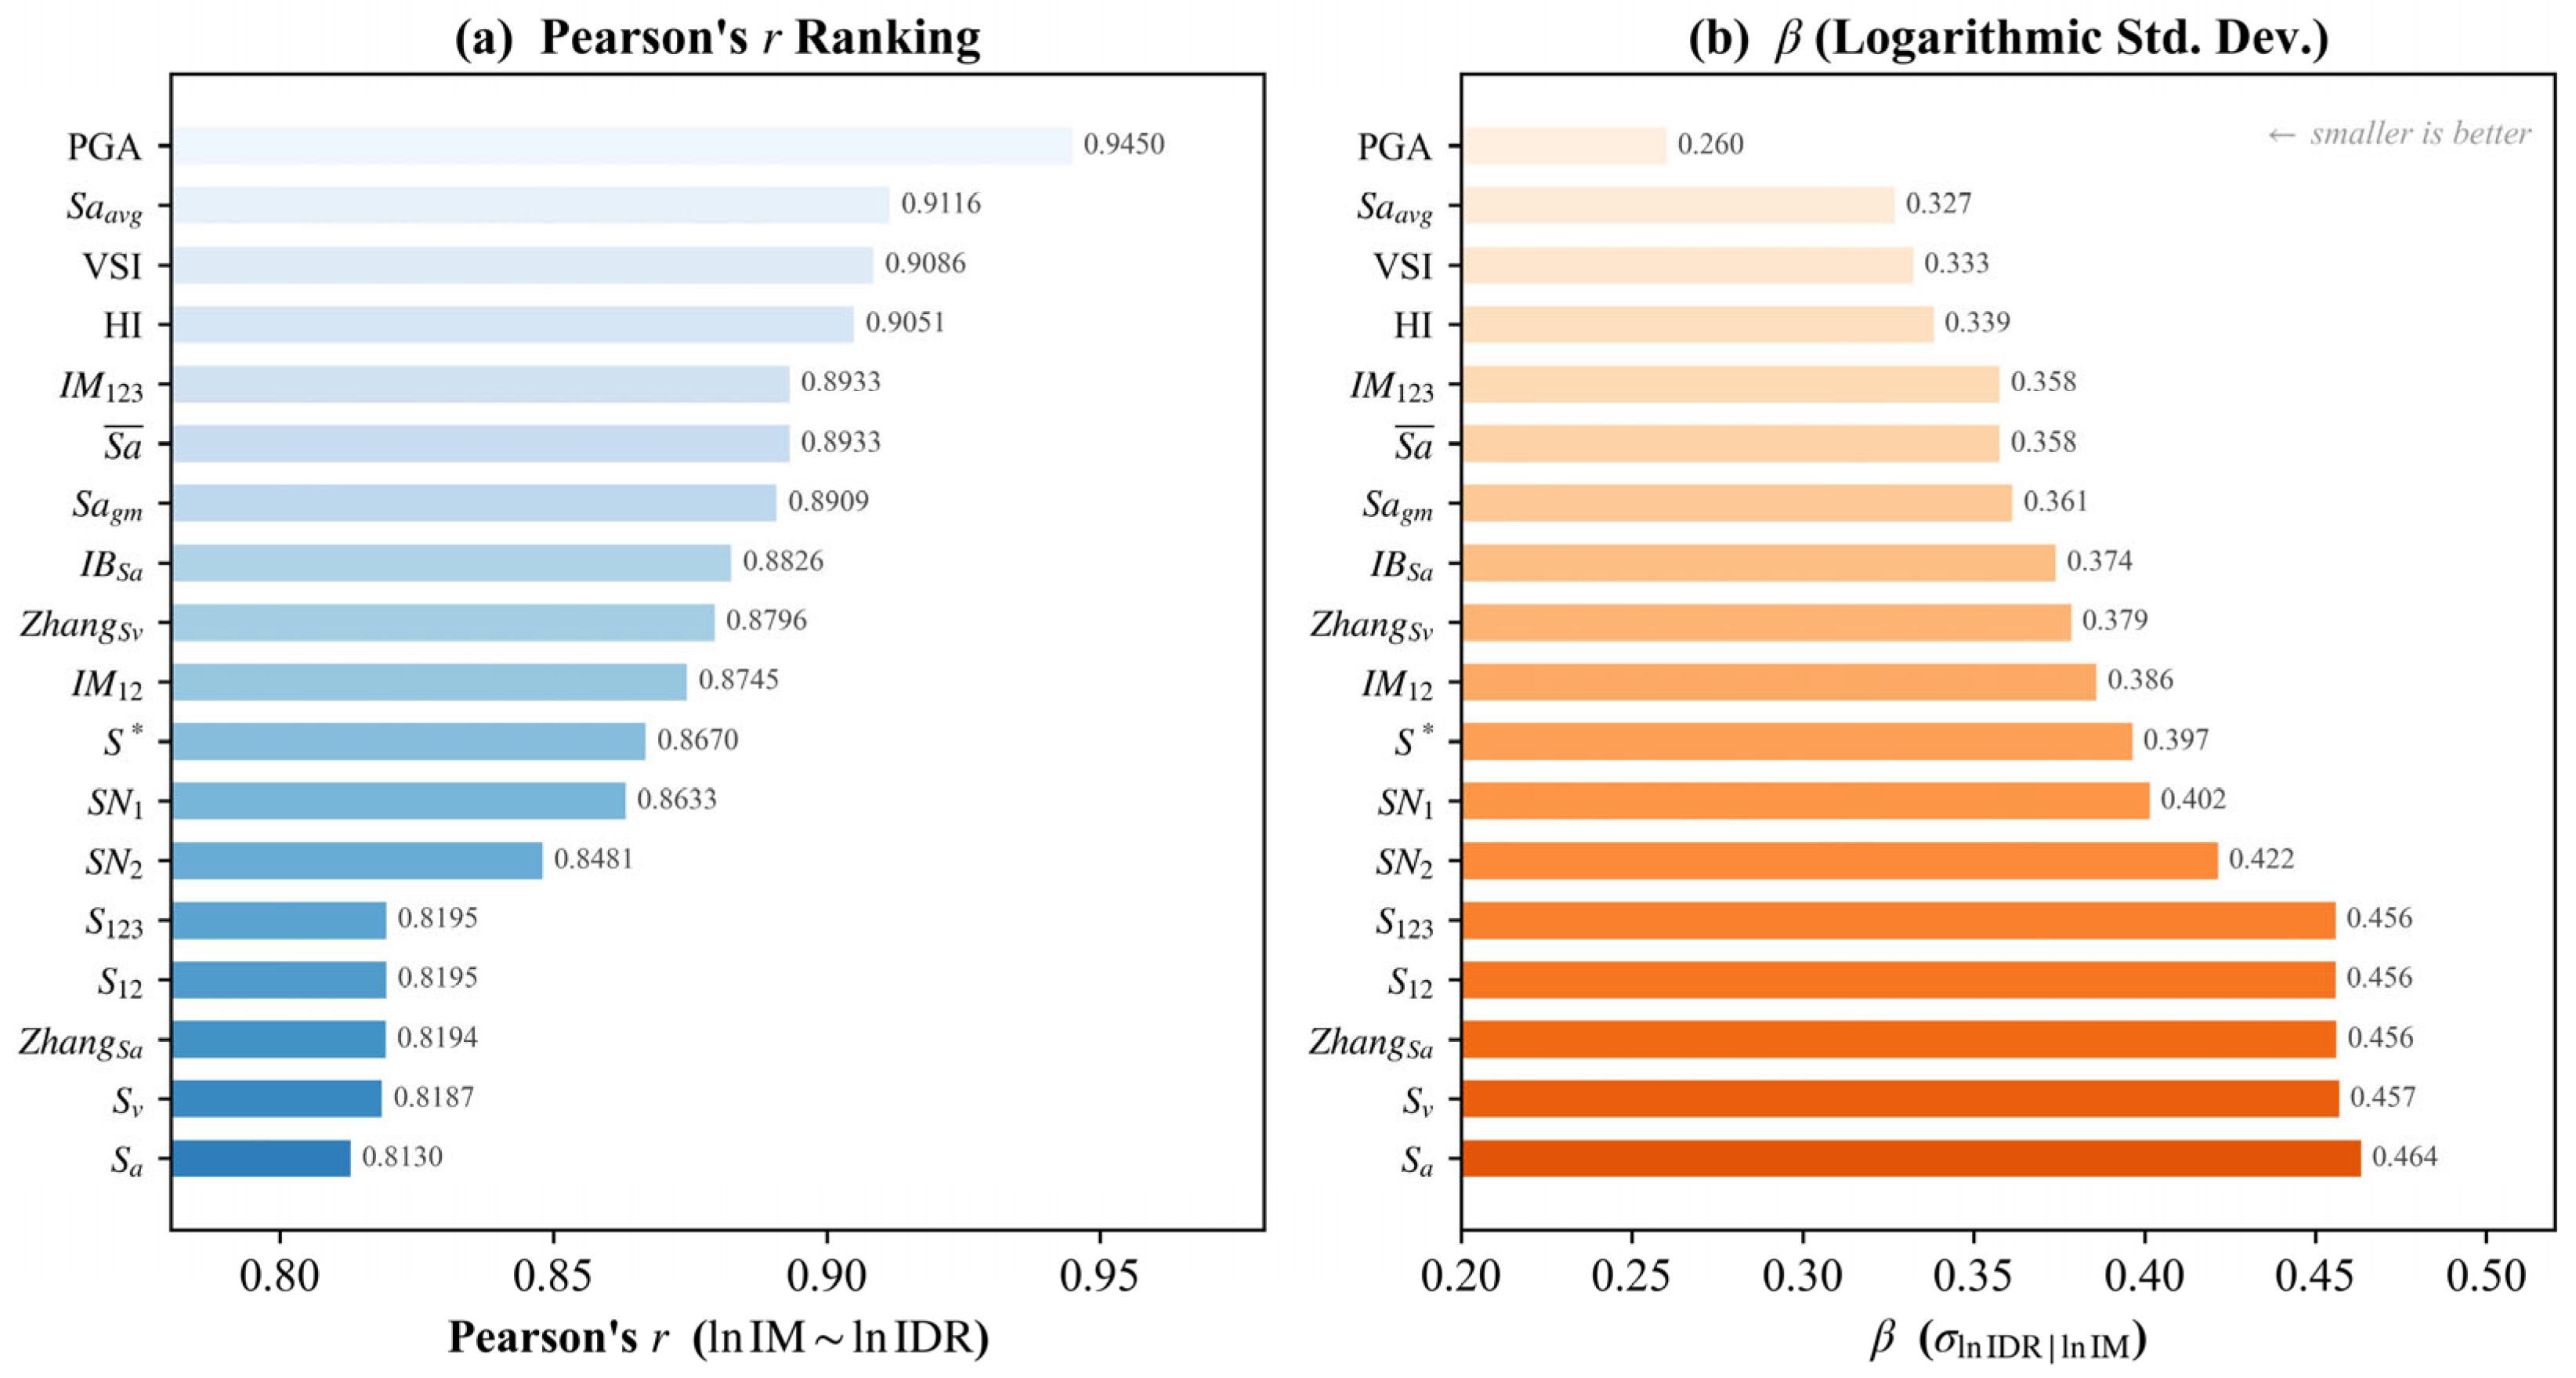
Eighteen candidate descriptors are retained from the existing comparison, using the definitions summarized in the intensity-measure literature [31]: one peak descriptor (PGA), two single-period spectral descriptors (Sa and Sv), two spectrum-integral descriptors (HI and VSI), and 13 composite descriptors (Sa_avg, Sa_gm, S*, SN1, SN2, IM12, IM123, IB_Sa, S12, S123, Zhang_Sa, Zhang_Sv, and average_Sa). HI and VSI summarize velocity-spectrum ordinates over a period interval; they are not direct measurements of hysteretic energy in the crane.
To avoid confusing the excitation levels, the peak calculated from one crane-base acceleration component is denoted PBAb = maxt|ab(t)|. For the two local components, the scalar peak-based descriptor is PBAcomb = √(PBAb,S PBAb,W). This is the geometric mean of component peaks, not the peak resultant acceleration. The abbreviation PGA in Figure 16, Figure 17 and Figure 18 is the legacy label of this base-response descriptor and must not be read as PGAg. Spectral descriptors are likewise computed from base motion rather than the original ground input.
Figure 16.
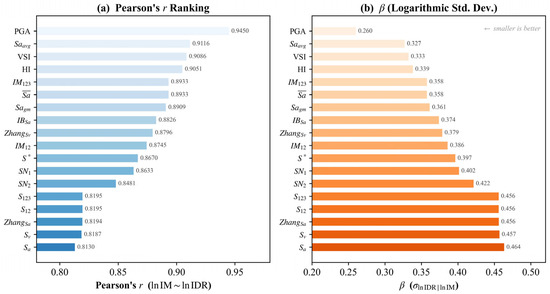
Reported rankings for 18 crane-base descriptors correlation in logarithmic coordinates and conditional logarithmic dispersion: (a) Pearson’s r ranking; (b) logarithmic standard deviation. “PGA” is the source label for the crane-base peak descriptor (PBAcomb in the text), not the ground peak PGAg.
Figure 17.
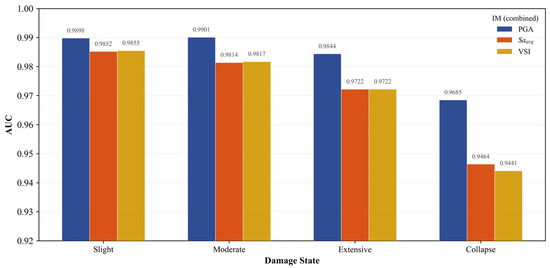
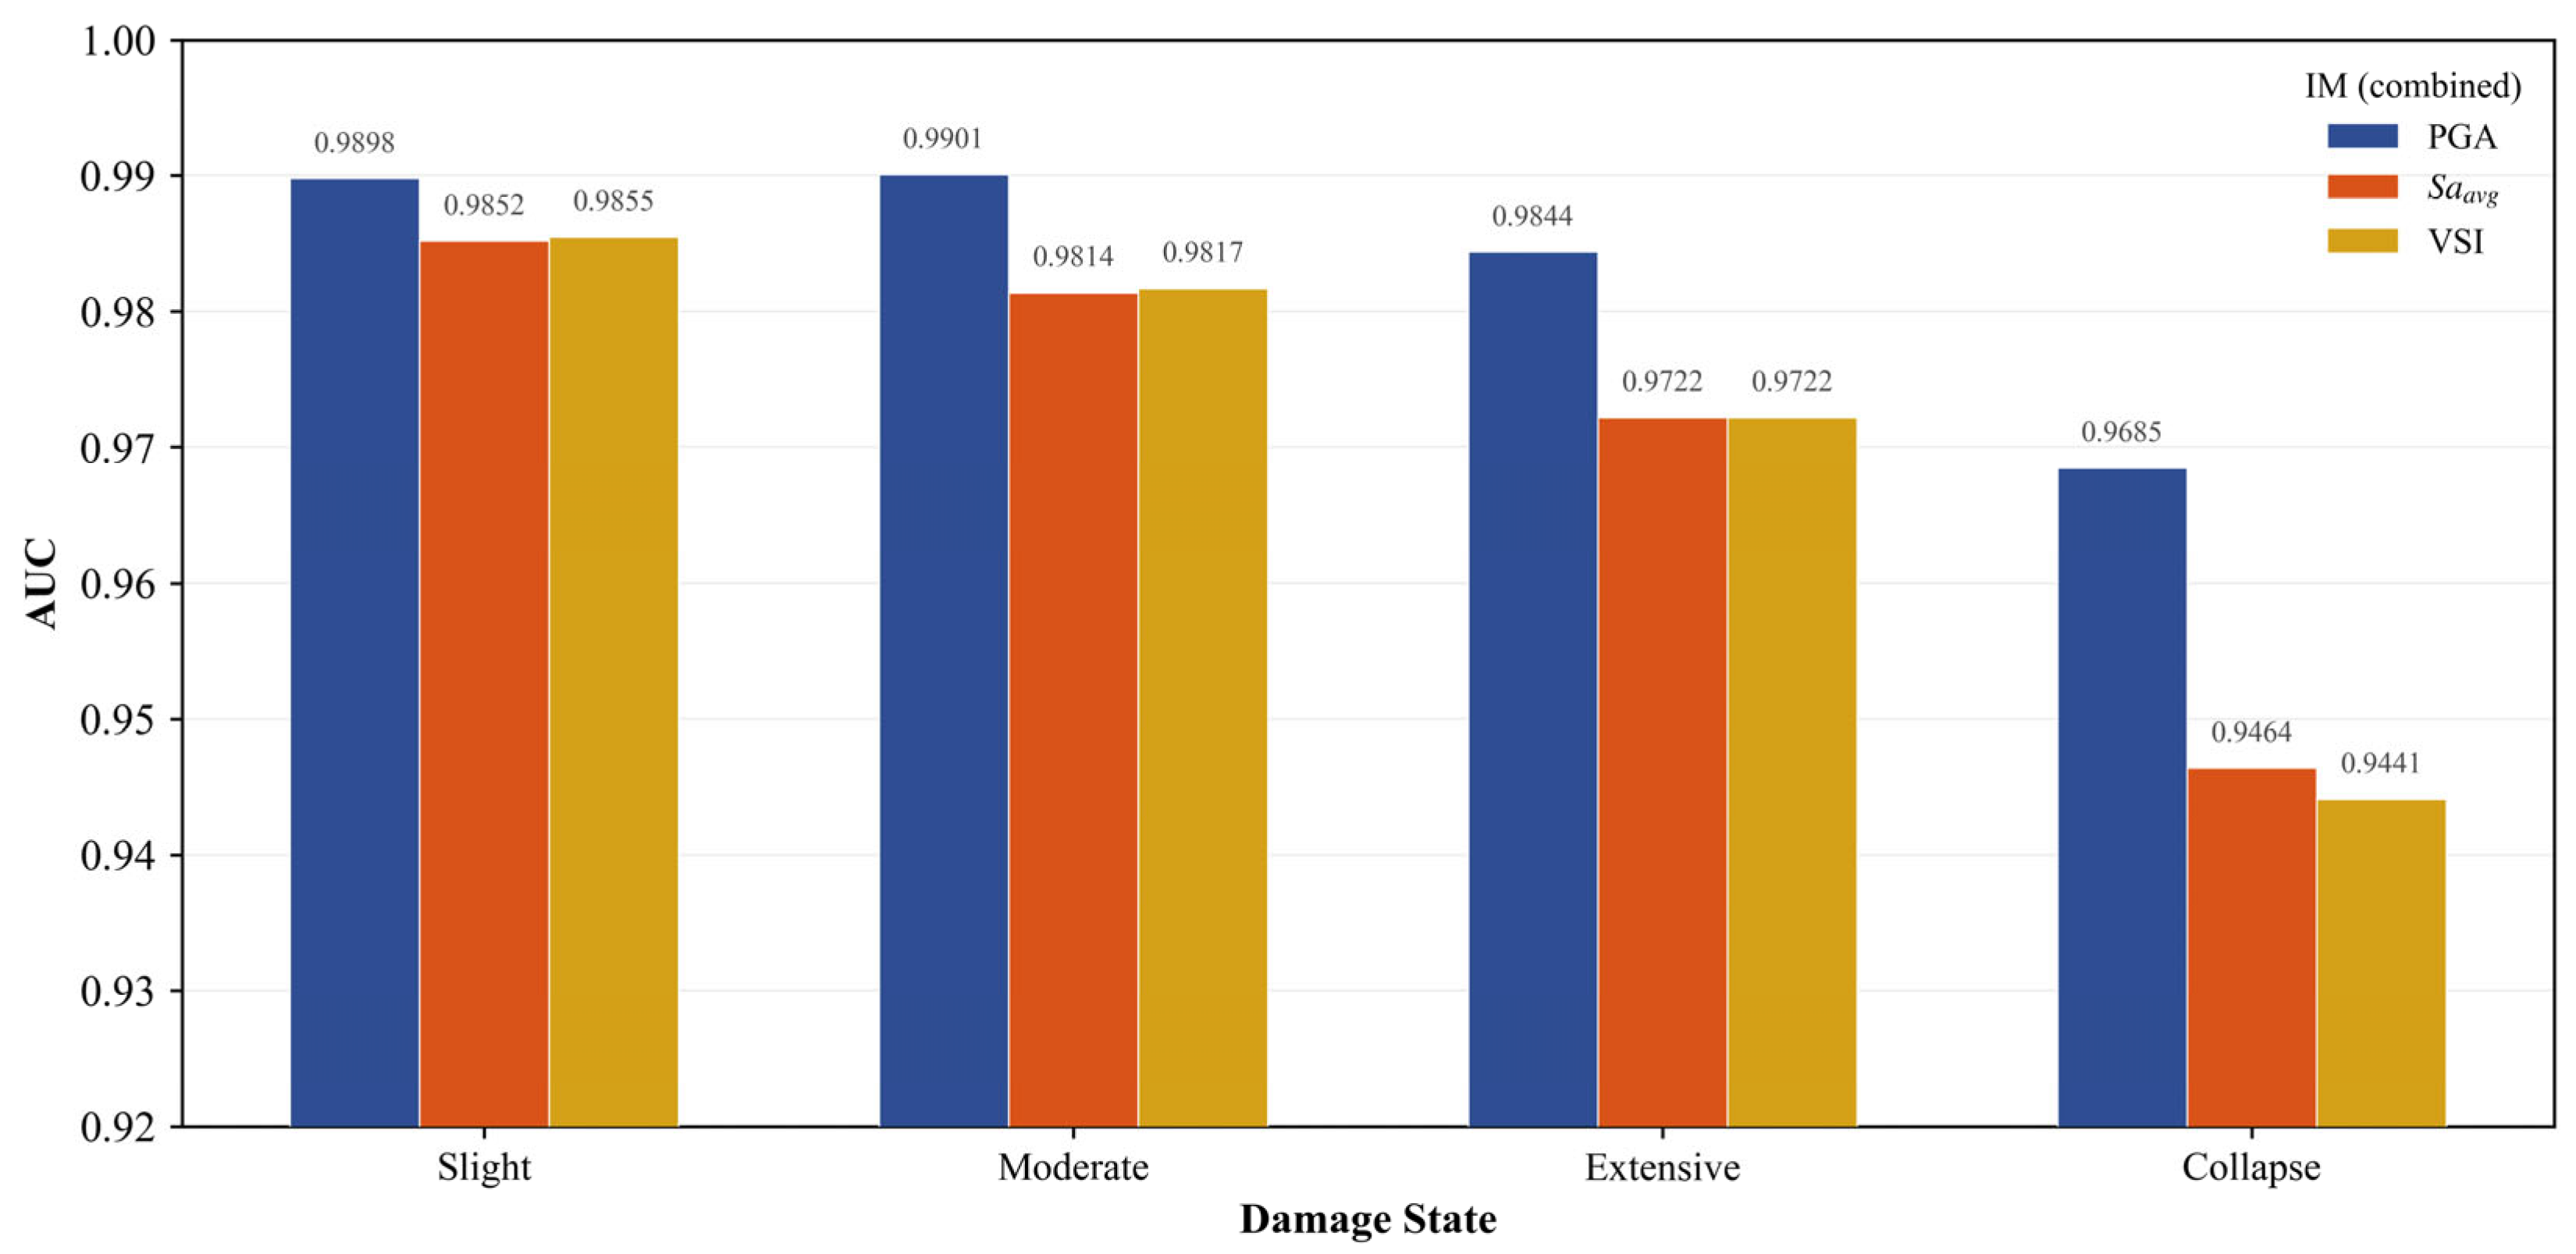
Reported AUC values for the three selected crane-base descriptors across damage thresholds. “PGA” denotes the crane-base peak descriptor. AUC measures discrimination and does not verify probability calibration or held-out predictive accuracy. The legacy “Collapse” category in the raster plot corresponds to D4.
Figure 18.
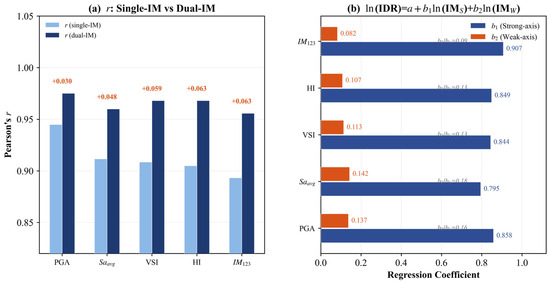
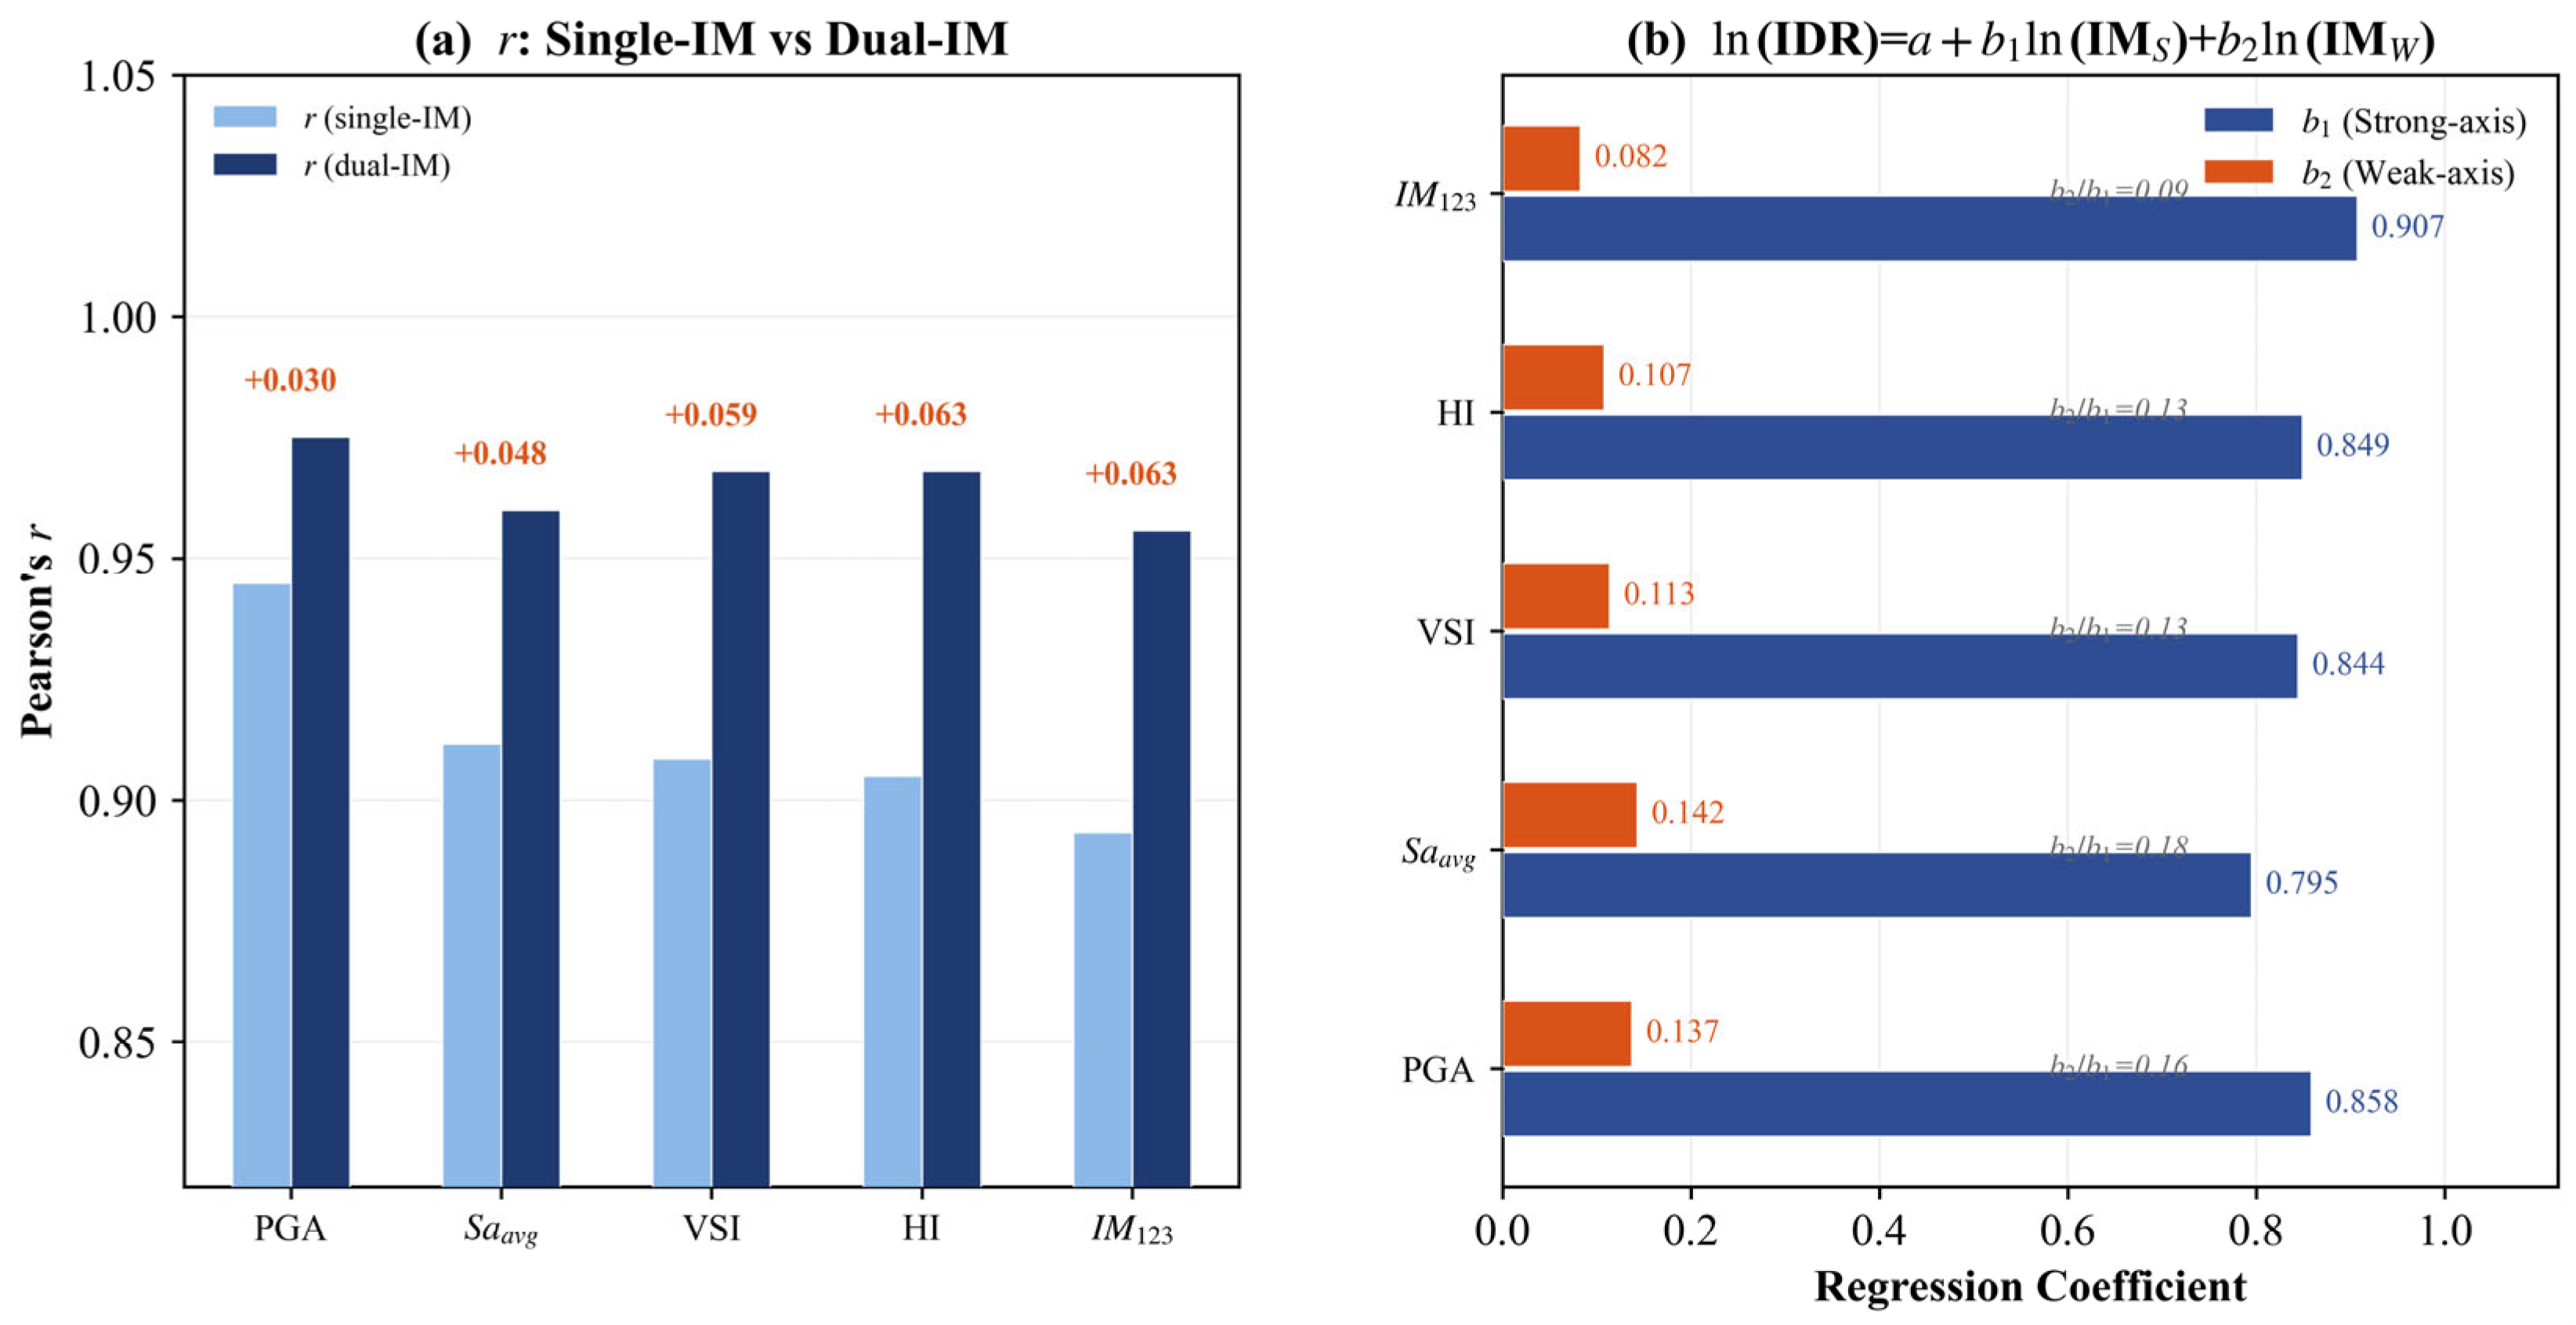
Comparison of geometric-mean scalar and two-local-component regression for selected base-motion descriptors: (a) r: Single-IM vs Dual-IM; (b) regression coeffient. “PGA” denotes the base peak descriptor. Both predictors are local responses under the reported single-direction global input; this is not a bidirectional ground-motion analysis.
The S and W labels identify the two local axes used in the existing regression dataset. Their mapping to the physical boom strong and weak bending directions must be retained consistently. Even with a single global X ground input, a three-dimensional coupled structure can generate two local crane-base response components. Using those two responses as predictors does not mean that a bidirectional ground-motion analysis has been performed.
4.5.2. Correlation Dispersion and Classification
The existing comparison uses the log-linear demand model ln(IDR) = a + b ln(IM). Pearson r is calculated in logarithmic coordinates, and the conditional logarithmic dispersion βres describes the scatter of ln(IDR) about its prediction. In a two-parameter ordinary least-squares fit, βres = √[Σ(ln(IDRi) − a − b ln(IMi))2/(n − 2)]. The area under a receiver-operating-characteristic curve (AUC) summarizes discrimination of threshold exceedance. AUC does not measure probability calibration or demonstrate that a predicted probability is unbiased.
For positive local descriptors, IMcomb = √(IMS IMW) gives ln(IMcomb) = 0.5 ln(IMS) + 0.5 ln(IMW). It treats the two components symmetrically in logarithmic space. Other combinations, including a maximum or square-root-sum-of-squares descriptor, remain legitimate alternatives; they are not invalid simply because their logarithm is not a linear mean. The two-predictor model ln(IDR) = a + bS ln(IMS) + bW ln(IMW) relaxes the equal-weight constraint. Zero-component intensities require an explicit treatment before logarithmic fitting.
Figure 16 reports r = 0.945 and βres = 0.260 for the peak-based descriptor. Sa_avg gives r = 0.912 and βres = 0.327. Relative to Sa_avg, the peak-based residual dispersion is lower by (0.327 − 0.260)/0.327 ≈ 20.5%; equivalently, the Sa_avg dispersion is about 25.8% larger. These percentages describe logarithmic residual dispersion, not a percentage reduction in physical damage or prediction error on the original displacement scale.
Figure 17 reports D4 AUC values of 0.969, 0.946, and 0.944 for the peak-based descriptor, Sa_avg, and VSI, respectively. The displayed lower-state AUC values exceed 0.97. These are descriptive comparisons for the analyzed dataset. The use of multiple intensities and multiple cranes under the same earthquake creates clustered observations; without record-level held-out evaluation, the values cannot establish predictive performance for unseen earthquakes.
In Figure 18, the peak-based descriptor’s reported correlation increases from 0.945 to 0.975 when the two local predictors are fitted separately. This is an increase of 0.030 in r, and additional predictors can improve an in-sample fit even without improving generalization. The reported coefficient ratios of approximately 6–11 suggest unequal local-component associations, but coefficient sizes alone do not prove a causal strong-axis failure mechanism, particularly if predictors are correlated.
The peak-based descriptor is therefore the most efficient of the compared descriptors for this dataset under the reported assumptions. Possible reasons include its direct representation of input amplitude at the crane base and the mismatch between fixed spectral periods and an evolving nonlinear response. The ranking does not show that seismic damage lacks period sensitivity or that composite measures are universally inferior. International nuclear-structure studies demonstrate that intensity-measure effectiveness can change with frequency content, response quantity, and uncertainty treatment [12,14]. A monitoring application should verify sensor orientation, baseline processing, sampling rate, calibration, and applicability to the actual crane configuration.
4.6. Limitations and Applicability
The principal limitation is the dependence of the quantitative curves on the input-motion identity and modeling assumptions. The recorded component, scaled amplitude series, and application axis must be consistent. The small record set and the uncertain support rotational restraints additionally limit numerical confidence. The results should therefore guide investigation of this configuration rather than be transferred directly as certified design limits.
Real bolted connections can exhibit finite rotational stiffness, slip, separation, and contact friction. Reduced stiffness may increase relative displacement, shift a period into or out of a spectral peak, and redistribute demand among cranes. Friction can add dissipation, while bolt or anchorage failure can introduce a new limit state absent from a rigid-connection model. A useful extension would parameterize connection stiffness, slip threshold, and friction using component tests and compare their effect on C50 and β. The present study contains no such calibrated sensitivity result and does not claim that rigid connections necessarily bound the true fragility.
The damping assumption concerns the elastic numerical model and does not separately quantify energy dissipated by joints, soil, or a suspended load. Rayleigh damping should be checked over the modes that contribute to crane-base excitation and against nonlinear stiffness changes. Alternative damping ratios and calibration bands could alter both the transmitted acceleration and crane deformation. Soil–structure interaction can also modify the input and modal properties; a fixed base does not identify the site class or establish an upper-bound response.
The unloaded standby case excludes the pendulum behavior of a lifted payload, which can alter effective inertia, couple with crane modes, and either increase or redistribute demand depending on rope length and payload mass. No payload-derived damping is included. The open-shell construction stage is one configuration; other shell heights, dome conditions, platform positions, and boom angles may produce different amplification and vulnerable-crane rankings.
Under paired horizontal excitation, a crane favorable to the X component may be unfavorable to the Y component. Simultaneous bending, torsion, and local yielding may change the resultant tip displacement and the probability that several cranes are damaged together. A second component may increase the probability of threshold exceedance, but the magnitude and even the component-wise direction of change depend on relative phase, incidence angle, and nonlinear interaction. No numerical bidirectional correction factor is inferred. A suitable extension would use paired horizontal records, preserve their relative timing, rotate the pair through relevant incidence angles, and define scalar or vector intensity measures consistently. Vertical excitation may further change axial force and local stability.
The adopted deformation thresholds require component-level calibration, and D4 exceedance is not equivalent to independently established physical collapse. Finite-record variability, uncertain material and connection properties, the lognormal fitting assumption, and possible low-intensity extrapolation all affect the tails. Confidence bands, record-level cross-validation, and sensitivity analyses would be needed before assigning operational probabilities or extending the method to other projects. These restrictions qualify the practical interpretation of Table 3 and Table 4 without negating the observed response patterns in the reported model.
5. Conclusions
The reported numerical case study examines attached cranes in a stationary, unloaded configuration on an integrated platform near completion of the cylindrical containment. Its principal findings are conditional on the input-motion provenance, support idealizations, and adopted deformation criteria.
The coupled system exhibits local amplification in its flexible upper components. In the reported Record 5 example at PGAg = 0.5 g, the crane-tip peak displacement is 1.42 times the platform-top peak and 2.54 times the support-level peak. Plastic-strain and yielding patterns are concentrated near the boom–column junction and, secondarily, the column base. These outputs identify regions for inspection rather than validated fracture locations.
For the analyzed X-direction excitation and installed layout, Crane 2 shows higher fragility than Crane 5. The reported severe-damage medians are 0.124 and 0.177 g, respectively, and the corresponding D4 medians are 0.275 and 0.399 g. The ratios of 1.43–1.45 indicate a substantial configuration-dependent difference, but boom orientation and attachment location co-vary and have not been independently isolated through matched parameter sweeps.
The group-level assessment gives conditional threshold PGAs for the unambiguous any-crane and all-crane events. The originally reported intermediate curve is retained only for completeness because its exact count convention could not be reconstructed. The results illustrate how a selected probability level can organize inspection priorities, but they do not establish deterministic damage counts, economic loss, or permission to resume lifting operations. Low-intensity extrapolation limits quantitative operational use.
For response-based assessment, the peak descriptor calculated from crane-base motion gives the strongest reported association among the 18 candidates, with r = 0.945, βres = 0.260, and D4 AUC = 0.969. Its logarithmic dispersion is approximately 20.5% below that of Sa_avg. The two-local-component fit gives r = 0.975. These results support further evaluation of a simple base-response descriptor, while record-level validation is needed before predictive generalization is claimed.
Further work should quantify input, connection, damping, sampling, and limit-state uncertainty through independently documented benchmarks and sensitivity studies. Paired horizontal and vertical excitation, changing construction stages, and payload–crane interaction would extend the applicable scope. The present conditional response results do not independently establish a site-specific horizontal hazard assessment or compliance with a nuclear seismic acceptance criterion.
Author Contributions
Conceptualization, X.L. and D.W.; methodology, C.L.; software, J.L.; validation, X.T., X.N. and K.Y.; formal analysis, J.X.; investigation, X.L.; resources, J.X.; data curation, J.X.; writing—original draft preparation, X.L., D.W., C.L., J.L., J.X., and K.Y.; writing—review and editing, X.T. and X.N.; visualization, D.W.; supervision, X.N.; project administration, X.T.; funding acquisition, X.N. and X.T. All authors have read and agreed to the published version of the manuscript.
Funding
This research was funded by the Shanghai Magnolia Talent Program Pujiang Project (Grant No: 24PJD136), National Natural Science Foundation of China (Grant No: 52508343), Basic Research Program of Jiangsu Province (Grant No: BK20251486), and Fundamental Research Funds for the Central Universities (Grant No: B250201004).
Data Availability Statement
Data, models, or code supporting the reported study are available from the corresponding author upon reasonable request.
Acknowledgments
The authors acknowledge the support of the Shanghai Magnolia Talent Program Pujiang Project (Grant No: 24PJD136), National Natural Science Foundation of China (Grant No: 52508343), Basic Research Program of Jiangsu Province (Grant No: BK20251486), and Fundamental Research Funds for the Central Universities (Grant No: B250201004).
Conflicts of Interest
Xiao Lai, Di Wu, Cheng Liu, Jianpeng Liu, Jiaqi Xu, and Kun Yang are employed by CNEC Innovation Technology Co., Ltd. The remaining authors declare no commercial or financial relationships that could be construed as a potential conflict of interest.
Appendix A. Reported Fragility Curve Parameters
Table A1 and Table A2 transcribe the μ and β annotations printed in Figure 12 and Figure 15. C50 is calculated as exp(μ) with the PGA expressed in g and rounded to three decimal places. Because μ is displayed to only two decimals, these derived values may differ slightly from medians obtained from the unrounded original fit. No new parameter estimation or confidence interval is implied. D1–D4 are the exceedance thresholds in Table 3; D4 remains a deformation criterion.
Table A1.
Individual-crane parameters transcribed from Figure 12.
Table A2.
Crane-group parameters transcribed from Figure 15.
References
- ISO 11031:2016; Cranes—Principles for Seismically Resistant Design. International Organization for Standardization: Geneva, Switzerland, 2016.
- Department of Labour of New Zealand. Approved Code of Practice for Cranes, 3rd ed.; Department of Labour: Wellington, New Zealand, 2009. [Google Scholar]
- JCAS 1101-2008; Japan Earthquake-Resistant Design Guidelines. Japan Crane Association: Tokyo, Japan, 2008.
- BBC News. Watch: Crane Falls from Top of High Rise in the Philippines After Quake. 2023. Available online: https://www.bbc.com/news/av/world-asia-67469186 (accessed on 31 December 2025).
- Taipei Times. Quake Kills Five as It Rattles the Nation. 2002. Available online: https://www.taipeitimes.com/News/front/archives/2002/04/01/0000130035 (accessed on 31 December 2025).
- Gong, J.; Fang, T. Research and application of integral steel platform formwork equipment technology. Build. Struct. 2021, 51, 141–144, 42. [Google Scholar] [CrossRef]
- Wang, K.; Wang, D.; Liu, W.; Zhao, W.; Huang, L.; Yang, K.; Huang, G.; Cui, J. Research on integrated construction platform for Hualong One reactor building. Constr. Technol. 2024, 53, 142–146. [Google Scholar]
- Vamvatsikos, D.; Cornell, C.A. Incremental dynamic analysis. Earthq. Eng. Struct. Dyn. 2002, 31, 491–514. [Google Scholar] [CrossRef] [Scilit]
- Baker, J.W. Efficient analytical fragility function fitting using dynamic structural analysis. Earthq. Spectra 2015, 31, 579–599. [Google Scholar] [CrossRef] [Scilit]
- Zentner, I.; Gündel, M.; Bonfils, N. Fragility analysis methods: Review of existing approaches and application. Nucl. Eng. Des. 2017, 323, 245–258. [Google Scholar] [CrossRef] [Scilit]
- Mai, C.; Konakli, K.; Sudret, B. Seismic fragility curves for structures using non-parametric representations. Front. Struct. Civ. Eng. 2017, 11, 169–186. [Google Scholar] [CrossRef] [Scilit]
- Nguyen, D.-D.; Thusa, B.; Han, T.-S.; Lee, T.-H. Identifying significant earthquake intensity measures for evaluating seismic damage and fragility of nuclear power plant structures. Nucl. Eng. Technol. 2020, 52, 192–205. [Google Scholar] [CrossRef] [Scilit]
- Lyu, M.-Z.; Fei, Z.-J.; Feng, D.-C. Copula-based cloud analysis for seismic fragility and its application to nuclear power plant structures. Eng. Struct. 2024, 305, 117754. [Google Scholar] [CrossRef] [Scilit]
- Kim, C.; Nguyen, H.D.; Kwon, O.-S.; Shin, M. Seismic fragility analysis for prestressed concrete containments of nuclear power plants based on stripe-based approach. Soil Dyn. Earthq. Eng. 2026, 200, 109804. [Google Scholar] [CrossRef] [Scilit]
- Rong, H.; Jin, S.; Gong, J. Fragility analysis of containment near ground vibration in nuclear power plant. Nucl. Power Eng. 2022, 43, 126–132. [Google Scholar] [CrossRef]
- Liu, K.; Wang, D. Seismic design analysis of nuclear power plant BOP building based on SL-2 verification. Ind. Build. 2023, 53, 190–193. [Google Scholar]
- Zhang, H.; He, Y. Analysis on anti-collapse of the main building of the conventional island of a nuclear power plant. J. Wuhan Univ. Eng. Sci. 2022, 55, 152–157. [Google Scholar]
- Lu, Y.; Gao, M.; Liang, T.; He, Z.; Feng, F.; Pan, F. Wind-induced vibration assessment of tower cranes attached to high-rise buildings under construction. Autom. Constr. 2022, 135, 104132. [Google Scholar] [CrossRef] [Scilit]
- He, Z.; Gao, M.; Liang, T.; Lu, Y.; Lai, X.; Pan, F. Tornado-affected safety assessment of tower cranes outer-attached to super high-rise buildings in construction. J. Build. Eng. 2022, 51, 104320. [Google Scholar] [CrossRef] [Scilit]
- Jin, H. Seismic Response and Fragility Analysis of Coupled Tower Crane Structure with Super High-Rise Frame-Core Tube Structure during Construction Phase. Master’s Thesis, Dalian University of Technology, Dalian, China, 2018. [Google Scholar]
- Torrielli, A.; Giusti, A.; Brusco, S.; Repetto, M.P. The contribution of higher order modes in the dynamic response of slender vertical structures with application to wind turbine towers. Eng. Struct. 2024, 308, 117886. [Google Scholar] [CrossRef] [Scilit]
- Dassault Systèmes. Abaqus Analysis User’s Manual; Version 2022; Dassault Systèmes Simulia Corp.: Providence, RI, USA, 2022. [Google Scholar]
- Lee, J.; Fenves, G.L. Plastic-damage model for cyclic loading of concrete structures. J. Eng. Mech. 1998, 124, 892–900. [Google Scholar] [CrossRef] [Scilit]
- GB 50010-2010, 2015 ed.; Ministry of Housing and Urban-Rural Development of the People’s Republic of China. Code for Design of Concrete Structures. China Architecture & Building Press: Beijing, China, 2015.
- GB 50017-2017; Ministry of Housing and Urban-Rural Development of the People’s Republic of China. Standard for Design of Steel Structures. China Architecture & Building Press: Beijing, China, 2018.
- Han, T.; Tesfamariam, S. Numerical analysis of CLT shear walls using high-fidelity model: Connection to building system. J. Build. Eng. 2023, 72, 106458. [Google Scholar] [CrossRef] [Scilit]
- Pacific Earthquake Engineering Research Center. PEER Ground Motion Database: NGA-West2 Documentation. Available online: https://ngawest2.berkeley.edu/site/documentation (accessed on 17 October 2026).
- U.S. Nuclear Regulatory Commission. Design Response Spectra for Seismic Design of Nuclear Power Plants; Regulatory Guide 1.60, Revision 2; NRC: Washington, DC, USA, 2014. Available online: https://www.nrc.gov/docs/ML1321/ML13210A432.pdf (accessed on 17 October 2026).
- GB 50267-2019; Ministry of Housing and Urban-Rural Development of the People’s Republic of China; State Administration for Market Regulation. Standard for Seismic Design of Nuclear Power Plants. China Planning Press: Beijing, China, 2019.
- ASCE/SEI 41-23; Seismic Evaluation and Retrofit of Existing Buildings. American Society of Civil Engineers: Reston, VA, USA, 2023. [Google Scholar] [CrossRef] [Scilit]
- Lai, X.; He, Z.; Chen, Y.; Zhang, Y.; Li, Z.; Guo, Z.; Ma, L. A modified spectral-velocity-based earthquake intensity measure for super high-rise buildings. Soil Dyn. Earthq. Eng. 2022, 162, 107504. [Google Scholar] [CrossRef] [Scilit]

Disclaimer/Publisher’s Note: The statements, opinions and data contained in all publications are solely those of the individual author(s) and contributor(s) and not of MDPI and/or the editor(s). MDPI and/or the editor(s) disclaim responsibility for any injury to people or property resulting from any ideas, methods, instructions or products referred to in the content. |
© 2026 by the authors. Licensee MDPI, Basel, Switzerland. This article is an open access article distributed under the terms and conditions of the Creative Commons Attribution (CC BY) license.