


Abstract
Considering the diverse structures, short service periods, dynamic site layouts, and vulnerability of temporary works to strong winds and heavy rainfall, a safety resilience evaluation framework is proposed to address typhoon-related risks. Drawing on resilience engineering theory and the typhoon disaster process, safety resilience is divided into five dimensions with 21 indicators: pre-disaster prevention, disturbance resistance, emergency response, post-disaster recovery, and learning and adaptive capacity. Subjective and objective weights are determined using the G1 method and entropy weight method (EWM), respectively, followed by integration through quadratic optimization. TOPSIS is then used to evaluate resilience. Risk early warning, hazard identification and inspection, emergency resource preparedness, personnel evacuation, and response timeliness receive relatively high weights. The case project achieves a relative closeness coefficient of 0.678, corresponding to Level II resilience. Sensitivity analyses of weights, indicator scores, and indicator structures show generally consistent evaluation levels, indicating classification stability. The framework supports resilience evaluation and vulnerability identification of temporary works under typhoon conditions.
1. Introduction
Typhoons, which are often accompanied by strong winds, heavy rainfall, and short-duration extreme weather events, can directly affect personnel, equipment, and temporary facilities on construction sites. Compared with permanent works, temporary works on construction sites are characterized by diverse structural forms, short service periods, and site layouts that continuously change with construction stages. Facilities such as scaffolds, hoardings, temporary buildings, and temporary support systems are also directly exposed to the external environment throughout their service periods [1]. Consequently, their safety conditions are highly dynamic. Under extreme weather conditions, meteorological disturbances may disrupt normal project operations. Therefore, construction safety management should not only focus on identifying and controlling specific risks, but should also consider a project’s capacity to continuously maintain and restore a safe state before, during, and after disturbances [2].
Resilience engineering provides a new research perspective for assessing safety in construction. From a resilience engineering standpoint, Peñaloza et al. established an evaluation framework for construction safety performance measurement systems and incorporated monitoring, anticipation, response, and learning capabilities into construction safety management evaluation [3]. Bridi et al. investigated evaluation methods for construction safety management practices based on systems thinking and highlighted the critical roles played by different safety management measures and the interactions in construction safety management [4]. Bhattacharjee et al. compared resilience-based safety practices among construction projects of different scales and indicated that resilience capabilities, including monitoring, learning, and anticipation, still have room for further improvement [5]. These studies mainly focused on construction safety management systems and organizational practices, providing an important foundation for construction safety resilience evaluation. However, their research focus was not specifically directed toward the comprehensive safety resilience evaluation of specific temporary works under typhoon conditions.
Regarding construction project resilience evaluation, Wang et al. established a dynamic organizational resilience analysis framework for prefabricated construction projects from the perspective of the project lifecycle, focusing on organizational efficiency, flexibility, and robustness [6]. Liu et al. examined safety management practices in major engineering projects through the lens of resilience governance and explored the effects of various resilience-related factors on construction safety through indicator analysis and system dynamics methods [7]. Kou et al. developed an approach for assessing the emergency resilience of infrastructure projects exposed to extreme disasters, integrating the pressure–state–response–adaptation model with the analytic hierarchy process and fuzzy comprehensive evaluation [8]. These studies further expanded the research objects and methods of construction resilience evaluation. However, they mainly focused on project organization, construction safety governance, or overall emergency management, which differs from the evaluation object of this study, namely temporary works and their typhoon safety management capabilities.
For safety prevention of construction sites under typhoon conditions, Tang et al. developed a system designed to facilitate prompt safety inspections at construction sites following the issuance of typhoon warnings, which identifies safety hazards through on-site information and provides corresponding preventive measures [9]. Lee et al. further investigated disaster preparedness issues associated with construction materials, incomplete structures, and temporary structures under extreme weather conditions and proposed an active severe weather prevention framework for construction sites [10]. Gao et al. further established a query-based system for identifying safety hazards and retrieving corresponding response measures at road and bridge construction sites during typhoon alerts to improve the efficiency of on-site safety inspection and risk management [11]. These studies directly focused on typhoon disasters and construction site safety issues, providing technical support for pre-disaster risk identification and proactive prevention. However, their research mainly concentrated on site inspection and preventive measures during typhoon warning periods, which differs from a comprehensive evaluation framework covering pre-disaster prevention, disturbance resistance, emergency response, post-disaster recovery, and learning and adaptive capacity.
In summary, previous studies have conducted extensive research from the perspectives of construction safety management systems, project organizational resilience, emergency management under extreme disasters, and safety prevention during typhoon warning periods. However, for temporary works on construction sites, comprehensive evaluation considering both structural safety characteristics and disaster lifecycle management capabilities still requires further refinement. Compared with general construction projects, temporary works, including scaffolds, construction hoardings, temporary buildings, and temporary supports, are characterized by short service periods, rapidly changing site layouts, and high sensitivity to strong winds and heavy rainfall. Their safety resilience involves not only engineering factors, such as wind resistance of temporary structures, facility stability, and drainage and flood control capacity, but also management capabilities related to pre-disaster warning, personnel evacuation, emergency response, post-disaster repair, and experience improvement.
Therefore, this study takes temporary works on construction sites under typhoon conditions as the research object and establishes a safety resilience evaluation indicator system from the perspective of the whole disaster management process. The proposed system incorporates pre-disaster prevention, disturbance resistance, emergency response, post-disaster recovery, and learning and adaptive capacity. The G1 method, entropy weight method (EWM), and quadratic optimization-based combined weighting method are integrated with the Technique for Order Preference by Similarity to an Ideal Solution (TOPSIS) method to conduct a comprehensive evaluation of safety resilience, and the specific application process is demonstrated through a real-world construction case. The primary contribution of this study is to further refine existing construction safety resilience evaluation approaches by focusing on temporary works under typhoon conditions and formulating an evaluation framework that jointly accounts for engineering technologies and site management practices. Through whole-process evaluation, the proposed framework can identify key indicators and vulnerable aspects affecting the safety resilience of temporary works, thereby providing references for typhoon risk prevention and safety management improvement at construction sites.
2. Development of the Indicator System
The safety resilience of temporary works on construction sites under typhoon conditions exhibits distinct dynamic and process-oriented characteristics. Focusing solely on risk sources, accident probabilities, and the state of safety management at a particular point in time cannot adequately capture the capacity of temporary works to cope with typhoon disasters. Therefore, this study adopts a whole-process disaster management perspective and integrates pre-disaster prevention, disturbance resistance, emergency response, post-disaster recovery, and learning and adaptive capacity into a unified evaluation framework, thereby extending the range of resilience capacities considered in a static comprehensive evaluation. It should be noted that the whole-process perspective adopted in this research is chiefly embodied in the design of the evaluation indicators and does not involve dynamic simulations of functional loss or recovery processes.
The 4R resilience framework proposed by Bruneau et al. characterizes system resilience in terms of robustness, redundancy, resourcefulness, and rapidity. It emphasizes the ability of a system to maintain its functions, mobilize alternative resources, and recover rapidly under external disturbances [12]. This framework provides an important theoretical foundation for evaluating engineering system resilience. However, directly adopting the 4R framework as the criterion level in the present study would make it difficult to adequately represent processes such as risk anticipation and hazard inspection before a typhoon and experience-based learning after a disaster. Resilience engineering theory proposed by Hollnagel et al. emphasizes that a system should possess four fundamental capacities: responding, monitoring, learning, and anticipating [13]. This perspective further demonstrates the transition of system resilience from passive resistance toward proactive prevention and continuous learning.
More recently, resilience theory has gradually been incorporated into studies on safety in the construction industry. From the standpoint of resilience governance, Liu et al. investigated construction safety in large-scale engineering projects and indicated that improvements in construction safety resilience are primarily reflected in the processes of accident and disturbance prevention, response, and adaptation [7]. Kou et al. developed an emergency resilience indicator system for infrastructure construction projects under extreme disaster conditions based on the pressure, state, response, and adaptation model. Their study emphasized the need to evaluate the prevention, response, and adaptation capacities of construction projects exposed to extreme disasters from a whole-process perspective [8]. In their investigation of construction sites under typhoon conditions, Tang et al. found that timely identification of safety hazards and verification of protective measures during typhoon warning periods can effectively improve the disaster resistance and overall resilience of construction sites [9].
In engineering practice, construction safety management under extreme weather conditions also exhibits clear whole-process characteristics. Before the occurrence of extreme weather events such as strong winds and heavy rainfall, risk identification and early warning response should be conducted [14]. Critical facilities, including scaffolds, hoardings, lifting machinery, and temporary buildings, should be inspected, reinforced, and protected [15], while adequate flood control supplies and emergency personnel should also be prepared. During a disaster, appropriate measures such as work suspension, personnel evacuation, and emergency response should be implemented according to the corresponding warning level. Therefore, the safety capacity of temporary works under typhoon conditions includes not only the technical attributes of engineering facilities that enable them to withstand disaster impacts, but also management attributes related to organizational coordination, emergency resource allocation, post-disaster recovery, and continuous improvement.
Sun et al. demonstrated that strong wind loads can significantly affect the stress, displacement, and connection safety performance of temporary scaffolding. Therefore, the capacity to resist external wind loads is an important factor affecting the safety of temporary works [16]. Compared with permanent works, temporary works on construction sites are characterized by diverse structural forms, short service periods, dynamically changing site layouts, and high sensitivity to extreme weather conditions [17]. Based on resilience theory, the entire evolution process of typhoon disasters, and the specific vulnerability characteristics of temporary works, this study divides the safety resilience of temporary works on construction sites under typhoon conditions into five primary dimensions: pre-disaster prevention capacity, disturbance resistance capacity, emergency response capacity, post-disaster recovery capacity, and learning and adaptive capacity. Secondary evaluation indicators are further selected under these five dimensions.
Pre-disaster prevention capacity primarily reflects the ability of a temporary works system to identify typhoon-related risks in advance and proactively control them. Hallowell and Gambatese indicated in their research on construction safety practices that monitoring and anticipation capacities constitute key foundations for improving the resilience of construction systems [18]. Xu et al. reported that construction safety management has gradually shifted from accident response toward proactive risk control. Safety leading indicators are considered effective for reflecting the management status of construction projects before accidents occur and generally include safety inspections, risk identification, safety training, and management systems [19]. Accordingly, four secondary indicators are selected for pre-disaster prevention capacity: risk early warning capacity, risk identification and hazard inspection capacity, adequacy of emergency plan management, and emergency resource preparedness.
Disturbance resistance capacity reflects the ability of temporary works on construction sites to withstand external disturbances such as strong winds and heavy rainfall caused by typhoons while maintaining their basic functions. As typical vulnerable facilities on construction sites, the stability of temporary works directly affects safety performance under extreme weather conditions. Sun et al. showed that the safety of temporary works is affected not only by their structural performance but also by the reliability of protective facilities, environmental adaptability, and system redundancy [16]. In their study of infrastructure resilience evaluation, Yang et al. indicated that the absorptive capacity, technical reliability, and resource support capacity of engineering systems are important components of their ability to resist disaster disturbances [20]. Accordingly, five secondary indicators are selected for disturbance resistance capacity: wind resistance capacity of temporary structures, facility stability, drainage and flood control capacity, integrity of protective facilities, and support redundancy capacity.
Emergency response capacity primarily reflects the ability of a construction site to rapidly address risks and control losses during a typhoon. She et al. demonstrated in their study of emergency management for construction safety accidents that risk identification, information transmission, organizational coordination, and decision-making efficiency during emergencies are important factors affecting accident consequences [21]. Guo et al. further indicated that cross-organizational coordination, information sharing, and response speed are key factors in improving construction emergency resilience [22]. Therefore, four secondary indicators are selected for emergency response capacity: response timeliness, personnel evacuation capacity, organizational coordination capacity, and information coordination efficiency.
Post-disaster recovery capacity reflects the ability of a construction site to restore normal functions after the effects of a typhoon have subsided. Ouyang et al. indicated that the recovery capacity of engineering systems depends not only on the assessment of damage conditions but also on resource mobilization, alternative solutions, and organizational adjustment capacities [23]. Śladowski et al., in their research on risk resilience in complex construction systems, demonstrated that resource redundancy, process adjustment, and organizational coordination can effectively shorten system recovery time and improve the continuity of project operations [24]. Accordingly, four secondary indicators are selected for post-disaster recovery capacity: damage assessment capacity, facility repair capacity, resource mobilization capacity, and functional recovery speed.
Learning and adaptive capacity reflects the ability of a construction system to continuously optimize management and technical measures based on experience gained from previous disaster events. Research on safety resilience by Hallowell and Gambatese suggests that organizational learning, experience feedback, and continuous improvement are important mechanisms for preventing recurring risks [18]. Fourar et al. showed in their evaluation of the resilience of construction safety management systems that insufficient learning capacity can constrain the ability of construction organizations to adapt to complex risk environments [25]. Therefore, four secondary indicators are selected for learning and adaptive capacity: experience feedback capacity, knowledge transfer capacity, institutional optimization capacity, and technical improvement capacity.
In summary, building on previous research on construction safety resilience and emergency management under extreme disaster conditions, this study develops a safety resilience evaluation indicator system comprising five primary indicators and 21 secondary indicators, considering the disaster susceptibility and safety management characteristics of temporary works on construction sites under typhoon conditions (As shown in Table 1). The proposed system integrates engineering factors, including the wind resistance capacity of temporary structures, facility stability, and drainage and flood control capacity, with management factors, such as risk early warning, emergency response, post-disaster recovery, and learning and adaptive capacity. By incorporating these factors into a unified evaluation framework, the system provides a more targeted assessment of the relevant capacities of temporary works throughout the disaster management process and establishes a basis for subsequent indicator weighting and comprehensive evaluation.
Table 1.
Safety resilience evaluation indicator system for temporary works on construction sites under typhoon conditions.
3. Methodology
3.1. Subjective Weighting Using the G1 Method
The evaluation of the safety resilience of temporary works on construction sites under typhoon conditions involves multiple dimensions, including prevention, resistance, response, recovery, and adaptation. The relative importance of these indicators varies, and objective data alone may not adequately reflect practical engineering experience. Therefore, the G1 method is adopted in this study to assign subjective weighting coefficients to the indicators. The G1 method determines indicator weights by asking experts to rank indicators at the same hierarchical level according to their relative importance and to establish numerical ratios reflecting the relative importance of consecutive indicators. Compared with the conventional analytic hierarchy process, the G1 method does not require the construction of a complex judgment matrix and can therefore reduce the need for consistency adjustments in expert judgments [39]. This method is particularly suitable for safety resilience evaluation problems involving a relatively large number of indicators and substantial dependence on engineering experience.
Given that the safety resilience of temporary works on construction sites encompasses multiple professional domains, including structural safety, construction safety management, disaster risk prevention and control, emergency response, and post-disaster recovery, experts were selected through purposive sampling to ensure that the subjective weighting results were supported by relevant professional expertise. The selection process primarily considered the experts’ professional backgrounds, relevant practical or research experience, and familiarity with construction safety and typhoon-related disaster risks.
Expert selection was guided by the following criteria: (1) an academic or professional background in civil engineering, building construction, safety engineering, engineering management, disaster prevention and mitigation, or a related discipline; (2) relevant engineering practice or research experience; (3) familiarity with construction site safety management, temporary works management, or risk prevention and control under extreme weather conditions; and (4) the ability to accurately interpret the proposed safety resilience evaluation indicator system and its constituent indicators and to assess indicator importance based on professional knowledge and engineering experience. A total of eight experts, designated E1–E8, were recruited to take part in the indicator importance assessment. The expert panel comprised two project managers, three project safety management professionals, one structural engineer, and two university researchers. Their relevant professional or research experience ranged from 9 to 15 years, with an average of approximately 11.5 years. Complementarity among professional backgrounds was explicitly considered during expert selection to balance practical construction experience with academic perspectives. The experts’ professional backgrounds covered civil engineering, construction safety management, engineering project management, and structural engineering. Specifically, the project managers had experience in construction organization, project coordination, resource allocation, and emergency management. The project safety management professionals had expertise in construction site safety management, risk identification, hazard inspection, and safety protection. The structural engineer possessed specialized knowledge of temporary structural stability, structural safety, and wind resistance performance. The university researchers had conducted research on resilience-related safety issues in construction, construction safety risk evaluation, and engineering management. This multidisciplinary composition enabled the expert panel to assess the importance of safety resilience indicators for temporary works on construction sites from complementary perspectives, including engineering technology, safety management, disaster risk, and project practice. The characteristics of the participating experts are outlined in Table 2.
Table 2.
Basic information of the participating experts.
During the expert assessment process, each expert was first provided with the safety resilience evaluation indicator system, indicator definitions, and assessment guidelines to promote a consistent understanding of the indicators. Based on this information, the experts independently assessed the relative importance of indicators at the same hierarchical level using their professional knowledge and engineering experience. Following the requirements of the G1 method, each expert determined the ranking of indicator importance and the relative importance ratios between adjacent indicators. All eight participating experts were selected according to predefined criteria and possessed professional backgrounds and practical experience relevant to construction safety, engineering management, temporary works, or related risk management fields. The assessment results indicated that the experts’ judgments regarding the relative importance of the indicators were generally consistent, with no substantial discrepancies affecting the indicator rankings. To incorporate the collective judgments of the expert panel, the arithmetic mean method was used to aggregate the individual assessments. The resulting mean values were then used to determine the ratios reflecting the relative importance of consecutive indicators, which served as the basis for calculating the subjective weighting coefficients of individual indicators. The importance rankings of the primary indicators and the corresponding judgments of relative importance between adjacent indicators are presented in Table 3. The experts applied the same assessment procedure to the secondary indicators within each primary indicator category. The complete importance rankings of the secondary indicators, together with the relative importance ratios provided by individual experts, together with corresponding mean values, are reported in Supplementary Table S1.
Table 3.
Ranking of primary indicators and relative importance ratios of adjacent indicators.
Assume that indicators at the same hierarchical level are arranged from the most important to the least important, as shown below:
The weight ratio between two adjacent indicators is defined as:
The relative importance ratios among the indicators are determined according to the expert assessments. Once the weight of the least important indicator is determined, the corresponding weighting coefficients for the other indicators can be calculated recursively using the adjacent importance ratios. For n indicators, the weight of the least important indicator is calculated as:
The weights of the remaining indicators are calculated as:
Finally, the weights are normalized to satisfy:
Accordingly, the G1 method is employed to determine the local weights of the primary and secondary indicators within their respective hierarchical levels. Because the final evaluation requires assessing each secondary indicator’s importance with respect to the overall evaluation objective, the weights must be aggregated across hierarchical levels. Let denote the weight assigned to the i-th primary indicator and denote the local weight assigned to the j-th secondary indicator within the i-th primary indicator. The overall weight of the secondary indicator is calculated as:
Drawing on the experts’ judgments, the subjective weighting coefficients of the indicators for assessing the safety resilience of temporary works on construction sites under typhoon conditions are calculated, as presented in Table 4.
Table 4.
Calculation results of subjective indicator weights.
3.2. Objective Weighting Using the EWM
The G1 method can effectively incorporate the experience and professional judgment of engineering experts regarding the importance of safety resilience indicators for temporary works under typhoon conditions. However, the resulting weights are inevitably influenced by differences in the experts’ knowledge structures and subjective perceptions. Therefore, to further minimize the impact of expert subjectivity on the assignment of indicator weights, the EWM was employed to assign objective weighting coefficients to the evaluation indicators. The EWM determines indicator weights according to the variability of the evaluation data. Its underlying principle is that an indicator exhibiting greater variation among evaluation objects contains more information and contributes more substantially to the evaluation results, and should therefore receive a higher weight. In contrast, an indicator with lower variability provides less discriminative information and is assigned a lower weight [40]. The indicator scores used in this study were derived from both supporting evidence and professional judgments made by evaluators according to standardized scoring criteria. In this context, objective weighting refers to the calculation of indicator weights using a standardized mathematical procedure based on the dispersion of indicator values within a given evaluation matrix, rather than the direct assignment of indicator importance by experts.
Considering the characteristics of typhoon disasters in Hainan Province, China, ten construction projects exposed to typhoon-related risks were selected as samples for entropy weight calculation. Sample selection primarily considered the relevance of each project to typhoon disaster risks, the types of temporary works involved, and the availability of on-site safety management records to meet the data requirements of the proposed safety resilience evaluation of temporary works. The projects were anonymized as P1–P10, and their main characteristics and evaluation dates are presented in Supplementary Table S2. Given that the safety resilience of temporary works on construction sites encompasses engineering conditions, on-site safety management, emergency response, and post-disaster recovery, five project management personnel familiar with the temporary works and typhoon-related safety management practices of each project were selected to independently assess the 21 secondary indicators. The evaluators were drawn primarily from project management, safety management, technical management, construction operations, and equipment and materials management positions to capture project conditions from different functional perspectives.
To minimize differences in indicator interpretation and scoring scales across projects and evaluators, standardized indicator definitions and a uniform scoring scale of 0–100 were adopted for all projects. The safety resilience indicators included both engineering-related factors, such as temporary structural conditions, facility stability, and drainage and flood prevention, and management-related factors, including organizational coordination, information sharing and coordination, experience feedback, and institutional improvement. During the assessment process, evaluators were instructed to prioritize verifiable project records and on-site management documentation when assigning scores. These materials included typhoon early-warning and notification records, risk and hazard inspection and rectification records, emergency response plans, temporary facility inspection and acceptance documents, emergency supplies and equipment records, personnel evacuation records, post-disaster inspection and repair records, and relevant post-event review and procedural revision documents. Where direct scoring based on documentary evidence was difficult, or project records were incomplete, evaluators were permitted to make comprehensive judgments according to the standardized scoring criteria, drawing on site interviews, photographic verification, supervision logs, or alternative supporting evidence, together with their knowledge of actual implementation practices.
The standardized scoring criteria were defined as follows: scores of 90–100 indicated that the relevant measures had been fully implemented, were functioning effectively, and were supported by relatively complete evidence; scores of 80–89 indicated that the principal measures had been established and effectively implemented; scores of 70–79 indicated that basic measures had been established but substantial deficiencies remained in implementation, coverage, or documentation completeness; scores of 60–69 indicated that the relevant measures had been only partially established or implemented, with limited effectiveness; and scores below 60 indicated that key measures were clearly absent or had not been effectively implemented. The specific assessment content and principal scoring evidence for the 21 secondary indicators are provided in Supplementary Table S3. These standardized scoring intervals also provide a common evaluation scale for establishing the reference states used in the subsequent safety resilience level classification, thereby maintaining consistency between individual indicator scores and the comprehensive level determination using the TOPSIS method.
The five evaluators assigned to each project independently completed their assessments using the standardized scoring guidelines. Where substantial discrepancies arose among evaluators for the same indicator, the corresponding project records and assessment evidence were re-examined before the scores were confirmed. The arithmetic mean of the five evaluators’ scores was then adopted as the final indicator score for each project, yielding an original evaluation matrix comprising ten construction projects and 21 secondary indicators. To ensure computational reproducibility, the complete 10 × 21 evaluation matrix is provided in Supplementary Table S4. Each value in the matrix represents the arithmetic average of the scores independently provided by five evaluators for the corresponding project and indicator. During data collection, indicator definitions and scoring criteria were standardized before assessment, and follow-up verification was conducted throughout the evaluation process. Consequently, valid scores were obtained for all 21 indicators across the ten projects, with no missing values. Therefore, no missing-value imputation was required in the entropy weight calculation. This matrix served as the input dataset for calculating the information entropy, divergence coefficients, and objective weights of the indicators using the EWM.
Assume that m and n denote the total numbers of evaluation objects and indicators, respectively, with indicating the score of the i-th object under the j-th indicator. The original evaluation matrix can be expressed in the following form:
To account for differences in measurement units and numerical ranges across indicators, the raw data are normalized before further analysis. All indicators used in this study are benefit-type indicators, meaning that a higher indicator value represents a higher level of safety resilience of temporary works. Therefore, min-max normalization is adopted. Before applying min-max normalization, the range of values for each indicator in the original evaluation matrix was examined. The results confirmed that all 21 indicators exhibited some variation across the ten construction projects, with no zero-range indicators for which the maximum and minimum values were identical. Accordingly, all indicators could be normalized directly using Equation (8). In other applications where zero-range indicators may occur, their objective divergence coefficients can be set to zero. For zero values arising after normalization, the corresponding zero-proportion terms were treated as contributing zero to the information entropy calculation.
The normalized matrix is then obtained as:
The relative proportion of evaluation object i with respect to indicator j is expressed as follows:
The information entropy associated with each indicator is subsequently determined using the following equation:
The corresponding divergence coefficient is then determined as:
The objective weight assigned to indicator j is obtained as follows:
Following the calculation procedure described above, the information entropy, divergence coefficient, and objective weight of each of the 21 indicators were obtained, as detailed in Table 5.
Table 5.
Calculation results of objective indicator weights.
Because the objective weights in this study were calculated using a relatively small sample of ten construction projects, the assessment characteristics of individual projects could influence the calculated information entropy and indicator weights. Therefore, a leave-one-project-out analysis was conducted to examine the sensitivity of the objective weights derived from the EWM to changes in the sample composition. Specifically, each of the ten construction projects was excluded in turn, and the objective weighting coefficients of the 21 indicators were recalculated according to the remaining nine projects following the entropy weight calculation procedure described above. The resulting weight sets were then compared with those obtained from the complete ten-project sample. Two measures were employed to assess weight stability: Spearman’s rank correlation coefficient and the sum of absolute weight differences. Spearman’s coefficient was employed to quantify the consistency of indicator importance rankings:
The sum of absolute weight differences was used to quantify changes in the numerical values of indicator weights across different sample compositions:
where denotes the rank correlation coefficient after excluding project ; represents the difference in the ranking of indicator between the complete sample and the sample excluding project ; denotes the corresponding magnitude of weight variation; and denote the indicator weights derived from the full dataset and the dataset with project i removed, respectively. The total number of indicators is denoted by n.
The leave-one-project-out results are presented in Supplementary Table S5. The results show that Spearman’s rank correlation coefficients remained above 0.75 after excluding P1, P2, P3, P4, P6, P7, P8, P9, or P10. Moreover, the coefficients exceeded 0.92 in all these cases except for the exclusion of P3 and P9, indicating that most changes in sample composition did not substantially alter the indicator importance rankings. Similarly, the sum of absolute weight differences remained below 0.06 in all scenarios except for the exclusion of P5, suggesting that the numerical values of the objective weights generally exhibited limited variation. Notably, excluding P5 reduced Spearman’s coefficient to −0.247 and increased the sum of absolute weight differences to 0.1246, indicating that this project had a relatively pronounced influence on the estimated weights of certain indicators. Further examination revealed that P5 received relatively low scores for most indicators and represented a comparatively low-performing project within the ten-project sample. Because the EWM determines indicator weights based on the dispersion of indicator values across projects, substantial differences in the scores of a particular project can influence the information entropy and divergence coefficients of multiple indicators, thereby altering the resulting weight distribution. The relatively large changes observed after excluding P5 therefore reflect the sensitivity of the EWM to the information contributed by an atypical sample under small-sample conditions, rather than an anomaly in the computational procedure. Overall, within the current sample of ten construction projects, both the indicator importance rankings and numerical weight values exhibited relatively good stability, except when individual projects with markedly different assessment characteristics were excluded. These findings also indicate that the objective weights obtained in this study are applicable to the safety resilience evaluation of temporary works under the present sample conditions. Nevertheless, further validation using a larger and more diverse set of construction projects is required to assess their broader applicability.
3.3. Combined Weighting Based on Quadratic Optimization
The G1 method and EWM described above are employed to calculate the subjective and objective weighting coefficients of the evaluation indicators, respectively. The G1 method effectively reflects engineering experts’ understanding of the key factors affecting the safety resilience of temporary works on construction sites under typhoon conditions, but its results are influenced by expert experience and knowledge structures. In contrast, the EWM assigns weights to indicators based on variations in the evaluation sample data and can therefore reflect the actual information contribution of individual indicators. However, a purely data-driven weighting approach may underestimate the importance of certain critical factors that are recognized as important in engineering practice. To incorporate expert knowledge and the objective characteristics of the evaluation data, a combined weighting method based on quadratic optimization was employed to calculate the combined weighting coefficients of the indicators.
Drawing on the concept of reconciling different weighting results in game theory [41,42], the proposed method determines the combination coefficients of subjective and objective weights through quadratic optimization, accounting for differences in the concentration of their weight distributions. For a normalized, non-negative weight vector, the squared Euclidean norm reflects the degree of concentration of its weight distribution. A larger norm indicates that the weights are more concentrated among a smaller number of indicators, whereas a smaller norm indicates a more balanced distribution. In this study, the squared Euclidean norm was incorporated into the optimization objective as a quadratic penalty factor, such that a weighting scheme with a more concentrated distribution receives a smaller combination coefficient, whereas a scheme with a more uniform distribution receives a larger coefficient. Accordingly, a quadratic optimization model was formulated to determine the combination coefficients. This approach accounts for the distributional characteristics of subjective and objective weights during their integration, rather than simply assigning equal coefficients to the two original weight vectors.
The weight vectors derived from the G1 method and EWM can be expressed as:
where and denote the subjective and objective weight vectors, respectively. is the number of indicators.
The combined weight vector is obtained by linearly combining the two weight vectors, where and are the combination coefficients of the subjective and objective weights, respectively, subject to and .
To determine the optimal combination coefficients, a quadratic optimization model was formulated by minimizing the sum of the products of the squared combination coefficients and the corresponding squared Euclidean norms of the weight vectors:
where denotes the Euclidean norm. The model uses the squared norms of the original weight vectors to penalize and adjust their corresponding combination coefficients.
Substituting into Equation (19) yields:
Taking the derivative with respect to and equating it to zero yields:
Solving the optimization model yields the combination coefficients:
Because the objective function has the following second derivative: , the objective function is strictly convex, and the resulting combination coefficients constitute the unique global optimum of the quadratic optimization model.
Based on the subjective and objective weighting coefficients of the 21 secondary indicators calculated in the preceding sections, the squared Euclidean norms of the subjective and objective weight vectors were approximately 0.05226 and 0.04800, respectively. Substituting these values into Equations (22) and (23) yielded combination coefficients of approximately 0.4788 and 0.5212 for the subjective and objective weights, respectively. The relatively similar squared norms indicate only minor differences in the concentration of the two weight distributions, resulting in combination coefficients close to equal weighting.
Accordingly, the combined weight vector is calculated as:
where and denote the subjective and objective weights of the j-th indicator, respectively. The final combined weights of all indicators are presented in Table 6. By integrating subjective and objective weighting results while accounting for their distributional characteristics in the determination of combination coefficients, the proposed method provides a quantitative weighting basis for the subsequent comprehensive safety resilience evaluation of temporary works on construction sites.
Table 6.
Combined weights of evaluation indicators obtained using quadratic optimization.
3.4. Safety Resilience Evaluation Framework Based on TOPSIS
To comprehensively assess the safety resilience of temporary works on construction sites, TOPSIS is introduced after the final combined weighting coefficients of the indicators have been determined [43]. TOPSIS evaluates an object by calculating its relative closeness to the positive and negative ideal solutions, thereby accounting for both the relative importance of the indicators and the information differences among them [44]. This research aims to identify the safety resilience level of temporary works for an individual construction project rather than to rank multiple projects according to their relative performance. Therefore, five standard reference states corresponding to safety resilience Levels I to V are established. An actual construction project is treated as the evaluation object, and its resilience level is determined by comparing its proximity to the reference states associated with the five predefined resilience levels.
First, data are collected for the 21 safety resilience indicators established in the preceding sections, and the measurements for each indicator are transformed into a 0–100 scoring scale, where a greater score reflects stronger safety resilience in the aspect being assessed. Standard values are then specified for each of the five resilience levels to construct the Level I to Level V reference matrix, into which the indicator data of the actual project are incorporated. After normalization, the final combined weights obtained above are applied to the indicators to construct the weighted evaluation matrix. The distances between the actual project and the positive and negative ideal solutions are subsequently calculated, from which the relative closeness coefficient is obtained. Finally, the safety resilience level of the temporary works is determined according to the interval within which falls. Let the evaluation matrix be expressed as , where m and n denote the total numbers of evaluation states and indicators, respectively. The vector normalization is applied as follows:
The normalized indicator values are multiplied by the corresponding final combined weights to obtain the weighted evaluation matrix:
Subsequently, the positive and negative ideal solutions are identified, and the distances from each evaluation state to these two ideal solutions are computed as follows:
The relative closeness coefficient is calculated as:
closer to 1 indicates that the evaluation object is closer to a high resilience state, whereas a value closer to 0 indicates that it is closer to a low resilience state.
To determine the safety resilience levels corresponding to different relative closeness coefficients, five standard reference states, designated Levels I–V, were established. The reference values were defined in accordance with the unified 0–100 scoring system introduced earlier. Using the assessment rules established in Section 3.2 as a reference, scores of 90–100, 80–89, 70–79, 60–69, and below 60 represent progressively deteriorating conditions, ranging from satisfactory implementation to substantial deficiencies in critical safety measures. Based on this scoring scale, five ordered reference values of 100, 90, 80, 70, and 60 were selected at equal intervals of 10 points to represent safety resilience Levels I–V. These equally spaced values were adopted to establish a consistent basis for level comparison while maintaining alignment with the preceding indicator scoring system. These reference values represent predefined classification states within the proposed evaluation framework rather than safety-critical thresholds derived from empirical data on typhoon-induced losses, damage to temporary facilities, or post-disaster recovery times. Consequently, the resulting safety resilience levels are intended primarily to compare the relative overall performance of the evaluated objects within the proposed indicator system and should not be regarded as direct proof that the engineering safety requirements for typhoon resistance have been satisfied. During the scoring process, 60 serves only as the lowest of the five standard reference values and does not constitute the lower bound of the original scoring scale. Indicators receiving scores below 60 are first identified and reported individually, together with their corresponding scores, to highlight substantial deficiencies in specific safety resilience capabilities. These indicators are then temporarily excluded from the subsequent TOPSIS calculation, and the weights of the remaining indicators are renormalized to ensure that their sum equals unity. The adjusted weights are subsequently used in the TOPSIS analysis. This procedure prevents indicators scoring below the lowest reference value from being directly classified within the predefined 60–100 reference range while retaining information on the weaknesses revealed by their low scores. Accordingly, the final evaluation results should be interpreted by considering both the separately reported indicators scoring below 60 and the TOPSIS results obtained using the remaining indicators with renormalized weights.
The relative closeness coefficients corresponding to the five standard reference states can be further derived using the TOPSIS method. Let denote the indicator score associated with the -th standard reference state. Because all 21 indicators are assigned the same reference value within each standard state, the distances between each reference state and the positive and negative ideal solutions remain proportional to the differences in their original scores after normalization, weighting, and distance calculation. Taking the reference states with scores of 100 and 60 as the positive and negative ideal reference states, respectively, the theoretical relative closeness coefficient of the -th standard reference state can be expressed as:
Accordingly, the theoretical relative closeness coefficients for Levels I–V are 1.000, 0.750, 0.500, 0.250, and 0, respectively. To avoid overlapping Level assignments for evaluated objects located between adjacent reference states, the midpoints of their theoretical relative closeness coefficients were adopted as Level boundaries, yielding four thresholds of 0.875, 0.625, 0.375, and 0.125. The safety resilience Levels were therefore defined as Level I (0.875–1.000), Level II (0.625–0.875), Level III (0.375–0.625), Level IV (0.125–0.375), and Level V (0–0.125), with boundary values assigned to the higher level. These classification intervals are not independently prescribed empirical thresholds; rather, they are derived from the theoretical relative positions of the five equally spaced standard reference states within the TOPSIS evaluation space. The criteria used to classify the safety resilience levels are presented in Table 7.
Table 7.
Safety resilience classification for temporary works on construction sites.
For an actual engineering project, the collected data for the 21 indicators are substituted into the above calculation procedure to obtain the corresponding value. The safety resilience level of the temporary works can then be determined according to the predefined classification criteria.
4. Results and Discussion
4.1. Analysis of the Final Combined Indicator Weights
In Table 6, the final combined weights of the 21 indicators vary to some extent. Risk early warning capacity, risk identification and hazard inspection capacity, and emergency resource preparedness have the three highest weights, with values of 0.0667, 0.0609, and 0.0565, respectively. Personnel evacuation capacity, response timeliness, and the wind resistance capacity of temporary structures also have relatively high weights, with values of 0.0556, 0.0537, and 0.0528, respectively (Figure 1). Overall, the indicators with relatively high weights are mainly concentrated in the pre-disaster prevention and emergency response stages.
Figure 1.
Ranking of final combined indicator weights.
The relatively high combined weights assigned to risk early warning capacity, risk identification and hazard inspection capacity, emergency resource preparedness, personnel evacuation capacity, and response timeliness are closely related to the inherent characteristics of temporary works on construction sites. Compared with permanent works, temporary works generally have shorter service periods, while their structural configurations and site layouts change continuously with the progression of construction. Facilities such as scaffolds, hoardings, temporary buildings, and temporary support systems are also directly exposed to strong winds and heavy rainfall [45,46]. Consequently, their safety conditions can change rapidly, and reliance solely on the structural capacity to withstand typhoon effects cannot adequately control the associated risks. Because typhoons generally provide a certain period of advance warning, construction sites can implement preventive measures before the arrival of a typhoon, including risk identification, facility inspection and reinforcement, removal of vulnerable temporary facilities, work suspension, and personnel evacuation. During the typhoon, rapid responses can also be implemented according to changing site conditions. These characteristics indicate that the safety of temporary works depends strongly on proactive intervention before a disaster and rapid emergency actions during the disaster. This dependence explains why indicators related to pre-disaster prevention and emergency response receive relatively high weights. In comparison, the wind resistance capacity of temporary structures remains an important component of safety resilience, but its effectiveness must be supported by early warning, personnel evacuation, and emergency response measures.
Differences are also observed among the weighting results obtained using different methods. The G1 method assigns greater importance to indicators such as risk early warning and personnel evacuation, which experts generally consider critical, whereas the EWM assigns relatively high weights to indicators such as experience feedback and institutional optimization when substantial differences exist among projects. For example, the G1 weight of risk early warning capacity is 0.0837, whereas its entropy weight is 0.051064. In contrast, the G1 weight of support redundancy capacity is 0.0292, whereas its entropy weight is 0.051254. These differences indicate that expert judgments and the importance reflected by actual project data are not completely consistent. The combined weighting method based on quadratic optimization incorporates both subjective and objective weights into the determination of the final combined weights. By accounting for the distributional characteristics of the two weight vectors, the method adjusts their combination coefficients accordingly. As a result, the combined weight of each indicator generally lies between its corresponding subjective and objective weights. The combined weights obtained in this study reflect the relative allocation of indicator importance arising from the joint consideration of expert judgments and variations in the sample data. However, they do not directly quantify the actual reduction in disaster losses that could be achieved by improving the corresponding indicators.
4.2. Safety Resilience Evaluation of Temporary Works in the Case Project
To further illustrate the applicability of the proposed safety resilience assessment framework, an additional construction project in Hainan Province, China, was selected for a case study. This project was not included among the ten construction projects used for entropy weight calculation in Section 3.2. The case study adopted a post-disaster retrospective assessment approach, with indicator scores derived from project records and on-site documentation concerning typhoon preparedness, emergency response, and post-disaster recovery. In particular, the assessment of post-disaster recovery capacity and learning and adaptive capacity incorporated information from post-disaster inspections, repair activities, and retrospective reviews. The ten previously introduced projects were mainly employed to determine the objective weighting coefficients of the evaluation indicators, whereas the independently selected case project was used to apply the established combined weights and the TOPSIS method to assess its safety resilience level and identify its principal weaknesses. Following the standardized indicator definitions and assessment procedures described in Section 3.2, project management personnel familiar with the temporary works and typhoon-related safety management practices of the case project evaluated the 21 indicators. The arithmetic mean of the scores independently assigned by multiple evaluators was adopted as the final score for each indicator. The evaluation results are presented in Table 8.
Table 8.
Safety resilience indicator scores for temporary works in a construction project in Hainan.
The indicator data in Table 8 were combined with the standard reference states corresponding to Levels I to V to construct the evaluation matrix. TOPSIS analysis was then performed using the final combined weights determined above. The distance between the case project and the positive ideal solution was 0.0144, while the distance from the negative ideal solution was 0.0304. The resulting relative closeness coefficient was 0.678. The safety resilience of the temporary works in the case project was classified as Level II, indicating a relatively high level of comprehensive safety resilience under the proposed 21-indicator evaluation system and predefined standard reference states. To further examine resilience performance across different stages of the disaster process, the five primary dimensions were evaluated separately. The results show clear differences among the five dimensions (Figure 2). Pre-disaster prevention capacity had the highest relative closeness coefficient, with a value of 0.772, followed by emergency response capacity at 0.730. Both dimensions were classified as Level II. These results indicate that the project performed well in risk early warning, hazard inspection, and emergency preparedness before the arrival of the typhoon, as well as in personnel evacuation and rapid response during the typhoon. The relative closeness coefficient for disturbance resistance capacity was 0.672, which was also classified as Level II. The results also indicate relatively favorable performance in indicators related to the wind resistance of temporary structures, facility stability, and protective measures. In contrast, post-disaster recovery capacity and learning and adaptive capacity had relative closeness coefficients of 0.596 and 0.570, respectively, both corresponding to Level III. These two dimensions therefore represent the relatively weak aspects of the project. The results suggest that further improvements are required in facility repair, functional recovery, experience feedback, and management optimization after typhoon events. Overall, although the project was capable of implementing relatively effective prevention and response measures before and during the typhoon, its capacities for post-disaster recovery and continuous improvement require further strengthening. Nevertheless, this result represents a provisional classification within the current evaluation framework. Targeted improvement measures should still be implemented for the identified weak indicators, taking into account actual site conditions and relevant management requirements. In the comprehensive evaluation using the TOPSIS method, differences in indicator scores may produce a certain degree of compensatory effect, whereby higher scores for management-related indicators may partially offset deficiencies in structural safety indicators. Consequently, the overall safety resilience level cannot replace independent inspections of critical structural safety indicators or serve as direct evidence that temporary facilities satisfy applicable safety requirements. Critical structural safety indicators, such as the wind resistance capacity of temporary structures and facility stability, must independently satisfy relevant engineering technical standards and safety requirements. A favorable comprehensive evaluation result should not be regarded as a substitute for necessary structural safety inspections.
Figure 2.
Safety resilience evaluation results for the five dimensions of the project.
On this basis, the indicators requiring priority improvement can be further identified by jointly considering their final combined weights and the actual project scores. The mean combined weight of the 21 indicators is 0.0476, while the mean project score is 86.62. Using these two mean values as dividing lines, the indicators can be classified into four groups: high weight and high score, high weight and low score, low weight and high score, and low weight and low score. As shown in Figure 3, the wind resistance capacity of temporary structures, functional recovery speed, and experience feedback capacity are characterized by relatively high weights but comparatively low project scores. These indicators should therefore receive particular attention in subsequent efforts to improve safety resilience. The wind resistance capacity of temporary structures directly affects the stability of temporary facilities under typhoon conditions. Structural inspections, connection inspections, and wind-resistant reinforcement should therefore be strengthened before the arrival of a typhoon. Functional recovery speed is primarily associated with the restoration of construction site operations after a typhoon. Procedures for facility repair, personnel organization, and resource allocation should be established in advance to shorten the recovery period. Experience feedback capacity determines whether lessons from typhoon preparedness and emergency response can be translated into subsequent management practices. A systematic post-event review and feedback mechanism should therefore be established so that problems identified during actual emergency operations can be incorporated into subsequent emergency plans and management systems. Risk early warning capacity, risk identification and hazard inspection capacity, response timeliness, and personnel evacuation capacity have relatively high weights and high project scores, representing the current strengths of the project. These capacities should be maintained in subsequent management and further consolidated through regular inspections and emergency drills. Overall, future improvements in project resilience should not focus solely on the structural performance of temporary works. Greater attention should also be given to post-disaster recovery and organizational learning so that safety resilience can extend beyond pre-disaster prevention and emergency response toward post-disaster recovery and continuous improvement. The indicators characterized by high weights and low scores in Figure 3 represent relative weaknesses identified from the combined weights and actual indicator scores of the case project. These indicators are primarily intended to inform targeted recommendations for improving safety resilience. Their distribution may change across projects as actual indicator scores, weights, or evaluation conditions vary. Therefore, the weaknesses identified in this study are specific to the conditions of the current case project and should not be generalized as common deficiencies across all temporary works on construction sites. Furthermore, the quadrant analysis does not account for the implementation costs of improvement measures, interdependencies among measures, or their actual disaster mitigation benefits. Accordingly, it is intended primarily to identify relative weaknesses rather than to determine an optimal resource allocation strategy.
Figure 3.
Relationship between combined indicator weights and project scores.
4.3. Sensitivity Analysis
To investigate the sensitivity of the comprehensive evaluation results for the case project to changes in input conditions, sensitivity analyses were conducted from four perspectives: weighting methods, indicator weights, indicator scores, and indicator structure. Section 3.2 previously examined the sensitivity of the entropy weight estimates to changes in sample composition through a leave-one-project-out analysis. In contrast, this section focuses on changes in the relative closeness coefficient and safety resilience level classification of the case project under variations in model inputs [47,48]. These analyses are intended primarily to evaluate the robustness of the assessment outcomes for the current case project under predefined perturbation scenarios and do not imply that the proposed evaluation framework exhibits the same robustness across different engineering conditions.
To investigate how different weighting approaches affect the assessment outcomes, the TOPSIS method was applied using the G1 subjective weights, entropy-based objective weights, and combined weights, respectively. The resulting relative closeness coefficients were 0.702, 0.655, and 0.678. Although the relative closeness coefficients varied across the three weighting schemes, the case project was consistently classified as Level II, indicating that changes in the weighting method did not alter its final safety resilience level classification. Furthermore, the result obtained using the combined weights lay between those obtained using the G1 subjective weights and entropy-based objective weights, suggesting that the combined weighting method integrates information from expert judgments and variations in the project sample data to some extent.
A sensitivity analysis of indicator weights was subsequently conducted using the combined weights as the baseline. In each scenario, the weight of one secondary indicator was increased or decreased by 10% or 20%, while the relative proportions of the remaining indicator weights were preserved. Following each adjustment, all indicator weights were renormalized to ensure that their sum equaled unity, and the relative closeness coefficient of the case project was recalculated using the same TOPSIS evaluation procedure. Adjustments to the 21 indicators in both positive and negative directions generated 42 perturbation scenarios at the ±10% level and 42 scenarios at the ±20% level. The results showed that the relative closeness coefficient ranged from 0.676 to 0.681 when individual indicator weights were varied by ±10%. When the perturbation magnitude increased to ±20%, the relative closeness coefficient ranged from 0.673 to 0.683. The case project remained classified as Level II under all weight perturbation scenarios, indicating that its Level classification was relatively insensitive to variations in individual indicator weights within the examined ranges.
Given that the 21 secondary indicators were evaluated using a 0–100 scoring scale, some indicator scores may be influenced by the completeness of supporting documentation, evaluator experience, and differences in on-site judgments. Therefore, a further sensitivity analysis was performed to investigate how changes in indicator scores affect the evaluation results. With the combined weights held constant, each of the 21 secondary indicators was independently subjected to perturbations of ±5 and ±10 points, with the adjusted scores constrained to the range of 0–100. After each adjustment, the evaluation matrix was reconstructed, normalized, and processed using the TOPSIS method. The findings revealed that the relative closeness coefficient ranged from 0.669 to 0.685 when individual indicator scores were varied by ±5 points. When the score perturbation increased to ±10 points, the relative closeness coefficient ranged from 0.658 to 0.690. The case project remained classified as Level II across all 84 score perturbation scenarios. Compared with weight perturbations, variations in indicator scores produced a relatively wider range of relative closeness coefficients, suggesting that the evaluation results were more sensitive to changes in the data representing actual project conditions. Nevertheless, changes in individual indicator scores within the examined ranges were insufficient to alter the final safety resilience level classification of the case project.
In addition, to determine whether the evaluation results were strongly dependent on any individual indicator, an indicator structure sensitivity analysis was conducted using a leave-one-indicator-out approach. Each of the 21 secondary indicators was removed in turn, the combined weights of the remaining 20 indicators were renormalized, and the TOPSIS evaluation was repeated. The results showed that the relative closeness coefficient ranged from 0.664 to 0.685 across the 21 indicator exclusion scenarios, with all evaluations retaining a Level II classification. Specifically, excluding risk early warning capacity produced the lowest relative closeness coefficient of 0.664389, whereas excluding technical improvement capacity yielded the highest coefficient of 0.685218. These findings indicate that although individual secondary indicators exerted different degrees of influence on the comprehensive evaluation results, the removal of any single indicator did not change the safety resilience level classification of the case project. Thus, the case evaluation results did not exhibit excessive dependence on any individual indicator under the examined conditions.
Overall, the relative closeness coefficient of the case project varied to some extent under the predefined scenarios involving different weighting methods, individual weight perturbations, individual score perturbations, and sequential indicator exclusion. However, all resulting values remained within the Level II interval, and no changes in Level classification were observed. Consistency in Level classification does not necessarily imply that the relative closeness coefficient is unaffected by changes in model inputs. The baseline relative closeness coefficient was approximately 0.678, which was about 0.053 above the lower boundary of Level II at 0.625. The lowest relative closeness coefficient observed across the examined perturbation scenarios was 0.655, which remained above this boundary. Therefore, the evidence derived from this analysis suggests that the Level classification of the current case project exhibited a certain degree of stability within the investigated perturbation ranges. They do not establish that projects with relative closeness coefficients near classification boundaries, or projects under different engineering conditions, would exhibit similar stability. In practical applications, the evaluation results should be interpreted by jointly considering changes in the relative closeness coefficient, the distance from the relevant Level boundaries, and the principal weak indicators, rather than relying solely on whether the final Level classification changes. Detailed results are presented in Table 9.
Table 9.
Sensitivity analysis results for the case project.
5. Conclusions
This research developed a safety resilience evaluation framework for temporary works on construction sites under typhoon conditions, addressing the changing safety conditions of temporary works across external environmental conditions and construction stages, as well as the insufficient consideration of resilience capacities throughout the disaster management process in existing safety evaluation approaches. Based on resilience theory, the evolution process of typhoon disasters, and the characteristics of temporary works, safety resilience was divided into five dimensions: pre-disaster prevention capacity, disturbance resistance capacity, emergency response capacity, post-disaster recovery capacity, and learning and adaptive capacity. An evaluation system consisting of 21 secondary indicators was subsequently established. The G1 method and EWM were employed to determine the subjective and objective weighting coefficients assigned to the evaluation indicators, respectively. The combination coefficients were subsequently determined through quadratic optimization to obtain the final combined weights. TOPSIS was further incorporated to classify the safety resilience level of a project, thereby forming an integrated framework for evaluating the safety resilience of temporary works on construction sites under typhoon conditions.
The combined weighting results show that risk early warning capacity, risk identification and hazard inspection capacity, emergency resource preparedness, personnel evacuation capacity, and response timeliness are among the most important indicators. This finding is closely related to the distinctive characteristics of temporary works. Compared with permanent works, temporary works have shorter service periods, rapidly changing site layouts, and greater sensitivity to changes in construction stages and external environmental conditions. Consequently, their safety under typhoon conditions depends strongly on risk control before the disaster and rapid response during the disaster. Compared with previous studies, this study extends existing construction safety resilience evaluation approaches by focusing specifically on temporary works under typhoon conditions. An evaluation indicator system and a comprehensive evaluation procedure integrating engineering technical factors and on-site management factors were developed, providing a reference for identifying weaknesses in typhoon risk prevention and control and safety management on construction sites.
Despite these contributions, several limitations remain.
- (1)
- Subjectivity in indicator scoring. The 21 indicators are currently evaluated primarily using a standardized 0–100 scoring scale, with some indicators relying on judgments made by experts and on-site management personnel. Future research could incorporate measured data, such as wind speed, structural monitoring measurements, personnel response times, and facility recovery times, to improve the objectivity of indicator scoring.
- (2)
- Validation of safety resilience level classification. The classification of safety resilience into Levels I–V was established based on the standardized scoring scale and predefined TOPSIS standard reference states. However, the classification criteria have not yet been calibrated against empirical data on typhoon-induced damage or engineering operational performance. Therefore, these Levels should be interpreted as provisional classifications within the proposed evaluation framework, and their applicability requires further validation using empirical engineering data. Future studies could incorporate damage and recovery data collected under different typhoon intensities, temporary works types, and construction stages to strengthen the correspondence between the assessment outcomes and the actual level of safety performance.
- (3)
- Generalizability of the sensitivity analysis. This study examined the sensitivity of the case evaluation results through comparisons of different weighting methods, weight perturbations, score perturbations, and sequential indicator exclusion. However, the analysis was using data from only one real-world construction project. Consequently, the findings only demonstrate the sensitivity of the case project to changes in model inputs and cannot substitute for external validation across different engineering conditions. Further studies should enlarge the independent sample by incorporating projects located in different geographical regions, construction stages, and temporary works types. Cross-case validation incorporating typhoon intensity and monitoring data is also required to provide further evidence of the stability and practical applicability of the proposed evaluation framework.
- (4)
- Limitations of static comprehensive evaluation. This study conducted a static comprehensive evaluation based on indicator scores obtained at a specific point in time. Continuous observational data were not used to characterize functional losses or post-disaster recovery trajectories, and dynamic updating rules for indicators and their weights were not established. Future research could integrate continuous monitoring data with repeated evaluations across different construction stages to further investigate temporal changes in safety resilience and develop mechanisms for dynamically updating the evaluation model.
Supplementary Materials
The following supporting information can be downloaded at: https://www.mdpi.com/article/10.3390/buildings16214246/s1. Table S1: Importance rankings of secondary indicators and judgments of relative importance between adjacent indicators; Table S2: Basic characteristics of the projects; Table S3: Indicator scoring criteria; Table S4: Original evaluation matrix of the 21 safety resilience indicators for the ten construction projects; Table S5: Stability analysis of objective weights.
Author Contributions
Conceptualization, D.L.; methodology, D.L.; software, J.W.; validation, X.C.; formal analysis, D.L.; resources, X.C.; data curation, D.L.; writing—original draft preparation, D.L. and J.W.; writing—review and editing, D.L. and J.W.; visualization, J.W.; supervision, X.C.; funding acquisition, X.C. All authors have read and agreed to the published version of the manuscript.
Funding
This research was funded by the Hainan Provincial Natural Science Foundation of China, grant number 525RC707.
Institutional Review Board Statement
Not applicable.
Informed Consent Statement
Not applicable.
Data Availability Statement
Data are contained within the article or Supplementary Materials.
Conflicts of Interest
The authors declare no conflicts of interest.
Abbreviations
The following abbreviations are used in this manuscript:
| TOPSIS | Technique for Order Preference by Similarity to an Ideal Solution |
| EWM | Entropy Weight Method |
References
- Hou, Y.; Wang, Y.; Hou, X.; Bo, F. New Challenges in Construction Engineering under Rainstorm Disaster. Adv. Civ. Eng. 2026, 2026, 7807986. [Google Scholar] [CrossRef] [Scilit]
- Qiao, L.; Wang, W.; Cao, W.; Mi, L.; Zhang, Y.; Ni, G. How Do Construction Projects Deal with Extreme Weather? Improving Organizational Resilience from the Perspective of Managers’ Perception and Affect. IEEE Trans. Eng. Manag. 2024, 71, 11585–11598. [Google Scholar] [CrossRef] [Scilit]
- Peñaloza, G.A.; Formoso, C.T.; Saurin, T.A. A Resilience Engineering-Based Framework for Assessing Safety Performance Measurement Systems: A Study in the Construction Industry. Saf. Sci. 2021, 142, 105364. [Google Scholar] [CrossRef] [Scilit]
- Bridi, M.E.; Formoso, C.T.; Saurin, T.A. A Systems Thinking Based Method for Assessing Safety Management Best Practices in Construction. Saf. Sci. 2021, 141, 105345. [Google Scholar] [CrossRef] [Scilit]
- Bhattacharjee, K.; Bugalia, N.; Mahalingam, A. An Analysis of Safety Practices for Small, Medium, and Large Construction Projects: A Resilience Engineering Perspective. Saf. Sci. 2024, 169, 106330. [Google Scholar] [CrossRef] [Scilit]
- Wang, B.; Geng, L.; Dang, P.; Zhang, L. Developing a Framework for Dynamic Organizational Resilience Analysis in Prefabricated Construction Projects: A Project Life Cycle Perspective. J. Constr. Eng. Manag. 2022, 148, 04022110. [Google Scholar] [CrossRef] [Scilit]
- Liu, K.; Liu, Y.; Kou, Y. Study on Construction Safety Management in Megaprojects from the Perspective of Resilient Governance. Saf. Sci. 2024, 173, 106442. [Google Scholar] [CrossRef] [Scilit]
- Kou, Y.; Liu, K.; Liu, Y.; Yang, X. Resilience Evaluation Method for Emergency Management of Infrastructure Construction Projects during Extreme Disasters. Nat. Hazards Rev. 2025, 26, 04025009. [Google Scholar] [CrossRef] [Scilit]
- Tang, M.; Wang, C.; Yu, L.; Li, H. Rapid Pre-Typhoon Safety Inspection System for Improving Construction Site Resilience. Int. J. Disaster Risk Reduct. 2024, 104, 104372. [Google Scholar] [CrossRef] [Scilit]
- Lee, J.; Jang, K.; Sparkling, A.E.; Kang, K. Large Language Model–Based Construction Site Management for Severe Weather Preparedness. J. Constr. Eng. Manag. 2026, 152, 04025220. [Google Scholar] [CrossRef] [Scilit]
- Gao, F.; Wang, C.; Wang, D.; Chen, Z.; Li, H.; Tong, J. Safety Hazard Inspection System during Typhoon Warning Period to Improve the Disaster Resistance Ability of Road and Bridge Construction Site. Int. J. Disaster Risk Reduct. 2024, 113, 104876. [Google Scholar] [CrossRef] [Scilit]
- Bruneau, M.; Chang, S.E.; Eguchi, R.T.; Lee, G.C.; O’Rourke, T.D.; Reinhorn, A.M.; Shinozuka, M.; Tierney, K.; Wallace, W.A.; von Winterfeldt, D. A Framework to Quantitatively Assess and Enhance the Seismic Resilience of Communities. Earthq. Spectra 2003, 19, 733–752. [Google Scholar] [CrossRef] [Scilit]
- Hollnagel, E. Resilience Engineering and the Future of Safety Management. In Handbook of Safety Principles; Möller, N., Hansson, S.O., Holmberg, J.-E., Rollenhagen, C., Eds.; John Wiley & Sons, Inc.: Hoboken, NJ, USA, 2017; pp. 23–41. [Google Scholar] [CrossRef] [Scilit]
- Li, Q.; Fan, W.; Huang, M.; Jin, H.; Zhang, J.; Ma, J. Machine Learning-Based Prediction of Dynamic Responses of a Tower Crane under Strong Coastal Winds. J. Mar. Sci. Eng. 2023, 11, 803. [Google Scholar] [CrossRef] [Scilit]
- He, Z.; Gao, M.; Liang, T.; Lu, Y.; Lai, X.; Pan, F. Tornado-Affected Safety Assessment of Tower Cranes Outer-Attached to Super High-Rise Buildings in Construction. J. Build. Eng. 2022, 51, 104320. [Google Scholar] [CrossRef] [Scilit]
- Sun, M.-H.; Zhang, L.; Li, X.-Y.; Li, X.-G.; Li, Q.-W. Wind Load Analysis on Temporary Scaffolding Structures in High-Altitude Venues Based on Numerical Simulation: A Case Study from the 2022 Beijing Olympics. Adv. Civ. Eng. 2024, 2024, 3746675. [Google Scholar] [CrossRef] [Scilit]
- Chou, J.-S.; Lin, T.-Y.; Molla, A.; Lin, C.-C.J. Advanced Risk Management Strategies for Safety Enhancement in Temporary Building Construction Works. J. Saf. Res. 2025, 95, 545–568. [Google Scholar] [CrossRef] [Scilit] [PubMed]
- Hallowell, M.R.; Gambatese, J.A. Construction Safety Risk Mitigation. J. Constr. Eng. Manag. 2009, 135, 1316–1323. [Google Scholar] [CrossRef] [Scilit]
- Golabchi, H.; Abellanosa, A.D.; Lefsrud, L.; Pereira, E.; Mohamed, Y. A Comprehensive Systematic Review of Safety Leading Indicators in Construction. Saf. Sci. 2024, 172, 106433. [Google Scholar] [CrossRef] [Scilit]
- Yang, Z.; Barroca, B.; Mebarki, A.; Laffréchine, K.; Dolidon, H.; Lilas, L. Critical Infrastructure Resilience: A Guide for Building Indicator Systems Based on a Multi-Criteria Framework with a Focus on Implementable Actions. Nat. Hazards Earth Syst. Sci. 2024, 24, 3723–3753. [Google Scholar] [CrossRef] [Scilit]
- She, J.; Guo, Z.; Li, Z.; Liang, S.; Zhou, Y. Research on Scenario Deduction and Emergency Decision-Making Evaluation for Construction Safety Accidents. Reliab. Eng. Syst. Saf. 2024, 251, 110317. [Google Scholar] [CrossRef] [Scilit]
- Guo, Z.; She, J.; Li, Z.; Du, J.; Ye, S. Integrating FRAM and BN for Enhanced Resilience Evaluation in Construction Emergency Response: A Scaffold Collapse Case Study. Heliyon 2024, 10, e25342. [Google Scholar] [CrossRef] [Scilit] [PubMed]
- Ouyang, M.; Dueñas-Osorio, L.; Min, X. A Three-Stage Resilience Analysis Framework for Urban Infrastructure Systems. Struct. Saf. 2012, 36–37, 23–31. [Google Scholar] [CrossRef] [Scilit]
- Śladowski, G.; Sroka, B.; Szewczyk, B.; Barnaś, K. Identification of Strategies for Enhancing the Risk Resilience of Construction Projects as Systems. Autom. Constr. 2024, 166, 105621. [Google Scholar] [CrossRef] [Scilit]
- Fourar, Y.O.; Djebabra, M.; Boubaker, L. Assessment of the Resilience of Safety Management Systems in the Algerian Construction Sector. Int. J. Bus. Contin. Risk Manag. 2024, 14, 287–304. [Google Scholar] [CrossRef] [Scilit]
- Liu, P.; Wang, Y.; Han, T.; Xu, J.; Li, Q. Safety Evaluation of Subway Tunnel Construction under Extreme Rainfall Weather Conditions Based on Combination Weighting–Set Pair Analysis Model. Sustainability 2022, 14, 9886. [Google Scholar] [CrossRef] [Scilit]
- Wang, C.; Tang, Y.; Kassem, M.A.; Chen, Z. UAV Application for Typhoon Damage Assessment in Construction Sites. Appl. Sci. 2022, 12, 6293. [Google Scholar] [CrossRef] [Scilit]
- Karthick, S.; Kermanshachi, S.; Pamidimukkala, A.; Namian, M. A Review of Construction Workforce Health Challenges and Strategies in Extreme Weather Conditions. Int. J. Occup. Saf. Ergon. 2023, 29, 773–784. [Google Scholar] [CrossRef] [Scilit] [PubMed]
- Huang, B.; Wang, J.; Huang, J. Vulnerability Analysis of Construction Safety System for Tropical Island Building Projects Based on GV-IB Model. Systems 2026, 14, 70. [Google Scholar] [CrossRef] [Scilit]
- Tamura, Y.; Yang, Q.; Wang, Y. Design of Temporary, Conditional, General and Highly Influential Buildings for Tropical Cyclones and Severe Local Storms. Adv. Struct. Eng. 2022, 25, 3215–3234. [Google Scholar] [CrossRef] [Scilit]
- Zhao, Z.; Yan, H.; Wang, Y.; Guo, D. A Coupled Analysis of Risk Factors of Tower Crane Collapse Accident in Extreme Winds Conditions Based on N-K Model. In Proceedings of ICCREM 2023; American Society of Civil Engineers: Reston, VA, USA, 2023. [Google Scholar] [CrossRef] [Scilit]
- Awolusi, I.; Marks, E.; Hainen, A.; Alzarrad, A. Incident Analysis and Prediction of Safety Performance on Construction Sites. CivilEng 2022, 3, 669–686. [Google Scholar] [CrossRef] [Scilit]
- Karthick, S.; Kermanshachi, S.; Namian, M. Physical, Mental, and Emotional Health of Construction Field Labors Working in Extreme Weather Conditions: Challenges and Overcoming Strategies. In Proceedings of the Construction Research Congress 2022; American Society of Civil Engineers: Reston, VA, USA, 2022; pp. 726–736. [Google Scholar] [CrossRef] [Scilit]
- Awolusi, I.; Martinez-Molina, A.; Nnaji, C.; Alamaniotis, M.; Sulbaran, T. Utility of Wearable Sensing Devices for Environmental Monitoring on Construction Sites. In Proceedings of the Construction Research Congress 2022; American Society of Civil Engineers: Reston, VA, USA, 2022; pp. 748–758. [Google Scholar] [CrossRef] [Scilit]
- Wang, J.; Guo, Q.; Zhao, H.; Wang, B.; Sun, H. Risk Assessment and Vulnerability Identification of Energy-Transportation Infrastructure Systems to Extreme Weather. IEEE Trans. Ind. Appl. 2026, 62, 7890–7903. [Google Scholar] [CrossRef] [Scilit]
- Cerè, G.; Rezgui, Y.; Zhao, W. Critical Review of Existing Built Environment Resilience Frameworks: Directions for Future Research. Int. J. Disaster Risk Reduct. 2017, 25, 173–189. [Google Scholar] [CrossRef] [Scilit]
- Seo, J.; Kim, J.; Park, G.; Son, H.; Na, D.H.; Lee, J. Optimization-Based and Optimization-Linked Decision Methods for Building Construction Safety: A Systematic Review. Buildings 2026, 16, 3389. [Google Scholar] [CrossRef] [Scilit]
- Chuang, K.-Y.; Tserng, H.-P. A Study of Automated Intelligent Monitoring of Scaffolding Safety for Construction Projects. J. Chin. Inst. Eng. 2024, 47, 626–642. [Google Scholar] [CrossRef] [Scilit]
- Xu, X.; Zhang, L.; Wang, N.; Wang, F. Comprehensive Evaluation of Maintainability Ergonomics Based on Combined Weighting. J. Eng. Appl. Sci. 2026, 73, 3. [Google Scholar] [CrossRef] [Scilit]
- Ju, W.; Xing, Z.; Shinwari, M. Safety Risk Assessment of Sustainable Construction Based on Projection Pursuit Model Optimized by Multi-Intelligent Algorithm: A Case Study of New Chemical Projects. Environ. Sci. Pollut. Res. 2024, 31, 5989–6009. [Google Scholar] [CrossRef] [Scilit] [PubMed]
- Huang, W.-G.; Zhang, S.-W.; Wang, G.-Z.; Huang, J.; Lu, X.; Wu, S.-L.; Wang, Z.-T. Modeling Methodology for Site Selection Evaluation of Underground Coal Gasification Based on Combination Weighting Method with Game Theory. ACS Omega 2023, 8, 11544–11555. [Google Scholar] [CrossRef] [Scilit] [PubMed]
- Ma, J.; Fan, Z.-P.; Huang, L.-H. A Subjective and Objective Integrated Approach to Determine Attribute Weights. Eur. J. Oper. Res. 1999, 112, 397–404. [Google Scholar] [CrossRef] [Scilit]
- Zhang, H.; Dai, P.; Kong, Y. Enhancing Urban Flood Resilience Through Emergency Shelter Assessment: A Coupled InfoWorks ICM–NetLogo Simulation and Spatial Evaluation Framework. Sustainability 2026, 18, 8878. [Google Scholar] [CrossRef] [Scilit]
- Sun, X.; Wang, W.; Liu, J.; Yao, X. Construction and Application of a Building Construction Safety Risk Assessment Model Based on Combined Weighting and an Improved Discrete Hopfield Neural Network. Reliab. Eng. Syst. Saf. 2026, 266, 111786. [Google Scholar] [CrossRef] [Scilit]
- Kim, K.; Cho, Y.; Kim, K. BIM-Driven Automated Decision Support System for Safety Planning of Temporary Structures. J. Constr. Eng. Manag. 2018, 144, 04018072. [Google Scholar] [CrossRef] [Scilit]
- Kamari, M.; Ham, Y. Semantic Detection of Potential Wind-Borne Debris in Construction Jobsites: Digital Twining for Hurricane Preparedness and Jobsite Safety. In Proceedings of Computing in Civil Engineering 2021; American Society of Civil Engineers: Reston, VA, USA, 2021; pp. 902–909. [Google Scholar] [CrossRef] [Scilit]
- Ruan, Y.; Luo, X.; Zheng, S.; Mei, Y.; Wang, Z.; Lu, H. A PSR–Entropy–TOPSIS Framework for Evaluating Low-Carbon Construction Performance of Subway Stations. Buildings 2026, 16, 1983. [Google Scholar] [CrossRef] [Scilit]
- Huang, Y.; Lu, S.; He, Z.; Ma, S.; Yu, H.; Pan, X.; Huang, W. Establishment and Application of Safety Evacuation Scheme Evaluation Model with Entropy Weight and TOPSIS for University Dormitories in China. Sci. Rep. 2026, 16, 6824. [Google Scholar] [CrossRef] [Scilit] [PubMed]
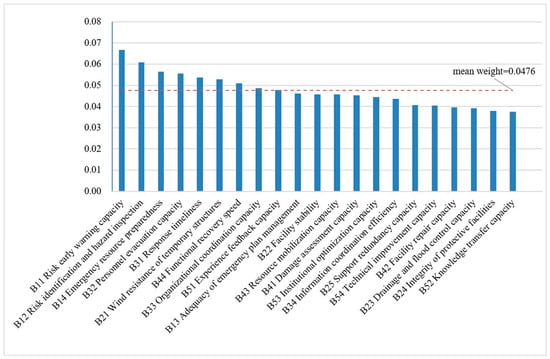
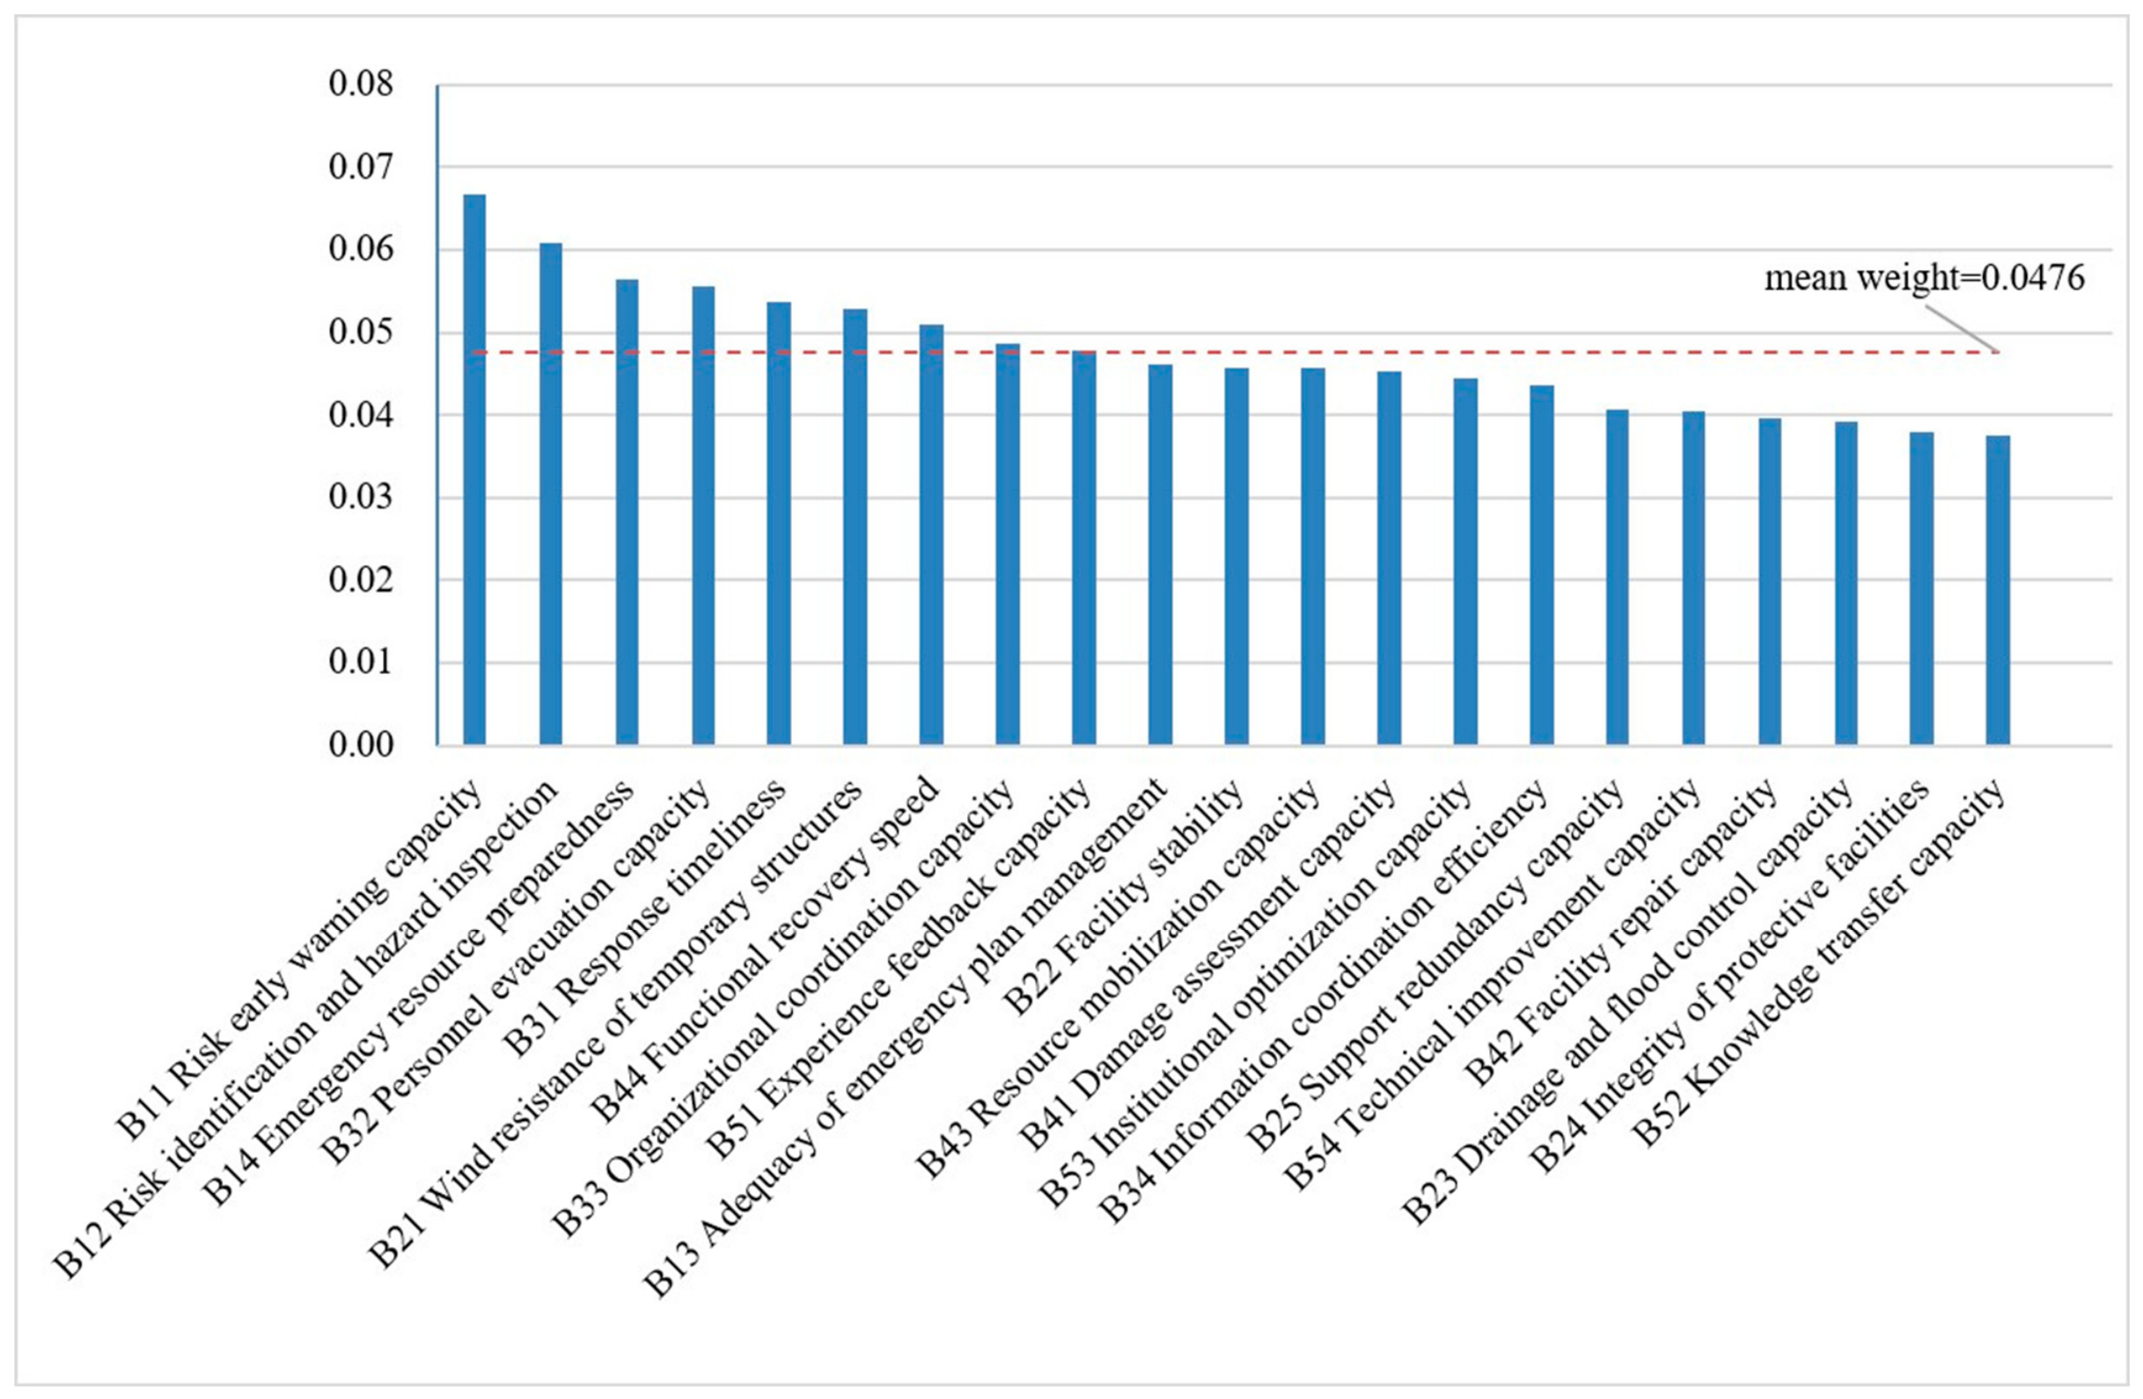
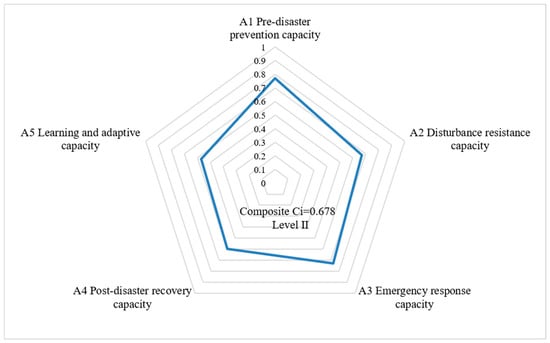
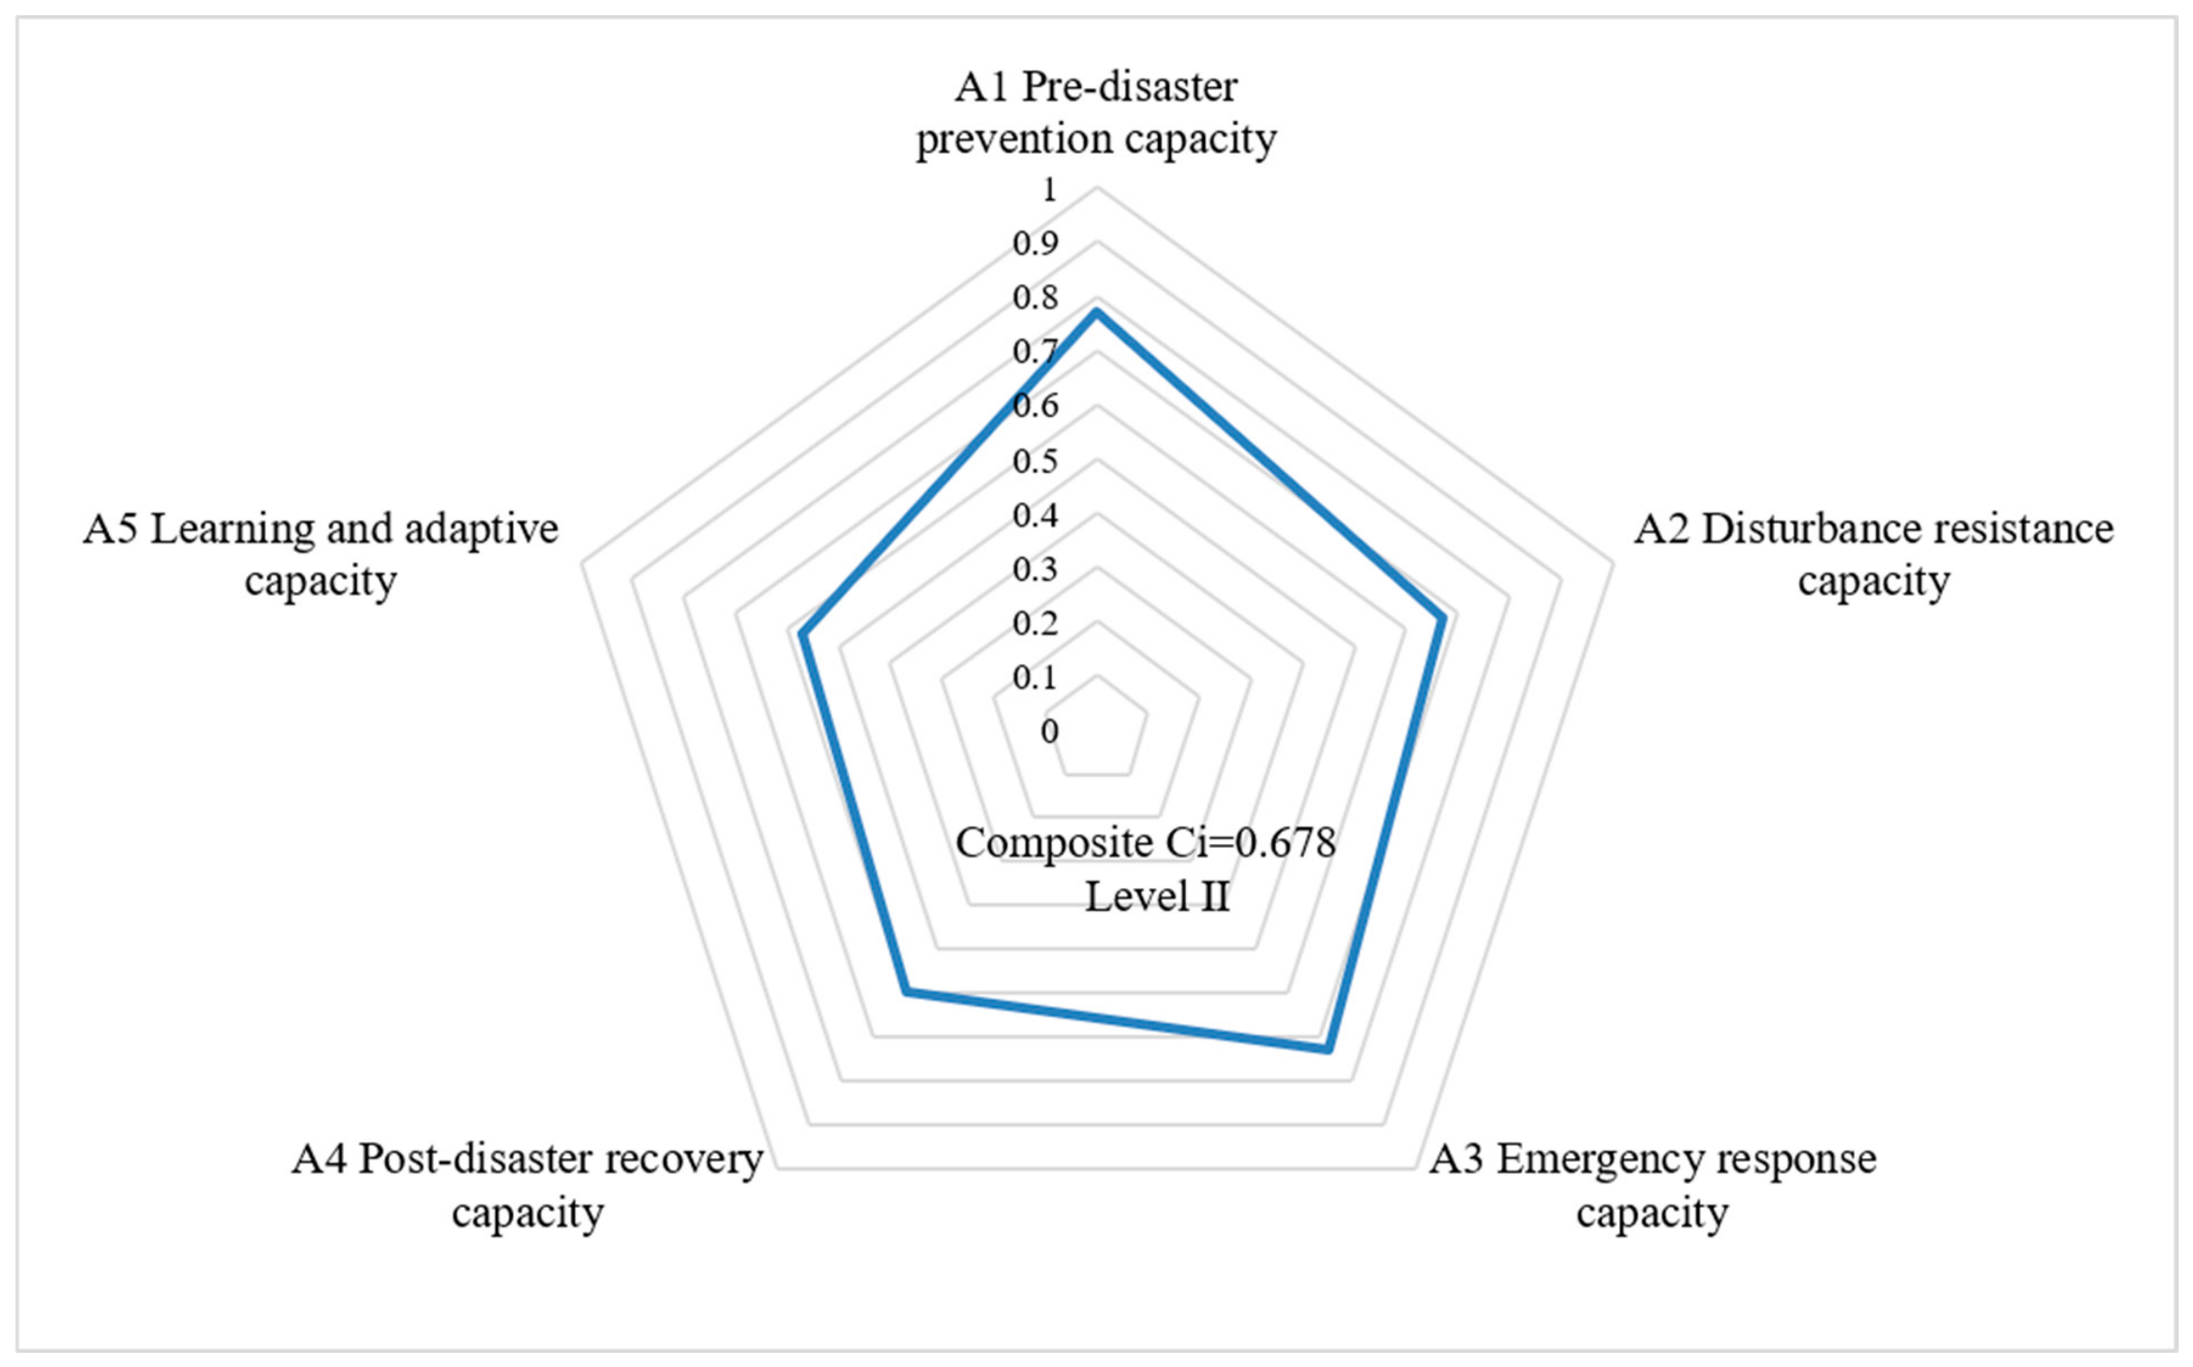
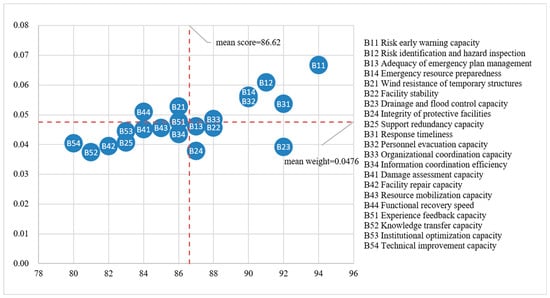
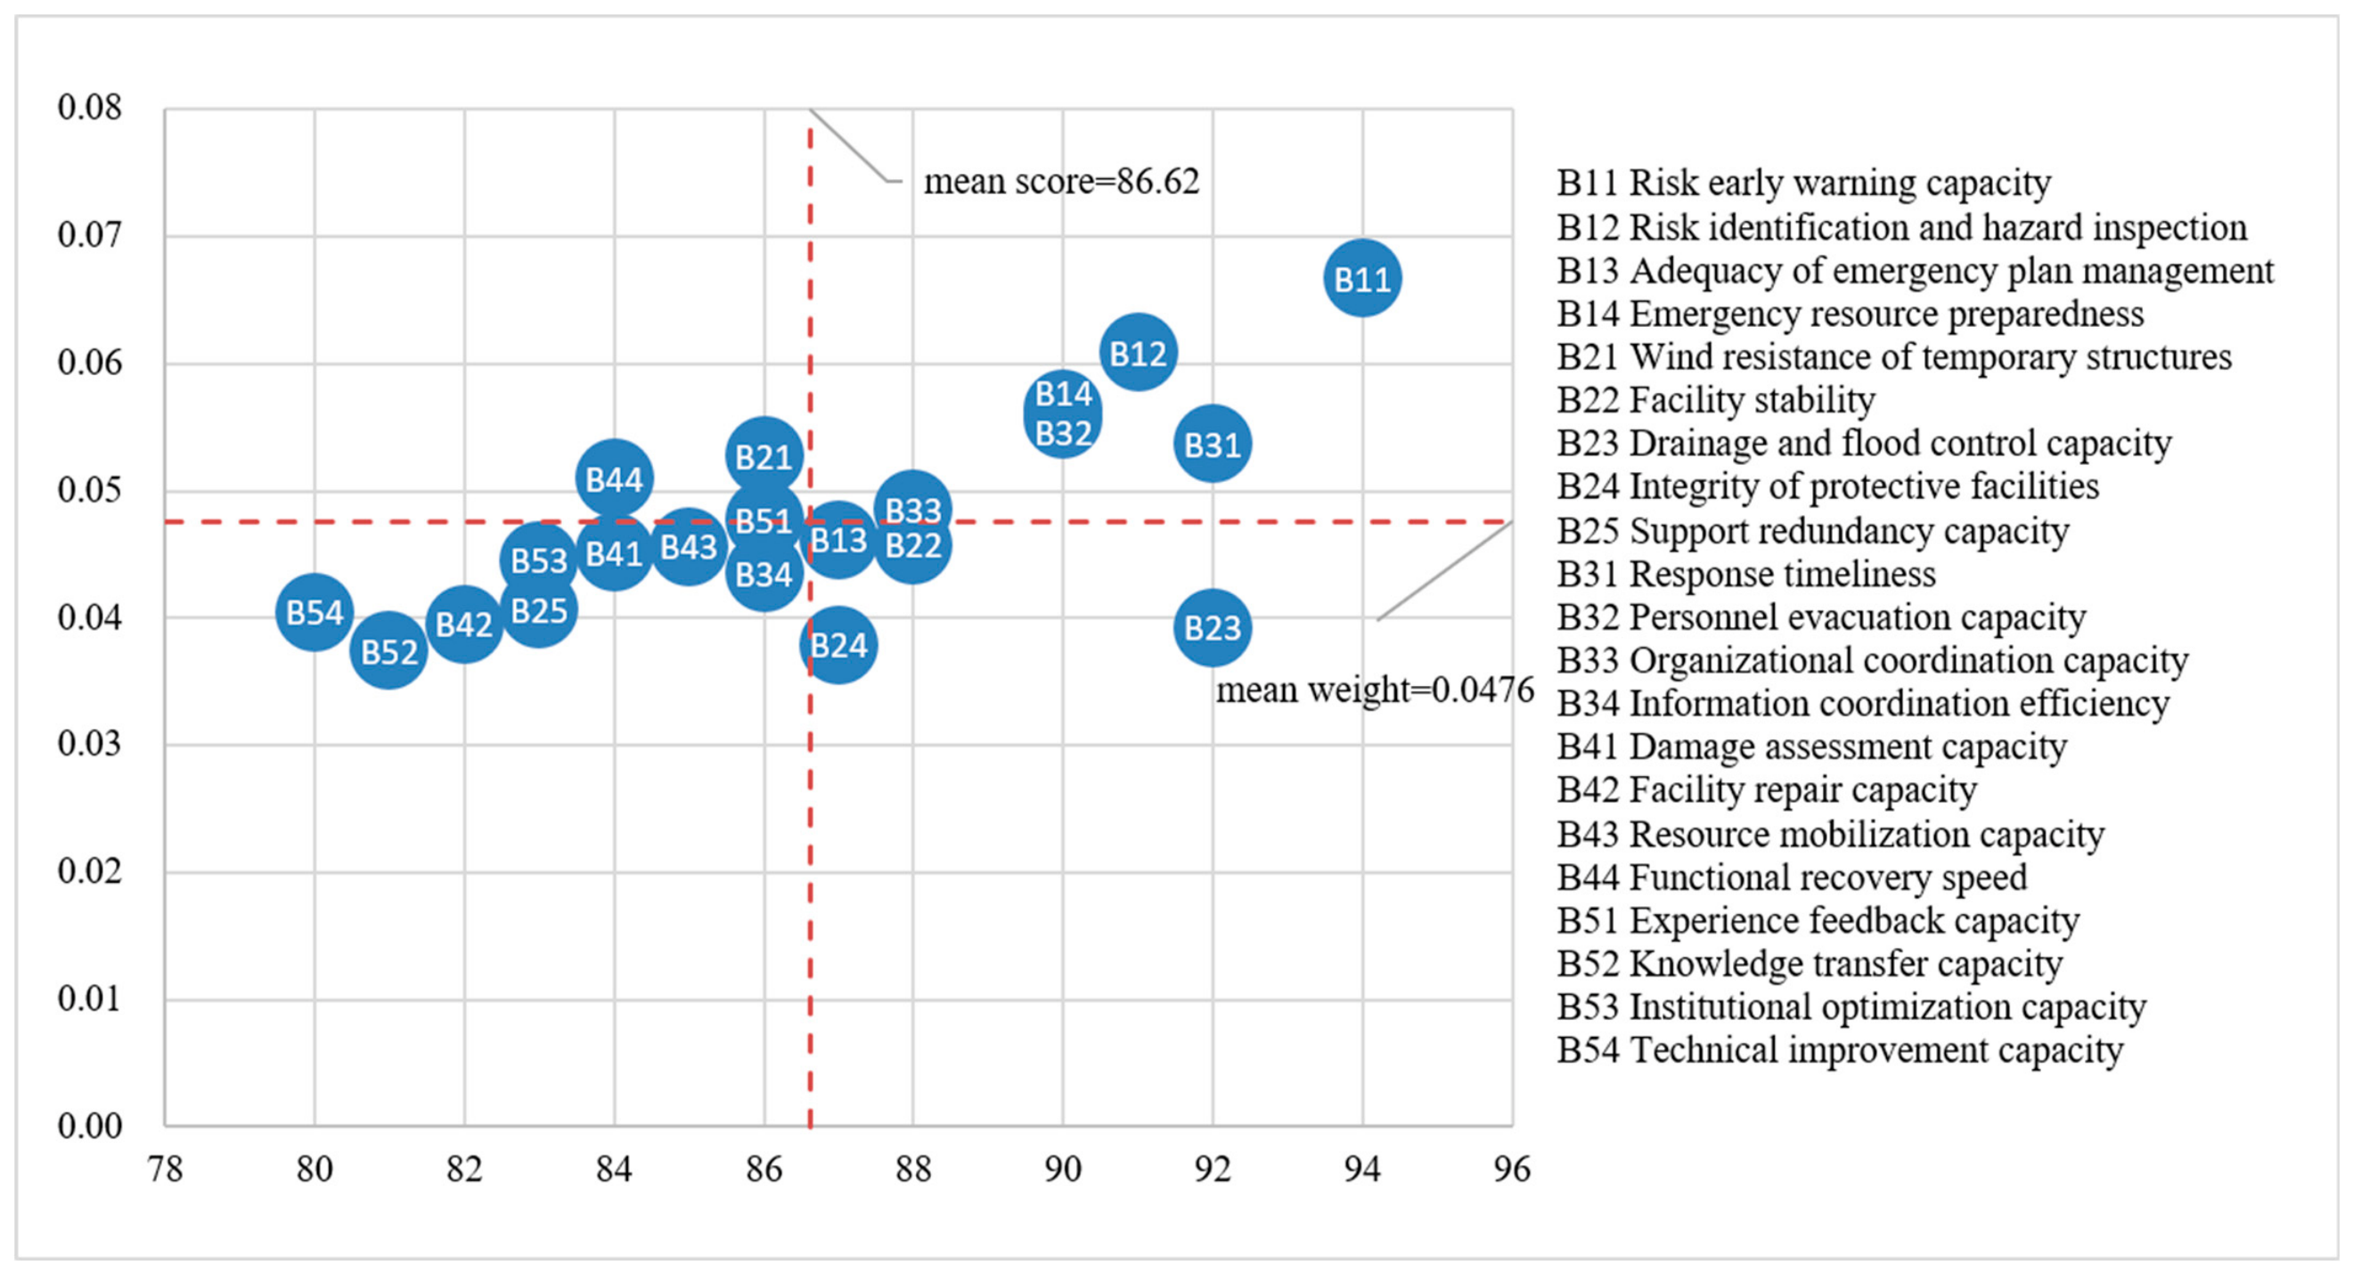

Disclaimer/Publisher’s Note: The statements, opinions and data contained in all publications are solely those of the individual author(s) and contributor(s) and not of MDPI and/or the editor(s). MDPI and/or the editor(s) disclaim responsibility for any injury to people or property resulting from any ideas, methods, instructions or products referred to in the content. |
© 2026 by the authors. Licensee MDPI, Basel, Switzerland. This article is an open access article distributed under the terms and conditions of the Creative Commons Attribution (CC BY) license.