


Abstract
To address structural deficiencies—including web cracking, transverse cracking at the girder bottom, and inadequate load-bearing capacity—in existing prestressed concrete continuous box-girder bridges with large cantilevers and thin webs, this study employed field inspections, static and dynamic load tests, and numerical simulations. Longitudinal frame models, transverse solid models, and refined interface models were developed to systematically investigate the effects of prestress loss, vehicle live loads, and temperature on crack formation. Furthermore, the effectiveness of a combined strengthening strategy involving web cross-section enlargement and internal prestressing was evaluated, with particular emphasis on the transfer efficiency of the added prestress across the interface. The results indicate that long-term prestress loss reduces the compressive stress reserve in the box-girder section and is a primary contributor to transverse cracking at the girder bottom, whereas inclined web cracking is primarily caused by the combined effects of shear stress and vertical tensile stress. Eccentric vehicle loading has a pronounced effect on the vertical tensile stress in the web; at the mid-span section, the maximum vertical tensile stress on the inner web face reached 4.24 MPa, of which 2.23 MPa was attributable to eccentric loading. After implementation of the combined strengthening strategy, the bottom-edge stress at the mid-span section decreased from 4.40 MPa to 1.74 MPa, representing a 60.45% reduction, while the mid-span deflection decreased from 30.6 mm to 20.13 mm, corresponding to a 24.54% reduction. In addition, the shear safety factor at the support increased from 0.78 to 1.10, demonstrating substantial improvements in crack resistance and overall structural stiffness. Finally, the interface stress-transfer efficiency reduction in the added internal prestress was 12.87%, indicating that the effect of interface transfer efficiency on the actual strengthening performance should be fully considered when applying the combined cross-section enlargement and internal prestressing method.
1. Introduction
In recent years, China has made remarkable advances in bridge engineering. By the end of 2025, the country had 1.1441 million highway bridges, with a total length of 108.7293 million linear meters [1]. Concrete box-girder bridges have been widely adopted in highway and railway construction owing to their high torsional rigidity, excellent structural integrity, and strong adaptability to diverse structural and service conditions. However, with increasing service age, many of these bridges have developed varying degrees of cracking, which can adversely affect their durability and structural safety [2].
Numerous scholars worldwide have conducted systematic investigations into the causes of cracking in box-girder bridges and corresponding repair and strengthening measures, proposing a range of prevention and mitigation strategies. Zeng et al. [3] identified temperature gradients and concrete shrinkage as the primary causes of cracking and advocated a comprehensive prevention strategy integrating design optimization and prestress control. Zhu et al. [4] combined numerical simulations with field measurements to investigate the temperature and strain fields of wet-joint concrete in a cross-sea bridge during construction. Their results indicated that thermal stress induced by the heat of concrete hydration was the primary cause of cracking, followed by concrete shrinkage. Lou et al. [5] evaluated structural strength, stiffness, and crack resistance, and determined that longitudinal cracking in prestressed concrete continuous box girders was primarily attributable to factors such as temperature differences between the interior and exterior of the box girder and concrete shrinkage. They proposed strengthening measures, including the installation of external prestressing tendons and increasing web thickness combined with steel plate bonding, to seal existing cracks and restore the overall load-bearing capacity of the bridge. Tu et al. [6] developed a full-bridge numerical model using solid elements to investigate the behavior of a prestressed concrete continuous girder bridge. The results showed that temperature-difference loads acting on the top slab significantly affected the tensile stress at its bottom edge, whereas the shading effect of the side flanges on the webs substantially reduced this tensile stress. Sveinson [7] systematically investigated the effects of temperature and humidity fluctuations on concrete crack propagation through experimental testing and found that increases in temperature and humidity accelerated crack growth, while their coupled effect significantly increased the propagation rate. Fu et al. [8] combined long-term monitoring with theoretical analysis to systematically evaluate the effects of thermal loads on the structural stress state. They found that thermal effects accumulated significantly in multi-span continuous systems, thereby promoting crack development, and recommended mitigating thermal stresses through the installation of expansion joints and improvements to the structural system. Guo et al. [9] analyzed several specific bridge cases and concluded that cracking in prestressed concrete continuous box girders was primarily caused by prestress loss, shrinkage and creep, and thermal effects.
Regarding strengthening techniques, Yang et al. [10] employed external prestressing to strengthen a variable-section continuous box-girder bridge. A sensor-based monitoring system was used to compare strain, crack width, and deflection before and after strengthening. The results showed that, after strengthening, the strain distribution became more concentrated and uniform, while the sectional stiffness was effectively enhanced. Zou et al. [11] experimentally investigated the effects of the number of deviators, tendon tensioning methods, and tendon profiles on the flexural performance of T-beams strengthened with external prestressing. The results demonstrated that external prestressing significantly improved the overall stiffness and ultimate load-carrying capacity of the structures. Zhang [12] evaluated the effectiveness of external prestressing through construction monitoring and on-site load tests conducted before and after strengthening. The results showed that external prestressing tendons significantly enhanced the flexural load-carrying capacity and stiffness of the beams. Jiang et al. [13] experimentally investigated the effects of various strengthening methods on the shear performance of reinforced concrete beams. The results indicated that strengthening with UHPC jackets significantly increased the ultimate shear capacity of the beams while also improving their crack resistance. Jia et al. [14] proposed a strengthening method combining section enlargement with prestressing tendons and conducted corresponding model tests. The results showed that this combined strengthening method markedly increased the ultimate load-carrying capacity of the beams and reduced deflection. Zhao Pengpeng [15] quantified concrete cracking and strength degradation by assuming a 20 mm reduction in effective section height, a C45 concrete strength grade, and a 40% loss of prestress, and subsequently strengthened the Nanling Bridge using internal prestressing. Comparative analysis of the structural response before and after strengthening revealed increases of 23–26% in structural strength, 13–15% in vertical stiffness, and 7.1% in dynamic stiffness. Wang et al. [16] used finite element analysis to evaluate the overall strengthening effect of the combined section enlargement and internal prestressing method. The results indicated that this method significantly enhanced the load-carrying capacity of prestressed concrete box-girder bridges. Furthermore, the effect of shrinkage in the added concrete on the existing box-girder structure was minimized when the fly ash content was 54%, while the prestress loss at the interface could be controlled within 10% with an interface rebar implantation ratio of 0.6% and a surface roughness of 0.9 mm.
Although FEM has been widely used for structural stress analysis and strengthening assessment, it is not the only available numerical approach. Wang et al. [17] developed a domain-decomposition generalized finite difference method for three-dimensional stress analysis of composite materials, providing an alternative meshless numerical framework for structural analysis. Kabir and Aghdam [18] proposed a generalized Bézier-based method for stress analysis of notched composite plates, demonstrating another numerical approach for evaluating stress distributions in structures with geometric discontinuities. These methods provide alternative numerical tools depending on the structural configuration and analysis objectives. In the present study, FEM was adopted because it is well suited to representing the complex geometry, prestressing effects, existing deterioration, and strengthening configuration of the investigated box-girder bridge.
In summary, although finite element analysis and conventional strengthening techniques have been widely applied to long-span continuous box-girder bridges, those with large cantilevers and thin webs exhibit distinct structural behavior and construction characteristics compared with conventional configurations. The authors’ previous study [16] primarily examined the interface force-transfer mechanism of the composite strengthening system, with particular emphasis on the effects of concrete shrinkage and interface parameters on prestress transfer. Building on that work, the present study investigates the causes of web cracking through integrated longitudinal and transverse analyses. A composite strengthening method combining web section enlargement with internal prestressing is evaluated in terms of its effectiveness in addressing the identified cracking mechanisms. In addition, the structural response and tensile-stress distributions associated with web cracking are analyzed, and a refined interface model is used to examine prestress transfer between the existing and added concrete. By integrating crack diagnosis, structural response analysis, and strengthening assessment, this study establishes a systematic framework for investigating web cracking and evaluating strengthening performance in continuous box-girder bridges with large cantilevers and thin webs.
2. Project Background
2.1. Bridge Overview
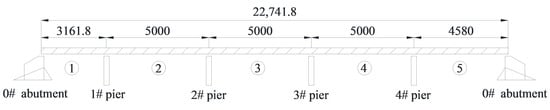
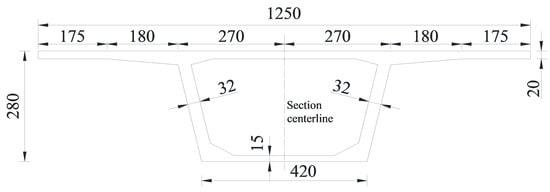
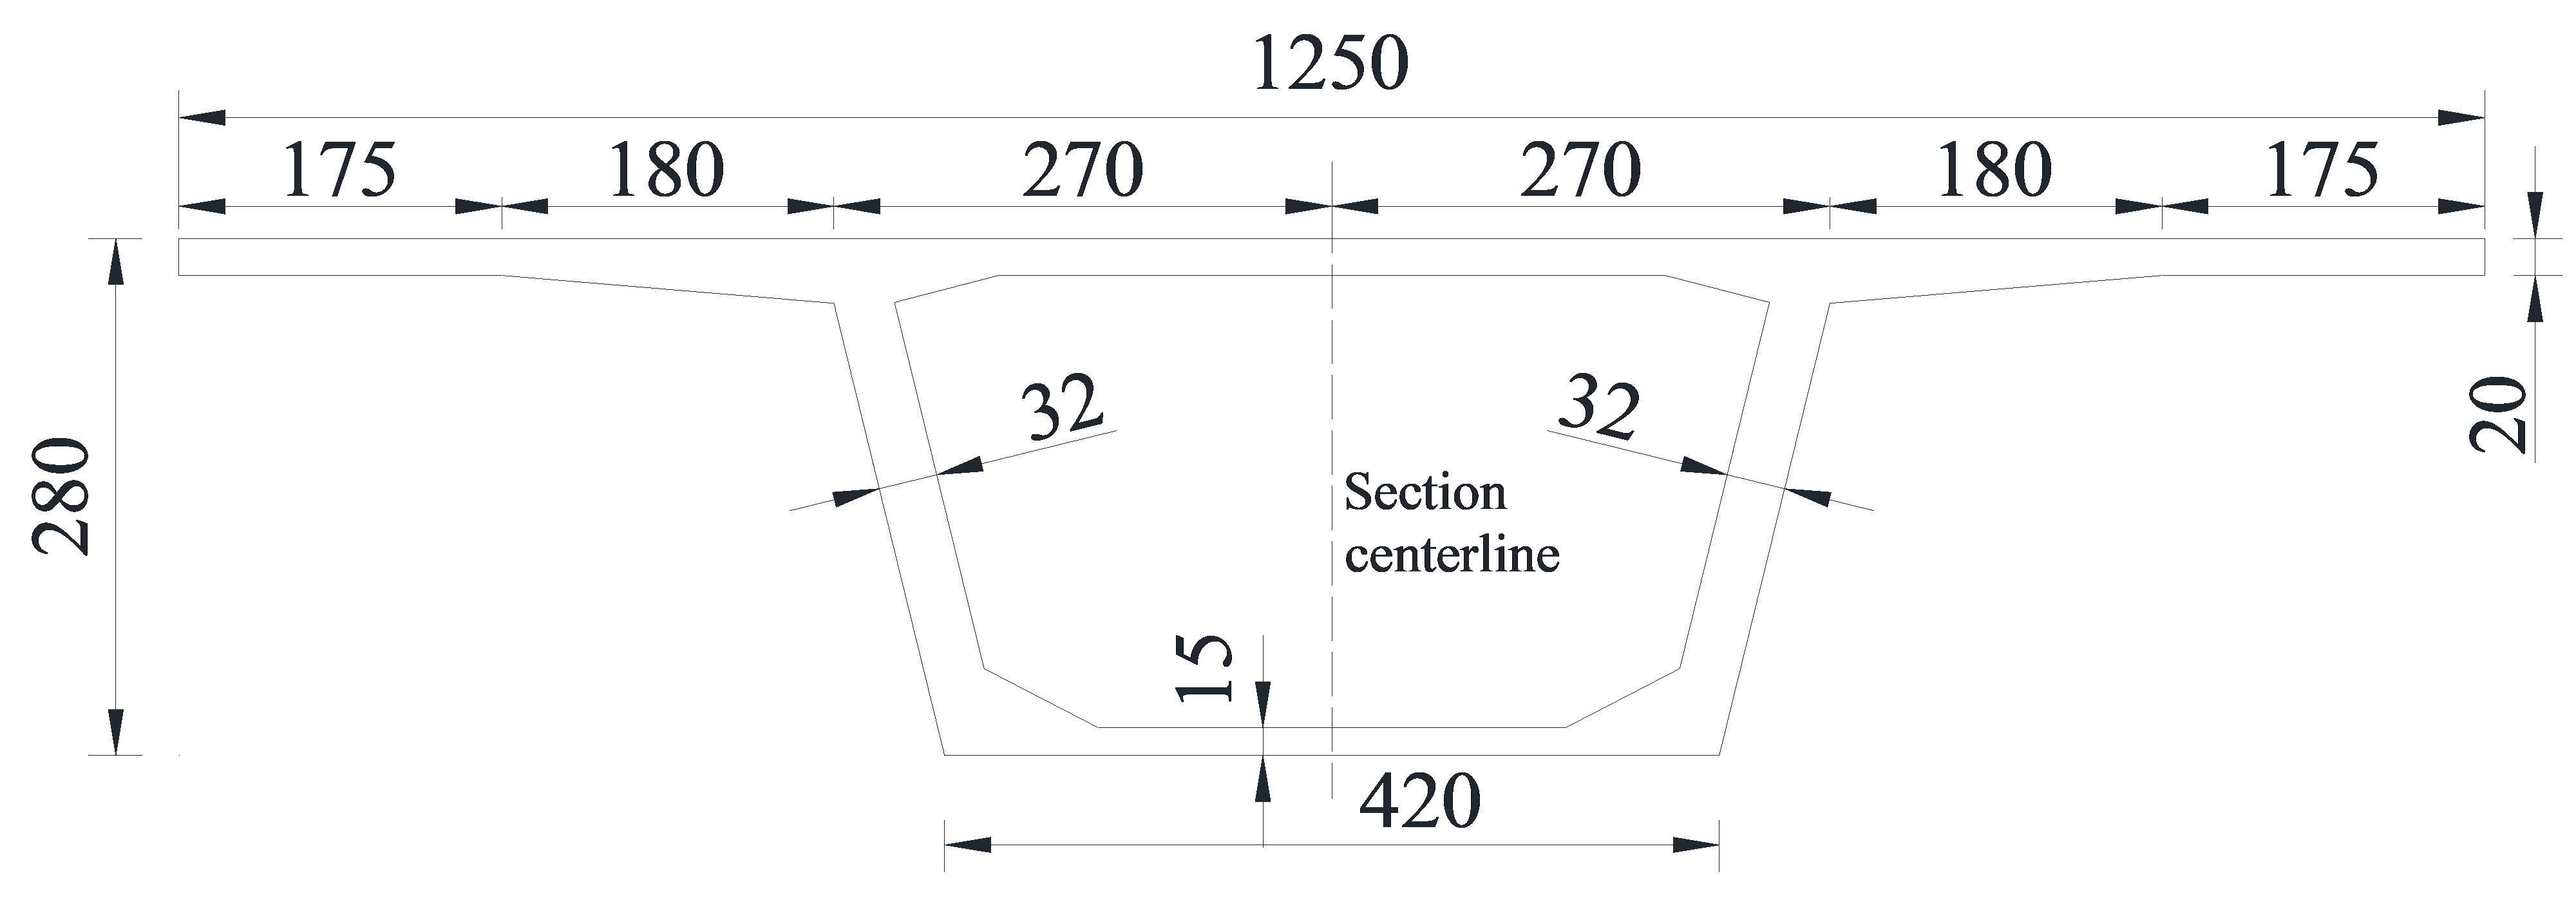
This study focuses on a constant-depth prestressed concrete continuous box-girder bridge located on an expressway. The bridge has a span arrangement of 31.6 m + 3 × 50 m + 45.8 m and a total length of 235.42 m. Completed in late 1997, the bridge underwent multiple visual inspections and static and dynamic load tests between 2006 and 2016. Despite the implementation of corresponding maintenance and strengthening measures following these inspections, the bridge remains classified as Class III or IV in terms of its technical condition, indicating the need for further strengthening. The general layout and mid-span cross-section of the bridge are shown in Figure 1 and Figure 2, respectively. The superstructure adopts a single-box, single-cell cross-section with inclined webs. The box girder has a depth of 2.8 m, a top flange width of 12.5 m, and a bottom flange width of 4.2 m, with a cantilever length of 3.55 m for the flange wings. Within a 10 m length extending from the intermediate support toward the mid-span, the cross-sectional dimensions vary: the bottom flange thickness tapers from 48 cm to 15 cm, the web thickness tapers from 45 cm to 32 cm, and the top flange thickness remains constant at 20 cm. The design loads for the bridge are Vehicle-Super 20 and Trailer-100.
Figure 1.
General arrangement plan (unit: cm).
Figure 2.
Box girder mid-span section (unit: cm).
2.2. Current Status of Box Girder Defects
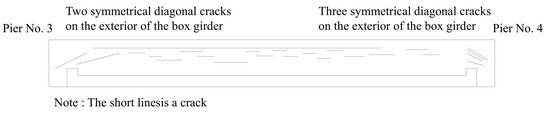
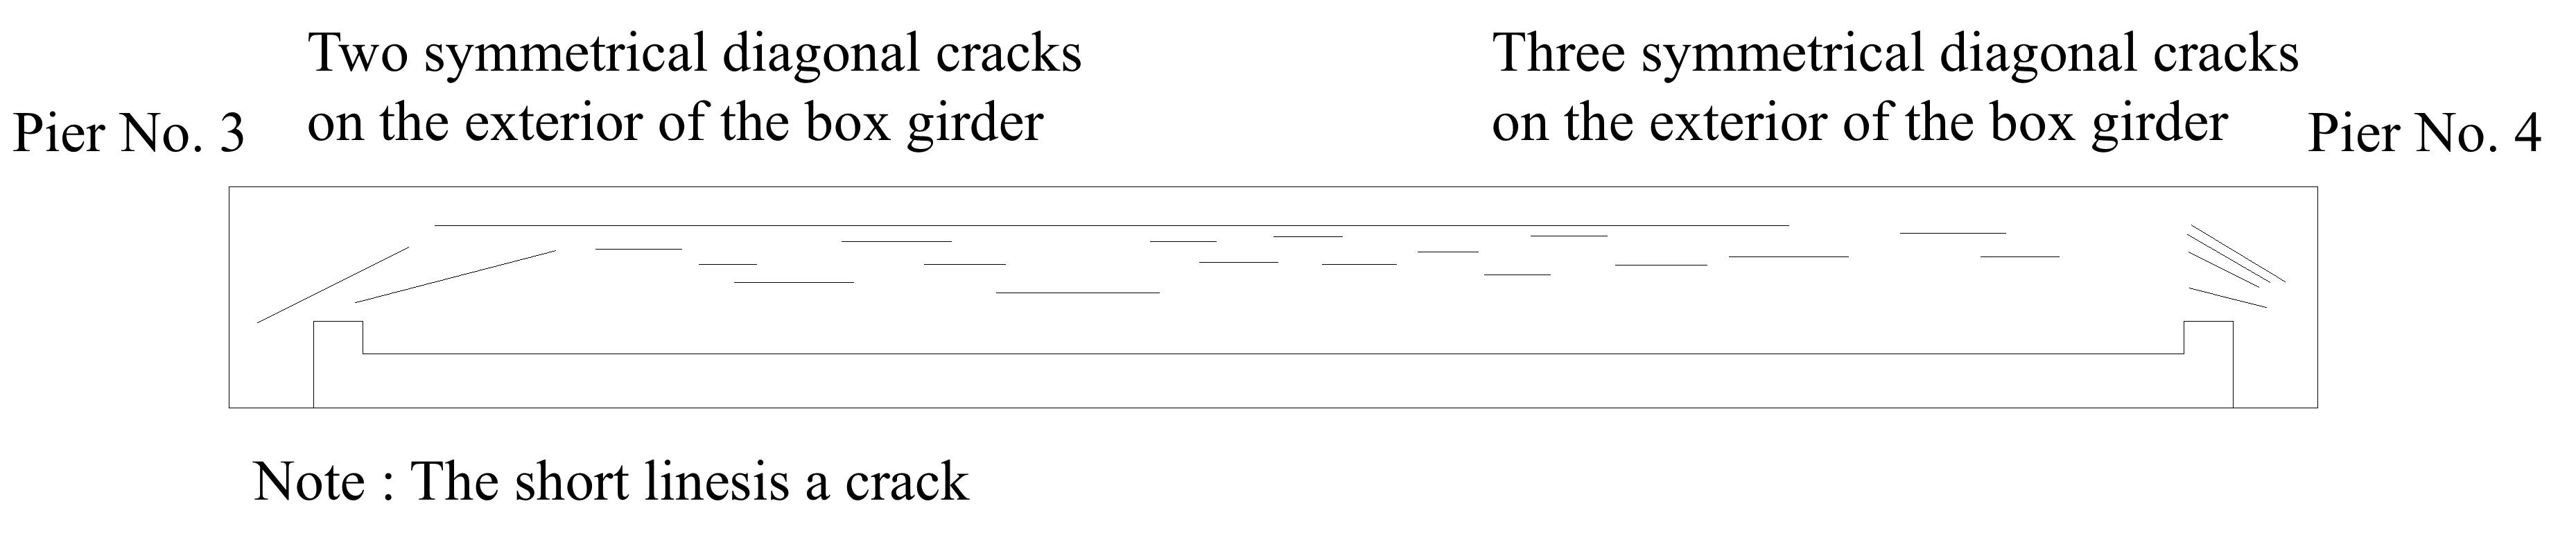
The primary defects observed in the bridge include transverse cracks on the exterior surface of the box girder, as well as longitudinal and diagonal cracks within the box girder. The exterior transverse cracks are mainly distributed between the quarter-span and mid-span sections along the girder soffit, whereas the diagonal cracks are primarily concentrated on the webs near the girder ends, as summarized in Table 1. Figure 3 illustrates the distribution of cracks on the left web of the fourth span of the left bridge deck. Across the five spans of the bridge, 14 diagonal cracks exceeding the allowable width limit of 0.15 mm were identified on the exterior of the box girder, with a total length of 17.7 m. On the interior, 24 diagonal cracks exceeding the same limit were identified, with a total length of 34.6 m, together with 157 longitudinal cracks with a total length of 496.2 m.
Table 1.
Crack summary table.
Figure 3.
A schematic diagram of the left web crack in the fourth span box on the left side.
Static and dynamic load tests were conducted on the left and right spans of the bridge in 2016. The main results are summarized as follows:
(1) The deflection verification coefficients were all greater than 1, indicating that the test results failed to satisfy the specified requirements. In the left span, the relative residual deflection was generally less than 20%, indicating that the structure retained a certain capacity for elastic recovery. In contrast, the relative residual deflection exceeded 20% in some areas of the right span, indicating that the corresponding requirements were not satisfied.
(2) Except for the stress verification coefficient under the pier-top negative bending moment condition, which was less than 1, the verification coefficients of the bottom flange under the mid-span positive bending moment condition were all greater than 1, indicating that the specified requirements were not satisfied. The relative residual strains were generally less than 20%, indicating that the structure retained a certain capacity for elastic recovery. In addition, the normal stress distribution along the cross-sectional height exhibited localized abrupt changes at the shear keys and bottom flange, indicating a deviation from the plane-section assumption.
(3) The inclined cracks at the pier top exhibited no significant changes during loading. Both the crack widths during loading and the residual crack widths after unloading satisfied the specification requirements. Test monitoring also showed no propagation of crack length.
(4) The measured natural frequencies were lower than the corresponding theoretical values. The ratios of the measured first-order natural frequencies to the theoretical frequencies were 0.963 and 0.929 for the left and right spans, respectively, both of which were less than 1. These results indicate that the actual structural stiffness was lower than the theoretical stiffness.
(5) The maximum impact coefficients of the left and right spans were 0.2817 and 0.269, respectively, both exceeding the impact coefficient of 0.14 calculated in accordance with the General Specifications for Design of Highway Bridges and Culverts (JTG D60-2015) [19]. Therefore, neither the left nor the right span satisfied the serviceability requirements under the design live-load conditions.
2.3. Preliminary Analysis of the Causes of Box Girder Cracks
2.3.1. Transverse Cracks in the Bottom Slab of the Box Girder
(1) The measured impact factor is relatively high. The bridge was completed in 1997 and designed in accordance with the then-applicable General Specifications for Design of Highway Bridges and Culverts (JTJ 021-89) [20]. Under this standard, the impact factor for prestressed concrete girder bridges with spans of 45 m or greater was specified as zero. However, according to the fundamental-frequency-based method specified in the current General Specifications for Design of Highway Bridges and Culverts (JTG D60-2015) [19], the calculated impact factor is 0.14. Therefore, the measured impact factor substantially exceeds the values specified or calculated under both the former and current design standards.
(2) The Specifications for Design of Highway Reinforced Concrete and Prestressed Concrete Bridges and Culverts (JTJ 023-85) [21] provide provisions only for calculating the internal forces in T-section continuous beams induced by solar radiation temperature differentials. In the absence of field measurement data, the specifications permit a uniform temperature increase of 5 °C across the bridge deck to be assumed. However, owing to the lack of systematic research on temperature gradients, these provisions are inadequate compared with those specified in the General Specifications for Design of Highway Bridges and Culverts (JTG D60-2015). For continuous beams, cross-sectional temperature differentials can generate substantial internal forces and, in some cases, produce effects greater than those induced by dead and live loads on the beam.
(3) Owing to the poor construction quality of the reference bridge, partial loss of the sustained prestress may have occurred, resulting in an insufficient compressive stress reserve in the cross-section.
(4) The actual structural stiffness is relatively low. The static and dynamic load tests indicate that both the deflection verification coefficients and the measured fundamental frequencies are consistent with a structural stiffness lower than the theoretical value. This reduced stiffness is primarily attributed to continuous construction cold joints at the junction (fillet) between the box-girder webs and the top slab. Because the webs and top slab were cast in separate stages, the long interval between completion of the web casting and subsequent slab casting, combined with inadequate interface roughening, made this location susceptible to the formation of cold joints. On-site measurements revealed that these cold joints were up to 4 mm wide and more than 10 cm deep, with some extending through the entire thickness of the web. These cold joints substantially impair force transfer between the top slab and webs, causing the box girder to exhibit behavior intermediate between that of a monolithic composite beam and a superimposed beam, thereby significantly reducing the overall structural stiffness.
2.3.2. Diagonal and Longitudinal Web Cracks
In the box-girder section of the investigated bridge, the long cantilevered flanges generate significant bending moments in the webs under eccentric vehicle loading. Owing to the thin webs and their low flexural rigidity, substantial vertical tensile stresses develop on the inner surfaces of the webs. These vertical tensile stresses, together with low stirrup reinforcement ratios, unfavorable longitudinal stirrup distribution, and a relatively thick concrete cover, contribute to the formation of longitudinal cracks on the inner surfaces of the webs. Near the supports, where the principal tensile stresses are relatively high, the interaction between vertical and principal tensile stresses promotes the formation of diagonal cracks inclined at angles of less than 45°.
3. Analysis of Causes of Box Girder Cracking
3.1. Construction of the Finite Element Model
3.1.1. Longitudinal Force Analysis Model
Continuous box-girder bridges are primarily subjected to longitudinal bending effects induced by dead loads, vehicular live loads, and prestressing forces. Transverse cracking in the bottom slab is typically associated with increased tensile stresses arising from longitudinal bending moments, while long-term prestress losses reduce the effective compressive stress reserve and consequently impair the crack resistance of the structure. Therefore, a longitudinal analysis model is established to identify the primary factors governing transverse cracking in the bottom slab, thereby providing a basis for the subsequent design of strengthening schemes.
The general-purpose finite element software MIDAS/Civil NX was employed to establish a frame-element model of the investigated bridge. The bridge model comprises 128 nodes and 129 elements, as shown in Figure 4. According to the original bridge design documents, C50 concrete is specified, with a modulus of elasticity of 34.5 GPa, a Poisson’s ratio of 0.2, a unit weight of 26 kN/m3, a characteristic tensile strength of 2.65 MPa, and a linear expansion coefficient of 1 × 10⁻⁵ (1/°C). Longitudinal prestressing was provided by prestressing strands, with a linear expansion coefficient of 1.2 × 10⁻⁵(1/°C). Eleven strands were used in the first span, while 12 strands were used in each of the Spans 2–5; transverse prestressing was provided by 24 strands. The basic material parameters are summarized in Table 2. The model parameters were primarily determined from measured data; where measurements were unavailable, the corresponding values were determined in accordance with the relevant specifications. Specifically, the impact coefficient, live-load influence correction coefficient, and eccentric-load coefficient were set to 0.28, 1.088, and 1.15, respectively.
Figure 4.
Finite element model.
Table 2.
Material parameters of prestressed steel bundle.
To validate the accuracy of the finite element model, the measured stresses and deflections obtained from the eccentric loading case of the static load test on the strengthened bridge were extracted and compared with the corresponding numerical results from the finite element analysis.
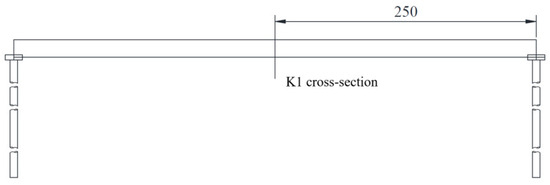
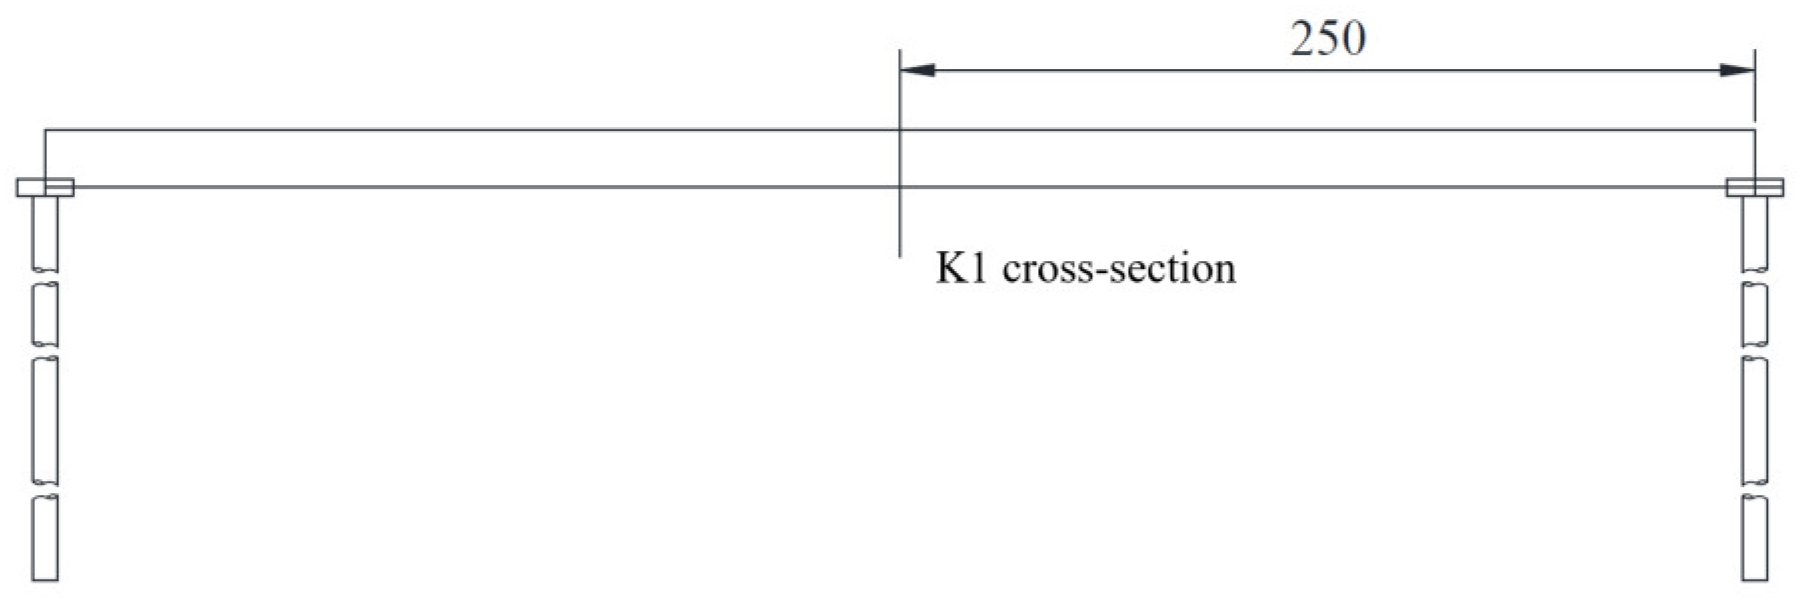
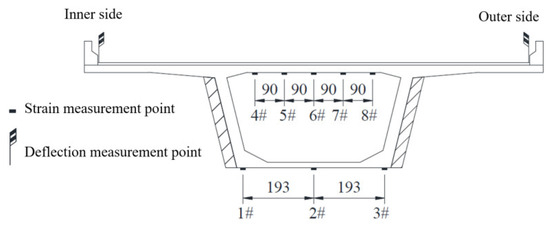
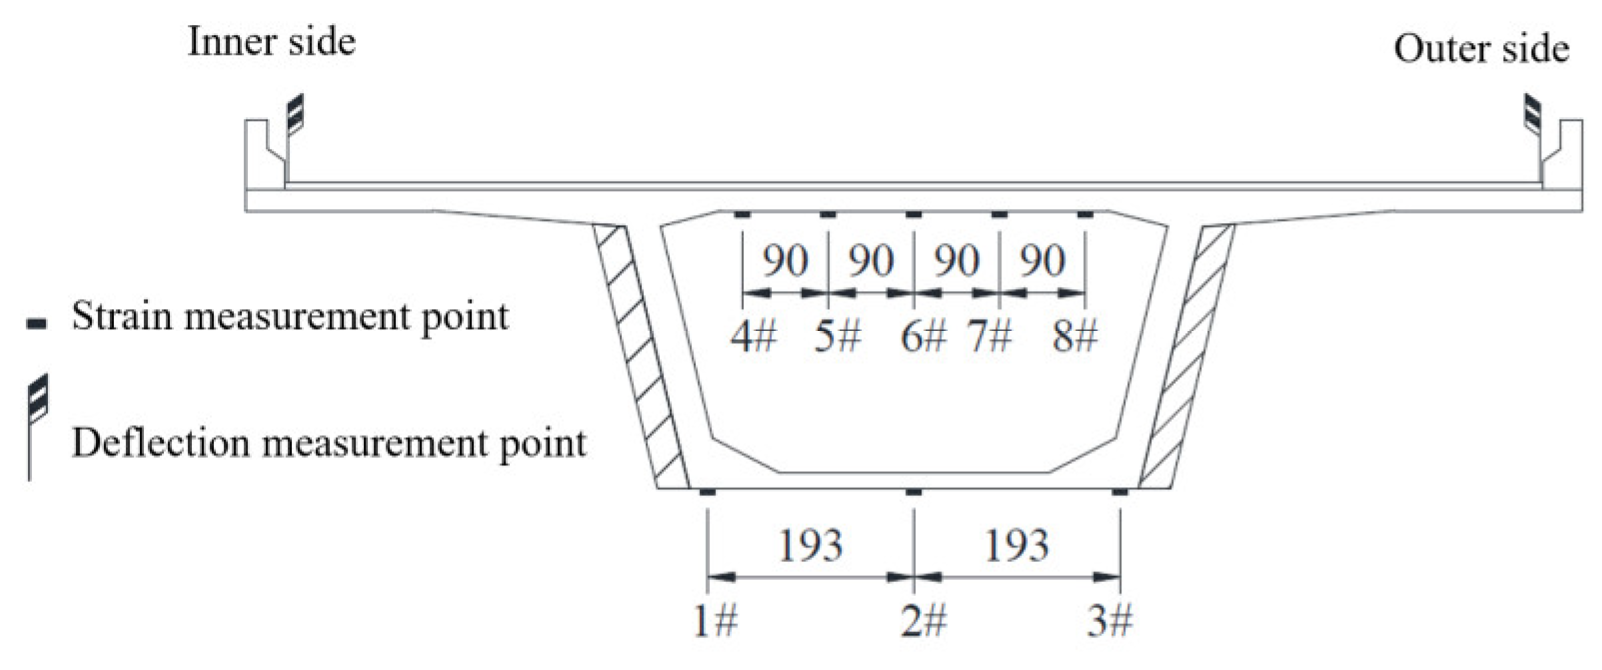
Considering the structural characteristics and site conditions of the bridge, the eccentric loading case that generated the maximum positive bending moment at the mid-span section was selected from the static load test conducted on the right bridge deck. BQ-120 strain gauges were used to measure the surface strains of the concrete at different sections, while precision leveling instruments were employed to measure deflections at the specified locations. The positions of the control sections are presented in Figure 5, and the arrangement of the strain and deflection measurement points is shown in Figure 6.
Figure 5.
Schematic diagram of test section locations (unit: cm).
Figure 6.
Schematic diagram of strain and deflection measurement point layout (unit: cm).
Table 3 and Table 4 present comparisons of the deflection and strain responses obtained from the static load test of the actual bridge and those predicted by the beam-element finite element model at the K1 section under the positive bending eccentric loading condition. The maximum relative differences between the measured and numerical results for deflection and strain at the K1 section were 8.12% and 8.97%, respectively. Since both relative differences were within 10%, the stiffness accuracy of the finite element model was verified.
Table 3.
Comparison of deflection values under eccentric load.
Table 4.
Comparison of eccentric load strain values.
3.1.2. Lateral Force Analysis Model
Conventional longitudinal beam-element models primarily capture the global longitudinal response of the bridge and are therefore unable to accurately characterize the local stress distribution within box-girder webs, particularly the vertical tensile stresses induced by eccentric vehicle loading. Therefore, to investigate the mechanism of web cracking in box-girder bridges with long cantilever flanges and thin webs, a three-dimensional solid finite element model of the full bridge cross-section was developed to characterize the local stress state within the webs in greater detail.
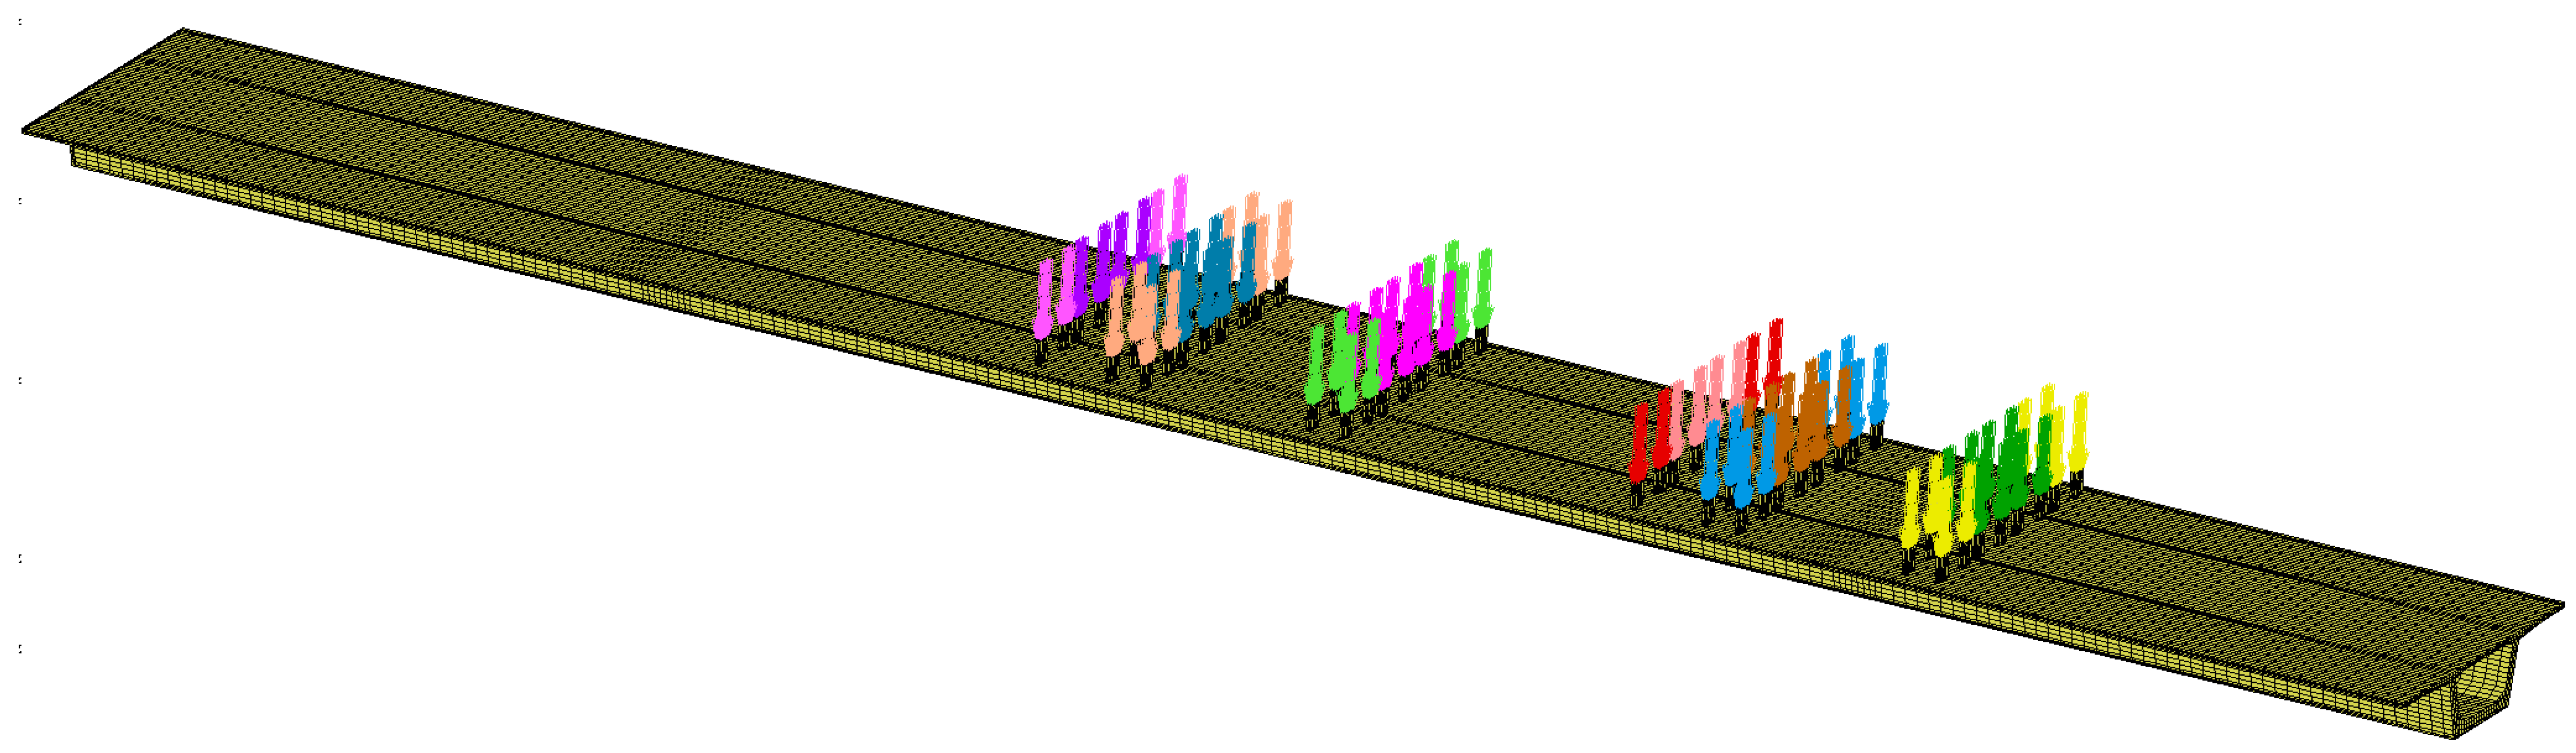
To ensure the accuracy and convergence of the solid finite element model, the concrete was simulated using the 8-node hexahedral solid element (HEX8) available in MSC.MARC, whereas the prestressing steel was modeled using the built-in 3D two-node rebar elements. The rebar elements were embedded into the concrete elements through the “Insert” function. The entire bridge model was discretized into 152,969 elements, including 41 transverse prestressing elements. The concrete element size was generally set to 500 mm and locally refined to 250 mm in the mid-span region. The linear expansion coefficient of the prestressed steel reinforcement is defined using the “cooling method” such that it contracts as the temperature drops, thereby generating tensile stress within the reinforcement, as shown in Equation (1).
where σ is the tensile stress of the prestressing tendon and α is the coefficient of linear expansion, taken as 1.2 × 10⁻⁵.
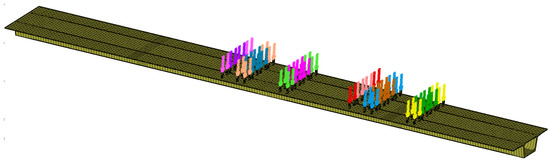
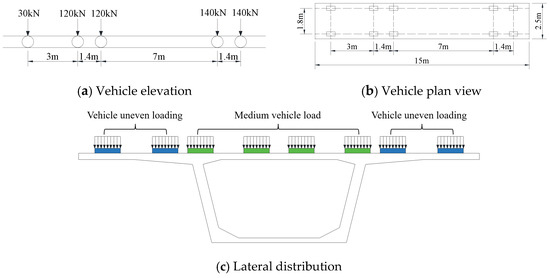
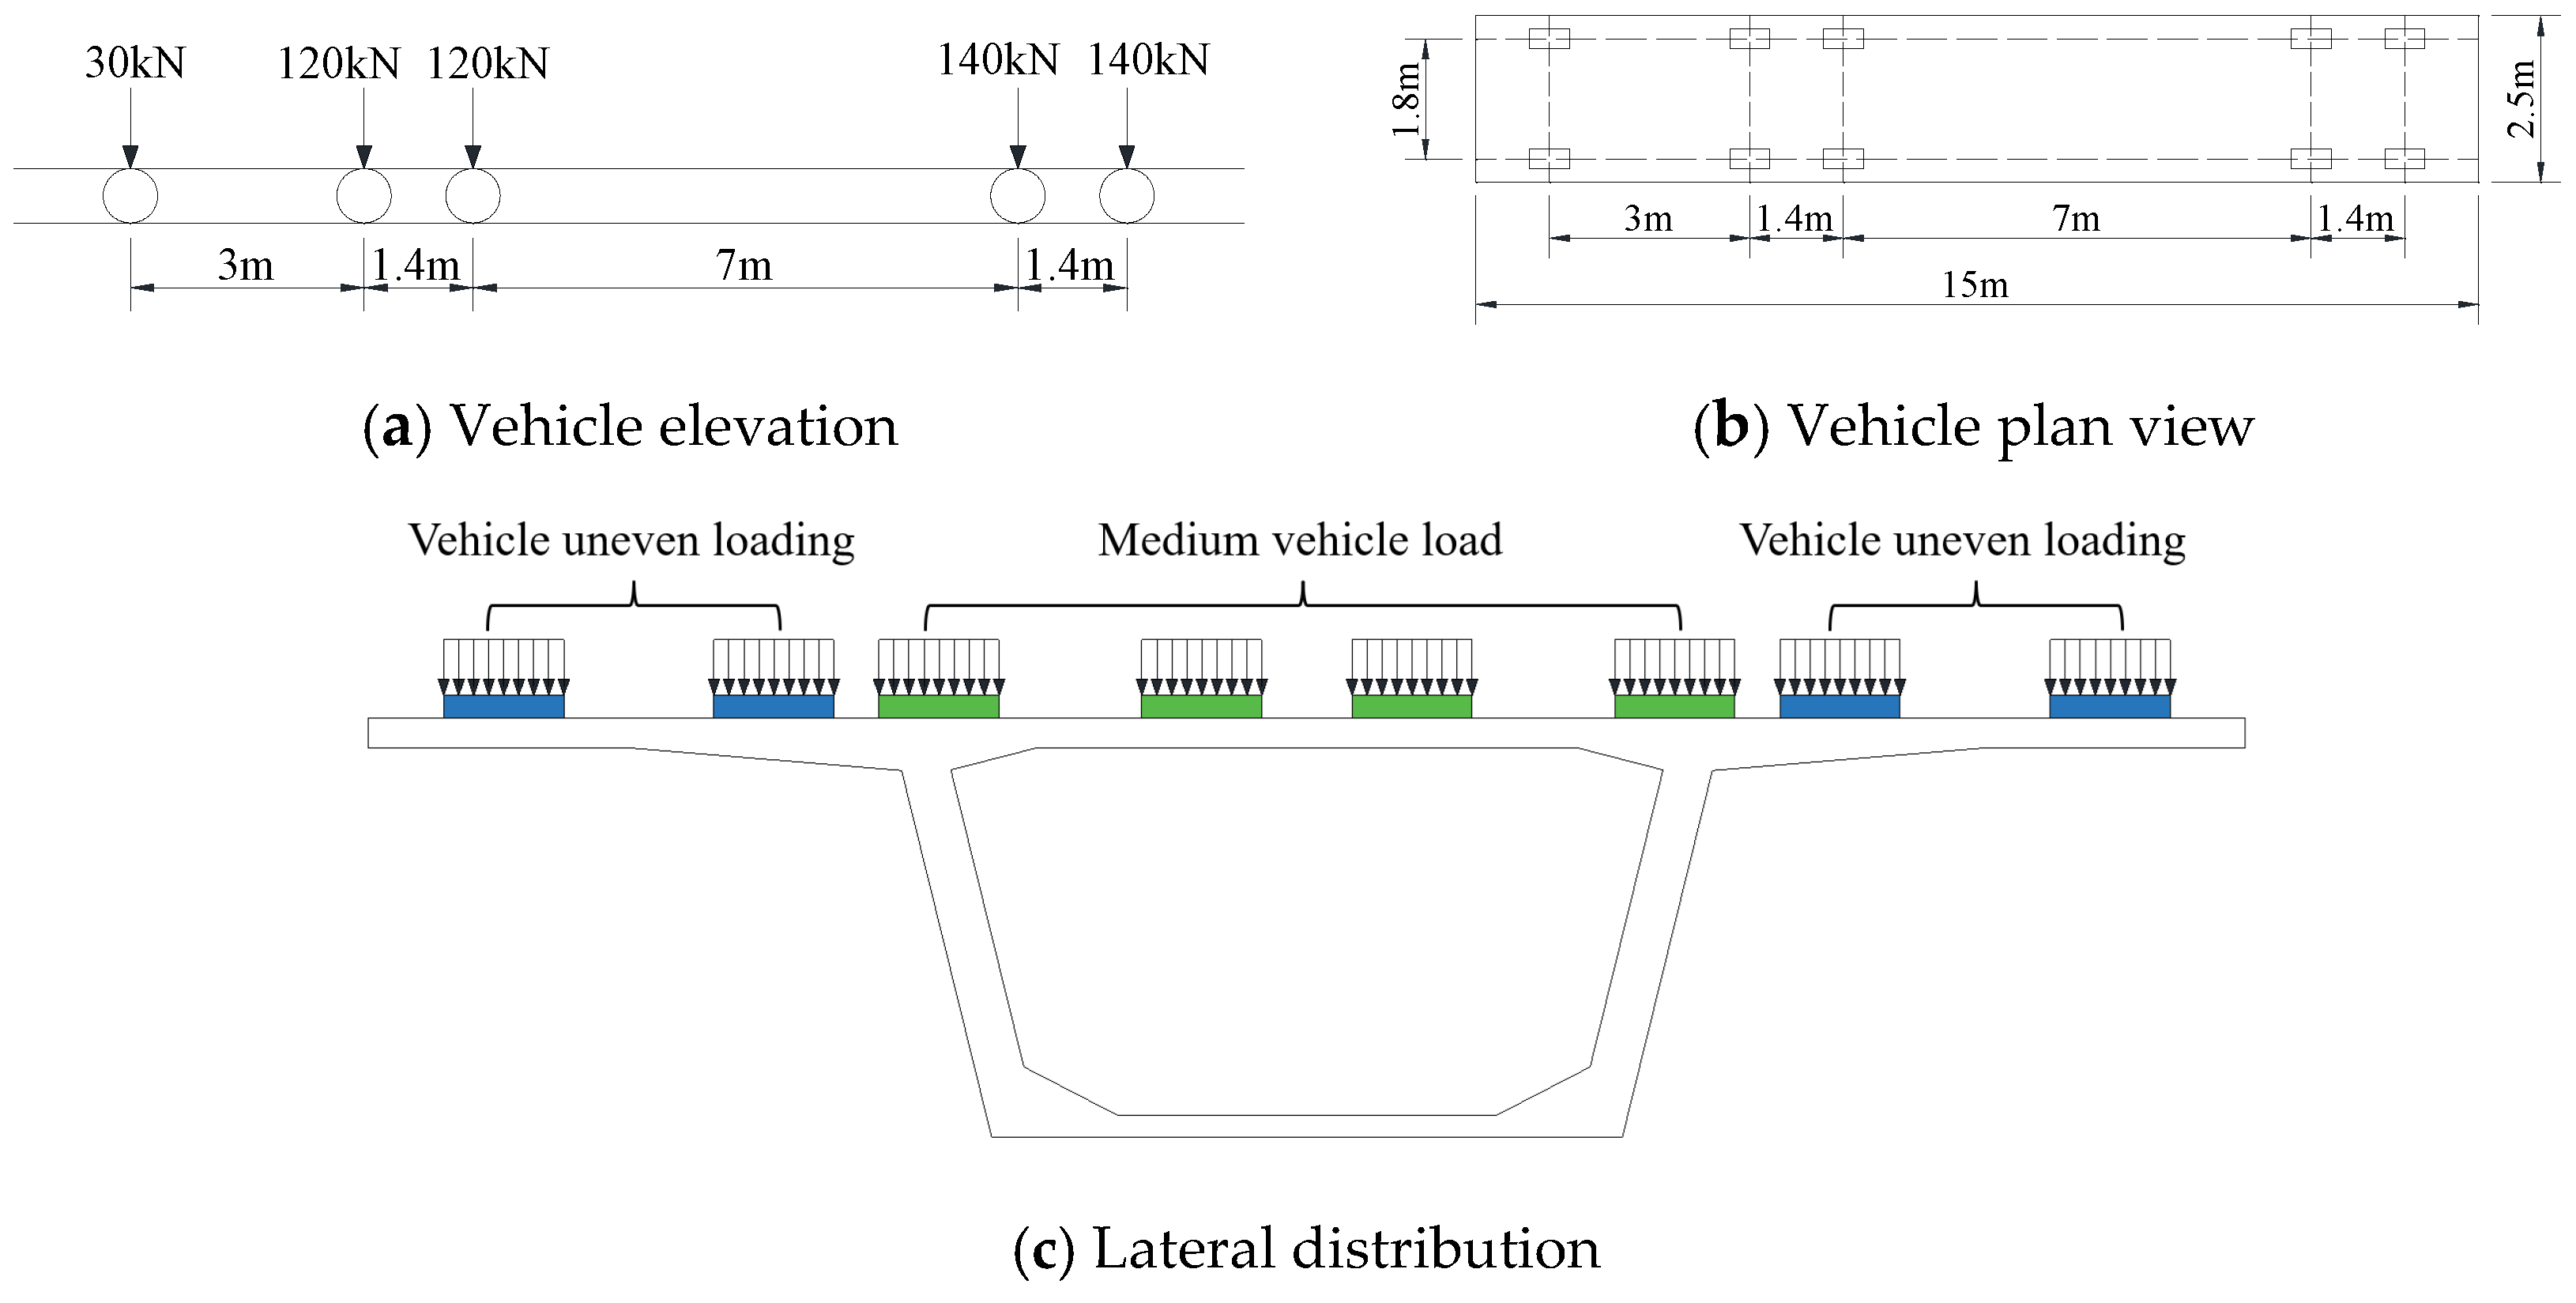
In the finite element model, the X-axis corresponds to the transverse direction, the Y-axis to the vertical direction, and the Z-axis to the longitudinal direction. A fixed constraint is applied at the top of the pier for the second span (restricting displacements in the X, Y, and Z directions at the base node), while simple support constraints are applied at the tops of the other piers (restricting displacements in the X and Y directions at the base node). Vehicle loads were applied as concentrated forces to loading pads, and a fixed contact condition was established between the loading pads and the concrete bridge deck, as shown in Figure 7. For the inner surface of the box-girder web, the most unfavorable loading condition consisted of one vehicle positioned eccentrically on each cantilever flange, based on the “Automobile-Super 20” heavy-vehicle loading standard. For the outer surface of the web, the most unfavorable loading condition consisted of two vehicles positioned side by side and centered transversely, with a transverse vehicle spacing of 1.3 m and a transverse wheel spacing of 1.8 m. The corresponding vehicle load arrangements are illustrated in Figure 8.
Figure 7.
Three-dimensional solid model.
Figure 8.
Vehicle load distribution diagram.
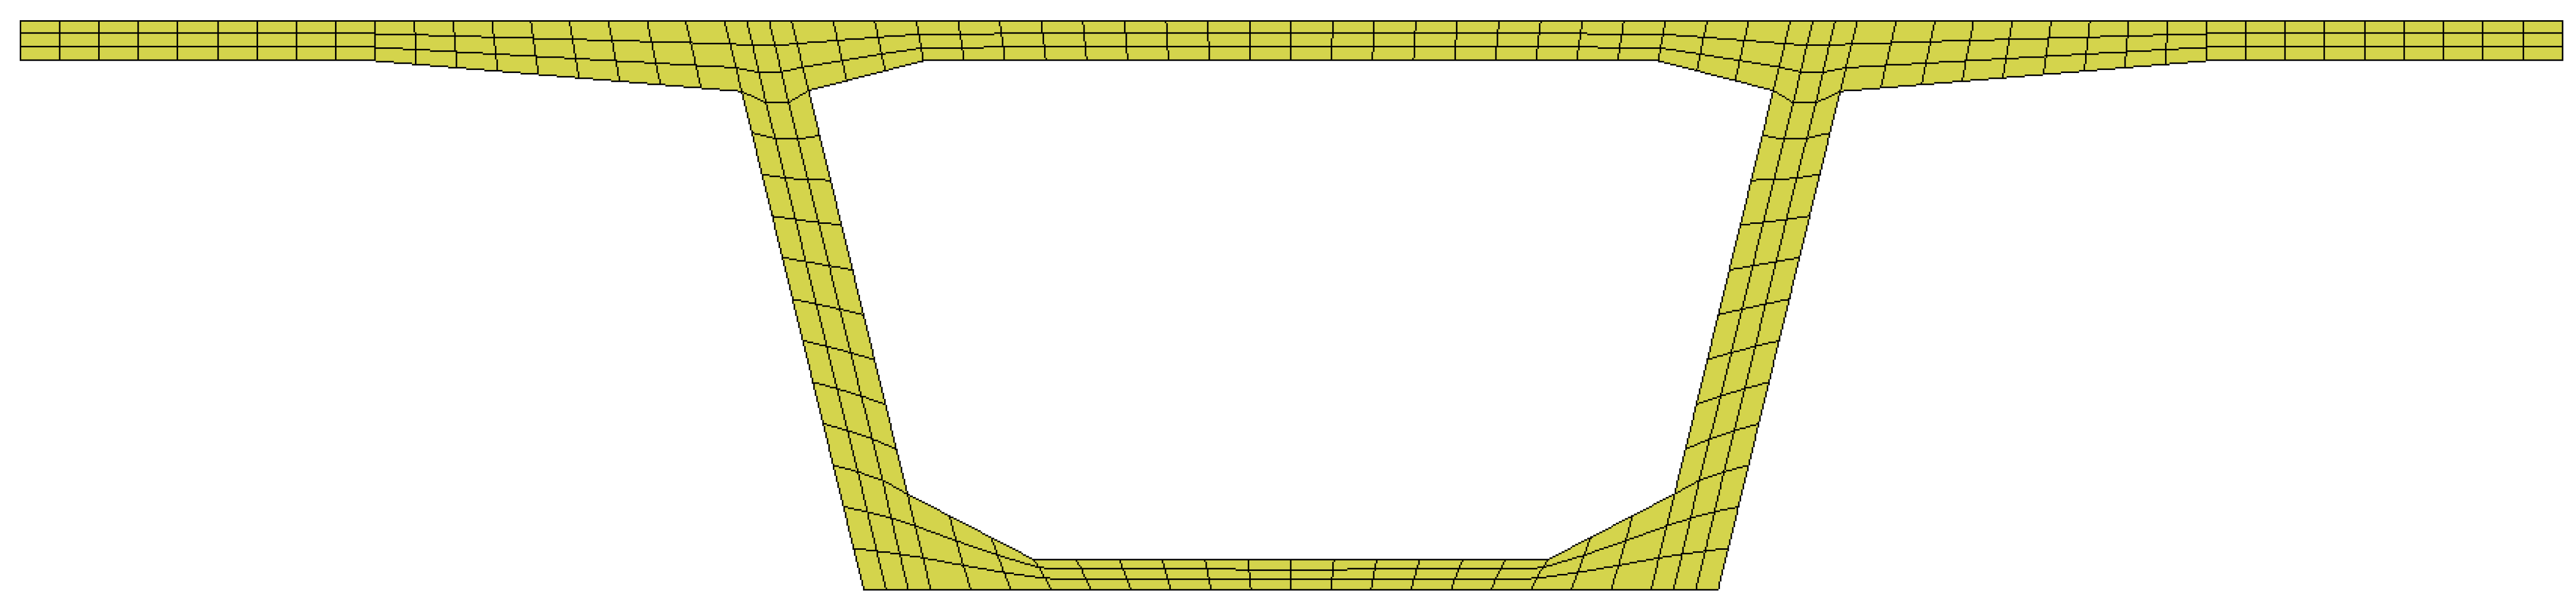
Given that the longitudinal length of the box girder far exceeds its cross-sectional dimensions, the longitudinal deformation of a typical cross-section under relevant thermal loads can be considered effectively constrained; therefore, a plane-strain model is adopted to evaluate the thermal stress distribution within the cross-section, as shown in Figure 9. The temperature field was modeled by imposing a 5 °C temperature differential between the interior and exterior surfaces of the girder [22].
Figure 9.
Plane strain model.
3.2. Longitudinal Force Analysis
During long-term service, the investigated bridge has experienced prestress loss, reduced structural stiffness, and increased traffic loading. In addition, the impact factors and temperature-gradient provisions specified in the original design codes were not fully representative of the actual structural conditions. Consequently, analyses based on the original design parameters can no longer accurately characterize the current stress state of the bridge. Therefore, the longitudinal analysis incorporated the temperature gradients specified in the current design codes and the impact factors obtained from field measurements, while the model parameters were adjusted to account for the observed structural defects. This approach enables the numerical model to more realistically reproduce the in-service condition of the bridge and provides a basis for investigating the mechanical mechanisms responsible for cracking in the girder bottom slab. Accordingly, based on the 2016 adaptability assessment report, the measured fundamental frequency was 0.93 times the theoretical value, indicating a corresponding reduction in the overall stiffness of the original structure. Therefore, both the concrete and structural stiffnesses were assumed to be reduced by a factor of 0.93. Because the structural dimensions had been largely established during the original design, the stiffness was primarily governed by the material elastic modulus (E), cross-sectional area (A), and moment of inertia (I). Modifying the cross-sectional area would inevitably change the self-weight of the structure; therefore, stiffness degradation was simulated by modifying only the elastic modulus [23]. Accordingly, the finite element model incorporated a reduction solely in the concrete elastic modulus, resulting in a reduced value of 29,839 MPa.
A 2012 visual inspection revealed transverse structural cracks on the soffits of the box girders, located 12–23 m from the mid-span of the 50 m and 45.8 m spans, specifically in Spans 1 and 2 of the left bridge and Span 2 of the right bridge. A 2015 specialized inspection further showed that the compliance rate for concrete cover thickness near the internal web construction joints was 60% in Spans 2–4 of the left bridge and 36.68% in Spans 2–4 of the right bridge. Together with the load test results, these findings indicate significant structural deficiencies and inadequate load-bearing capacity. Accordingly, an investigation was conducted into the causes of the transverse cracks in the mid-span bottom slabs, considering structural deficiencies, live-load impact factors, live-load influence correction factors, nonlinear temperature effects, and long-term prestress losses in the original structural tendons. The load cases adopted for the prestress-loss analysis are summarized in Table 5.
Table 5.
Prestress loss condition.
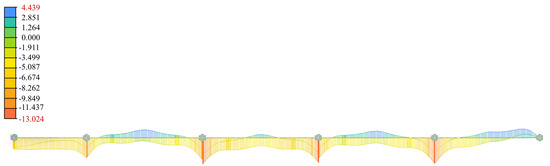
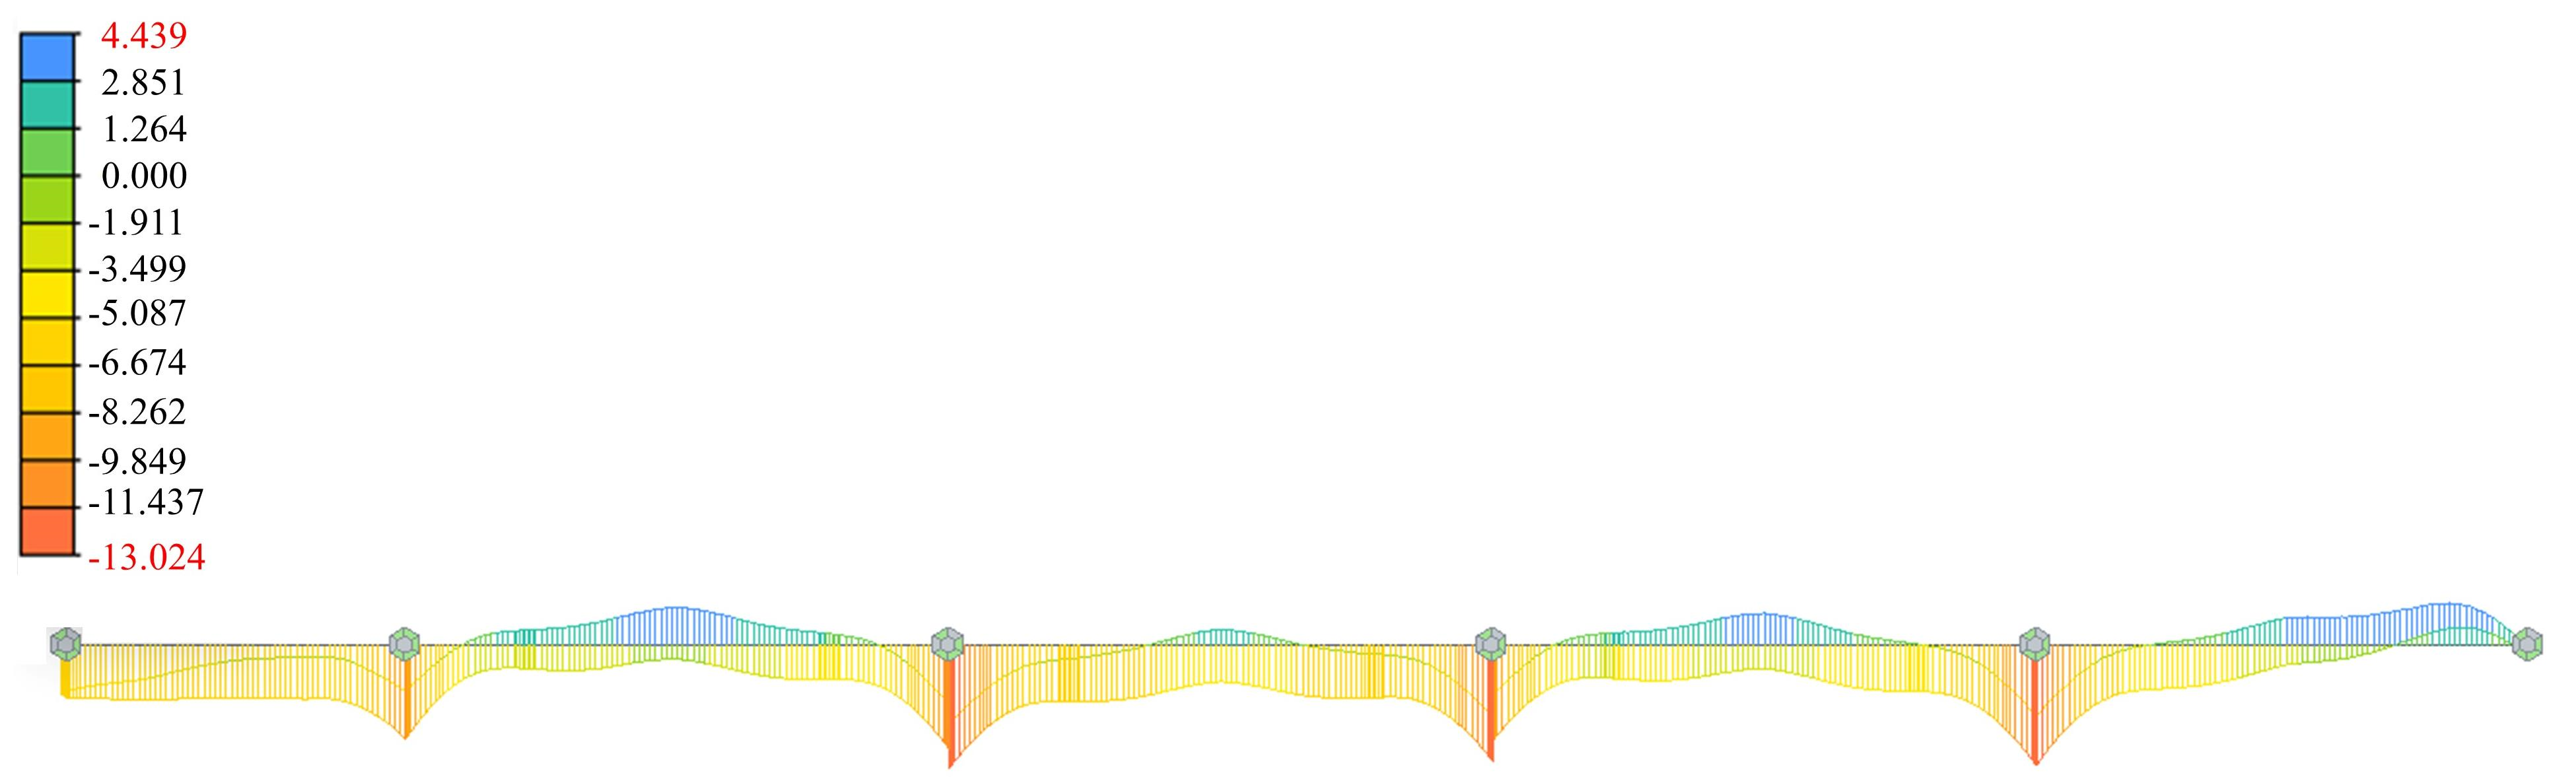
Based on a preliminary analysis conducted in accordance with the General Specifications for Design of Highway Bridges and Culverts (JTG D60-2015), the tensile stresses at the bottom edge of the mid-span section of the 50 m span under different loading conditions are presented in Table 6. Preliminary calculations indicate that for the 50 m and 45.8 m spans, assuming permanent prestress losses of 10% in the web tendons and 5% in the top and bottom tendons, the zones where the normal stress at the bottom edge of the mid-span section exceeds the code’s upper limit align closely with the areas of transverse cracking at the bottom of the girder observed during visual inspection, as shown in Figure 10. The calculated maximum normal stresses at the bottom edge of the mid-span section are 4.0 MPa for the 50 m span and 4.4 MPa for the 45.8 m span, respectively. Moreover, the maximum principal tensile stress at a section located from h/2 the support reaches 3.37 MPa, exceeding the design tensile strength of C50 concrete. This result is consistent with the observed distribution of diagonal cracks in the webs. Considering the systematic distribution of longitudinal web cracks, it is inferred that the diagonal web cracking was primarily associated with excessive vertical tensile stress in the webs. In summary, after accounting for the live load impact factor, live load modification factor, non-linear temperature effects, and assumed prestress losses, the tensile stress at the bottom edge of the mid-span section and the principal tensile stress at the supports both exceeded the limits specified in relevant codes. These stress distributions align with the observed locations of inclined web cracks, suggesting that the combined effect of the aforementioned factors may be a contributing cause of the main girder cracking. For subsequent strengthening calculations, the aforementioned prestress loss assumptions are treated as analysis cases rather than precise estimates of actual prestress losses.
Table 6.
Stress at the bottom edge of the mid-span section under various operating conditions (MPa).
Figure 10.
Finite element tensile stress distribution cloud diagram (unit: MPa).
However, this study assesses cracking by comparing calculated elastic tensile stresses with the concrete’s tensile strength—thereby identifying zones prone to cracking and explaining the observed crack distribution—but it does not directly simulate the initiation or propagation of cracks. Consequently, the calculated tensile stress distribution serves as an indicator of potential cracking zones rather than a direct prediction of crack development.
3.3. Lateral Force Analysis
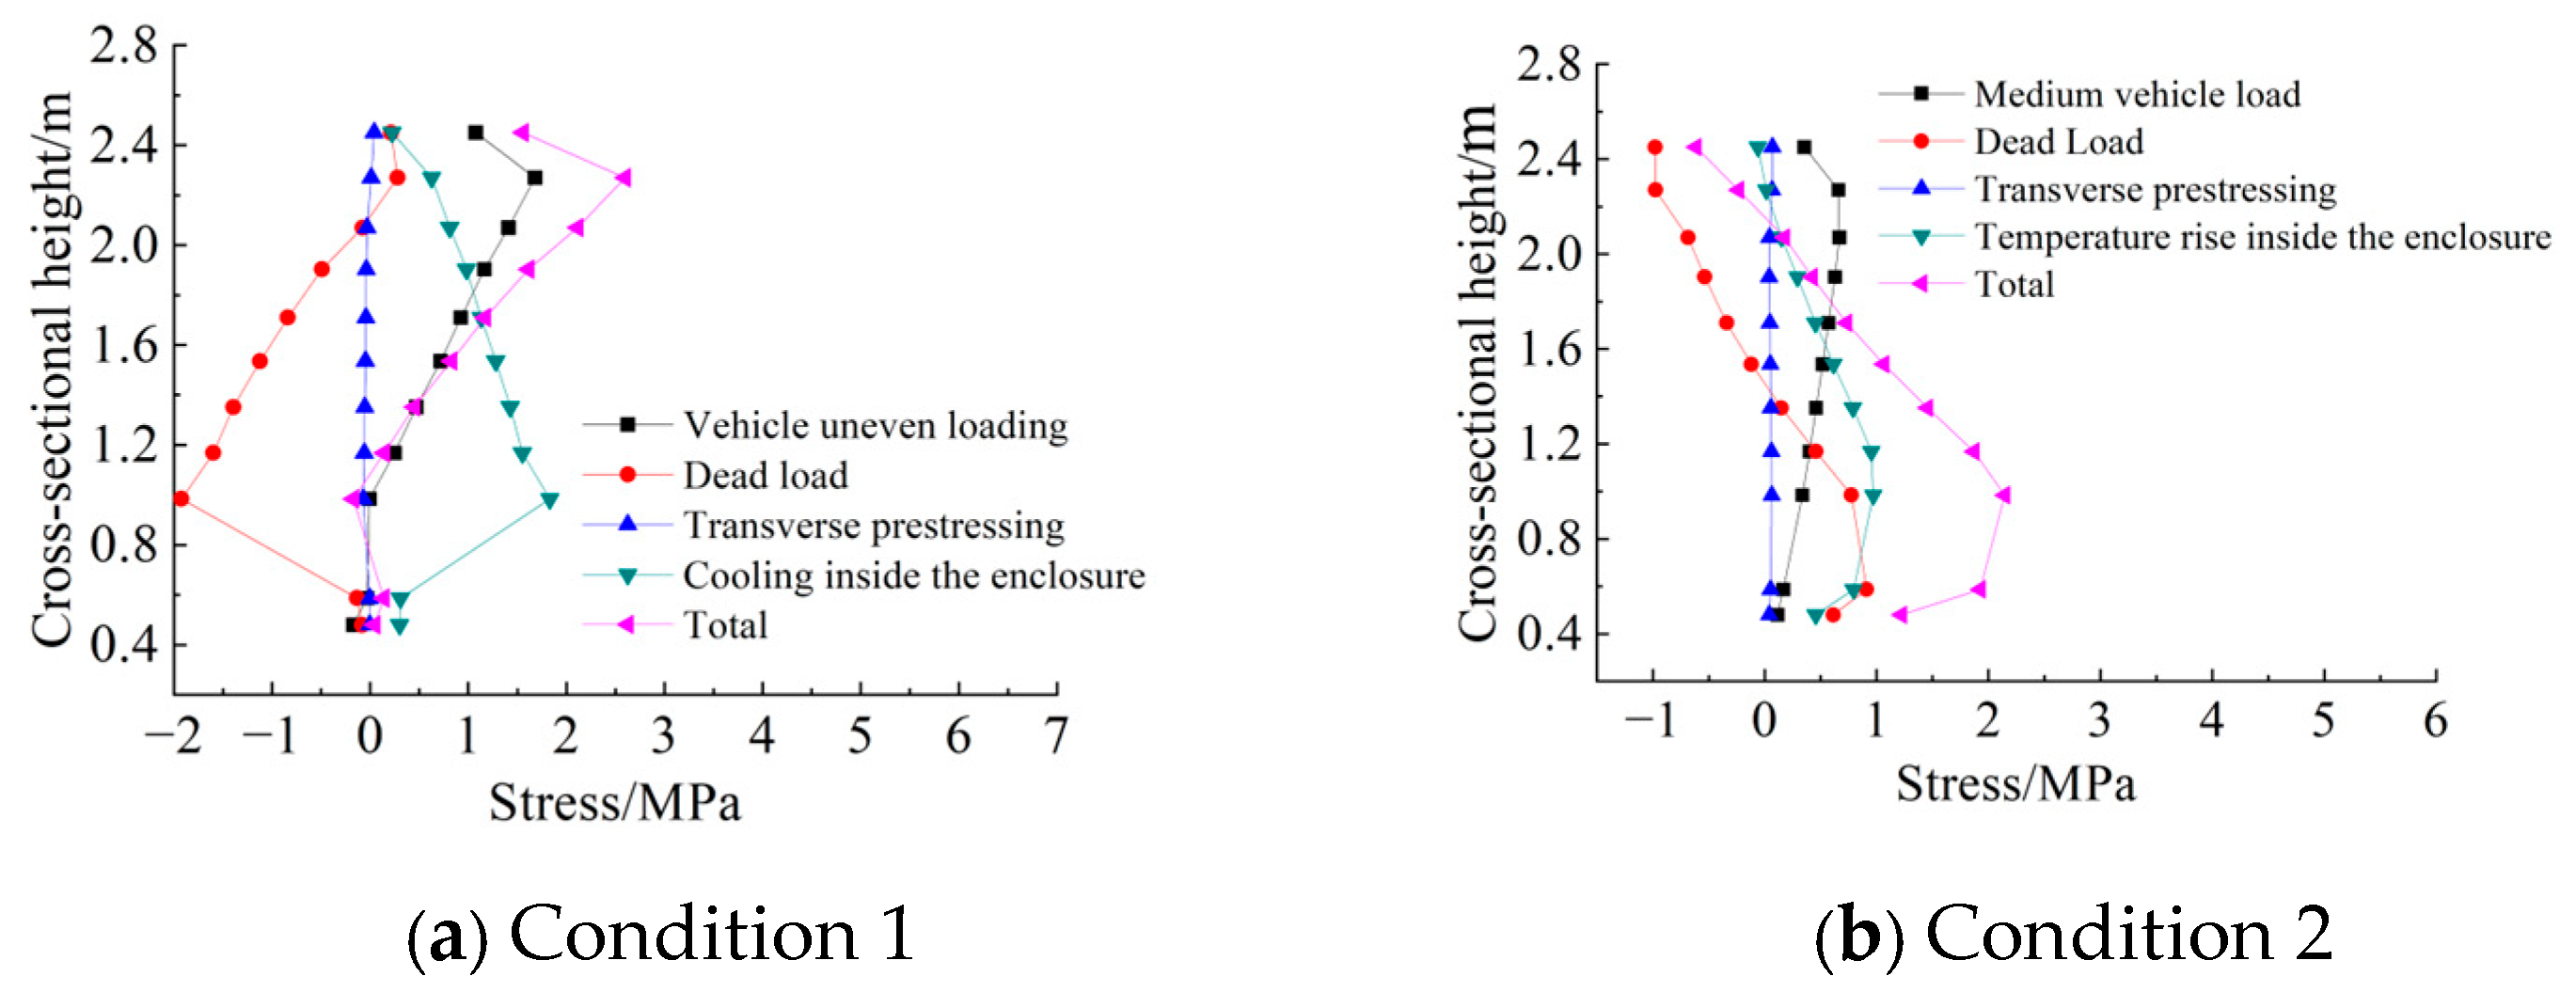
The transverse analysis focuses primarily on the mechanism of web cracking. Because the webs of box girders with long cantilever flanges and thin webs are subjected to substantial shear forces and transverse bending moments, significant local tensile stresses may develop under vehicle loading. Therefore, a solid finite element model was employed to investigate the vertical stresses on the inner and outer web surfaces and to clarify the contributions of different loading factors to web cracking. The transverse structural analysis was conducted under the most unfavorable loading conditions for the inner and outer web surfaces. Load Case 1 represents the most unfavorable condition for the inner web surface, with the following load combination: 1.0 Dead Load + 1.0 Transverse Prestressing + 1.0 Eccentric Vehicle Load + 1.0 Temperature Drop of 5 °C inside the box girder. Load Case 2 represents the most unfavorable condition for the outer web surface, with the following load combination: 1.0 Dead Load + 1.0 Transverse Prestressing + 1.0 Centered Vehicle Load + 1.0 Temperature Rise of 5 °C inside the box girder.
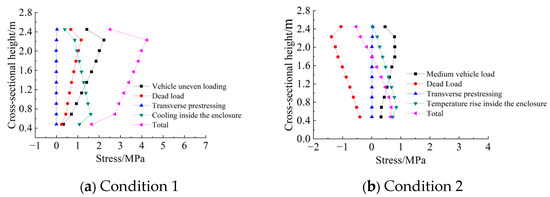
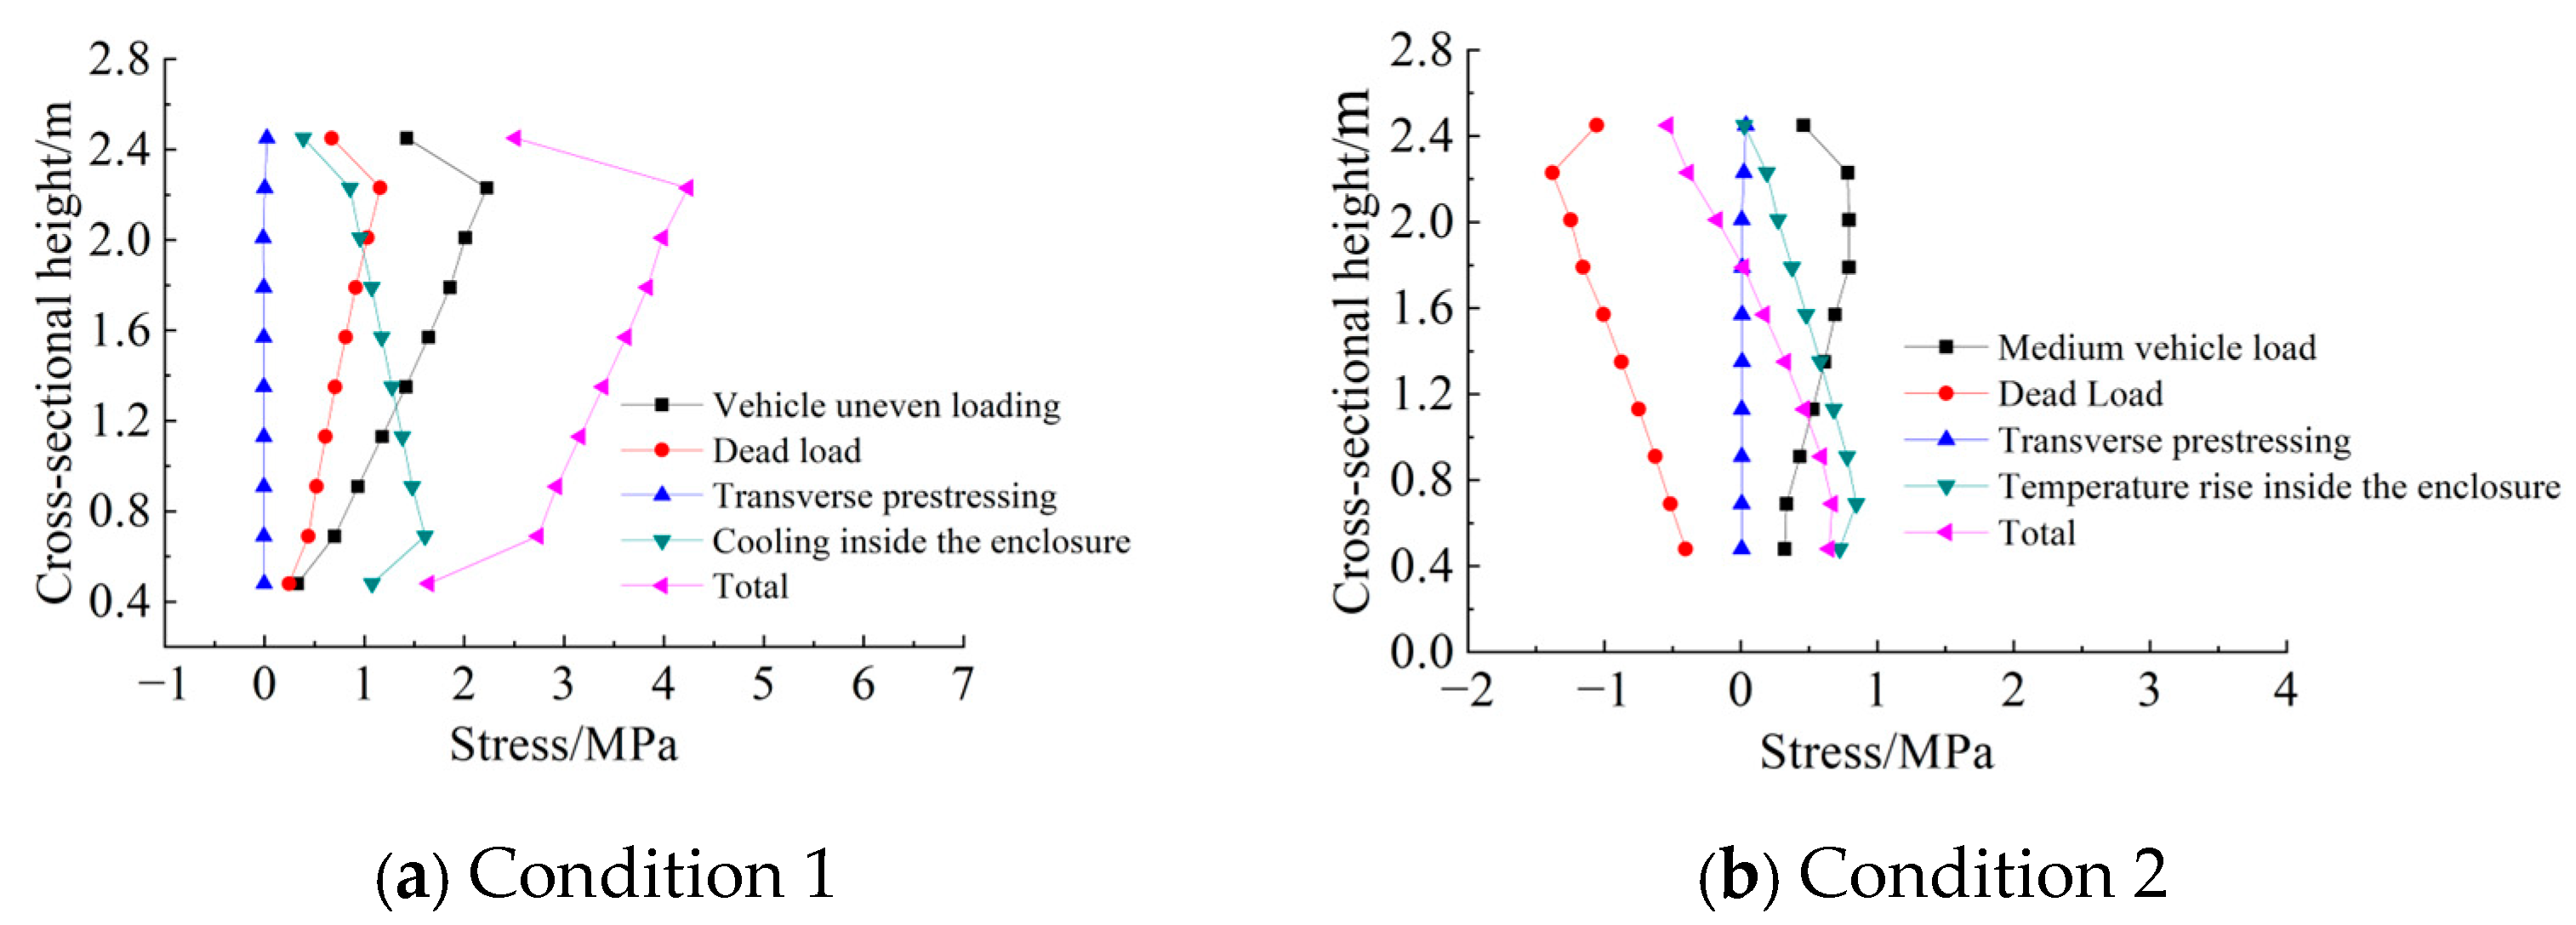
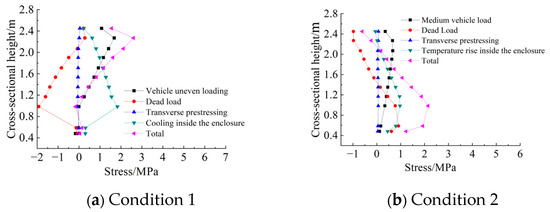
Figure 11 illustrates the distribution of vertical tensile stress along the web height at the mid-span section under various loading conditions. As shown in Figure 11a, the vertical stress on the inner surface of the web at mid-span is predominantly tensile and exhibits a pronounced nonuniform distribution along the web height. The vertical tensile stress induced by eccentric vehicle loading is substantial, reaching a maximum of 2.23 MPa at a section height of 2.23 m, and represents the primary contributor to the vertical stress state of the web. The stresses induced by dead load are also predominantly tensile, with a maximum value of 1.16 MPa, whereas the effect of transverse prestressing is relatively minor. In addition, the 5 °C temperature drop inside the box girder generates additional tensile stress, with a maximum value of 1.61 MPa. Under the combined action of the four load components, the maximum vertical tensile stress occurs at a section height of approximately 2.23 m, reaching 4.24 MPa, which substantially exceeds the code-specified limit of 2.65 MPa.
Figure 11.
Vertical stress distribution inside and outside the web of mid-span section.
As shown in Figure 11b, the vertical stresses induced by the various load components are substantially lower on the outer surface of the web. The maximum tensile stress induced by the medium-vehicle load is approximately 0.79 MPa. Transverse prestressing primarily induces tensile stress but has a relatively minor effect, whereas the dead load mainly induces compressive stress, with a maximum value of −1.38 MPa. When a 5 °C temperature rise inside the box girder is considered, none of the resulting combined stresses exceed the code-specified limits, with the maximum tensile stress reaching only 0.67 MPa. These results indicate that there is no significant risk of vertical cracking on the outer surface of the web at mid-span.
Figure 12 illustrates the distribution of vertical stress on the inner and outer web surfaces at a section located h/2 from the support. As shown in Figure 12a, the vertical stress on the inner web surface is generally lower than that at mid-span. The maximum tensile stress induced by eccentric vehicle loading is 1.68 MPa, whereas the dead load induces compressive stress over most of the section, with a maximum value of −1.92 MPa. Transverse prestressing also induces compressive stress, although its effect is relatively minor. The maximum combined vertical stress is 2.60 MPa, which remains below the code-specified limit of 2.65 MPa. Therefore, based solely on the vertical normal stress, no significant exceedance of the code limit is observed in the web near the support.
Figure 12.
Vertical stress distribution inside and outside the web of h/2 section from the fulcrum.
However, owing to the high shear forces in the region near the support, the stress state of the web is strongly influenced by shear stress. Principal stress analysis indicates that the maximum principal tensile stress at the section located h/2 from the support reaches 3.37 MPa, substantially exceeding the code-specified limit and indicating a significant risk of diagonal cracking in this region. As shown in Figure 12b, the vertical tensile stress induced by vehicle live loads on the outer web surface at the h/2 section is relatively small, whereas the dead load generates substantial compressive stress. The resulting maximum combined vertical stress is 2.15 MPa, which remains below the allowable limit for vertical tensile stress. Consequently, cracking near the support is primarily attributed to the combined effects of shear stress and vertical stress rather than to vertical tensile stress alone.
Based on the above analysis, vehicular live load is the primary factor governing variations in vertical stress within the web, and the resulting stress trends are generally consistent with the distribution of the combined stress. Dead load and thermal effects further modify the local stress state. Specifically, a temperature drop inside the box girder increases the vertical tensile stress on the inner web surface, whereas a temperature rise has a more pronounced effect on the stress state of the outer web surface. In the mid-span region, where vertical tensile stress is the governing factor, cracks are predominantly horizontal. In contrast, near the supports, the substantial increase in shear stress causes the principal tensile stress to exceed the code-specified limit, resulting in a transition from horizontal to inclined cracking. The inclination angle increases toward the supports, ultimately producing a crack pattern with inclination angles ranging from 0° to 45°.
4. Analysis of the Combined Strengthening Effect of Web Section Enlargement and Internal Prestressing
4.1. Strengthening Methods
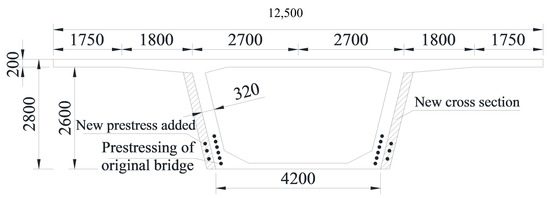
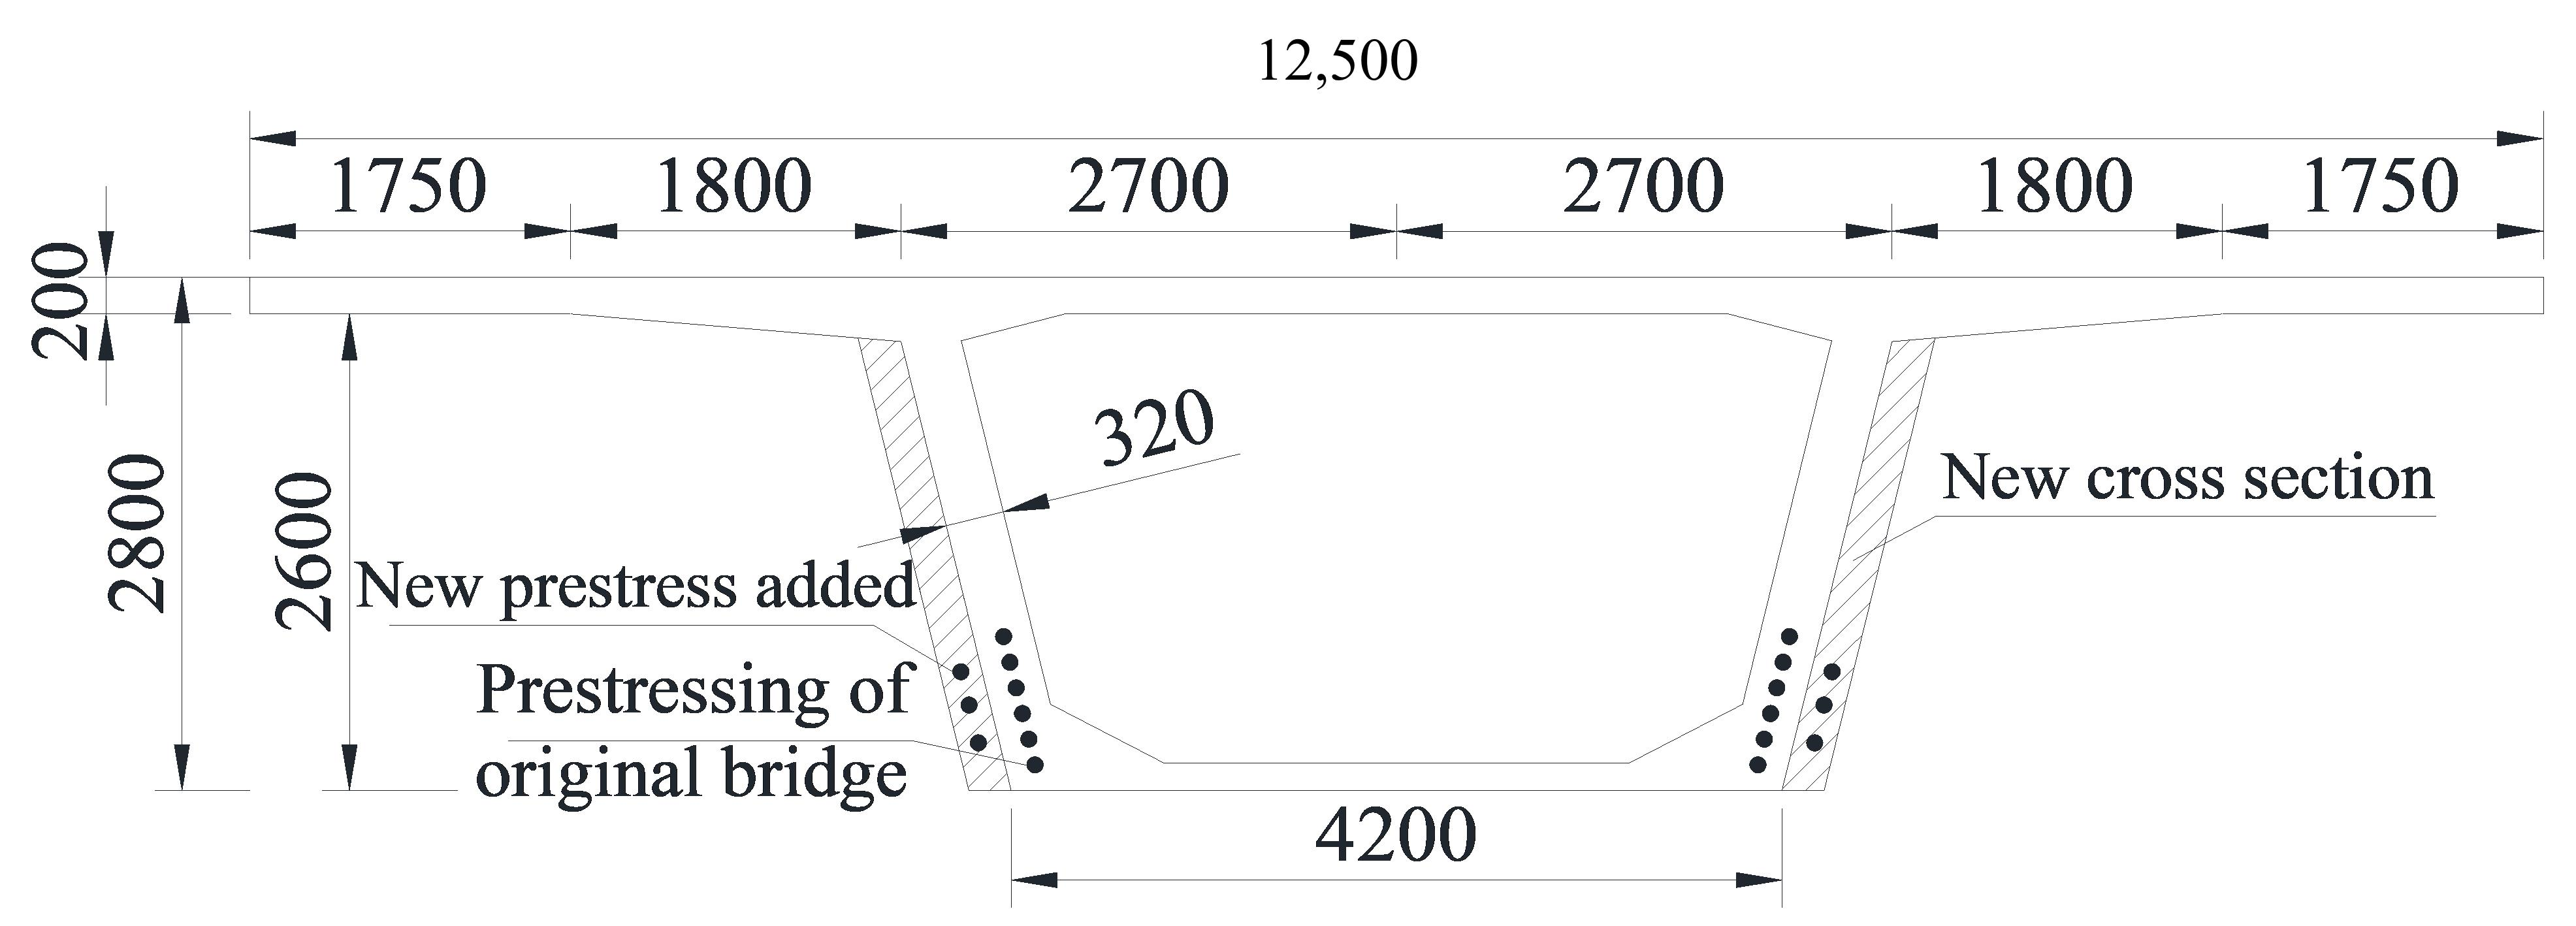
Common strengthening methods for bridge superstructures include section enlargement, external prestressing, bonded steel plates, and bonded prestressed carbon-fiber-reinforced polymer (CFRP) plates, as summarized in Table 7. Although these methods are generally designed to address specific types of structural deterioration, the bridge under investigation exhibits severe and diverse defects resulting from multiple interacting factors. Therefore, no single strengthening method can adequately address all of the identified deficiencies, necessitating a comprehensive and integrated strengthening strategy. Accordingly, the proposed strengthening scheme combines passive and active strengthening techniques to enhance the flexural and torsional stiffness of the box girder, improve the transverse integrity of its cross-section, optimize the structural stress state, and increase the flexural and shear load-carrying capacities of the bridge. On this basis, a composite strengthening method combining web section enlargement with internal prestressing is proposed. Specifically, internal prestressing tendons are installed within the newly added web concrete while the web thickness is simultaneously increased. The outer surfaces of the box-girder webs are thickened by 18 cm along the full length of the bridge, with the anchorage zones locally thickened by 50 cm. The outer faces of the box-girder webs are thickened by 18 cm along the full length of the bridge, with an additional 50 cm of thickness provided in the anchorage zones. Within the thickened web sections, six continuous tendon groups, each comprising 15 strands of 15.2 mm diameter (15Φs15.2), are installed. The material properties were determined in accordance with the relevant specifications, including a characteristic tensile strength of 1860 MPa, an elastic modulus of 1.95 × 10⁵ MPa, and a linear thermal expansion coefficient of 1.2 × 10⁻⁵ (1/°C). The added concrete is C55 self-compacting concrete, with material properties determined in accordance with the relevant standards, including an elastic modulus of 35.5 GPa, a Poisson’s ratio of 0.2, a unit weight of 26 kN/m3, a characteristic tensile strength of 2.74 MPa, and a linear thermal expansion coefficient of 1.0 × 10⁻⁵ (1/°C). The strengthening configuration is shown in Figure 13.
Table 7.
Characteristics of common strengthening methods.
Figure 13.
Combined strengthening diagram (unit: mm).
4.2. Comparison of Structural Performance Before and After Strengthening
To determine the thickness of the strengthened web, the reinforcement layout including the diameters of the longitudinal and transverse reinforcement bars, the concrete cover thickness, and the diameter of the prestressing ducts must first be established in accordance with the relevant strengthening specifications. Specifically, the diameter of the longitudinal reinforcement is set to 12 mm, the stirrup diameter to 8 mm, the concrete cover thickness to 25 mm based on the bridge’s environmental exposure category, and the prestressing duct diameter to 90 mm. Accordingly, the minimum required thickness of the strengthened web is calculated as tmin = 90 + 2 × (12 + 8 + 25) = 180 mm.
The purpose of introducing internal prestressing is to counteract the internal forces induced by the additional self-weight resulting from section enlargement, as well as those generated by a portion of the external loads, thereby improving the mechanical performance of the box girder. First, based on the actual loading conditions after strengthening and in accordance with the relevant provisions of Standard [24], the design values of the internal force combinations at the critical mid-span section were calculated for an assumed web thickening of 180 mm, considering both the ultimate limit state and the serviceability limit state. The results are presented in Table 8. Subsequently, the required amount of prestressing steel was determined based on the geometric properties of the gross strengthened cross-section. For a web thickening of 180 mm, the gross cross-sectional area is 6.16 × 106 mm2, the distance from the centroid to the bottom edge is 1793.4 mm, and the section modulus is 3.55 × 109 mm3. Based on these section properties, the required effective internal prestressing force was calculated as 1.32 × 10⁷ N. The prestressing system adopts Φs15.2 strands, each with a nominal cross-sectional area of Ap1 = 139 mm2 and a characteristic tensile strength of fpk = 1860 MPa. The tensioning control stress was set to σcon = 0.75, fpk = 1395 MPa in according to regulations, and the prestress loss was conservatively assumed to be 20% of the control stress. Based on the requirements for cracking resistance at the normal section, the calculated number of steel strands required for the cross-section is rounded up to 90; thus, six prestressing tendon groups are required, with a total cross-sectional area of Ap = 90 × 139 = 12,510 mm2.
Table 8.
Load internal force calculation results (unit: kN·m).
To investigate the effects of web enlargement and additional internal prestressing on the structural behavior of the existing bridge, a frame-element finite element model of the strengthened bridge was developed based on the finite element damage model described in Section 3.1. The added concrete is C55 self-compacting concrete, and the strengthened web sections were modeled using the “dual-element method,” in which elements representing the existing bridge and the newly added concrete are generated between the same nodes and assigned different material properties. This approach enables the newly added concrete elements to be activated at the corresponding construction stages. By avoiding the explicit definition of interfaces between the existing bridge and the added concrete, the dual-element method simplifies model construction and improves computational efficiency.
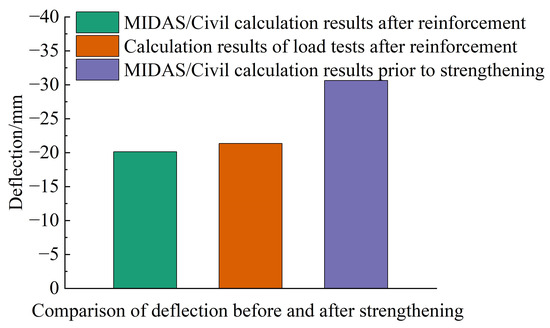
Table 9 compares the longitudinal structural behavior of the box girder before and after strengthening. The strengthening measures significantly improved the longitudinal structural performance of the box girder. The cross-sectional stress under the serviceability limit state and the flexural bearing capacity under the persistent design situation were evaluated in accordance with the relevant provisions of the Specifications for Design of Highway Reinforced Concrete and Prestressed Concrete Bridges and Culverts (JTG 3362-2018) [24]. Under the serviceability limit state, the stress at the top edge over the support decreased from 2.53 MPa before strengthening to 0.41 MPa after strengthening, while the stress at the bottom edge at mid-span decreased from 4.40 MPa to 1.74 MPa. After strengthening, the stress levels at the top and bottom edges of the section are significantly reduced, and the structural stress state is effectively improved. The flexural safety factor at the support increased from 0.95 to 1.05 (a 10.5% increase), while the mid-span flexural load-bearing capacity rose from 63,308.1 kN·m to 83,003.95 kN·m, with the safety factor increasing from 0.90 to 1.18 (a 31.1% increase). The shear safety factor at the support increased from 0.78 to 1.10, corresponding to a 41.0% increase, demonstrating that the increased web thickness substantially improved the shear capacity reserve of the section. Following strengthening, the mid-span deflection of the box girder decreased from 30.63 mm to 20.13 mm, a reduction of approximately 34.28%, further confirming the improvement in overall structural stiffness.
Table 9.
Summary of longitudinal calculation results.
In the table, the flexural safety factor is the ratio of the ultimate flexural capacity of the member’s normal section to the calculated bending moment at the section; the shear safety factor is the ratio of the ultimate shear capacity of the member’s inclined section to the calculated shear force at the section.
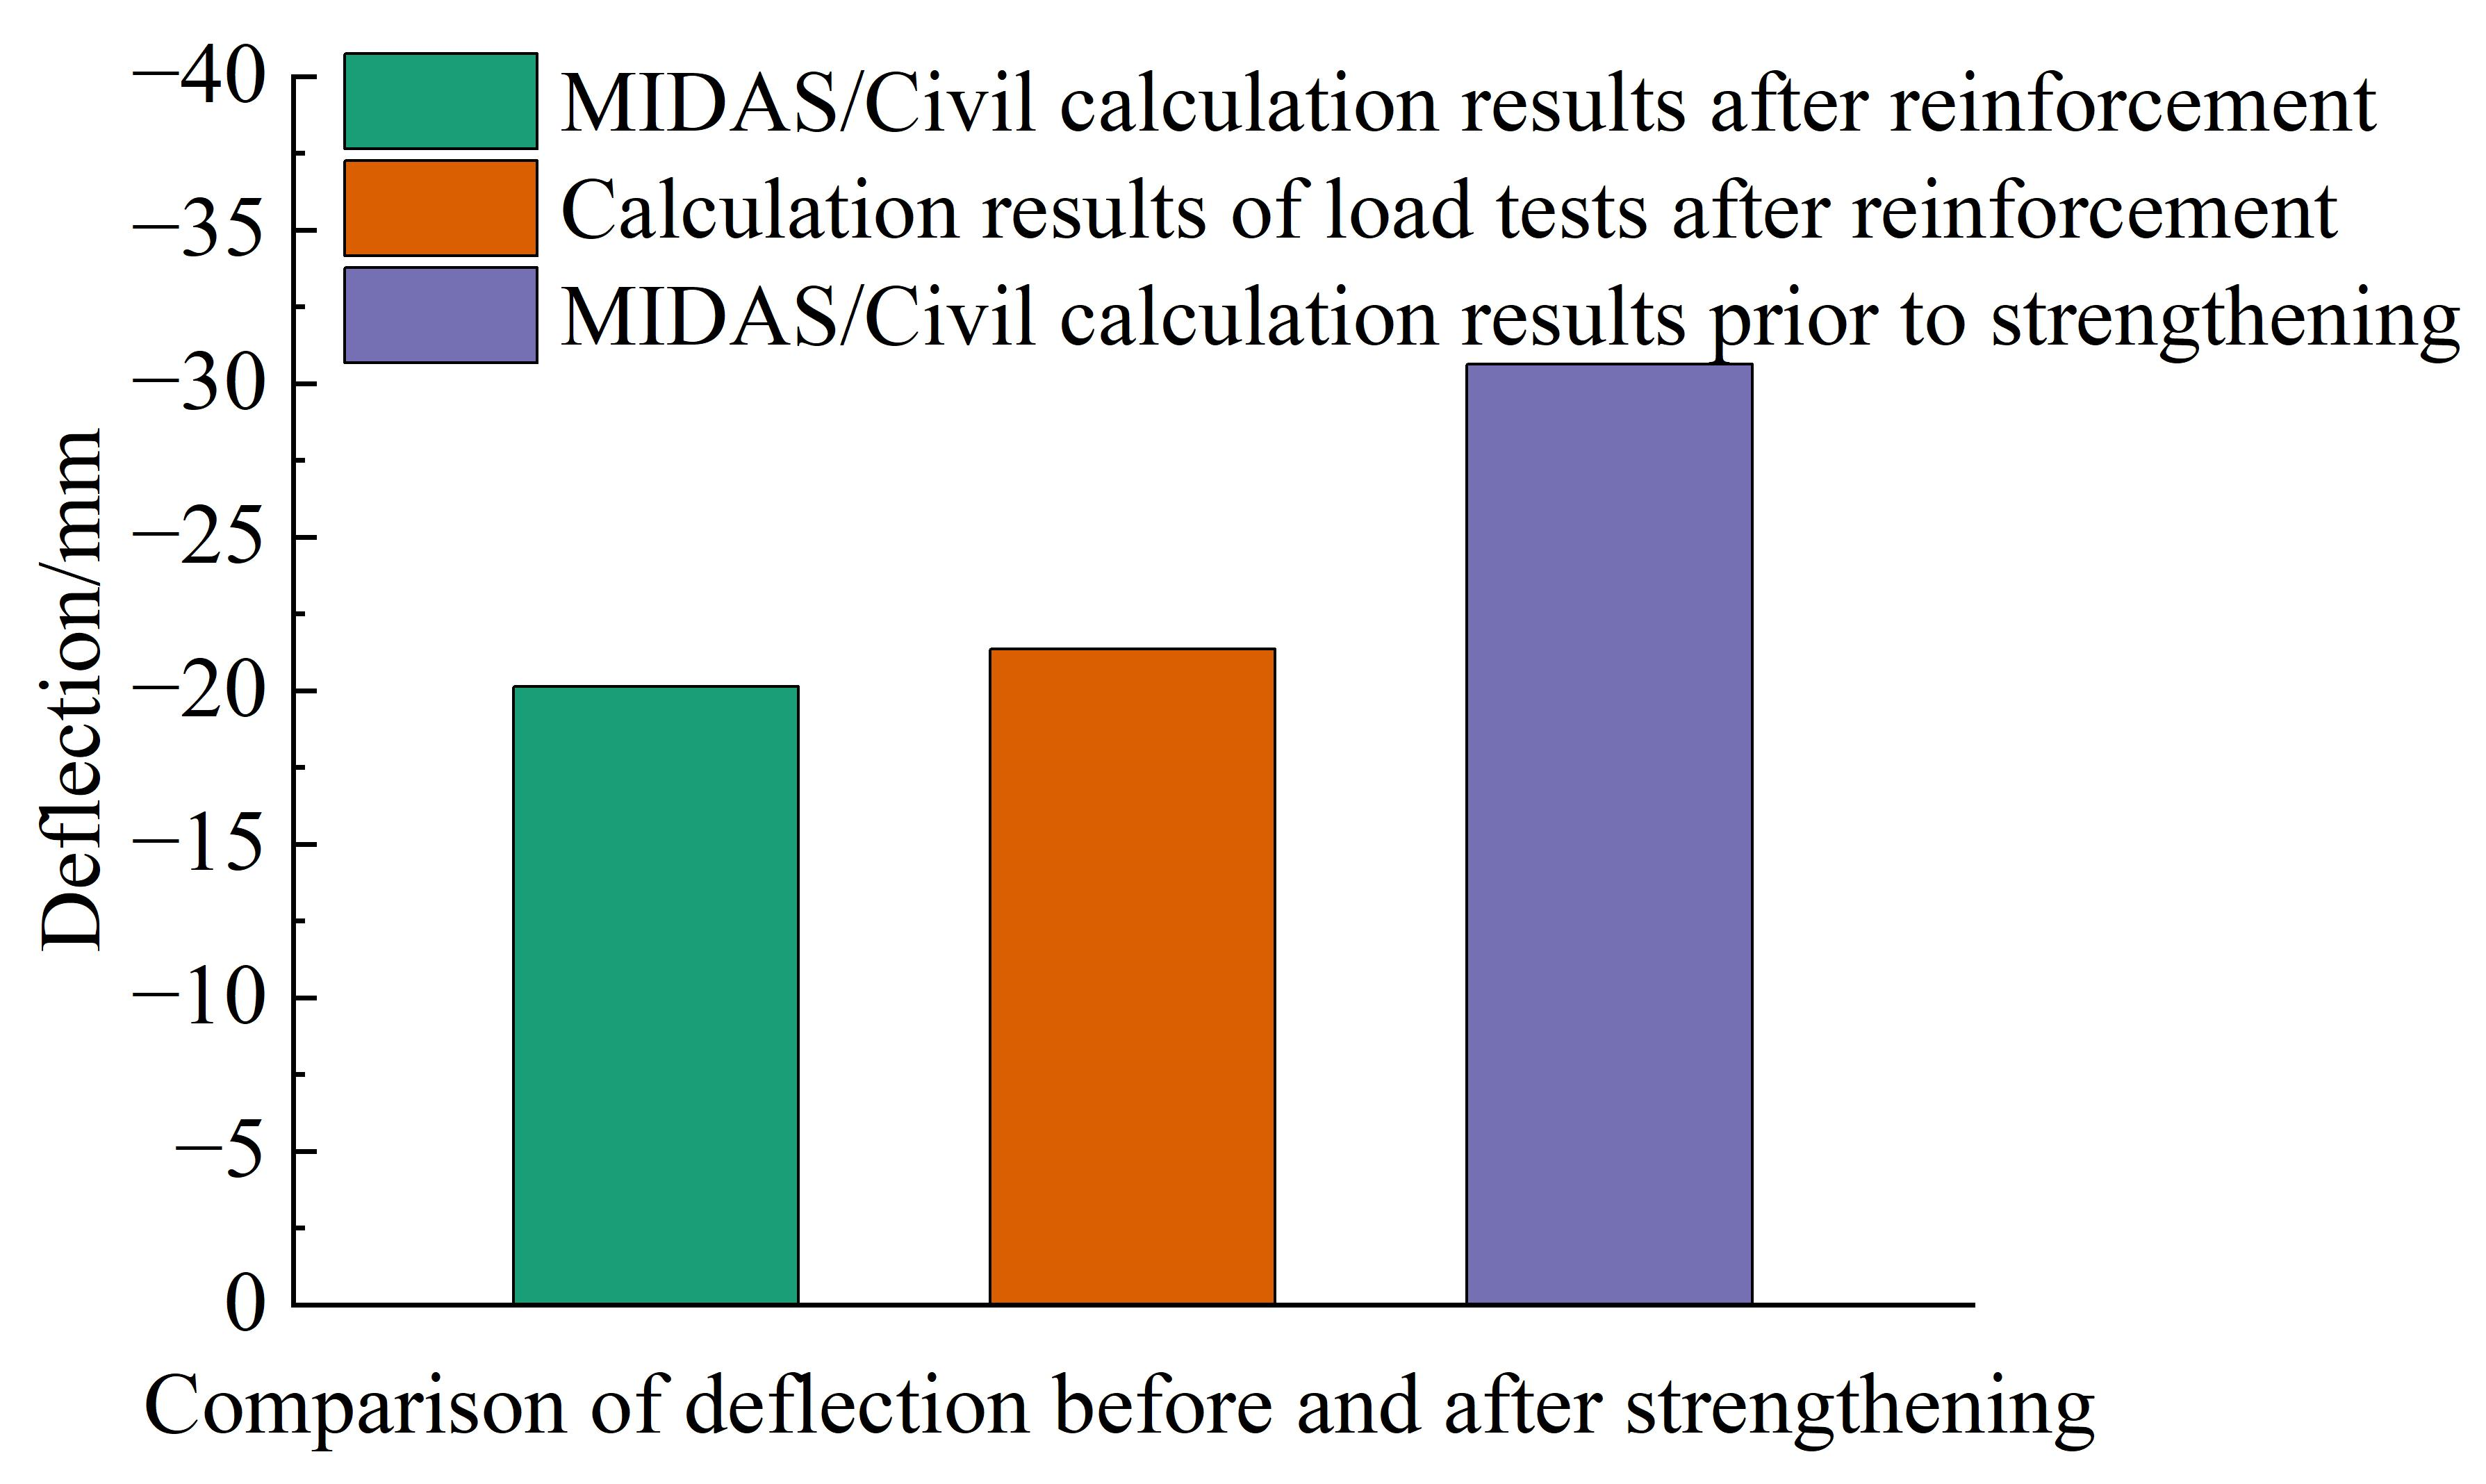
Figure 14 compares the deflection at the critical cross-section before and after strengthening. Finite element analysis indicates that the mid-span deflection of the original structure under the short-term load combination at the service stage is 27.3 mm. After strengthening, the calculated mid-span deflection decreases to 20.6 mm, corresponding to a reduction of 24.54%, thereby satisfying the code requirements for the deflection of Class A prestressed concrete members. Considering long-term effects, the long-term deflection growth coefficient (ηθ) of the strengthened main girder is calculated as 1.425 using linear interpolation, resulting in a long-term deflection of 28.69 mm, which also satisfies the corresponding code requirements for Class A prestressed concrete members.
Figure 14.
Comparison of deflection results.
Table 10 presents the changes in principal tensile stress and vertical tensile stress at critical sections before and after strengthening. Finite element analysis indicates that, at the cross-section located (h/2) from the support, the maximum principal tensile stress in the web decreased from 3.37 MPa before strengthening to 2.01 MPa after strengthening, corresponding to a reduction of 40.4%. The vertical tensile stress at the same section decreased from 1.41 MPa to 0.64 MPa, representing a reduction of approximately 54.6%. At the mid-span cross-section, the vertical tensile stress decreased from 4.03 MPa to 2.52 MPa, corresponding to a reduction of approximately 37.5%. Nevertheless, the self-weight of the added concrete and the longitudinal prestressing introduced during construction caused slight increases in vertical tensile stress at certain sections. Under Load Case 2, for example, the vertical tensile stress increased from 0.41 MPa to 0.46 MPa at the section located at h/2 from the support and from 0.65 MPa to 0.96 MPa at the mid-span section. Both values remained within the code-specified limits. Overall, web thickening primarily reduces the tensile stress response of the web under vehicle loading and enhances the shear performance of the box girder, while the additional stresses induced by the added concrete and longitudinal prestressing remain relatively small and do not adversely affect the overall structural safety margin.
Table 10.
Comparison of web stress before and after strengthening (unit: MPa).
4.3. Analysis of Interface Loss in Strengthening Systems
In the global finite element model of the strengthened bridge, the existing and added concrete are connected using a dual-element approach with shared nodes, thereby assuming no relative slip at the interface and idealized composite action when evaluating the overall structural response. In contrast, the refined interface model explicitly incorporates bond–slip behavior and allows relative displacement between the existing and added concrete. This model is used to investigate the influence of interface deformability on interface stress-transfer efficiency. The two models serve complementary purposes: the global model evaluates the overall structural response under a perfect-bond assumption, whereas the refined interface model examines local interface behavior based on the adopted bond–slip relationship.
Because the additional prestressing tendons are embedded in the newly added concrete outside the webs of the original box girder, the prestressing force must be transferred through the interface between the new and existing concrete before reaching the original structure. In this composite strengthening system, interface deformability may therefore result in prestress-transfer losses. Accordingly, the interface bond model is employed to quantify the influence of interface slip on prestress transfer, rather than to reproduce the idealized fully composite behavior assumed in the global model.
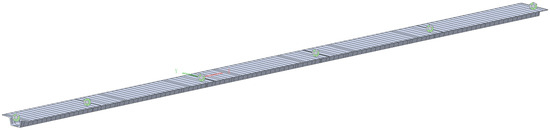
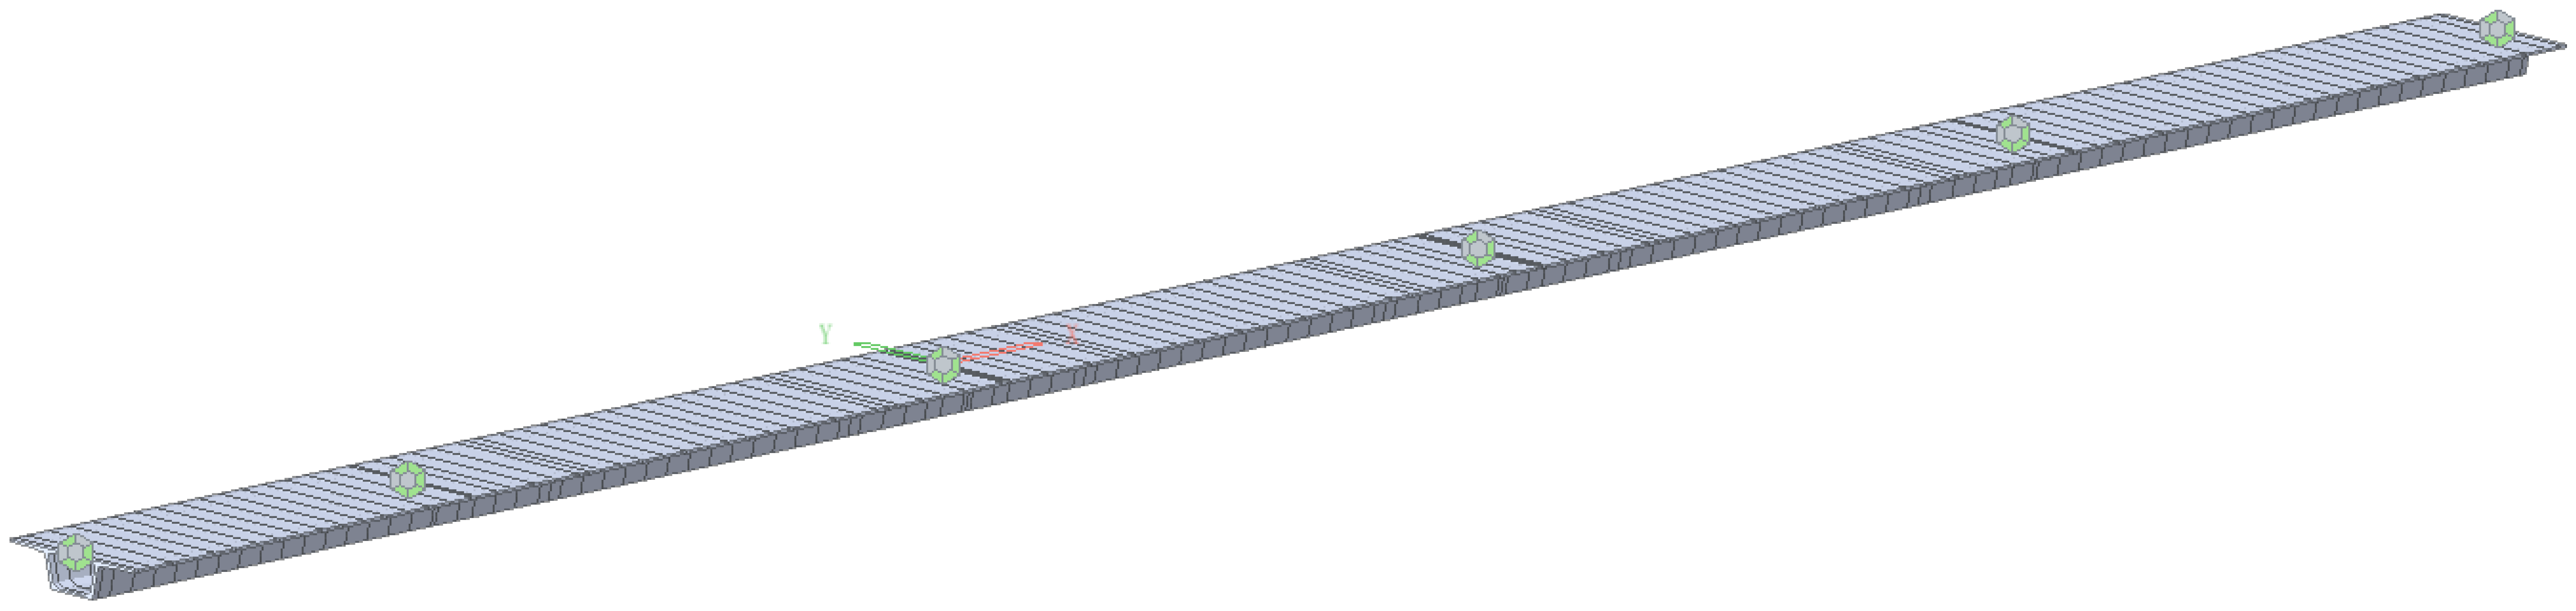
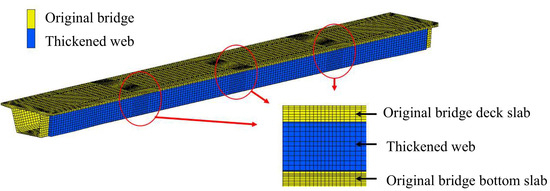
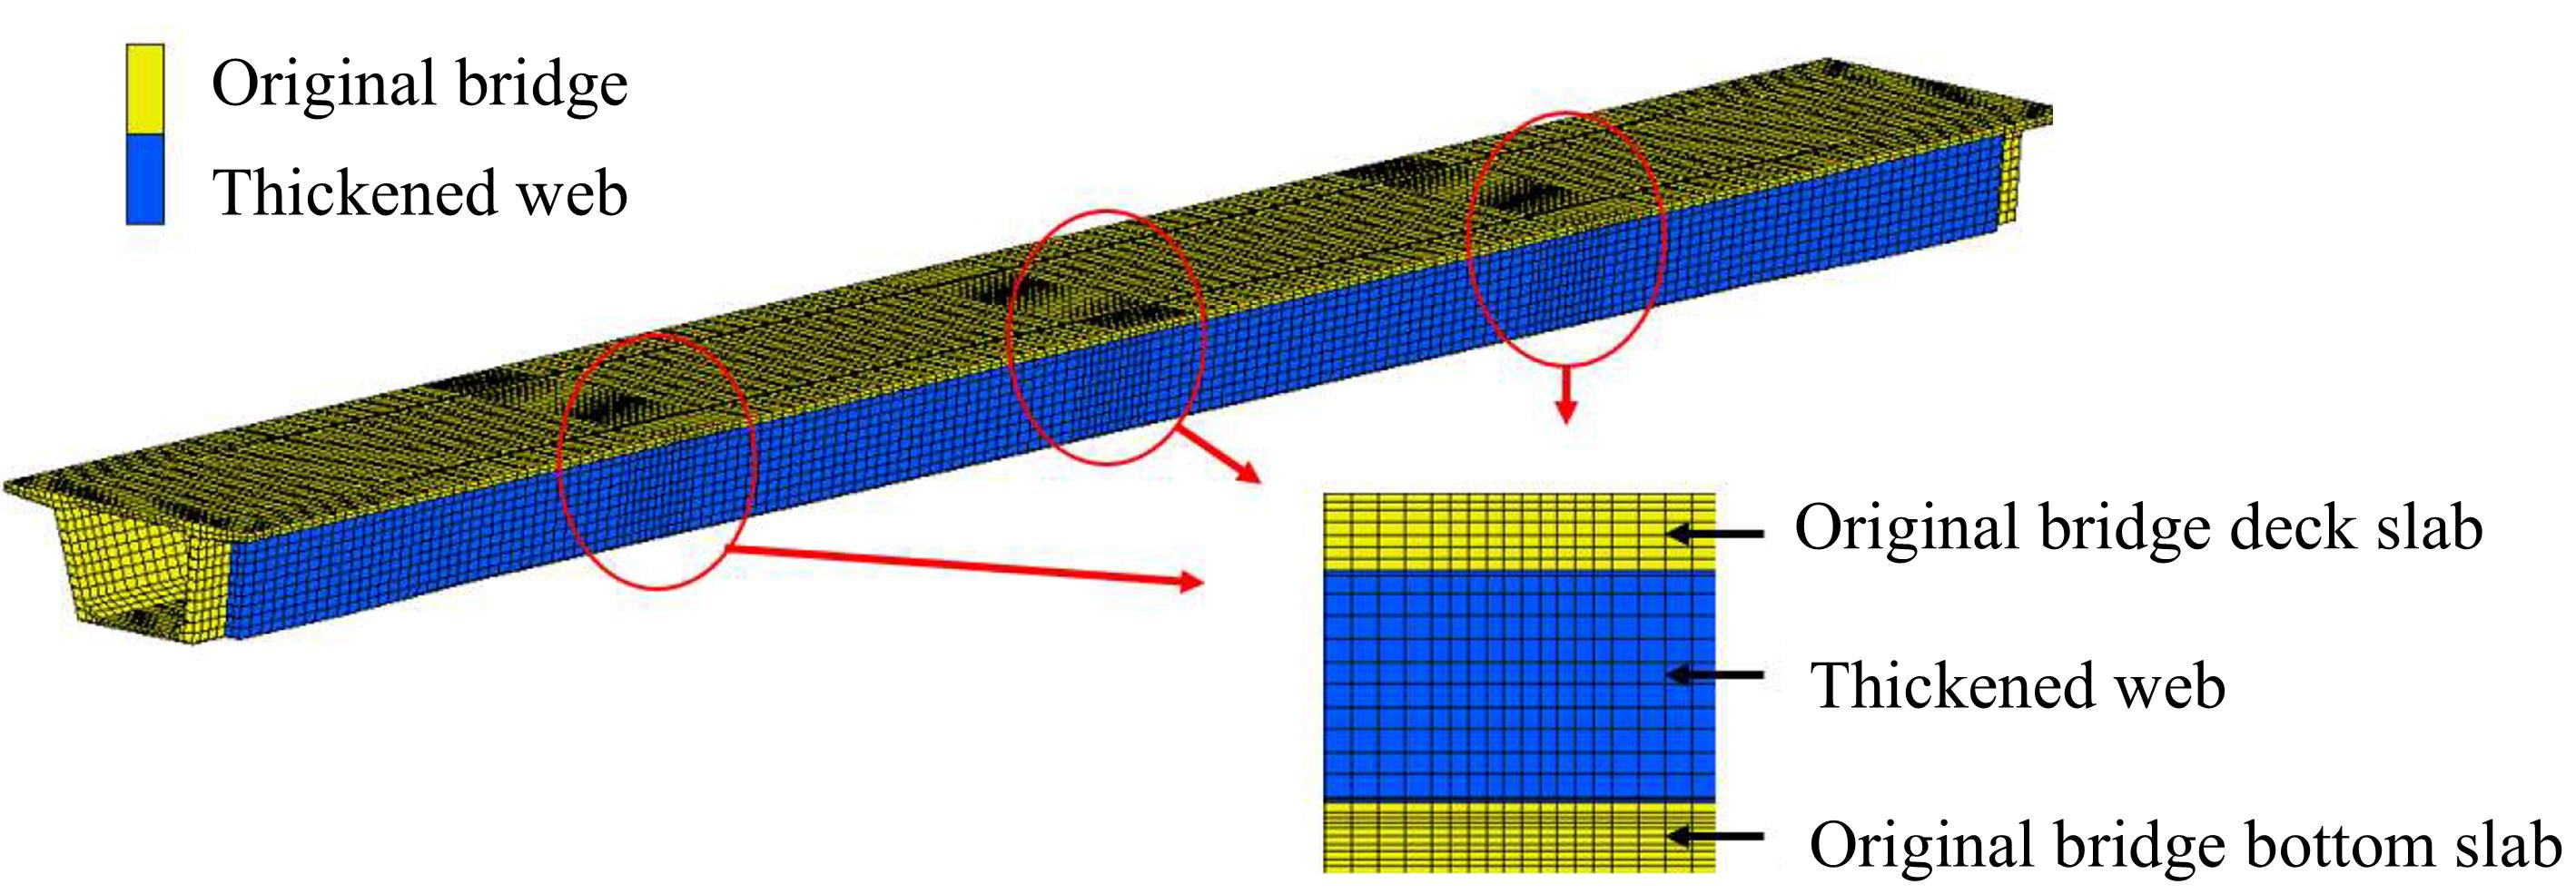
A nonlinear solid finite element model of the strengthened box-girder bridge was developed using MSC.MARC. Preliminary analyses indicated that the interface stress-transfer efficiency reduction at the new–existing concrete interface was minimally affected by the tendon transfer length. Therefore, to reduce the computational effort, only the 50 m main span of the box girder was modeled. A mesh size of 100 mm was adopted within 1 m on either side of three critical cross-sections located at one-quarter, one-half, and three-quarters of the span, while a coarser mesh size of 250 mm was used elsewhere. The model comprised 28,534 elements in total, including 20,700 elements representing the original bridge structure and 7720 elements representing the added web sections, as shown in Figure 15.
Figure 15.
Schematic diagram of finite element model after strengthening.
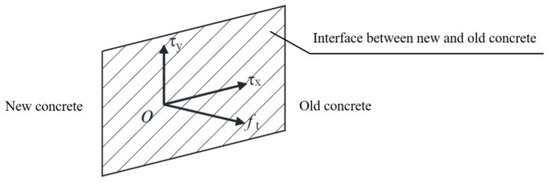
In MSC.MARC, the interface between new and existing concrete can be modeled using interface elements, spring elements, or specific contact definitions. The available contact types include “Standard” and “Bonded,” with the latter further comprising the “Standard” and “Adhered” options. The “Standard” option rigidly constrains the relative motion between the two deformable bodies, whereas the “Adhered” option allows bond–slip behavior to be defined through a contact stress table. Accordingly, the contact stress table available in MSC.MARC is adopted in this study to simulate the interface between the new and existing concrete. The interfacial bond strength is characterized according to the directions of the forces acting on the interface, including the normal tensile strength (ft) perpendicular to the interface and the shear strengths (τx and τy) in the two tangential directions, as illustrated in Figure 16.
Figure 16.
Bond strength direction of bonding surface.
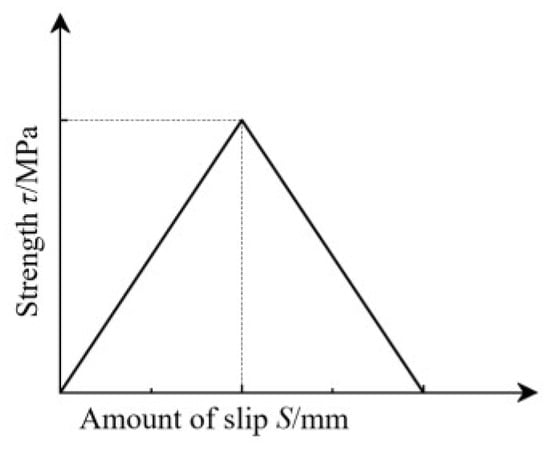
According to Reference [25], the bond–slip relationship between the new concrete (added to enlarge the cross-section of the box-girder web) and the original concrete can be modeled using a bilinear model, as shown in Figure 17. The horizontal axis represents the relative slip between the new and old concrete, the vertical axis represents the stress generated by the interaction between them, and the slope of the curve represents the bond–slip stiffness.
Figure 17.
Double broken line model.
The normal axial tensile strength at the interface between new and old concrete can be taken as 70% of the axial tensile strength of the weaker concrete [25], as shown in Equation (2).
ft = 0.7ftk = 0.7 × 2.65 = 1.855 MPa
For the tangential shear strength between new and old concrete, the calculation formula proposed by Chen [26] is adopted, as shown in Equation (3).
In this equation, α1 and α2 represent the concrete strength coefficient and the interface bonding agent coefficient, respectively, with values of 0.42 and 1.34; ρᵥ represents the planted reinforcement ratio; fy represents the design tensile strength of the shear reinforcement, taken as 330 MPa; and τᵥ represents the shear strength of the existing bridge concrete, which can be calculated using Equation (4).
In the formula, fcd is the design value of compressive strength, taken as 22.4 MPa, and ftd is the design value of tensile strength, taken as 1.83 MPa.
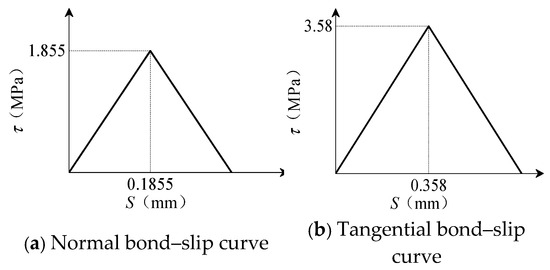
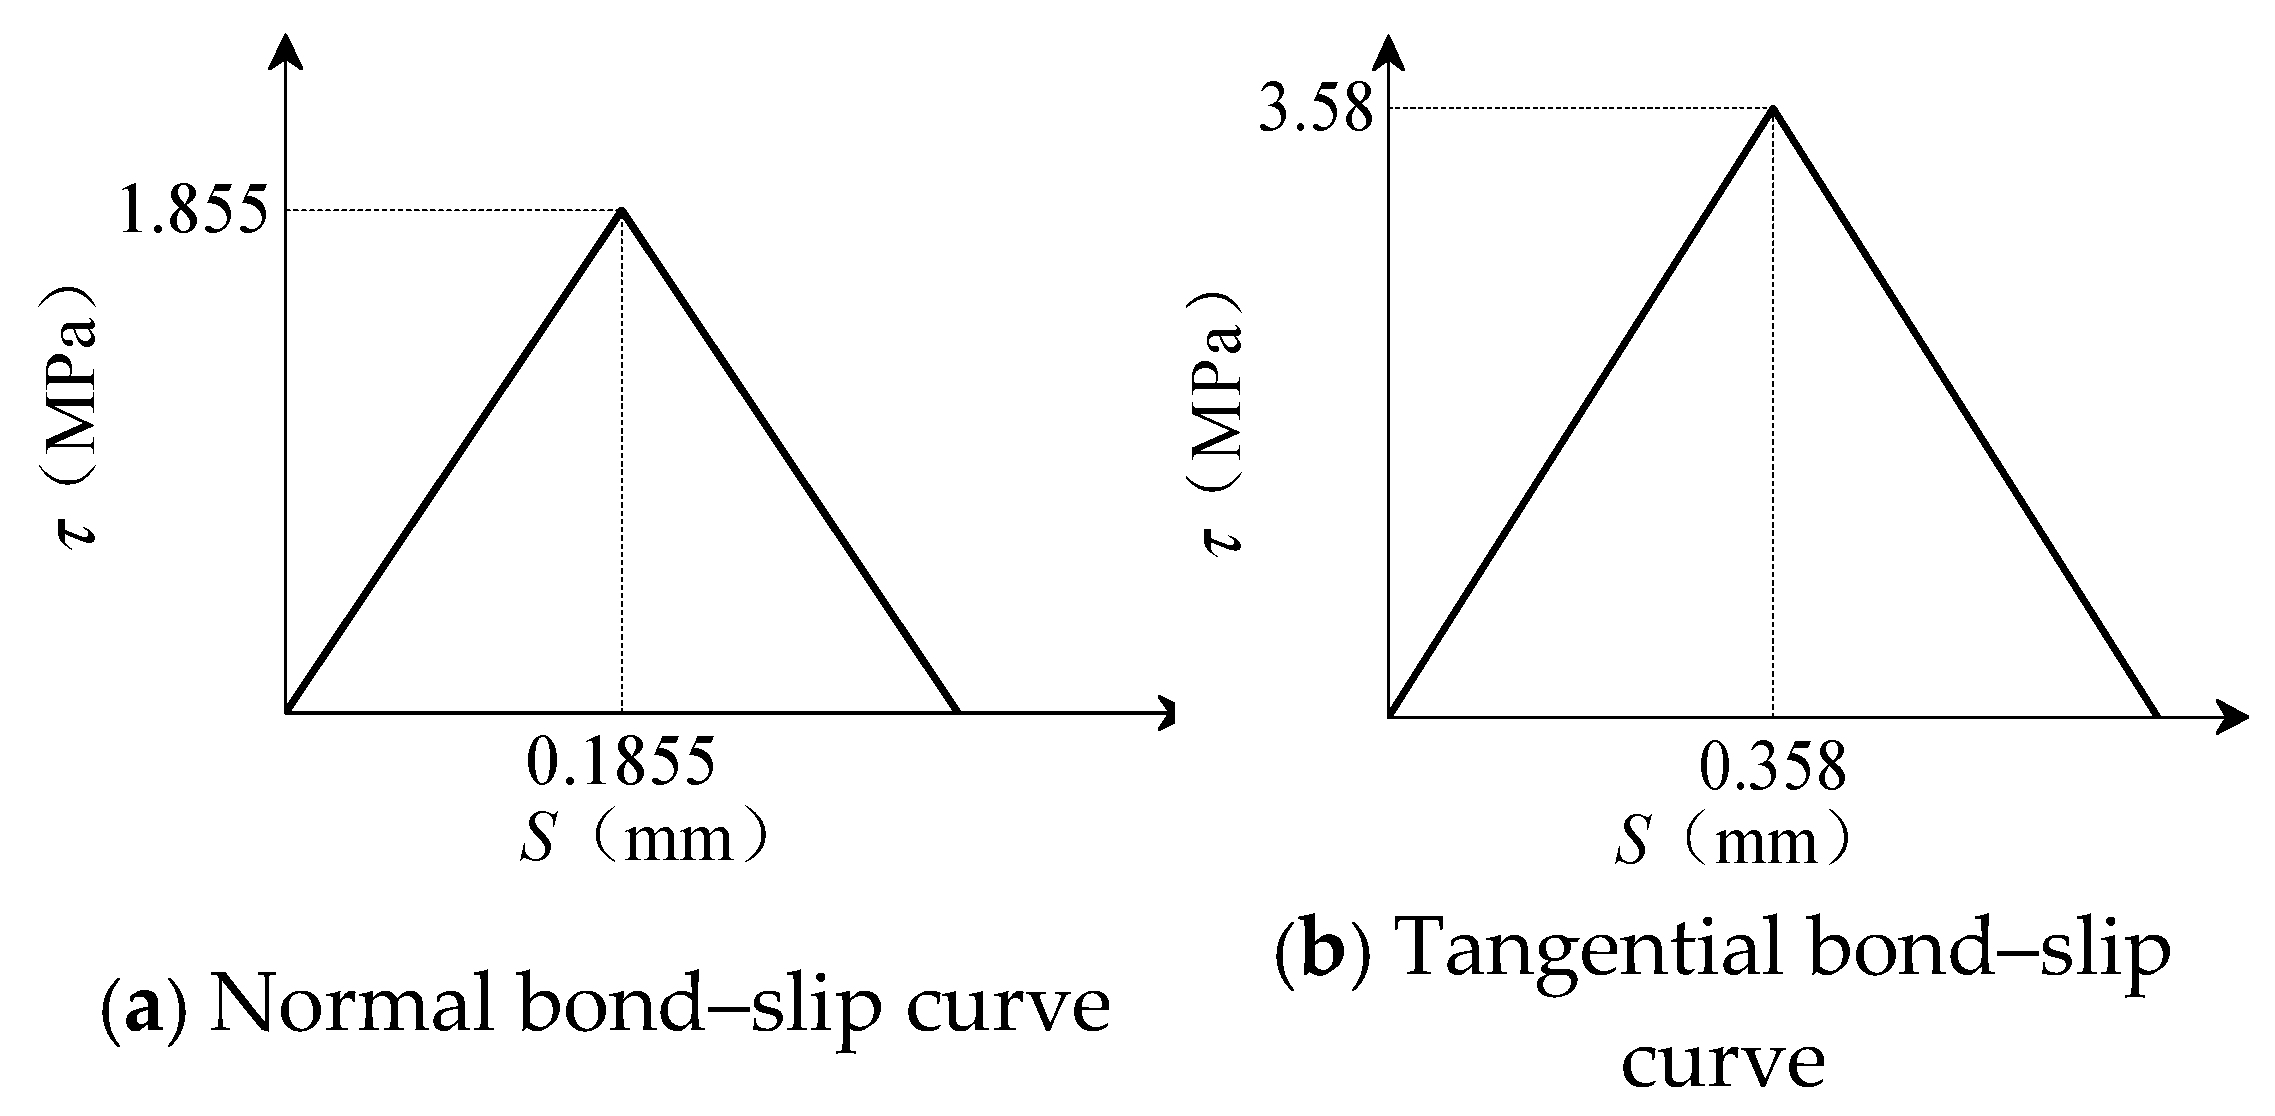
Based on the project design documents, the interface rebar ratio is 0.3%; substituting this into Equations (2)–(4) yields the normal and tangential bond–slip curves shown in Figure 18. For these calculations, the bond–slip stiffness at the interface between the new and old concrete is set at 10 MPa/mm, and the ultimate slip value is taken as twice the slip value corresponding to the peak bond stress [27].
Figure 18.
Normal and tangential bond–slip curves.
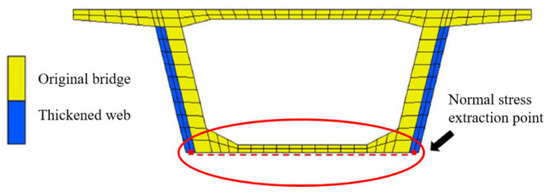
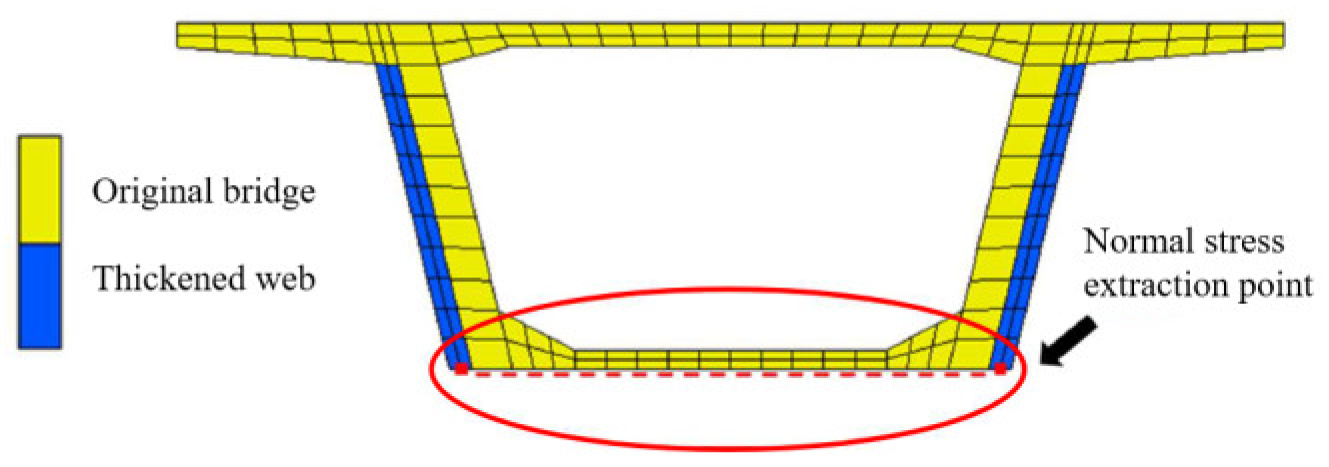
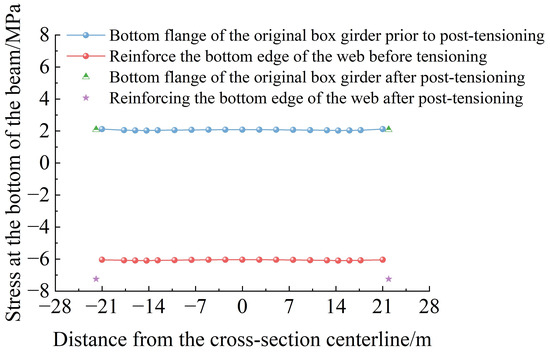
Before the internal prestressing is applied to the newly added web, both the original box girder and the strengthened web are already subjected to normal stresses under dead loads. Therefore, the initial normal stresses are deducted to determine the increment in normal stress induced by the internal prestressing applied to the added web. For simplicity, the changes in normal stress at the bottom edges of the original box girder and the added web before and after tensioning the additional internal prestressing tendons are denoted by Δσold and Δσnew, respectively. An interface stress-transfer efficiency reduction indicator, δ, is defined in Equation (5) to quantify the relative difference between these stress increments. Figure 19 illustrates the locations from which the stresses are extracted.
Figure 19.
Stress extraction position diagram.
For simplicity, the stresses at the bottom edges of the original box girder and the added web, recorded before and after tensioning the internal prestressing tendons in the added concrete section, are presented in Figure 20. Although tensioning the internal prestressing tendons in the added web reduced the stress at the bottom edge of the original box girder at mid-span under dead load, a substantial difference in stress remained between the bottom edges of the original box girder and the added web. Accordingly, the stresses at the bottom edges of the original box girder and the added web at mid-span were extracted under both pre-tensioning and post-tensioning conditions. The interface stress-transfer efficiency reduction in the internal prestressing force transferred across the interface was then calculated using Equation (5), and the results are presented in Table 11. After the additional internal prestressing tendons were tensioned, the stress increment at the bottom edge of the original box girder at mid-span was 8.12 MPa, whereas that at the bottom edge of the added web was 9.32 MPa. Substitution of these values into Equation (5) gives an interface stress-transfer efficiency reduction indicator of 12.87%.
Figure 20.
The change in the stress of the original bridge floor before and after the strengthening of the internal prestress.
Table 11.
Interface stress-transfer efficiency reduction results calculation table.
Therefore, provided that the tensile strength requirements of the prestressing tendons are satisfied, the prestressing jacking control stress specified in the original strengthening design should be increased by 14.8% to ensure the intended strengthening effect. The obtained values are applicable only to the bridge investigated in this paper, the interface model employed, and the specified material and interface parameters.
5. Conclusions
(1) After accounting for structural stiffness reduction, live-load modification, and permanent prestress losses, the calculated regions where the bottom-edge stresses at mid-span exceeded the code limits closely corresponded to the crack distribution observed during on-site inspections. The calculated maximum tensile stresses at the mid-span sections of the main and side spans of the reference bridge reached 4.0 MPa and 4.4 MPa, respectively, while the maximum principal tensile stress at the section located (h/2) from the support reached 3.37 MPa. These results indicate that the existing prestress loss is a significant factor contributing to the reduced crack resistance of the box girder.
(2) Under the combined action of dead load, transverse prestressing, eccentric vehicle load, and temperature variation, finite element analysis indicates that the maximum vertical tensile stress on the inner side of the mid-span web reaches 4.24 MPa. Eccentric vehicle loading contributed a maximum tensile stress of 2.23 MPa. The maximum principal tensile stress at the section located h/2 from the support reached 3.37 MPa, indicating that cracking in the mid-span web is primarily governed by vertical tensile stress, whereas inclined cracking near the supports results from the combined effects of shear and tensile stresses.
(3) Based on an analysis of the causes of cracking in the box girder, a composite strengthening method combining web section enlargement with internal prestressing was proposed. Finite element analysis indicates that following the strengthening of the bridge in the case study, the stress at the top edge above the support decreased from 2.53 MPa to 0.41 MPa, and the stress at the bottom edge at mid-span decreased from 4.40 MPa to 1.74 MPa, representing a reduction of 60.45%. The flexural safety factors increased by 10.5% at the support and 31.1% at mid-span, while the shear safety factor at the support increased by 41.0%. Furthermore, the mid-span deflection decreased from 30.63 mm to 20.13 mm, representing a reduction of 34.28%. The calculation results indicate that the proposed combined strengthening method effectively enhances the load-bearing capacity and overall stiffness of the bridge in the reference project.
(4) Finite element analysis indicates that, after the additional internal web prestressing tendons were tensioned in the reference bridge, the interface stress-transfer efficiency decreased by 12.87%. Therefore, when evaluating the effectiveness of the composite strengthening scheme combining web section enlargement with internal prestressing, the influence of interface stress-transfer efficiency on the actual strengthening performance should be taken into account.
Author Contributions
Conceptualization, J.W. and Q.W.; formal analysis, J.C. and J.H.; writing—original draft preparation, J.W. and J.C.; writing—review and editing, J.H. and X.H.; supervision, Q.W.; validation, J.H. and Y.J. data curation, X.H. and Y.J.; investigation, J.C.; funding acquisition, J.W. and Q.W. All authors have read and agreed to the published version of the manuscript.
Funding
This research was supported by the Natural Science Research Project of Fujian Agriculture Vocational Technical College (ZZXYB12526004); the Horizontal Project of Fujian Agriculture Vocational Technical College (HKS12526014) and the Natural Science Foundation of Fujian Province (Grant No. 2024J01356). These supports are sincerely appreciated.
Data Availability Statement
The data underlying this article will be shared upon reasonable re-quest to Qu Wang (wangqu1989@fzu.edu.cn).
Acknowledgments
We thank the Fujian Provincial Key Laboratory of Multi-Disasters for providing the finite element simulation platform.
Conflicts of Interest
Author Juanjuan Chen is employed by the Xiamen Construction Project Quality and Safety Station. Author Jinlong Huang is employed by the Fuzhou Planning & Design Research Institute Group Co, Ltd. The remaining authors declare that the research was conducted in the absence of any commercial or financial relationships that could be construed as a potential conflict of interest.
References
- Department of Comprehensive Planning; Ministry of Transport. Statistical Communiqué on the Development of the Transportation Industry in 2025; Ministry of Transport of China: Beijing, China, 2026. (In Chinese)
- Liu, C.; Xu, D. Influence of Cracking on Deflections of Concrete Box Girder Bridges. Balt. J. Road Bridge Eng. 2012, 7, 104–111. [Google Scholar] [CrossRef] [Scilit]
- Zeng, Q.X.; Han, D.J. A Review of Crack Prevention in Prestressed Concrete Box Girder Bridges. Eng. Mech. 2010, 27, 184–188. (In Chinese) [Google Scholar]
- Zhu, H.; Zhao, Y.; Luo, X.; Xu, R. Investigation and control of cracks in wet joint of concrete box girders. J. Perform. Constr. Facil. 2021, 35, 04021076. [Google Scholar] [CrossRef] [Scilit]
- Lou, L.; Pan, Z.L.; Zhao, C.J. Analysis of Crack Causes and Strengthening Measures for Prestressed Concrete Continuous Box Girders. Highway 2011, 8, 49–52. (In Chinese) [Google Scholar]
- Tu, J.; Zhao, T.B.; Lei, J.Q. Study on Causes and Preventive Measures of Cracks in PC Continuous Box Girder. Railw. Eng. 2021, 61, 35–39. (In Chinese) [Google Scholar]
- Liang, W. Influence of temperature and humidity on crack propagation in prestressed concrete box-girder bridges: Experimental study and mechanism analysis. J. Comput. Methods Sci. Eng. 2025, 25, 2007–2023. [Google Scholar] [CrossRef] [Scilit]
- Fu, Y.; Dewolf, J.T. Effect of differential temperature on a curved post-tensioned concrete bridge. Adv. Struct. Eng. 2004, 7, 385–397. [Google Scholar] [CrossRef] [Scilit]
- Guo, F.; Yang, Y.Q.; Huang, S.Q. Research on deflection and cracking of prestressed concrete continuous girder bridge. Adv. Mater. Res. 2014, 838, 1014–1017. [Google Scholar] [CrossRef] [Scilit]
- Yang, J.; Yang, C.Q.; ZhangY; Chen, Y.; Hou, P.; Zhu, F. Safety Monitoring and Effect Evaluation of Variable Cross-Section Continuous Box-Girder Bridges Strengthened with External Prestressing. J. Perform. Constr. Facil. 2023, 37, 04022082. [Google Scholar] [CrossRef] [Scilit]
- Zou, J.H.; Huang, Y.H.; Feng, W.X.; Chen, Y.; Huang, Y. Experimental study on flexural behavior of concrete T-beams strengthened with externally prestressed tendons. Math. Biosci. Eng. 2019, 16, 6962. [Google Scholar] [CrossRef] [Scilit]
- Zhang, K.X.; Qi, T.Y.; Li, D.C.; Liu, X.; Xue, X.; Wu, F. Health Monitoring-Based Assessment of Continuous Girder Bridge Reinforcement. J. Perform. Constr. Facil. 2022, 36, 04022001. [Google Scholar] [CrossRef] [Scilit]
- Jiang, H.B.; Li, J.; Gao, Y.Y.; Zhang, L.-F.; Fang, H.; Chen, Z.; Shi, Q. Shear strengthening of reinforced concrete (RC) beams using ultra-high performance concrete (UHPC) jacketing: Experimental analyses and calculation models. J. Build. Eng. 2026, 118, 114938. [Google Scholar] [CrossRef] [Scilit]
- Jia, L.C.; Tao, L.; Hong, H.; Jian, J.; Zhi, H. Experimental Test on Bridge Reinforcement by Enlarging Section-Prestress Method. E3S Web Conf. 2020, 165, 04015. [Google Scholar] [CrossRef] [Scilit]
- Zhao, P.P. Research on Internal Prestressing Reinforcement Technology of Separated Small Box Girder; Wuhan Institute of Technology: Wuhan, China, 2023. (In Chinese) [Google Scholar]
- Wang, Q.; Han, X.Y.; Fang, Z.M.; Wu, Q.; Huang, Q.; Chen, K.; Xie, Y. Interface force transfer mechanism of internal prestressing and section enlargement composite reinforcement in PC box girder bridges. Buildings 2026, 16, 1159. [Google Scholar] [CrossRef] [Scilit]
- Wang, Y.Y.; Gu, Y.; Liu, J.L. A domain-decomposition generalized finite difference method for stress analysis in three-dimensional composite materials. Appl. Math. Lett. 2020, 104, 106226. [Google Scholar] [CrossRef] [Scilit]
- Kabir, H.; Aghdam, M.M. A generalized 2D Bézier-based solution for stress analysis of notched epoxy resin plates reinforced with graphene nanoplatelets. Thin-Walled Struct. 2021, 169, 108484. [Google Scholar] [CrossRef] [Scilit]
- JTG D60-2015; General Specifications for Design of Highway Bridges and Culverts. China Communications Press Co., Ltd.: Beijing, China, 2015. (In Chinese)
- J JTJ021-89; General Specifications for Design of Highway Bridges and Culverts. China Communications Press Co., Ltd.: Beijing, China, 1989. (In Chinese)
- JTJ023-85; Specifications for Design of Highway Reinforced Concrete and Prestressed Concrete Bridges and Culverts. China Communications Press Co., Ltd.: Beijing, China, 1989. (In Chinese)
- Chen, B.C.; Zheng, Z.F. Thermal Stresses under Nonlinear Thermal Gradients in Arch Bridges. J. Fuzhou Univ. Nat. Sci. 1990, 3, 75–81. [Google Scholar]
- Liang, D.Y. Study on Damage Simulation and External Prestress Reinforcement Test of Single-Box Multi-Cell Continuous Beam Bridge. Master’s Thesis, Northeast Forestry University, Harbin, China, 2020. (In Chinese) [Google Scholar]
- JTG 3362-2018; Specifications for Design of Highway Reinforced Concrete and Prestressed Concrete Bridges and Culverts. China Communications Press Co., Ltd.: Beijing, China, 2018. (In Chinese)
- Liu, J. Study on the Mechanics Performance of Adherence of Young on Old Concrete. Ph.D. Thesis, Dalian University of Technology, Dalian, China, 2000. (In Chinese) [Google Scholar]
- Chen, F.; Zheng, J.L. Experimental research on direct shear behavior of adhesion of self-compacting concrete on existing concrete. J. Build. Struct. 2007, 28, 59–63. (In Chinese) [Google Scholar]
- Chen, K.M.; Wu, Q.X.; Huang, W.K.; Chen, B.-C. Parameter Analysis on Mechanical Property of Hinged Hollow Slab Bridge with Gate-type Steel Bars at Bottom of Junction Surface. J. Highw. Transp. Res. Dev. 2016, 33, 65–75. (In Chinese) [Google Scholar]


Disclaimer/Publisher’s Note: The statements, opinions and data contained in all publications are solely those of the individual author(s) and contributor(s) and not of MDPI and/or the editor(s). MDPI and/or the editor(s) disclaim responsibility for any injury to people or property resulting from any ideas, methods, instructions or products referred to in the content. |
© 2026 by the authors. Licensee MDPI, Basel, Switzerland. This article is an open access article distributed under the terms and conditions of the Creative Commons Attribution (CC BY) license.