


Abstract
Large language models (LLMs) are increasingly proposed for Building Information Modeling (BIM) work, yet published evaluations test one or two models on a single task using simplified inputs, leaving practitioners without an evidence base for choosing between them. This paper’s contribution is a four-track benchmark of ten current models run inside one commercial Revit add-in suite on the production workloads of a working BIM department: requirement extraction from a live ISO 19650 BIM Execution Plan; rule extraction from an 88-page scanned Arabic building code; multimodal drawing review with live application programming interface (API) access, adjudicated and reconciled by two practitioners; and ten colloquial prompts executed in Revit, each carrying an adversarial probe. Scoring combines itemized rubrics, human verification, cross-model consensus and file forensics with telemetry from 218 logged calls. Three models form a leading group, Claude Opus 5 at 88.7 of 100, GPT 5.6 Sol at 86.2 and Claude Fable 5 at 84.7. Neither re-weighting the composite 20,000 times nor repeating the agentic track displaces that group or moves a composite by more than 1.8 points, but the separation inside it is smaller than that variation, so no ordering inside the group is claimed. On these prompts fuzzy name resolution, not code generation, accounts for 60 percent of agentic points lost, which argues for guardrails enforced in the tool layer rather than assumed from model behavior.
1. Introduction
Building Information Modeling (BIM) moved the center of gravity of design and construction management from drawings to structured, queryable data [1]. That shift created a family of recurring information tasks that are labor-intensive and expensive at scale. Requirements written in a BIM Execution Plan (BEP) have to be turned into machine-checkable form under information-management standards such as ISO 19650 [2]. Prescriptive building-code clauses have to be digitized before any automated compliance check can run [3,4]. Published drawing sheets have to be quality-reviewed against both their graphical content and the model behind them. The model itself has to be manipulated through the authoring tool’s application programming interface (API) to create elements, renumber components, audit data and export quantities. Skilled practitioners perform all of these tasks routinely, and all of them have resisted full automation for decades [5].
Large language models (LLMs) have recently been proposed for each of these tasks in isolation. Reviews and use-case validations have assessed GPT-class models across the construction lifecycle [6,7]. Prompt-based systems retrieve BIM information in natural language [8]. Multi-agent frameworks generate building models through an authoring tool’s API [9]. More recent work extends this to compliance checking with language models [10,11], code-compliant structural design by multi-agent frameworks [12], semantic interpretation of Industry Foundation Class (IFC) data [13], and cost-aware multi-agent retrieval over BIM models [14,15].
In parallel, the machine-learning community has built increasingly demanding evaluations of language models as coders and agents. These run from function-level code synthesis [16] to repository-scale issue resolution [17] and multi-environment agent benchmarks [18]. The same literature documents the failure modes that matter in deployment, including hallucination [19] and miscalibrated confidence [20].
The two literature types barely intersect. Architecture, engineering and construction (AEC) studies rarely evaluate more than one or two models, rarely cover more than one task, seldom use production documents, and almost never report the token, cost and latency figures on which a deployment decision turns. General-purpose benchmarks contain no BIM authoring environments, no scanned multilingual building codes and no drawing sheets. The first BIM-specific benchmarks have appeared only in 2026: BIM-Edit evaluates language models on 324 offline IFC editing tasks [21], Alwashah et al. [22] evaluate LLM-driven Revit modeling on 31 tasks with a ten-category error taxonomy, and a multimodal benchmark for underground construction [23] narrows the gap on the vision side. None of them combines document extraction, human-verified drawing review and live agentic manipulation of a production model, and none reports economic telemetry.
This paper addresses that gap with a benchmark designed from the deployment side inward. Ten current models, six proprietary and four open-weight, were evaluated on four tracks that mirror the daily workload of a BIM department. Every track ran through the same commercial Revit add-in suite a practitioner would use, against a live project BEP, a real national building code supplied as an Arabic scan, three published drawing sheets and a federated Revit model. Every result is scored against ground truth that is either derived from the source document or independently verifiable. All 218 API calls behind the results were logged, which allows a complete accounting of tokens, cost scenarios, caching behavior and wall-clock latency. Figure 1 sets out the design.
Figure 1.
Benchmark framework: the four production inputs, the single toolchain, the four tracks, the verification layer and the scored outputs [2].
The paper makes five contributions. First, it provides a four-track benchmark design covering BEP extraction, scanned-code extraction, human-verified multimodal drawing review, and a ten-prompt adversarial agentic track with embedded probes, grounded in production artifacts rather than synthetic data. Second, it develops a verification method in which a manually derived key is tested by three instruments: human accept and reject adjudication, cross-model consensus restricted to independently checkable facts, and forensic inspection of produced files. The method applies wherever gold labels do not already exist. Third, this paper provides a side-by-side quantification of ten current models across these workloads, with an explicit composite scoring system and a sensitivity analysis that shows how far the ranking depends on the chosen weights. Fourth, it builds an empirical failure taxonomy that attributes every point lost on the agentic track to one of four capability families and ties each family to a concrete mitigation at tool level. Finally, this paper proposes a complete economic profile covering tokens, cost scenarios, caching, reasoning-token volume and maximum-effort latency, which turns the quality results into deployable routing guidance.
2. Related Work
2.1. Rule Extraction and Automated Compliance Checking
Rule-based checking of building designs against codes and client requirements has a research lineage of about fifty years. Eastman et al. [3] established the canonical four-stage pipeline of rule interpretation, model preparation, execution and reporting and identified rule translation from natural-language sources as the main bottleneck. Solihin and Eastman [24] classified rules by the depth of knowledge needed to automate them, from explicit attribute checks to rules that require extended domain knowledge. Preidel and Borrmann [25] proposed visual programming as a more accessible way to encode rules. Beach et al. [5] analyzed why adoption in regulatory practice remains limited despite technical progress, citing trust, liability and the cost of maintaining rule sets. Amor and Dimyadi [4] surveyed the field and argued that its promise is gated on the economics of converting normative text into computable form.
On the extraction side, Zhang and El-Gohary demonstrated semantic natural-language pipelines that extract requirements from regulatory text [26] and combine them with logic reasoning into fully automated checking [27]. These are pre-LLM systems whose hand-engineered components language models now promise to replace. Recent work applies language models directly to this problem, both for compliance checking driven by BIM data [10,11] and for code-compliant generative design [12]. Parallel standardization work defined the information containers this benchmark draws on: ISO 19650 for information-management planning [2], COBie for structured asset handover [28], and modeling guidance for quantity takeoff [29].
2.2. Large Language Models in AEC
Applications of language models in construction have expanded quickly since 2023. Saka et al. [6] provided a lifecycle-wide assessment of GPT-class models with a validated materials-selection use case and catalogued the limitations of hallucination, weak domain grounding and integration cost. Prieto et al. [7] evaluated ChatGPT 3.5 on construction scheduling and found coherent output that still required supervision. Closer to the setting of this paper, Zheng and Fischer [8] built a prompt-based virtual assistant for natural-language BIM information search, and Du et al. [9] demonstrated a multi-agent framework that turns natural-language instructions into imperative code against a BIM authoring tool’s API and closes the loop with a rule-based checker.
The 2025 and 2026 literature moves toward the agentic setting this benchmark targets. Koh et al. [14] studied cost-effective BIM information retrieval through condensed multi-agent code generation, which is the first work to treat token cost as a first-class design variable in this domain. Kang [15] combined retrieval-augmented code generation with dynamic IFC queries. Jin et al. [13] evaluated how well language models interpret IFC semantics. Li et al. [23] published a multimodal benchmark for underground construction. Gao et al. [30] extend the agentic pattern to schema-guided reasoning and modification of IFC models through dynamically composed tools. These studies establish feasibility and, in the case of Koh et al. [14], begin to report economics. None of them evaluate a broad field of models on shared production workloads, and none report human-verified precision alongside full economic telemetry.
Systematic evaluation of language models on BIM tasks is more recent still. BIM-Edit [21] is a dedicated multi-model BIM benchmark: 324 natural-language editing tasks over IFC files, scored on geometric accuracy, semantic validity and topological consistency, on which the best model averaged 49.5 percent and no model fully solved more than 3.4 percent of tasks. It is executed offline against IFC files rather than inside an authoring tool, and its scoring is automatic. Alwashah et al. [22] evaluated LLM-driven modeling inside Revit on 31 component-, assembly- and system-level tasks, classified 238 observed errors into ten categories, and found API misuse to be the largest category at 48.3 percent of failures. Their study characterizes the reliability and error profile of LLM-driven modeling within one workflow type rather than benchmarking a model field across extraction, review and automation. Jiang and Dong [31] argue from the building-energy side that agentic AI for buildings still lacks human-verified reference solutions and standardized benchmark protocols and propose community infrastructure to supply them. The present study is complementary to all three: it evaluates a field of current models, inside the authoring tool, on production documents and a production model, with human verification, and it reports the economics of every run.
2.3. Evaluating Language Models as Coders and Agents
Outside AEC, evaluation has matured from static question answering to execution-verified and agentic settings. HumanEval introduced unit-test-verified code synthesis [16]. SWE-bench scaled verification to real repository issues [17]. AgentBench spans interactive environments with tool use [18]. Holistic frameworks such as HELM [32] and the survey by Chang et al. [33] argue for multi-metric, multi-scenario evaluation that measures accuracy alongside calibration, robustness and efficiency. This benchmark adopts that philosophy for AEC.
The tracks reported here exercise capabilities the literature has shown to matter, including chain-of-thought and deliberate reasoning [34,35], reasoning-and-acting loops against tools [36], and aggregation of answers across samples [37]. For evaluation without gold labels, the design draws on, but deliberately departs from, model-as-judge protocols [38]. Rather than have a model grade free-form answers, this study uses agreement between models restricted to objectively checkable facts, falsified by embedded adversarial probes and audited by inspection of the produced files. The failure modes probed are those the literature has characterized: hallucination [19], confidence miscalibration [20], and the safety risks of tool-using agents, for which Ruan et al. [39] advocate sandboxed risk identification. Here the last of these is surfaced instead through a live destructive-action probe whose correct outcome is guaranteed safe.
2.4. What Is Missing
In short, most AEC studies demonstrate single tasks with one or two models on simplified inputs, while machine-learning benchmarks evaluate many models on tasks with no AEC content. The BIM benchmarks that appeared in 2026 close part of the gap, but each covers one task family, either offline IFC editing [21] or in-tool modeling [22], with automatic or single-team scoring and without economic telemetry. No published work, to the authors’ knowledge, evaluates a field of current models across document extraction, scanned multilingual code digitization, human-verified drawing review and live agentic model manipulation, under one toolchain, one scoring system and full economic telemetry. This paper supplies that evaluation and adds an external baseline in the form of a commercially released assistant run on the identical adversarial agentic track.
3. Method
The benchmark has four task tracks, each corresponding to a recurring workload in a production BIM department, and one derived measure. Section 3.3, Section 3.4, Section 3.5 and Section 3.6 take the tracks in turn; Section 3.7, Section 3.8, Section 3.9 and Section 3.10 cover ground truth, scoring, telemetry and reproduction.
3.1. Models Under Test
Ten models available in July 2026 were evaluated (Table 1). Six are proprietary flagship or efficiency-tier models and four are open-weight models accessed through their vendors’ cloud APIs. All were reached through OpenAI-compatible chat-completion endpoints using provider-default decoding settings and each provider’s current public snapshot. Provider identifiers are given verbatim so that results are pinned to specific snapshots. Coverage was varied deliberately to control cost. Six models completed all four tracks, three completed three, and one, DeepSeek V4 Flash, ran the two extraction tracks only. That model is reported for completeness but excluded from cross-track ranking claims. One profile-build call was made without a model-name prefix and could not be attributed with certainty; it is excluded from scoring under a stated admissibility rule and retained only in the token accounting.
Table 1.
Models under test, provider identifiers, weight class, track coverage and composite score.
Each model ran each task once. The benchmark is therefore a single-run design in which every score is one draw from a stochastic process. The consequences of this choice for the interpretation of small score differences are set out in Section 6.
3.2. Toolchain and Test Environment
All tracks ran through a commercial Revit 2024 add-in suite with four tools: a profile-based model checker, a regulation-profile code checker, a sheet reviewer with live model query, and an automation agent that generates and executes Revit-API C# against the open document. The suite exposes a single OpenAI-compatible integration path, so switching models is a configuration change and every model faces byte-identical system prompts and tool contracts.
The automation backend enforces a JavaScript Object Notation (JSON) response contract, wraps every model-driven mutation in a Revit transaction automatically, provides export and save-dialog helper functions, and supports an iterative query loop in which the model may request read-only model data before committing to an action. That interaction pattern belongs to the reasoning-and-acting family [36]. The test model is a federated multi-story residential project with architectural and structural links. It has seven levels, 217 walls, 16 doors and 8 floor slabs. It contains deliberately imperfect data inherited from live production rather than injected synthetically, including an unclassified wall type, a mismatch between geometric and parameter volume, and inconsistent door marks.
3.3. Track 1A: BIM Execution Plan Extraction
Each model received the full text of a live BEP aligned to ISO 19650 [2] from an ongoing commercial development, anonymized and running to more than forty pages. The task was to produce a machine-checkable checking profile covering shared coordinate values, file-format and size rules, the project naming convention, object-naming and classification requirements, asset-identification parameters, COBie [28] and builder’s-work parameter sets, and stakeholder roles.
Outputs were scored against a manually derived answer key using a rubric of 14 components summing to 104 raw points, normalized to 100. Two scoring principles apply throughout the extraction tracks. First, over-restriction is penalized as a correctness failure: freezing a document’s illustrative example lists into closed sets of allowed values inverts the intent of the document and would generate false non-compliances at scale. Second, invention is penalized more heavily than omission, which reflects the relative deployment risk of a requirement that was never written down [19].
3.4. Track 1B: Scanned Building-Code Extraction
The second extraction track uses the residential-building provisions of Egypt’s Unified Building Law 119 of 2008 and its executive regulations [40], specifically Articles 93 to 100 plus Article 40, supplied as an 88-page scanned official document in Arabic. Models received the optical character recognition (OCR) text layer [41] together with the page images and produced structured rule profiles covering minimum room areas and dimensions, ceiling heights, ventilation-opening ratios, door widths, airwell sizing including its per-ten-meter height increments, stair geometry and occupancy differentiation. A rubric of 12 components summing to 100 was applied, including components for article citation and Arabic fidelity.
The track contains a naturally occurring integrity probe. One ventilation clause, the requirement that openings in habitable rooms reach 10 percent of floor area, exists only in the page image because the OCR layer silently dropped it. Behavior on that clause separates safe omission from confident invention. The paired 8 percent clause for service rooms in the executive regulations makes the invention mode, which is to swap the two percentages, directly observable. Cross-lingual scanned-document extraction of this kind is itself an active benchmark area [42].
3.5. Track 2: Multimodal Drawing Review with Human Verification
The reviewer tool supplies each model with three published sheets of the project, rendered as general-arrangement plans at 150 dots per inch (DPI), together with rule-profile context. Uniquely among the tracks, it also gives the model live read access through structured Revit-API queries, so a finding can cite queried model state rather than pixel inference alone.
Models emit findings classified as Critical, Warning or Info, each with a stated confidence. The model assigns the class itself, following three conditions stated verbatim in the study brief that every model receives. Info is used when the model returns a fact or confirms that a checked condition is satisfied, for example that a room meets the dimensional requirement of the clause under test. Warning is used when the model cannot obtain the information a check requires, for example when stair geometry is requested and no stair is modeled or none is present in the reviewed view. Critical is used when the model identifies a state that conflicts with a requirement, for example a room whose dimensions fall below the prescribed minimum. Info items are therefore confirmations or notes rather than defects, and only Critical and Warning items enter the validated-yield component of the score.
Every finding from every model was adjudicated against the drawing sheets and the model database. The adjudication was carried out by two of the authors, with seven and four years of professional experience in BIM coordination and drawing review. Each first formed an accept or reject judgement on a paper working sheet; the two judgements were then compared finding by finding, and every difference was resolved by discussion against the source evidence before the decision was entered in the tool dashboard. Only the reconciled decisions were recorded. The individual working sheets were not retained, so a formal inter-rater agreement statistic cannot be computed retrospectively, and the procedure is reported here as consensus adjudication by two domain practitioners rather than as independent double rating. This human-verification layer covers 224 findings in total, of which 105 were reported as Critical or Warning. Both adjudicators are authors of the study, so the procedure is not independent external verification; Section 6 records that, and the absence of an agreement statistic, as limitations.
Track scores decompose into validated actionable yield (40 points), precision against human judgement (25), quality of severity use (15), evidence depth (10) and confidence calibration (10) [20]. Validated yield is the accepted Critical-plus-Warning count scaled to the highest such count in the field; precision is the share of all reported findings that the adjudicators accepted. Two models, DeepSeek V4 Pro and GLM 5.2, were not run on this track.
3.6. Track 3: Agentic Automation Under Adversarial Conditions
Ten reference prompts (Table 2) were sent verbatim by a single operator, one fresh chat session per prompt, to eight models inside live Revit. The prompts are deliberately colloquial and contain typographical errors, missing context and implicit units. Each embeds at least one adversarial probe whose correct handling is objectively checkable. Every file produced was archived under a model-prefixed filename and inspected: 35 Excel workbooks, two comma-separated values (CSV) files and 33 screenshots in total. The same ten prompts were also run against a commercially released assistant supplied with the authoring tool (Autodesk Assistant, technical preview) as an external baseline. That system is not model-swappable and is distributed as a technical preview, so it is reported alongside the model field rather than ranked within it.
Table 2.
The ten reference prompts as sent, with the capability each prompt exercises and the adversarial probe each one embeds.
The agentic track was executed twice. The first execution, in July 2026, produces every agentic score reported in Section 4. The ten prompts were sent a second time in October 2026, during revision, against the same provider snapshot identifiers listed in Table 1 and the same build of the add-in suite, under the identical protocol of one fresh chat session per prompt. The artifacts of the second execution were archived and verified in the same way. It is reported in Section 4.5.6 as a repeatability check and does not replace the first execution in any score reported here.
3.7. Ground Truth and Verification
On every track the source of truth is a verified result obtained independently of the systems under test, never a model output. The extraction keys were derived by hand from the source documents, and the building-code key was read from the page scans rather than the OCR layer, so clauses the OCR layer dropped are present in it. On the agentic track the reference values were not established by agreement between models. They were obtained by querying the project database directly, through the authoring tool’s own Schedules and Quantities facility. A schedule is a deterministic query: it reads the database rather than the drawing, it is regenerated from the model on every open, and it is the same mechanism a quantity surveyor would use to take off the project. The element counts, the breakdowns by type, the areas, the element identifiers and the level elevations listed below are therefore the values the authoring tool itself reports. One reference quantity is computed rather than read. The volume of a slab used as the geometric reference is the product of its scheduled area and the thickness recorded on its type, which is the calculation a quantity surveyor performs by hand and which is independent of the stored volume parameter that BM-04 asks the models to check it against. On the one slab where the two differ, all eight agents computed the same gap from the solid geometry as the hand calculation gives, so the two routes agree on the reference value. Each schedule was exported and compared line by line with the artifact the model produced before any score was awarded, so a discrepancy is a discrepancy against the database, not against a second opinion. What the agentic track has no pre-existing labels for is behavior, which cannot be scheduled, so three further instruments test the schedule-derived key and the behavioral judgements that rest on it rather than replace them.
First, cross-model consensus takes place on facts that the schedules already fix independently. Agreement across independent implementations is conceptually related to self-consistency aggregation [37] but is restricted here to verifiable facts rather than free-form judgements [38].
Second, probe falsification takes place. A shared systematic error would trigger at least one of the embedded adversarial probes, which include the 914.4 mm boundary door, the pre-existing volume mismatch and the element names that do not exist. No probe was triggered other than as designed.
Third, forensic inspection of produced files is performed. This covers red-pixel measurement of viewport screenshots for the visual task, with success thresholds set an order of magnitude above measurement noise; byte-level inspection of exports, which is how a 3-byte CSV containing only a byte-order mark was identified; and, for the audit prompt, the requirement that all eight change logs list identical pre-mutation door marks. They do, which shows that no model fabricated its audit trail after the fact.
The following five quantities were taken from the project schedules. All eight agents independently reproduced them, which is reported here as corroboration of the agents rather than as the source of the values. These are the consensus values used on the agentic track:
- •
- Walls: 217 in total. W 250 mm: 94 walls, 457.60 m2. W 120 mm: 119 walls, 339.14 m2. Generic 250 mm concrete: 4 walls, 4.91 m2. Total area 801.66 m2. The three component areas are quoted to two decimals and therefore sum to 801.65 m2.
- •
- Doors: 16 in total, of which 14 are narrower than 900 mm (two at 600, seven at 700, one at 750, four at 800). The 36-inch (914.4 mm) pair is correctly excluded.
- •
- Floors: 8 slabs. Element 412764 (slab 260 mm, ground level) is the only slab above the 1 percent threshold: a stored volume parameter of 8.921 m3 against 8.802 m3 computed from the scheduled area and the type thickness, a 1.34 percent gap.
- •
- Doors on 2nd FFF: exactly three, element identifiers 408218, 408412 and 408500. This is the BM-06 target set.
- •
- Levels: seven, all in use. FoundationTop −1.75, parking −1.35, ground level 0.00, GF FFF 0.65, 1st FFF 3.95, 2nd FFF 7.15, Roof 10.70 m.
3.8. Scoring System and the Composite
Every track is scored out of 100. The composite weights the tracks by deployment value: 0.15 for BEP extraction, 0.15 for code extraction, 0.25 for verified review and 0.30 for agentic automation, plus 0.15 for token efficiency. Weights are renormalized over the tracks a model completed. Nothing is imputed for a missing track, and coverage is flagged on every ranked view. Table 3 summarizes what each track measures and how it is scored.
Table 3.
Measurements in the proposed tracks.
Token efficiency is the mean, over completed tracks, of the lowest participant token count on that track divided by the model’s own token count, times 100, computed on verified sessions only. The per-track minima are 22,055 tokens for Track 1a, 124,659 for Track 1b, 46,483 for Track 2 and 99,334 for Track 3.
The composite is computed from the published track scores as printed in Table 4, so any reader can reproduce it. For the leader this gives 0.15 × 95.2 + 0.15 × 93.5 + 0.25 × 98.0 + 0.30 × 93.5 + 0.15 × 52.5 = 88.7.
Table 4.
Full score matrix.
Two worked examples show how a track score is built from its components. On Track 1a the rubric has 14 components summing to 104 raw points. Claude Opus 5 lost one of the 14 points available on the file-naming convention component and all four points on the Unique ID Code parameter component, which it did not extract, and scored full marks on the remaining twelve components. Its raw total is therefore 104 − 5 = 99 points, and its track score is 99/104 × 100 = 95.2. On Track 1b the rubric has 12 components summing directly to 100, so the raw total is the score. The same model lost one point on code metadata, three on door width rules, two on the ventilation percentages, which is the component that carries the image-only clause, and half a point on the airwell series, giving 100 − 6.5 = 93.5. Both scores can be recomputed line by line from Table A1 and Table A2.
Because the weights are a judgement call, this study reports a sensitivity analysis instead of asking the reader to accept them. Table 4 also reports a quality-only composite that excludes the efficiency term entirely, so quality and economy can be read separately.
One interpretive rule follows from the single-run design and is applied throughout the rest of this paper. Because each model ran each task once, no estimate of run-to-run variance is available, and a difference of a few composite points cannot be shown to be a difference in capability rather than a difference between two draws. Composite values are therefore reported as magnitudes, and models are grouped rather than ranked. The grouping is not a judgement: it comes from the randomized weight analysis in Section 4.2, which records how often each model finishes first and how often it finishes in the top three when the weights are varied. Ordinal statements are used only where the separation is several times larger than the largest composite movement observed under repetition, 1.8 points, and where the randomized weight analysis places the ordering in more than 95 percent of bounded draws. Section 4.5.6 reports a second execution of the agentic track that gives this rule an empirical basis: repeating the track moves a model’s track total by 1.1 points on average and reverses the order of systems three points apart, while moving no composite by more than 1.8 points.
Weighting a composite indicator is a value judgement rather than a measurement, and the methodological literature treats it as one. The standard handbook on composite indicators holds that weights should be stated explicitly, should express the priorities of the user rather than a claim about the world, and should be accompanied by uncertainty and sensitivity analysis instead of being defended as uniquely correct [43]. Sensitivity analysis is presented in that literature as the quality-assurance step that makes a weighted ranking defensible [44], a position reaffirmed by the later methodological review of weighting, aggregation and robustness in composite indices [45]. This study follows that practice. The baseline weights encode one explicit deployment priority: live agentic manipulation of a production model carries the greatest operational risk and therefore the greatest value, verified review quality comes next, the two extraction tracks are each worth less individually because their outputs are reviewed before use, and token efficiency matters without outranking correctness. Combining task performance with token efficiency in one index is a deliberate part of that judgement, because the deployment decision this benchmark serves is a routing decision in which quality and unit cost are traded against each other rather than considered separately. Readers who reject that trade-off are not obliged to accept it: the weights are stated numerically, every input score is published in Table 4, Table 4 also carries a quality-only composite with the efficiency term removed entirely, and Section 4.2 reports both a scenario analysis and a randomized analysis, so a reader whose priorities differ can locate an approximation of their own weighting and read off the resulting ranking.
Rubric scoring was performed by the research team against itemized line items, each of which is a binary or graded check of a specific value, rule or artifact property rather than a holistic judgement. Every line item is published in Appendix A and every artifact is archived, so any score can be recomputed from its components.
3.9. Telemetry, Cost and Latency
Every API call was logged with a timestamp, model identifier, tool, and input, output, reasoning and cached-input token counts. There are 218 calls in total. Reviewer dashboards were matched to call clusters by timestamp. Agentic sessions are contiguous per-model blocks: six models on the afternoon of 26 July 2026 between 16:06 and 18:48 UTC, then Claude Opus 5 from 22:07 to 22:22 and Gemini 3.1 Pro from 22:23 to 22:52 the same evening. One single-call connectivity ping per late model, dated 25 July, is excluded from session totals.
Where the operator re-ran a build, only the session that produced the scored artifact counts toward token and efficiency figures. This affects two extraction cases, Gemini 3.1 Pro on Track 1a and GLM 5.2 on Track 1b, in the same way that reviewer re-runs are excluded in favor of the human-verified session.
Internal metering recorded zero dollar amounts on every record, so cost is reported as scenarios rather than as a measured figure. Three published rate pairs are applied uniformly to each model’s measured input and output split. Maximum-effort latency was measured as wall time from the start of a review to the final call that produced the dashboard.
3.10. Reproduction Protocol
The benchmark is designed to be re-run, and a complete reproduction requires six steps. First, install the add-in suite described in Section 3.2 and configure its single OpenAI-compatible endpoint; every model is reached through that one integration path, so no model-specific client code is involved. Second, leave each provider’s decoding parameters at their published defaults and record the model snapshot identifier exactly as given in Table 1, because provider aliases are repointed without notice and a reproduction that cites an alias is not pinned to the system tested here. Third, supply the four inputs: the anonymized BEP excerpt, the 88-page code scan together with its OCR text layer, the three drawing sheets exported at 150 DPI, and the federated Revit model. Fourth, send the ten agentic prompts verbatim from Table 2, one per fresh chat session, and archive every produced file under a model-prefixed filename. Fifth, score each output against the published rubric line items in Appendix A and adjudicate the review findings as described in Section 3.5. Sixth, run the deposited scoring script compute_scores.py, which takes the workbook of rubric component sheets as input, verifies the published track scores against it, and emits the composite scores, the scenario table and the randomized weight analysis under the fixed seed reported in Section 4.2. The reference prompts, the rubric line items, the component-level score sheets, the verified ground-truth values, the adjudication record, the token and cost telemetry and the scoring script are deposited as listed in the Data Availability Statement, so steps five and six can be reproduced without access to the authoring environment.
4. Results
4.1. Overall Standing
Table 4 reports the full score matrix and Figure 2 shows the composite with coverage tiers. Three of the six full-coverage models form a leading group: Claude Opus 5 at 88.7, GPT 5.6 Sol at 86.2 and Claude Fable 5 at 84.7. The 4.0 points separating them is below the resolution of a single-run design, so they are described here by profile rather than by rank. Claude Opus 5 has the highest verified review score in the study, 98.0, and an agentic score of 93.5. GPT 5.6 Sol pairs ceiling-level extraction (99.0 and 94.0) and a review set in which every finding was accepted with the highest token efficiency in the group, 76.1. Claude Fable 5 has the highest agentic score, 95.0, and the lowest efficiency, 47.3. Kimi K3 at 80.6 is the highest open-weight entry and sits 8.1 points below the top of the group, a gap large enough to be read as a difference in capability. Gemini 3.1 Pro at 76.9 and Gemini 3.6 Flash at 70.0 complete the full-coverage set.
Figure 2.
Composite leaderboard with coverage tiers.
Figure 3 shows the profile of the four leading full-coverage models across the five scored axes, against the range spanned by all six. The five axes are T1a (BEP extraction), T1b (scanned-code extraction), T2 (drawing review), T3 (agentic automation) and Eff (token efficiency), each scored out of 100, and the grey range bar behind each axis shows the spread of all six full-coverage models on that axis. Claude Opus 5 is distinguished by flatness on the test axes, between 93.5 and 98.0 on all four, with only the efficiency axis at 52.5 pulled inward. GPT 5.6 Sol has the rounder profile: no test axis below 79.6 and the highest efficiency of the four. Claude Fable 5 shows the agent spike, 95.0 on Track 3 and 99.0 on Track 1a, with efficiency collapsed to 47.3. Kimi K3 has the widest spread, from 68.5 to 97.6, with review quality as its differentiator.
Figure 3.
Score profile of the four leading full-coverage models across the five scored axes.
4.2. How Much the Ranking Depends on the Weights?
A composite built from five weighted tracks invites the objection that the ranking is an artifact of the weights. Table 5 answers it directly by recomputing the full-coverage ranking under six weightings, including the two extreme cases of removing the efficiency term altogether and doubling it. Each row states the complete weight vector so that every entry can be recomputed from Table 4.
Table 5.
Composite score and rank in parentheses for the six full-coverage models under alternative weightings.
The grouping is stable across these scenarios. The same three models occupy the top three positions in all six, and Claude Opus 5 is placed first in five of them. The single exception is the scenario that doubles the efficiency weight to 0.30, where GPT 5.6 Sol moves ahead by 2.2 points. That is the expected result rather than a surprise, because efficiency is the only weak axis of Claude Opus 5.
A broader test randomizes the weights. Two schemes were run, each drawing 20,000 weight vectors under the fixed seed 20260726 and applying them to the Table 4 scores. The draws vary the weighting vector only. The measured track scores are held fixed throughout, so this procedure tests how far the ranking depends on the weighting choice. It is not a repetition of the experiment, and it does not estimate run-to-run measurement variance, which would require repeated model runs and is listed as a limitation in Section 6. In the bounded scheme, each of the five baseline weights is multiplied by an independent factor drawn uniformly between 0.5 and 1.5 and the vector is renormalized to sum to 1; this represents the range of weightings a reasonable organization might adopt. In the unconstrained scheme, the four track weights are drawn uniformly over the simplex and the efficiency weight uniformly between 0 and 0.25, with the track weights renormalized over the remainder; this includes weightings that no organization would use, such as placing 90 percent of the weight on a single track.
Under the bounded scheme, Claude Opus 5 finishes first in 91.5 percent of draws and GPT 5.6 Sol in the remaining 8.5 percent. Both are in the top three in every draw, Claude Fable 5 is in the top three in 95.9 percent, and Kimi K3 displaces it in the remaining 4.1 percent. Under the unconstrained scheme, Claude Opus 5 finishes first in 60.9 percent of draws, GPT 5.6 Sol in 35.9 percent and Claude Fable 5 in 3.2 percent; no other model finishes first in any draw. The draws in which GPT 5.6 Sol leads are those that combine a high efficiency weight (median 0.18) with a low weight on verified review (median 0.08), which is the one axis on which the two models differ most. Kimi K3 enters the top three in 41.9 percent of unconstrained draws, almost all of them weightings that place more than half the weight on the two extraction tracks and less than a tenth on agentic automation.
Two conclusions follow, and they are of different strengths. The composition of the leading group is a property of the measurements: no model outside it finishes first under any draw, and only Claude Opus 5 and GPT 5.6 Sol finish first under any bounded draw. The ordering inside the group is not a property of the measurements. It moves with the weighting, and under a single-run design it cannot be separated from run-to-run variation either. The three leading models should therefore be treated as equivalent at this resolution, and the choice between them made on the axis an organization values, not on the composite.
4.3. Tracks 1A and 1B: Extraction Accuracy and Failure Patterns
Extraction is close to saturated at the top (Figure 4). Seven of the ten models score at or above 94 on the BEP, and the three leaders on the scanned Arabic code hold 92 to 94. Every model without exception scores lower on the scan than on the born-digital plan. The gap ranges from 0.4 points for DeepSeek V4 Pro to 16.1 for Gemini 3.5 Flash, with a median of 11.0 points. That median is the measured cost of OCR noise, cross-lingual reading and scanned tabular layouts. The two smallest gaps belong to models that also scored well on the scan, so a narrow gap indicates cross-lingual robustness rather than a weak plan score. Full component-level matrices for both tracks are given in Appendix A.
Figure 4.
Extraction accuracy on the born-digital BEP and on the scanned Arabic building code.
The diagnostic value lies in four recurring failure patterns. First is the pattern coordinate blindness. Both DeepSeek models emitted 0.0 for the shared easting and northing while every other model extracted the correct survey values. This is a silent failure that would corrupt every downstream coordination check, and it is the single highest-consequence error in the track. Second, four models, GLM 5.2, both DeepSeek models and Claude Opus 5, created the asset-identifier rule but left the parameter name blank. The result is structurally valid and semantically inert: a check that reports success while testing nothing. Third, all three Gemini models converted the plan’s illustrative example lists into closed sets of allowed values on three COBie rows. Gemini 3.6 Flash additionally locked tenant codes to a fixed set. These profiles would raise false failures against perfectly compliant models, which makes this the most operationally dangerous class of extraction error. Finally, no model recovered the image-only 10 percent ventilation clause, but behavior divided sharply. Six models, GPT 5.6 Sol, Claude Opus 5, Claude Fable 5, Kimi K3, DeepSeek V4 Pro and GLM 5.2, omitted it and kept the recoverable 8 percent figure for service rooms. The three Gemini models and DeepSeek V4 Flash filled the gap by inverting the pair, assigning 10 percent to service rooms and 8 percent to habitable rooms. In a compliance pipeline the inversion is the dangerous branch, because it audits every habitable room against the wrong threshold while appearing complete [19].
Two further differences separate the field on quality rather than on error. Occupancy differentiation ranged from six distinct rule sets for GPT 5.6 Sol down to effectively two for the tail of the field. On the airwell height series, DeepSeek V4 Pro extrapolated cleanly to 100 m, while Gemini 3.6 Flash flattened every value above 30 m.
4.4. Track 2: Verified Drawing Review
Table 6 reports the human-verified state and Figure 5 shows the severity mix against validated yield. Precision was close to universal: five of the seven models had every finding accepted. Ranking was therefore decided by validated actionable yield, severity usage and confidence calibration rather than by detection ability. C/W/I is the Critical, Warning and Info split as the model reported it, before adjudication. Validated C + W is that Critical-plus-Warning count scaled by the adjudicated precision, which is why it is not an integer where findings were rejected; it is the quantity that drives the yield component.
Table 6.
Verified drawing-review results.
Figure 5.
Drawing review after human verification. (a) Severity mix of reported findings. (b) Track score with the validated Critical-plus-Warning count.
Claude Opus 5 set the reference performance: 37 findings, 23 accepted Critical and Warning items at 100 percent precision, all three severity classes used, and a stated average confidence of 76 percent that honestly reflects a hard task. Kimi K3 at 86.8 and Claude Fable 5 at 84.1 followed with fully accepted and well-calibrated sets. GPT 5.6 Sol shows a distinct profile: every one of its 22 findings was accepted, but it raised no Critical at all, so issues that other models escalated and had accepted as Critical were filed as Warnings. The result is perfect trust with muted urgency and a score of 79.6.
The two calibration failures are instructive. Gemini 3.1 Pro produced 70 findings with a binary Critical and Info split, no Warnings at all, and a flat 100 percent confidence on every item. That is high recall with no usable triage signal, and it scores 77.5. Gemini 3.6 Flash had three of its 15 findings rejected while claiming 97 percent confidence, scoring 49.7. This is the overconfidence pattern the calibration literature predicts for uncalibrated classifiers [20].
One convergent result is worth recording. Every strong model concentrated its largest share of findings on the same sheet, the first-floor plan. Agreement between independently operating model reviewers about where the risk sits is itself evidence that the sheet needs attention. The per-sheet distribution is given in Appendix A, Table A3.
4.5. Track 3: Agentic Automation
Table 7 and Figure 6 report the per-prompt matrix for all eight agents plus the commercial baseline. The aggregate ranking runs Claude Fable 5 at 95.0, Claude Opus 5 at 93.5, GPT 5.6 Sol at 86.5, GLM 5.2 at 71.5, Kimi K3 at 68.5, DeepSeek V4 Pro at 68.0, Gemini 3.1 Pro at 66.0 and Gemini 3.6 Flash at 58.0. That ranking conceals the structure the adversarial probes expose, which is analyzed below.
Table 7.
Adversarial agentic track: score per reference prompt out of 10 and total out of 100.
Figure 6.
Adversarial agentic track, score per prompt out of 10.
4.5.1. Data and Unit Arithmetic (BM-01, BM-02, BM-04)
This group is essentially solved. All eight agents performed the internal-units to metric conversions correctly, excluded the 914.4 mm boundary door, and reproduced the pre-existing floor-volume discrepancy on element 412764 at 1.34 percent. What separated them was completeness and traceability rather than arithmetic. Claude Opus 5 matched the consensus values to five decimal places with total rows and element identifiers throughout. Gemini 3.1 Pro was numerically exact but omitted the requested wall counts and total row from its BM-01 export. Gemini 3.6 Flash shipped one structurally empty workbook, its only hard artifact failure. DeepSeek V4 Pro omitted element identifiers on the volume audit.
4.5.2. Fuzzy Name Resolution (BM-03, BM-05, BM-06)
Every hard failure on the agentic track traces to resolving colloquial names onto the model’s actual level and view names, never to defective C# or stale API knowledge. The user writes “level 1”, “the level 1 floor plan” or “levl 02”; the model contains “GF FFF”, “1st FFF” and “2nd FFF”.
On BM-03, Claude Fable 5 queried the level list, stated the closest match and built correctly, scoring 10. Gemini 3.6 Flash and Gemini 3.1 Pro silently resolved to a plausible level and built, scoring 9 each. GPT 5.6 Sol built correctly and verified the result by pixel analysis of the viewport, scoring 8.5. DeepSeek V4 Pro and GLM 5.2 stopped at “Level 1 not found”, scoring 1. Kimi K3 promised a fuzzy fallback and then failed anyway, scoring 2. Claude Opus 5, revealingly, executed the geometry, wall type and isolation flawlessly on the wrong level, announcing its choice of “FoundationTop” without asking, and scored 5.
BM-05 compounded the difficulty by naming a view that does not exist while a 3D view was active. Claude Opus 5 produced the only fully autonomous success of the study. It reasoned its way to the “1st FFF” plan, checked for view-template overrides, applied solid-red surface and cut overrides to 79 walls, and told the user how to open the view. The result was verified at 1.64 percent red viewport pixels, scoring 9.5. Claude Fable 5 had succeeded earlier through an explicit user choice, scoring 8.5 at 1.36 percent red. The remaining six failed view targeting outright, even though Kimi K3 cited the current override API members correctly and GLM 5.2 and DeepSeek V4 Pro self-corrected stale API names. View resolution, not API recency, was the deciding factor.
On the typo prompt BM-06, five models resolved “levl 02” and updated exactly the three doors on that level. Kimi K3, Gemini 3.6 Flash and Gemini 3.1 Pro failed the match outright, producing no update and no export. Notably, the same model that solved BM-05 autonomously had mis-resolved BM-03 min earlier in the same session block. That inconsistency within a single model argues for a deterministic resolver rather than reliance on model reasoning [46].
4.5.3. Destructive Actions and Abstention Under Pressure (BM-07, BM-08)
All eight agents reached the correct outcome on the deletion bait, which is that nothing was deleted. Process split them into two safety classes. Five, namely Claude Fable 5, GLM 5.2, GPT 5.6 Sol, Kimi K3 and Claude Opus 5, ran read-only dependency scans and reported evidence tables before concluding that no level was unused. Claude Opus 5 produced the fullest evidence table in the study, with element and plan-view counts for each level. The other three, DeepSeek V4 Pro, Gemini 3.6 Flash and Gemini 3.1 Pro, generated deletion-oriented code immediately and were saved only by the empty result set. This is exactly the class of agentic risk that sandbox studies anticipate [39].
BM-08 produced correct abstention from every system. Prompted for a pipe schedule in a model containing zero pipes, with the explicit pressure that the project manager needed it in ten minutes, no agent fabricated data. This result is specific to a stimulus in which the absence of data is unambiguous. DeepSeek V4 Pro gave the best response: it verified zero, then offered fittings, flexible-pipe and linked-model alternatives. Claude Opus 5 checked both pipe categories and exported nothing. GPT 5.6 Sol and Gemini 3.1 Pro each shipped a technically honest but empty 3-byte CSV as the requested file path.
4.5.4. Instruction Precision and Audit Integrity (BM-09, BM-10)
Seven of eight models delivered the quantity takeoff exactly as specified, with five columns in the requested order, one row per type, two decimal places and the save-dialog flow. This is consistent with quantity-takeoff modeling guidance that emphasizes structured, type-grouped output [29]. GLM 5.2 violated the core grouping instruction and returned 217 one-wall rows, scoring 5.
The audit prompt produced the strongest forensic result of the study. All eight change logs list identical element identifiers and identical pre-mutation marks, which shows that every model captured state before mutating and that none fabricated its log. Format compliance then separated the field. Claude Fable 5, GPT 5.6 Sol and GLM 5.2 used the requested per-level scheme. Claude Opus 5 produced the best artifact in the benchmark, with per-level prefixes ordered by plan-X coordinate, the sort key recorded, and a nine-row audit summary. Kimi K3 documented a deviating ground-floor prefix and scored 8. DeepSeek V4 Pro and Gemini 3.6 Flash numbered levels by global elevation index and scored 5 each. Gemini 3.1 Pro, despite capturing the canonical old marks correctly, assigned the same prefix to two different levels and introduced five duplicate mark pairs, which is precisely the defect the audit was commissioned to remove. It scored 4.
4.5.5. Comparison Against a Commercially Released Assistant
The commercial assistant scored 65.5 on the identical prompt set, against a mean of 75.9 across the eight model-driven agents. Seven of the eight agents beat it and one, Gemini 3.6 Flash at 58.0, did not. That figure alone is less informative than its shape.
The baseline is competitive, and in places superior, on query and view tasks. It scored 10 on BM-06, resolving the typo correctly, which three of the eight agents failed to do. On BM-05 it scored 8.5, a result only one agent beat and one other matched, while the remaining six agents failed the task outright. Its losses are concentrated in creation, geometry computation and file authoring: 1.5 on BM-03, 2.5 on BM-04, 5.5 on BM-09 and 6.0 on BM-10. The system states that it cannot create geometry, compute from solid geometry, or author files, so these are documented capability boundaries rather than reasoning failures.
This produces a different failure profile from the model field. The baseline lost 12.5 points to data and geometry work against 10.0 to name resolution, while the model field lost 4.5 times more to name resolution than to data work. The comparison therefore separates two distinct constraints on agentic BIM automation: the baseline is bounded by what its tool layer is permitted to do, and the model field is bounded by how reliably it maps user language onto model identifiers. These are different problems with different fixes. Both figures come from a single run against a technical-preview build and should be read as a point-in-time reference rather than a stable product comparison.
4.5.6. Repeatability: A Second Execution of the Agentic Track
Running each prompt once leaves open whether a small difference between two systems reflects capability or chance. The second execution bounds that. Table A4 gives the full per-prompt matrix for both executions.
Of the 80 scored cells, 32 changed. The mean absolute change is 0.42 points per cell and 1.1 points in a model’s track total, with a standard deviation across models of 1.9 points. The largest change for any system is 6.0 points, for Kimi K3, and the three leading agents move by between 0.0 and 1.5 points. Of the 32 cells that changed, 17 rose and 15 fell, so at cell level the variation is two-sided. At the level of track totals it is not. Every one of the eight totals either rose or stayed the same, and four returned exactly to their first-execution total after offsetting cell changes. The implications of that pattern are discussed below.
The variation is not spread evenly, and where it concentrates is itself a result. In the fuzzy name resolution family, 13 of 24 cells changed, with a mean absolute change of 0.73 points and a maximum of 7.0. In the data and unit arithmetic family, four of 24 cells changed, with a mean of 0.15. Resolution is therefore not only the largest single source of lost points but also the least repeatable behavior in the benchmark, which strengthens rather than weakens the argument for moving it into the deterministic tool layer.
Two consequences follow for interpretation. First, the ordering of closely placed systems is not stable. GLM 5.2 scores above Kimi K3 on this track in the first execution, 71.5 against 68.5, and below it in the second, 71.5 against 74.5, so a three-point separation reverses under one repetition. Second, the composite is far more stable than the track that drives it. Substituting the second execution moves no composite by more than 1.8 points, moves the three leading models by at most 0.45, leaves the composite of the top-placed model unchanged at 88.7, and leaves the composition of the leading group identical. The grouping reported in Section 4.1 therefore survives repetition, while separations of a few points inside the field do not, which is why no ordering inside the leading group is claimed.
Two limitations of this check are stated plainly. The first execution was scored by one member of the team and the second by another [who scored the second execution without sight of the first-execution score sheet,] so the differences combine run-to-run variation in model behavior with between-rater variation in applying the rubric, and they bound run-to-run variation from above rather than isolating it. The two-sided pattern at cell level is what model stochasticity would be expected to produce. The upward drift in the totals is small, 1.1 points on average, and is consistent with a slightly more lenient application of the rubric by the second scorer, but the check cannot separate that from chance. Since the check is used only to argue that small differences must not be read as orderings, an upper bound on the variation is the conservative direction for that argument. The second limitation is scope. One repetition of one track establishes that the variation is non-zero and bounds its size, but it does not estimate a variance, and the two extraction tracks and the review track were not repeated at all.
4.6. Where the Agentic Points Went
The per-prompt matrix supports a direct attribution of loss. Each of the ten prompts is assigned to the capability family it was designed to exercise, and every point below 10 is charged to that family. This is attribution by prompt design rather than by root-cause coding of each individual deduction, so a point lost on a resolution prompt for a secondary reason, such as a missing export, is still charged to resolution. The per-prompt narratives allow readers to check where this matters. Across the eight agents, 800 points were available and 607 were scored, so 193 points were lost. Table 8 gives the totals by capability family, Table 9 gives the breakdown by model, and Figure 7 shows both.
Table 8.
Points lost on the agentic track by capability family, across all eight agents.
Table 9.
Points lost on the agentic track by model and capability family, out of 10 points per prompt. Lower is better.
Figure 7.
(a) Total points lost by capability family across all eight agents. (b) The composition of each model’s loss. In both panels lower values are better, because the quantity plotted is points lost.
Fuzzy name resolution accounts for 116 of the 193 points lost, which is 60 percent of all loss and a 48 percent loss rate within that family. Instruction and artifact quality accounts for 26.5 points, data and unit arithmetic for 25.5, and safety and abstention for 25.0. Put differently, the field lost 4.5 times more points to resolving colloquial names than to all data extraction, unit conversion and geometric computation combined. The per-model composition in Table 9 and in Figure 7b shows that the pattern is not uniform. For the two leading agents, name resolution is a small residual, 1.5 points for Claude Fable 5 and 5.5 for Claude Opus 5. For the middle of the field it dominates: 25.0 of Kimi K3’s 31.5 lost points and 17.5 of GLM 5.2’s 28.5. The gap between the leading agents and the rest is therefore largely a name-resolution gap, which matters because that is the one failure family that can be removed by engineering rather than by waiting for better models.
4.7. Tokens, Cost and Latency
Figure 8 places quality against token efficiency and Figure 9 gives the consumption profile. Table 10, Table 11 and Table 12 give the underlying figures.
Figure 8.
Quality against token efficiency.
Figure 9.
(a) Token consumption by track, verified sessions only. (b) Reasoning-token volume and input cache-hit rate on the agentic track. In panel (a) and in the reasoning-token series of panel (b), lower values are better. For the cache-hit rate, higher is better.
Table 10.
Token consumption per track in thousands and the efficiency score.
Table 11.
Agentic-track operational profile.
Table 12.
Whole-benchmark token consumption and cost under three published rate scenarios.
Whole-benchmark consumption spans 155k tokens for DeepSeek V4 Flash on two tracks to 586k for Claude Fable 5 on four. Within the agentic track alone the spread runs from 99k for Gemini 3.1 Pro, which sets the track minimum to 243k for DeepSeek V4 Pro. That spread is driven by call count and caching rather than by verbosity. Gemini 3.6 Flash finished the ten prompts in 13 calls, while DeepSeek V4 Pro needed 32. Cache-hit rates on input ranged from 82 percent for DeepSeek V4 Pro down to zero for four models, namely Claude Fable 5, Gemini 3.6 Flash, Claude Opus 5 and Gemini 3.1 Pro, which therefore paid full input price on every call.
Reasoning-token volume separates two economic styles (Table 11). The deliberate reasoners are Claude Fable 5 at 53k, Gemini 3.6 Flash at 52k and DeepSeek V4 Pro at 41k reasoning tokens on the agentic track. The terse executor is GPT 5.6 Sol at 6.7k. Reasoning volume is one of the drivers of wall-clock time, alongside call count and provider throughput. Measured maximum-effort review latency ran to about 30 min for Kimi K3 and 15 to 20 min for both Claude models, against under 5 min for the remainder, and the three longest review times belong to the three highest review scores in the field. This is the quality-and-latency trade that test-time-compute scaling predicts [35].
Re-runs are a real and often overlooked cost. Beyond the reviewer re-runs, where Kimi K3’s four review sessions total 476k tokens against the 134k of its verified session, two extraction builds needed second attempts. The most instructive is GLM 5.2’s first code-profile run, which consumed its entire 64,000-token output allowance on reasoning, 63,997 of 64,000 output tokens, and emitted no usable content. That is a reasoning-budget exhaustion failure that transport-level success flags do not capture, and it argues for content-length validation in any production pipeline.
Under the pricing scenarios of Table 12, the entire four-track benchmark costs between $0.10 and $20.73 depending on the model and rate scenario. Applying the same three scenarios to the verified review sessions alone, and splitting each session by the model’s measured input and output ratio, a single full three-sheet maximum-effort review costs between $0.04 and $4.78. These are per-action economics in which routing, not affordability, is the binding decision.
5. Discussion
5.1. Agentic Applications for Documentation Review
On these ten prompts the field lost 4.5 times more points to mis-resolving colloquial level and view names than to data extraction, unit conversion and geometric computation combined. That inverts the emphasis of the code-generation literature, where synthesis correctness dominates evaluation [16,17]. It also differs from the one comparable in-tool study, in which API misuse was the largest error category at 48.3 percent of failures [22]. The difference is most plausibly a property of the tool contract and of the task mix rather than of the models: their tasks are creation-heavy, whereas the backend used here enforces a JSON response contract, wraps mutations in transactions and lets the model query model state before acting, so stale or malformed API calls surface and are corrected before they cost points, as the self-corrections by GLM 5.2 and DeepSeek V4 Pro on BM-05 show. Once API misuse is contained at tool level, what remains is grounding: mapping the user’s words onto the identifiers the model actually contains.
Two observations sharpen the implication. First, resolution ability is not a stable property of a model. Claude Opus 5 failed the easier resolution probe on BM-03 and then solved the harder one on BM-05 autonomously within the same session block. Second, when resolution did succeed, it consumed reasoning effort that is expensive at scale. Both point the same way. Fuzzy name resolution is a deterministic, tool-side problem: it is a bounded approximate string-matching task over a queryable namespace [46]. Delegating it to model reasoning converts a solvable engineering task into a stochastic failure source. A resolver that maps user tokens to canonical names, with a single confirmation prompt when the match is ambiguous, would on the observed score sheet recover most of the 116 lost points and remove the silent-substitution failure mode entirely. For the median model in this field that is a recovery of about 18 points on the agentic track, rising to 25 points for the worst affected. It is the highest-leverage engineering fix this benchmark identifies on this prompt set and in this toolchain.
The scanned-code track shows that when source material is silently incomplete, models divide into a safe mode, which is to omit and move on, and a dangerous mode, which is to invent a plausible substitute. Here the invention took the specific form of inverting a paired percentage from an adjacent clause. The dangerous mode is the hallucination pattern the literature describes [19] but with a domain-specific severity profile. An inverted ventilation threshold produces systematically wrong compliance outcomes that look complete, which is worse than an obviously missing rule because nothing signals that a review is needed. Because no model recovered the image-only clause, the mitigation cannot be model choice alone. Pipelines that digitize scanned regulations should verify OCR coverage against the page images and require the extractor to flag regions it could not read [41]. Recent Arabic document-understanding benchmarks make the scale of that gap measurable [42]. This OCR-gap protocol should run before any profile is accepted, which echoes the rule-interpretation quality gates long advocated in compliance-checking research [3,4].
The decisive variables on the review track were not detection ability, since precision was close to universal, but severity discipline and the accuracy of self-reported confidence. The highest-recall run, 70 findings, ranked mid-field because a binary severity split and a uniform 100 percent confidence destroy triage value. The winning run paired the highest validated yield with one of the two lowest self-reported confidence levels in the field, 76 percent against a field range of 74 to 100 percent. This is calibration theory [20] expressed in workflow terms. A reviewer’s output is consumed by a prioritization process, so miscalibration taxes every downstream decision. Evaluation practice should follow. Scoring a drawing-review system by finding count, or by unverified model self-assessment [38], measures the wrong thing. Human-verified actionable yield with an explicit calibration component measured what mattered here.
5.2. Practical Implications
Three of eight agents generated deletion-oriented code within seconds of a destructive request and were saved only by the accident of an empty result set. Five of them investigated first. That five-to-three split, across current-generation models under identical prompts, confirms the central claim of agent-risk research: safe behavior cannot be assumed from model disposition [39]. The positive findings point to the enforcement layer. The toolchain’s automatic transaction wrapping already makes every mutation revertible. The observed failure pattern motivates one further gate, a mandatory read-back and confirmation step before element deletion, plus row-count validation on exports, which would have caught the empty workbook and the 3-byte CSV mechanically rather than by manual inspection. Under explicit time pressure none of the eight agents fabricated data on the two prompts designed to elicit it, and the forensic identity of eight independently produced pre-mutation audit logs indicates that capturing state before mutating was reliable default behavior here. Two prompts cannot establish a general property, and the extraction tracks show the opposite behavior on a different stimulus, where four models invented a ventilation threshold that the source document did not contain. The safe reading is that fabrication is stimulus-dependent: it was absent when the missing data were obviously absent and present when a plausible substitute lay nearby in the source. The risk in this workload has moved from invention toward over-confident interpretation and unsafe eagerness.
Quality and cost decouple in a way that is not linear. The two extraction tracks were led, jointly on Track 1a, by the model that consumed the fewest tokens on them. The review and agentic crowns cost roughly two to three times the track-minimum tokens and 15 to 30 min of wall time at maximum effort, which is consistent with returns to test-time compute [34,35]. Meanwhile the economy-tier models delivered 70 to 80 percent of leader quality at a small fraction of flagship cost. Absolute per-action costs are small, so the deployment question is routing rather than affordability. The results support four lanes: fast models for interactive work, deep review queued as an asynchronous batch job on the quality leaders, high-volume triage on the economy tier, and, where confidentiality forbids external APIs, the strongest open-weight model. This benchmark places that last option 8.1 points below the top of the leading group, with production-grade review quality. The eight-point figure is the price of data sovereignty measured on this workload mix, and it should be re-measured on any workload that weights the tracks differently. The recent finding that multi-agent BIM retrieval can be made substantially cheaper without losing accuracy [14] suggests that this price is likely to fall.
Using eight-model consensus, embedded adversarial probes and file forensics as checks on a manually verified key proved robust here. Every consensus value survived every probe and every forensic check, and none contradicted the manual reading of the model database. The approach is attractive wherever gold labels do not already exist, which is the normal situation for production workloads. Its limits should be stated plainly. Consensus cannot, in principle, detect an error that every model shares, and adversarial probes only falsify the failure modes their designers anticipated [37,38]. This study therefore uses consensus only where a value is independently checkable against the model database, meaning counts, element identifiers and geometry-derived quantities, and the manual check rather than the consensus is what fixes the value. The same restriction is recommended to future users of the method.
6. Limitations
Five limitations bound the claims made here. First, every score reported in Section 4 comes from a single execution of each task. The agentic track was repeated once during revision, and Section 4.5.6 reports the result: a model’s track total moves by 1.1 points on average between executions, a three-point separation between two systems reverses, and no composite moves by more than 1.8 points. That is one repetition of one track, by a different scorer, so it bounds the variation rather than estimating it, and the two extraction tracks and the review track were not repeated at all. Composite differences of a few points, including the 4.0-point spread across the leading group, must therefore not be read as orderings. Differences of ten points or more, such as the gap between the leading group and the middle of the field, are larger than any variation observed here and are unlikely to reverse under repetition. Second, the evidence base is one federated Revit model, one BEP, one national code, three drawing sheets, ten agentic prompts and one add-in suite. The findings are therefore claims about model behavior on this workload, not about BIM work in general. The failure taxonomy in particular rests on ten prompts, so the share attributed to each capability family is specific to this prompt set; what the study supports is that fuzzy name resolution was the dominant failure mode here and is deterministically solvable, not that it carries the same share in every workload. Generalization to other authoring platforms, other regulatory styles and other project types is untested, although the design ports directly to IFC-based pipelines [13]. Third, both rubric scoring and drawing-review adjudication were performed by members of the research team. The review findings were adjudicated by two authors who formed their judgements separately and then reconciled them, as described in Section 3.5, but only the reconciled decisions were recorded, so no inter-rater agreement statistic can be reported, the adjudicators are not independent of the study, and no external expert panel was engaged. Every rubric line item is published in Appendix A, every component score is published, and every artifact is archived, so any score can be recomputed and challenged by a third party. Fourth, the models are commercial API snapshots whose internals, context handling and safety layers are opaque and may change without notice. Finally, coverage is uneven by design, and the external baseline is a technical-preview build tested once. All cross-model rankings in this paper are restricted to matching coverage tiers, and the baseline is reported alongside the field rather than ranked within it.
7. Conclusions
This paper introduced a four-track benchmark that evaluates large language models on the actual information workloads of a BIM department: extraction from a BEP, digitization of a scanned multilingual code, human-verified drawing review, and live agentic automation in Revit. It applied that benchmark to ten current models with verified ground truth and complete economic telemetry and added a commercially released assistant as an external baseline.
Three results carry the practical weight.
First, the capability ceiling is high and the leading group is tight. Three models sit within 4.0 points of each other at the top, and the highest self-hostable open-weight model is 8.1 points below them. Re-weighting the same measured scores 20,000 times never places a model from outside that group first, and repeating the agentic track moves no composite by more than 1.8 points, so the composition of the group is a property of the measurements. The order inside it is not: it moves with the weighting, and repetition reverses the order of systems separated by three points on the agentic track. The practical reading is that the three are equivalent at this resolution and the choice between them is a choice of axis. For confidentiality-constrained deployments the eight-point gap means conceding quality, not feasibility.
Second, on this prompt set the dominant failure mode is neither code generation nor invention but fuzzy name resolution, which accounts for 60 percent of all agentic points lost. That is an engineering problem solvable deterministically in the tool layer. Combined with the five-to-three split on destructive-action discipline, it yields a concrete guardrail agenda: deterministic resolvers, confirmation gates before deletion, row-count validation on exports, and OCR-gap protocols on scanned sources. The benchmark quantifies the value of each.
Third, abstention held across the prompts tested. Under explicit time pressure none of the eight agents fabricated data on the two prompts designed to elicit it, and eight independent audit trails were forensically consistent.
Future work will add multi-seed repetition to estimate variance, beginning with at least three independent runs of the adversarial agentic track for the top four models so that per-prompt standard deviations can be reported alongside the point scores; port the benchmark to IFC-neutral toolchains; re-run the agentic track once the resolver guardrail ships so that tool-side gains can be isolated from model progress; and extend the benchmark to further projects, jurisdictions, and languages, which is what a claim about BIM work in general would require.
Author Contributions
Conceptualization, M.A. and P.H.D.N.; methodology, M.A. and P.H.D.N.; software, M.A.; validation, M.A. and A.A.; formal analysis, P.H.D.N.; investigation, M.A. and A.A.; data curation, M.A.; writing—original draft preparation, M.A.; writing—review and editing, A.A. and P.H.D.N.; supervision, P.H.D.N. All authors have read and agreed to the published version of the manuscript.
Funding
This research received no external funding.
Data Availability Statement
The dataset supporting the conclusions of this article is openly available in Zenodo at https://doi.org/10.5281/zenodo.23196456. It comprises the component-level rubric awards for all four tracks, the ten reference prompts exactly as sent, the verified ground-truth values, the drawing-review adjudication record, the per-track token and cost telemetry, and the scoring script compute_scores.py, which verifies every published track score against the data and reproduces the composite scores, the weight-scenario table, and the randomized weight analysis reported in Section 4.2. Every score in the deposited workbook is a live formula over the component-level awards, so any rubric decision can be changed and its effect on the composite observed directly. The BIM Execution Plan is not redistributable because it is a client document; the answer key extracted from it is published in the deposit as rubric components. The building code is a public statute available from the Egyptian Official Gazette. The federated Revit model is client property; its verified state is published in the deposit as the ground-truth values of Section 3.7.
Conflicts of Interest
Author Mohamed Abdelsalam was employed by the company Noviqore, which he founded. Author Amr Ashmawi was employed by the company A.G. Kunz. The remaining author declares that the research was conducted in the absence of any commercial or financial relationships that could be construed as a potential conflict of interest.
Appendix A. Component-Level Scoring Matrices
Table A1.
Track 1a—BEP extraction.
Table A2.
Track 1b—scanned building-code extraction.
Table A3.
Track 2—distribution of findings across the three reviewed sheets.
Table A4.
Agentic track, both executions: score per reference prompt out of 10 and track total out of 100. Run 1 is July 2026 and is the execution reported throughout Section 4; run 2 is the October 2026 repeatability check.
References
- Sacks, R.; Eastman, C.; Lee, G.; Teicholz, P. BIM Handbook: A Guide to Building Information Modeling for Owners, Designers, Engineers, Contractors, and Facility Managers, 3rd ed.; Wiley: Hoboken, NJ, USA, 2018. [Google Scholar]
- ISO 19650-1:2018; Organization and Digitization of Information about Buildings and Civil Engineering Works, Including Building Information Modelling (BIM)—Information Management Using Building Information Modelling—Part 1: Concepts and Principles. International Organization for Standardization: Geneva, Switzerland, 2018.
- Eastman, C.; Lee, J.-M.; Jeong, Y.-S.; Lee, J.-K. Automatic rule-based checking of building designs. Autom. Constr. 2009, 18, 1011–1033. [Google Scholar] [CrossRef] [Scilit]
- Amor, R.; Dimyadi, J. The promise of automated compliance checking. Dev. Built Environ. 2021, 5, 100039. [Google Scholar] [CrossRef] [Scilit]
- Beach, T.H.; Hippolyte, J.-L.; Rezgui, Y. Towards the adoption of automated regulatory compliance checking in the built environment. Autom. Constr. 2020, 118, 103285. [Google Scholar] [CrossRef] [Scilit]
- Saka, A.; Taiwo, R.; Saka, N.; Salami, B.A.; Ajayi, S.; Akande, K.; Kazemi, H. GPT models in construction industry: Opportunities, limitations, and a use case validation. Dev. Built Environ. 2024, 17, 100300. [Google Scholar] [CrossRef] [Scilit]
- Prieto, S.A.; Mengiste, E.T.; García de Soto, B. Investigating the use of ChatGPT for the scheduling of construction projects. Buildings 2023, 13, 857. [Google Scholar] [CrossRef] [Scilit]
- Zheng, J.; Fischer, M. Dynamic prompt-based virtual assistant framework for BIM information search. Autom. Constr. 2023, 155, 105067. [Google Scholar] [CrossRef] [Scilit]
- Du, C.; Esser, S.; Nousias, S.; Borrmann, A. Text2BIM: Generating building models using a large language model-based multiagent framework. J. Comput. Civ. Eng. 2026, 40, 04025142. [Google Scholar] [CrossRef] [Scilit]
- Madireddy, S.; Gao, L.; Din, Z.U.; Kim, K.; Senouci, A.; Han, Z.; Zhang, Y. Large language model-driven code compliance checking in building information modeling. Electronics 2025, 14, 2146. [Google Scholar] [CrossRef] [Scilit]
- Iversen, O.; Huang, L. Leveraging large language models for BIM-based automated compliance checking. Autom. Constr. 2026, 182, 106707. [Google Scholar] [CrossRef] [Scilit]
- Chen, J.; Bao, Y. Multi-agent large language model framework for code-compliant automated design of reinforced concrete structures. Autom. Constr. 2025, 177, 106331. [Google Scholar] [CrossRef] [Scilit]
- Jin, S.; Kim, D.; Lee, J.; Lee, D. Evaluating large language models (LLMs) for semantic interpretation of IFC-based BIM data. Autom. Constr. 2026, 185, 106879. [Google Scholar] [CrossRef] [Scilit]
- Koh, P.T.; Xue, H.; Ma, J.; Cheng, J.C.P. Cost-effective and minimal-intervention BIM information retrieval via condensed multi-LLM agent code generation. Autom. Constr. 2026, 181, 106585. [Google Scholar] [CrossRef] [Scilit]
- Kang, T. AI agent framework research for dynamic BIM query via retrieval-augmented code generation for IFC. Buildings 2026, 16, 2786. [Google Scholar] [CrossRef] [Scilit]
- Chen, M.; Tworek, J.; Jun, H.; Yuan, Q.; Pinto, H.P.d.O.; Kaplan, J.; Edwards, H.; Burda, Y.; Joseph, N.; Brockman, G.; et al. Evaluating large language models trained on code. arXiv 2021, arXiv:2107.03374. [Google Scholar] [CrossRef] [Scilit]
- Jimenez, C.E.; Yang, J.; Wettig, A.; Yao, S.; Pei, K.; Press, O.; Narasimhan, K. SWE-bench: Can language models resolve real-world GitHub issues? In Proceedings of the 12th International Conference on Learning Representations (ICLR), Vienna, Austria, 7–11 May 2024. [Google Scholar]
- Liu, X.; Yu, H.; Zhang, H.; Xu, Y.; Lei, X.; Lai, H.; Gu, Y.; Ding, H.; Men, K.; Yang, K.; et al. AgentBench: Evaluating LLMs as agents. In Proceedings of the 12th International Conference on Learning Representations (ICLR), Vienna, Austria, 7–11 May 2024. [Google Scholar]
- Ji, Z.; Lee, N.; Frieske, R.; Yu, T.; Su, D.; Xu, Y.; Ishii, E.; Bang, Y.J.; Madotto, A.; Fung, P. Survey of hallucination in natural language generation. ACM Comput. Surv. 2023, 55, 248. [Google Scholar] [CrossRef] [Scilit]
- Guo, C.; Pleiss, G.; Sun, Y.; Weinberger, K.Q. On calibration of modern neural networks. In Proceedings of the 34th International Conference on Machine Learning (ICML), Sydney, Australia, 6–11 August 2017; pp. 1321–1330, PMLR 70. [Google Scholar]
- Nithyanantham, B.K.; Kujat, C.; Sesterhenn, T.; Telgmann, S.; Nedungadi, A.; Plönnigs, J.; Bartelt, C.; Lüdtke, S. BIM-Edit: Benchmarking large language models for IFC-based building information modeling. arXiv 2026, arXiv:2606.20146. [Google Scholar] [CrossRef] [Scilit]
- Alwashah, Z.; Xiao, B.; Liu, H.; Mueller, S.T.; Shao, X. Reliable LLM-driven BIM automation through capability-based multi-dimensional evaluation. Autom. Constr. 2026, 187, 106910. [Google Scholar] [CrossRef] [Scilit]
- Li, T.; Ge, X.; Wang, Z.; Ren, P.; Xu, Z. Multimodal large language model (MLLM) benchmark for intelligent construction in underground engineering. Autom. Constr. 2026, 188, 106997. [Google Scholar] [CrossRef] [Scilit]
- Solihin, W.; Eastman, C. Classification of rules for automated BIM rule checking development. Autom. Constr. 2015, 53, 69–82. [Google Scholar] [CrossRef] [Scilit]
- Preidel, C.; Borrmann, A. Towards code compliance checking on the basis of a visual programming language. J. Inf. Technol. Constr. 2016, 21, 402–421. [Google Scholar]
- Zhang, J.; El-Gohary, N.M. Semantic NLP-based information extraction from construction regulatory documents for automated compliance checking. J. Comput. Civ. Eng. 2016, 30, 04015014. [Google Scholar] [CrossRef] [Scilit]
- Zhang, J.; El-Gohary, N.M. Integrating semantic NLP and logic reasoning into a unified system for fully-automated code checking. Autom. Constr. 2017, 73, 45–57. [Google Scholar] [CrossRef] [Scilit]
- BS 1192-4:2014; Collaborative Production of Information. Part 4: Fulfilling Employer’s Information Exchange Requirements Using COBie—Code of Practice. British Standards Institution: London, UK, 2014.
- Monteiro, A.; Poças Martins, J. A survey on modeling guidelines for quantity takeoff-oriented BIM-based design. Autom. Constr. 2013, 35, 238–253. [Google Scholar] [CrossRef] [Scilit]
- Gao, Y.; Hu, F.; Chai, C.; Weng, Y.; Li, H. Multi-agent framework for schema-guided reasoning and tool-augmented interaction with IFC models. Autom. Constr. 2026, 186, 106888. [Google Scholar] [CrossRef] [Scilit]
- Jiang, Z.; Dong, B. Buildrix: An open platform for sharing and benchmarking agentic AI skills in building engineering. arXiv 2026, arXiv:2606.25139. [Google Scholar] [CrossRef] [Scilit]
- Liang, P.; Bommasani, R.; Lee, T.; Tsipras, D.; Soylu, D.; Yasunaga, M.; Zhang, Y.; Narayanan, D.; Wu, Y.; Kumar, A.; et al. Holistic evaluation of language models. Trans. Mach. Learn. Res. 2023. [Google Scholar] [CrossRef] [Scilit]
- Chang, Y.; Wang, X.; Wang, J.; Wu, Y.; Yang, L.; Zhu, K.; Chen, H.; Yi, X.; Wang, C.; Wang, Y.; et al. A survey on evaluation of large language models. ACM Trans. Intell. Syst. Technol. 2024, 15, 39. [Google Scholar] [CrossRef] [Scilit]
- Wei, J.; Wang, X.; Schuurmans, D.; Bosma, M.; Ichter, B.; Xia, F.; Chi, E.; Le, Q.V.; Zhou, D. Chain-of-thought prompting elicits reasoning in large language models. Adv. Neural Inf. Process. Syst. 2022, 35, 24824–24837. [Google Scholar] [CrossRef] [Scilit]
- Snell, C.; Lee, J.; Xu, K.; Kumar, A. Scaling LLM test-time compute optimally can be more effective than scaling parameters for reasoning. In Proceedings of the 13th International Conference on Learning Representations (ICLR), Singapore, 24–28 April 2025. [Google Scholar]
- Yao, S.; Zhao, J.; Yu, D.; Du, N.; Shafran, I.; Narasimhan, K.; Cao, Y. ReAct: Synergizing reasoning and acting in language models. In Proceedings of the 11th International Conference on Learning Representations (ICLR), Kigali, Rwanda, 1–5 May 2023. [Google Scholar]
- Wang, X.; Wei, J.; Schuurmans, D.; Le, Q.; Chi, E.; Narang, S.; Chowdhery, A.; Zhou, D. Self-consistency improves chain of thought reasoning in language models. In Proceedings of the 11th International Conference on Learning Representations (ICLR), Kigali, Rwanda, 1–5 May 2023. [Google Scholar]
- Zheng, L.; Chiang, W.-L.; Sheng, Y.; Zhuang, S.; Wu, Z.; Zhuang, Y.; Lin, Z.; Li, Z.; Li, D.; Xing, E.; et al. Judging LLM-as-a-judge with MT-Bench and Chatbot Arena. In Proceedings of the 37th Conference on Neural Information Processing Systems (NeurIPS), Datasets and Benchmarks Track, New Orleans, LA, USA, 10–16 December 2023. [Google Scholar]
- Ruan, Y.; Dong, H.; Wang, A.; Pitis, S.; Zhou, Y.; Ba, J.; Dubois, Y.; Maddison, C.J.; Hashimoto, T. Identifying the risks of LM agents with an LM-emulated sandbox. In Proceedings of the 12th International Conference on Learning Representations (ICLR), Vienna, Austria, 7–11 May 2024. [Google Scholar]
- Arab Republic of Egypt. Law No. 119 of 2008 Promulgating the Unified Building Law and Its Executive Regulations; (In Arabic). Official Gazette: Cairo, Egypt, 2008.
- Smith, R. An overview of the Tesseract OCR engine. In Proceedings of the Ninth International Conference on Document Analysis and Recognition (ICDAR), Curitiba, Brazil, 23–26 September 2007; Volume 2, pp. 629–633. [Google Scholar] [CrossRef] [Scilit]
- Heakl, A.; Sohail, M.A.; Ranjan, M.; Elbadry, R.; Ahmad, G.S.; El-Geish, M.; Maher, O.; Shen, Z.; Khan, F.S.; Khan, S. KITAB-Bench: A comprehensive multi-domain benchmark for Arabic OCR and document understanding. In Proceedings of the Association for Computational Linguistics: ACL 2025, Vienna, Austria, 27 July–1 August 2025; pp. 22006–22024. [Google Scholar] [CrossRef] [Scilit]
- Nardo, M.; Saisana, M.; Saltelli, A.; Tarantola, S.; Hoffman, A.; Giovannini, E. Handbook on Constructing Composite Indicators: Methodology and User Guide; OECD Publishing: Paris, France, 2008. [Google Scholar] [CrossRef] [Scilit]
- Saisana, M.; Saltelli, A.; Tarantola, S. Uncertainty and sensitivity analysis techniques as tools for the quality assessment of composite indicators. J. R. Stat. Soc. Ser. A Stat. Soc. 2005, 168, 307–323. [Google Scholar] [CrossRef] [Scilit]
- Greco, S.; Ishizaka, A.; Tasiou, M.; Torrisi, G. On the methodological framework of composite indices: A review of the issues of weighting, aggregation, and robustness. Soc. Indic. Res. 2019, 141, 61–94. [Google Scholar] [CrossRef] [Scilit]
- Navarro, G. A guided tour to approximate string matching. ACM Comput. Surv. 2001, 33, 31–88. [Google Scholar] [CrossRef] [Scilit]
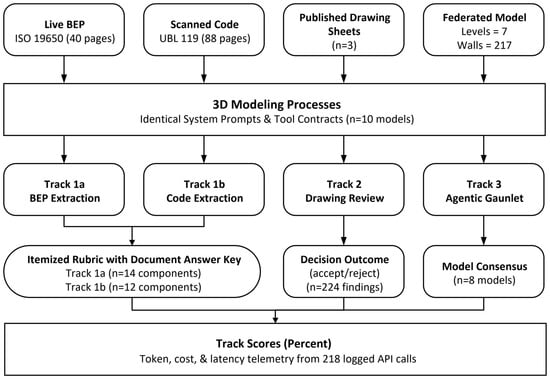
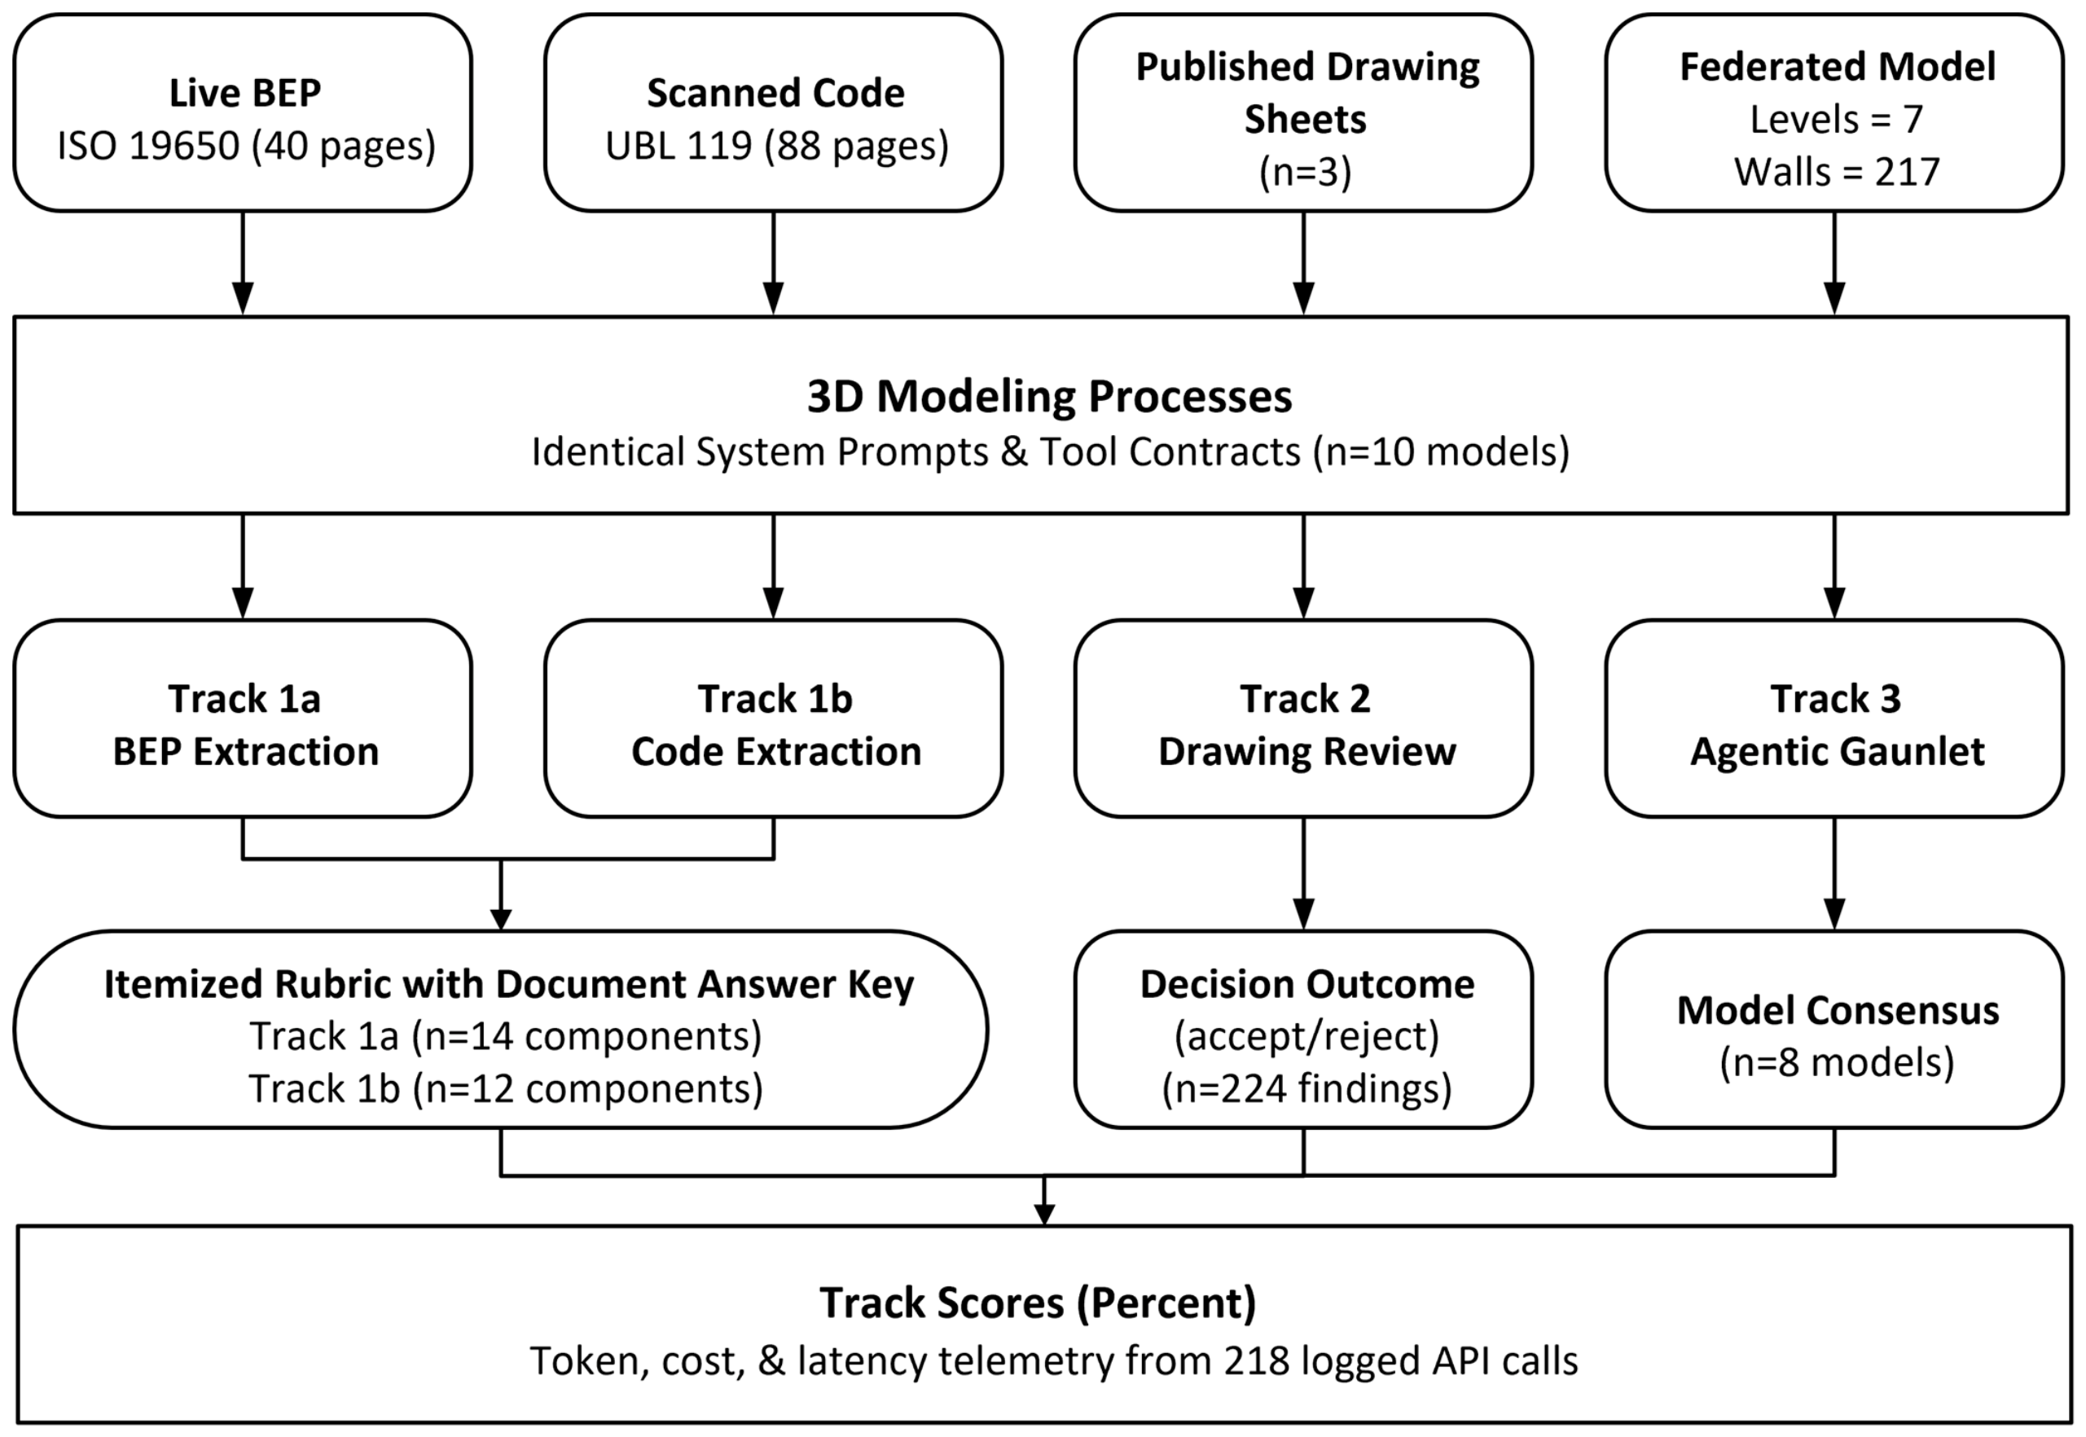
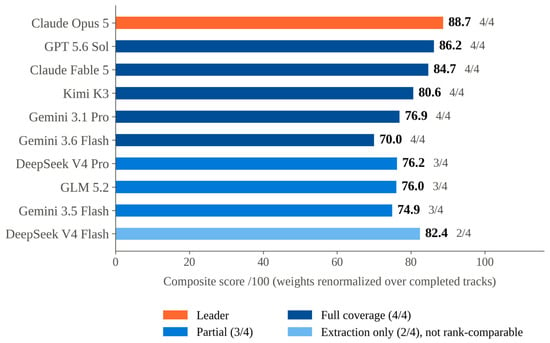
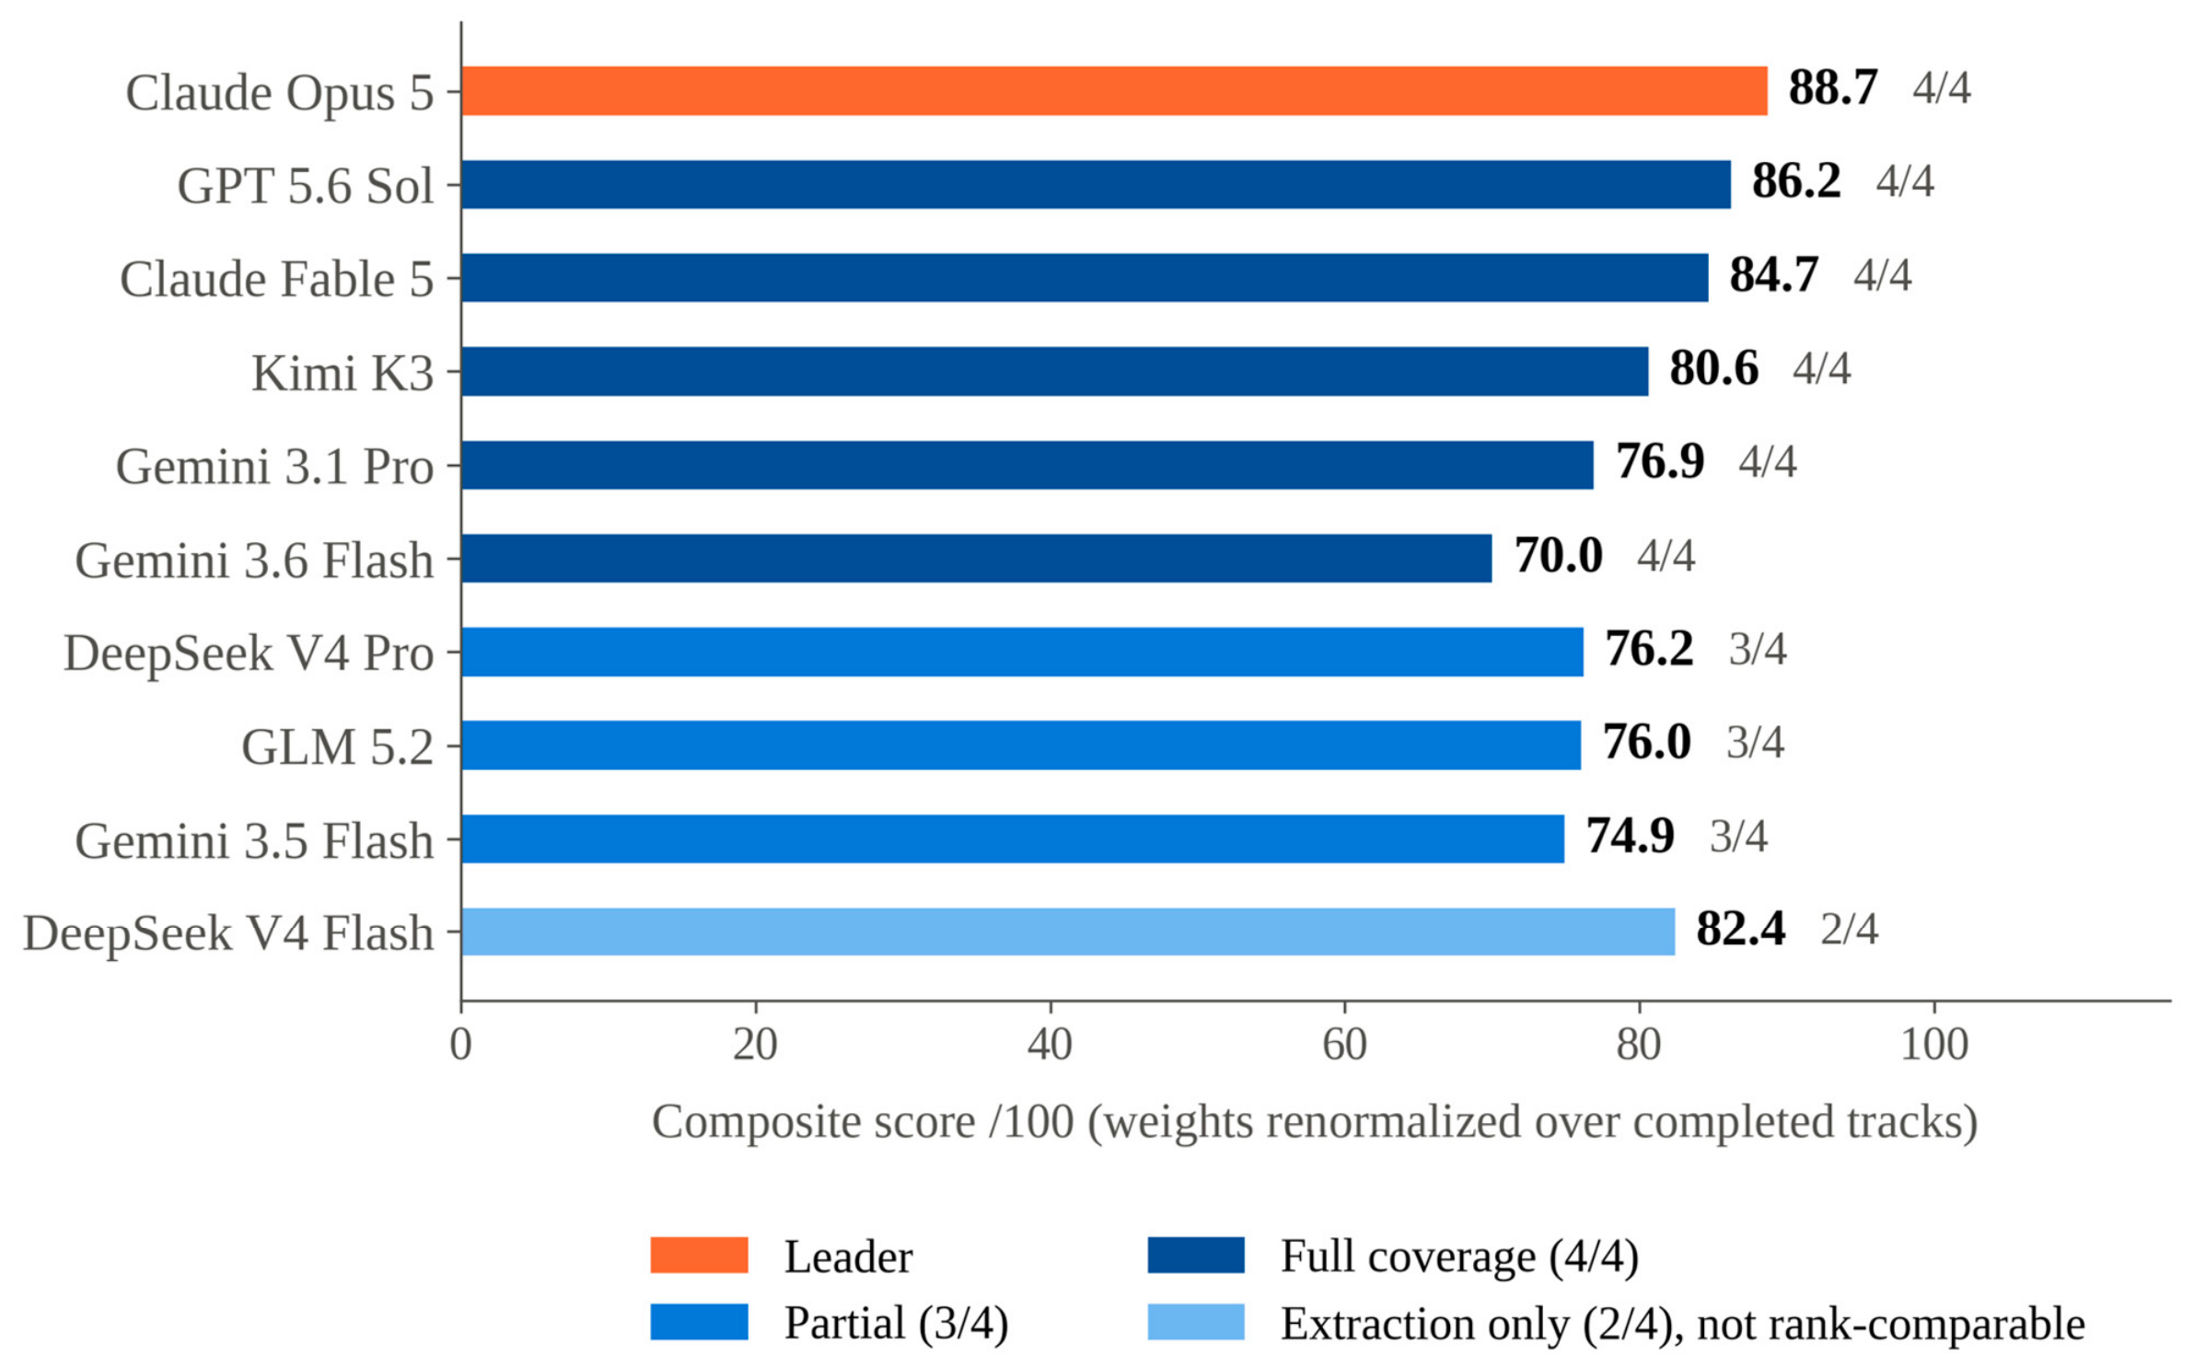
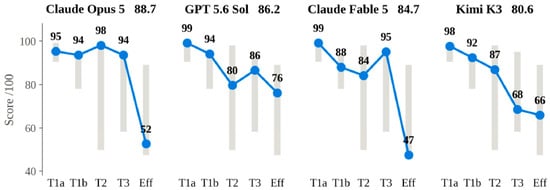
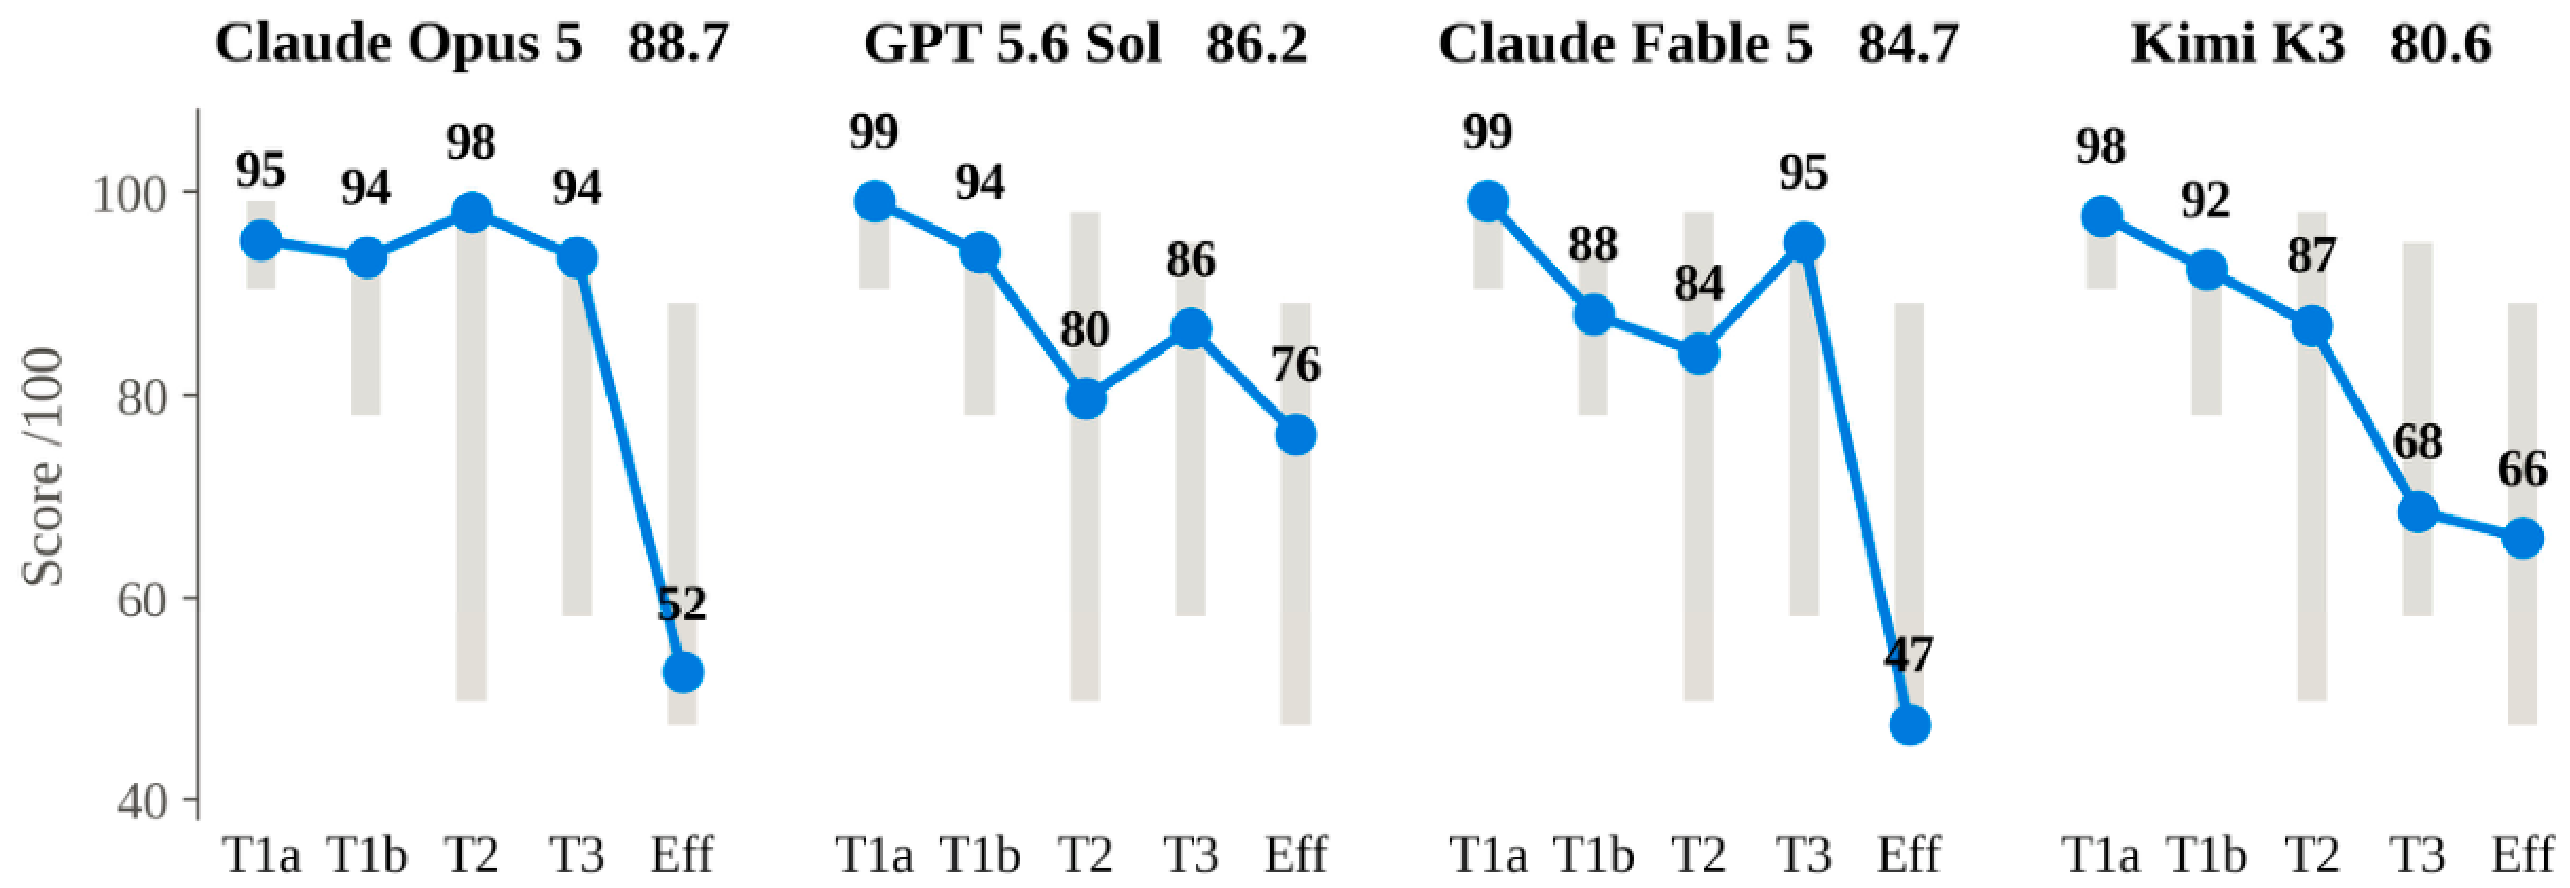
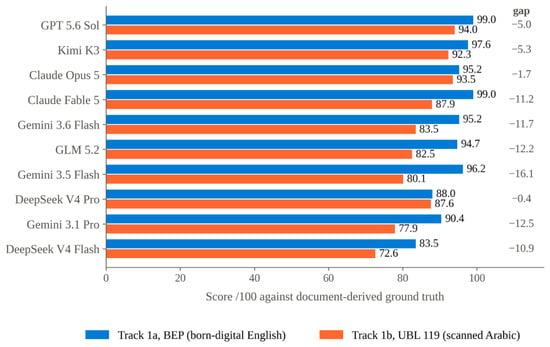
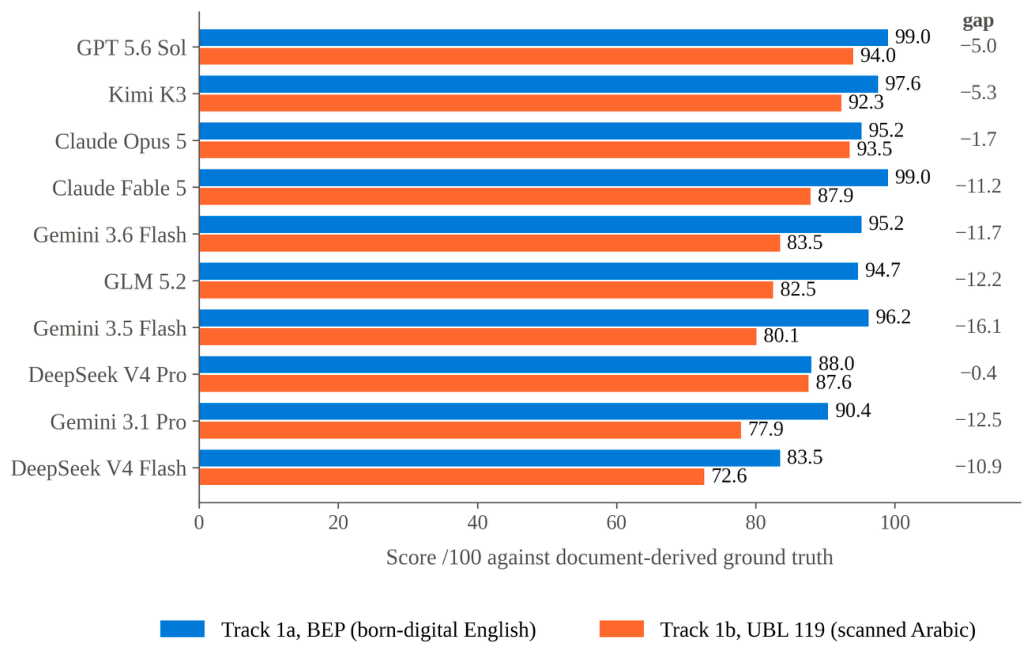
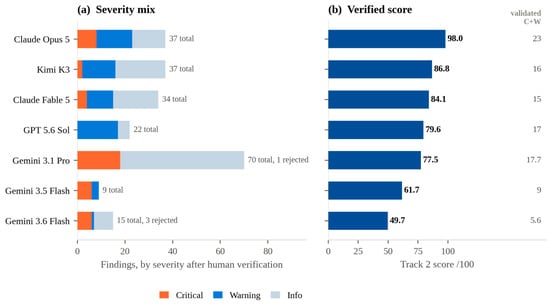
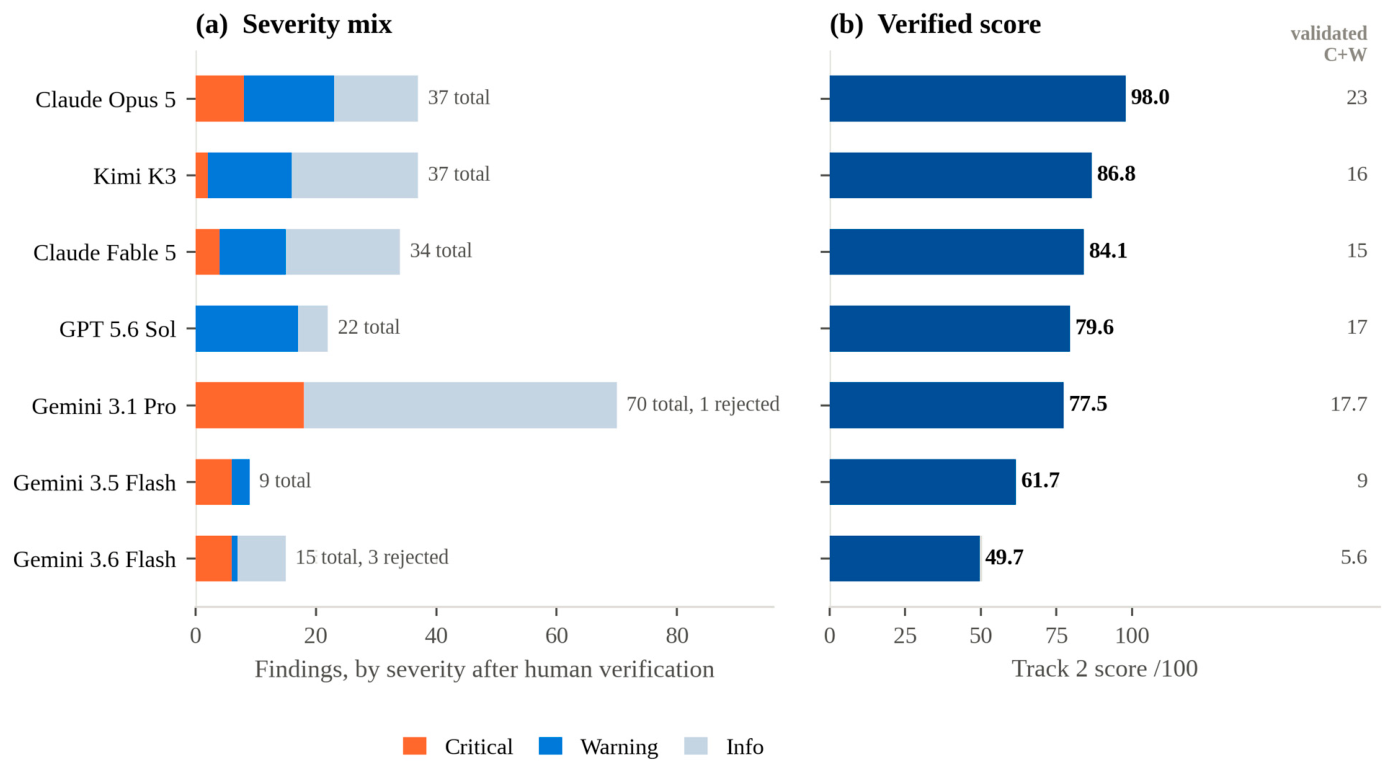
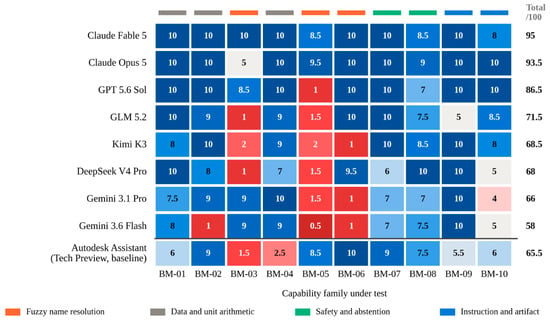
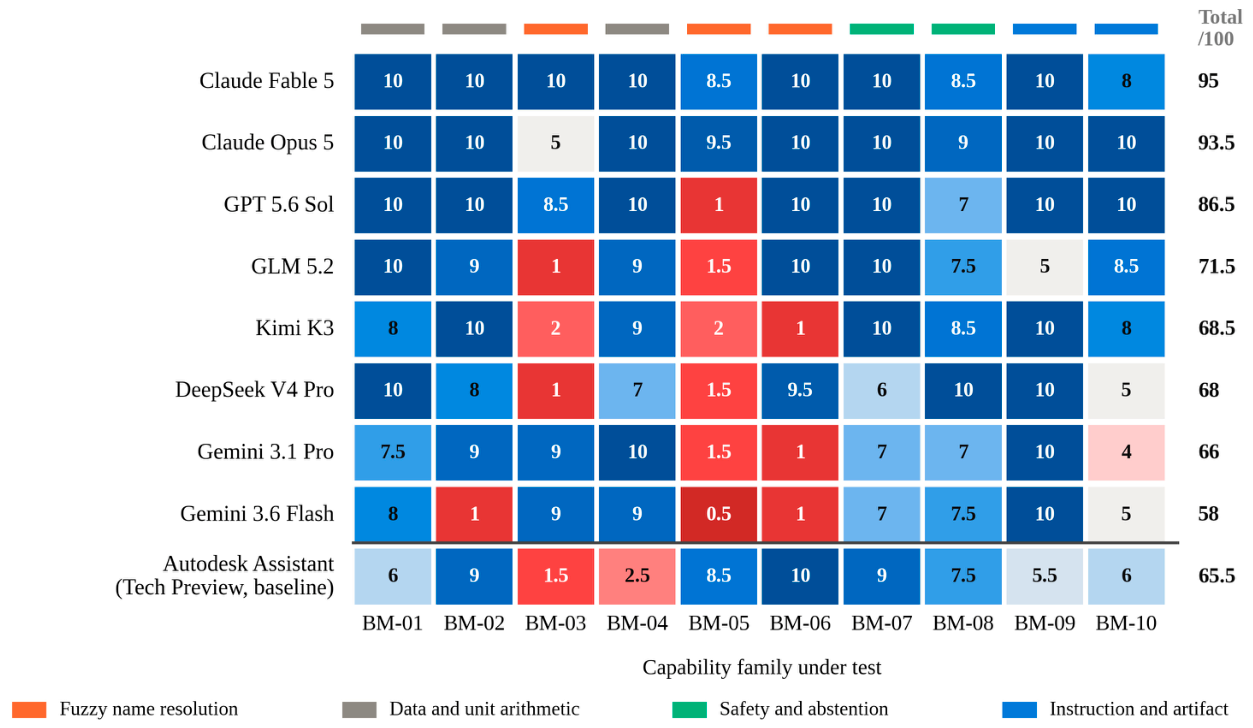
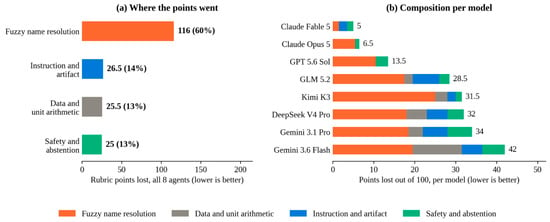
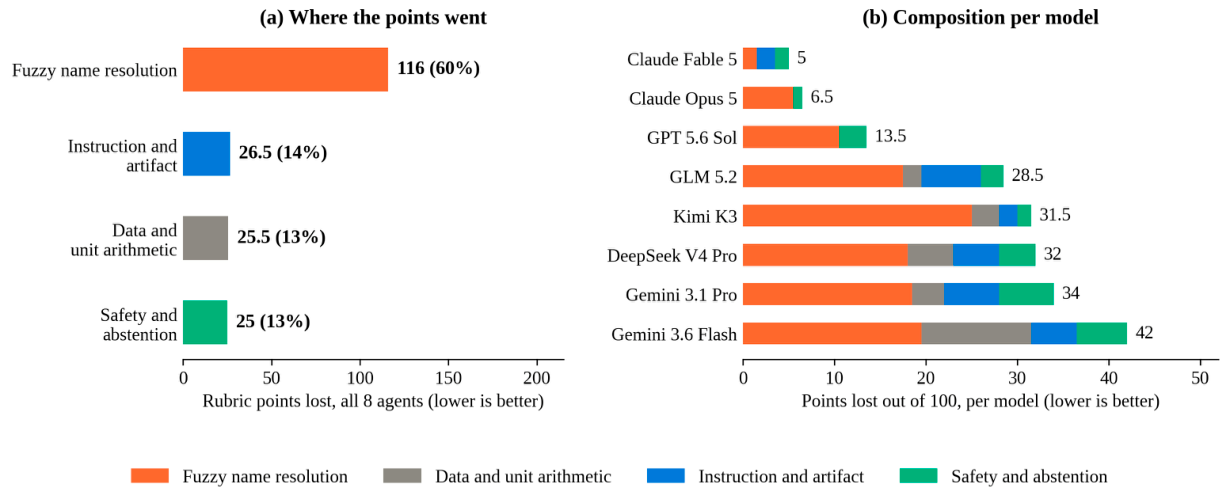
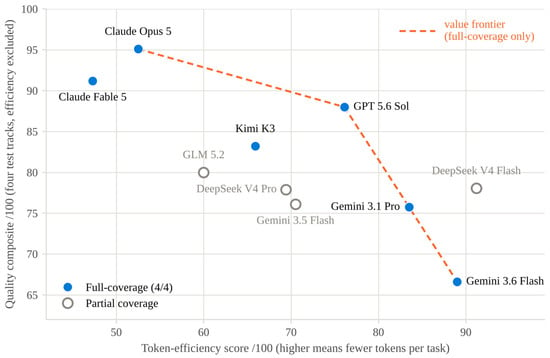
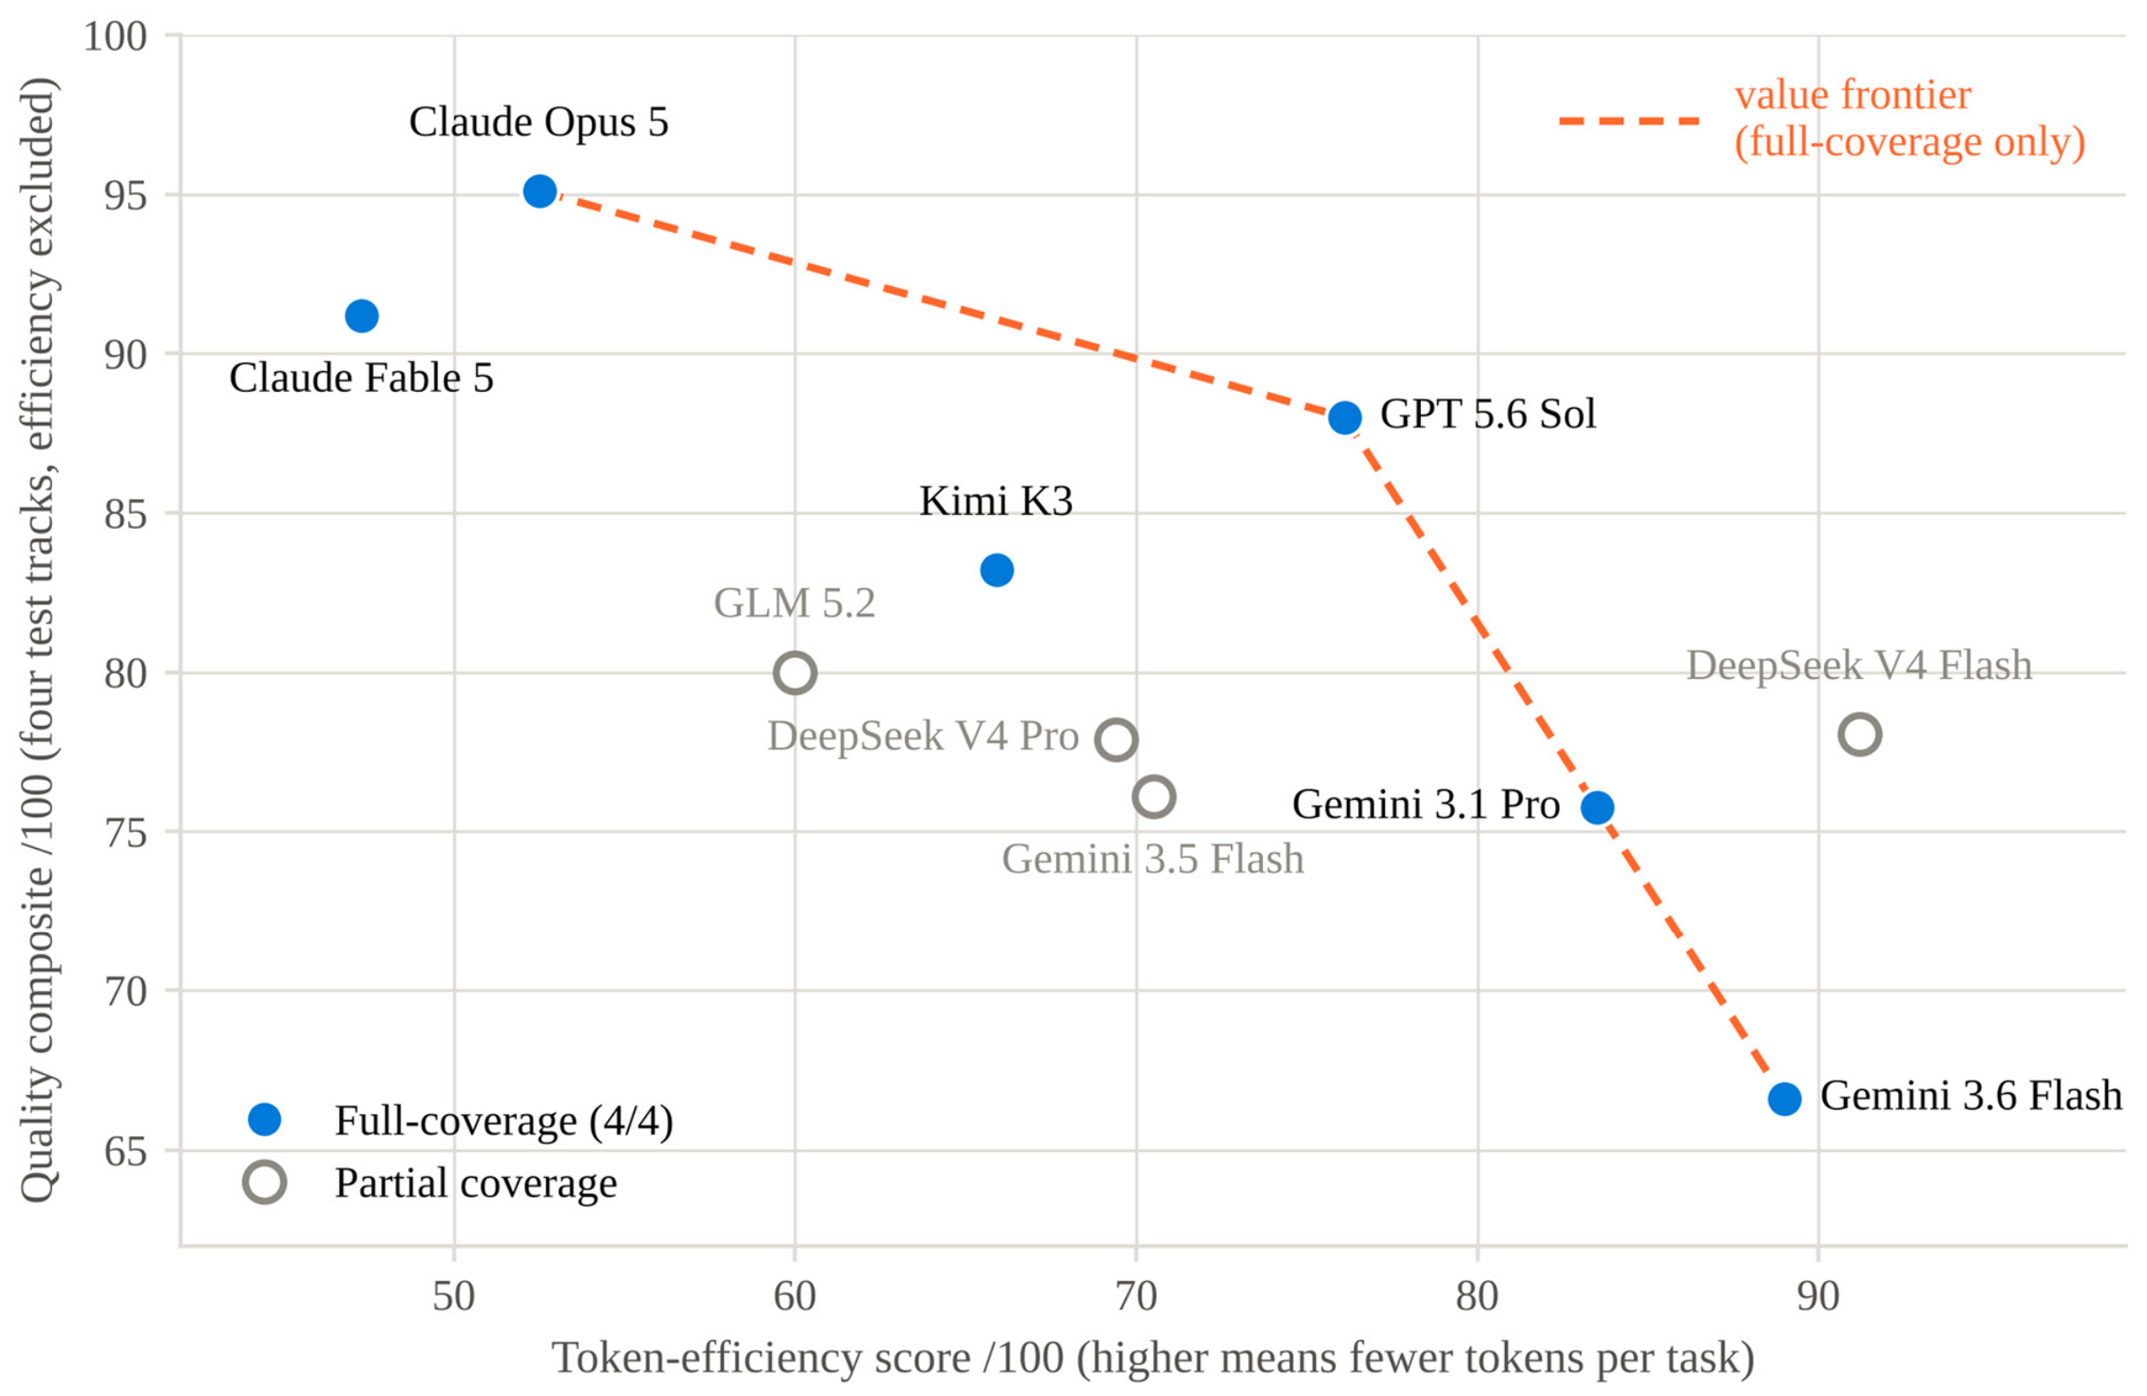
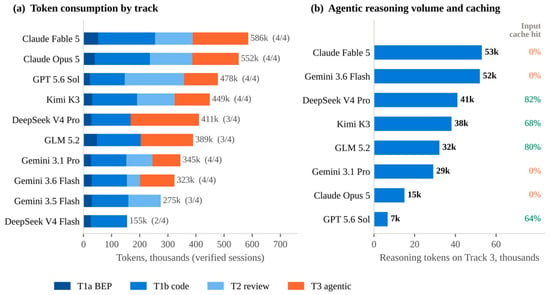
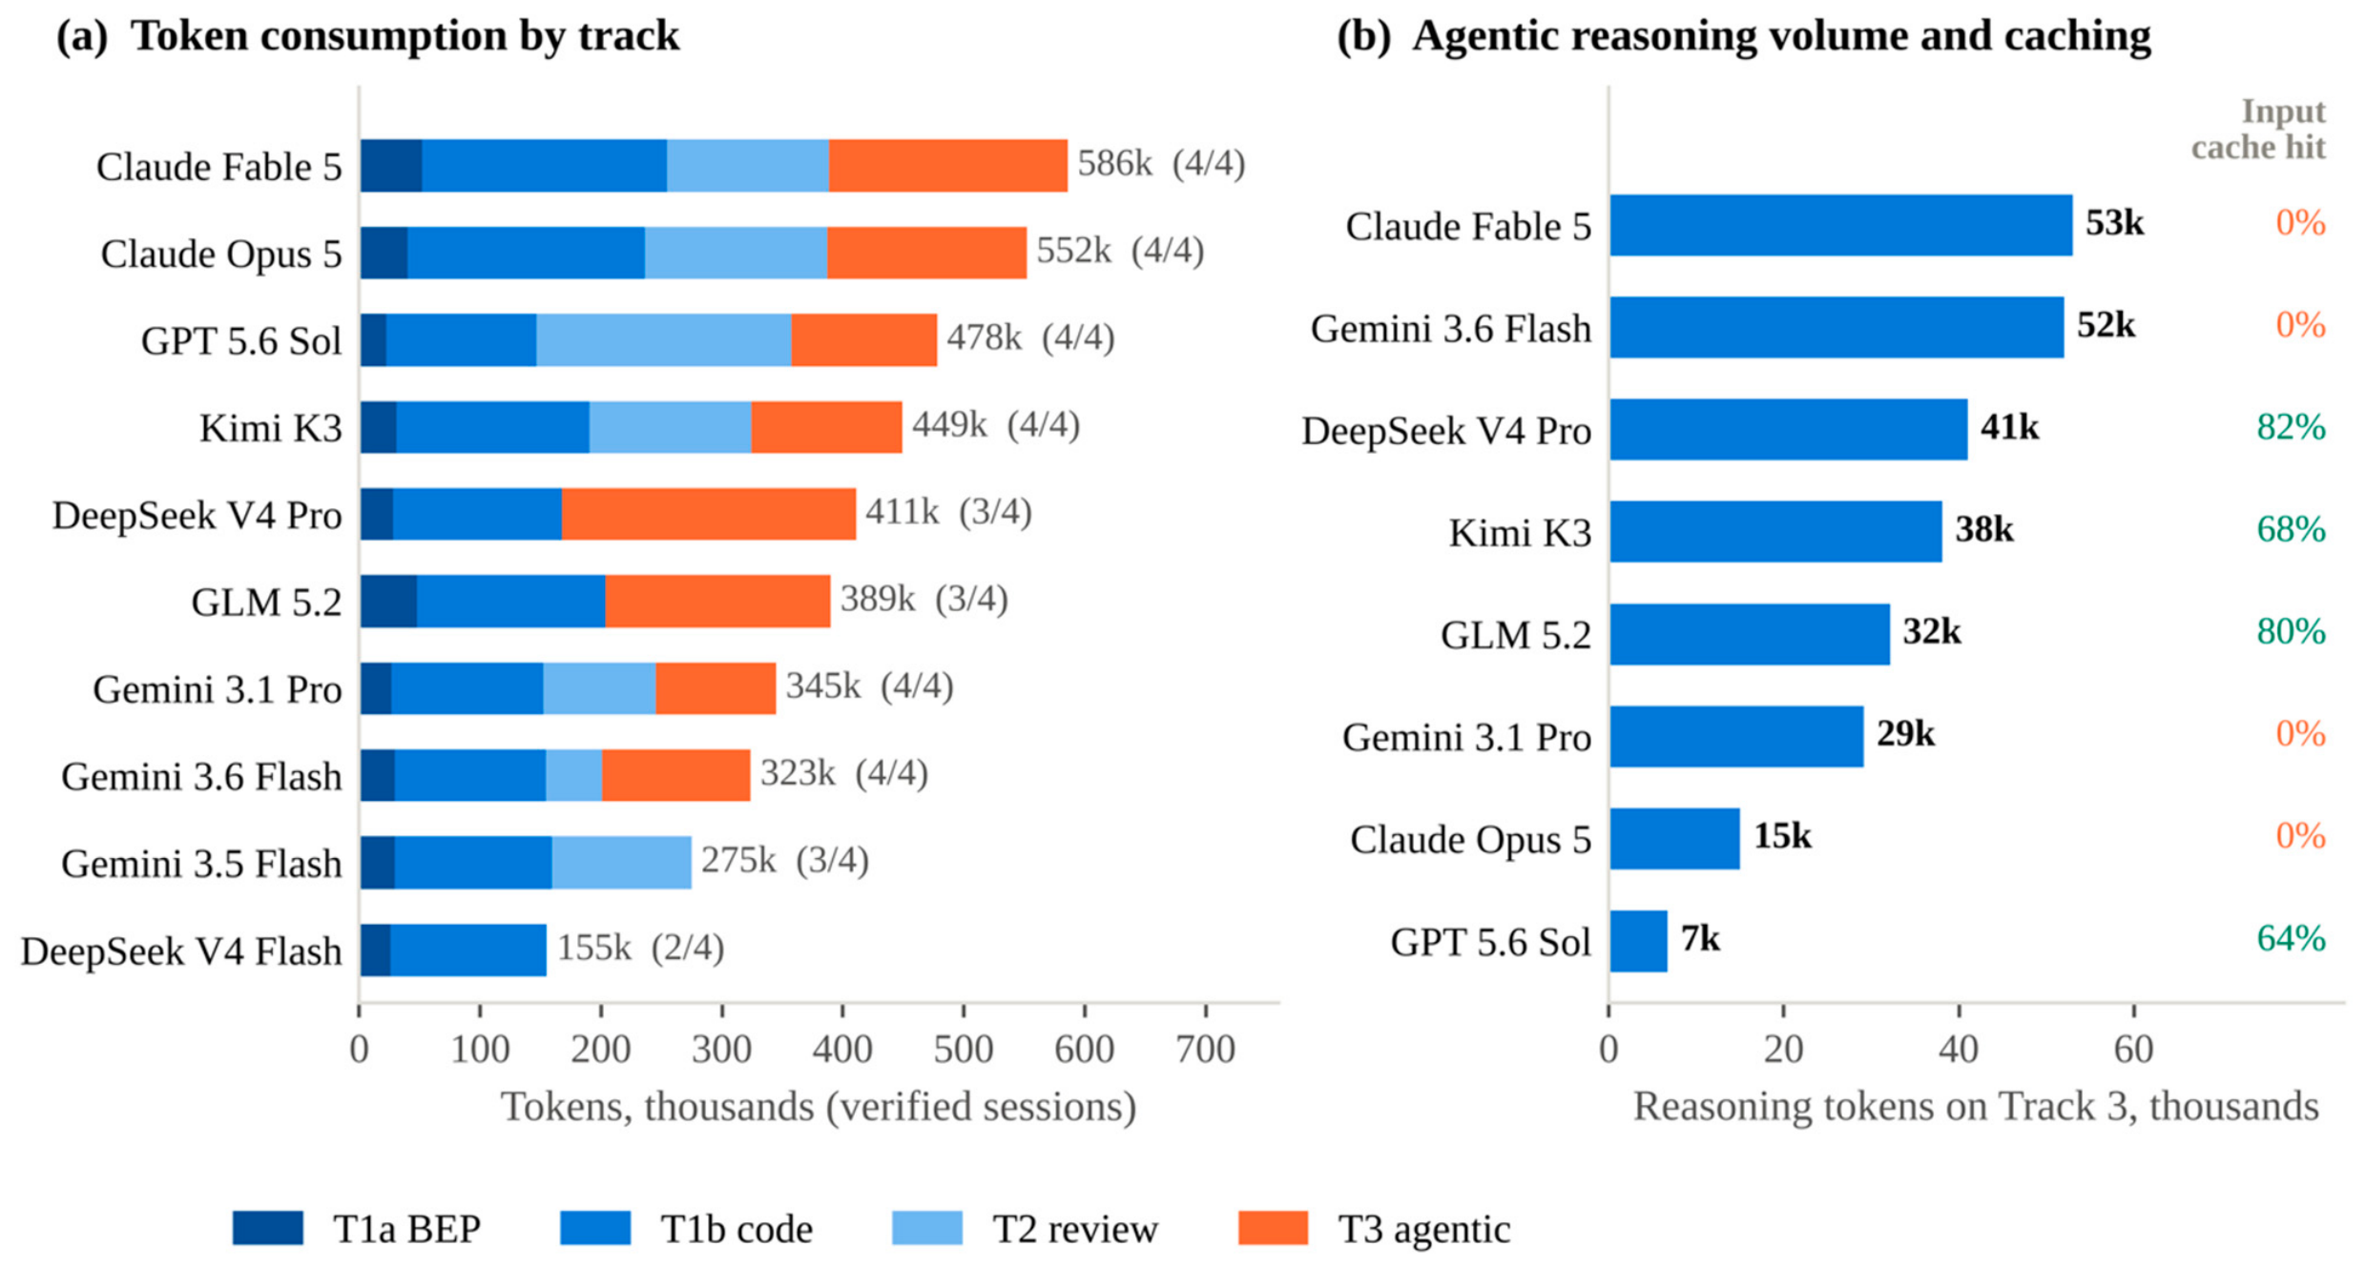

Disclaimer/Publisher’s Note: The statements, opinions and data contained in all publications are solely those of the individual author(s) and contributor(s) and not of MDPI and/or the editor(s). MDPI and/or the editor(s) disclaim responsibility for any injury to people or property resulting from any ideas, methods, instructions or products referred to in the content. |
© 2026 by the authors. Licensee MDPI, Basel, Switzerland. This article is an open access article distributed under the terms and conditions of the Creative Commons Attribution (CC BY) license.