


Abstract
Nighttime lighting represents a topical problem. This study aimed to explore the influence of interior and exterior lighting on a residential area environment at nighttime, mainly focusing on how windows and shadings impact the building and its surroundings. The research method involved analyzing light simulation outputs and processing light measurement data. Light simulations were run in DIALux software under specified conditions and light sources. Two different models of a building façade were simulated—one with a checkerboard arrangement of illuminated windows, and another with linear arrangements of the same. The window shading effect was studied for white metal blinds under three simulation variations—a window without shading, with horizontal blinds, and with blinds inclined at 45°. Light measurements provided data on the indoor and outdoor illuminance distribution as well as luminance and melanopic radiance images. The measurements were carried out for two cases to study the impact of external light on the dark interior and, conversely, the effect of a lit window on the exterior. The global distribution of light and radiant energy at a specific place and time was monitored using the Alanisator device developed within the framework of a university research project. This is a panoramic scanning system that measures both light and alpha-opic radiant and spatial quantities with high accuracy. In our study, the simulation outputs were in agreement with the measurements. The study was limited by the scope and time of the measurements: it included one type of shading blind and specified light sources for indoor and outdoor lighting. The main contribution of the study is in assessing the impact of window shading blinds in reducing obtrusive light at nighttime. It was proven that the selected type of blind is inefficient and, in specific cases, inclined blinds could increase obtrusive light compared to situations with non-shaded windows.
1. Introduction
The natural environment has been shaped by the regular alternation of daylight and night darkness periods since the very beginning of our planet’s existence. Living organisms evolved in this environment, adapting to the natural daily cycle over millions of years. Until the end of the 19th century, when street lighting began to be used more widely in cities, the only sources of light in the night environment were the Moon and stars, except for fire flames used as light sources. However, the invention of artificial lighting and its massive expansion changed the night environment. Artificial light has brought indisputable benefits but also causes a number of undesirable effects. Over the last hundred years, the natural patterns of light have been greatly disrupted through the introduction of artificial light into the nighttime environment [1]. Increasing reliance on artificial lighting changes natural rhythms of daylight and night darkness [2]. Artificial light has been introduced in places where it does not naturally occur, and at unnatural times and intensities, across a spectrum totally different from that of natural light sources [3].
1.1. Obtrusive Light
Anthropogenic light [4] in the nocturnal environment is human-generated light [5]. The human alteration of natural light cycles causes ecological impacts [6]. The effects of artificial light at night (ALAN) pose a serious problem, first highlighted by reports of astronomical observations [7] being disturbed by outdoor lighting installations [8]. ALAN is now perceived to cause problems across a wide range of professional disciplines. A surplus of nocturnal light has an obtrusive effect and acts as an environmental pollutant [9]. Its impact is exacerbated by developments in lighting technology [10], and its enormous and improper application.
Obtrusive light is defined as spill light which, because of its quantitative or directional attributes, causes annoyance, discomfort, or distraction or reduces one’s ability to see essential information such as transport signals [11]. Obtrusive light causes over-illumination, glare, sky glow, and light clutter, and originates from diverse light sources, including street, vehicle, architectural, advertising, and security lighting. According to the CIE definition [12], light pollution is the sum of all the adverse effects of artificial light. The definition of light pollution encompasses all adverse effects of anthropogenic light.
Light pollution represents a global problem [13,14]. It exerts detrimental effects on astronomical research and ecological balance [15,16,17]. At local levels, it is connected with economic and societal development [18]. Light pollution is evident from the specialized world atlas of artificial night sky brightness [19], which shows night sky luminance that creates artificial sky glow. The Sky Quality Map Europe [20] and satellite maps [21] reveal light pollution regions. Light pollution impacts the living environment, and the importance of the problem is obvious from standards and guides that recommend reducing obtrusive lighting. Long-term exposures to light at night can have serious health consequences [22]. Nocturnal artificial light affects natural biological rhythms and contributes to various health issues, ranging from poor sleep to metabolic dysfunction [23,24,25,26,27]. Light has been proven to influence health and biological rhythms [28,29], and research [30] points to the importance of light and darkness [31] for light hygiene [32,33].
Experts encourage [34] the use of natural light and minimizing the use of artificial lighting at night, indoors and outdoors, because of environmental, economic, and energy-saving demands [18]. It is desirable to prevent areas from being artificially lit and limit the time of electric light activation. It is recommended to minimize the intensity of night lighting and change the artificial light spectrum [35]. Good lighting practice entails providing the right light, at the right time, in the right place, controlled by the right system. Directives and guidance aim to reduce the impact of human lighting.
The CIE [36] specifies environmental zones in which different expectations should be met, ranging from dark sky parks and reservations to city centers and commercial areas with high district brightness. Their document addresses interfering light and establishes emission limits for light sources in these different areas, including vertical illumination limits for houses and brightness limits for the field of vision. In a document pertaining to urban lighting master planning [37], the influence of light on astronomical observation, ecological impacts, and health problems are noted together with visual and non-visual effects. A report dedicated to reductions in obstructive light [38] states light curtain brightness and threshold increment limits, and an appropriate light flux ratio for controlled lighting. Another official document [39] focuses on minimizing obtrusive light through targeted, low-intensity, and shielded lighting to protect biodiversity, human health, and the night sky. The European Union imposes specific requirements for protecting the night environment [40]. International challenges for light pollution monitoring are manifested [41].
The advancement of light pollution assessment methodology has played a significant role in shaping prevention and control strategies. A review of the characteristics of light pollution summarizes assessment techniques, policy, and legislation [35] and states that light pollution from artificial lighting significantly impacts human health, traffic safety, the ecological environment, astronomy, and energy use. Light intrusion into windows, the brightness intensity for glare identification, the upward light ratio for determining sky glow from lighting devices, and the observer perception of building brightness are also mentioned. The CIE Guidelines on Minimising Sky Glow provide general guidance for lighting designers and policy makers [42]. Regulations for building façade and logo sign brightness limits are specified [43]. The standard for the lighting of workplaces [44] imposes requirements for limiting vision discomfort glare [45] to minimize the perceived impact of light that is considered obtrusive.
The trend is to protect the natural environment from obtrusive lighting at nighttime [46,47]. On the ground, this disruption of natural light patterns takes two principal forms [48]. Nocturnal artificial light has been introduced in places where it does not naturally occur, and at unnatural times and intensities, with a spectrum different from that of sunlight or moonlight and starlight [48]. The spectrum of artificial light at night depends fundamentally on the kind of lighting device, which is in many cases different from the natural light environment. It is desirable to minimize the impact of nighttime artificial lighting, including its ecological consequences [49,50].
Artificial light at night disrupts natural biological rhythms and contributes to various health issues, ranging from poor sleep to metabolic dysfunction [51,52,53]. Room lighting at night significantly impacts the circadian rhythm, suppressing sleep-inducing hormones such as melatonin, increasing alertness, raising heart rate, and leading to poorer sleep quality, thereby affecting mood, cognition, and long-term health [54,55,56,57]. High-intensity blue-spectrum light disrupts sleep and physiology; dim and warm-colored light sources are recommended for night lighting [58].
1.2. Light and Buildings
The modern lifestyle requires intensive and high-performing activities, including those requiring lighting for the whole daytime. As people spend substantial parts of their lives in the enclosed spaces of buildings, proper lighting and visual comfort are key to people’s health and work performance. Lighting in the built environment affects human life and health. A lack of light quality can impair concentration and cause fatigue, discomfort, eye pain, headaches, depression, or other psychological problems. Poor lighting can even be a factor contributing to the so-called sick building syndrome.
Appropriate lighting does not only mean sufficient illuminance; over-illumination of spaces must be avoided. Excessive light can cause eye strain and headaches, which in turn reduce concentration and, consequently, work engagement and performance. Lighting should not create glare and shadows that strain the eyes and can lead to dangerous situations. It is always necessary to adjust lighting conditions so that they are balanced and suitable for the specific environment and visual activity.
Lighting conditions in buildings and outdoor spaces represent an integral part of the design parameters when considering the mutual relationships between occupants and their living environment [59].
Light pollution influences external lighting in urban areas and buildings, and it should be monitored and controlled [60,61,62]. Building façades and light advertising signs in big cities represent intensive sources of obtrusive light [63]. Building interiors could also be obtrusive at nighttime due to lit transparent areas. Research projects and evaluations have specialized in this problem. Nevertheless, studies on windows and their shadings mostly focus on daylight and integrated lighting [64,65,66]. Models of lighting systems in a room with blinds [67] and vertical surface radiation [68] were studied with the aim toward a comprehensive solution for indoor lighting [69]. Evaluations of spectral radiance fields and light pollution indoors were analyzed [70,71]. Some fundamental studies directly explore the impact of windows as obtrusive light elements. A study analyzed the quality of photometers using vertical window illuminance measurements at nighttime [72]. Another paper [73] provides insights into the effects of the light emitted from buildings toward the outdoor environment. A comprehensive study by [74] describes a method for evaluating windows’ impact on light pollution, analyzing how much artificial light a typical home emits toward the outdoor environment. The effects of glazed parts of building façades and window shadings and overhangs on light pollution were studied through light simulations by [75,76,77].
Windows can be illuminated at nighttime due to a variety of interior light sources, and their configurations represent a complex problem. Light transmittance is affected by glass curtains, shadings, and overhangs. It represents a large set of geometrical parameters, and optical properties such as internal surface color and surface roughness influence light reflectance and transmittance. Practical evaluations of nocturnal lighting in buildings are often simplified due to a lack of specified parameters and restricted access into buildings at nighttime. This study combines light measurements and simulations to comprehensively evaluate the effects of obtrusive light in a residential area.
1.3. Goal of the Present Study
This study aimed to explore the influence of both interior and exterior lighting on a residential area at nighttime. In particular, residential building window blinds and their effects on the building environment were studied.
The goal of this evaluation was to study the effects of light transmitted through a building’s windows to the external environment and the impact of outdoor advert lighting on the indoor environment. In big buildings, a lighted façade could play an obtrusive role for nearby areas. This study includes a comparative analysis of the influence of windows and shadings on both external and internal light conditions. The novelty of the presented method is in light measurements taken using a panoramic screening device to monitor photopic and melanopic images of interior and exterior places. The images together with light simulation outputs can support data for limiting intrusive light in buildings.
Several questions need to be addressed in relation to the topical problem:
- •
- What impacts could lighting in residential buildings have on nearby areas through their windows?
- •
- Are shading blinds efficient in reducing light transmission to the external space?
- •
- What are the luminance and melanopic exposures in a room illuminated solely by an external advertising sign?
2. Materials and Methods
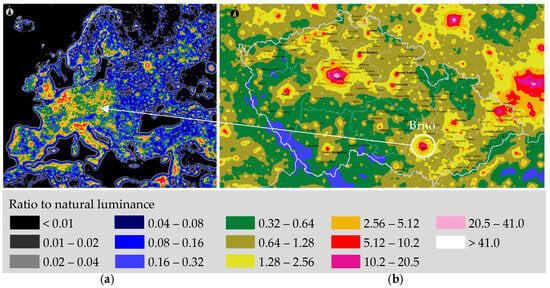
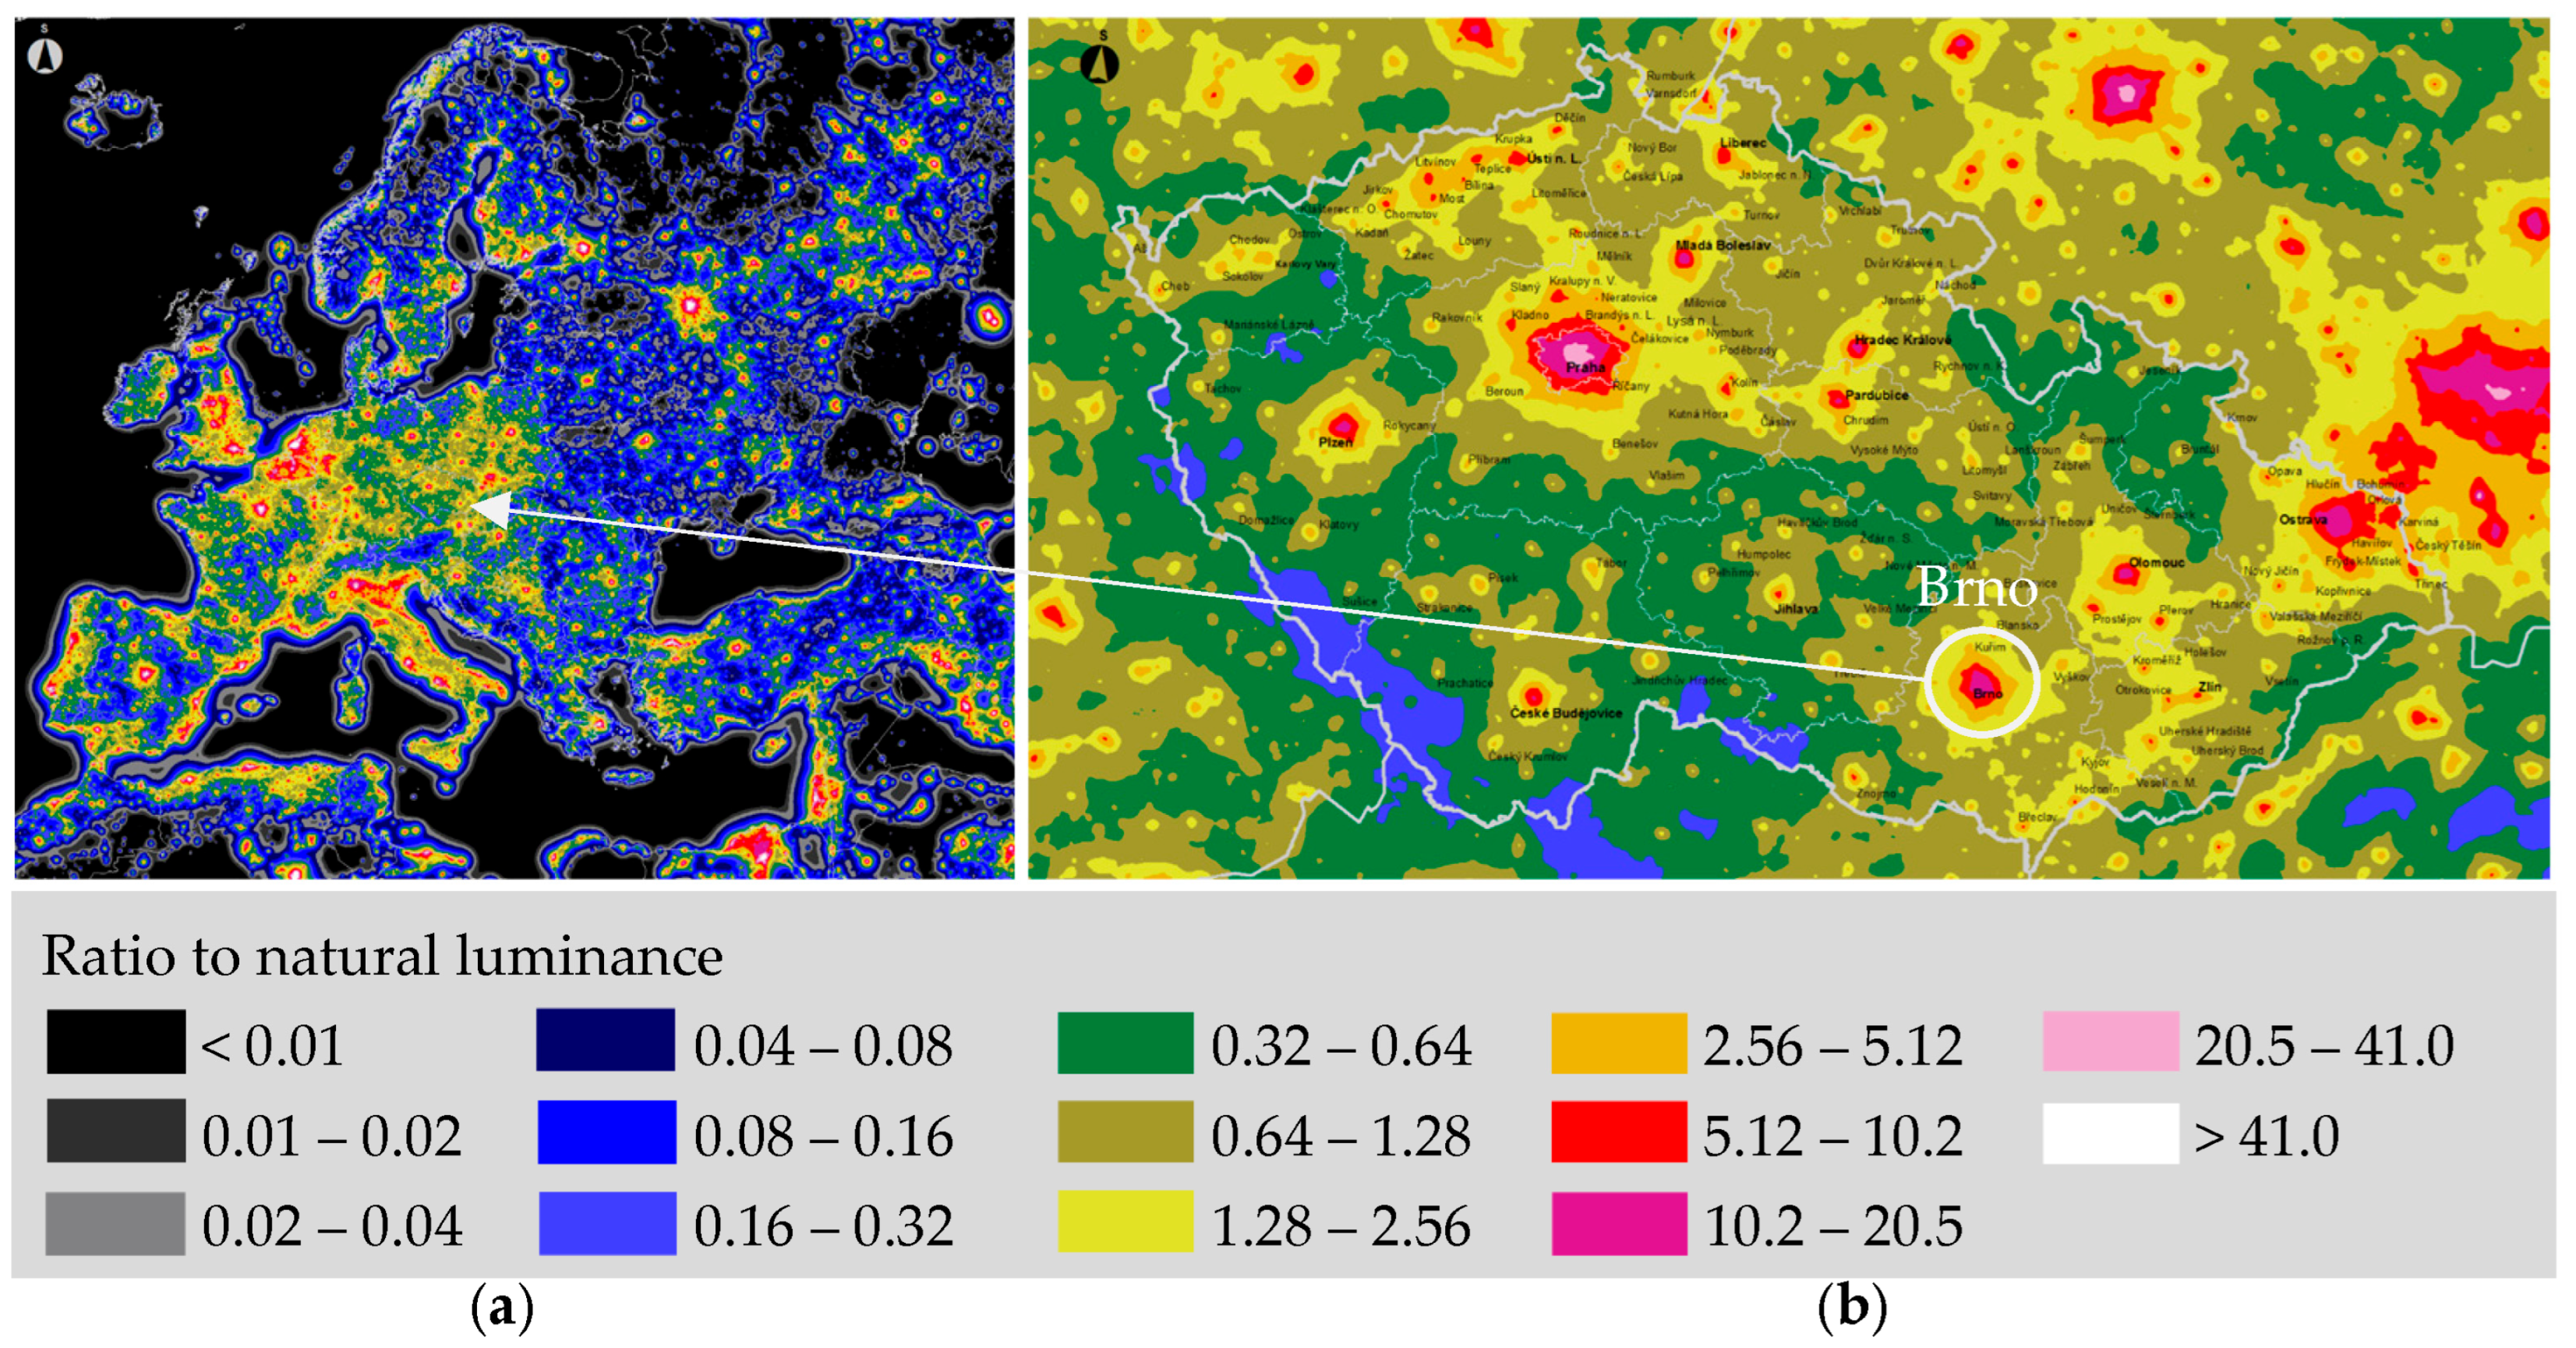
A university residence building and its influence on the outdoor environment were studied. The campus is located in Brno, Czech Republic (49°11′42.8″ N 16°36′28.7″ E). Brno is a statutory city, the second largest city in the Czech Republic, and is known as an industrial and university city and trade fair center. Light pollution appears to be a serious problem in this big city, as is obvious from the map of the artificial luminance of the night sky above the Czech Republic shown in Figure 1. The Brno region is highlighted on the map [78].
Figure 1.
Artificial luminance in the night sky: (a) Europe; (b) the Czech Republic (Brno is highlighted).
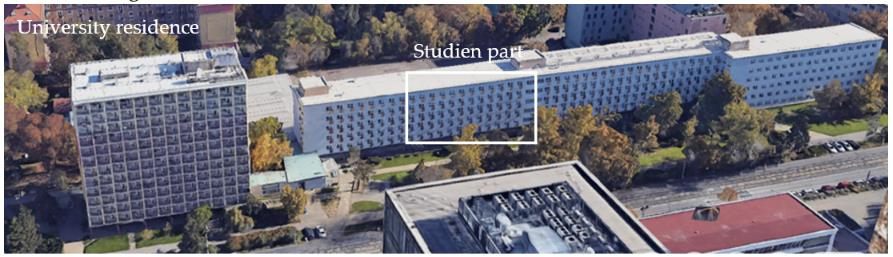
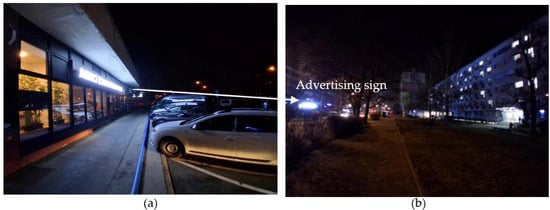
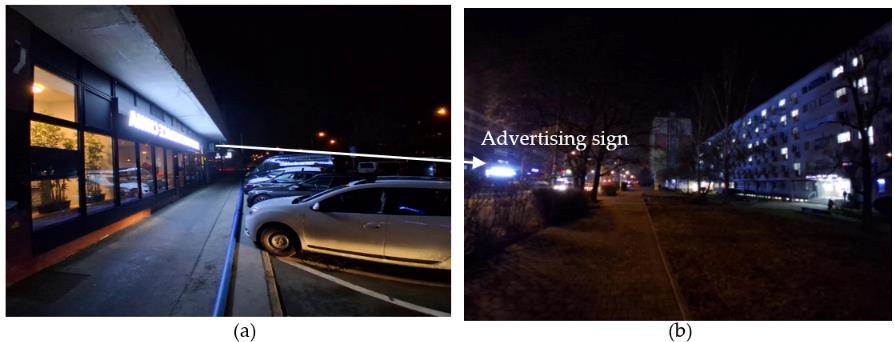
The residence building and its influence on outdoor lighting conditions were studied based on light simulation outputs and light measurements. The studied central part of the residence building is specified in the white rectangle in Figure 2. This part of the residential campus is directly influenced by a big light screen located on the opposite side of the street (Figure 3).
Figure 2.
The university residence building on the campus of Brno University of Technology.
Figure 3.
Advertising sign of the nearby building: (a) Nearby building with advertising sign. (b) Photograph with the university residence and the light advertising sign on the opposite side.
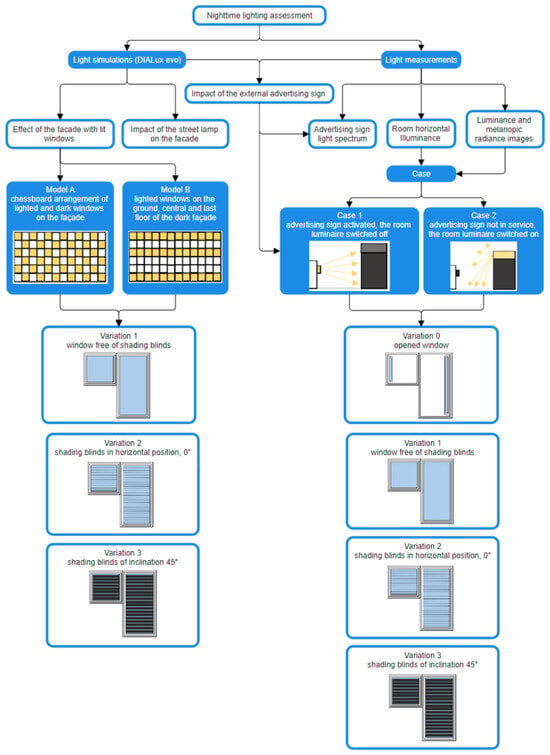
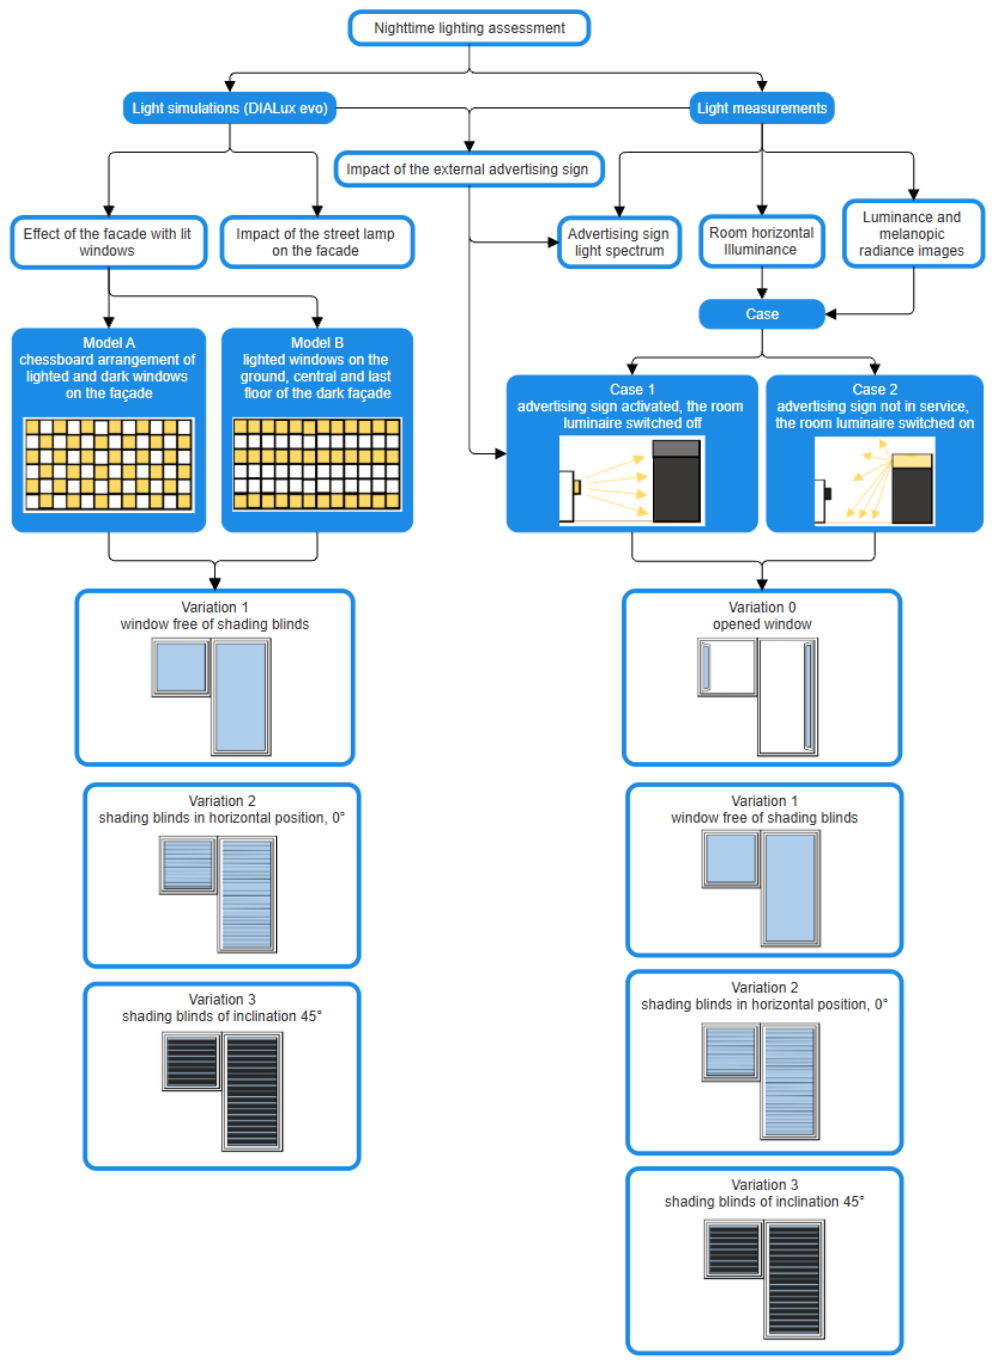
The nighttime lighting assessment was based on light simulations and measurements for specific window variations and lighting cases as presented in the diagram of Figure 4.
Figure 4.
The diagram of the nighttime lighting assessment methods.
2.1. Light Simulations
The lighting of a room within the student residence building in Brno and the lighting’s influence on the outdoor environment were studied through varied light simulations. The DIALux evo 14.0 software [79] was chosen to assess obtrusive lighting.
Simulations were run for the following conditions: Brno, latitude 49.21°, longitude 16.59°. North orientation 0°, time zone: UTC+01:00, assessment according to EN 12464-2, environmental zone E2, post-curfew time.
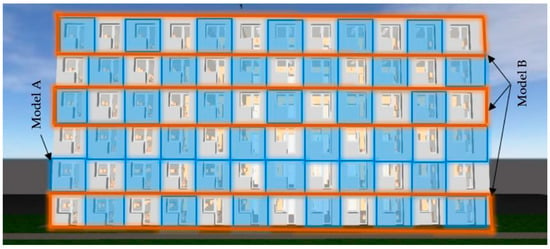
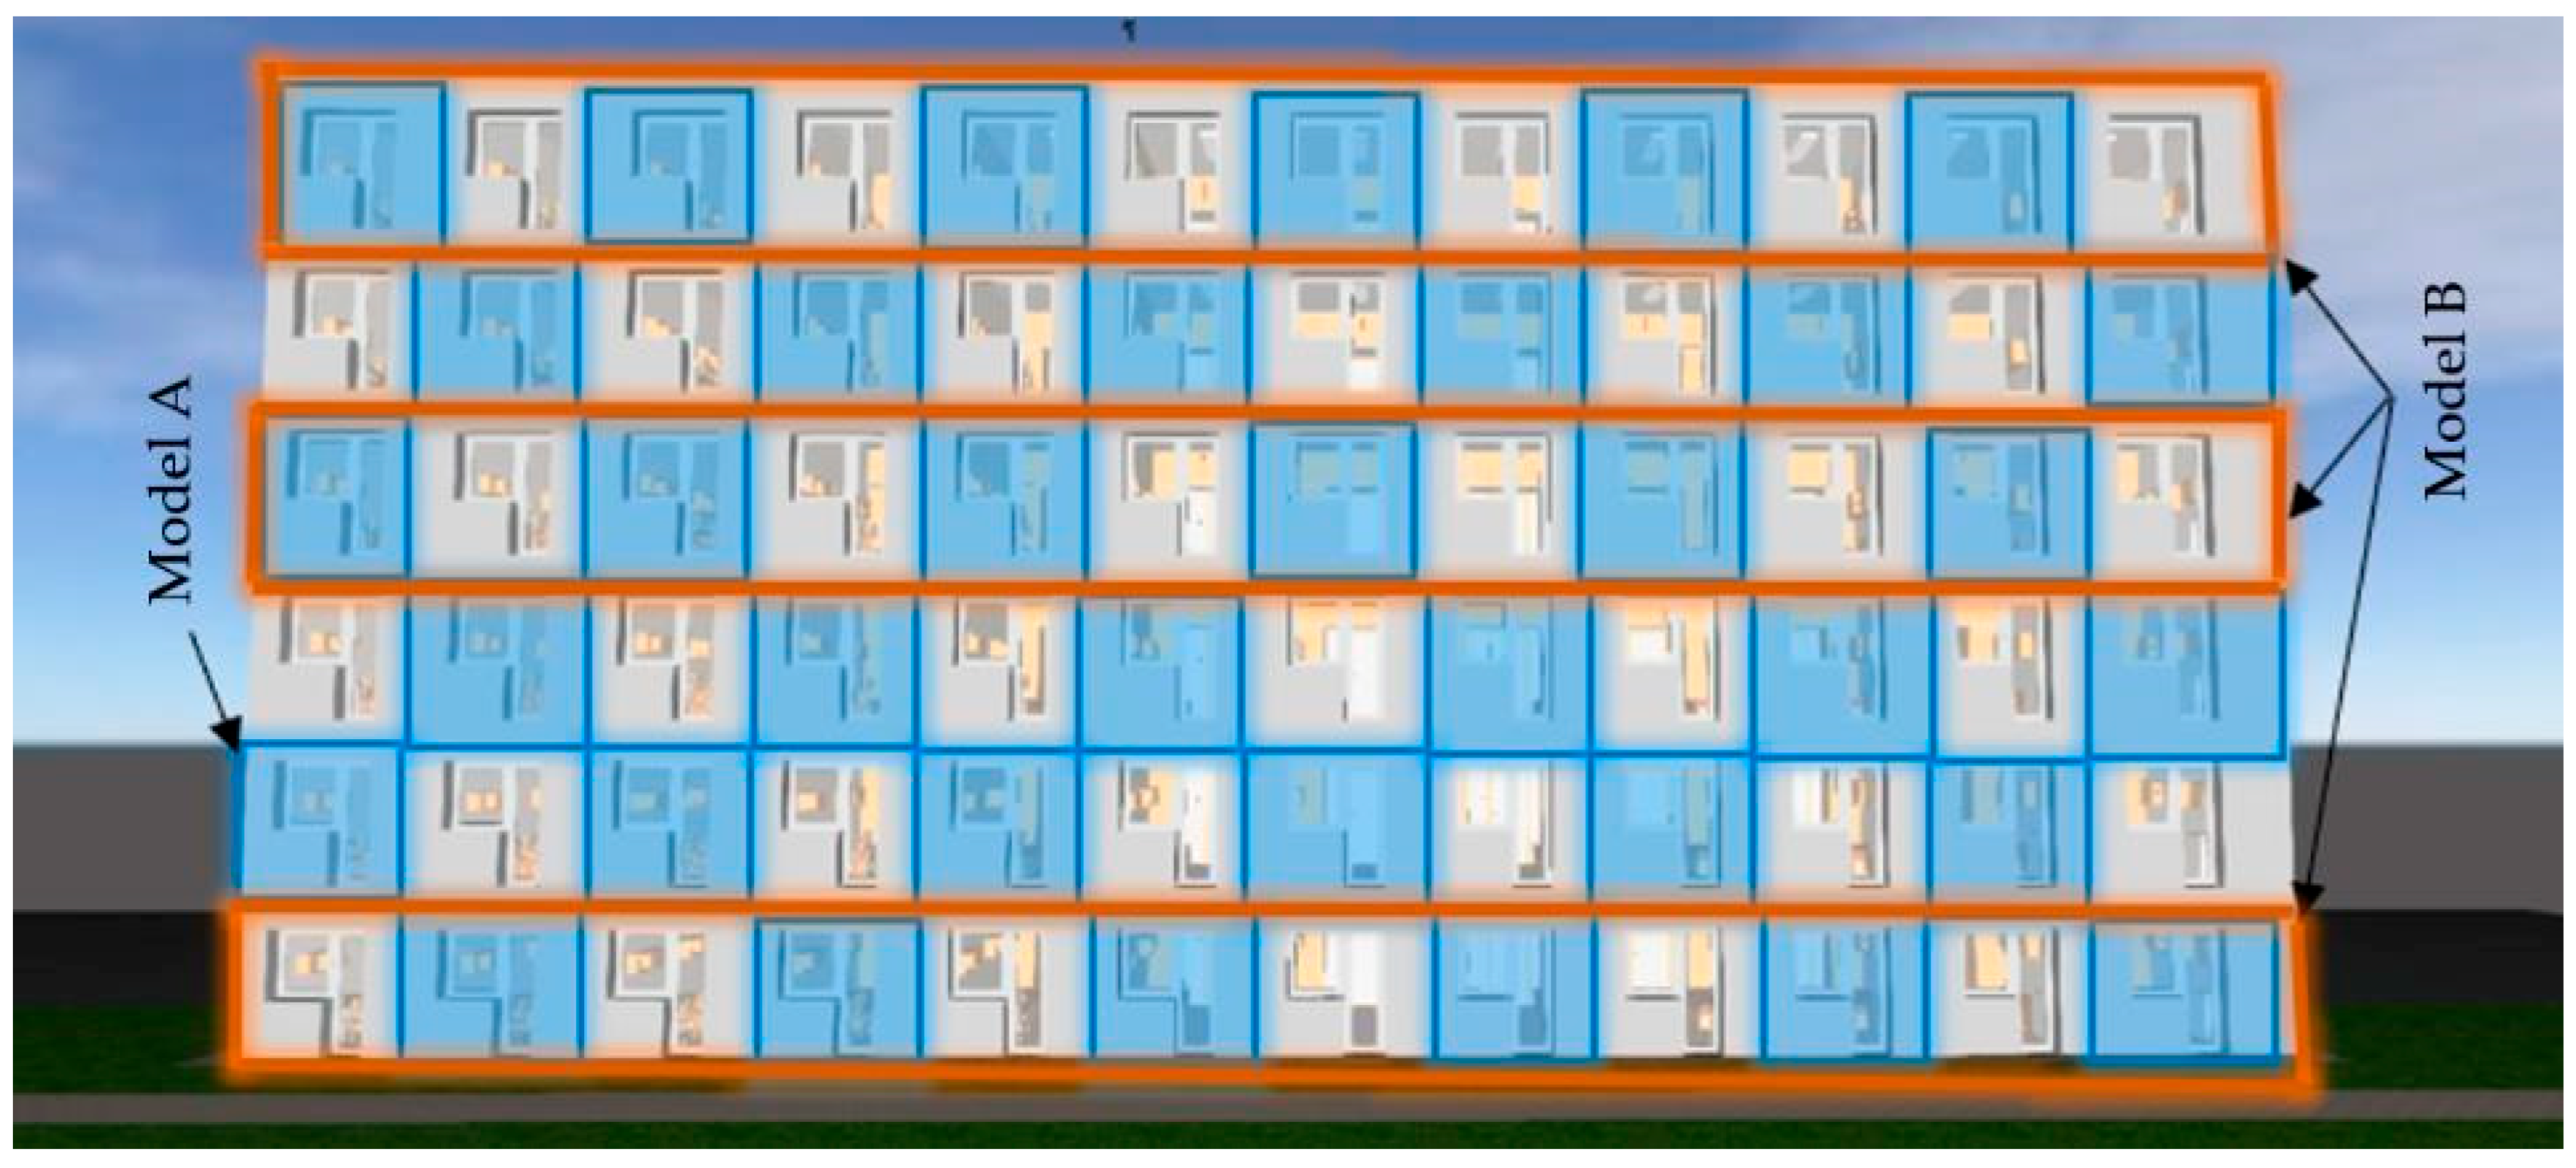
Models of the student residence building façade with different window scenarios were designed and investigated (Figure 5):
Figure 5.
DIALux model of the student residence building façade.
- •
- Model A: chessboard arrangement of lighted and dark windows on the façade;
- •
- Model B: lighted windows on the ground, central, and last floor of the dark façade.
Both models were studied for variations of windows:
- •
- V1: free of shading blinds;
- •
- V2: shading blinds in horizontal position, 0°;
- •
- V3: shading blinds with inclination of 45°.
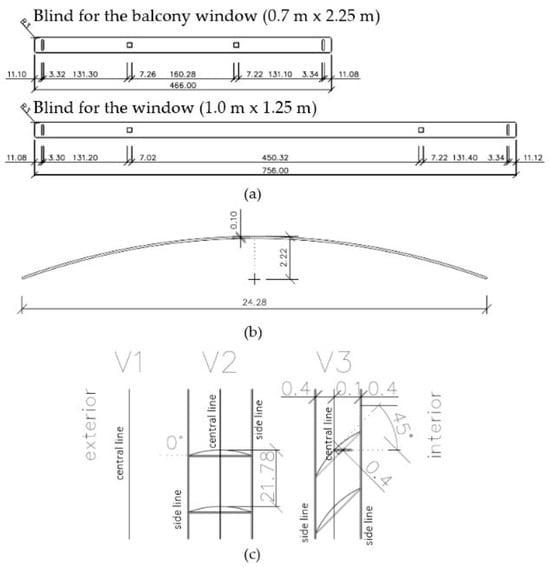
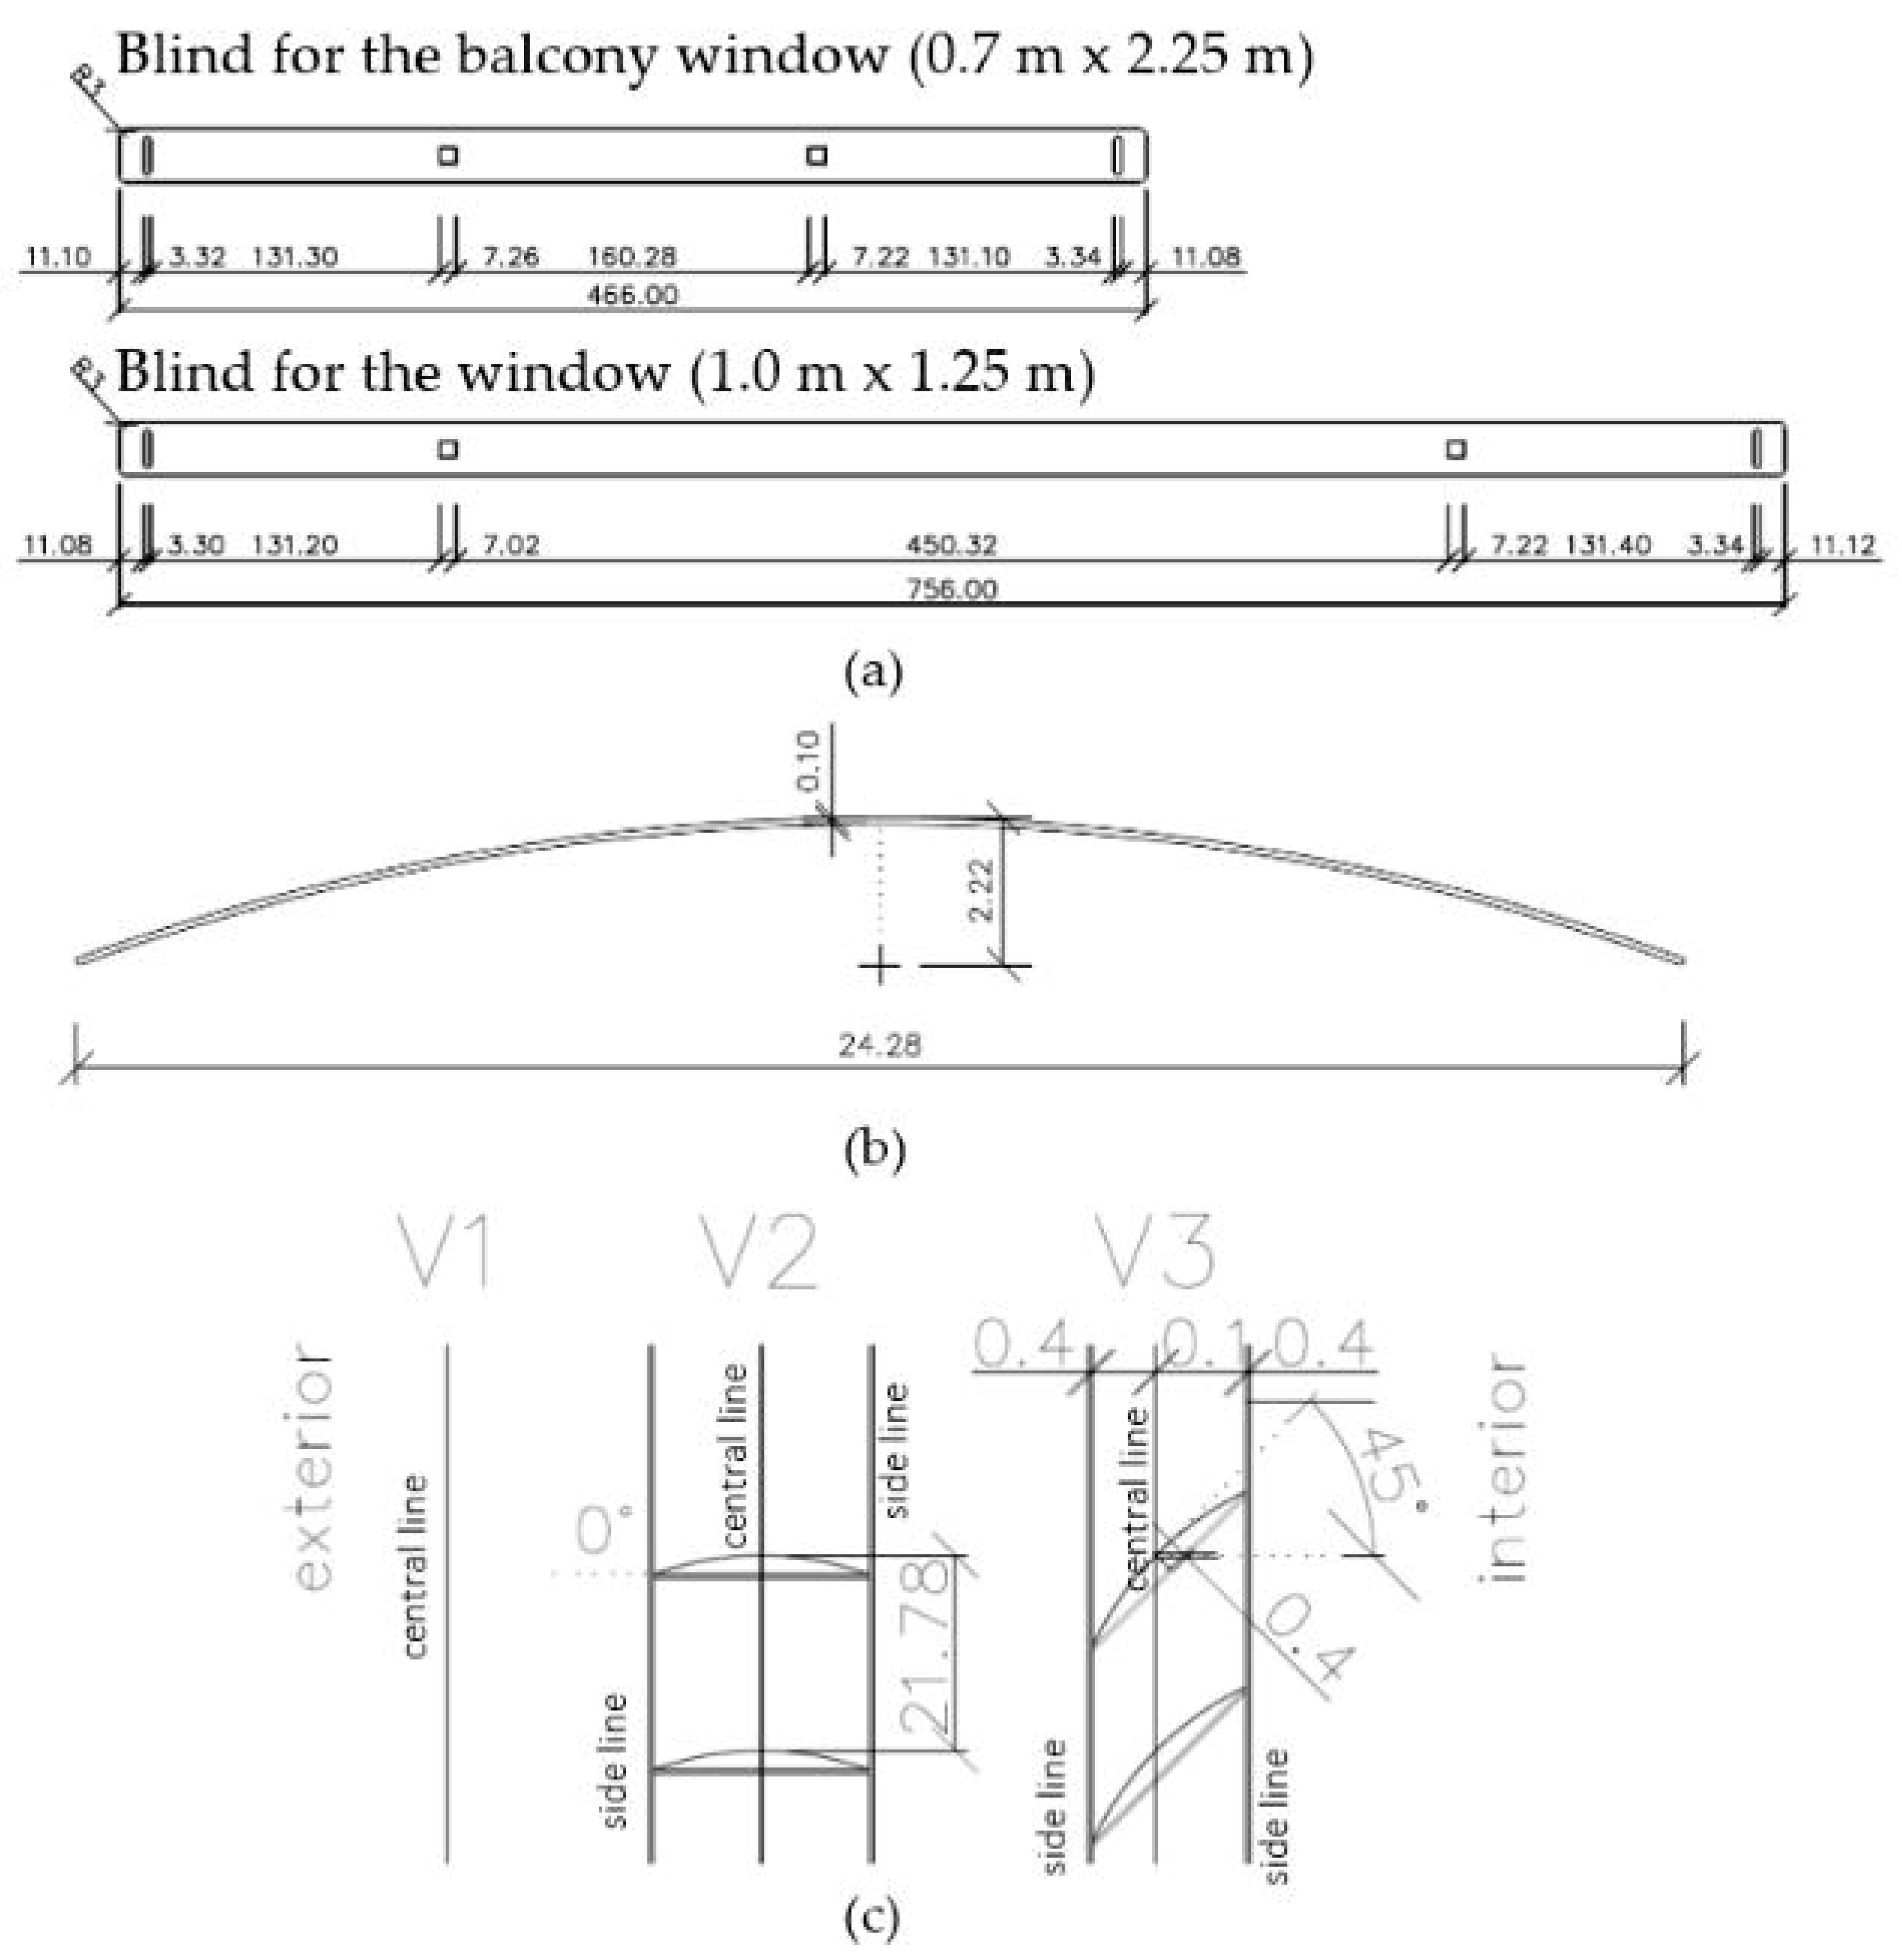
The shape and dimensions of the shading blinds are shown in detail in Figure 6. For a balcony window with dimensions of 0.7 m × 2.25 m, 93 blind lamellas with a length of 466 mm were used. For a window with dimensions of 1.0 m × 1.25 m, 47 blind lamellas with a length of 756 m were selected.
Figure 6.
Shading blinds (dimensioned in mm): (a) dimensions of the blinds; (b) shape of the blind lamella; (c) lamella distances in variations V1, V2, and V3.
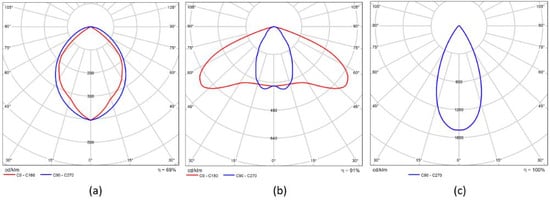
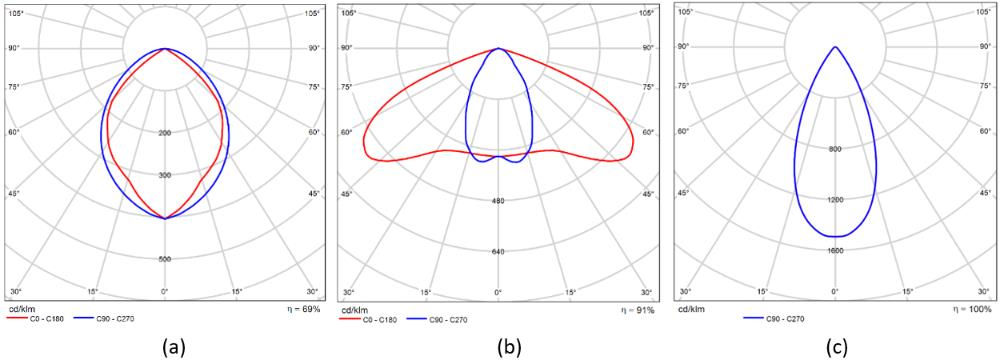
For light simulations, the parameters of interior and exterior luminaires were selected from the DIALux software database. The luminous intensity distribution curves of the selected luminaires are shown in Figure 7. The maintenance factor of luminaires MF = 0.8.
Figure 7.
Luminous intensity distribution curves of luminaires: (a) interior luminaire; (b) street lamp; (c) advertising sign (component).
The DIALux Evo software handles diffuse reflection and transmission very well. However, for specular reflection and transmission, the calculation algorithm is insufficient. All surfaces in the simulation model were considered to be diffuse: interior surfaces included plaster, carpet, furniture, and textiles, and exterior surfaces included pavement, building façades, and a window with shading blinds.
2.2. The Tested Room
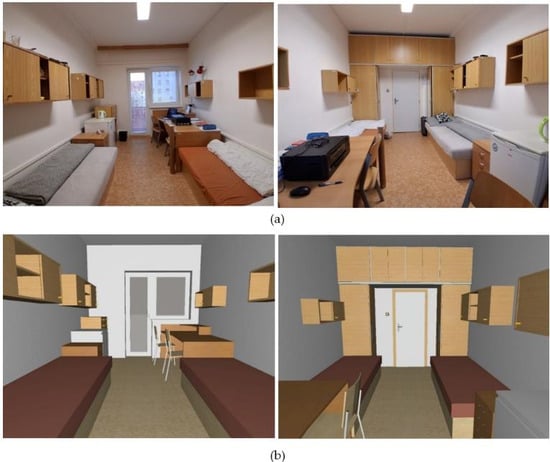
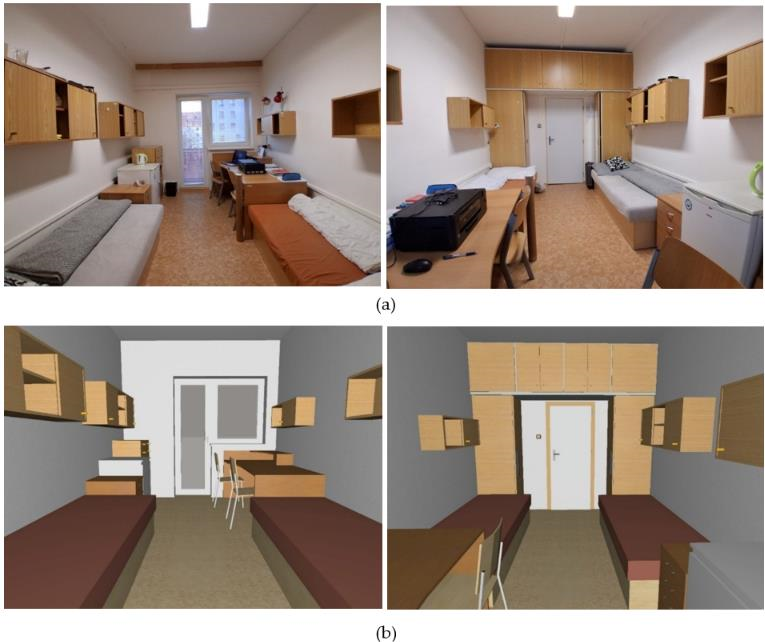
A room in the student residence building was selected for this study (Figure 8). The room luminaire was determined from the DIALux database: the luminaire power was 36 W and the luminous flux was 1972 lm. The room is located on the last floor in the middle building block. The room dimensions consist of a floor area of 4.56 m × 2.85 m and a clearance height of 3.0 m. It was modeled with windows in Variations V1 to V3. The following study explored a case in which the dark room was influenced by a large advertising area of an opposite nearby building.
Figure 8.
The studied room in the student residence building: (a) photographs documenting the actual measurement conditions of the investigated room; (b) DIALux Evo model of the studied room used for numerical simulations.
The simulations were run for the reflectance of interior and exterior surfaces specified in Table 1 and Table 2. The window glass parameters are shown in Table 3.
Table 1.
Surface reflectance—colors.
Table 2.
Surface reflectance—materials.
Table 3.
Transparent construction—light reflectance and transmittance of window glass.
2.3. Light Measurements
The light measurements focused on monitoring the vertical illuminance of the residential building façade on the top floor. This floor was selected because it is practically not influenced by light from traffic or street lamp. Luminance and melanopic images were monitored for the façade window from the exterior side and from in the interior view.
It was necessary to limit the scope of the problem by focusing on specific, simplified models of a single building within a university campus to conduct an initial assessment. The impact of the significant outdoor light source (advertising sign) on the internal environment was studied.
The assessment of nighttime lighting on this university residential campus represents a complex problem comprising several tasks. The studied building is mostly affected by the advertising sign from the opposite building. However, there are shading obstructions and grown trees in front of the residential building. Therefore, the room selected for light simulations and measurements is situated above the tree line, and the room’s interior is practically unshaded by external obstructions.
The initial phase of the research aimed to compare the results of lighting simulations with field measurements. Given the reasonable agreement achieved, the next step will involve a wide range of parameters for light simulations to cover the complexity of the problem. Due to limited access to the residential buildings at night, the simulations appear to be a suitable alternative to measurements and in situ assessments. Finally, the aforementioned factors are noted, as they represent influential conditions that require further evaluation in future studies.
The field measurement was taken in the city of Brno, with latitude 49°11′42.8″ N, longitude 16°36′28.7″ E, and altitude 237 m above sea level. The measurement was carried out to assess the outdoor and indoor lighting conditions. The measurements started on 24 June 2025 at 18:39 and ended on 25 June 2025, 23:47. The outdoor conditions were as follows:
- •
- At the beginning (data from 18:27): outdoor temperature 25.5 °C, relative humidity 43%, pressure 1016 hPa, wind speed 8–12 km/h, direction south-east (135°). Dry conditions, clear sky, stars visible, the illuminated fraction of the Moon was 3.3% at distance of 366,169 km from the Earth’s surface.
- •
- At the end (data from 23:40): outdoor temperature 25.8 °C, relative humidity 56%, pressure 1012 hPa, wind speed 10–13 km/h, direction south-east (189°). Dry conditions, clear sky, stars visible, the illuminated fraction of the Moon was 0.4% at distance of 369,213 km from the Earth’s surface.
Measurements of illuminance were provided for the following:
- •
- An opened window (Variation V0);
- •
- A closed window free of shading (Variation V1);
- •
- A window with shading blinds at 0° (Variation V2);
- •
- A window with shading blinds at 45° (Variation V3).
The influence of the advertising sign of a nearby building was studied in two cases:
- •
- Case 1: advertising sign activated, the room luminaire switched off.
- •
- Case 2: advertising sign not in service, the room luminaire switched on.
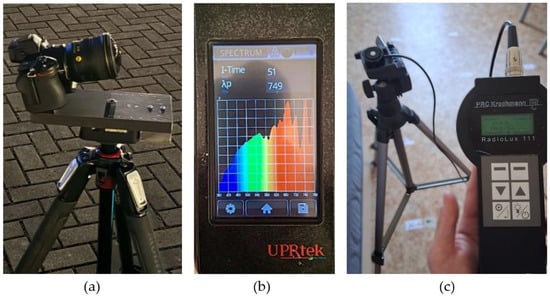
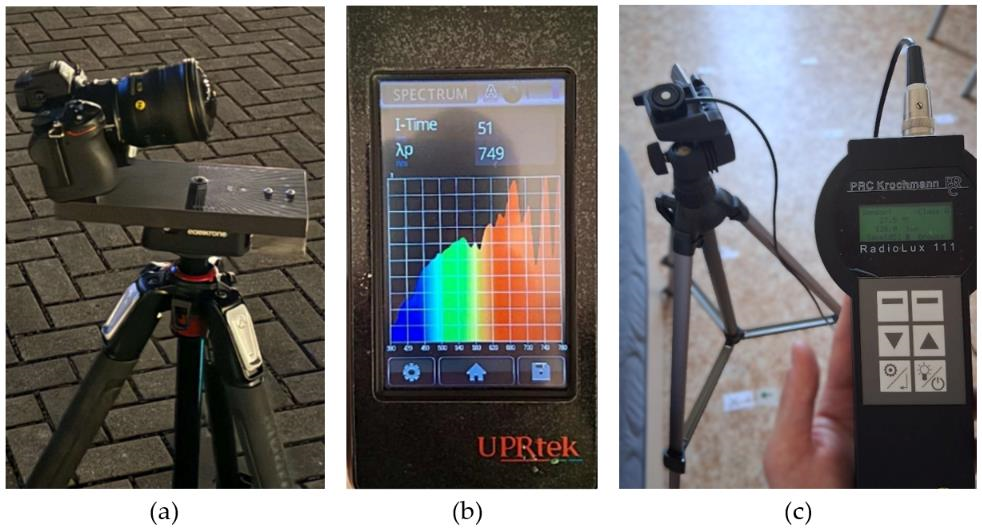
The devices used for the light measurements (Figure 9) were as follows:
Figure 9.
Photographs of measuring devices: (a) Alanisator device; (b) Spectroradiometer UPRtek; (c) RadioLux 111 PRC Krochmann.
- •
- RadioLux 111, PRC Krochmann, serial number: 0511132; calibration certificate no 220914-1.
- •
- Spectroradiometer UPRtek MK350S, serial number: A13M0096, new device.
- •
- Alanisator prototype—luminance and melanopic radiance distribution analyzer.
- •
- Luminance Distribution Analyser LDA—ML6, calibration 18320-LDA-ML6-2023-3.
- •
- Calibrated set: Digital camera Nikon Z6 II, no: 6001066, Lens Nikon 8–15 mm f/3.5–4.5E ED no: 214147, Correction filter: V(λ), no: SFG13a-Me020222-He-1303/1975020, LumiDISP software version 3.1.0.8.
The Alanisator is a device for measuring the global distribution of light/radiant energy in a specific place and time. It represents a panoramic scanning system that measures both light and alpha-opic radiant and spatial quantities with high accuracy, producing structured data that enable more complex calculations and obtaining more complex environmental parameters. The device was developed within the framework of a research project [80]. The luminance analyzer LDA [81] is based on a digital mirrorless interchangeable-lens camera, and enables the monitoring of luminance and melanopic radiance. Luminance is measured at a vast number of points (more than 20 million). The measured data is saved in a database and subsequently processed in the software LumiDISP [81]. The sensitivity of the measuring system is adequate according to the CIE defined spectral sensitivity V(λ). Melanopic values are modified by sensitivity smel (defined by the CIE S 026/E:2018). Sensor: BSI CMOS 24,5 Mpx, measure Range: 0.001–10,000,000 cd∙m−2.
The light measurements were aimed at the specification of photopic parameters such as luminance (cd∙m−2) and illuminance (lx), as well as the melanopic parameter of melanopic radiance (mW∙sr−1∙m−2). The data enable us to evaluate the influence of light on perception. The human eye’s retina contains photoreceptors and nerve cells that interconnect and transmit the signals resulting from their stimulation to the optic nerve. There are three types of photoreceptors: rods and cones, which are responsible for vision, and intrinsically photosensitive retinal ganglion cells (ipRGCs), which play a role in controlling circadian and neuro-endocrine systems [82,83,84].
3. Results
3.1. Simulation Outputs
3.1.1. Effect of Lighted Façade on Outdoor Environment
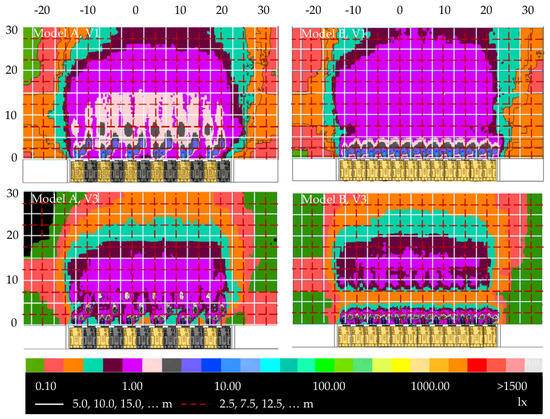
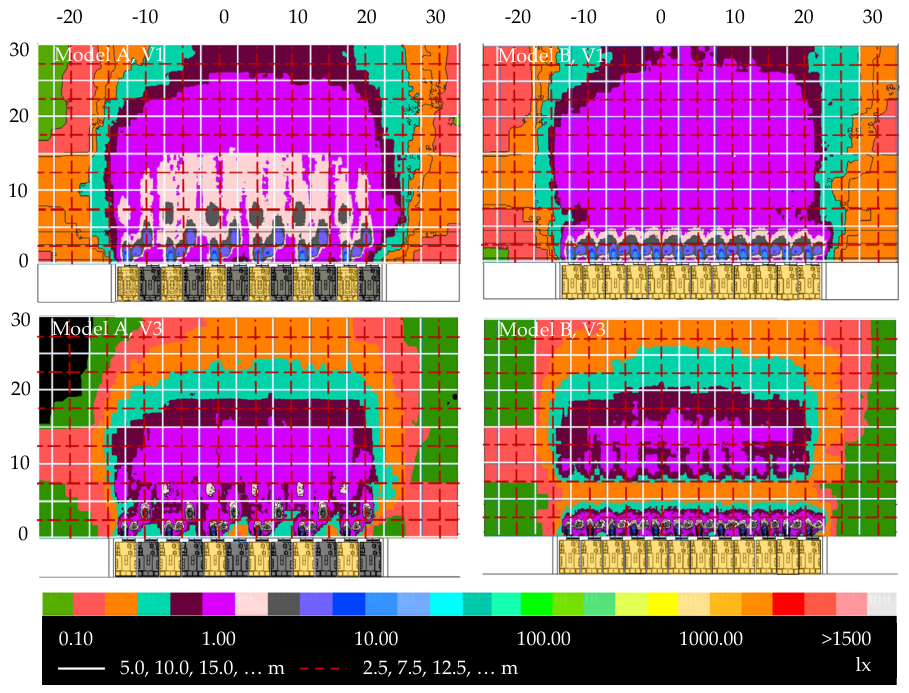
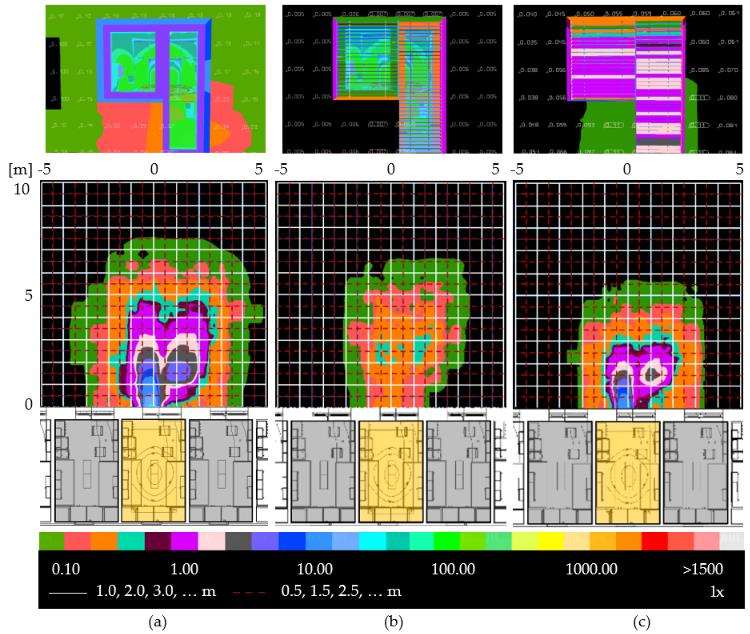
The simulation outputs show the horizontal illuminance distribution in the exterior area due to the residence façade in Model A and Model B with windows in Variations V1, V2, and V3. The influence of the residence room lighting on the indoor climate and on the exterior environment was studied. Finally, the effect of the street luminaire on the residence façade was simulated. An example of the graphical outputs for V3 is shown in Figure 10.
Figure 10.
External horizontal illuminance 0.2 m above the ground (Model A and B, V1 and V3).
The average values of the vertical illuminance and luminance on the residence façade are summarized in Table 4 and Table 5, respectively.
Table 4.
Vertical illuminance [lx] on the residence façade.
Table 5.
Luminance [cd∙m−2] on the residence façade.
3.1.2. Effect of the Room Lighting on the External Environment
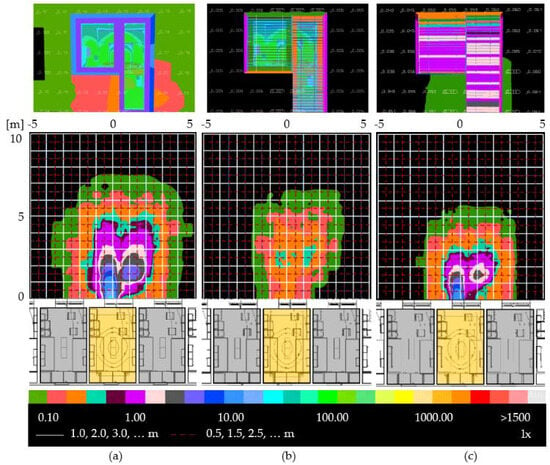
Models of the room’s lit window’s impact on the outdoor environment show the illuminance distribution on the vertical plane of the façade and on the external horizontal reference plane close to the window (Figure 11).
Figure 11.
Vertical illuminance of the façade and external horizontal illuminance 0.2 m over the ground: (a) Window free of shading—V1. (b) Shaded window, blind (0°)—V2. (c) Shaded window, blind (45°)—V3.
The simulation outputs of Figure 11 are summarized in Table 6 for the values of the average and maximum illuminance on the horizontal plane close to the façade with the window located in the position 0.2 m above the ground level. It is obvious that the blinds (V3) in inclination transmit more light compared to the ones in the horizontal position (V2).
Table 6.
External horizontal illuminance close to the residence façade (on the reference plane 0.2 m above the ground).
3.1.3. Effect of Street Lamp on the Building Façade
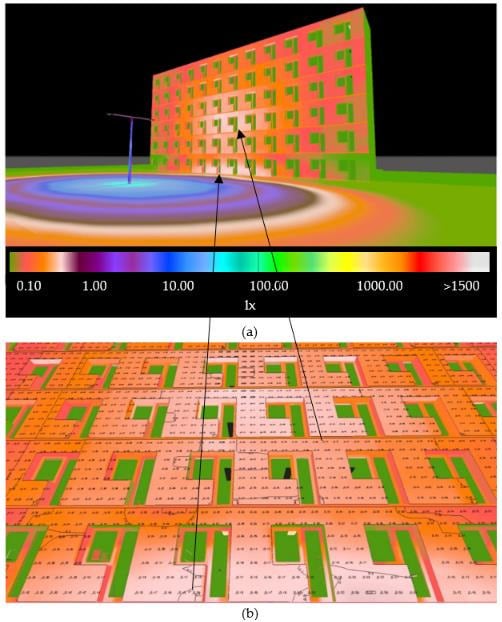
The simulation result for a street lamp’s influence on the residence façade and neighbor areas is shown in Figure 12. The simulation was run with the following parameters: the reflectance of the façade and the building surroundings were as specified in Table 1.
Figure 12.
Illuminance of the façade due to the street lamp: (a) 3D view to the façade. (b) Vertical illuminance [lx] of the brightest part of the façade.
The street lamp parameters were set as follows: power, 18.7 W; luminous flux of the bulb, 2700 lm; luminous flux of the luminaire, 2469 lm; luminous efficacy, 132.0 lm/W; correlated color temperature (CCT), 2200 K; color rendering index (CRI), 70; light output ratio η, 91.45% [68].
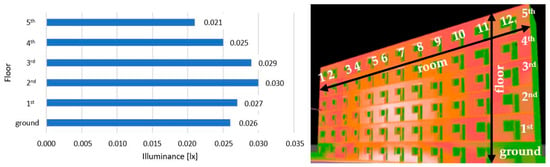
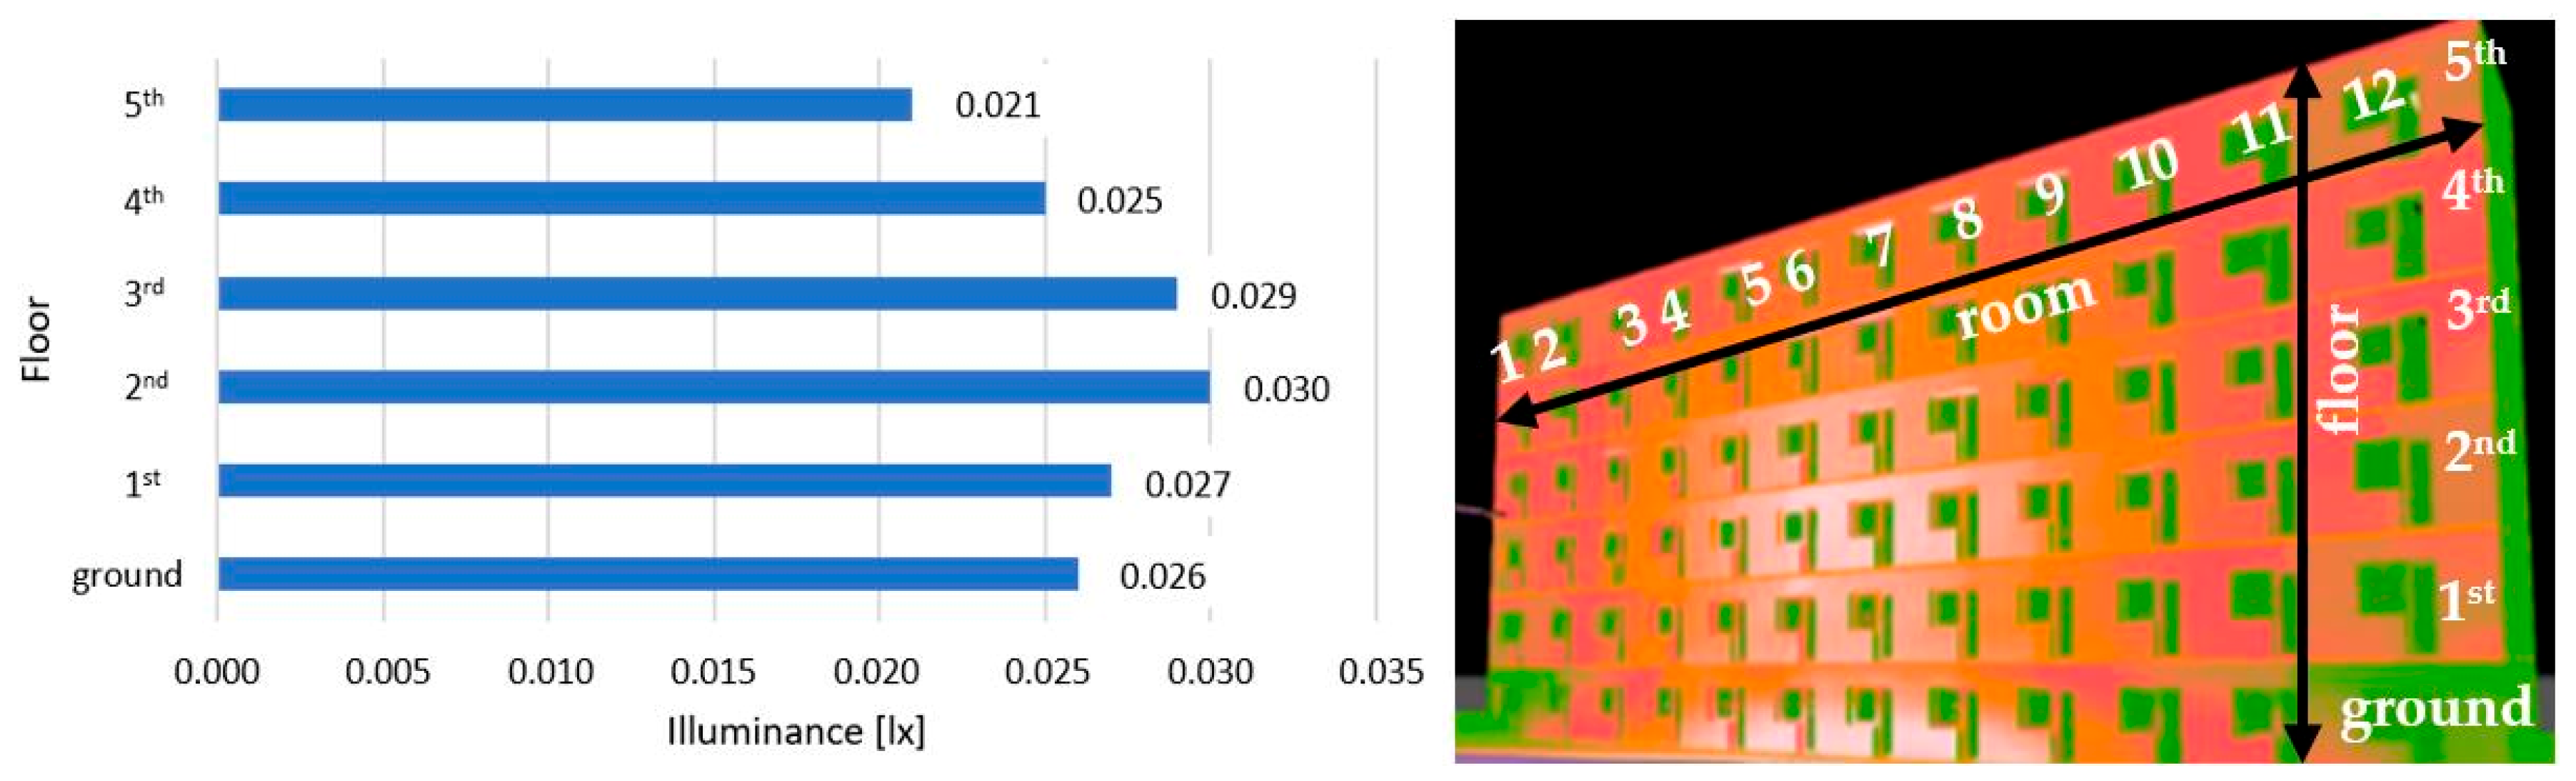
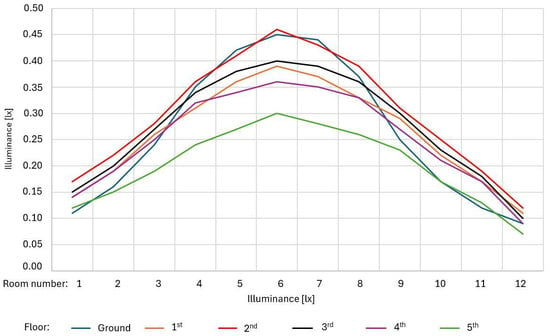
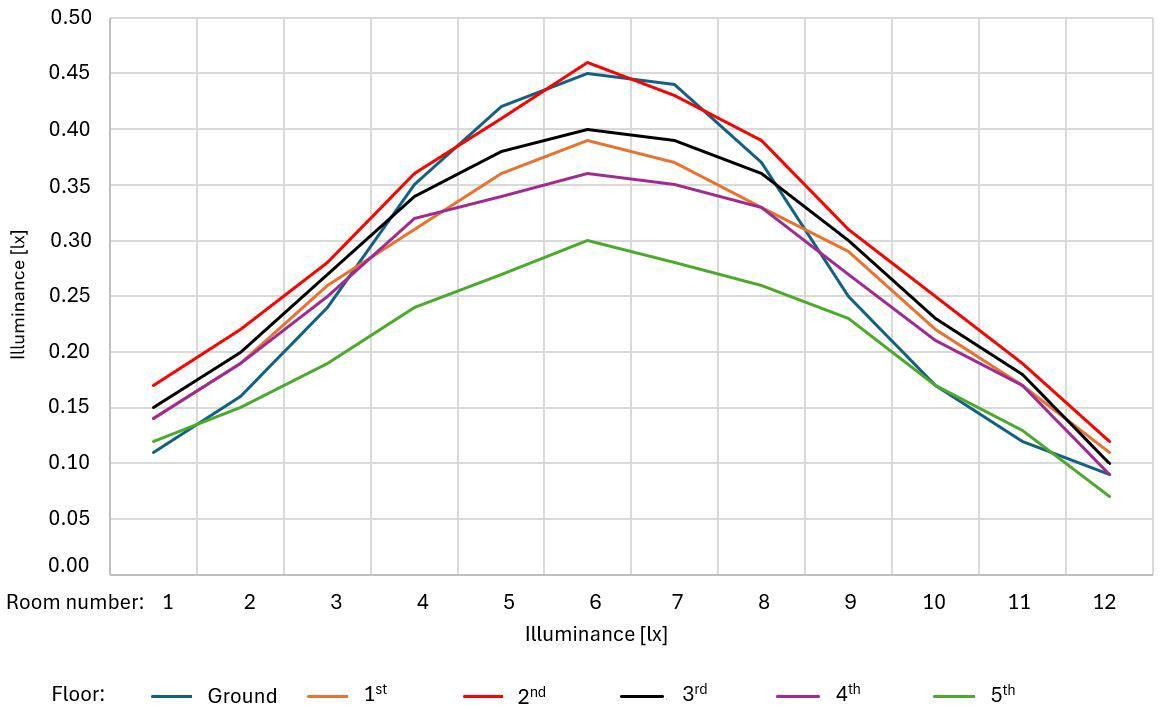
The average values of the vertical illuminance from the ground floor to the 5th floor of the façade and the horizontal illuminance close to the windows of individual floors are summarized in Figure 13. The 2nd and 3rd floors are mostly affected by the light from the street lamp. On the ground floor, the illuminance is slightly increased because of light reflection from the concrete pavement along the building. The street lamp emits light downwards toward the ground. The impact of the street lamp light on the building room is shown in Figure 14.
Figure 13.
Average vertical illuminance [lx] of the residence façade.
Figure 14.
Average horizontal illuminance [lx] on the façade in individual room locations.
3.1.4. Advertising Sign Luminance
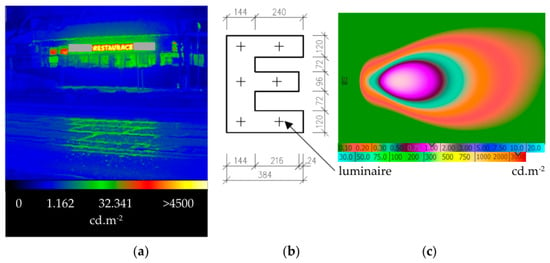
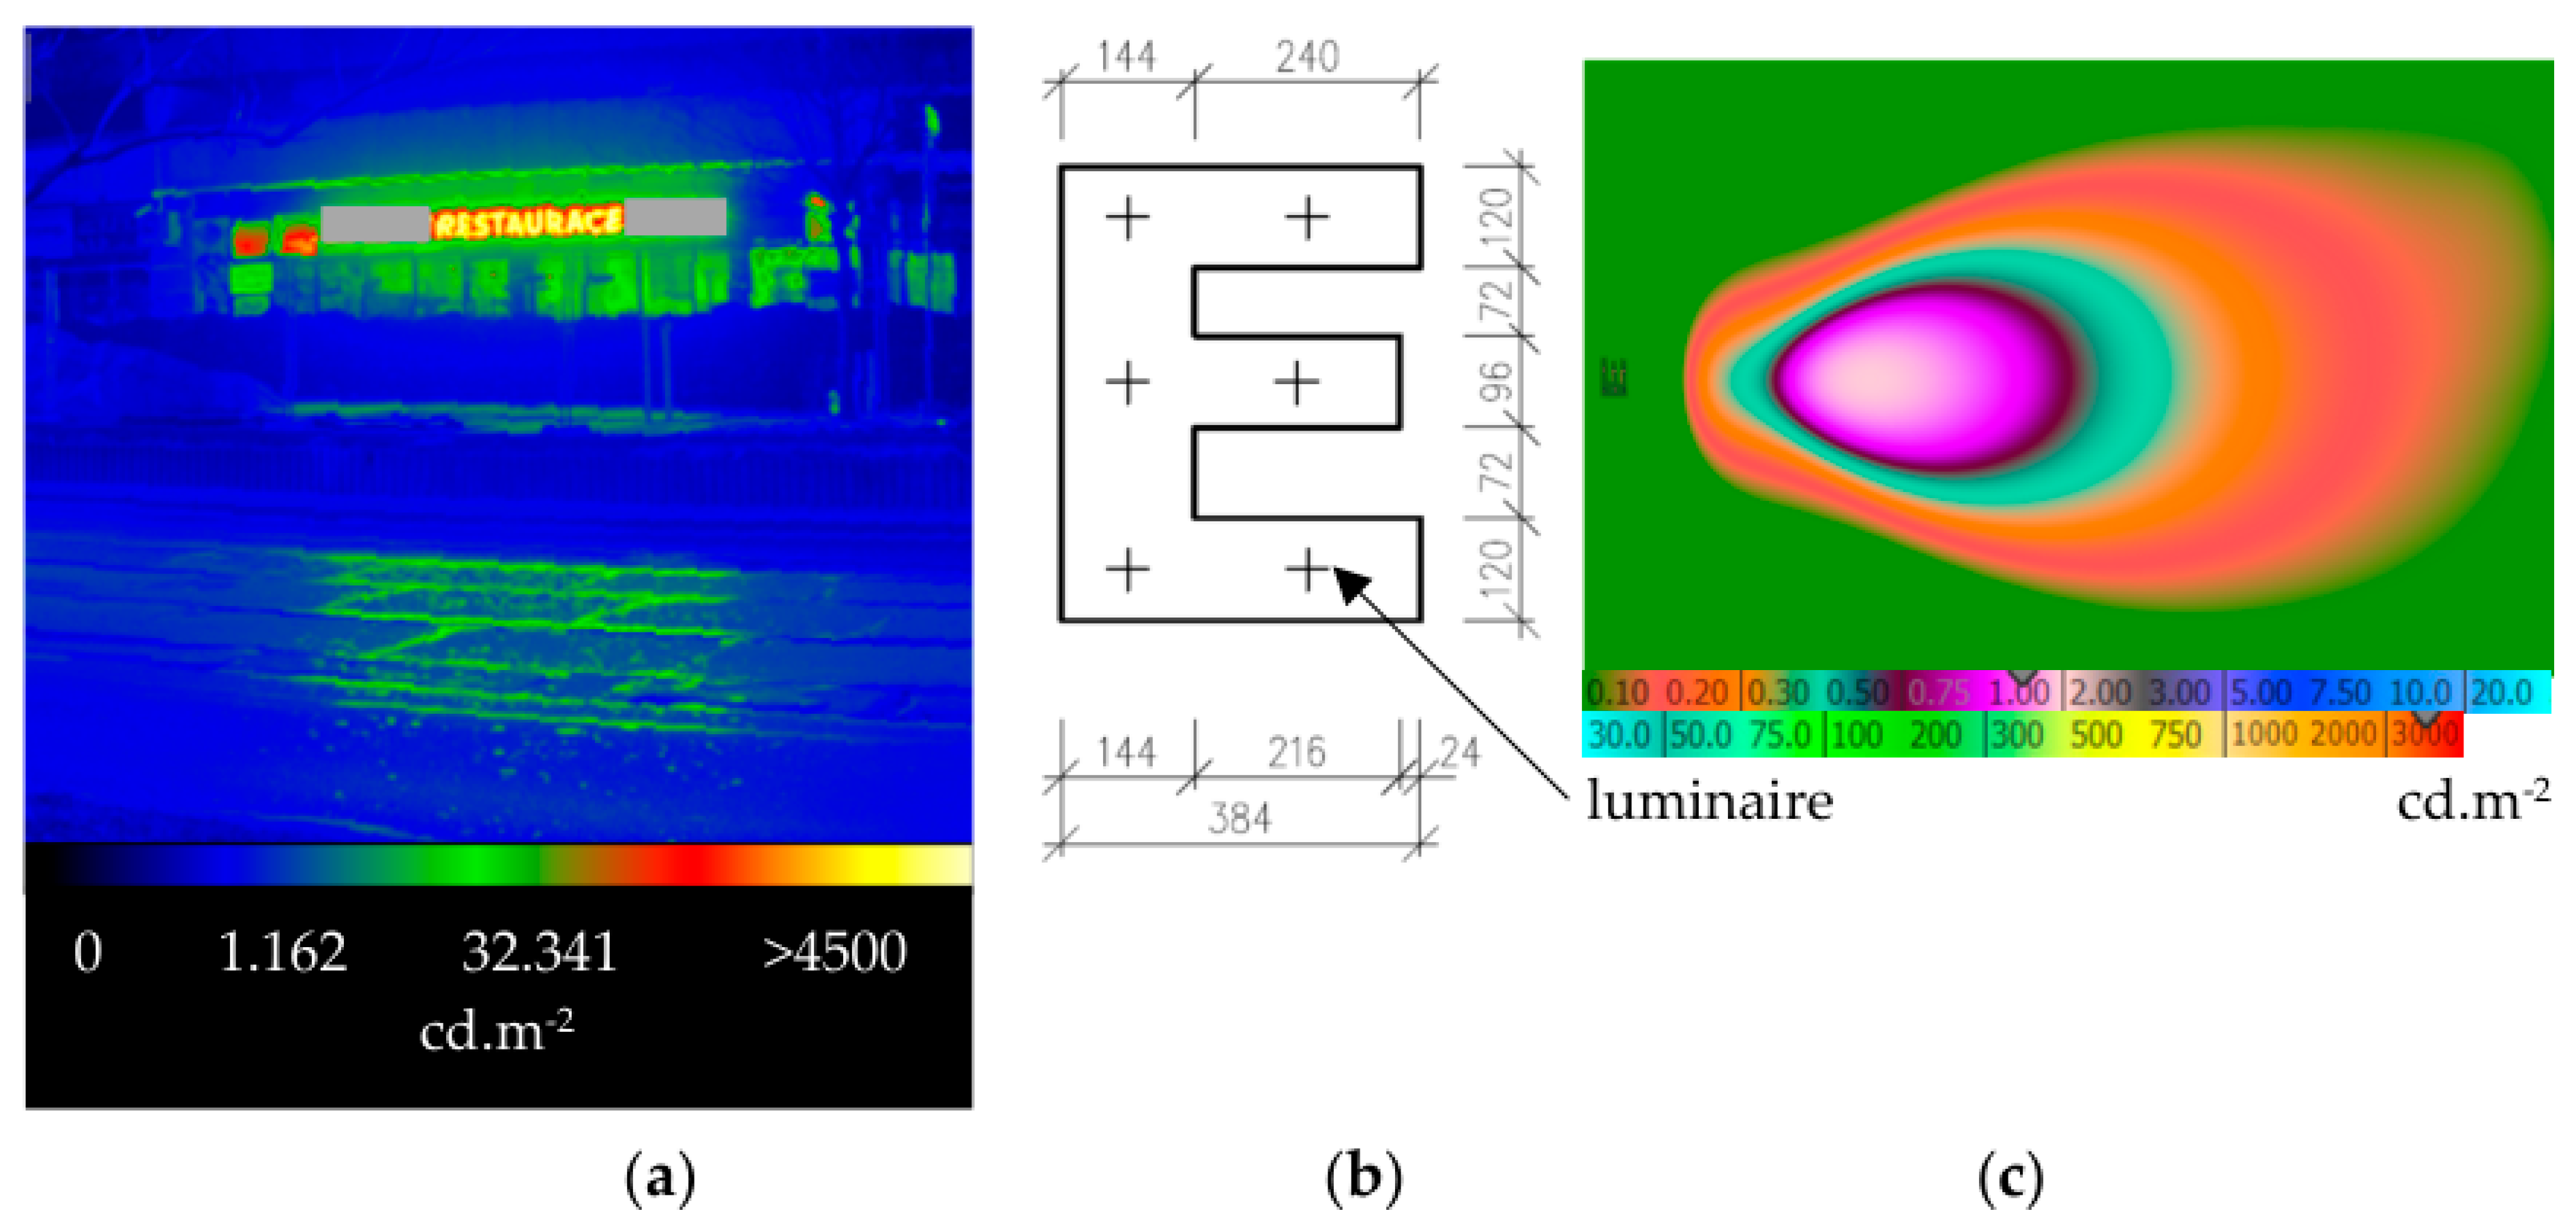
The advertising sign represents a dominant external light source in the locality, and the effect of this light source was studied. The sign consists of letter signs with mounted luminaires that are covered by light-diffusing glass. The title of the sign was analyzed for individual letters and their luminaires. An example of the luminance distribution due to part of the sign is shown in Figure 15.
Figure 15.
Luminance distribution of the advertising sign: (a) Luminance image (monitored on site). (b) Example of location of luminaires within part of the advertising sign—letter E. (c) Model of the luminance distribution of the advertising sign—letter E (simulated in DIALux).
3.2. Light Measurements
3.2.1. Horizontal Illuminance in the Room
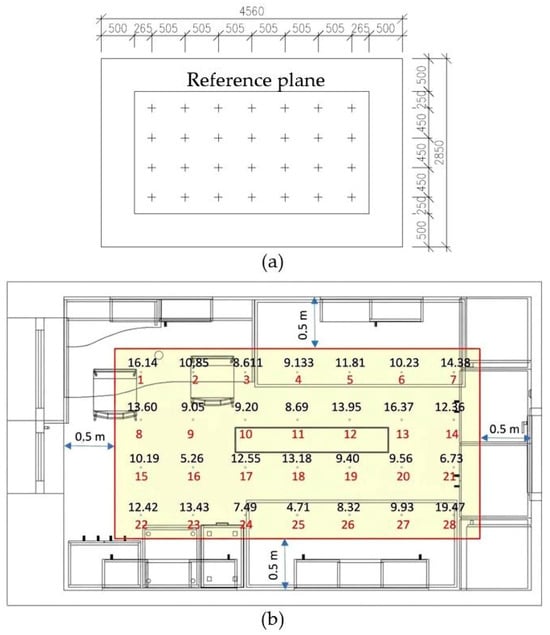
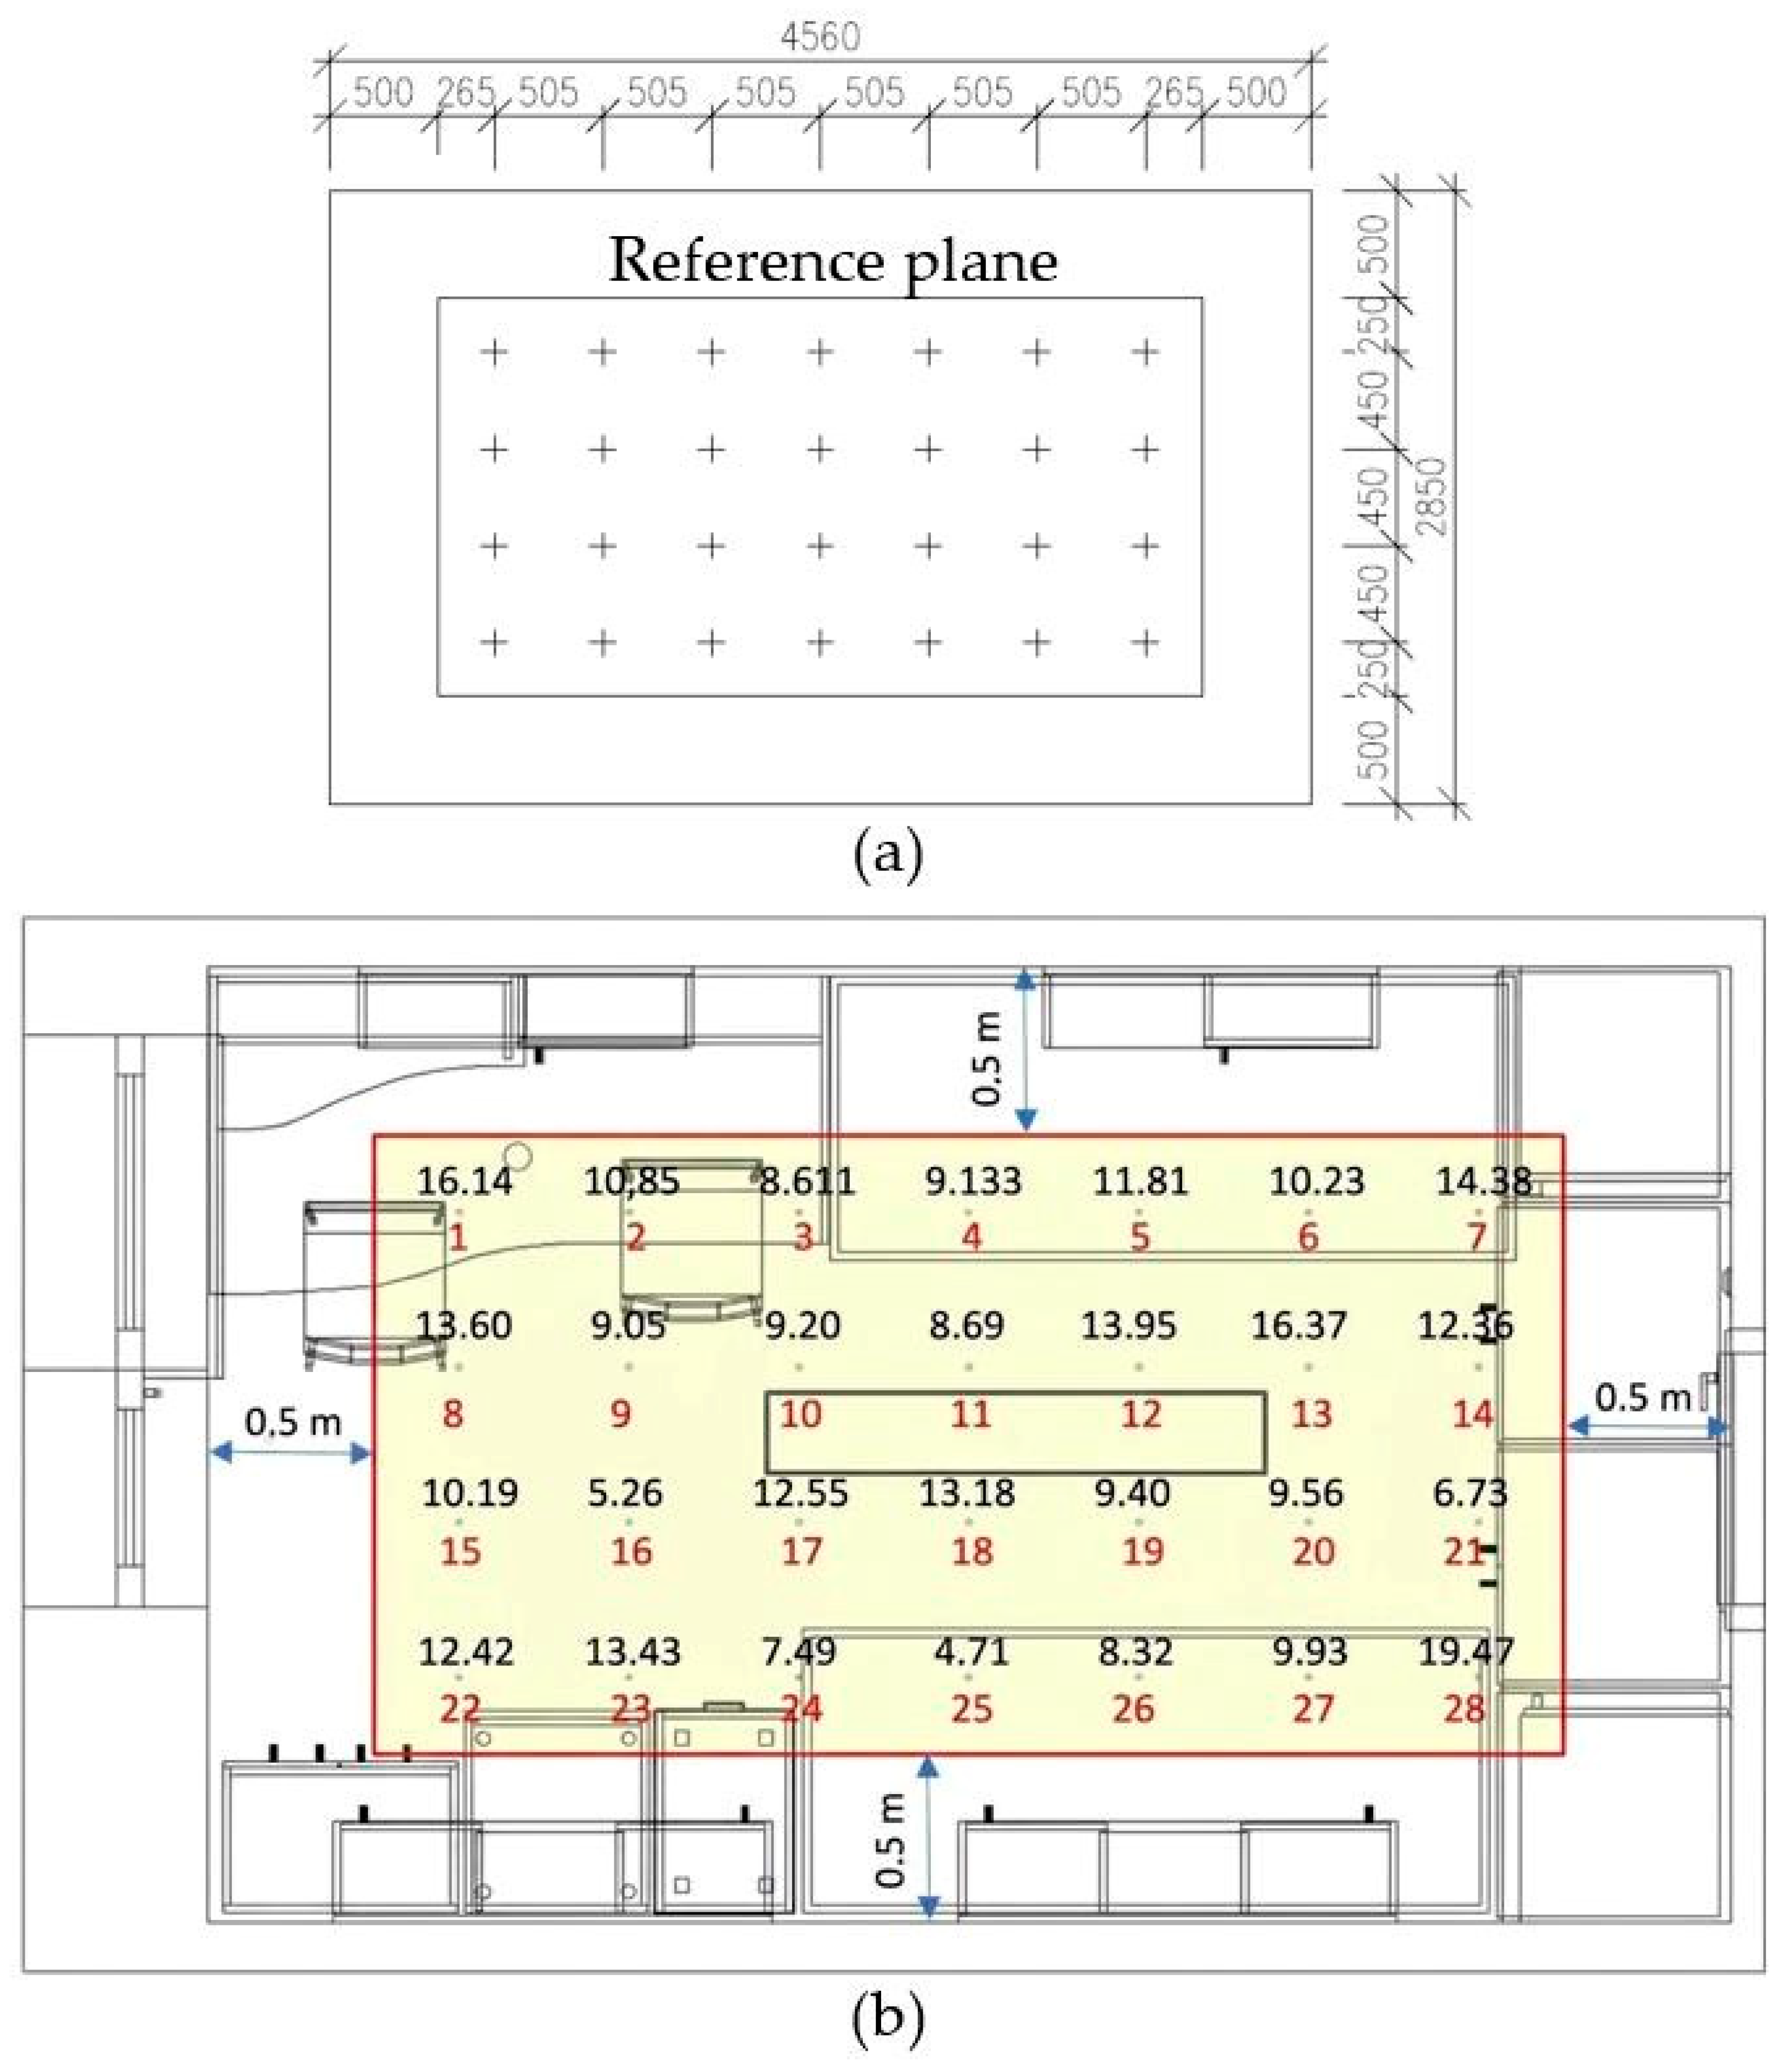
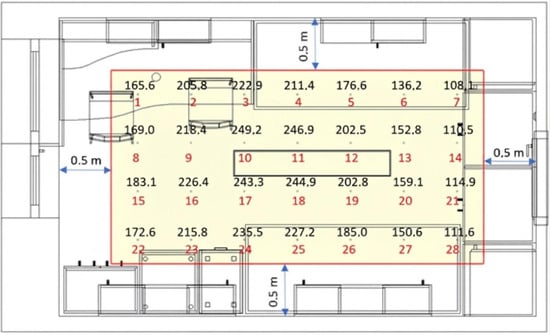
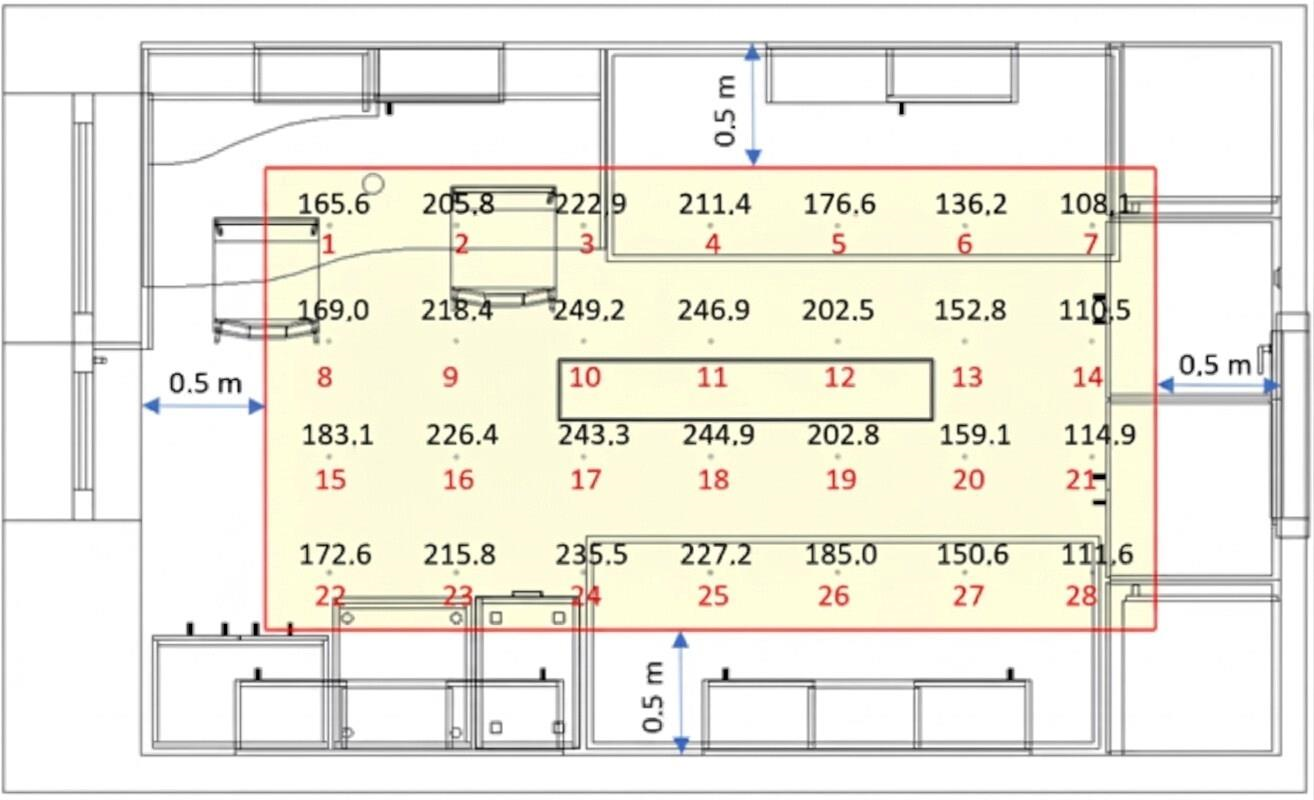
The internal illuminance at 28 points on the horizontal reference plane 0.85 m above the room floor was monitored for two cases. Measurements of illuminance were repeated three times, and the presented values are averages from the measured data.
The impact of the exterior advertising sign on the indoor illuminance level in the dark room was studied (Case 1) (Figure 16). The higher values of illuminance are close to the window, at points 1, 8, 15, and 22. The increased illuminance at point 28 at the back of the room is caused by light reflectance on the polished surface of the cupboard. Comparable measurements were completed for the same room illuminated by the interior luminaire (the external advertising sign is not activated—Case 2) (Figure 17).
Figure 16.
Illuminance [mlx] on the horizontal reference plane in the interior (0.85 m above the floor)—Case 1: (a) Reference plane with points for measurement (dimensioned in mm). (b) Measured values of horizontal illuminance on the reference plane.
Figure 17.
Illuminance [lx] of the horizontal plane in the interior illuminated by the internal luminaire—Case 2.
3.2.2. Spectral Data
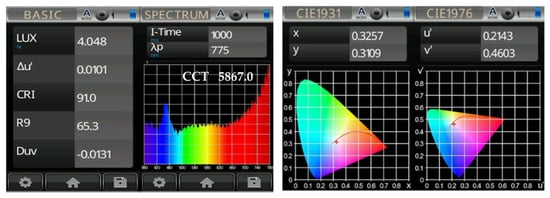
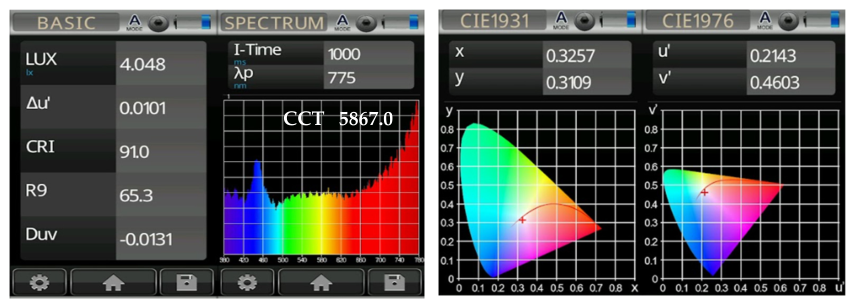
The spectrum of the dominant exterior light source was monitored. The external advertisement sign has a continual light spectrum (Figure 18). It is quite interesting that, despite the dominant red component of the light spectrum of the advertisement sign, the correlated color temperature (CCT) is 5867.0 and the color rendering index (CRI) = 88; this is because of the wide range of the blue light component. The red part of the light spectrum is influenced by light from nearby street lamps. The advertisement sign light source has a light spectrum that is not appropriate for nocturnal lighting. This effect together with the high illuminance of the sign acts as a highly obtrusive element at nighttime.
Figure 18.
Light spectrum of the external advertising sign (monitored in the exterior).
The interior luminaire has a common LED lamp and produces light unsuitable for nighttime indoor lighting. The interior luminaire has a dominant blue light spectrum. For night illumination, more appropriate light sources have a light spectrum shifted more toward the color of flames. Blue-enriched white light at night has the potential to delay the circadian rhythm in the daily life cycle [84]. Studies have shown that a high correlated color temperature of lighting is associated with delayed sleep timing in university students [85] and home occupants [86].
Despite the fact that the effects of light at night may be influenced by other lifestyle factors depending on the locality, type of building, occupants’ age, etc., the selection of an appropriate light source plays a key role in comfort and well-being. The standard [87] provides guidance that the color appearance of light is a matter of psychology and esthetics. The light source choice depends on the illuminance level, colors of the interior surfaces, and indoor and outdoor conditions.
The research [88] demonstrates that people’s alertness response is related to light illuminance > 1000 lx (for example, a fluorescent lamp of CCT 4000K). As the day progresses, the intensity and temperature of light should be decreased, shifting from a short wavelength (blue spectrum) to longer wavelengths (amber color) [88,89]; an example 24-h dynamic tunable lighting profile is as follows: CCT 5200 K preferred for the morning, 4000 K for the afternoon, and 3000 K at nighttime. Appropriate light source selection represents an important part of lighting design influencing the visual comfort and health of occupants [89,90,91].
3.2.3. Luminance and Melanopic Radiance Images
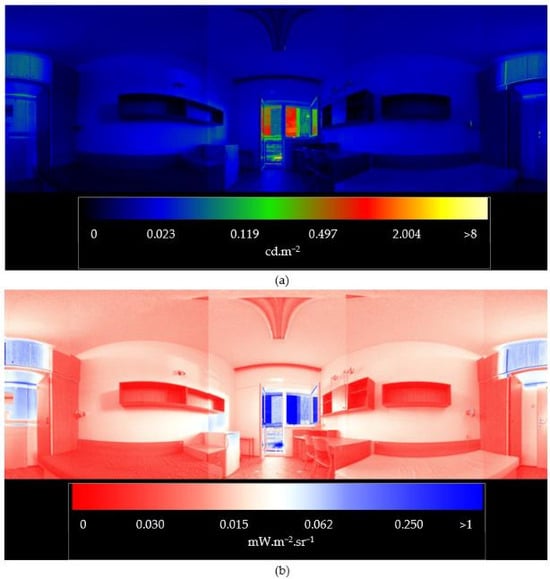
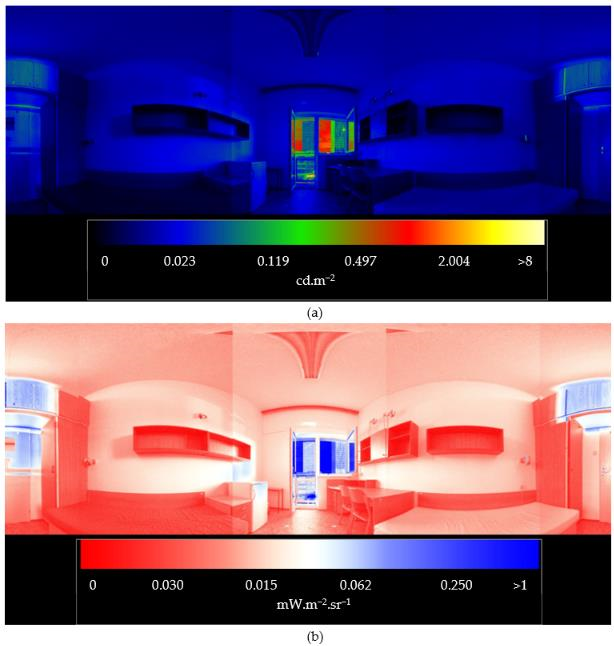
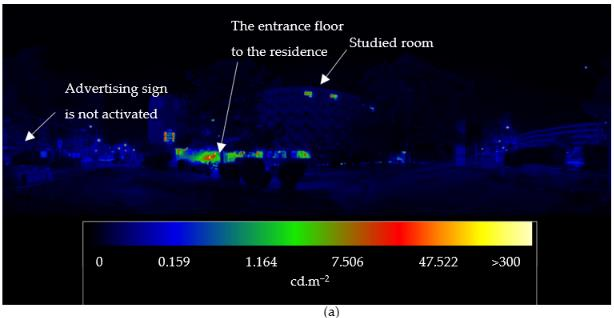
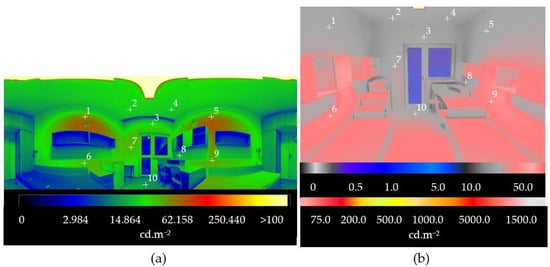
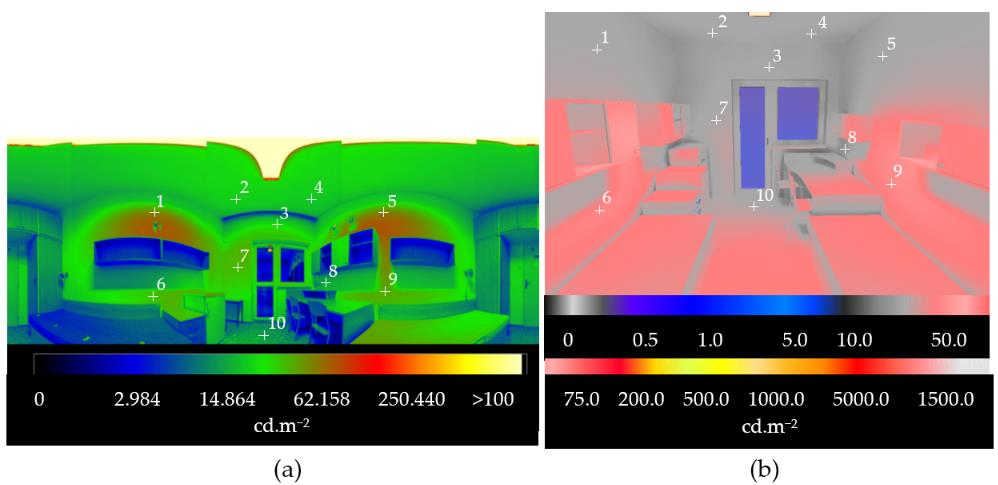
Luminance [cd∙m−2] and melanopic radiance [mW∙m−2∙sr−1] [82] were monitored on the room’s interior and exterior sides. Panoramic images were captured using an Alanisator device. The images show the window shading’s influence in terms of reducing obtrusive light transmitted from the building to outdoors. The impact of the external advertising sign on the room’s interior was also monitored. Two light cases were considered for the study (Cases 1 and 2).
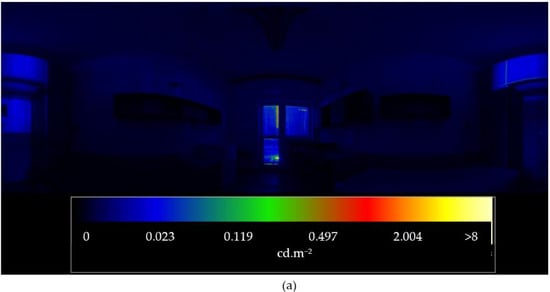
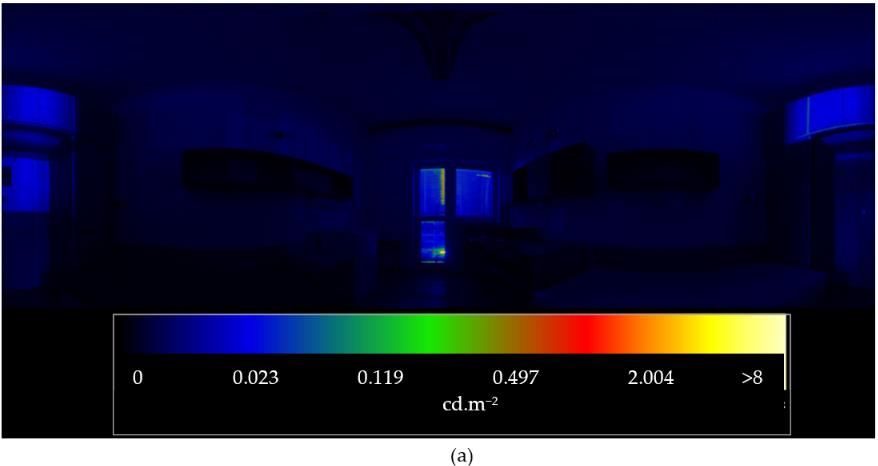
Case 1 is a dark room where the internal luminaire is switched off. The room is located on the last floor of the student residence building. The images show the effect of the advertising sign on the dark room’s indoor environment (Figure 19).
Figure 19.
Light image analysis—Case 1: (a) View to the room (on the 5th floor of the students’ residence)—luminance [cd∙m−2]. (b) View to the room—melanopic radiance [mW∙m−2∙sr−1].
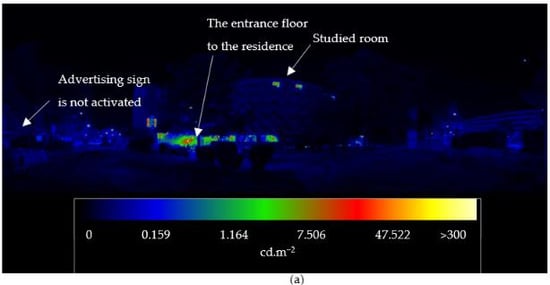
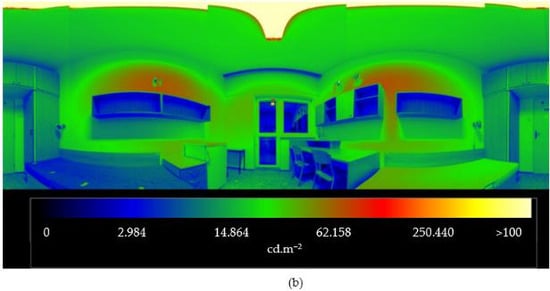
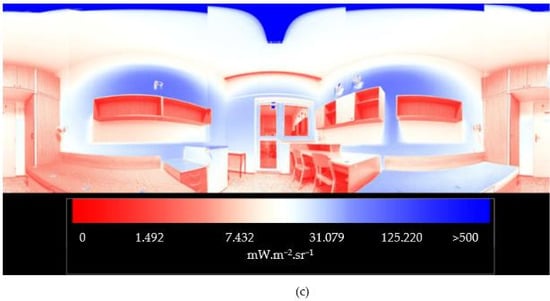
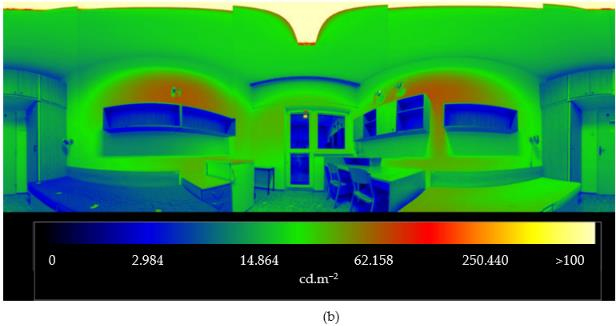
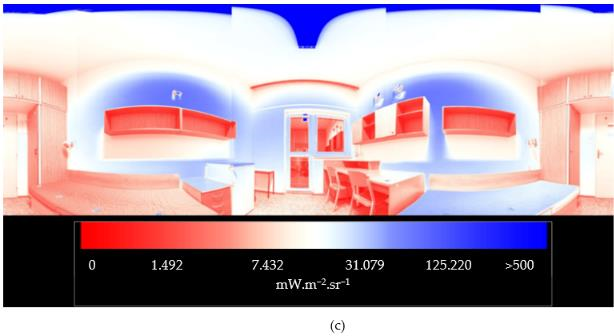
Case 2 is the luminaire switched on and the external light advertising sign not in service. These images show the room luminaire’s impact on the indoor and outdoor environment (Figure 20). The luminance distribution is changed from about 1 to 100 cd∙m−2. The melanopic image shows the difference between 0.5 and 85 mW∙m−2∙sr−1.
Figure 20.
Light image analysis in Case 2: (a) Photopic image—panoramic view to the façade—luminance distribution [cd∙m−2]. (b) View to the room—luminance [cd∙m−2]. (c) View to the room—melanopic radiance [mW∙m−2∙sr−1].
The results of the luminance monitoring in the room are summarized with minimum, maximum, and average values for all Variations V0 to V3 in Table 7. The percentage reduction in the room luminance compared to the reference Variation V0 is specified.
Table 7.
Luminance monitored in the room.
Table 8 shows the processing of the horizontal Eh and spherical Eo illuminance [lx] and horizontal Eh,mel and spherical melanopic irradiance Eo,mel [mW∙m−2] [82] data collected in the room using the luminance analyzer LDA in the center of the lens, at a position 0.85 m above the room floor.
Table 8.
Horizontal and spherical illuminance and melanopic irradiance monitored in the room.
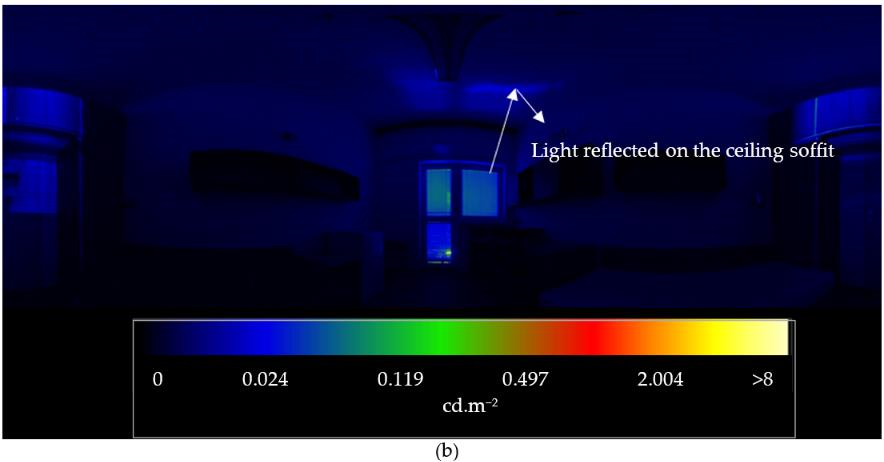
The increase in horizonal illuminance in Variation V3 is caused by light transmitted from outdoors and reflected on the ceiling soffit. The reflected light directly affects the measurement sensor.
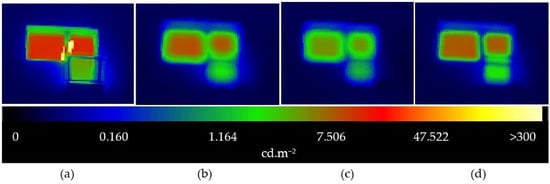
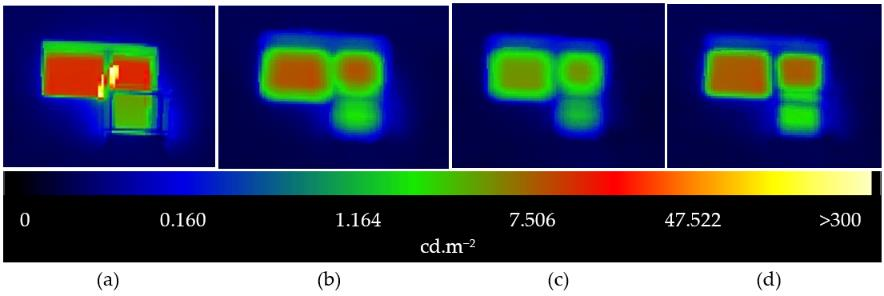
The luminance images under the different Variations V0 to V3 of the room window are compared in Figure 21. From the distant place view, the luminance images look similar and show that even windows with shading blinds impact the external obtrusive lighting. However, Variation V2 substantially reduces the interior light transmission to outdoors compared to Variation V3. Table 9 summarizes the luminance data from the images. The luminance data were sorted for the window and a part of the building façade that borders the window (0.5 m wide).
Figure 21.
Luminance (cd∙m−2) distribution on the windows of the residence building façade in the panoramic view: (a) opened window, Variation V0; (b) Variation V1; (c) Variation V2; (d) Variation V3.
Table 9.
Minimum, maximum, and average luminance of windows in Variations V0 to V3.
As expected, the open window image has the highest luminance distribution. However, the window in Variation V3 shows a brighter luminance image compared to Variation V2. This means that the blinds inclined toward the exterior side are less efficient in reducing the interior light transmission. Variation V3 lead to even higher luminance than V1 because of the additional effect of light reflection on the blinds.
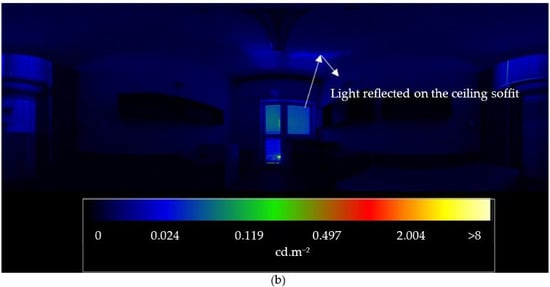
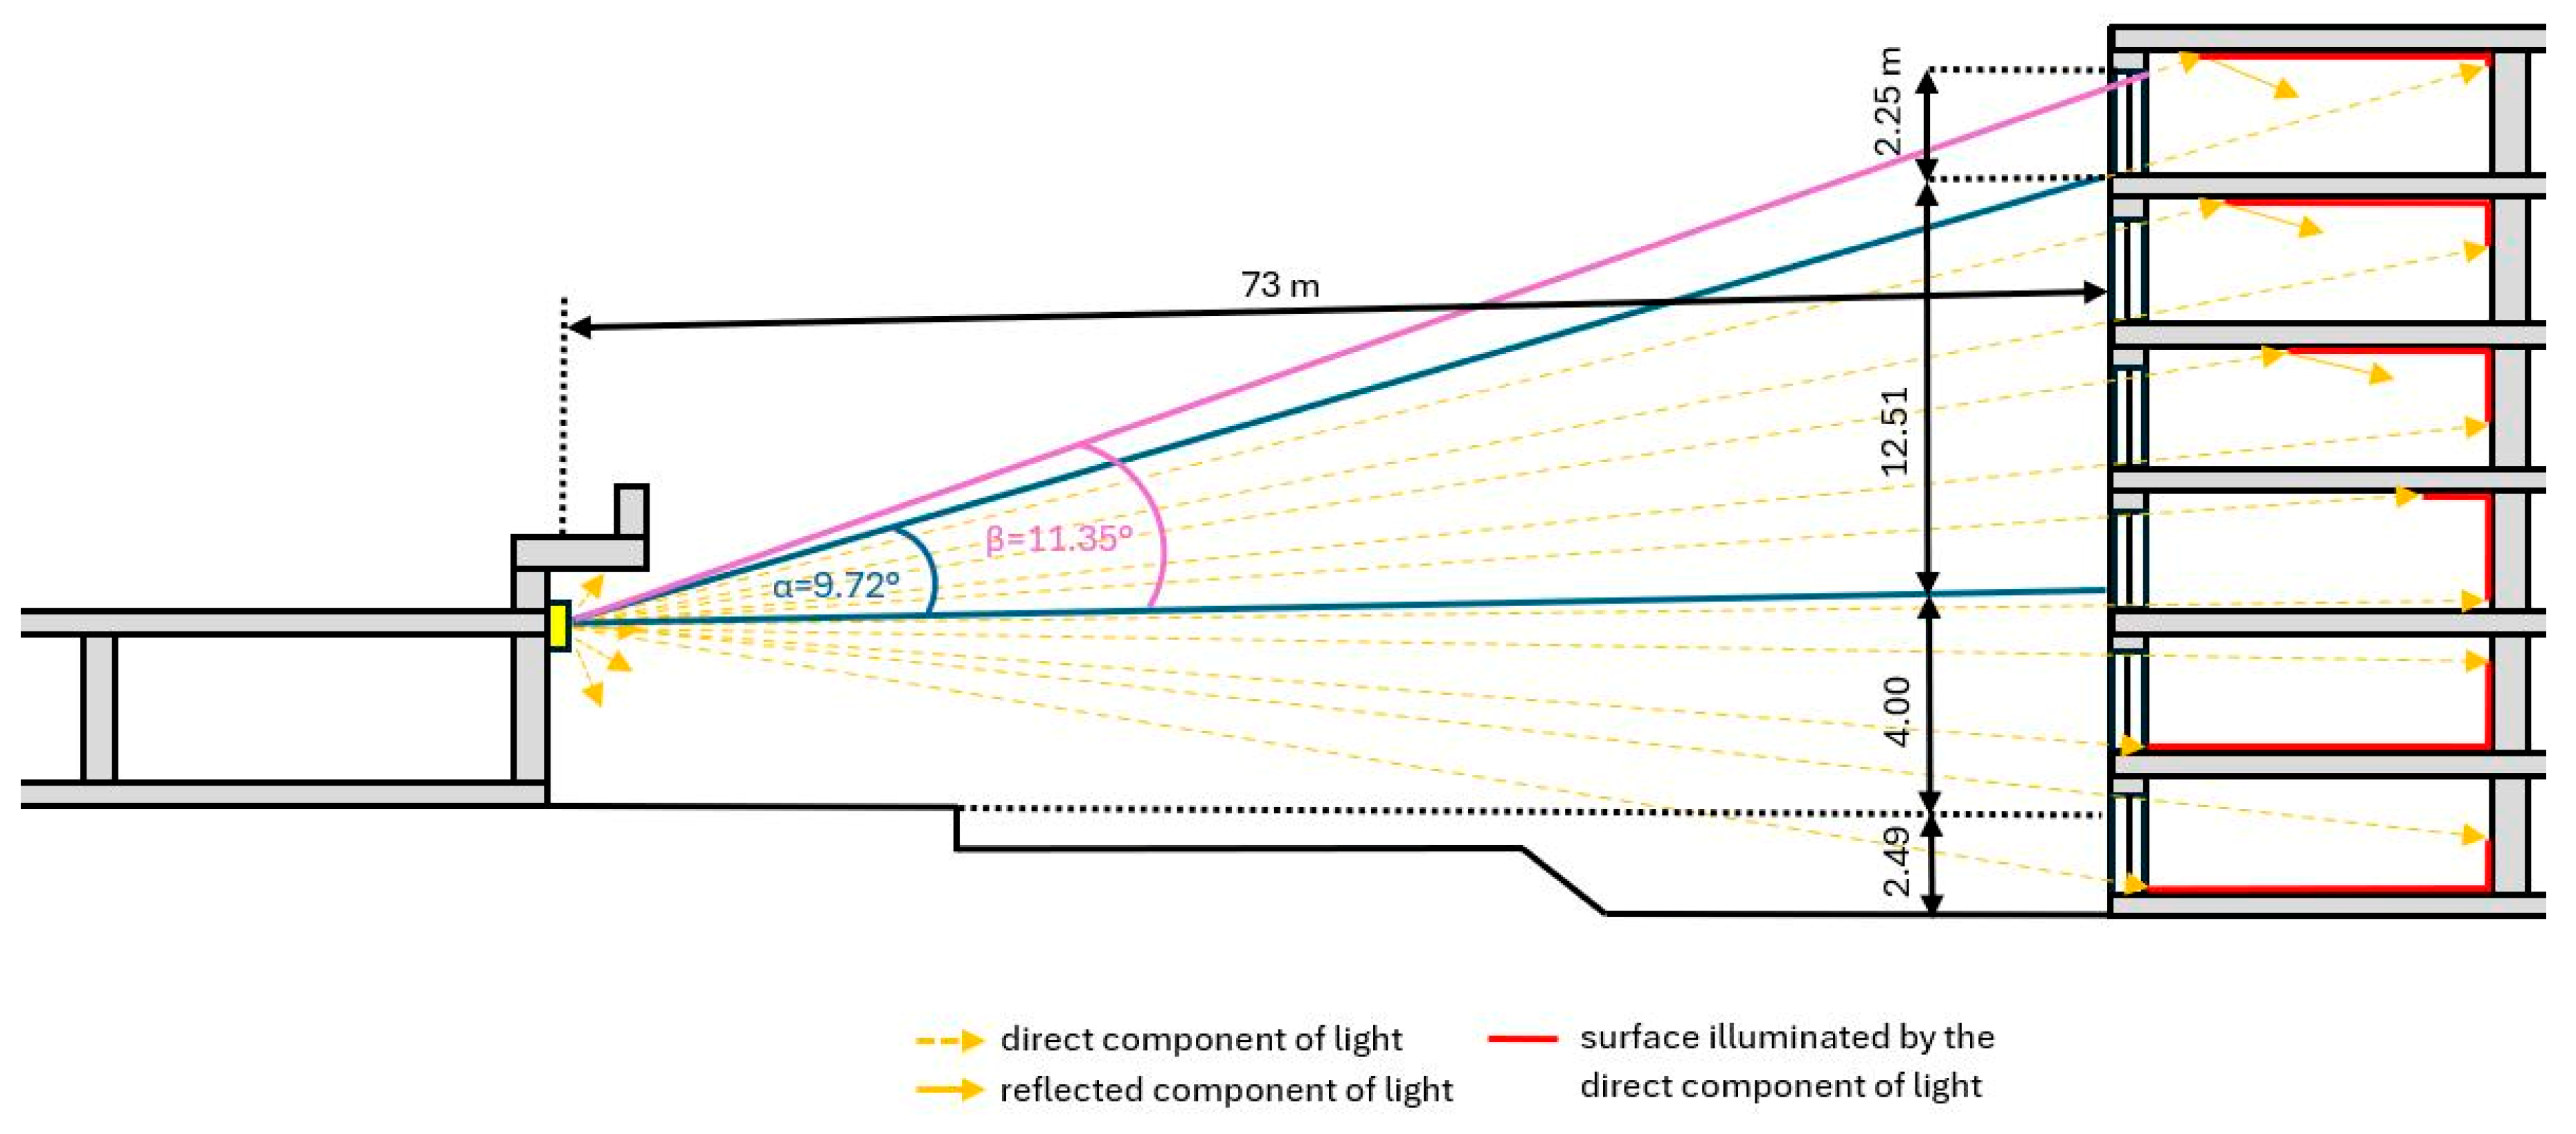
The impact of the external advertising sign on the dark room with the V2 and V3 window is shown in Figure 22. As the studied room is on the 5th floor and the external advertising sign is on the opposite side located on the ground floor building, it appears that the V3 window transmits more external light compared to the V2 shaded window. Horizontal blinds represent obstructions to the light coming from below. Light is transmitted through the window into the room and reflected on the white surface of the ceiling soffit, as shown in Figure 22b.
Figure 22.
Luminance (cd∙m−2) distribution in the view into the room in Case 1: (a) window with blind in Variation V2; (b) window with blind in Variation V3.
4. Discussion
4.1. Comparison of Simulation Outputs and Data of Measurements
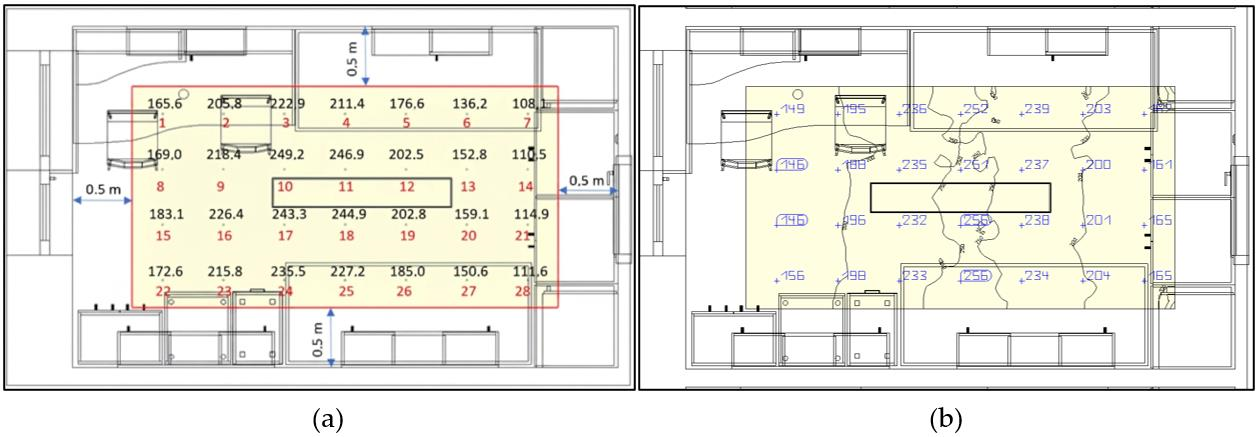
The results of the computer simulations were compared with data from light measurements (Figure 23). The figure compares the illuminance values on the horizontal reference plane in the room under the Case 2 evaluation for the activated interior luminaire and without the influence of the external advertising sign. Measurements and simulation values are compared and summarized in Table 10 for the illuminance data and Table 11 for the luminance records, respectively.
MAPE = Mean Absolute Percentage Error = 20.52%
MAE = Mean Absolute Error = 32.38 lx
Figure 23.
Horizontal illuminance [lx] on the reference plane in the room (0.85 m above the floor): (a) measurement data; (b) simulation outputs.
Table 10.
Comparison of measured and simulated illuminance values; absolute percentage error.
Table 11.
Comparison of measured and simulated luminance values.
- RMSE = Root Mean Square Error = 37.18 lx
- where n is the total number of measurement points;
- is the calculated illuminance from the simulation at the i-th point [lx];
- is the measured illuminance at the i-th point [lx].
When analyzing the horizontal illuminance (Table 10), a specific distribution character of the simulation model errors relative to the experimental data is evident. In the central area of the room, which is located directly underneath the activated luminaire and exhibits the highest illuminance values, the simulation model achieves a high correlation with reality. In individual grid nodes such as points 2, 3, 10, 11, 17, 18, and 24, the absolute percentage error fluctuates close to 5%. This strong agreement confirms that the luminous flux of the luminaire and its luminous intensity distribution implemented in the software correspond closely to the parameters of the actual luminaire installed in the room interior.
Conversely, a rapid escalation of errors occurs towards the peripheral zones and corners of the room (e.g., points 5, 6, 7, 13, and 14, and, symmetrically, 19, 21, 27, and 28), where the absolute percentage error exceeds 35% and reaches nearly 50% in extreme cases (points 7 and 28). In these areas, the simulation significantly overestimates the real values. One of the primary causes may be the reflected component of light from adjacent surfaces, which substantially influences the resulting illuminance values at these close-range points. The software operates with idealized surfaces that lack their actual physical texture, thereby altering the reflectance and scattering properties of light from the surfaces. Furthermore, the resulting illuminance values in the real environment were affected by non-homogeneous surface colors (the floor features a multi-tone variegated pattern) and surface dirt due to dust particles. Discrepancies between the model and the real state also arose from the color shades of the surfaces, which were defined in the simulation based on the closest visual similarity.
The measurement instrument uncertainty also significantly contributes to this error, specifically, the cosine error of the luxmeter photometric head. While the software integrates light rays arriving at oblique angles with mathematical perfection, the real sensor exhibits reduced sensitivity to these low angles of incidence, causing the luxmeter to underestimate the values in the corners. The error is further amplified by minor geometric inaccuracies during the manual positioning of the luxmeter within the physical grid, deviations in the sensor position and height, a decrease in the luminous flux due to the thermal stabilization of the luminaire after activation, grid voltage fluctuations, ambient light penetrating from the exterior, deviations in the luminous intensity distribution due to manufacturing tolerances of the luminaire, the age of the luminaire, luminaire dirt accumulation, aging of the luminaire materials, or light reflections from the present measurement operator.
The overall accuracy of the simulation model compared to the experimental measurements was verified using three statistical metrics. The mean absolute error reached a value of 32.38 lx, representing the average linear difference between the simulation and reality at each node of the scene. The root mean square error value stands at 37.18 lx, and its increase relative to the linear error mathematically confirms the presence of pronounced localized deviations in the corners of the room. From the perspective of relative evaluation, the mean absolute percentage error yields a value of 20.52%.
Furthermore, the in situ monitored luminance image was compared with the result of the DIALux simulation of the interior luminance distribution for Case 2, as shown in Figure 24 and Table 11.
Figure 24.
Luminance distribution in the room in Case 2: (a) in situ image; (b) simulation.
The comparative cases shown in Figure 23 and Figure 24 demonstrate the consistency of the measured and simulated data under analysis. The scope of the measurements in this study is limited due to restricted access to students’ rooms. The study covers only one type of shading blind and evaluates specific light sources used for indoor and outdoor lighting. It is obvious that window glazing and frames, as well as shading elements of various types and colors, could influence the light transmission of different light sources and their installations, as well as their impact on the indoor and outdoor environments.
4.2. Result Discussion
4.2.1. Discussion of Simulation Outputs
The light simulations present models of the building façade illumination due to windows and predict its influence on outdoor areas. In Model A, a gradation of illumination is visible with decreasing distance from the building. In Model B, concentrated bands of higher illumination are created in agreement with the linear arrangement of illuminated rooms. Especially when the blinds are tilted at an angle of 45° and the distance of windows from the ground increases, the distant part of the reference plane is illuminated. The closer the window is to the ground, the smaller the illuminated area of the reference horizontal plane.
The simulations show that the façade of the building was mostly illuminated on the ground floor (model B, V1—0.350 lx), because the reflected component of the light flux from the adjacent pavement is increased there. As the distance of the façade from the terrain increased, the façade illumination decreased and there was no significant local increase in illumination alongside the building height. In Model B and with the blinds in Variation V3, the façade illumination decreased by about 57% (0.150 lx) on the ground floor level. In the case of the same model with horizontal blinds (V2), the façade illumination decreased by 93% (0.022 lx) on the ground floor compared to the model with the unshaded window (V1).
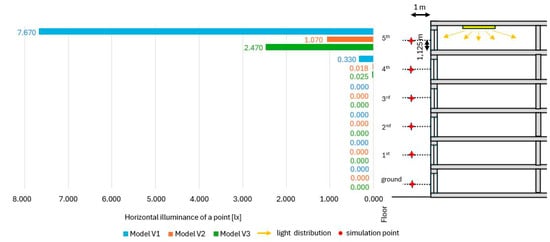
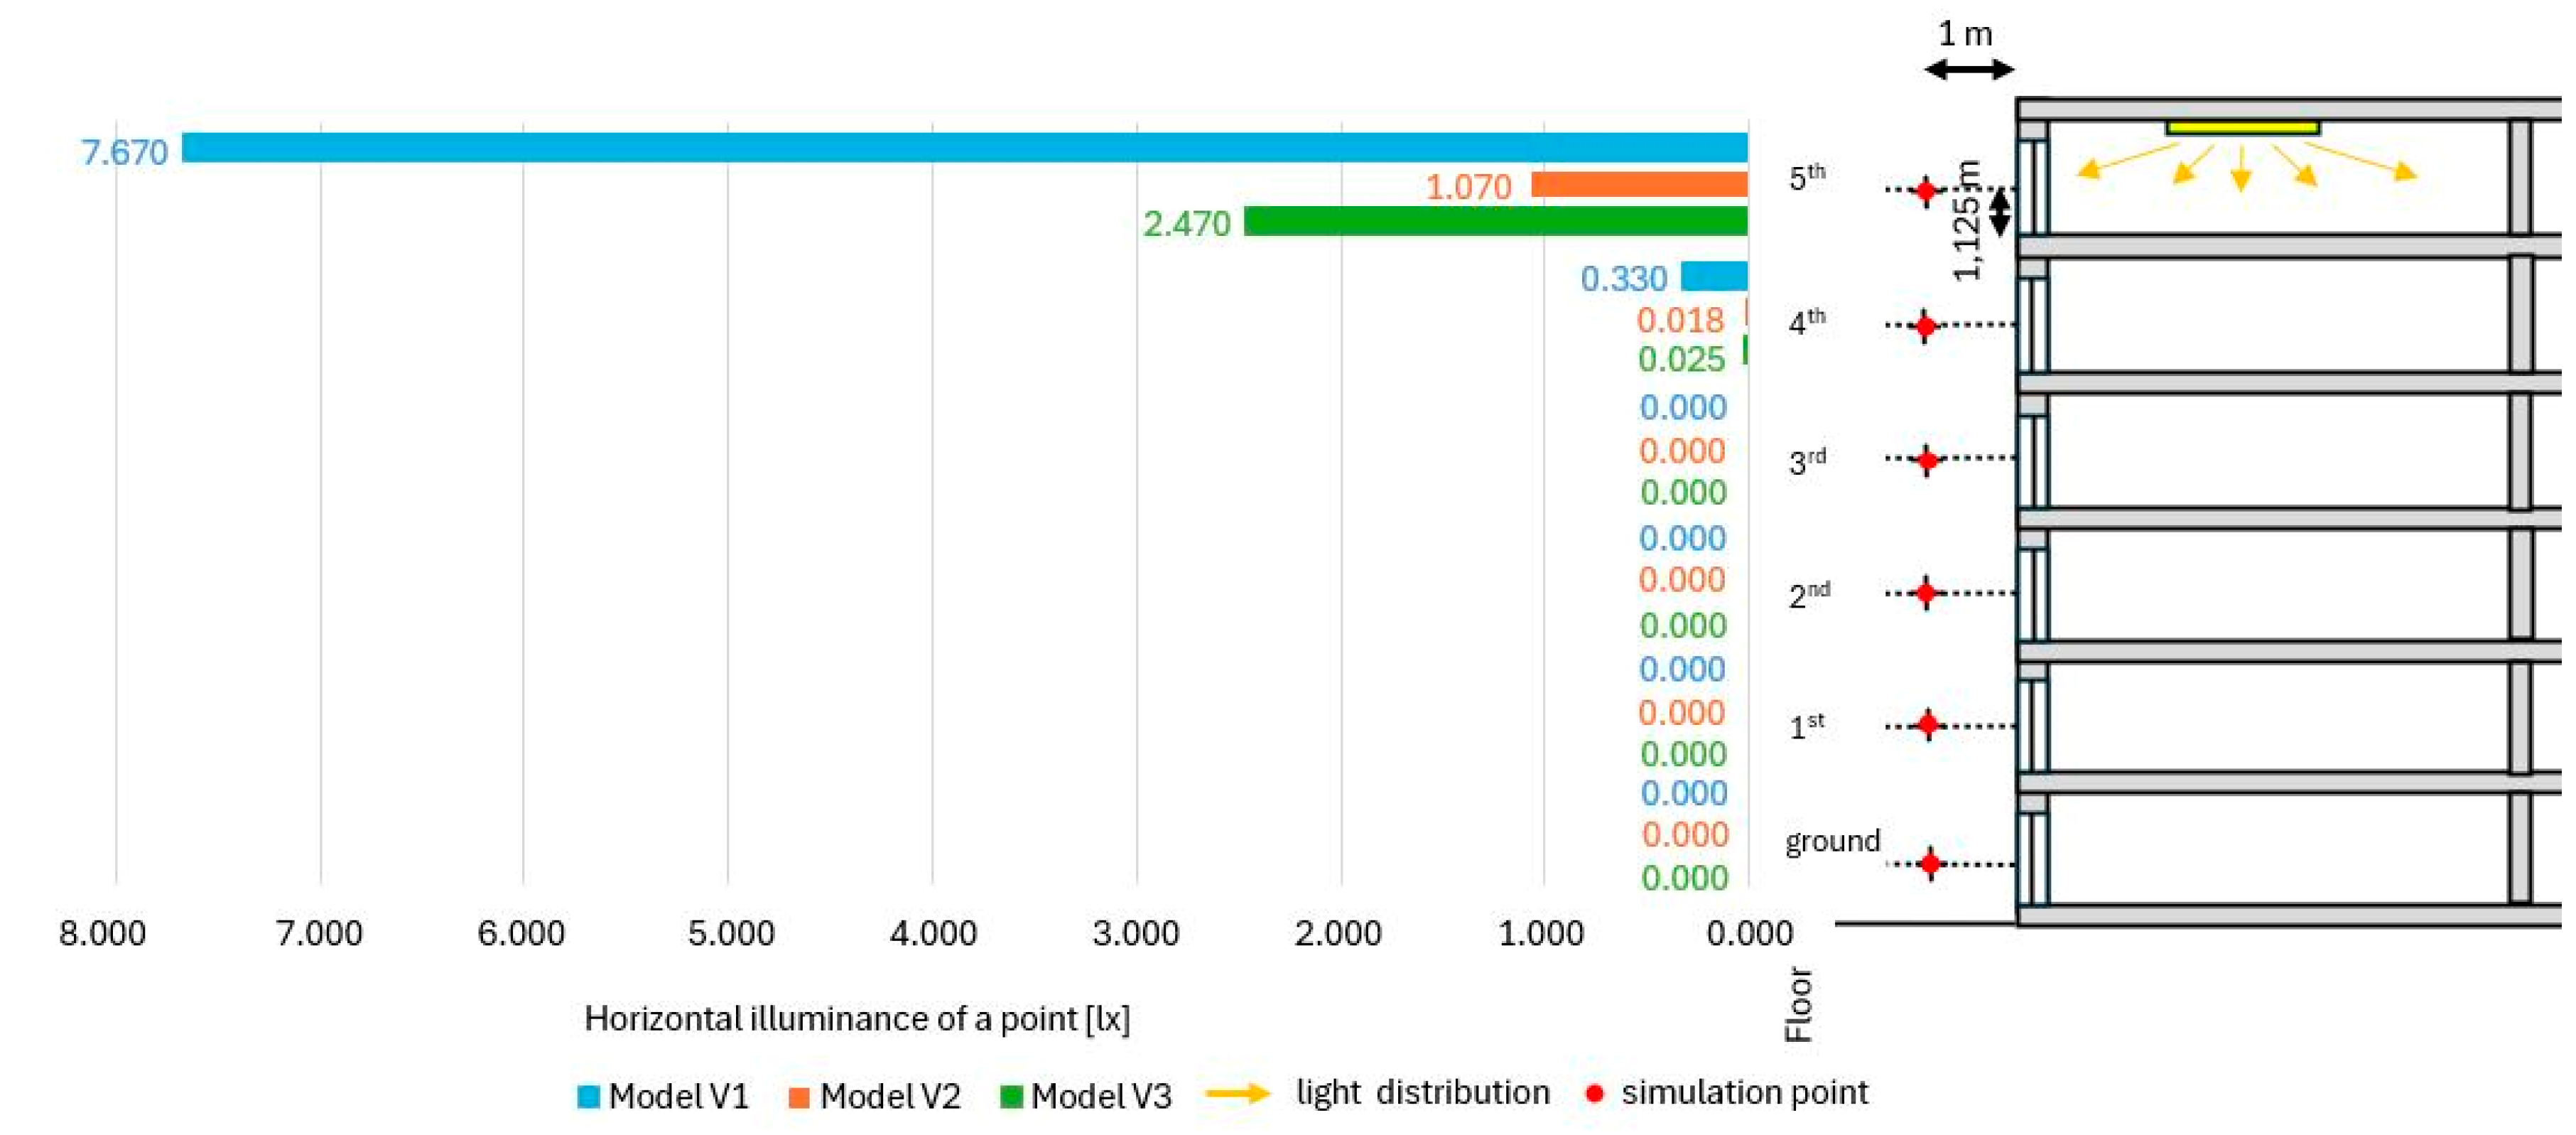
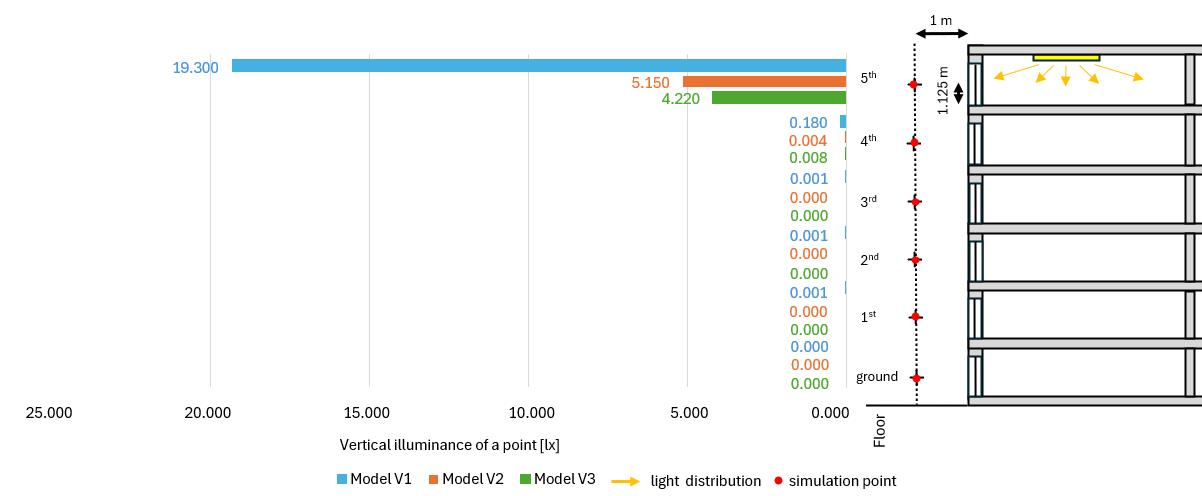
With the active luminaire in the room on the fifth floor, the illuminance was simulated at points located 1 m from the building façade at the center of the window, i.e., 1.125 m above the room floor. The horizontal illuminance of the points was calculated to compare the effects of the top floor luminaire activation on the building exterior at nighttime (Figure 25).
Figure 25.
External horizontal illuminance [lx] across the building floors.
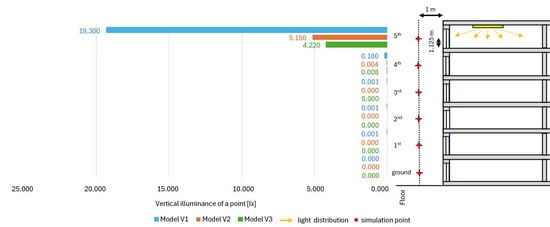
The same external points close to the façade were selected to compare the top floor luminaire activation’s impact on the vertical illuminance across the building floors. The vertical illuminance reaches up to 19.30 lx for the window without shading (Figure 26).
Figure 26.
External vertical illuminance [lx] across the building floors.
The light distribution of the luminaire is defined by its luminous intensity distribution. The internal luminaire has an oval curve (in both the longitudinal and transverse axes of the luminaire).
4.2.2. Discussion of Measured Data
The results of the luminance monitoring show images where the effect of illuminated windows is noticeable. The positions of shading blinds play an important role in the evaluation.
The measurement results are in agreement with similar studies and previously published results. A previous study [73] reports a monitored luminance of 1.2 cd∙m−2 for a window with shading. This study identifies a luminance of 4.3 cd∙m−2 for the window with horizontal blinds (V2) and that of 8.3 cd∙m−2 for the variation of the window with a blind (V3). In this comparison, the window of Variation V3 is less shaded from the exterior side. The room view image shows high luminance of the window because of the effect of the advertising sign. The window luminance reaches more than 1000 cd∙m−2, in contrast with other internal surfaces of the dark room (less than 0.02 cd∙m−2). Luminance on the interior furniture is slightly increased.
The light of the advertising sign is transmitted into the room and reflected on the white surface of the ceiling soffit as shown in Figure 22b and Figure 27. This represents a quite inconvenient situation in the room with the window shading blinds in Variation V3.
Figure 27.
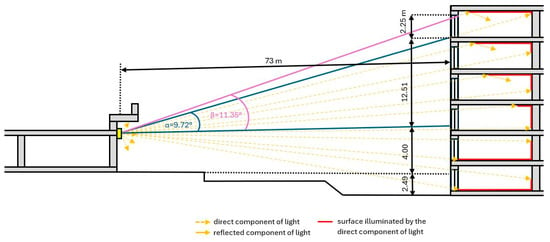
Scheme of the advertising sign’s light transmission into the student residence building.
The melanopic image shows the impact of the advertising sign because the melanopic effect is dominant for light affecting the eyes for the upper quadrant [92,93]. The window glass pane has a melanopic radiance exceeding 0.1 mW∙m−2∙sr−1, the white plaster surfaces about 0.1 mW∙m−2∙sr−1, the darker surfaces about 0.01 mW∙m−2sr−1, and the polished furniture about 0.06 mW∙m−2∙sr−1.
There is a little roof overhang above the advertising sign, which is visible in the photograph of Figure 3 and drawn in Figure 26. The overhang represents an obscuring element for the upper floors of the building with the sign installation, while the opposite student residence building is not influenced by the roof shading effect. At an angle of about 45°, the light could freely affect the window of the room on the top floor.
It is advisable to use appropriate shading systems at night to prevent the leakage of disturbing light into nearby areas. Common window blinds are not efficient for nighttime shading. The evaluation of the shading effect for horizontal blinds based on light simulations [77] is in agreement with this study’s approach. To prevent obtrusive light at night, blind slats should be fully closed or in the horizontal position or they can be tilted toward the interior side. It is also appropriate to use other shading techniques like roller blinds or louvres and shutters.
Summarizing the measured data regarding the maximum values of the vertical illuminance Ev [lx] (measured using the spectroradiometer) and luminance Lb [cd∙m−2] (monitored using the Alanisator) on the students’ residence façade, it can be concluded that the nighttime lighting exceeds the standard illuminance limit (Table 12) but complies with the luminance limit (Table 13) for environmental zone E2, which represents low-district brightness areas, such as industrial or residential rural areas [94].
Table 12.
Comparison of measured illuminance with standard requirements.
Table 13.
Comparison of measured luminance with standard requirements.
4.3. Study Limitation
The study addresses the impact of nocturnal light in the locality of the students’ residence. Two contradictory problems were solved, namely the transmission of light from the interior to outdoors and the penetration of light from the exterior into the building interior. Particular attention was paid to windows and shading blinds. As these blinds are commonly found in residential rooms, it was of interest to evaluate their actual shading impact during nighttime hours. The next part of this study will focus on different shading systems and various types of interior and exterior light sources. Given the broad scope of the subject matter, which involves numerous parameters and aspects, the initial phase of this study focused on a specific type of shading blind set at various tilt angles.
Another limitation of this study is in the external light sources. As street lamp and traffic lighting is essentially beyond one’s control, the study was conducted under two different cases to estimate the effect of the big advertising sign on the residential building and the impact of the lit window on the exterior environment. Ideally, four conditions should be examined: the exterior and interior light sources off, both sources on, the advertising sign only, and the room luminaire only. This complex evaluation is planned for a future study, which would involve all these cases. In this instance, the site of the students’ residence is in the city center, located near a busy road. It was not possible to switch off street lights or limit local traffic. This problem could be solved by contacting the local municipality to request extra permissions for our research purposes. However, because the advertisement sign is quite a dominant light source in the local area, measurements were limited to two scenarios: Case 1, with the advertisement light and dark room interior, and Case 2, with the lit window and non-activated advertisement sign. Consequently, the presented results were influenced by starlight and moonlight.
The initial phase of the research aimed to compare the results of lighting simulations with field measurements. Given the reasonable agreement achieved, the next step will involve a wide range of parameters for light simulations to cover the complexity of the problem. Due to limited access to the residential buildings at night, the simulations appear to be a suitable alternative to in situ assessments.
5. Conclusions
The impact of a student residence building’s lighting on the outdoor nocturnal environment of the university residential campus was studied, and the influence of light emitted from a nearby advertising sign on a room inside the building was also monitored. In both cases, the night lighting represents an obtrusive element for the locality and for indoor spaces in the fully occupied residential building. It was observed that, between 8 PM and 1 AM, at least half of the building façade has lit windows. Consequently, two models were chosen representing a scenario where fifty percent of the lights are active, based on different configurations of illuminated windows.
Firstly, the lit windows were arranged in a checkerboard pattern. Secondly, they appeared in horizontal rows on the ground floor, top floor, and third floor. In the next step, variations involving window shading blinds at different angles were analyzed to assess their shading impact. The study evaluations focused on the following:
- •
- Vertical illuminance and luminance analysis on the external vertical plane of the building façade;
- •
- Specifying exterior horizontal illuminance close to illuminated windows presented on the external horizontal reference plane 0.20 m above ground level;
- •
- Comparing interior horizontal illuminance measurements and simulations on the horizontal reference plane 0.85 m above the room floor;
- •
- Discussing the external vertical and horizontal illuminance changes in central parts of windows across individual floors of the students’ residence building on the external reference planes positioned 1 m from the façade.
All these evaluations were carried out to study the specific situation of the nighttime lighting in the selected region. The simulation outputs were compared with results from light measurements. The analysis shows consistency between the measured and simulated data. Light simulations appear to be convenient for further comprehensive evaluations; the presented study only covers windows with common shading blinds and specific light sources.
As presented in simulation outputs and monitored in luminance and melanopic radiance images, the shading effect of the selected window blinds is limited in this specific case. The solution may lie in more efficient shading systems and the installation of electric lights with changeable light spectra and intensities for nighttime lighting that would be less obtrusive for buildings and their surroundings.
Based on the results of this study, the questions set out in the Introduction can be answered as follows:
- •
- The studied building façade influences its external areas through lit windows during nighttime hours, failing to meet the required vertical illuminance limits on a building façade in the given environmental zone according to standard BS EN 12464-2 [94];
- •
- The selected type of shading blind does not seem to be entirely effective in reducing light transmission. In particular, blinds inclined 45° to the exterior side represent a risk of direct light transmission from the rooms’ ceiling luminaires to the external areas near the building. On the other hand, such shadings installed on the windows of rooms on the upper floor could transmit light from the advertising sign toward the upper part of the rooms and affect the interior at nighttime.
- •
- The luminance and melanopic radiance images demonstrate that lit windows represent parts of the building façade with increased luminance. Nevertheless, the monitored façade luminance complies with the standard requirements [94].
Finally, the aforementioned limitations are noted because they represent influential conditions for further investigations. The problem is expected to be addressed in a following study focused on testing different types of light sources and window shadings. The study will aim to reduce obtrusive light to improve the visual comfort and well-being of occupants, while respecting energy, environmental, and architectural considerations, in agreement with the current research strategies and statements [95,96,97].
Author Contributions
Conceptualization, J.M.; formal analysis, J.Š.; data curation, Z.K.; writing—original draft preparation, Z.K.; writing—review and editing, J.M.; supervision, P.B.; visualization, Z.K.; investigation, Z.K.; methodology, P.B.; validation, J.Š. All authors have read and agreed to the published version of the manuscript.
Funding
This research received no external funding.
Data Availability Statement
The original contributions presented in this study are included in the article. Further inquiries can be directed to the corresponding author.
Acknowledgments
The authors acknowledge the research project of the Technology Agency of the Czech Republic TAČR SS07020273 Omnidirectional Light Pollution Analyser. Special thanks go to Adam Vávra for his help with the light measurements. The Alanisator device’s invention was supported by the project TAČR SS05010159 Research and development in the field of measurement and evaluation of artificial light in the night environment and its impact on living organisms and the environment as a whole.
Conflicts of Interest
The authors declare no conflict of interest.
Abbreviations
The following abbreviations are used in this manuscript:
| ALAN | Artificial Light at Night |
| CCT | Correlated Color Temperature |
| CRI | Color Rendering Index |
| LED | Light Emitting Diode |
| MAE | Mean Absolute Error |
| MAPE | Mean Absolute Percentage Error |
| RMSE | Root Mean Square Error |
| TAČR | Technology Agency of the Czech Republic |
References
- Falchi, F.; Furgoni, R.; Gallaway, T.A.; Rybnikova, N.A.; Portnov, B.A.; Baugh, K.E.; Cinzano, P.; Elvidge, C.D. Light pollution in USA and Europe: The good, the bad and the ugly. J. Environ. Manag. 2019, 248, 109227. [Google Scholar] [CrossRef] [Scilit]
- Gaston, K.J.; Visser, M.E.; Hölker, F. The biological impacts of artificial light at night: The research challenge. Philos. Trans. R. Soc. B Biol. Sci. 2015, 370, 20140133. [Google Scholar] [CrossRef] [Scilit]
- Gaston, K.J.; Duffy, J.P.; Gaston, S.; Bennie, J.; Davies, T.W. Human alteration of natural light cycles: Causes and ecological consequences. Oecologia 2014, 176, 917–931. [Google Scholar] [CrossRef] [Scilit]
- Aubé, M. Physical behaviour of anthropogenic light propagation into the nocturnal environment. Philos. Trans. R. Soc. B 2015, 370, 20140117, Correction in Philos. Trans. R. Soc. B 2015, 370, 20150143. [Google Scholar] [CrossRef] [Scilit]
- Jägerbrand, A.J.; Spoelstra, K. Effects of anthropogenic light on species and ecosystems. Science 2023, 380, 1125–1130. [Google Scholar] [CrossRef] [Scilit]
- Gaston, K.J.; Bennie, J.; Davies, T.W.; Hopkins, J. The ecological impacts of nighttime light pollution: A mechanistic appraisal. Biol. Rev. 2013, 88, 912. [Google Scholar] [CrossRef] [Scilit]
- Falchi, F.; Cinzano, P.; Elvidge, C.D.; Keith, D.M.; Haim, A. Limiting the impact of light pollution on human health, environment and stellar visibility. J. Environ. Manag. 2011, 92, 2714–2722. [Google Scholar] [CrossRef] [Scilit]
- Falchi, F.; Ramos, F.; Bará, S.; Sanhueza, P.; Arancibia, M.J.; Damke, G.; Cinzano, P. Light pollution indicators for all the major astronomical observatories. Mon. Not. R. Astron. Soc. 2023, 519, 26–33. [Google Scholar] [CrossRef] [Scilit]
- Bará, S.; Falchi, F. Artificial light at night: A global disruptor of the night-time environment. Philos. Trans. R. Soc. B Biol. Sci. 2023, 378, 20220352. [Google Scholar] [CrossRef] [Scilit]
- Pandharipande, A.; Newsham, G. Lighting controls: Evolution and revolution. Light. Res. Technol. 2018, 50, 115–128. [Google Scholar] [CrossRef] [Scilit]
- CIE. Obtrusive Light. In e-ILV; CIE 17-29-181; CIE: Vienna, Austria, 2020; Available online: https://cie.co.at/eilvterm/17-29-181 (accessed on 9 July 2026).
- CIE. ILV: International Lighting Vocabulary, 2nd ed.; CIE S 017:2020; CIE: Vienna, Austria, 2020. [Google Scholar] [CrossRef] [Scilit]
- Narisada, K.; Schreuder, D. Light Pollution Handbook, 1st ed.; Springer: Dordrecht, The Netherlands, 2004. [Google Scholar]
- Cao, M.; Xu, T.; Yin, D. Understanding light pollution: Recent advances on its health threats and regulations. J. Environ. Sci. 2023, 127, 589–602. [Google Scholar] [CrossRef] [Scilit]
- Longcore, T.; Rich, C. Ecological light pollution. Front. Ecol. Environ. 2004, 2, 191–198. [Google Scholar] [CrossRef]
- Rich, C.; Longcore, T. (Eds.) Ecological Consequences of Artificial Night Lighting; Island Press: Washington, DC, USA, 2006. [Google Scholar]
- Jägerbrand, A.K.; Bouroussis, C.A. Ecological impact of artificial light at night: Effective strategies and measures to deal with protected species and habitats. Sustainability 2021, 13, 5991. [Google Scholar] [CrossRef] [Scilit]
- Gallaway, T.; Olsen, R.N.; Mitchell, D.M. The economics of global light pollution. Ecol. Econ. 2010, 69, 658–665. [Google Scholar] [CrossRef] [Scilit]
- Falchi, F.; Cinzano, P.; Duriscoe, D.; Kyba, C.C.M.; Elvidge, C.D.; Baugh, K.; Portnov, B.A.; Rybnikova, N.A.; Furgoni, R. The new world atlas of artificial night sky brightness. Sci. Adv. 2016, 2, e1600377. [Google Scholar] [CrossRef] [Scilit]
- Stoyan, R.; Falchi, F.; Furgoni, R. Sky Quality Map Europe: Light Pollution & Dark Sky Map—Star Light Preserves and Star Party Sites; Oculum-Verlag: Erlangen, Germany, 2022. [Google Scholar]
- Light Pollution Map. Available online: https://www.lightpollutionmap.info (accessed on 9 July 2026).
- Cho, Y.; Ryu, S.H.; Lee, B.R.; Kim, K.H.; Lee, E.; Choi, J. Effects of artificial light at night on human health: A literature review of observational and experimental studies applied to exposure assessment. Chronobiol. Int. 2015, 32, 1294–1310. [Google Scholar] [CrossRef] [Scilit]
- Figueiro, M.G. An overview of the effects of light on human circadian rhythms: Implications for new light sources and lighting systems design. J. Light Vis. Environ. 2013, 37, 51–61. [Google Scholar] [CrossRef] [Scilit]
- Baron, K.G.; Reid, K.J. Circadian misalignment and health. Int. Rev. Psychiatry 2014, 26, 139–154. [Google Scholar] [CrossRef] [Scilit]
- Kumar, P.; Ashawat, M.S.; Pandit, V.; Sharma, D.K. Artificial light pollution at night: A risk for normal circadian rhythm and physiological functions in humans. Curr. Environ. Eng. 2019, 6, 111–125. [Google Scholar] [CrossRef] [Scilit]
- Davis, L.K.; Bumgarner, J.; Nelson, R.J.; Folken, L.K. Health effects of disrupted circadian rhythms by artificial light at night. Policy Insights Behav. Brain Sci. 2023, 10, 229–236. [Google Scholar] [CrossRef] [Scilit]
- Pauley, S.M. Lighting for the human circadian clock: Recent research indicates that lighting has become a public health issue. Med. Hypotheses 2004, 63, 588–596. [Google Scholar] [CrossRef] [Scilit]
- Cinzano, P.; Falchi, F. Quantifying light pollution. J. Quant. Spectrosc. Radiat. Transf. 2014, 139, 13–20. [Google Scholar] [CrossRef] [Scilit]
- Son, S.; Lamp, S.; Yeom, D.J.; Sharp, N. The influence of lighting and thermal environments on sleep and cognitive function in older adults. Build. Environ. 2024, 265, 112028. [Google Scholar] [CrossRef] [Scilit]
- Jägerbrand, A.; Gašparovský, D.; Bouroussis, C.; Schlangen, L.; Lau, S.; Donners, M. Correspondence: Obtrusive light, light pollution and sky glow: Areas for research, development and standardisation. Light. Res. Technol. 2022, 54, 191–194. [Google Scholar] [CrossRef] [Scilit]
- Wirz-Justice, A. Light and dark as a “drug”. In Progress in Drug Research; Jucker, E., Meyer, U., Eds.; Birkhäuser: Basel, Switzerland, 1987; Volume 31, pp. 383–411. [Google Scholar] [CrossRef] [Scilit]
- Erren, T.C.; Reiter, R.J. Light hygiene: Time to make preventive use of insights—Old and new—Into the nexus of the drug light, melatonin, clocks, chronodisruption and public health. Med. Hypotheses 2009, 73, 537–541. [Google Scholar] [CrossRef] [Scilit]
- Erren, T.C.; Reiter, R.J.; Piekarski, C. Light, timing of biological rhythms, and chronodisruption in man. Naturwissenschaften 2003, 90, 485–494. [Google Scholar] [CrossRef] [Scilit]
- Zielinska-Dabkowska, K.M. Make lighting healthier. Nature 2018, 553, 274–276. [Google Scholar] [CrossRef] [Scilit]
- Hao, Y.; Wang, P.; Zhang, Z.; Xu, Z.; Jia, D. A review of the characteristics of light pollution: Assessment technique, policy, and legislation. Energies 2024, 17, 2750. [Google Scholar] [CrossRef] [Scilit]
- CIE. Guide on the Limitation of the Effects of Obtrusive Light from Outdoor Lighting Installations; CIE 150:2017; CIE: Vienna, Austria, 2017. [Google Scholar] [CrossRef] [Scilit]
- CIE. A Guide to Urban Lighting Masterplanning; CIE 234:2019; CIE: Vienna, Austria, 2019. [Google Scholar] [CrossRef] [Scilit]
- Institution of Lighting Professionals (ILP). Guidance Note 01/21: The Reduction of Obtrusive Light; ILP: Rugby, UK, 2021. [Google Scholar]
- The Society of Light and Lighting. CIBSE Lighting Guide 06: The Exterior Environment; CIBSE: London, UK, 2016. [Google Scholar]
- Ministry of the Environment of the Czech Republic. Light Pollution Reduction Measures in Europe; Ministry of the Environment of the Czech Republic: Prague, Czech Republic, 2022. Available online: https://mzp.gov.cz/system/files/2025-03/OPZPUR-Light_pollution_reduction_measures_in_Europe_short-20230117.pdf (accessed on 9 July 2026).
- Yakushina, Y.; Smith, D.; Sánchez de Miguel, A. Light Pollution: Challenges and Responses for Monitoring; DarkSky International: Tucson, AZ, USA, 2025; Available online: https://darksky.org/app/uploads/2025/02/EU-Manifesto-1.pdf (accessed on 9 July 2026).
- CIE. Guidelines on Minimizing Sky Glow. Available online: https://cie.co.at/publications/guidelines-minimizing-sky-glow (accessed on 9 July 2026).
- Howard, A.; Raynham, P.; Zielinska-Dabkowska, K.M.; Stolk, H. Professional Lighting Guide PLG 05/23: The Brightness of Illuminated Advertisements Including Digital Displays; ILP: Rugby, UK, 2023; Available online: https://docs.planning.org.uk/20251016/8/T3525NMF19P00/tjy1e18bh1khwech.pdf (accessed on 9 July 2026).
- ISO/CIE 8995-1:2025; Light and Lighting—Lighting of Work Places—Part 1: Indoor. ISO/CIE: Geneva, Switzerland, 2025.
- Quek, G.; Wienold, J.; Khanie, M.S.; Erell, E.; Kaftan, E.; Tzemepelikos, A.; Konstantzos, I.; Christoffersen, J.; Kuhn, T.; Andersen, M. Comparing performance of discomfort glare metrics in high and low adaptation levels. Build. Environ. 2021, 206, 108335. [Google Scholar] [CrossRef] [Scilit]
- Longcore, T. A compendium of photopigment peak sensitivities and visual spectral response curves of terrestrial wildlife to guide design of outdoor nighttime lighting. Basic Appl. Ecol. 2023, 73, 40–50. [Google Scholar] [CrossRef] [Scilit]
- Hölker, F.; Moss, T.; Griefahn, B.; Kloas, W.; Voigt, C.C.; Henckel, D.; Franke, S.; Uhrlandt, D.; Fischer, J.; Klenke, R.; et al. The dark side of light: A transdisciplinary research agenda for light pollution policy. Ecol. Soc. 2010, 15, 13. [Google Scholar] [CrossRef]
- Gaston, K.J.; Gaston, S.; Bennie, J.; Hopkins, J. Benefits and costs of artificial nighttime lighting of the environment. Environ. Rev. 2015, 23, 14–23. [Google Scholar] [CrossRef] [Scilit]
- Gaston, K.J.; Davies, T.W.; Bennie, J.; Hopkins, J. Review: Reducing the ecological consequences of night-time light pollution: Options and developments. J. Appl. Ecol. 2012, 49, 1256–1266. [Google Scholar] [CrossRef] [Scilit]
- Zielinska-Dabkowska, K.M.; Xavia, K. Global approaches to reduce light pollution from media architecture and non-static, self-luminous LED displays for mixed-use urban developments. Sustainability 2019, 11, 3446. [Google Scholar] [CrossRef] [Scilit]
- Figueiro, M.G.; Saldo, E.; Rea, M.S.; Kubarek, K.; Cunningham, J. Developing architectural lighting designs to improve sleep in older adults. Open Sleep J. 2008, 1, 40–51. [Google Scholar] [CrossRef] [Scilit]
- Figueiro, M.G.; Brons, J.A.; Plitnick, B.; Donlan, B.; Leslie, R.P. Measuring circadian light and its impact on adolescents. Light. Res. Technol. 2011, 43, 201–215. [Google Scholar] [CrossRef] [Scilit]
- Palomar-Cros, A.; Deprato, A.; Papantoniou, K.; Straif, K.; Lacy, P.; Maidstone, R.; Adan, A.; Haldar, P.; Moitra, S.; Navarro, J.F.; et al. Indoor and outdoor artificial light-at-night (ALAN) and cancer risk: A systematic review and meta-analysis of multiple cancer sites and with a critical appraisal of exposure assessment. Sci. Total Environ. 2024, 955, 177059. [Google Scholar] [CrossRef] [Scilit]
- Rea, M.S.; Figueiro, M.G.; Bullough, J.D. Circadian photobiology: An emerging framework for lighting practice and research. Light. Res. Technol. 2002, 34, 177–190. [Google Scholar] [CrossRef] [Scilit]
- Sanders, D.; Frago, E.; Kehoe, R.; Patterson, C.; Gaston, K.J. A meta-analysis of biological impacts of artificial light at night. Nat. Ecol. Evol. 2021, 5, 74–81. [Google Scholar] [CrossRef] [Scilit]
- Martinsons, C.; Veitch, J.A.; Loughran, S.; Nixon, A.; Mate, R.; Harris, R.; Shen, L. Solid State Lighting: Review of Health Effects; IEA 4E Smart Sustainability in Lighting & Controls Platform: Stockholm, Sweden, 2024.
- Vetter, C.; Phillips, A.J.K.; Silva, A.; Lockley, S.W.; Glickman, G. Light me up? Why, when, and how much light we need. J. Biol. Rhythm. 2019, 34, 573–575. [Google Scholar] [CrossRef] [Scilit]
- Shahidi, R.; Golmohammadi, R.; Babamiri, M.; Faradmal, J.; Aliabadi, M. Effect of warm/cool white lights on visual perception and mood in warm/cool color environments. EXCLI J. 2021, 20, 1379–1393. [Google Scholar] [CrossRef] [Scilit]
- Lewis, P.; Christoforou, R.; Ha, P.P.; Wild, U.; Schweiker, M.; Erren, T.C. Architecture, light, and circadian biology: A scoping review. Sci. Total Environ. 2024, 955, 177212. [Google Scholar] [CrossRef] [Scilit]
- Han, Z.; Zhou, Y.; Jiang, H.; Chien, S.; Xie, L.; Spanos, C.J. WinLight: A WiFi-based occupancy-driven lighting control system for smart building. Energy Build. 2018, 158, 924–938. [Google Scholar] [CrossRef] [Scilit]
- Bouroussis, C.A.; Topalis, F.V. Assessment of outdoor lighting installations and their impact on light pollution using unmanned aircraft systems—The concept of the drone-gonio-photometer. J. Quant. Spectrosc. Radiat. Transf. 2020, 253, 107155. [Google Scholar] [CrossRef] [Scilit]
- Dubnicka, R.; Lipnicky, L.; Gasparovsky, D. Measurement of obtrusive lighting of outdoor lighting installations. In Proceedings of the 29th CIE Session, Washington, DC, USA, 14–22 June 2019. [Google Scholar] [CrossRef] [Scilit]
- Ho, C.; Lin, H. Analysis of and control policies for light pollution from advertising signs in Taiwan. Light. Res. Technol. 2015, 47, 931–944. [Google Scholar] [CrossRef] [Scilit]
- Van Den Wymelenberg, K. Patterns of occupant interaction with window blinds: A literature review. Energy Build. 2012, 51, 165–176. [Google Scholar] [CrossRef] [Scilit]
- Isaacs, N.P. “The window area shall be at least one-tenth of the area of the room”: The origins of a daylight (and ventilation) requirement in modern building codes. Light. Res. Technol. 2024, 56, 637–659. [Google Scholar] [CrossRef] [Scilit]
- Sanati, L.; Utzinger, M. The effect of window shading design on occupant use of blinds and electric lighting. Build. Environ. 2013, 64, 67–76. [Google Scholar] [CrossRef] [Scilit]
- Bálský, M.; Panská, Z.; Zálešák, J.; Pavlousek, J. Mathematical models for analysing the lighting system in a room with blinds. In Proceedings of the World Sustainable Energy Days 2017, Wels, Austria, 1–3 March 2017. [Google Scholar]
- Novak, T.; Becak, P. Modeling of vertical surfaces radiation in connection with the evaluation of the obtrusive light. In Proceedings of the CIE 2021 Conference, Online, 27–29 September 2021. [Google Scholar] [CrossRef] [Scilit]
- Žák, P.; Habel, J.; Pelánová, Z. Comprehensive solution of the indoor lighting. In Proceedings of the LUMEN V4 Conference, Budapest, Hungary, 8–10 October 2014; pp. 26–29. [Google Scholar]
- Bará, S.; Escofet, J. Research note: Calculating spectral irradiance indoors. Light. Res. Technol. 2017, 49, 122–127. [Google Scholar] [CrossRef] [Scilit]
- Bará, S.; Escofet, J. On lamps, walls, and eyes: The spectral radiance field and the evaluation of light pollution indoors. J. Quant. Spectrosc. Radiat. Transf. 2018, 205, 267–277. [Google Scholar] [CrossRef] [Scilit]
- Tabaka, P.; Ściężor, T. Quality analysis of photometers using vertical window illuminance measurements. Sci. Rep. 2024, 14, 30421. [Google Scholar] [CrossRef] [Scilit]
- Darula, S. Windows in buildings: Potential source of light pollution. In Proceedings of the International Conference LPTMM on Light Pollution Theory, Modelling and Measurements, Smolenice, Slovakia, 15–18 April 2013; pp. 51–56. Available online: http://gpi.savba.sk/GPIweb/ogg/ikohut/LPTMM/proceedings_LPTMM-2013.pdf (accessed on 9 July 2026).
- Bará, S. Light pollution from windows in buildings. Zenodo 2025. [Google Scholar] [CrossRef]
- Du, J.; Zhang, X. Light trespass protection in a glazed office building: How the shading system works? In Proceedings of the 14th International Conference of IBPSA, Hyderabad, India, 7–9 December 2015. [Google Scholar] [CrossRef] [Scilit]
- Du, J.; Zhang, X. The impact of overhang on the risk of light trespass in a fully glazed office building. In Proceedings of the 1st International Conference on Sustainable Lighting and Light Pollution, Seoul, Republic of Korea, 5–7 November 2014; Available online: https://www.researchgate.net/publication/328253437_The_Impact_of_Overhang_on_the_Risk_of_Light_Trpass_in_a_Fully_Glazed_Office_Building (accessed on 9 July 2026).
- Du, J.; Zhang, X.; King, D. An investigation into the risk of night light pollution in a glazed office building: The effect of shading solutions. Build. Environ. 2018, 145, 243–259. [Google Scholar] [CrossRef] [Scilit]
- Map of Light Pollution (Adapted by Jan Mašek).
- DIALux. Available online: https://www.dialux.com/en-GB/dialux (accessed on 9 July 2026).
- Baxant, P.; Motyčka, M.; Škoda, J.; Novák, M. Research and Development in the Field of Measurement and Evaluation of Artificial Light in the Night Environment and Its Impact on Living Organisms and the Environment as a Whole; Report—Project Starfos SS05010159; Brno University of Technology (VUT): Brno, Czech Republic, 2024. [Google Scholar]
- LumiDISP. Available online: https://lumidisp.eu/ (accessed on 9 July 2026).
- CIE. CIE System for Metrology of Optical Radiation for ipRGC-Influenced Responses to Light; CIE S 026/E:2018; CIE: Vienna, Austria, 2018. [Google Scholar]
- Berman, S.; Clear, R. Simplifying Melanopsin Metrology. IES Fires. 2019. Available online: https://ies.org/fires/simplifying-melanopsin-metrology/ (accessed on 9 July 2026).
- Lucas, R.J.; Peirson, S.N.; Berson, D.M.; Brown, T.M.; Cooper, H.M.; Czeisler, C.A.; Figueiro, M.G.; Gamlin, P.D.; Lockley, S.W.; O’Hagan, J.B.; et al. Measuring and using light in the melanopsin age. Trends Neurosci. 2014, 37, 1–9. [Google Scholar] [CrossRef] [Scilit]
- Higuchi, S.; Lin, Y.; Qiu, J.; Zhang, Y.; Ohashi, M.; Lee, S.I.; Kitamura, S.; Yasukouchi, A. Is the use of high correlated color temperature light at night related to delay of sleep timing in university students? A cross-country study in Japan and China. J. Physiol. Anthropol. 2021, 40, 7. [Google Scholar] [CrossRef] [Scilit]
- Higuchi, S.; Lee, S.I.; Kozaki, T.; Harada, T.; Tanaka, I. Late circadian phase in adults and children is correlated with use of high color temperature light at home at night. Chronobiol. Int. 2016, 33, 448–452. [Google Scholar] [CrossRef] [Scilit]
- BS EN 12464-1:2021; Light and Lighting—Lighting of Work Places—Part 1: Indoor Work Places. BSI: London, UK, 2021.
- Cajochen, C.; Zeitzer, J.; Czeisler, C.; Dijk, D.J. Dose-response relationship for light intensity and ocular and electroencephalographic correlates of human alertness. Behav. Brain Res. 2000, 115, 75–83. [Google Scholar] [CrossRef] [Scilit]
- Lowden, A.; Kecklund, G. Considerations on how to light the night-shift. Light. Res. Technol. 2021, 53, 437–452. [Google Scholar] [CrossRef] [Scilit]
- Luo, W.; Kramer, R.; Kompier, M.; Smolders, K.; de Kort, Y.; van Marken Lichtenbelt, W. Effects of correlated color temperature of light on thermal comfort, thermophysiology and cognitive performance. Build. Environ. 2023, 231, 109944. [Google Scholar] [CrossRef] [Scilit]
- Dai, Q.; Cai, W.; Hao, L.; Shi, W.; Wang, Z. Spectral optimisation and a novel lighting-design space based on circadian stimulus. Light. Res. Technol. 2018, 50, 1198–1211. [Google Scholar] [CrossRef] [Scilit]
- DIN 5031-100; Optical Radiation Physics and Illuminating Engineering—Part 100: Non-Visual Effects of Light on Human Beings—Quantities, Symbols and Action Spectra. DIN: Berlin, Germany, 2021.
- Melanopic Efficiency of Light. Trilux, Indoor Lighting. Available online: https://www.trilux.com/en/lighting-practice/indoor-lighting/general-requirements/light-and-non-visual-effects/melanopic-efficiency-of-light/ (accessed on 9 July 2026).
- BS EN 12464-2:2024; Light and Lighting—Lighting of Work Places—Part 2: Outdoor Work Places. BSI: London, UK, 2024.
- CIE. CIE Research Strategy 2023–2027, 2nd ed.; CIE: Vienna, Austria, 2025. [Google Scholar] [CrossRef] [Scilit]
- CIE. CIE Position Statement on Obtrusive Light and Light Pollution, 1st ed.; CIE PS 003:2025; CIE: Vienna, Austria, 2025. [Google Scholar] [CrossRef] [Scilit]
- Brown, T.M.; Brainard, G.C.; Cajochen, C.; Czeisler, C.A.; Hanifin, J.P.; Lockley, S.W.; Lucas, R.J.; Münch, M.; O’Hagan, J.B.; Peirson, S.N.; et al. Recommendations for daytime, evening, and nighttime indoor light exposure to best support physiology, sleep, and wakefulness in healthy adults. PLoS Biol. 2022, 20, e3001571. [Google Scholar] [CrossRef] [Scilit]



Disclaimer/Publisher’s Note: The statements, opinions and data contained in all publications are solely those of the individual author(s) and contributor(s) and not of MDPI and/or the editor(s). MDPI and/or the editor(s) disclaim responsibility for any injury to people or property resulting from any ideas, methods, instructions or products referred to in the content. |
© 2026 by the authors. Licensee MDPI, Basel, Switzerland. This article is an open access article distributed under the terms and conditions of the Creative Commons Attribution (CC BY) license.