


Abstract
The diversity of modern structural glasses is extremely broad, and their mechanical properties vary significantly. In this work, original specimen geometry is proposed for determining the fracture toughness parameters of glass under quasi-static loading conditions. A key feature of the developed configuration is the presence of a stabilization zone, which ensures crack propagation in a given direction. The specimen shape is justified by the results of a numerical simulation of fracture processes in brittle solids. The proposed geometry is characterized by reduced sensitivity to the loading device stiffness and promotes the straight-line propagation of the crack. Specimen fabrication is straightforward and does not require specialized equipment, allowing mechanical testing to be performed using standard tensile testing machines. The developed configuration ensures stable regimes of crack deceleration and complete arrest. The crack tip formed at this stage acquires a natural configuration, and the geometric characteristics of the initial notch do not have a critical influence on the measurement results. The capabilities of the specimen are demonstrated through both numerical and physical experiments in comparison with the classic compact tension (CT) specimen. Physical testing of glass specimens allowed for obtaining the relationship between the crack velocity and the stress intensity factor within a velocity range from 10−6 to 10−2 m/s.
1. Introduction
The modern construction industry is dynamically expanding its range of structural materials. Driven by technological advancements, load-bearing elements are increasingly being manufactured from materials previously reserved primarily for architectural decoration, such as silicate glass. Glass components not only serve as translucent building envelopes but are also utilized as floor slabs, columns, and cladding panels [1,2,3]. This material is environmentally safe, chemically inert, and exhibits high resistance to weathering and ultraviolet radiation. Furthermore, its favorable strength-to-weight ratio enables a reduction in the self-weight of engineering structures.
This study focuses on silicate glasses. From a practical standpoint, these materials are attractive due to their relatively high specific strength; however, glass is a classic brittle material. Consequently, the reliability of predicting its ultimate limit state directly depends on the accuracy of data regarding crack behavior across three key stages: initiation, quasi-static propagation, and arrest. Investigating these processes under various loading conditions establishes the necessary foundation for safely expanding the structural application of glass. Such studies are critical, given the vast range of modern glass types and the substantial differences in their brittle fracture characteristics [4,5].
The mechanisms of crack initiation and propagation in glasses have been thoroughly reviewed in several classic and modern studies [6,7,8], which analyze the coupled effects of mechanical and chemical factors on these processes. The stress intensity factor (SIF) acts as one of the key parameters determining the fracture toughness of the material, serving as a fundamental metric for describing all stages of crack evolution. Hereinafter, the fracture processes are considered exclusively under static and quasi-static external loading conditions. Under these conditions, the analysis and prediction of subcritical crack growth kinetics in a specific type of glass can be performed based on experimentally determined parameters of the crack velocity versus current SIF relationship.
To obtain the experimental data required to construct these relationships, a wide range of testing methodologies and specimen geometries has been developed. Among this variety, three- or four-point bending tests of single-edge notched beams (SENB, SEPB) [9], compact tension (CT) specimens [10], and double cantilever beam (DCB) geometries [11] have become widely adopted. Each of these methods possesses specific advantages and technological limitations; however, they are primarily oriented toward evaluating the critical stress intensity factor, i.e., KIc [12].
In particular, the popularity of DCB specimens stems from the convenience of gripping them in tensile testing machines and the possibility of direct visualization of the fracture process. In principle, this configuration enables the recording of not only crack initiation but also the subsequent stages of stable growth and arrest [11,13]. However, directional crack propagation in the standard DCB geometry is characterized by high instability: the crack trajectory frequently deviates from the longitudinal axis, leading to the spalling of one of the arms. To stabilize the fracture direction along the intended crack propagation line, side grooves are typically machined to confine the stress concentration zone. However, the presence of such stress concentrators induces a more complex stress–strain state in the specimen, which must be taken into account when calculating the SIF. A 3D stress–strain state is formed near the crack tip, and the crack front undergoes significant curvature, which substantially complicates the analysis of experimental data. In addition, the precision machining of guide grooves significantly increases both the labor intensity of specimen fabrication and its cost.
The fracture behavior of DCB specimens is significantly influenced by the magnitude of the quasi-dynamic crack increment (jump) from the moment of initiation to arrest. The scale of this jump is predetermined by the stiffness of the loading system. The use of testing equipment with low stiffness (‘soft’ machines) implies that substantial crack propagation is required to relax the elastic energy and reduce the forces in the grips. Consequently, it becomes necessary to proportionally increase the specimen dimensions to guarantee the registration of the crack arrest moment, which complicates the fabrication technology, increases the experimental cost, and tightens the equipment requirements [14].
One of the common methods to increase the stiffness of the loading system is to implement the experiment using the wedge splitting scheme [15,16]. This approach allows for minimizing of the magnitude of the quasi-dynamic crack jump and, consequently, substantially reducing the specimen dimensions. However, wedge loading introduces uncertainty in determining the actual force transmitted to the specimen. This error is caused by the instability of the friction coefficient in the contact zone between the wedge and the gripping elements, which significantly depends on several difficult-to-control factors, such as surface roughness, the type of lubricant applied, and the level of contact stresses.
To prevent unstable (catastrophic) fracture of brittle solids under conditions where introducing a fatigue precrack is technically impractical, specimens with a V-shaped (chevron) notch have been developed [17]. The features of this geometry ensure stable subcritical crack propagation, which allows for highly accurate determination of the material’s fracture toughness characteristics. Nevertheless, the precision machining of a chevron notch of a given configuration in glass represents a complex technological challenge, the solution to which requires the use of specialized and expensive equipment.
A common feature of all considered specimen configurations is that their application is methodologically justified primarily for determining the critical stress intensity factor at the stage of unstable (rapid) crack growth. At the same time, their use for the precision analysis of subcritical growth kinetics and crack arrest under quasi-static conditions is associated with significant experimental and computational difficulties, since it is extremely challenging to ensure stable defect propagation in a controlled mode within these configurations. Achieving controlled fracture requires the use of non-standard, high-tech equipment equipped with a precision active feedback system. Such a system must control the process in a high-stiffness closed loop based on the crack opening displacement rather than the preset force.
An alternative that enables stable crack growth in brittle solids involves double-torsion (DT) specimens [18] and double-cleavage drilled compression (DCDC) [19] schemes. The geometry of these specimens is designed to redistribute mechanical stresses and ensure crack propagation in a given direction at a controlled velocity. The main advantage of the DT method lies in the independence of the stress intensity factor from the crack length under a constant load, whereas the DCDC configuration guarantees high stability due to the decrease in the SIF as the defect grows and a flat crack front forms. This property of DCDC specimens allows for the obtaining of experimental data across all stages of subcritical crack growth. However, both techniques involve specific difficulties when applied to glass. The fabrication of DCDC specimens requires precision compliance with geometry (in particular, the parallelism of the ends and accuracy in manufacturing the central hole). For DT specimens, the high labor intensity of cutting the guiding groove and the inability to ensure a straight crack front remain key challenges.
To overcome these challenges in the study of subcritical fracture in silicate glass, an original specimen geometry is proposed and scientifically justified in this work. The developed configuration features a stabilization zone, the stiffness of which significantly reduces the sensitivity of the measuring system to the loading device stiffness during quasi-static tensile testing. This structural feature ensures strictly rectilinear crack propagation and enables stable regimes of crack deceleration and complete arrest. The experimental data obtained under such controlled conditions serve as a reliable basis for determining the threshold and critical stress intensity factors. The proposed specimen type allows for fracture toughness testing using standard tensile testing machines. Based on the processing of experimental results, the functional relationship between the crack growth rate and the stress intensity factor was established. The advantages of the developed specimen geometry are clearly demonstrated by comparing its capabilities with those of traditional compact tension (CT) specimens.
The remainder of this paper is organized as follows: Section 2 describes the materials used and the experimental setup, and justifies the conceptual design solution of the proposed specimen geometry. Section 3 presents the results of numerical experiments evaluating the sensitivity of the developed specimen to the loading device stiffness and the accuracy of starter notch positioning, and demonstrates the crack growth rate versus SIF relationships obtained from physical experiments. Section 4 discusses the results obtained and future research prospects. The Conclusions summarizes the study.
2. Materials and Methods
The static fracture toughness study was conducted using 4 mm thick soda–lime–silicate float glass manufactured by JSC “Trakya Glass Rus” (Yelabuga, Russia). The material complies with the EN 572-8:2012+A1:2016 standard [20]. The physical and mechanical properties of the glass are presented in Table 1.
Table 1.
The physical and mechanical properties of the glass.
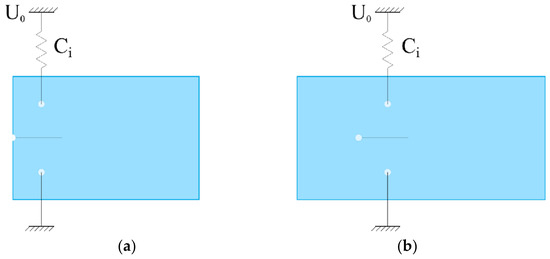
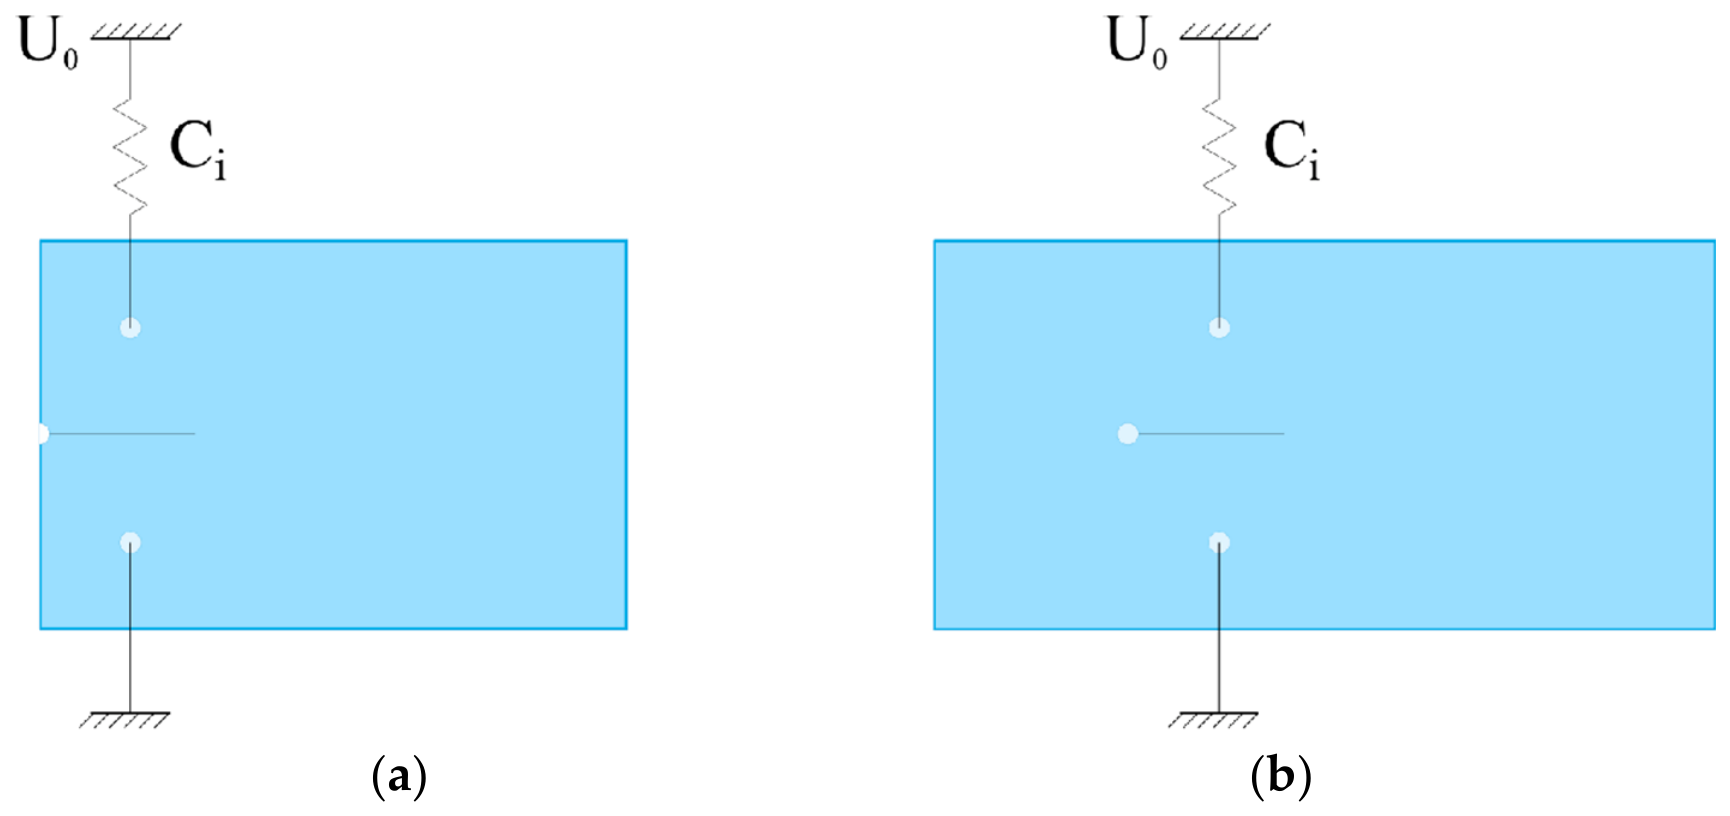
Two types of specimens were prepared for the experiments. The first type, similar in shape to a traditional compact specimen, was a rectangular glass plate with dimensions of 135 × 90 mm. The second type was a custom specimen designed in-house, with overall dimensions of 180 × 90 mm. In both specimens, the initiating crack was located on the axis of symmetry. In the compact specimen, it extended from the edge, while in the modified specimen it was located inside the plate and was bounded on one side by a 5 mm diameter hole. Holes with a diameter of 5 mm for the testing machine grips were located at a distance of 20 mm from the specimen edges. All holes were drilled using a spear-point drill bit without any subsequent post-processing. The structural diagrams of the specimens and the loading conditions are shown in Figure 1.
Figure 1.
Loading diagrams: (a) CT specimen; (b) stabilized specimen.
The initial through-thickness crack in the specimens was formed as follows: a surface score mark was applied to the air side of the float glass using a standard glass cutter, and then a series of controlled light impacts was delivered along the score line from the opposite side of the specimen using a metal ball (15 mm in diameter and 13.9 g in mass) dropped from a fixed height of 50 mm.
The fundamental feature of the proposed specimen configuration is that the initiating crack is offset from its edge and bounded by a hole that prevents its propagation in one of the directions. Consequently, an additional stiffness zone is formed in the plate to the left of the hole, which is maintained throughout the crack propagation process. Selecting an appropriate stiffness for this zone prevents catastrophic crack growth in the main direction, ensuring controlled initiation, propagation, and arrest processes. This, in turn, provides the experimental data necessary to determine the stress intensity factor (SIF) values across three crack states: initiation, growth, and arrest. Given the stabilizing role of the additional stiffness zone, the proposed configuration will hereinafter be referred to as a stabilized specimen. The justification for all characteristic dimensions determining the geometry of the developed specimen is provided below.
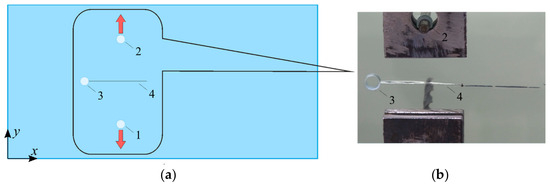
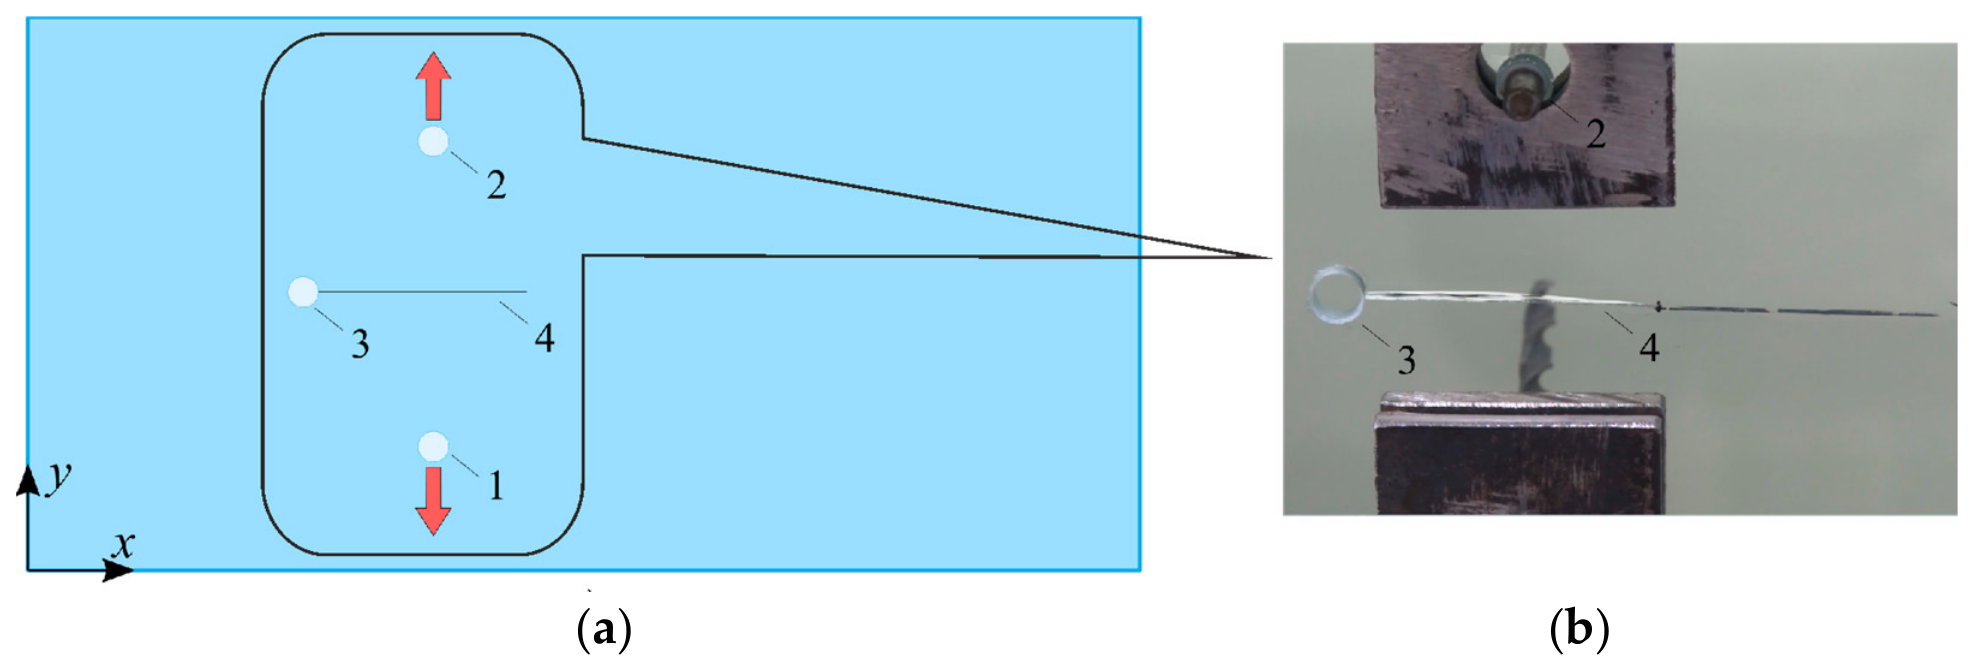
Figure 2a shows a schematic of the developed specimen, and Figure 2b shows a photograph of the specimen in the grips of the loading fixture. In Figure 2, 1 and 2 are the grip holes, 3 is the crack-arresting hole, and 4 is the initial crack. The photograph clearly illustrates the region of the plate with the initial crack bounded on the left by the hole.
Figure 2.
Stabilized specimen: (a) schematic diagram; (b) photo of the specimen in the grips of the tensile testing machine.
Tensile testing of the specimens was performed using a MIM.2-20 universal testing machine (LLC GOST, Moscow, Russia). The loading unit features the following technical characteristics: a load capacity range of 0.2–20 kN (relative force measurement error of ±0.5%), a crosshead travel range of up to 1300 mm (relative displacement measurement error of ±1%), and a crosshead speed range of 0.001–500 mm/min under nominal load. The load is applied via metal pins inserted into the holes of the specimen. To ensure alignment, a 3D-printed PLA plastic centering sleeve with a thickness of 0.5 mm is placed between the pin and the hole surface. Based on preliminary physical experiments, the ultimate tensile force F for the selected specimen material was determined to be limited to 540 N.
The advancement of the crack front was recorded via video imaging using a digital camera (Sony Cyber-shot DSC-HX300; Sony Digital Products Co., Ltd., Wuxi, China) at a frame rate of 50 frames per second. Based on the acquired video data, the position of the crack front was determined with a time step of 20 ms. The force applied to the specimen by the testing machine was recorded synchronously with the video recording. This made it possible to capture the crack position corresponding to the applied load at each time point. The collected experimental dataset is sufficient to determine the dependencies of the stress intensity factor on the crack length based on numerical simulation.
In processing the experimental data, methods for the numerical modeling of crack propagation in brittle materials were applied within the framework of linear elastic fracture mechanics [21]. Finite element analysis was performed using the ANSYS 2021.R2 software package [22]. To construct a sequence of elastic solutions and determine the SIF, the built-in SMART technology was employed. The SIF values for each recorded crack position and the corresponding tensile load were determined based on the evaluation of the J-integral [23]. The following elastic properties of silicate glass were adopted in the calculations (see Table 1): Young’s modulus of 70 GPa and Poisson’s ratio of 0.20.
For the finite element numerical implementation within the ANSYS software package, three-dimensional, 10-node tetrahedral structural solid elements with quadratic displacement behavior (SOLID187) were utilized. The relation used to calculate the mode I stress intensity factor KI is given by , where J is the J-integral, E is the Young’s modulus of the material, and ν is the Poisson’s ratio. Four integration contours were used to evaluate the J-integral.
To ensure the accuracy of the obtained results and justify the choice of finite element mesh parameters, a numerical convergence study was preliminary conducted. In the course of this verification, the SIF values KI obtained in ANSYS were compared with the exact analytical solution KI* A classical problem of an elastic strip with an edge-cracked profile under tension was considered as a benchmark test [24].
where KI* is the analytical SIF value; σt is the tensile stress; a is the crack length; and α = a/W is the ratio of the crack length to the strip width W. In the calculations, the values were set to W = 50 mm, a = 5 mm.
It was established that with a characteristic finite element size of 1 mm in the vicinity of the crack tip, the relative error of the numerical solution compared to the analytical one was . Halving the element size in the crack tip region (down to 0.5 mm) altered the calculated SIF value by less than 0.2%, indicating that solution convergence had been achieved. Therefore, a verified finite element approximation with a baseline element size of 1 mm in the stress concentration zone was employed in all subsequent numerical calculations.
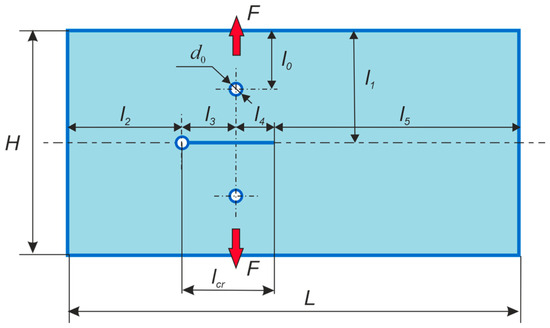
The geometric parameters of the developed specimen require a dedicated scientific and methodological justification. The choice of the plate’s overall dimensions and the initiating defect configuration was based on a series of preliminary numerical studies. The modeling logic, the results of which formed the basis for the final specimen geometry presented in Figure 3, is discussed in detail below.
Figure 3.
Geometric parameters determining the specimen shape.
One of the key factors determining the geometry of the plate is the material strength in the vicinity of the holes with a diameter of d0 = 5 mm, which are designed for the application of tensile forces F. The centers of these holes are located at a distance of l0 = 20 mm from the specimen edges. Based on preliminary physical experiments, it was established that, for the selected material, the ultimate tensile force F ensuring specimen integrity within the grip zone is limited to 540 N.
The next critical parameter is the height of the symmetrical part of the specimen, l1, which determines its overall dimensions. This parameter must guarantee the exclusion of any effect from the non-uniform stress–strain state near the grip holes on the region of the symmetry axis along which the crack propagates. This condition is satisfied if the relation (l1 − l0) ≥ 3d0 is met. For the developed specimen geometry, a value of l1 = 45 mm was adopted. All other dimensions are determined based on the parameters l0 and l1.
The next important quantity is the stabilizer length l2, on which its stiffness directly depends; as l2 increases, the stiffness increases. The stiffness of the stabilizer determines its capability to compensate for the low stiffness of the testing machine’s loading system. For the developed specimen, the length of the stabilization zone was chosen to be l2 = 40 mm.
The allowable dimensions l3 and l4 were determined based on the numerical modeling results of the specimen’s elastic deformation under the tensile load F. For a fixed position of the left crack tip l3, the critical force F* required for its initiation was calculated as a function of the position of its right tip (l4).
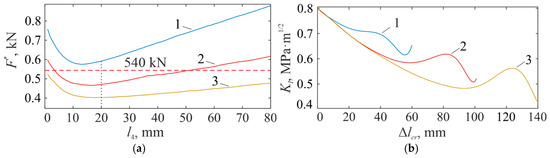
As a result of the calculations, parametric dependencies F*(l4) were obtained (Figure 4a). In the figure, curves 1, 2, and 3 correspond to the parameter values of l3 = 10, 20 and 30 mm, respectively. Taking into account the experimental limitation on the tensile force magnitude F < 540 H, it is possible to determine the ratio of dimensions l3 and l4 that ensure crack propagation within the specimen without causing failure in the grip zone. As can be seen from Figure 4, these values lie in the region located below the straight line F = 540 N. Based on these considerations, the values of l3 = 20 mm and l4 = 20 mm were adopted for the stabilized specimen. At this position and size of the initiating crack, the calculated crack initiation force is F = 470 N.
Figure 4.
Parametric dependencies: (a) crack initiation force versus parameter l4 (1—l3 = 10 mm, 2—20, 3—30); (b) SIF at the crack tip versus the initial crack length increment Δlcr (1—l5 = 60 mm, 2—100, 3—140).
To justify the choice of the length of the potential crack propagation zone (l5), the stress intensity factor at the crack tip was calculated for specimens whose total length varied due to changes in this parameter (Figure 4b). The figure illustrates the variation of KI as a function of the initial crack length increment, Δlcr. Curves 1, 2, and 3 correspond to different zone lengths l5 (60, 100, and 140 mm). With an increase in the initial crack length, the SIF value drops below the critical level KIc = 0.8 MPa·m1/2 for all specimen configurations. This indicates that a stable crack arrest regime is guaranteed in all considered cases. For the experimental specimens, the dimension of l5 was chosen to be 100 mm.
Thus, as a result of the parametric analysis, the geometric parameters of the developed stabilized specimen (ST) were determined and justified (Table 2). For comparison, the table also presents the characteristics of the traditional compact specimen (CT).
Table 2.
Specimen geometric parameters, mm.
3. Results
3.1. Sensitivity of a Stabilized Specimen to the Loading Device Stiffness
The testing machine and its clamping grips possess a finite stiffness, which significantly influences the crack propagation process. Insufficient stiffness of the loading system leads to a rapid release of stored elastic strain energy and its transfer to the crack tip. In brittle materials, this induces unstable (catastrophic) crack propagation, making it virtually impossible to study the kinetics of subcritical crack growth. Under such conditions, the crack propagates instantaneously through the entire specimen, preventing the identification of the crack arrest point. Furthermore, specimens of various geometries exhibit distinct sensitivities to the stiffness of the loading assembly.
This section presents the results of the numerical simulation of crack propagation in glass specimens under varying stiffness conditions of the loading assembly. The numerical solution was implemented using the finite element algorithm described in the “Materials and Methods” section. The schematic diagram used for the calculation is shown in Figure 1. The stiffness of the loading system Ci was assumed to be 5 N/µm. By applying various crack length increments in the CT and modified specimens, the corresponding tensile forces F and SIF values were determined. By comparing the calculated SIF with the critical stress intensity factor KIc and the threshold SIF for crack arrest KIa, it was evaluated whether the crack would reach a given length and propagate further or arrest. In the simulation, the values of KIc = 0.8 MPa·m1/2 and KIa = 0.7 MPa·m1/2 were adopted.
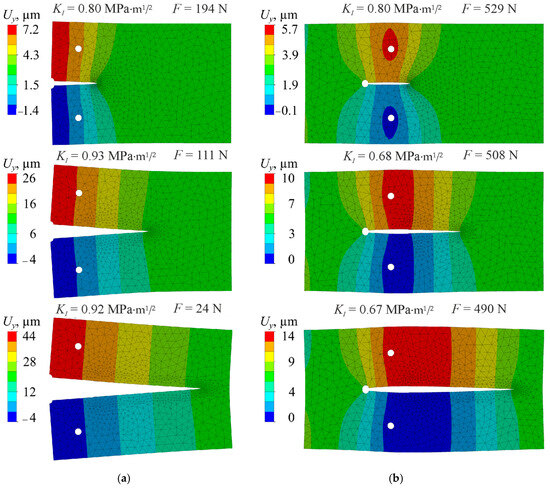
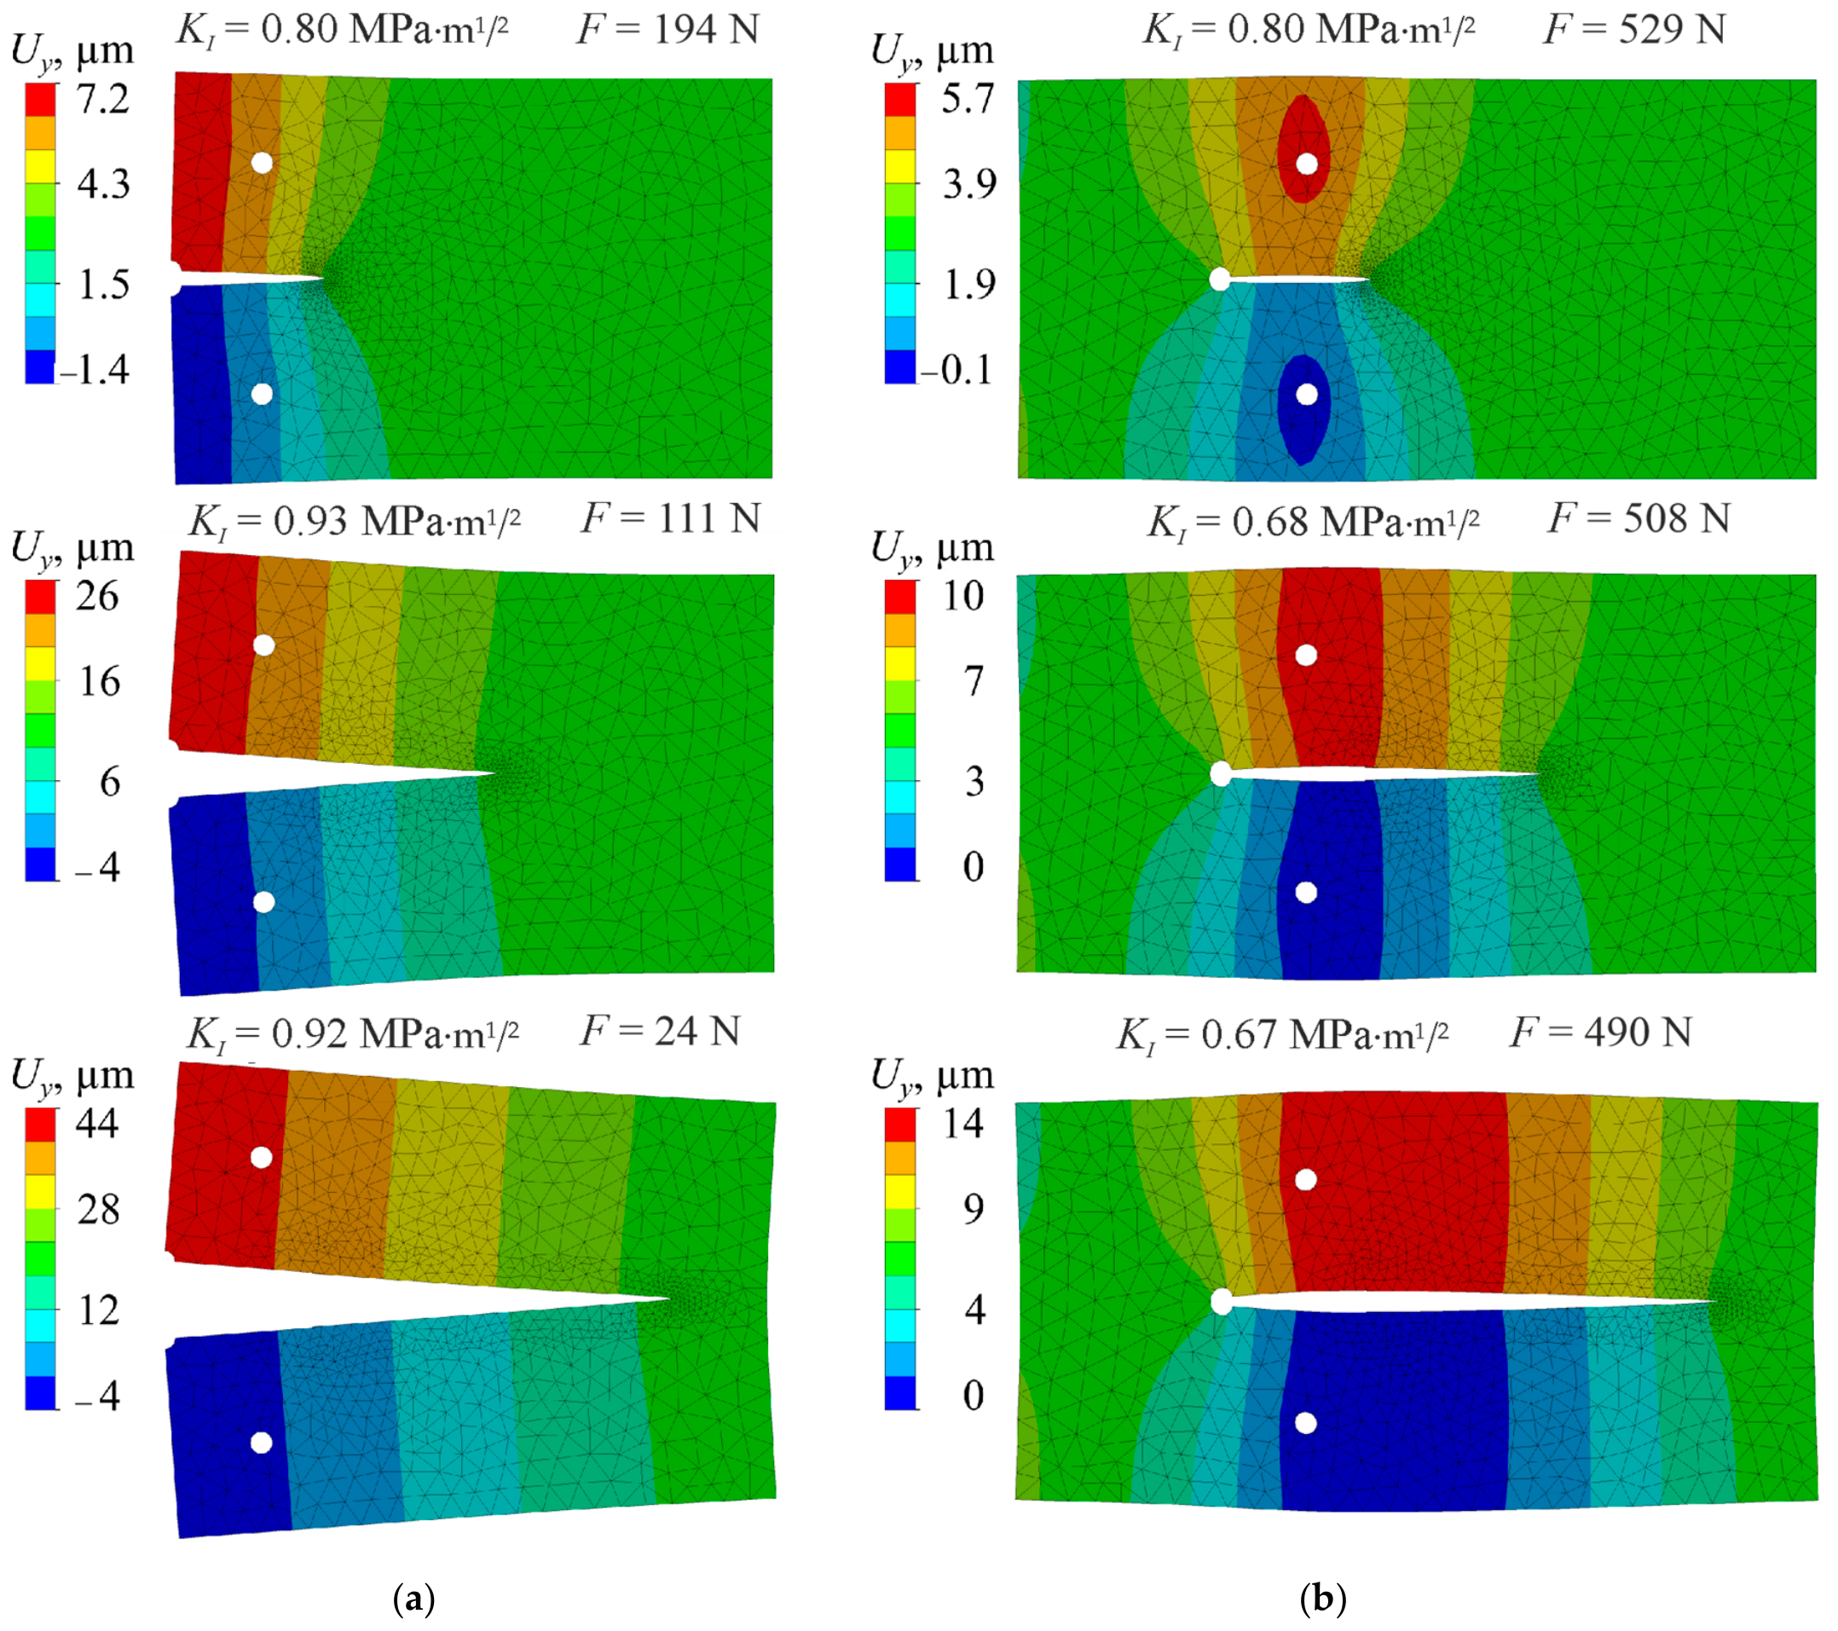
Figure 5 illustrates three states of the specimens: the initial state (with a crack length of 30 mm) and two subsequent states corresponding to total crack lengths of 70 mm and 110 mm. For each state, the vertical displacement fields are displayed along with the respective tensile forces F and KI values. The left column of the figure corresponds to the compact tension (CT) specimen, whereas the right column represents the stabilized specimen.
Figure 5.
Numerical simulation results of the fracture process: (a) CT specimen; (b) stabilized specimen. The top row corresponds to a crack length of 30 mm, the middle row to 70 mm, and the bottom row to 110 mm.
For the CT specimen (Figure 5a), increasing the crack length from its initial value to 70 mm and 110 mm causes the SIF to change from 0.80 MPa·m1/2 to 0.93 MPa·m1/2 and 0.92 MPa·m1/2, respectively. Concurrently, the tensile force F sequentially takes the values of 192 N, 111 N, and 24 N. Consequently, the crack initiated from the initial state with KI = KIc = 0.80 MPa·m1/2 will continue to propagate because the determined SIF values 0.93 and 0.92 MPa·m1/2 exceed the threshold SIF for crack arrest KIa = 0.70 MPa·m1/2.
In contrast to the CT specimen, the stabilized specimen (Figure 5b) under identical crack growth conditions exhibits a decrease in the SIF from the initial 0.80 MPa·m1/2 to 0.68 MPa·m1/2 and 0.67 MPa·m1/2. The tensile force F sequentially registers as 529 N, 508 N, and 490 N. In this scenario, the crack starting at KI = KIc = 0.80 MPa·m1/2, is incapable of further propagation, as its calculated SIF values 0.68 and 0.67 MPa·m1/2 drop below the crack arrest threshold KIa = 0.70 MPa·m1/2. Consequently, it follows that, under identical stiffness of the loading system, cracks initiated at the same initial SIF KI = KIc = 0.80 MPa·m1/2 exhibit fundamentally different propagation behaviors. In the CT specimen, the crack will continue its rapid, unstable propagation. Conversely, the stabilized specimen enables controlled, stable crack growth under quasi-static loading conditions.
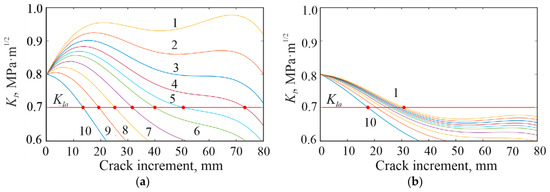
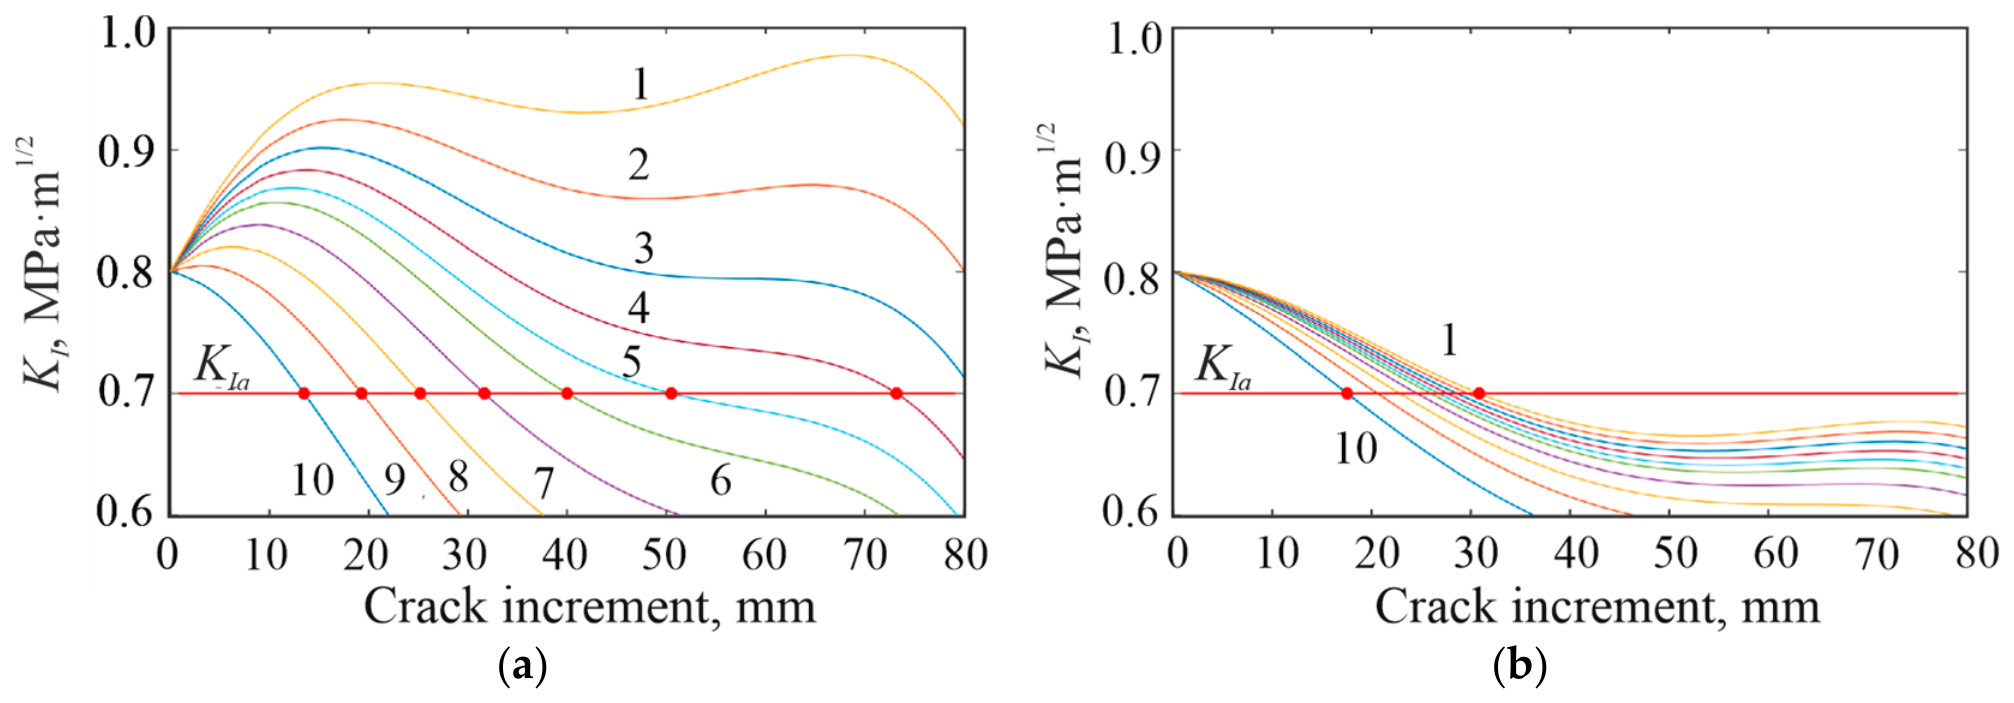
Figure 6 presents the results of the extended numerical simulation, conducted analogously to the study illustrated in Figure 5. Parametric curves of the SIF (KI) as a function of the crack extension under varying stiffness of the loading system were obtained. Curves 1 to 10 correspond to the stiffness values of Ci = 5, 6, 7, 8, 9, 10, 12, 15, 20, 30 N/µm. The stiffness of the actual tensile testing machine used in the physical experiment was 10 N/µm; thus, Curve 6 in Figure 6 corresponds to this case. Figure 6a corresponds to the compact tension specimen, whereas Figure 6b represents the stabilized specimen. On both plots, a horizontal red line denotes the threshold value of KI = KIa = 0.70 MPa m1/2, corresponding to the crack arrest condition.
Figure 6.
Variation of the SIF as a function of crack increment for ten stiffness values of the loading system: (a) CT specimen; (b) stabilized specimen (1 − Ci = 5 N/µm, 2—6, 3—7, 4—8, 5—9, 6—10, 7—12, 8—15, 9—20, 10—30).
The obtained relationships lead to the following conclusions. In the CT specimen (Figure 6a), a decrease in the loading stiffness results in a significant increase in the crack length. At stiffness values below 8 N/µm (curves 1, 2, and 3), the threshold SIF for crack arrest (KIa) is not reached, even when the crack increment reaches 80 mm. In contrast, the stabilized specimen exhibits a fundamentally different behavior. Throughout the entire investigated stiffness range (from 5 to 30 N/µm), the ultimate crack extension remains below 35 mm. This property of the stabilized specimen, unlike the compact tension specimen, enables the effective control, deceleration, and arrest of crack propagation over a wide range of loading assembly stiffness.
3.2. Sensitivity of a Stabilized Specimen to the Accuracy of Crack Notch Positioning
Our experiments show that the crack propagation path under quasi-static tension significantly depends on the specimen preparation accuracy. In a conventional compact tension (CT) specimen, even a slight deviation of the crack notch from the symmetrical position leads to the curvature of its path and subsequent specimen failure [9].
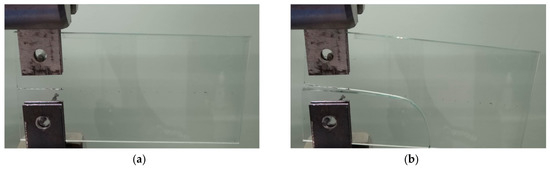
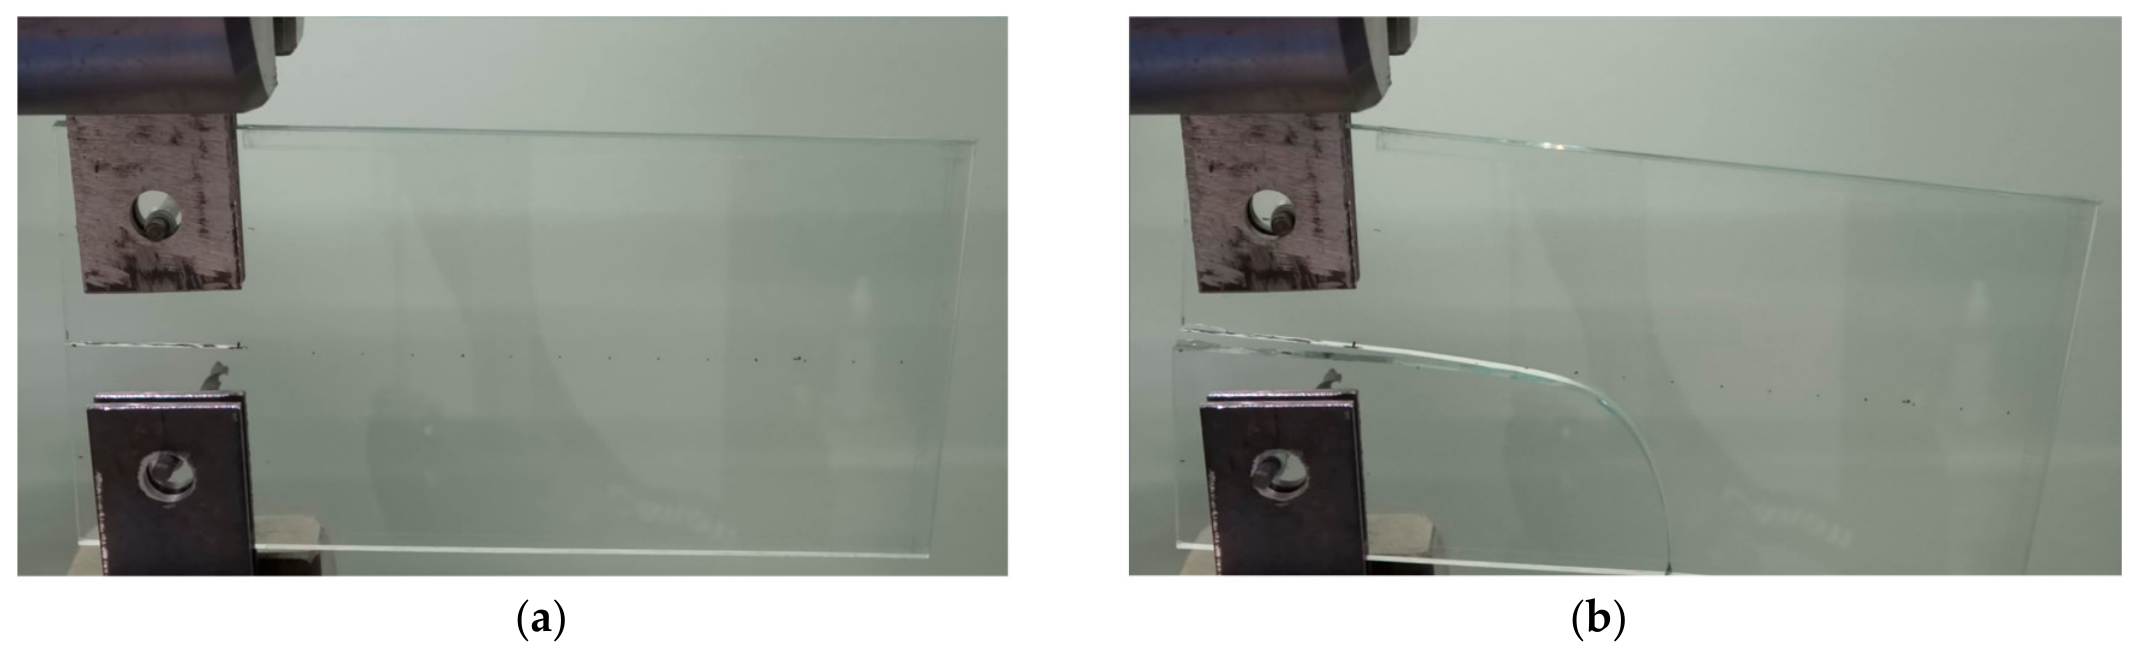
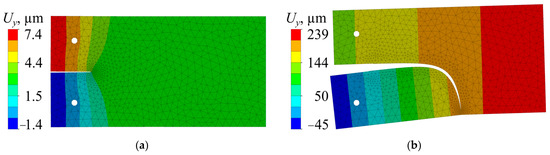
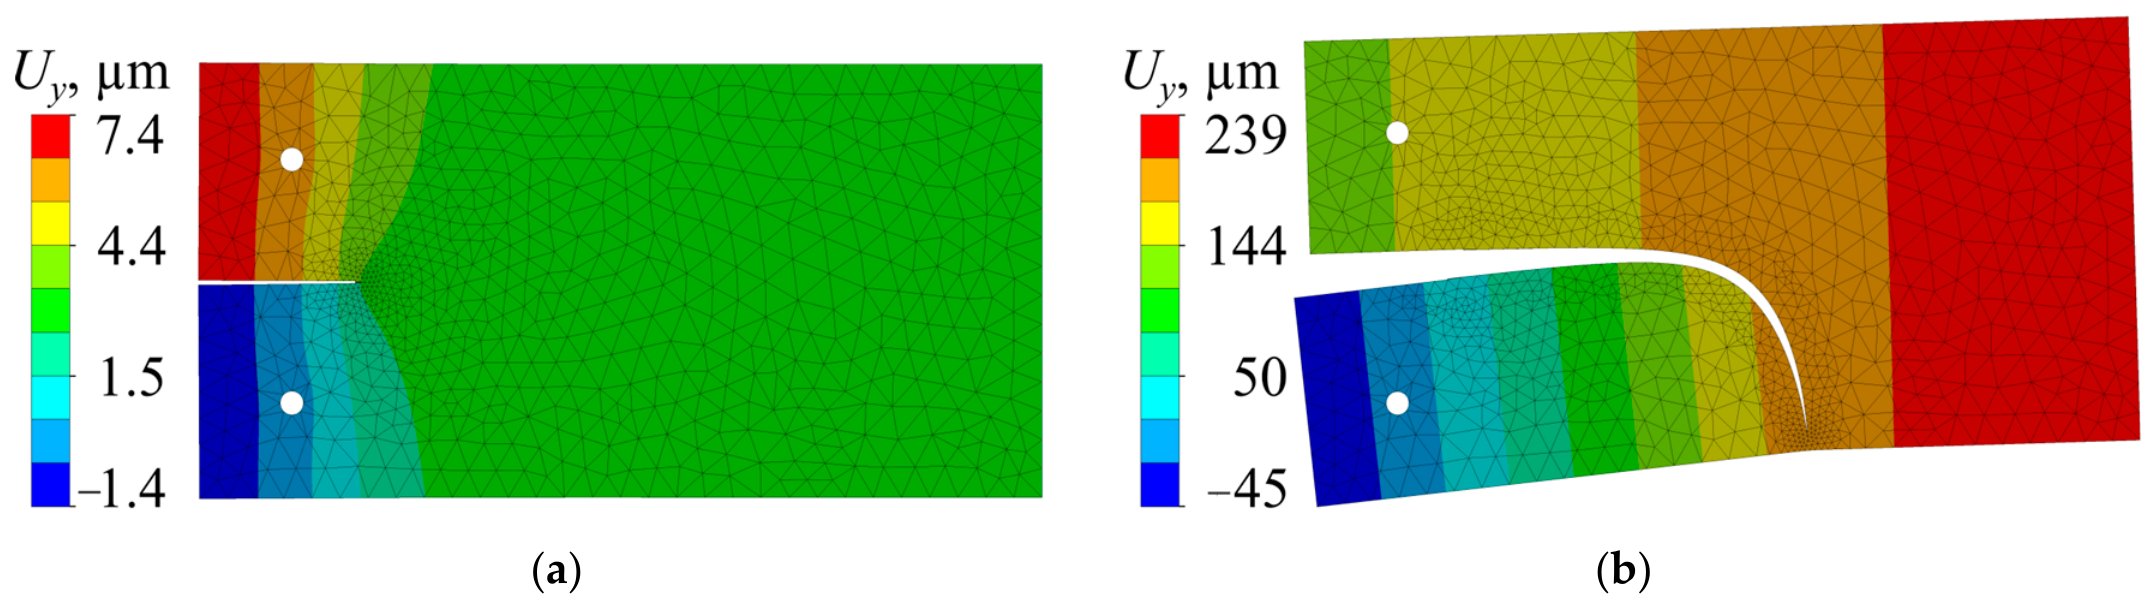
Figure 7 shows the experimental result of tensioning a glass CT specimen with the crack notch shifted 5 mm downward relative to the axis of symmetry. During loading, the crack initially propagates horizontally in the direction specified by the starter notch, and then deflects toward the lower edge of the specimen, ultimately splitting the plate into two parts. Figure 8 presents the numerical simulation results for the same scenario.
Figure 7.
Physical experiment—crack propagation in a CT specimen from an initiating notch shifted by 5 mm: (a) initial stage; (b) moment of specimen failure.
Figure 8.
Numerical simulation—crack propagation in a CT specimen from an initiating notch shifted by 5 mm: (a) initial stage; (b) moment of specimen failure.
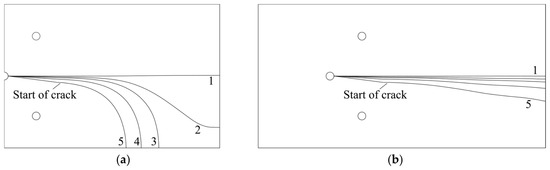
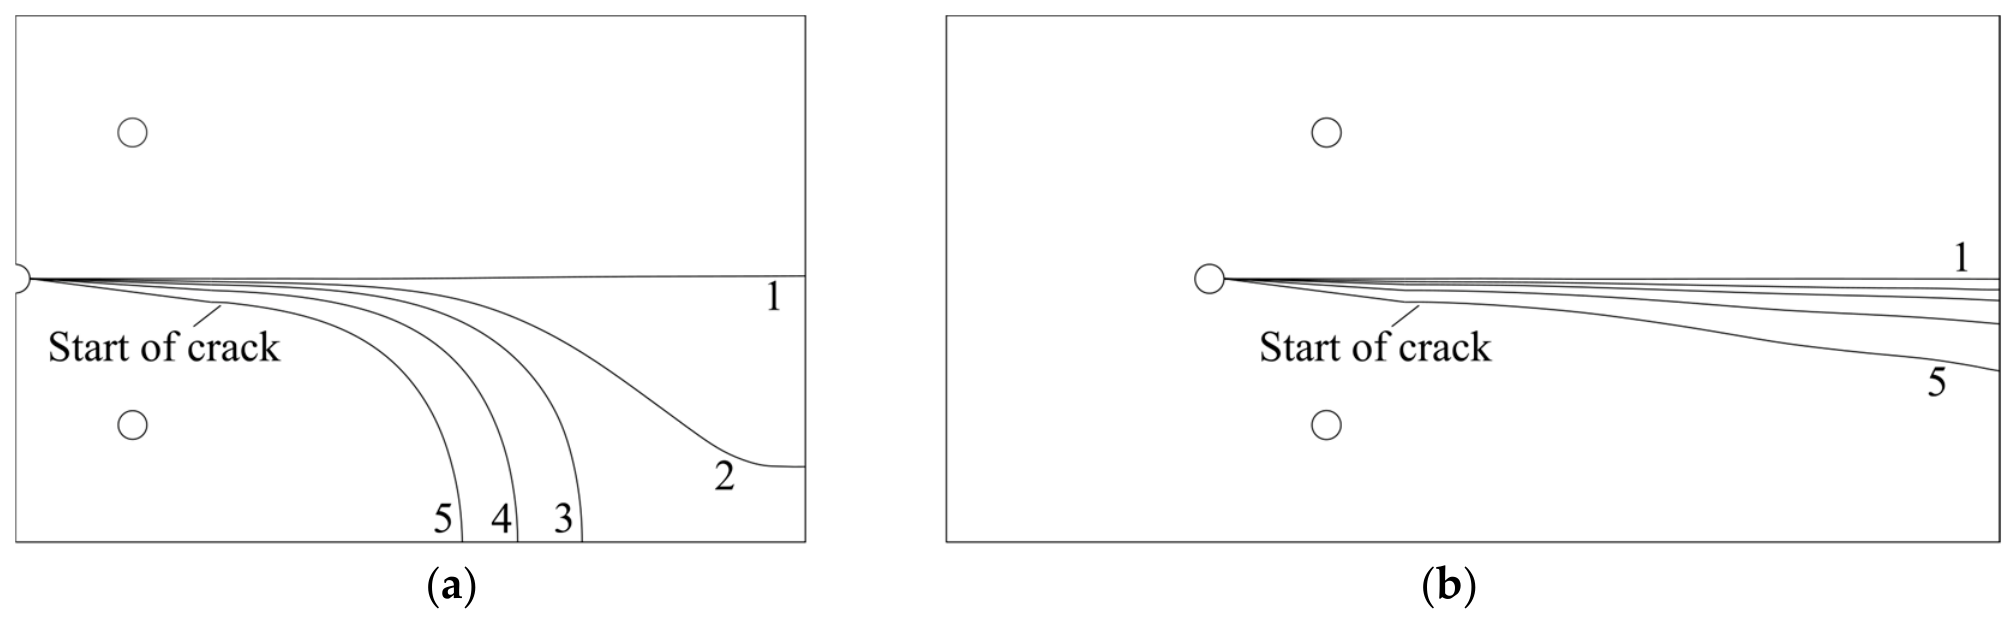
Figure 9 shows the numerical simulation results of the crack path in the CT specimen and in a modified specimen with asymmetrically positioned notches. With a symmetrical position of the initial notch, the crack propagates strictly horizontally (curves 1). Shifting the starter crack toward the lower face of the specimen leads to a path deflection. In the graphs, curves 2–5 correspond to the vertical displacement of the initial crack by 0.5 mm, 1 mm, 2 mm, and 4 mm, respectively. As can be seen from the figure, even a small displacement of the notch in the CT specimen is accompanied by a significant distortion of the crack path, and a shift of more than 0.5 mm leads to specimen failure. At the same time, the modified specimen demonstrates good stability even with a significant asymmetry of the initial configuration.
Figure 9.
Crack paths with vertical displacement of the initial notch: (a) CT specimen; (b) stabilized specimen (1—initial crack displacements 0, 2—0.5 mm, 3—1, 4—2, 5—4).
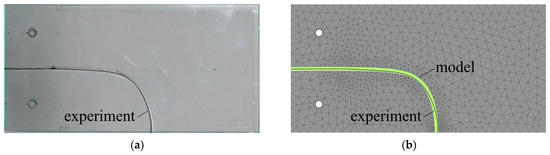
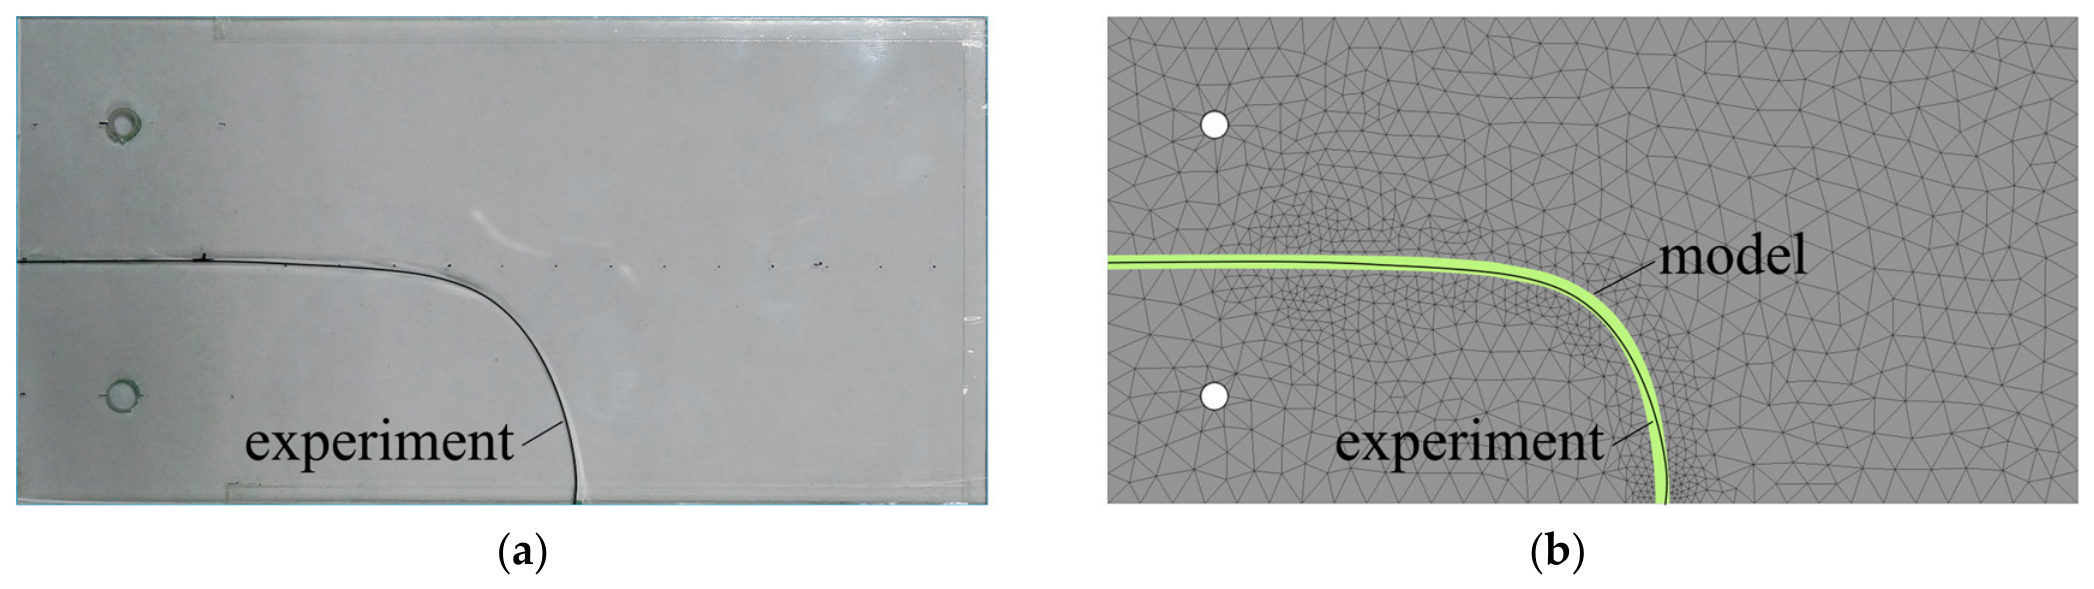
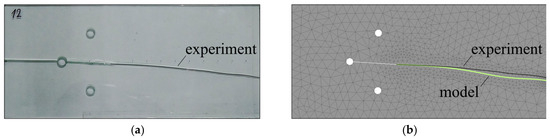
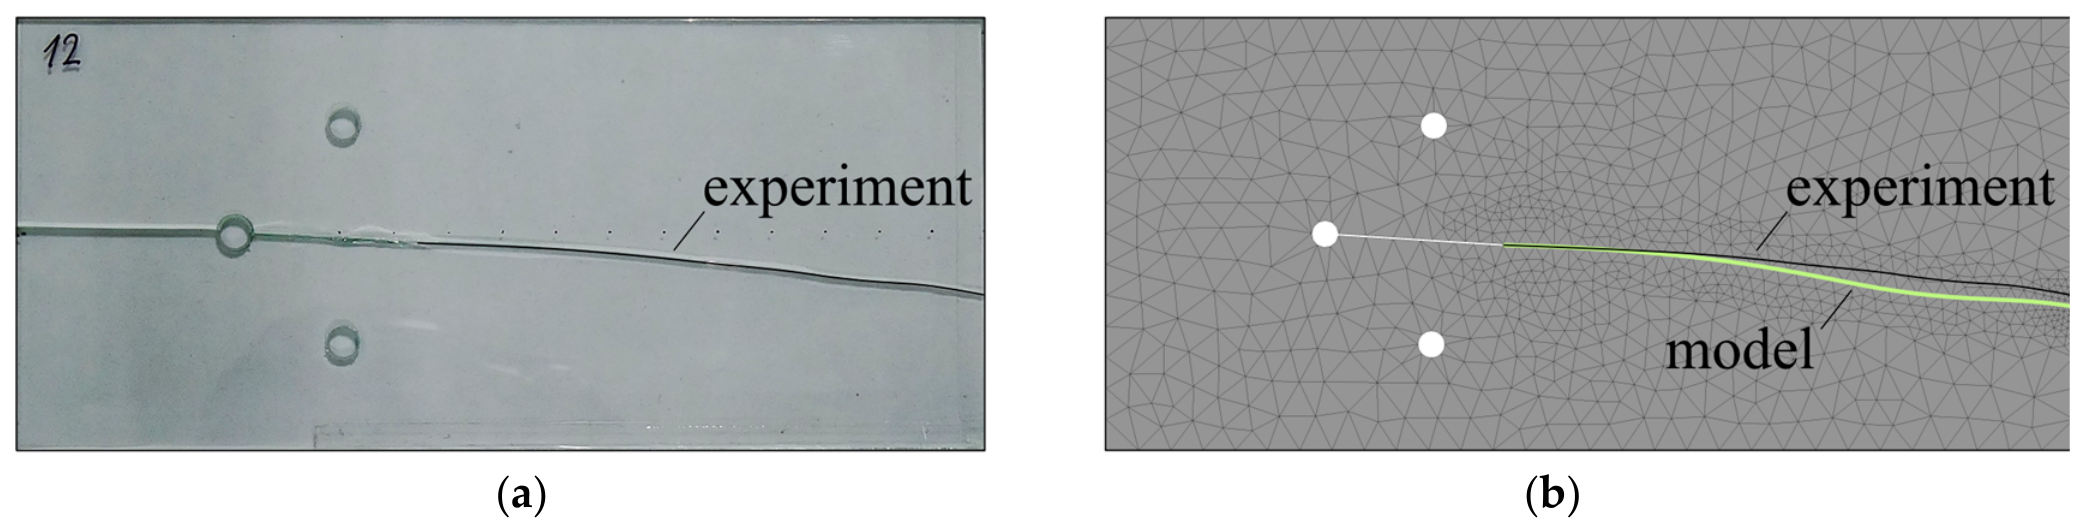
Figure 10 and Figure 11 demonstrate the results of the physical experiment with the CT and stabilized specimens. Figure 10a and Figure 11a show the recorded crack paths in both specimens. In Figure 10b and Figure 11b, these paths are compared with the data obtained in the corresponding numerical experiments. The thin black line in these figures shows the experimentally recorded path, while the yellow line corresponds to the failure zone obtained in the simulation. A point-by-point comparison of these curves implies that the absolute deviation of the paths does not exceed 2.5 mm.
Figure 10.
Crack path in the CT specimen with the initial notch shifted by 5 mm: (a) Photograph of the specimen after failure. (b) Comparison of numerical and experimental paths at the moment of specimen splitting.
Figure 11.
Crack path in the stabilized specimen with the initial notch shifted by 2.2 mm: (a) Photograph of the specimen after failure. (b) Comparison of numerical and experimental paths.
3.3. Determination of the Crack Velocity Versus Stress Intensity Factor Relationship Based on Testing of a Stabilized Specimen
Six stabilized specimens made of soda–lime–silicate float glass were investigated in the experiments; their properties are presented in Table 1. The specimen design corresponds to Figure 3, and their geometric parameters were selected according to the rationale described in Section 2 (Table 2). An initial 20 mm long crack was initiated on all specimens using a glass cutter.
The loading of the specimens was performed in two stages. In the first stage, the specimen was fixed in the grips of the testing machine (Figure 2), followed by a smooth application of a tensile force ensured by the crosshead displacement at a rate of 0.01 to 0.05 mm/min. This loading regime enabled controlled crack propagation by 15–20 mm. After this, the specimen was completely unloaded and held in that state for 30 min. The crack configuration formed in this manner was taken as its initial state. The described stage of preliminary crack growth ensured the formation of an identical, natural initial state of the defect for all specimens.
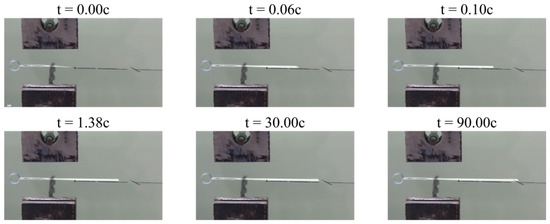
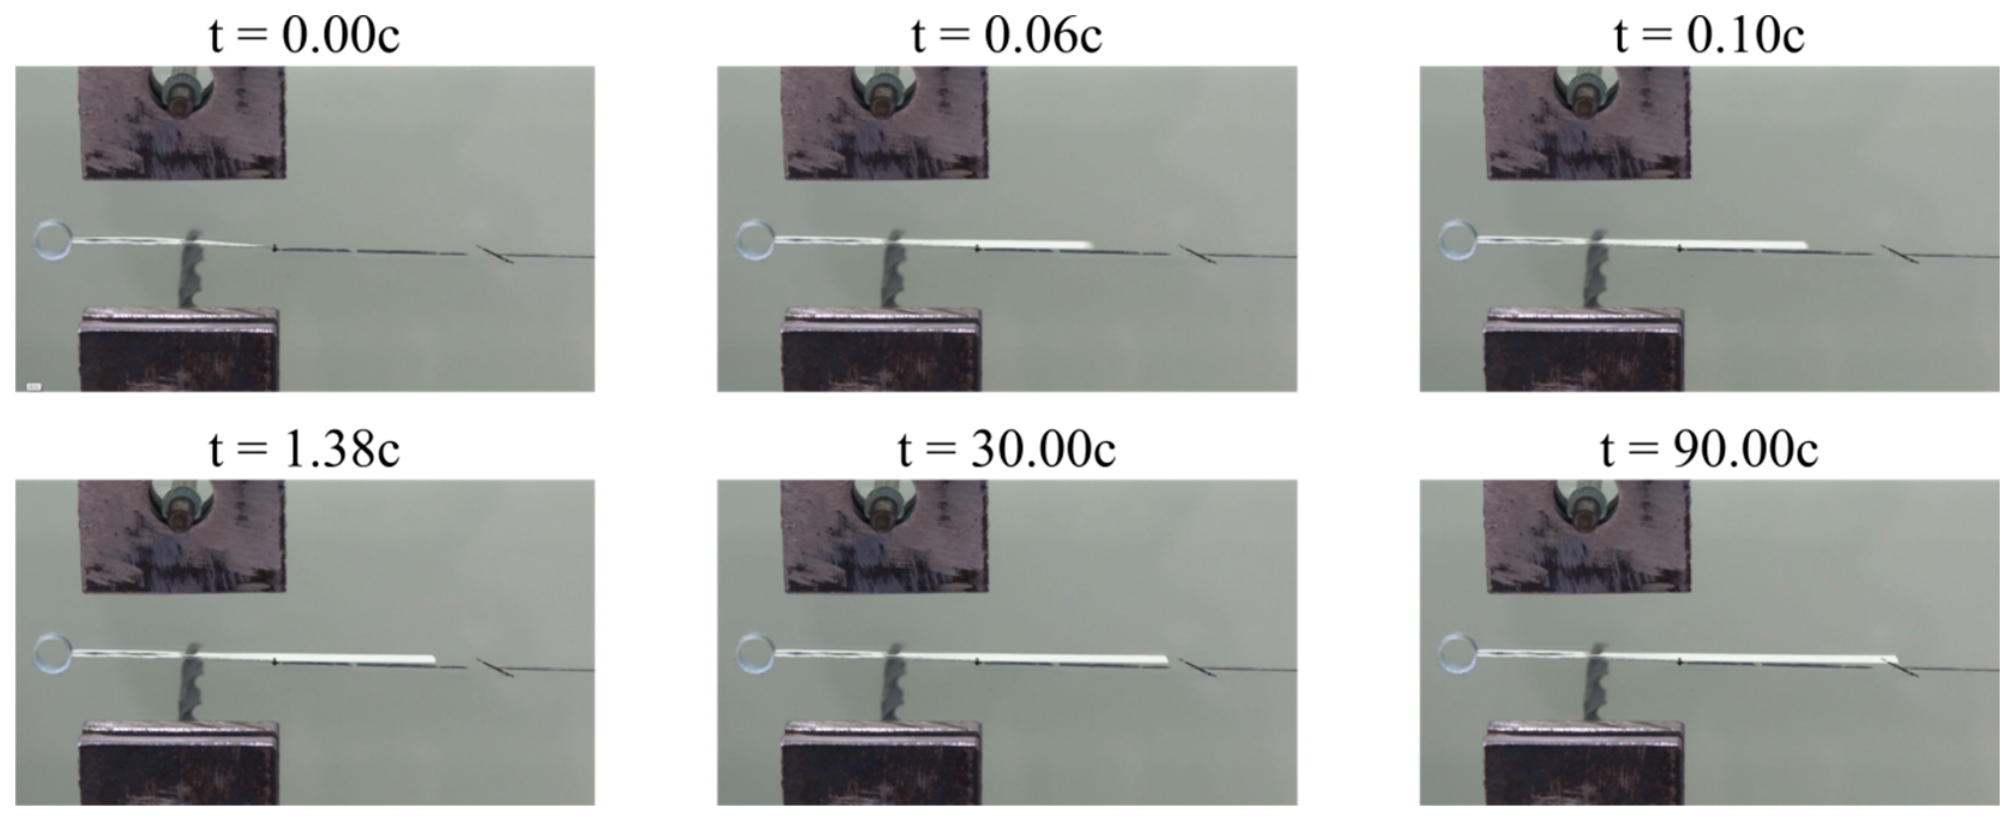
Thirty minutes after unloading, the main loading stage was performed at the same crosshead displacement rate. The crack propagation was recorded by a video camera, while the variation in the force at the grips was automatically transmitted from the load cell to a personal computer. During the testing, the environmental conditions were maintained constant: temperature of 23 °C and relative humidity of 47%. Figure 12 illustrates a typical chronological frame sequence of the video recording capturing the crack propagation process. The moment of crack arrest was defined as the state in which the change in crack length on the video recording of the optical registration system did not exceed 1 pixel over an observation period of 100 s. In this case, the crack velocity can be estimated as the pixel size divided by the observation interval. Thus, given a pixel size of 55 µm and an observation interval of 100 s, the crack velocity corresponding to the moment of arrest did not exceed 0.55 × 10⁻⁶ m/s; consequently, a threshold value of 10−6 m/s was adopted to define the crack arrest.
Figure 12.
Evolution of the crack front during the stabilized specimen test.
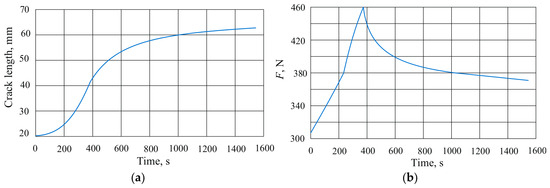
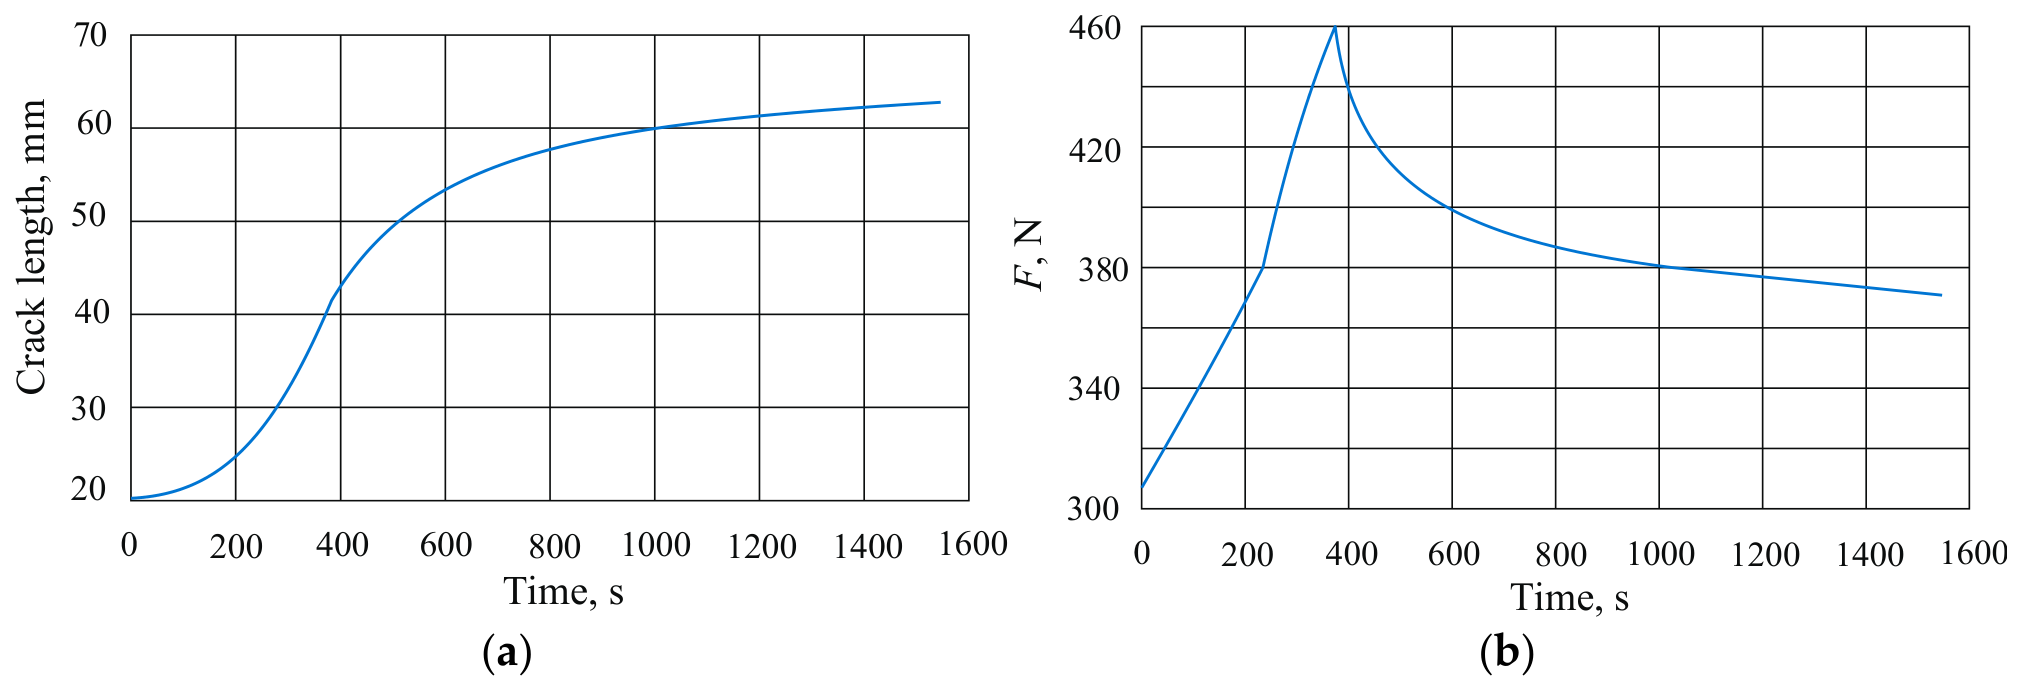
The data obtained from processing the results of one of the experiments are shown in Figure 13. The crack length evolution curve (Figure 13a) was constructed based on the video recording analysis of the crack propagation within the specimen, while the force–time relationship (Figure 13b) was derived from the synchronized recording of the load at the testing machine grips.
Figure 13.
Experimental relationships: (a) Force versus time. (b) Crack length versus time.
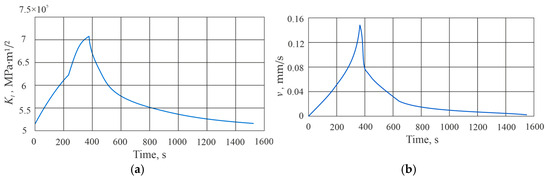
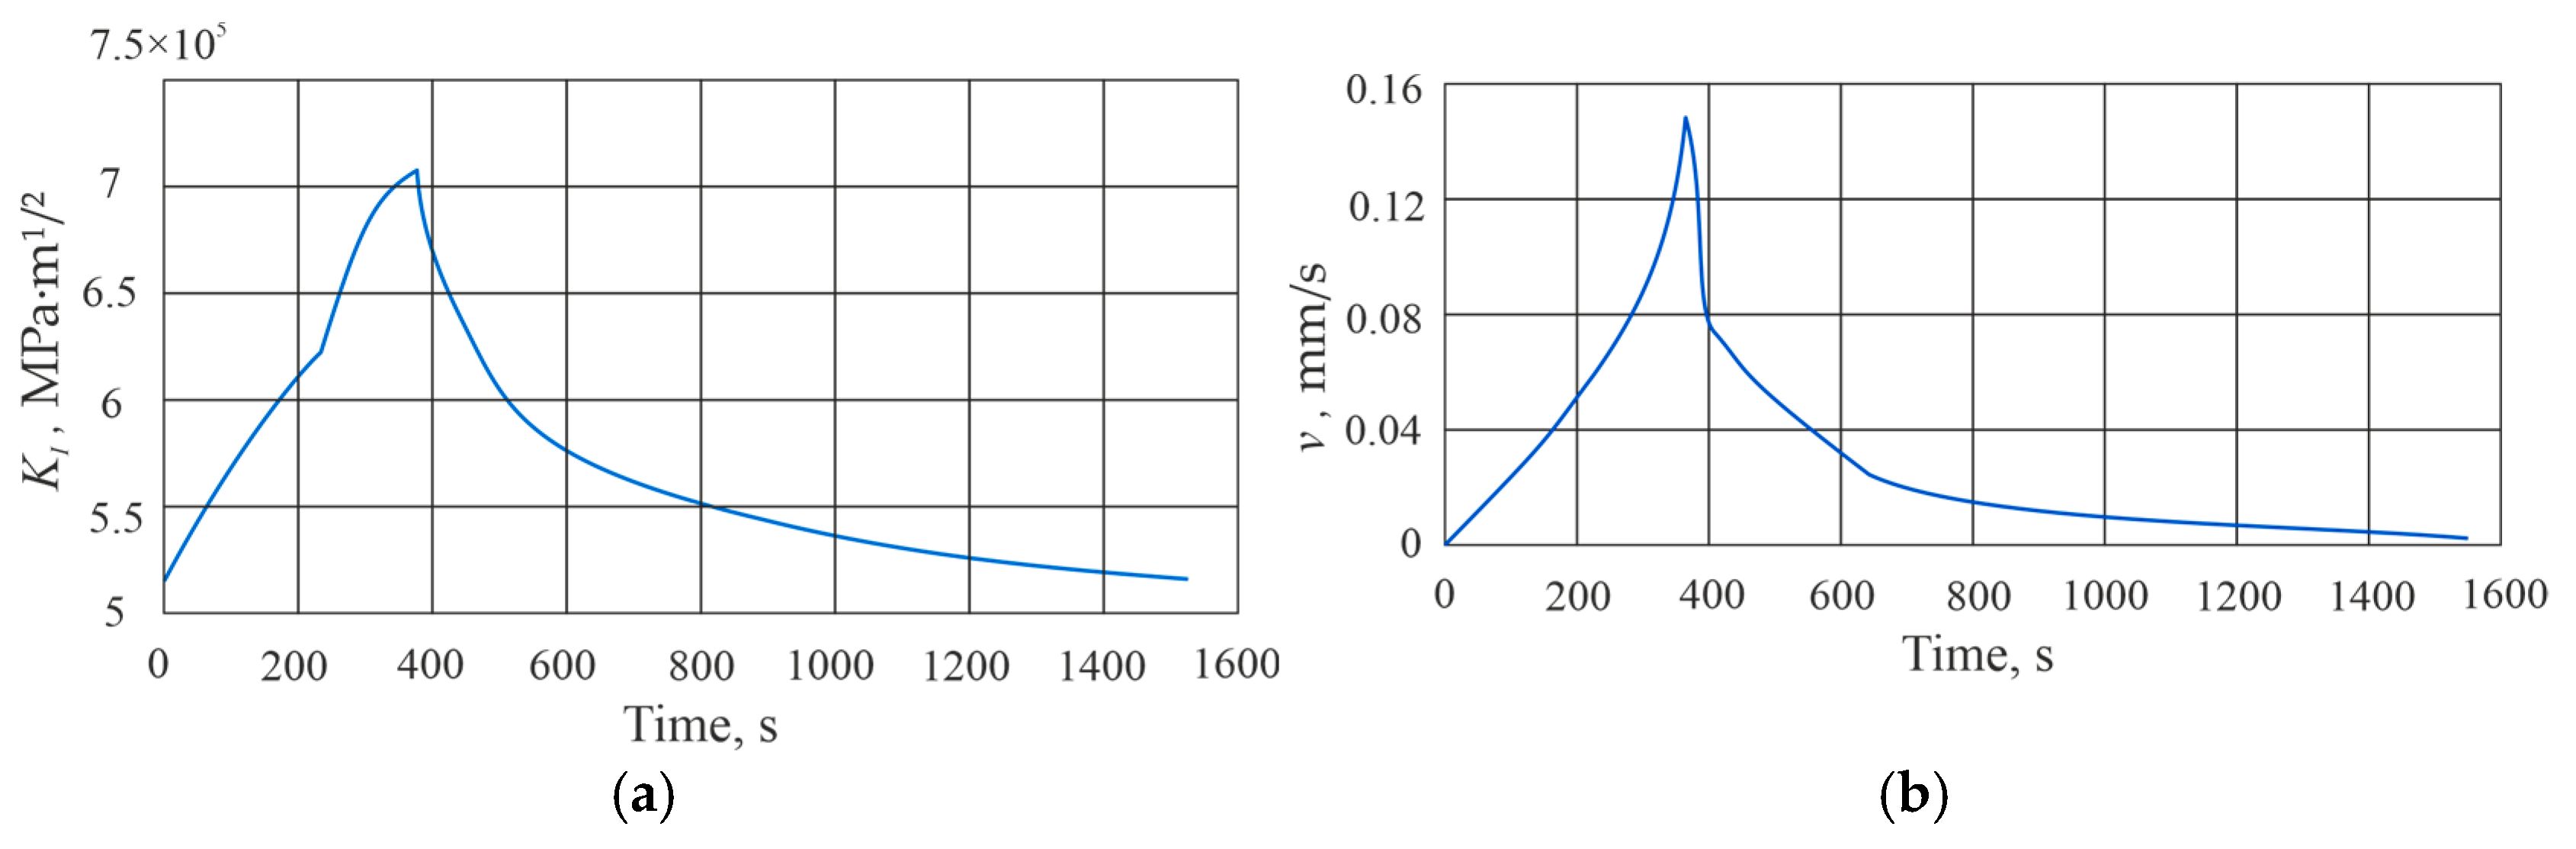
Subsequently, the data for each specimen, similar to those shown in Figure 13, were used in finite element modeling to determine the time dependence of the stress intensity factor KI. The simulation result for one of the specimens, based on the data from Figure 13, is presented in Figure 14.
Figure 14.
Time-dependent curves: (a) stress intensity factor KI; (b) crack propagation velocity v.
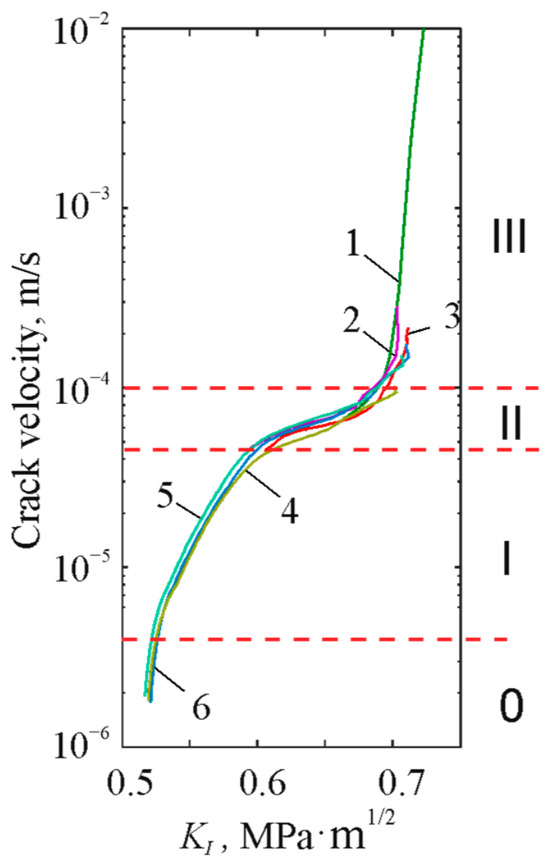
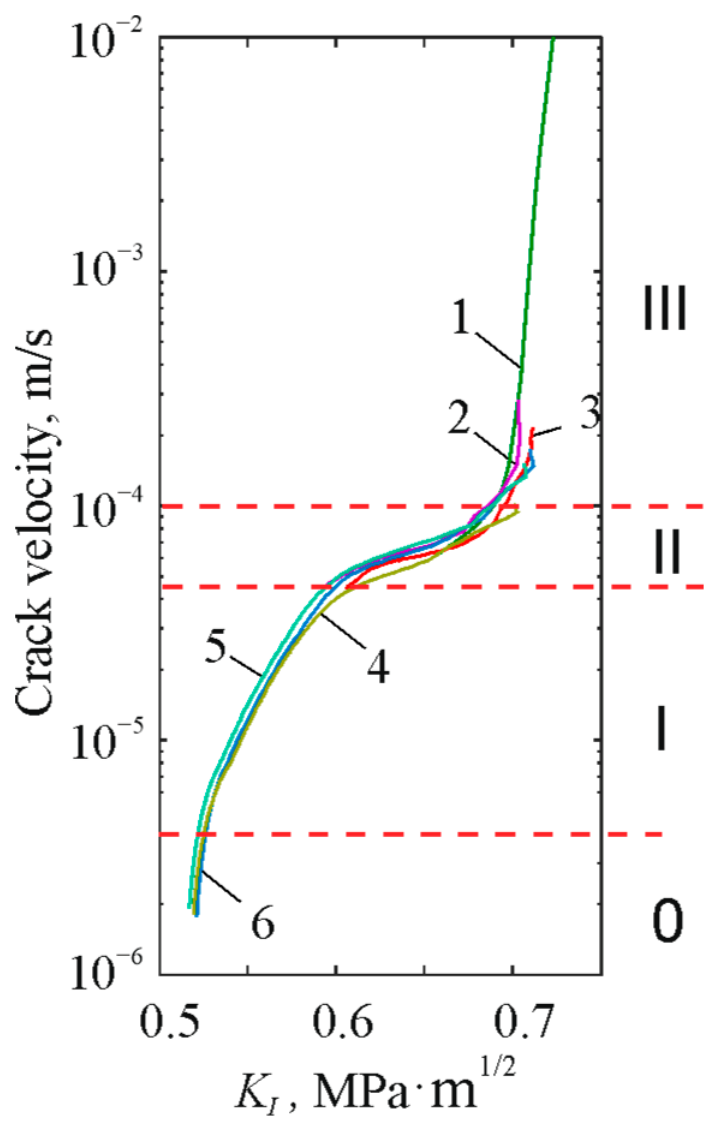
Relationships analogous to those shown in Figure 14 were established for each tested specimen. As a result, the crack propagation velocity (v) as a function of the stress intensity factor (KI) was obtained for the six specimens (Figure 15).
Figure 15.
Crack propagation velocity v versus stress intensity factor KI for six identical specimens (numbered 1–6).
Based on the stress intensity factor obtained in the deceleration zone for four specimens, the mean value of the SIF at the moment of crack arrest was determined to be = 0.519 MPa·m1/2. The confidence interval was Δ = ±0.005 MPa·m1/2 at a confidence level of P = 95%. For the same specimens, the average SIF corresponding to the moment of crack re-initiation after complete unloading was = 0.545 MPa·m1/2, with a confidence interval of Δ = ±0.080 MPa·m1/2 at P = 95%. Based on the experimental data presented in Figure 15, the parameters of the Charles equation [26] were determined for zone (I).
where A = 28 × 10−4 m/s, n = 17.69, and KIc = 0.75 MPa·m1/2.
All obtained numerical values of the parameters characterizing the regions in the Wiederhorn diagram and the constants of the Charles equation are in good agreement with the reported literature data [27,28] for soda–lime–silica glass under ambient conditions (temperature: +23 °C, relative humidity: 47%).
The results presented in Figure 15 correspond to the well-known Wiederhorn diagram [25]. Four characteristic regions separated by dashed lines can be distinguished in this plot: a deceleration zone (0) at velocities below 2 × 10⁻⁶ m/s; zone (I) of exponential growth in the velocity range from 2 × 10⁻⁶ to 7 × 10⁻⁵ m/s; zone (II), a plateau (diffusion zone), at velocities from 7 × 10⁻⁵ to 10−4 m/s; and zone (III), where within a narrow interval of K1 values from 0.7 to 0.75 MPa·m1/2, the crack velocity increases sharply, reaching critical values at KIc.
4. Discussion
The necessity of developing a specimen capable of providing a simple and reliable method for obtaining experimental data on subcritical crack propagation in glasses is driven by several critical factors. First, the parameters of the subcritical fracture regime are essential for an adequate assessment of the operational properties and durability of glasses under prolonged static and quasi-static external loading conditions. Second, the experimental realization of stable subcritical crack growth is extremely challenging due to the pronounced brittleness of glass. Third, existing approaches that bypass this issue impose stringent requirements on both specimen fabrication precision and testing equipment characteristics.
One of the main technical challenges in replicating a stable subcritical regime on standard laboratory equipment using simple specimens is the insufficient stiffness of the loading device. In this work, an alternative approach is proposed, which consists of providing the specimen itself (based on the classic compact tension [CT] geometry) with additional internal stiffness. This task was successfully accomplished by incorporating a stabilization zone into the specimen design. The local stiffness of this zone compensates for the compliance of the loading device, thereby allowing for the stable replication of the subcritical fracture regime on standard tensile testing machines using relatively easy-to-fabricate specimens.
Based on a series of experiments on six specimens, the kinetic Wiederhorn diagram was successfully constructed, and the constants of the power-law Charles equation were determined. The obtained value (n = 17.69) is in good agreement with the well-known literature data for ambient conditions, which confirms the validity of the developed technique.
It should be highlighted that the experiments demonstrated the capability for complete crack arrest upon load reduction, as well as the subsequent re-initiation of crack growth when the load was reapplied. Due to this feature, a crack with a natural configuration was successfully formed during the initial loading stage, which then served as a precision starter defect for the second stage. This ensured that the subsequent measurement results were completely independent of the initial notch preparation quality.
Overall, the established properties and advantages of the developed specimen open up broad prospects for its application in studying crack propagation processes in advanced novel materials. Most importantly, the simplicity of the specimen design enables its effective use for investigating the effects of various aggressive media and environmental conditions on subcritical fracture kinetics.
5. Conclusions
In this work, a novel specimen configuration for determining the fracture toughness parameters of silicate glass under quasi-static tensile loading was proposed and experimentally validated. A key feature of the developed geometry is the presence of an additional stiffness zone, which enables stable regimes of slow crack propagation and complete arrest. Crucially, during this process, the crack tip acquires a natural profile fully formed under the action of the local stress field.
Based on the experimental and numerical results, the following main conclusions can be drawn:
- The developed original specimen configuration enables the reliable registration of subcritical crack growth parameters in silicate glasses using standard tensile testing machines.
- Based on a series of physical experiments performed on six soda–lime–silica glass specimens, the kinetic subcritical fracture diagram (the Wiederhorn diagram) was successfully constructed, and the numerical constants of the power-law Charles equation were determined (n = 17.69).
- The demonstrated advantages of the proposed specimen geometry open up broad prospects for its effective application in determining the static fracture toughness and durability parameters for a wide range of structural glasses utilized in the construction industry.
Author Contributions
Conceptualization, A.S. and I.S.; methodology, A.S. and I.S.; software, A.S. and O.S.; validation, A.S., O.S. and I.G.; formal analysis, A.S. and I.S.; investigation, A.S., I.G. and O.S.; resources, A.S. and I.S.; data curation, A.S.; writing—original draft preparation, A.S., and I.S.; writing—review and editing, I.S. and I.G.; visualization, A.S., and I.G.; supervision, I.S. project administration, A.S.; funding acquisition, I.S. and A.S. All authors have read and agreed to the published version of the manuscript.
Funding
This research was supported by a grant from the Russian Science Foundation, project no. 22-19-00108-P, https://rscf.ru/en/project/22-19-00108/(accessed on 16 October 2026).
Data Availability Statement
The data that support the findings of this study are available from the corresponding author upon reasonable request.
Acknowledgments
During the preparation of this manuscript, the authors used Gemini (Gemini 3.6/4 Argon; Google LLC, Mountain View, CA, USA) for English language editing and style corrections. The authors critically reviewed and revised all outputs and take full responsibility for the final content of this publication.
Conflicts of Interest
The authors declare no conflicts of interest.
References
- Haldimann, M.; Luible, A.; Overend, M. Structural Use of Glass; International Association for Bridge and Structural Engineering (IABSE): Zurich, Switzerland, 2008. [Google Scholar] [CrossRef] [Scilit]
- Bedon, C.; Zhang, X.; Santos, F.; Honfi, D.; Kozłowski, M.; Arrigoni, M.; Figuli, L.; Lange, D. Performance of structural glass facades under extreme loads—Design methods, existing research, current issues and trends. Constr. Build. Mater. 2018, 163, 921–937. [Google Scholar] [CrossRef] [Scilit]
- Schittich, C.; Staib, G.; Balkow, D.; Schuler, M.; Sobek, W. Glass Construction Manual, 2nd ed.; Birkhäuser: Basel, Switzerland, 2007. [Google Scholar]
- Rouxel, T. Some strange things about the mechanical properties of glass. Comptes Rendus. Phys. 2023, 24, 99–112. [Google Scholar] [CrossRef] [Scilit]
- Wondraczek, L.; Bouchbinder, E.; Ehrlicher, A.; Mauro, J.C.; Sajzew, R.; Smedskjaer, M.M. Advancing the Mechanical Performance of Glasses: Perspectives and Challenges. Adv. Mater. 2022, 34, 2109029. [Google Scholar] [CrossRef] [Scilit] [PubMed]
- Pukh, V.P. Prochnost’ I Razrushenie Stekla [Strength and Fracture of Glass]; Nauka: Leningrad, Russia, 1973. (In Russian) [Google Scholar]
- Lawn, B. Fracture of Brittle Solids, 2nd ed.; Cambridge University Press: Cambridge, UK, 1993. [Google Scholar] [CrossRef] [Scilit]
- Freiman, S.W.; Wiederhorn, S.M.; Mecholsky, J.J., Jr. Environmentally Enhanced Fracture of Glass: A Historical Perspective. J. Am. Ceram. Soc. 2009, 92, 1371–1382. [Google Scholar] [CrossRef] [Scilit]
- Rouxel, T.; Yoshida, S. The fracture toughness of inorganic glasses. J. Am. Ceram. Soc. 2017, 100, 4374–4396. [Google Scholar] [CrossRef] [Scilit]
- ASTM C1421-18; Standard Test Methods for Determination of Fracture Toughness of Advanced Ceramics at Ambient Temperature. ASTM International: West Conshohocken, PA, USA, 2018. [Google Scholar] [CrossRef] [Scilit]
- Wiederhorn, S.M.; Shorb, A.M.; Moses, R.L. Critical analysis of the theory of the double cantilever method of measuring fracture-surface energies. J. Appl. Phys. 1968, 39, 1569–1572. [Google Scholar] [CrossRef] [Scilit]
- Sakai, M.; Bradt, R.C. Fracture toughness testing of brittle materials. Int. Mater. Rev. 1993, 38, 53–78. [Google Scholar] [CrossRef]
- Aaldenberg, J.S.; Aaldenberg, E.M.; Picu, C.R.; Negi, V.; Lezzi, P.J. Double cantilever beam fracture toughness measurement method for glass. J. Am. Ceram. Soc. 2022, 105, 3949–3958. [Google Scholar] [CrossRef] [Scilit]
- Virkar, A.V.; Gordon, R.S. Application of load-relaxation techniques to study subcritical crack growth in brittle materials. J. Am. Ceram. Soc. 1976, 59, 68–71. [Google Scholar] [CrossRef] [Scilit]
- Dondeti, S.; Tippur, H.V. Crack initiation and slow growth in soda-lime glass from a self-healed crack. Theor. Appl. Fract. Mech. 2022, 119, 103341. [Google Scholar] [CrossRef] [Scilit]
- Brühwiler, E.; Wittmann, F.H. The wedge splitting test, a new method of performing stable fracture mechanics tests. Eng. Fract. Mech. 1990, 35, 117–125. [Google Scholar] [CrossRef] [Scilit]
- Boccaccini, A.R.; Rawlings, R.D.; Dlouhý, I. Reliability of the chevron-notch technique for fracture toughness determination in glass. Mater. Sci. Eng. A 2003, 347, 102–108. [Google Scholar] [CrossRef] [Scilit]
- Evans, A.G. A method for evaluating the time-dependent failure characteristics of brittle materials—And its application to polycrystalline alumina. J. Mater. Sci. 1972, 7, 1137–1146. [Google Scholar] [CrossRef] [Scilit]
- Pallares, G.; Ponson, L.; Grimaldi, A.; George, M.; El Yaakoubi, M.; Ciccotti, M. Crack opening profile in DCDC specimen. Int. J. Fract. 2009, 156, 11–20. [Google Scholar] [CrossRef] [Scilit]
- EN 572-8:2012+A1:2016; Glass in Building—Basic Soda-Lime Silicate Glass Products—Part 8: Supplied and Final Cut Sizes. CEN: Brussels, Belgium, 2016.
- Cherepanov, G.P. Mechanics of Brittle Fracture; McGraw-Hill: New York, NY, USA, 1979. [Google Scholar]
- Ansys Help System. Fracture Mechanics Analysis Guide: SMART Method for Crack-Growth Simulation. In Ansys 2021 R1; Ansys, Inc.: Canonsburg, PA, USA, 2021; Available online: https://ansys.com (accessed on 5 October 2026).
- Rice, J.R. A Path Independent Integral and the Approximate Analysis of Strain Concentration by Notches and Cracks. J. Appl. Mech. 1968, 35, 379–386. [Google Scholar] [CrossRef] [Scilit]
- Murakami, Y. (Ed.) Stress Intensity Factors Handbook; Pergamon Press: Oxford, UK, 1987; Volume 1–2, p. 1464. [Google Scholar]
- Wiederhorn, S.M. Fracture Surface Energy of Glass. J. Am. Ceram. Soc. 1969, 52, 99–105. [Google Scholar] [CrossRef] [Scilit]
- Charles, R.J. Static fatigue of glass. I. J. Appl. Phys. 1958, 29, 1549–1553. [Google Scholar] [CrossRef] [Scilit]
- Yoda, M. Subcritical crack growth of glass. Eng. Fract. Mech. 1987, 28, 77–84. [Google Scholar] [CrossRef] [Scilit]
- Ciccotti, M. Stress-corrosion mechanisms in silicate glasses. J. Phys. D Appl. Phys. 2009, 42, 214006. [Google Scholar] [CrossRef] [Scilit]

Disclaimer/Publisher’s Note: The statements, opinions and data contained in all publications are solely those of the individual author(s) and contributor(s) and not of MDPI and/or the editor(s). MDPI and/or the editor(s) disclaim responsibility for any injury to people or property resulting from any ideas, methods, instructions or products referred to in the content. |
© 2026 by the authors. Licensee MDPI, Basel, Switzerland. This article is an open access article distributed under the terms and conditions of the Creative Commons Attribution (CC BY) license.