


Abstract
Public housing construction projects are inherently vulnerable to chronic delays, cost overruns, and quality deficiencies, vulnerabilities critically amplified in Myanmar, where ongoing political and economic instability, compounded by the COVID-19 pandemic, has produced a data-scarce, high-volatility environment in which traditional deterministic risk models are ineffective. To address this gap, this study develops an integrated three-stage decision-support framework combining Relative Importance Index (RII), Total Interpretive Structural Modelling (TISM), and Bayesian Belief Networks (BBNs). RII first screens 51 candidate disruption factors down to a critical subset using survey data from 210 industry respondents. TISM then structures these factors into a causal hierarchy through focus group consensus with eight domain experts, circumventing the need for historical databases that are largely absent or unreliable in this context. This causal structure is parameterized into a BBN using discrete survey data and the Expectation-Maximization algorithm, enabling probabilistic inference under severe data scarcity. Through 693 exhaustive single-, dual-, and triple-node scenario simulations, the framework identifies eight high-impact conditional what-if scenarios. Under the highest-ranked of these (T3), the probability of favourable performance for project delays, poor quality, and cost overruns rises from baseline levels of 47.3%, 70.4%, and 57.4% to 83.0%, 78.9%, and 82.6%, respectively. Findings from this study can help practitioners diagnose the current state of public housing construction performance and prioritize corrective actions accordingly.
1. Introduction
According to Sustainable Development Goal 11, everyone should have access to safe, affordable, accessible, and sustainable housing and basic services [1]. Public housing construction is one of the key mechanisms that governments use to meet this need. Despite increasing demand, the performance of public housing construction remains a critical concern in developing countries. Housing projects are frequently challenged by budgetary constraints, ineffective policies, inadequate infrastructure, lack of skilled labour, and limited use of advanced technology, which hinder the success of housing construction projects [2,3].
Studies have reported schedule delays in housing projects in Ghana [2], cost overruns in Small Island Developing States [3], and inferior quality in Nigeria [4] and Malaysia [5]. Existing studies have extensively identified critical success and failure factors for public housing construction in developing countries [5,6,7]. However, there is still a significant gap in understanding how these factors interact and influence performance outcomes holistically.
In Myanmar, a period of political transition in 2011 prompted the initiation of low-cost public housing programs designed for civil servants and low-income demographics [8]. Starting from 2011, there have been efforts to improve housing provision in Myanmar [9]. Private-sector participation has increased in public housing construction projects, and Government’s Department of Urban and Housing Development (DUHD) has since introduced a range of affordable and low-cost housing initiatives [8]. Despite these efforts, public housing projects have frequently encountered cost overruns, project delays and substandard quality [7,9].
Since 2021, however, the country has experienced severe economic fluctuations driven by the COVID-19 pandemic, political instability, and natural disasters [10,11,12]. These crises have had cascading effects on the construction sector, significantly diminishing project performance and highlighting a critical need for research that bridges micro- and macro-level dynamics. Effective management of housing construction performance requires a comprehensive understanding of these influencing factors and their interdependencies to support evidence-based decision-making. Moreover, the prevailing context, such as Myanmar, presents complex challenges that cannot be adequately captured by identifying influencing factors in isolation [13,14]. These issues stem from a range of interrelated challenges, underscoring the need for an integrated approach to understanding and addressing performance constraints in public housing construction, particularly under difficult conditions such as post-pandemic recovery, political instability and economic challenges.
However, the unavailability of reliable historical project data, resulting from fragmented record-keeping across government agencies and limited institutional capacity, constrains the applicability of conventional data-driven modelling approaches. This limitation motivates the expert-elicitation-based RII-TISM-BBN framework adopted in this study, detailed in Section 3.
Accordingly, this study examines the interrelationships and combined effects of these variables to enhance the performance of public housing construction projects in Myanmar (PHCPM). To achieve the aim, this study investigated three primary research questions: “What are the factors influencing the performance of PHCPM?”, “How do they interrelate and affect the performance of PHCPM?”, and “What scenarios most significantly impact PHCPM performance?” To answer these research questions, three specific objectives were established: (1) to examine the critical performance-influencing factors; (2) to explore the interrelationships among these factors; and (3) to diagnose the scenarios that significantly impact the time, cost, and quality performance of PHCPM. To support such conditions, project managers and policymakers require robust decision-support tools that are capable of capturing interactions among multiple factors and delivering enhanced explanatory and predictive performance [15].
Prior studies on decision-support models in construction projects have applied a range of techniques, including artificial neural networks [16], Interpretive Structural Modelling [17], fuzzy logic [18], Monte Carlo simulation [19], support vector machines [20], and reference class forecasting [15], and other machine learning models [21]. While these methods have contributed valuable insights, single-technique approaches are limited in their ability to represent nonlinear relationships and interdependencies among influencing factors, and many rely on large, high-quality historical datasets that are unavailable in data-scarce contexts such as Myanmar. Recent research therefore emphasizes the integration of complementary techniques to enhance explanatory capability and predictive accuracy [15].
Given the large number of candidate factors typically identified in construction performance literature, a preliminary screening step is often necessary to ensure that subsequent structural modelling remains cognitively manageable for expert participants. The Relative Importance Index (RII) is commonly used for this purpose [22,23], as it allows a large pool of factors to be systematically ranked and reduced to a critical subset based on practitioner input, before more resource-intensive structural or probabilistic modelling is applied [24].
The unavailability of historical project data further hinders the application of machine learning and artificial intelligence approaches to diagnosing public housing development performance [25]. To address this limitation, this study adopts an integrated RII-TISM-BBN approach, in which Total Interpretive Structural Modelling (TISM) and Bayesian Belief Networks (BBNs) are combined to structure complex causal relationships while enabling probabilistic reasoning under uncertainty. Rather than learning the causal structure from historical data, expert judgement elicitation methods were used to develop the causal model, which was then parameterized into a probabilistic model using questionnaire survey data collected across individual projects for parameter learning in the BBN. While TISM and BBN have each been applied individually across various engineering domains, their integrated application to public housing construction remains sparse, particularly within volatile, resource-constrained, and crisis-affected economies, where existing literature predominantly relies on deterministic risk assessments or data-rich predictive models ill-suited to abrupt socio-political shifts and severe data scarcity. This study bridges this gap by demonstrating how TISM’s structural hierarchy can systematically configure BBN parameters to model complex, multi-variable disruptions where historical data is absent, making the approach particularly suitable for decision-making in complex construction project environments.
This study is structured around three sequential phases, illustrated in Figure 1 and detailed in the Methodology section. The remainder of this paper is organized as follows: Section 2 reviews relevant literature on public housing construction performance and decision-support modelling techniques; Section 3 overviews the integrated decision-support framework; Section 4, Section 5 and Section 6 present three phases of research including data collection, analysis and results of each phase; Section 7 discusses the findings and their implications for theory and practice; and Section 8 concludes the study, outlining its contributions, limitations, and directions for future research.
Figure 1.
Research Design Flow. Orange boxes denote the data input to each phase, green boxes the processes, and yellow boxes the output of each step.
2. Literature Review
Factors Influencing the Performance of Construction Projects in Developing Countries
Challenges faced by different countries vary and are specific to their political status, economic conditions, strategic plans, construction technologies, etc. [26]. Previous studies have identified numerous challenges that hinder construction performance. Although extensive literature has documented numerous challenges affecting performance, these factors can be effectively consolidated according to the Project Management Institute (PMI) framework, which classifies them into People, Process, and Business/External domains [27].
- People: The People domain encompasses the human elements and stakeholder dynamics critical to project execution. Literature highlights that poor communication and a lack of coordination among stakeholders are primary catalysts for project failure [28]. For instance, deficiencies in contractor and subcontractor capabilities, ranging from poor technical knowledge to a lack of managerial experience, directly compromise structural quality and site safety [29]. Furthermore, the client’s role is equally crucial; poor cooperation and communication from the client side often create cascading delays across the supply chain [30]. In the traditional delivery systems characteristic of public housing, design and specifications are typically controlled by the client; consequently, any shortcomings in these areas directly impact the project schedule and overall housing quality [31,32]. Finally, addressing workforce shortages and ensuring adequate skill levels remain persistent challenges in maintaining project momentum [33].
- Process: The Process domain relates to the operational, administrative, and procedural workflows of a construction project [27]. A recurring theme in the literature is the detrimental impact of delayed decision-making and inefficient planning. Incompleteness of tender documents, delayed site handovers, and frequent changes to the scope of work by the client frequently disrupt baseline schedules [2,34,35]. Additionally, poor planning by the contractor, coupled with ineffective inspection routines by consultants, often results in defective work and mandatory reworking [2]. External procedural hurdles, such as delayed approvals by relevant authorities, further exacerbate these scheduling constraints.
- Business/External: The Business domain captures the economic, logistical, and external environmental variables that impact project viability [32]. Financial instability, often triggered by delayed progress payments from clients, can severely restrict a contractor’s ability to procure sufficient equipment and materials [2]. Beyond internal financial management, external market volatility, such as material price fluctuations [30] and the unavailability of desired quality materials, poses a significant risk to cost baseline adherence [36]. Furthermore, construction projects are highly susceptible to exogenous shocks, including unfavourable weather conditions, unexpected disasters, and abrupt government policy changes [37], all of which require robust risk mitigation strategies [34].
The complete inventory of 51 candidate performance factors is presented in Table 1.
Table 1.
Full list of 51 candidate performance factors, classified by PMI domain [27].
Although previous efforts have established a foundational inventory of ranked critical performance factors across these three domains, the static identification of these variables is no longer sufficient. A significant gap remains in understanding the dynamic, interconnected ecosystem in which these factors operate. To accurately capture real-world project dynamics, future research must move beyond isolated analysis. Therefore, a critical need exists to deploy an integrated structural and probabilistic modelling framework capable of mapping their complex hierarchical structures alongside their probabilistic behaviours.
3. The Integrated Decision-Support Framework
This study adopts a three-phase research design, illustrated in Figure 1, to develop an integrated decision-support framework for diagnosing public housing construction project management (PHCPM) performance. Phase 1 identifies the critical factors influencing PHCPM through questionnaire-based screening. Phase 2 develops a contextual causal model of these factors through expert elicitation via focus group discussion (FGD). Phase 3 transforms this causal structure into a probabilistic model capable of quantitative scenario and sensitivity analysis. Detailed data collection, analysis and results were presented in each phase of research.
4. Phase 1: Listing Critical Factors
The first phase identifies the critical factors influencing PHCPM performance from an initial pool of 51 candidate factors drawn from the literature. A questionnaire survey was administered to industry respondents to rate how frequently each candidate factor occurs. The Relative Importance Index (RII) was then calculated for each factor from these frequency-of-occurrence ratings, and factors were ranked accordingly. Factors exceeding a defined RII threshold were retained as critical, and the ten highest-ranked of these were carried forward to Phase 2, ensuring that the subsequent structural modelling process remained analytically manageable for expert participants.
4.1. Questionnaire Survey
To establish the empirical baseline for this study, a comprehensive set of 51 performance factors was initially identified and categorized into three primary domains: people, operational process, and external/business. These variables were operationalized into a structured questionnaire instrument. For each factor, respondents rated both the frequency with which it occurs and its perceived level of impact on project outcomes, each on a five-point Likert scale. Factor occurrence was rated from “Almost Never (1)” to “Very Often (5),” while performance outcomes—project delays, poor quality, and cost overruns—were assessed on a scale from “Very Low (1)” to “Very High (5)”. The frequency-of-occurrence ratings are used both for the Relative Importance Index and for the parameterization of the Bayesian network, so that factor selection and probabilistic estimation refer to the same measured variable.
Survey data were collected from PHCPM practitioners, comprising clients, consultants, contractors and subcontractors. The questionnaire comprised four parts: respondent background, general project information, factor evaluation, and an invitation to participate in the subsequent focus group discussion. The questionnaire form can be found in the Supplementary Materials. Given the limited number of public housing projects and the difficulty of accessing experienced professionals, snowball sampling was used to identify and engage knowledgeable experts. Experts were asked to reflect on a recently completed project and evaluate the 51 listed factors accordingly. An open-ended question was included to allow experts to propose additional factors not captured in the initial list. A total of 210 valid responses were obtained. Respondent backgrounds are summarized in Table 2.
Table 2.
Respondents’ background (n = 210).
Data collection commenced on 1 June 2021 and continued, as conditions permitted, until July 2022, so the 210 valid responses span a period coinciding with the economic and political conditions described in Section 1. These data derive from the same data collection reported in Nwal et al. [7], which identified and ranked the critical performance factors from the 86 responses available at that time; those responses are included among the 210 analysed here, and the present study re-derives the ranking on the full sample before using the resulting factor set as the input to the structural and probabilistic modelling phases described in Section 5 and Section 6.
4.2. Data Screening and Reliability
A total of 210 valid responses were obtained, and the respondents’ professional backgrounds are summarized in Table 2. Item-level non-response was negligible: every factor was rated by at least 209 of the 210 respondents, and the effective sample size for each item is reported in Table A3. The internal consistency of the 51-item instrument was assessed using Cronbach’s alpha. The coefficient obtained was , which exceeds the threshold of 0.70 conventionally taken to indicate acceptable reliability and lies within the range regarded as evidence of strong internal consistency [59]. The scale therefore measures the underlying construct coherently, and no item was found to depress reliability to an extent that would justify its removal. Divergence of perception between the stakeholder group whose behaviour a factor describes and the groups evaluating it is a substantive feature of a multi-party supply chain rather than measurement noise, so factors on which the four groups disagree are not treated as unreliable and no factor was removed on that basis. All 51 candidate factors were therefore carried forward to the prioritization step in Section 4.3, where the imbalance in sample composition—contractors constituting 48.57% of the sample against 15.71% for government clients—is addressed directly by recomputing the Relative Importance Index so that each stakeholder group contributes equally regardless of its share of the sample.
4.3. Identifying the Critical Factors
Following the survey data collection, all 51 candidate factors were subjected to preliminary statistical analysis to further prioritize and reduce the variable set. Descriptive statistics and the Relative Importance Index () were calculated for each factor from the frequency-of-occurrence ratings, ranking the factors individually before their interrelationships were examined in Phase 2. The for each factor was computed using Equation (1):
where W is the weight assigned to each factor by respondents on the five-point Likert scale (ranging from 1 to 5), A is the highest possible weight (i.e., 5), and N is the total number of respondents [22]. values range from 0 to 1, with higher values indicating a greater reported frequency of occurrence in PHCPM.
Factors were ranked in descending order of , and a dimension reduction was performed to isolate the top ten most critical performance factors. The reduction applied two criteria in sequence. The first was a fixed threshold, set a priori rather than chosen to yield a particular number of factors: factors with were retained as critical. Since with , this threshold corresponds to a mean occurrence rating above 3.0 on the five-point scale, that is, to factors reported as occurring at least moderately often. Thirteen of the 51 factors met this criterion. The second was the elicitation capacity of Phase 2. TISM requires a directed judgement, with an interpretive justification, on each pair of elements in the model. With the ten factors and the three performance aspects, the panel made 78 such judgements in a single session; carrying all thirteen threshold-passers forward would have required 120, which we judged to exceed what one facilitated session could sustain while preserving the quality of the interpretive justifications. The ten highest-ranked factors were therefore carried forward, spanning values from 0.693 to 0.611, against 0.605, 0.604 and 0.603 for the three threshold-passers not carried forward. The index is reported for all 51 factors in Table A3, under both the pooled and the equal-weighted computation. To assess whether the pooled rankings were disproportionately influenced by sample composition, given that contractors constituted 48.57% of the 210 respondents while government clients constituted only 15.71% (Table 2), an equal-weighted was additionally computed for all 51 factors by first computing separately within each of the four stakeholder groups (clients, consultants, contractors, and subcontractors) and then averaging the four group-level values with equal weight, so that each group contributed equally to the resulting score regardless of its share of the pooled sample. The pooled and equal-weighted rankings correlated strongly (Spearman’s , ), and a direct comparison of the two top-ten factor sets returned the same set of factors. We therefore conclude that the top-ten factor set, and the Bayesian network parameterization that rests on it, are not artefacts of the sample’s stakeholder composition. This step ensured that the subsequent structural and probabilistic modelling focused exclusively on the variables with the highest empirical significance, keeping the scope analytically manageable for the expert-elicitation process employed in the TISM phase. The top ten critical factors are:
- Material price fluctuations: Stringent budget allocations result in public housing construction contractors often experiencing minimal profits, making them especially vulnerable to the adverse effects of material cost instability or sudden increases. In an effort to reduce costs, contractors may resort to using lower-quality materials, thereby compromising the overall quality of the projects [36]. Consequently, material price volatility directly impacts the quality and cost of construction projects in developing countries such as Nigeria and the Gaza Strip [30].
- Delayed approval by the authority: Delayed approval by the authority can be a major factor in project delays, especially in public projects, as the project cannot proceed without approval [37]. Delayed approval by relevant authorities, such as construction permits by the local government, can lead to schedule delays and increased project costs [36]. According to Aibinu and Odeyinka [34], slow permitting by the government is one of the important delay factors in Nigeria’s public construction projects.
- Contractor is in difficult financial situation: Local contractors, as independent SMEs with limited resources, often underbid competitors to secure contracts in a competitive market, but this strategy increases their financial burden due to low-profit margins in public construction projects [32]. Consequently, contractors encounter significant challenges in securing capital, leading to project delays, cost overruns, and sometimes abandonment due to insufficient funding [35].
- Scope of work change by client: Studies show that client-initiated scope changes significantly impact financial performance, causing delays and reducing construction quality [31,32]. Client-initiated scope changes after work begins can significantly delay completion due to design and schedule adjustments, impacting public housing construction in developing countries like Ghana [2] and Algeria [53].
- Delay in progress payment by client: Delayed client payments can cause cash flow issues for contractors, often necessitating loans or financing and potentially putting other projects on hold. This challenge is a critical factor affecting the performance of construction projects in various countries, including Algeria [53] and Ghana [2]. These financial constraints can lead to quality issues resulting from necessary cost-cutting measures [30].
- Delay in schedule: Schedule delays can significantly impact the performance outcomes of construction projects, particularly with respect to overall construction duration and cost overruns [2]. Existing studies in the performance management of construction projects have attempted to identify not only the causes but also the effects of delays in schedules [2,34,35]. In particular, delays in the schedule can pose unique challenges for public construction projects subject to strict rules and regulations.
- Incomplete design, drawings, and specifications: Clear and comprehensive drawings and specifications can facilitate the determination of the scope of work, potentially reducing the risk of delays [40]. On the other hand, late review and approval of design documents by the client cause delays in large construction projects [31]. Therefore, this factor was ranked as one of the most influential factors on the performance of public construction projects, particularly in developing countries such as Nigeria [34].
- Client’s inappropriate construction timeline: Construction duration should be defined and negotiated with due consideration of the contractor’s capacity and resource availability [53]. Otherwise, if the team is pressured to complete tasks rapidly, they may make mistakes, leading to additional delays and cost overruns. Unrealistic construction durations or excessively short timelines are significant factors influencing construction delays, as evidenced in countries such as Algeria [53].
- Delay in delivery of materials: It is crucial that materials are delivered on time in order to facilitate the smooth progress of a construction project. Failure to do so can negatively impact construction performance, with certain tasks requiring specific materials that may not be readily available. In such cases, delays in material delivery can result in project timeline setbacks and increased costs. This factor was indicated as one of the most influential factors affecting the performance of construction projects in the Gaza Strip [30] and Nigeria [34].
- Shortage of workers: This factor critically influences large labour-intensive projects, where the lack of qualified workers can cause delays in project completion [31]. Shortage of workers highly impacts the performance of construction projects in both developed and developing countries, including Saudi Arabia [31], Thailand [33], and Jordan [32].
5. Phase 2: Development of the TISM Model
The second phase develops a contextual causal model of the critical factors identified in Phase 1, using Total Interpretive Structural Modelling (TISM). This phase was conducted through a focus group discussion with eight domain experts, structured according to the guidelines proposed by Azevedo et al. [60], Sushil [61].
5.1. Focus Group Discussion
The focus group discussion was held on 29 December 2022, after data collection had been completed, the date being determined by the availability of the participants. A focus group discussion (FGD) was conducted to develop the TISM model, incorporating the critical factors selected from RII analysis and three key performance aspects: project delays, cost overruns, and poor quality. The discussion was structured into three parts: an icebreaker session, a review of the ten factors and three performance measures, and an in-depth examination of their interrelationships and impacts on PHCPM. During the two-hour structured brainstorming session, participants conducted pairwise comparisons of the factors, identified the directional relationships between them, and discussed the underlying cause-and-effect rationale for each link. Where initial judgments diverged, participants deliberated until a majority-consensus decision was reached for each pairwise comparison [61]. The session was audio-recorded and transcribed for subsequent analysis. The panel comprised eight professionals from clients, consultants, contractors, and subcontractors, each with a minimum of nine years of experience in housing construction. Participant profiles are detailed in Table 3.
Table 3.
General information of participants.
A recognised limitation of expert-elicited network construction is the risk that group consensus reflects social or hierarchical dynamics rather than independent causal judgement, particularly where panel composition spans pronounced differences in organisational seniority (Table 3). To mitigate this risk, the facilitator applied a structured turn-taking protocol during the pairwise comparison discussions, in which each participant was called on in a fixed rotation to state their judgement on a given contextual link before the floor was opened to general deliberation; this ensured that every participant’s independent judgement was registered for each pairwise comparison before discussion could converge around any one participant’s view, rather than allowing the most vocal or senior participant to set the initial framing by default. Further, every accepted contextual link was required to carry an explicit interpretive justification rather than being accepted on the basis of a bare majority vote, making authority-driven links visible and contestable within the session transcript.
5.2. Overview of TISM Approach
Interpretive Structural Modelling (ISM) is a systematic approach for developing a contextual model through qualitative analysis, providing a structured, organized way to map relationships among variables. Since its introduction by Warfield [62], ISM has been widely applied in construction management research [63]. Total Interpretive Structural Modelling (TISM), an advanced extension of ISM introduced by Sushil [61], incorporates interpretations of the causal connections within the model, distinguishing it from conventional ISM.
The development of TISM followed the guidelines of Sushil [61]. It begins with the identification of variables (Step 1). Steps 2 and 3 involve determining the contextual links between variables and discussing them through group deliberation. Steps 4 through 9 constitute the core structural analysis, encompassing the construction of the Structural Self-Interaction Matrix, the reachability matrix, the transitivity check, level partitioning, and the development of the final TISM model [61]. The resulting TISM model comprises the critical factors and their associated performance aspects. Phase 2 of the research flow (Figure 1) provides an overview of the TISM development process adopted in this study.
Data collection for TISM can be conducted individually or through a suitable group process, such as brainstorming or the nominal group technique [61]. Several existing studies have applied group discussion exclusively for developing contextual links, including Sarhan et al. [12] and Thirupathi and Vinodh [64]. The number of experts engaged in focus group discussions for ISM-based studies typically ranges from 5 to 20 [12,60,64]. Participants should be drawn from diverse professional backgrounds to incorporate a broad range of perspectives and experiences into the study.
5.3. Development of the TISM Model
The TISM model was developed following the step-by-step guidelines outlined by Sushil [61].
- Identification of factors. The critical factors were evaluated and ranked using the Relative Importance Index method. The top ten influencing factors, alongside three core performance aspects, project delays, cost overruns, and poor quality, were subsequently isolated to guide an in-depth discussion of their interrelationships. In total, the developed model encompasses 13 variables: ten influencing factors and three performance measures.
- Establishment of links between factors. Data collected from the group discussion were transformed into symbolic notation for analysis, using the symbols . A Structural Self-Interaction Matrix (SSIM) was then developed, as shown in Table 4. The symbols represent:V: a directed relationship from element i to element j only;A: a directed relationship from element j to element i only;X: a bidirectional relationship between elements i and j;O: no relationship between elements i and j.The symbols were converted into binary codes (1 and 0) in a pairwise manner, forming the reachability matrix: if one factor influences another, the relationship is denoted as 1; otherwise, it is denoted as 0.
- Transitivity check. The transitivity rule was applied to the reachability matrix. According to this rule, if variable A influences B, and B influences C, then A must also influence C [60]. Where the reachability matrix did not satisfy the transitivity rule, it was revised by adding the missing links. Any missing transitive links identified during this process were incorporated into the matrix and denoted with an asterisk (1*), as shown in the Final Reachability Matrix in Table 4.
- Level partitioning. Using the final reachability matrix, the reachability set and antecedent set were determined for each variable. The reachability set comprises the variable itself together with the other variables it influences, while the antecedent set comprises the variable itself together with the other variables that influence it. The intersection of these two sets was computed for each variable, and variables for which the reachability set and intersection set were identical were assigned to the first level of the hierarchy (Level I). These variables were then removed from consideration, and the process was iterated for the remaining variables until all variables were assigned to a hierarchical level. Detailed calculation can be seen in Table 5.
- Development of the ISM model. Based on the level partitioning results, a directed graph (digraph) was constructed, positioning variables according to their assigned hierarchical level and connecting them using the direct and significant transitive links identified in the final reachability matrix [61]. This digraph constitutes the ISM model, representing the structural hierarchy of the critical factors and performance aspects.
- Development of the TISM model. The ISM model was subsequently converted into a TISM model by incorporating the interpretive explanations obtained during the focus group discussion (Section 5.1) for each retained link [60]. Unlike conventional ISM, which represents relationships as binary directional links without justification, TISM annotates each link with a brief interpretation of the underlying cause-and-effect rationale, providing a more transparent and interpretable structural model [61]. The resulting TISM model, comprising the thirteen elements of the model, that is the ten critical factors and the three performance aspects, is presented in Figure 2.Figure 2. Total Interpretive Structural Model.
Table 4.
SSIM and Final Reachability Matrix.
Table 5.
Level Partition.
Development of TISM model: Antecedent and reachability sets for each variable are developed from the final reachability matrix. The reachability set includes the variable itself and those it may influence, while the antecedent set includes the variable and those that influence it [60]. Variables with identical reachability and intersection sets are assigned the lowest level (Level I) and removed from subsequent iterations. This process is repeated until all variables are levelled (see Table 5). Level partitions establish the hierarchy for the ISM model, which includes necessary direct linkages between variables as shown in Figure 2.
Indirect links are typically removed, but transitive links can be restored if clearly explained [61]. In this study, four transitive links were restored due to meaningful expert explanations Table 6.
Table 6.
Description of logical links between cause and effect variables.
6. Phase 3: Development of the BBN Model
The third phase converts the causal structure derived from the TISM model into a probabilistic model using Bayesian Belief Networks (BBNs), enabling quantitative inference under uncertainty.
- Learning from data: The TISM structure was used to define the network topology (nodes and directional edges) of the BBN. Conditional probability tables were parameterized using discrete data collected through a questionnaire survey of 210 respondents, applying the Expectation-Maximization algorithm to estimate parameters from the survey responses.
- Sensitivity analysis: The parameterized BBN was subjected to sensitivity analysis to identify the factors exerting the greatest influence on target performance nodes (project delays, poor quality, and cost overruns).
- Scenario analysis: Single-, dual-, and triple-node scenario simulations were performed to identify the combinations of factors producing the most significant impact on PHCPM performance outcomes.
- Cross-validation and expert review: The model’s predictive validity was assessed through k-fold Cross-Validation. In parallel, expert interviews were conducted to review the model’s structure and the practical validity of the derived management strategies, ensuring the resulting validated model was both statistically sound and practically credible before drawing conclusions and recommendations.
6.1. Overview of BBN Approach
The BBNs provide a powerful mathematical framework for dealing with uncertainty and making probabilistic inferences [63]. Since 1998, BBN has been used in civil engineering for decision-making purposes [24,43,44,65,66,67]. The ability of BBNs to model complex probabilistic relationships between variables and their dependencies makes them a valuable tool for solving real-world problems [68].
In a BBN, nodes represent variables, and directed links represent causal relationships between them. The probabilistic relationships are encoded in conditional probability distributions, capturing the likelihood of a node given its parents [69]. To complete the BBN model, Conditional Probability Tables (CPTs) for all variables must be added. Parameter learning can be used to establish these CPTs based on the network structure and available data, by first defining the possible states of each node (e.g., True/False or other categories) [70]. The probability of a variable depends on the state of another variable, and Bayes’ theorem analyses the influence of one or multiple variables through their conditional relationships. Bayes’ theorem is mathematically expressed as Equation (2).
where P(A) and P(B) are unconditional probabilities of event A and event B. P(A|B) is a posterior conditional probability of event A occurring given that B is true, and P(B|A) is a conditional probability of event B occurring given that A is true. By applying Bayes’ Theorem, BBNs dynamically update the probabilities of nodes, offering a robust framework for probabilistic inference under uncertainty.
One of the advantages of BBNs is their ability to incorporate new evidence, allowing the model to revise its predictions in real time, a particularly valuable feature in dynamic environments where new observations continuously emerge [65]. Data used to parameterize a BBN can take the form of historical records, survey data, expert judgement, secondary data, or a combination of these sources. In this study, historical project records were difficult to obtain given the country’s political and economic situation and the nature of public housing projects; consequently, survey data collected from experienced PHCPM practitioners were used for parameter learning.
6.2. Development of BBN Model
After developing the TISM model, it was transformed into a BBN model by incorporating CPTs, with parameters estimated using the Expectation–Maximization (EM) algorithm in the BBN software Netica 6.0.4 [71]. Survey data, initially collected on a five-point Likert scale, were treated as continuous data and converted into discrete categories to simplify the model and support decision-making. The Likert scale (1 to 5: “Almost Never” to “Very Often”) was grouped into three intervals: 1–2.5 (“Rarely”), 2.5–3.5 (“Sometimes”), and 3.5–5 (“Frequently”). Similarly, the target nodes— project delays, poor quality, and cost overruns—were discretized into three categories: “Low,” “Medium,” and “High.” This discretization method follows the approach of Wipulanusat et al. [70]. Fisher’s Exact Test confirmed a significant association () between the original and discretized categories, validating the method. The resulting network, with its node states and marginal probabilities, is shown in Figure 3. The following section presents the sensitivity analysis conducted to identify the key factors influencing each target node (project delays, poor quality, and cost overrun).
Figure 3.
BBN model for Performance Management of PHCPM. The arrows are the directed arcs of the network and represent the conditional dependencies between nodes. Each node lists its three states with their marginal probabilities; the value beneath each node is the mean of that node’s marginal distribution ± one standard deviation.
To assess the robustness of factor rankings to the choice of discretization scheme, the Likert-scale factor scores were re-discretized using two alternative methods: equal-frequency (tertile) binning and a supervised entropy-minimizing (MDL) discretization using each output node’s severity rating as the target. Mutual information between each discretized factor and the corresponding output was computed under all three schemes (original uniform-interval, equal-frequency, and MDL-optimal), and the resulting factor rankings were compared via Spearman’s rank correlation. Rankings were highly consistent across schemes (Spearman’s , and for the three pairwise comparisons between schemes, all ), indicating that the reported factor rankings, and hence the sensitivity analysis built upon them, are robust to the specific discretization thresholds chosen. The per-factor mutual information values under all three schemes, together with the MDL cut points and the three rank correlations, are reported in Table A2. For five of the ten factors the entropy-minimizing procedure recovers the uniform cut points of 2.5 and 3.5 exactly, so the uniform and MDL-optimal columns coincide for those rows. This test covers the ranking of factors by their informativeness for the query nodes. The ordering of the scenarios themselves was not re-derived under the alternative schemes, since each scenario posterior depends on the full set of conditional probability tables rather than on the factor rankings alone; the stability of the scenario ordering under alternative discretization is therefore not established here and is noted as a limitation.
6.3. Sensitivity Analysis
Sensitivity analysis is a technique for the systematic investigation of the influence of variation in the finding nodes on the values of the query nodes [72]. Parameters of the finding nodes are adjusted from their lowest to highest values while holding all other nodes constant, allowing their individual impact on the query nodes to be observed [73]. Using Netica software, variance reduction was calculated for each finding node to evaluate its explanatory power with respect to the query nodes. The finding nodes reported for each query node were selected by identifying the natural discontinuity in the ordered variance-reduction values: factors were retained as long as each successive factor still contributed materially to the cumulative variance reduction, and excluded once the marginal contribution of the next-ranked factor fell below approximately 5 percentage points of the total. Applying this criterion retained two factors for cost overrun (cumulative variance reduction 84.99%), three factors for project delays (91.98%), and three factors for poor quality (93.72%), in each case immediately preceding a marked decline in the marginal contribution of subsequent factors (Table 7, Table 8 and Table 9). According to the results, project cost is mainly influenced by “Material price fluctuations” and “Delay in schedule.” Project delays are mainly influenced by “Client’s inappropriate construction timeline,” “Delays in schedule,” and “Contractor’s difficult financial situation.” Poor quality is mainly influenced by “Delay in schedule,” “Incomplete design, drawings, and specifications,” and “Scope of work change by the client.” For each target node, the relevant finding nodes and their corresponding variance reduction values are reported in Table 7, Table 8 and Table 9.
Table 7.
Sensitivity of Node11 (Cost overrun).
Table 8.
Sensitivity of Node12 (Project delays).
Table 9.
Sensitivity of Node13 (Poor quality).
The six finding nodes carried forward to scenario analysis were selected as the union of the factors retained by the sensitivity-analysis discontinuity criterion (Section 6.3) across the three query nodes: Material price fluctuations (Node 1), Contractor is in difficult financial situation (Node 3), Scope of work change by client (Node 4), Delay in schedule (Node 6), Incomplete design, drawings, and specifications (Node 7), and Client’s inappropriate construction timeline (Node 8). The remaining four factors (Delayed approval by the authority, Node 2; Delay in progress payment by client, Node 5; Delay in delivery of materials, Node 9; Shortage of workers, Node 10) did not meet this criterion for any of the three query nodes and were therefore excluded from scenario analysis.
6.4. Scenario Analysis
Scenario analysis serves as a diagnostic tool for proposing strategies to achieve project objectives by generating hypothetical combinations of evidence and predicting the resulting outcomes. This process involved modifying the states of individual finding nodes and observing the resulting changes in the query nodes, with conditional probabilities updated as evidence was set. These scenarios are conditional rather than interventional: setting a finding node’s state returns the posterior distribution of the query nodes given that evidence, which is not in general the distribution that would follow from manipulating the factor itself. The implications of this distinction for interpretation are discussed in the concluding section. For example, the finding node “Material price fluctuations” was set to “Rarely” with 100% probability, and the resulting changes in the query nodes were observed. Scenarios were categorized as single-node (S1, S2, …, Si), dual-node (D1, D2, …, Di), and triple-node (T1, T2, …, Ti) combinations, with the analysis limited to three-node scenarios due to the complexity of managing higher-order combinations.
Six key finding nodes, each with three discrete states, were examined in the scenario analysis to investigate their impact on the three query nodes. This yielded a total of 18 single-node scenarios, 135 dual-node scenarios, and 540 triple-node scenarios, for a combined total of 693 scenarios, each generating a corresponding posterior probability distribution over the query nodes. The prior probability of the query nodes, calculated before any evidence was set, was taken as the baseline. Scenarios whose triangular area exceeded that of the baseline were selected for further analysis, so that selection reflected the combined shift across all three performance dimensions rather than movement in any single outcome; where a scenario leaves one outcome slightly below its baseline value, this trade-off is reported.
To assess the relative severity of these scenarios, the area of a triangle plotted on a spider chart was calculated for each scenario, with the length from the origin to each vertex representing the posterior probability of the project delay, cost overrun, and poor quality query nodes, respectively. A larger triangular area indicated a more balanced impact across all three performance dimensions, suggesting a stronger combined effect on overall project outcomes. This approach enabled the identification of scenarios posing heightened risk across time, cost, and quality simultaneously, highlighting the need for targeted management and contingency planning.
Based on this analysis, eight scenarios were selected for recommendation, as presented in Table 10, with the corresponding management actions and responsible stakeholders set out in Table 11. The table reports the baseline scenario (B), representing the prior probabilities of the query nodes, alongside the eight selected scenarios (S1, S2, D1, D2, D3, T1, T2, and T3), which represent their posterior probabilities. Each scenario is evaluated according to its impact on the three key performance metrics: project delays, cost overruns, and poor quality.
Table 10.
Scenario Analysis Results.
Table 11.
Recommended Actions by Scenario and Responsible Stakeholder.
The top three ranked scenarios, T3, D2, and T1, produced the most substantial improvements across project performance. Scenario T3, combining “Rarely” states for “Material price fluctuations,” “Contractor is in difficult financial situation,” and “Client’s inappropriate construction timeline,” ranked first with a triangular area of 8626.32. This scenario increased the low-state probability of project delays, poor quality, and cost overruns from baseline values of 47.3%, 70.4%, and 57.4% to 83.0%, 78.9%, and 82.6%, respectively, representing the most balanced improvement across all three performance dimensions. Scenario D2, combining “Material price fluctuations” and “Client’s inappropriate construction timeline” at the “Rarely” state, ranked second with a triangular area of 7160.78, increasing the low-state probability of project delays, poor quality, and cost overruns to 63.9%, 78.9%, and 80.5%, respectively. Notably, D2 matched T3’s poor-quality improvement exactly while conditioning on only two factors, suggesting that jointly stabilizing material prices and enforcing realistic construction timelines offers a comparatively efficient strategy for improving construction quality. Scenario T1 ranked third, with a triangular area of 6592.51. This scenario combined a partial improvement in “Client’s inappropriate construction timeline”, “Contractor is in difficult financial situation” and “Incomplete design, drawings, and specifications” (set to “Rarely”), raising the low-state probability of project delays and poor quality to 73.3% and 84.9%, while leaving cost overrun marginally below its 57.4% baseline at 56.9%. T1 achieved the highest poor-quality improvement among all eight selected scenarios, exceeding both T3 and D2, indicating that jointly addressing design completeness and contractor financial stability has a particularly strong influence on construction quality. However, its comparatively modest cost-overrun improvement, relative to T3’s 82.6%, suggests that maximizing improvement in a single outcome may come at the expense of the others, whereas T3’s more balanced profile achieves substantial gains across all three outcomes simultaneously.
6.5. Validation
Whereas the network was parameterized and the sensitivity and scenario analyses conducted in Netica 6.0.4 [71], the validation reported in this section was carried out in GeNIe [74], whose validation module produces the cross-validated confusion matrices and receiver operating characteristic curves reported below. The BBN model was subsequently validated through three complementary approaches: testing the structural links using Spearman’s rho, assessing predictive accuracy through cross-validation, and examining structural and behavioural credibility through expert-based validation.
The structure of the model, comprising a total of 19 links, was validated by testing each link against the survey data using Spearman’s correlation. The resulting rho values ranged from 0.49 to 0.87 across all 19 links (), indicating moderate to strong positive correlation between the modelled relationships and the empirical survey responses [75].
Predictive performance was assessed by stratified five-fold cross-validation because it allows the per-state classification measures reported below to be estimated on test folds of non-trivial size, given the comparatively small sample [76]. At each iteration the conditional probability tables were estimated from the training folds alone, and each held-out case was then assigned to the state receiving the highest posterior probability. Accuracy is accordingly defined as the proportion of held-out cases whose highest-posterior state equals the observed state. Precision, recall and F1 are computed per state in the conventional one-versus-rest form; balanced accuracy is the unweighted mean of the three state-level recall values, and is reported in preference to overall accuracy because the query-node distributions are skewed towards the favourable state. The area under the receiver operating characteristic curve (AUC) is likewise computed one-versus-rest for each state, so that all three states of every query node are covered rather than the favourable state alone.
Table 12 reports these measures for the three query nodes. Overall accuracy is 72.86% for cost overrun, 78.57% for project delays and 93.33% for poor quality, against no-information rates—the accuracy obtainable by always predicting the most frequent state—of 56.19%, 52.86% and 75.24% respectively. Balanced accuracy, which weights the three states equally, is 71.20%, 69.83% and 79.75%, so the advantage over the majority-state baseline is retained when the three states are weighted equally rather than resting on the favourable state alone. Recall nonetheless declines with state rarity, from 83.05–100% for the favourable state to 51.28–75.00% for the High state, which follows from assigning each case to its highest-posterior state when the prior distribution is skewed. Because the states are ordinal, the distance of a misclassification is also informative: 98.57%, 96.67% and 98.10% of held-out cases were assigned either to the observed state or to the state immediately adjacent to it, with mean absolute errors of 0.286, 0.248 and 0.086 states. Quadratic-weighted Cohen’s , which penalizes misclassification by squared distance on the ordinal scale, is 0.625, 0.710 and 0.778. For external context, error rates reported in comparable Bayesian network applications in construction and related safety and risk domains range from 15% to 29% [66,77,78,79].
Table 12.
Classification performance of the three query nodes under five-fold cross-validation ().
The cross-validated confusion matrices from which these measures are derived are shown in Figure 4, and the corresponding receiver operating characteristic curves in Figure 5. The area under the curve (AUC) values for all states of the target nodes fall within 0.759 to 0.845. According to Jitwasinkul et al. [77], AUC values between 0.7 and 0.9 indicate acceptable to good discriminative ability, suggesting that the model reliably distinguishes between favourable and unfavourable performance outcomes. Discrimination and the decision rule are separate properties. The network orders cases by risk substantially better than chance for every state, and under the maximum-posterior assignment rule it also recovers the majority of severe cases: recall for the High state is 75.00%, 51.28% and 63.64% for cost overrun, project delays and poor quality respectively. Predictions of an elevated state are highly dependable: of the cases assigned to Medium or High, 57 of 77, 68 of 70 and 38 of 38 were genuinely in an elevated state, against base rates of 43.8%, 47.1% and 24.8%. The residual weakness lies at the boundary between the Low and Medium states rather than in the identification of severe cases: two-state misassignments, in which a Low case is assigned to High or the reverse, account for 1.43%, 3.33% and 1.90% of held-out cases. The full count matrices are reported in Table A1.
Figure 4.
Cross-validated confusion matrices for the three query nodes. Rows give the observed state and columns the state receiving the highest posterior probability. The colour intensity of each cell is proportional to the number of cases it contains, and the leading diagonal gives the correctly classified cases.
Figure 5.
Receiver operating characteristic curves for the three query nodes.
The confusion matrices locate the residual error rather than leaving it unattributed. Of the 116 misclassified cases across the three query nodes, 88 (75.9%) fall between the Low and Medium states, 14 (12.1%) between Medium and High, and 14 (12.1%) span two states. The error is therefore predominantly a boundary effect: the three-state discretization places cut-points within a five-point ordinal scale, so cases lying close to a cut-point may be assigned to an adjacent state by small differences in reported severity. The discretization sensitivity analysis reported in Section 6.2 indicates that factor rankings are stable under alternative cut-points, but the assignment of individual cases near a boundary remains sensitive to them. Four further factors contribute, though the present design does not permit their separate quantification. First, the query-node distributions are skewed towards the favourable state, so the less frequent states are represented by comparatively few cases in each test fold, and recall declines with state rarity accordingly. Second, the network is parameterized from perceptual survey responses rather than recorded project outcomes, so respondent subjectivity enters both the predictors and the targets. Third, with 210 responses distributed across conditional probability tables containing up to 27 parent configurations, some configurations are supported by few observations, which limits the precision of the estimated parameters. Finally, project-specific determinants outside the modelled factor set, such as site conditions, procurement route and contractor-specific capability, are not represented in the network, and their variation is absorbed into the residual error.
In addition to these quantitative measures, the expert-based validation method proposed by Pitchforth et al. [80] was applied to assess the structural and behavioural validity of the BBN model, ensuring that its outputs remained consistent with practitioner judgement. Semi-structured interviews were conducted with four experts who had previously participated in the focus group discussion described in Section 5.1. These experts were selected to represent clients, consultants, contractors, and subcontractors, and each possessed over twenty years of experience in the construction industry. The use of a smaller panel of four experts was deemed appropriate given the time-consuming nature of eliciting expert knowledge [80,81,82].
Each semi-structured interview consisted of two sections. The first section clarified the objective of the interview and reviewed the research aims and factors discussed in the earlier focus group session. The second section focused on assessing the acceptability of the relationships identified among the factors, and on discussing the results of the scenario analyses in terms of their acceptability and feasibility. Notably, only acceptability was assessed for the causal relationships, whereas both acceptability and feasibility were assessed for the proposed strategies, since it was necessary to determine not only whether each strategy was logically sound but also whether it could be practically implemented. Each interview lasted approximately 30 min on average. At the end of the interviews, all four interviewees agreed on the validity of the model’s causal links and scenario results. However, one interviewee expressed reservations about the feasibility of the proposed strategy for addressing material price fluctuations’ impact on construction projects.
7. Discussion
7.1. Comparison of Critical Factors with Existing Literature
The sensitivity analysis results reveal that the dominant drivers of PHCPM performance vary by outcome type. Material price fluctuations and delays in schedule are the primary drivers of cost overrun, together accounting for approximately 85% of the cumulative variance explained (Table 7). Client’s inappropriate construction timeline, delays in schedule, and contractor financial difficulty dominate project delays, accounting for over 90% of cumulative variance (Table 8). Delay in schedule, incomplete design documentation, and client-initiated scope changes are the leading contributors to poor quality, together explaining nearly 94% of the cumulative variance (Table 9).
These findings are broadly consistent with prior studies conducted in other developing-country contexts. The prominence of material price volatility as the leading cost driver echoes findings from the Gaza Strip [30], while the centrality of schedule delays as a cross-cutting driver of all three performance outcomes mirrors patterns reported in Ghana [2] and Nigeria [34]. However, the relative dominance of material price fluctuations in the present study—explaining over 62% of the variance in cost overrun alone—is notably higher than comparable single-factor effects reported elsewhere. This likely reflects Myanmar’s particular macroeconomic volatility during the study period, including currency depreciation and import disruptions associated with ongoing political and economic instability [10], which is less pronounced in the relatively more stable economies (e.g., Malaysia, Jordan) represented in much of the existing literature. This suggests that while the general categories of risk (financial, schedule, and quality-related factors) are broadly transferable across developing-country contexts, their relative weighting is highly sensitive to the specific macroeconomic and political conditions of the country under study, reinforcing the value of context-specific diagnostic tools such as the one developed here, rather than the direct transplantation of risk rankings from other national contexts.
7.2. The Value of Multi-Factor Conditional Scenarios
A central finding of this study is that combined, multi-factor scenarios are associated with substantially larger shifts in outcome probability than isolated single-factor scenarios. The most informative single-factor scenario (S2, conditioning on material price fluctuations alone) improved the low-state probability of cost overrun from 57.4% to 80.2%, yet left project delays and poor quality comparatively unimproved. By contrast, the top-ranked three-factor scenario (T3) achieved balanced improvements of similar or greater magnitude across all three performance dimensions simultaneously.
This finding empirically substantiates the core critique motivating this study’s methodological design: that single-technique, single-factor approaches to construction risk management, including many of the artificial neural network, fuzzy logic, and regression-based models reviewed in Section 1, risk overstating the apparent effectiveness of isolated single-factor changes by failing to capture how disruptions compound one another. The interaction visible between D2 (Material price fluctuations and Client’s inappropriate construction timeline) and T3 is particularly instructive: D2 achieved a poor-quality improvement identical to T3’s while conditioning on only two factors, suggesting that not all additional factors contribute equally to a scenario’s overall effectiveness, and that some two-factor combinations may offer more efficient returns than three-factor combinations for specific performance dimensions. This pattern would be invisible to any modelling approach that evaluates risk factors independently rather than through combinatorial scenario simulation, underscoring the practical value of the BBN’s capacity for joint probabilistic inference.
7.3. Methodological Contributions
Methodologically, this study demonstrates that the integration of RII, TISM, and BBN offers a coherent solution to a problem common across construction management research in data-scarce settings: the trade-off between structural interpretability (favoured by qualitative techniques such as ISM) [61] and quantitative inferential power (favoured by data-driven techniques such as BBN) [67]. By using TISM’s expert-elicited causal structure to constrain and inform BBN parameterization [24], this study avoids the overfitting risk associated with purely data-driven structure learning on small samples [82], while retaining the capacity for probabilistic scenario simulation that purely qualitative structural models (such as standalone ISM) cannot provide.
7.4. Managerial and Policy Implications
The results carry several practical implications for stakeholders involved in PHCPM delivery. For contractors, the dominance of material price fluctuations as a cost driver suggests that proactive procurement strategies, such as bulk pre-purchasing or fixed-price supply agreements negotiated ahead of anticipated price escalation, may offer disproportionate returns relative to their implementation cost, though such strategies must be weighed against the short-term liquidity strain they can impose on financially constrained contractors (Link b, Table 6). For clients, particularly the Department of Urban and Housing Development, the consistent appearance of “Client’s inappropriate construction timeline” among the top drivers of both project delays and, indirectly, poor quality (Link f, Table 6) points to a concrete, low-cost management priority: aligning contractual timelines more realistically with contractor capacity and avoiding scheduling practices that concentrate construction activity within adverse seasonal windows. For policymakers, although delayed authority approval was not among the most sensitive factors in the current model, its role as a contributing factor to Client’s inappropriate construction timeline (Link c, Table 6) suggests that streamlining administrative approval processes could yield indirect downstream benefits across multiple performance dimensions, even where its direct sensitivity contribution appears modest.
More broadly, the framework developed in this study is intended to function as a diagnostic tool rather than a one-time analytical exercise. Agencies overseeing public housing delivery could, in principle, re-parameterize the BBN model using project-specific or updated survey data to generate a tailored risk diagnosis prior to groundbreaking, or periodically during project execution as new information becomes available, allowing management priorities to be revisited as conditions evolve.
It is worth noting that cross-validation, while providing a genuinely out-of-sample prediction for every case, evaluates the model within the same 210-respondent sample used for its own construction, and is therefore not equivalent to blind testing on independent, previously unseen projects. Reserving a separate external validation sample was not feasible within the scope of this study, given the constraints of accessing additional documented public housing projects in the Myanmar context described in Section 1. We note this as a limitation of the present validation and recommend that future applications of this framework incorporate prospective validation on an independently collected sample of projects as such data becomes available.
8. Conclusions
This study developed an integrated RII-TISM-BBN decision-support framework to diagnose and address the performance of PHCPM in Myanmar, a context characterized by extreme data scarcity, political instability, and economic volatility. The framework addresses a key limitation of conventional data-driven risk models: their inapplicability in environments where historical project data is fragmented, unreliable, or entirely absent.
The RII screening reduced an initial pool of 51 candidate factors to the thirteen meeting the threshold, of which the ten highest-ranked were carried forward. That selection does not depend on the composition of the sample: recomputing the index so that each stakeholder group contributes equally selects the same ten factors. These were structured into a causal hierarchy using TISM through focus group discussion with eight domain experts, and the resulting structure was parameterized into a BBN from the survey responses, enabling probabilistic inference under uncertainty without reliance on historical databases.
The model was validated in four ways, reported in Section 6.5. Five-fold cross-validation gave accuracies of 93.3%, 72.9% and 78.6% for poor quality, cost overrun and project delays, against no-information rates of 75.2%, 56.2% and 52.9%; balanced accuracy confirms that the advantage over the majority-state baseline does not rest on the favourable state alone. Discriminative ability spans the acceptable and good bands, the TISM links are corroborated by rank correlation, and expert-based structural validation supports the network’s behaviour. Misclassification is almost always to an adjacent state, so the ordinal ranking remains informative where the exact state is missed, but recall is lower for the rarer states and a minority of at-risk projects will not be flagged. The network is accordingly best used to prioritize monitoring effort and as an early-warning instrument rather than as a decision rule.
Exhaustive single-, dual- and triple-node simulation identified eight conditional scenarios whose combined effect across the three outcomes exceeded the baseline, reported in Table 10. Setting a finding node computes the posterior distribution of the query nodes conditional on that evidence, which is equivalent to an intervention only under conditions this study does not claim to have established; the scenarios reported in Section 6.4 are therefore conditional what-if scenarios rather than demonstrated causal effects, and the associated recommendations are framed as priorities for monitoring and preventive management.
This study makes three principal contributions: an integrated, replicable methodology suited to data-scarce and volatile developing-country contexts; empirical evidence that project performance is interaction-driven rather than attributable to factors in isolation, conditioning jointly on three factors shifting the outcome profile substantially more than any single factor does (Table 10); and a practical diagnostic tool that stakeholders can apply to prioritize management attention, as outlined in Section 7.4.
The study has limitations. The TISM structure was derived from a single expert panel of eight participants, which, although consistent with sample sizes used in comparable ISM/TISM studies, may not capture the diversity of perspectives across Myanmar’s broader construction industry. The BBN was parameterized from cross-sectional survey data rather than longitudinal project records, limiting its ability to capture how factor relationships may evolve over a project’s lifecycle. Because the TISM structure and the parameterizing survey are drawn from the same professional domain, the model is better suited to validating predictive performance within this population than to establishing structural generalizability beyond a shared industry narrative. Three factors that met the threshold were not carried forward to the structural and probabilistic modelling phases, the selection having been limited to ten factors by the number of pairwise interpretive judgements a single panel session can sustain, and the margin at the cut is narrow. Responses were gathered over a fourteen-month period under changing political and economic conditions, which reflects the operating environment the study examines rather than a feature of the sampling design. Finally, this study focused exclusively on public housing construction in Myanmar; the generalizability of the specific factor rankings and scenario outcomes to other developing-country contexts or other categories of public infrastructure remains to be tested.
Future research could extend this framework in several directions. Longitudinal data collection would allow the model to be updated dynamically as project conditions evolve, enhancing its utility as a real-time monitoring tool rather than a static diagnostic instrument. Comparative studies applying the same framework across multiple developing-country contexts would help establish the extent to which the identified critical factors and management strategies generalize beyond Myanmar. Finally, future studies could explore hybrid approaches that combine expert elicitation with emerging techniques such as synthetic data generation, as a means of further mitigating the effects of data scarcity in construction risk modelling.
Supplementary Materials
The following supporting information can be downloaded at: https://www.mdpi.com/article/10.3390/buildings16204139/s1, File S1: Questionnaire survey on the factors influencing public housing construction projects in Myanmar.
Author Contributions
Conceptualization, S.S.N.; methodology, S.S.N.; investigation, K.P.; resources, K.P.; data curation, S.S.N.; writing—original draft preparation, S.S.N.; writing—review and editing, K.P.; supervision, K.P. All authors have read and agreed to the published version of the manuscript.
Funding
This research was supported by Thammasat Postdoctoral Fellowship Grant TUPD 15/2567.
Institutional Review Board Statement
In the context of this study, conducted in a setting where formal ethics approval for survey-based research is not required, all necessary ethical considerations were followed.
Informed Consent Statement
Participation in the study was voluntary, and informed consent was obtained from all participants.
Data Availability Statement
The data presented in this study are available on request from the corresponding author. The data are not publicly available due to confidentiality agreements with survey and interview participants.
Conflicts of Interest
The authors declare no conflicts of interest.
Appendix A
Table A1.
Cross-validated confusion matrices for the three query nodes. Rows give the observed state and columns the state receiving the highest posterior probability.
Table A2.
Mutual information between each factor node and the query nodes under three discretization schemes, with the cut points selected by the supervised entropy-minimizing (MDL) procedure. For the five factors marked † the MDL procedure recovers the uniform cut points of 2.5 and 3.5 exactly, which is why the first and third columns coincide for those rows.
Table A3.
Relative Importance Index for all 51 candidate performance factors (–210). The pooled index weights every respondent equally; the equal-weighted index computes the index separately within each of the four stakeholder groups and averages the four values with equal weight, so that no group’s share of the sample influences the result.
References
- United Nations. Transforming our World: The 2030 Agenda for Sustainable Development; United Nations: New York, NY, USA, 2015. [Google Scholar]
- Amoatey, C.T.; Ameyaw, Y.A.; Adaku, E.; Famiyeh, S. Analysing Delay Causes and Effects in Ghanaian State Housing Construction Projects. Int. J. Manag. Proj. Bus. 2015, 8, 198–214. [Google Scholar] [CrossRef] [Scilit]
- Chadee, A.A.; Martin, H.H.; Mwasha, A.; Otuloge, F. Rationalizing Critical Cost Overrun Factors on Public Sector Housing Programmes. Emerg. Sci. J. 2022, 6, 647–666. [Google Scholar] [CrossRef] [Scilit]
- Jiboye, A.D. Evaluating public housing performance: Providing a basis for residential quality improvement in Nigeria. Middle-East J. Sci. Res. 2011, 9, 225–232. [Google Scholar]
- Hashim, A.E.; Samikon, S.A.; Nasir, N.M.; Ismail, N. Assessing factors influencing performance of Malaysian low-cost public housing in sustainable environment. Procedia-Soc. Behav. Sci. 2012, 50, 920–927. [Google Scholar] [CrossRef] [Scilit]
- Hwang, B.G.; Zhao, X.; Ng, S.Y. Identifying the critical factors affecting schedule performance of public housing projects. Habitat Int. 2013, 38, 214–221. [Google Scholar] [CrossRef] [Scilit]
- Nwal, S.S.; Panuwatwanich, K.; Naing, M. Critical Factors Influencing the Performance of Public Housing Construction Projects in Myanmar. J. Constr. Dev. Ctries. 2024, 29, 163–190. [Google Scholar] [CrossRef] [Scilit]
- DUHD; UN-Habitat. National Housing Policy White Paper; Technical Report; UN-Habitat: Nairobi, Kenya, 2018. [Google Scholar]
- JICA. Myanmar Data Collection Survey on Housing Finance System Report; Survey Report; JICA: Tokyo, Japan, 2018. [Google Scholar]
- Bissinger, J. Challenges and Priorities for Myanmar’s Conflicted Economy; Technical Report; ISEAS: Singapore, 2025. [Google Scholar]
- McGuickin, G. “Housing Now” Responds to Myanmar’s Housing Crisis with Prefabricated Bamboo Homes; Archello: Amsterdam, The Netherlands, 2023. [Google Scholar]
- Sarhan, J.G.; Xia, B.; Fawzia, S.; Karim, A.; Olanipekun, A.O.; Coffey, V. Framework for the Implementation of Lean Construction Strategies Using the Interpretive Structural Modelling (ISM) Technique: A Case of the Saudi Construction Industry. Eng. Constr. Archit. Manag. 2019, 27, 1–23. [Google Scholar] [CrossRef] [Scilit]
- Rhoads, E.; Poine, T.S.; Win, C.C.; Kyed, H. Myanmar—Urban Housing Diagnostic and COVID-19 Rapid Assessment; Technical Report; World Bank Group: Washington, DC, USA, 2020. [Google Scholar]
- The World Bank. The World Bank Continues to Produce In-Depth Analytical Work Across a Wide Range of Topics and Provide Direct Support to the Poor and Vulnerable; The World Bank: Washington, DC, USA, 2024. [Google Scholar]
- Atapattu, C.N.; Domingo, N.; Sutrisna, M. A Bibliometric Review of the Statistical Modelling Techniques for Cost Estimation of Infrastructure Projects. Smart Sustain. Built Environ. 2025, 14, 1369–1388. [Google Scholar] [CrossRef] [Scilit]
- Kaushik, A.K.; Islam, R.; ElBahy, S.; Arif, M.; Arsalan, H.; AlHorr, Y.; Obi, L.; Rana, M.Q. Artificial neural network application in construction and the built environment: A bibliometric analysis. Buildings 2024, 14, 2423. [Google Scholar] [CrossRef] [Scilit]
- Obi, L.I.; Arif, M.; Lamb, S.M.; Ashayeri, I. Establishing Interrelationships and Dependencies of Critical Success Factors for Implementing Offsite Construction in the UK. Smart Sustain. Built Environ. 2025, 14, 810–834. [Google Scholar] [CrossRef] [Scilit]
- Fayek, A.R. Fuzzy logic and fuzzy hybrid techniques for construction engineering and management. J. Constr. Eng. Manag. 2020, 146, 04020064. [Google Scholar] [CrossRef] [Scilit]
- Qazi, A.; Simsekler, M.C.E. Risk assessment of construction projects using Monte Carlo simulation. Int. J. Manag. Proj. Bus. 2021, 14, 1202–1218. [Google Scholar] [CrossRef] [Scilit]
- Cheng, M.Y.; Cao, M.T.; Mendrofa, A.Y.J. Dynamic feature selection for accurately predicting construction productivity using symbiotic organisms search-optimized least square support vector machine. J. Build. Eng. 2021, 35, 101973. [Google Scholar] [CrossRef] [Scilit]
- Erdis, E.; Un, B.; Genc, O. Development of an analytical framework for AEC dispute cost analysis with hybrid feature selection and machine learning. J. Asian Archit. Build. Eng. 2026, 1–24. [Google Scholar] [CrossRef] [Scilit]
- Genc, O. Identifying Principal Risk Factors in Turkish Construction Sector according to Their Probability of Occurrences: A Relative Importance Index (RII) and Exploratory Factor Analysis (EFA) Approach. Int. J. Constr. Manag. 2021, 23, 979–987. [Google Scholar] [CrossRef] [Scilit]
- Ibrahim, A.; Abdelkhalek, S.; Zayed, T.; Meshref, A.N. Assessment of Lean Construction Practices in Developing Countries Using Fuzzy Relative Importance Index. Eng. Manag. J. 2025, 1–21. [Google Scholar] [CrossRef] [Scilit]
- Wang, P.; Wang, K.; Huang, Y.; Fenn, P.; Stewart, I. Auditing Construction Cost from an In-Process Perspective Based on a Bayesian Predictive Model. J. Constr. Eng. Manag. 2022, 148, 04022003. [Google Scholar] [CrossRef] [Scilit]
- Ataei, B.; Nazari, A. A Hybrid AI Framework for Engineering Risk Management under Data Scarcity and High Uncertainty. Int. J. Constr. Manag. 2026, 26, 3827–3845. [Google Scholar] [CrossRef] [Scilit]
- Nyein, T.S.; Hadikusumo, B.H.W. Factors influencing the adoption of public–private partnership in low-cost housing development in Myanmar. J. Financ. Manag. Prop. Constr. 2021, 26, 337–365. [Google Scholar] [CrossRef] [Scilit]
- Project Management Institute. A Guide to the Project Management Body of Knowledge (PMBOK Guide)—Seventh Edition and The Standard for Project Management; Project Management Institute: Newtown Square, PA, USA, 2021. [Google Scholar]
- Prell, C.; Hubacek, K.; Reed, M. Stakeholder Analysis and Social Network Analysis in Natural Resource Management. Soc. Nat. Resour. 2009, 22, 501–518. [Google Scholar] [CrossRef] [Scilit]
- Alzahrani, J.I.; Emsley, M.W. The impact of contractors’ attributes on construction project success: A post construction evaluation. Int. J. Proj. Manag. 2013, 31, 313–322. [Google Scholar] [CrossRef] [Scilit]
- Enshassi, A.; Al-Najjar, J.; Kumaraswamy, M. Delays and Cost Overruns in the Construction Projects in the Gaza Strip. J. Financ. Manag. Prop. Constr. 2009, 14, 126–151. [Google Scholar] [CrossRef] [Scilit]
- Assaf, S.A.; Al-Hejji, S. Causes of delay in large construction projects. Int. J. Proj. Manag. 2006, 24, 349–357. [Google Scholar] [CrossRef] [Scilit]
- Sweis, R.J.; Bisharat, S.M.; Bisharat, L.; Sweis, G.J. Factors Affecting Contractor Performance on Public Construction Projects. Life Sci. J. 2014, 11, 28–39. [Google Scholar]
- Toor, S.U.R.; Ogunlana, S.O. Problems causing delays in major construction projects in Thailand. Constr. Manag. Econ. 2008, 26, 395–408. [Google Scholar] [CrossRef] [Scilit]
- Aibinu, A.A.; Odeyinka, H.A. Construction delays and their causative factors in Nigeria. J. Constr. Eng. Manag. 2006, 132, 667–677. [Google Scholar] [CrossRef] [Scilit]
- Sambasivan, M.; Soon, Y.W. Causes and Effects of Delays in Malaysian Construction Industry. Int. J. Proj. Manag. 2007, 25, 517–526. [Google Scholar] [CrossRef] [Scilit]
- Vijayalaxmi, J.; Khan, U. Chapter 29—Assessment of factors affecting time and cost overruns in construction projects. In Risk, Reliability and Sustainable Remediation in the Field of Civil and Environmental Engineering; Roshni, T., Samui, P., Bui, D.T., Kim, D., Khatibi, R., Eds.; Elsevier: Amsterdam, The Netherlands, 2022; pp. 511–521. [Google Scholar] [CrossRef] [Scilit]
- Larsen, J.K.; Shen, G.Q.; Lindhard, S.M.; Brunoe, T.D. Factors Affecting Schedule Delay, Cost Overrun, and Quality Level in Public Construction Projects. J. Manag. Eng. 2016, 32, 04015032. [Google Scholar] [CrossRef] [Scilit]
- Enshassi, A.; Mohamed, S.; Abushaban, S. Factors Affecting the Performance of Construction Projects in the Gaza Strip. J. Civ. Eng. Manag. 2009, 15, 269–280. [Google Scholar] [CrossRef] [Scilit]
- Khodeir, L.M.; Mohamed, A.H.M. Identifying the Latest Risk Probabilities Affecting Construction Projects in Egypt According to Political and Economic Variables: From January 2011 to January 2013. HBRC J. 2015, 11, 129–135. [Google Scholar] [CrossRef] [Scilit]
- Nasir, D.; McCabe, B.; Hartono, L. Evaluating risk in construction schedule model: Construction schedule risk model. J. Constr. Eng. Manag. 2003, 129, 518–527. [Google Scholar] [CrossRef] [Scilit]
- Chileshe, N.; Yirenkyi-Fianko, A.B. An Evaluation of Risk Factors Impacting Construction Projects in Ghana. J. Eng. Des. Technol. 2012, 10, 306–329. [Google Scholar] [CrossRef] [Scilit]
- Amusan, L.M.; Afolabi, A.; Ojelabi, R.; Omuh, I.; Okagbue, H.I. Data Exploration on Factors That Influences Construction Cost and Time Performance on Construction Project Sites. Data Brief 2018, 17, 1320–1325. [Google Scholar] [CrossRef] [Scilit] [PubMed]
- Yu, T.; Man, Q.; Wang, Y.; Shen, G.Q.; Hong, J.; Zhang, J.; Zhong, J. Evaluating different stakeholder impacts on the occurrence of quality defects in offsite construction projects: A Bayesian-network-based model. J. Clean. Prod. 2019, 241, 118390. [Google Scholar] [CrossRef] [Scilit]
- Luu, V.T.; Kim, S.-Y.; Tuan, N.V.; Ogunlana, S.O. Quantifying schedule risk in construction projects using Bayesian belief networks. Int. J. Proj. Manag. 2009, 27, 39–50. [Google Scholar] [CrossRef] [Scilit]
- Alaghbari, W.; Salim, A.; Dola, K.; Abdullah Abang Ali, A. Housing Shortage for Low-Income in Yemen: Causes and Suggestions. Int. J. Hous. Mark. Anal. 2009, 2, 363–372. [Google Scholar] [CrossRef] [Scilit]
- Bingöl, B.N.; Polat, G. Measuring Managerial Capability of Subcontractors Using a KPI Model. Procedia Eng. 2017, 196, 68–75. [Google Scholar] [CrossRef] [Scilit]
- El-khalek, H.A.; Aziz, R.F.; Morgan, E.S. Identification of Construction Subcontractor Prequalification Evaluation Criteria and Their Impact on Project Success. Alex. Eng. J. 2019, 58, 217–223. [Google Scholar] [CrossRef] [Scilit]
- Lew, Y.L.; Hassim, S.; Muniandy, R.; Hua, L.T. Structural Equation Modelling for Subcontracting Practice: Malaysia Chapter. Eng. Constr. Archit. Manag. 2018, 25, 835–860. [Google Scholar] [CrossRef] [Scilit]
- Hatmoko, J.; Scott, S. Simulating the Impact of Supply Chain Management Practice on the Performance of Medium-Sized Building Projects. Constr. Manag. Econ. 2010, 28, 35–49. [Google Scholar] [CrossRef] [Scilit]
- Tam, V.W.Y.; Shen, L.Y.; Kong, J.S.Y. Impacts of Multi-Layer Chain Subcontracting on Project Management Performance. Int. J. Proj. Manag. 2011, 29, 108–116. [Google Scholar] [CrossRef] [Scilit]
- Eom, C.S.; Yun, S.H.; Paek, J.H. Subcontractor Evaluation and Management Framework for Strategic Partnering. J. Constr. Eng. Manag. 2008, 134, 842–851. [Google Scholar] [CrossRef] [Scilit]
- Jha, K.; Iyer, K. Critical Factors Affecting Quality Performance in Construction Projects. Total Qual. Manag. Bus. Excell. 2006, 17, 1155–1170. [Google Scholar] [CrossRef] [Scilit]
- Rachid, Z.; Toufik, B.; Mohammed, B. Causes of Schedule Delays in Construction Projects in Algeria. Int. J. Constr. Manag. 2019, 19, 371–381. [Google Scholar] [CrossRef] [Scilit]
- Gunduz, M.; Nielsen, Y.; Özdemir, M. Quantification of Delay Factors Using the Relative Importance Index Method for Construction Projects in Turkey. J. Manag. Eng. 2013, 29, 133–139. [Google Scholar] [CrossRef] [Scilit]
- Hossen, M.M.; Kang, S.; Kim, J. Construction Schedule Delay Risk Assessment by Using Combined AHP-RII Methodology for an International NPP Project. Nucl. Eng. Technol. 2015, 47, 362–379. [Google Scholar] [CrossRef] [Scilit]
- Gebrehiwet, T.; Luo, H. Analysis of Delay Impact on Construction Project Based on RII and Correlation Coefficient: Empirical Study. Procedia Eng. 2017, 196, 366–374. [Google Scholar] [CrossRef] [Scilit]
- Mohamed, M. Assessing Egyptian Construction Projects Performance Using Principal Component Analysis. Int. J. Product. Perform. Manag. 2018, 67, 1727–1744. [Google Scholar] [CrossRef] [Scilit]
- Takim, R.; Akintoye, A. Performance Indicators for Successful Construction Project Performance. In Proceedings of the 18th Annual ARCOM Conference; Greenwood, D., Ed.; Association of Researchers in Construction Management: Newcastle upon Tyne, UK, 2002; Volume 2, pp. 545–555. [Google Scholar]
- Hair, J.F. Multivariate Data Analysis; Pearson: London, UK, 2009. [Google Scholar]
- Azevedo, S.; Carvalho, H.; Cruz-Machado, V. Using Interpretive Structural Modelling to Identify and Rank Performance Measures: An Application in the Automotive Supply Chain. Balt. J. Manag. 2013, 8, 208–230. [Google Scholar] [CrossRef] [Scilit]
- Sushil Interpreting the Interpretive Structural Model. Glob. J. Flex. Syst. Manag. 2012, 13, 87–106. [CrossRef] [Scilit]
- Warfield, J.N. On Arranging Elements of a Hierarchy in Graphic Form. IEEE Trans. Syst. Man Cybern. 1973, SMC-3, 121–132. [Google Scholar] [CrossRef] [Scilit]
- Walley, P. Measures of uncertainty in expert systems. Artif. Intell. 1996, 83, 1–58. [Google Scholar] [CrossRef] [Scilit]
- Thirupathi, R.M.; Vinodh, S. Application of interpretive structural modelling and structural equation modelling for analysis of sustainable manufacturing factors in Indian automotive component sector. Int. J. Prod. Res. 2016, 54, 6661–6682. [Google Scholar] [CrossRef] [Scilit]
- Arabi, S.; Eshtehardian, E.; Shafiei, I. Using Bayesian Networks for Selecting Risk-Response Strategies in Construction Projects. J. Constr. Eng. Manag. 2022, 148, 04022067. [Google Scholar] [CrossRef] [Scilit]
- Mohammadfam, I.; Ghasemi, F.; Kalatpour, O.; Moghimbeigi, A. Constructing a Bayesian Network Model for Improving Safety Behavior of Employees at Workplaces. Appl. Ergon. 2017, 58, 35–47. [Google Scholar] [CrossRef] [Scilit] [PubMed]
- Zhang, C.; Hu, K.; Liu, X. Multi-Factor superposition influence analysis in engineering projects: A Bayesian network approach. J. Asian Archit. Build. Eng. 2026, 25, 3589–3605. [Google Scholar] [CrossRef] [Scilit]
- Conrady, S.; Jouffe, L. Bayesian Networks & BayesiaLab—A Practical Introduction for Researchers; Bayesia: Franklin, TN, USA, 2015. [Google Scholar]
- McCabe, B.; AbouRizk, S.M.; Goebel, R. Belief networks for construction performance diagnostics. J. Comput. Civ. Eng. 1998, 12, 93–100. [Google Scholar] [CrossRef] [Scilit]
- Wipulanusat, W.; Panuwatwanich, K.; Stewart, R.A.; Arnold, S.L.; Wang, J. Bayesian network revealing pathways to workplace innovation and career satisfaction in the public service. J. Manag. Anal. 2020, 7, 253–280. [Google Scholar] [CrossRef] [Scilit]
- Norsys Software Corp. Netica-J Manual Version 4.18 and Higher; Norsys Software Corp.: Vancouver, BC, Canada, 2010. [Google Scholar]
- Osama, M.; Sherif, A.; Badawy, M. Risk Analysis of Construction of Administration Projects Using Bayesian Networks. J. Eng. Des. Technol. 2023, 21, 281–298. [Google Scholar] [CrossRef] [Scilit]
- Laskey, K.B. Sensitivity Analysis for Probability Assessments in Bayesian Networks. IEEE Trans. Syst. Man Cybern. 1995, 25, 901–909. [Google Scholar] [CrossRef] [Scilit]
- BayesFusion, LLC. GeNIe User’s Manual (Version 5.0.R2); BayesFusion, LLC: Pittsburgh, PA, USA, 2024. [Google Scholar]
- Xiao, C.; Ye, J.; Esteves, R.M.; Rong, C. Using Spearman’s correlation coefficients for exploratory data analysis on big dataset. Concurr. Comput. Pract. Exp. 2016, 28, 3866–3878. [Google Scholar] [CrossRef] [Scilit]
- Vabalas, A.; Gowen, E.; Poliakoff, E.; Casson, A.J. Machine Learning Algorithm Validation with a Limited Sample Size. PLoS ONE 2019, 14, e0224365. [Google Scholar] [CrossRef] [Scilit] [PubMed]
- Jitwasinkul, B.; Hadikusumo, B.H.W.; Memon, A.Q. A Bayesian Belief Network Model of Organizational Factors for Improving Safe Work Behaviors in Thai Construction Industry. Saf. Sci. 2016, 82, 264–273. [Google Scholar] [CrossRef] [Scilit]
- Zhou, Q.; Fang, D.; Wang, X. A Method to Identify Strategies for the Improvement of Human Safety Behavior by Considering Safety Climate and Personal Experience. Saf. Sci. 2008, 46, 1406–1419. [Google Scholar] [CrossRef] [Scilit]
- Howes, A.L.; Maron, M.; McAlpine, C.A. Bayesian Networks and Adaptive Management of Wildlife Habitat. Conserv. Biol. 2010, 24, 974–983. [Google Scholar] [CrossRef] [Scilit] [PubMed]
- Pitchforth, J.; Wu, P.; Mengersen, K. Applying a Validation Framework to a Working Airport Terminal Model. Expert Syst. Appl. 2014, 41, 4388–4400. [Google Scholar] [CrossRef] [Scilit]
- Kleemann, J.; Celio, E.; Fürst, C. Validation Approaches of an Expert-Based Bayesian Belief Network in Northern Ghana, West Africa. Ecol. Model. 2017, 365, 10–29. [Google Scholar] [CrossRef] [Scilit]
- Khodabakhshian, A.; Re Cecconi, F.; Lopez Droguett, E. Probabilistic Risk Identification and Assessment Model for Construction Projects Using Elicitation-Based Bayesian Network. J. Inf. Technol. Constr. (ITcon) 2025, 30, 185–212. [Google Scholar] [CrossRef] [Scilit]
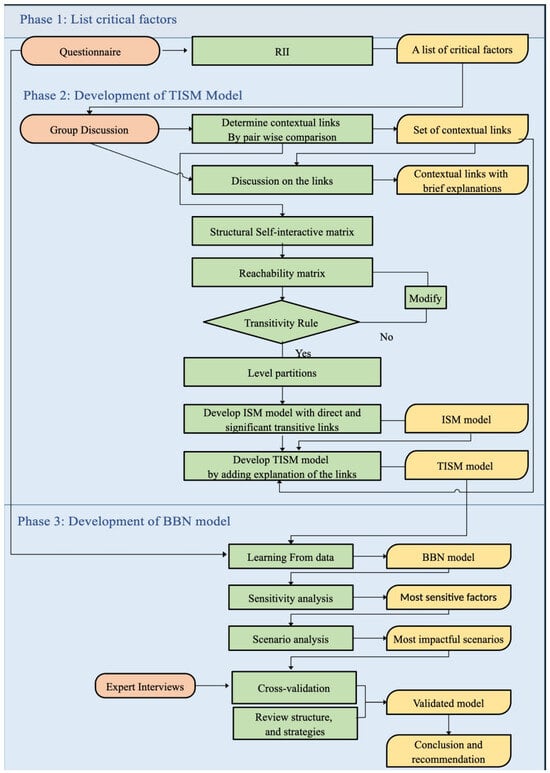
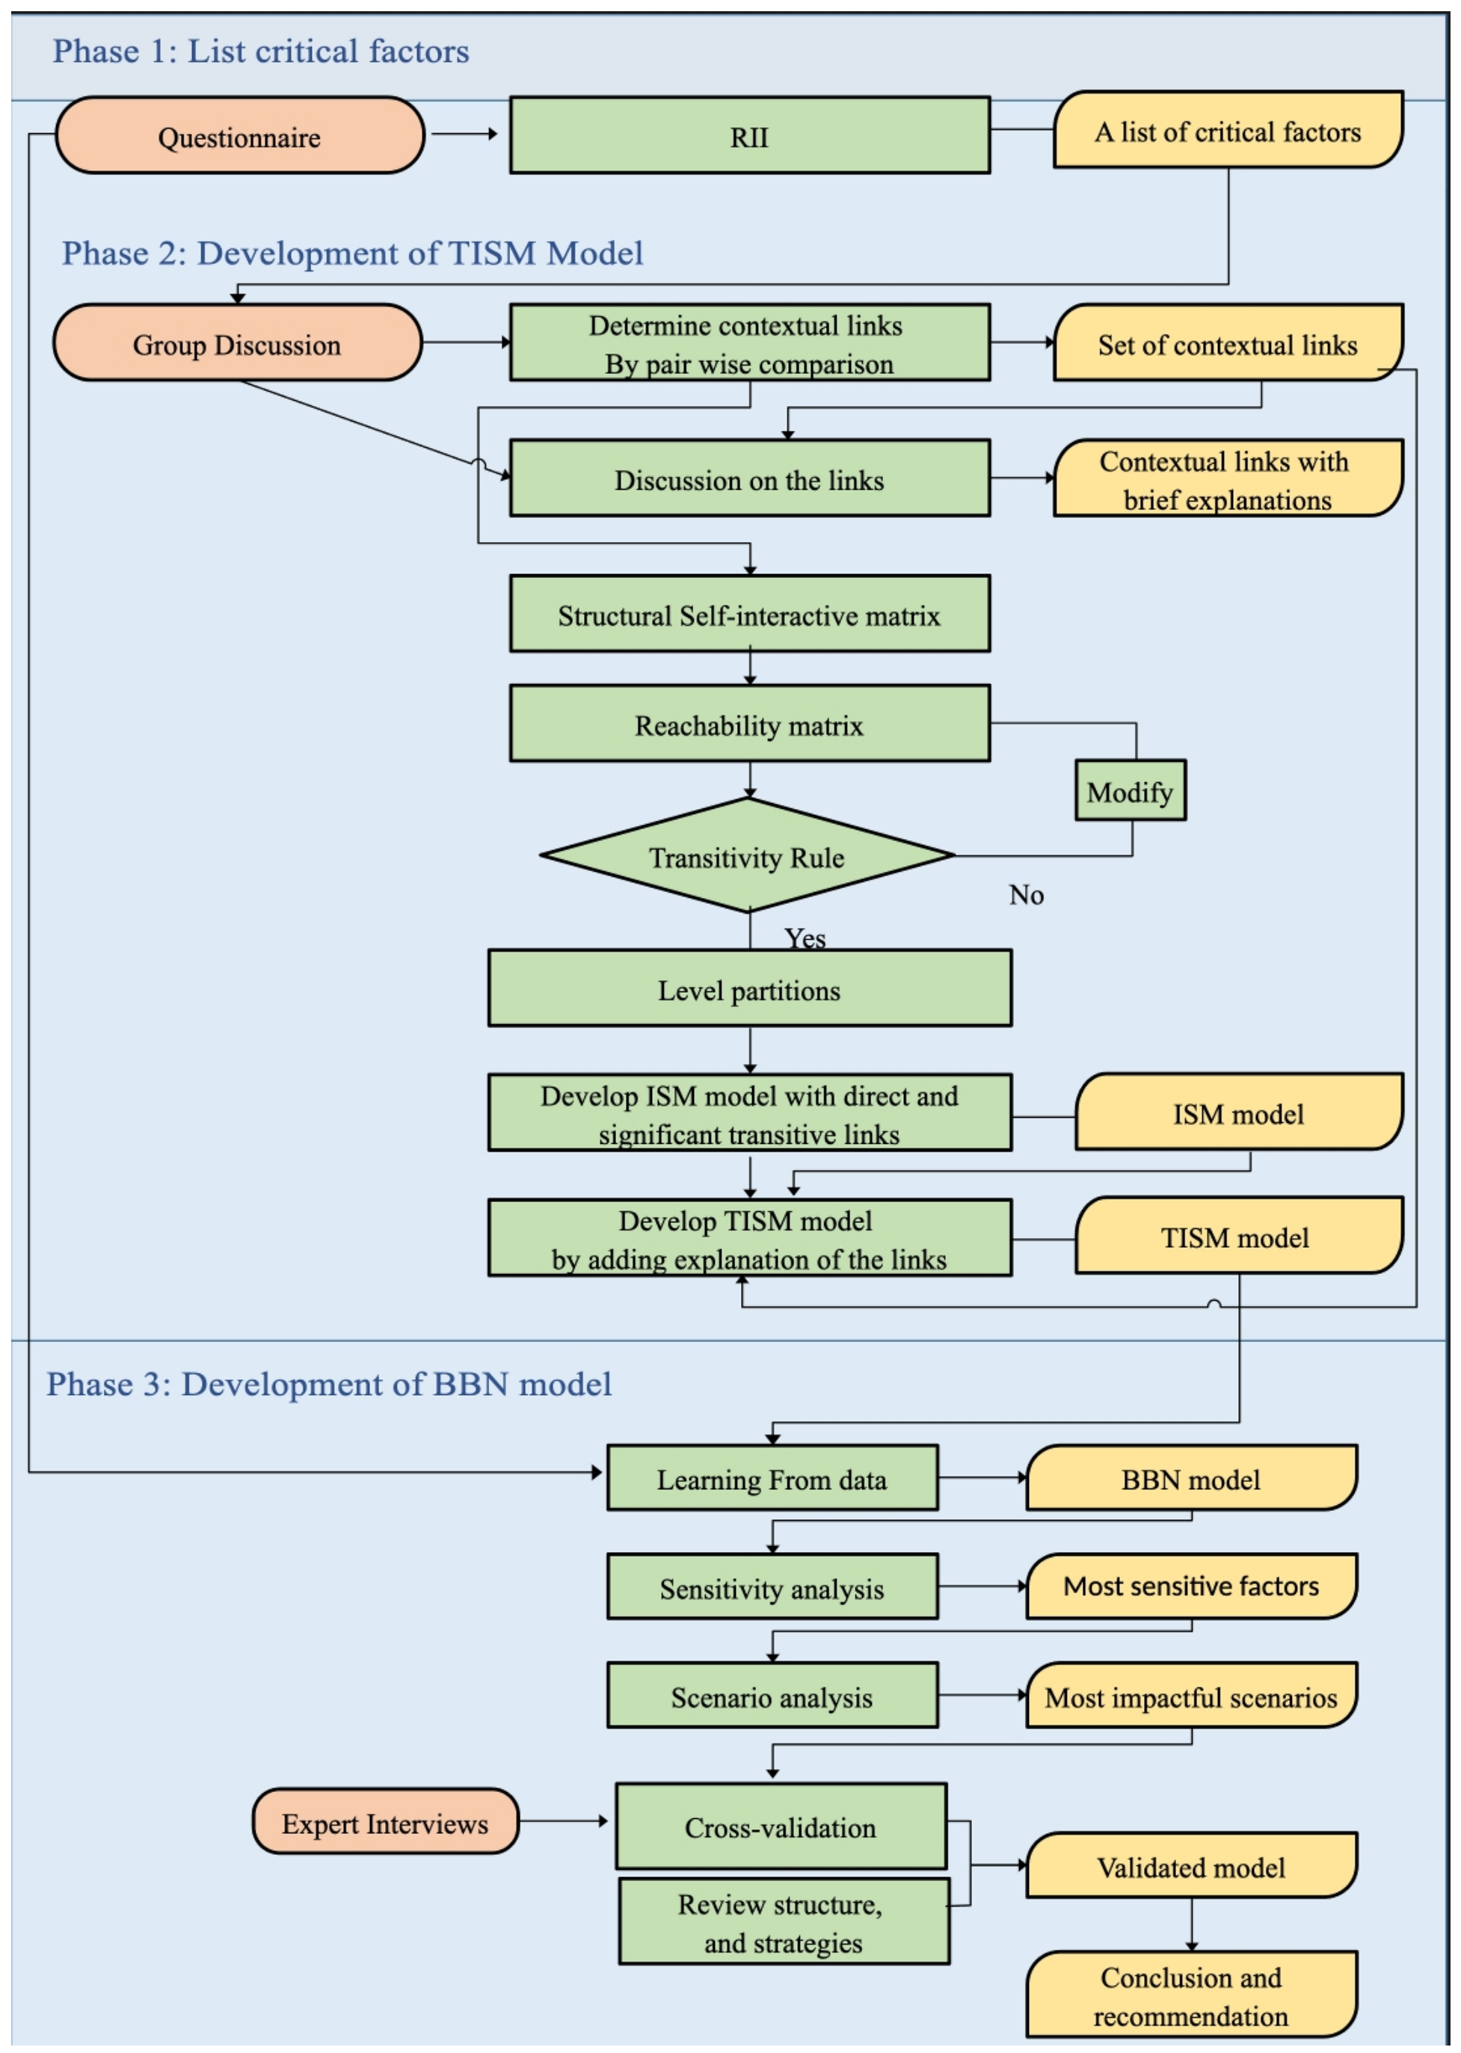
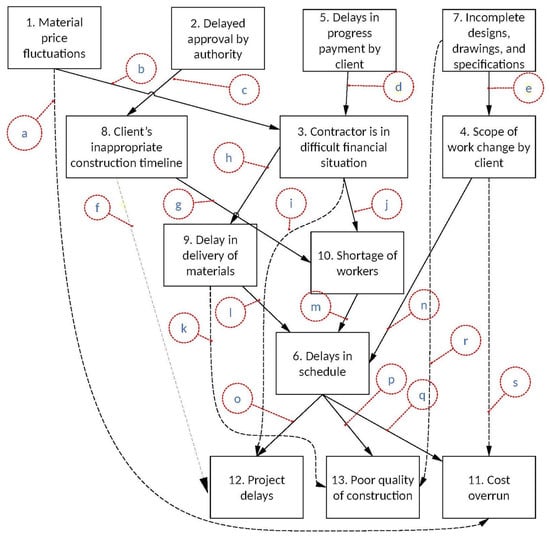
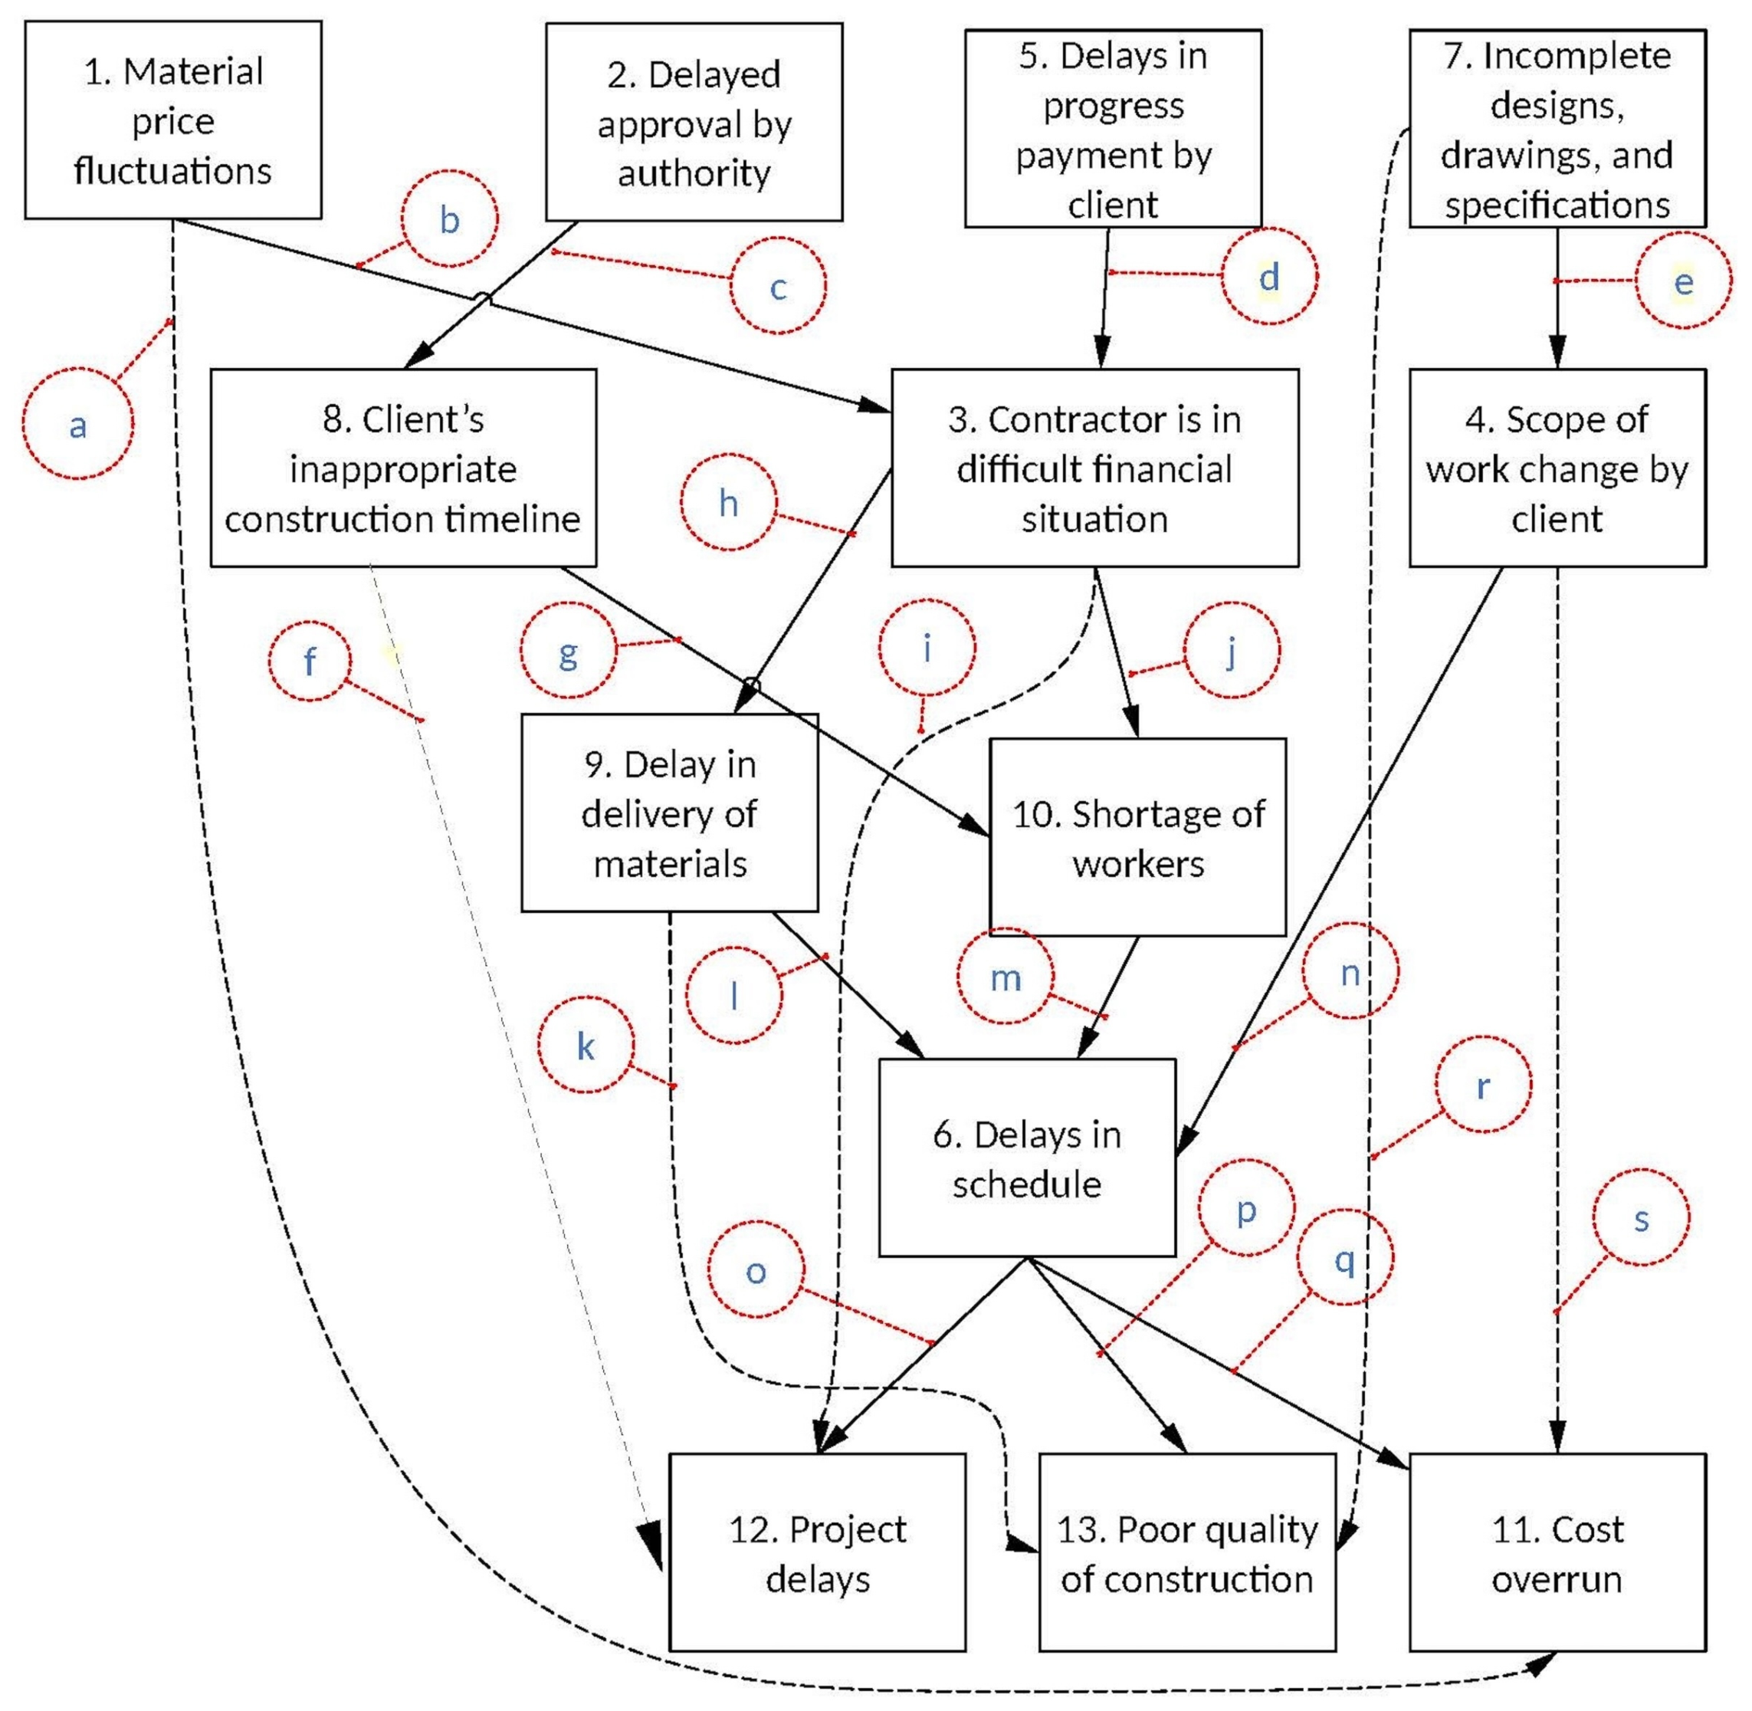
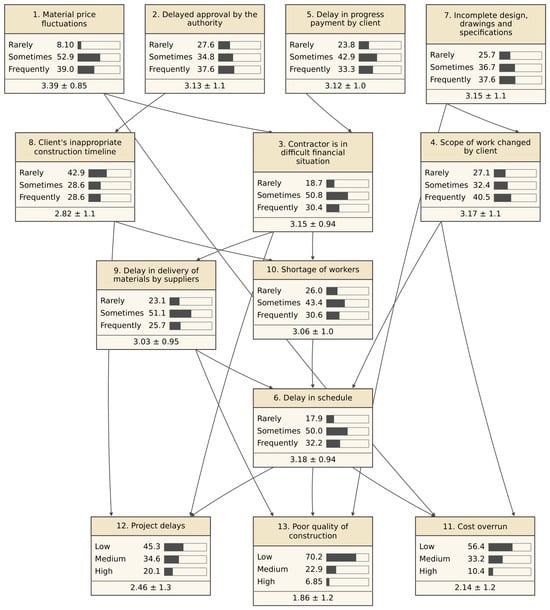
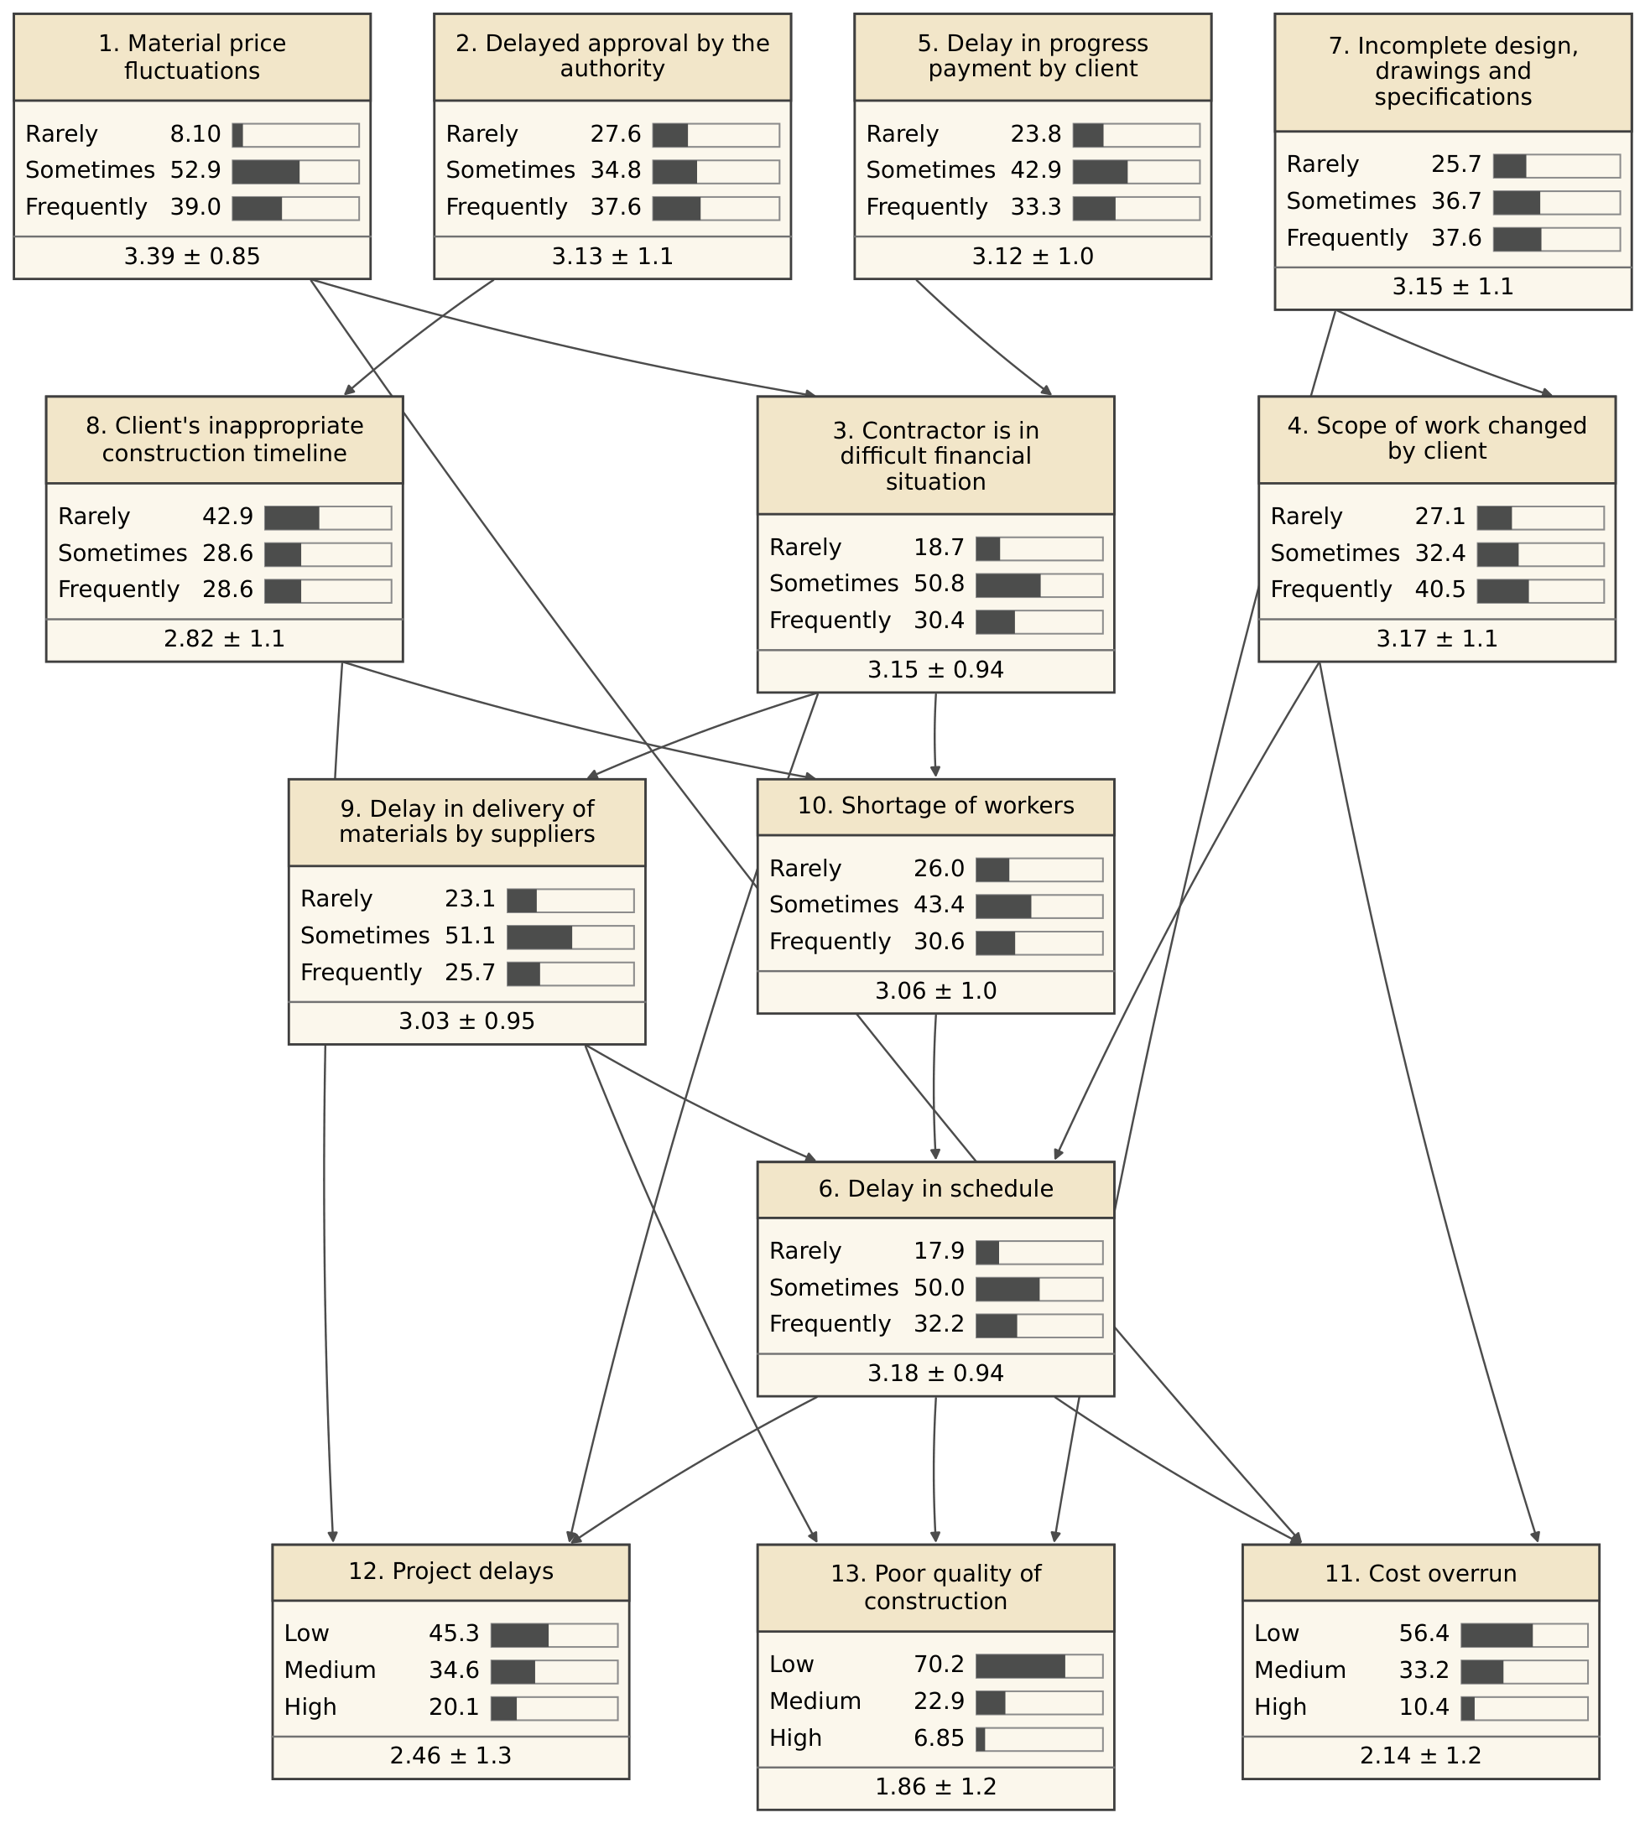
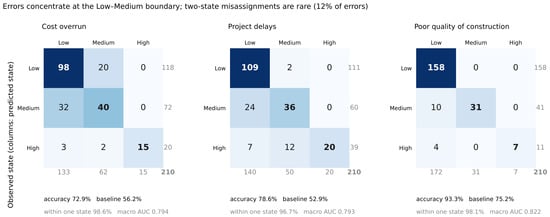
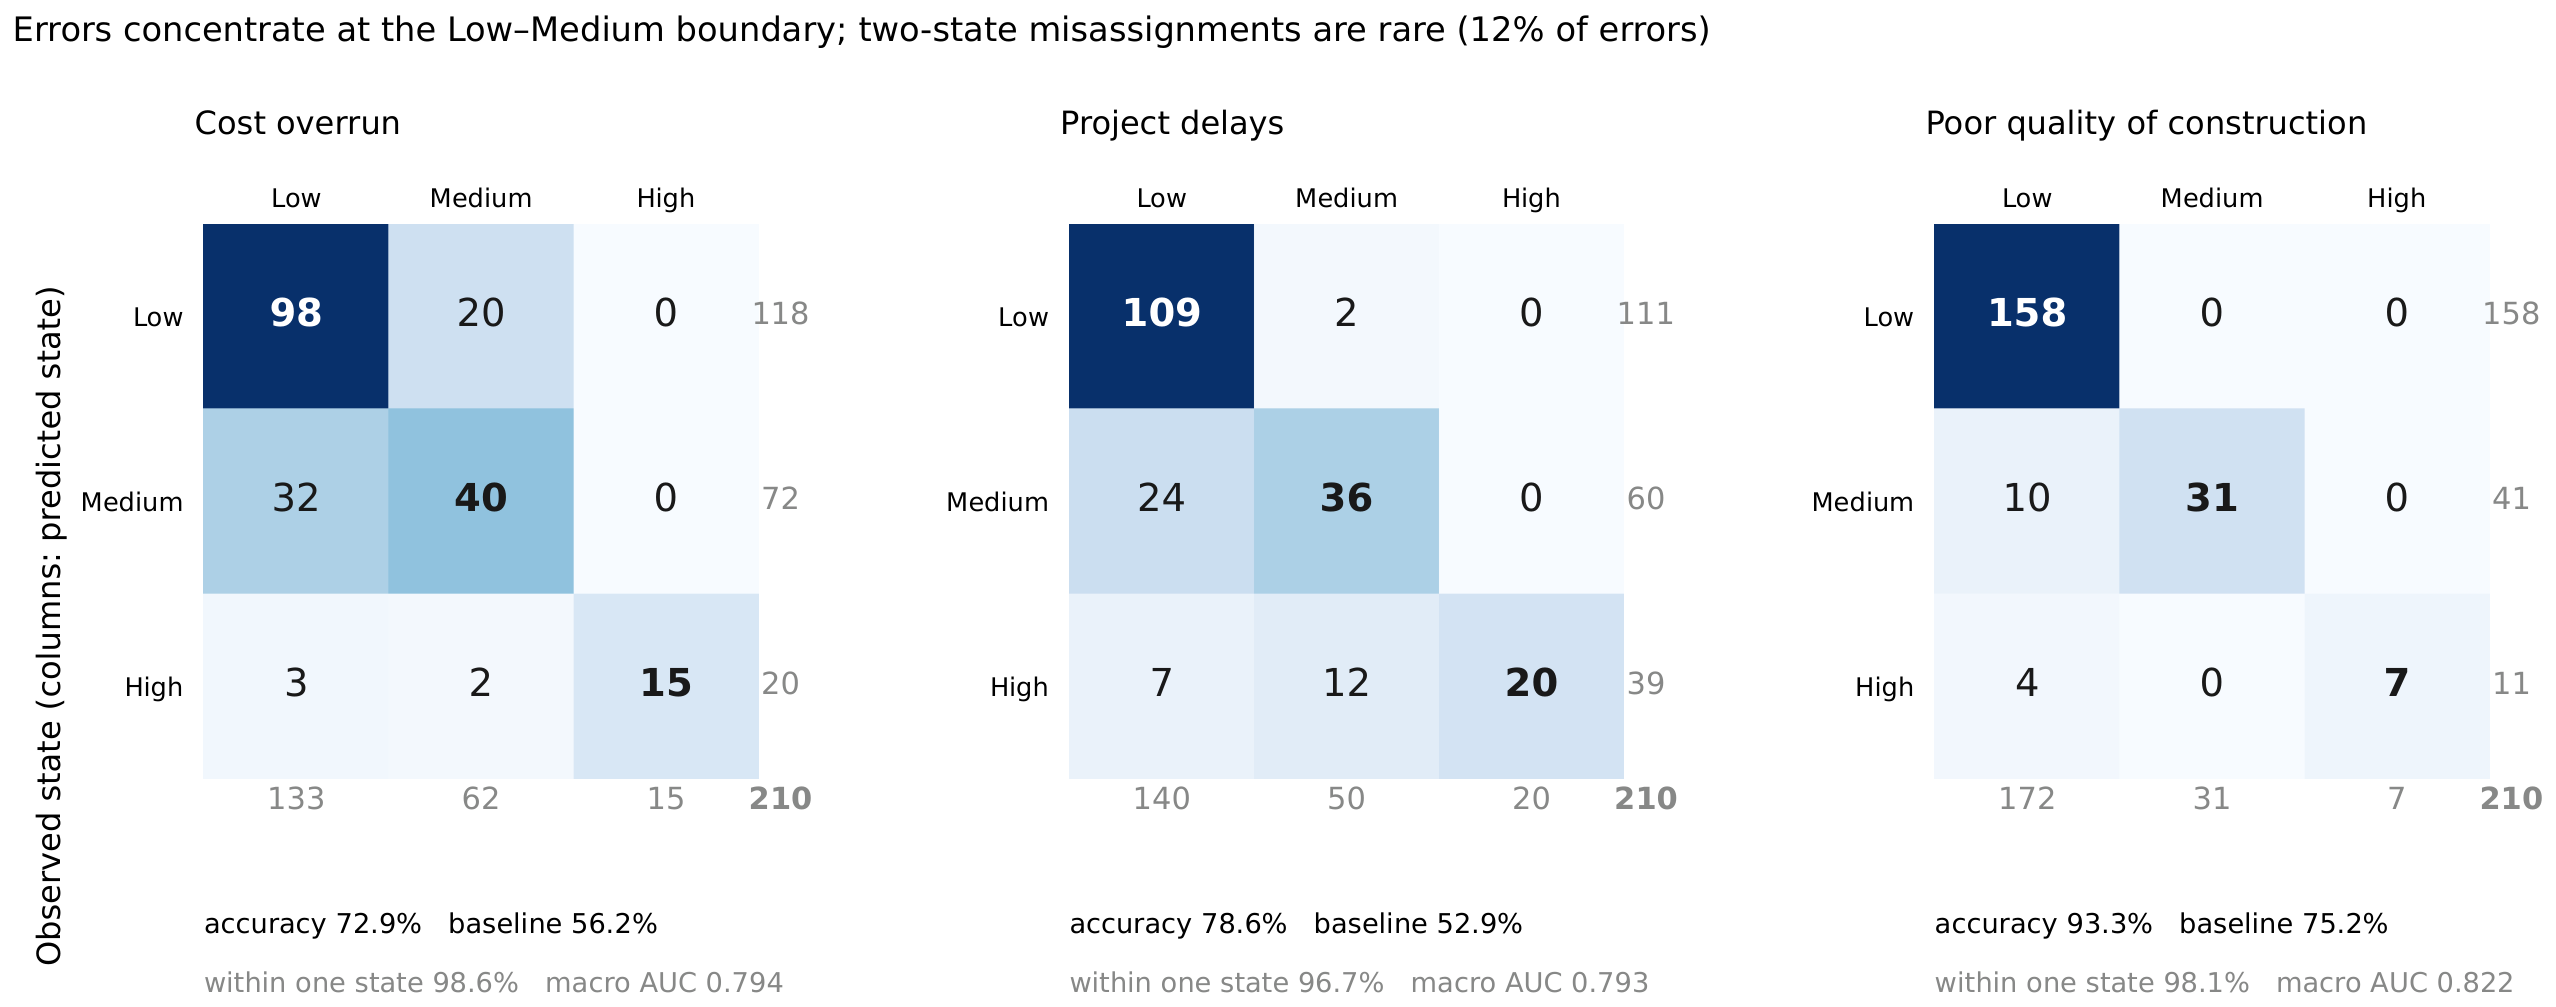
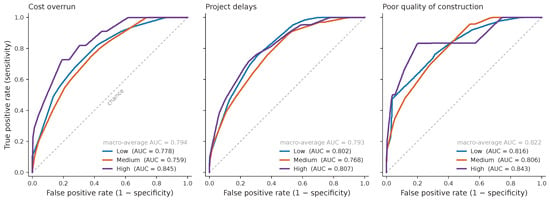
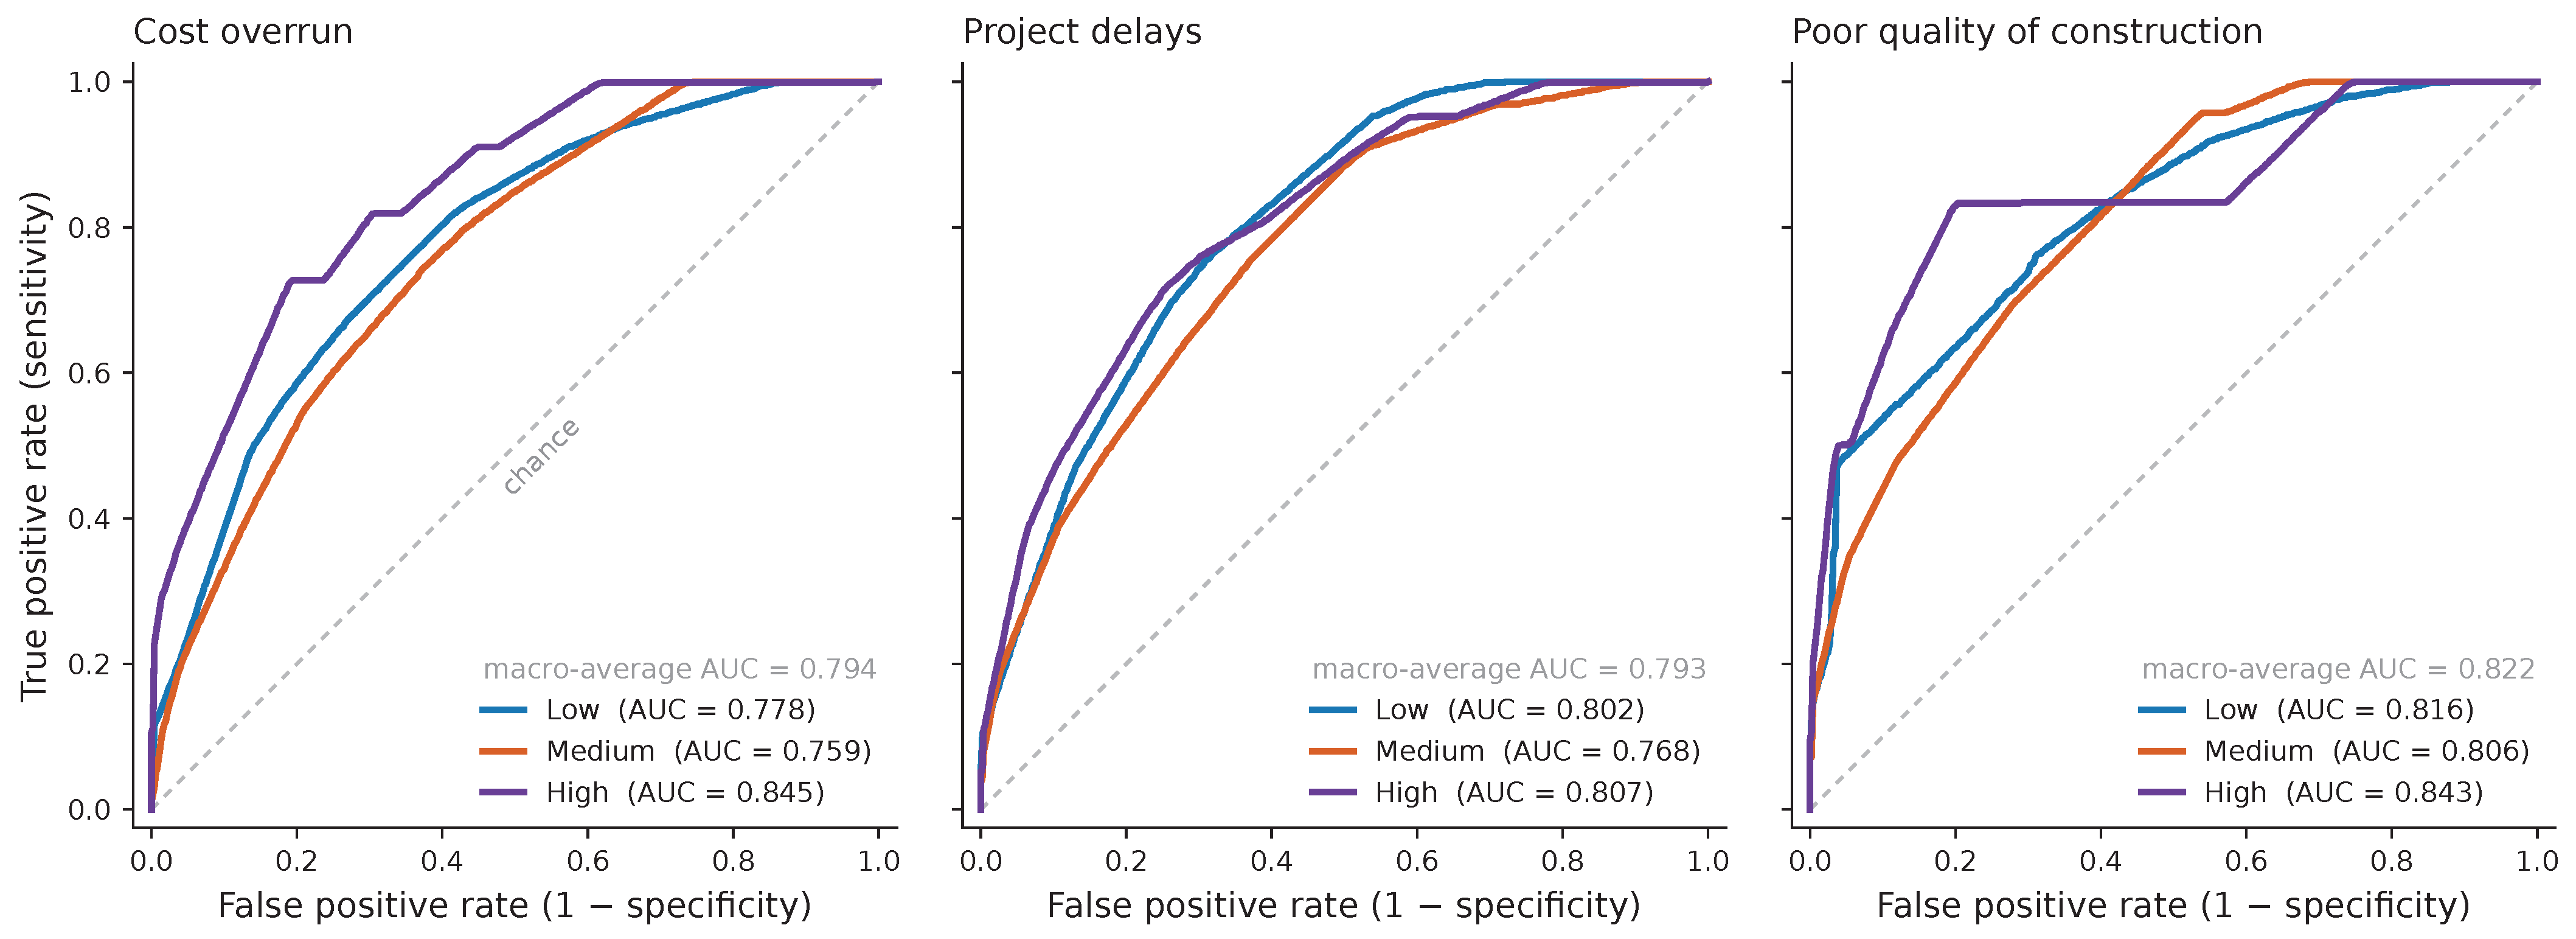

Disclaimer/Publisher’s Note: The statements, opinions and data contained in all publications are solely those of the individual author(s) and contributor(s) and not of MDPI and/or the editor(s). MDPI and/or the editor(s) disclaim responsibility for any injury to people or property resulting from any ideas, methods, instructions or products referred to in the content. |
© 2026 by the authors. Licensee MDPI, Basel, Switzerland. This article is an open access article distributed under the terms and conditions of the Creative Commons Attribution (CC BY) license.