


Abstract
Severe head injuries can leave construction workers with permanent disability, prolonged work absence, or high medical costs. Although case counts identify sectors with many reports, workforce comparisons may identify different prevention priorities. This study examined 1485 OSHA Severe Injury Reports with head-region codes across 15 U.S. construction sectors from 2015 to 2024 and linked them with Quarterly Census of Employment and Wages data. Ten pairwise tests examined relationships among construction sector, event type, injury source, head region, and injury nature, followed by intracranial proportions within common event-source combinations. Three findings emerged. (1) Building Equipment Contractors recorded the most cases but fell below workforce expectation. (2) Structural Steel and Precast Concrete Contractors had the largest workforce-relative observed-to-expected ratio, followed by Masonry and Framing Contractors. (3) Transportation incidents were strongly associated with vehicle sources, whereas lower-level falls were associated with intracranial injuries. Within struck-by reports, machinery showed a numerically higher intracranial proportion than tools or equipment; these proportions were descriptive rather than statistically ranked. These results can help agencies allocate prevention resources across sectors and help contractors focus reviews on traffic movement, elevated access, material handling, and electrical work.
1. Introduction
In 2024, construction and extraction occupations recorded 1032 fatal work injuries in the United States [1]. Roofers and structural iron and steel workers remained among occupations with high fatal injury rates [2]. Severe head injuries are especially consequential because work-related traumatic brain injury can result in permanent neurological impairment, long-term disability, or death [3,4,5,6]. Medical costs and reduced long-term work participation can extend those consequences well beyond the incident [7,8]. Reducing severe head injuries therefore remains an important construction-safety priority.
The Occupational Safety and Health Administration (OSHA) expanded its severe-injury reporting requirements in 2015 to improve information on serious occupational injuries. Covered employers in federal OSHA jurisdictions must report work-related inpatient hospitalizations, amputations, and losses of an eye within 24 h [9,10]. The resulting Severe Injury Reporting (SIR) database has since supported several construction-safety studies. Alsharef et al. [11] examined more than 11,000 construction reports and described patterns across event types, injury sources, injured body parts, injury natures, and construction sectors. Later research used the same reporting system to examine severe occupational injuries more broadly [12]. These studies established the value of SIR data, but they did not isolate severe head injuries as a distinct construction problem. Recent construction-safety research has applied topic modeling and automated classification to accident-report datasets [13,14,15]. These studies improve extraction of incident information but do not test how sector priorities change after report volume is benchmarked against workforce size.
Trade-specific research shows that the circumstances surrounding injury differ with the work performed. Roofing studies have documented fall hazards and differences in fall-protection practice [16,17,18]. Highway work-zone studies have examined injuries involving traffic and mobile equipment [19,20,21], while electrical-fatality research has identified hazards associated with electrical work [22]. Studies of specialty contractors and other trade-specific injury records have also reported differences across contractor types and work settings [23,24,25]. However, these studies examine different hazards, outcomes, and datasets, so they do not provide a common basis for comparing severe head injuries across construction sectors.
A head-injury-specific analysis can test whether the sectors identified from report counts also warrant attention relative to their employment. Previous occupational-injury studies have shown that the population measure used for comparison can change safety rankings [26,27], but the studies reviewed here do not resolve this question for severe construction head injuries. Sector comparisons also leave open which events and sources occur together and how the reported injuries differ between those combinations. Examining these relationships within the same head-injury population can connect sector priorities to the incidents that contractors need to review. The contribution is the integration of two surveillance signals, absolute report volume and workforce-relative reporting, followed by injury-pattern localization. This separates sectors with many reports from sectors with disproportionate reporting relative to workforce representation and connects both signals to prevention-relevant incident patterns.
OSHA records identify the employer’s industry and classify each incident by event, source, body part, and injury nature [28,29,30], while Bureau of Labor Statistics Quarterly Census of Employment and Wages (QCEW) data provide employment for corresponding North American Industry Classification System (NAICS) industries [31,32]. Linking these sources first establishes whether sector priorities based on report volume change after workforce size is considered. The injury attributes are then examined to determine which event, source, head-region, and injury-nature combinations characterize the reported cases. Finally, intracranial proportions within common event-source groups describe how the recorded injury composition differs across incident types.
Four research questions guided the analysis.
- RQ1. Are severe head-injury reports distributed unevenly across U.S. construction sectors?
- RQ2. Does workforce benchmarking change the sector priorities indicated by reported case counts?
- RQ3. Are event type, injury source, head region, and nature of injury associated with construction sector, and are specific sector-category combinations overrepresented?
- RQ4. Are event type, injury source, head region, and injury nature associated with one another, and which category pairs occur more often than expected?
2. Materials and Methods
2.1. Data Source and Study Sample
OSHA SIR records from January 2015 through December 2024 were restricted to construction (NAICS #23), jurisdictions represented in the federal OSHA reporting system, and structured body-part codes within the head domain [28,29,30]. In this study, “severe head injury” refers to a report meeting the OSHA Severe Injury Reporting criteria with a head-region body-part code; it is not a clinical severity grade. The head-domain extract used the structured OIICS body-part codes 10, 12, 18, 110, 111, 112, 113, 120, 122, 123, 1241, 125, 127, 1289, 130, 131, 132, 1330, 134, 135, 1360, 1361, 1363, 1368, 1369, 138, and 139 as present across the 2015–2024 coding versions. This restriction yielded 1490 reports. Five territorial reports from the U.S. Virgin Islands (n = 3), Guam (n = 1), and American Samoa (n = 1) were excluded because compatible QCEW employment data were unavailable, leaving N = 1485 reports for analysis. The final analytic universe therefore represents 29 states and the District of Columbia under federal OSHA coverage rather than the entire U.S. construction workforce.
Before workforce matching, primary NAICS codes were cross-checked against the 15 sector categories used in the study. The categories cover building construction (NAICS 236), heavy and civil engineering construction (NAICS 237), and specialty trade contractors (NAICS238). Table 1 defines the study variables and period.
Table 1.
Analytic cohort and study attributes.
2.2. Injury and Sector Categories
Each report was classified by Construction Sector (C), Event (E), Injury Source (S), Head Region (H), and Nature of Injury (N), which contained 15, 13, 10, 7, and 8 categories, respectively. Event, source, nature, and body-part categories followed the Bureau of Labor Statistics Occupational Injury and Illness Classification System. Event, source, nature, and body-part values came from structured SIR/OIICS fields and were deterministically mapped to the study categories; free-text narratives were not used to assign these variables. Because no manual case coding was used for these fields, inter-rater reliability is not applicable. For example, body-part code 111 (Brain) mapped to H-01, code 113 (Skull) mapped to H-04, and facial-region codes mapped to H-02.
Construction Sector was cross-tabulated with each injury attribute, while the four injury attributes were also cross-tabulated with one another. Event describes how the incident occurred, Injury Source identifies the object, substance, equipment, or environmental element involved, and Head Region and Nature of Injury describe the reported location and injury category.
2.3. Construction Workforce Benchmark
Annual-average private-sector employment from BLS QCEW was restricted to the same 29 states and the District of Columbia represented in the injury sample for 2015 through 2024 [31,32]. Employment was matched to the 15 sector categories at the finest NAICS level compatible with each SIR classification. Four-digit parent industries and five-digit subgroups were matched at the corresponding QCEW level. Three sectors required combined industries: utility systems and land subdivision (C-03), glazing, roofing, siding, and exterior work (C-04), and masonry and framing (C-07). Their denominators summed nonoverlapping component QCEW industries to match the prespecified SIR categories without reusing a shared parent denominator. Table 2 reports the resulting employment values and workforce shares.
Table 2.
Private-sector workforce shares for the 15 construction sectors across the same 29 states and the District of Columbia, 2015–2024.
Annual employment for each sector was averaged across the ten study years. Period-average employment across the 15 sectors summed to 4,201,161 jobs. Each sector’s share of this total defined the workforce share used to calculate its expected report count. Because employment composition and report counts can vary by year, a sensitivity benchmark also calculated each year’s expected sector counts from that year’s QCEW employment shares and then summed those annual expectations across 2015–2024.
2.4. Statistical Analysis
Counts and percentages described the distribution of each study attribute. Before the workforce comparison, sector case counts were tested against an equal-share reference across k = 15 sectors using Pearson’s goodness-of-fit statistic. If Oi denotes the observed count in sector i and Ei(0) the equal-share expectation, the quantities were defined as follows [33]. This equal-share benchmark is descriptive: it quantifies concentration across the 15 study categories before any workforce denominator is introduced and is not interpreted as an exposure-adjusted risk comparison.
Ei(0) = N/k
χ2 = Σi = 1k (Oi − Ei(0))2/Ei(0)
w = √(χ2/N)
ri(0) = (Oi − Ei(0))/√Ei(0)
Ei(Q) = Npi(Q)
ρi = Oi/Ei(Q)
ri(Q) = (Oi − Ei(Q))/√Ei(Q)
ρi,L = Oi [1 − 1/(9Oi) − 1.96/(3√Oi)]3/Ei(Q)
ρi,U = (Oi + 1) [1 − 1/{9(Oi + 1)} + 1.96/{3√(Oi + 1)}]3/Ei(Q)
For the workforce comparison, pi(Q) denotes sector i’s share of matched QCEW employment and Ei(Q) its expected report count. The workforce-based ratio ρi was calculated as the observed count divided by the expected count, so a value of 1 indicates that the observed count matches workforce representation. The residual ri(Q) records the direction and magnitude of the departure from the expected count. Byar 95% confidence intervals were calculated from the observed Poisson count and scaled by Ei(Q). Because QCEW measures workforce size rather than exposure hours, ρi indicates workforce-relative reporting, not injury risk. Small sectors were retained to preserve the prespecified classification; their uncertainty is shown by the confidence intervals.
To determine whether differences among NAICS 236, NAICS 237, and NAICS 238 drove the pooled comparison, the same calculations were repeated within each family. For family g, Ng denotes the number of reports and pi|g the employment share of sector i within that family.
Ei|g = Ng pi|g
ρi|g = Oi/Ei|g
Within each NAICS family, Pearson goodness-of-fit statistics, Cohen’s w, workforce-based ratios, Byar 95% confidence intervals, and standardized residuals were recalculated from the family-specific expected counts. The three family-level p-values were controlled with the Benjamini–Hochberg false discovery rate (BH-FDR) at q = 0.05.
Pearson tests of independence evaluated all ten pairwise relationships among C, E, S, H, and N. Bergsma’s bias-corrected Cramér’s V measured each table-wide association [34], while adjusted standardized residuals identified category pairs above expectation [35]. In the equations below, j indexes rows and i indexes columns, while R and C denote the numbers of row and column categories.
Eij = n·i nj/N
χ2 = Σj Σi (Oij − Eij)2/Eij
rij = (Oij − Eij)/√[Eij (1 − n·i/N)(1 − nj/N)]
φ2 = χ2/N
φc2 = max{0, φ2 − [(R − 1)(C − 1)/(N − 1)]}
Rc = R − (R − 1)2/(N − 1)
Cc = C − (C − 1)2/(N − 1)
Vbc = √[φc2/min(Rc − 1, Cc − 1)]
The ten table-level p-values formed one Benjamini–Hochberg family at q = 0.05 [36]. Fixed-margin Monte Carlo checks used 10,000 replicates and seed 42 for each table [37]. Positive hotspots required rij > +3.00, Oij ≥ 5, and Eij ≥ 5, excluding nonclassifiable categories. Section 3.5 summarizes the two largest eligible positive residuals for each of the six injury-attribute pairs. The complete matrices retain all cells in Tables S1–S10. Residual hotspots are exploratory localization aids rather than individually multiplicity-adjusted tests. Sensitivity checks evaluated a stricter residual cutoff of +3.29 and a stricter minimum of 10 for both observed and expected counts while retaining the prespecified primary thresholds.
2.5. Injury Nature Within Event-Source Combinations
A complementary descriptive analysis used the same 1485 reports to calculate intracranial injury proportions within event-source combinations. The OIICS nature category Intracranial injuries defined the outcome. For each combination, the number of intracranial reports was divided by all reports in that combination, pooling across construction sectors. Exact 95% binomial confidence intervals were calculated using the Clopper–Pearson method [38]. Combinations containing at least 2% of the sample, equivalent to at least 30 reports, were retained for presentation. These comparisons were descriptive; no between-combination hypothesis tests were performed, and the confidence intervals show precision rather than establish a statistically ordered ranking.
3. Results
3.1. Analytic Sample and Sector Distribution
The final sample contained 1485 severe head-injury reports that could be matched to QCEW employment. Specialty trade contractors (NAICS 238) contributed 902 reports (60.7%), heavy and civil engineering construction (NAICS #237) contributed 293 (19.7%), and building construction (NAICS 236) contributed 290 (19.5%).
3.2. Sector Differences in Raw Case Counts
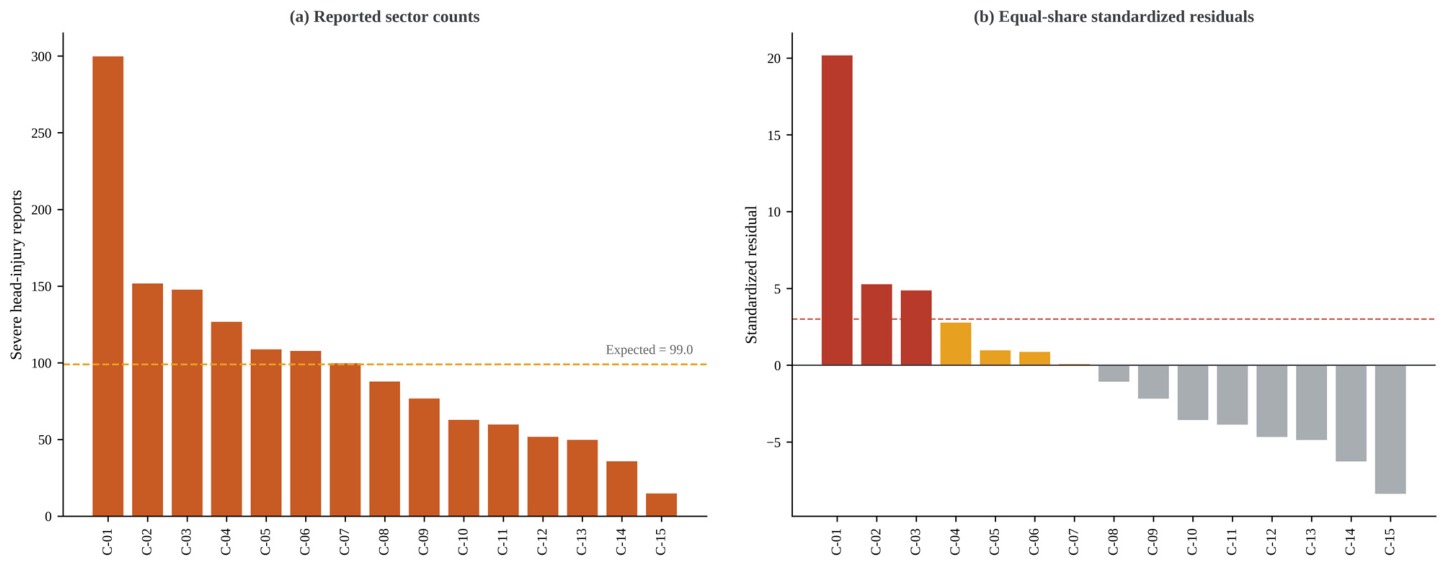
Reported cases were not evenly distributed across the 15 sectors, χ2(14) = 663.0, p < 0.001, with Cohen’s w = 0.67 (Table 3, Figure 1). Building Equipment Contractors (C-01) contributed the largest count (n = 300, 20.2%) and the largest positive equal-share residual (ri = +20.2). Commercial and Institutional Building Construction (C-02, n = 152, ri = +5.3) and Utility System Construction and Land Subdivision (C-03, n = 148, ri = +4.9) also exceeded the +3 localization threshold.
Table 3.
Construction-sector counts and standardized residuals under the equal-share benchmark, χ2(14) = 663.0, p < 0.001, w = 0.67. The expected count per sector is 99.0.
The lowest count occurred in Other Foundation, Structure, and Building Exterior Contractors (C-15, n = 15, ri = −8.4). Glazing, Roofing, Siding, and Exterior Contractors (C-04) recorded 127 reports but remained below the positive residual threshold (ri = +2.8). Table 3 provides the remaining sector results.
Figure 1.
Construction-sector case counts and equal-share standardized residuals. The dashed line in panel (a) marks the equal-share expectation of 99.0 reports per sector. The dashed line in panel (b) marks a standardized residual of +3.
3.3. Sector Reports Relative to Workforce Size
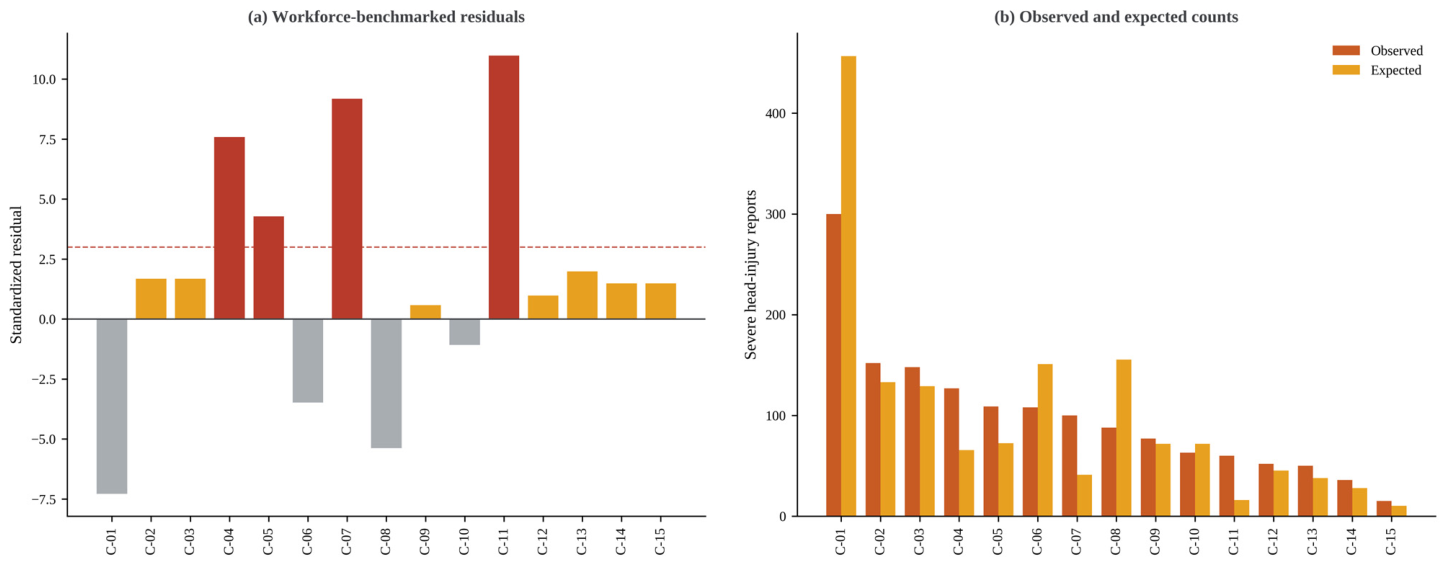
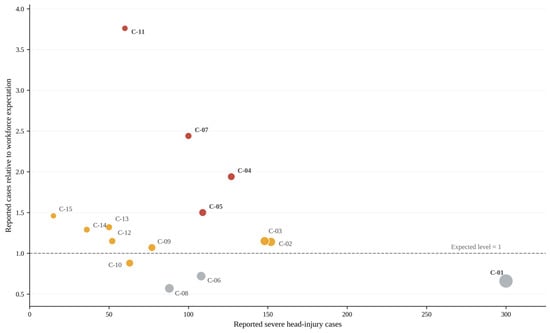
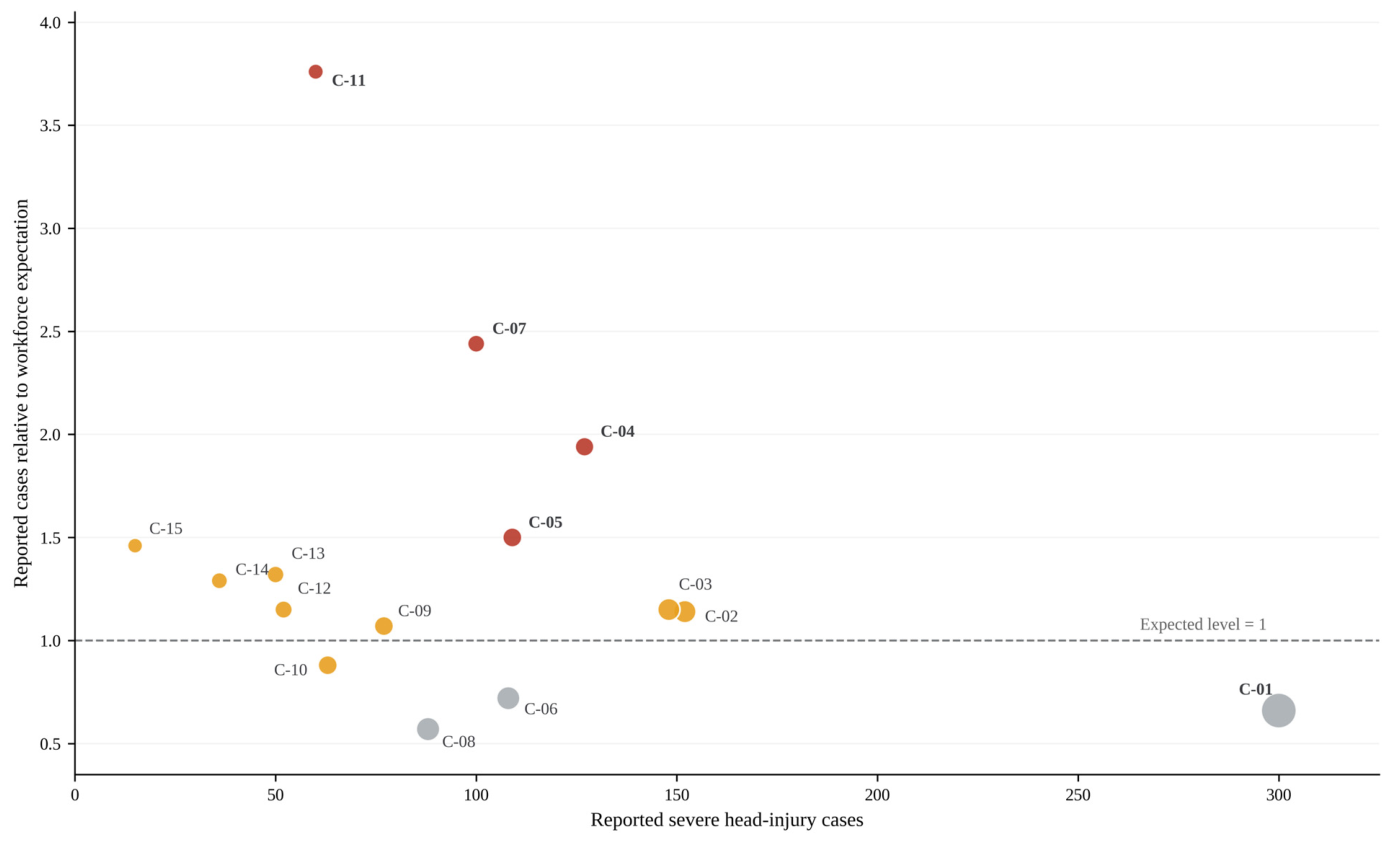
Sector report counts differed from their workforce-based expectations, χ2(14) = 393.6, p < 0.001, with Cohen’s w = 0.51 (Table 4). Figure 2 compares observed and expected counts, while Figure 3 displays the relationship between report volume and the workforce-based ratio.
Table 4.
Construction-sector reports relative to QCEW workforce shares, χ2(14) = 393.6, p < 0.001, w = 0.51.
Figure 2.
Construction-sector reports relative to QCEW workforce shares. Panel (a) shows standardized residuals with the dashed line at +3, while panel (b) compares observed and expected report counts.
Figure 3.
Case count and workforce comparison for each sector. Bubble area represents workforce share. Red points indicate sectors whose 95% confidence interval for the workforce-based ratio lies above 1, orange points indicate intervals that include 1, and grey points indicate intervals that lie below 1. The dashed line marks the expected level of 1.
Four sectors had workforce-based ratios with 95% confidence intervals entirely above 1. Structural Steel and Precast Concrete Contractors (C-11) recorded 60 reports against 16.0 expected, yielding the largest workforce-relative ratio of 3.76 (95% CI 2.87–4.84). Masonry and Framing Contractors (C-07) followed at 2.44 (1.98–2.97). Glazing, Roofing, Siding, and Exterior Contractors (C-04) and Highway, Street, and Bridge Construction (C-05) had ratios of 1.94 and 1.50, respectively. These ratios compare report shares with workforce shares and are not sector injury rates.
Building Equipment Contractors (C-01) recorded 300 reports against 456.6 expected, despite leading the case-count ranking. Its workforce-based ratio was 0.66 (95% CI 0.58–0.74). Building Finishing Contractors (C-06) and Residential Building Construction (C-08) also fell below expectations, with ratios of 0.72 and 0.57 and confidence intervals below 1 (Table 4).
Rank positions changed when sectors were ordered by the workforce-based ratio rather than case count. C-01 moved from first by case count to 14th by the workforce comparison, whereas C-11 moved from 11th to first and C-07 from seventh to second. C-02 moved from second to 10th, and C-08 moved from eighth to 15th (Figure 3).
Sensitivity Within Major NAICS Families
Repeating the workforce comparison within three-digit NAICS families preserved the main specialty-trade results (Table S1). Within NAICS 238, sector counts differed from within-family workforce shares, χ2(8) = 343.7, BH-FDR p < 0.001, w = 0.62. Structural Steel and Precast Concrete Contractors had the highest within-family ratio at 3.87 (95% CI 2.95–4.98). Masonry and Framing Contractors followed at 2.51 (2.04–3.06), while Glazing, Roofing, Siding, and Exterior Contractors had a ratio of 1.99 (1.66–2.37). Building Equipment Contractors remained below expectation at 0.68 (0.60–0.76). NAICS 236 also differed from its within-family employment distribution, χ2(2) = 35.8, BH-FDR p < 0.001, w = 0.35. NAICS 237 did not, χ2(2) = 4.6, BH-FDR p = 0.099, w = 0.13. A separate year-matched sensitivity benchmark produced the same sector ordering, χ2(14) = 389.7 and w = 0.51. For every sector, the summed year-specific expected count differed from the period-average expectation by less than one report.
3.4. Sector Associations with Injury Attributes
All four sector associations remained significant within the ten-test BH adjustment, and fixed-margin Monte Carlo checks supported the same conclusions (Table 5). Bias-corrected Cramér’s V was 0.136 for C × E, 0.143 for C × S, 0.068 for C × H, and 0.073 for C × N. Table 6 reports selected sector-category hotspots, while Tables S1–S10 provide the complete matrices. The sector associations with head region and injury nature were small in table-wide magnitude; their statistical significance is therefore not interpreted as evidence of a large sector effect.
Table 5.
Tests of independence for all ten attribute pairs (N = 1485). BH-adjusted p-values use a single family of ten tests.
Table 6.
Selected sector-category cells with adjusted standardized residuals above +3.00. Tables S1–S10 provide the complete residual matrices.
Table 6 includes only cells that met the prespecified residual and count criteria. Tables S1–S10 report the complete matrices, and Appendix B defines the category codes. Under the stricter residual cutoff of +3.29, 15 of the 16 Table 6 cells remained eligible; the only cell removed was the C-04 intracranial cell (rij = +3.03). Requiring both observed and expected counts to be at least 10 retained 13 of 16 cells, excluding three cells with expected counts below 10. These checks support the dominant sector-event and sector-source patterns while identifying the weakest flags as threshold-sensitive.
3.4.1. Event Patterns
Transportation incidents were overrepresented in Highway, Street, and Bridge Construction (C-05), with 28 reports compared with 7.0 expected (rij = +8.55). In practice, this category includes incidents in which passing traffic or a work-zone truck strikes a worker.
Lower-level falls were concentrated in exterior, finishing, and masonry or framing work. Glazing, Roofing, Siding, and Exterior Contractors (C-04) recorded 93 reports compared with 54.7 expected (rij = +7.17), followed by Building Finishing Contractors (C-06), with 74 versus 46.5 (rij = +5.54), and Masonry and Framing Conractors (C-07), with 59 versus 43.1 (rij = +3.33). Roofs, scaffolds, and temporary platforms are representative settings for these elevation-related incidents.
Utility System Construction and Land Subdivision (C-03) recorded 81 struck-by reports against 49.1 expected (rij = +5.86). Building Equipment Contractors (C-01) showed a different pattern, with 24 electrical-exposure reports against 7.3 expected (rij = +7.03). The former group includes incidents involving displaced pipes or falling materials during installation, whereas the latter includes maintenance or troubleshooting near energized components.
3.4.2. Injury-Source Pattern
Tools, instruments, and equipment were overrepresented in Building Equipment Contractors (C-01), with 111 reports compared with 63.6 expected (rij = +7.49). The category includes ladders and tools used for installation or maintenance.
Highway, Street, and Bridge Construction (C-05) had a vehicle-source concentration, with 28 reports against 8.9 expected (rij = +6.95). Passing cars and construction trucks are representative vehicle sources in this setting. Utility System Construction and Land Subdivision (C-03), in contrast, recorded 52 parts-and-materials reports against 28.4 expected (rij = +5.19), including sources such as pipes, fittings, and displaced components.
Structures and surfaces were overrepresented in the same three sectors that showed lower-level-fall concentrations. Exterior contractors (C-04) recorded 62 reports compared with 35.1 expected (rij = +5.57). Masonry and framing contractors (C-07) recorded 49 versus 27.7 (rij = +4.94), and finishing contractors (C-06) recorded 51 versus 29.9 (rij = +4.71). Roofs, scaffolds, stairs, and floors are representative sources within this category.
3.4.3. Head-Region and Injury-Nature Patterns
Facial-region injuries were overrepresented in Utility System Construction and Land Subdivision (C-03), with 80 reports compared with 50.3 expected (rij = +5.43). A fitting or displaced material striking the face during handling or installation provides one representative incident configuration.
Building Equipment Contractors (C-01) recorded 31 burns and corrosions against 13.9 expected (rij = +5.24). Electrical arc exposure and torch work are representative sources of burns during installation or maintenance.
Glazing, Roofing, Siding, and Exterior Contractors (C-04) recorded 71 intracranial injuries compared with 54.8 expected (rij = +3.03). One representative pathway is a fall from a roof or elevated platform followed by head impact with the landing surface.
3.5. Hotspots Among Events, Injury Sources, and Injury Outcomes
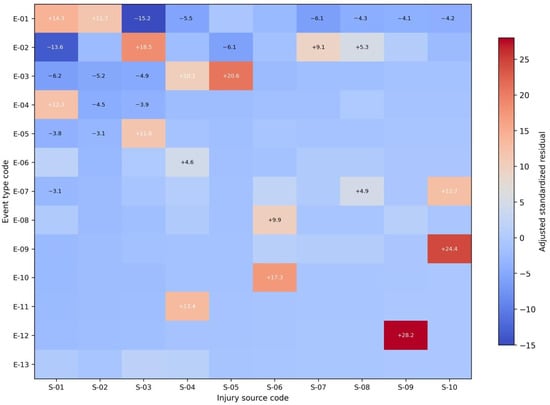
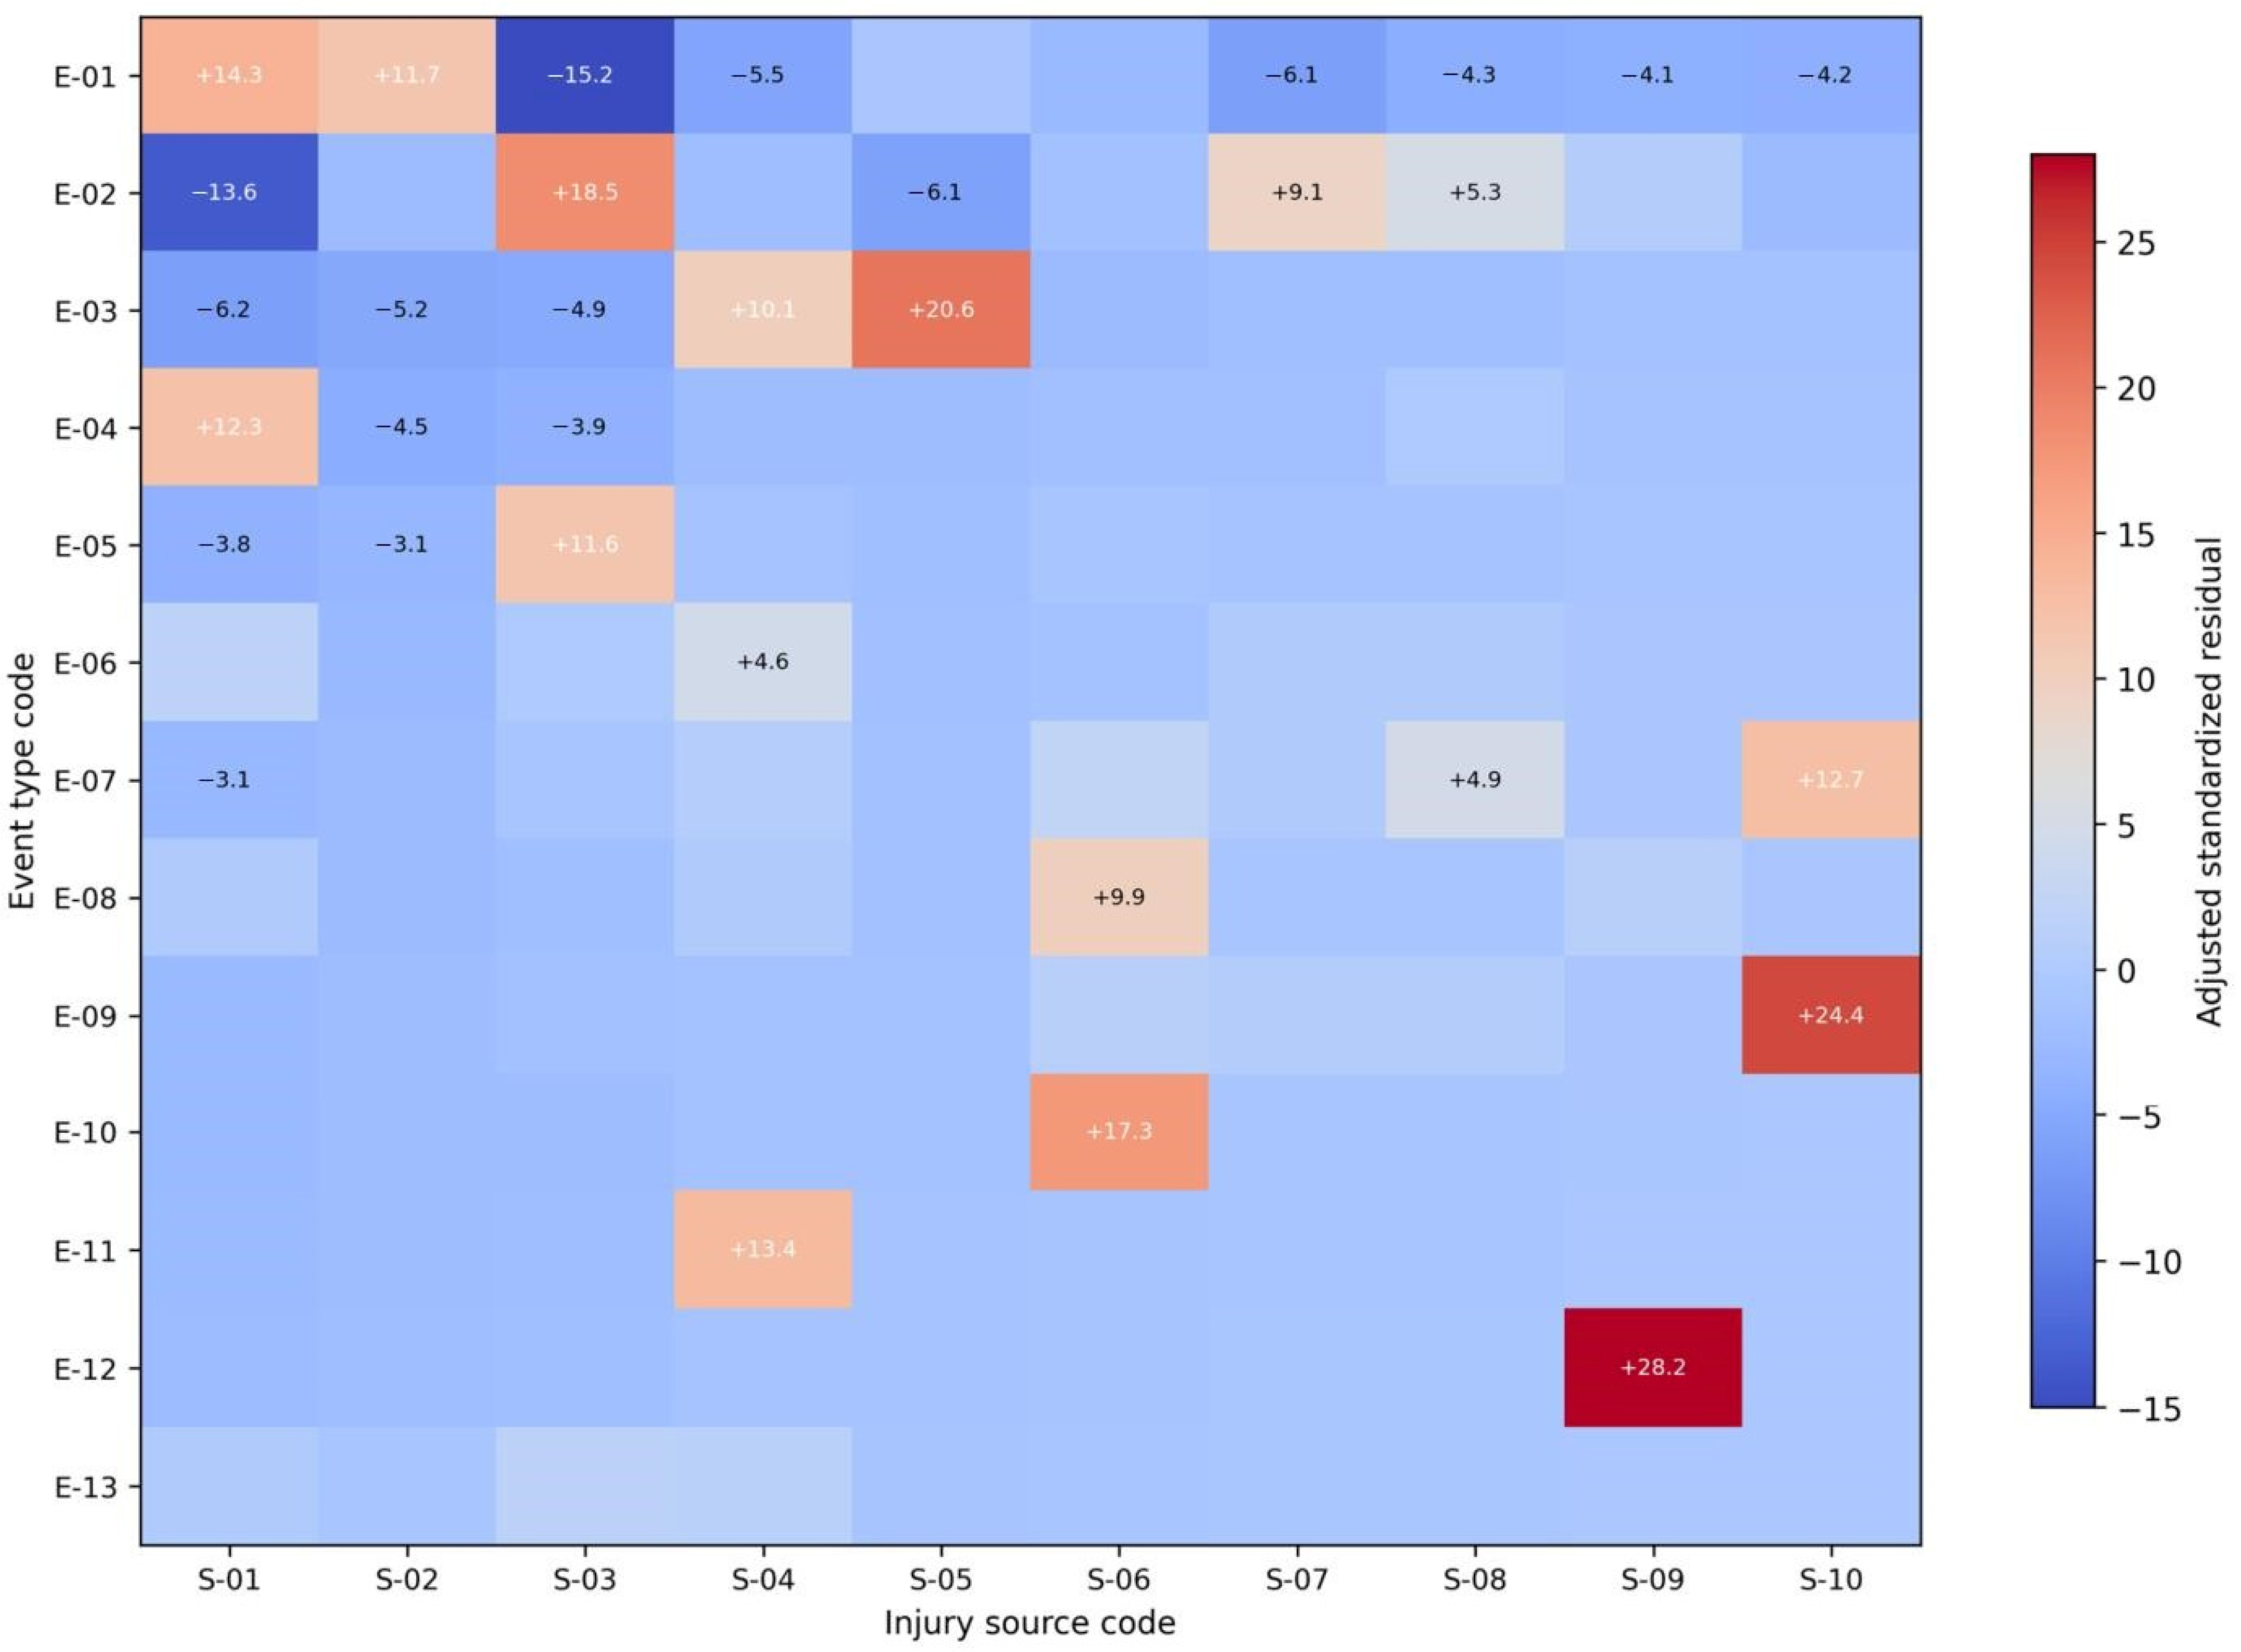
All six pooled injury-attribute associations met the ten-test BH threshold and the Monte Carlo check (Table 5). The event-source table showed three distinct incident configurations. Transportation incidents with vehicles had the largest eligible residual, with 61 reports compared with 7.7 expected (rij = +20.65), followed by struck-by events involving parts and materials at 227 versus 94.6 (rij = +18.52). Lower-level falls involving structures and surfaces were also concentrated above expectation, with 299 reports against 177.1 expected (rij = +14.27). These combinations correspond to different prevention problems, such as vehicle movement through a work zone, materials shifting during handling, or a fall through an opening. Table 7 reports the two largest eligible residuals for each comparison. These cell residuals are exploratory and not independently multiplicity-adjusted. All 12 Table 7 hotspots exceeded +3.29; 11 also met O and E ≥ 10. The transportation-vehicle cell (O = 61, E = 7.7, rij = +20.65) was the sole exception. Figure 4 shows the full event-source residual matrix.
Figure 4.
Adjusted standardized residual heatmap for event type × injury source. Positive values indicate combinations above the independence expectation; category codes are defined in Appendix B. Cell-level residuals are exploratory and interpretation remains subject to the prespecified count criteria.
Those event differences carried into the injuries that were recorded. Struck-by incidents contained more facial-region reports than expected, with 288 observed versus 167.7 expected (rij = +14.00), and more open wounds, with 156 versus 89.3 (rij = +9.54). Lower-level falls showed the contrasting pattern: 397 brain-region reports occurred against 277.1 expected (rij = +12.68), while 396 intracranial injuries occurred against 276.3 expected (rij = +12.67). A projected component striking the face and a fall ending in head impact represent the different physical configurations captured by these associations.
The source comparisons showed a parallel distinction. Parts and materials were associated with facial-region injuries, with 163 reports compared with 96.9 expected (rij = +9.19), whereas structures and surfaces were associated with both brain-region injuries (250 versus 178.0, rij = +8.43) and intracranial injuries (250 versus 177.4, rij = +8.50). Vehicles were also overrepresented among intracranial reports, with 69 observed against 52.2 expected (rij = +3.21). Parts and materials instead showed a burns-and-corrosions concentration, with 34 reports versus 13.2 expected (rij = +6.50). Because this source category includes electrical components such as wiring and switches, the association can reflect electrical arc exposure rather than mechanical impact alone.
Head region and injury nature require a different interpretation because both describe the resulting injury rather than the hazardous interaction. Brain-region reports included 641 intracranial injuries compared with 277.6 expected (rij = +38.43), while skull reports included 112 traumatic bone, nerve, or spinal injuries compared with 22.8 expected (rij = +21.74). A skull fracture is one example of the latter correspondence. These large residuals therefore describe anatomical and injury-classification overlap and should not be interpreted as additional exposure hotspots.
Table 7.
Two largest eligible positive residuals for each of the six injury-attribute pairs. Category codes are defined in Appendix B.
3.6. Intracranial Injury in Common Event-Source Combinations
The residual analysis identifies event-source combinations that occur more often than expected, but it does not describe the injury composition within those groups. Intracranial proportions provide that second view. Twelve combinations met the presentation threshold, accounting for 1192 reports or 80.3% of the sample (Table 8). Although machinery accounted for fewer struck-by reports than parts and materials, its descriptive intracranial proportion was numerically higher, at 41.9% compared with 24.2%. Tools and equipment had a lower proportion of 8.0%. These percentages are descriptive and were not formally tested as pairwise differences.
Table 8.
Intracranial injury within common event-source combinations, pooled across all construction sectors (N = 1485).
Transportation reports involving vehicles were 65.6% intracranial, compared with 32.4% for machinery. The proportions for lower-level falls were closer, at 65.6% for structures and surfaces and 60.8% for tools and equipment. Table 8 provides the counts and exact confidence intervals, including the wider interval for machinery-related struck-by reports, which contained 31 cases.
4. Discussion
4.1. Sector Priorities for Severe Head Injury Prevention
Building Equipment Contractors remained a prevention priority despite its below-expectation workforce ratio, since it contributed the largest number of reports. The workforce comparison brought structural steel and precast concrete contractors forward, followed by masonry and framing contractors, without requiring either group to lead the count ranking. Allocating resources by either measure alone would therefore omit part of the sector-level evidence. The first signal identifies absolute reported burden, whereas the second identifies workforce-relative reporting; neither is a direct estimate of worker-level injury risk.
Previous occupational-injury research has shown that the population measure used for comparison can alter safety rankings [26,27]. The present study applies that distinction to severe head injuries while retaining case counts as a separate reason for prevention attention. Agencies can maintain prevention capacity in sectors with many reports and use the employment comparison to identify smaller trades for additional review.
The persistence of the specialty-trade pattern within NAICS 238 indicates that the pooled result was not attributable solely to differences among the three construction families. Highway work exceeded expectations in the pooled comparison, although the family-wide test within NAICS 237 did not meet the adjusted threshold. These findings address different comparisons and should not be used interchangeably to rank closely related trades.
4.2. Incident Hotspots and Prevention Planning
Vehicle movement and material handling require different control reviews even when both can result in head impact. The transportation-vehicle hotspot identifies one incident group, while struck-by events involving parts and materials identify another. The sector tests separately locate transportation and vehicle concentrations in highway construction, consistent with work-zone research [19,20,21]. Contractors can examine passing traffic, internal vehicle routes, visibility, and backing movements when reviewing these incidents.
Lower-level falls and structures or surfaces were separately overrepresented in exterior, finishing, and masonry or framing work. The pooled fall-source association adds evidence for reviewing elevated access and working surfaces, consistent with roofing research [16,17,18]. Reviewing roof edges, openings, scaffolds, and temporary platforms can make fall-prevention planning more specific than a general head-injury warning. Structural steel and precast concrete contractors warrant a broader review, as their high workforce-based ratio was not accompanied by an individual injury-attribute hotspot meeting the interpretation criteria. This pattern is directionally consistent with earlier fatal-TBI surveillance, which identified structural iron and steel workers and roofers as having high fatal TBI rates and falls as the leading cause in those occupations [5]. Because the outcome and denominator differ, this comparison is contextual. Head-protection selection is also relevant: biomechanical work shows that construction-helmet response varies with impact conditions [39], and recent construction research examined the transition from Type I to Type II helmets [40]. PPE complements, rather than replaces, controls for falls, openings, traffic, and struck-by hazards.
Parts and materials should not be treated solely as objects that fall or shift. The burns-and-corrosions association also directs attention to electrical components within that category. Building-equipment reports contained separate concentrations of electrical exposure, tools or equipment, and burns or corrosions, making energy isolation and electrical safe-work practices relevant [22]. Utility-system reports instead showed struck-by and material concentrations alongside facial injuries, supporting review of material movement and workers’ positions relative to released components.
Because the pairwise tests do not establish a joint sector-event-source sequence, the findings should be used to guide review rather than to reconstruct a causal pathway. Sector priorities can therefore be translated into reviews of the vehicle, material, access, or energy interactions represented by the corresponding hotspots. These associations therefore support targeted review, not causal attribution or prediction of future injury.
4.3. Intracranial Injury Within Common Incident Groups
The intracranial proportions add injury information that report frequency alone cannot supply. Machinery-related struck-by incidents were less frequent than those involving parts and materials, and the observed intracranial proportion was numerically higher. Keeping the object or equipment in incident summaries preserves this contrast instead of treating all struck-by reports as equivalent. The wide confidence interval for the 31 machinery cases also argues against treating the point estimate as a precise ranking of worker risk.
For prevention planning, the proportions can identify incident groups that merit closer review alongside the high-count groups. They do not make non-intracranial injuries a lesser concern, since all reports met the severe-injury threshold. The brain-region and intracranial hotspot require a different interpretation because the two classifications describe related aspects of the same injury. Its large residual does not identify another hazardous exposure or establish that a particular control would prevent the injury.
4.4. Limitations
OSHA SIR does not capture all construction injuries in the United States. It records reportable severe injuries in jurisdictions represented in the federal system, and reporting completeness can differ across employers. Underreporting and recordkeeping differences have been documented, especially among smaller establishments [41,42,43], so the observed sector counts should not be read as a complete national injury census. Accordingly, the findings generalize to the matched federal OSHA analytic universe, not to state-plan jurisdictions or a complete national construction workforce.
QCEW also limits what can be inferred from the workforce comparison. It measures wage-and-salary employment rather than task-specific exposure hours and does not fully capture self-employed workers or unincorporated proprietors. The resulting ratio therefore compares reported cases with workforce representation rather than estimating worker-level risk. Compatible sector-level exposure-hour data would permit a different type of rate analysis.
Intracranial injury is an administrative classification rather than a clinical severity score. Reports classified otherwise still met the severe-injury reporting threshold. The six injury-attribute tests and event-source proportions pool sectors and cannot establish a joint sector-event-source effect or injury incidence. Head-region and injury-nature codes also describe the same injury, which partly explains their association. Table-level BH correction does not make individual residual flags multiplicity-adjusted cell tests, and the count threshold restricts interpretation of sparse combinations. The pooled event-source analysis was intentionally descriptive and was not adjusted for construction sector, so sector composition may contribute to the observed proportions. Small groups, such as the 31 machinery-related struck-by reports, should be interpreted through their wide exact confidence intervals.
Three sector categories combine multiple NAICS subgroups using nonoverlapping QCEW components: C-03 combines 2371 + 2372, C-04 combines 23815 + 23816 + 23817, and C-07 combines 23813 + 23814. Primary NAICS counts were as low as 2 for land subdivision, 9 for siding, and 12 for glazing, making several five-digit comparisons unstable. The reported estimates therefore apply to the combined categories, not individual components.
The primary benchmark uses period-average workforce composition, although the year-matched sensitivity produced the same sector ordering. Neither analysis estimates temporal trends or uncertainty in QCEW employment values, so the results support period-level sector comparison rather than year-specific risk inference.
5. Conclusions
Severe head-injury prevention priorities differed when sector employment was considered alongside case counts. Building Equipment Contractors contributed the most reports, whereas Structural Steel and Precast Concrete Contractors had the largest workforce-relative observed-to-expected ratio, followed by Masonry and Framing Contractors. These measures represent absolute report volume and workforce-relative reporting, respectively, not competing estimates of worker risk. Retaining both measures allows prevention planning to address high report volume without overlooking smaller trades.
The injury-attribute comparisons identify incident groups for closer examination, including vehicle-related transportation events, struck-by incidents involving materials, and falls involving structures or surfaces. Intracranial proportions describe the recorded injuries within common combinations rather than the risk of injury to individual workers. Agencies can use the sector comparisons to allocate prevention capacity, while contractors can use the incident findings to focus reviews of vehicle movement, elevated access, material handling, and electrical work.
Supplementary Materials
The following supporting information can be downloaded at: https://www.mdpi.com/article/10.3390/buildings16204137/s1, Table S1: Construction sector × event type; Table S2: Construction sector × injury source; Table S3: Construction sector × head region; Table S4: Construction sector × nature of injury; Table S5: Event type × injury source; Table S6: Event type × head region; Table S7: Event type × nature of injury; Table S8: Injury source × head region; Table S9: Injury source × nature of injury; Table S10: Head region × nature of injury; Table S11: Within-major-sector workforce sensitivity for NAICS #236, #237, and #238.
Author Contributions
Conceptualization, A.O. (Anto Ovid) and A.A. (Alex Albert). Methodology, A.O. (Anto Ovid), A.A. (Alex Albert), and A.A. (Abdullah Alsharef). Investigation, A.O. (Anto Ovid) Validation, A.O. (Anto Ovid) and A.A. (Abdullah Alsharef). Formal analysis, A.O.(Anto Ovid). Data curation, A.O. (Anto Ovid). Visualization, A.O. (Anto Ovid). Writing—original draft preparation, A.O. (Anto Ovid). Writing—review and editing, A.O. (Anto Ovid), A.A. (Alex Albert) and A.A. (Abdullah Alsharef). Supervision, A.A. (Alex Albert). Funding Acquisition, A.A. (Alex Albert), and A.A. (Abdullah Alsharef). Project administration, A.A. (Alex Albert). All authors have read and agreed to the published version of the manuscript.
Funding
This research was partially funded by the Ongoing Research Funding program (ORF-2026-1632), King Saud University, Riyadh, Saudi Arabia, and by the Job-Site Safety Institute, grant number 536891.
Institutional Review Board Statement
Not applicable. This study analyzed de-identified, publicly available administrative records and involved no interaction with human participants.
Informed Consent Statement
Not applicable.
Data Availability Statement
The OSHA Severe Injury Reports and Bureau of Labor Statistics QCEW source datasets are publicly available [28,31,32]. Tables S1–S11 provide the residual matrices and within-family workforce results. The curated analytic workbook, analysis scripts, and derived statistical outputs are available from the corresponding author on reasonable request.
Conflicts of Interest
The authors declare no conflicts of interest.
Appendix B. Category Code Legend
Table A2 provides the full code-to-category mapping for the 53 study categories across construction sector, event, source, head region, and injury nature. Categories are listed in descending order of frequency within each attribute.
Table A2.
Category code legend for all five study attributes (N = 1485).
References
- Bureau of Labor Statistics. National Census of Fatal Occupational Injuries in 2024; USDL-26-0230; U.S. Department of Labor: Washington, DC, USA, 2026.
- Bureau of Labor Statistics. Fatal Occupational Injuries by Selected Characteristics, 2020–2024; U.S. Department of Labor: Washington, DC, USA, 2026.
- Tiesman, H.M.; Konda, S.; Bell, J.L. The epidemiology of fatal occupational traumatic brain injury in the United States. Am. J. Prev. Med. 2011, 41, 61–67. [Google Scholar] [CrossRef] [Scilit] [PubMed]
- Konda, S.; Reichard, A.A.; Tiesman, H.M.; Hendricks, S. Non-fatal work-related traumatic brain injuries treated in U.S. hospital emergency departments, 1998–2007. Inj. Prev. 2015, 21, 115–120. [Google Scholar] [CrossRef] [Scilit] [PubMed]
- Konda, S.; Tiesman, H.M.; Reichard, A.A. Fatal traumatic brain injuries in the construction industry, 2003–2010. Am. J. Ind. Med. 2016, 59, 212–220. [Google Scholar] [CrossRef] [Scilit] [PubMed]
- Toccalino, D.; Colantonio, A.; Chan, V. Update on the epidemiology of work-related traumatic brain injury: A systematic review and meta-analysis. Occup. Environ. Med. 2021, 78, 769–776. [Google Scholar] [CrossRef] [Scilit] [PubMed]
- Waehrer, G.M.; Dong, X.S.; Miller, T.; Haile, E.; Men, Y. Costs of occupational injuries in construction in the United States. Accid. Anal. Prev. 2007, 39, 1258–1266. [Google Scholar] [CrossRef] [Scilit] [PubMed]
- Graff, H.J.; Siersma, V.; Moller, A.; Kragstrup, J.; Andersen, L.L.; Egerod, I.; Rytter, H.M. Labour market attachment after mild traumatic brain injury: Nationwide cohort study with 5-year register follow-up in Denmark. BMJ Open 2019, 9, e026104. [Google Scholar] [CrossRef] [Scilit] [PubMed]
- Occupational Safety and Health Administration. Occupational injury and illness recording and reporting requirements, NAICS update and reporting revisions. Fed. Regist. 2014, 79, 56130–56188. [Google Scholar]
- Occupational Safety and Health Administration. 29 CFR 1904.39: Reporting Fatalities, Hospitalizations, Amputations, and Losses of an Eye as a Result of Work-Related Incidents to OSHA; U.S. Department of Labor: Washington, DC, USA, 2026.
- Alsharef, A.; Albert, A.; Awolusi, I.; Jaselskis, E. Severe injuries among construction workers: Insights from OSHA’s new severe injury reporting program. Saf. Sci. 2023, 163, 106126. [Google Scholar] [CrossRef] [Scilit]
- Williams, A.A.; Marc, J. Traumatic workplace injuries: A cross-sectional analysis of OSHA severe injury reports, including the impacts of seasonality and COVID-19 from 2015 to 2022. J. Saf. Res. 2024, 91, 38–49. [Google Scholar] [CrossRef] [Scilit] [PubMed]
- Cao, Y.; Qu, Z.; Wu, S.; Chen, Y.; Skitmore, M.; Ma, X.; Wang, J. Analyzing OSHA Construction Accident Reports Using BERTopic Topic Modeling for Thematic Insights. Buildings 2026, 16, 10. [Google Scholar] [CrossRef] [Scilit]
- Wang, J.; Wu, S.; Qu, Z.; Shen, J.; Memon, S.A.; Skitmore, M.; Ma, L. Classifying OSHA construction accident reports: Leveraging ensemble learning and lightweight large language models (l-LLMs). Eng. Constr. Archit. Manag. 2025, 1–28. [Google Scholar] [CrossRef] [Scilit]
- Ovid, A.; Albert, A.; Alsharef, A.; Uddin, S.M.J.; Chen, G. Automated Classification of Construction Incident Reports: A Systematic Review and Evaluation of Models. In Construction Research Congress 2026; ACSE: Reston, VA, USA, 2026; pp. 858–867. [Google Scholar] [CrossRef] [Scilit]
- Fredricks, T.K.; Abudayyeh, O.; Choi, S.D.; Wiersma, M.; Charles, M. Occupational injuries and fatalities in the roofing contracting industry. J. Constr. Eng. Manag. 2005, 131, 1233–1240. [Google Scholar] [CrossRef] [Scilit]
- Dong, X.S.; Choi, S.D.; Borchardt, J.G.; Wang, X.; Largay, J.A. Fatal falls from roofs among U.S. construction workers. J. Saf. Res. 2013, 44, 17–24. [Google Scholar] [CrossRef] [Scilit] [PubMed]
- Sa, J.; Seo, D.C.; Choi, S.D. Comparison of risk factors for falls from height between commercial and residential roofers. J. Saf. Res. 2009, 40, 1–6. [Google Scholar] [CrossRef] [Scilit] [PubMed]
- National Institute for Occupational Safety and Health. Struck-by Injuries in the Construction Sector: Common Hazards, Barriers, and Opportunities to Keep Workers Safe; NIOSH Science Bulletin, 2023. Available online: https://www.cdc.gov/niosh/bulletin/2023/struck-by-stand-down.html (accessed on 30 August 2026).
- Li, Y.; Bai, Y. Development of crash-severity-index models for the measurement of work zone risk levels. Accid. Anal. Prev. 2008, 40, 1724–1731. [Google Scholar] [CrossRef] [Scilit] [PubMed]
- Li, Y.; Bai, Y. Highway work zone risk factors and their impact on crash severity. J. Transp. Eng. 2009, 135, 694–701. [Google Scholar] [CrossRef] [Scilit]
- Chi, C.F.; Yang, C.C.; Chen, Z.L. In-depth accident analysis of electrical fatalities in the construction industry. Int. J. Ind. Ergon. 2009, 39, 635–644. [Google Scholar] [CrossRef] [Scilit]
- Hatipkarasulu, Y. Project level analysis of special trade contractor fatalities using accident investigation reports. J. Saf. Res. 2010, 41, 451–457. [Google Scholar] [CrossRef] [Scilit] [PubMed]
- Małysa, T. Relative Risk (RR) Analysis and Prediction as Part of Assessing Occupational Safety and Determining Priorities for Action in Occupational Health and Safety in the Construction Industry in Poland. Buildings 2023, 13, 1304. [Google Scholar] [CrossRef] [Scilit]
- Onuchukwu, I.S.; Gholizadeh, P.; Liko, G.; Esmaeili, B. Nature of Occupational Incidents among Roofing Contractors: A Data Mining Approach. Buildings 2024, 14, 595. [Google Scholar] [CrossRef] [Scilit]
- Ruser, J.W. Denominator choice in the calculation of workplace fatality rates. Am. J. Ind. Med. 1998, 33, 151–156. [Google Scholar] [CrossRef]
- Richardson, D.B.; Loomis, D.; Bailer, A.J.; Bena, J. The effect of rate denominator source on U.S. fatal occupational injury rate estimates. Am. J. Ind. Med. 2004, 46, 261–270. [Google Scholar] [CrossRef] [Scilit] [PubMed]
- Occupational Safety and Health Administration. Severe Injury Reports Dataset; U.S. Department of Labor: Washington, DC, USA, 2026.
- Bureau of Labor Statistics. Occupational Injury and Illness Classification Manual, Version 2.01; U.S. Department of Labor: Washington, DC, USA, 2012.
- Northwood, J.M.; Sygnatur, E.F.; Windau, J.A. Updated BLS Occupational Injury and Illness Classification System. Mon. Labor Rev. 2012, 135, 19. [Google Scholar] [CrossRef] [Scilit][Green Version]
- Bureau of Labor Statistics. Quarterly Census of Employment and Wages Overview; U.S. Department of Labor: Washington, DC, USA, 2026.
- Bureau of Labor Statistics. Quarterly Census of Employment and Wages Handbook of Methods; U.S. Department of Labor: Washington, DC, USA, 2026.
- Cohen, J. Statistical Power Analysis for the Behavioral Sciences, 2nd ed.; Lawrence Erlbaum Associates: Hillsdale, NJ, USA, 1988. [Google Scholar]
- Bergsma, W. A bias correction for Cramer’s V and Tschuprow’s T. J. Korean Stat. Soc. 2013, 42, 323–328. [Google Scholar] [CrossRef] [Scilit]
- Sharpe, D. Your chi-square test is statistically significant: Now what? Pract. Assess. Res. Eval. 2015, 20, 8. [Google Scholar]
- Benjamini, Y.; Hochberg, Y. Controlling the false discovery rate: A practical and powerful approach to multiple testing. J. R. Stat. Soc. Ser. B 1995, 57, 289–300. [Google Scholar] [CrossRef] [Scilit]
- Agresti, A. Categorical Data Analysis, 3rd ed.; Wiley: Hoboken, NJ, USA, 2013. [Google Scholar]
- Clopper, C.J.; Pearson, E.S. The use of confidence or fiducial limits illustrated in the case of the binomial. Biometrika 1934, 26, 404–413. [Google Scholar] [CrossRef]
- Wu, J.Z.; Pan, C.S.; Wimer, B.M.; Rosen, C.L. Finite element simulations of the head-brain responses to the top impacts of a construction helmet: Effects of the neck and body mass. Proc. Inst. Mech. Eng. Part H J. Eng. Med. 2017, 231, 58–68. [Google Scholar] [CrossRef] [Scilit] [PubMed]
- Ovid, A.; Albert, A.; Choi, S.D.; Namian, M. Upgrading Head Protection: Supporting the Transition from Type I Hard Hats to Type II Safety Helmets. In Construction Research Congress 2026; ACSE: Reston, VA, USA, 2026; pp. 1289–1298. [Google Scholar] [CrossRef] [Scilit]
- Dong, X.S.; Fujimoto, A.; Ringen, K.; Stafford, E.; Platner, J.W.; Gittleman, J.L.; Wang, X. Injury underreporting among small establishments in the construction industry. Am. J. Ind. Med. 2011, 54, 339–349. [Google Scholar] [CrossRef] [Scilit] [PubMed]
- Wuellner, S.E.; Bonauto, D.K. Exploring the relationship between employer recordkeeping and underreporting in the BLS Survey of Occupational Injuries and Illnesses. Am. J. Ind. Med. 2014, 57, 1133–1143. [Google Scholar] [CrossRef] [Scilit] [PubMed]
- Michaels, D. Year one of OSHA’s severe injury reporting program: An impact evaluation. In Occupational Safety and Health Administration; U.S. Department of Labor: Washington, DC, USA, 2016. [Google Scholar]

Disclaimer/Publisher’s Note: The statements, opinions and data contained in all publications are solely those of the individual author(s) and contributor(s) and not of MDPI and/or the editor(s). MDPI and/or the editor(s) disclaim responsibility for any injury to people or property resulting from any ideas, methods, instructions or products referred to in the content. |
© 2026 by the authors. Licensee MDPI, Basel, Switzerland. This article is an open access article distributed under the terms and conditions of the Creative Commons Attribution (CC BY) license.