


Abstract
Large-scale international Engineering, Procurement, and Construction (EPC) projects undertaken for startup owners involve substantial transactional and financial risks that may not be adequately captured by conventional Failure Mode and Effects Analysis (FMEA), which assumes equal weighting of risk factors and rational decision-making. This study develops an integrated risk assessment framework combining the Modified Delphi Method (MDM), Step-wise Weight Assessment Ratio Analysis (SWARA), FMEA, Prospect Theory, and Decision-Making Trial and Evaluation Laboratory (DEMATEL) to identify, weight, behaviorally adjust, and analyze the causal relationships among EPC risks. A large international EPC turnkey project was examined using assessments from seven senior managers, resulting in 25 risk indicators across five dimensions. The results show that severity is the most influential risk factor, accounting for 43.5% of the total weight. Incorporating a prospect-theoretic transformation of the expert ratings alters conventional risk rankings, with owner insolvency, funding-chain disruptions, and liability-cap risks emerging among the nine most critical risks. DEMATEL further identifies Owner Relationship Risk and Contractual Risk as the primary causal dimensions, whereas Financial Risk represents the major outcome dimension. Sensitivity analyses of the criterion weights, prospect-theory parameters and reference point, together with expert-level bootstrapping, indicate that the high-priority risk set is robust, although the exact order within it is less certain. The proposed framework integrates behavioral preferences into EPC risk assessment; because it was validated retrospectively on a completed project, it is proposed as a basis for risk prioritization and bid-stage governance in future prospective applications.
1. Introduction
As global trade and technological investment continue to expand, international Engineering, Procurement, and Construction (EPC) contracting has become an important indicator of firms’ international competitiveness. In large-scale EPC projects, the characteristics of the project owner can be as consequential as the engineering scope itself. This issue is particularly relevant when contractors serve startup owners, which are typically characterized by rapid growth, limited financial reserves, and relatively immature project-management capabilities. At the tendering stage, such owners may also impose stringent risk-transfer arrangements, including Guaranteed Maximum Price (GMP) and Lump Sum Turnkey (LSTK) contracts, potentially exposing contractors to substantial cost overruns and counterparty solvency risks.
These contractual arrangements can create substantial risk asymmetry by transferring uncertainty from owners to contractors. Funding interruptions, disputed change orders, or performance-bond claims may consequently lead to cash-flow pressures, legal disputes, and potentially unrecoverable losses. Previous research has demonstrated that contractor financial distress can be associated with counterparty and contractual characteristics [1], highlighting the importance of identifying high-risk owner relationships at an early stage. Moreover, EPC risk is not purely financial or operational. Under high uncertainty and pressure, managerial decisions may be influenced by behavioral tendencies such as escalation of commitment and loss aversion [2,3,4]. Conventional engineering risk-assessment approaches generally do not explicitly account for such behavioral characteristics.
Failure Mode and Effects Analysis (FMEA) remains one of the most widely used approaches for risk prioritization in engineering and project management. Traditional FMEA calculates the Risk Priority Number (RPN) by multiplying Severity (S), Occurrence (O), and Detection (D) [5,6]. However, the conventional RPN framework assumes that these three factors have equal importance and are independent, which may result in non-unique scores and limited discrimination among failure modes [7,8]. To address these limitations, numerous studies have integrated FMEA with Multiple Criteria Decision-Making (MCDM) methods. For example, Analytic Hierarchy Process (AHP) has been applied to assign differential weights to risk factors; however, its extensive pairwise comparisons can impose a considerable cognitive burden on decision-maker respondents [9]. Step-wise Weight Assessment Ratio Analysis (SWARA) provides a more parsimonious alternative by requiring decision-makers to rank criteria and evaluate their relative importance sequentially, and has subsequently been incorporated into FMEA-based risk assessment [10,11,12].
Recent FMEA-MCDM studies have further improved the mathematical treatment of uncertainty and interdependence. For instance, interval-based models have been combined with Technique for Order Preference by Similarity to Ideal Solution (TOPSIS) to enhance the discrimination of uncertain risk assessments, while dependency-based FMEA models have been developed to account for interactions among failure modes [7,13]. Nevertheless, these approaches primarily improve the mathematical representation of risk and generally remain focused on what risks should be prioritized rather than how decision-makers psychologically perceive those risks. This distinction is particularly important in EPC projects involving financially vulnerable startup owners, where the perceived consequences of potential losses may differ substantially from their objective magnitudes. Prospect Theory provides a behavioral perspective for addressing this limitation. Kahneman and Tversky [14] demonstrated that individuals evaluate outcomes relative to a reference point and tend to exhibit loss aversion, whereby losses exert greater psychological impact than equivalent gains [15]. This perspective is particularly relevant to EPC contractors that must determine whether to continue or withdraw from financially distressed projects. Previous studies have incorporated Prospect Theory into FMEA-based risk assessment to account for decision-makers’ nonlinear risk perceptions [16,17,18]. Meanwhile, Decision-Making Trial and Evaluation Laboratory (DEMATEL) has been widely used to identify causal relationships among risk factors rather than treating them as independent elements [19].
Despite these advances, an important research gap remains. Existing studies have rarely integrated criterion weighting, behavioral risk perception, and causal risk analysis into a unified framework for international EPC projects involving startup owners. Existing FMEA-MCDM models primarily focus on weighted risk ranking, whereas DEMATEL-based studies generally emphasize causal relationships without identifying the most critical individual failure modes. Furthermore, conventional construction-risk inventories rarely address the owner-induced financial risk transfer and moral-hazard characteristics associated with startup-owner projects. Consequently, there remains a gap between conventional risk metrics and the behavioral and systemic mechanisms underlying contractors’ risk decisions.
To address this gap, this study develops an integrated five-stage risk assessment framework for large-scale international EPC projects involving startup owners. First, a structured literature review establishes an initial risk inventory, followed by the Modified Delphi Method (MDM) to identify and validate relevant risk indicators. Second, SWARA is employed to determine the relative importance of the FMEA factors of Severity, Occurrence, and Detection, thereby relaxing the conventional equal-weighting assumption. Third, the resulting weights are combined with decision-makers’ assessments to derive a Weighted Risk Priority Number (W_RPN). Fourth, Prospect Theory is incorporated to transform risk perceptions relative to a group-mean reference point and derive a Psychologically-perceived Risk Priority Number (PRPN). Finally, DEMATEL is applied at the dimension level to identify causal and effect dimensions within the EPC risk system.
Accordingly, this study addresses three research questions. RQ1: How do senior decision-makers weight severity, occurrence and detection, and which failure modes are prioritized in EPC projects involving startup owners? RQ2: How does incorporating prospect-theoretic loss aversion change risk priorities relative to a weighted RPN, and how robust is this change to the behavioral parameter assumptions? RQ3: What causal structure links the five risk dimensions, and how can the combined results inform bid-stage risk governance? Because the framework is applied retrospectively to a completed project, the study constitutes a retrospective validation of a framework intended for prospective use at the bidding stage.
The individual methods used in this study, namely MDM, SWARA, FMEA, Prospect Theory and DEMATEL, are well established; the contribution of this study therefore lies in their combination and contextualization rather than in the development of a new method. Within this scope, the study makes three contributions. First, it makes the behavioral adjustment explicit by incorporating loss aversion into the risk-priority calculation rather than treating behavioral effects only as an interpretive consideration. Second, it interprets the behaviorally adjusted priorities together with DEMATEL-based causal analysis, so that the two provide complementary evidence on which risks are prioritized and which dimensions drive the risk system. Third, and most distinctively relative to the existing FMEA-MCDM literature, it translates EPC counterparty risk in startup-owner projects into two explicit mechanisms, owner-induced financial risk transfer and contractual moral hazard, and operationalizes them in a 25-indicator inventory, thereby extending FMEA-MCDM risk assessment from generic construction-risk taxonomies to counterparty risk. Together, these elements provide a replicable basis for bid-stage risk governance when contractors engage financially vulnerable owners.
2. Literature Review
This section reviews the theoretical and methodological foundations of the proposed risk assessment framework. The literature is organized into four interconnected streams. Section 2.1 examines the risk characteristics of international EPC projects involving startup owners, with particular emphasis on contractual asymmetry, financial vulnerability, and owner-induced risk transfer. Section 2.2 reviews the evolution of FMEA and MCDM approaches and discusses the limitations of conventional risk prioritization. Section 2.3 introduces behavioral decision theory, particularly Prospect Theory, to explain how loss aversion and escalation of commitment may influence risk perception. Section 2.4 examines DEMATEL as a tool for identifying causal relationships among risk dimensions and synthesizes the reviewed literature to establish the research gap addressed by this study.
2.1. EPC Contracting and the Startup-Owner Risk Context
International Engineering, Procurement, and Construction (EPC) contracting operates under persistent cost and margin pressures, as owners increasingly seek tighter control over capital expenditure while contractors are required to enhance technological and organizational capabilities to maintain profitability [20]. These pressures are further amplified by the asymmetric allocation of contractual risk. Under the Silver Book of the International Federation of Consulting Engineers (FIDIC), contractors undertaking Lump Sum Turnkey (LSTK) projects assume substantial responsibility for unforeseen physical conditions and, in certain circumstances, deficiencies in owner-provided requirements [21]. Such contractual asymmetry, together with weak governance and limited mutual trust, can adversely affect supply-chain performance and increase the potential for moral hazard [22,23].
These challenges can be particularly pronounced when the project owner is a startup. Startups typically operate under evolving business models and depend heavily on external equity or venture financing rather than established internal cash flows [24]. Consequently, financing interruptions may rapidly affect their ability to meet contractual payment obligations. Blank [25] characterizes startups as temporary organizations searching for a scalable and repeatable business model, implying that their technical specifications and organizational structures may remain relatively immature. Consistent with this perspective, Vitvarová [26] reports that startup production processes are often still at the pilot or early commercialization stage, limiting the operational experience required to stabilize engineering specifications. Picken [27] further notes that rapidly growing startups may struggle to establish formal project-management capabilities, resulting in concentrated decision-making and governance structures that may be inadequate for large-scale capital projects. From the contractor’s perspective, such financial vulnerability is consequential because counterparty characteristics can contribute to contractor financial distress, while substantial project losses may have prolonged effects on a firm’s financial position and creditworthiness [1].
For the purpose of this study, a startup owner is operationally defined as an owner that, at contract award, (i) had been incorporated for fewer than eight years; (ii) was pursuing a business model or production technology not yet commercially proven [25,26]; and (iii) depended on external financing for project capital expenditure without an effective credit backstop, either because no parent company guarantee existed or because the guarantor lacked the capacity to honor it [24].
Two related mechanisms are particularly relevant to startup-owner EPC projects. First, owner-induced financial risk transfer may occur when financial constraints lead to delayed milestone payments, disputed change orders, or disagreements over acceptance criteria, thereby transferring financial pressure from the owner to the contractor. Second, contractual moral hazard may emerge when fixed-price or capped-price arrangements reduce the owner’s incentive to share execution risks equitably. These mechanisms may become more pronounced when startup owners face pressure from boards and financing partners to conserve capital. Thus, startup-owner EPC risk should be viewed not simply as a conventional construction risk category but as an emergent characteristic of a financially interdependent contracting relationship.
Another distinctive feature is the potential instability of the owner’s underlying technology. In large plant-construction and technology-intensive EPC projects, the owner’s production technology may still be evolving when the EPC contract is executed. Vitvarová [26] indicates that startup production processes frequently remain at the pilot or first-commercial-demonstration stage. Consequently, design modifications may arise from the owner’s evolving process knowledge rather than contractor deficiencies. This characteristic creates a distinctive execution-risk profile that may be less prevalent in projects involving established owners with mature technologies and standardized specifications.
2.2. Evolution of Risk Assessment and Multi-Criteria Decision-Making Methods
Construction risk management has evolved from relatively narrow assessments of cost and schedule uncertainty toward more systematic and multidimensional risk-management frameworks [28,29]. Failure Mode and Effects Analysis (FMEA), originally formalized in the U.S. Department of Defense standard MIL-STD-1629A [5], has become a widely adopted technique for engineering risk assessment. Traditional FMEA evaluates failure modes according to Severity (S), Occurrence (O), and Detection (D), and calculates the Risk Priority Number (RPN) as their product [6]. Despite its widespread application, conventional FMEA has several methodological limitations. First, it implicitly assumes equal importance among S, O, and D, although experts from different functional backgrounds may assign substantially different importance to these factors [30]. Second, the multiplicative RPN formulation can generate identical scores from different combinations of S, O, and D, thereby reducing its ability to discriminate among fundamentally different risk profiles [7,13].
Multiple Criteria Decision-Making (MCDM) techniques have therefore been increasingly integrated with FMEA to address these limitations. The Analytic Hierarchy Process (AHP), proposed by Saaty [31], uses pairwise comparisons to derive criterion weights and remains one of the most influential MCDM approaches [9]. However, the number of comparisons increases substantially with the number of criteria, reaching n(n − 1)/2 comparisons for n criteria. This requirement can impose a considerable cognitive burden when evaluating large EPC risk inventories. The Step-wise Weight Assessment Ratio Analysis (SWARA), introduced by Keršulienė et al. [10] and further developed by Zolfani and Šaparauskas [32] and Alinezhad and Khalili [33], provides a more efficient alternative. Rather than requiring extensive pairwise comparisons, SWARA asks decision-makers to rank criteria and assess the relative importance of adjacent criteria. This substantially reduces the elicitation burden while retaining both ordinal and cardinal information. Its efficiency is particularly advantageous when risk assessment relies on a limited panel of senior decision-makers with substantial domain knowledge but limited availability [11].
Recent studies have further incorporated uncertainty and interdependence into FMEA-MCDM models. Interval-based approaches have been combined with TOPSIS to improve risk discrimination under uncertain assessments, while dependency-oriented FMEA models have been developed to capture interactions among failure modes [7,13]. Nevertheless, these approaches primarily address the mathematical representation and prioritization of risk and provide comparatively limited insight into the behavioral mechanisms underlying decision-makers’ risk perceptions.
2.3. Behavioral Decision Theory and the Psychology of Loss
While conventional risk assessment generally assumes rational decision-making, behavioral decision research demonstrates that individuals may systematically deviate from expected-utility assumptions when evaluating uncertain outcomes. Prospect Theory, developed by Kahneman and Tversky [14], proposes that decision-makers evaluate outcomes relative to a reference point rather than according to absolute levels of wealth or utility. A central feature of the theory is loss aversion, whereby losses generally exert a greater psychological impact than equivalent gains. Cumulative Prospect Theory further formalizes this asymmetric valuation and suggests that the psychological impact of a loss can be substantially greater than that of an equivalent gain [15]. This perspective is particularly relevant to contractors evaluating projects involving financially vulnerable startup owners. The perceived risk of a potential loss may therefore exceed that implied by conventional magnitude-based measures such as RPN. Behavioral considerations may consequently alter the prioritization of risks even when their objective characteristics remain unchanged.
Another relevant behavioral phenomenon is escalation of commitment. Staw [2] demonstrates that decision-makers who have committed resources to a prior decision may continue investing despite unfavorable feedback. A subsequent meta-analysis by Sleesman et al. [3] indicates that this tendency becomes particularly pronounced when project completion appears attainable and sunk costs are salient. These conditions are common in large EPC projects, where substantial financial and organizational resources may already have been committed before emerging risks become fully apparent.
Several studies have incorporated Prospect Theory into FMEA-based risk assessment. Wang et al. [16] integrated Prospect Theory with the Choquet integral for FMEA risk evaluation, while Wang et al. [30] developed a hybrid FMEA framework incorporating decision-makers’ psychological behavior. Sagnak et al. [17] applied Prospect Theory to FMEA-based quality-risk assessment, and Fu et al. [18] incorporated Cumulative Prospect Theory into railway risk prioritization. Although these studies demonstrate the value of behavioral adjustment in risk assessment, they do not specifically address EPC contracting involving startup owners. Moreover, the integration of behavioral risk adjustment with an efficient weighting technique such as SWARA and a causal analysis technique such as DEMATEL remains underexplored.
2.4. Causal Structure and the Need for an Integrated Framework
Risk prioritization alone cannot fully explain the mechanisms through which risks emerge and interact. Whether based on conventional RPN, MCDM-weighted FMEA, or Prospect-Theory-adjusted FMEA, ranking-based approaches primarily identify which risks are important but provide limited information about why these risks occur or which factors act as their underlying causes. The Decision-Making Trial and Evaluation Laboratory (DEMATEL), developed by Gabus and Fontela [34], provides a systematic approach for analyzing such causal relationships. By collecting decision-makers’ assessments of the degree of influence among factors, DEMATEL constructs a total-relation matrix from which the prominence and causal characteristics of each factor can be determined. Specifically, d + r represents the overall prominence of a factor within the system, whereas d − r distinguishes causal factors from effect factors [19]. DEMATEL has therefore been applied in construction and engineering risk studies to identify interdependencies that cannot be captured through independent risk-ranking approaches. However, DEMATEL does not explicitly account for the psychological importance that decision-makers attach to individual risks. A risk dimension may function as a major systemic cause while receiving relatively limited psychological attention from decision-makers. Conversely, a risk with strong psychological salience may not necessarily constitute a fundamental causal driver. Accordingly, causal analysis and behavioral risk prioritization should be viewed as complementary rather than substitutive approaches.
Taken together, the literature reviewed above reveals an important methodological and contextual gap. Existing EPC risk-management research has largely emphasized risk identification, measurement, and response, with comparatively limited attention to the interaction between decision-makers’ psychological perceptions and the causal structure of risk systems [35]. In particular, no prior study identified in this review integrates Modified Delphi Method (MDM)-based indicator screening, SWARA-based criterion weighting, Prospect-Theory-based behavioral recalibration, and DEMATEL-based causal analysis within a unified framework for EPC projects involving startup owners. Furthermore, existing risk taxonomies rarely explicitly capture the owner-induced financial risk transfer and contractual moral-hazard mechanisms associated with startup-owner engagements. This study addresses these gaps not by proposing a new method but by combining established methods for risk identification, efficient weighting, behavioral adjustment, and causal analysis, and by contextualizing them in the two startup-owner mechanisms described in Section 2.1, to provide a more comprehensive basis for EPC risk governance.
3. Methodology
This study develops a five-stage integrated framework for assessing risks in large-scale international EPC projects involving startup owners, as illustrated in Figure 1. The framework sequentially comprises risk indicator screening, criterion weighting, risk assessment, behavioral adjustment, and causal analysis. Each stage addresses a specific limitation of conventional risk assessment and provides the foundation for the subsequent stage.
Figure 1.
Proposed integrated model.
In Stage 1, the Modified Delphi Method (MDM) is employed to identify and validate relevant risk indicators. Stage 2 applies the SWARA to determine the relative importance of the FMEA risk factors. Stage 3 incorporates these weights into FMEA to derive a Weighted Risk Priority Number (W_RPN). Stage 4 applies Prospect Theory to account for decision-makers’ loss-averse risk perceptions and derives a Psychologically-perceived Risk Priority Number (PRPN). Finally, Stage 5 employs the DEMATEL to identify the causal relationships among the major risk dimensions.
Seven senior managers (P1–P7), with professional backgrounds in general management, risk management, finance, legal affairs, and cost management, participated throughout the five stages. Using the same decision panel ensured that criterion weights, risk scores and causal judgments were based on identical indicator definitions and the same case context. However, it may also introduce common method bias; its potential influence is examined in Section 4.6 and discussed in Section 6.
3.1. Failure Modes Screening Using the Modified Delphi Method
An initial set of candidate failure modes was identified through a structured literature review and classified into five dimensions: Financial Risk (F), Contractual Risk (C), Execution Risk (E), Owner Relationship Risk (O), and External Environment Risk (X). The Modified Delphi Method (MDM) was subsequently employed to evaluate the relevance and consensus of the proposed indicators. Compared with the conventional Delphi technique, MDM reduces the number of iterative rounds while maintaining structured expert judgment [36,37].
For each failure mode/indicator i, the geometric mean of the expert ratings is calculated as:
where xi(k) denotes the importance rating assigned to failure mode i by expert k, and K represents the number of experts.
Expert consensus is assessed using the quartile deviation:
where Q1 and Q3 denote the first and third quartiles, respectively.
A failure mode is retained when it simultaneously satisfies:
Gi ≥ 3.5
and
QDi ≤ 0.6.
Failure modes that satisfy only one of these conditions are subjected to a second round of evaluation with anonymized group feedback. This procedure enables indicators with initially divergent judgments to be reassessed while maintaining methodological transparency and expert independence.
The procedure was conducted in two rounds. In Round 1, each expert rated the importance of every candidate failure mode on a five-point scale and could comment on its wording. Failure modes that did not meet both criteria were returned to the experts in Round 2 together with the anonymized Round-1 group statistics (Gi and QDi), and indicator descriptions were refined on the basis of the Round-1 comments. The surveys were completed individually online after a personal or telephone briefing by the researcher, and the experts did not discuss their responses with one another. Failure modes that had not converged after Round 2 were examined with respect to their importance and the source of disagreement, and the effect of retaining them is tested in Section 4.6.
3.2. Criterion Weighting Using SWARA
The three conventional FMEA assessment factors, namely Severity (S), Occurrence (O), and Detection (D), are weighted using the SWARA method. For each expert, the three factors are first ranked according to their perceived importance. The expert then evaluates the relative importance of each factor with respect to the preceding factor using the comparative coefficient sj [10,33].
The coefficient kj is determined as:
The recalculated weight coefficient qj is then obtained recursively:
The normalized weight of factor j is calculated as:
where m = 3 represents the number of FMEA factors.
The individual weights obtained from the seven experts are subsequently aggregated to derive the group weights wS, wO, and wD. Unlike pairwise-comparison approaches such as AHP, SWARA requires only m − 1 comparative judgments, thereby reducing the cognitive burden imposed on senior managers while retaining their relative-importance judgments.
3.3. FMEA-Based Risk Assessment and Weighted RPN
Each senior manager evaluates the retained risk indicators according to Severity, Occurrence, and Detection using a 1–10 scale. Higher scores indicate greater risk; specifically, a higher Detection score represents greater difficulty in detecting the corresponding failure mode.
To overcome the equal-weighting assumption of conventional FMEA, the SWARA-derived weights are incorporated into the RPN calculation. The Weighted Risk Priority Number for risk indicator j is defined as:
where , , and denote the aggregated manager scores for Severity, Occurrence, and Detection, respectively.
This formulation preserves the multiplicative structure of conventional FMEA while relaxing its implicit assumption that the three risk factors contribute equally to overall risk priority.
3.4. Prospect Theory and Psychologically-Perceived Risk Priority
Although W_RPN incorporates differentiated factor weights, it remains fundamentally magnitude-based and does not account for the nonlinear manner in which decision-makers perceive gains and losses. Prospect Theory is therefore introduced to capture behavioral risk preferences, particularly loss aversion [15].
For each FMEA factor, the reference point is defined as the mean score across the failure modes:
where N is the number of failure modes. The mean represents the typical risk level of the assessed portfolio, against which a failure mode is judged to be worse or better; alternative reference points are tested in Section 4.6.
The deviation of failure mode i from the reference point is calculated as:
where f ∈ {S, O, D}.
Xfi = fi − RPf
The Prospect Theory value function is expressed as:
Following Tversky and Kahneman [15], the parameters are specified as α = β = 0.88 and λ = 2.25. These estimates were obtained from experiments with monetary gambles; their transferability to engineering risk judgments is therefore treated as an assumption and examined in Section 4.6. The parameter λ > 1 reflects loss aversion, whereby negative deviations from the reference point receive greater psychological weight than equivalent positive deviations.
The Psychologically-perceived Risk Priority Number (PRPN) is then calculated by combining the prospect-theoretic values with the SWARA-derived weights:
PRPNi = wS v(xS,i) + wO v(xO,i) + wD v(xD,i)
Unlike W_RPN, PRPN may take either positive or negative values. A positive PRPN indicates that the overall risk profile of a failure mode exceeds the defined reference point, whereas a negative value indicates a comparatively lower perceived risk level. This behavioral adjustment enables the proposed framework to distinguish between objective risk magnitude and psychologically perceived risk priority, thereby providing a more behaviorally informed basis for EPC risk prioritization. A weighted additive form is adopted because v(·) takes negative values for below-reference deviations; a multiplicative combination would convert the product of two negative values into a positive one and invert the risk ordering. PRPN is thus a behaviorally informed transformation of the expert ratings rather than a direct measurement of loss-averse behavior.
3.5. DEMATEL-Based Causal Analysis
Following the identification of priority risks, DEMATEL is employed to examine the causal relationships among the five risk dimensions. Each decision-maker evaluates the degree of direct influence exerted by one dimension on another using a 0–4 scale, where 0 indicates no influence and 4 represents very high influence. The survey contained 20 directed pairwise items at the dimension level, and each dimension was presented together with its five constituent failure modes so that the experts evaluated influence between well-defined risk groups. These judgments are aggregated to construct the direct-relation matrix Z = [zij].
The matrix is normalized as follows:
The total-relation matrix is subsequently obtained by incorporating both direct and indirect effects:
For each dimension, the total influence exerted and received are represented by di and ri, respectively:
Two indicators are then derived. Prominence, di + ri, represents the overall importance of a dimension within the causal network. Relation, di − ri, identifies its causal position. A positive value indicates a cause dimension, whereas a negative value indicates an effect dimension [19,34]. Accordingly, DEMATEL complements PRPN by identifying not only the most psychologically salient risks but also the underlying dimensions that generate or transmit risk within the EPC system.
4. Empirical Analysis
This section describes the case background, introduces the profiles of the evaluation team, explains how the failure modes were identified, and presents the subsequent analytical procedures and results.
4.1. Case Description and Decision-Maker Panel
The empirical analysis focuses on an EPC turnkey project for the conversion of an existing petroleum refinery into a biofuel refinery, undertaken by a major Taiwanese EPC contractor with extensive international operations. The lump-sum turnkey scope covered engineering, procurement, construction and project management, including the process equipment. The owner, incorporated in 2016 and active in biofuel production, met the startup-owner criteria defined in Section 2.1: its business was not yet commercially proven, and it financed the project through a project-finance structure supported by a parent company guarantee (PCG). The identities of both the contractor and owner are anonymized to maintain confidentiality. At the bidding stage, the contractor had not yet established a formalized and systematic bid risk review mechanism. Project evaluation was therefore primarily based on business opportunities, preliminary cost estimates, and technical feasibility. During project execution, several risks that had not been adequately anticipated at the bidding stage materialized. The owner’s financing arrangements proved less stable than initially expected, and payment became the principal subject of dispute: invoiced progress payments remained unpaid, a contract amendment was signed to restructure the payment terms, and after completion the owner became insolvent. The parent company was also unable to pay, so the guarantee provided no effective protection. Change-order compensation was also disputed. In addition, changes in project scope and technical specifications increased execution uncertainty. These developments generated substantial financial, contractual, and operational pressures and provide an appropriate empirical context for evaluating the proposed risk assessment framework.
Following the project, the case company established an internal Gate Review procedure for bid risk control. Because this procedure was developed after the risks and losses associated with the case had occurred, the present study is designed as an ex post empirical analysis rather than an assessment of a pre-existing risk control mechanism. The proposed framework is therefore applied retrospectively, and the study should be read as a retrospective validation of a framework intended for prospective use at the bidding stage. Because the Gate Review procedure is an internal document of the case company, it is not analyzed in detail; the governance recommendations in Section 5.3 are derived from the PRPN and DEMATEL results.
Seven senior managers participated in the assessment, including a general manager, chief risk officer, accounting manager, finance manager, legal manager, cost management department manager, and legal and risk control manager. Their professional tenure ranged from 3.5 years (the legal manager, who additionally had more than five years of prior legal practice) to 38 years, with a mean of 23.6 years. All seven managers belonged to the same EPC contractor and were directly involved in the bidding, execution or risk-management decisions of the case project. The composition of the panel provides multidisciplinary expertise covering management, finance, accounting, legal affairs, cost management, and risk control, which are directly relevant to the assessment of EPC projects involving startup owners. Data were collected through individual in-person or telephone briefings, after which each manager completed the surveys independently through an online form; the managers did not discuss their responses with one another. This procedure was adopted to minimize group influence and maintain the independence of individual judgments. The managers’ direct knowledge of the project provides rich contextual information; however, because the assessments were made after the outcomes were known, they may also be affected by hindsight and outcome bias. This possibility is examined in Section 4.6.6 and discussed as a limitation in Section 6.
4.2. Failure Mode Convergence
Based on a structured review of the relevant literature and interviews with senior managers, 25 potential failure modes were identified and classified into five dimensions: Financial Risk (F), Contractual Risk (C), Execution Risk (E), Owner Relationship Risk (O), and External Environment Risk (X). The resulting failure modes are presented in Table 1. The Modified Delphi Method was subsequently employed to evaluate the importance and consensus of these failure modes and to confirm their suitability for subsequent analysis.
Table 1.
The 25 failure modes.
Following the procedure described in Section 3.1, 23 of the 25 indicators satisfied the convergence criteria of Gi ≥ 3.5 and QDi ≤ 0.6, while E3 and O5 were retained despite not fully meeting this criterion, as detailed below. Nineteen indicators reached the predefined convergence criteria in the first round, while four additional failure modes, namely E4, E5, O1, and O4, achieved convergence following a second round incorporating anonymized group feedback. Failure mode E3, namely “Technical Specifications Exceeding Capability Limits,” did not fully satisfy the predefined consensus criterion, although its geometric mean was 4.054. Its quartile deviation was 0.750, exceeding the threshold of 0.6. Nevertheless, the failure mode was retained because the observed disagreement reflected differences in professional perspectives rather than apparent response errors. Specifically, decision-makers with legal and risk control backgrounds considered this risk relatively more manageable through the deliberate selection of technically experienced partners, whereas decision-makers with operational responsibilities assigned greater importance to the risk. This interpretation is consistent with the documented disagreement principle proposed by Beiderbeck et al. [43], which recognizes that persistent disagreement may reflect meaningful differences in professional judgment. Beiderbeck et al. [43] recommend an interquartile range not exceeding 25% of the scale (1.25 on a five-point scale) as a consensus criterion; the threshold QDi ≤ 0.6 used here corresponds to an interquartile range of at most 1.2 (equivalent to at most 1.0 for seven integer ratings) and is therefore stricter. E3 (interquartile range = 1.5) did not reach consensus under either criterion. The importance threshold Gi ≥ 3.5 requires the geometric mean to lie above the scale midpoint. Indicator O5 was also retained. Its first-round score distribution was identical to that of O4, which subsequently achieved convergence in the second round. O5 was not included in the second round because of an administrative omission. Given the identical first-round distribution and its substantive relevance to the risk context, the indicator was retained for subsequent analysis. We acknowledge that this is a procedural limitation rather than a methodological choice; Section 4.6.4 shows that excluding E3, O5 or both does not change the high-priority risk set.
Consequently, all 25 failure modes identified during the initial screening process were retained across the five risk dimensions. Notably, none of the candidate failure modes was excluded because of insufficient perceived importance, as all indicators satisfied the minimum importance criterion. This finding suggests that the initial literature-based risk inventory provides broad coverage of the risk characteristics associated with EPC projects involving startup owners and provides an appropriate basis for the subsequent SWARA, FMEA, Prospect Theory, and DEMATEL analyses. In this study, the MDM therefore served as a content-validity check of the literature-derived inventory and as a means of refining indicator wording (e.g., X5), rather than as an elimination filter.
4.3. Assessment Risk Factor Weights
Table 2 presents the group weights derived using the SWARA method for the three FMEA risk factors. Severity was unanimously identified as the most important factor by all seven managers, regardless of their functional backgrounds. This finding indicates that the potential magnitude of loss constitutes the primary consideration in EPC risk assessment, outweighing the likelihood of occurrence and the difficulty of detection. Such a preference may reflect the high financial exposure and potentially irreversible consequences associated with EPC project failures. Occurrence and Detection were assigned relatively similar secondary weights of 27.6% and 28.9%, respectively. However, differences emerged across functional backgrounds. Decision-makers from general management, risk control, and cost management assigned greater importance to Occurrence, whereas managers from finance, legal affairs, and legal and risk control placed greater emphasis on Detection. This distinction may reflect differences in professional perspectives, with the latter group placing greater emphasis on early risk identification and contractual protection mechanisms. The accounting manager assigned nearly equal importance to all three factors, indicating no substantial preference among Severity, Occurrence, and Detection. Nevertheless, this individual assessment had little influence on the aggregated results. The consistency of the remaining decision-maker assessments therefore suggests that the dominant weighting assigned to Severity represents a shared priority among the decision panel rather than the influence of an individual outlier.
Table 2.
SWARA group weights for the FMEA assessment factors.
4.4. Weighted vs. Psychologically-Perceived Risk Ranking
Following completion of the SWARA analysis, the panel of managers evaluated the 25 failure modes against the different risk factors (S, O, D), with the mean evaluation results presented in Table 3. Combining the SWARA-derived weights with the manager assessments of Severity, Occurrence, and Detection using Equation (6) yields the W_RPN ranking. The Prospect Theory transformation specified in Equations (7)–(10) subsequently generates the PRPN ranking. Nine of the 25 risk indicators obtain positive PRPN values, indicating that their transformed risk levels exceed the collective reference point of the decision panel. Because the number of positive values depends partly on the choice of reference point (Section 4.6.3), the critical risk set is defined as the nine highest-ranked indicators rather than by the sign of PRPN; under the baseline reference point, the two definitions coincide. Table 3 presents their W_RPN and PRPN values and corresponding rankings, while Figure 2 illustrates the PRPN rankings of all 25 indicators.
Table 3.
W_RPN and PRPN results and rankings.
Figure 2.
PRPN ranking of the 25 failure modes.
At the lower end of the PRPN ranking, O3, “Turnover of Owner’s Senior Management,” O4, “Insufficient Owner Governance Capability,” and C5, “Abusive Call on the Performance Bond,” obtain the most negative PRPN values. These results do not imply that these risks are insignificant. Rather, their S, O, and D scores are generally close to or below the corresponding reference points, resulting in limited positive psychological valuation under the Prospect Theory transformation. From the perspective of the decision panel, these risks therefore represent areas for which the organization may already possess relatively adequate preparedness, whereas the critical risk set indicates exposures that exceed the level of risk the panel considers acceptable.
X1, “Owner’s Insolvency or Acquisition,” clearly ranks first by a substantial margin. F1, “Break in Owner’s Funding Chain,” and X2, “Owner’s Financing Failure,” further reinforce the importance of owner financial stability and payment security. Together, these indicators constitute the most prominent psychologically perceived risk cluster identified in the case.
The comparison between W_RPN and PRPN also reveals several meaningful changes in risk priorities. F3 increases from eighth under W_RPN to third under PRPN because its Severity and Occurrence scores are both above their respective reference points. The nonlinear Prospect Theory value function consequently amplifies their combined psychological effect. In contrast, X5, “Impact of Force Majeure Events,” declines from ninth to tenth because its relatively low Occurrence score, which is below the reference point, offsets part of the psychological contribution associated with its Severity and Detection scores. These changes show how the prospect-theoretic transformation re-weights combinations of above- and below-reference scores in a way that a magnitude-based index does not.
Notably, X1 remains the highest-ranked indicator under conventional RPN, W_RPN, and PRPN, demonstrating that its dominance is robust to both differential weighting and behavioral adjustment. This finding is further examined through the sensitivity analysis in Section 4.6. Conversely, E1 and E2, which exhibit relatively high Occurrence scores but moderate Severity scores, decline in priority after the application of the severity-dominant SWARA weights and Prospect Theory transformation. The proposed framework therefore provides greater discrimination between frequently occurring but manageable risks and less frequent risks with potentially catastrophic consequences.
4.5. Causal Relationship Among Risk Dimensions
Table 4 presents the initial direct influence matrix derived from the managers’ judgments. The total influence matrix was subsequently calculated using Equations (11) and (12), as reported in Table 5. Table 6 presents the dimension-level DEMATEL results obtained using Equation (13). Owner Relationship Risk (O) exhibits the highest net causal degree (d − r = +0.9098), indicating that it is the strongest causal dimension in the group-average matrix; together with Contractual Risk, it forms the principal causal core of the risk system (see the bootstrap results in Section 4.6.5). Contractual Risk (C) has the highest centrality (d + r = 9.8644), suggesting that it is the most prominent and highly interconnected dimension, linking owner-related problems with downstream financial and execution risks. External Environment Risk (X) has a relatively low positive net causal degree (d − r = +0.2733), suggesting that its influence is primarily indirect and operates by exacerbating the owner’s existing financial vulnerability rather than directly initiating the risk cascade. In contrast, Financial Risk (F) has the lowest net causal degree (d − r = −1.3713), identifying it as the strongest effect dimension and suggesting that financial losses represent the terminal consequence of the risk system rather than an independent primary cause. Execution Risk (E) is also classified as an effect dimension, although its negative net causal degree is comparatively moderate (d − r = −0.5344).
Table 4.
Initial direct influence matrix.
Table 5.
Total influence matrix.
Table 6.
DEMATEL causal-relationship results by risk dimension.
According to Table 6, with d + r as the horizontal axis and d − r as the vertical axis, a causal diagram among the risk dimensions can be obtained, as shown in Figure 3. Owner relationship and contractual risk are the principal cause dimensions, external environment risk is a weak cause dimension, and execution and financial risk are effect dimensions.
Figure 3.
DEMATEL cause-effect diagram of the five risk dimensions.
Reading Table 3 and Table 6 together with Figure 3 reveals a phenomenon that merits particular attention. Individual owner relationship indicators, such as O1 and O4, rank near the bottom of the PRPN list, suggesting that managers do not, in isolation, perceive them as major psychological threats. However, the Owner Relationship dimension to which these indicators belong emerges as the strongest causal dimension in the system. In other words, the risks that senior decision-makers feel most acutely, namely financial loss, are largely downstream effects, whereas the risks that structurally drive the system, namely owner relationship quality, are comparatively under-weighted in immediate psychological perception. Because PRPN and DEMATEL measure different constructs, namely the transformed priority of individual indicators and the influence flow between dimensions, this contrast is best regarded as complementary evidence rather than a counterintuitive discovery. Notably, the causal position of O does not arise merely from high outgoing influence ratings, as the contractual dimension received similar or higher outgoing ratings (e.g., C → F = 3.571 and C → E = 3.571). O stands out mainly because it received the lowest incoming influence of all dimensions (r = 4.2386); that is, the experts judged the other dimensions to rarely drive the owner relationship. This complementary perspective is discussed further in Section 5.
A closely related observation concerns External Environment Risk (X). Although X1 and X2 are the two individual indicators with the highest PRPN values in the entire study, the External Environment dimension as a whole exhibits only a modest cause degree (d − r = 0.2733) in the DEMATEL analysis. This apparent tension can be resolved once the underlying mechanism is made explicit. X1 and X2 (owner insolvency and financing failure) are best understood not as an independent, direct cause of downstream risk in the DEMATEL sense, but rather as the point at which an already fragile owner’s external environment converts a pre-existing financial vulnerability into a realized crisis. External environment shocks therefore appear to function as a trigger or amplifier layered upon the causal structure generated by owner relationship and contractual weaknesses, rather than as an independent root cause in their own right. This distinction also explains why X1 and X2 register such extreme psychological salience individually, even though their parent dimension’s DEMATEL cause degree is comparatively modest.
4.6. Sensitivity and Robustness Analysis
4.6.1. Criterion Weights
Perturbing wS, wO, and wD by ±10% in six separate scenarios left the composition of the high-risk group essentially unchanged (Table 7): X1 remained ranked first in every scenario, and F1 and F3 also remained within the top five across all six scenarios; C3, E4, and X2 each appeared within the top five in four of the six scenarios, occasionally displacing one another, while the overall composition of the top five otherwise remained broadly stable. In every scenario, the direction of movement was consistent with each failure mode’s own underlying S/O/D score profile rather than appearing arbitrary, which is itself a useful validity check on the model: the ranking responds to weight changes in the direction theory would predict, rather than in an unpredictable or noisy fashion. This confirms that the PRPN ranking reported in Table 3 is not an artifact of one specific weight configuration but reflects a reasonably robust ordering of psychologically-perceived risk, giving decision-makers confidence that the recommended governance priorities in Section 5.3 would not change materially even if the underlying SWARA weights had been elicited somewhat differently.
Table 7.
Comparison of the PRPN top-five rankings across different weights.
4.6.2. Prospect-Theory Parameters
To test whether the results depend on the parameter values of Tversky and Kahneman [15], PRPN was recomputed for all 252 combinations of λ = 1.50–3.00 (step 0.25) and α, β = 0.5–1.0 (step 0.1, varied independently). Spearman’s ρ between each ranking and the baseline ranking ranged from 0.926 to 0.997 (median 0.978). In every combination, at least eight of the nine baseline high-priority failure modes remained among the top nine, and X1 ranked first in 94.8% of the combinations and never lower than second (Figure 4). The priority set is therefore not an artifact of the specific parameter values adopted.
Figure 4.
Sensitivity of the PRPN ranking to λ and α = β: (a) Spearman’s ρ with the baseline ranking; (b) number of baseline top-nine failure modes retained.
4.6.3. Reference Point and Aggregation Structure
The number of positive PRPN values depends partly on the reference point: it is 9 with the mean, 11 with the median and 12 with the scale midpoint (5.5). The high-priority set is therefore defined by rank. Table 8 shows that this set is identical under the mean, the median and the 10% trimmed mean, and that eight of the nine failure modes are retained under the scale midpoint and under the best-observed (ideal) and worst-observed reference points.
Table 8.
PRPN ranking under alternative reference points.
With respect to the aggregation structure, 11 of the 25 failure modes have two negative prospect values. A multiplicative combination would therefore reverse the sign of 18 of the 25 PRPN values, correlate negatively with the baseline ranking (ρ = −0.43) and move X1 from first to 24th position, confirming that the additive form is required. When the prospect values are first shifted to be strictly positive and then aggregated by a weighted geometric mean, the ranking remains almost unchanged (ρ = 0.975; identical top nine).
4.6.4. Retention of E3 and O5
To assess the retention decisions described in Section 4.2, all analyses were repeated with E3 excluded, with O5 excluded and with both excluded, recomputing the reference points in each case. In all three cases, the nine high-priority failure modes were identical to the baseline set, and Spearman’s ρ with the baseline ranking was at least 0.999. The retention of these two failure modes therefore does not affect the conclusions.
4.6.5. Expert Agreement and Bootstrap Confidence
Inter-expert agreement was assessed with Kendall’s coefficient of concordance (W). As shown in Table 9, concordance was statistically significant for Severity and for the DEMATEL influence judgments, but not for Occurrence or Detection. The stronger agreement on Severity is consistent with the unanimous ranking of Severity as the most important factor in the SWARA stage (Section 4.3), whereas the weaker agreement on Occurrence and Detection motivates the bootstrap analysis below.
Table 9.
Inter-expert agreement (Kendall’s W, seven experts).
The seven experts were then resampled with replacement 5000 times. For PRPN, the individual SWARA weights and S/O/D ratings of each drawn expert were resampled jointly; for DEMATEL, the individual direct-influence matrices were resampled. For PRPN, the separation between high- and low-priority failure modes is robust, whereas the exact order within the high-priority group is less certain (Figure 5): X1, C1, F1 and E4 entered the top nine in 93%, 86%, 80% and 77% of the resamples, respectively, whereas O3 and O4 never did. A leave-one-expert-out analysis yielded Spearman’s ρ values of 0.85–0.96 with the baseline ranking and retained seven or eight of the nine high-priority failure modes. The results are therefore interpreted as priority tiers rather than as exact ranks.
Figure 5.
Expert-level bootstrap of PRPN ranks (5000 resamples): median rank (dot), 95% interval (line), baseline rank (bar) and probability of entering the top nine.
For DEMATEL (Table 10), Owner Relationship Risk was a cause dimension in all resamples and the strongest cause in 66.7% of them, with Contractual Risk the strongest cause in most of the remainder. Financial Risk was an effect dimension in all resamples and the strongest effect in 89.2%, and Contractual Risk had the highest prominence in 72.1%. In a leave-one-expert-out analysis, Financial Risk was the strongest effect and Contractual Risk the most prominent dimension in all seven runs, and Owner Relationship Risk was the strongest cause in five runs (Contractual Risk in the other two). The causal role of External Environment Risk was weak and uncertain.
Table 10.
Expert-level bootstrap of the DEMATEL results (5000 resamples).
4.6.6. Hindsight-Bias Diagnostic
Because the ratings were elicited after project completion, they may be affected by hindsight and outcome bias [44]. Hindsight bias should primarily inflate the judged likelihood of events that actually occurred. The group ratings of the 11 failure modes that materialized in the case (F1, F2, F3, C1, C2, C3, C4, E1, X1, X2 and X5) were therefore compared with those of the 14 that did not. Occurrence (4.95 vs. 5.07; Mann–Whitney p = 0.545) and Detection (5.17 vs. 5.23; p = 0.641) did not differ, whereas Severity was higher for the materialized failure modes (7.49 vs. 6.04; p < 0.001). Hence, no systematic inflation of occurrence judgments was observed, but an outcome effect on severity cannot be excluded.
Table 11 maps the losses that occurred in the case to the corresponding failure modes. Seven of the nine high-priority failure modes materialized, whereas advance-payment pressure (F2), unlimited scope (C2) and milestone-payment disputes (C4) materialized without being ranked among the top nine. This mapping is illustrative rather than an independent validation, because the ratings were given after the outcomes were known; it nevertheless indicates that the ratings did not simply reproduce the realized losses.
Table 11.
Losses in the case and the corresponding PRPN priorities.
5. Discussion
5.1. Theoretical Contributions
The first theoretical contribution lies in embedding Prospect Theory’s loss-aversion mechanism directly into the risk-priority calculation framework, rather than invoking behavioral bias merely as a post hoc explanation for why decision-makers deviate from model recommendations. The Psychologically-perceived Risk Priority Number (PRPN) construct operationalizes loss aversion as a first-class quantitative output: failure mode F3′s five-place jump from W_RPN to PRPN, along with X5′s one-place decline, illustrates how the transformation re-weights combinations of above- and below-reference scores. These rank changes reflect the application of prospect-theoretic value functions to the expert ratings; they should not be interpreted as direct empirical evidence of loss-averse behavior, which was not observed in this study. This finding offers a concrete, testable alternative to the common practice of treating Failure Mode and Effects Analysis (FMEA) scores as behaviorally neutral inputs.
Furthermore, the architecture is designed to generalize beyond this specific case. Any organization with an internal decision panel and documented failure modes can compute its own Step-wise Weight Assessment Ratio Analysis (SWARA) weights and reference points from its internal scoring distribution. PRPN does not require eliciting project-specific behavioral parameters. It adopts the estimates of Tversky and Kahneman [15], α = β = 0.88 and λ = 2.25, which were obtained from monetary gambles; their transferability to engineering risk judgments is therefore not assumed but examined in Section 4.6.2, where the high-priority set proved stable across λ = 1.5–3.0 and α, β = 0.5–1.0. Future research could re-estimate these parameters using a firm’s historical decision data.
A second theoretical contribution is the explicit reconciliation of individual-indicator salience with dimension-level causal structure. Literature on hybrid FMEA and Multiple-Criteria Decision Making (MCDM) models has largely developed in parallel with Decision Making Trial and Evaluation Laboratory (DEMATEL) causal mapping research. A joint synthesis of Table 3 and Table 6 indicates that these tools answer complementary questions: PRPN indicates which individual risks the panel prioritizes after the behavioral transformation, whereas DEMATEL indicates which dimensions the panel judges to drive the system. The two provide complementary evidence and can diverge, as observed in the case of Owner Relationship Risk. This divergence extends existing escalation of commitment literature [2,3]: if decision-makers systematically underestimate the psychological salience of risks that causally drive financial losses, it provides a behavioral explanation for why organizations repeatedly under-invest in owner-relationship due diligence despite past costly experience with unstable startup counterparties. Materialized losses are financial, vivid, and easily attributed to financial causes, whereas upstream owner-relationship judgment failures are diffuse, occur early in the project lifecycle, and remain difficult to hold salient in institutional memory or bid-review design.
Third, and most distinctively, by grounding its initial risk inventory in Owner-induced Financial Risk Transfer and Moral Hazard in Contract Performance patterns specific to startup-owner engagements, rather than adopting generic construction taxonomies, this study extends MCDM-FMEA models into counterparty risk contexts that have received limited dedicated focus [35]. This domain-specific grounding delivers a methodological benefit: because the 25-indicator inventory was custom-built, the Modified Delphi convergence results in Section 4.2 serve as an implicit validity check. The retention of all 25 indicators, with only isolated and well-explained disagreements, suggests that the underlying construct of “startup-owner Engineering, Procurement, and Construction (EPC) risk” is coherent enough to be captured by a moderately sized indicator set without requiring an open-ended taxonomy.
5.2. Practical Contributions
Practically, this study converts an abstract risk assessment exercise into actionable governance levers. The nine highest-priority indicators cluster into three groups, each mapping onto a distinct managerial response strategy.
The first group, Owner Survival and Payment Security (X1, F1, X2, F5), points to pre-contractual financial due diligence: verifying audited financials, requiring bank-confirmed financing commitments, and securing payment through irrevocable letters of credit rather than relying on stated intentions. The second group, Asymmetric Contract Structure (C3, C1), calls for mandatory contract clause reviews, specifically capping indemnity liability and closing gaps in scope and change-order definitions prior to signature, as startup owners face structural incentives to keep these clauses favorable to themselves. The third group, Compound Execution Risk (E4, F3, E1), reflects a self-reinforcing cycle: unstable owner requirements (E1) trigger rework and undercompensated change orders (F3), while complex multi-subcontractor interfaces (E4) obscure responsibility assignment. This highlights the need to price explicit design-change reserves and interface-management costs into the bidding stage rather than absorbing them post-award.
The asymmetry between what senior decision-makers perceive as psychologically threatening and what the causal structure identifies as systemically dangerous contains broader policy implications. Any organization relying solely on a ranked list of top risks, regardless of how rigorously constructed, remains structurally prone to under-investing in root-cause dimensions whose impacts are indirect, delayed, or dispersed across visible loss categories. A ranking-only approach, while internally rigorous, creates a governance blind spot precisely where DEMATEL causal analysis is required.
DEMATEL results add complementary guidance in that intervening solely at the financial monitoring stage occurs too late in the causal chain because Owner Relationship Risk and Contractual Risk act as system root causes while Financial Risk represents the terminal effect. Risk governance effort must shift forward, concentrating scrutiny at the bid assessment and contract negotiation stages where owner qualification can still be verified and protective clauses negotiated. This forward-shifting logic carries organizational design implications. Because Owner Relationship Risk and Contractual Risk fall under the domain of business development and legal departments, rather than finance functions that typically own risk monitoring, governance cannot be delegated to finance alone. Effective governance requires a cross-functional structure mirroring the decision panel (general management, risk control, legal, and finance working from a shared model) integrated into the bid evaluation committee before crises reach financial dashboards.
5.3. Managerial Implications and Recommended Governance Gates
Based on joint PRPN and DEMATEL results, four quantified governance gates are proposed for EPC contractors evaluating startup-owner opportunities.
First, a Risk-Floor Screening Gate, driven by Owner Relationship Risk’s dominant causal role, establishes strict no-go thresholds. Bids should be declined if an owner lacks a qualified project management consultant, cannot supply audited financials, lacks confirmed follow-on financing, or refuses liability caps. Second, a Payment-Security Gate, inspired by the X1/F1/X2 cluster, requires bank-backed irrevocable payment guarantees, an advance payment ratio of at least 20% of contract value, and milestone payments tied to verifiable progress with automatic work-stoppage triggers for late payments. Third, a Contract-Scheme Review Gate, prompted by the C3/C1 cluster, mandates pre-signature approval for liability caps (recommended not to exceed 100% of contract value), a single named owner representative with binding response deadlines, explicit design-freeze clauses, and capped scope definitions. Fourth, a Price Review Gate, driven by the E4/F3/E1 cluster, requires an explicit risk-premium reserve sized to the dimensions of the nine highest-priority indicators, alongside itemized allowances for multi-subcontractor interface management and design-change costs. These four gates operationalize statistical findings into pre-contractual controls that intervene at bidding and negotiation, where causal analysis indicates risk containment is most effective.
A further implication concerns long-term framework maintenance. Because PRPN is computed relative to the panel’s reference points, adopting contractors should expect their catastrophic risk set to evolve as experience with different owner profiles grows. For instance, a firm that successfully mitigates funding security exposure via the Payment-Security Gate should observe F1 and X2 decline in relative PRPN rank over time, while other risks become comparatively salient. This indicates that the framework operates best as a dynamic governance instrument rather than a static checklist. Periodically re-running the model with updated decision-maker scores as mitigation practices evolve ensures governance efforts track current top threats rather than historical baselines.
6. Conclusions
This study addressed the practical problem of EPC contractors increasingly serving startup owners whose fragile capital structures and immature governance create catastrophic financial and contractual exposures. Standard risk assessment tools like FMEA assume equal factor weighting and fully rational decision-makers, assumptions that fail in high-stakes environments. To close this gap, the study implemented a five-stage integrated framework applied retrospectively to a large EPC turnkey case with seven senior decision-makers to address three research questions.
Regarding RQ1, the results demonstrate that severity dominates senior decision-makers’ calculus (SWARA weight of 43.5%, far exceeding occurrence or detectability). Regarding RQ2, the prospect-theoretic transformation reorders risk rankings compared to magnitude-weighted models, notably elevating undercompensated change orders. Nine indicators, anchored by owner insolvency, funding-chain breakdown, and unlimited liability, constitute the high-priority risk set. Regarding RQ3, DEMATEL identifies Owner Relationship Risk and Contractual Risk as the principal causal dimensions and Financial Risk as a robust effect dimension, providing evidence complementary to PRPN. Sensitivity analyses of the criterion weights, behavioral parameters and reference point, together with expert-level bootstrapping, show that the high-priority set is robust, whereas the exact order within it is less certain. These findings translate into four quantified pre-contractual governance gates that shift risk mitigation forward to bidding and negotiation stages.
This study has limitations that highlight future research avenues. Empirical observations derive from a single EPC contractor and project. While the decision panel’s shared context enhances internal validity, external validity across contractors, industries, and contractual regimes warrants multi-case replication. A related limitation is sample size. Following established expert-based MCDM research paradigms that prioritize deep domain expertise over large generic samples [9,10], this study relies on seven managers from one firm. The weights and rankings represent a rigorously elicited expression of this panel’s professional judgment rather than a population-level estimate. Methodologically, DEMATEL analysis was executed at the dimension level. A natural extension involves indicator-level causal mapping to trace specific failure mode interactions.
Three further limitations concern the data. First, because the ratings were elicited after the project outcomes were known, they may be affected by hindsight and outcome bias; although occurrence ratings did not differ between materialized and non-materialized failure modes, severity ratings may contain an outcome effect, and the bid-stage value of the framework is therefore proposed rather than demonstrated. Second, because the same seven experts from one contractor provided all judgments, common method bias cannot be ruled out [45]. Its influence was reduced by using different response formats and levels of analysis for FMEA and DEMATEL and by individual, anonymous completion, and the bootstrap and leave-one-expert-out analyses indicate that the main conclusions do not depend on any single expert. Third, inter-expert agreement was significant for Severity but not for Occurrence or Detection. The retention of E3, which did not reach consensus, and of O5, which was omitted from the second Delphi round, is a further procedural limitation, although neither affected the results. Future research should apply the framework prospectively at the bidding stage and use multi-firm, multi-case data.
Finally, integration choices across the five framework stages, particularly group-weighting procedures and DEMATEL thresholds, involve modeling parameters whose sensitivity can be systematically explored. Future studies should also test whether this framework generalizes to broader counterparty risk contexts beyond EPC contracting, such as project finance, supply chain contracting with financially fragile partners, or venture-backed technology licensing agreements.
Author Contributions
Conceptualization, C.-F.L. and J.J.H.L.; methodology, C.-F.L. and J.J.H.L.; software, C.-F.L.; validation, C.-F.L. and J.J.H.L.; formal analysis, C.-F.L.; investigation, C.-F.L.; resources, C.-F.L.; data curation, C.-F.L.; writing—original draft preparation, C.-F.L.; writing—review and editing, J.J.H.L.; visualization, C.-F.L.; supervision, J.J.H.L.; project administration, J.J.H.L.; funding acquisition, J.J.H.L. All authors have read and agreed to the published version of the manuscript.
Funding
This research received no external funding.
Data Availability Statement
The data presented in this study are available on request from the corresponding author. The data are not publicly available due to confidentiality agreements with the participating EPC contractor and to protect the anonymity of the case project and the expert respondents.
Acknowledgments
The authors thank the participating EPC contractor for providing access to project information and the seven senior managers for their time and expertise. The company is not named for reasons of confidentiality.
Conflicts of Interest
The authors declare no conflicts of interest.
References
- Koksal, A.; Arditi, D. Predicting Construction Company Decline. J. Constr. Eng. Manag. 2004, 130, 799–807. [Google Scholar] [CrossRef] [Scilit]
- Staw, B.M. Knee-Deep in the Big Muddy: A Study of Escalating Commitment to a Chosen Course of Action. Organ. Behav. Hum. Perform. 1976, 16, 27–44. [Google Scholar] [CrossRef] [Scilit]
- Sleesman, D.J.; Conlon, D.E.; McNamara, G.; Miles, J.E. Cleaning up the Big Muddy: A Meta-Analytic Review of the Determinants of Escalation of Commitment. Acad. Manag. J. 2012, 55, 541–562. [Google Scholar] [CrossRef] [Scilit]
- Kahneman, D. Thinking, Fast and Slow; Farrar, Straus and Giroux: New York, NY, USA, 2011. [Google Scholar]
- Department of Defense. MIL-STD-1629A: Procedures for Performing a Failure Mode, Effects, and Criticality Analysis; U.S. Department of Defense: Washington, DC, USA, 1980.
- Liu, H.C.; Liu, L.; Liu, N. Risk Evaluation Approaches in Failure Mode and Effects Analysis: A Literature Review. Expert Syst. Appl. 2013, 40, 828–838. [Google Scholar] [CrossRef] [Scilit]
- Liou, J.J.H.; Liu, P.C.Y.; Lo, H.-W. Dependency-Based FMEA Model for Product Risk Analysis: A Case Study of a Switch Mode Power Supply. Int. J. Interact. Des. Manuf. 2024, 18, 5225–5242. [Google Scholar] [CrossRef] [Scilit]
- Yu, Y.; Yang, Y.; Yu, J.; Wu, S.; Zeng, Q.; Ding, H.; Ma, J.; Duan, Q. An Improved FMEA Approach Based on Interval-Valued Spherical Fuzzy Sets and CODAS Method for LNG Tank Safety Analysis. J. Loss Prev. Process Ind. 2025, 97, 105679. [Google Scholar] [CrossRef] [Scilit]
- Darko, A.; Chan, A.P.C.; Ameyaw, E.E.; Owusu, E.K.; Pärn, E.; Edwards, D.J. Review of Application of Analytic Hierarchy Process (AHP) in Construction. Int. J. Constr. Manag. 2019, 19, 436–452. [Google Scholar] [CrossRef] [Scilit]
- Keršulienė, V.; Zavadskas, E.K.; Turskis, Z. Selection of Rational Dispute Resolution Method by Applying New Step-Wise Weight Assessment Ratio Analysis (SWARA). J. Bus. Econ. Manag. 2010, 11, 243–258. [Google Scholar] [CrossRef] [Scilit]
- Lo, H.-W.; Liou, J.J.H. A Novel Multiple-Criteria Decision-Making-Based FMEA Model for Risk Assessment. Appl. Soft Comput. 2018, 73, 684–696. [Google Scholar] [CrossRef] [Scilit]
- AL Mashaqbeh, S.; Munive-Hernandez, J.E.; Khan, M.K. Using EWGM Method to Optimise the FMEA as a Risk Assessment Methodology. Concurr. Eng. 2019, 27, 144–154. [Google Scholar] [CrossRef] [Scilit]
- Huang, A.; Yang, Y. FMEA Risk Assessment Method: Integration of Multi-Perspective Weights and Interval Cloud Model with TOPSIS Approach. Expert Syst. Appl. 2025, 289, 128377. [Google Scholar] [CrossRef] [Scilit]
- Kahneman, D.; Tversky, A. Prospect Theory: An Analysis of Decision under Risk. Econometrica 1979, 47, 263–291. [Google Scholar] [CrossRef] [Scilit]
- Tversky, A.; Kahneman, D. Advances in Prospect Theory: Cumulative Representation of Uncertainty. J. Risk Uncertain. 1992, 5, 297–323. [Google Scholar] [CrossRef] [Scilit]
- Wang, W.; Liu, X.; Qin, Y.; Fu, Y. A Risk Evaluation and Prioritization Method for FMEA with Prospect Theory and Choquet Integral. Saf. Sci. 2018, 110, 152–163. [Google Scholar] [CrossRef] [Scilit]
- Sagnak, M.; Kazancoglu, Y.; Ozkan Ozen, Y.D.; Garza-Reyes, J.A. Decision-Making for Risk Evaluation: Integration of Prospect Theory with Failure Modes and Effects Analysis (FMEA). Int. J. Qual. Reliab. Manag. 2020, 37, 939–956. [Google Scholar] [CrossRef] [Scilit]
- Fu, Y.; Qin, Y.; Wang, W.; Liu, X.; Jia, L. An Extended FMEA Model Based on Cumulative Prospect Theory and Type-2 Intuitionistic Fuzzy VIKOR for the Railway Train Risk Prioritization. Entropy 2020, 22, 1418. [Google Scholar] [CrossRef] [Scilit]
- Li, C.W.; Tzeng, G.H. Identification of a Threshold Value for the DEMATEL Method Using the Maximum Mean De-Entropy Algorithm to Find Critical Services Provided by a Semiconductor Intellectual Property Mall. Expert Syst. Appl. 2009, 36, 9891–9898. [Google Scholar] [CrossRef] [Scilit]
- Wagner, R.F. EPC 4.0: The Quest for Reducing CAPEX in EPC Projects. Organ. Technol. Manag. Constr. Int. J. 2020, 12, 2245–2255. [Google Scholar] [CrossRef] [Scilit]
- International Federation of Consulting Engineers (FIDIC). Conditions of Contract for EPC/Turnkey Projects (Silver Book), 2nd ed.; FIDIC: Geneva, Switzerland, 2017. [Google Scholar]
- Ke, H.; Cui, Z.; Govindan, K.; Zavadskas, E.K. The Impact of Contractual Governance and Trust on EPC Projects in Construction Supply Chain Performance. Eng. Econ. 2015, 26, 349–363. [Google Scholar] [CrossRef] [Scilit]
- Eriksson, P.-E.; Lind, H. Strategies for Reducing Moral Hazard in Construction Procurement: A Conceptual Framework. J. Self-Gov. Manag. Econ. 2016, 4, 7–33. [Google Scholar] [CrossRef] [Scilit]
- OECD. Financing SMEs and Entrepreneurs 2020: An OECD Scoreboard; OECD Publishing: Paris, France, 2020. [Google Scholar] [CrossRef] [Scilit]
- Blank, S. Why the Lean Start-Up Changes Everything. Harv. Bus. Rev. 2013, 91, 63–72. [Google Scholar]
- Vitvarová, J. Success Factors of Startups, Case Study in the Construction Industry—Digital Transformation Systems. Sci. Soc. 2024, 20, 1–17. [Google Scholar]
- Picken, J.C. From Founder to CEO: An Entrepreneur’s Roadmap. Bus. Horiz. 2017, 60, 7–14. [Google Scholar] [CrossRef] [Scilit]
- Taroun, A. Towards a Better Modelling and Assessment of Construction Risk: Insights from a Literature Review. Int. J. Proj. Manag. 2014, 32, 101–115. [Google Scholar] [CrossRef] [Scilit]
- ISO 31000:2018; Risk Management—Guidelines. ISO: Geneva, Switzerland, 2018.
- Wang, W.Z.; Liu, X.W.; Chen, X.Q.; Qin, Y. Risk Assessment Based on Hybrid FMEA Framework by Considering Decision Maker’s Psychological Behavior Character. Comput. Ind. Eng. 2019, 136, 516–527. [Google Scholar] [CrossRef] [Scilit]
- Saaty, T.L. A Scaling Method for Priorities in Hierarchical Structures. J. Math. Psychol. 1977, 15, 234–281. [Google Scholar] [CrossRef] [Scilit]
- Zolfani, S.H.; Šaparauskas, J. New Application of SWARA Method in Prioritizing Sustainability Assessment Indicators of Energy System. Eng. Econ. 2013, 24, 408–414. [Google Scholar] [CrossRef] [Scilit]
- Alinezhad, A.; Khalili, J. New Methods and Applications in Multiple Attribute Decision Making (MADM); Springer: Cham, Switzerland, 2019. [Google Scholar]
- Gabus, A.; Fontela, E. World Problems, an Invitation to Further Thought within the Framework of DEMATEL; Battelle Geneva Research Center: Geneva, Switzerland, 1972. [Google Scholar]
- Wei, Q.; Xiao, Y. A Review of Research Related to Risk Management of EPC Engineering Projects and Future Prospects. Acad. J. Bus. Manag. 2023, 5, 25–34. [Google Scholar] [CrossRef] [Scilit]
- Hsu, C.C.; Sandford, B.A. The Delphi Technique: Making Sense of Consensus. Pract. Assess. Res. Eval. 2007, 12, 10. [Google Scholar] [CrossRef]
- Murry, J.W.; Hammons, J.O. Delphi: A Versatile Methodology for Conducting Qualitative Research. Rev. High. Educ. 1995, 18, 423–436. [Google Scholar] [CrossRef] [Scilit]
- Munawir; Arifuddin, R.; Abdurrahman, M.A. Analysis of the Delay Risk of the Engineering, Procurement, Construction, and Commissioning (EPCC) Phases in Oil and Gas Industry Projects. Eng. Technol. Appl. Sci. Res. 2026, 16, 32015–32023. [Google Scholar] [CrossRef] [Scilit]
- Yuan, X.; Ma, L. Game Analysis in the Construction Claim Negotiations. Procedia Eng. 2012, 28, 586–593. [Google Scholar] [CrossRef] [Scilit]
- AIA Document A201-2017; General Conditions of the Contract for Construction. American Institute of Architects: Washington, DC, USA, 2017.
- Chen, J.; Taylor, J.E. Modeling Retention Loss in Project Networks: Untangling the Combined Effect of Skill Decay and Turnover on Learning. J. Manag. Eng. 2014, 30, 04014017. [Google Scholar] [CrossRef] [Scilit]
- Wang, T.; Tang, W.; Du, L.; Duffield, C.F.; Wei, Y. Relationships among Risk Management, Partnering, and Contractor Capability in International EPC Project Delivery. J. Manag. Eng. 2016, 32, 04016017. [Google Scholar] [CrossRef] [Scilit]
- Beiderbeck, D.; Frevel, N.; von der Gracht, H.A.; Schmidt, S.L.; Schweitzer, V.M. Preparing, Conducting, and Analyzing Delphi Surveys: Cross-Disciplinary Practices, New Directions, and Advancements. MethodsX 2021, 8, 101401. [Google Scholar] [CrossRef] [Scilit]
- Fischhoff, B. Hindsight ≠ Foresight: The Effect of Outcome Knowledge on Judgment under Uncertainty. J. Exp. Psychol. Hum. Percept. Perform. 1975, 1, 288–299. [Google Scholar] [CrossRef]
- Podsakoff, P.M.; MacKenzie, S.B.; Lee, J.-Y.; Podsakoff, N.P. Common Method Biases in Behavioral Research: A Critical Review of the Literature and Recommended Remedies. J. Appl. Psychol. 2003, 88, 879–903. [Google Scholar] [CrossRef] [Scilit]
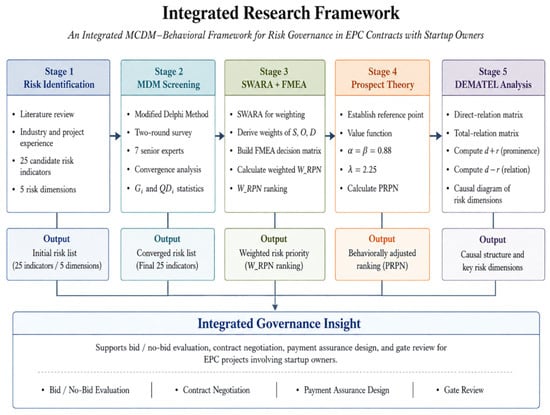
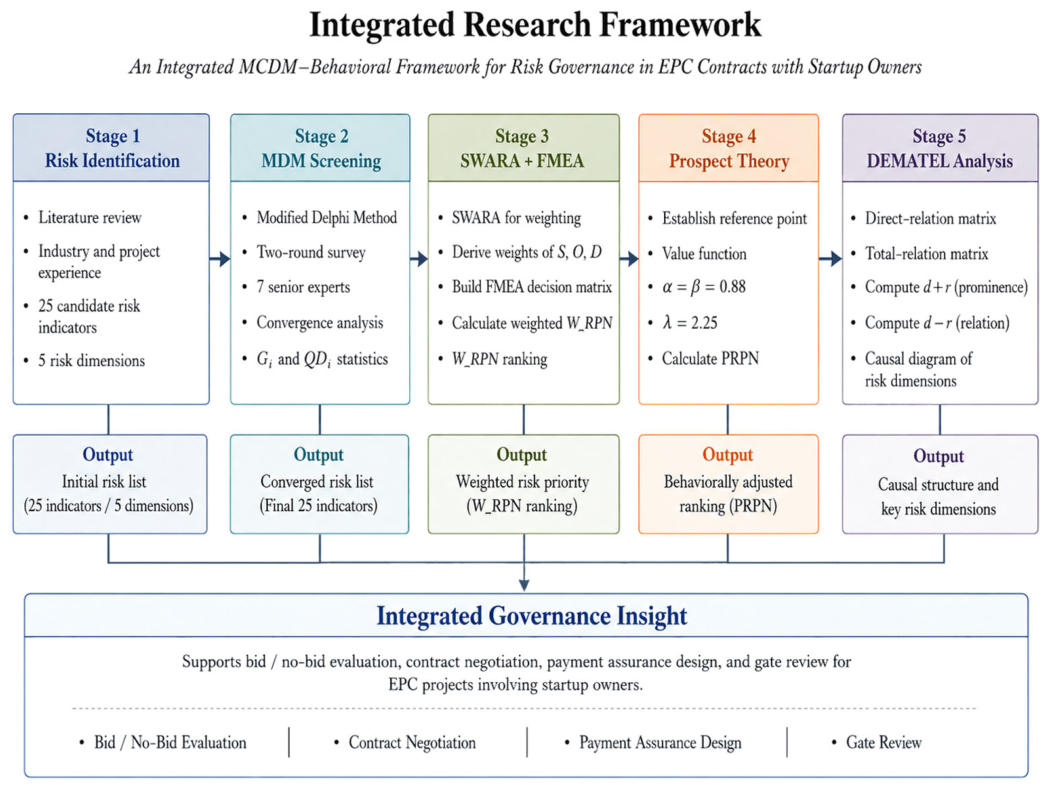
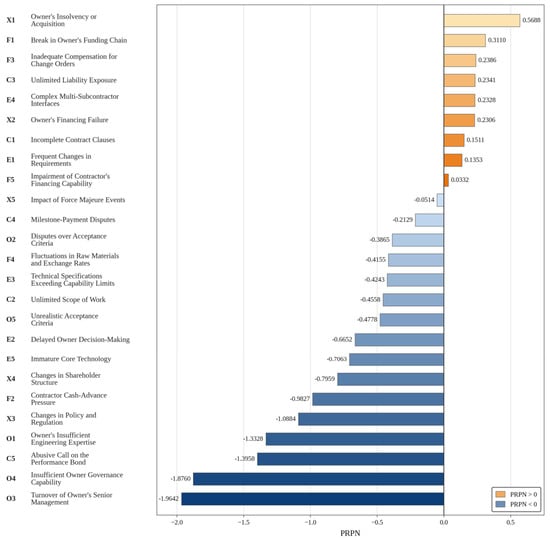
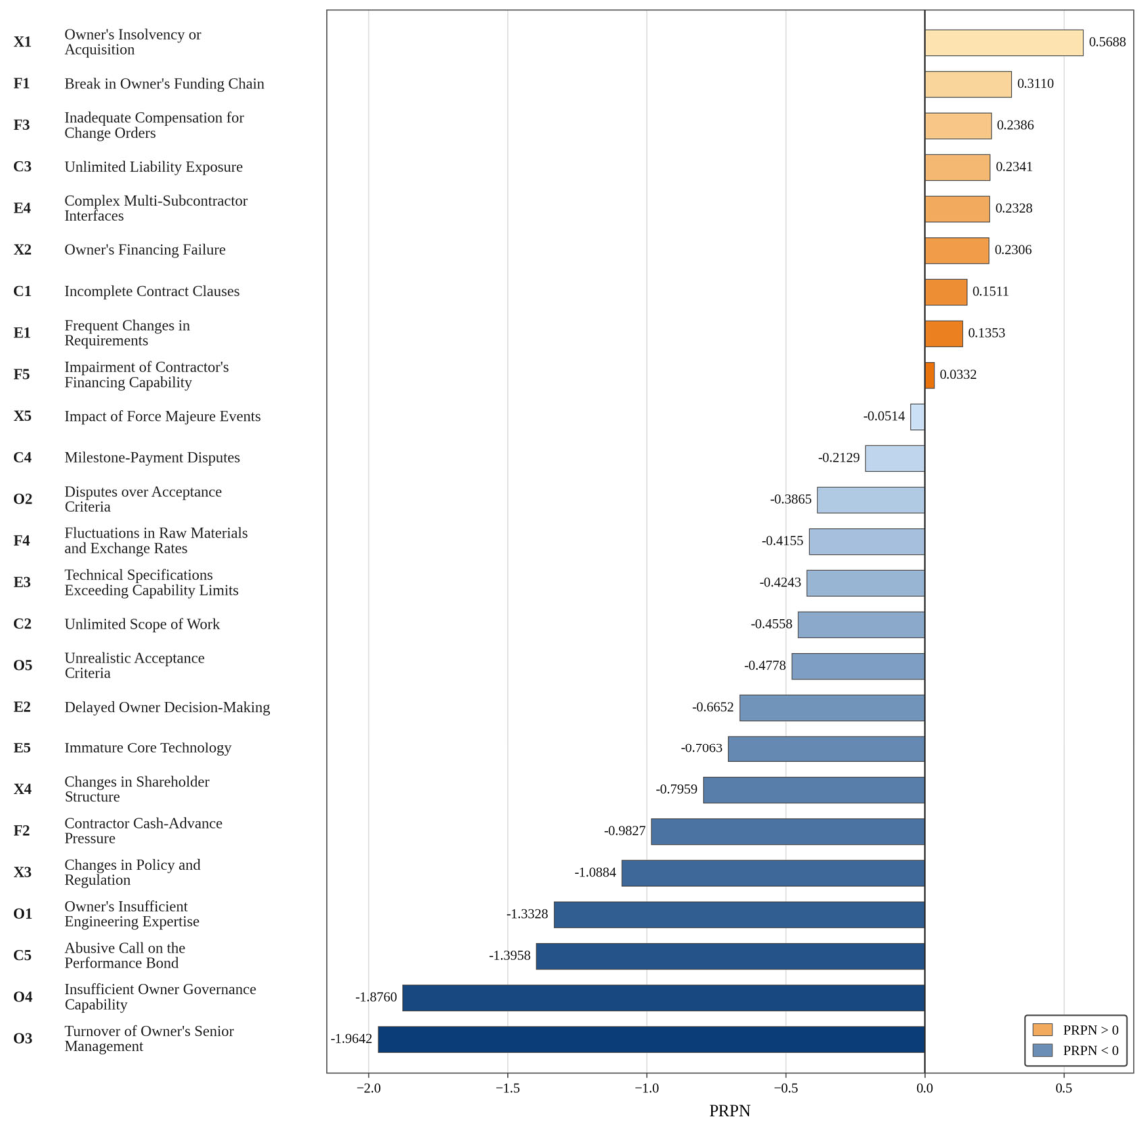
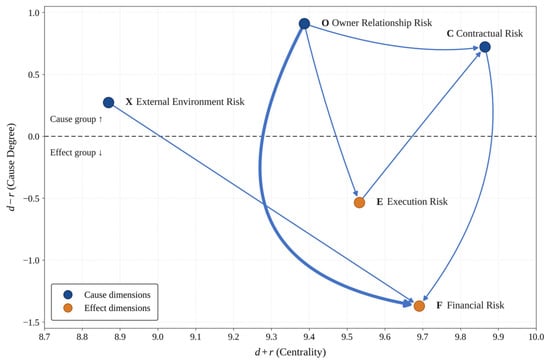
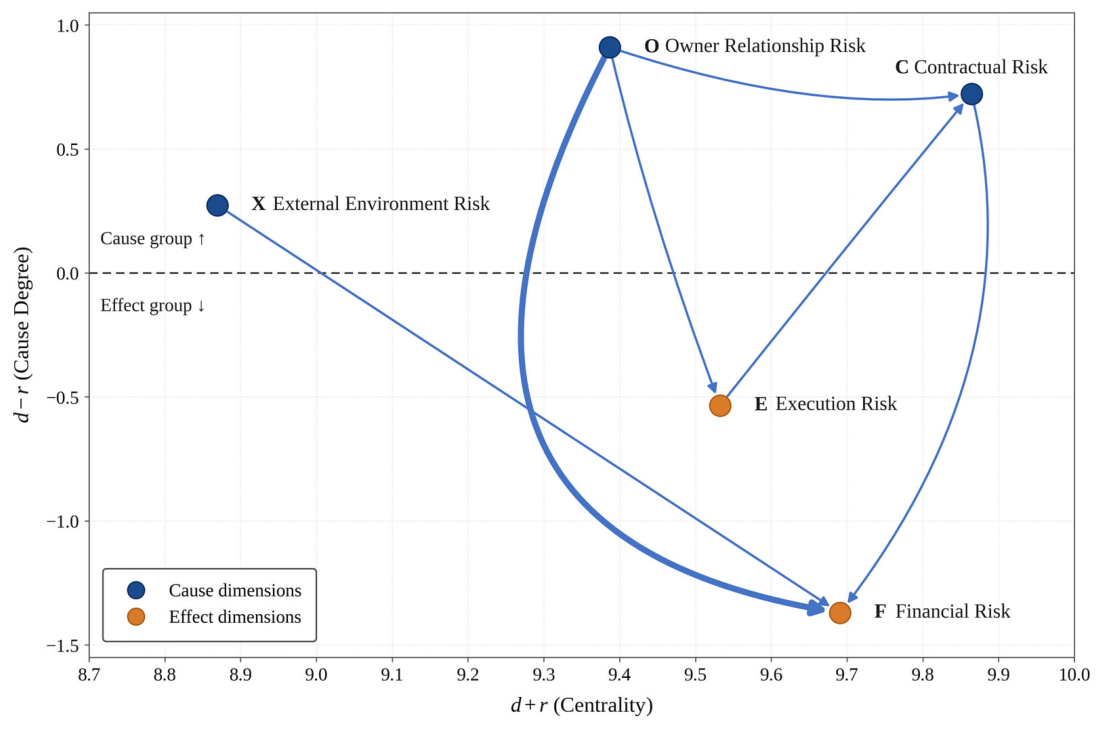
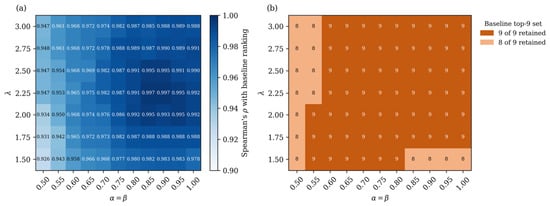
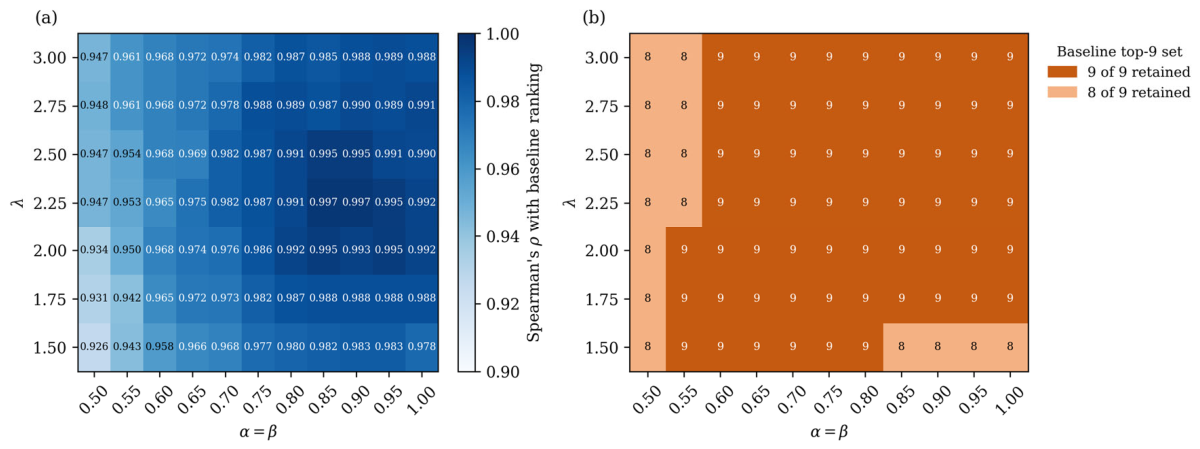
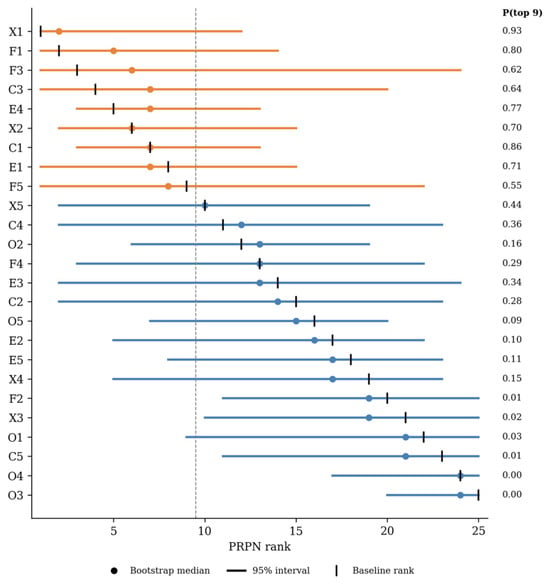
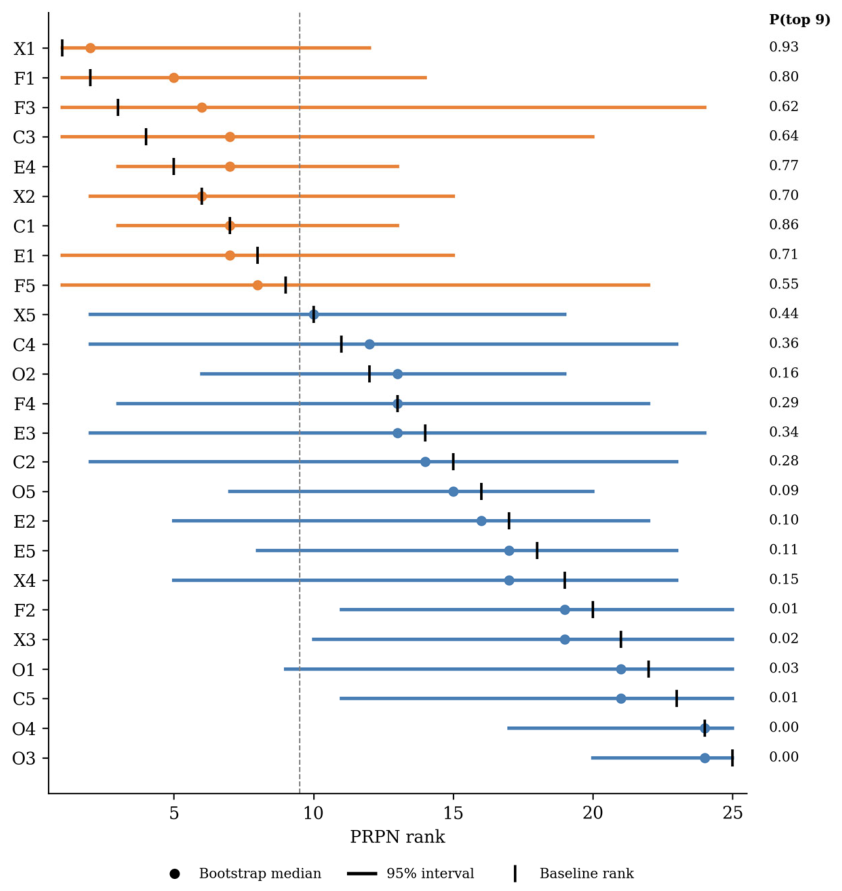

Disclaimer/Publisher’s Note: The statements, opinions and data contained in all publications are solely those of the individual author(s) and contributor(s) and not of MDPI and/or the editor(s). MDPI and/or the editor(s) disclaim responsibility for any injury to people or property resulting from any ideas, methods, instructions or products referred to in the content. |
© 2026 by the authors. Licensee MDPI, Basel, Switzerland. This article is an open access article distributed under the terms and conditions of the Creative Commons Attribution (CC BY) license.