


Abstract
Pretensioned precast pavement slabs exhibit reduced compressive stress near their free ends owing to the finite transfer length of prestressing strands. This study investigated an 800 mm self-stressing concrete end segment using five mixtures containing 0%, 6%, 10%, 12%, and 18% expansive agent and a 3700 mm × 975 mm × 240 mm instrumented slab monitored during strand release and for 180 days thereafter. The E10 and E12 restrained specimens developed calculated self-stresses of 1.36 and 1.53 MPa, respectively, whereas the E18 specimen exhibited a visible longitudinal crack. At 28 days, the expansive mixtures attained compressive and flexural strengths of at least 59.2 and 7.7 MPa, respectively. In the slab, strand-induced compression was approximately 0.50 MPa at 125 mm from the end and 1.25 MPa in the interior, indicating a local deficit of 0.75 MPa. The mean end-segment strain 24 h before release was 221.23 με, corresponding to 1.86 MPa of calculated restraint stress. Total compression at 125 mm reached 2.24 MPa immediately after release and was estimated at 1.58 MPa on day 140 before thermal correction. A full-length compatibility model estimated the end-plate device contribution at 0.12 MPa after release and 0.07 MPa on day 140. The monitored release response indicates that restrained expansion restored compression in the slab end relative to the interior reference.
1. Introduction
Concrete pavements are widely used in heavily trafficked road sections because of their strength and construction efficiency. Pretensioned precast slabs also permit plant quality control and rapid field installation. However, prestressing force is transferred to the concrete through bond over a finite length; so, the resulting compressive stress increases from the free end toward the slab interior. This reduced end-zone compression motivates the use of a local stress-compensation measure [1,2].
Self-stressing concrete, as a special type of expansive concrete, provides a potential approach for compensating prestress deficiencies by generating internally induced compressive stress. During hydration and hardening, expansive components react with cementitious materials and produce expansion products, such as ettringite, resulting in volumetric expansion of the concrete matrix. When the expansion is restrained by reinforcement or external constraints, part of the expansion strain is converted into compressive stress, commonly referred to as self-stress or chemical prestress [3,4]. This mechanism enables the internal stress state of concrete structures to be modified through material-induced expansion rather than relying solely on external mechanical prestressing.
Previous studies have demonstrated the feasibility of applying expansive concrete for shrinkage compensation and chemical prestressing. Richardson et al. reported that Type K expansive cement could introduce beneficial compressive strains and reduce shrinkage-induced cracking in concrete bridge decks [5]. Chen and Brouwers investigated the hydration behavior of mineral shrinkage-compensating admixtures and confirmed their effectiveness in mitigating autogenous shrinkage through expansion compensation [6]. Wyrzykowski et al. further developed CSA-based expansive high-performance concrete and demonstrated that chemical prestress could be generated while maintaining satisfactory mechanical properties and durability [7].
Recent research has focused on the influence of expansive-agent type, dosage, and curing conditions on the performance of expansive concrete. Zhang et al. summarized the application of calcium-based expansive agents in high-strength concrete and emphasized that expansion efficiency, cracking resistance, and mechanical performance are strongly affected by expansive-agent composition and restraint conditions [8]. Meddah et al. demonstrated that the combined use of expansive and shrinkage-reducing admixtures could effectively reduce autogenous deformation and promote self-stress development in high-performance concrete [9]. Further studies have shown that calcium sulfoaluminate-based expansive systems and composite expansive agents can significantly influence expansion behavior, mechanical properties, and crack resistance of concrete [10,11].
The magnitude of chemical prestress depends on expansive-agent chemistry and restraint from reinforcement and adjacent concrete [12,13]. Early-age curing conditions may therefore affect the transfer of laboratory mixture performance to full-scale elements [14,15,16].
Prestress transfer is also influenced by strand geometry, concrete properties, sensor position, and release procedure [1,2,17]. Here, concrete-strain increments measured immediately before and after release are used to characterize the end-zone response.
Alternative end-zone measures include additional reinforcement, changes in strand arrangement or release procedure, strand debonding or anchorage, and fiber reinforcement. Strand debonding and release influence transferred strain profiles [18], while the effects of fibers, stirrups, and release procedure on transfer length have also been investigated [19]. The proposed 800 mm segment generates restrained-expansion compression without changing the strand arrangement. It occupies approximately 21.6% of the slab length, slightly exceeding the measured transfer scale of about 0.7 m, but introduces a construction joint and requires careful curing and bond development. Transfer-length estimates may also depend on the sensing technique [17].
Compared with a conventional single-pour slab, construction of the end segment entails a second placement, preparation of the construction joint, additional curing, and inspection, with associated time and cost. The present assessment focuses on the measured stress response; construction cost and schedule were not evaluated.
The expansive concrete was placed in the region of lowest strand-induced compression. The PT mixture served as the laboratory material control, while the ordinary-concrete region of the slab provided an internal reference for strand-induced compression. The contribution of the permanent end-plate device was estimated independently from its axial stiffness and the measured strain. The structural investigation comprised one full-scale slab.
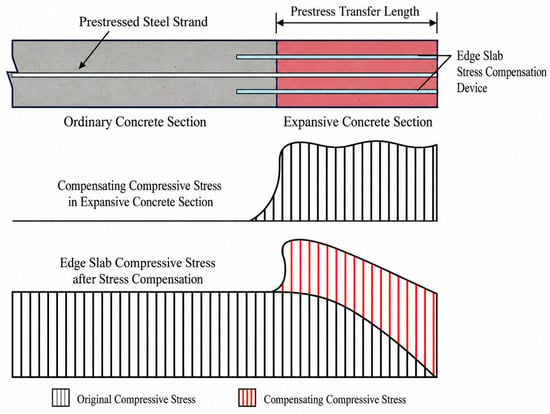
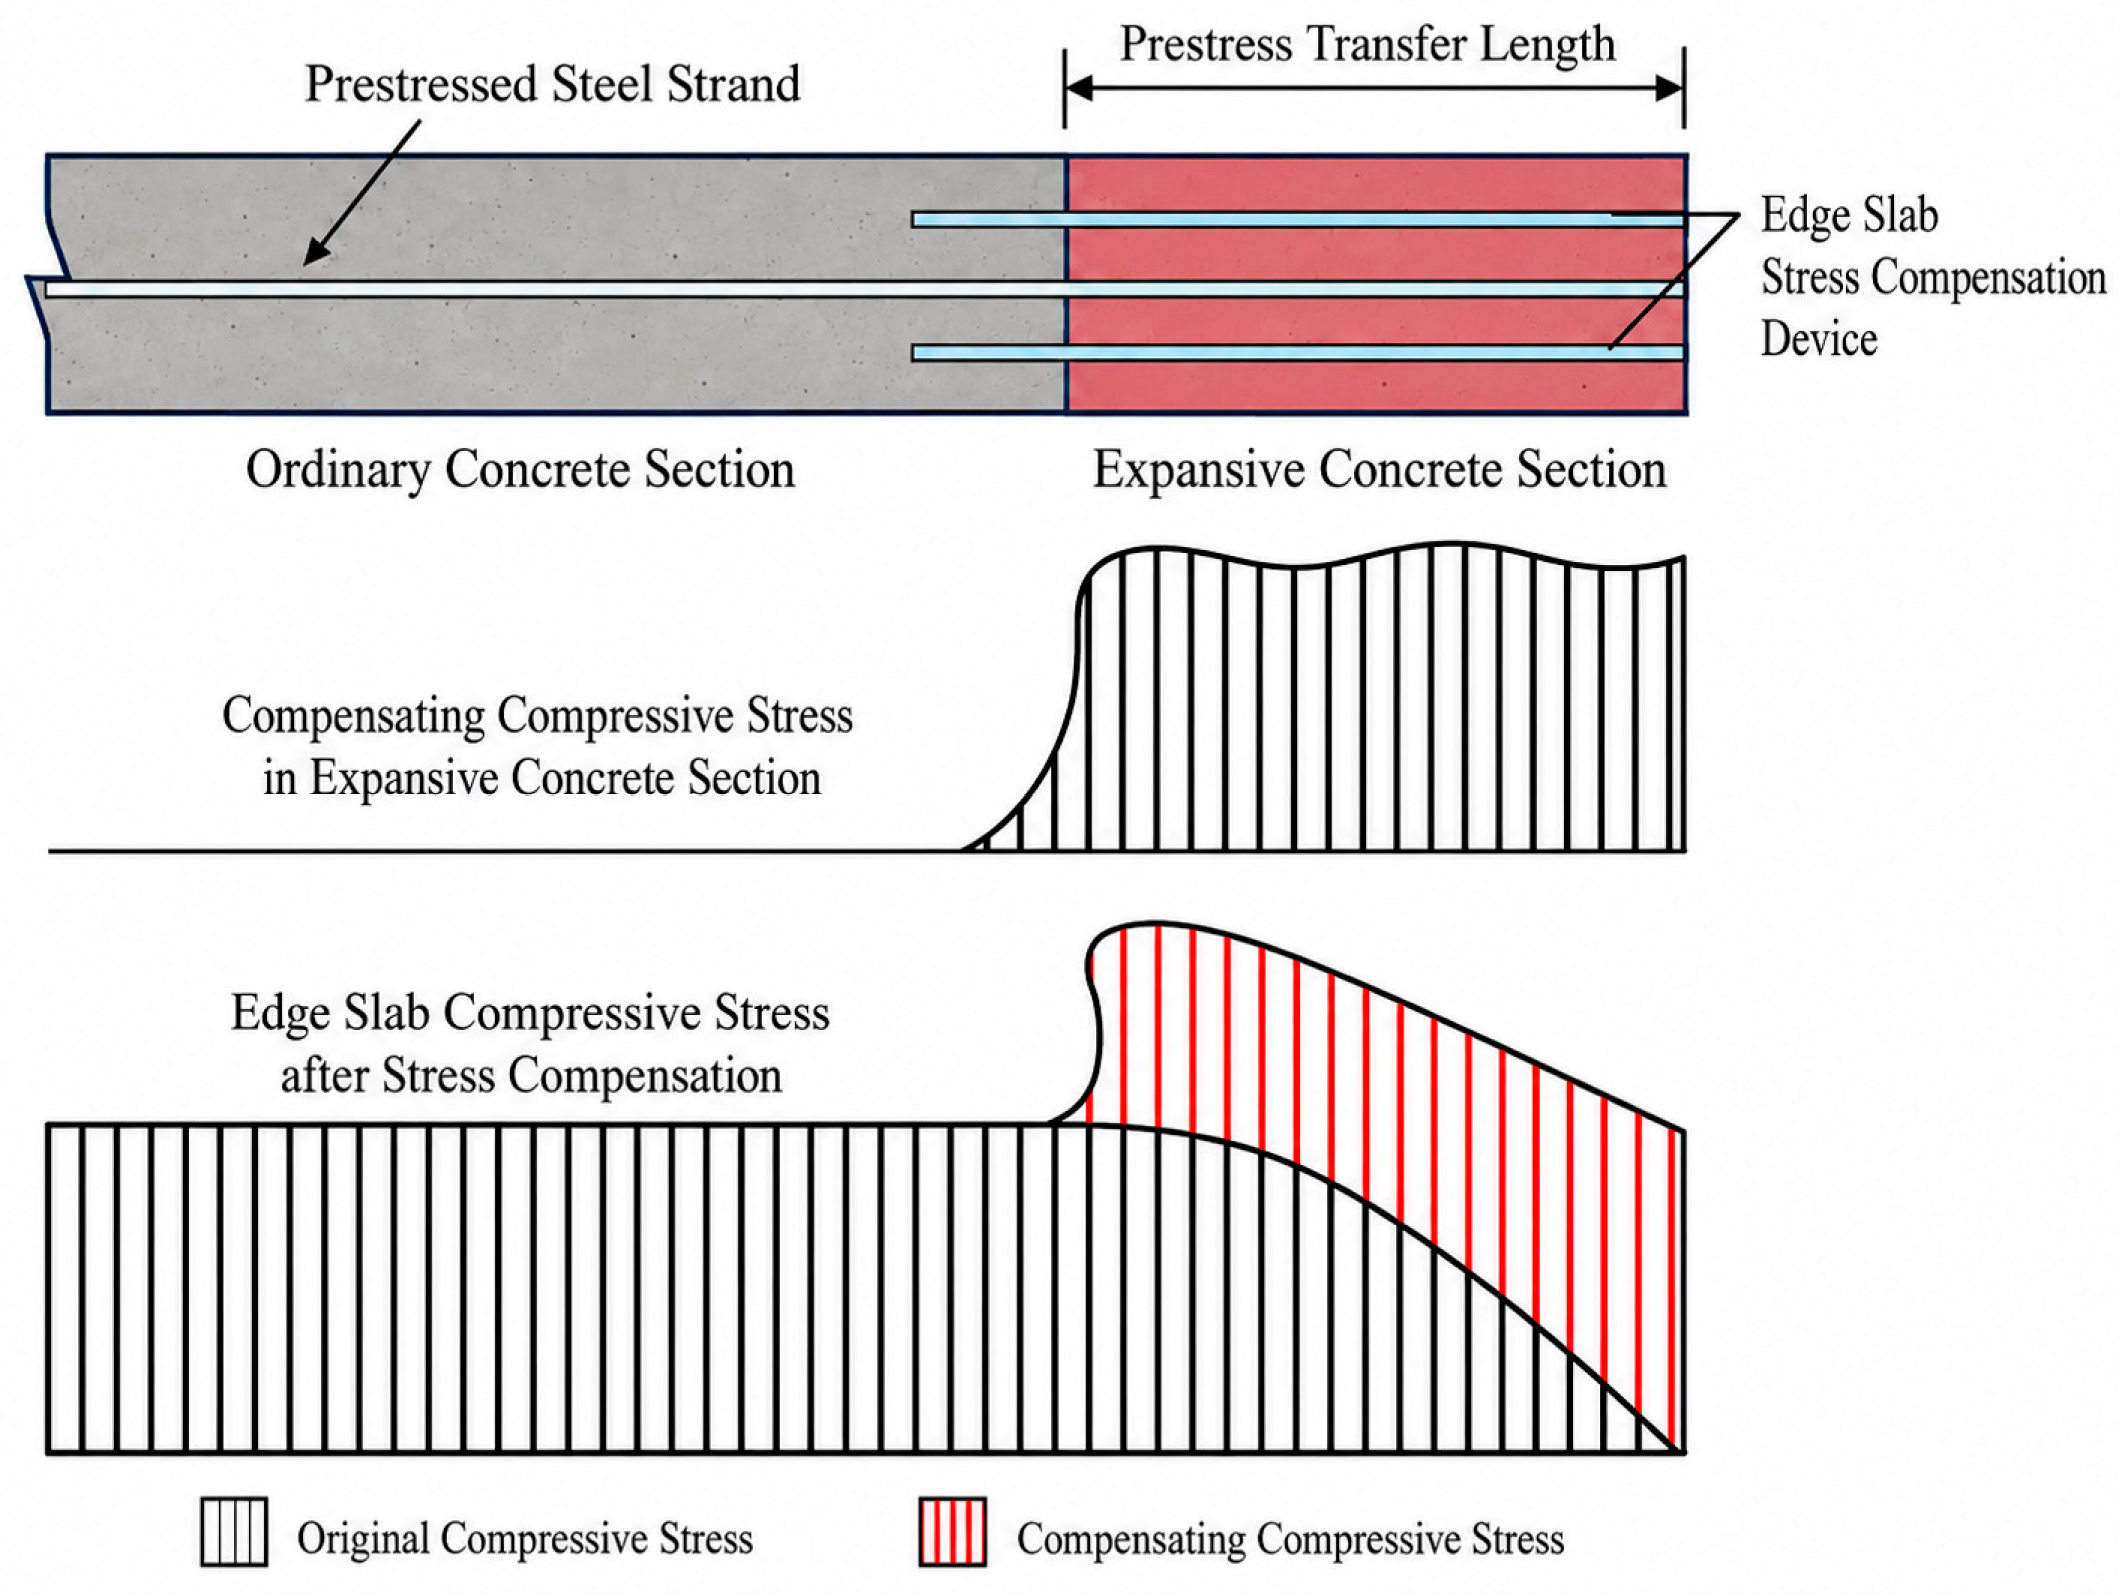
Restrained expansion and strength were first evaluated for the five mixtures. Strain measurements during casting, strand release, and 180 days of field exposure were then used to assess end-zone stress development. Stress restoration was evaluated by comparing compression at 125 mm from the slab end with strand-induced compression in the ordinary-concrete interior (Figure 1).
Figure 1.
Conceptual addition of expansion-induced compression to the strand-induced stress profile near the slab end.
2. Experimental Program
2.1. Mix Design and Materials
Table 1 gives the batching masses. PT is the plain-concrete control; E6, E10, E12, and E18 contain 6%, 10%, 12%, and 18% high-performance calcium sulfoaluminate (HCSA) expansive agent, respectively. The percentages are relative to the total cementitious binder. HCSA replaces Portland cement by mass, whereas fly ash remains at 92.4 kg/m3; the nominal water-to-binder ratio is 0.30.
Table 1.
Mixture proportions by mass per cubic meter.
The binder consisted of P·O 42.5 Portland cement, Grade I fly ash, and an HCSA expansive agent supplied by Wuhan Sanyuan Special Building Materials Co., Ltd. (Wuhan, China). Their oxide compositions are given in Table 2. The listed oxide fractions sum to approximately 100% after rounding. The relatively high CaO and SO3 contents of the HCSA agent are consistent with a sulfate-bearing expansive system.
Table 2.
Oxide composition of cement, fly ash, and HCSA expansive agent (mass fraction, %).
Natural crushed stone with particle sizes of 5–10 and 10–20 mm was blended at a mass ratio of 4:6. The river sand had a fineness modulus of 2.9. Polycarboxylate high-range water reducer was added at 1.0% of binder mass. The total mass of the constituents listed in Table 1 was approximately 2478 kg per cubic meter of concrete.
The binder characterization used in the present analysis is limited to the oxide compositions reported in Table 2; batch-specific density, fineness, and quantitative phase composition were not included as variables. The test program focused on restrained expansion and hardened strength.
2.2. Test Methods
2.2.1. Restrained Expansion and Strength Testing
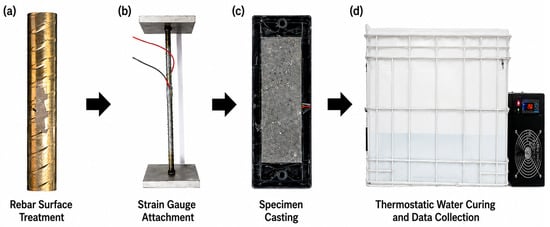
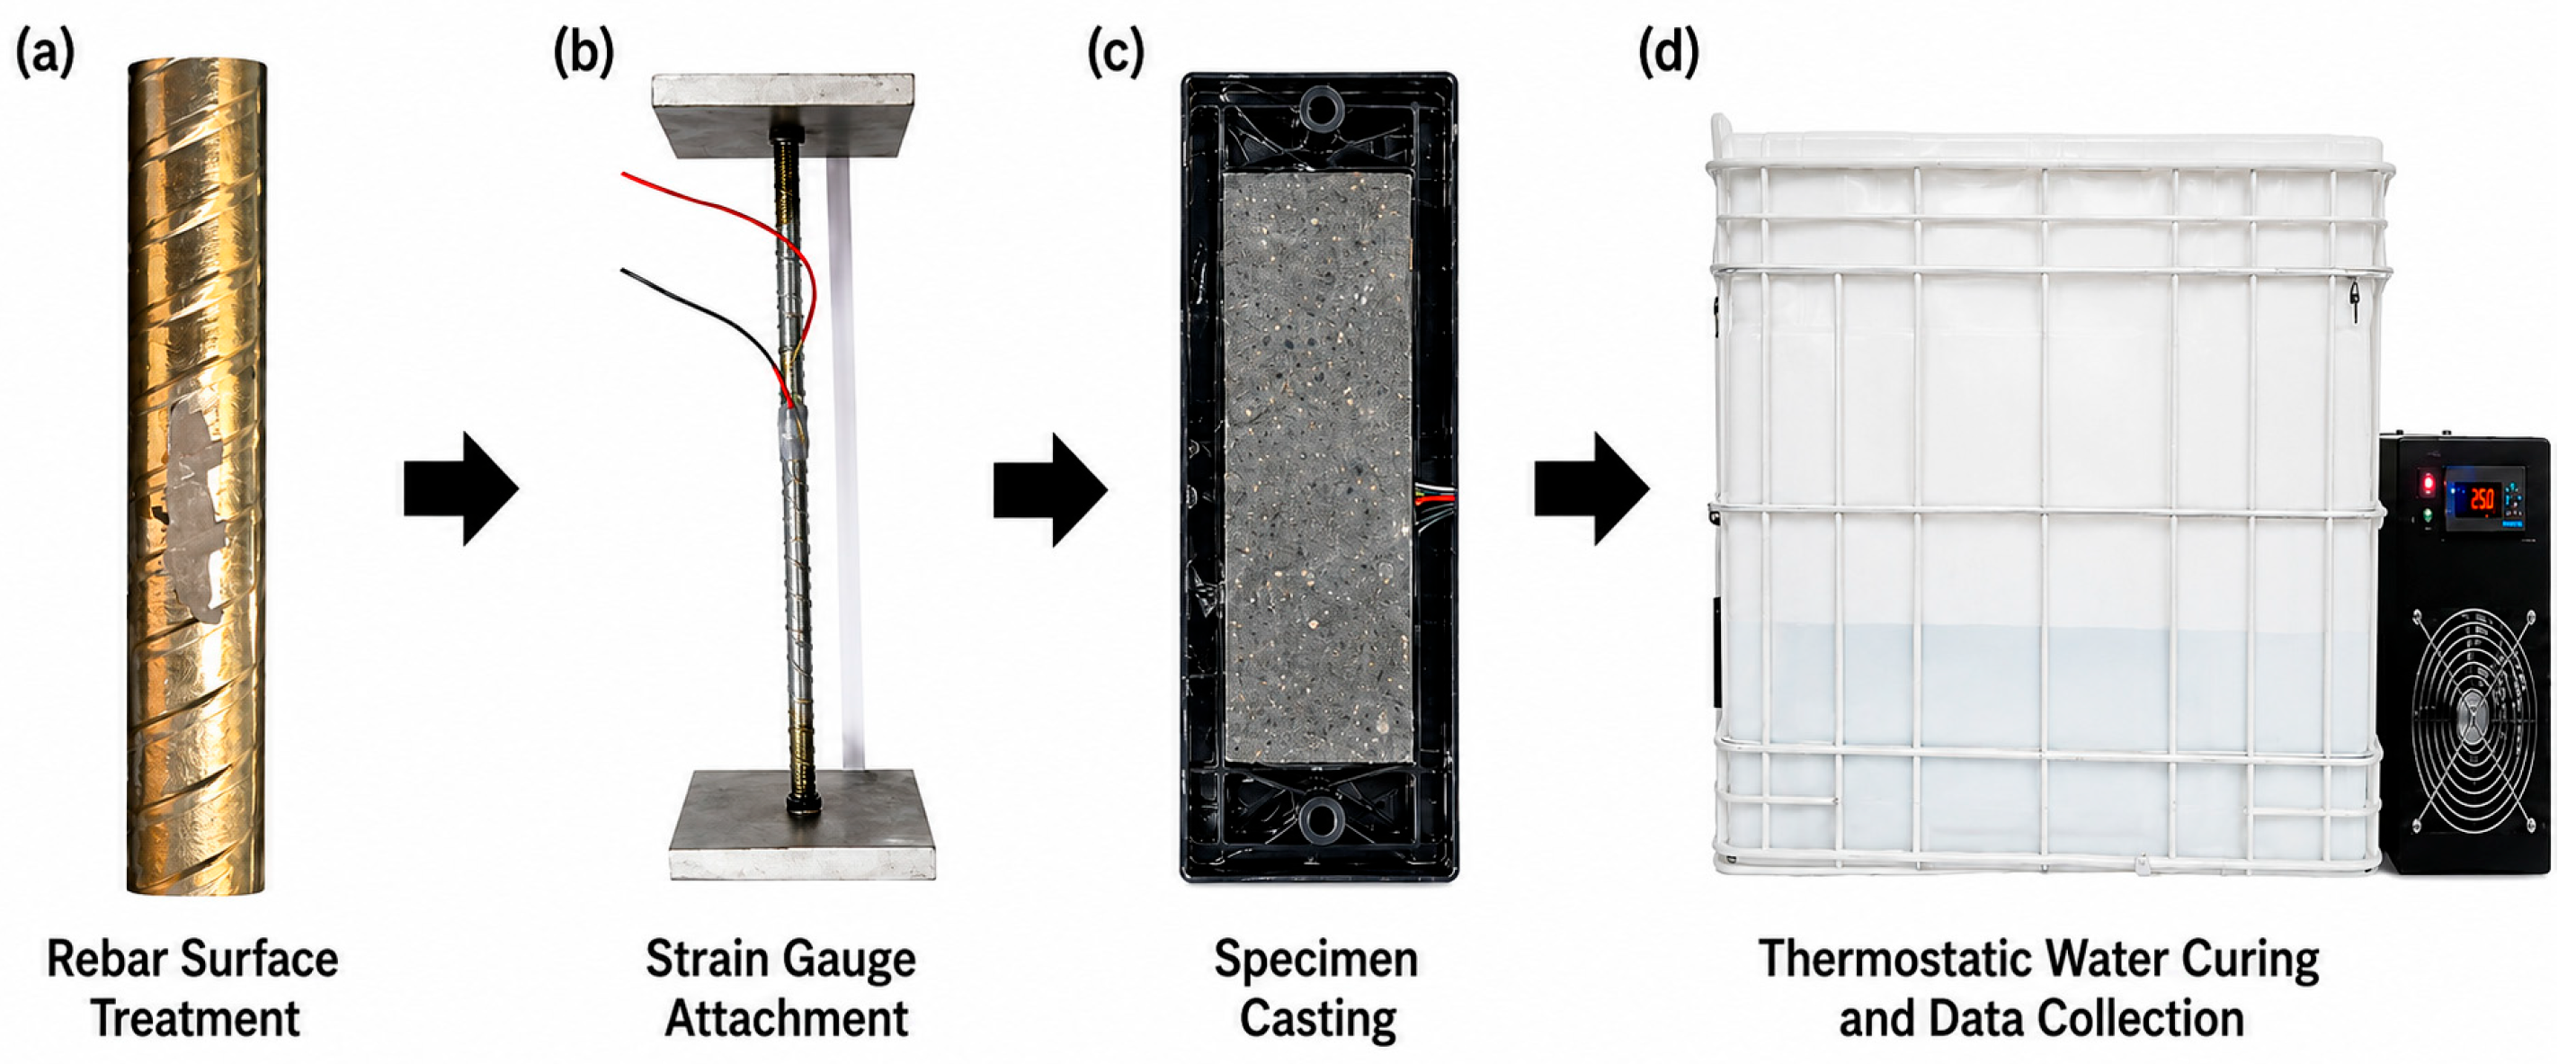
Restrained expansion was measured during 14 days of water curing in accordance with GB/T 23439-2017 [20]. The specimen preparation and data-acquisition procedure are illustrated in Figure 2. The four expansive mixtures were monitored under the same longitudinal restraint, and the PT mixture was used as the plain-concrete strength control.
Figure 2.
Preparation, instrumentation, casting, and water-curing sequence for restrained specimens: (a) rebar surface treatment; (b) strain-gauge attachment; (c) specimen casting; (d) thermostatic water curing and data collection.
The prism measured 100 mm × 100 mm × 300 mm. Its 355 mm longitudinal restraint included one 10 mm diameter steel bar and 12 mm end plates, giving a steel ratio ρ = π(10 mm)2/[4(100 mm × 100 mm)] = 0.785%, rounded to 0.79%. Steel was mechanically connected to the two end plates, and the strain response reflects axial expansion restrained by this bar.
A 120-3AA resistance strain gauge was bonded to each of the opposite upper and lower faces of the smoothed middle portion of the restraining bar. After waterproofing, the prism was held in water at 20 ± 2 °C. The DH3821 recorder (DongHua Testing Technology Co., Ltd., Jingjiang, China) acquired both bar strains at 1 h intervals for 14 days. Their arithmetic mean, εs = (εupper + εlower)/2, reduces the influence of bar bending and is the input to Equation (1). The reference reading was the stable value following installation and before significant restrained expansion.
Compressive and flexural strengths were measured at 3, 7, and 28 days in accordance with JTG 3420-2020 [21]. Specimens were demoulded after 24 h and subjected to standard moist curing. The cited procedure specifies nominal 150 mm cubes for compression and 150 mm × 150 mm × 550 mm prisms with a 450 mm third-point loading span for flexure; the nominal loading-rate ranges are 0.5–0.8 and 0.05–0.08 MPa/s, respectively. Unlike the restrained-expansion prisms, the strength specimens contained no longitudinal restraining bar.
These comparisons are descriptive. The 10–12% dosage interval identifies the tested E10 and E12 mixtures under the specified curing and restraint conditions and does not represent a statistically established optimum for a wider mixture population.
2.2.2. Full-Scale Slab, Restraint Device, and Field Instrumentation
One full-scale pretensioned slab was produced for the field trial. Its overall dimensions were 3700 mm (length) × 975 mm (width) × 240 mm (thickness), with an 800 mm self-stressing concrete segment at the monitored end. Ordinary concrete was cast first and cured to the required strength before the end segment was placed. The construction joint was located at x = 800 mm from the free end; cleaning and premoistening of the joint face were specified for the second placement. The end-plate assembly was embedded in the end-segment pour. Following surface finishing and water curing, the pretensioned strands were released at 6–7 days. Curing continued to day 14, after which the slab was lifted and installed (Figure 3).
Figure 3.
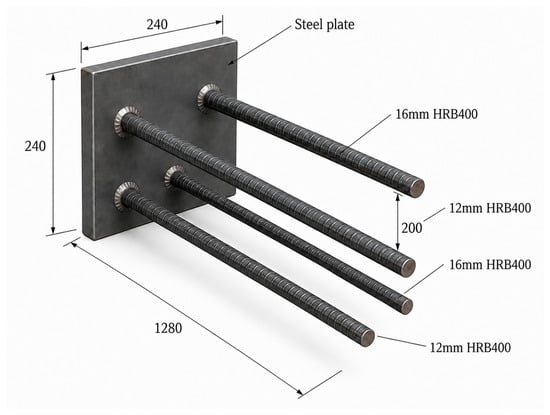
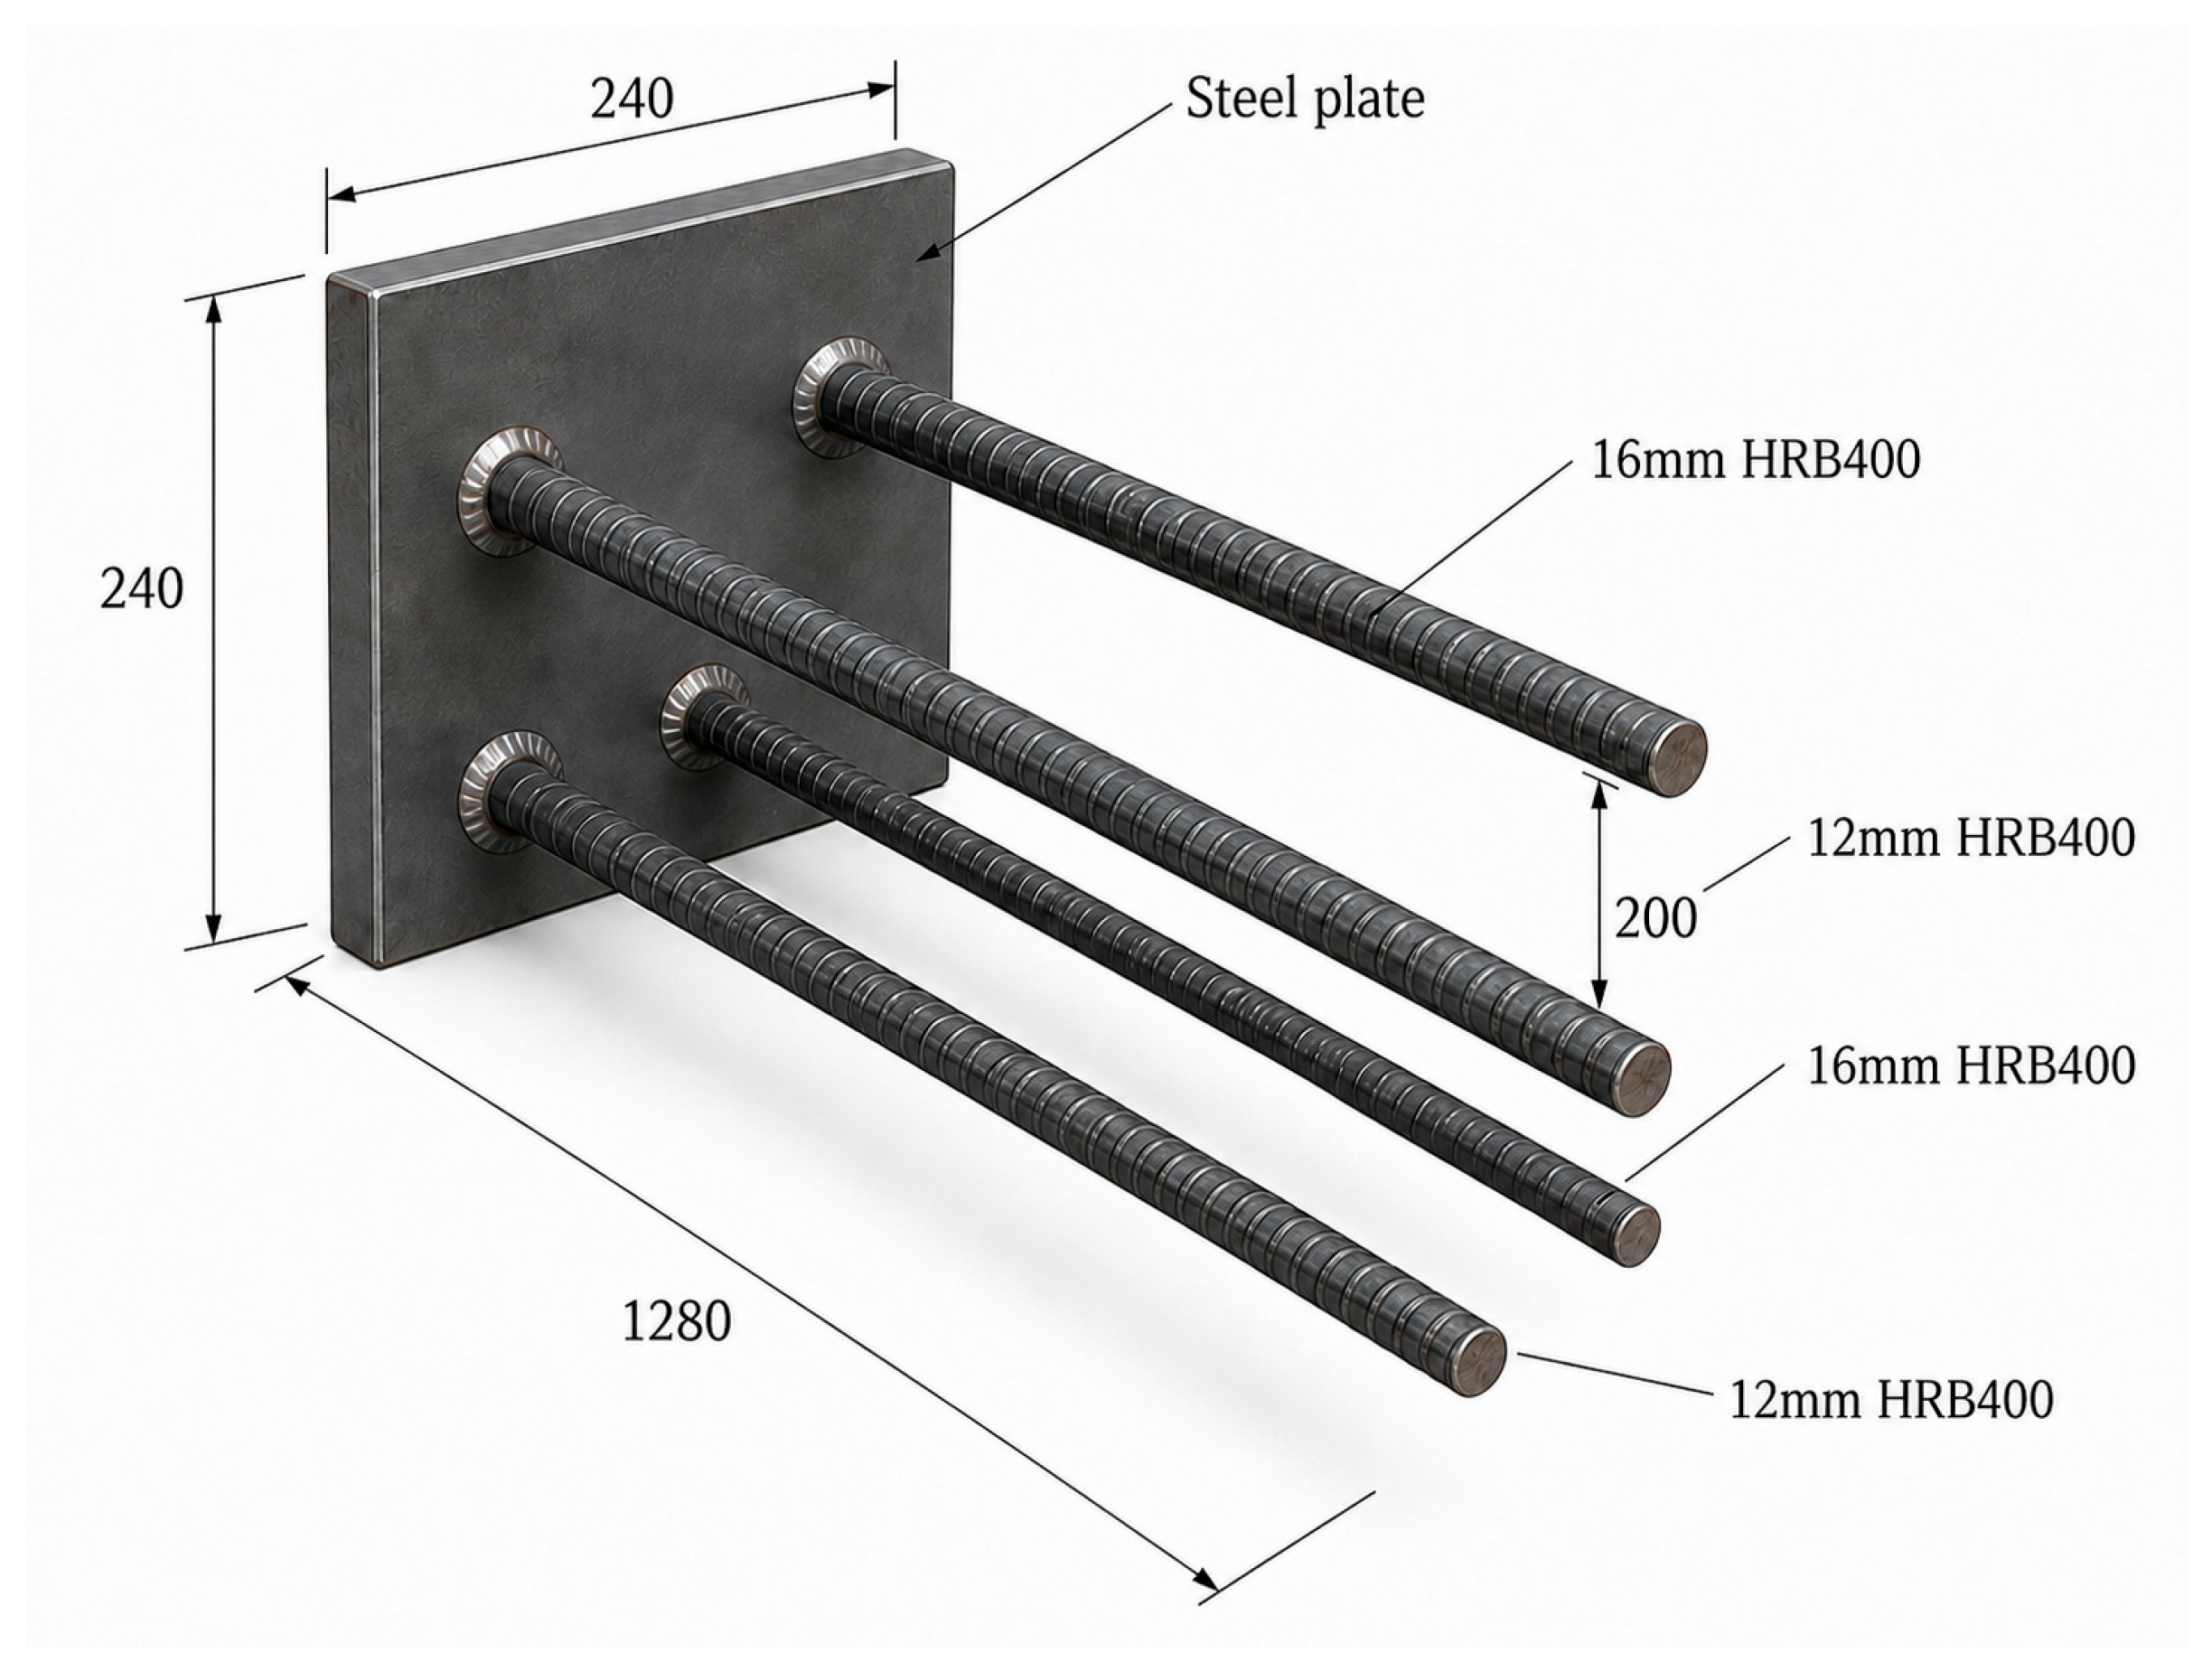
End-plate restraint device comprising a 240 mm × 240 mm steel plate, two 16 mm bars, and two 12 mm bars with a length of 1280 mm (dimensions in mm).
The end-plate device comprised four HRB400 bars (two 16 mm and two 12 mm in diameter); each was 1280 mm long and welded to a 240 mm square steel plate. Their combined area was As,d = 2π(162 + 122)/4 = 628.3 mm2. For Es = 200,000 MPa, the ideal axial stiffness was kd = EsAs,d/L = 98.2 kN/mm. Concrete expansion tensions the bars, while the plate transfers the restraining force to the surrounding concrete. The bars extend beyond the 800 mm segment into the adjacent concrete to develop anchorage.
Each 1280 mm bar crosses the 800 mm expansive end segment and extends approximately 480 mm into the adjacent ordinary concrete. The 240 mm plate spans the slab thickness. The device contribution was estimated assuming that all four bars underwent the measured pre-release end-segment strain of 221.23 με over their full 1280 mm length. This full-length compatibility assumption gave Fd = EsAs,dε = 27.8 kN, equivalent to 0.119 MPa when distributed over the 975 mm × 240 mm slab section. At 128.2 με, the corresponding force and average stress were 16.1 kN and 0.069 MPa. Because only 800 mm of the bar length traverses the expansive segment, this model provides a conservative sensitivity estimate under the assumed uniform strain. The estimates were subtracted from the total compression in the end-zone comparisons.
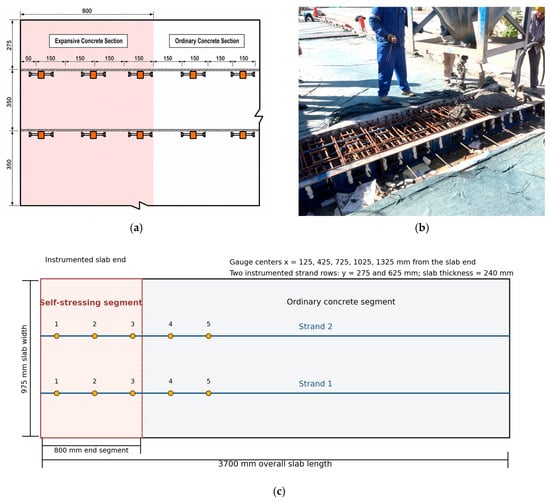
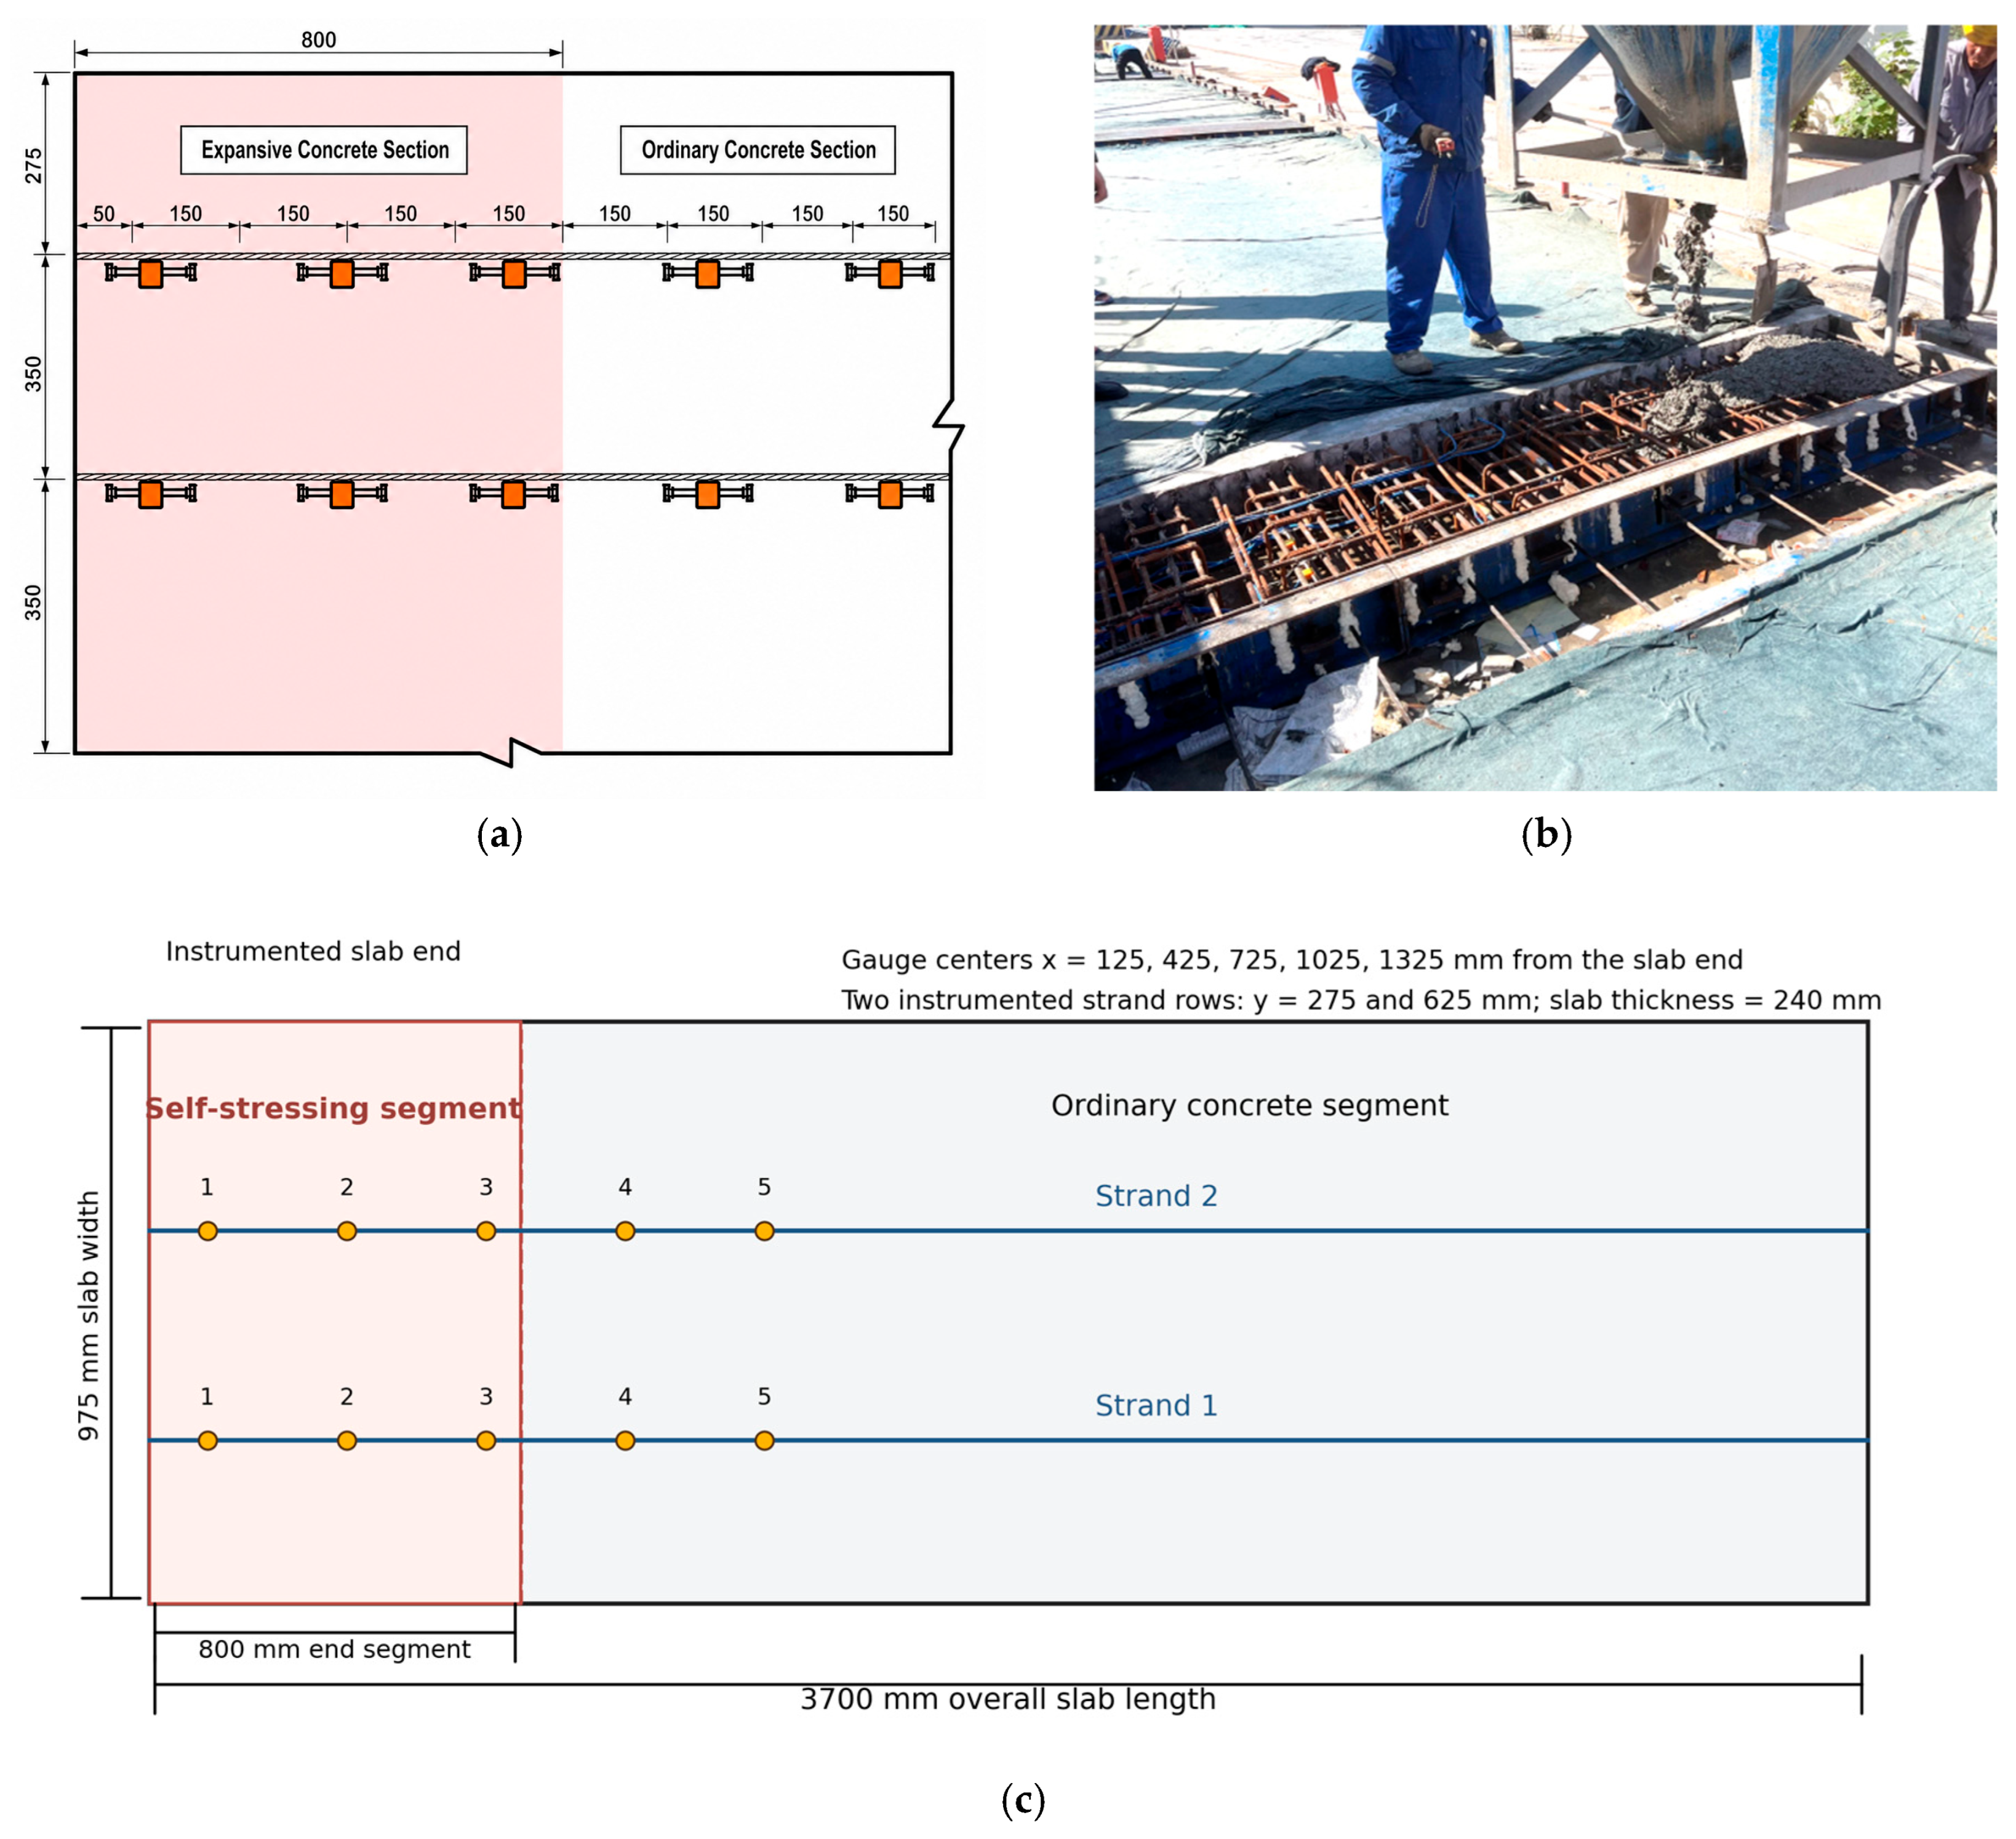
Five vibrating-wire strain gauges were installed beside each of two longitudinal strand lines, at x = 125, 425, 725, 1025, and 1325 mm from the same free end (Figure 4). The first three gauges on each line were located in the 800 mm end segment; the remaining two were in ordinary concrete. The strand lines were approximately 275 and 625 mm from the transverse slab edge. The gauges measured axial strain in the surrounding concrete.
Figure 4.
Full-scale slab geometry, segment interface, instrumented strands, and vibrating-wire gauge coordinates (dimensions in mm). (a) Gauge layout; (b) casting photograph; (c) dimensioned plan of the instrumented slab.
Vibrating-wire strain and built-in temperature were recorded every 5 min in the plant, beginning 2 h before end-segment placement, and every 30 min after field installation. Stable pre-placement readings defined the zero reference for each channel. The strain increment associated with release was obtained from paired readings immediately before and after strand cutting. For the long-term series, the 14:00 reading on each available day was selected to maintain a consistent observation time. The 18-day acquisition gap during transfer and installation was retained without interpolation.
2.2.3. Stress Decomposition and Transfer-Length Analysis
Distance x was measured from the monitored free end, and t0 denotes the stable pre-placement gauge reference. For consistency, compression is represented as negative in the plots and reported as a positive magnitude in the text and summary tables. The measured strain was decomposed as εobs(x,t) = εexp(x,t) + Δεrelease(x,t) + εthermal(x,t) + εshrink/creep(x,t), where Δεrelease is the difference between immediately post-release and pre-release readings at the same gauge. Strand-induced compression was calculated as σp(x) = Ec|Δεrelease(x)| using the nominal C50 modulus Ec = 34.5 GPa. Expansion-induced compression was estimated as σs(x,t) = ρEsεexp(x,t), with ρ = 4.2% for the end segment; total compression was σtotal = σp + σs. The influence of elastic modulus and device restraint is assessed below.
For the 975 mm × 240 mm gross section, the adopted end-segment restraint ratio of ρ = 0.042 corresponds to a nominal effective longitudinal steel area of 9828 mm2. Conversion of measured strain to stress assumes axial compatibility between this effective reinforcement and the surrounding concrete. Strain increments recorded across strand release characterize the net transferred-strand response at the gauge locations; the applied strand force and individual time-dependent prestress-loss components cannot be resolved independently from these readings. The end-plate contribution is evaluated separately in Section 2.2.2.
Transfer length was evaluated for each strand line using the 95% average-maximum-strain method [17]. Release-induced strain was calculated at each gauge from paired pre-release and post-release readings. The near-constant values at the two most distant gauges defined an interior plateau εAMS. Linear interpolation between the adjacent gauges bracketing 0.95εAMS gave lt = xa + (xb − xa)(0.95εAMS − εa)/(εb − εa). No smoothing was applied between the gauges, which were spaced 300 mm apart. Accordingly, the spatial resolution of the transfer-length estimate was approximately ±150 mm.
The ordinary-concrete region (x = 1025–1325 mm) provided a strand-induced compression reference of approximately σref = 1.25 MPa. At x = 125 mm, strand-induced compression was σp,end ≈ 0.50 MPa, giving a local deficit Δσ = σref − σp,end ≈ 0.75 MPa. End-zone stress restoration was quantified by R(t) = σtotal(125 mm,t) − σref; R(t) ≥ 0 indicates compression at least equal to the interior reference. To assess the influence of the end-plate device, an adjusted reserve was calculated as Rmin(t) = σtotal − σd,max − σref, where σd,max is the device contribution estimated above.
Sensitivity to the assumed concrete modulus was evaluated over Ec = 30–38 GPa. Because the local and interior strand-induced components use the same conversion, the estimated end-zone deficit varied from approximately 0.65 to 0.83 MPa. After subtracting the estimated device contribution, the day-140 end-segment component was approximately 1.01 MPa, exceeding the upper end of this deficit range.
3. Analysis and Discussion
3.1. Restrained Expansion and Self-Stress of Self-Stressing Concrete
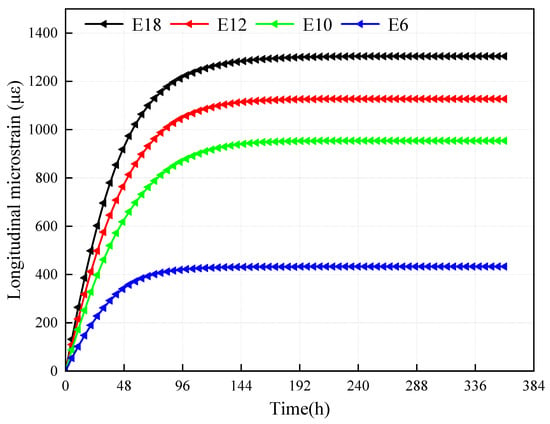
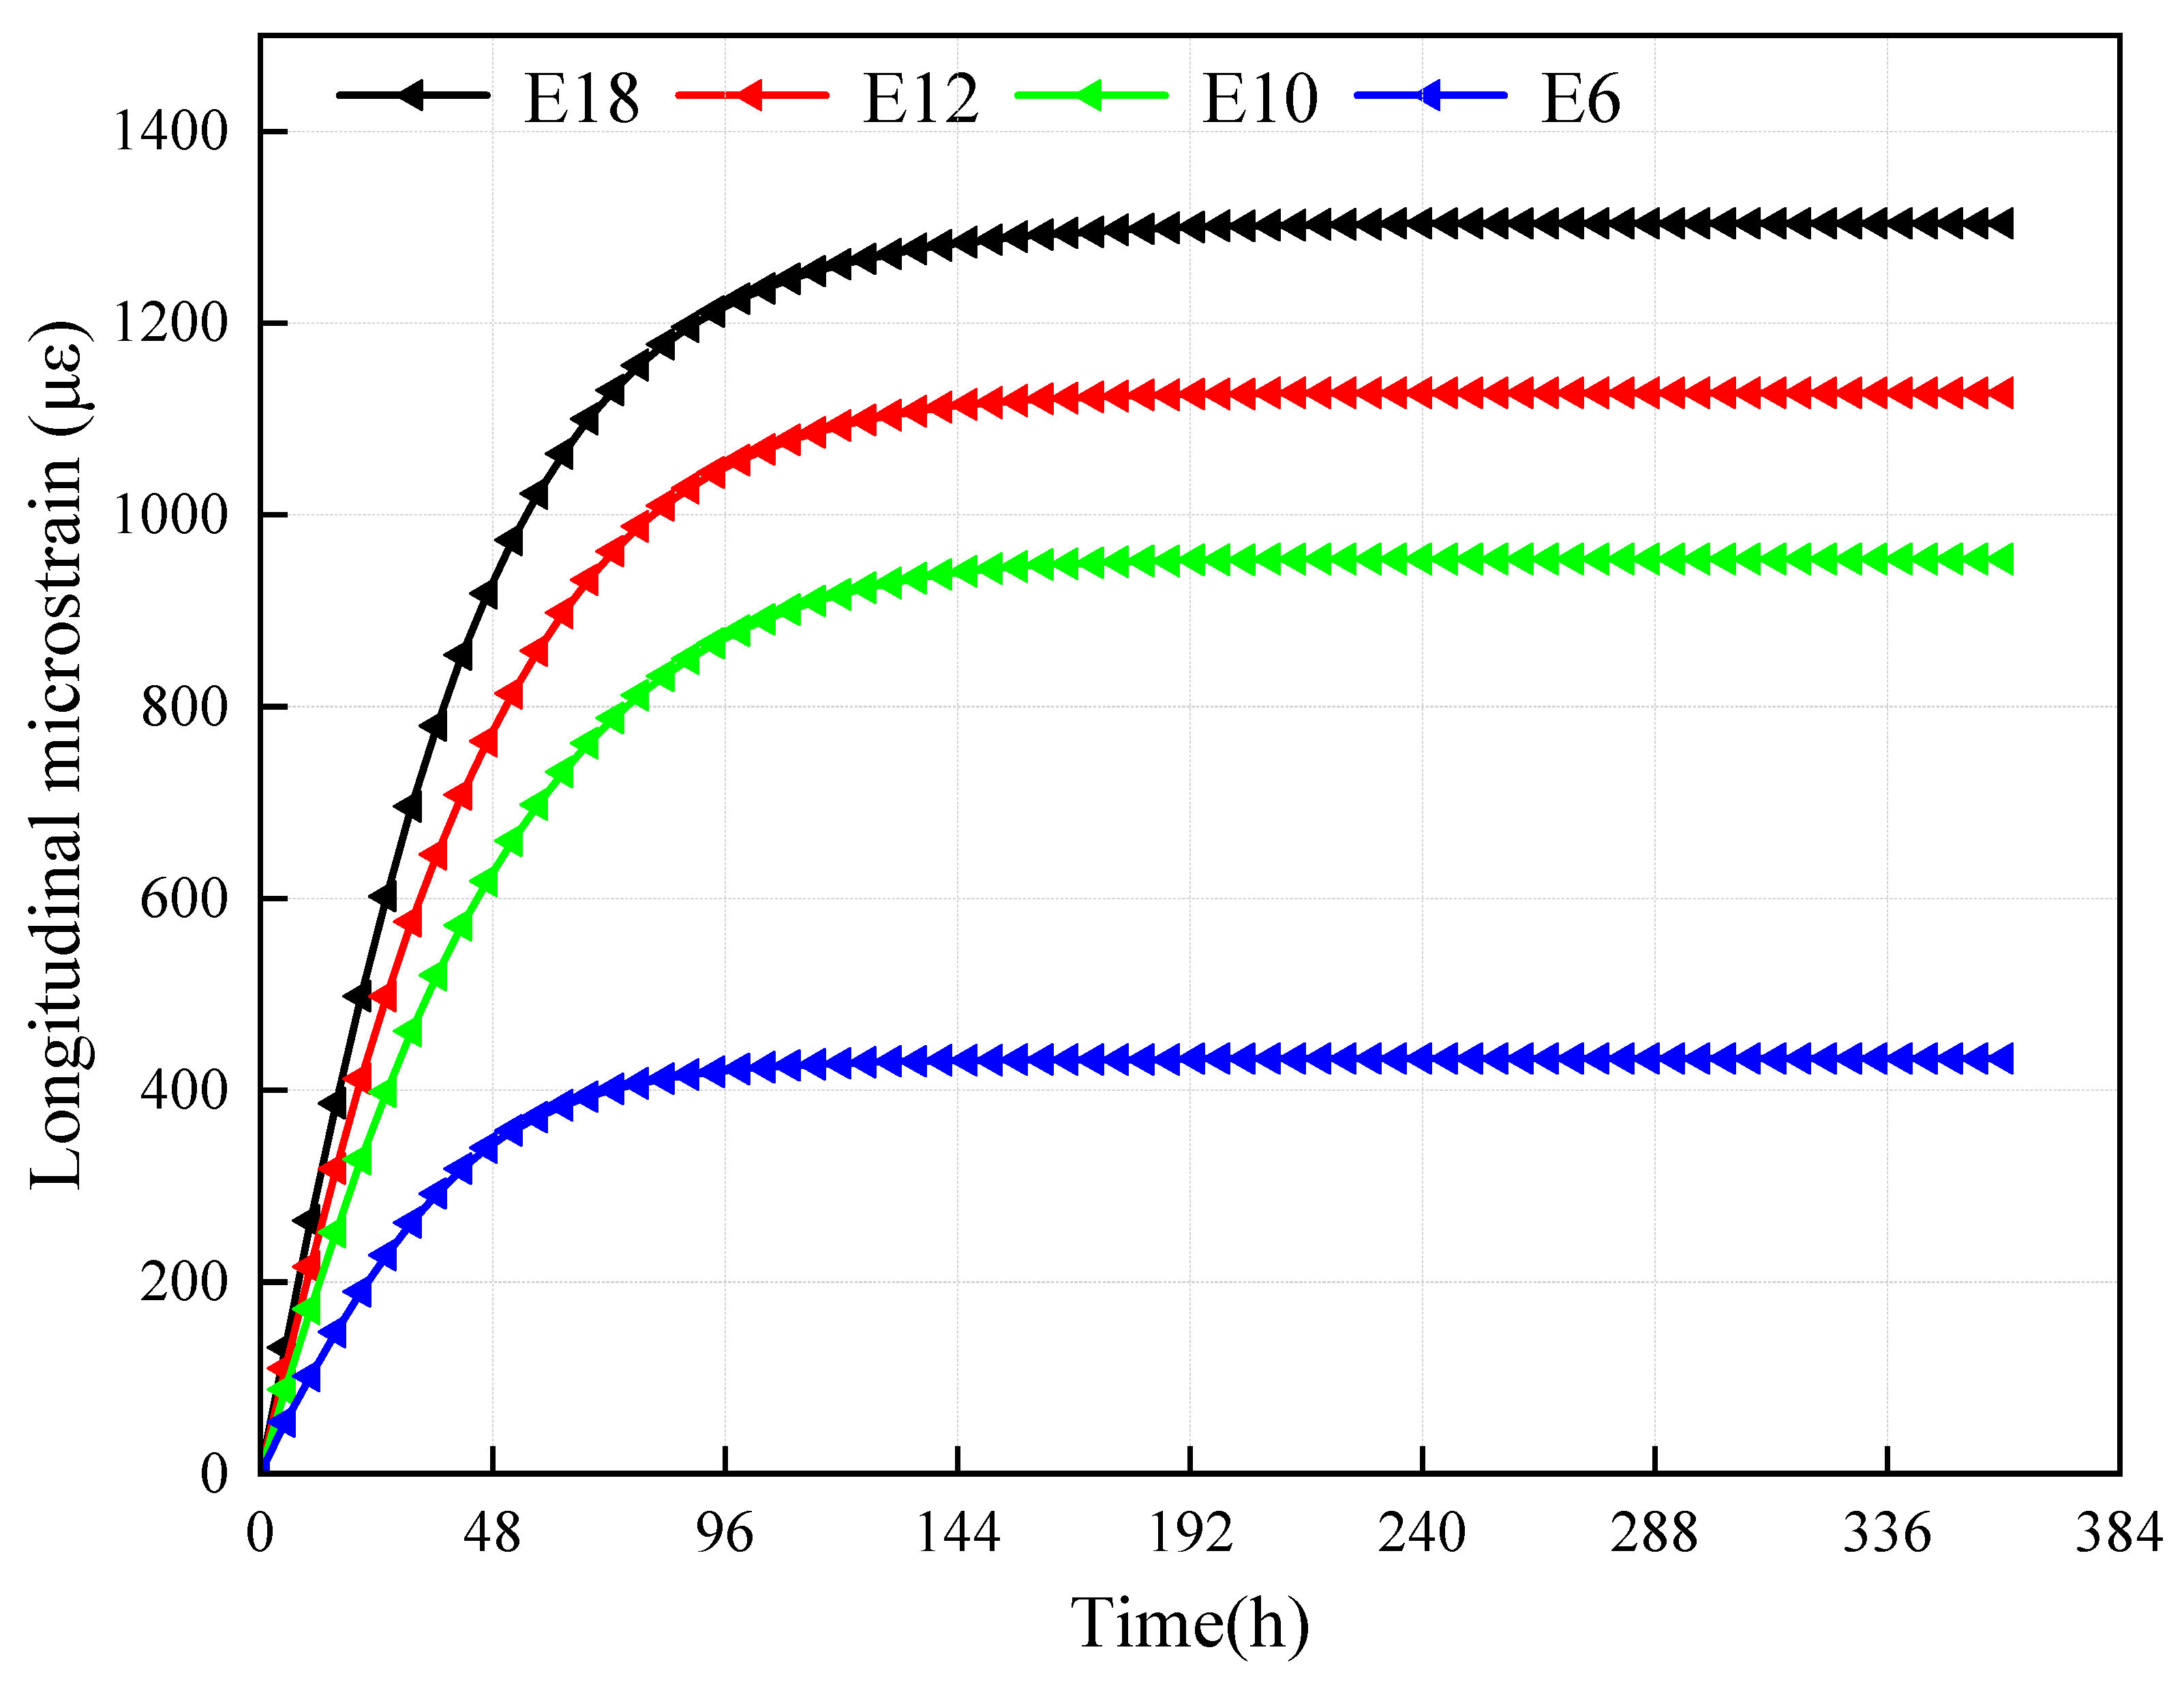
The longitudinal restrained-bar strains measured for the four expansive mixtures are shown in Figure 5. Their 14-day development can be divided into four stages:
Figure 5.
Longitudinal restrained expansion at four expansive-agent dosages.
(1) Initial hydration (0–10 h). Strain was small while setting, bond, and restraint were developing; expansion produced little measurable bar tension during this interval.
(2) Rapid restrained expansion (10–216 h).
As hydration proceeded, the measured bar strain rose rapidly and the 10%, 12%, and 18% curves separated clearly. Increasing expansive-agent dosage therefore increased the restrained expansion recorded under the same bar ratio.
(3) Decelerating expansion (216–288 h). The strain-growth rate decreased after approximately 216 h as rapid expansion subsided.
(4) Stabilization (288–336 h). Only minor additional strain developed during the final two days of water curing.
Axial force equilibrium between the restraining bar and concrete gives the compressive self-stress of the restrained specimen as Equation (1):
Here σs is the compressive self-stress in MPa, ρ = As/Ac is the restraining-steel area divided by the gross concrete area, Es = 2.0 × 10⁵ MPa, and εs is the mean steel strain expressed as a dimensionless quantity (e.g., 862 με = 862 × 10−6). For E10, using the nominal steel ratio of 0.79% gives 0.0079 × 200,000 × 862 × 10−6 = 1.36 MPa. The restrained-expansion and calculated self-stress results are summarized in Table 3.
Table 3.
Restrained expansion and calculated self-stress for the tested mixtures.
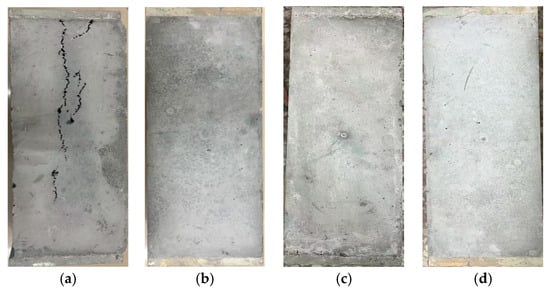
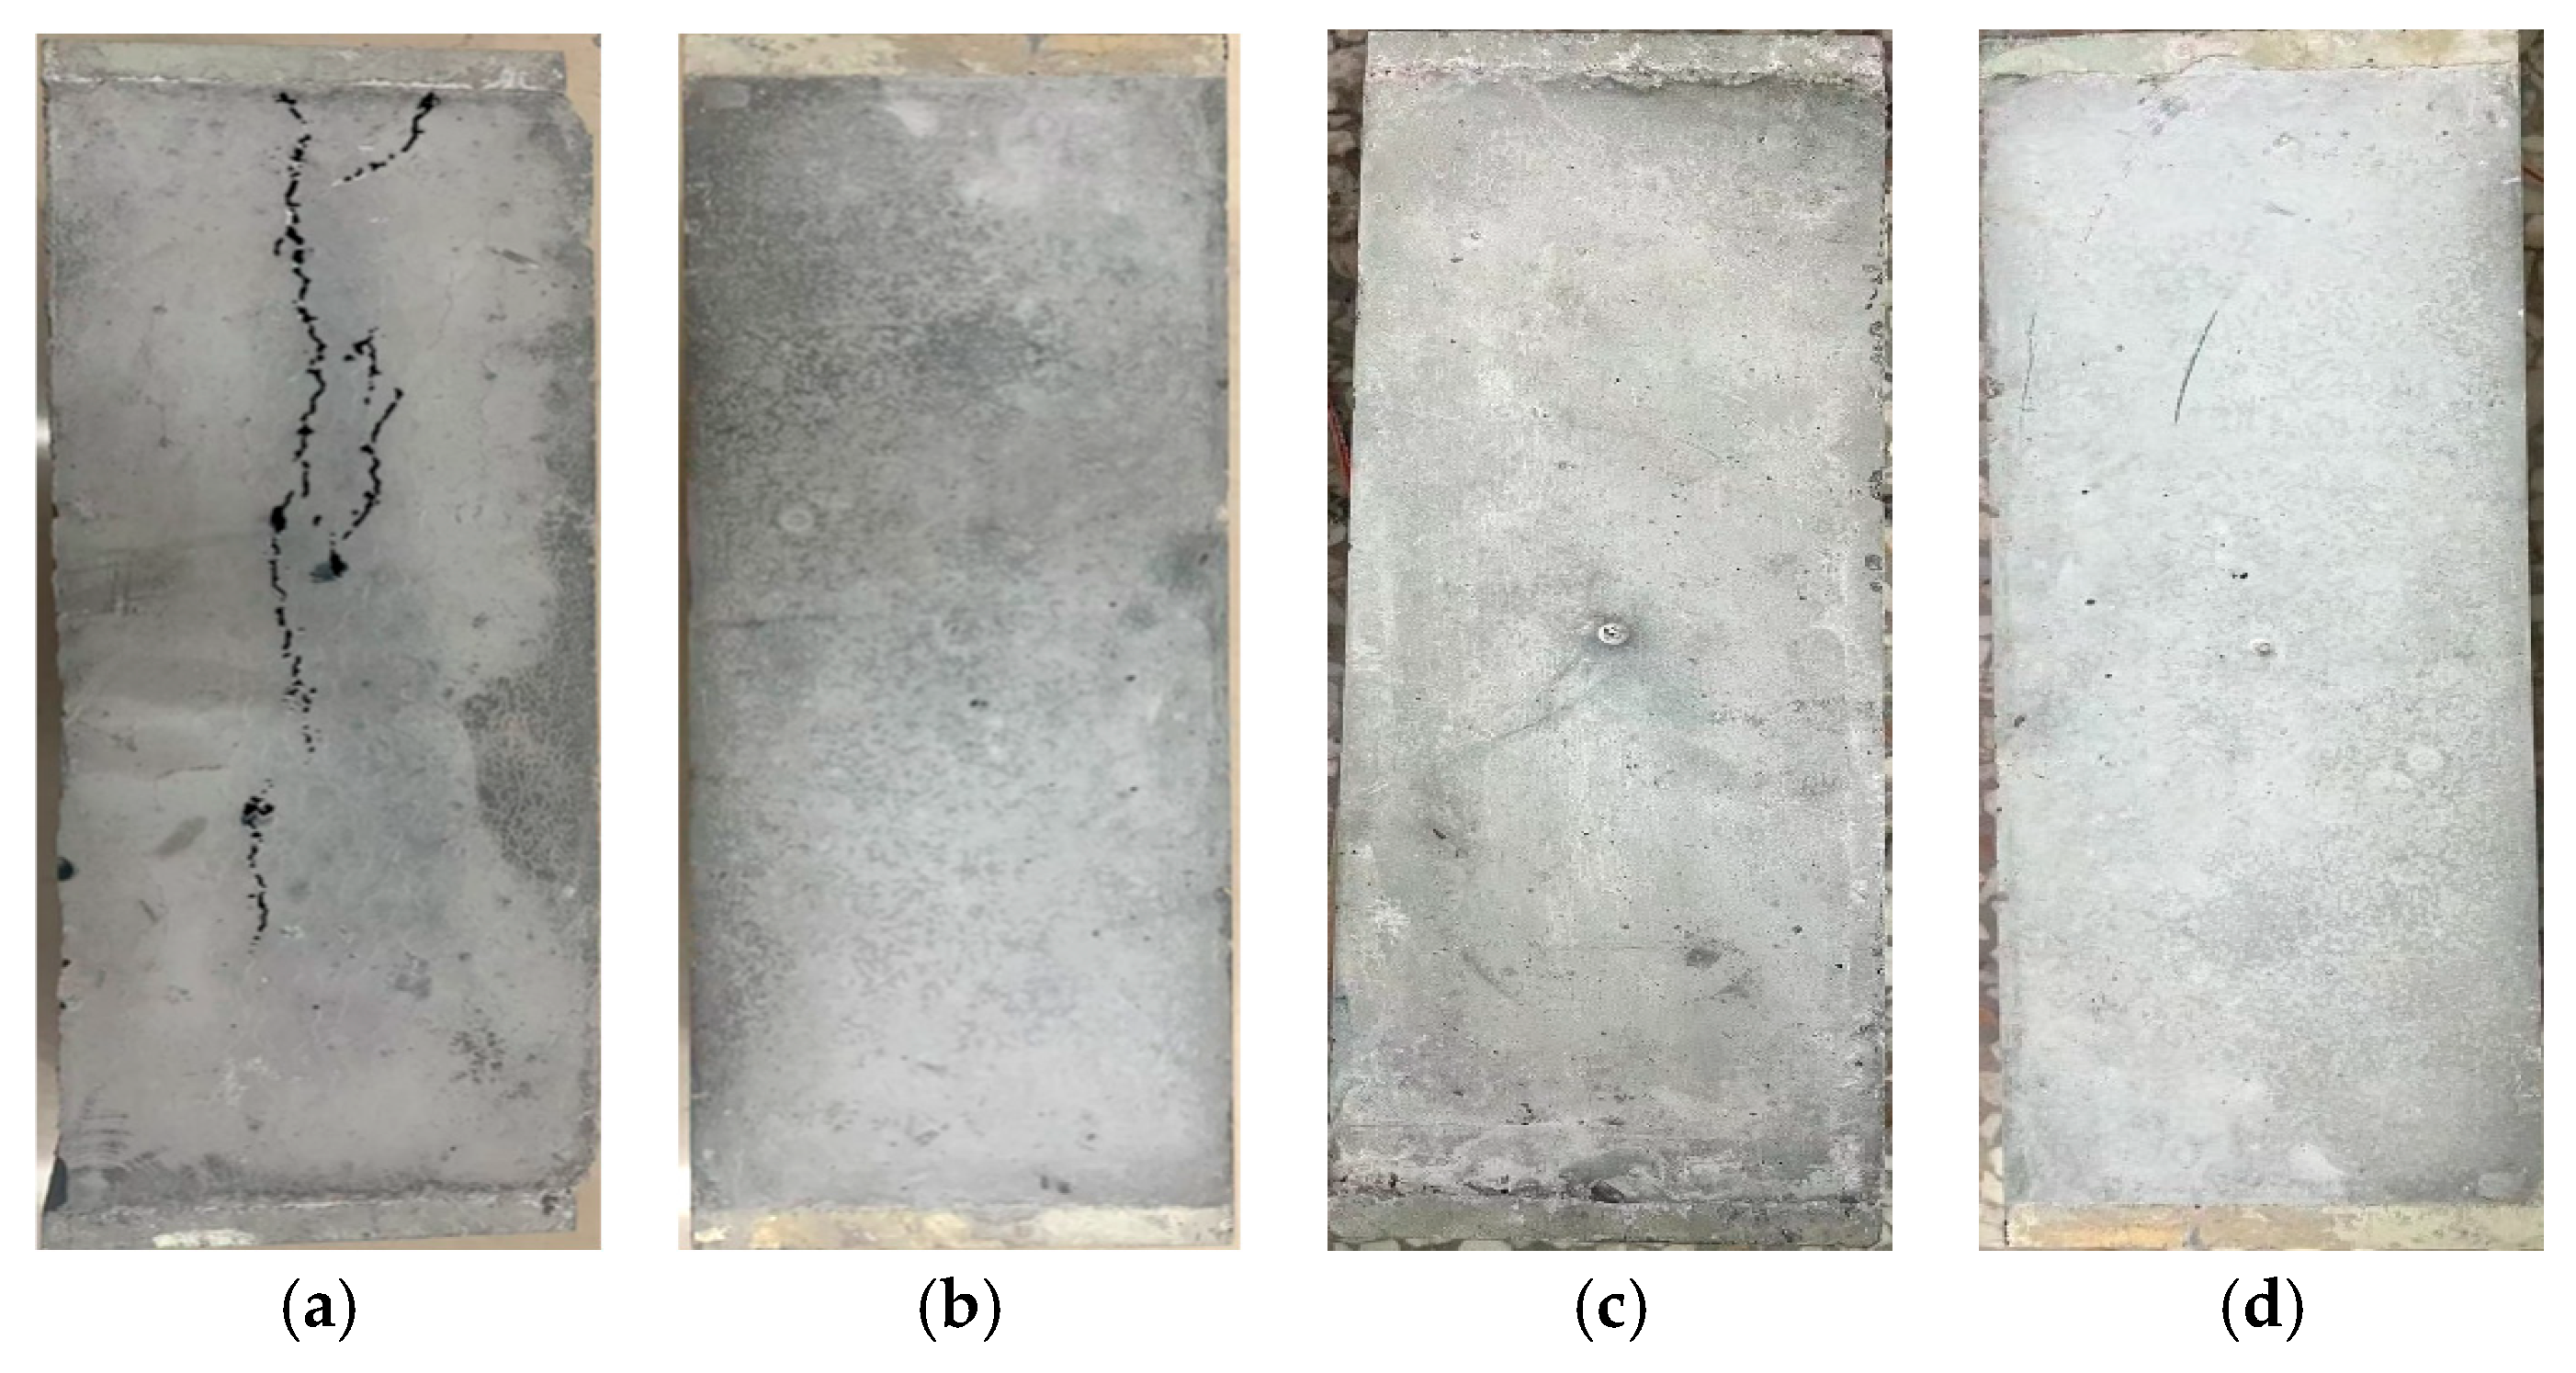
After 14 days, the E18 restrained specimen showed a visible longitudinal crack extending along much of its face (Figure 6). No comparable crack was observed on the photographed E6, E10, or E12 specimens. The 18% mixture was therefore excluded from the end-segment application, and the 10–12% range was selected from the tested mixtures on the basis of restrained expansion and surface condition.
Figure 6.
Restrained-prism surface condition after 14 days; the longitudinal E18 crack is marked in the image. (a) E18; (b) E12; (c) E10; (d) E6.
3.2. Mechanical Properties of Self-Stressing Concrete
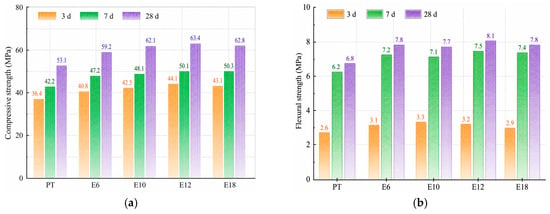
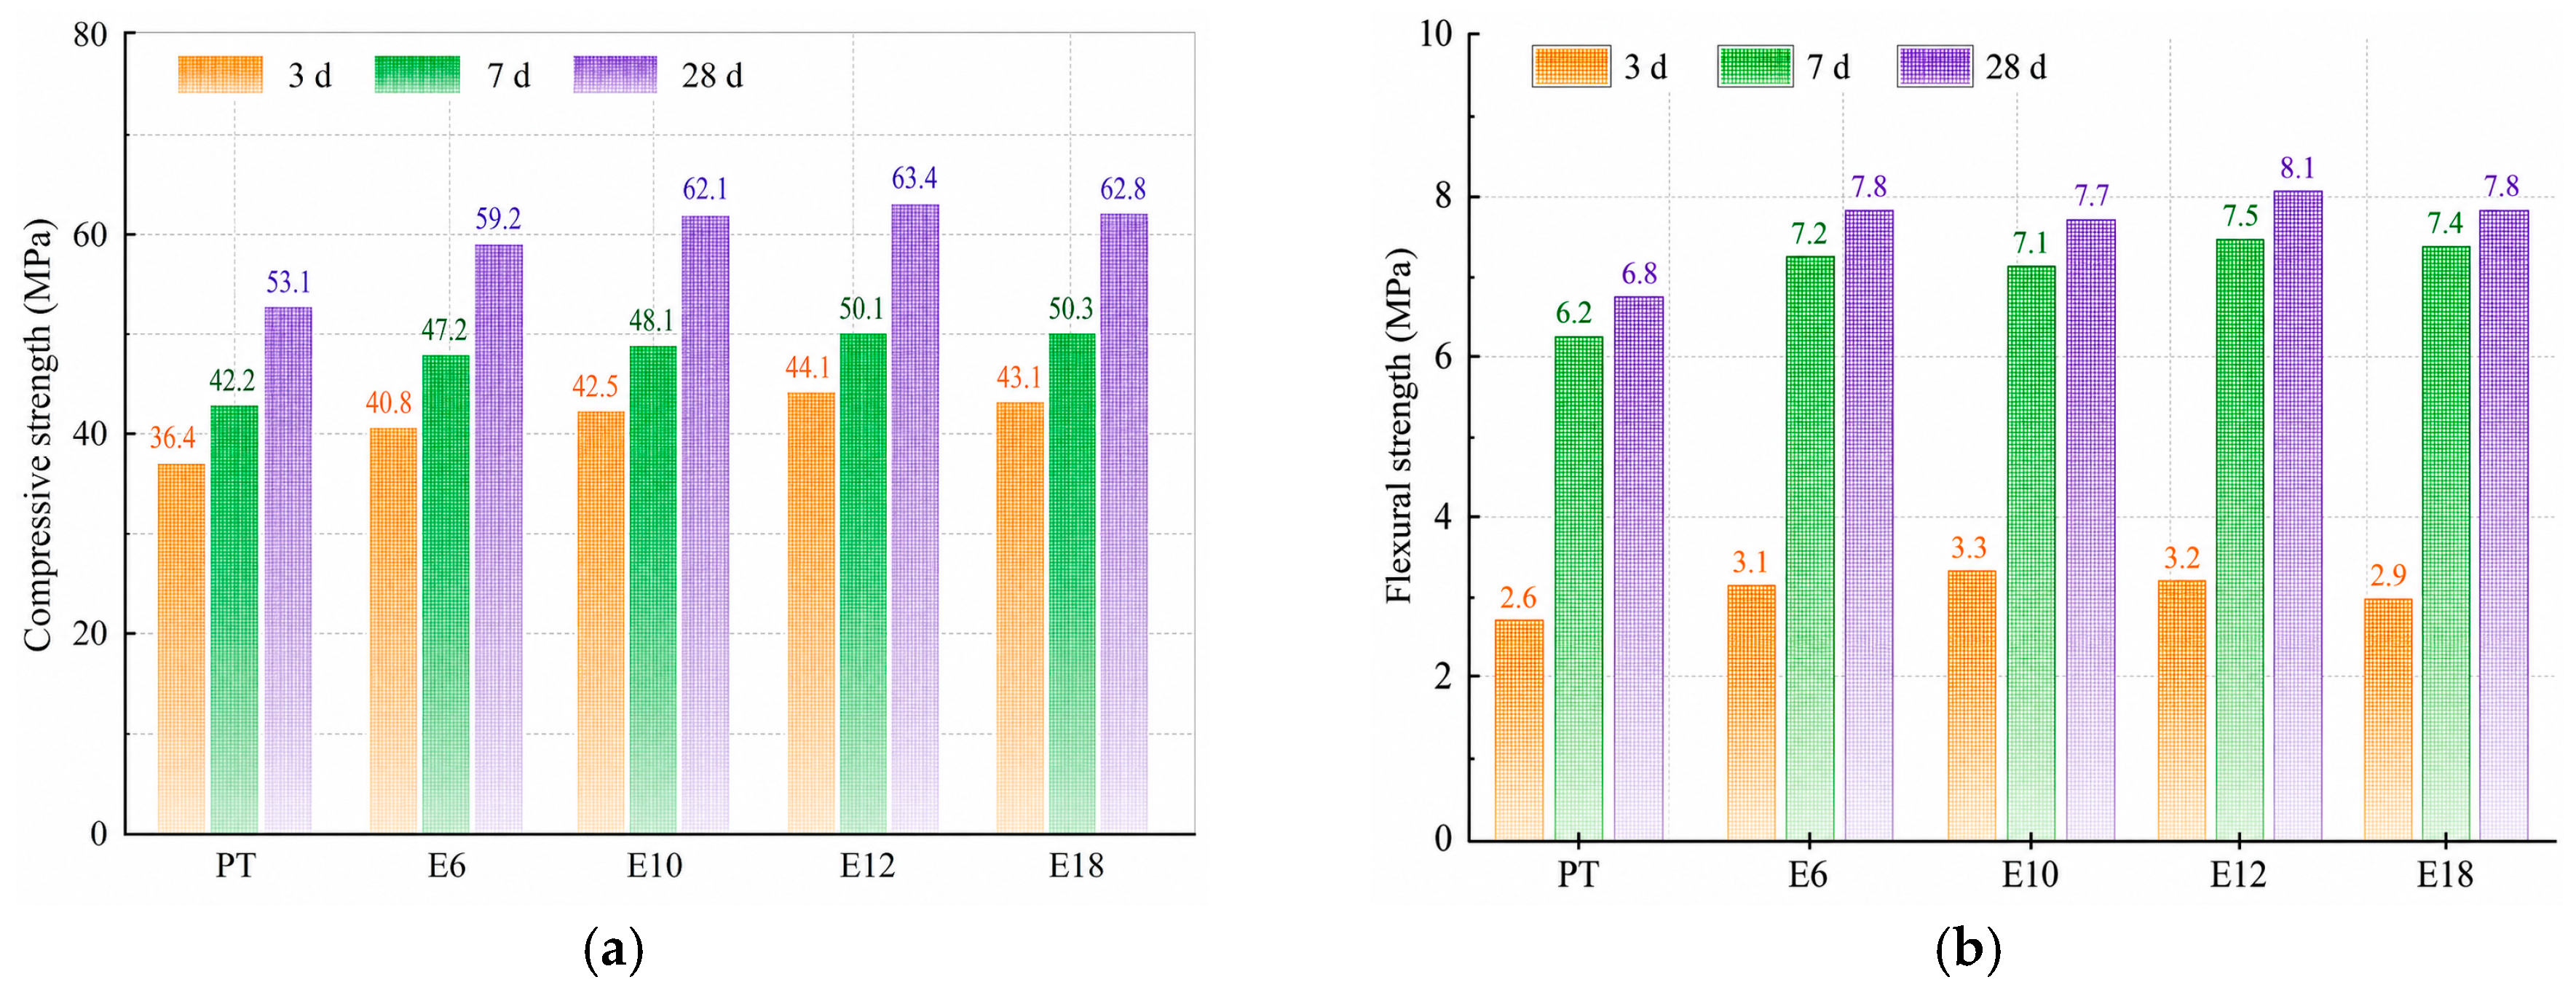
The nominal compressive-strength requirement for the precast slab was 50 MPa in the cited JTG D40-2011 design context [22]. The compressive and flexural strength results are shown in Figure 7 and listed numerically in Table 4.
Figure 7.
Compressive and flexural strengths at 3, 7, and 28 days. (a) Compressive strength; (b) flexural strength.
Table 4.
Compressive and flexural strengths of the tested mixtures at 3, 7, and 28 days (MPa).
Relative to PT, the 3-day compressive strengths of E10 and E12 increased by 16.8% and 21.2%, respectively. At 28 days, the compressive strengths of E10, E12, and E18 increased by 16.9%, 19.4%, and 18.3%, while their flexural strengths increased by 13.2%, 19.1%, and 14.7%, respectively. The percentages were calculated from the values in Table 4.
E12 achieved the highest 28-day compressive and flexural strengths, at 63.4 and 8.1 MPa, respectively. Although E18 also exceeded the PT control in strength, its restrained specimen exhibited a longitudinal crack. Strength and restrained-expansion behavior were therefore considered jointly in mixture selection.
The 28-day compressive and flexural strengths of the expansive mixtures were at least 59.2 and 7.7 MPa, respectively.
The E10 and E12 mixtures combined calculated laboratory self-stresses of 1.36–1.53 MPa with relatively high strengths and no visible longitudinal cracking. Because laboratory specimens were continuously water-cured whereas the slab experienced plant and field temperature variations, the full-scale strain data are analyzed separately in Section 3.3.
3.3. Full-Scale Slab Stress Restoration Through 180 Days
The monitored response is presented for three successive stages:
During casting and curing, restrained expansion tensions the internal steel and end-plate bars, generating compression in the self-stressing segment.
At strand release (6–7 days), prestressing force is transferred to the concrete; the resulting strain increment is isolated from paired gauge readings.
Following 14 days of curing and field installation, paired strain and temperature readings were collected through day 180, with an 18-day interruption during transfer and installation.
3.3.1. Casting and Curing of the Self-Stressing Segment
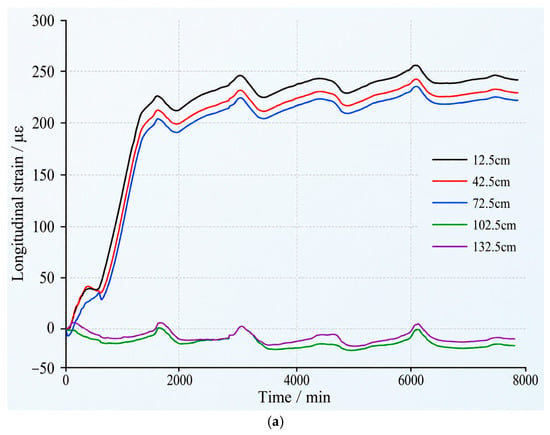
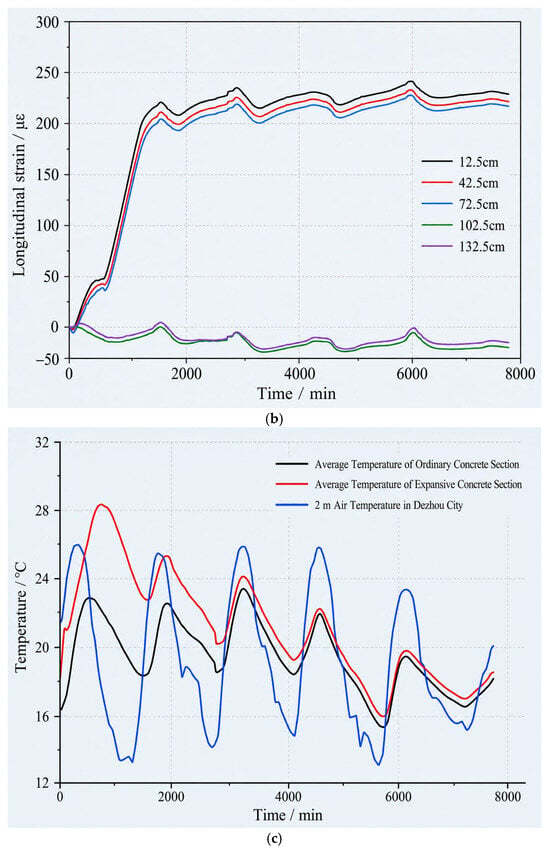
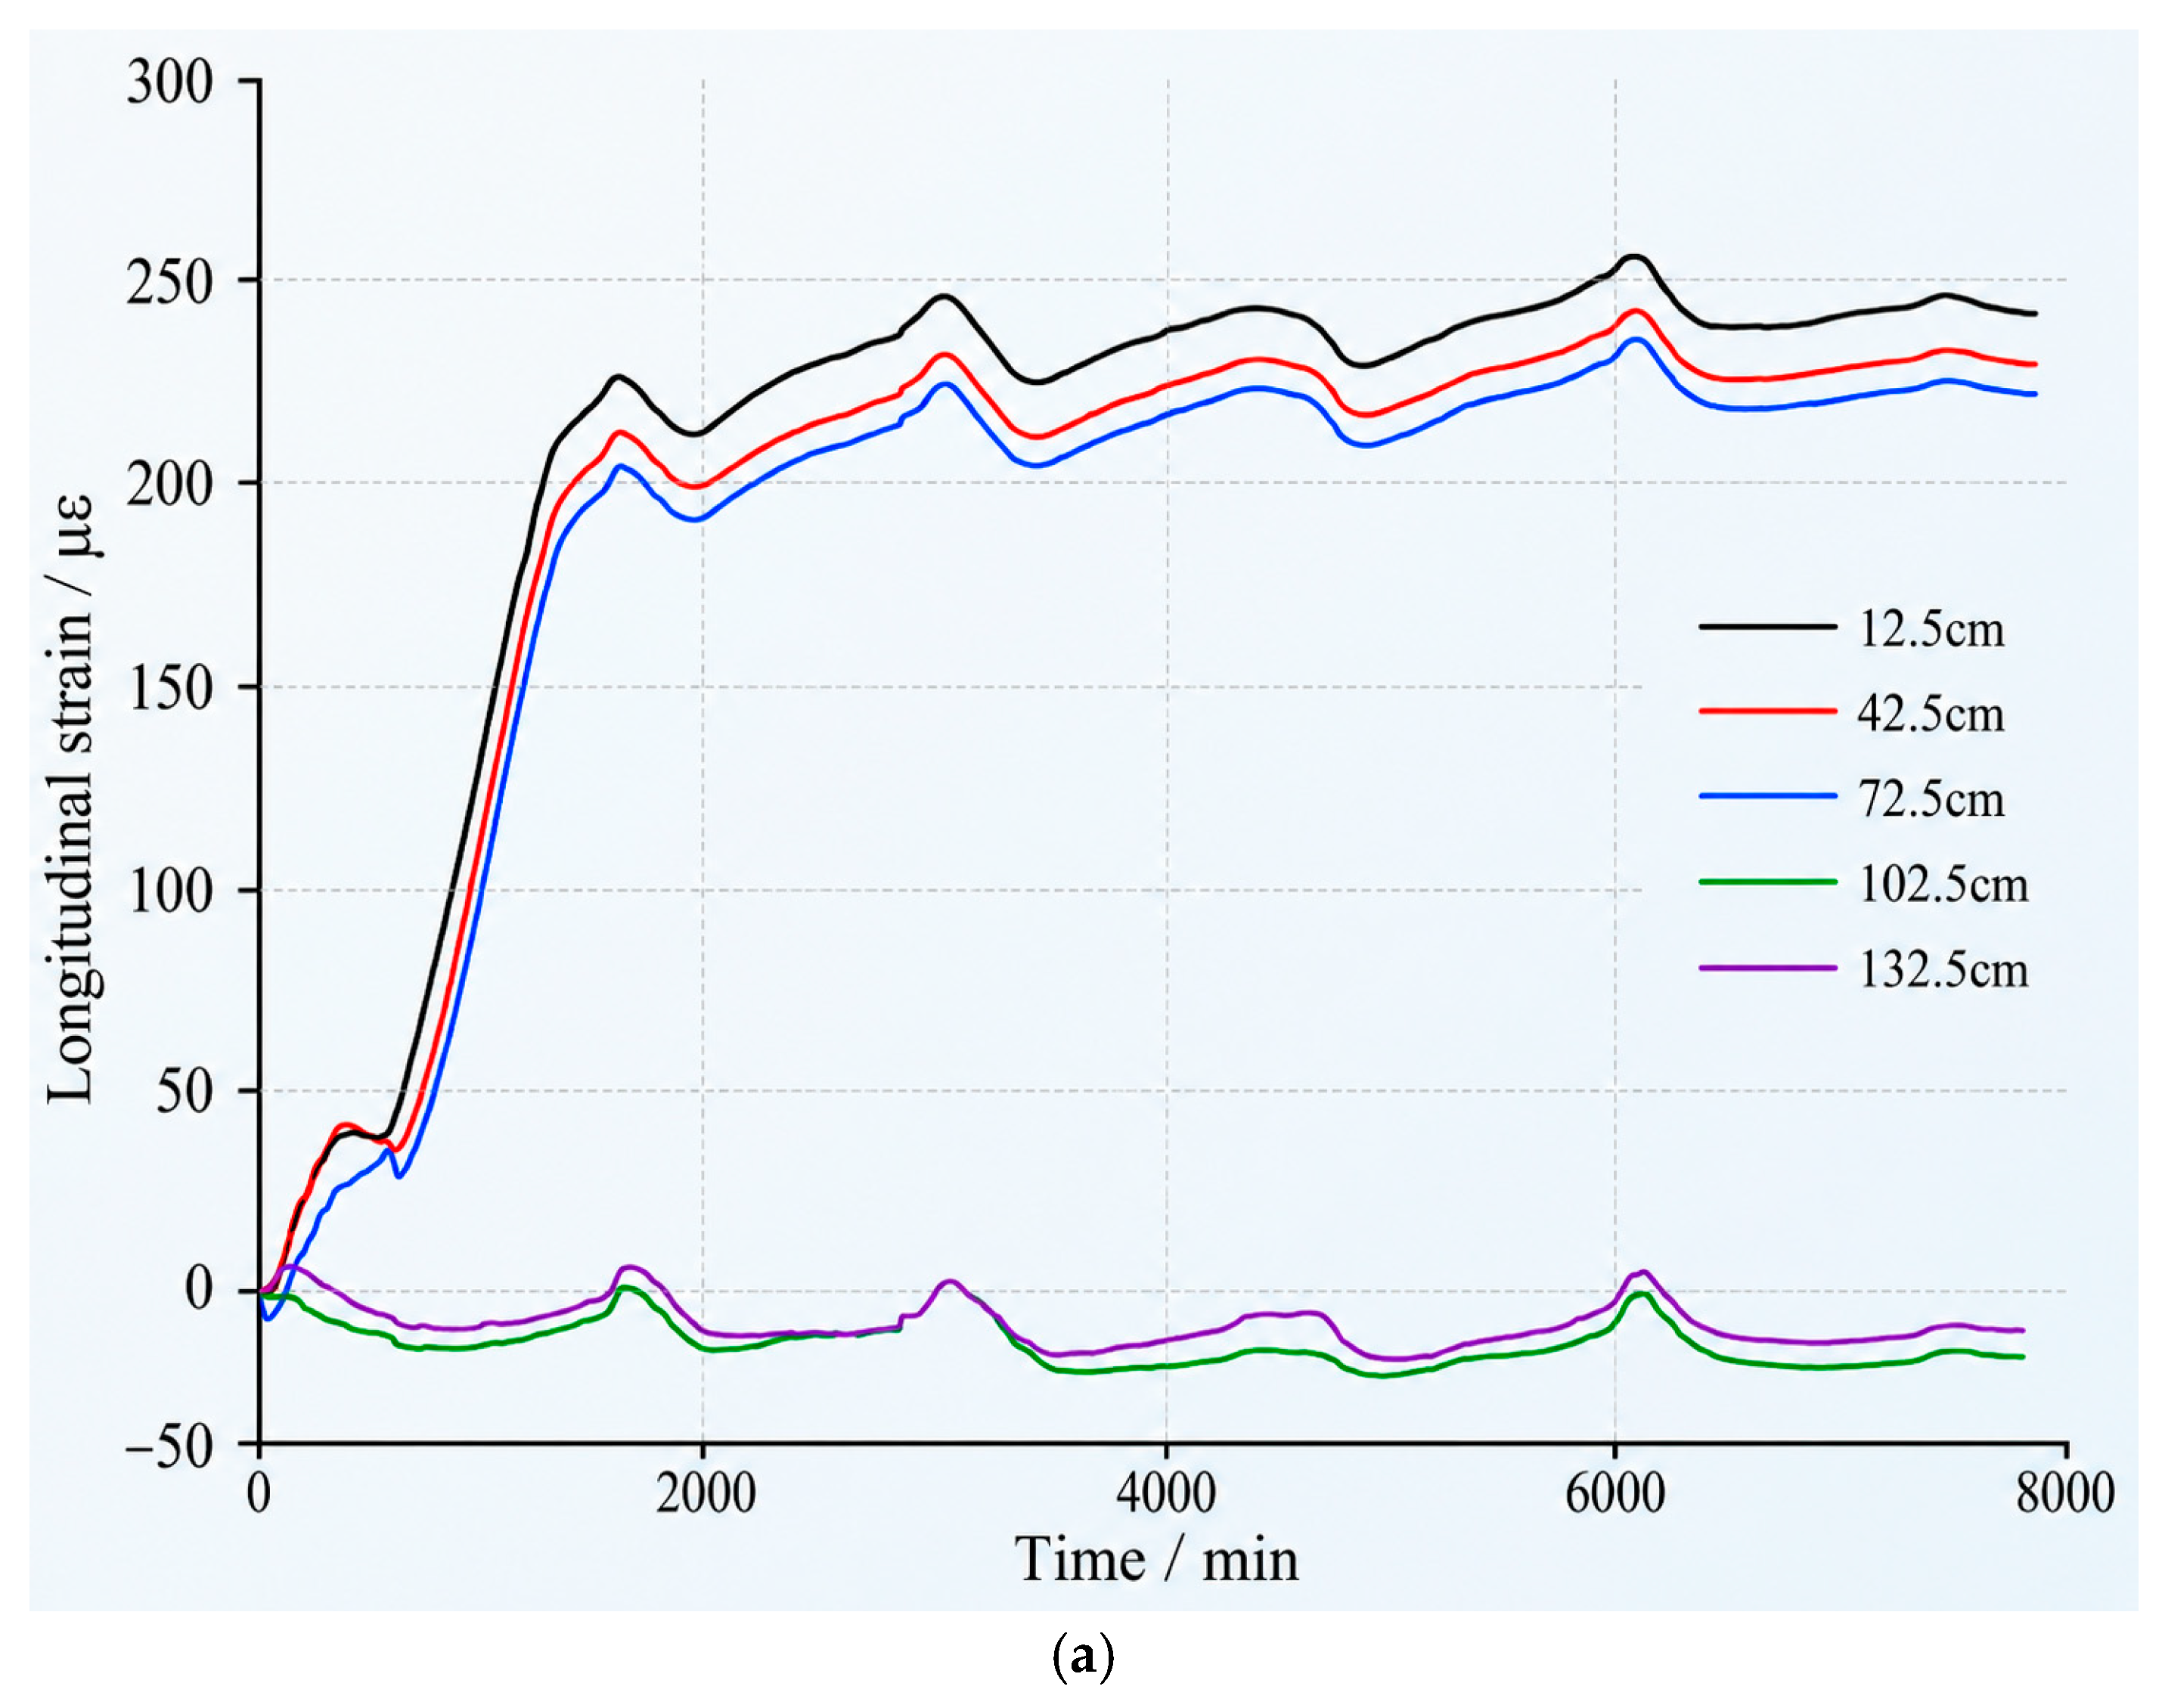
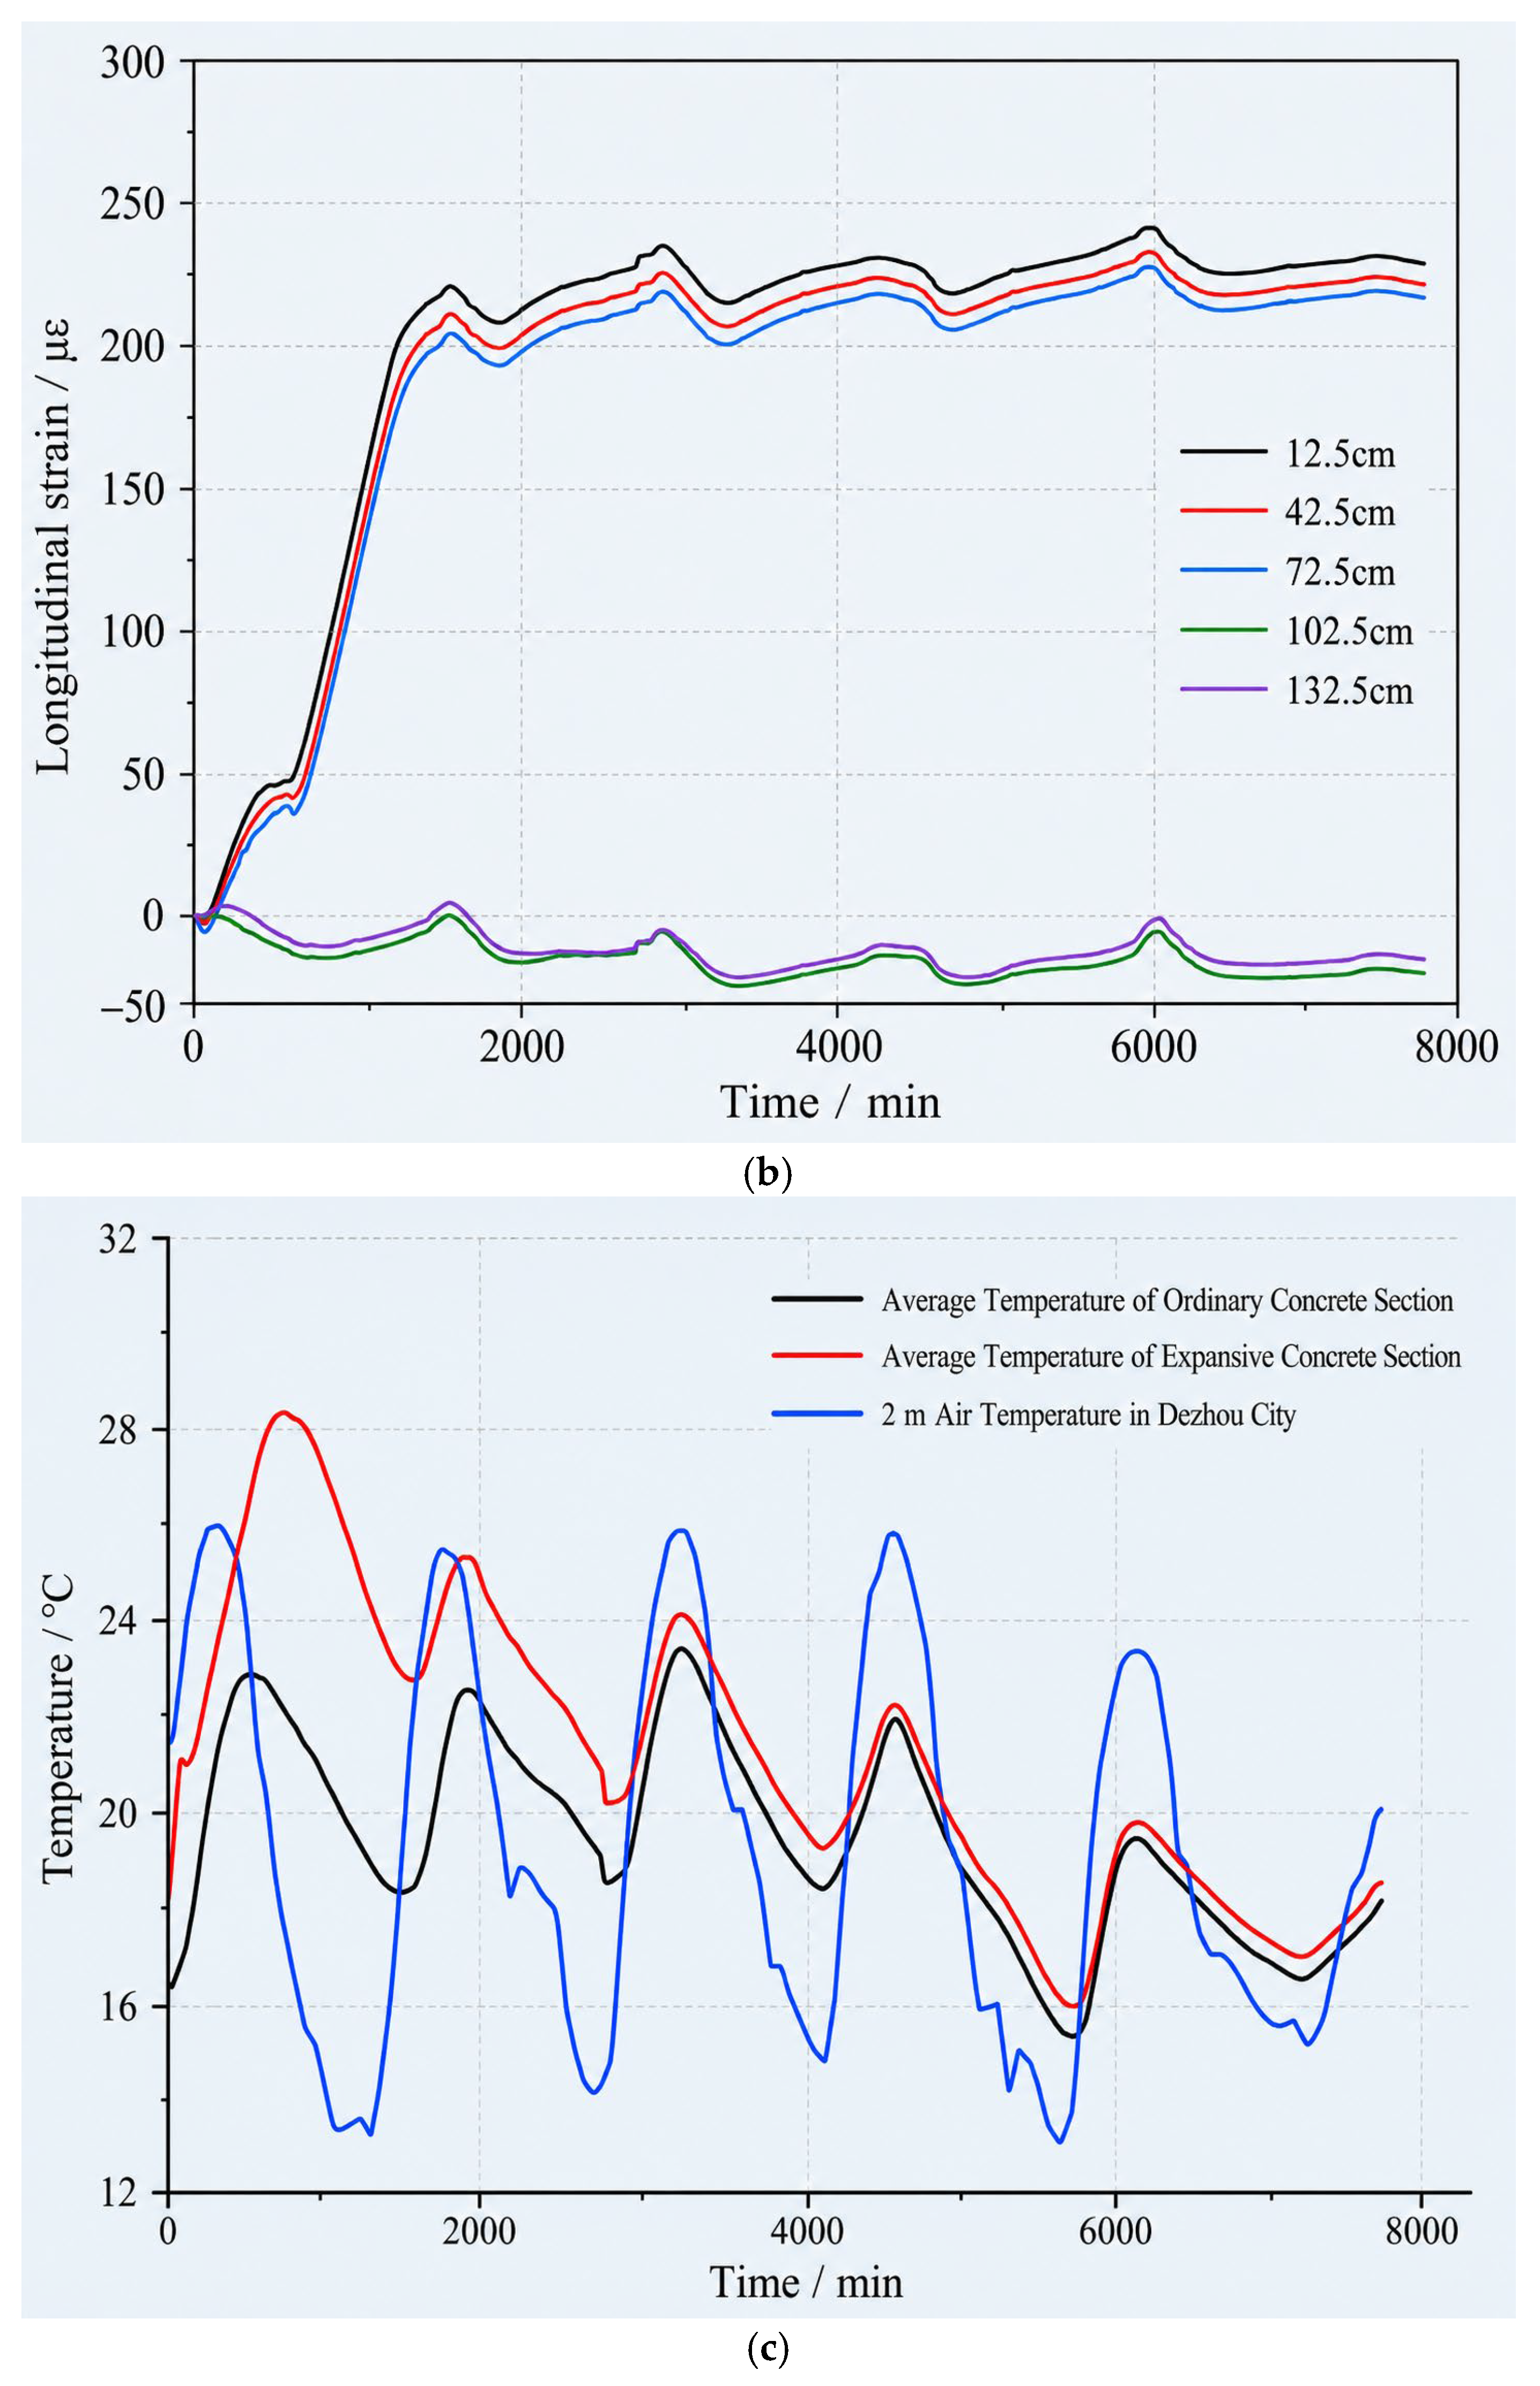
The two concrete-strain profiles and the paired temperature trace in Figure 8 show the casting and curing sequence along both instrumented strands.
Figure 8.
Vibrating-wire concrete strain along two strand lines and paired slab temperatures during casting and curing; positions are distances from the slab end. (a) Concrete strain beside strand line 1; (b) concrete strain beside strand line 2; (c) paired temperatures in the two concrete segments and ambient air.
Strain growth near the slab end slowed during the first 5–8 h after casting, coinciding with surface finishing before water curing. The subsequent increase following water application suggests that early moisture availability influenced expansion. Paired temperature traces and the ordinary-concrete gauges indicate that the response was localized to the end segment.
After the early pause, end-segment strain increased rapidly, with the most pronounced acceleration occurring after water curing began.
At approximately 25 h, the six end-segment gauges recorded a mean strain of 211.3 με. The mean increased to 221.23 με by 24 h before strand release; the latter value was used for the pre-release stress calculation.
The subsequent gradual strain variations coincided with temperature cycles in the precast yard. The paired strain and temperature records in Figure 8 reflect the combined effects of expansion, restraint, temperature, and creep under field-curing conditions.
Before release, the ordinary-concrete gauges at x = 1025 and 1325 mm remained near their initial readings on both strand lines, whereas gauges at x = 125–725 mm showed substantially greater strain growth. This spatial contrast is consistent with expansion concentrated in the self-stressing segment.
Using the pre-release mean strain of 221.23 με, ρ = 0.042, and Es = 2.0 × 10⁵ MPa in Equation (1) gives an estimated end-segment restraint stress of 0.042 × 200,000 × 221.23 × 10−6 = 1.86 MPa. This value includes the restraint of the slab reinforcement and end-plate device; the device sensitivity estimate is given in Section 2.2.2.
3.3.2. Pretensioned-Strand Release and Transfer Length
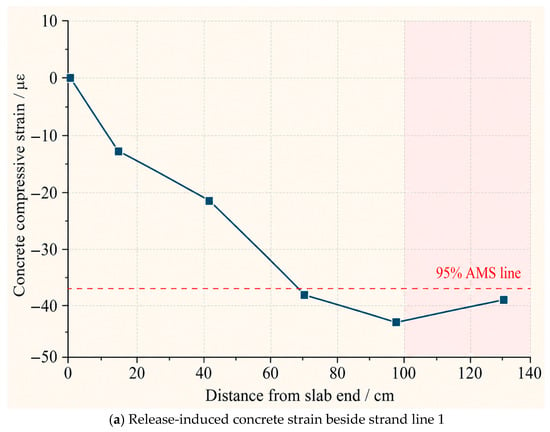
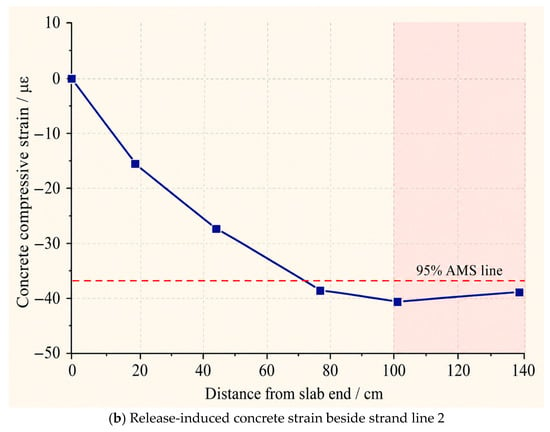
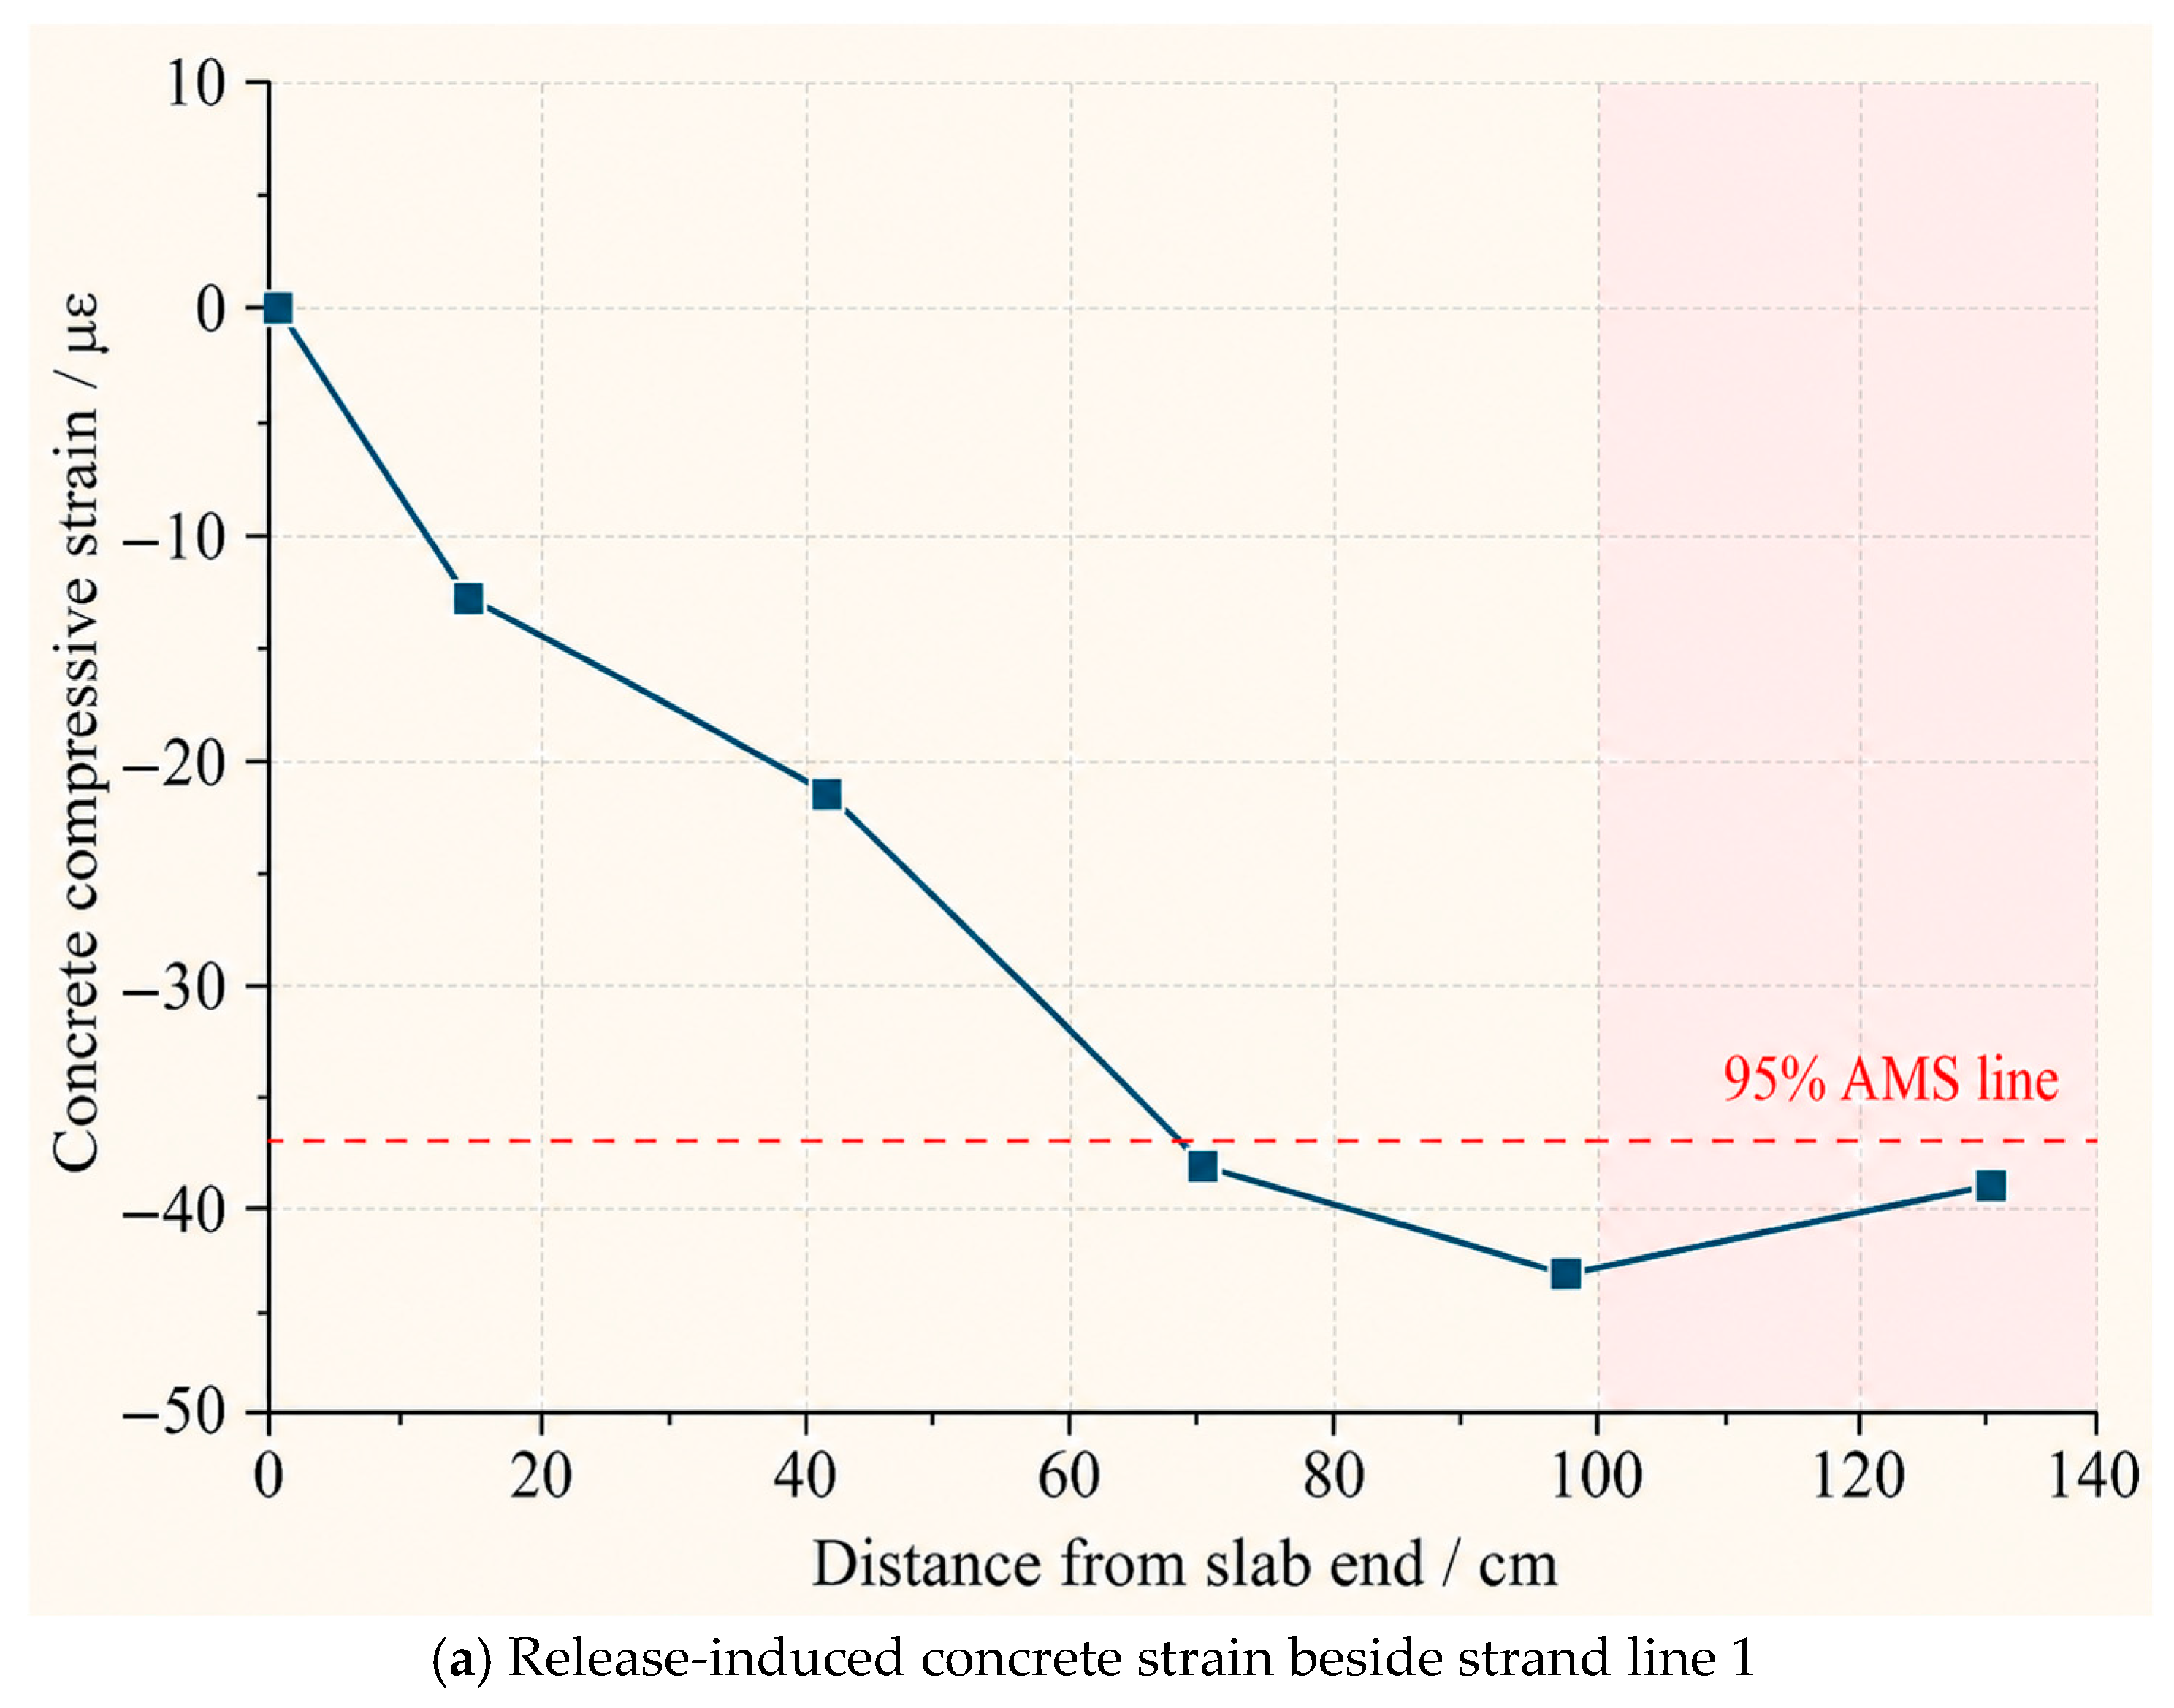
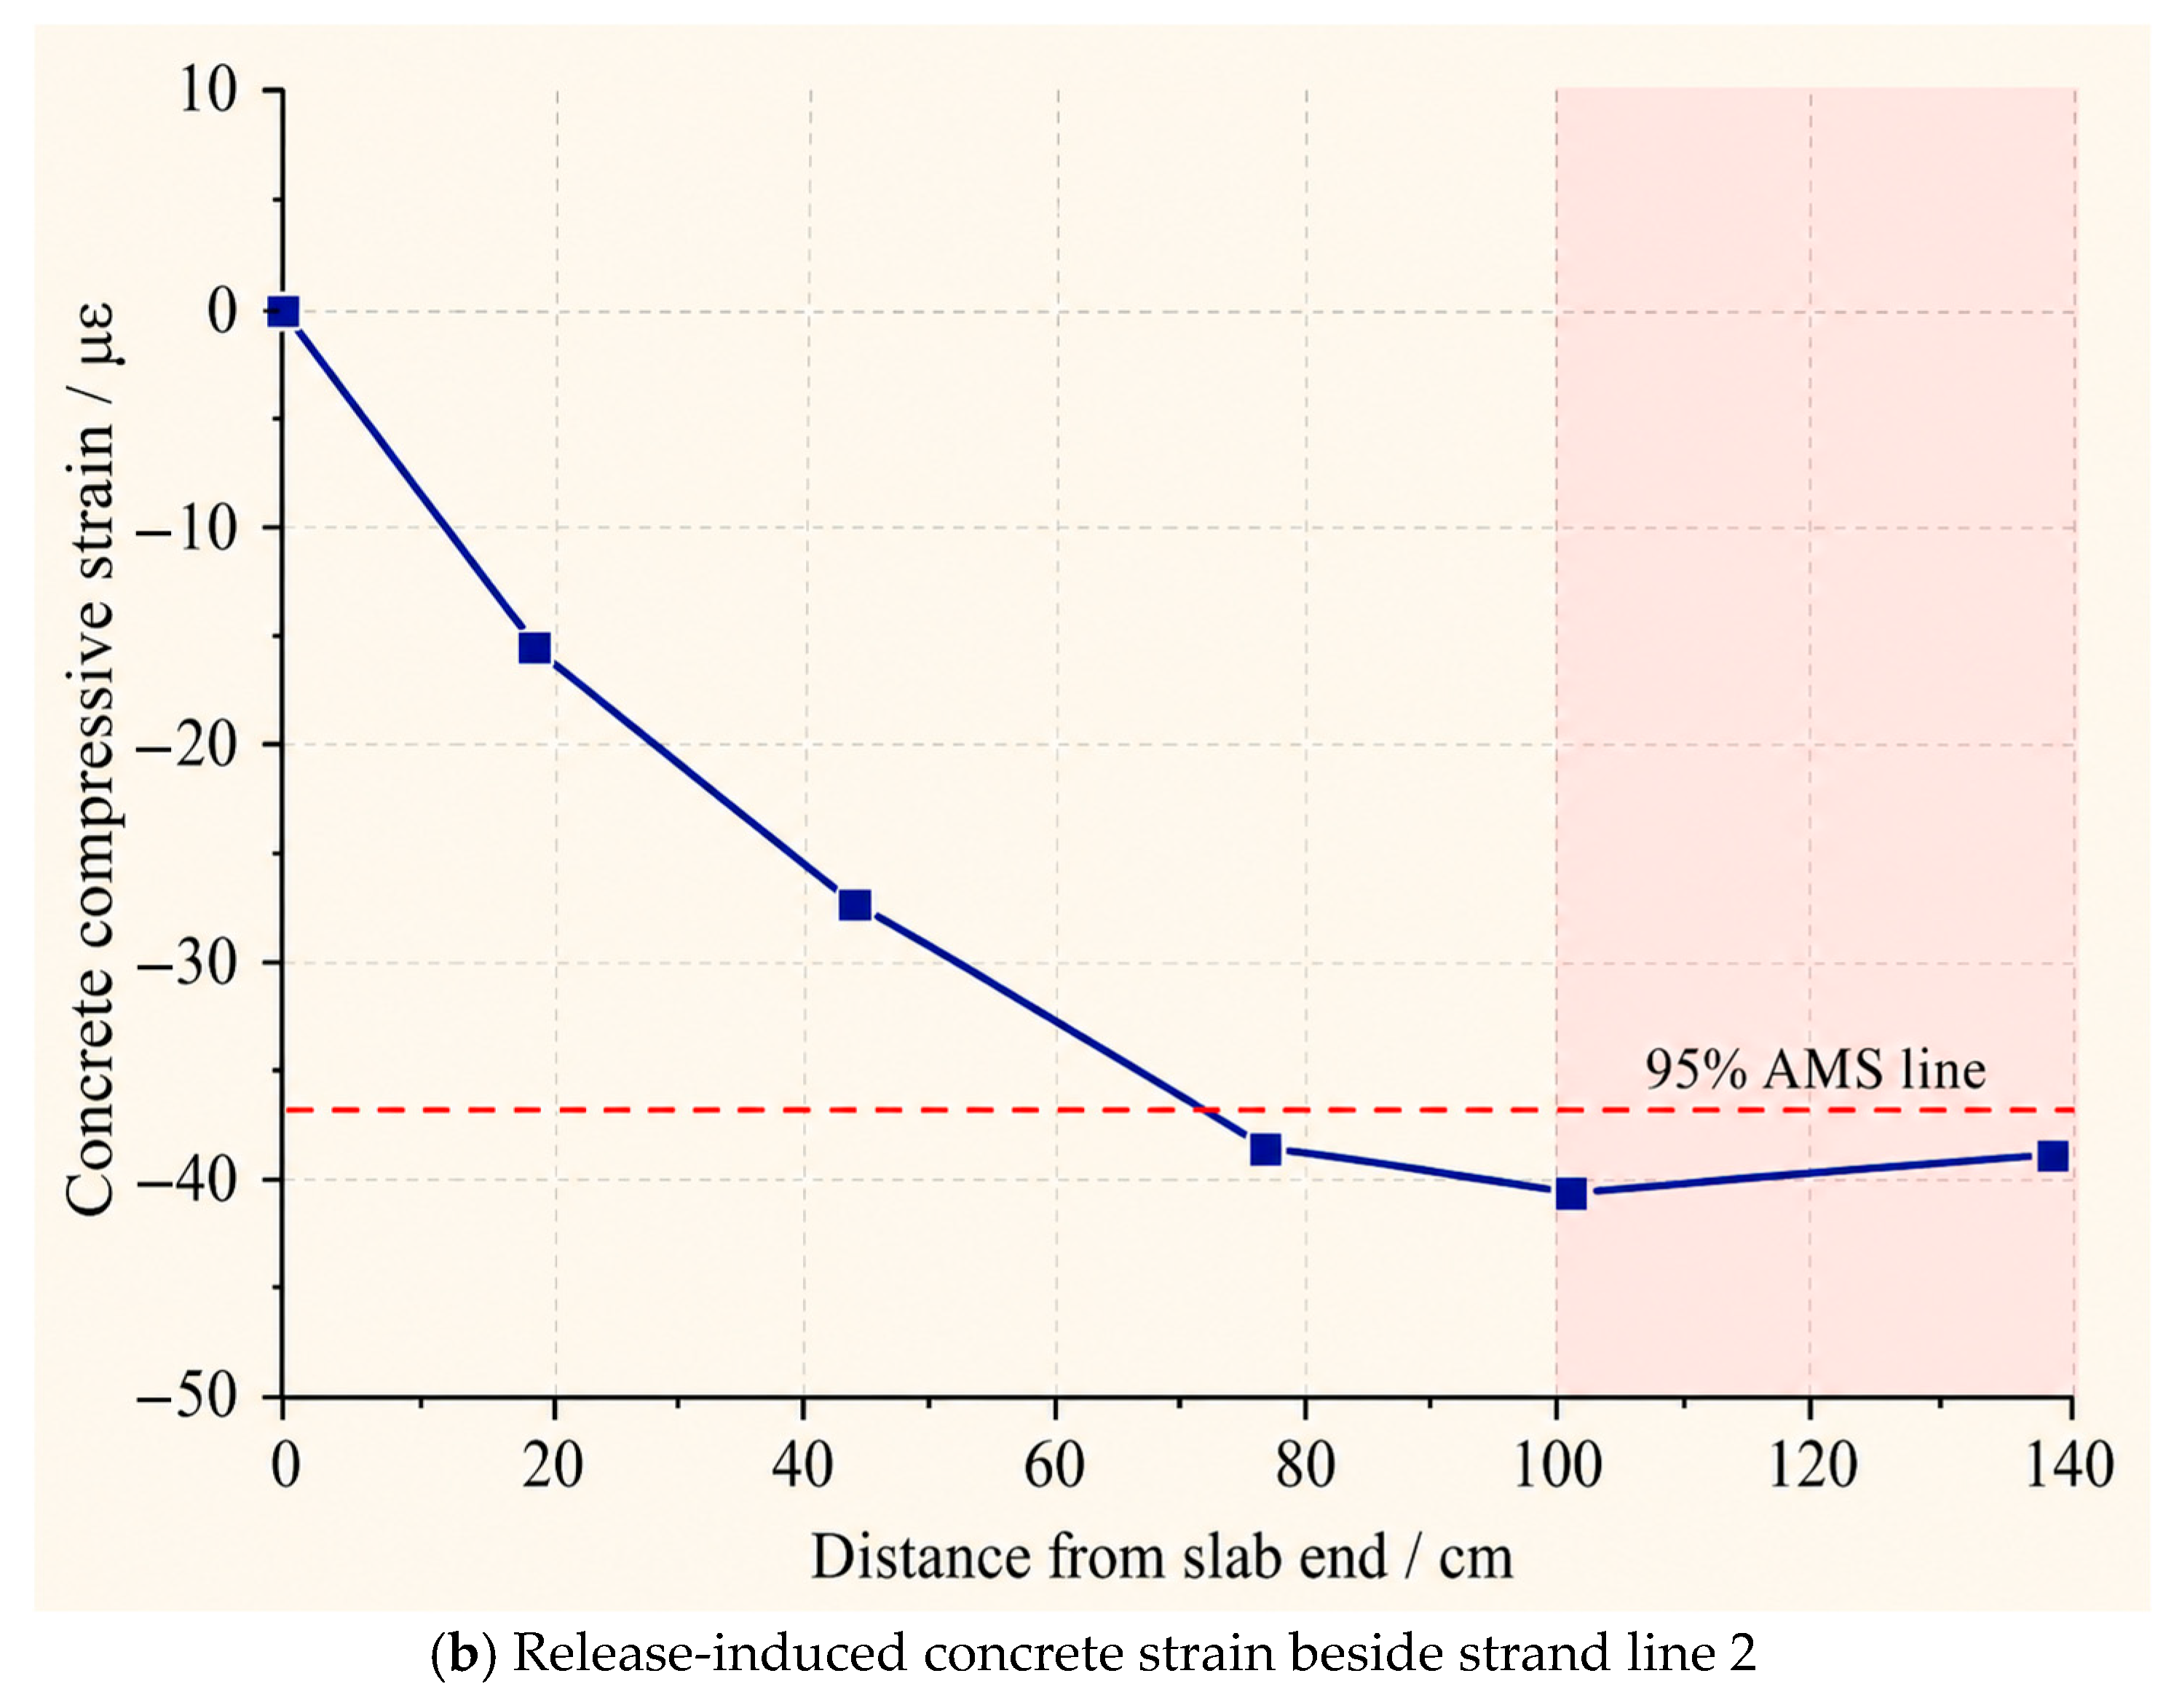
Figure 9 shows the release-induced concrete-strain increments measured beside the two strand lines. These compressive strains were recorded in the surrounding concrete.
Figure 9.
Release-induced concrete compressive strain and 95% average-maximum-strain transfer-length construction for strand lines 1 and 2. (a) Strand line 1; (b) strand line 2.
The 95% average-maximum-strain method gave transfer lengths of 714.4 and 684.8 mm for strand lines 1 and 2, respectively, both within the 800 mm end segment. Their difference of 29.6 mm was small relative to the 300 mm gauge spacing, indicating a characteristic transfer scale of approximately 0.7 m for both lines.
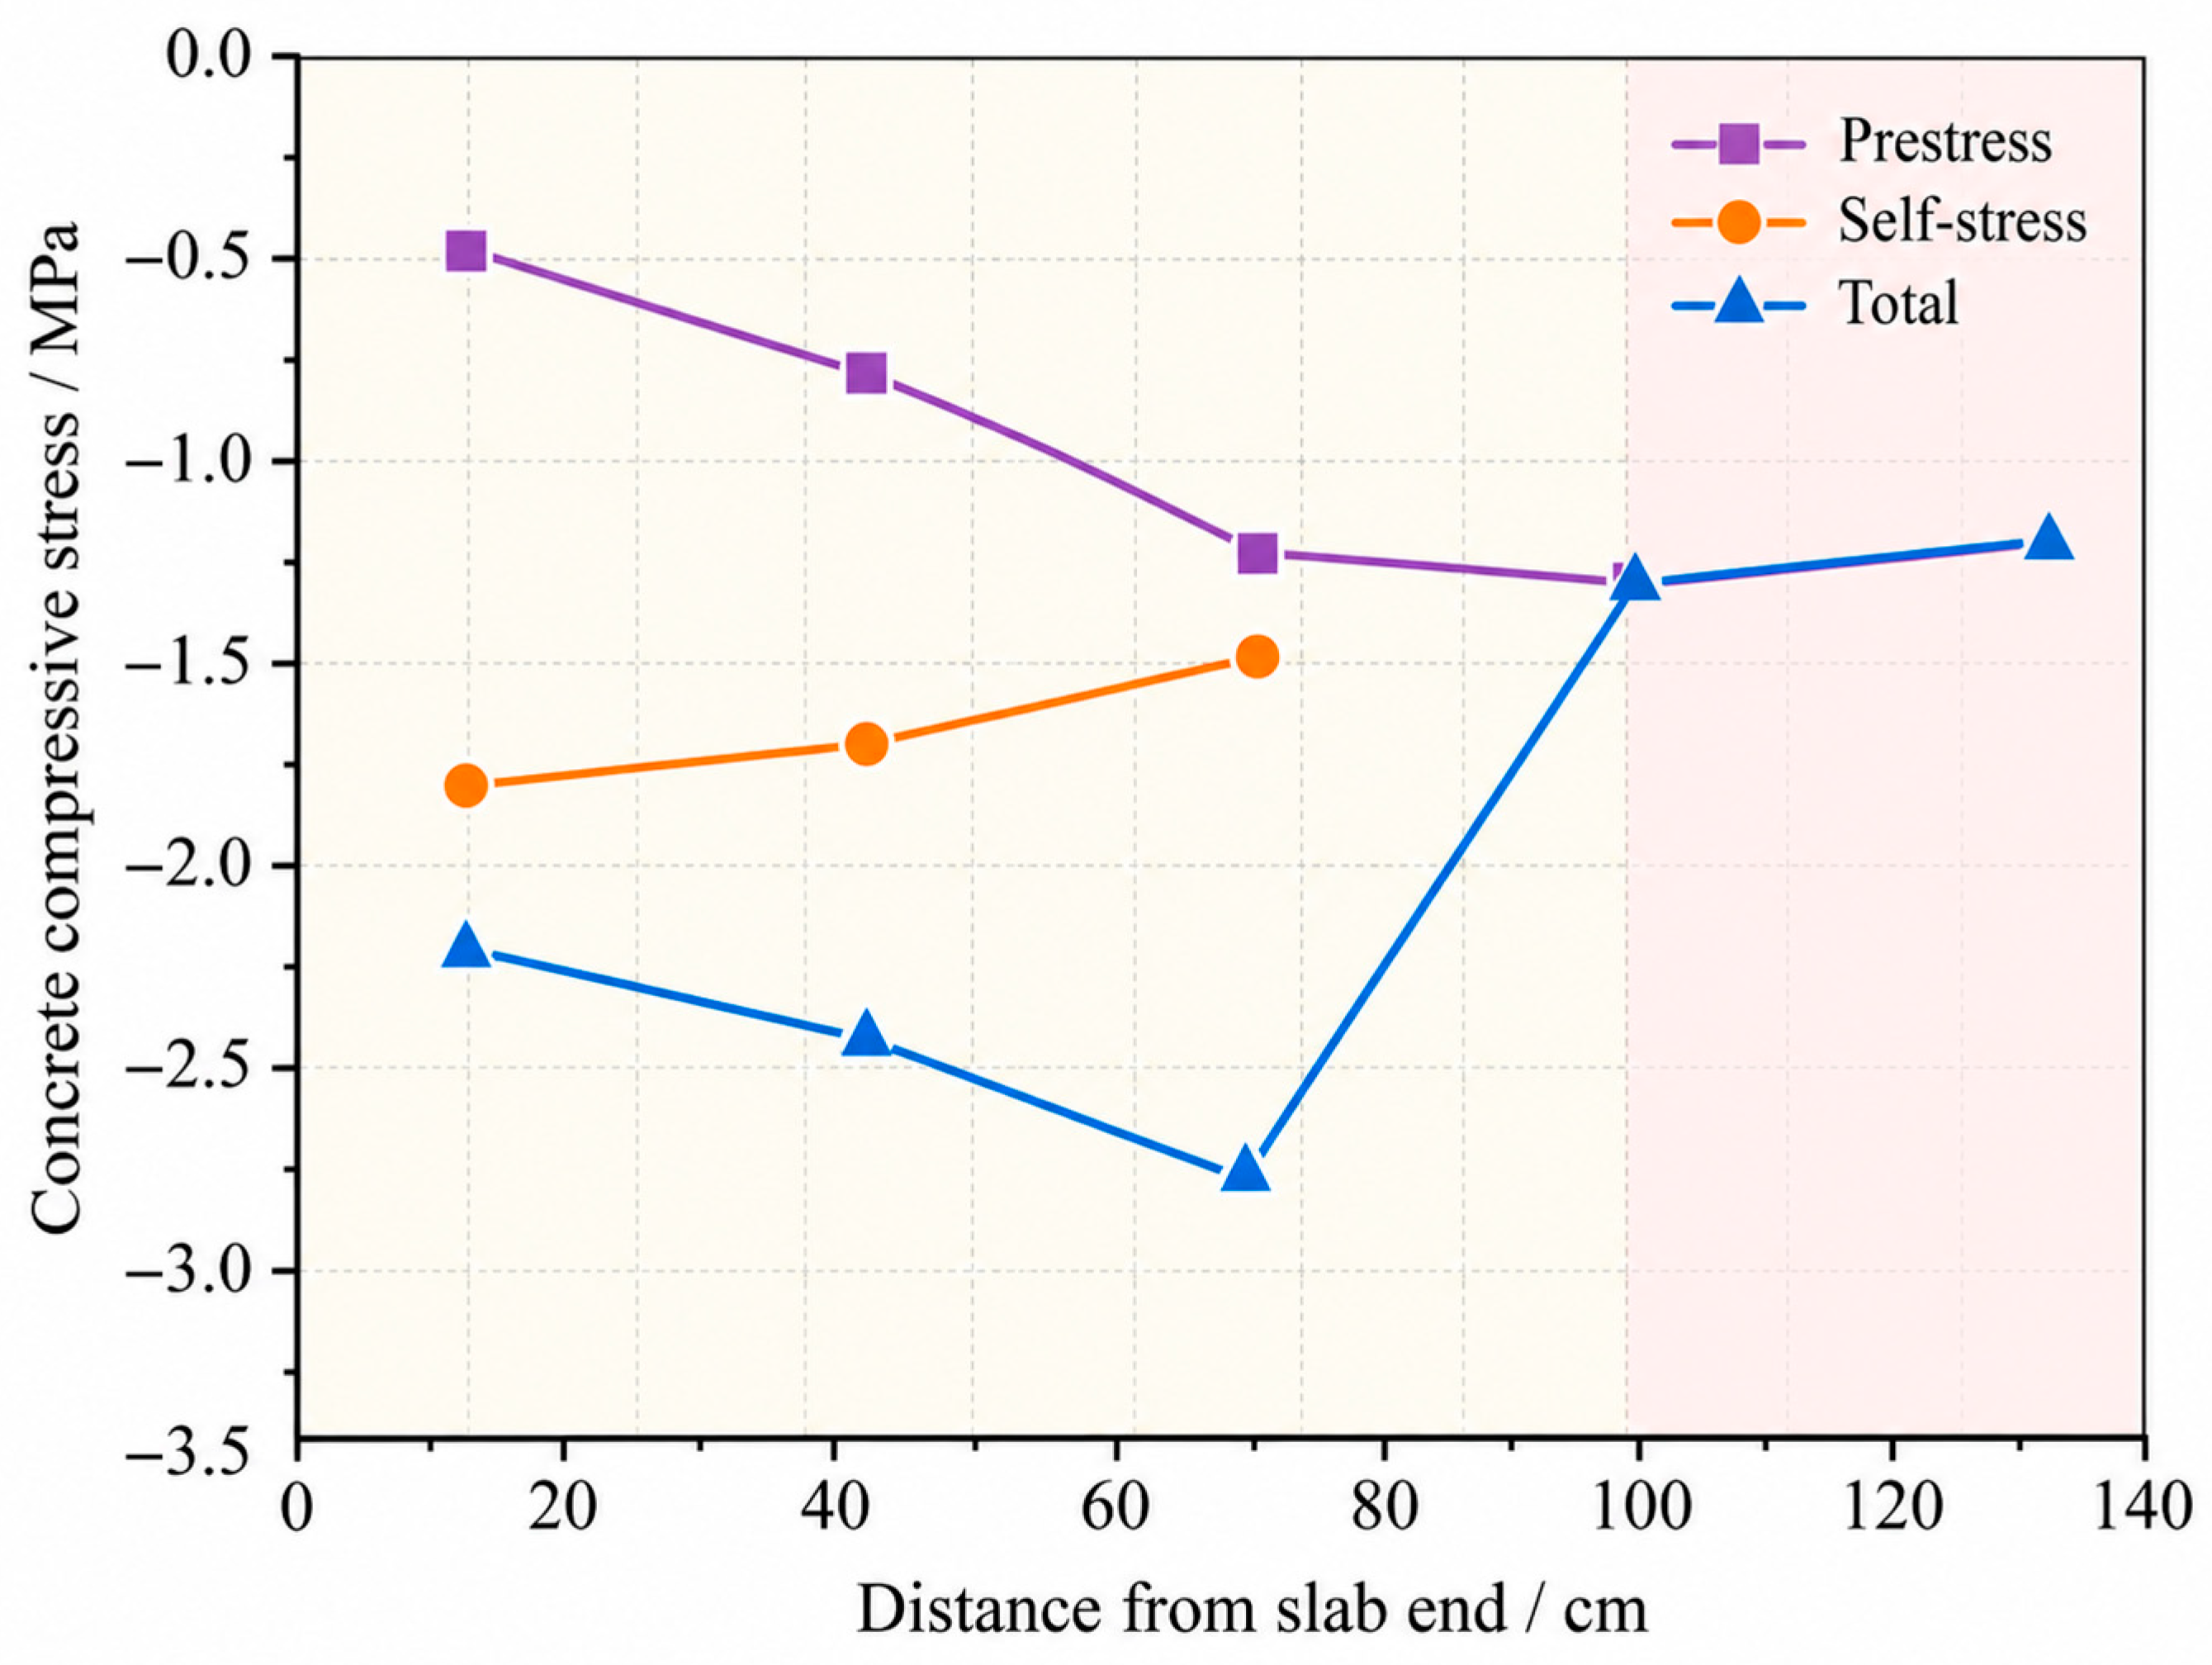
The strand-induced and expansion-induced stress components calculated from the release and expansion measurements are shown in Figure 10 and summarized in Table 5.
Figure 10.
Strand-induced compression, restrained-expansion compression, and their sum along the slab end region; negative plotted values denote compression.
Table 5.
End-zone restoration calculation at 125 mm from the free end (compression magnitudes, MPa).
Immediately after release, the estimated total compression at x = 125 mm was 2.24 MPa. Strand-induced compression was approximately 0.50 MPa at this position and 1.25 MPa in the ordinary-concrete interior, giving a local deficit of 0.75 MPa. The total end-zone compression thus exceeded the interior reference by 0.99 MPa. After subtracting the estimated 0.12 MPa end-plate contribution, the adjusted compression was 2.12 MPa, leaving a positive reserve of 0.87 MPa relative to the 1.25 MPa reference.
3.3.3. Field Response Through Day 180
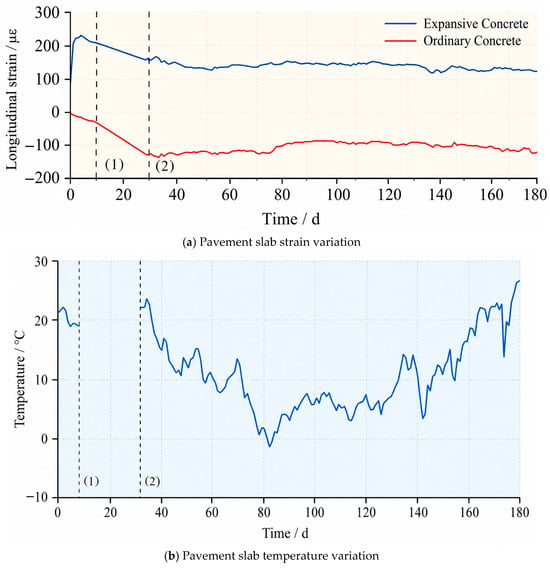
Figure 11 presents the fixed-time daily concrete-strain readings and paired temperatures through day 180.
Figure 11.
Daily 14:00 vibrating-wire concrete strain and paired temperature through day 180: (a) slab strain; (b) slab temperature. Vertical lines indicate (1) the end of plant curing and (2) field installation; the intervening line connects the available endpoints across the acquisition gap.
The field logger recorded data every 30 min, corresponding to 48 nominal readings per full day. Figure 11 displays the 14:00 reading from each available day. No measurements were acquired during the 18-day interval between plant curing and activation of the field system; the strain and temperature traces are paired at each available observation time.
At approximately day 140, the end-segment strain was 128.2 με (Figure 11a), a decrease of 93.03 με from the pre-release value of 221.23 με. Using the same restraint coefficient, the residual expansion-induced component was estimated at 1.08 MPa. Together with approximately 0.50 MPa of local strand-induced compression, this gave 1.58 MPa of total compression before thermal correction. The corresponding reserve above the 1.25 MPa interior reference was 0.33 MPa, or 0.26 MPa after subtracting the estimated 0.07 MPa device contribution.
The paired temperature record showed substantial variation, including a decrease of approximately 14.9 °C near day 145. Temperature-normalized strain can be expressed as εcorr,i(t) = εobs,i(t) − αeff,i[Ti(t) − Ti(t0)], where αeff,i is the effective coefficient for an embedded gauge. For αeff = 10 με/°C, a 10 °C change corresponds to 100 με, or 0.84 MPa when converted using ρ = 0.042 and Es = 200,000 MPa. This sensitivity exceeds the estimated day-140 device-adjusted reserve of 0.26 MPa; so, the long-term absolute stress depends on thermal calibration. The near-synchronous comparison across strand release is less affected by this source of uncertainty.
Figure 11 presents the observed 14:00 strain readings without a fitted thermal correction. The thermal-sensitivity analysis defines the calibration dependence of the day-140 stress estimate and, consequently, the interpretation of the residual compression at that time.
The field measurements characterize axial stress development in the monitored, unloaded slab. Wheel-load response, interface load transfer, and durability under environmental exposure require separate structural and material evaluations before application-specific design.
4. Conclusions
Laboratory mixture tests and full-scale strain measurements were combined to evaluate end-zone stress restoration in a pretensioned pavement slab. The main findings are as follows:
(1) Under 0.79% uniaxial steel restraint, E10 and E12 developed calculated 14-day self-stresses of 1.36 and 1.53 MPa, respectively. The E18 specimen exhibited a longitudinal crack. Among the tested mixtures, E10 and E12 provided a favorable combination of restrained expansion, strength, and surface condition.
(2) The expansive mixtures achieved 28-day compressive strengths of 59.2–63.4 MPa and flexural strengths of 7.7–8.1 MPa. E12 produced the highest values in both tests, at 63.4 and 8.1 MPa, respectively.
(3) The 3700 mm × 975 mm × 240 mm slab incorporated an 800 mm self-stressing end segment. Transfer lengths estimated from the two strand-line concrete-strain profiles were approximately 0.7 m. The mean pre-release segment strain of 221.23 με corresponded to 1.86 MPa of calculated restraint stress, and total compression at 125 mm reached 2.24 MPa after release.
(4) The strand-induced compression deficit at 125 mm relative to the interior reference was approximately 0.75 MPa. Immediately after release, the total end-zone compression exceeded the 1.25 MPa interior reference by 0.99 MPa, or 0.87 MPa after the estimated device adjustment. The day-140 strain corresponded to 1.58 MPa of total compression before thermal correction. The 180-day record further describes the evolution of end-segment strain and temperature following installation.
Author Contributions
L.J.: Investigation, Methodology, Formal analysis, Writing—original draft; S.T.: Investigation, Software, Formal analysis, Visualization, Writing—review and editing; X.S.: Conceptualization, Project administration, Supervision, Validation, Writing—review and editing; J.L.: Software, Formal analysis, Visualization, Validation; H.Z.: Software, Formal analysis, Visualization, Validation; J.B.: Conceptualization, Supervision, Writing—review and editing. All authors have read and agreed to the published version of the manuscript.
Funding
This research was funded by the Key R&D Program of Shandong Province (2026CXPT181); National Natural Science Foundation of China (52608754 and 52478460); the Shandong Natural Science Foundation of China (ZR2024ME054); the Joint Fund of Shandong Natural Science Foundation of China (ZR2025LH142); and the Youth Foundation of Shandong Natural Science Foundation of China (ZR2026QC0469 and ZR2024QE495).
Data Availability Statement
Mixture proportions, oxide compositions, restrained-expansion and strength results, and the inputs to the stress calculations are provided in the article. The time-series gauge data, calibration records, and strand-release log are available from the corresponding author upon reasonable request.
Conflicts of Interest
Author Longfei Jin was employed by Shandong Expressway Construction Management Group Co., Ltd., Author Xiaopeng Shi was employed by Shandong Qilin Highway Co., Ltd. The remaining authors declare that the research was conducted in the absence of any commercial or financial relationships that could be construed as a potential conflict of interest.
References
- Vázquez-Herrero, C.; Martínez-Lage, I.; Martínez-Abella, F. Transfer length in pretensioned prestressed concrete structures composed of high-performance lightweight and normal-weight concrete. Eng. Struct. 2013, 56, 983–992. [Google Scholar] [CrossRef] [Scilit]
- Yang, J.M.; Kim, J.K.; Yoo, D.Y. Transfer length in full-scale pretensioned concrete beams with 1.4 m and 2.4 m section depths. Eng. Struct. 2018, 171, 433–444. [Google Scholar] [CrossRef] [Scilit]
- Nagataki, S.; Gomi, H. Expansive admixtures (mainly ettringite). Cem. Concr. Compos. 1998, 20, 163–170. [Google Scholar] [CrossRef] [Scilit]
- Cohen, M.D. Theories of expansion in sulfoaluminate-type expansive cements: Schools of thought. Cem. Concr. Res. 1983, 13, 809–818. [Google Scholar] [CrossRef] [Scilit]
- Richardson, D.; Tung, Y.; Tobias, D.; Hindi, R. An experimental study of bridge deck cracking using Type K cement. Constr. Build. Mater. 2014, 52, 366–374. [Google Scholar] [CrossRef] [Scilit]
- Chen, W.; Brouwers, H.J.H. Hydration of mineral shrinkage-compensating admixture for concrete: An experimental and numerical study. Constr. Build. Mater. 2012, 26, 670–676. [Google Scholar] [CrossRef] [Scilit]
- Wyrzykowski, M.; Terrasi, G.; Lura, P. Expansive high-performance concrete for chemical-prestress applications. Cem. Concr. Res. 2018, 107, 275–283. [Google Scholar] [CrossRef] [Scilit]
- Zhang, Y.; Pan, Y.; Ren, T.; Liang, H.; Zhang, J.; Zhang, D. The Application of Calcium-Based Expansive Agents in High-Strength Concrete: A Review. Buildings 2024, 14, 2369. [Google Scholar] [CrossRef] [Scilit]
- Meddah, M.S.; Suzuki, M.; Sato, R. Influence of a combination of expansive and shrinkage-reducing admixture on autogenous deformation and self-stress of silica fume high-performance concrete. Constr. Build. Mater. 2011, 25, 239–250. [Google Scholar] [CrossRef] [Scilit]
- Carballosa, P.; García Calvo, J.L.; Revuelta, D. Influence of expansive calcium sulfoaluminate agent dosage on properties and microstructure of expansive self-compacting concretes. Cem. Concr. Compos. 2020, 107, 103464. [Google Scholar] [CrossRef] [Scilit]
- Guo, J.; Zhang, S.; Guo, T.; Zhang, P. Effects of UEA and MgO expansive agents on fracture properties of concrete. Constr. Build. Mater. 2020, 263, 120245. [Google Scholar] [CrossRef] [Scilit]
- Dhahir, M.K.; Marx, S. Development of expansive concrete for chemical prestressing applications. Case Stud. Constr. Mater. 2023, 19, e02611. [Google Scholar] [CrossRef] [Scilit]
- Dhahir, M.K.; Marx, S.; Zdanowicz, K. Chemical prestressing of concrete structures: State-of-the-art review. Struct. Concr. 2024, 25, 1450–1464. [Google Scholar] [CrossRef] [Scilit]
- García Calvo, J.L.; Revuelta, D.; Carballosa, P.; Gutiérrez, J.P. Comparison between the performance of expansive SCC and expansive conventional concretes in different expansion and curing conditions. Constr. Build. Mater. 2017, 136, 277–285. [Google Scholar] [CrossRef] [Scilit]
- Semianiuk, V.; Tur, V.V.; Herrador, M.F.; Paredes-González, M. Early-age strains and self-stresses of expansive concrete members under uniaxial restraint conditions. Constr. Build. Mater. 2017, 131, 39–49. [Google Scholar] [CrossRef] [Scilit]
- Chang, X.; Huang, C.K.; Zhang, P. Expansive behaviors of self-stressing concrete under different restraining conditions. J. Wuhan Univ. Technol.-Mater. Sci. Ed. 2011, 26, 780–785. [Google Scholar] [CrossRef] [Scilit]
- Jeon, S.-J.; Shin, H.; Kim, S.-H.; Park, S.Y.; Yang, J.-M. Transfer Lengths in Pretensioned Concrete Measured Using Various Sensing Technologies. Int. J. Concr. Struct. Mater. 2019, 13, 43. [Google Scholar] [CrossRef] [Scilit]
- Burgueño, R.; Sun, Y.; Donoso, M. Stress Transfer Characteristics of Sheathed Strand in Prestressed Concrete Beams: Experimental Study. PCI J. 2015, 60, 104–120. [Google Scholar] [CrossRef] [Scilit]
- Kim, J.K.; Yang, J.M.; Yim, H.J. Experimental Evaluation of Transfer Length in Pretensioned Concrete Beams Using 2,400-MPa Prestressed Strands. J. Struct. Eng. 2016, 142, 04016088. [Google Scholar] [CrossRef] [Scilit]
- GB/T 23439-2017; Expansive Agents for Concrete. Standards Press of China: Beijing, China, 2017. (In Chinese)
- JTG 3420-2020; Test Methods of Cement and Cement Concrete for Highway Engineering. China Communications Press: Beijing, China, 2020. (In Chinese)
- JTG D40-2011; Specifications for Design of Highway Cement Concrete Pavement. China Communications Press: Beijing, China, 2011. (In Chinese)

Disclaimer/Publisher’s Note: The statements, opinions and data contained in all publications are solely those of the individual author(s) and contributor(s) and not of MDPI and/or the editor(s). MDPI and/or the editor(s) disclaim responsibility for any injury to people or property resulting from any ideas, methods, instructions or products referred to in the content. |
© 2026 by the authors. Licensee MDPI, Basel, Switzerland. This article is an open access article distributed under the terms and conditions of the Creative Commons Attribution (CC BY) license.