


Abstract
Reliable estimation of the in situ compressive strength of concrete is an essential component of the assessment of existing reinforced concrete structures, particularly in earthquake-prone regions. This study investigates the regional calibration and applicability of relationships based on the Schmidt rebound hammer, ultrasonic pulse velocity, and core tests for concrete used in the Erzincan region of Türkiye. Field investigations were carried out in reinforced concrete buildings constructed before and after the regulatory requirement to use ready-mixed concrete; the former were generally built with traditionally produced site-mixed concrete and the latter with ready-mixed concrete. Laboratory specimens produced from locally used ready-mixed concrete and core samples obtained from existing buildings were investigated. Linear regression models relating the rebound number and the ultrasonic pulse velocity to compressive strength were developed, and a combined rebound–ultrasonic (SonReb) model was also established. Model performance was evaluated using goodness-of-fit and error metrics, predictive performance was assessed by repeated k-fold cross-validation, and the relationships were independently validated against core samples from additional buildings. The rebound-based models showed strong relationships with compressive strength for laboratory specimens and for cores from both ready-mixed and traditionally produced concrete, and the combined SonReb model predicted strength more accurately than either single-parameter model. In the independent validation, the rebound-based relationships produced deviations from core strength that are acceptable in view of the material safety factor for ready-mixed concrete, but considerably larger deviations for traditionally produced concrete, while the ultrasonic-only relationship was too imprecise to be used on its own. These results indicate that locally calibrated non-destructive relationships can provide useful estimates of in situ concrete strength when applied to concrete with characteristics comparable to those represented in the calibration dataset. However, the proposed relationships should not be transferred directly to other regions or to substantially different materials and construction practices without additional calibration and validation. The principal contribution of this study is the regional calibration and validation of non-destructive concrete strength relationships and the quantitative evaluation of the combined rebound–ultrasonic approach for ready-mixed concrete in the Erzincan region.
1. Introduction
Compressive strength of concrete is a fundamental property that plays an important role in the structural performance and durability of reinforced concrete structures [1,2]. The compressive strength of concrete is one of the main factors considered in the design and evaluation of reinforced concrete structures and the concrete must be able to carry the applied loads without failure [3,4,5,6,7,8,9]. In the conventional method, specimens are cast from fresh concrete during placement, kept under the same conditions for one day, demolded without damage and cured in lime-saturated water at 23 ± 2 °C. At 28 days, the specimens are removed from the curing tank and tested in compression in accordance with the relevant standards [4,5,6,10,11]. This result reflects only the potential strength of the concrete as produced; it may differ considerably from the in situ strength, which is affected by many factors such as placement, compaction and curing [6,12,13,14].
Since the first step in assessing the safety of an existing reinforced concrete structure is to collect data on its current condition and evaluate them analytically, field tests are essential for this evaluation. A major problem in the seismic assessment of existing reinforced concrete buildings is the reliable determination of in situ concrete strength. The compressive strength of concrete in existing structures is determined by either DT or NDT methods [6,13,15]. In the DT method, cores are drilled from different structural members and tested in the laboratory in accordance with the relevant standards [16]. Although this method provides reliable results, it is often avoided because it is expensive and time-consuming and reduces the cross-section of the members [8,15]. The in situ compressive strength is therefore generally estimated using indirect methods [8,9,15], the most widely used of which are the Schmidt hammer and ultrasonic pulse velocity tests. The rebound hammer was developed by Ernst Schmidt in the late 1940s and has been manufactured by Proceq since the 1950s. It has since become the most widely used method for estimating the compressive strength of concrete worldwide and is covered by national and international standards [15,16,17,18]. Another commonly used NDT method is ultrasonic testing. The ultrasonic technique is widely used in the mechanical characterization of materials, technological control and identification of non-homogeneity in building components. Owing to its advantages over conventional testing methods, many studies have investigated the correlations between the compressive strength of concrete and ultrasonic pulse velocity [17,19,20]. The main drawback of NDT methods is that their results are affected by numerous parameters; because they provide only approximate estimates, they are of limited use on their own. Their error can reach 60%, depending on factors such as equipment calibration, the operator’s knowledge and experience, concrete production methods, and the materials used in the concrete [6,15]. Sefrin & Glock [21] state that it is difficult to establish a theoretical relationship between the measurement values obtained using any of these methods and the strength of the concrete. Whereas the Schmidt hammer reflects mainly the hardness and quality of the surface layer, UT reflects the elastic properties and homogeneity of the concrete through its thickness; both therefore rely on empirical correlations with strength. These tests are also subject to specific limitations related to the concrete and member details, equipment reliability and operator technique [15], and it is difficult to determine whether the value obtained is truly representative of the material in situ and whether there are changes over time [16]. The buildings included in the study range in age from 10 to 50 years. No visible subsequent deterioration was observed in the concrete during the study. The most reliable approach is to combine the information obtained from DT and NDT appropriately. Kog [18] states that more accurate results can be obtained by correlating core, UT and RH test results. Obtaining reliable information about in situ compressive strength is necessary as part of a reliable structural analysis and reinforcement intervention, especially when it comes to the structural seismic capacity of existing buildings that in most cases have been designed only for gravity loads or according to old seismic codes with low seismic safety factors [20,21]. Approximately 75–80% of the settled area of Türkiye lies in regions containing active faults capable of generating destructive earthquakes [22]. The damage and structural failures caused by recent devastating earthquakes in Türkiye were far greater than expected owing to deficiencies in design, workmanship and materials, among which low concrete strength played a major role. Settlements must therefore be made safe against strong earthquakes, which may occur at any time, by rapidly assessing the existing building stock. The main reason for the excessive damage and loss of life in the previous earthquakes in Erzincan in 1992, Dinar in 1995, Adana-Ceyhan in 1998, Marmara in 1999 and Kahramanmaraş in 2023 was the low concrete strength of existing reinforced concrete structures, as indicated by investigations conducted on the rubble. If the buildings had been inspected before these earthquakes, many lives could have been saved. To determine the approximate seismic resistance of structures in the Erzincan region, it is necessary to accurately and quickly determine the concrete strength of these structures. This can be achieved using correlations between NDT and DT results. Preservation of these structures is not only decisive in terms of economics, sustainability and resource conservation, but also creates added value from a cultural and social perspective [21].
The aim of this study is to quickly and accurately determine concrete strength, one of the necessary parameters for evaluating the seismic behavior of existing reinforced concrete structures within the scope of urban transformation. As noted above, although the DT method yields accurate results, it is impractical for the large number of buildings involved because it is time-consuming and expensive and reduces the load-bearing capacity of the tested members. Unlike most previous studies, DT and NDT were performed on a large number of structures and specimens, both in the field and in the laboratory. The relationships between the RH test, UT and core strength were then established [22]. To represent the concrete used in local construction, specimens were sampled during the placement of concrete produced at ready-mix plants in Erzincan. The sampling procedure was carried out according to [23]. After 28 days of curing, the specimens were subjected to ultrasonic testing and then tested in compression in accordance with the standards; the rebound number R was measured with the Schmidt hammer during loading, and fc was recorded at failure. Core samples were taken from the elements in the buildings that had the lowest average rebound value R and were tested in compression to determine fc. Since the results depend strongly on the concrete production method and the aggregate used, such calibrations should be carried out separately for each region.
2. Materials and Methods
2.1. Materials
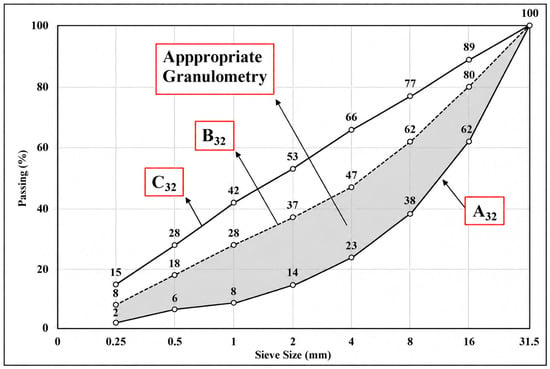
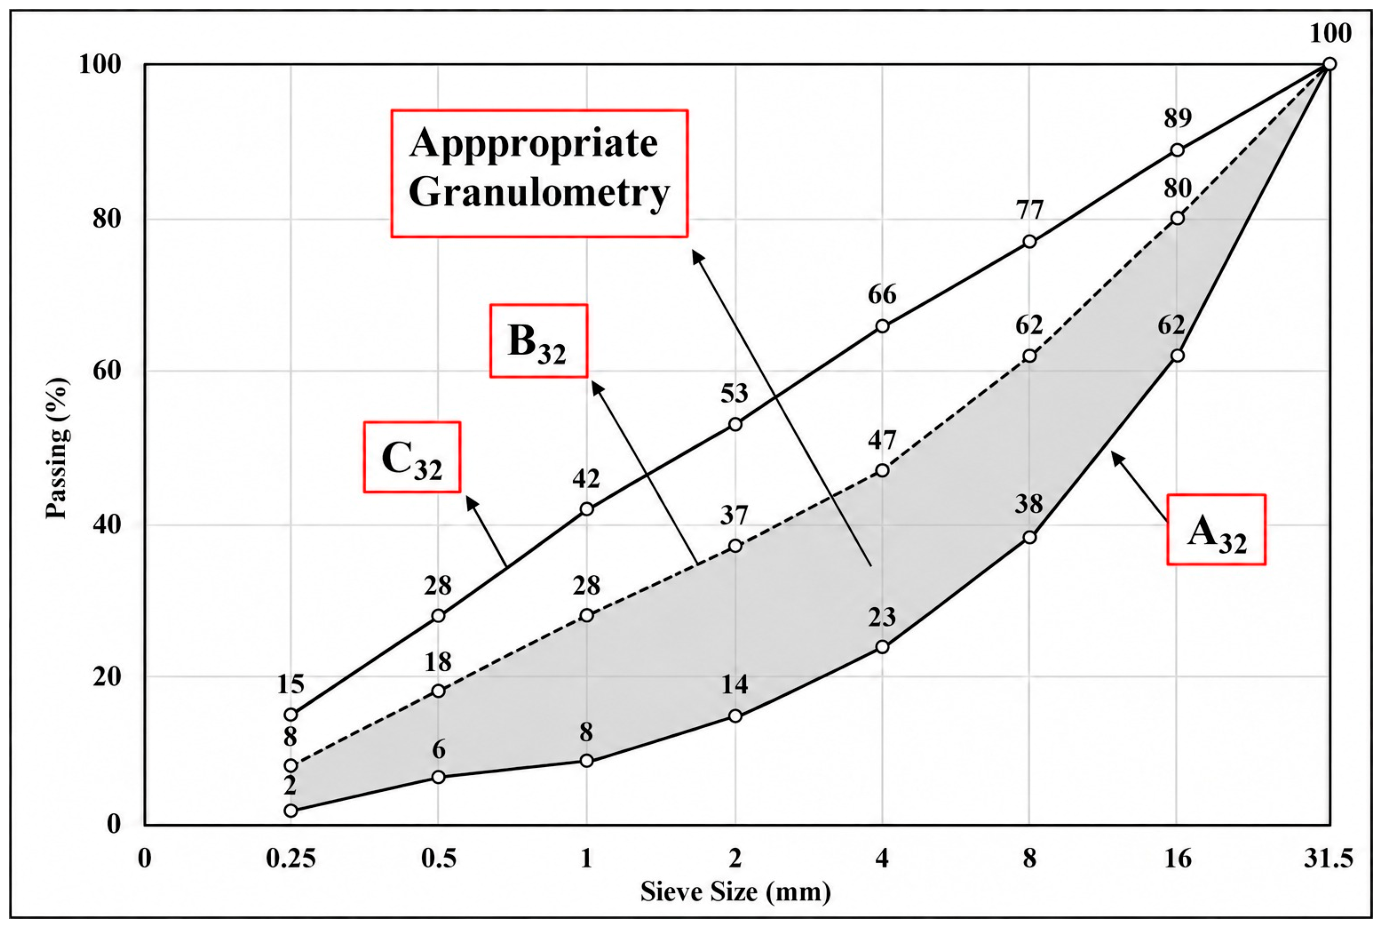
The specimens were sampled during the placement of concrete produced by ready-mix plants in Erzincan to represent the concrete used in reinforced concrete buildings. All aggregates used in concrete production in the Erzincan region are sourced from the Euphrates River. These are natural stream aggregates (sand and gravel) extracted from the bed of the Euphrates River (Karasu branch) and consist of geological rocks from the region’s ophiolite-serpentinite group. A water-to-cement ratio of about 0.5 is generally used, with aggregate conforming to the grading curve shown in Figure 1. The plants use Euphrates (Fırat) River aggregate with the same physical and mechanical properties; all concrete plants use the shaded area between the A32-B32 curves as the aggregate granulometry. Curve C32 in Figure 1 is shown only as the upper reference limit of the standard grading envelope and is not used in production; all plants therefore follow the same granulometric distribution. CEM I 42.5 N cement from the same factory and mixing water from the Erzincan municipal network.
Figure 1.
Grading curve of the aggregate used in ready-mix concrete production. A32, B32, and C32 are the reference grading curves for a maximum aggregate size of 32 mm. The shaded zone between A32 and B32 is the grading envelope adopted in production; curve C32 is shown for reference only.
A melamine sulfonate-based water-reducing admixture is used as the plasticizer. Since these concrete plants use the same materials and similar mix ratios, the concrete they produce has largely similar properties. Differences in strength among the specimens arise from differences in mix proportions between batches; such differences are necessary because a calibration relationship must cover the range of strengths encountered in practice. The specimens were not selected according to a particular specified strength class; the resulting relationships are therefore valid for concrete made with constituent materials and production practice similar to those described above and within the strength range investigated. Cores (Core1) were drilled from reinforced concrete buildings constructed with ready-mix concrete, and cores (Core2) from buildings constructed with concrete produced by traditional (site-mixed) methods. The RH test is one of the oldest, simplest and best-known NDT methods. It is generally used to compare the concrete in different parts of a structure and to assess its strength indirectly. The hammer weighs approximately 1.8 kg and is suitable for use both in the laboratory and in the field. The rebound of the spring-driven mass depends on the hardness and stiffness of the surface it strikes. A type N rebound hammer was used in this study. The other NDT method used was ultrasonic testing (UT), in which the transit time of an ultrasonic pulse through the concrete is measured and the pulse velocity V is calculated from the path length [15]. Since the pulse velocity depends on the dynamic modulus of elasticity, density and Poisson’s ratio of the material, it is used to characterize concrete, assess its homogeneity and detect internal defects. Because concrete strongly attenuates high frequencies, transducers of 20–150 kHz (typically 54 kHz) are used for concrete, unlike the MHz-range frequencies used for metals. UT is increasingly used to estimate the in situ strength of reinforced concrete structures and to measure the depth of cracks. The source of this data is samples taken by technicians and me within the scope of urban transformation. Samples were taken between 1992 and 2025 and tested within one week of collection. All measurements were made using the same instruments/machines. Although the same instruments were used throughout, minor variations in mix proportions or equipment condition over the long data-collection period (1992–2025) cannot be completely excluded, which is another reason why the relationships should be applied only to concrete comparable to that represented in the calibration dataset.
2.2. Method
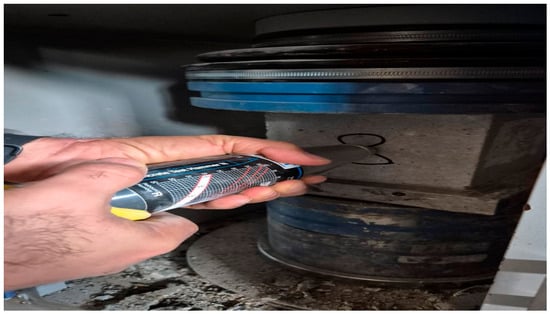
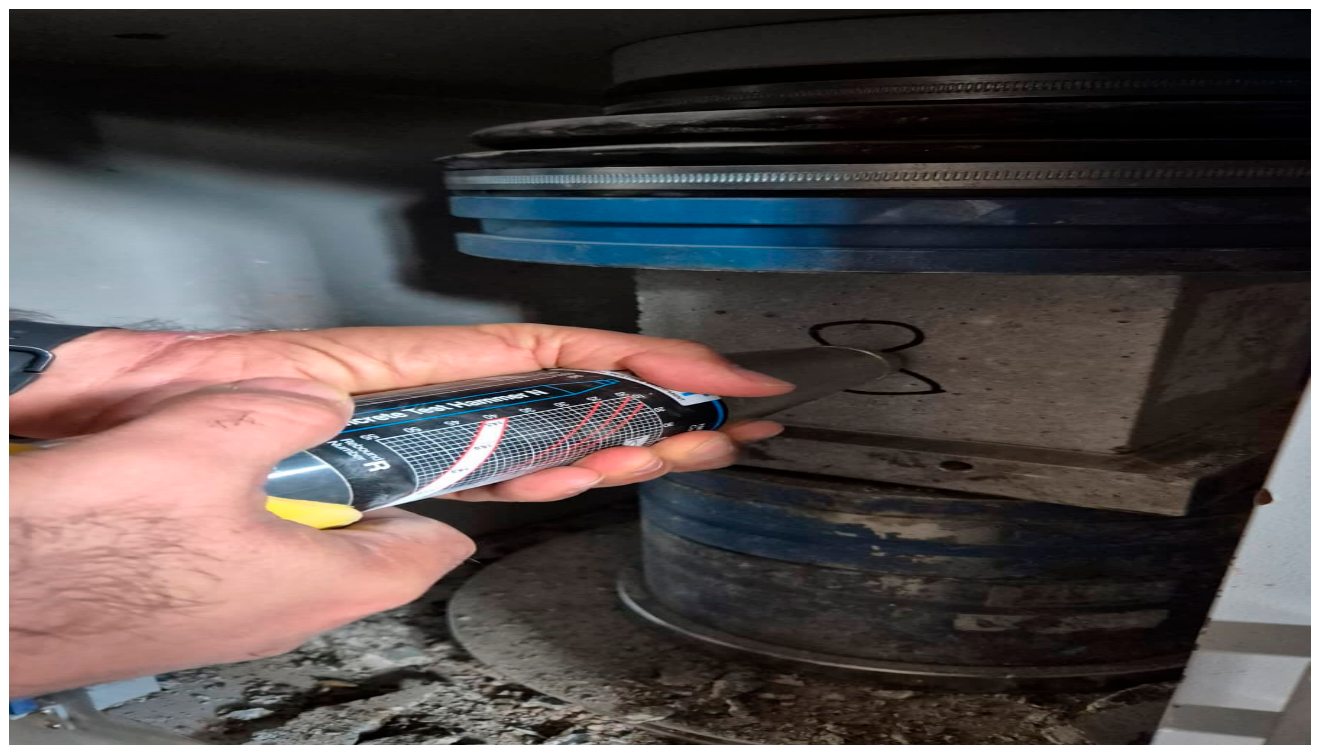
To determine the strength of the concrete produced, 150 × 150 × 150 mm cube samples were taken from the fresh concrete during pouring according to [23], subjected to curing according to [24], and subjected to compression testing according to [25]. When the load reached approximately 40% of the expected failure load, 10 horizontal rebound readings (α = 0°) were taken on one suitable side face of the cube, as shown in Figure 2.
Figure 2.
Determination of the rebound number R of the specimens with the rebound hammer.
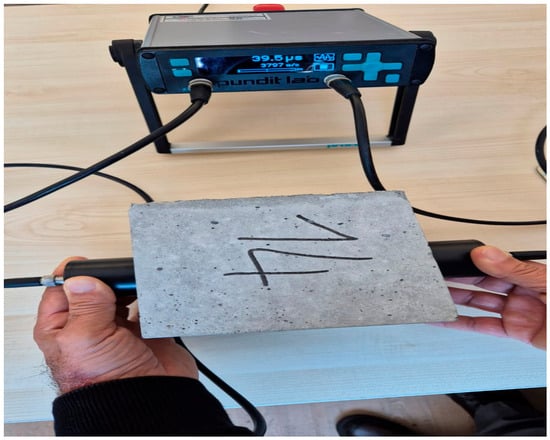
The highest and lowest readings were discarded and the average of the remaining eight was recorded as the rebound number R; the stress at failure was recorded as fc. Before the compression test, the pulse velocity was measured by direct transmission both parallel and perpendicular to the casting direction (Figure 3), and the average of the two measurements was recorded as V.
Figure 3.
Determination of the ultrasonic wave velocity V of concrete samples.
This procedure was applied to all specimens, so that the pulse velocity V corresponding to each compressive strength was determined. The Ministry of Public Works and Housing (now the Ministry of Environment, Urbanization and Climate Change) is the sole authorized authority for market surveillance and inspection (MSI) of products covered by the Construction Products Regulation. In reinforced concrete buildings, the conformity of concrete, one of the most important elements of the load-bearing system, to standards is of paramount importance. The Ministry’s Circular No. 248 dated 20 April 2004, and the relevant articles of the Regulation on Buildings to be Constructed in Earthquake Zones, mandate the use of ready-mixed concrete (high-quality, inspected, maintained, and placed with a vibrator) in buildings [26]. This date is used in the present study as the criterion for separating the two building populations examined: buildings constructed before it, generally with traditional site-mixed concrete, and buildings constructed after it, with ready-mixed concrete. Prior to 2004, concrete was poured on site using traditional methods in most reinforced concrete structures. In traditional site mixing, mix design calculations and placement guidelines are not followed, and the resulting concrete is highly heterogeneous. The aggregate is used as extracted from the river, without sieving or washing, so the silt and clay it contains impair the bond between the cement paste and the aggregate. Moreover, because the workers are paid per cubic meter rather than per day, they tend to place the concrete as quickly as possible, paying little attention to mixing time or proportions. For these reasons, concrete produced using traditional methods has a highly heterogeneous structure. This heterogeneity is evidenced in Section 3.1.1 by the visual examination of the cores and by the within-building dispersion of core strengths. This reduces the strength of the concrete and prevents reinforced concrete structures from performing as expected, especially during earthquakes. For most site-mixed concrete, no specimens were taken for strength testing, so no strength information is available for the buildings constructed with it. With ready-mix concrete, specimens are taken during placement, but their results indicate only the potential strength of the concrete as produced. Placement and curing strongly affect the compressive strength; because specimens are better compacted and cured than the concrete in the formwork, the strength of cube specimens is generally higher than the in situ strength [6,8,11]. To determine the relationship between the core test result fc, the rebound value R, and the ultrasonic wave velocity V, Schmidt hammer and ultrasonic tests were performed at the coring location (shear wall or column) before the cores were drilled. The highest and lowest rebound values were discarded, and the arithmetic mean of the remaining 8 rebound values was recorded as the rebound value R. Before coring, direct-transmission ultrasonic measurements were made at 3–4 reinforcement-free points in the coring area, and their average was taken as V. Each core was then tested in compression to determine fc. To obtain sufficient data, this procedure was repeated in 74 reinforced concrete buildings constructed before 20 April 2004 and 74 constructed after that date, since the concrete in buildings constructed before this date was generally produced and placed using traditional methods. Core samples were generally taken from shear walls. In areas without shear walls, cores were taken from columns. The members to be cored were those with the lowest rebound number R in the preliminary rebound hammer survey. Cores 100 mm in diameter and 200 mm long were drilled perpendicular to the casting direction.
2.3. Statistical Analysis
Linear regression was used to investigate the relationships between rebound number R, ultrasonic pulse velocity V, and concrete compressive strength. For the Schmidt hammer dataset (n = 74), separate models were created for laboratory cube compressive strength (fc), ready-mixed concrete core strength fc1, and conventional concrete core strength fc2, and R was used as the predictor in each model. For the dataset (n = 74) containing R, V and fc measurements, two single-predictor models (fc ~ R and fc ~ V) were created. In addition, a combined SonReb model (fc = a + bR + cV) was created to examine whether using R and V together improves compressive strength prediction. Model fit and prediction error were evaluated using R2, adjusted R2, root mean square error (RMSE), mean absolute error (MAE) and mean absolute percentage error (MAPE). Regression coefficients are reported with 95% confidence intervals. Because some models showed signs of heteroscedasticity, heteroscedasticity-consistent (HC3) standard errors and confidence intervals were also calculated. The fitted regression relationships are shown graphically together with their 95% confidence and prediction intervals. Model assumptions were checked using residuals-versus-fitted, normal Q–Q, scale–location and residuals-versus-leverage plots. These graphical checks were supported by the Breusch–Pagan test for heteroscedasticity, the Shapiro–Wilk test for normality of the residuals and the Ramsey RESET test for functional-form misspecification. Standardized residuals, leverage and Cook’s distance were examined to identify potentially influential observations; when such observations were found, the models were refitted without them to determine whether they materially affected the results. For models in which the RESET test indicated possible misspecification, quadratic terms were examined as a sensitivity check. Predictive performance was further evaluated using 10-fold cross-validation repeated 10 times. In each repetition, the data were randomly divided into 10 folds; nine folds were used for model fitting and the remaining fold for validation, until each fold had served once as the validation set. The same fold assignments were used when comparing models within each dataset. RMSE, MAE and MAPE were calculated from the held-out predictions and are reported separately from the corresponding in-sample values. Given the limited sample sizes, repeated cross-validation was preferred to a single calibration–validation split.
3. Results and Discussion
3.1. Results
Although there are many non-destructive methods for estimating concrete strength, this study examines two methods that are commonly used in practice: the Schmidt hammer and ultrasonic tests.
3.1.1. Schmidt Hammer Measurements and Applications
The rebound numbers R and the three corresponding compressive strength measurements are presented in Table 1. Table 1 presents the rebound values R and their corresponding three compressive strength measurements.
Table 1.
Compressive strength values measured as a function of the rebound value. Table 1 compiles three independent series: laboratory cubes (fc), cores from ready-mixed concrete buildings (fc1), and cores from traditional concrete buildings (fc2), each tabulated against the rebound number R and used separately to fit its own regression equation. Values in the same row belong to different concretes and are not paired measurements on the same specimen.
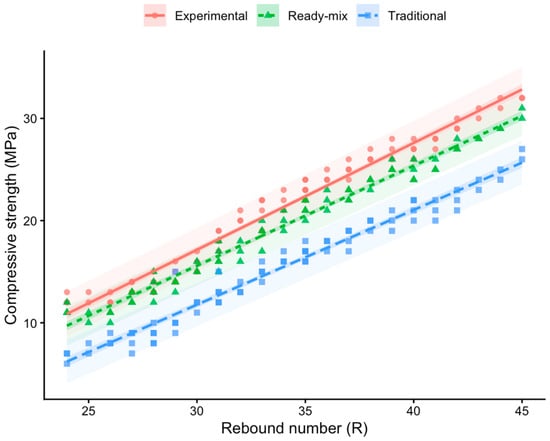
The first column of Table 1 shows the rebound value R measured with a Schmidt test hammer, the second column shows the compressive strength value fc of cube samples taken during concrete pouring, the third column shows the compressive strength value fc1 of core samples taken from reinforced concrete structures built using ready-mixed concrete, and the fourth column shows the compressive strength value fc2 of core samples taken from reinforced concrete structures built using conventional methods. The core strengths obtained from buildings constructed with traditional and ready-mix concrete within the scope of urban transformation, and the compressive strengths of the cube specimens sampled during pouring. Table 1 does not contain paired measurements on a single concrete. The three strength series (fc, fc1, fc2) belong to three different populations—(1) conventional 150 mm cubes cast from fresh ready-mixed concrete and tested in the laboratory, (2) in situ ready-mixed concrete (cores), and (3) in situ traditional concrete (cores)—and are arranged side by side in ascending order of R only to allow a compact comparison at the same rebound level. Each population was analyzed with its own regression equation (Table 2), and the slopes were compared through an interaction term. Cores were generally extracted from shear walls and, where no shear walls existed, from columns, from the members with the lowest rebound number in the preliminary survey; beams and slabs were not cored, the cube specimens are not associated with any structural member, and member type was not included as a covariate in the regression models. The relationships therefore represent walls and columns with relatively low rebound values. As shown in Figure 4, all three strength measurements increase approximately linearly with R. Laboratory cube compressive strength (fc) generally shows the highest values, whereas traditional concrete core strength (fc2) shows the lowest values.
Table 2.
Linear regression models between rebound number (R) and concrete compressive strength.
Figure 4.
Relationship between the rebound number R and the compressive strength of cube and core samples.
Lines show the fitted linear regression models. The darker inner bands represent the 95% confidence intervals for the fitted relationships, whereas the lighter outer bands represent the 95% prediction intervals for individual observations. In accordance with EN 13791:2019, the distribution of the test results should be checked for normality [20]. The regression results are presented in Table 2. In all models, R was a positive and significant predictor of compressive strength. The models explain 97.1%, 97.3% and 96.4% of the variance for the laboratory cube specimens, ready-mix concrete cores and traditional concrete cores, respectively. The HC3-based 95% confidence intervals for the R coefficients were [1.004, 1.087], [0.940, 1.017], and [0.886, 0.968], respectively. In-sample prediction errors were RMSE = 1.059 MPa, MAE = 0.892 MPa and MAPE = 4.76% for the compressive strength of the laboratory cube specimens (fc); RMSE = 0.939 MPa, MAE = 0.803 MPa, and MAPE = 4.74% for ready-mix concrete core strength fc1; and RMSE = 1.034 MPa, MAE = 0.786 MPa, and MAPE = 5.98% for traditional concrete core strength fc2. Repeated 10-fold cross-validation gave similar estimates: RMSE = 1.090 MPa, MAE = 0.919 MPa, and MAPE = 4.92% for laboratory cube strength; RMSE = 0.967 MPa, MAE = 0.826 MPa, and MAPE = 4.88% for ready-mix concrete core strength; and RMSE = 1.070 MPa, MAE = 0.813 MPa, and MAPE = 6.19% for traditional concrete core strength.
Diagnostic checks showed some departures from the standard linear-model assumptions. The Breusch–Pagan test indicated evidence of heteroscedasticity for the laboratory cube strength model (p = 0.049), while the result for the ready-mix core model was borderline (p = 0.054) and no evidence was found for the traditional concrete model (p = 0.385). The Shapiro–Wilk test did not indicate a departure from residual normality for the laboratory cube strength model (p = 0.130), but did so for the ready-mix (p = 0.0067) and traditional concrete models (p = 0.0050). The RESET test indicated possible functional-form misspecification for the laboratory cube strength model (p < 0.001), whereas the ready-mix (p = 0.073) and traditional concrete models (p = 0.637) showed no clear evidence of misspecification. Adding a quadratic term to the laboratory cube strength model did not significantly improve fit over the linear model (p = 0.069), so the linear specification was retained. Potentially influential observations were also examined. Refitting the models after excluding the principal influential observation produced only small changes in the R coefficients (1.046 to 1.055 for laboratory cube strength, 0.978 to 0.988 for ready-mix core strength, and 0.927 to 0.935 for traditional concrete core strength), with no change in the substantive conclusions. The observations were therefore retained in the reported models.
In the supplementary comparative model, the interaction between R and sample origin was significant (p < 0.001). This indicates that the slope of the R–strength relationship depends on the origin of the measured samples (laboratory cubes, cores from ready-mixed concrete, or cores from traditional concrete), since the measurement method is the same for all three. The slopes are 1.046 for fc, 0.978 for fc1, and 0.927 for fc2. Accordingly, as R increases, the greatest increase in strength was observed in the laboratory cube results, while the smallest increase was observed in the traditional concrete (Core 2) measurement.
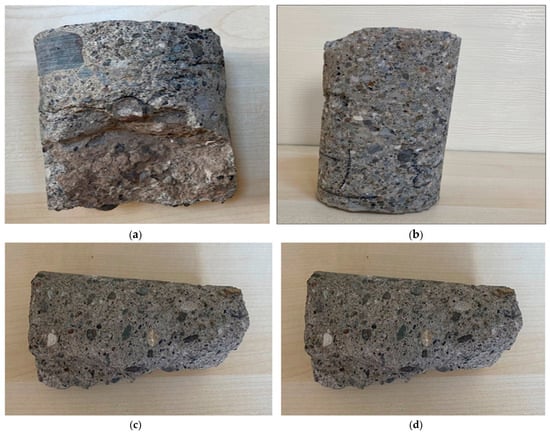
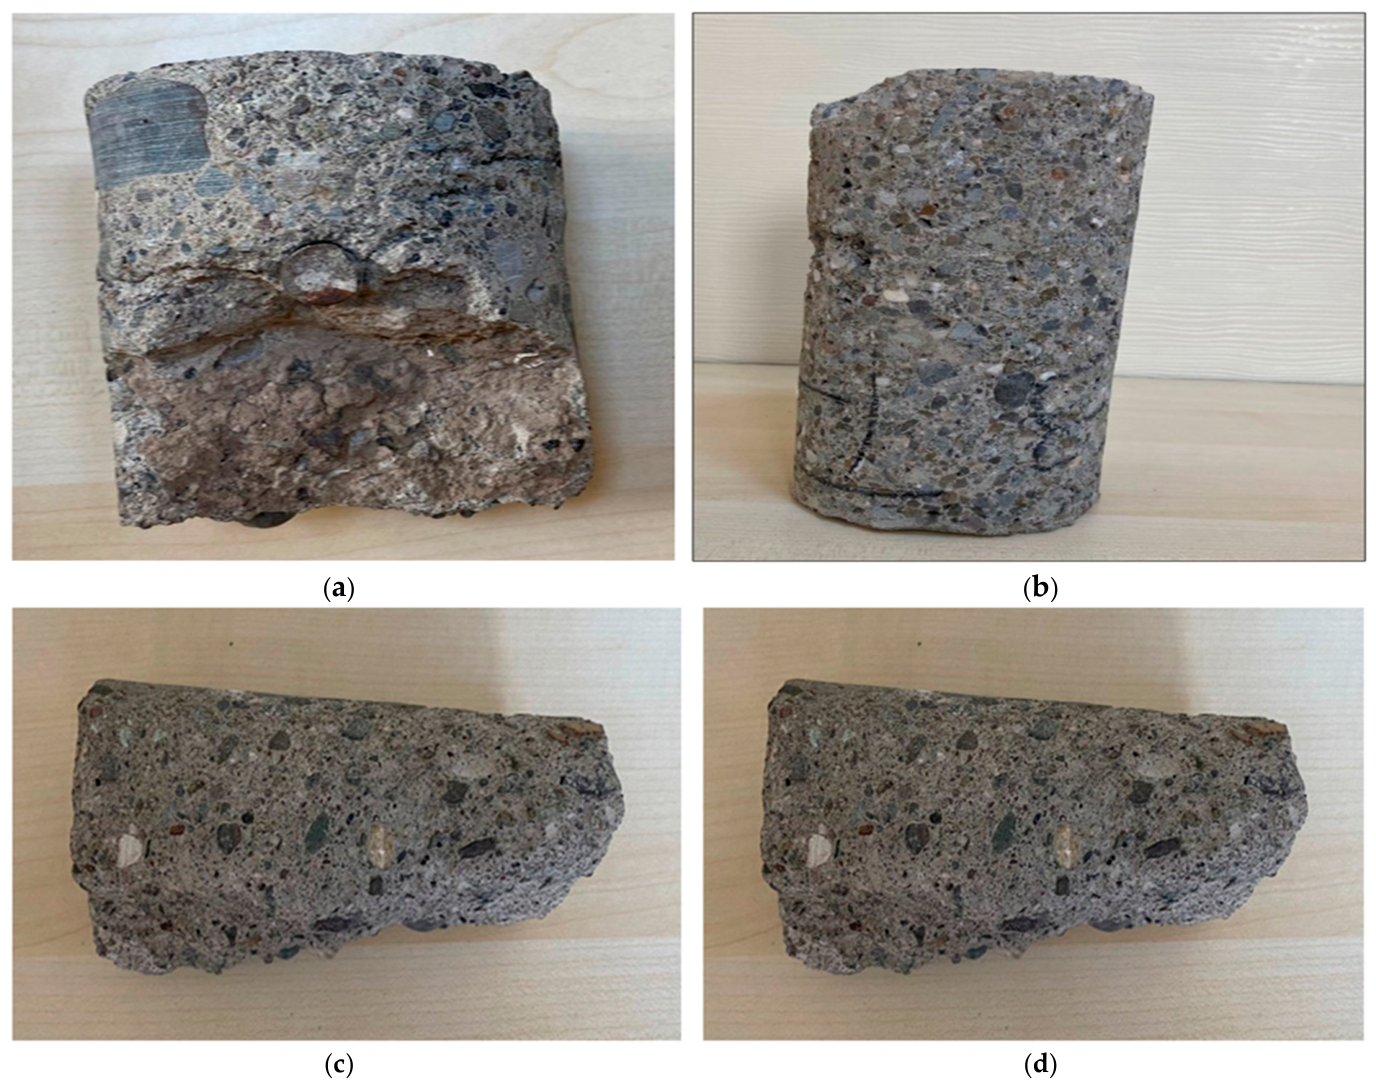
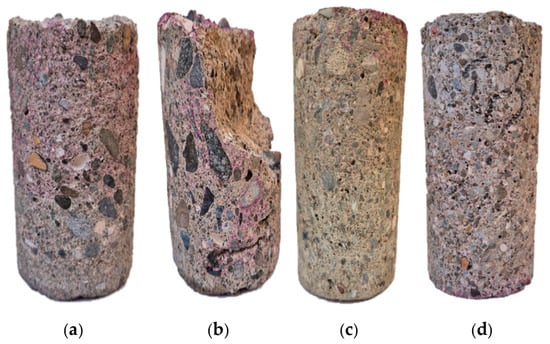
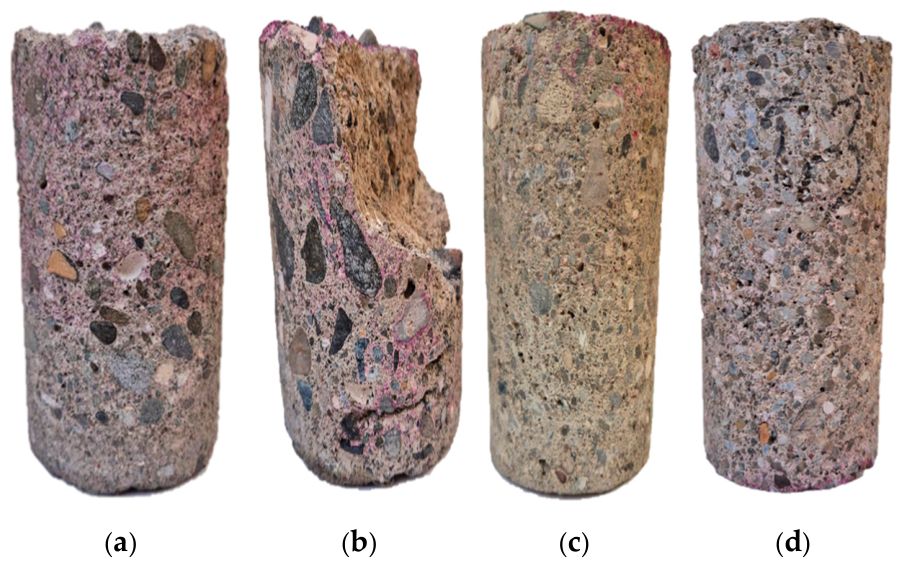
Schmidt hammer results are affected by several factors and vary significantly with the aggregate type, binder content and water–binder ratio of the concrete [3,6,7,11], which are difficult and time-consuming to determine in existing concrete. As described in Section 2.1, all aggregates in the Erzincan region are natural river aggregates from the Euphrates. Examination of the cores revealed that in concrete produced using traditional methods, the aggregate gradation was quite irregular, and the cement matrix and the overall appearance of the concrete were poor. The maximum aggregate size (Dmax) was highly variable in these concretes, ranging from 20 mm in some cores to 36 mm in others, whereas Dmax should not exceed 31.5 mm in reinforced concrete structures [11]. The specimens in Figure 5 are cores taken from reinforced concrete buildings constructed with traditional concrete. Due to the poor quality of the concrete, compression tests were not performed on these specimens. They are presented solely to illustrate the weaknesses of concrete produced using conventional methods. Nevertheless, visual examination of the core surfaces (Figure 5 and Figure 6) provides clear information on Dmax and grading and allows the quality of the concrete to be assessed. Figure 5a–d show that the grading is poor and the overall concrete quality is low. Because the aggregate is not washed in the traditional method, silt, clay and clay lumps may be present in the concrete (Figure 5a); these impair the bond of the cement paste and significantly reduce the mechanical properties of the concrete.
Figure 5.
Cores taken from buildings constructed with traditional concrete. (a) A core sample taken from a reinforced concrete structure built using traditional concrete pouring contains a clay lump, as shown in the figure; (b) A core sample taken from a reinforced concrete structure built using traditional concrete pouring; it appears to be in very good condition; (c) A core sample taken from a reinforced concrete structure built using traditional concrete pouring; it is in very poor condition; (d) A core sample taken from a reinforced concrete structure built using traditional concrete pouring; it is in very poor condition.
Figure 6.
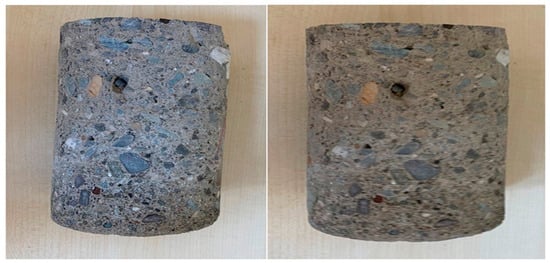
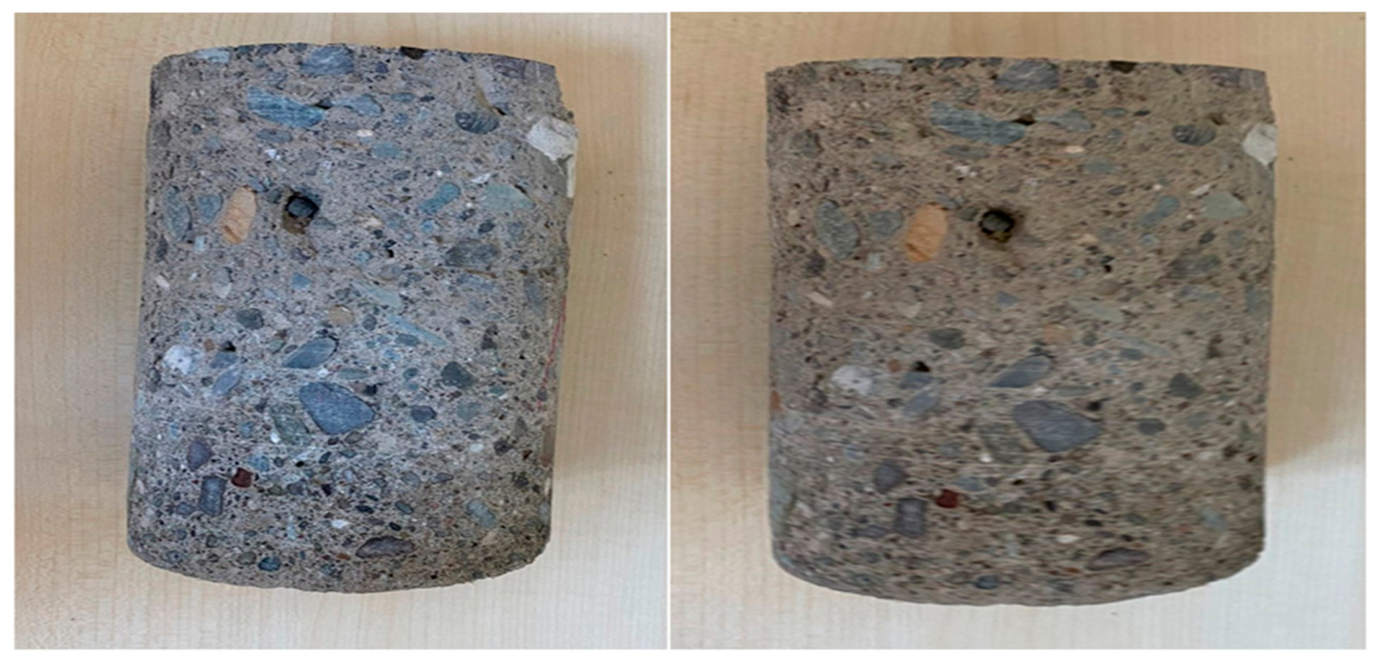
Cores taken from buildings constructed with ready-mix concrete.
The surfaces of the cores in Figure 5 indicate that cores a, c and d have very poor mechanical and physical properties, whereas core b does not. This confirms the heterogeneity of concrete produced by traditional methods. Figure 6 shows cores taken from ready-mix concrete; visual examination indicates a normal Dmax, acceptable grading and moderate concrete quality.
The presence of clay lumps in the concrete does not cause a drop in the Schmidt hammer value R, but it causes an excessive drop in ultrasonic velocity V and compressive strength value fc. This distorts the relationship between the rebound number R and the core strength fc and causes large deviations from the actual value. Visual examination of Figure 5c,d show that the core surfaces appear glazed, which suggests that the concrete has carbonated. Carbonation occurs when the calcium hydroxide in the hardened cement paste reacts with atmospheric carbon dioxide to form calcium carbonate and water (Ca(OH)2 + CO2 → CaCO3 + H2O) [6,12]. The calcium carbonate fills the surface pores and increases the surface hardness of the concrete and, consequently, the rebound number R, while lowering the pH of the pore solution. Carbonation therefore leads to an overestimation of strength when the Schmidt hammer is used [5,8,11,15]. To determine the carbonation depth, a phenolphthalein indicator solution was sprayed onto the core surfaces one day after coring. The non-carbonated, alkaline zone (pH above about 9) turns fuchsia pink, whereas the carbonated zone remains colorless [6,11], as shown in Figure 7. Carbonation was observed along the cores in Figure 7a,b; in Figure 7b, however, the fractured section containing clay lumps was not carbonated. Since construction records are not available for older structures in Türkiye, the age of the traditional concrete was estimated to be 25–50 years. The carbonation depth was 20–25 mm in Figure 7d and 10–15 mm in Figure 7c.
Figure 7.
Cores after the phenolphthalein carbonation test. (a) A core sample taken from a reinforced concrete structure built using conventional concrete, showing an irregular distribution of aggregate and matrix and a high degree of carbonation; (b) A core sample taken from a reinforced concrete structure built using conventional concrete shows an irregular distribution of aggregate and matrix, as well as the adverse effect of clay lumps on the concrete; (c) The core sample taken from a reinforced concrete structure built using ready-mix concrete appears to have a very homogeneous distribution of aggregate and matrix; (d) The core sample taken from a reinforced concrete structure built using ready-mix concrete appears to have a very homogeneous distribution of aggregate and matrix.
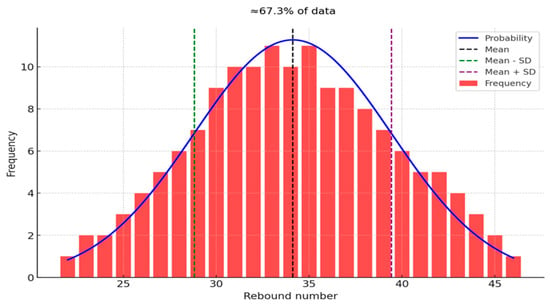
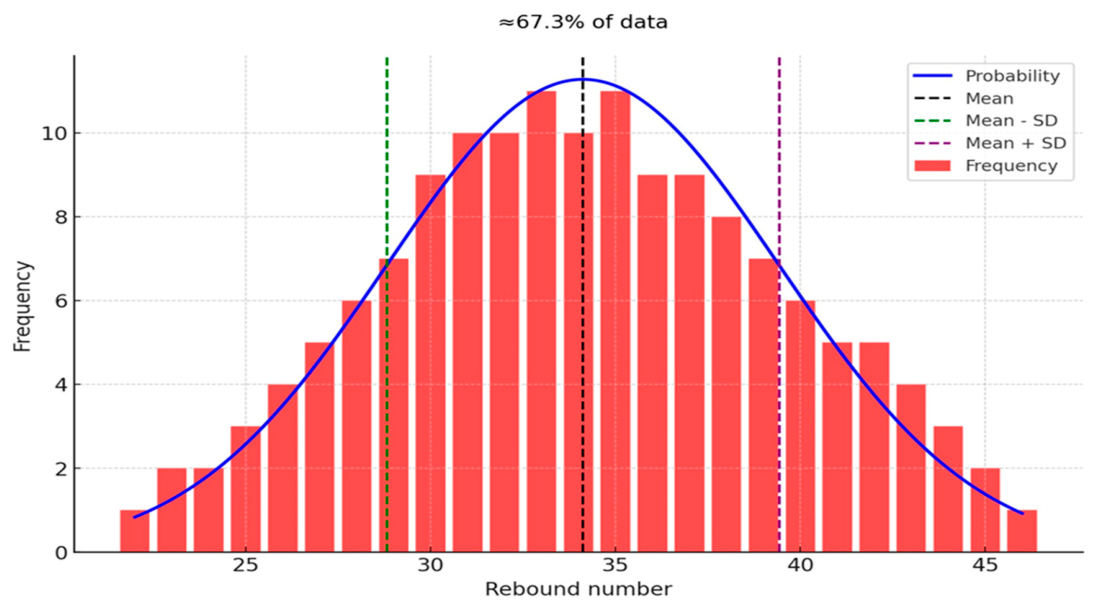
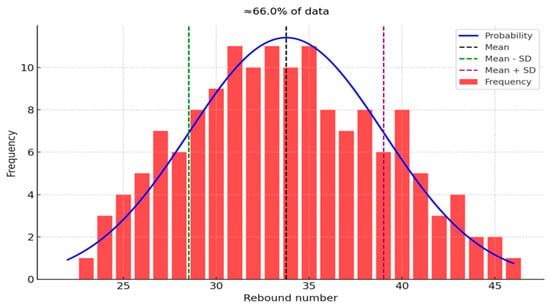
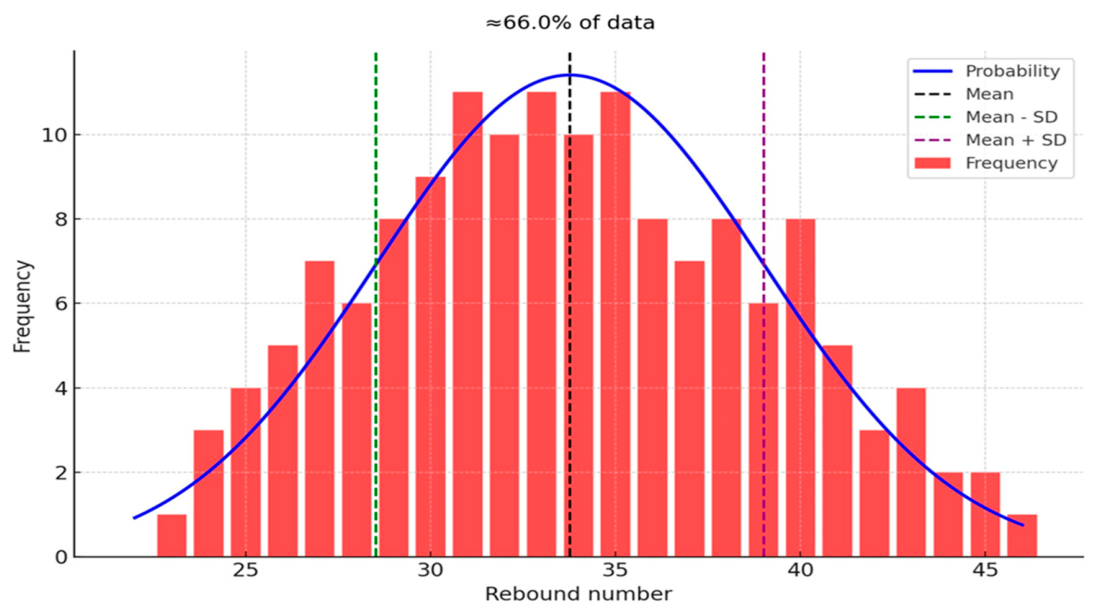
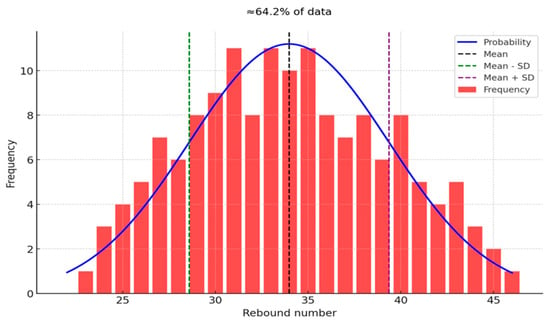
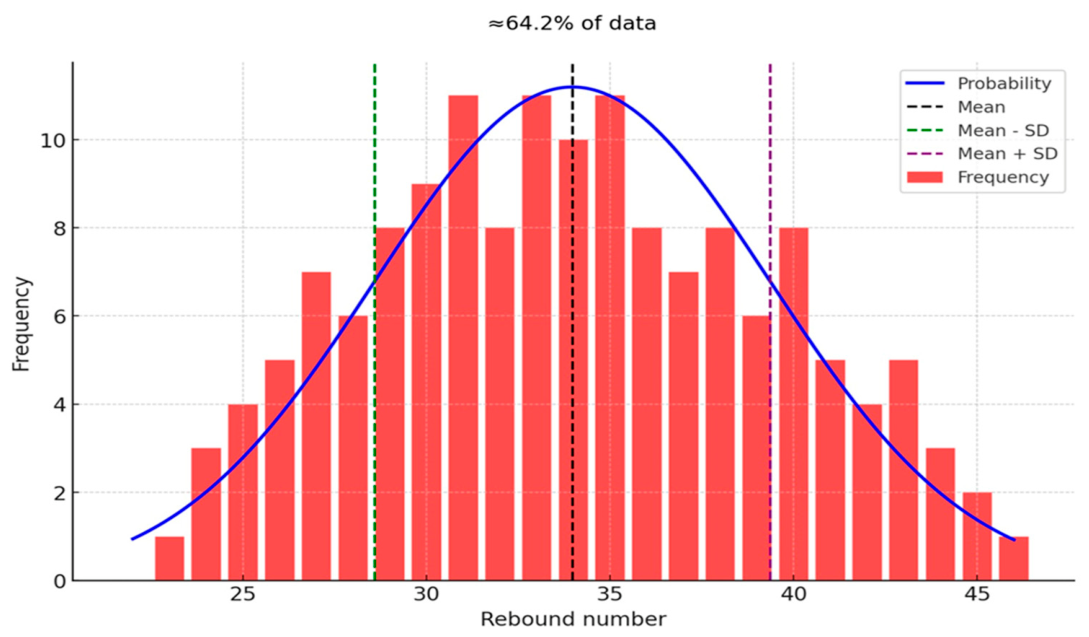
Figure 7a,b show cores from buildings constructed with traditional concrete, in which carbonation is very extensive. In contrast, the cores from ready-mix concrete buildings (Figure 7c,d) show much less carbonation, although the carbonation depth differs between them. This indicates that carbonation depends not only on the production method but also on the placement and curing of the concrete [6,11]. The core in Figure 7c appears to be of better quality than that in Figure 7d, and its carbonation depth is correspondingly smaller; the carbonation in Figure 7d is considerable, although less than in the traditional concrete. Where carbonation is significant, rebound hammer results deviate considerably from the true strength [6,11,15]. In the present study, the rebound readings were taken at the coring location immediately before each core was drilled, and the carbonation depth was determined on the extracted cores by the phenolphthalein test; however, the carbonation depth was not used as an explanatory variable in the regression models. The relationship for traditional concrete (Equation (3)) therefore implicitly reflects the average carbonation state of the 25–50-year-old buildings investigated, which is probably one of the reasons for the larger deviations observed in the validation. Consequently, this relationship should not be applied to structures of a different age or exposure without measuring the carbonation depth at the test location. The frequency and probability density distributions of the Schmidt hammer data for the three populations are shown in Figure 8, Figure 9 and Figure 10. For all concrete types, the results clustered around the mean, with most values within one standard deviation (SD) of the mean.
Figure 8.
Frequency and probability density of Schmidt hammer test results distribution with laboratory cube specimens.
Figure 9.
Frequency and probability density of RH test results distribution for ready-mixed concretes.
Figure 10.
Frequency and probability density of RH test results distribution for traditional concretes.
As shown in Figure 8 and Figure 9, the values for the laboratory cube specimens and ready-mix concrete largely conform to a normal distribution and are fairly homogeneous.
The difference between the laboratory cube specimens and the ready-mix concrete is very small and may be due to the smoother surfaces of the molded specimens.
As shown in Figure 10, the results for traditional concrete can also be considered normally distributed. About 67% of the values for laboratory cube specimens and ready-mix concrete lie within ±1 SD of the mean (close to the 68% expected for a normal distribution), compared with about 64% for traditional concrete. Although the distribution of conventional concrete resembles the distribution of ready-mixed concrete samples in terms of shape, its standard deviation is slightly larger; this is due to the structure of conventional concrete. The dispersion of R is, however, only moderately larger for traditional concrete (coefficients of variation of about 12%, 15%, and 18% for the laboratory cubes, the ready-mix concrete cores, and the traditional concrete cores, respectively), and the mean rebound numbers are almost identical. The lower quality of traditional concrete is therefore expressed not in the mean rebound number but in the strength associated with a given rebound number (for example, at R = 34, Equation (2) gives about 19.5 MPa and Equation (3) about 15.5 MPa) and in the dispersion of the core strengths. In the validation data, the mean within-building coefficient of variation of core strength is about 8% for the ready-mix concrete buildings (Table 3) and about 22% for the traditional concrete buildings (Table 4); in building 22, for example, the five cores range from 11 to 27 MPa. Together with the visual evidence from the cores (Figure 5 and Figure 6), this supports the heterogeneity of traditional concrete. Figure 8 shows the results of samples taken during concrete pouring. The mean value is 34, and the standard deviation is 4. Figure 9 shows the results for cores from structures built with ready-mix concrete; the mean value is 33.5, and the standard deviation is 5. Figure 10 shows the results for cores from structures built with traditional concrete; the mean value is 34, and the standard deviation is 6. In addition, each population of Schmidt hammer test and core strength data was compared with the standard Gaussian distribution. The regression relationships between rebound number R and compressive strength are shown in Figure 4 and summarized in Table 2. The R-squared values were 0.971 for the laboratory cube specimens, 0.973 for ready-mix concrete cores, and 0.964 for traditional concrete cores. The laboratory cube and ready-mix concrete results were close to each other, whereas the traditional concrete results showed greater variability, consistent with the distributions shown in Figure 8, Figure 9 and Figure 10. Equations (1)–(3) correspond to the laboratory cube, ready-mix concrete, and traditional concrete relationships, respectively.
Table 3.
Comparison of core results with RH test results in reinforced concrete structures produced using ready-mix concrete.
Table 4.
Comparison of core results with RH test results in reinforced concrete structures produced using traditional concrete.
To test the validity of the derived relationships, the in situ compressive strength of reinforced concrete structures built using both ready-mix concrete and concrete produced by traditional methods was determined in accordance with the TS EN 13791:2019 standard. For verification, cores were taken from 15 buildings constructed with ready-mix concrete and 15 constructed with traditional concrete (five cores per building). The results are presented in Table 3 and Table 4. The core results were evaluated according to TS EN 13791:2019 as follows:
fc core aver. = core average value
fc core min. = minimum core value
fck,spec = characteristic concrete compressive strength
- (1)
- fc core aver. ≥ 0.85 (fck,spec + 2)
- (2)
- fc core min. ≥ 0.85 (fck spec − 4)
The value that satisfies these two criteria is considered the concrete strength.
As shown in Table 3, in reinforced concrete structures produced using ready-mix concrete, the in situ compressive strength determined from cores according to TS EN 13791:2019 was up to 11% lower than the value predicted by the regression equation, whereas the difference reached 25% in structures constructed with traditional concrete. An 11% deviation is acceptable because, in reinforced concrete design, the design strength fcd is obtained by dividing the characteristic strength fck by a material safety factor (fcd = fck/γc) [8], which is generally taken as 1.5 and varies with the production method. For traditional concrete, however, the deviation is too large for the method to be applied directly. As a solution, for concrete poured using traditional methods, the values obtained from the formula derived from regression analysis based on the R value can be used after dividing them by a safety factor. This factor should be chosen according to the operator’s assessment of the concrete quality.
3.1.2. Ultrasonic Testing Measurements and Applications
Concrete technologists have always given special importance to the possibility of determining concrete properties through non-destructive testing [22]. A dataset of V and the corresponding compressive strength fc from destructive tests can be used to establish a correlation for estimating the in situ strength of any member of the structure under investigation, provided that the correlation is valid for that concrete and V is measured on the member [26,27,28,29]. Due to its advantages over DT, many studies investigate the correlation between the compressive strength of concrete fc and V [17]. The primary goal of non-destructive methods applied to reinforced concrete structures is to provide an accurate estimate of the material’s quality. UT is one such method [18] and is primarily used to assess the homogeneity of concrete and the depth of cracks in reinforced concrete members. To relate R, V and fc, the pulse velocity V of each specimen was first measured (Figure 3); the specimen was then loaded in compression, R was measured with the Schmidt hammer at approximately 40% of the failure load, and loading was continued until failure to determine fc. This analysis examines the relationships between ultrasonic velocity V, rebound number R, and compressive strength fc. Table 5 presents the results for 72 specimens sampled at different times between 1992 and 2025 from concrete produced at ready-mix plants in Erzincan.
Table 5.
Ultrasonic pulse velocity, rebound number and compressive strength fc of the specimens (specimens sampled between 1992 and 2025).
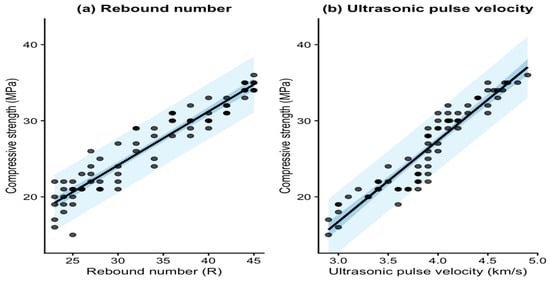
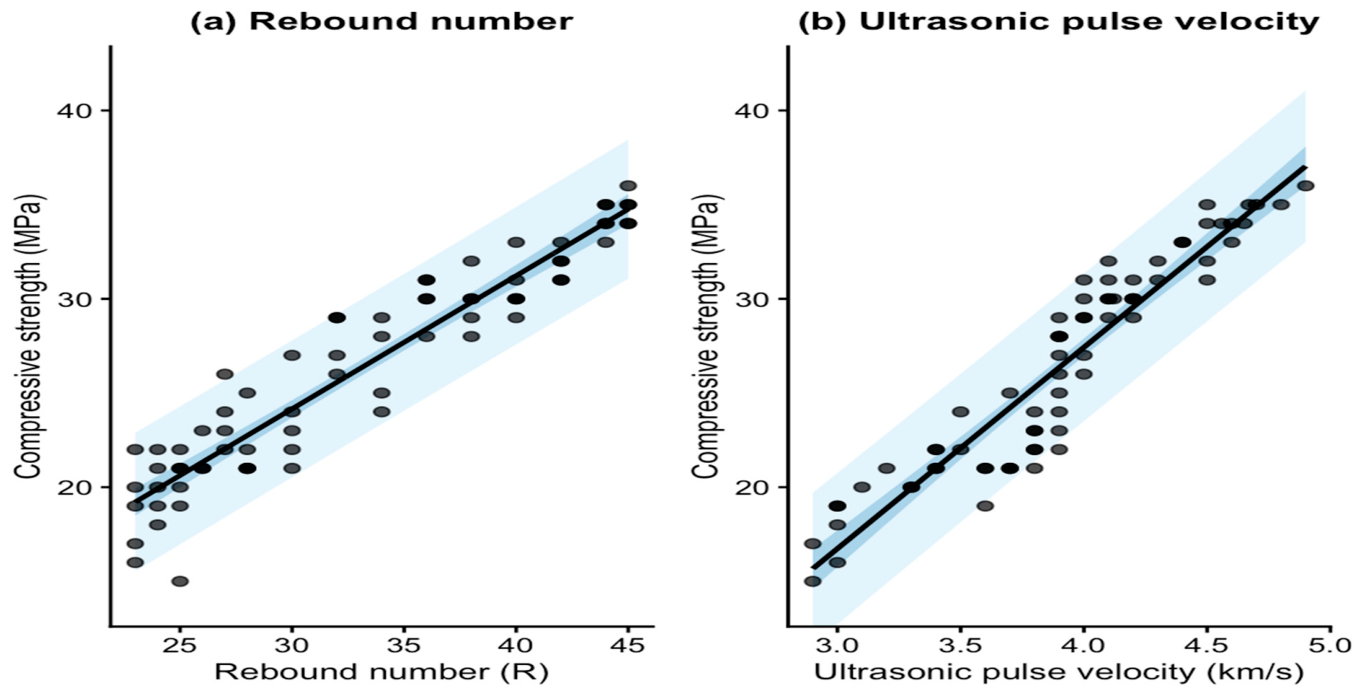
For the n = 72 dataset, three models were fitted to predict compressive strength (fc): an R-only model, a V-only model, and a combined SonReb model including both R and V. The R-only model yielded fc = 2.956 + 0.707R (R2 = 0.896, adjusted R2 = 0.895), while the V-only model yielded fc = −15.326 + 10.688V (R2 = 0.879, adjusted R2 = 0.877). In the combined model, both predictors remained significant (p < 0.001), yielding fc = −7.829 + 0.402R + 5.349V (R2 = 0.950, adjusted R2 = 0.949). HC3-based 95% confidence intervals were [0.656, 0.758] for the R coefficient in the R-only model and [9.989, 11.387] for the V coefficient in the V-only model. In the combined model, the corresponding intervals were [0.322, 0.483] for R and [4.021, 6.677] for V. The fitted single-predictor relationships are shown in Figure 11.
Figure 11.
Relationships between compressive strength and (a) rebound number and (b) ultrasonic pulse velocity.
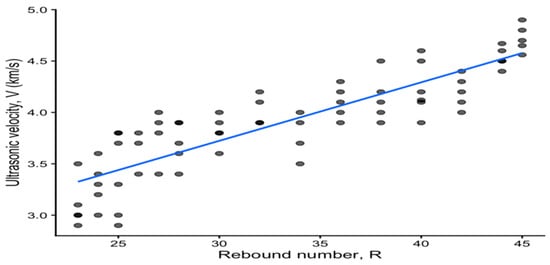
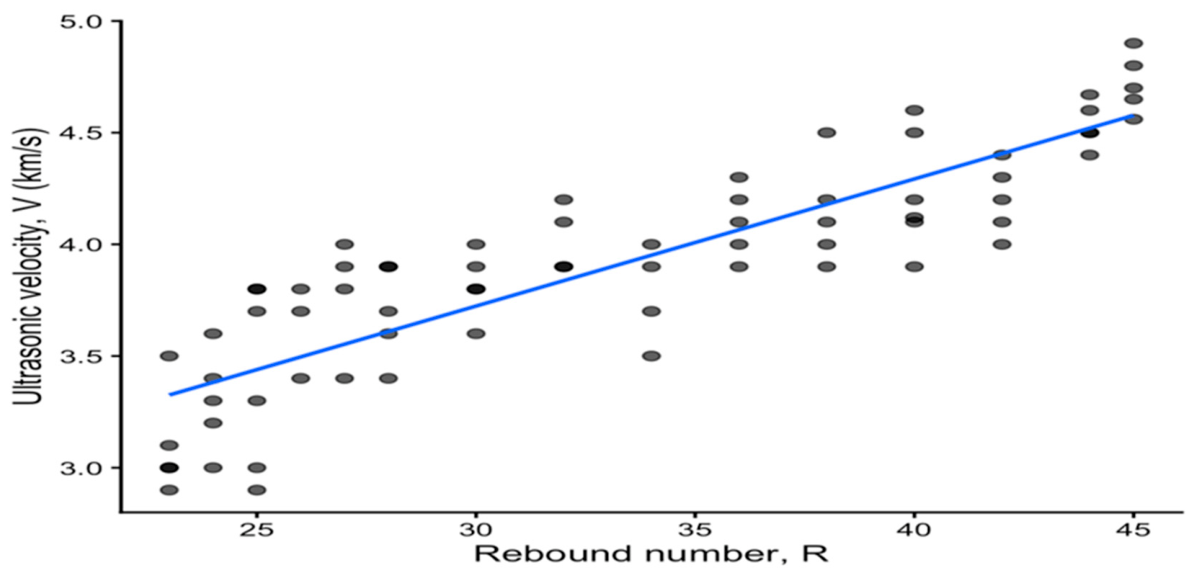
Solid lines show the fitted linear regression models. The darker inner bands represent the 95% confidence intervals for the fitted relationships, whereas the lighter outer bands represent the 95% prediction intervals for individual observations. The relationship between rebound number R and ultrasonic velocity V was also examined as a descriptive auxiliary analysis. As shown in Figure 12, ultrasonic velocity increased with rebound number. The fitted equation was V = 2.016 + 0.057R (R2 = 0.755, p < 0.001). This relationship is reported separately from the compressive-strength prediction models (Table 6).
Figure 12.
Relationship between ultrasonic pulse velocity V and rebound number R.
Table 6.
Linear regression models for the n = 72 dataset.
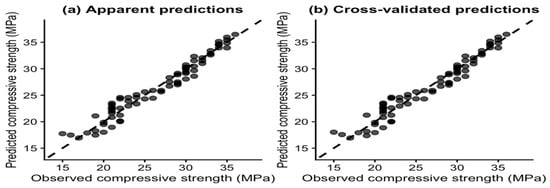
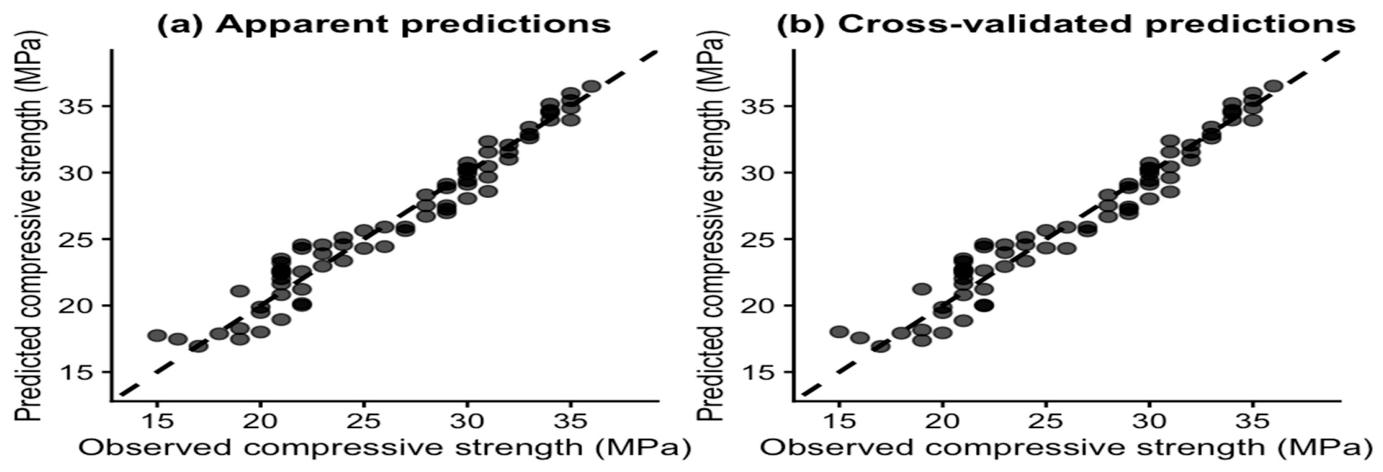
Predictive accuracy was evaluated both in-sample and using repeated 10-fold cross-validation with 10 repetitions. In-sample RMSE, MAE, and MAPE were 1.783 MPa, 1.418 MPa, and 5.90% for the R-only model; 1.925 MPa, 1.565 MPa, and 6.42% for the V-only model; and 1.237 MPa, 0.991 MPa, and 4.17% for the combined model. The corresponding cross-validated values were 1.818 MPa, 1.446 MPa, and 6.02%; 1.965 MPa, 1.605 MPa, and 6.59%; and 1.286 MPa, 1.027 MPa, and 4.33%, respectively. Thus, the combined R + V model showed lower prediction errors than either single-predictor model in both the apparent and held-out predictions. Apparent and cross-validated predictions from the combined SonReb model are shown in Figure 13.
Figure 13.
Observed versus predicted compressive strength for the combined SonReb model based on rebound number and ultrasonic pulse velocity.
(a) apparent predictions from the model fitted to the full dataset and (b) cross-validated predictions from repeated 10-fold cross-validation. For panel (b), each point represents the mean of the 10 held-out predictions obtained for that observation across the 10 repetitions. Dashed lines indicate perfect agreement between observed and predicted values. Diagnostic checks indicated some departures from the standard linear-model assumptions. The Breusch–Pagan test indicated heteroscedasticity for the R-only (p = 0.029) and combined (p = 0.003) models, but not for the V-only model (p = 0.207); HC3 inference was therefore used for coefficient confidence intervals. The Shapiro–Wilk test indicated a departure from residual normality for the V-only model (p = 0.016), but not for the R-only (p = 0.690) or combined (p = 0.364) models. The RESET test indicated possible functional-form misspecification for the V-only (p = 0.005) and combined (p = 0.012) models, but not for the R-only model (p = 0.402). Adding quadratic terms did not significantly improve the combined model (p = 0.778); a quadratic extension of the V-only model was also not significant (p = 0.148). The linear specifications were therefore retained. R and V were strongly correlated (r = 0.869), with variance inflation factors of 4.08 in the combined model, but both predictors remained significant. Observation 15 was identified as the principal influential observation in the combined model (Cook’s D = 0.196). Excluding it produced only small coefficient changes (R: 0.402 to 0.419; V: 5.349 to 4.952) and essentially unchanged model fit (R2 = 0.950 to 0.951), so it was retained.
In reinforced concrete structures produced using ready-mix concrete, the core compressive strength obtained using the in situ compressive strength determination method according to TS EN 13791:2019 [30] was 9–19% lower than the value predicted by the UT-based regression equation, as shown in Table 7. Ultrasonic results are affected by moisture content, the amount and structure of voids, micro-cracks, the structure of the cement matrix, and the type and grading of the aggregate. Consequently, the strength predicted from V by the general equation deviated from the core strength by up to 19%, which is too large for this equation to be used on its own to determine the in situ compressive strength.
Table 7.
Comparison of core and ultrasonic test results in reinforced concrete structures produced using ready-mix concrete.
4. Conclusions
The objective of this study is to determine the relationships between Schmidt hammer, ultrasonic, and core drilling test results in order to estimate the in situ compressive strength of reinforced concrete structures in the Erzincan region, and to investigate the applicability of the derived correlations. The suitability of the derived correlations was examined using destructive core drilling test results. Since the accuracy of non-destructive testing depends largely on material properties, aggregate characteristics, concrete quality, and local construction practices, and in line with previous findings reported in the literature [15,19,21,26,27,29], separate regional calibration models should be developed for laboratory specimens, reinforced concrete structures constructed using ready-mix concrete, and reinforced concrete structures constructed using conventional concrete. Regression analysis showed strong relationships between the Schmidt hammer test results and the compressive strength test results, with coefficients of determination (R2) ranging from 0.964 to 0.973.
The results obtained using the developed equations were found to be in good agreement with the test results of laboratory specimens and core samples taken from reinforced concrete structures built using ready-mix concrete; however, this agreement was not observed in reinforced concrete structures built using conventional concrete, which is probably attributable to the greater variability of concrete produced using traditional methods, resulting from its heterogeneous internal structure, inadequate aggregate grading, impurities, and the effects of carbonation. These observations are consistent with previous studies showing that Schmidt hammer measurements are significantly influenced by concrete composition, surface condition, and carbonation [6,8,11,15].
The ultrasonic testing method also showed a statistically significant correlation with compressive strength. In the n = 72 dataset, the V-only model showed lower predictive accuracy than the R-only model. In the n = 72 dataset, combining rebound number and ultrasonic pulse velocity in the SonReb model improved prediction relative to either variable used alone: repeated 10-fold cross-validation yielded RMSE = 1.286 MPa, MAE = 1.027 MPa, and MAPE = 4.33% for the combined model, compared with 1.818 MPa, 1.446 MPa, and 6.02% for the R-only model and 1.965 MPa, 1.605 MPa, and 6.59% for the V-only model, respectively. Although the increase in ultrasonic velocity correlated with the increase in compressive strength, deviations of up to 19% were observed based on core test results obtained for verification purposes. This discrepancy confirms, as previously reported by many researchers [17,23,28,29], that ultrasonic wave propagation is strongly influenced by concrete heterogeneity, internal voids, cracks, moisture content, and aggregate properties. The applicability of the regression equations obtained using the procedures specified in the TS EN 13791:2019 [30] standard was further examined. It was demonstrated that the relationships derived from the Schmidt hammer test model predict the in situ compressive strength of reinforced concrete structures built with ready-mix concrete with a maximum deviation of approximately 11% from core drill test results. This level of deviation remains within acceptable engineering limits when considering the safety factors adopted for concrete in reinforced concrete design [8,20]. In contrast, core sample results from reinforced concrete structures built using concrete produced by the traditional method showed deviations of up to approximately 25% from the results obtained using the formulas derived from the correlations; this is an unusable value unless an appropriate correction or safety factor, as recommended by the testing operator, is applied. This demonstrates that the direct application of a general correlation equation to heterogeneous concrete is not sufficiently reliable. The results indicate that the reliability of a non-destructive strength relationship depends on how closely the tested concrete resembles the concrete used for its calibration; the production method influences this reliability only indirectly, through its effect on aggregate grading, homogeneity, compaction, curing, and carbonation state. While concrete produced in ready-mix plants exhibits relatively homogeneous behavior and consistent estimation accuracy, concrete poured using traditional methods showed significant variation due to differences in production quality, material distribution, and workmanship. Therefore, as suggested in previous studies [16,18,19,31,32,33], universal empirical equations should be avoided, and locally calibrated relationships should be established for each region and concrete production practice. In general, the findings indicate that when the Schmidt hammer is calibrated using locally obtained core test data, it provides a fast, economical, and sufficiently reliable technique for estimating the in situ compressive strength of existing reinforced concrete buildings. The relationships were derived mainly from cores of shear walls and columns with relatively low rebound values, and member type was not included in the models; they should therefore be applied to other members with caution. When a rebound hammer is calibrated or used on existing structures, the carbonation depth should be measured at each test location, and the rebound values should be corrected, or the carbonated surface layer removed, before the relationship is applied. Ultrasonic testing should be considered primarily as a complementary tool for assessing the homogeneity of concrete and detecting internal structural defects, rather than as an independent method for estimating strength. The combined use of destructive and non-destructive testing provides a more robust framework for assessing the structural condition and seismic safety of existing reinforced concrete structures, particularly in earthquake-prone regions [16,19,21,32,33,34].
Funding
This research received no external funding.
Data Availability Statement
The data that support the findings of this study are available from the corresponding author upon reasonable request.
Conflicts of Interest
The author declares no conflict of interest.
References
- Garcez, M.R.; Rohden, A.B.; De Godoy, L.G.G. The role of concrete compressive strength on the service life and life cycle of a RC structure: Case study. J. Clean. Prod. 2018, 172, 27–38. [Google Scholar] [CrossRef] [Scilit]
- Moccia, F.; Yu, Q.; Fernández Ruiz, M.; Muttoni, A. Concrete compressive strength: From material characterization to a structural value. Struct. Concr. 2021, 22, E634–E654. [Google Scholar] [CrossRef] [Scilit]
- Chahar, A.S.; Pal, P. Study on various properties of reinforced concrete—A review. Mater. Today Proc. 2022, 65, 597–602. [Google Scholar] [CrossRef] [Scilit]
- Hughes, B.P.; Watson, A.J. Compressive strength and ultimate strain of concrete under impact loading. Mag. Concr. Res. 1978, 30, 189–199. [Google Scholar] [CrossRef] [Scilit]
- Yankelevsky, D.Z. The uniaxial compressive strength of concrete: Revisited. Mater. Struct. 2024, 57, 144. [Google Scholar] [CrossRef] [Scilit]
- Neville, A.M. Properties of Concrete, 4th ed.; Longman: London, UK, 1995. [Google Scholar]
- Hassoun, M.N.; Al-Manaseer, A. Structural Concrete: Theory and Design, 7th ed.; John Wiley & Sons: Hoboken, NJ, USA, 2020. [Google Scholar]
- Ersoy, U.; Özcebe, G.; Tankut, T. Reinforced Concrete; METU Press: Ankara, Turkey, 2008. [Google Scholar]
- Gu, X.; Jin, X.; Zhou, Y. Basic Principles of Concrete Structures; Springer: Berlin/Heidelberg, Germany, 2016; pp. 193–196. [Google Scholar]
- Mohamad, H.M.; Asman, N.A.; Mirasa, A.K.; Saad, I.; Bolong, N.; Steven, C.C.K.; Mr, S.N. A consistency check of concrete compressive strength using Pearson’s correlation coefficient. Civ. Eng. J. 2021, 7, 541–548. [Google Scholar] [CrossRef] [Scilit]
- Erdoğan, T.Y. Beton [Concrete]; METU Press: Ankara, Turkey, 2021. [Google Scholar]
- Aïtcin, P.-C. High-Performance Concrete; E & FN Spon: London, UK, 1998. [Google Scholar]
- Neville, A.M. Review of Properties of Concrete, 5th ed.; Prentice Hall, Pearson: San Francisco, CA, USA, 2012. [Google Scholar]
- Nikoo, M.; Zarfam, P.; Sayahpour, H. Determination of compressive strength of concrete using Self Organization Feature Map (SOFM). Eng. Comput. 2015, 31, 113–121. [Google Scholar] [CrossRef] [Scilit]
- Bungey, J.H.; Millard, S.G. Testing of Concrete in Structures, 3rd ed.; Blackie Academic & Professional: London, UK, 1996. [Google Scholar]
- Uva, G.; Porco, F.; Fiore, A.; Mezzina, M. Proposal of a methodology for assessing the reliability of in situ concrete tests and improving the estimate of the compressive strength. Constr. Build. Mater. 2013, 38, 72–83. [Google Scholar] [CrossRef] [Scilit]
- do Nascimento Moura, M.A.; Júnior, A.L.M.; dos Santos Ferreira, G.C. Ultrasonic testing on evaluation of concrete residual compressive strength: A review. Constr. Build. Mater. 2023, 373, 130887. [Google Scholar] [CrossRef] [Scilit]
- Kog, Y.C. Estimating in-situ compressive strength of existing concrete structures. Pract. Period. Struct. Des. Constr. 2018, 23, 04018013. [Google Scholar] [CrossRef] [Scilit]
- Ali-Benyahia, K.; Kenai, S.; Ghrici, M.; Sbartaï, Z.M.; Elachachi, S.M. Analysis of the accuracy of in-situ concrete characteristic compressive strength assessment in real structures using destructive and non-destructive testing methods. Constr. Build. Mater. 2023, 366, 130161. [Google Scholar] [CrossRef] [Scilit]
- Görür, N. Türkiye’de Deprem [Earthquakes in Türkiye]; Doğan Kitap: İstanbul, Turkey, 2020. [Google Scholar]
- Sefrin, R.A.; Glock, C. Determination of in-situ concrete compressive strength under consideration of rearrangement effects. Acta Polytech. CTU Proc. 2022, 33, 525–532. [Google Scholar] [CrossRef] [Scilit]
- Silva, F.A.; Delgado, J.M.; Cavalcanti, R.S.; Azevedo, A.C.; Guimarães, A.S.; Lima, A.G. Use of nondestructive testing of ultrasound and artificial neural networks to estimate compressive strength of concrete. Buildings 2021, 11, 44. [Google Scholar] [CrossRef] [Scilit]
- TS EN 12350-1; Testing Fresh Concrete Part 1: Sampling. Turkish Standards Institution: Ankara, Turkey, 2010.
- TS EN 12390-2; Testing Hardened Concrete—Part 2: Making and Curing Specimens for Strength Tests. Turkish Standards Institution: Ankara, Turkey, 2010.
- TS EN 12390-3; Testing Hardened Concrete—Part 3: Compressive Strength of Test Specimens. Turkish Standards Institution: Ankara, Turkey, 2003.
- Ministry of Public Works and Housing, Republic of Türkiye. Circular No. 248, 20 April 2004; Ministry of Public Works and Housing, Republic of Türkiye: Ankara, Turkey, 2004.
- Mata, R.; Ruiz, R.O.; Nuñez, E. Correlation between compressive strength of concrete and ultrasonic pulse velocity: A case of study and a new correlation method. Constr. Build. Mater. 2023, 369, 130569. [Google Scholar] [CrossRef] [Scilit]
- Ofuyatan, O.; Olowofoyeku, A.; Oluwafemi, J.; Ighalo, J. Predicting the compressive strength of concrete by ultrasonic pulse velocity. In Proceedings of the IOP Conference Series: Materials Science and Engineering; IOP Publishing: Brsistol, UK, 2021; Volume 1036, p. 012053. [Google Scholar]
- Kabashi, N.; Krasniqi, C.; Dautaj, A. Evaluation of the compressive strength in concrete structures using the in-situ test methods. J. Civ. Eng. Environ. Sci. 2016, 2, 001–004. [Google Scholar] [CrossRef] [Scilit]
- TS EN 13791:2019; Assessment of In-Situ Compressive Strength in Structures and Precast Concrete Components. Turkish Standards Institution (TSE): Ankara, Türkiye, 2019.
- Breysse, D.; Balayssac, J.P.; Biondi, S.; Borosnyói, A.; Candigliota, E.; Chiauzzi, L.; Fontan, M. Non destructive assessment of in-situ concrete strength: Comparison of approaches through an international benchmark. Mater. Struct. 2017, 50, 133. [Google Scholar] [CrossRef] [Scilit]
- Pucinotti, R. Assessment of in situ characteristic concrete strength. Constr. Build. Mater. 2013, 44, 63–73. [Google Scholar] [CrossRef] [Scilit]
- Vasanelli, E.; Colangiuli, D.; Calia, A.; Luprano, V.A. Estimating in situ concrete strength combining direct and indirect measures via cross validation procedure. Constr. Build. Mater. 2017, 151, 916–924. [Google Scholar] [CrossRef] [Scilit]
- Sabbağ, N.; Uyanık, O. Prediction of reinforced concrete strength by ultrasonic velocities. J. Appl. Geophys. 2017, 141, 13–23. [Google Scholar] [CrossRef] [Scilit]

Disclaimer/Publisher’s Note: The statements, opinions and data contained in all publications are solely those of the individual author(s) and contributor(s) and not of MDPI and/or the editor(s). MDPI and/or the editor(s) disclaim responsibility for any injury to people or property resulting from any ideas, methods, instructions or products referred to in the content. |
© 2026 by the author. Licensee MDPI, Basel, Switzerland. This article is an open access article distributed under the terms and conditions of the Creative Commons Attribution (CC BY) license.