


Abstract
Reliable characterization of rock-mass deformability is essential for rock-supported infrastructure. This study combined six in situ rigid bearing plate tests with two-dimensional discrete element method (DEM) simulations implemented in Particle Flow Code (PFC2D) to investigate basalt deformation and energy evolution at the Gushui Hydropower Station. Five nested loading–unloading cycles reached 10.203 MPa. Mean deformation/elastic moduli were 15.402/22.236 GPa for weakly weathered basalt and 18.082/30.205 GPa for slightly weathered basalt; excluding fault-controlled E2-2 increased the weakly weathered means to 21.197/29.486 GPa. Three inverse-calibrated models reproduced the field paths with displacement root-mean-square errors of 0.090, 0.058, and 0.184 mm. Additional seed, particle-size, and domain-size calculations showed that contact strain energy was comparatively stable, whereas peak displacement, slip energy, and crack counts were realization- or boundary-dependent. The simulations therefore provide plausible, unit-thickness mechanism interpretations rather than unique three-dimensional reconstructions. Field stiffness and apparent dissipation are controlled jointly by matrix condition and local discontinuity geometry.
1. Introduction
The long-term safety and serviceability of large infrastructure systems depend strongly on the mechanical stability of their supporting geological foundations. For dams, underground caverns, tunnels, and other rock-supported structures, excessive deformation of the surrounding rock mass may compromise structural performance and operational reliability. Accurate characterization of rock-mass deformability is therefore important not only for engineering design, but also for condition assessment and long-term infrastructure management. Rock masses are heterogeneous and anisotropic geological media whose engineering-scale stiffness is controlled not only by intact-rock properties, but also by weathering, discontinuity geometry, filling materials, groundwater, and the in situ stress environment. Parameters measured after sampling may therefore differ from those governing the rock mass in place [1,2]. In situ loading tests remain an important means of obtaining deformation parameters at a representative engineering scale.
Rock-mass deformation is commonly described using deformation modulus, elastic modulus, and related indices derived from stress-deformation curves [3,4,5,6]. In situ plate-loading studies have shown that the measured response depends strongly on discontinuity orientation, stress state, burial depth, and scale [7,8,9,10]. Consequently, a comparison based only on weathering classes may mask the influence of a local fault, joint set, interlayer, or loading direction. A defensible interpretation should preserve the point-specific geological context and explicitly test the sensitivity of group statistics to structurally anomalous points.
Rock deformation and damage are accompanied by energy storage and dissipation [11,12,13,14,15,16,17]. Loading–unloading paths provide a practical measure of recoverable work and apparent hysteretic loss, while the discrete element method (DEM) can track contact strain energy, frictional-slip energy, and bond breakage. These quantities are complementary but are not automatically equivalent because field and numerical models have different dimensions, control volumes, and unrepresented sources of compliance.
Complementary experimental and numerical approaches are also used in cement-based materials and their production systems. Ji et al. combined nuclear magnetic resonance with mechanical testing and microstructural characterization to investigate cement pastes containing accelerators and superabsorbent polymers [18]. Liu et al. examined structural reliability and process optimization in large-scale vertical roller mills [19], while Mei et al. compared coupled combustion–decomposition simulations of a precalciner with measured data [20]. These studies provide methodological context for linking local processes to engineering performance, although their material parameters and governing mechanisms are not transferable to basalt rock masses.
In situ bearing plate tests preserve natural discontinuities and engineering-scale heterogeneity, but the measured P–W curve records only the boundary response. DEM provides a complementary view of crack initiation, contact-force redirection, displacement localization, and contact-scale energy evolution [21,22,23,24,25]. Previous studies have generally emphasized either field modulus evaluation or laboratory/numerical damage processes. A remaining need is to connect a repeated field-loading path to a transparent, structurally constrained DEM interpretation while distinguishing calibration fit from independent validation and acknowledging the dimensional mismatch between a circular field plate and a two-dimensional strip model.
Accordingly, this study contributes four linked elements: (1) a sensitivity analysis that separates the fault-controlled E2-2 point from the original weathering-group statistics; (2) PFC2D models that reproduce the same 30-node, five-cycle field-loading path and distinguish group-average cases from the point-specific E2-2 case; (3) a numerical sensitivity assessment covering particle realization, particle-size range, and model-domain size; and (4) a constrained macro-meso comparison in which field loop work and PFC energy terms are compared by stage trend and case ranking rather than assumed to be identical.
2. Integrated In Situ Testing and DEM Methodology
2.1. Test Point Layout and Preparation
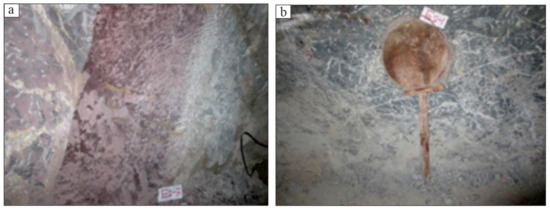
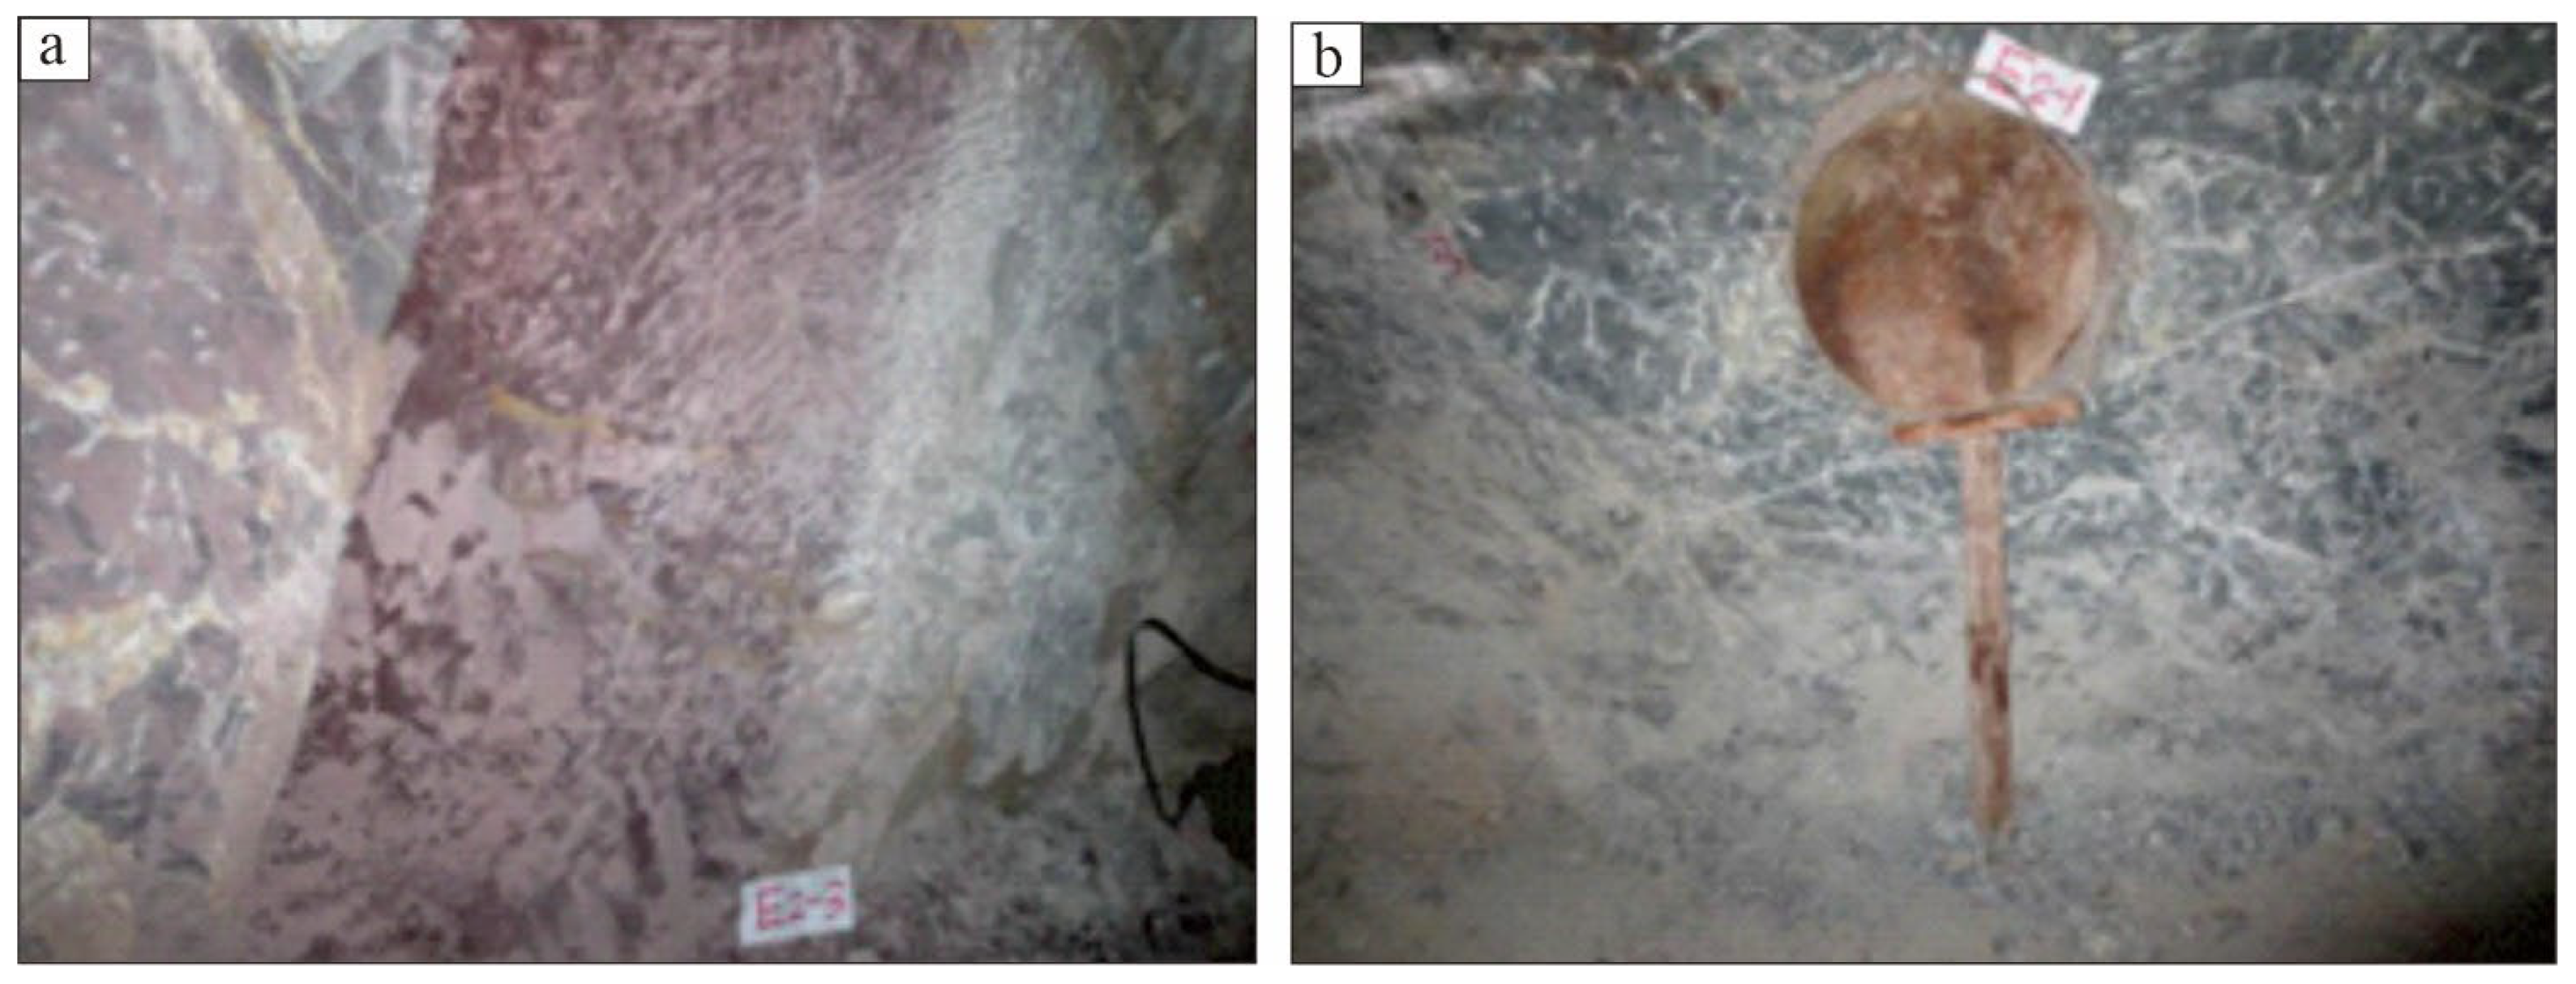
In situ rock-mass deformation measurements were performed in engineering tunnels at the pivot zone of the upper dam site for the Gushui Hydropower Station. Three positions (E2-1, E2-2, and E2-3) were set inside tunnel PD2 and three positions (E4-1, E4-2, and E4-3) inside tunnel PD4. The documented lithology, weathering levels, site coordinates, and discontinuity states are detailed in Table 1. The test surfaces were prepared in accordance with GB/T 50266-2013 [26] and DL/T 5368-2007 [27]. Within an approximately 2 m × 2 m zone, blast-disturbed rock was removed manually and the central surface unevenness was controlled to less than 1% of the plate diameter. The surface was cleaned, photographed, geologically logged, and bonded to the rigid plate with high-grade cement mortar. Testing started after seven days of curing. Figure 1 shows the prepared surface and attached plate.
Table 1.
Test-point layout and recorded discontinuity characteristics.
Figure 1.
Schematic diagram of specimen preparation. (a) Trimmed test surface and (b) bearing plate attachment.
Supplementary stress measurements in PD4 indicate a medium-to-high in situ stress environment: the measured maximum principal stresses at three adit locations were 17.574, 16.787, and 20.819 MPa, with corresponding minimum principal stresses of 2.530, 0.676, and 3.369 MPa. Because these measurements do not coincide exactly with the six plate-test surfaces, they were used as geological context rather than imposed as point-specific initial stresses in the local DEM models.
2.2. Test Method
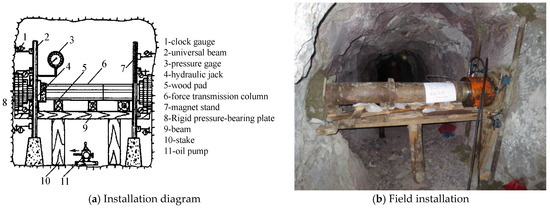
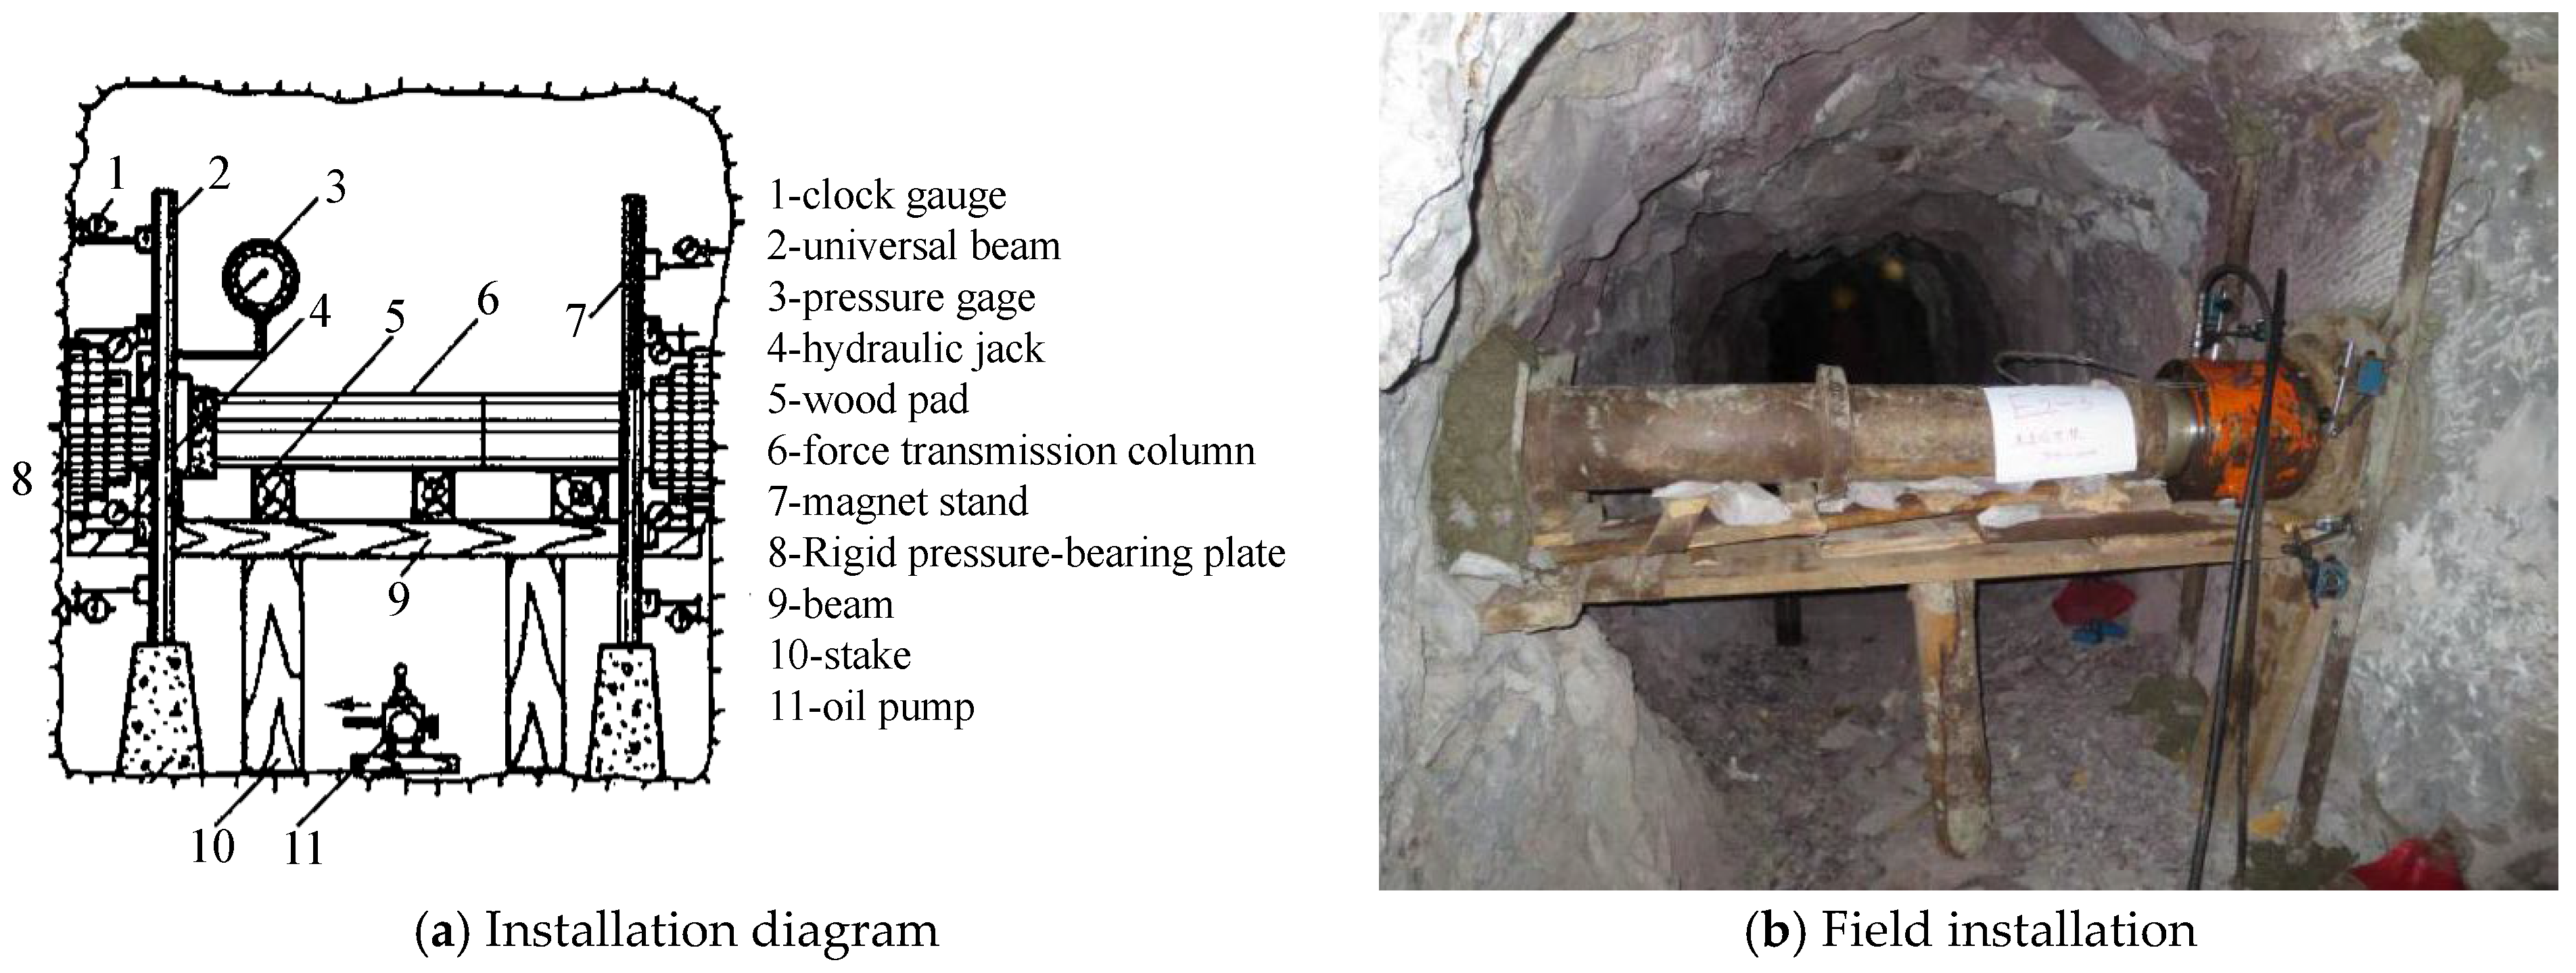
The rigid bearing plate tests followed GB/T 50266-2013 [26] and DL/T 5368-2007 [27]. The 0.52 m diameter plate was subjected to five nested loading–unloading cycles with target pressures P1–P5 of 2.041, 4.081, 6.122, 8.162, and 10.203 MPa. Each new cycle passed through the preceding pressure levels before reaching its new maximum and was then unloaded stepwise to zero. Four displacement gauges were arranged on the plate. After conversion of the original dial-gauge units, the reported displacement W at each stabilized node was the arithmetic mean of the four readings. Readings were taken immediately after each load change and at 10 min intervals. Deformation was considered stable when |ΔW0/W0| was less than 5% for all four gauges. Figure 2 illustrates the test installation and the field arrangement.
Figure 2.
Rigid bearing plate deformation test. (a) Installation diagram and (b) field installation.
The supplied calculation sheets retain the stabilized endpoint readings but not a complete time stamp for every intermediate observation. Therefore, the actual stabilization and unloading durations cannot be reconstructed for each pressure level, and a separate creep component cannot be identified. The project records also do not provide independent compliance calibrations for the jack, reaction column, mortar layer, or bearing plate. No additional system-compliance correction was applied in this study. Any apparatus compliance, bedding-layer deformation, or time-dependent closure remaining before the stability criterion was met is therefore included in the measured P–W path and in the apparent hysteresis work. This limitation is considered when comparing the field response with the quasi-static DEM results.
2.3. Cross-Scale Research Framework
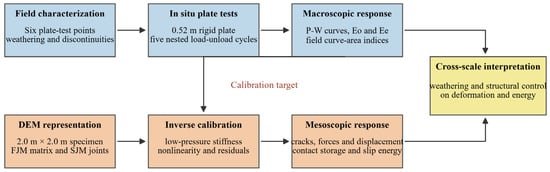
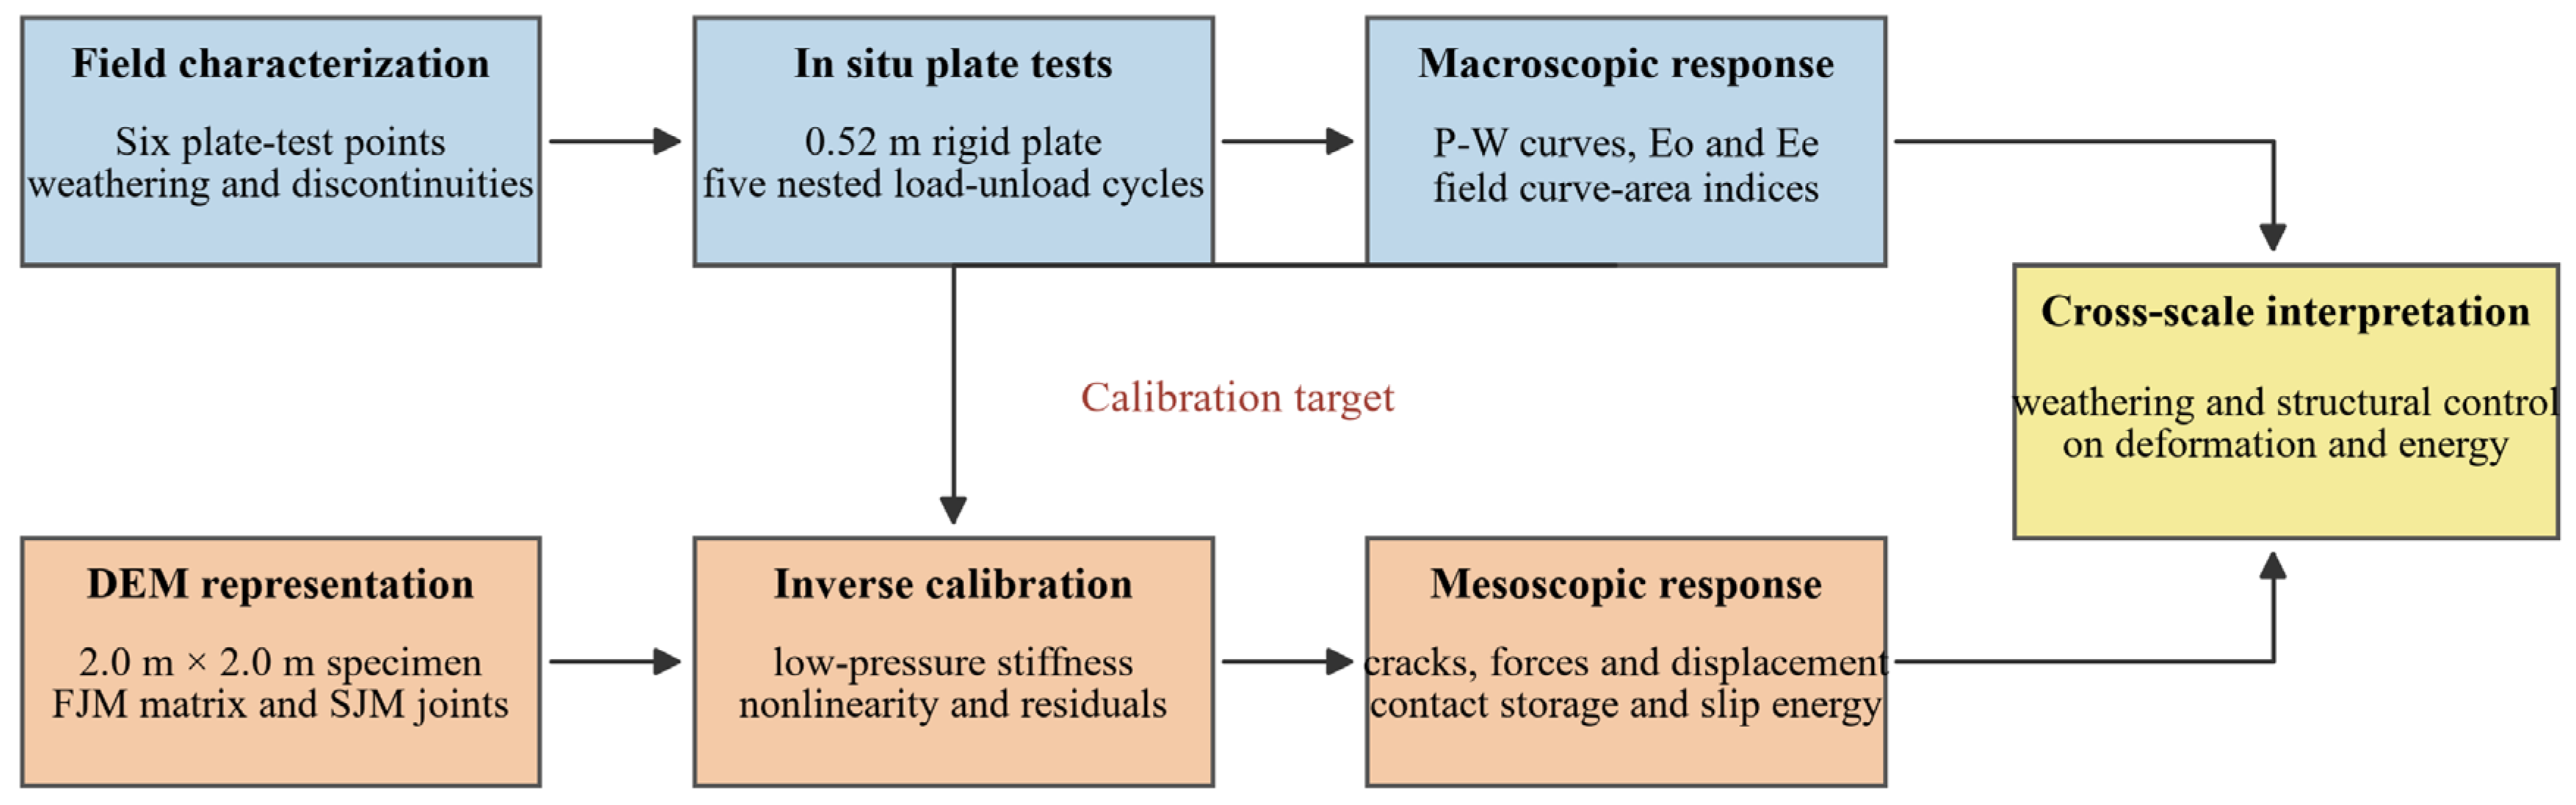
The research workflow contains two mutually constrained branches (Figure 3). The field branch provides geological classification, P–W curves, Eo, Ee, and macro-energy indices. The numerical branch converts representative geological conditions into flat-joint model (FJM) and smooth-joint model (SJM) contact networks and uses the measured loading path as the servo-control target. Low-pressure stiffness, medium-to-high pressure nonlinearity, and unloading residuals are calibrated sequentially. Crack growth, force transmission, displacement localization, and contact-scale energy are then compared with the field-scale response.
Figure 3.
Integrated field-test and DEM research framework.
2.4. PFC2D Model Construction and Boundary Conditions
A 2.0 m × 2.0 m unit-thickness specimen containing 2105 circular particles was generated in PFC2D 6.00.13 using random seed 20260717. Particle radii ranged from 0.018 to 0.027 m, initial porosity was 0.12, density was 2850 kg/m3, and local damping during loading was 0.20. The bottom and lateral boundaries were rigid, and the top boundary was a 0.52 m rigid strip plate. After seating at 0.10 MPa, a stress servo reproduced the 30 stabilized field nodes with a relative pressure tolerance of 0.5% and a low-pressure absolute tolerance of 0.002 MPa. The weakly weathered model was calibrated to the original mean E2-1/E2-2/E2-3 path, the slightly weathered model to the mean E4-1/E4-2/E4-3 path, and the fault model to E2-2. The first two are equivalent group representations rather than single-site replicas. For numerical sensitivity, the weakly weathered case was rerun with seeds 20260718 and 20260719, a coarser radius range of 0.020–0.030 m, and a 3.0 m × 3.0 m domain while retaining the calibrated contact parameters and loading protocol.
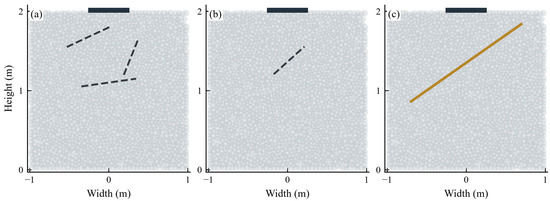
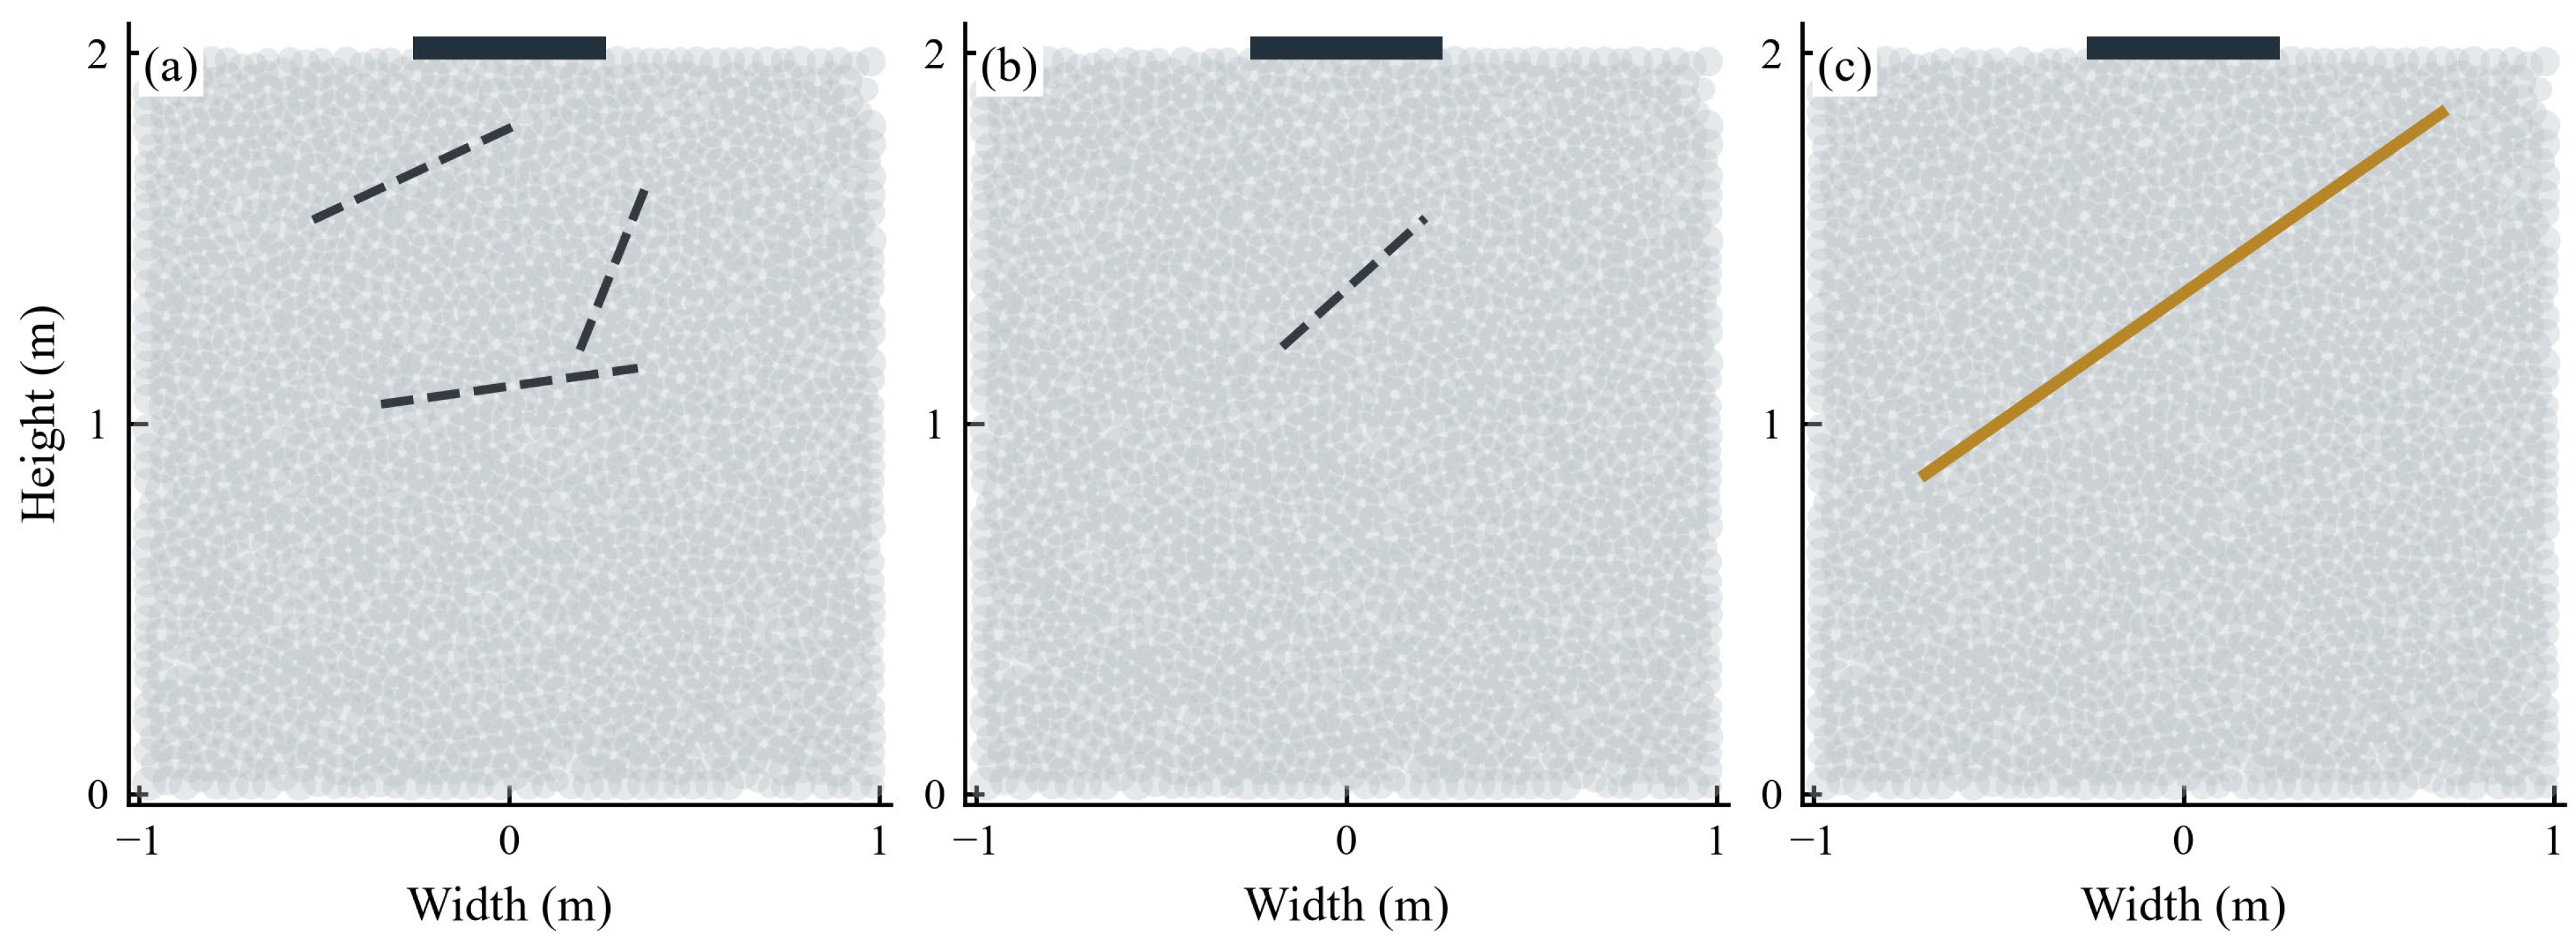
The field plate is circular and produces a three-dimensional stress bulb, whereas the PFC2D plate is an infinitely long strip under plane-strain, unit-thickness conditions. Pressure was calculated as wall force divided by 0.52 m × 1 m, and displacement was calibrated directly to plate movement; numerical work is therefore reported in J/m. The baseline width and depth are each about 3.85 plate diameters. The 3.0 m sensitivity model increased this distance to about 5.77 plate diameters. Because neither model reproduces radial stress decay or field confinement, and because the sensitivity variants were not re-calibrated, the calculations test numerical dependence rather than boundary independence. Absolute three-dimensional stress, crack volume, and total field energy are not inferred. Figure 4 shows the three numerical model geometries.
Figure 4.
PFC2D plate-loading models and representative discontinuity geometry. (a) Weakly weathered; (b) slightly weathered; and (c) E2-2 fault (35 degrees). Dashed dark lines indicate the conceptual pre-existing joints in panels (a,b), the solid gold line indicates the E2-2 fault in panel (c), and the thick black strip above each assembly represents the loading plate; grey circles are particles.
2.5. Contact Models, Calibration, and Monitoring Variables
Particle–particle contacts in the basalt matrix used the flat-joint model (FJM), and pre-existing discontinuities used the smooth-joint model (SJM) [21,22,23,24]. The common assembly settings, case-specific parameters, calibration targets, and geometric basis are detailed in Section 3.4. The approximately 35-degree E2-2 fault orientation is taken from the field log; its 1.70 m model length was selected to cross the numerical bearing influence zone and is not a measured trace length. The short joints in the group-average cases are conceptual equivalent structures introduced to reproduce nonlinear response and must not be interpreted as surveyed maps. FJM bond breakage was classified as tensile or shear cracking. Boundary work, contact strain energy, and cumulative slip energy were recorded; numerical damping was used only for quasi-static convergence and was not treated as physical dissipation.
3. Test Results and Discussion
3.1. Analysis of Rock-Mass Deformation Characteristics
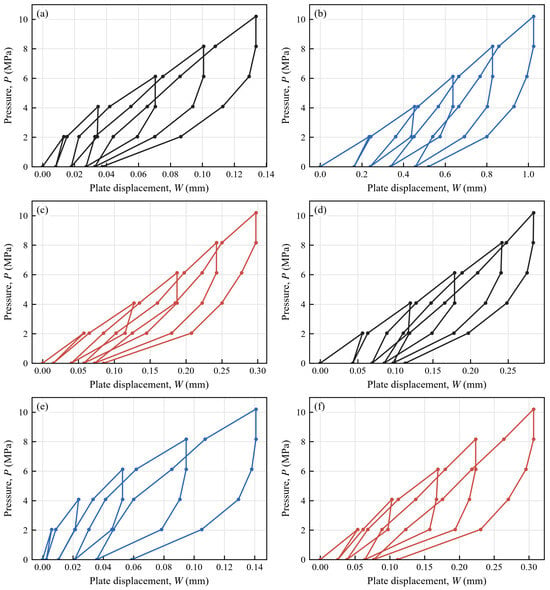
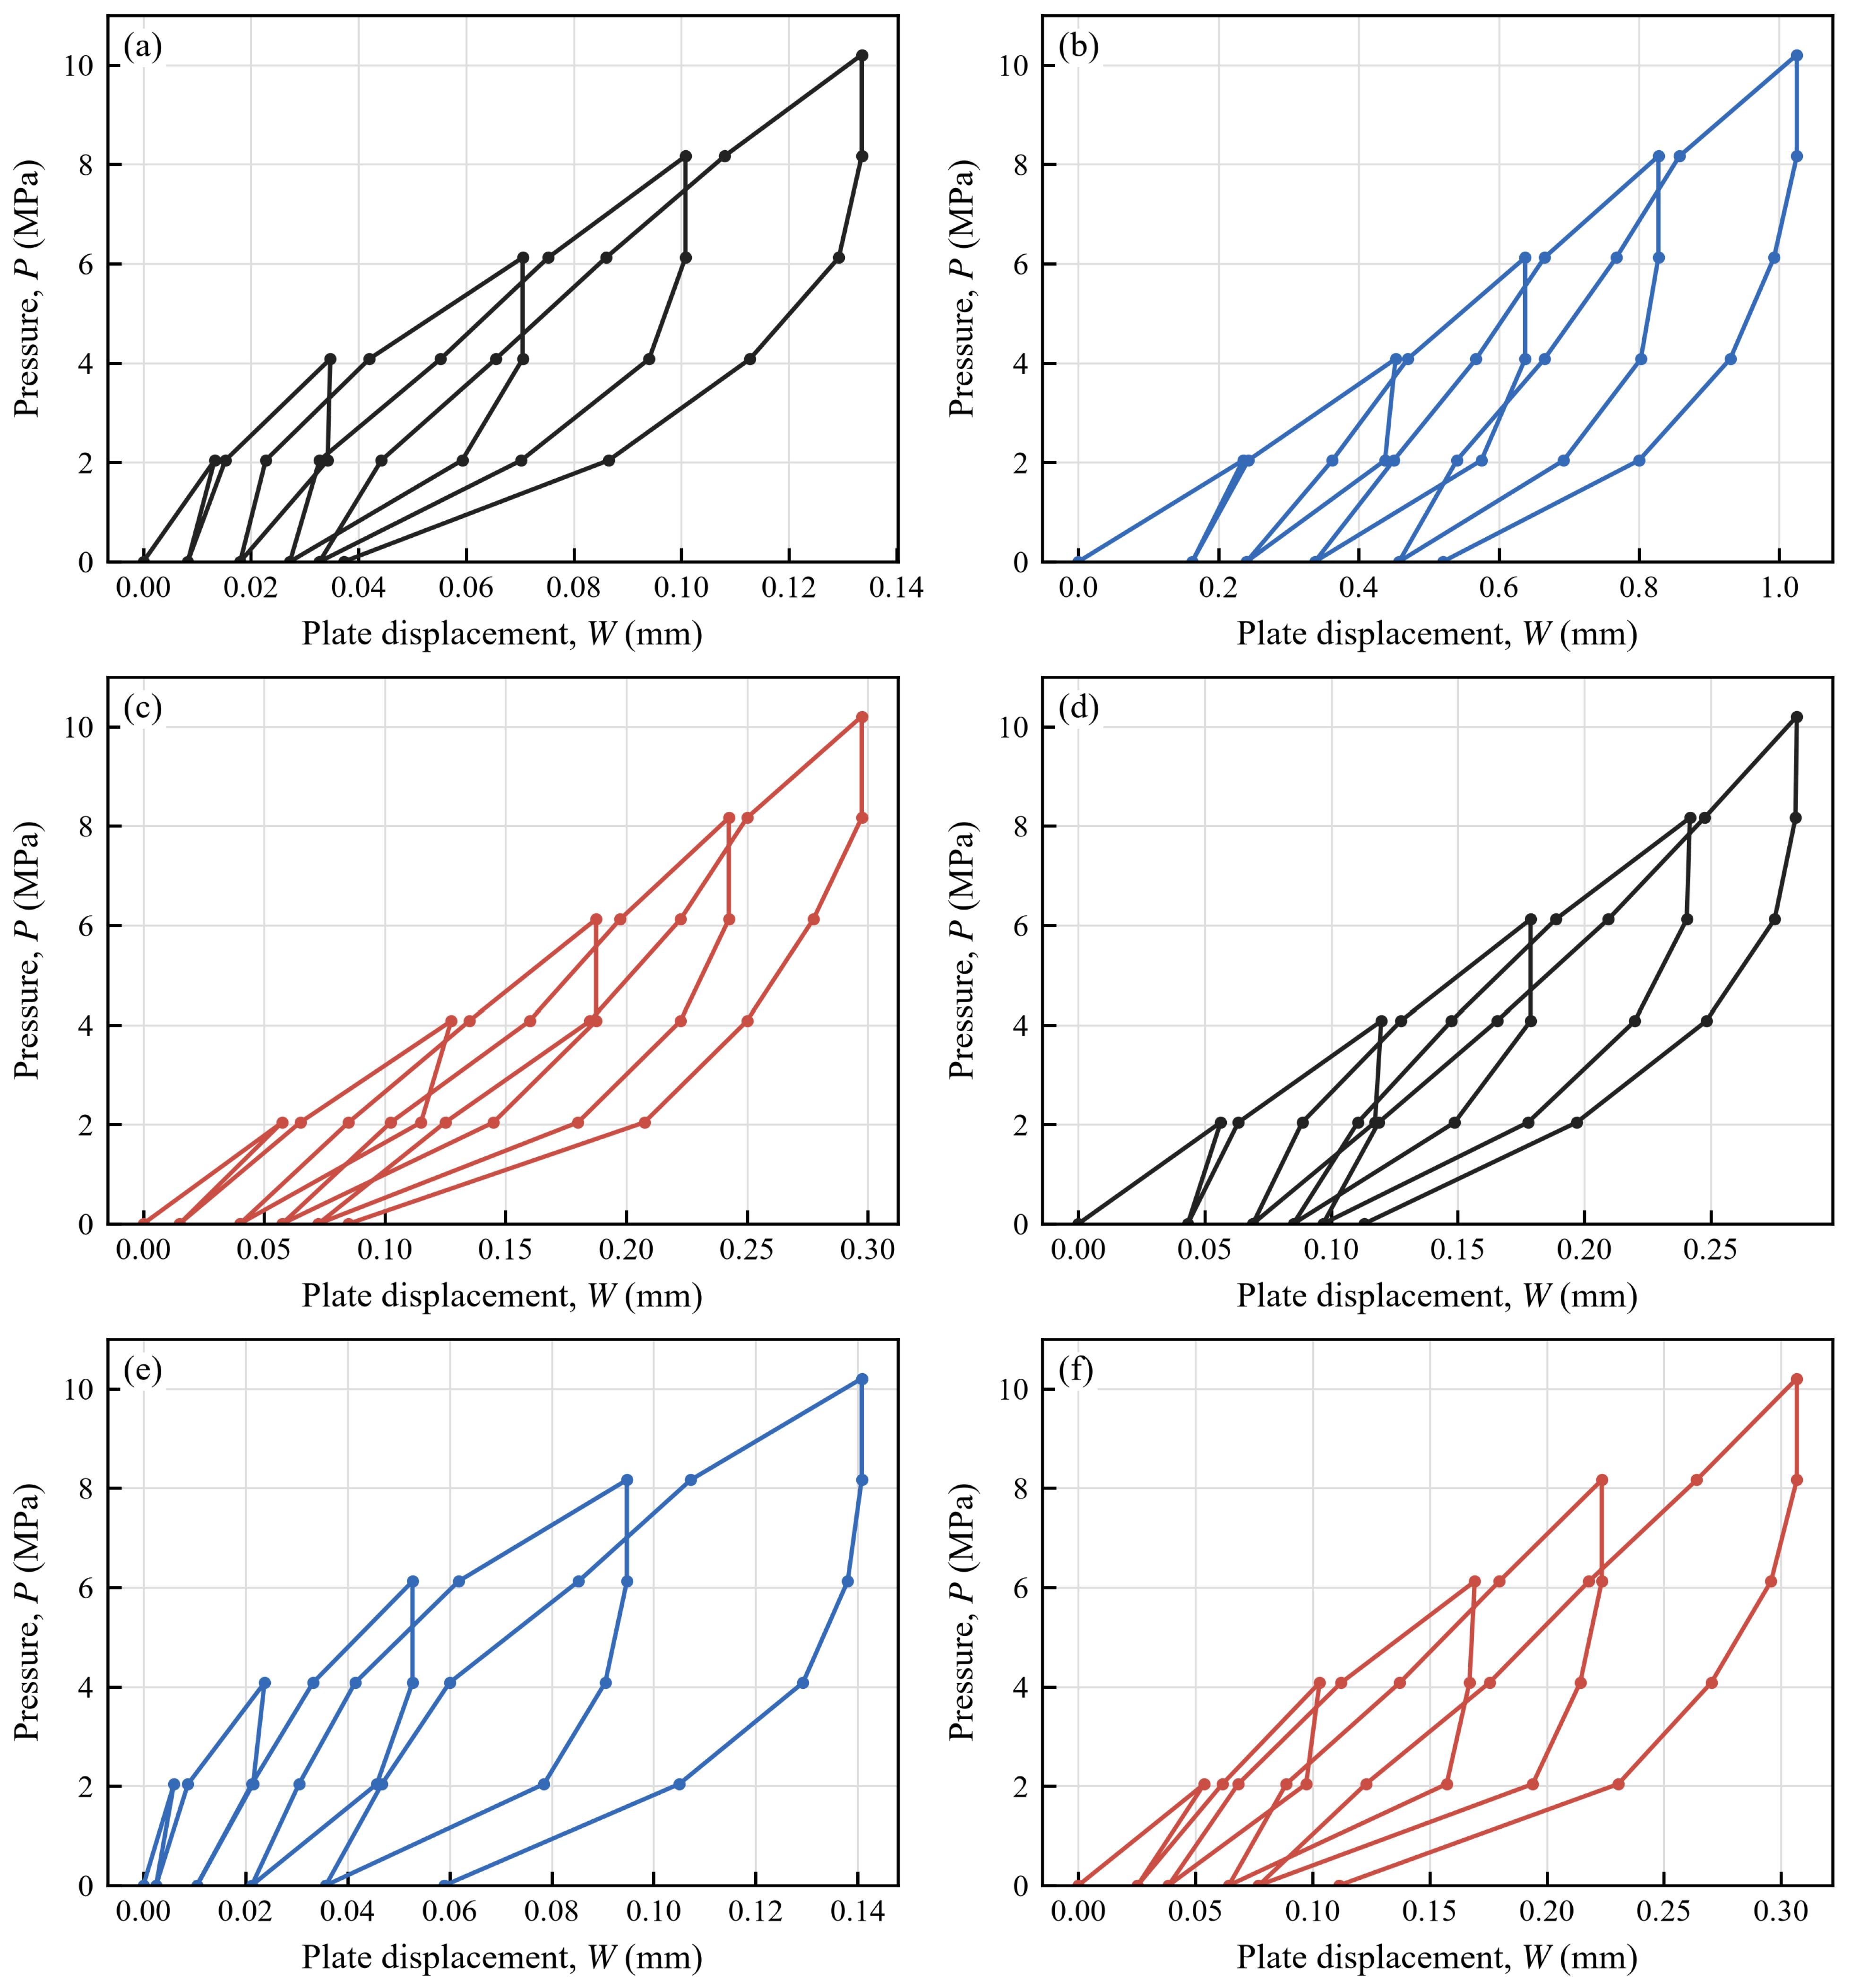
The pressure–displacement (P–W) data derived from the experiments are displayed in Figure 5. As depicted in this illustration, the loading–unloading profiles across various cycles for a single test location demonstrate comparable forms, while residual strain is detected. Nevertheless, the stress–displacement diagrams differ between distinct test positions, reflecting diverse features.
Figure 5.
Pressure–displacement (P–W) paths. (a) E2-1; (b) E2-2; (c) E2-3; (d) E4-1; (e) E4-2; and (f) E4-3.
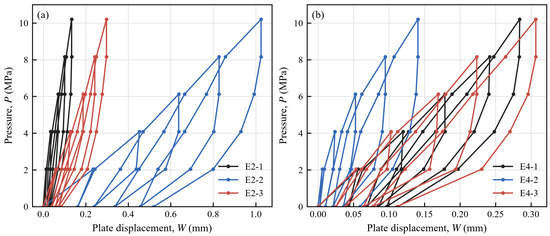
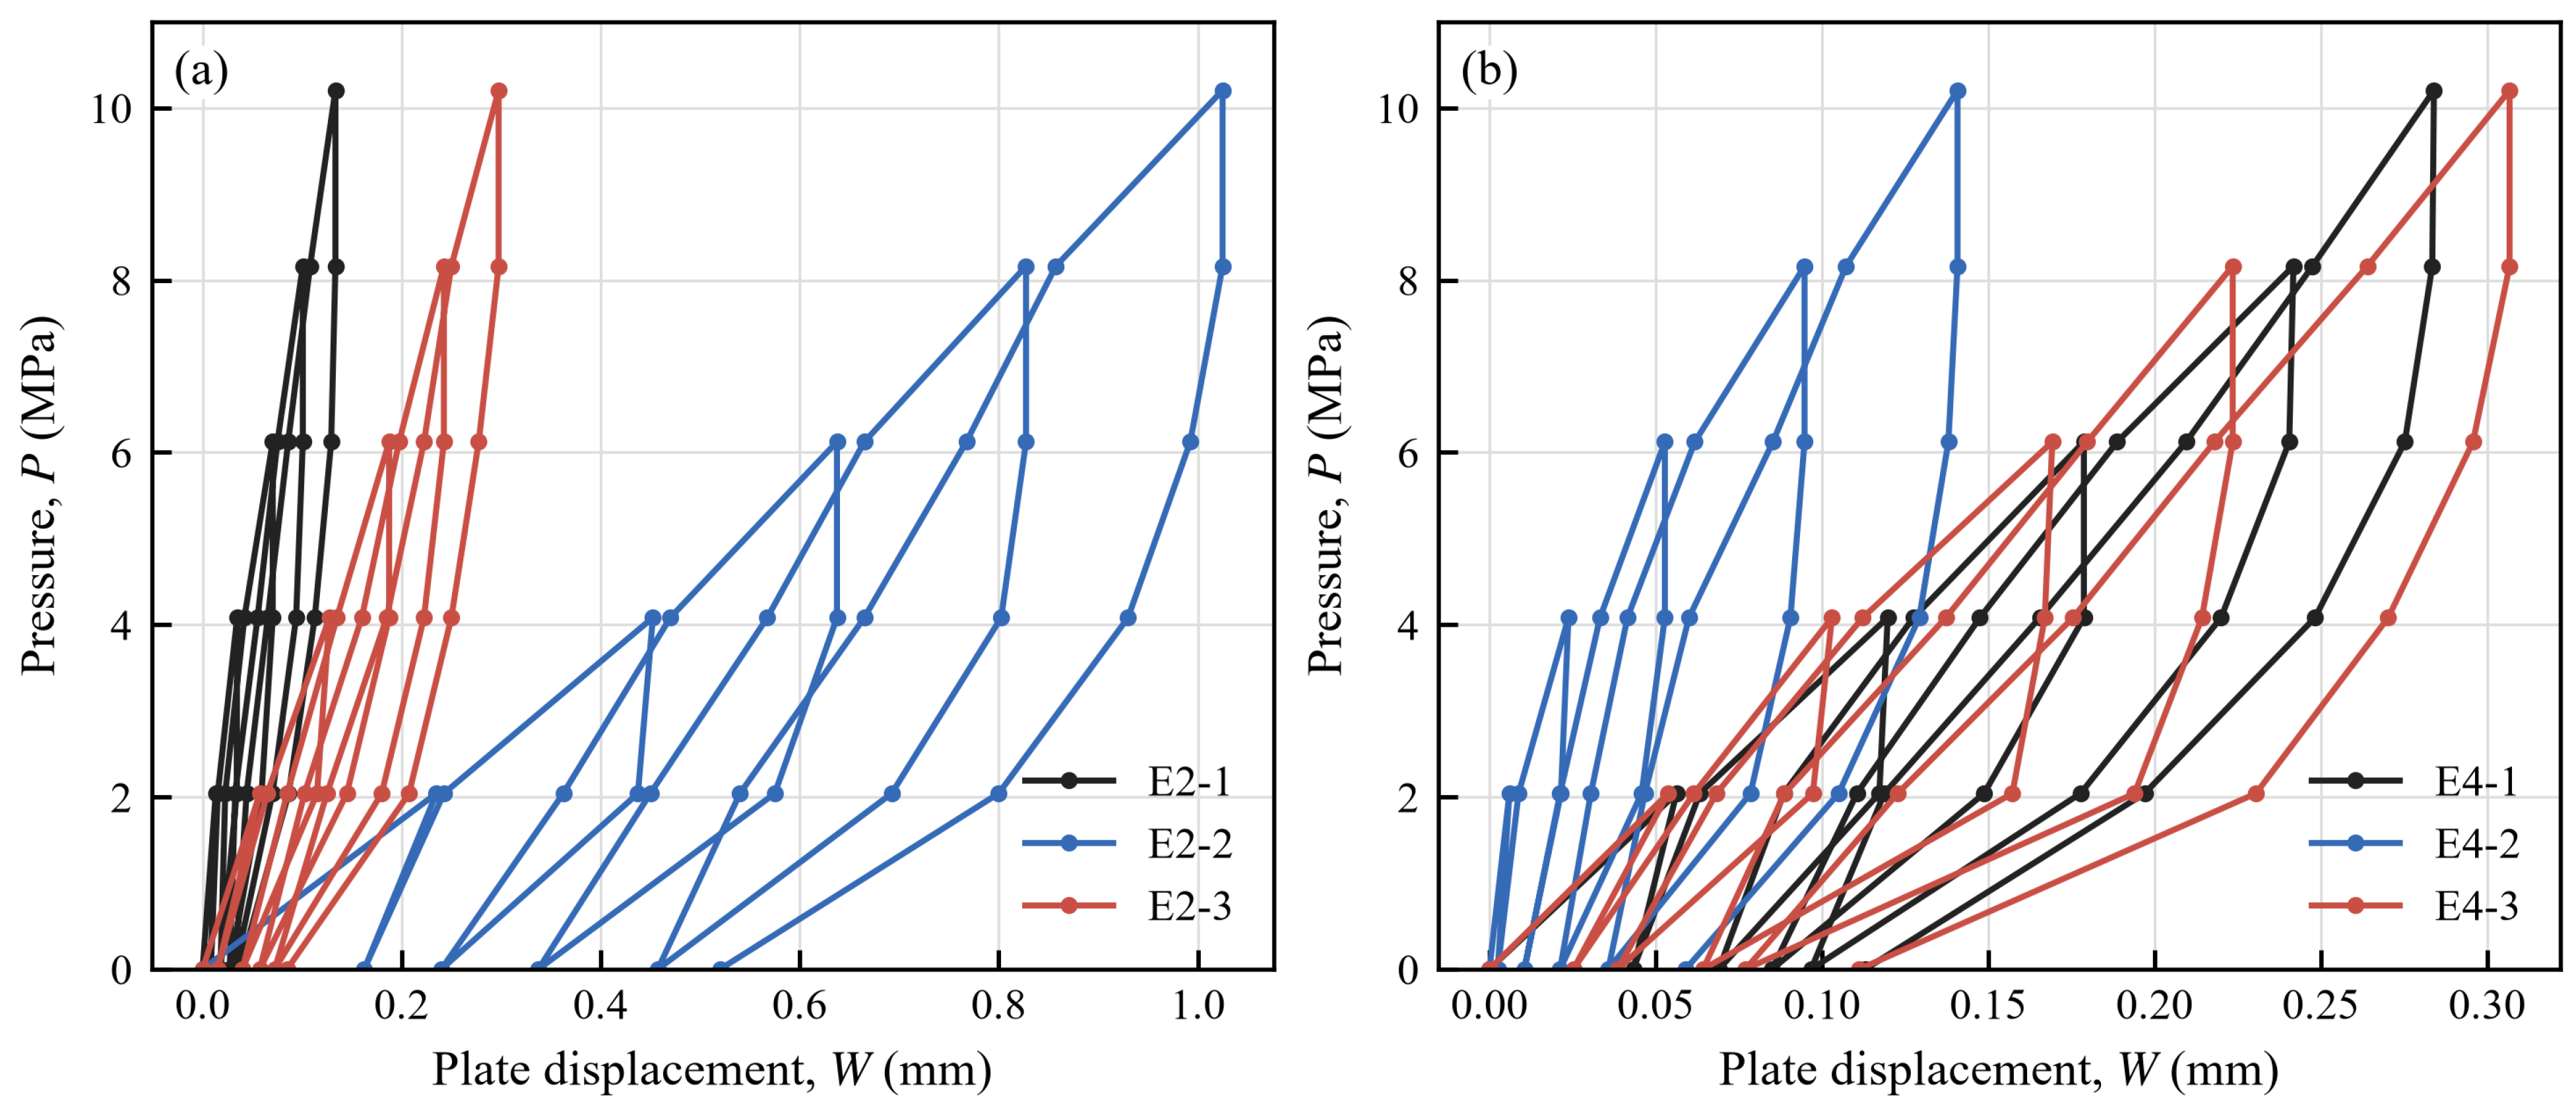
Rock-mass P–W curves are commonly described as linear, concave, convex, or polyline forms, but a curve shape is not a unique geological diagnostic. The predominantly linear responses at E2-2, E2-3, and E4-1 indicate an approximately stable secant stiffness over the measured range; they do not demonstrate the absence of faults or major discontinuities. E2-2 is the clearest counterexample because the field log records open joints and a fault at approximately 35 degrees despite its near-linear boundary response. The concave responses at E4-2 and E4-3 are consistent with progressive stiffness reduction, whereas the polyline response at E2-1 may reflect initial closure, stress-history effects, or structural strength. Geological logs, modulus values, residual displacement, and curve shape must therefore be interpreted together. Table 2 summarizes these curve types and their possible causes. Figure 6 compares the pressure–displacement paths within each weathering group.
Table 2.
Types, characteristics, and causes of P–W curves.
Figure 6.
Comparison of pressure–displacement paths. (a) E2-1 to E2-3 and (b) E4-1 to E4-3.
3.2. Analysis of Rock-Mass Deformation Modulus (Eo) and Elastic Modulus (Ee)
In the rigid bearing plate method, load is applied to the rock-mass surface through a rigid plate, and the resulting deformation is measured. According to the Code for Rock Tests of Hydroelectric and Water Conservancy Engineering (DL/T 5368-2007) [27], the elastic modulus or deformation modulus of the rock mass is calculated using Equation (1). For the same test point, the deformation modulus is calculated based on the total deformation, including both recoverable and irrecoverable deformation. In contrast, the elastic modulus is calculated considering only the recoverable deformation. Therefore, the elastic modulus is greater than the deformation modulus. The more intact the rock mass, the closer the values of the deformation modulus and elastic modulus; conversely, the poorer the integrity, the greater the difference between the two values. The ratio Ee/Eo can be used to evaluate the integrity and deformation characteristics of the rock mass. Generally, Ee/Eo = 1–1.33 indicates an elastic medium (relatively intact), Ee/Eo = 1.33–2 indicates a quasi-elastic medium (relatively complete), and Ee/Eo > 2 indicates poor integrity. The test results are presented in Table 3 and Figure 7.
Table 3.
Results of in situ rock-mass deformation tests using the rigid bearing plate method.
Figure 7.
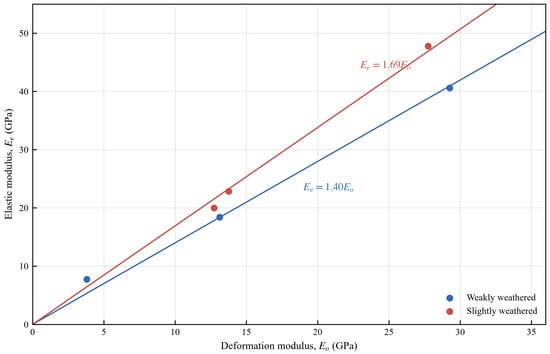
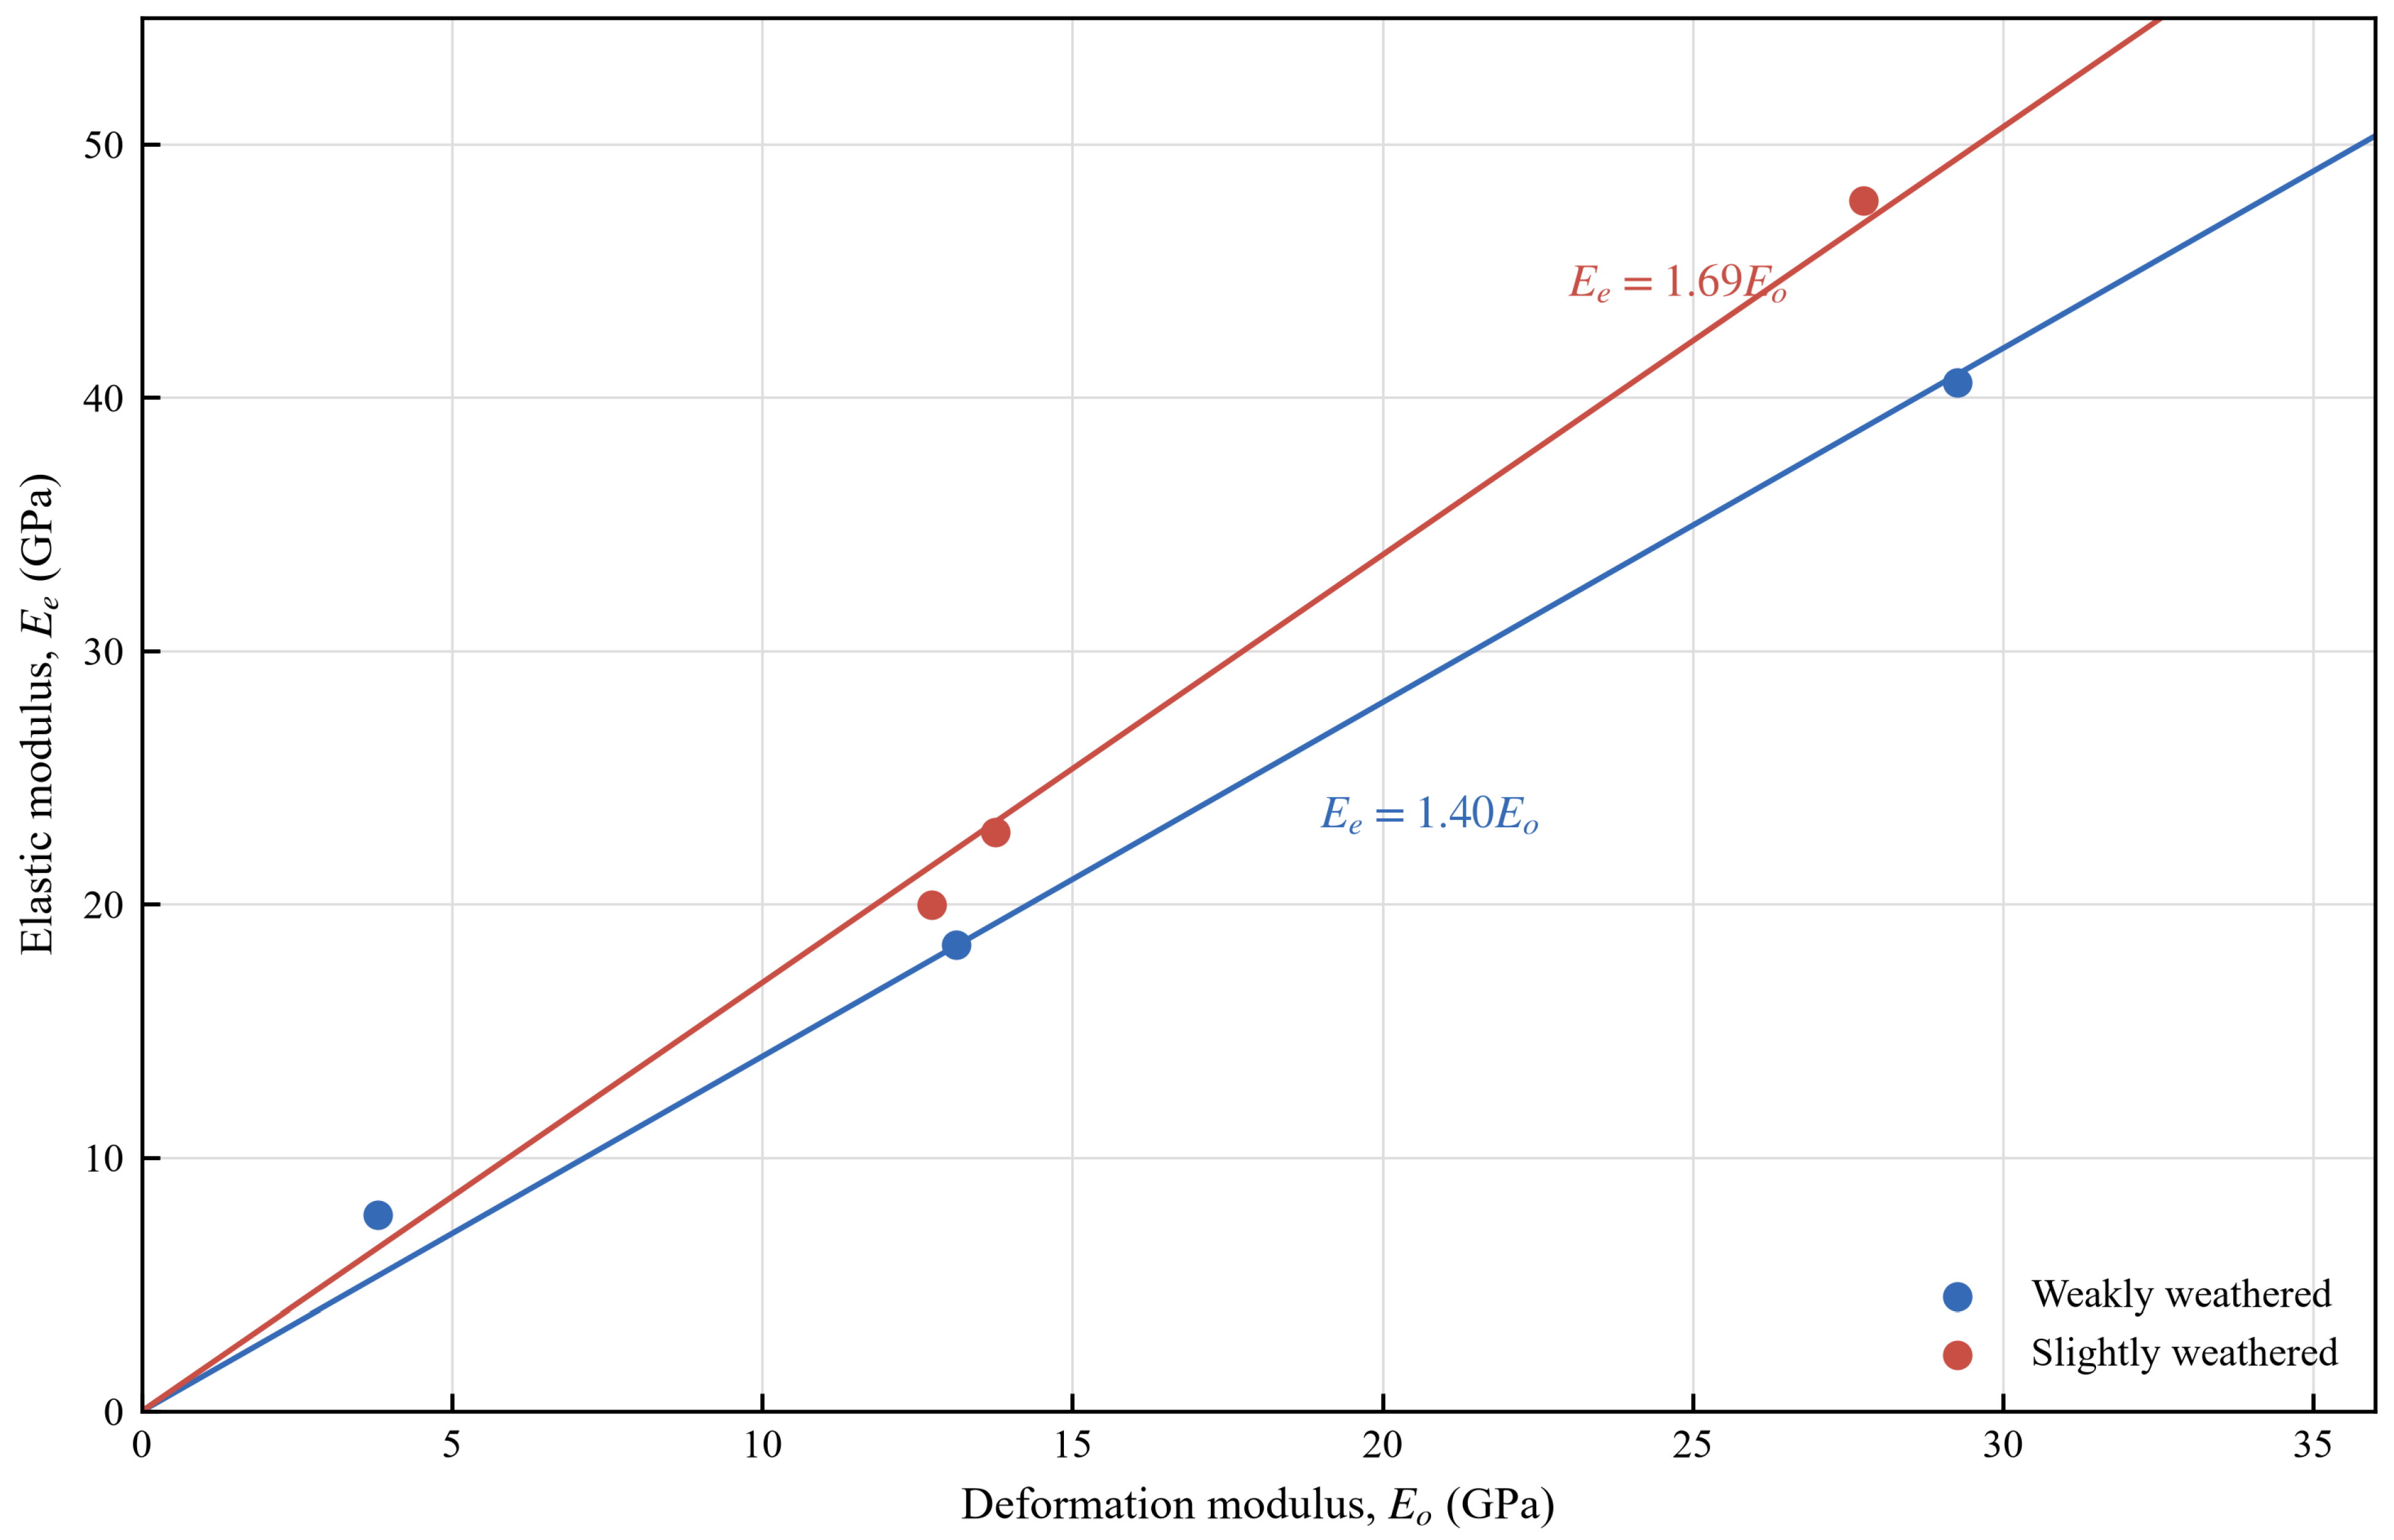
Origin-constrained descriptive relationships between deformation modulus Eo and elastic modulus Ee, based on three observations per weathering group.
For the rigid circular plate, Equation (1) follows the formulation used in basalt bearing-plate tests by Zhu et al. [28], together with the test-code procedure [27].
Here, E denotes deformation modulus or elastic modulus; P is plate pressure, W is the corresponding total or recoverable displacement, D is the 0.52 m plate diameter, and μ is Poisson’s ratio. The project sheets use μ = 0.25, but no point-specific measurements were supplied. Because Equation (1) scales with (1 − μ2), varying μ from 0.20 to 0.30 changes the moduli by +2.4% to −2.9% relative to μ = 0.25 and does not change the case ranking. In Table 3, the lower-bound mean is the arithmetic mean of the two lowest values among the three points in each weathering group. It is a descriptive engineering index, not a statistical confidence bound. Table 4 summarizes the sensitivity of the weathering-group means to excluding E2-2.
Table 4.
Sensitivity of weathering-group mean moduli to the E2-2 fault point.
Table 5 confirms that the moduli are cycle-dependent. E2-1 and E4-2 soften as the pressure range expands, E2-2 remains persistently compliant, and E2-3 is comparatively stable. The large P1 elastic moduli arise because a very small recovered displacement appears in the denominator; the estimates are consequently sensitive to unresolved reading and system-compliance uncertainty. Gauge manufacturer, nominal resolution, and calibration uncertainty were not retained in the supplied records, so no instrument-resolution correction is claimed. P5 values are useful summaries, but nonlinear interpretation requires the full evolution.
Table 5.
Cycle-dependent deformation and elastic moduli calculated from stabilized endpoints.
Figure 7 and Table 3 show substantial point-to-point variability. Origin-constrained descriptive fits give Ee = 1.40Eo for the weakly weathered group and Ee = 1.69Eo for the slightly weathered group. Each fit is based on only three observations and is not a general statistical relationship; no inferential significance is assigned and extrapolation beyond these test points is not justified. E2-2 has the lowest Eo and an Ee/Eo ratio of 2.03, consistent with reduced integrity associated with its approximately 35-degree fault and open joints. The measured differences reflect weathering, local structure, lithology, and loading direction rather than weathering alone.
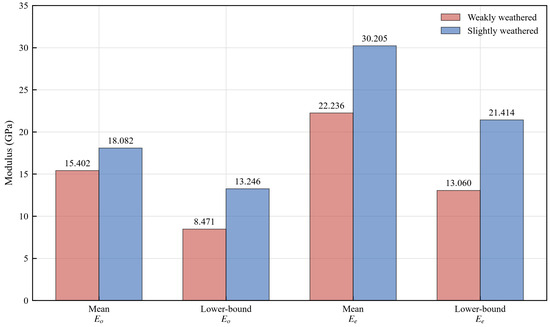
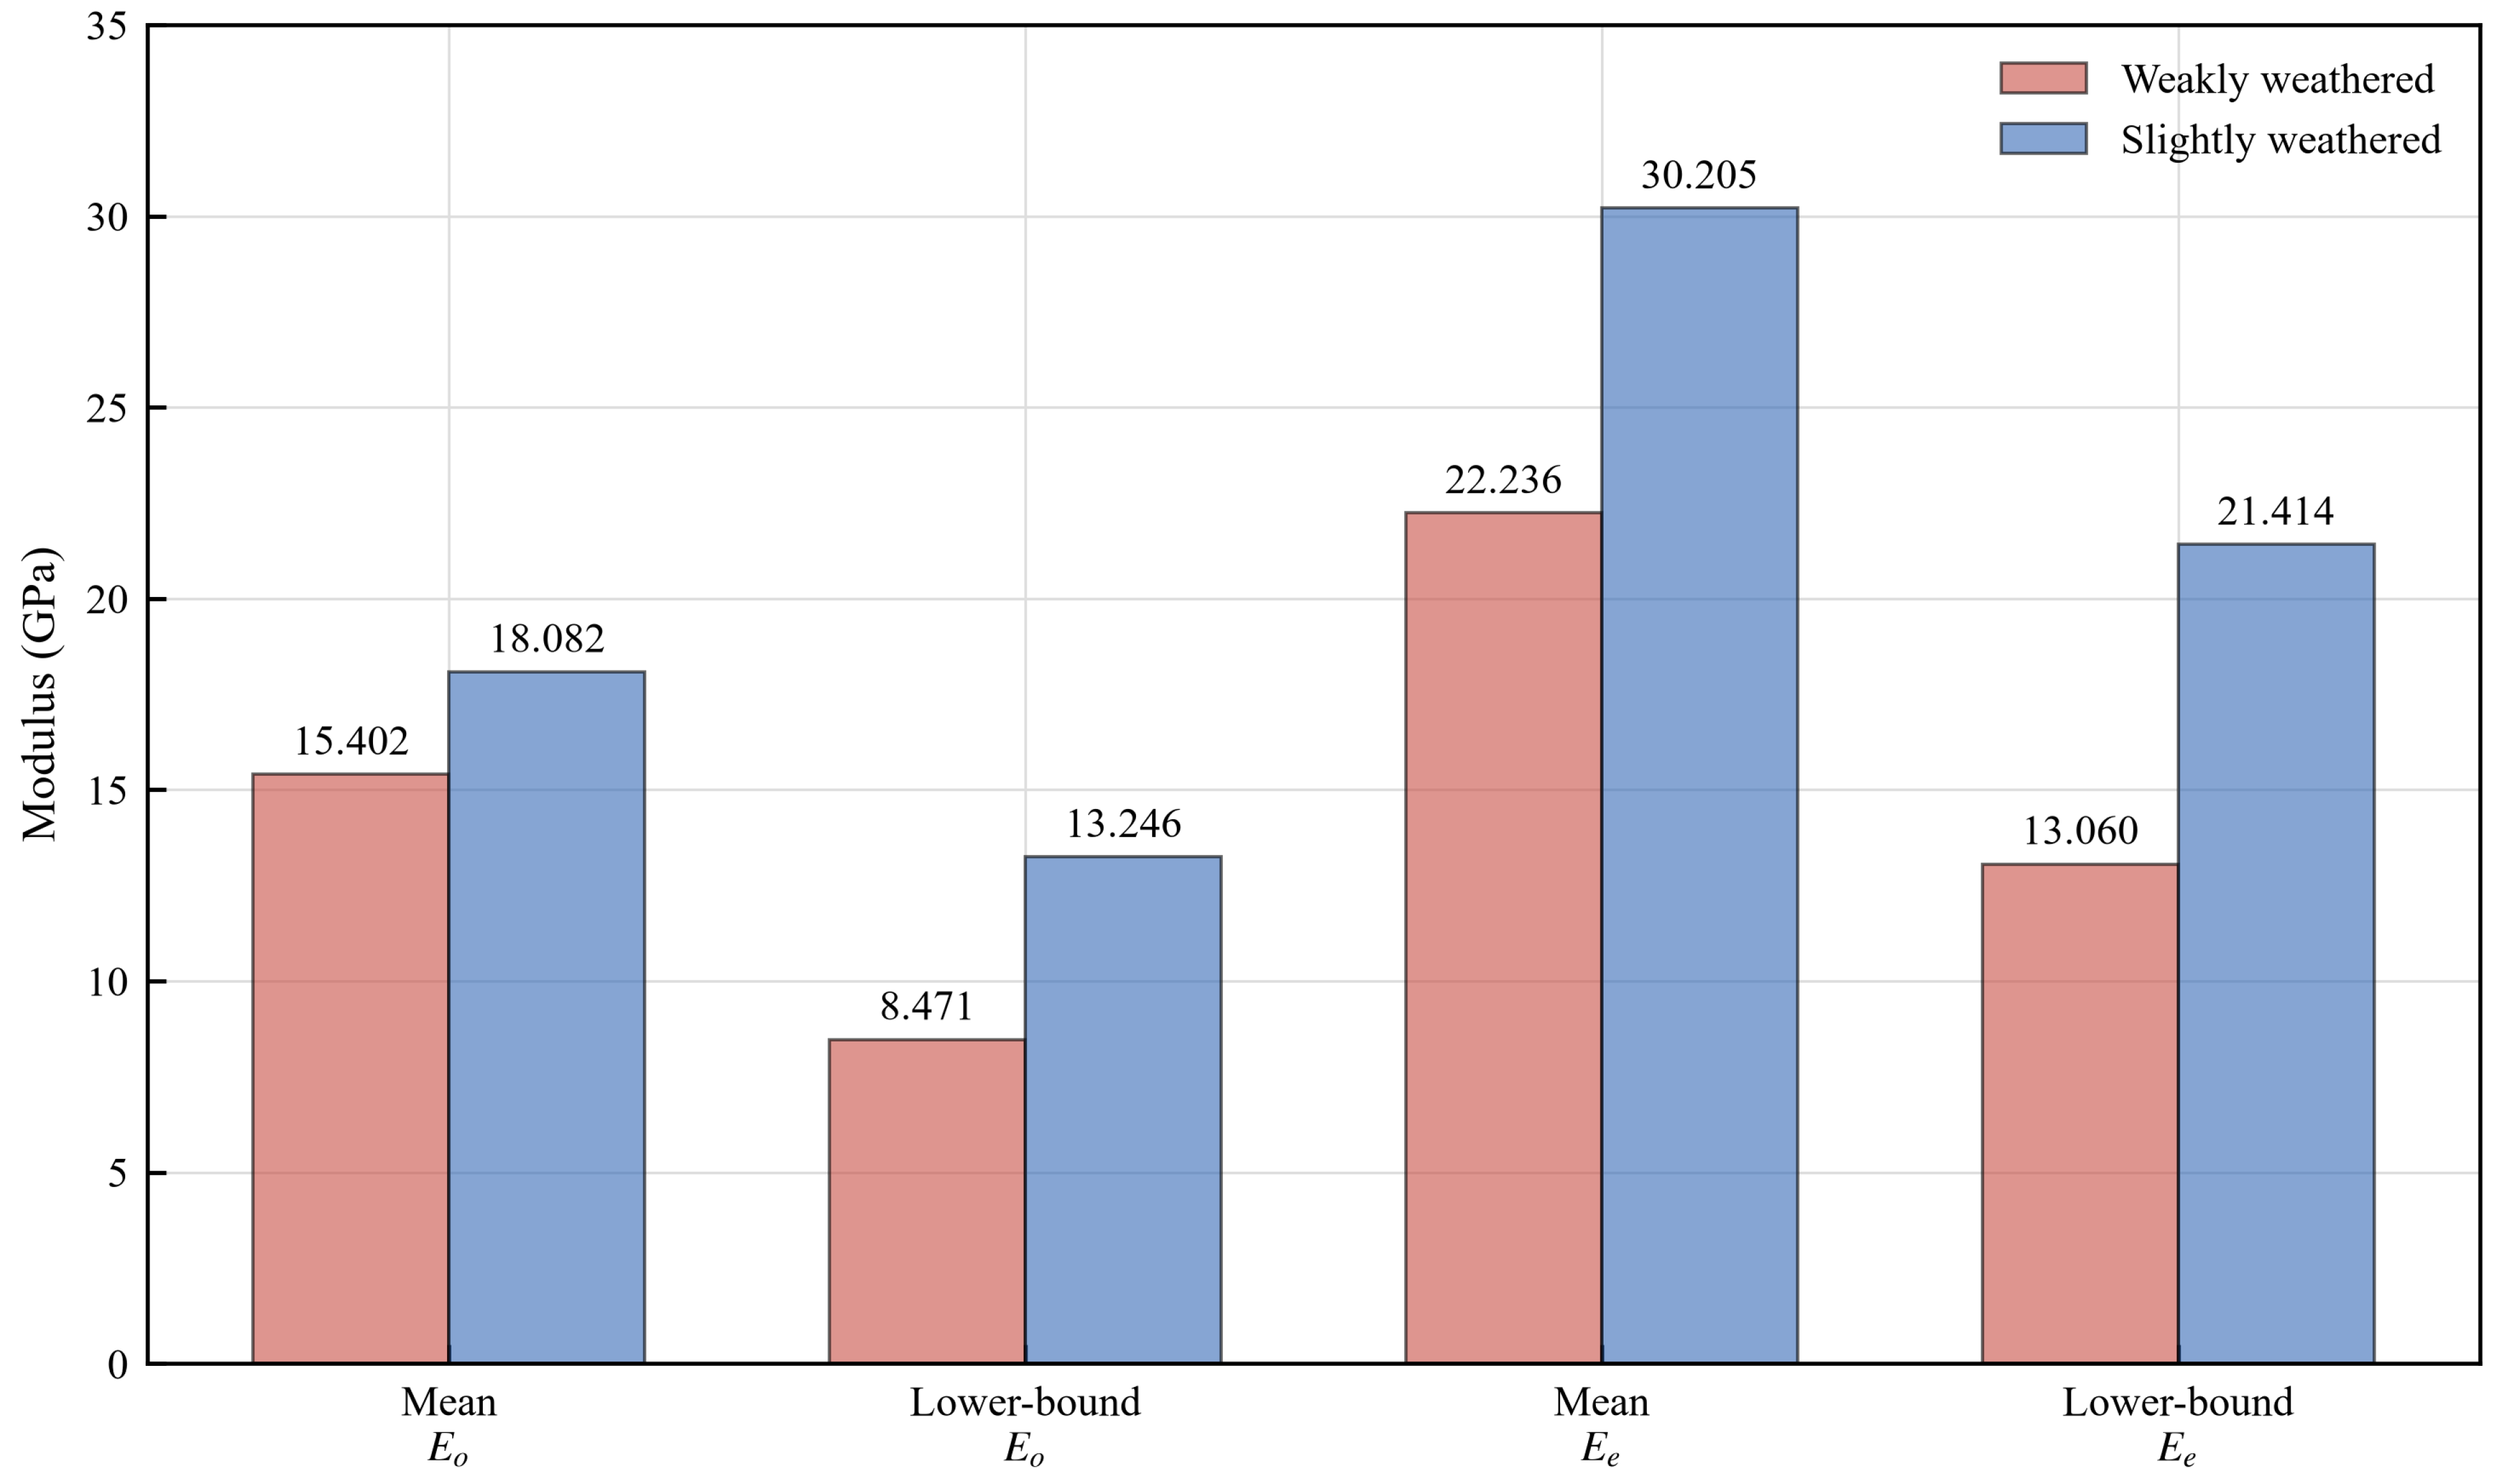
Using all three points in each weathering class gives mean Eo/Ee values of 15.402/22.236 GPa for weakly weathered basalt and 18.082/30.205 GPa for slightly weathered basalt. However, excluding the fault-controlled E2-2 point increases the weakly weathered means to 21.197/29.486 GPa. Under this sensitivity case, weakly weathered Eo is higher than the slightly weathered group mean and Ee is similar. The available six tests therefore do not isolate a unique weathering effect. The robust conclusion is that local discontinuity condition is at least as important as weathering class, with E2-2 producing the clearest structural reduction in stiffness. The weathering-group comparison should be treated as descriptive rather than causal. Figure 8 compares the arithmetic and lower-bound mean moduli for the two weathering groups.
Figure 8.
Arithmetic and lower-bound means of deformation modulus Eo and elastic modulus Ee for the two weathering groups. The lower-bound mean is the mean of the two lowest observations in each three-point group.
3.3. Analysis of Energy Evolution Characteristics
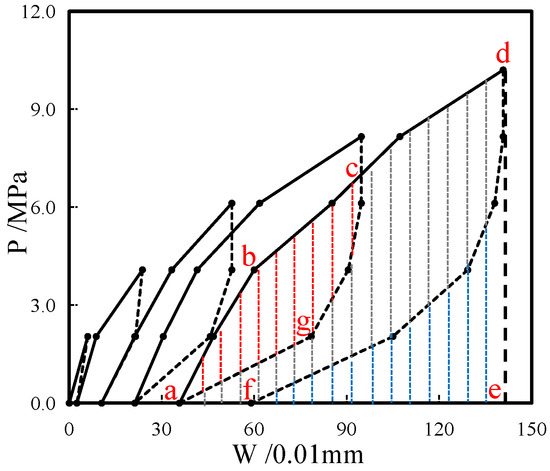
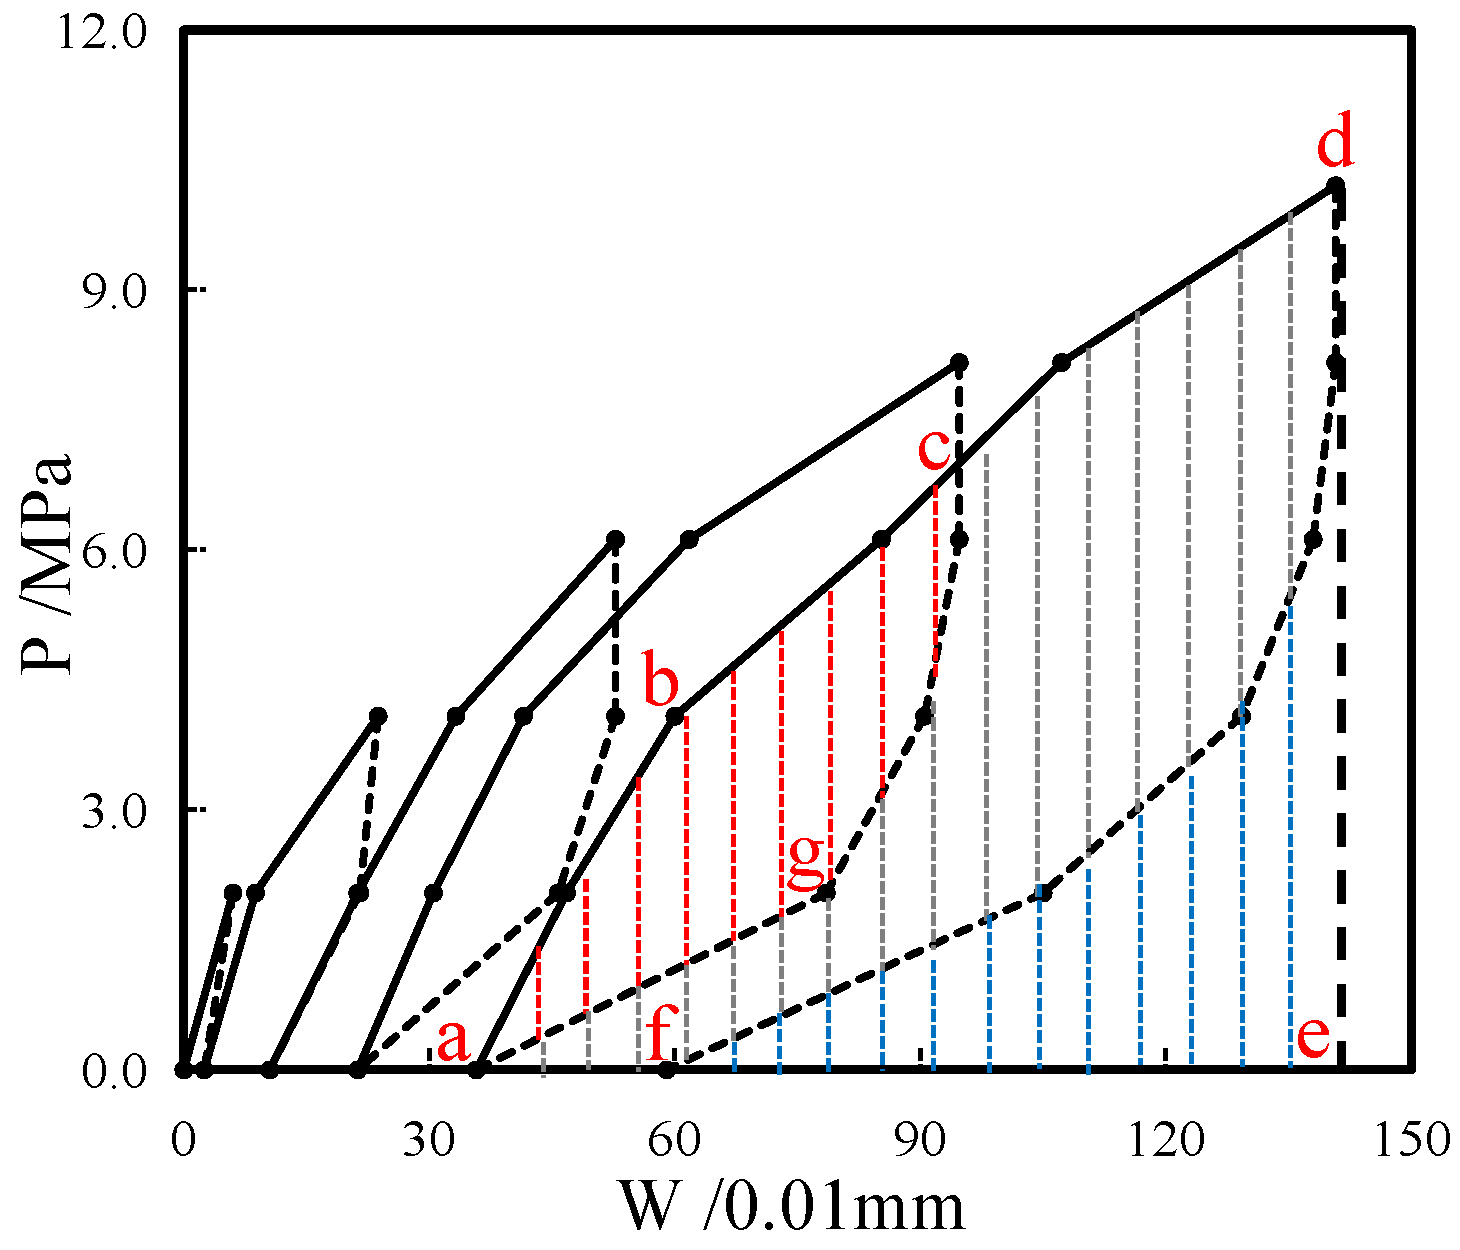
Loading and unloading curve areas provide a basis for energy interpretation in cyclic rock tests [29]. The loading and unloading sums in Equation (2) apply the trapezoidal quadrature rule [30] to consecutive pressure–displacement segments. The accumulated preceding-cycle and residual-area terms are bookkeeping definitions adopted in this study for the nested loading path, rather than independently established constitutive energy laws.
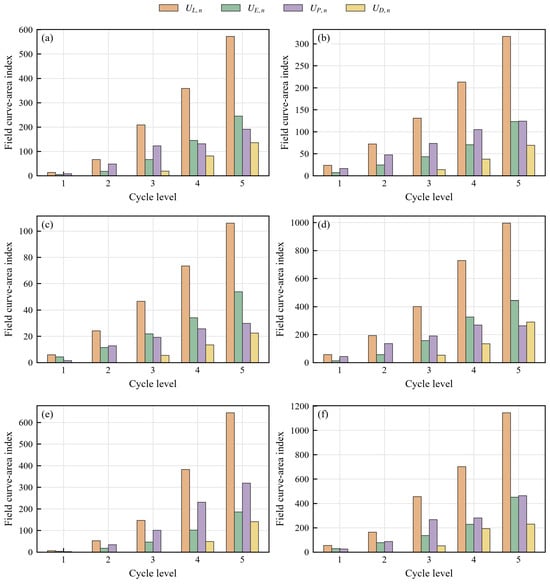
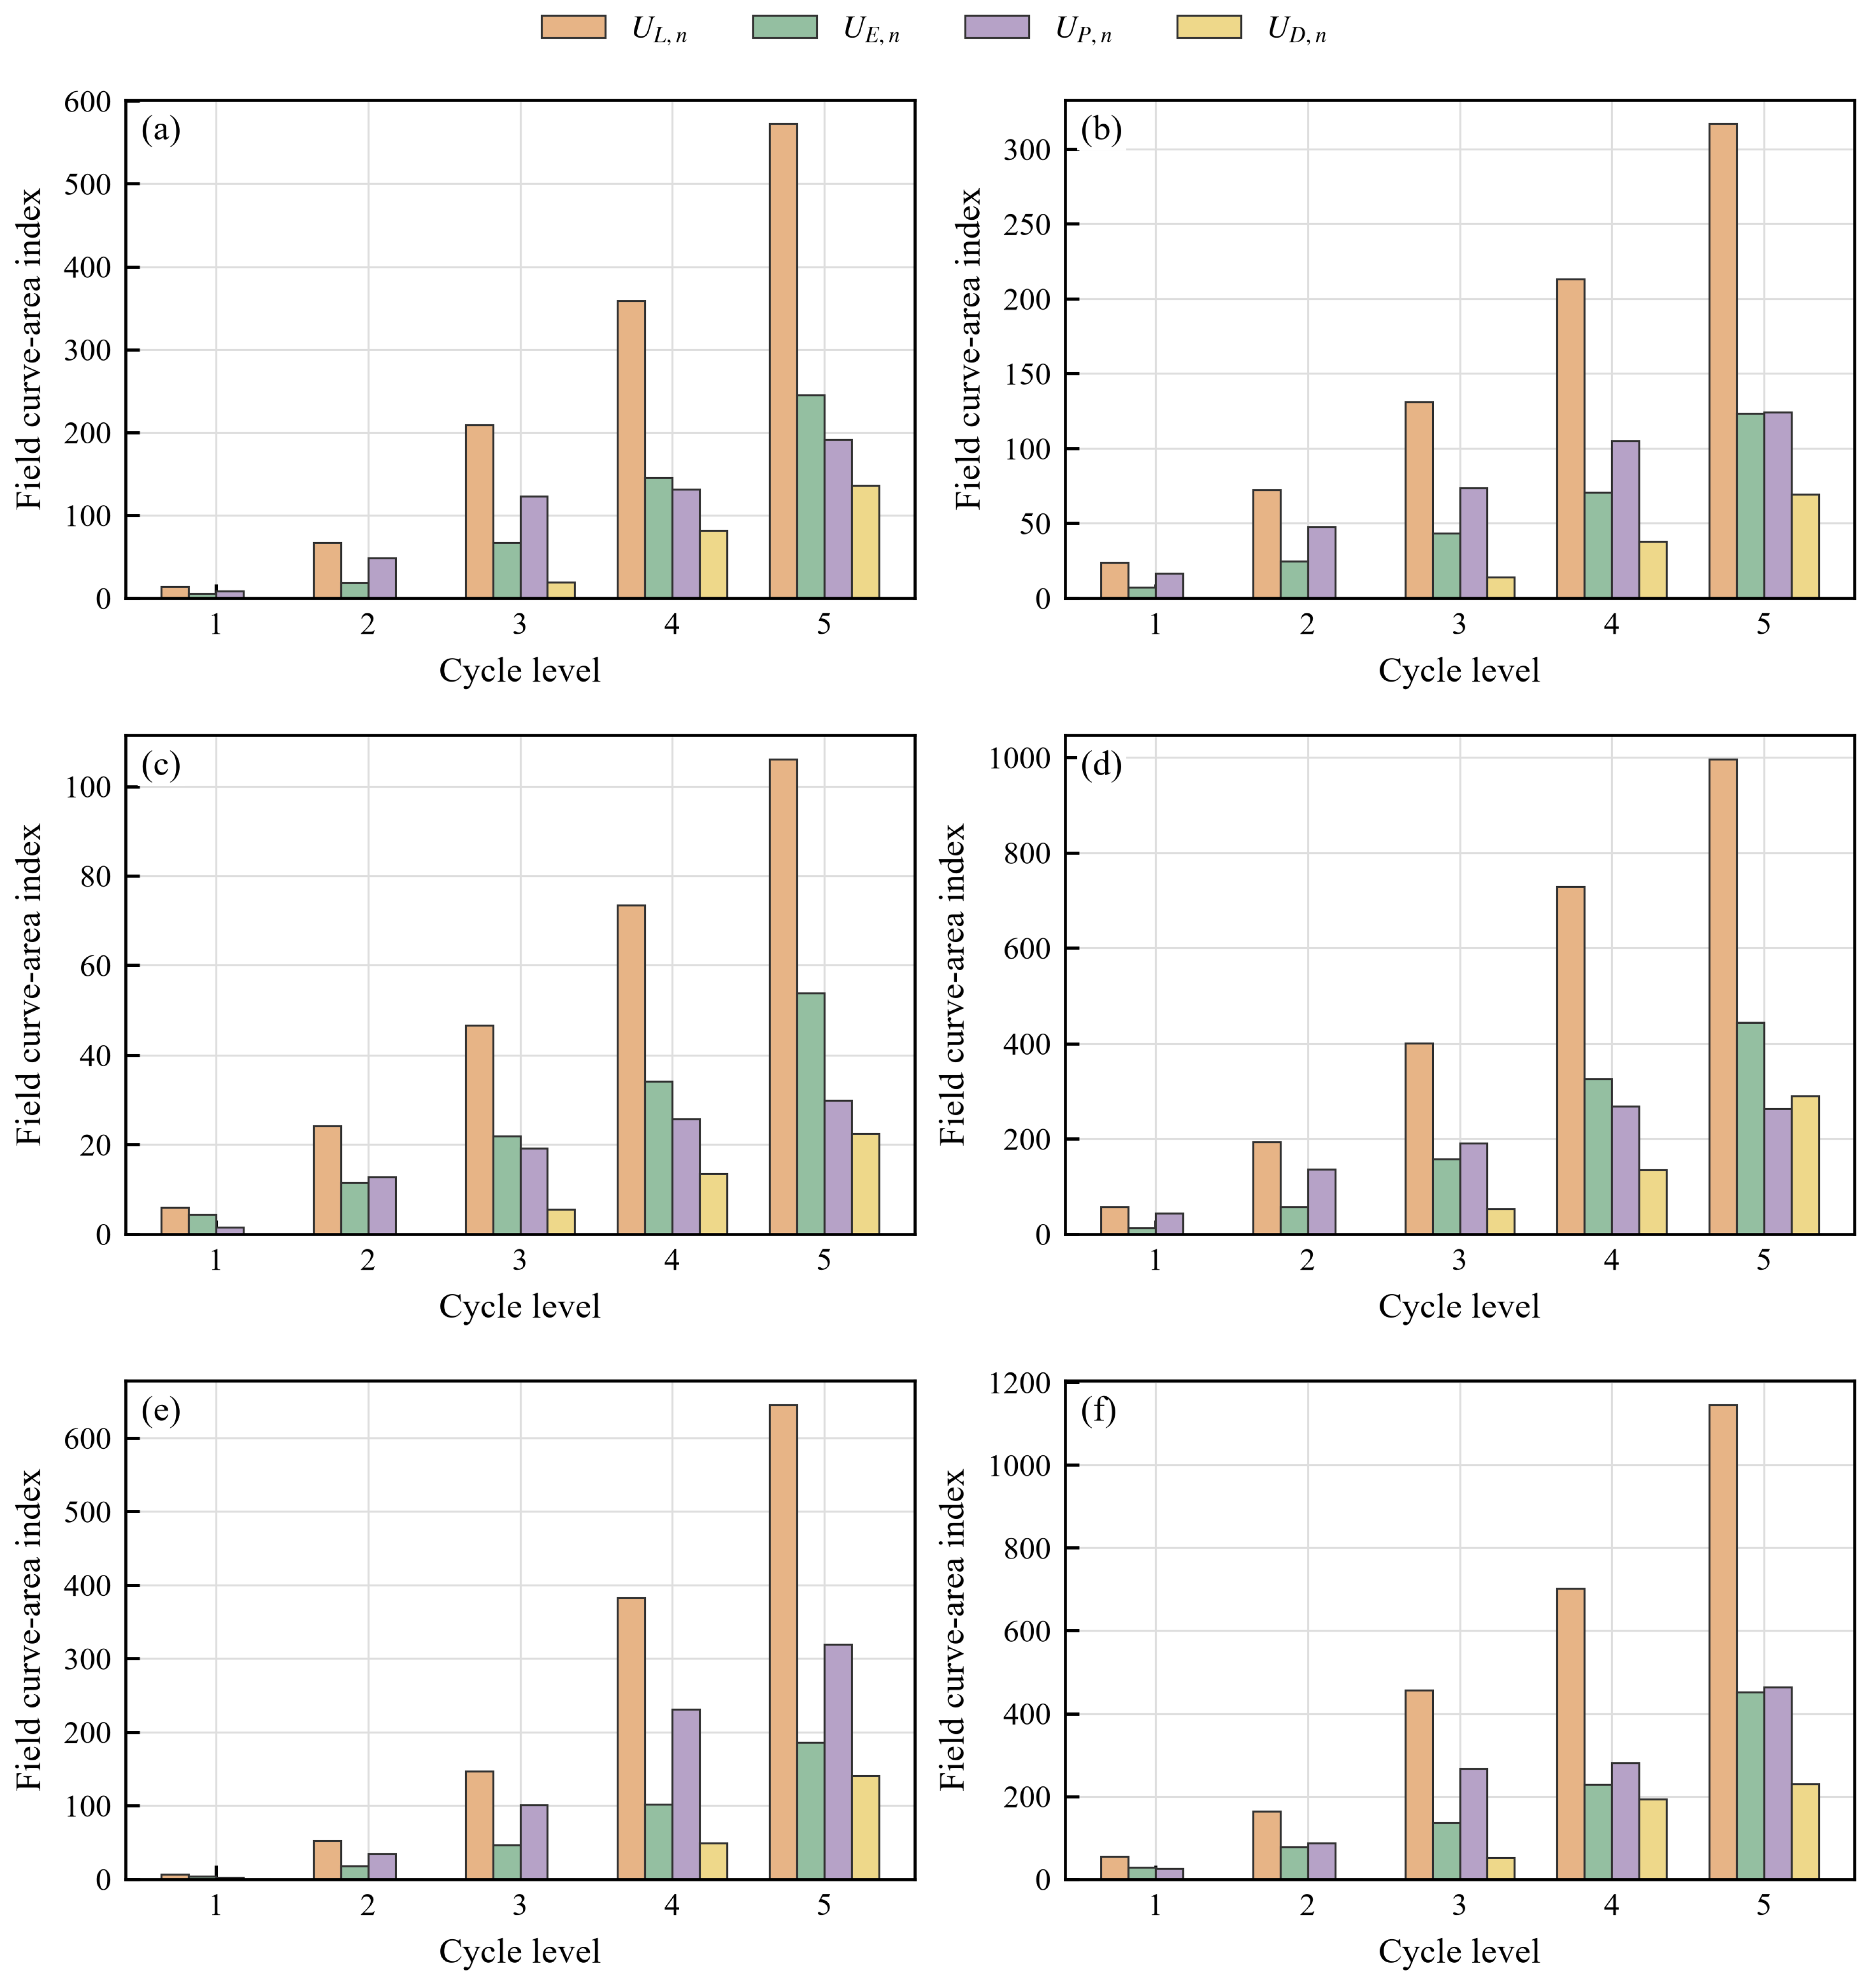
For each cycle, the loading and unloading branches were integrated between consecutive stabilized P−W nodes using the trapezoidal rule. With pressure P in Pa, displacement W in m, and equivalent strip width b = 0.52 m, multiplication by b gives work per unit out-of-plane thickness in J/m. UL,n is the loading work to the nth peak, UE,n is the absolute unloading-branch work recoverable from that peak, UD,n is the accumulated closed-loop hysteresis work from completed preceding cycles, and UP,n is the residual area obtained from UL,n − UE,n − UD,n. Because complete time histories and apparatus-compliance calibration are unavailable, UD,n and UP,n are operational curve-area indices rather than unique thermodynamic partitions of rock-mass dissipation.
Equation (2) defines four non-overlapping geometric contributions for the nested cycles. The subscript i denotes consecutive loading nodes and j denotes consecutive unloading nodes. UE,n represents recoverable boundary work. UD,n represents accumulated apparent hysteresis and may include rock-mass friction and damage, mortar-layer deformation, residual system compliance, and time-dependent closure. UP,n is the remaining irreversible envelope-area index after subtraction of UE,n and UD,n; it is not interpreted as an independently measured plastic strain energy. In PFC2D, the reported terms are defined separately: net boundary work is the algebraic external input, contact strain energy is recoverable contact storage, and slip energy is cumulative frictional dissipation. The numerical energy definitions follow the PFC 6.0 energy-tracking formulation [31] and the energy partitions of its flat-joint [32] and smooth-joint [33] contact models. Figure 9 illustrates the geometric construction of the nested-cycle curve areas.
Figure 9.
Geometric definition of field curve-area energy indices. Letters a–g identify construction points on successive curve branches and their displacement-axis projections. The black curves trace loading–unloading paths and their outer envelope; the colored hatching illustrates the curve-area partitions in Equation (2), and the vertical dotted lines are geometric integration guides.
Figure 10 presents the four field curve-area indices for the six test points. Loading work and recoverable work generally increase nonlinearly with cycle level. The apparent hysteresis and residual envelope-area indices also increase, but their partition is affected by the nested loading history and unresolved test-system compliance. The slightly weathered group has larger loading-work indices on average at the fifth cycle, whereas E2-2 has the largest apparent hysteresis work. These results support the comparison of stage trends and case ordering, not a unique separation of physical dissipation mechanisms from the field curves alone.
Figure 10.
Field curve-area indices from the original calculation workbook. (a) E2-1; (b) E2-2; (c) E2-3; (d) E4-1; (e) E4-2; and (f) E4-3. Bar values retain the original worksheet scale and are not equated with PFC energies in J/m. The four series denote UL,n, UE,n, UP,n, and UD,n, respectively.
3.4. Numerical Calibration and Fit Assessment
Table 6 and Table 7 list the common and case-specific settings. Matrix stiffness was constrained mainly by the low-pressure slope, while bond strength, friction, and initial defects controlled nonlinearity and damage onset. SJM stiffness and strength controlled discontinuity closure, slip, and high-pressure stability. This inverse procedure is non-unique because the same field paths were used for parameter selection and fit assessment. The reported RMSE and peak errors are calibration diagnostics, not independent validation statistics. Alternative parameter combinations may reproduce similar boundary curves while producing different mesoscopic fields; therefore, particle-scale results are interpreted as plausible mechanisms rather than as uniquely identified material properties.
Table 6.
Common PFC2D assembly, boundary, and contact settings.
Table 7.
Case-specific calibration targets, contact parameters, and geometric basis.
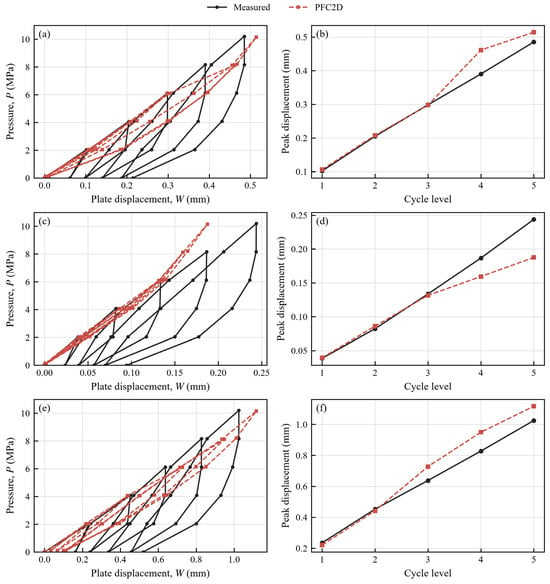
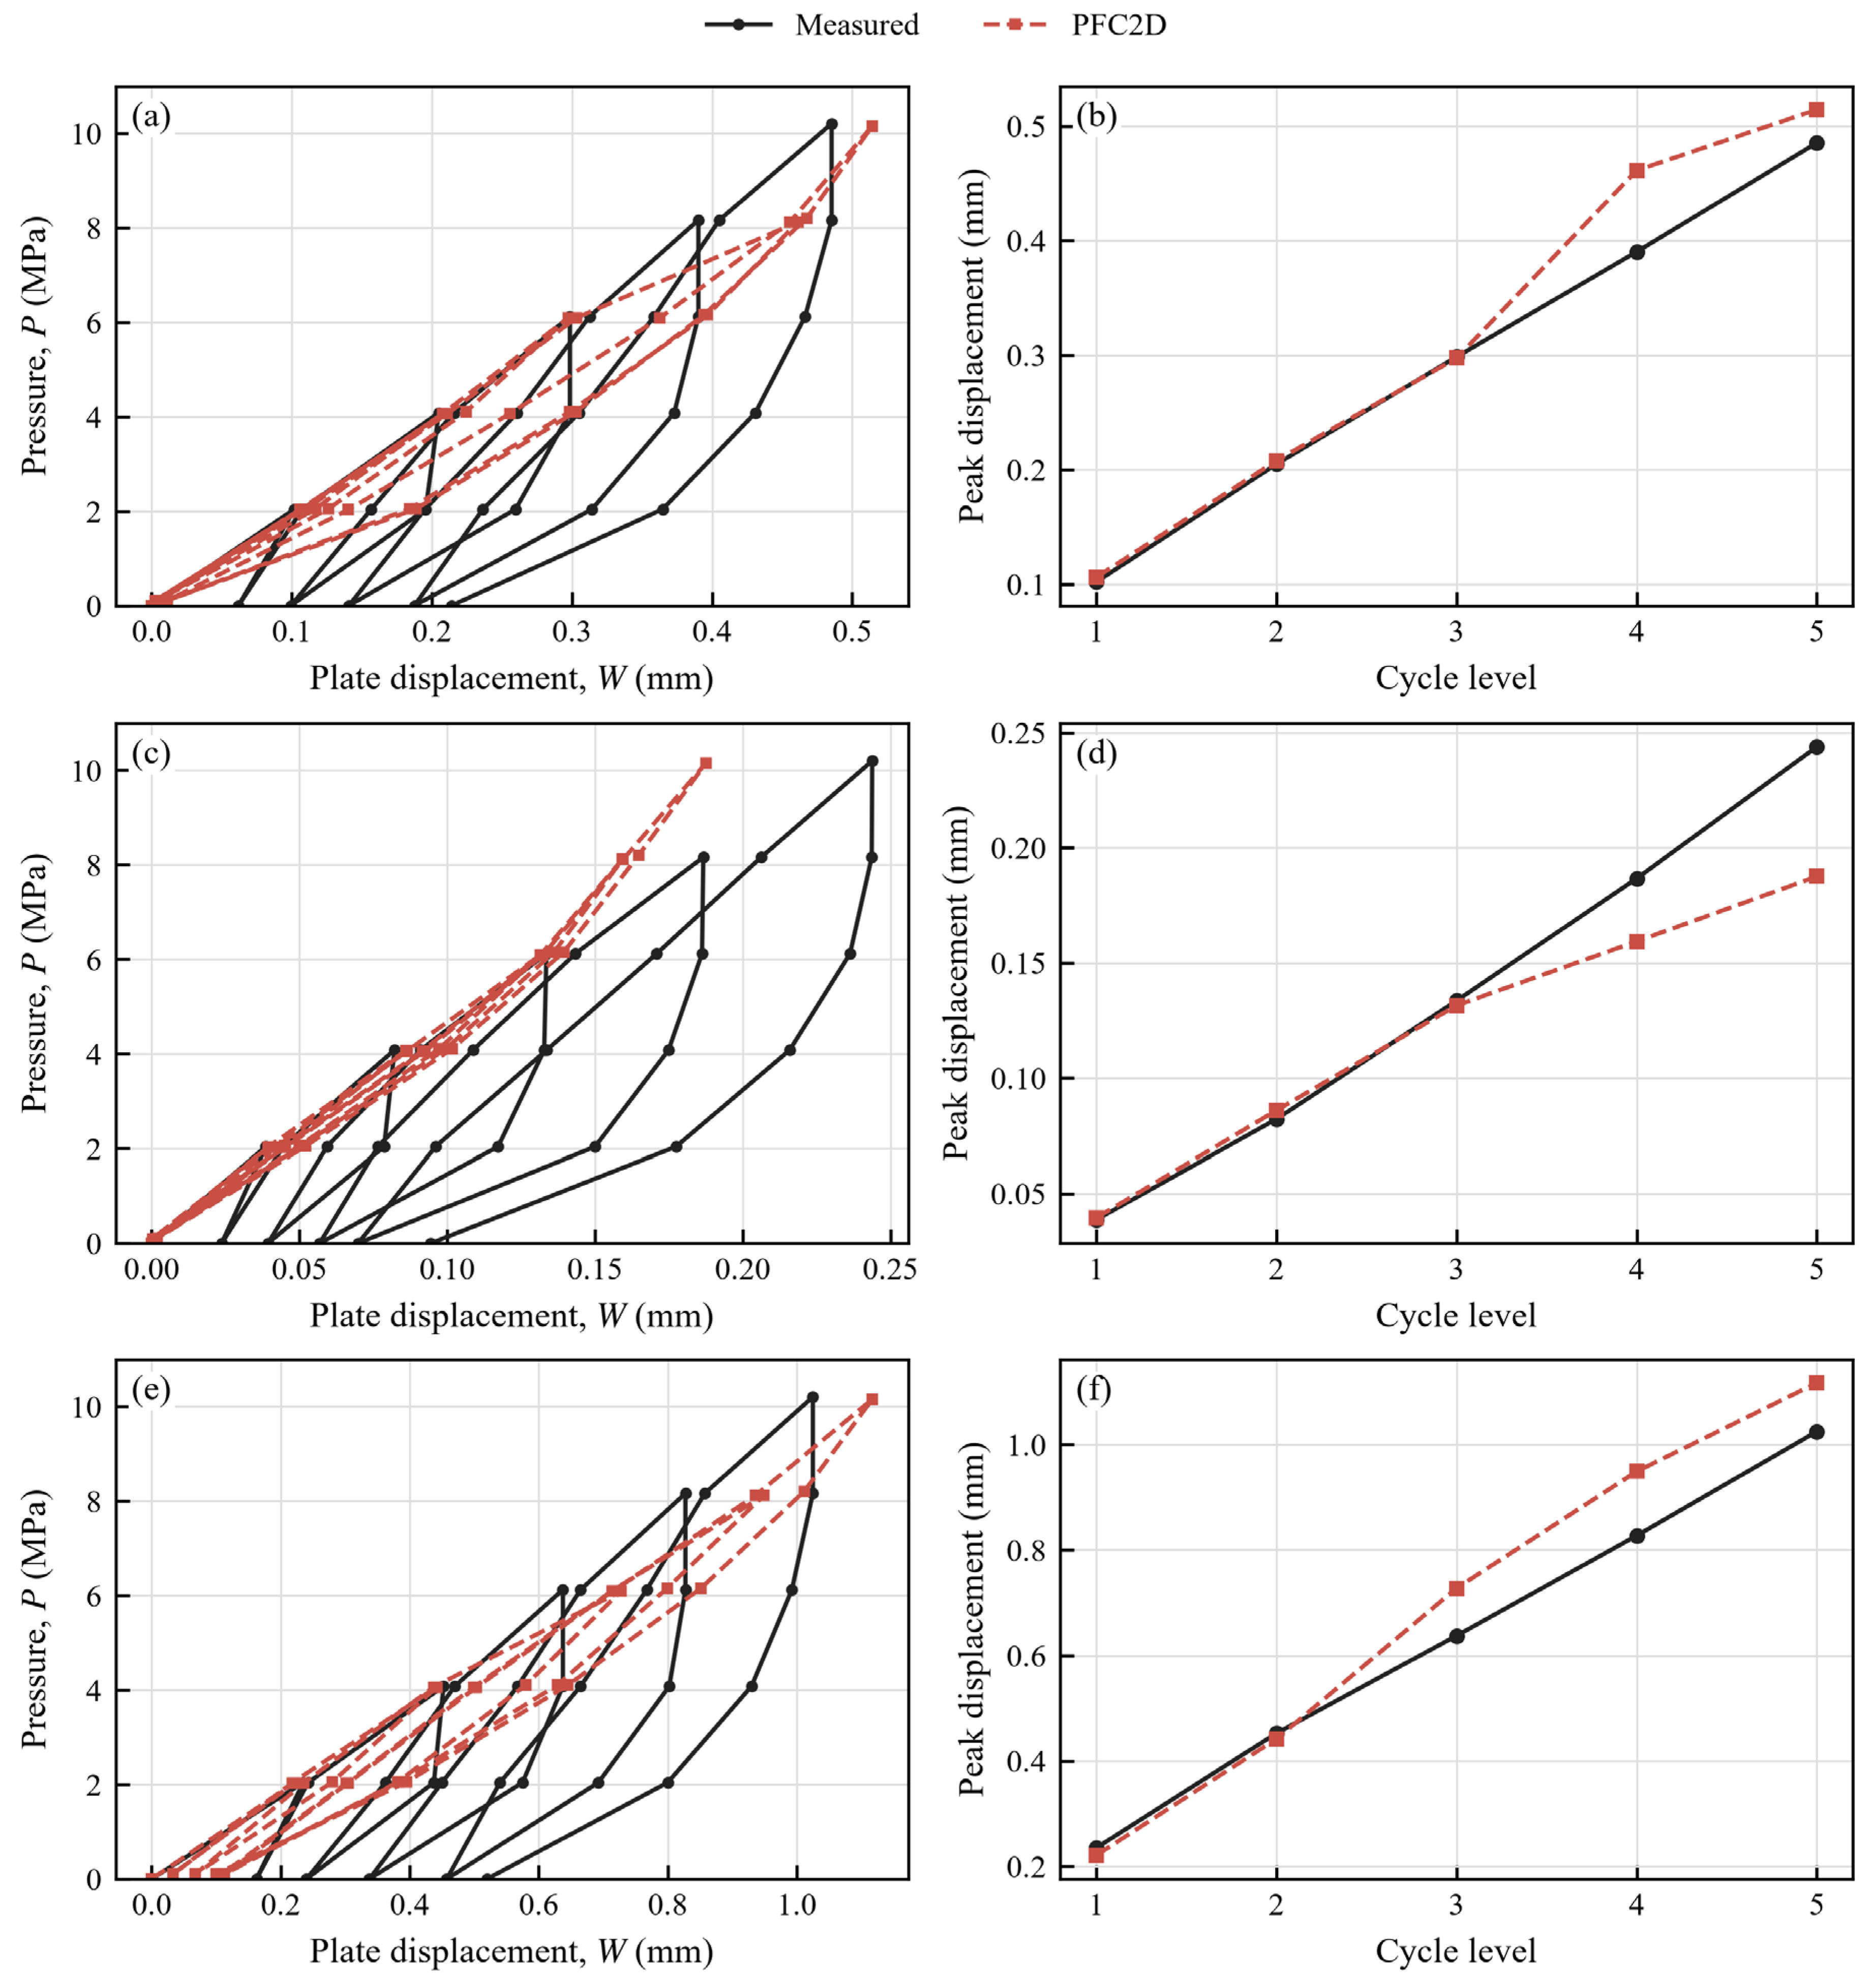
All three cases completed the 30 controlled stages and reached the five peak targets. The maximum absolute pressure-control error was 0.052 MPa. Figure 11 compares the calibration targets and simulated paths. The 30-node displacement RMSE values were 0.090 mm for the weakly weathered group-average case, 0.058 mm for the slightly weathered group-average case, and 0.184 mm for E2-2. Agreement was strongest in the low-to-medium pressure range. The slightly weathered model underestimated the fourth and fifth peaks, while the fault model overestimated several medium-to-high pressure peaks, illustrating residual uncertainty in hidden-crack closure and fault-filling behaviour. Table 8 summarizes the calibration errors and fifth-peak responses.
Figure 11.
Calibration comparison. (a,c,e) Measured and PFC2D pressure–displacement paths and (b,d,f) corresponding peak displacements versus cycle level. Panels (a,b), (c,d), and (e,f) represent the weakly weathered, slightly weathered, and E2-2 cases, respectively.
Table 8.
Summary of deformation calibration fit and fifth-peak response.
Numerical residual deformation is generally smaller than the field residual because the model excludes explicit creep, particle crushing, apparatus compliance, and nonlinear compaction of filling material. No artificial displacement offset was applied. The calibrated models support comparative mechanism analysis over the measured pressure range but do not constitute independent validation, unique identification of joint properties, or prediction of ultimate bearing failure.
3.5. Microcrack Evolution, Force Transfer, and Deformation Localization
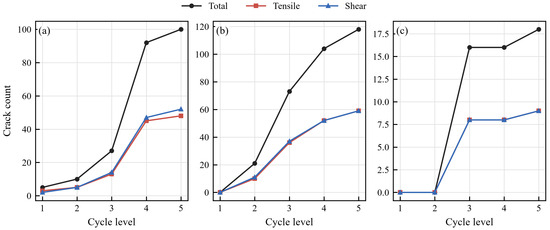
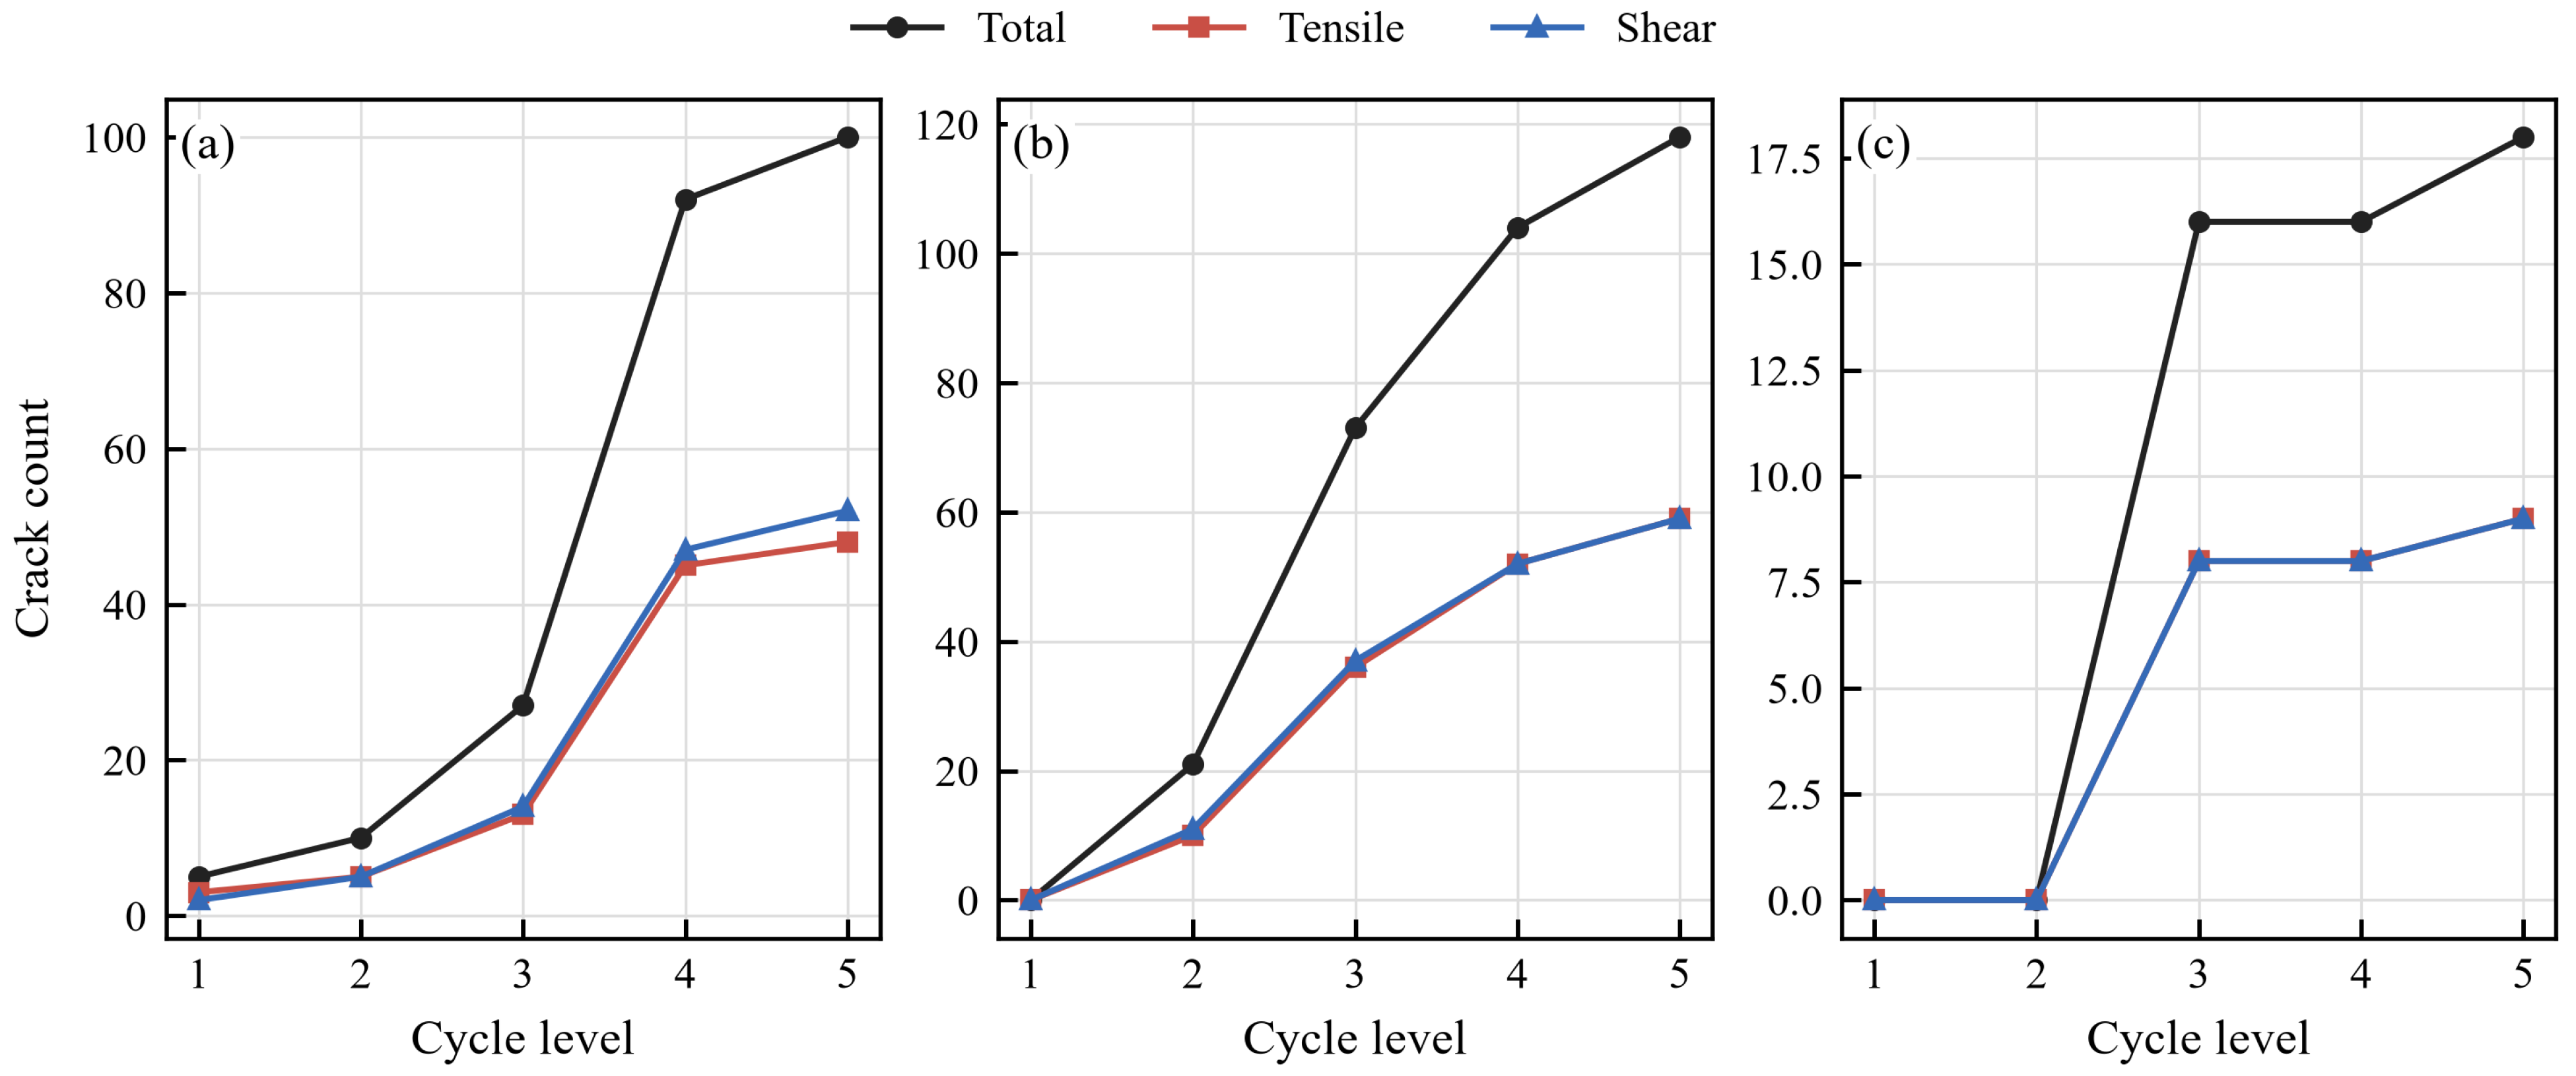
Figure 12 shows crack counts for the baseline-calibrated realizations. At P5, the weakly weathered, slightly weathered, and E2-2 cases contained 100, 118, and 18 newly generated FJM cracks, respectively, with tensile fractions of 48%, 50%, and 50%. These exact counts are realization-specific. The weak-model sensitivity calculations produced 3–100 P5 cracks, demonstrating that crack number is not robust to particle realization and domain choice without re-calibration. The baseline maps remain useful for locating plausible concentration zones near plate edges and discontinuity tips, while E2-2 irreversible deformation is represented mainly by SJM slip rather than repeated counting of the pre-existing fault as new FJM breakage.
Figure 12.
Evolution of total, tensile, and shear crack counts at the five pressure peaks in the baseline realizations. (a) Weakly weathered; (b) slightly weathered; and (c) E2-2 fault (35 degrees).
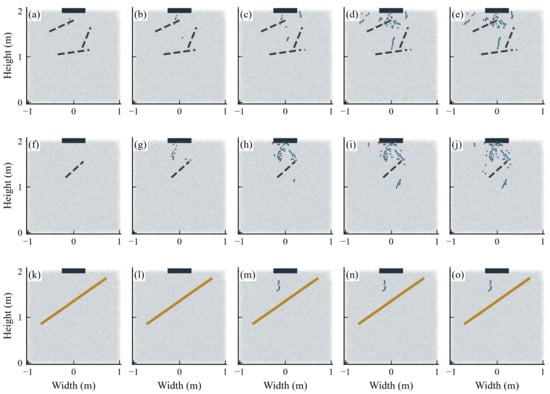
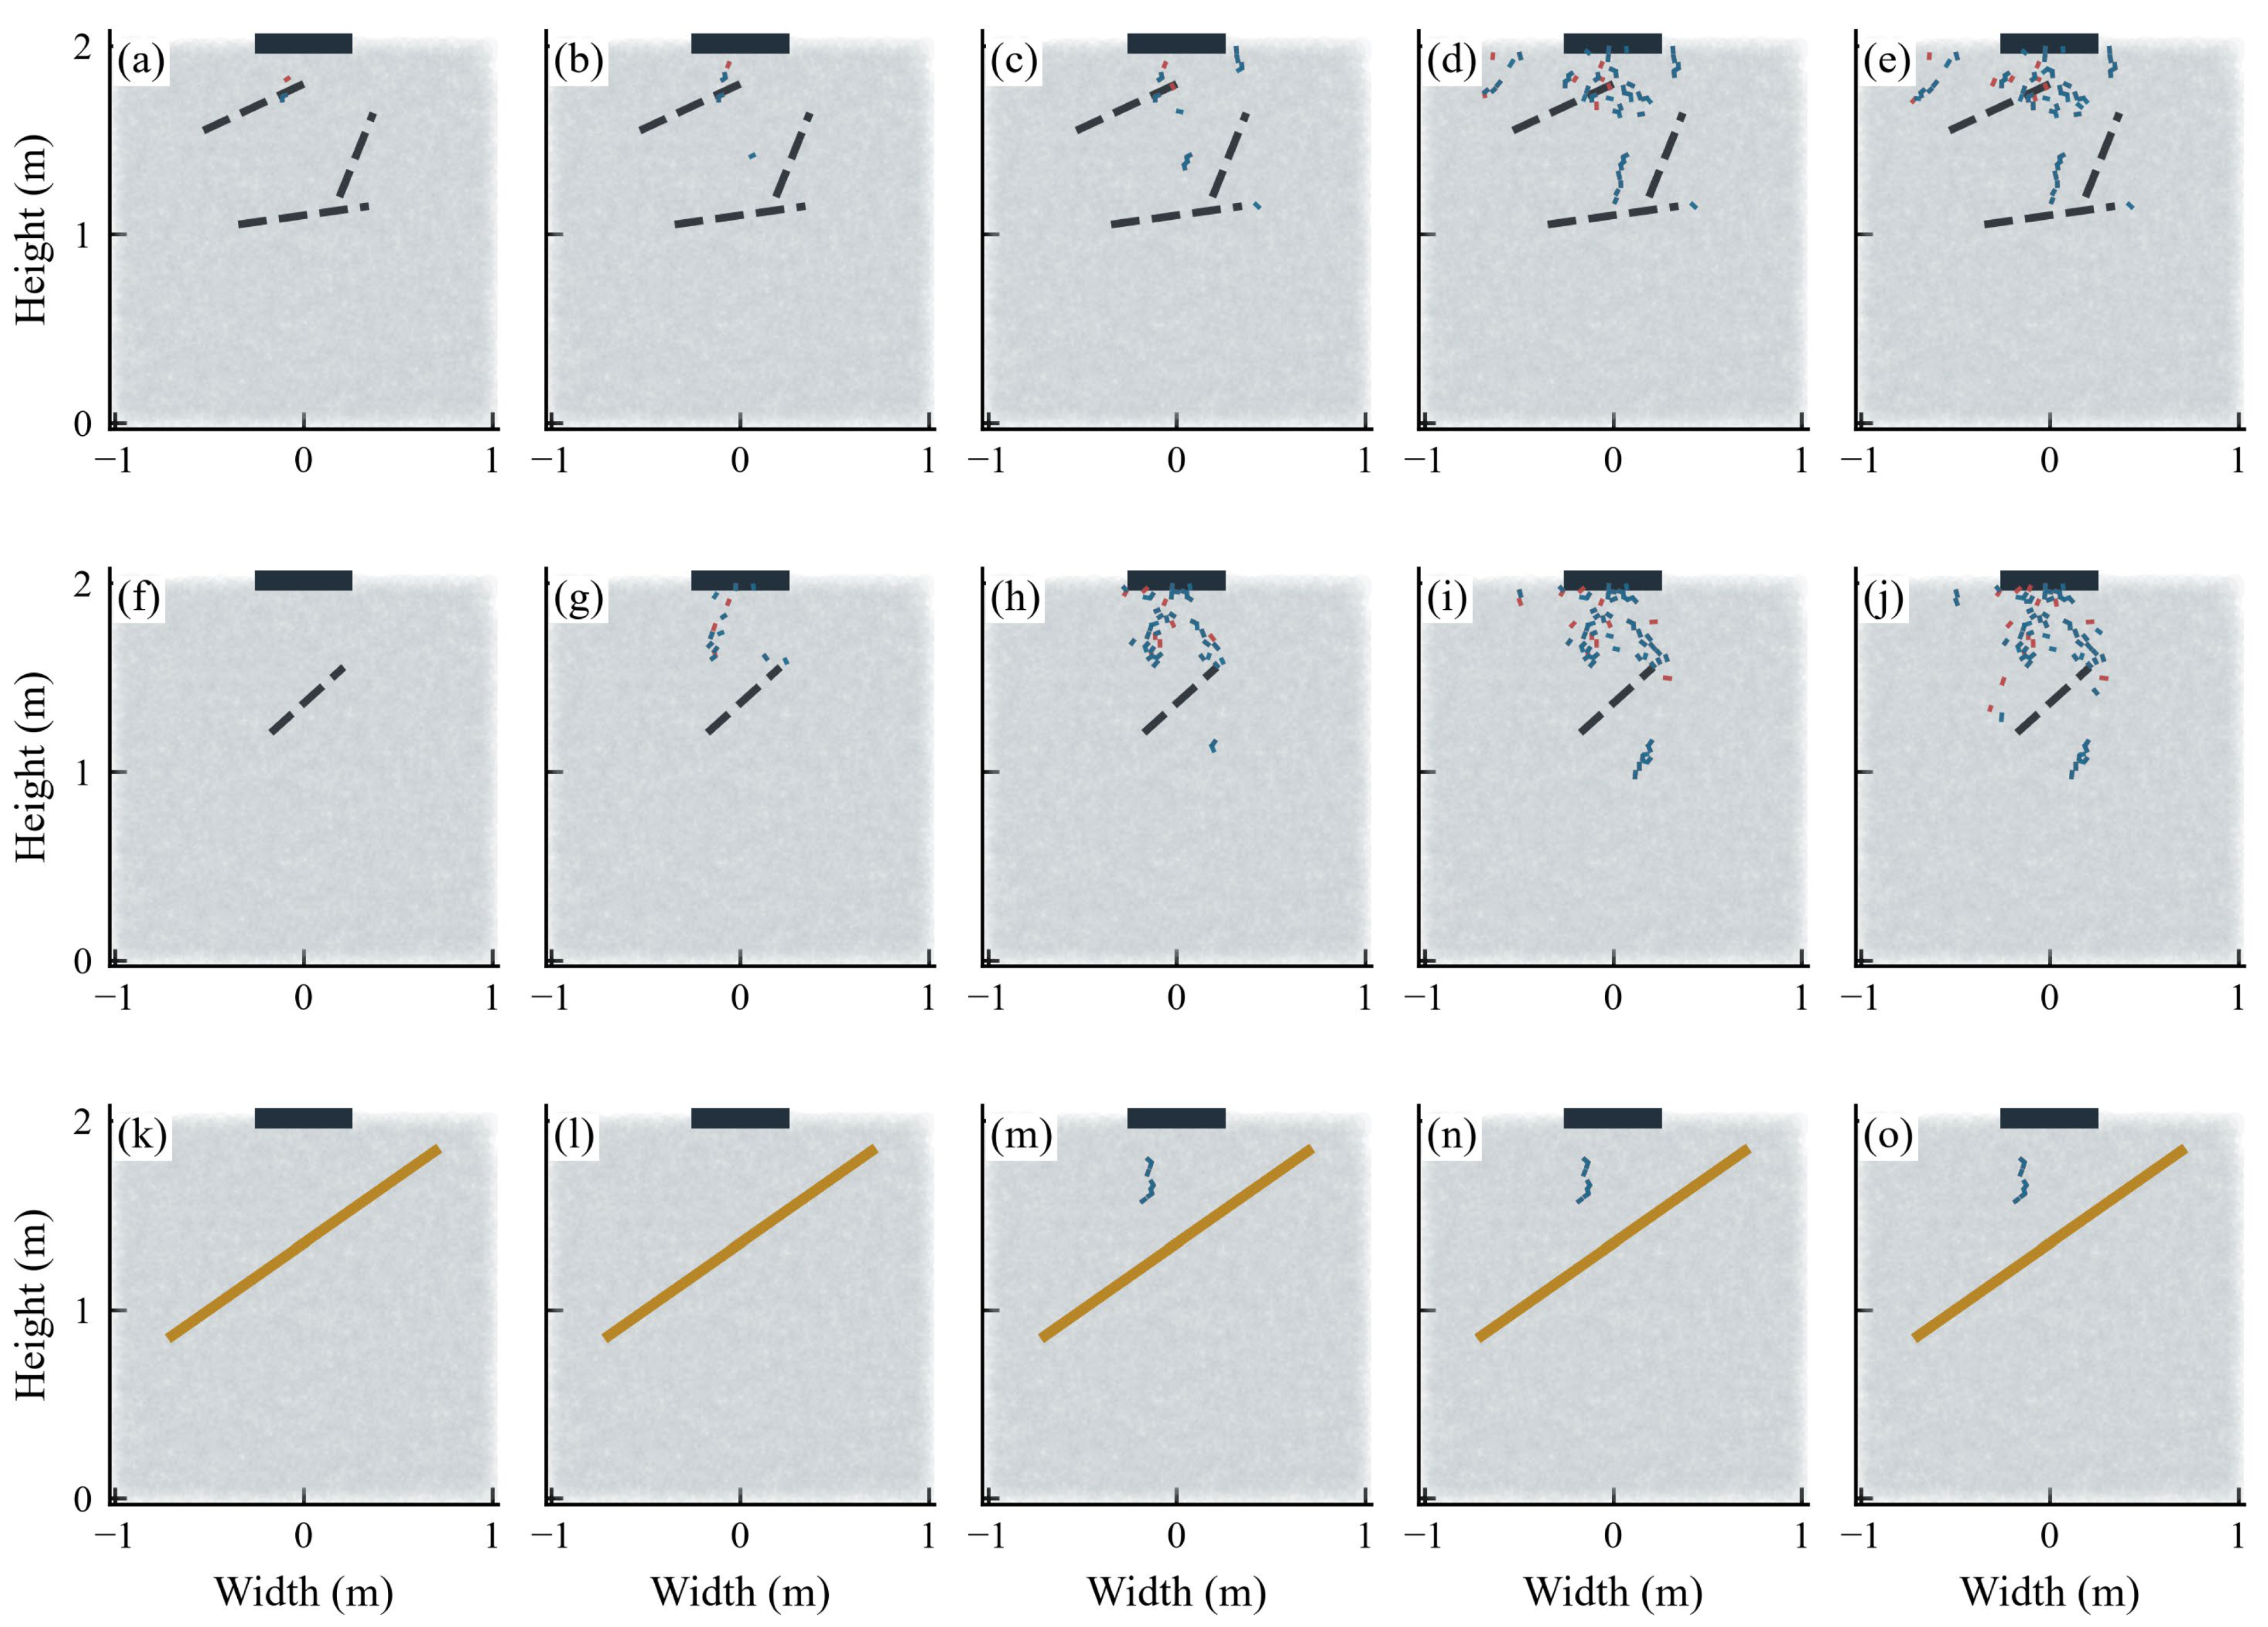
The baseline crack maps in Figure 13 provide a qualitative mechanism illustration. Crack clusters occur near plate edges and discontinuity tips, where force-chain termination can create mixed-mode concentration. In E2-2, the baseline realization develops cracks preferentially around the hanging-wall side and the ends of the 35-degree fault. The exact crack paths must not be interpreted as a surveyed or statistically unique fracture pattern.
Figure 13.
Microcrack evolution in the baseline PFC2D realizations. Panels (a–e), (f–j), and (k–o) represent the weakly weathered, slightly weathered, and E2-2 fault (35 degrees) cases, respectively. Within each row, the five panels correspond to P1–P5 from left to right. Red and blue segments denote tensile and shear cracks; grey particles show the model geometry. Dashed dark lines show conceptual pre-existing joints, the solid gold line marks the pre-existing E2-2 fault, and the thick black strip denotes the loading plate.
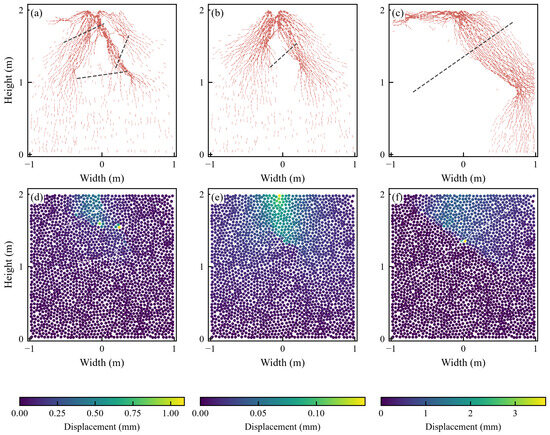
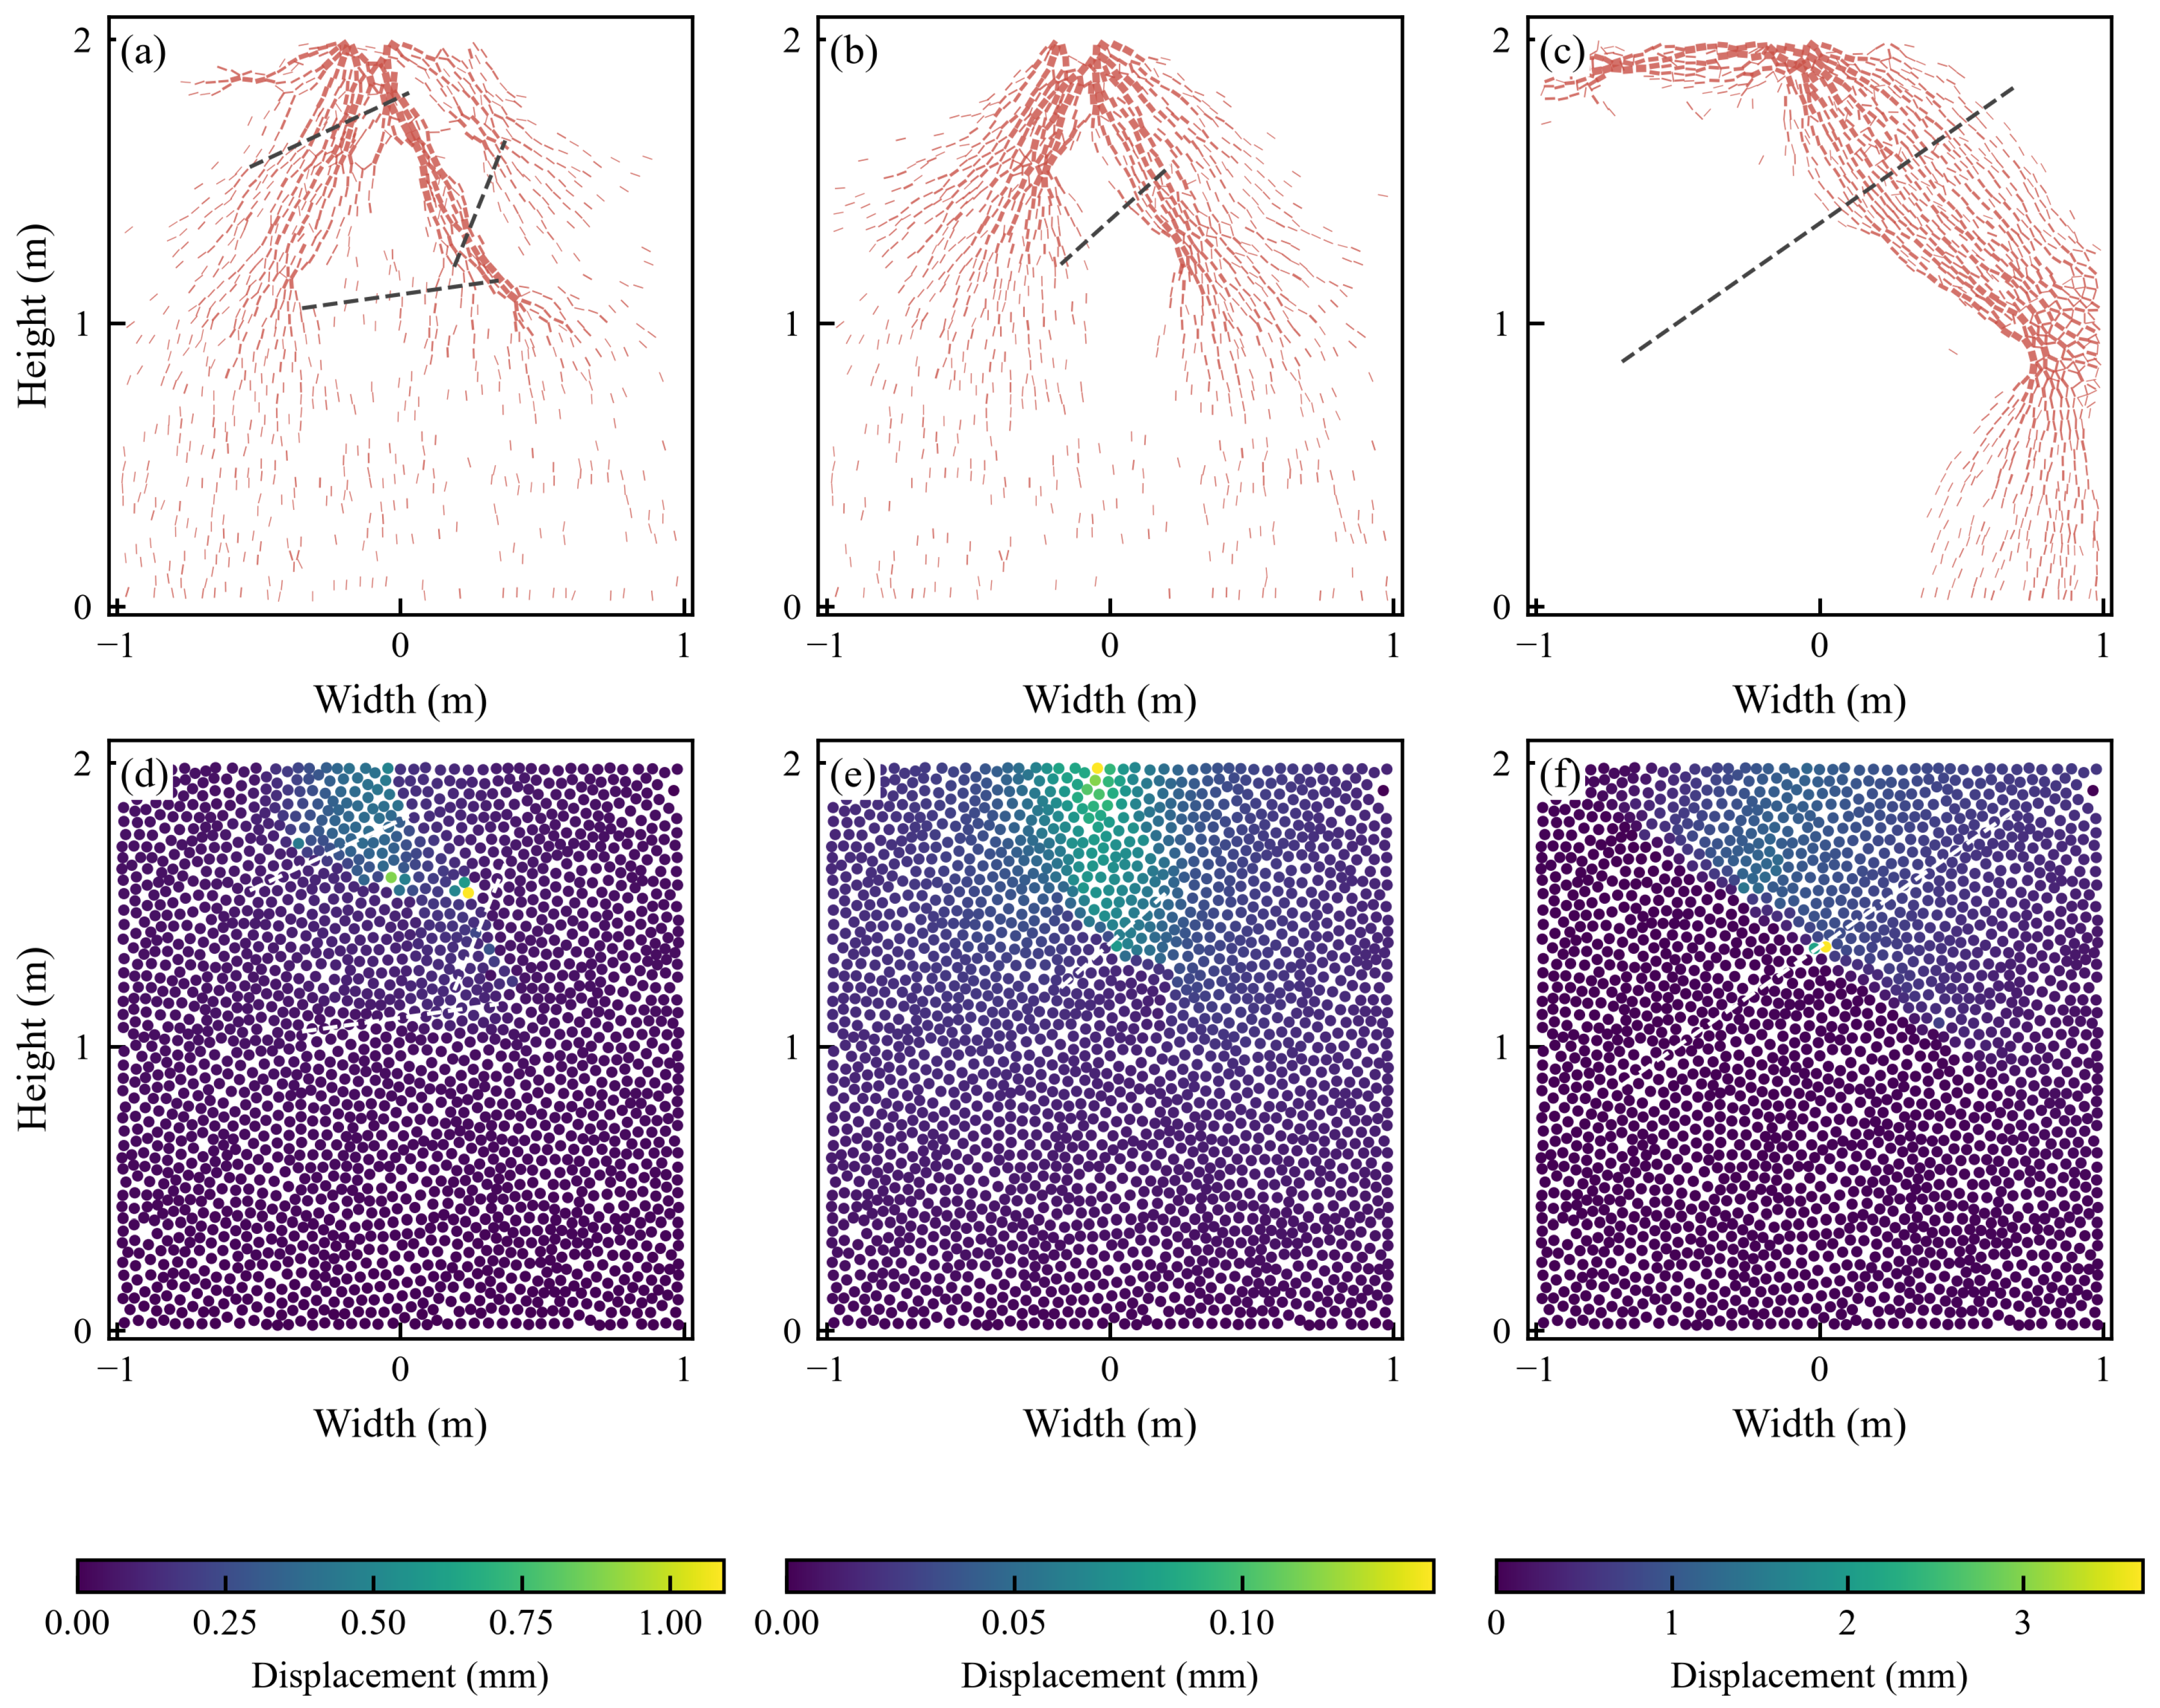
Within the baseline realizations, Figure 14 links plate response to internal load transfer. The weakly and slightly weathered cases form broadly fan-shaped strong-force networks beneath the plate, whereas the E2-2 fault deflects and segments the network and broadens the displacement-localization zone. This is a plausible mesoscopic explanation for the low Eo, high Ee/Eo ratio, and large residual displacement at E2-2, but the detailed chain and localization pattern remains dependent on discretization and boundary conditions.
Figure 14.
Baseline PFC2D fields at the fifth pressure peak. (a–c) Strong contact-force chains and (d–f) particle-displacement magnitudes. Columns from left to right represent the weakly weathered, slightly weathered, and E2-2 cases. Strong contacts comprise the upper 22% of contact-force magnitudes within each case; displacement colour bars are in mm. Dashed lines locate the pre-existing discontinuities: dark lines in panels (a–c) and white lines in panels (d–f).
3.6. Macro-Meso Energy Correspondence
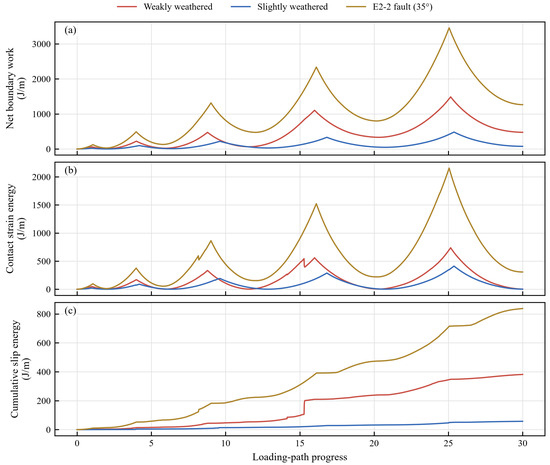
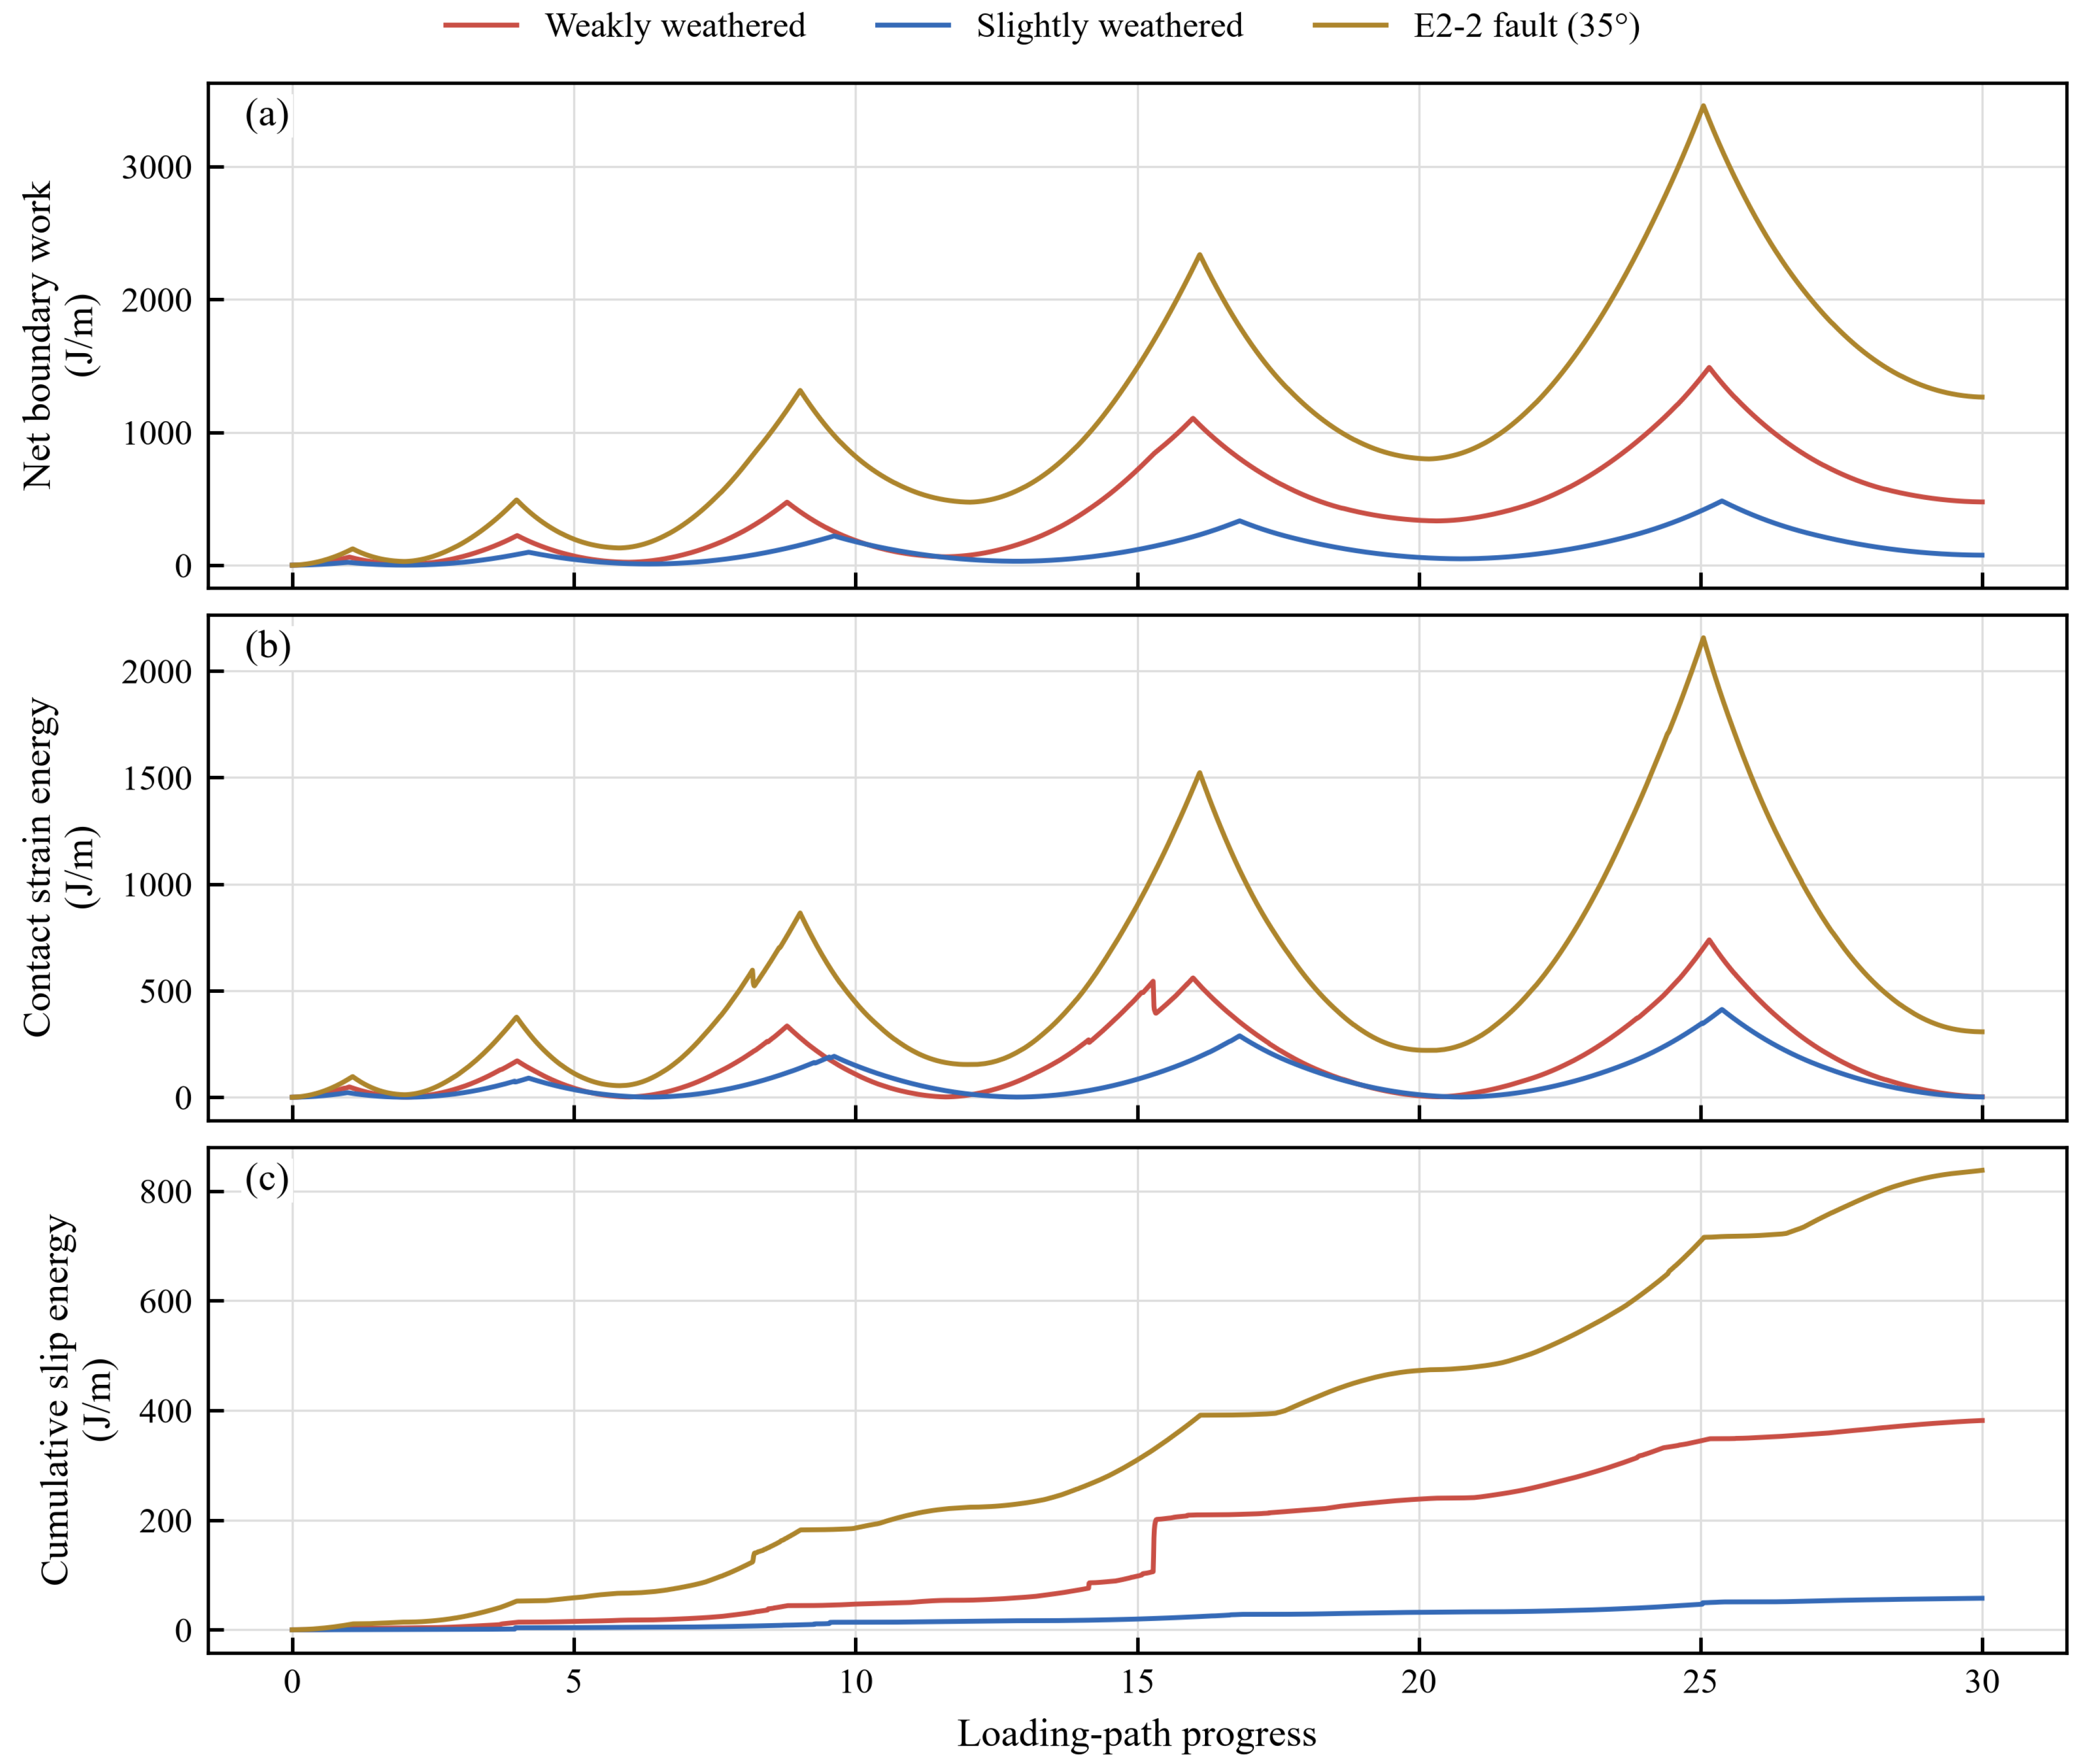
Field and PFC energy variables describe related but nonidentical control volumes. Field loop work is the apparent closed-loop boundary work defined in Equation (2). In PFC, net boundary work is the algebraic external input, contact strain energy is recoverable storage in the contact network, and slip energy is cumulative frictional dissipation. Figure 15 shows increasing contact storage at successive peaks and monotonic slip-energy accumulation. Sensitivity calculations show that P5 contact strain energy is comparatively stable across the tested seeds (coefficient of variation 8.9%), while slip energy is much less stable (89.5%); quantitative particle-scale dissipation is therefore not treated as uniquely calibrated. These numerical quantities use the PFC definitions [31,32,33]. The coefficient of variation is the standard deviation divided by the mean, expressed as a percentage [34].
Figure 15.
PFC2D energy evolution along the loading path. (a) Net boundary work; (b) contact strain energy; and (c) cumulative slip energy.
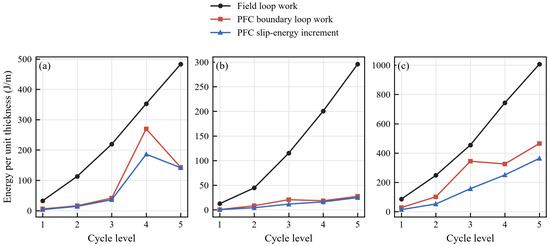
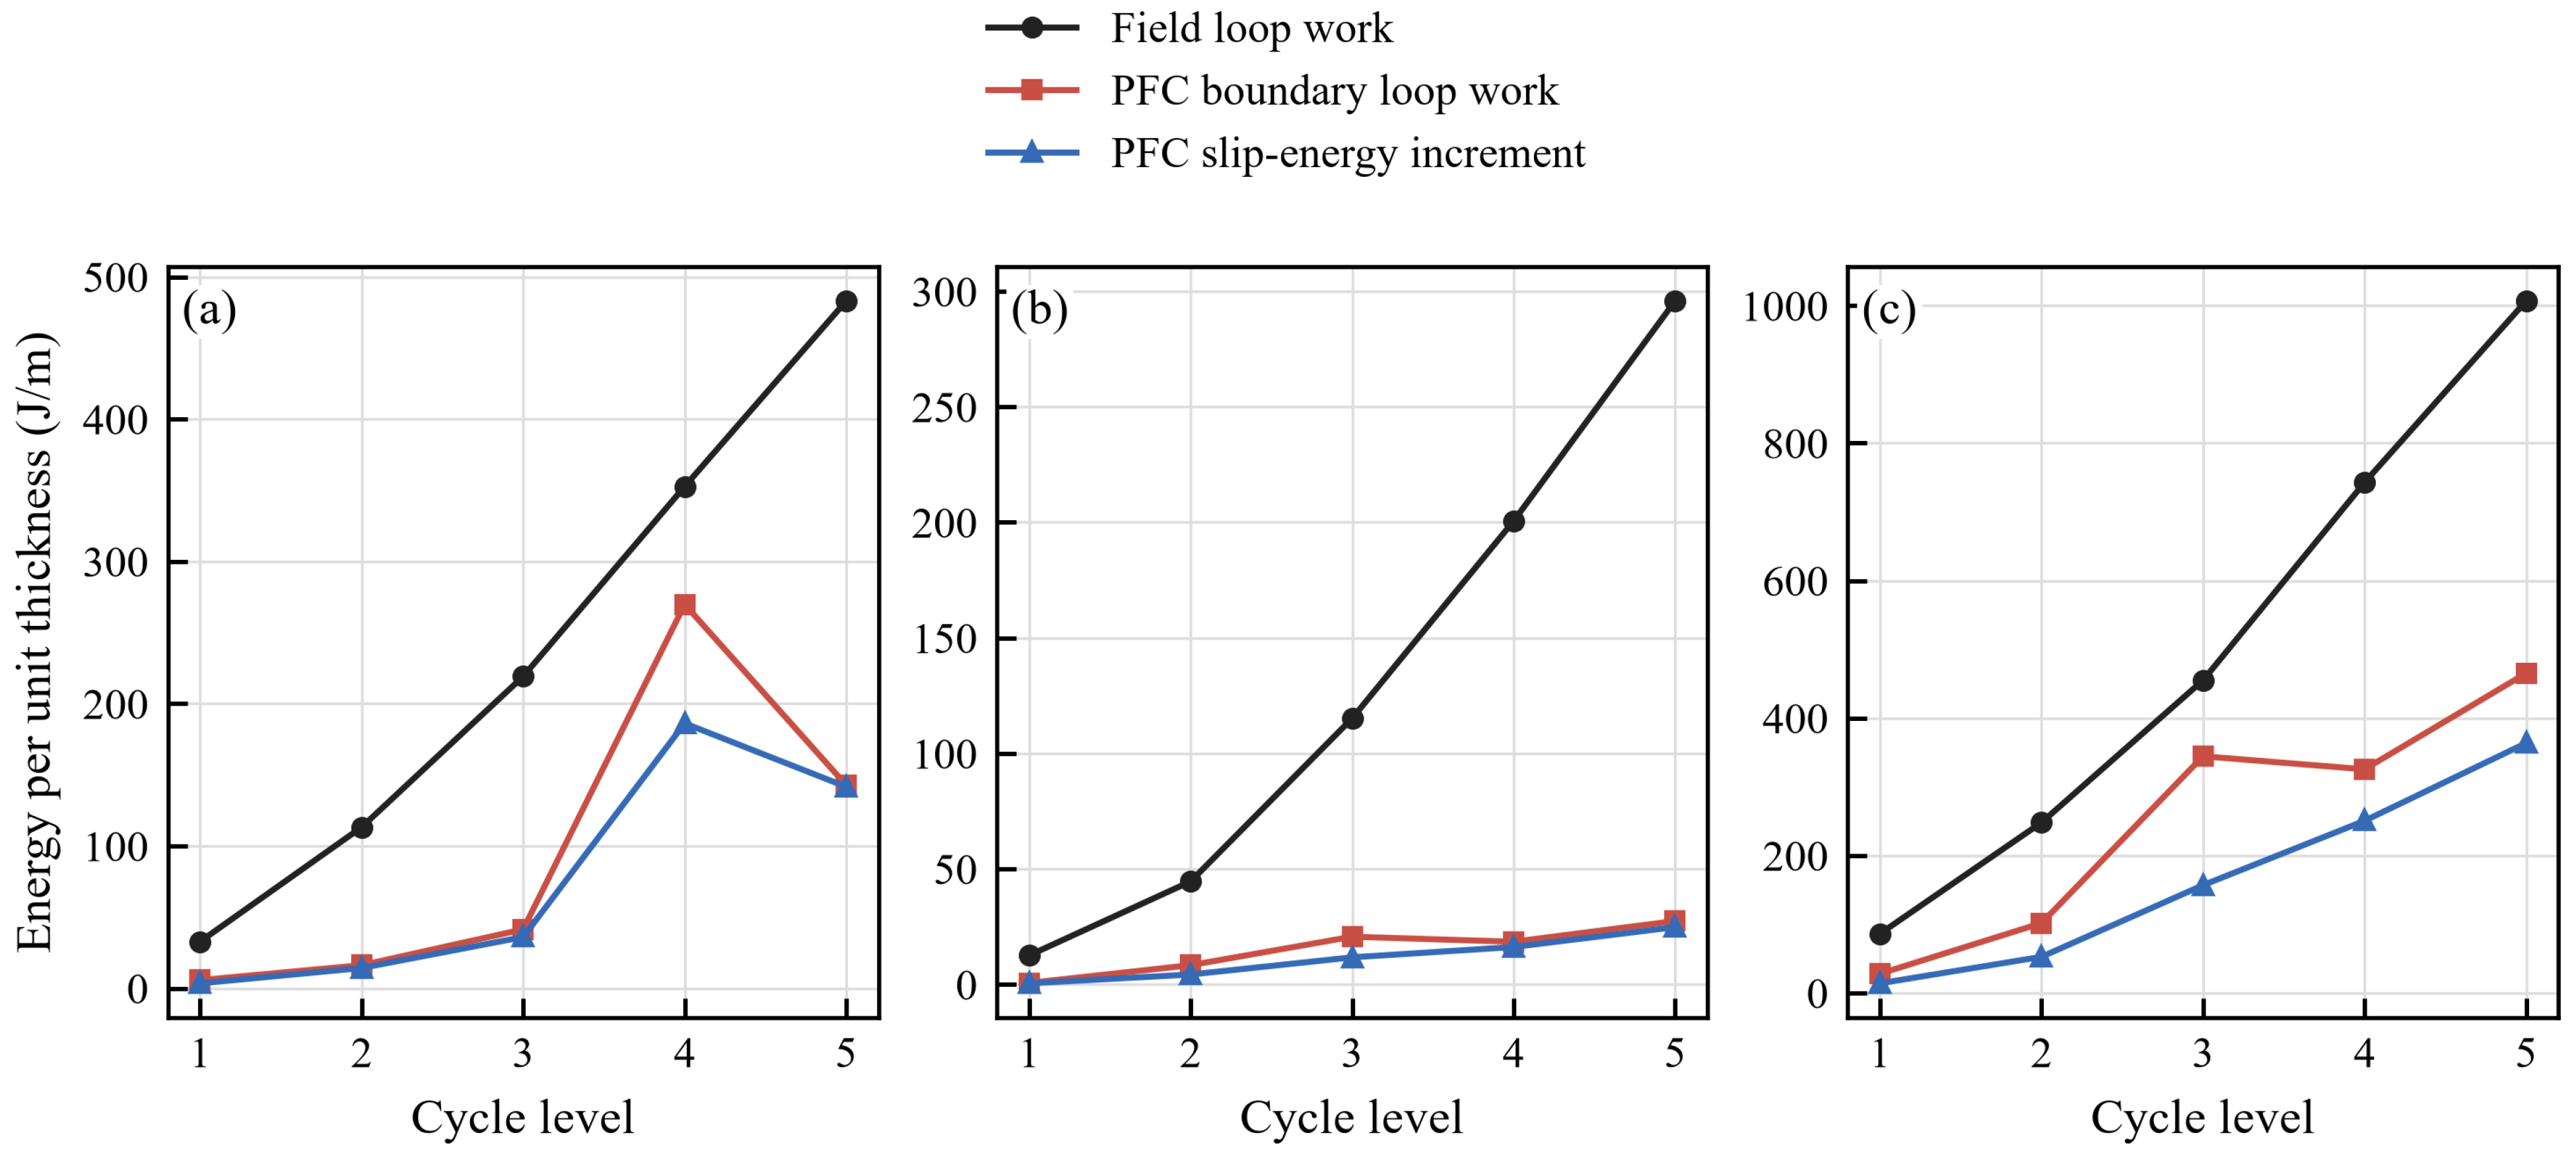
The fifth-cycle comparison in Figure 16 and Table 9 shows the baseline case ranking for irreversible work: E2-2 has the largest field loop work, numerical loop work, and slip-energy increment; weakly weathered basalt is intermediate; and slightly weathered basalt is smallest. This ranking differs from field-loading work because loop work isolates apparent hysteresis. The numerical and field values cannot be equated because the unit-thickness strip model omits the three-dimensional stress bulb, time effects, system compliance, and filling-material compaction. Assessment is therefore based on stage trend and baseline case ordering.
Figure 16.
Comparison of field loop work, PFC boundary loop work, and PFC slip-energy increments over the five loading cycles. (a) Weakly weathered; (b) slightly weathered; and (c) E2-2 fault (35 degrees).
Table 9.
Fifth-cycle macro-meso energy indices per unit model thickness.
The cross-scale mechanism can therefore be summarized as follows. Low-pressure deformation is dominated by contact accommodation and closure or slip of pre-existing discontinuities. At medium pressure, the contact skeleton stiffens and recoverable storage increases. At higher pressure, bond breakage at plate edges and discontinuity tips interacts with frictional slip, producing nonlinear deformation, residual displacement, and accelerated dissipation. The balance among these processes is governed jointly by weathering-related matrix stiffness and local structural geometry.
3.7. Standardized Cross-Scale Response Matrix and Statistical Limitation
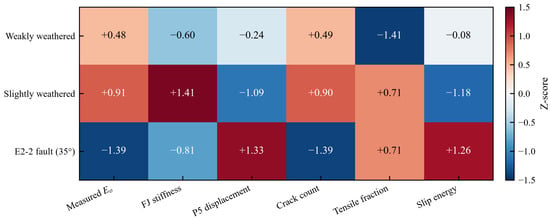
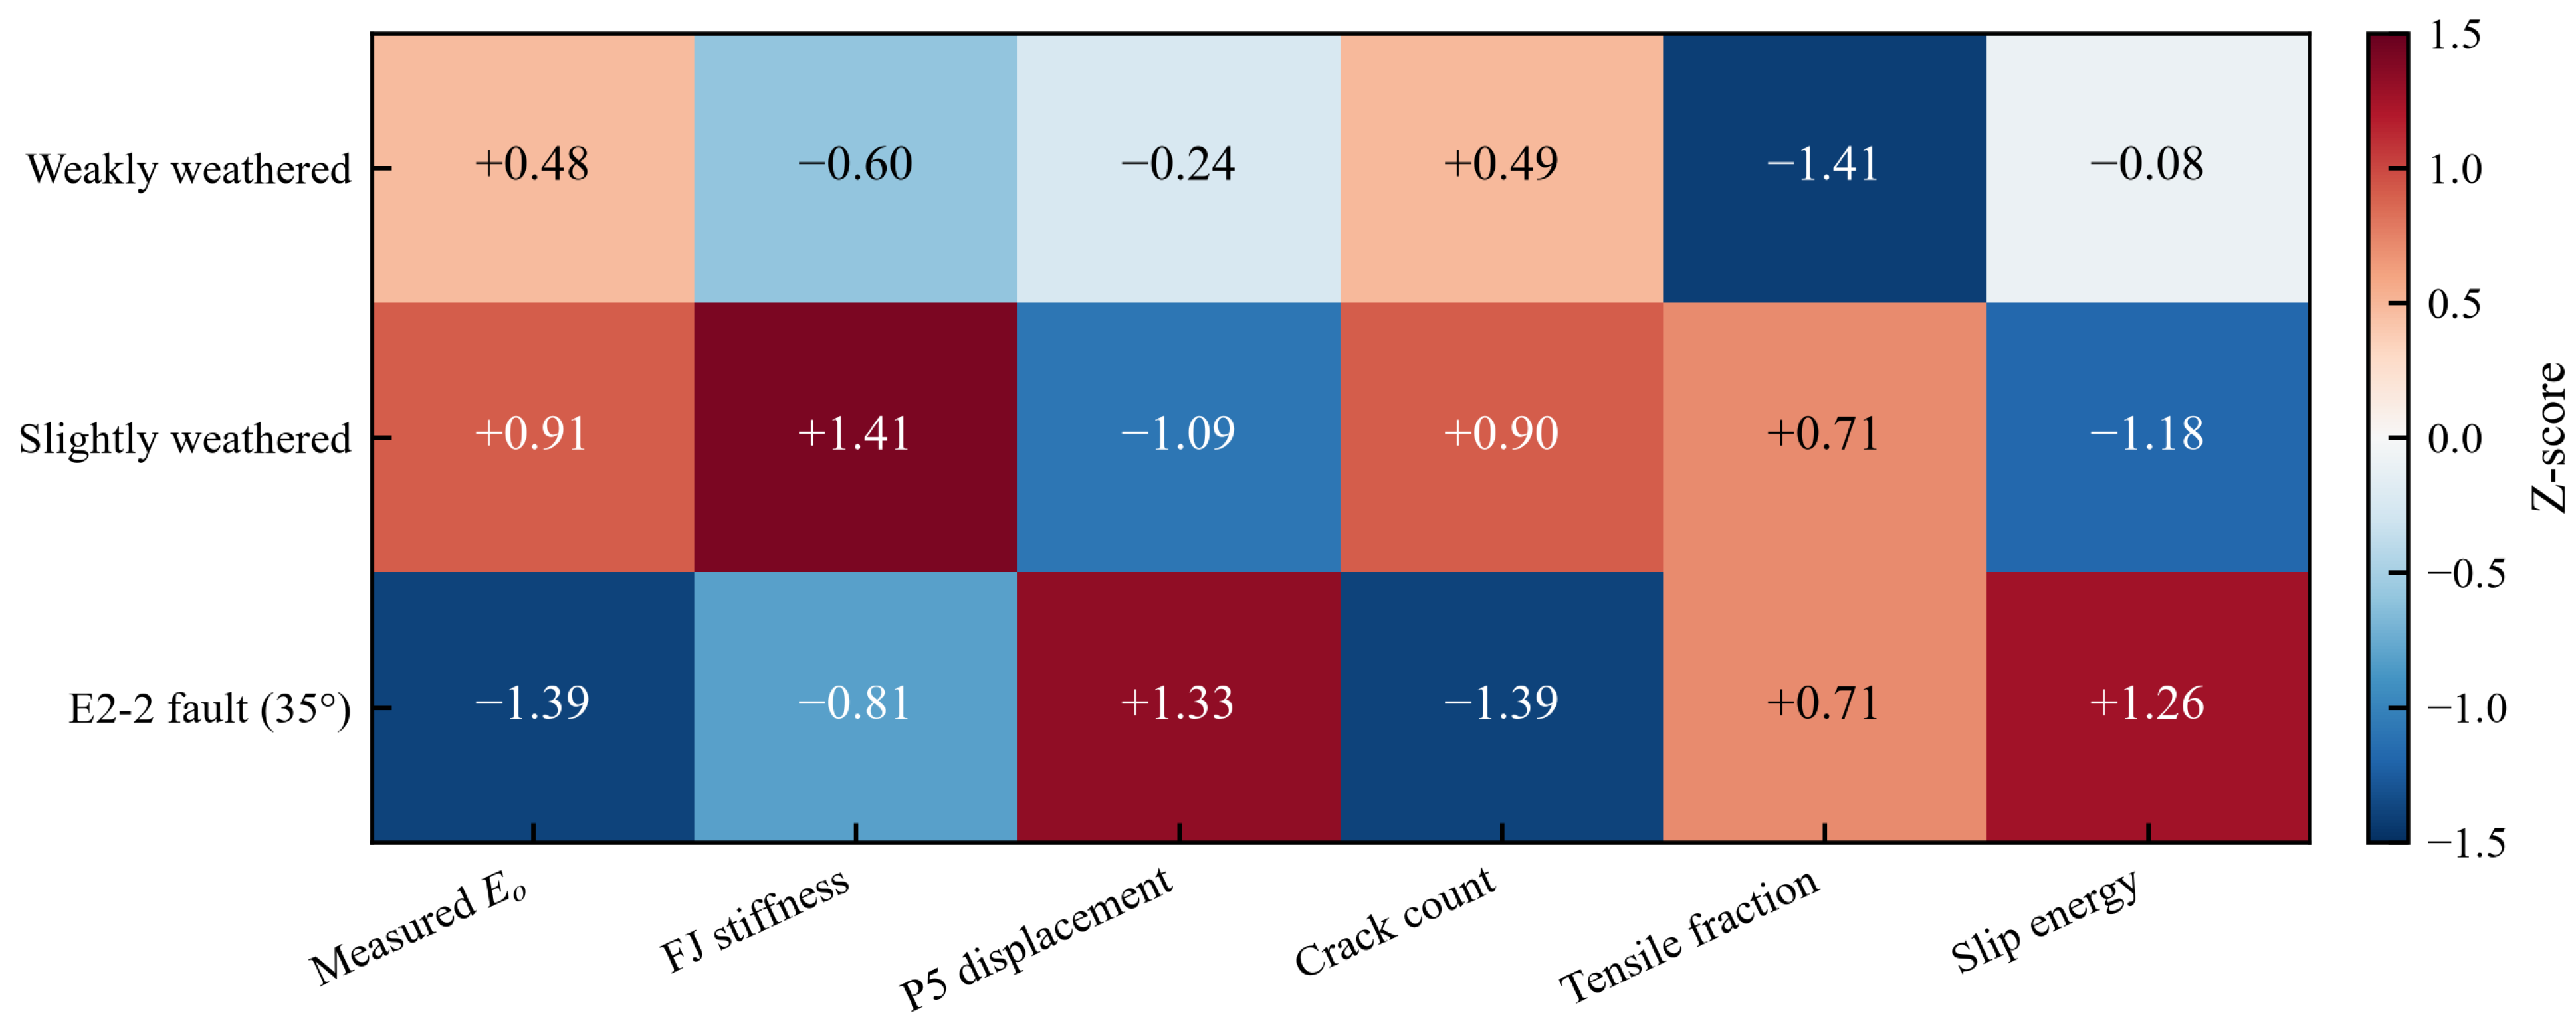
Figure 17 standardizes six baseline macro-meso indicators by Z-score to visualize the relative signatures of the three calibrated cases. The matrix is an exploratory case-comparison tool, not a correlation heatmap or general constitutive relationship. Only three independent calibrated cases are available, so Pearson or Spearman coefficients would be statistically unstable and are not reported. The added numerical sensitivity study further shows that exact crack counts and slip energy cannot be generalized from one particle realization. Standardization subtracts the mean of each indicator across the three cases and divides by its standard deviation [35]; it does not establish a probabilistic model for the case population.
Figure 17.
Standardized macro-meso response matrix for the three baseline-calibrated cases.
The principal uncertainty sources are the small number of field tests, confounding between weathering and local structure, absence of point-specific Poisson ratios, gauge specifications, complete time histories, and test-system-compliance calibration, conceptual joint geometry, non-unique inverse mesoparameters, omitted point-specific initial stress, rigid boundaries, and the 2D/3D mismatch. The available PD4 stress measurements were not imposed because their locations and orientations do not coincide with the plate surfaces. Initial stress may alter discontinuity closure, stiffness, slip, localization, cracking, and energy evolution; the present calculations are therefore not site-specific prestressed reconstructions.
3.8. Numerical Sensitivity of the Weakly Weathered Model
Table 10 compares the baseline weakly weathered model with two additional random seeds, a coarser particle-radius range, and a larger domain. Contact parameters and the 30-node loading protocol were held fixed and the variants were not re-calibrated. Among the three seed realizations, the P5 displacement coefficient of variation was 27.0%, contact strain energy 8.9%, cumulative slip energy 89.5%, and crack count 73.8%. The larger domain and coarser particles produced similarly large changes in displacement, slip energy, and crack number. These calculations do not establish a converged discretization; they demonstrate that the detailed mesoscopic outputs are conditional on realization and boundary choice.
Table 10.
P5 sensitivity of the weakly weathered model without re-calibration.
The baseline and sensitivity variants consistently retain contact-energy storage during loading, but they do not preserve a unique crack population or frictional-energy magnitude. Accordingly, subsequent interpretation is limited to qualitative mechanisms supported jointly by the field response and the baseline geological representation. Quantitative mesoscopic prediction would require ensemble calibration against independent laboratory properties and point-specific structural observations.
4. Conclusions
An integrated field-test and PFC2D study was conducted to interpret the deformation and energy evolution of basalt rock masses in the Gushui Hydropower Station pivot area. The principal conclusions are as follows:
(1) The six field tests are mostly quasi-elastic but exhibit strong within-group variability. Full-group mean Eo/Ee values are 15.402/22.236 GPa for weakly weathered basalt and 18.082/30.205 GPa for slightly weathered basalt. Excluding E2-2 raises the weakly weathered means to 21.197/29.486 GPa, demonstrating that the original group contrast cannot be attributed to weathering alone. Local faults, joints, interlayers, and loading direction must be considered explicitly.
(2) The FJM/SJM models reproduced the 30 pressure-control stages with maximum pressure errors of 0.052 MPa or less. Displacement RMSE values of 0.090, 0.058, and 0.184 mm quantify inverse-calibration fit, not independent validation. Because contact parameters and conceptual joint geometry are non-unique, the models support mechanism interpretation over the measured range but do not identify a unique mesostructure.
(3) In the baseline realizations, P5 crack counts were 100, 118, and 18 for the weakly weathered, slightly weathered, and E2-2 cases. Weak-model sensitivity runs gave 3–100 cracks and 74.4–348.0 J/m cumulative slip energy, while contact strain energy varied from 619.5 to 777.3 J/m. Exact crack counts, slip-energy magnitudes, force chains, and localization patterns are therefore realization- and boundary-dependent. The robust interpretation is qualitative: pre-existing discontinuities redirect force transfer and promote irreversible deformation through slip and local bond breakage.
(4) Field-loading work, recoverable work, apparent hysteresis work, PFC boundary work, contact strain energy, and slip energy are dimensionally defined but refer to different control volumes and mechanisms. Their absolute values cannot be equated. Contact strain energy was the least sensitive numerical energy measure in the tested seed ensemble, whereas slip energy was highly sensitive; cross-scale comparison is restricted to stage trends and case ordering.
(5) The field comparison demonstrates that the E2-2 fault effect is at least as important as the weathering classification. The numerical results provide a physically plausible explanation but remain limited by inverse-calibration non-uniqueness, unmeasured point-specific initial stress, rigid boundaries, and two-dimensional idealization. Further work requires independently measured contact parameters, surveyed discontinuity geometry, prestress calibration, and replicated particle realizations.
Supplementary Materials
The following supporting information can be downloaded at: https://www.mdpi.com/article/10.3390/buildings16203991/s1, Supplementary_Data_S1.xlsx, containing the six stabilized field P–W series, group-average and E2-2 calibration targets, corresponding PFC2D values, model parameters, and numerical sensitivity results.
Author Contributions
X.G. curated the field-test data, performed the numerical simulations and analyses, and drafted the manuscript. S.W. conceived and supervised the study, developed the methodology, interpreted the results, and reviewed and edited the manuscript. All authors have read and agreed to the published version of the manuscript.
Funding
This research was funded by the National Natural Science Foundation of China, grant number 52334004, under the project titled “Fundamental Research on a New-Generation Method for Constructing In Situ Rock-Mass Strength in Underground Engineering”.
Data Availability Statement
All data generated or analyzed during this study are included in this article and the accompanying Supplementary Data S1 workbook (Supplementary_Data_S1.xlsx).
Conflicts of Interest
Author Xuewei Guan was employed by the company PowerChina Kunming Engineering Corporation Limited. The remaining author declares that the research was conducted in the absence of any commercial or financial relationships that could be construed as a potential conflict of interest.
References
- Cai, M.; Kaiser, P.K.; Uno, H.; Tasaka, Y.; Minami, M. Estimation of rock mass deformation modulus and strength of jointed hard rock masses using the GSI system. Int. J. Rock Mech. Min. Sci. 2004, 41, 3–19. [Google Scholar] [CrossRef] [Scilit]
- Zhang, Q.Y.; Wang, J.H.; Fei, D.J.; He, R.P.; Zeng, J.Q.; Huang, Y.K. Testing study of rigid pressure-bearing plate of dam zone rock mass in Dagangshan Hydropower Station. Chin. J. Rock Mech. Eng. 2008, 27, 1417–1422. [Google Scholar]
- Farmer, I.W.; Kemeny, J.M. Deficiencies in rock test data. In Proceedings of the ISRM Symposium EUROCK ‘92, Chester, UK, 14–17 September 1992; pp. 298–303. [Google Scholar]
- Hoek, E.; Diederichs, M.S. Empirical estimation of rock mass modulus. Int. J. Rock Mech. Min. Sci. 2006, 43, 203–215. [Google Scholar] [CrossRef] [Scilit]
- Jaeger, C. Rock Mechanics and Engineering; Cambridge University Press: Cambridge, UK, 1979. [Google Scholar]
- Shen, J.; Karakus, M.; Xu, C. A comparative study for empirical equations in estimating deformation modulus of rock masses. Tunn. Undergr. Space Technol. 2012, 32, 245–250. [Google Scholar] [CrossRef] [Scilit]
- Agharazi, A.; Tannant, D.D.; Martin, C.D. Characterizing rock mass deformation mechanisms during plate load tests at the Bakhtiary Dam Project. Int. J. Rock Mech. Min. Sci. 2012, 49, 1–11. [Google Scholar] [CrossRef] [Scilit]
- Asef, M.R.; Reddish, D.J. The impact of confining stress on the rock mass deformation modulus. Géotechnique 2002, 52, 235–241. [Google Scholar] [CrossRef]
- Zhang, B.H.; Mu, J.Y.; Zheng, J.; Lv, Q.; Deng, J.H. A new estimation method and an anisotropy index for the deformation modulus of jointed rock masses. J. Rock Mech. Geotech. Eng. 2022, 14, 153–168. [Google Scholar] [CrossRef] [Scilit]
- Shi, A.; Tang, M.; Zhou, Q. Research on deformation characteristics of columnar jointed basalt at Baihetan Hydropower Station on Jinsha River. Chin. J. Rock Mech. Eng. 2008, 27, 2079–2086. [Google Scholar]
- Xie, H.; Li, L.; Peng, R. Energy analysis and criteria for structural failure of rocks. J. Rock Mech. Geotech. Eng. 2009, 1, 11–20. [Google Scholar] [CrossRef] [Scilit]
- Peng, K.; Lv, H.; Zou, Q.; Wen, Z.; Zhang, Y. Evolutionary characteristics of mode-I fracture toughness and fracture energy in granite from different burial depths under high-temperature effect. Eng. Fract. Mech. 2020, 239, 107306. [Google Scholar] [CrossRef] [Scilit]
- Xie, H.P.; Ju, Y.; Li, L.Y.; Peng, R.D. Energy mechanism of deformation and failure of rock masses. Chin. J. Rock Mech. Eng. 2008, 27, 1729–1740. [Google Scholar]
- Gaziev, E. Rupture energy evaluation for brittle materials. Int. J. Solids Struct. 2001, 38, 7681–7690. [Google Scholar] [CrossRef] [Scilit]
- Gong, F.Q.; Yan, J.Y.; Li, X.B.; Luo, S. A peak-strength strain energy storage index for rock burst proneness of rock materials. Int. J. Rock Mech. Min. Sci. 2019, 117, 76–89. [Google Scholar] [CrossRef] [Scilit]
- Peng, K.; Liu, Z.; Zou, Q.; Wu, Q.; Zhou, J. Mechanical property of granite from different buried depths under uniaxial compression and dynamic impact: An energy-based investigation. Powder Technol. 2020, 362, 729–744. [Google Scholar] [CrossRef] [Scilit]
- Peng, K.; Liu, Z.; Zou, Q.; Zhang, Z.; Zhou, J. Static and dynamic mechanical properties of granite from various burial depths. Rock Mech. Rock Eng. 2019, 52, 3545–3566. [Google Scholar] [CrossRef] [Scilit]
- Ji, Y.; Sun, Z.; Chen, C.; Pel, L.; Barakat, A. Setting characteristics, mechanical properties and microstructure of cement pastes containing accelerators mixed with superabsorbent polymers (SAPs): An NMR study combined with additional methods. Materials 2019, 12, 315. [Google Scholar] [CrossRef] [Scilit]
- Liu, D.; Du, X.; Nie, W.; Hua, S.; Liu, C.; Qin, Z. Technology development and industrial application of large-scale TRM vertical roller mill. ZKG Int. 2025, 78, 1–6. [Google Scholar] [CrossRef] [Scilit]
- Mei, S.; Wan, Z.; Xie, J.; Yang, H.; Liu, C. CFD-based multiphysics analysis of coupled combustion-decomposition interactions and NOx reduction mechanisms in an NSF-I type precalciner. ZKG Int. 2025, 78, 1–8. [Google Scholar] [CrossRef] [Scilit]
- Potyondy, D.O.; Cundall, P.A. A bonded-particle model for rock. Int. J. Rock Mech. Min. Sci. 2004, 41, 1329–1364. [Google Scholar] [CrossRef] [Scilit]
- Mas Ivars, D.; Pierce, M.E.; Darcel, C.; Reyes-Montes, J.; Potyondy, D.O.; Young, R.P.; Cundall, P.A. The synthetic rock mass approach for jointed rock mass modelling. Int. J. Rock Mech. Min. Sci. 2011, 48, 219–244. [Google Scholar] [CrossRef] [Scilit]
- Hu, W.; Kwok, C.Y.; Duan, K.; Wang, T. Parametric study of the smooth-joint contact model on the mechanical behavior of jointed rock. Int. J. Numer. Anal. Methods Geomech. 2018, 42, 358–376. [Google Scholar] [CrossRef] [Scilit]
- Chen, P.Y. Effects of microparameters on macroparameters of flat-jointed bonded-particle materials and suggestions on the trial-and-error method. Geotech. Geol. Eng. 2017, 35, 663–677. [Google Scholar] [CrossRef] [Scilit]
- Zhang, Y.; Shao, Z.; Wei, W.; Qiao, R. PFC simulation of crack evolution and energy conversion during basalt failure process. J. Geophys. Eng. 2019, 16, 639–651. [Google Scholar] [CrossRef] [Scilit]
- GB/T 50266-2013; Standard for Test Methods of Engineering Rock Mass. China Planning Press: Beijing, China, 2013.
- DL/T 5368-2007; Code for Rock Tests of Hydroelectric and Water Conservancy Engineering. China Electric Power Press: Beijing, China, 2007.
- Zhu, S.; He, C.; Peng, F.; Shi, A.; Yuan, D.; Zhang, W. Experimental and numerical studies on the mechanical properties of columnar jointed basalt. Adv. Civ. Eng. 2020, 2020, 6659718. [Google Scholar] [CrossRef] [Scilit]
- Sun, B.; Yang, H.; Fan, J.; Liu, X.; Zeng, S. Energy evolution and damage characteristics of rock materials under different cyclic loading and unloading paths. Buildings 2023, 13, 238. [Google Scholar] [CrossRef] [Scilit]
- National Institute of Standards and Technology. Trapezoidal Rules. In NIST Digital Library of Mathematical Functions, Section 3.5(i); National Institute of Standards and Technology: Gaithersburg, MD, USA. Available online: https://dlmf.nist.gov/3.5.i (accessed on 22 September 2026).
- Itasca Consulting Group, Inc. Energy and Dissipation Mechanisms in PFC. PFC 6.0 Documentation. Available online: https://docs.itascacg.com/pfc600/pfc/docproject/source/manual/numerical_simulations_with_pfc/pfc_formulation/energy_and_dissipation_mechanisms.html (accessed on 22 September 2026).
- Itasca Consulting Group, Inc. Flat-Joint Model: Energy Partitions. PFC 6.0 Documentation. Available online: https://docs.itascacg.com/pfc600/common/contactmodel/flatjoint/doc/manual/cmflatjoint.html (accessed on 22 September 2026).
- Itasca Consulting Group, Inc. Smooth-Joint Model: Energy Partitions. PFC 6.0 Documentation. Available online: https://docs.itascacg.com/pfc600/common/contactmodel/smoothjoint/doc/manual/cmsmoothjoint.html (accessed on 22 September 2026).
- National Institute of Standards and Technology. Coefficient of Variation. Dataplot Reference Manual. Available online: https://www.itl.nist.gov/div898/software/dataplot/refman2/ch2/coef_var.pdf (accessed on 22 September 2026).
- National Institute of Standards and Technology. Standardize. Dataplot Reference Manual. Available online: https://itl.nist.gov/div898/software/dataplot/refman2/auxillar/standard.htm (accessed on 22 September 2026).

Disclaimer/Publisher’s Note: The statements, opinions and data contained in all publications are solely those of the individual author(s) and contributor(s) and not of MDPI and/or the editor(s). MDPI and/or the editor(s) disclaim responsibility for any injury to people or property resulting from any ideas, methods, instructions or products referred to in the content. |
© 2026 by the authors. Licensee MDPI, Basel, Switzerland. This article is an open access article distributed under the terms and conditions of the Creative Commons Attribution (CC BY) license.