


Abstract
Electrical curing is a viable alternative to traditional thermal curing for geopolymer materials due to its capability for rapid and internal geopolymerization. In this research, reinforced geopolymer-based composite beams were successfully fabricated at a macroscale using a binary system of fly ash (FA) and granulated blast furnace slag (GBFS). The mixture was activated with a solution of sodium silicate (Na2SiO3) and sodium hydroxide (NaOH) with a fixed molar ratio of 2:1 for both, and aggregate-to-binder and activator-to-binder (A/B) ratios of 2.5 and 0.7, respectively. To ensure electrical conductivity, individual fiber systems were employed, including carbon fiber (CF), steel fiber (SF), and waste wire erosion (WWE), each incorporated at a dosage of 0.5 vol.% of the total mix volume. In addition, carbon black (CB) was introduced as a conductive filler at a constant dosage of 2.0 vol.% of the binder content in selected specimens. Each beam specimen contained only one type of conductive reinforcement or filler. A total of twelve reinforced geopolymer-based composite beams with a 150 mm square section and a span of 1300 mm, with a clear span of 1200 mm, were successfully cast and reinforced based on reinforced concrete beam designs and standards, with a dominant goal of enhancing beam behavior under flexure. The beams were cured in ambient curing conditions, or using thermal curing at 80 °C for 24 h, and using electrical curing from the fresh states with a fixed voltage of 25 V. Notwithstanding a common beam size and reinforcement pattern, distinct curing methods significantly influenced beam structure properties. Peak loads were between 20.8 and 31.5 kN, initial stiffness between 1.75 and 6.09 kN/mm, and total energy absorption between 690 and 1550 kN/mm, with a post-peak energy component of between 0.12 and 0.55. Displacement-based ductility measures spanned from 3.2 to 8.1 units with a distinct improvement in electrical curing regimes, especially in the SF-reinforced specimens; this indicates that electrical curing in reinforced geopolymer composite materials works as a governing mechanism in performance rather than simply a method for enhancing the strength of materials.
1. Introduction
The structural behavior in cementitious systems has long been interpreted through the combined effects of material composition, reinforcement strategy, and applied loading, while curing has traditionally been regarded as a secondary processing step rather than a governing parameter of mechanical response. This conceptual separation has shaped most experimental studies on both ordinary Portland cement (PC) and geopolymer systems, despite the fact that geopolymerization is fundamentally governed by kinetically sensitive aluminosilicate reactions whose progression is directly dependent on the manner in which energy is supplied during curing [1,2,3,4]. Unlike other cementitious systems based on hydration reactions, geopolymer matrices undergo a series of dissolution reactions based on the transport of aluminate and silicate ions, and subsequent polycondensations within a three-dimensional network of Si-O-Al bonds, which largely depend on curing temperatures and thermal gradients. Based on this critical understanding, curing in geopolymer systems thus holds a promising prospect in not just affecting early strengths but also microstructural integrity, interfacial transition zones, resistance to cracking, stiffness, and cracking behavior in geopolymer systems under a structural setup. Although geopolymer systems have emerged as a widely attractive option in the literature due to their superior mechanical durability, resistance to aggressive environments, and excellent sustainability compared to PC systems, most studies conducted under a structural arrangement have largely focused on curing under indoor or outdoor thermal conditions, where curing is treated as a contributing factor rather than a secondary factor influencing the behavior of geopolymer systems [5,6,7].
Most beam-scale studies have reported that geopolymer mortars and concretes exhibit superior mechanical performance compared to conventional systems, particularly in terms of load-carrying capacity, fatigue resistance, and energy absorption under dynamic loading conditions. Thakur et al. [8] attributed this behavior to the formation of a dense aluminosilicate gel network, which enhances stiffness and resistance at the structural level. Similarly, Kılıc et al. [9] demonstrated that geopolymer-based systems used for strengthening and rehabilitation applications led to increased span capacity, improved ductility, and enhanced energy dissipation under beam-scale loading. In addition, a distinct literature stream has emerged addressing electrical curing as a novel activation technique, particularly in geopolymer composites as pastes or mortars. In this technique, electrical potential is used to create a Joule heating effect in the composite, leading to accelerated geopolymerization, improved pore morphology, and increased mechanical strength at an early age. These studies have demonstrated that electrical curing can support volumetric and intrinsically distributed thermal activation and overcome external thermal curing problems such as irregular thermal gradients and high energy requirements. Furthermore, while establishing a direct correlation with the electrical conductivity of geopolymer matrices in these studies, there has been an increased interest in using conductive fillers, such as carbon fibers [10,11], steel fibers [12,13], carbon black [14,15], and metal inclusions, to create permeable conductive pathways with sufficient conductivity to allow for the flow of electric current. While these types of conductive pathways have proven effective in enhancing thermal activation, they have also shown specific effects on stress redistribution, crack-stopping capacity, and post-cracking behavior in geopolymer composites, particularly in fiber-reinforced geopolymer composites. A distinct level of progress in this area remains bound to small specimens and have not considered the intricate stress states, cracking mechanics, and stiffness degradation in geopolymer composites governing the behavior of structural members (such as geopolymer-based composite beams); as such, investigations and studies covering geopolymer-based composite beams, in terms of their resistance to brittle and fatigue failures, bonding performance, exposure to high temperatures, and efficiency of subsequent strengthening, have not focused on electrical curing variables but have remained bound to conventional thermal curing methods, whereas other parameters, such as reinforcement materials, fiber volumes, and exposure levels, have gained prominence [16,17]. Evidently, this distinct separation in the literature implies an evident critical knowledge gap in this domain, where an apparent need has emerged to establish an inclusive platform integrating electrical curing [16,17,18,19], conductive geopolymer composites, and geopolymer-based composite beam mechanics.
Beams, being fundamentally different in scale and complexity when contrasted with research conducted using mortar specimens, possess intricate non-uniformities in mechanical behavior, including non-uniform stressing, the initiation of transverse cracks, crack progression in geopolymer-based composite beams, and intricate energy dissipation patterns strongly susceptible to internally inhomogeneous geopolymer composites. On the other hand, when electrical curing is facilitated by an internal conductive pathway, a possibility arises for volumetric, controlled, and mutually compatible activations evolving simultaneously with the internal stress field of a beam. Furthermore, if conductive fibers or fillers are incorporated into geopolymer-based composite beams, in essence, an electro-mechanical coupling situation arises where microstructural formations, micro-cracking, and subsequent micro-cracking-healing in geopolymer-based systems proceed simultaneously rather than in a serendipitous and progressive manner. Under these circumstances, the electrical curing of geopolymers can hardly be classified under strength augmentation methodologies but rather under a governing principle, where stiffness, inter-crack distances, width of cracks, ductility, and energy absorption characteristics—structural parameters of immense importance—could be comprehensively controlled. Some recent studies focusing on geopolymer-based composite beams have concentrated on their fracture mechanics, fatigue performance, and size effects, while others have highlighted enhanced bonding performance, flexural, and durability performance when used in geopolymer matrices in a structural or rehabilitation capacity [8,20,21,22,23]. However, not a single research work has attempted to describe the impact of an internally developed curing phenomenon, which can be externally controlled via electrical conduction, on the structural performance of geopolymer-based composite beams.
In this context, this study aimed to fill this gap by introducing electrical curing as an internally generated but externally controlled activation mechanism and extending its application from geopolymer composite at the material scale to structural elements at the beam scale. The experimental scope was deliberately designed to ensure clarity and interpretability by focusing on geopolymer-based composite beams reinforced with macro fibers and incorporating conductive fillers, while isolating the influence of electrical curing from the mechanical crack-bridging contribution of the fibers. Electrical curing allows for the generation of internal heat within the geopolymer matrix at controlled low-voltage levels, promoting a more homogeneous curing process compared to conventional external curing methods. Particular attention was paid to the transfer of electrical curing to beam-scale elements, where internal current flow and curing homogeneity become critical for structural response. Rather than treating the curing process as a secondary step, the research directly links the curing strategy to structural performance by evaluating load–strain behavior, crack formation and propagation, hardness reduction, ductility, and energy dissipation capacity under bending load. Although the experimental framework is intentionally limited, this focused approach allows for the investigation of the combined effects of electrical curing and structural behavior without excessive parameter interaction, providing a clear and structurally relevant contribution to the understanding of geopolymer beam performance. Accordingly, this study focuses on the bending behavior of geopolymer-based beams subjected to electrical curing, with particular emphasis on load–strain response, crack development, and deformation capacity.
2. Materials and Methods
2.1. Material Properties
The mixture design was designed in a way that it can strike a balance between the structural properties, crack control, and electrical properties of the geopolymer composite. Granulated blast furnace slag (GBFS) (Oyak Cement, Istanbul, Türkiye) and class F fly ash (FA) (Catalagzı, Zonguldak, Türkiye) were chosen as the aluminosilicate source materials (Table 1), and natural sand was used as the fine aggregate. The alkaline solution for activation came from a high-purity sodium hydroxide (NaOH) (AS Kimya, Istanbul, Türkiye) solution of 99% purity and a commercial solution of sodium silicate (Na2SiO3) (AS Kimya, Istanbul, Türkiye) with 27.2% SiO2 and 8.2% Na2O, with a pH of 11–12.4. Improved load transfer properties and efficiency in crack-bridging came from the addition of 35 mm hook-ended steel fibers (SF) (Table 2) and 35 mm SIGRAFIL (SGL Carbon, Wiesbaden, Germany) chopped carbon fibers (CF) (Table 3) of 1.80 g/cm3 density. Electrical conductivity properties came from the incorporation of CuZn37-alloy-based waste wire erosion fibers of 0.25 mm in diameter and 35 mm in length, obtained from electrical discharge machines. Carbon black (CB) (Ecosave, Istanbul, Türkiye) in powder form with carbon content was used as a filler due to its conductivity properties, which are widely used in the polymer and rubber industries (Table 4).

Table 1.
Chemical composition of materials.
Table 2.
Physical properties of steel fiber.
Table 3.
Properties of carbon fiber.
Table 4.
Properties of carbon black.
2.2. Mix Design
The mixtures had a sand-to-binder ratio of 2.5, an activator-to-binder (A/B) ratio of 0.70, and a Na2SiO3/NaOH (12 M) ratio of 2:1. The binder phase consisted of GBFS and FA, which were jointly used in the mix design. To enhance the electrical conductivity of the geopolymer-based composite beams, CB was incorporated as a conductive filler at a constant dosage of 2 vol.% concerning the binder, whereas CF, SF, and WWE fibers were each introduced at a vol. ratio of 0.5% relative to the total mix volume (Table 5). Based on the mix design described above, an experimental matrix was established to assign fiber systems and curing regimes to the beam specimens, as detailed in Table 6.
Table 5.
Mix proportions and constituent dosages for geopolymer-based composite beams.
Table 6.
Experimental matrix of geopolymer-based composite beam specimens.
During the mixing and casting process, neither agglomeration nor fiber grouping was observed in the samples, regardless of the type of curing. The gradual and step-by-step process of adding the fibers to the geopolymer matrix helped promote an ideal level of fiber dispersion and workability. However, it is important to note that the application of thermal and electrical curing occurred only after casting and setting. Moreover, the relatively fine fiber geometry combined with the cohesive and adhesive nature of the geopolymer matrix prevented fiber floating and entanglement. These observations confirm that neither thermal nor electrical curing promoted fiber balling in the geopolymer-based composite beams.
To analyze the effect of curing method on the structural performance of geopolymer-based composite beams, three different curing methods were used.
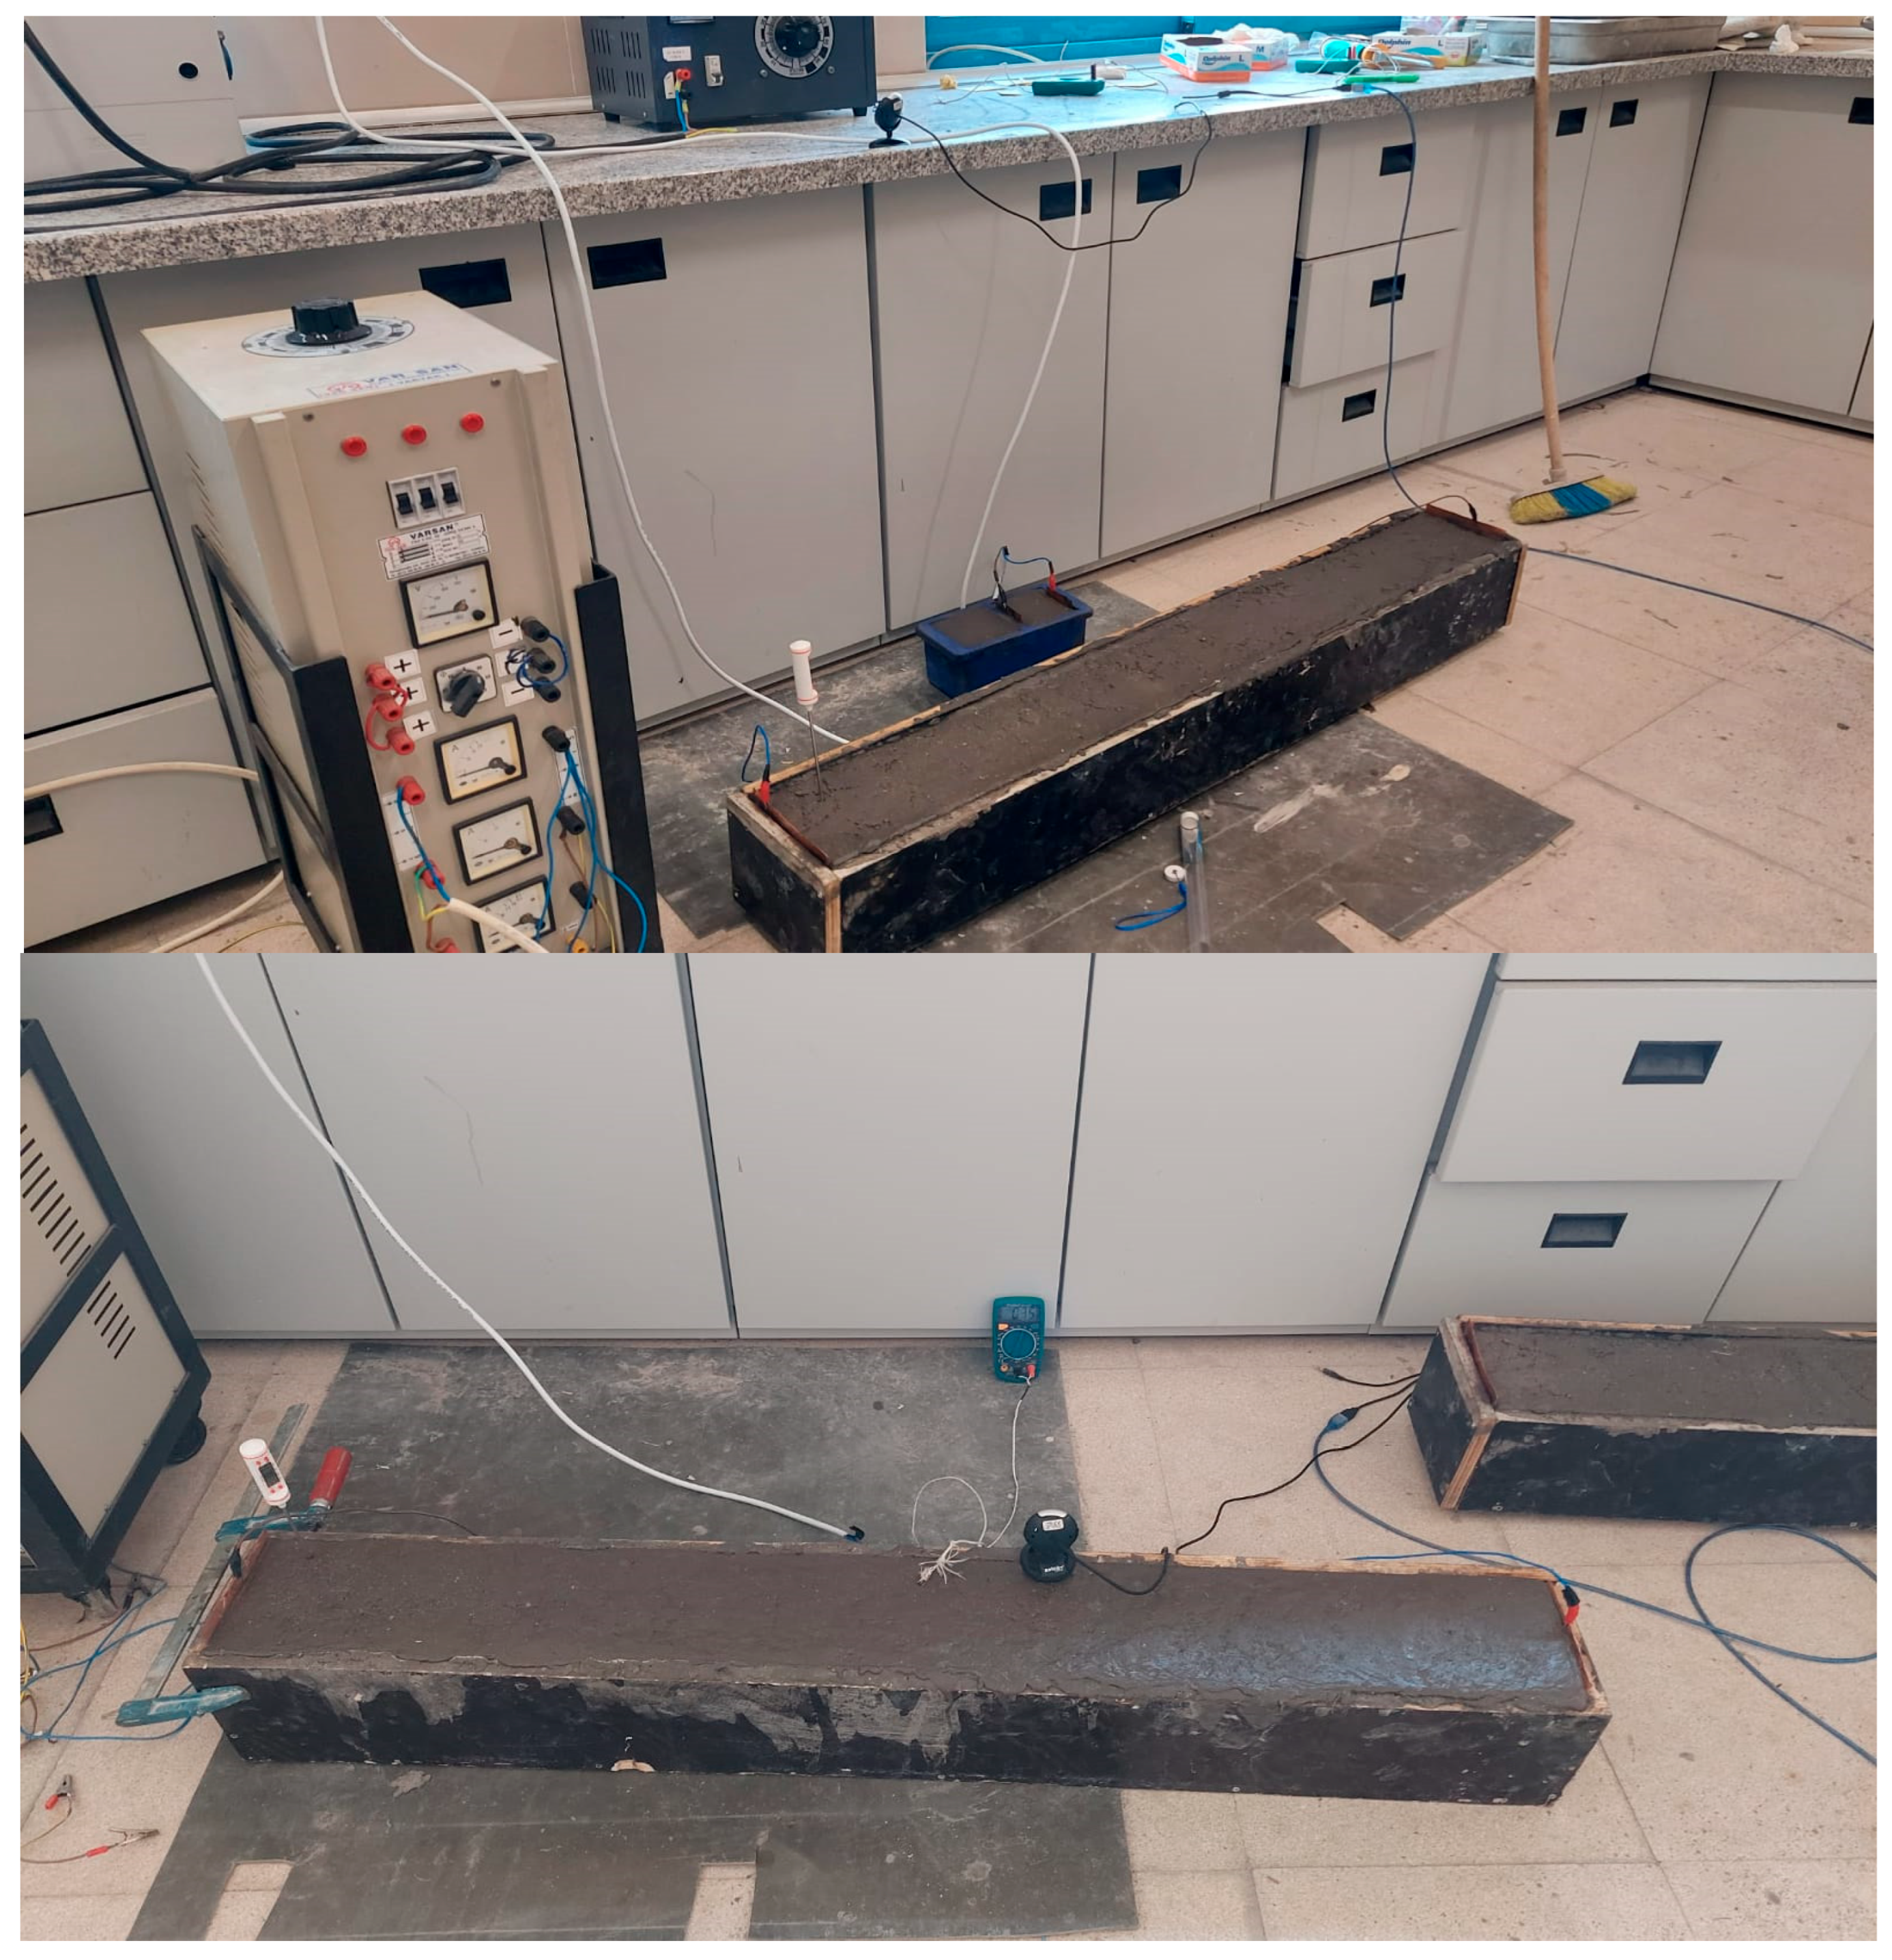
In the first curing approach, the specimens were retained in their molds for a period of 24 h and then removed from the mold and stored in a laboratory environment (23 ± 2 °C and 95% RH) until the time of testing, which was 28 days. This curing method simulates the conditions that exist in the natural environment, in which beams are cast and then allowed to cure. For the second curing approach, the specimens were held in the mold for 24 h, removed, and then underwent thermal curing in an oven set at 80 °C for 24 h. Finally, all specimens were placed back in the room conditions with a temperature range of 23 ± 2 °C and an RH level of 95% for 28 days before testing. The choice of a curing temperature of 80 °C was informed by a preliminary test. The third curing approach was performed through electrically assisted curing. For this particular set of specimens, they were retained in molds for a period of 24 h and subjected to an electric field with an application of an alternating current (AC) voltage of 25 V in laboratory conditions of 23 ± 2 °C and 95% RH. Specimens were also placed in molds with copper plates lining their sides to facilitate electric current passing through the new geopolymer for an electric current-assisted curing period of 24 h. After the completion of the electric current treatment process, the specimens were cast out of molds and allowed to cure for 28 days under laboratory conditions before mechanical testing. The approach was intended to be an alternative to oven drying with the goal of inducing self-heating for geopolymer consolidation (Figure 1).
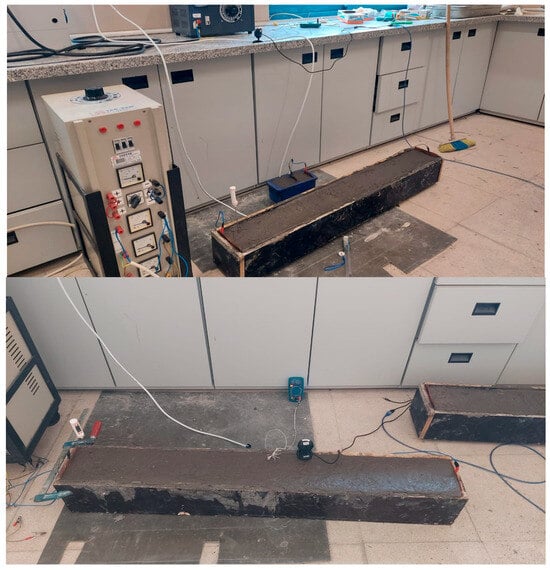
Figure 1.
Electrical curing arrangement for geopolymer-based composite beams under controlled laboratory conditions.
During the electrical curing process, the applied current was monitored at 30 min intervals using a computer-based imaging system, and the corresponding current–time relationships were subsequently established. In parallel, internal temperature development within the geopolymer beams was continuously recorded using a data logger to track Joule heating effects. The electrical response of the specimens was interpreted in accordance with Ohm’s law, which relates voltage (V), current (I), and electrical resistance (R) through the expression:
V = I·R
The electrical resistance is governed by the intrinsic resistivity (ρ) of the material as well as its geometric characteristics, and can be expressed as:
where L is the effective length of the current path, and A is the cross-sectional area. Since resistivity is an inherent material property and is inversely related to electrical conductivity (σ), variations in current flow during curing were attributed to both temperature evolution and changes in the internal microstructure of the geopolymer matrix.
R = ρ·L/A
Preliminary trial-stage procedures and pre-casting observations conducted prior to the main experimental program are documented in Appendix A.
2.3. Beam Preparation
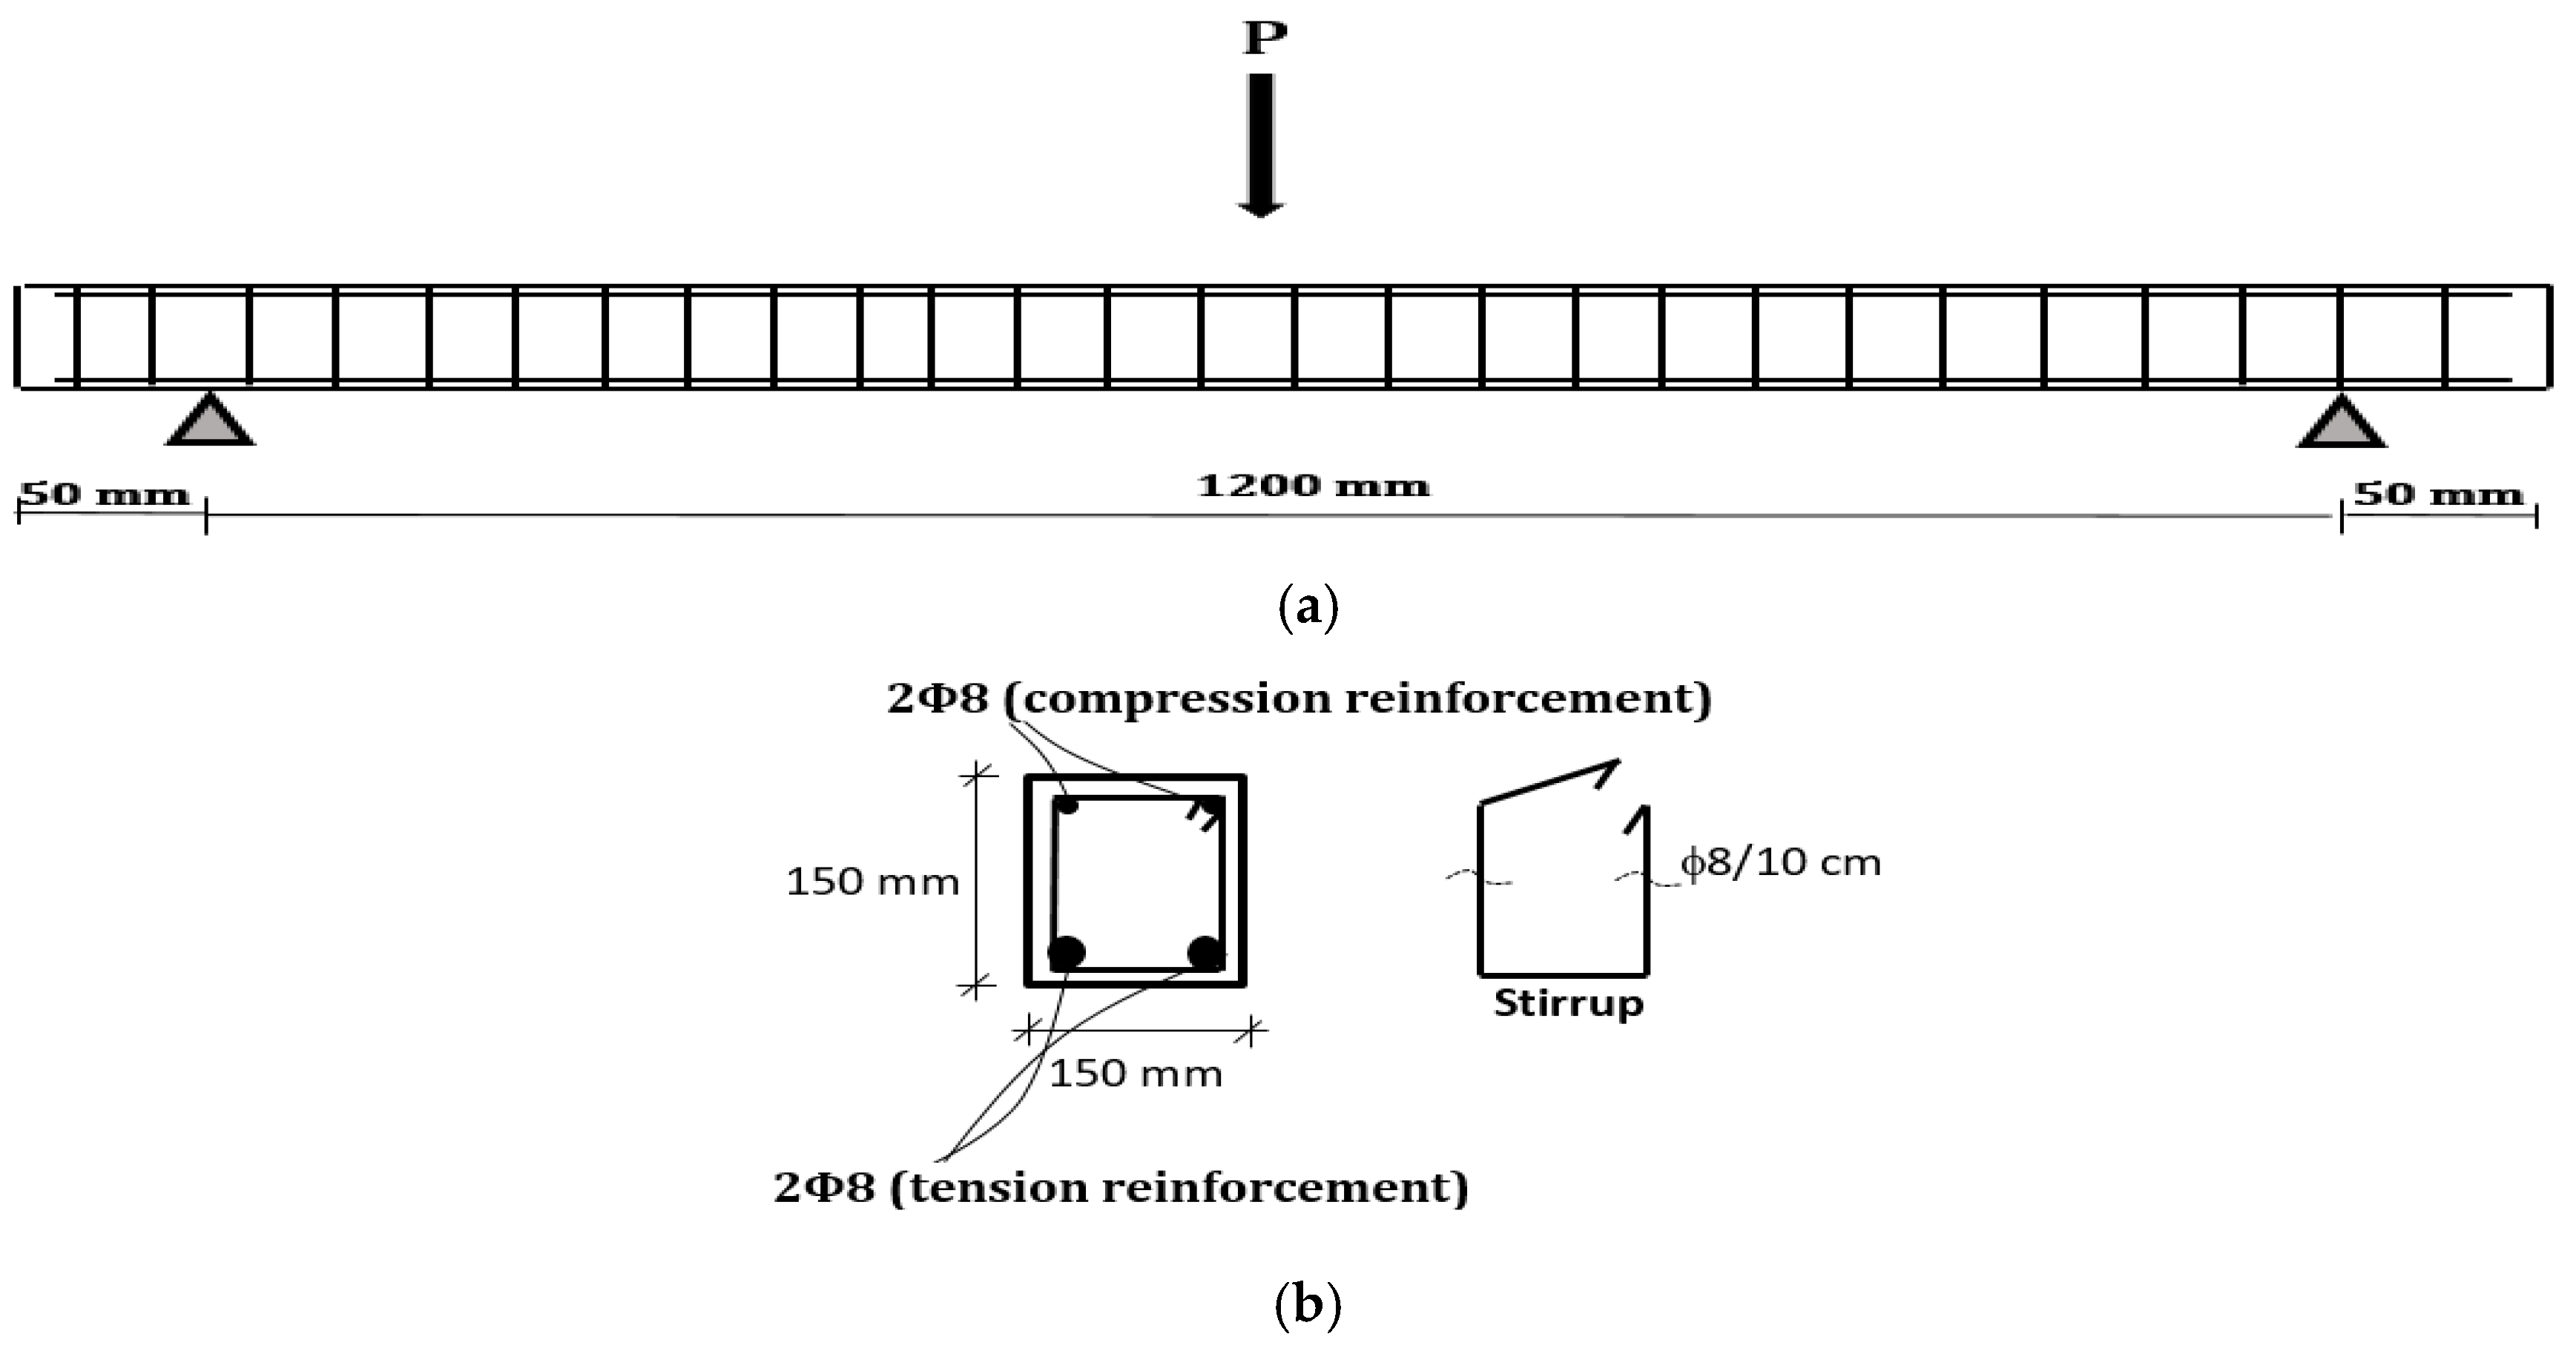
An experimental program for the beam specimens was designed in accordance with structural engineering design principles and the detailing philosophy of ACI 318-11 [24] to ensure flexural behavior and to prevent premature shear failure, thereby enabling a controlled and reliable evaluation of the structural response of geopolymer-based composite beams (Figure 2).
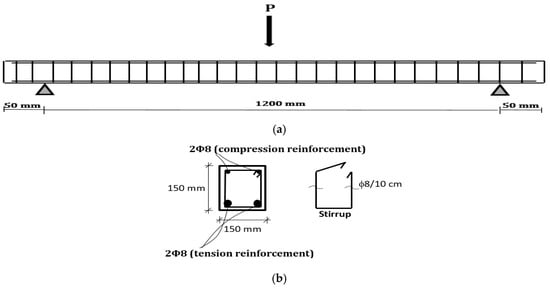
Figure 2.
Geometric dimensions, loading configuration, and reinforcement details of the reinforced geopolymer-based composite beam: (a) Three-point bending test setup, (b) cross-section and reinforcement layout.
A total of 12 fiber-reinforced geopolymer-based composite beams were produced with identical geometry, reinforcement detailing, and curing duration, while differences were limited to the curing regime and the type of macro fiber used (CF, SF, or WWE), with carbon black added separately as a conductive filler. The beam specimens were designed with a square cross-section of 150 mm × 150 mm. The nominal concrete cover was taken as 25 mm. Both the longitudinal and transverse reinforcements consisted of steel bars with a diameter of 8 mm, and the stirrup spacing was fixed at 100 mm along the beam length. Based on these parameters, the effective cover to the centroid of the tensile reinforcement was calculated as d′ = 25 + 8/2 = 29 mm, resulting in an effective depth of d = 150 – 29 = 121 mm. Beam width was defined as bw = 150 mm. Compliance with the reinforcement ratio limitations specified in ACI 318-11 [24] and TSE 500 [25] was verified, and it was confirmed that the flexural reinforcement ratio satisfied the code requirements, while the volumetric stirrup ratio remained below 0.03. To promote flexural-governed behavior, the shear span-to-effective depth ratio (a/d) was conservatively selected as 4.96. Accordingly, the shear span was calculated as a = 600 mm, and since a single concentrated load was applied at midspan, the distance between supports was determined as 2a = 1200 mm. To ensure stable boundary conditions and to avoid edge effects during testing, an additional length of 50 mm was provided at each end beyond the support locations, resulting in a total beam length of 1300 mm. All beam specimens were reinforced using identical longitudinal and transverse reinforcement layouts. In the design calculations, concrete class C30 and high-strength reinforcing steel with a yield strength of fy = 550 Mpa were considered for the tensile reinforcement. Based on preliminary design calculations conducted within the scope of the study, the nominal flexural moment capacity of the beam specimens was calculated as Mr = 7.99 kN·m. Under the adopted three-point bending configuration, this moment capacity corresponds to an applied load level of approximately P = 26.63 kN, at which flexural failure was expected to occur. In contrast, the shear capacity of the beams was intentionally designed to be significantly higher, with shear failure expected at an applied load level of approximately P = 169.62 kN. Consequently, the load-carrying capacity of the beam specimens was governed by flexural behavior. Flexural tests were carried out using a three-point bending setup under laboratory-controlled conditions. The load was applied monotonically at midspan, and both the applied load and the corresponding midspan displacement were continuously recorded throughout the test using a calibrated load cell and displacement measurement system. In experimental studies, displacement-controlled loading was conducted, with a loading rate of 50 μm/s. Three LVDTs were used for all beams. The central LVDT measured the displacement at the midspan. Two additional LVDTs were positioned to the right and left of the center, at a distance equal to the beam height of 150 mm, and vertical displacements were measured along the expected hinge length of the beams. Furthermore, flexural cracks that formed in the beams were observed throughout the entire experimental process. During testing, crack initiation, crack propagation, crack patterns, and dominant failure modes were visually observed and documented. The experimental data obtained from the beam tests were subsequently used to evaluate the load–deflection response, stiffness degradation, deformation capacity, and energy dissipation behavior of geopolymer-based composite beams subjected to different curing regimes.
2.4. Data Processing and Analytical Definitions
To provide a clear and reproducible analytical framework, the calculation methods for stiffness normalization, energy absorption, and toughness indices are formally defined below.
- (a)
- Stiffness Normalization: As discussed in Section 3.2, the normalized secant stiffness () is now formally defined as the ratio of the secant stiffness at a given load increment (Pi) to the initial secant stiffness measured at 10% of the peak load (0.1 Pmax), formulated as:
- (b)
- Energy Integration Limits: We clarified the numerical integration procedure for energy absorption (E) mentioned in Section 3.3, defining the limits from the start of loading (δ = 0) to the failure point (δu), calculated using the trapezoidal rule area under the load–deflection curve:
- (c)
- Toughness Ratios: We explicitly formulated the Toughness Ratio (TR) and Post-Peak Toughness Ratio described in Section 3.3:where Epeak corresponds to the energy absorbed up to the maximum load (Pmax).
3. Results and Discussion
3.1. Peak Load and Load-Carrying Capacity
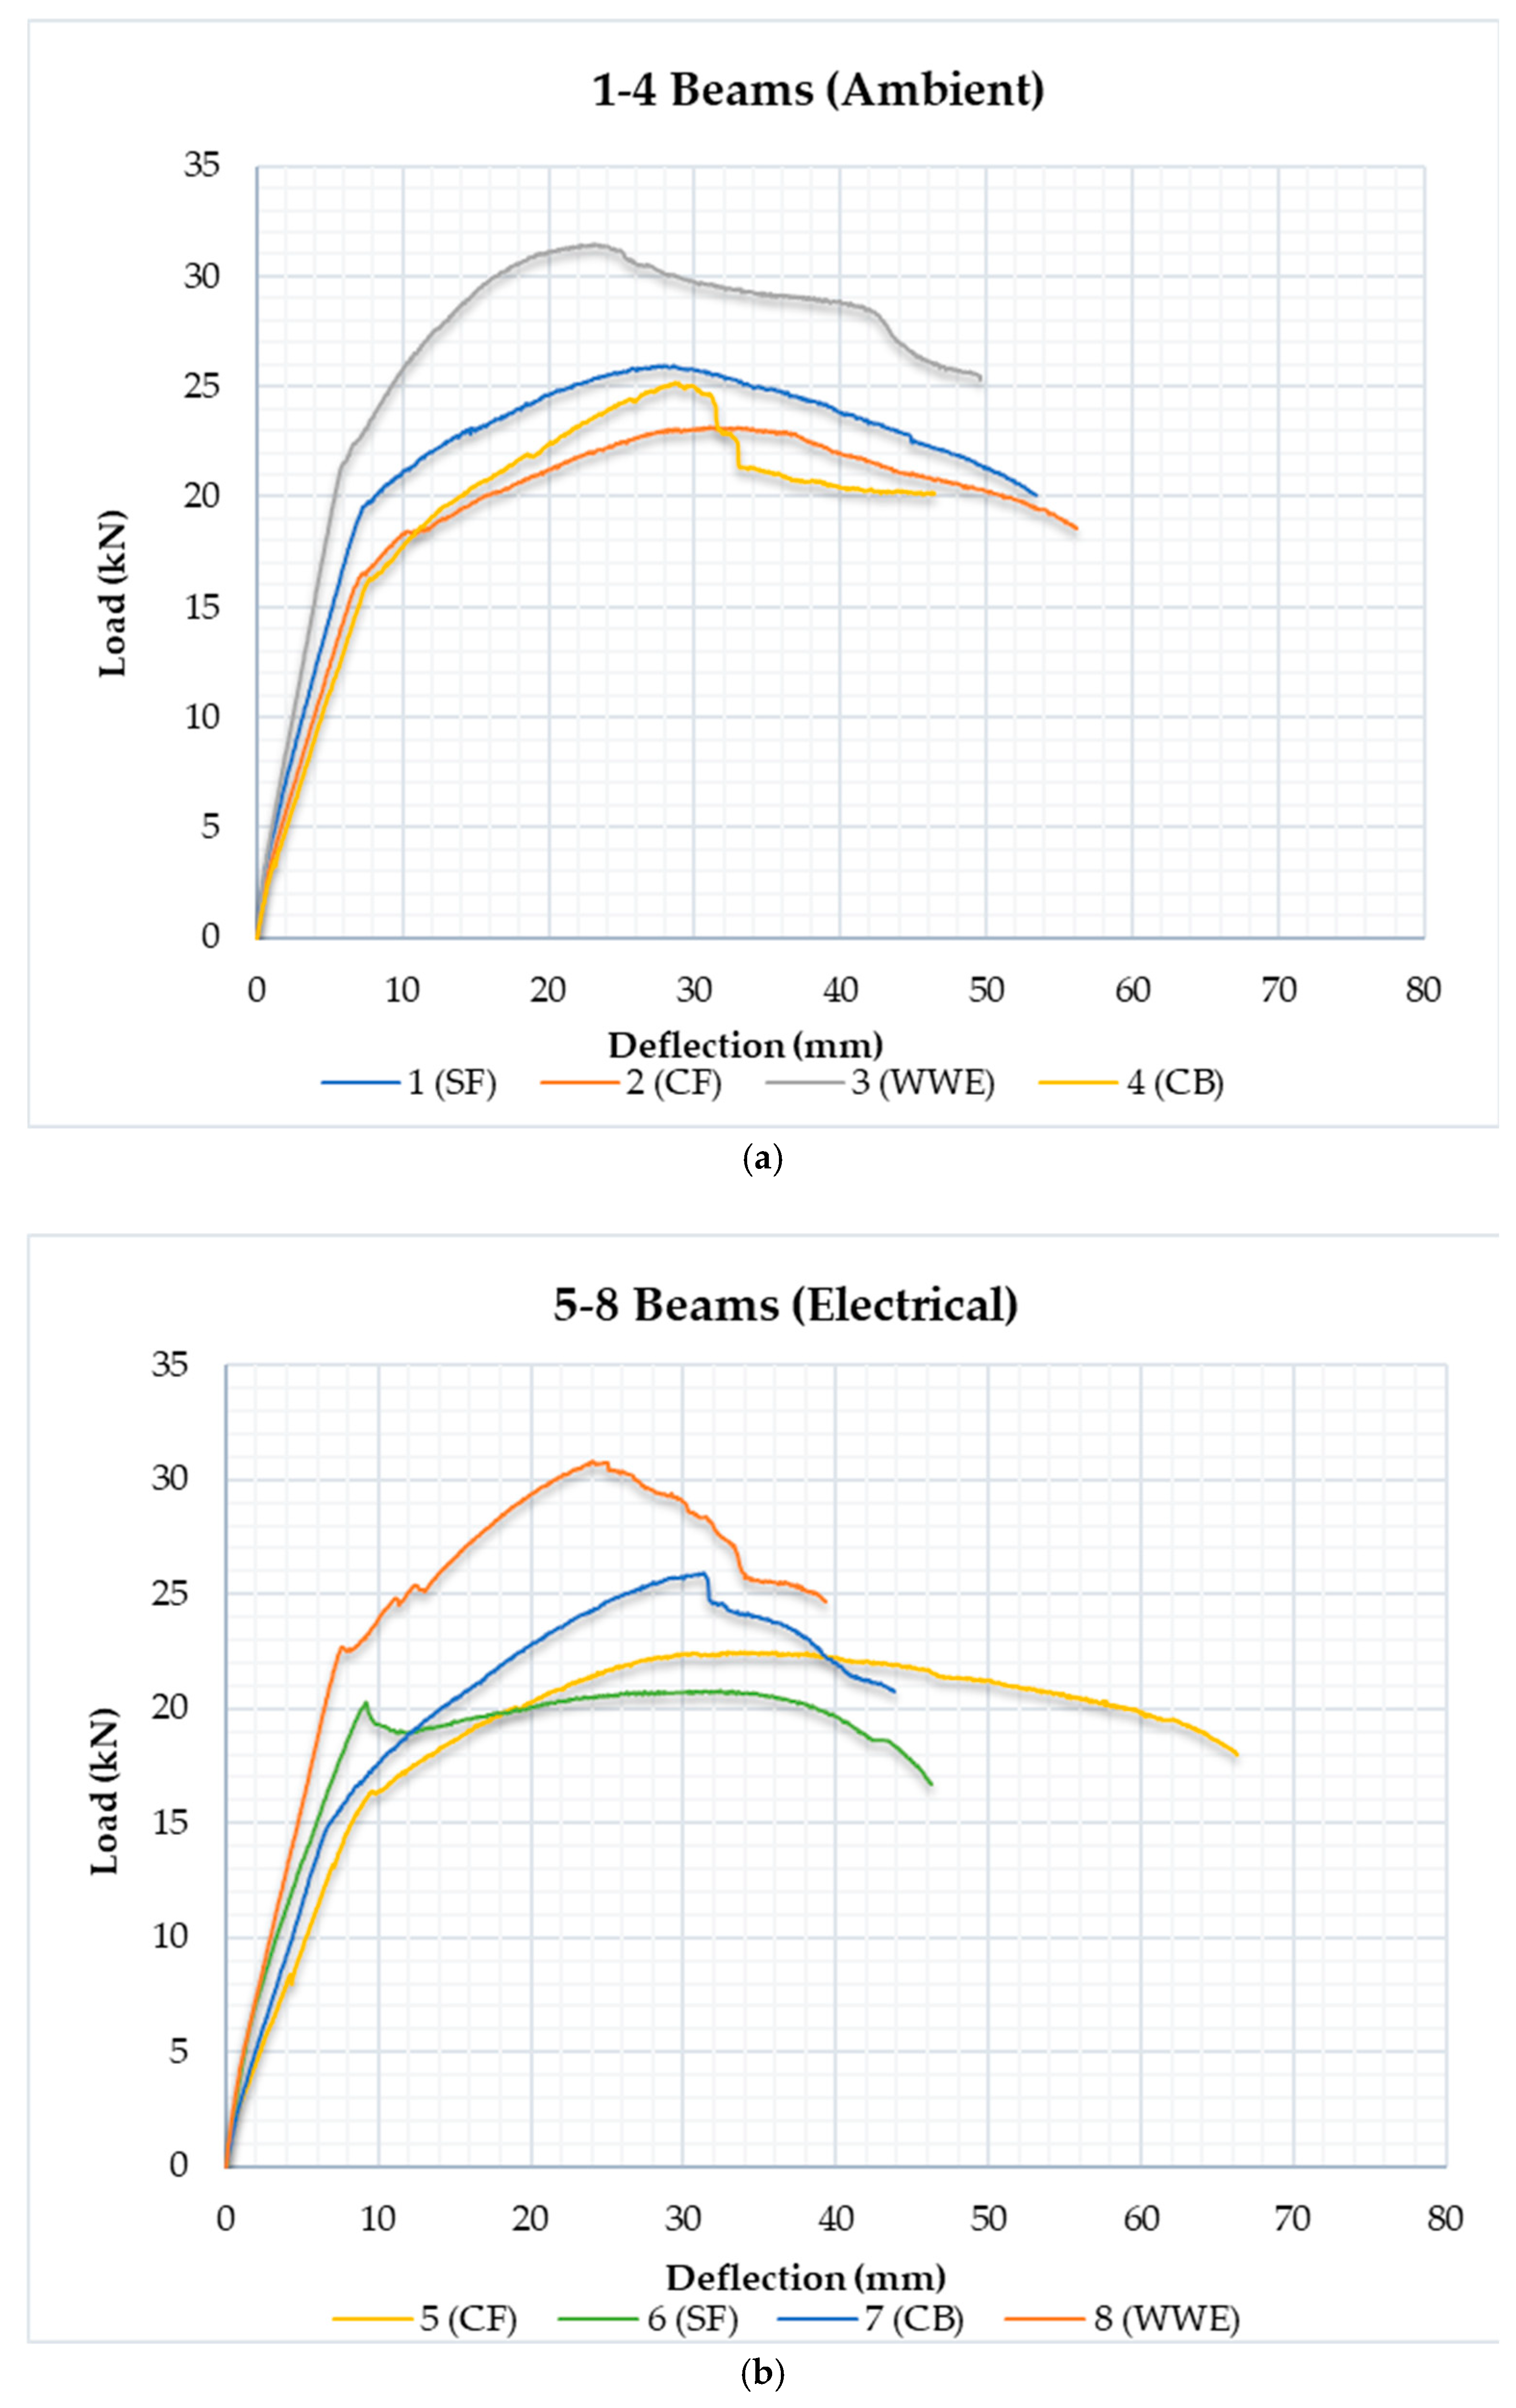
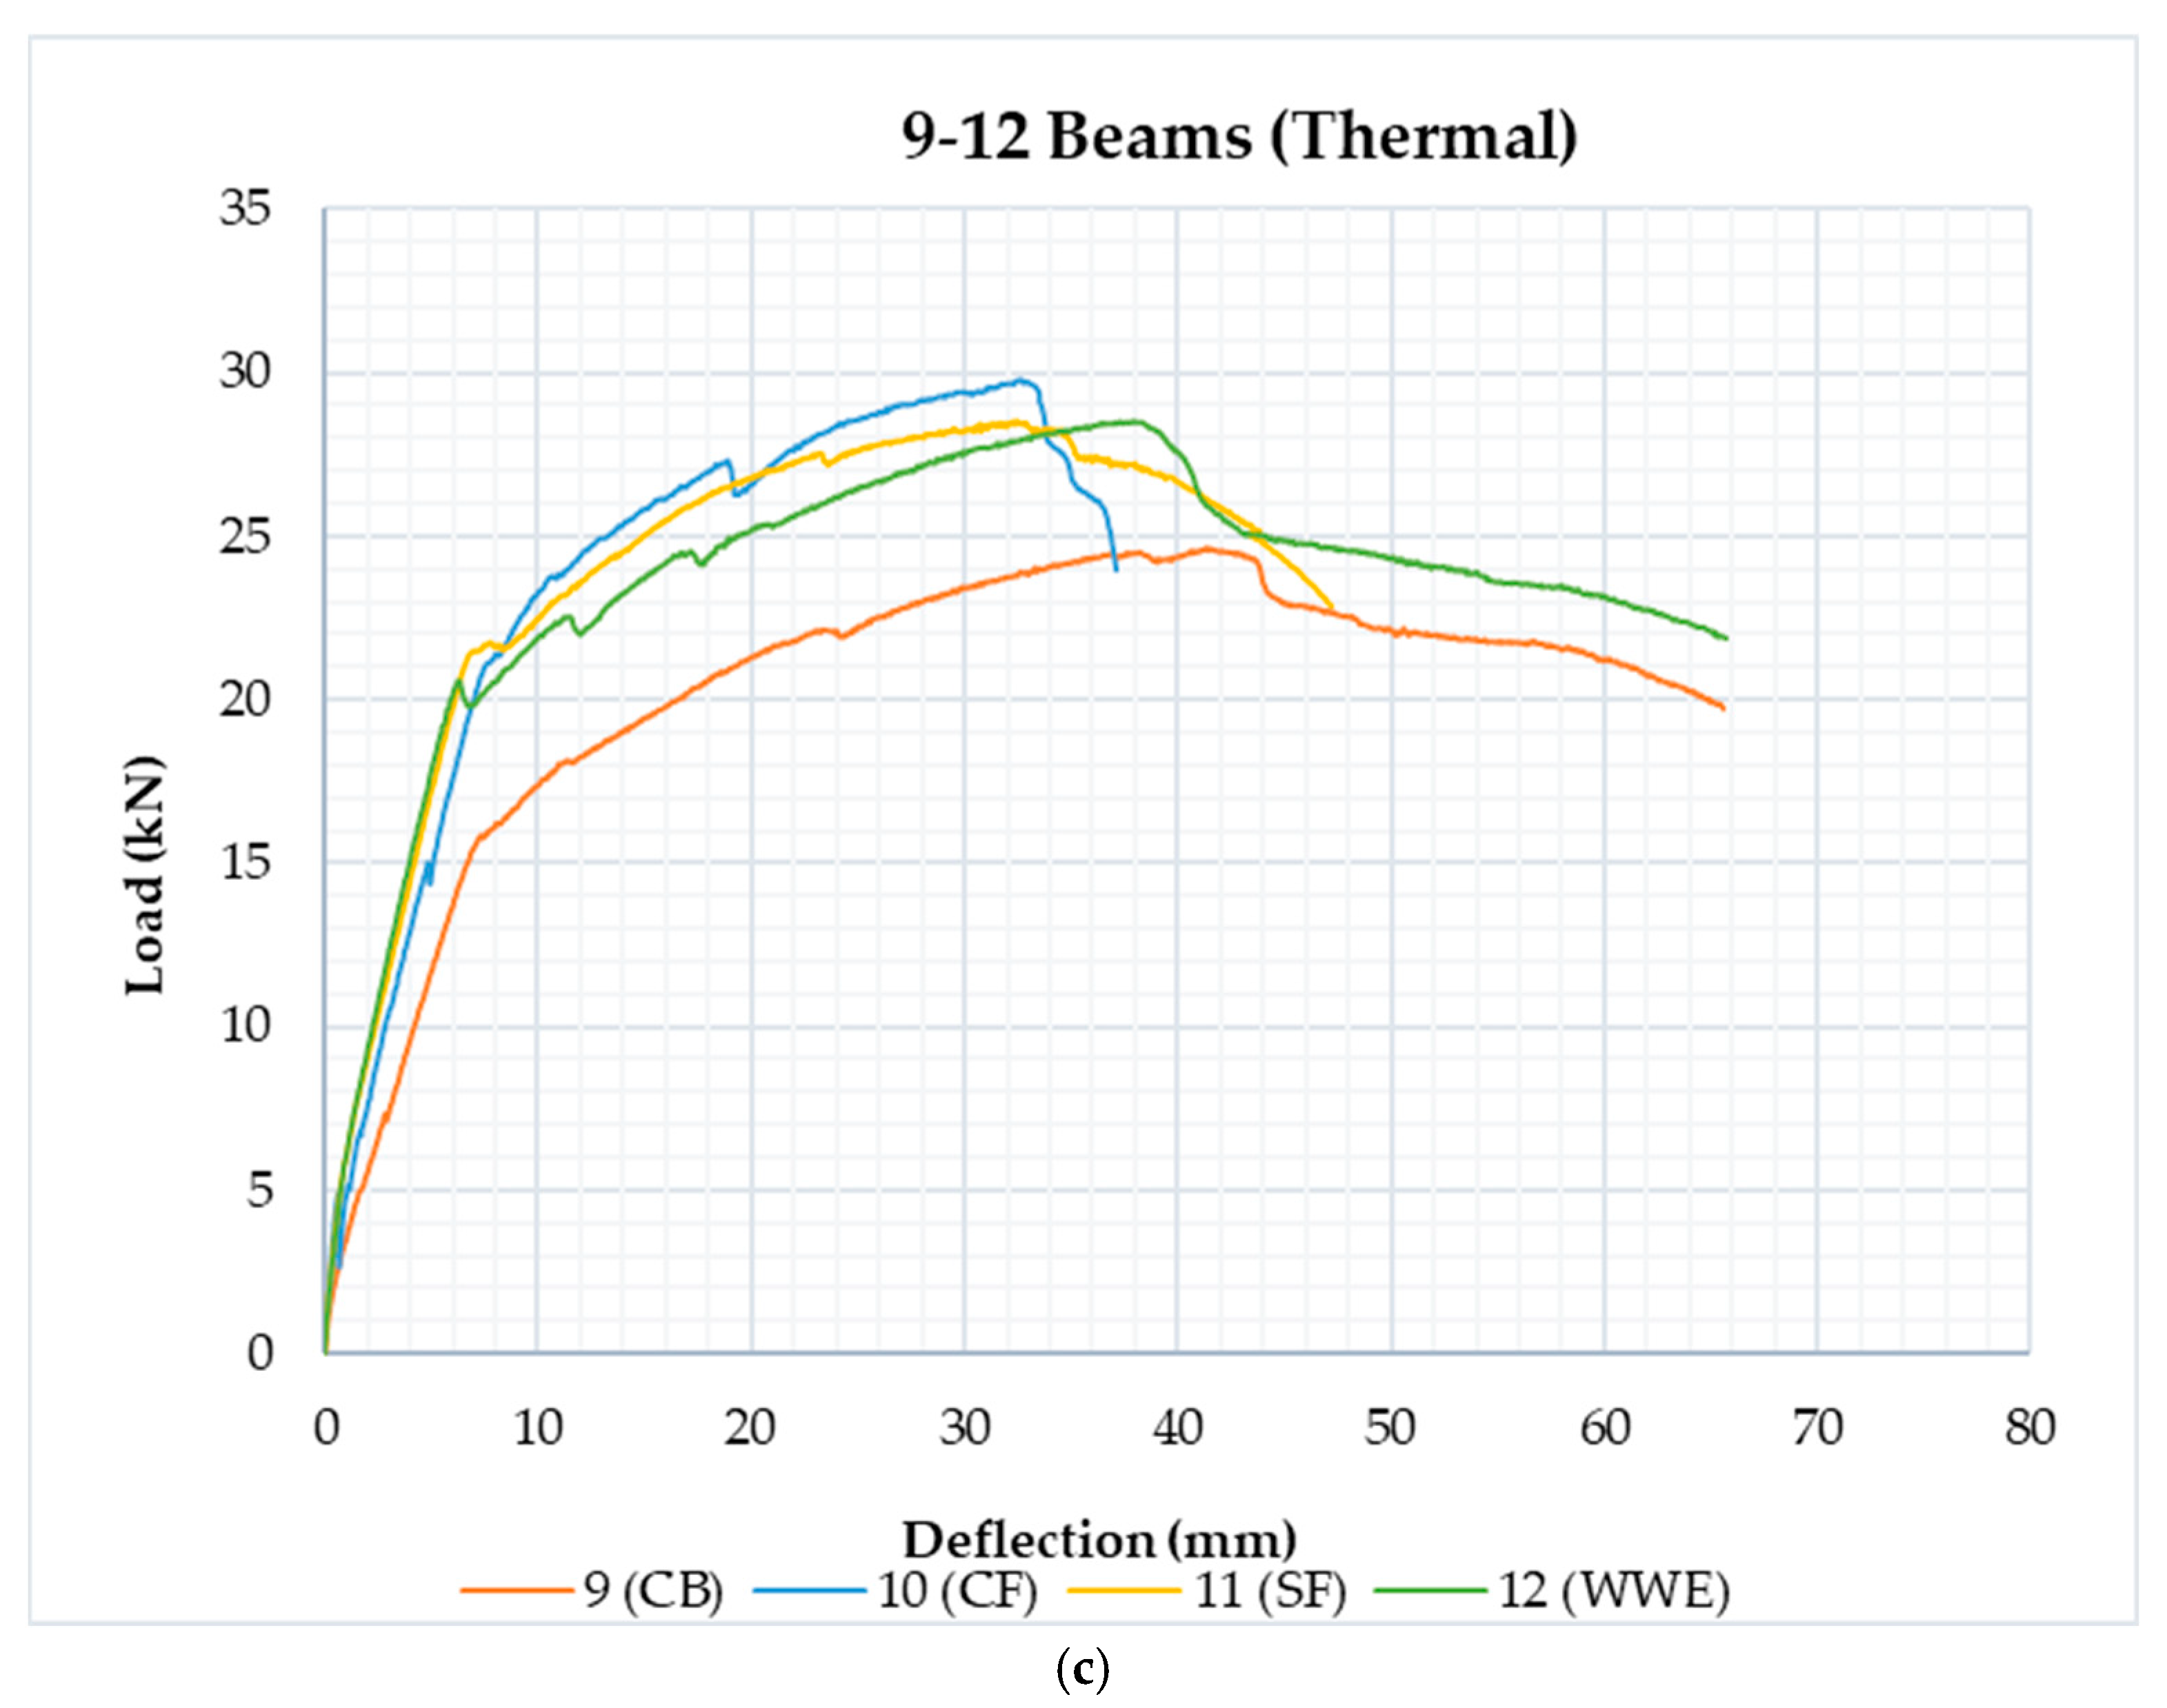
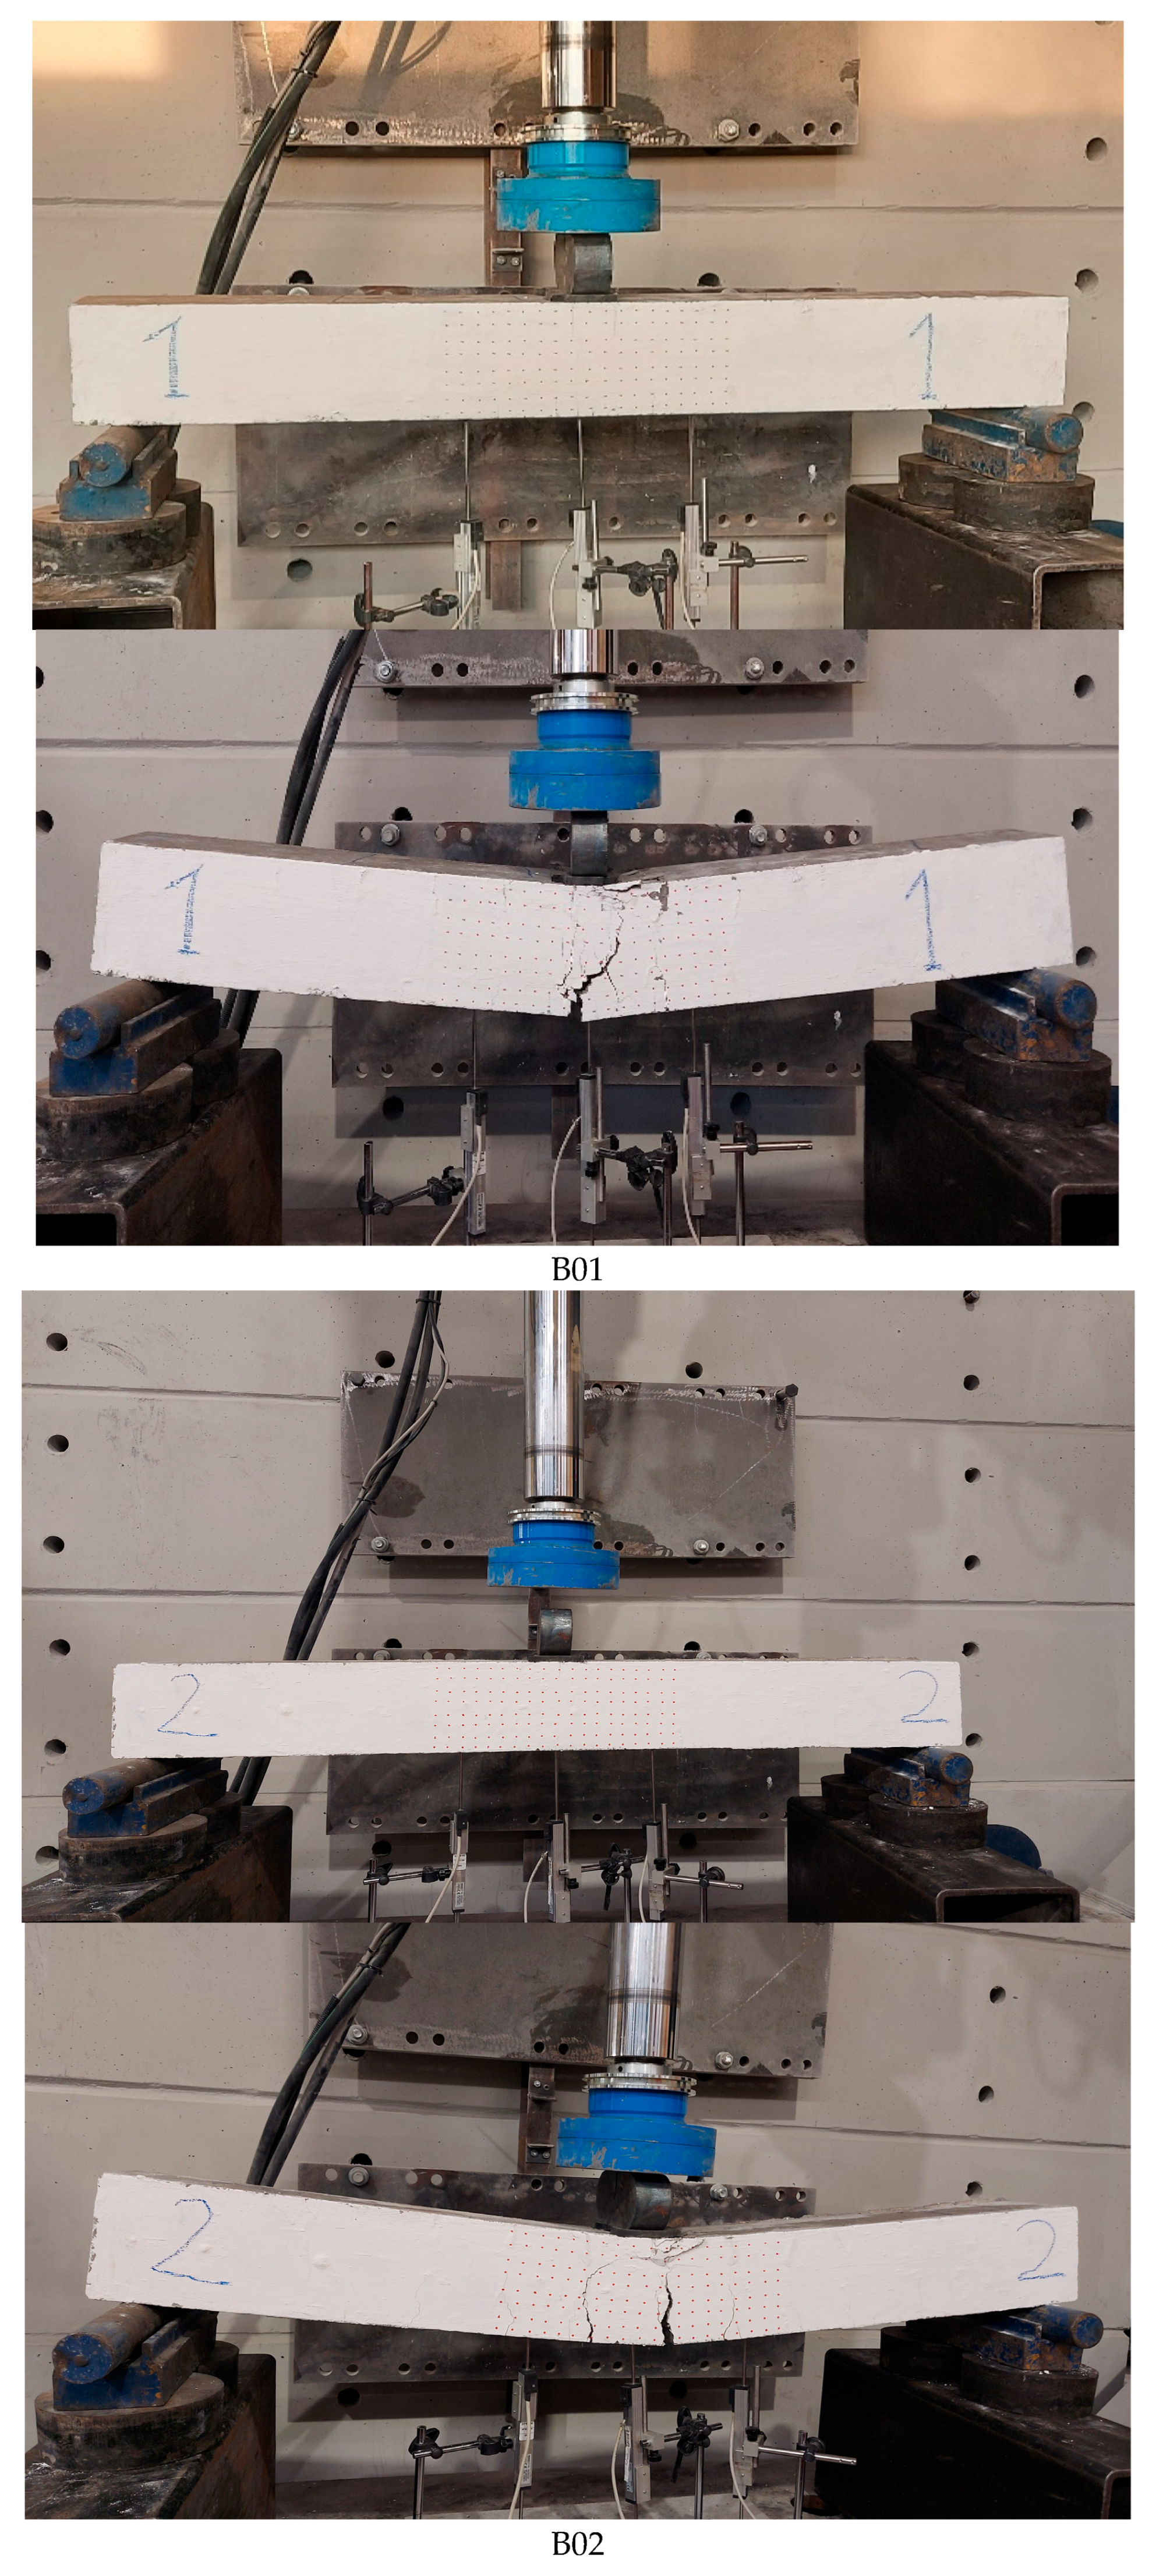
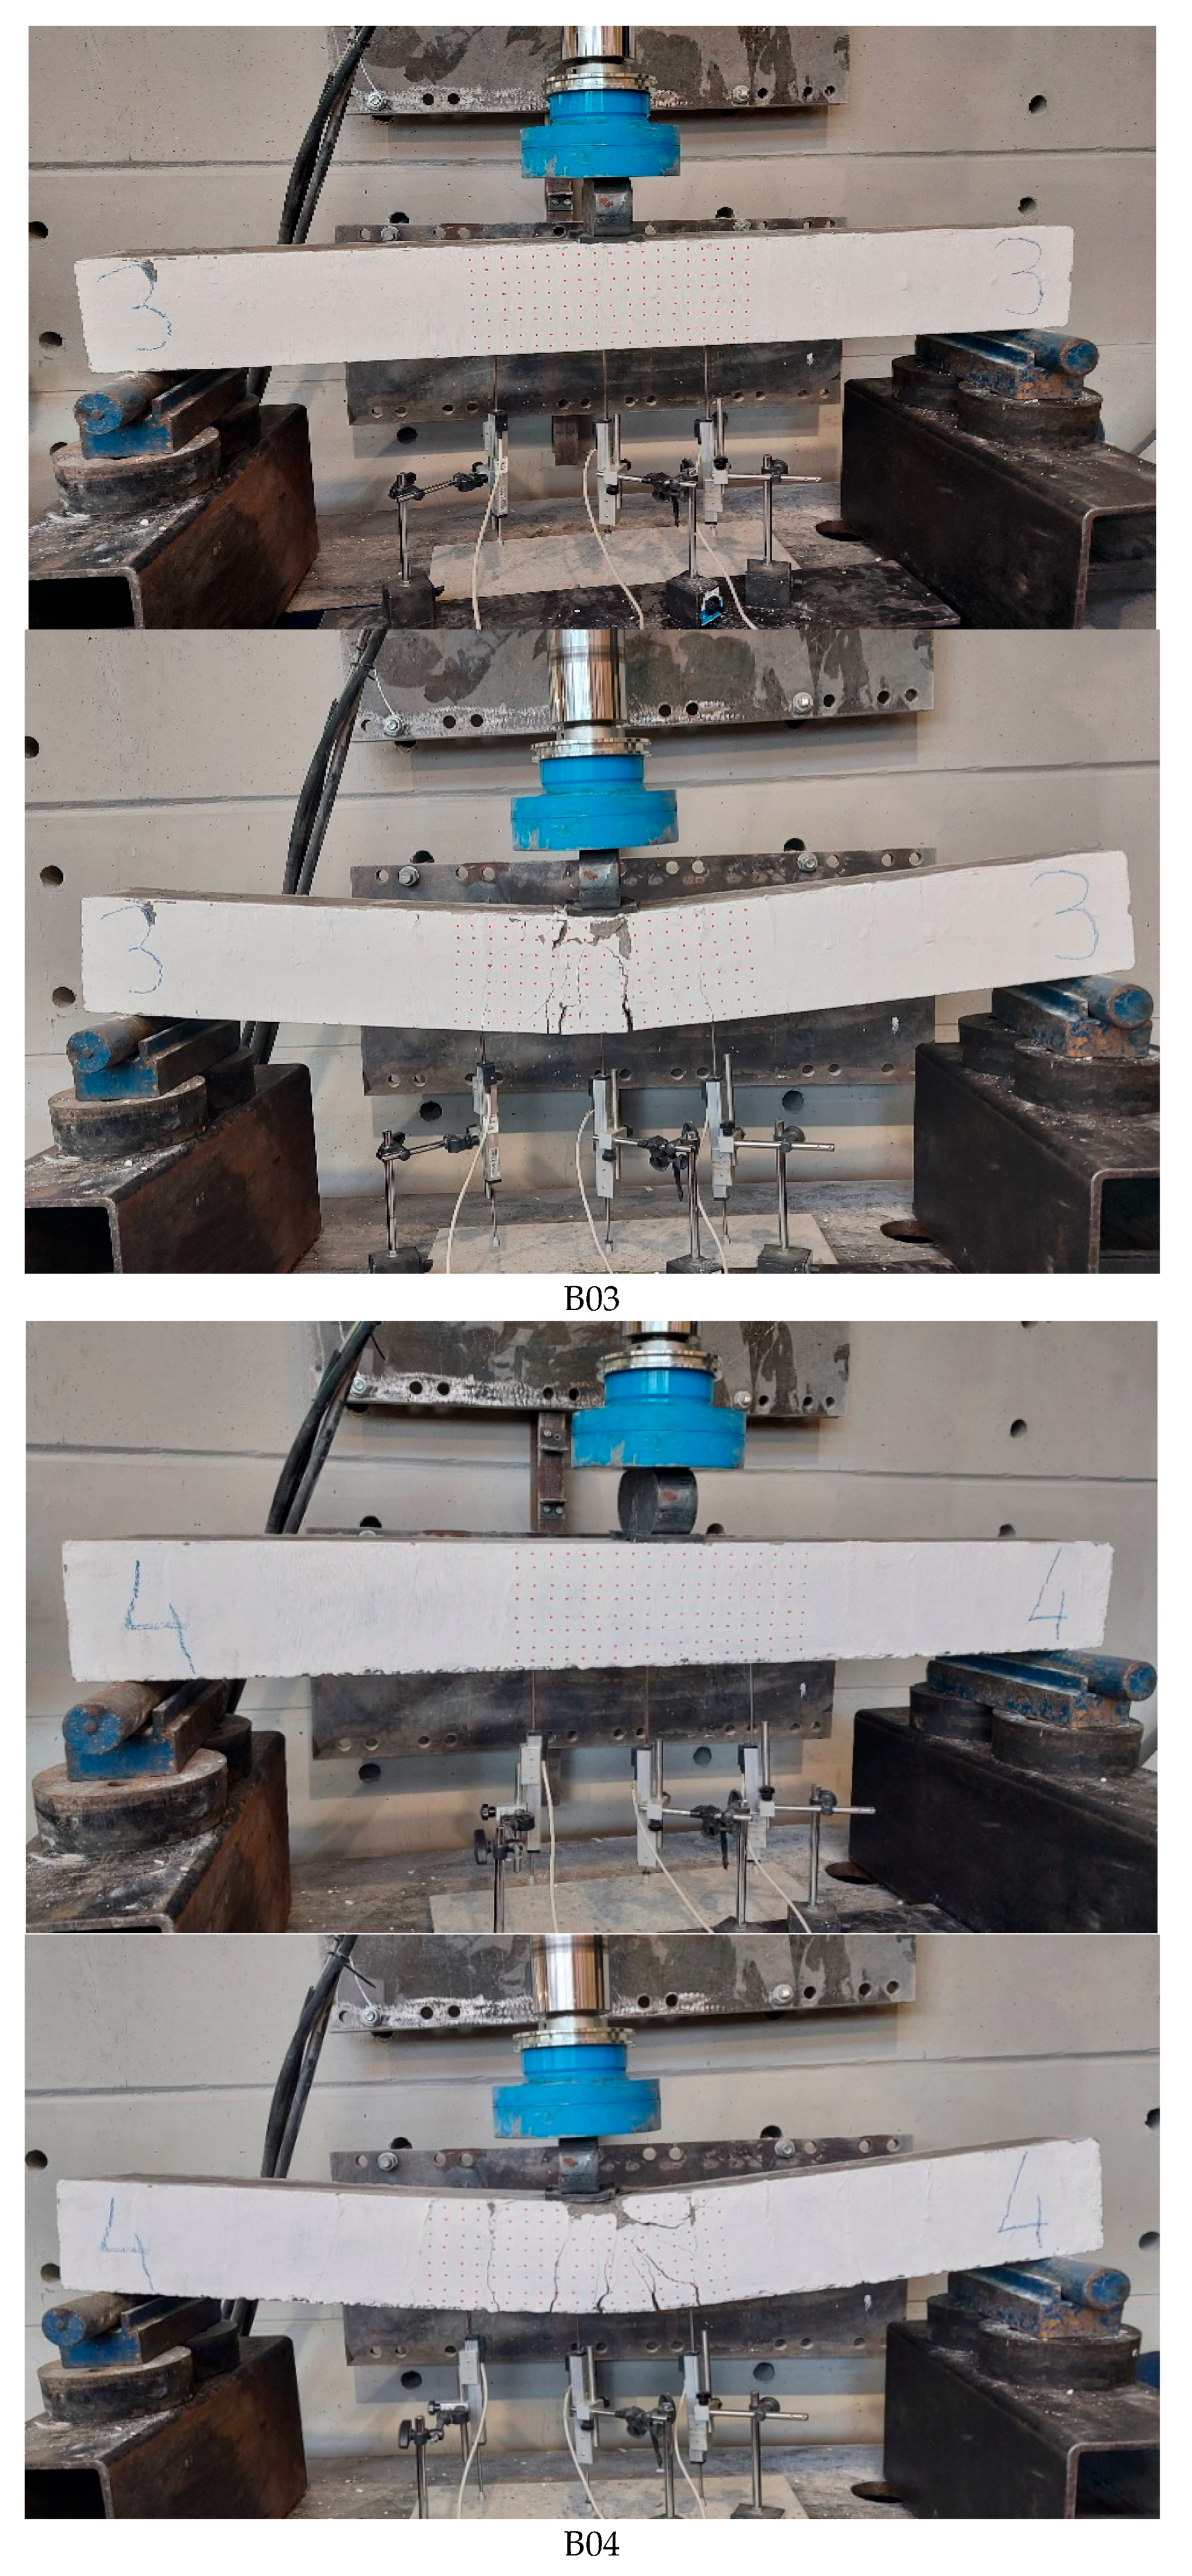
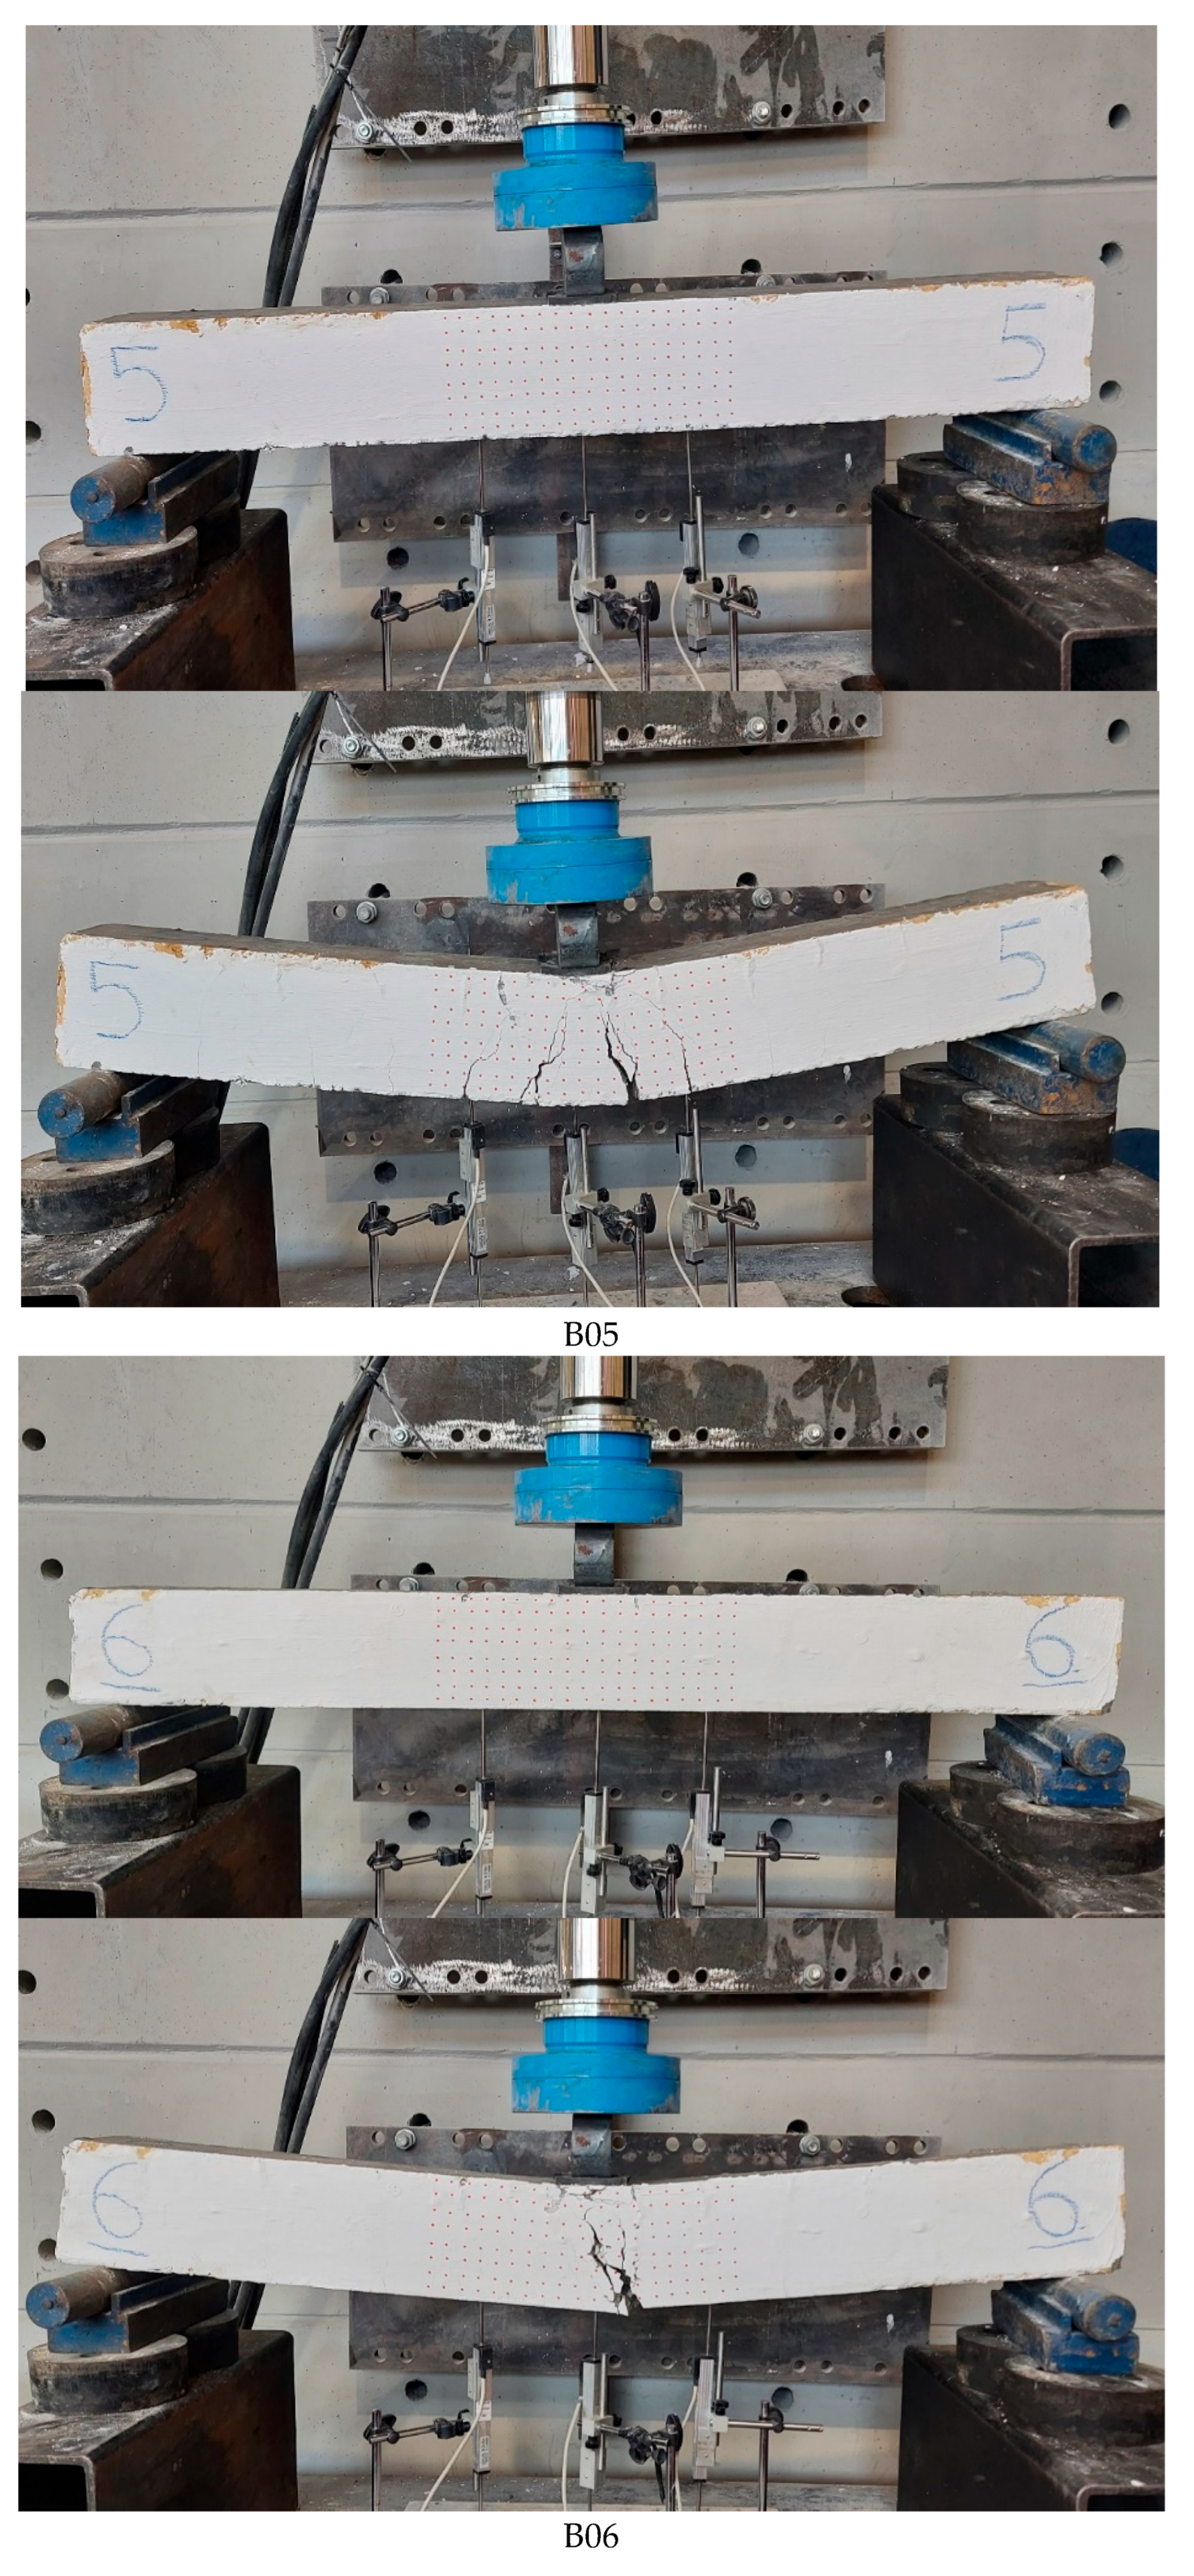
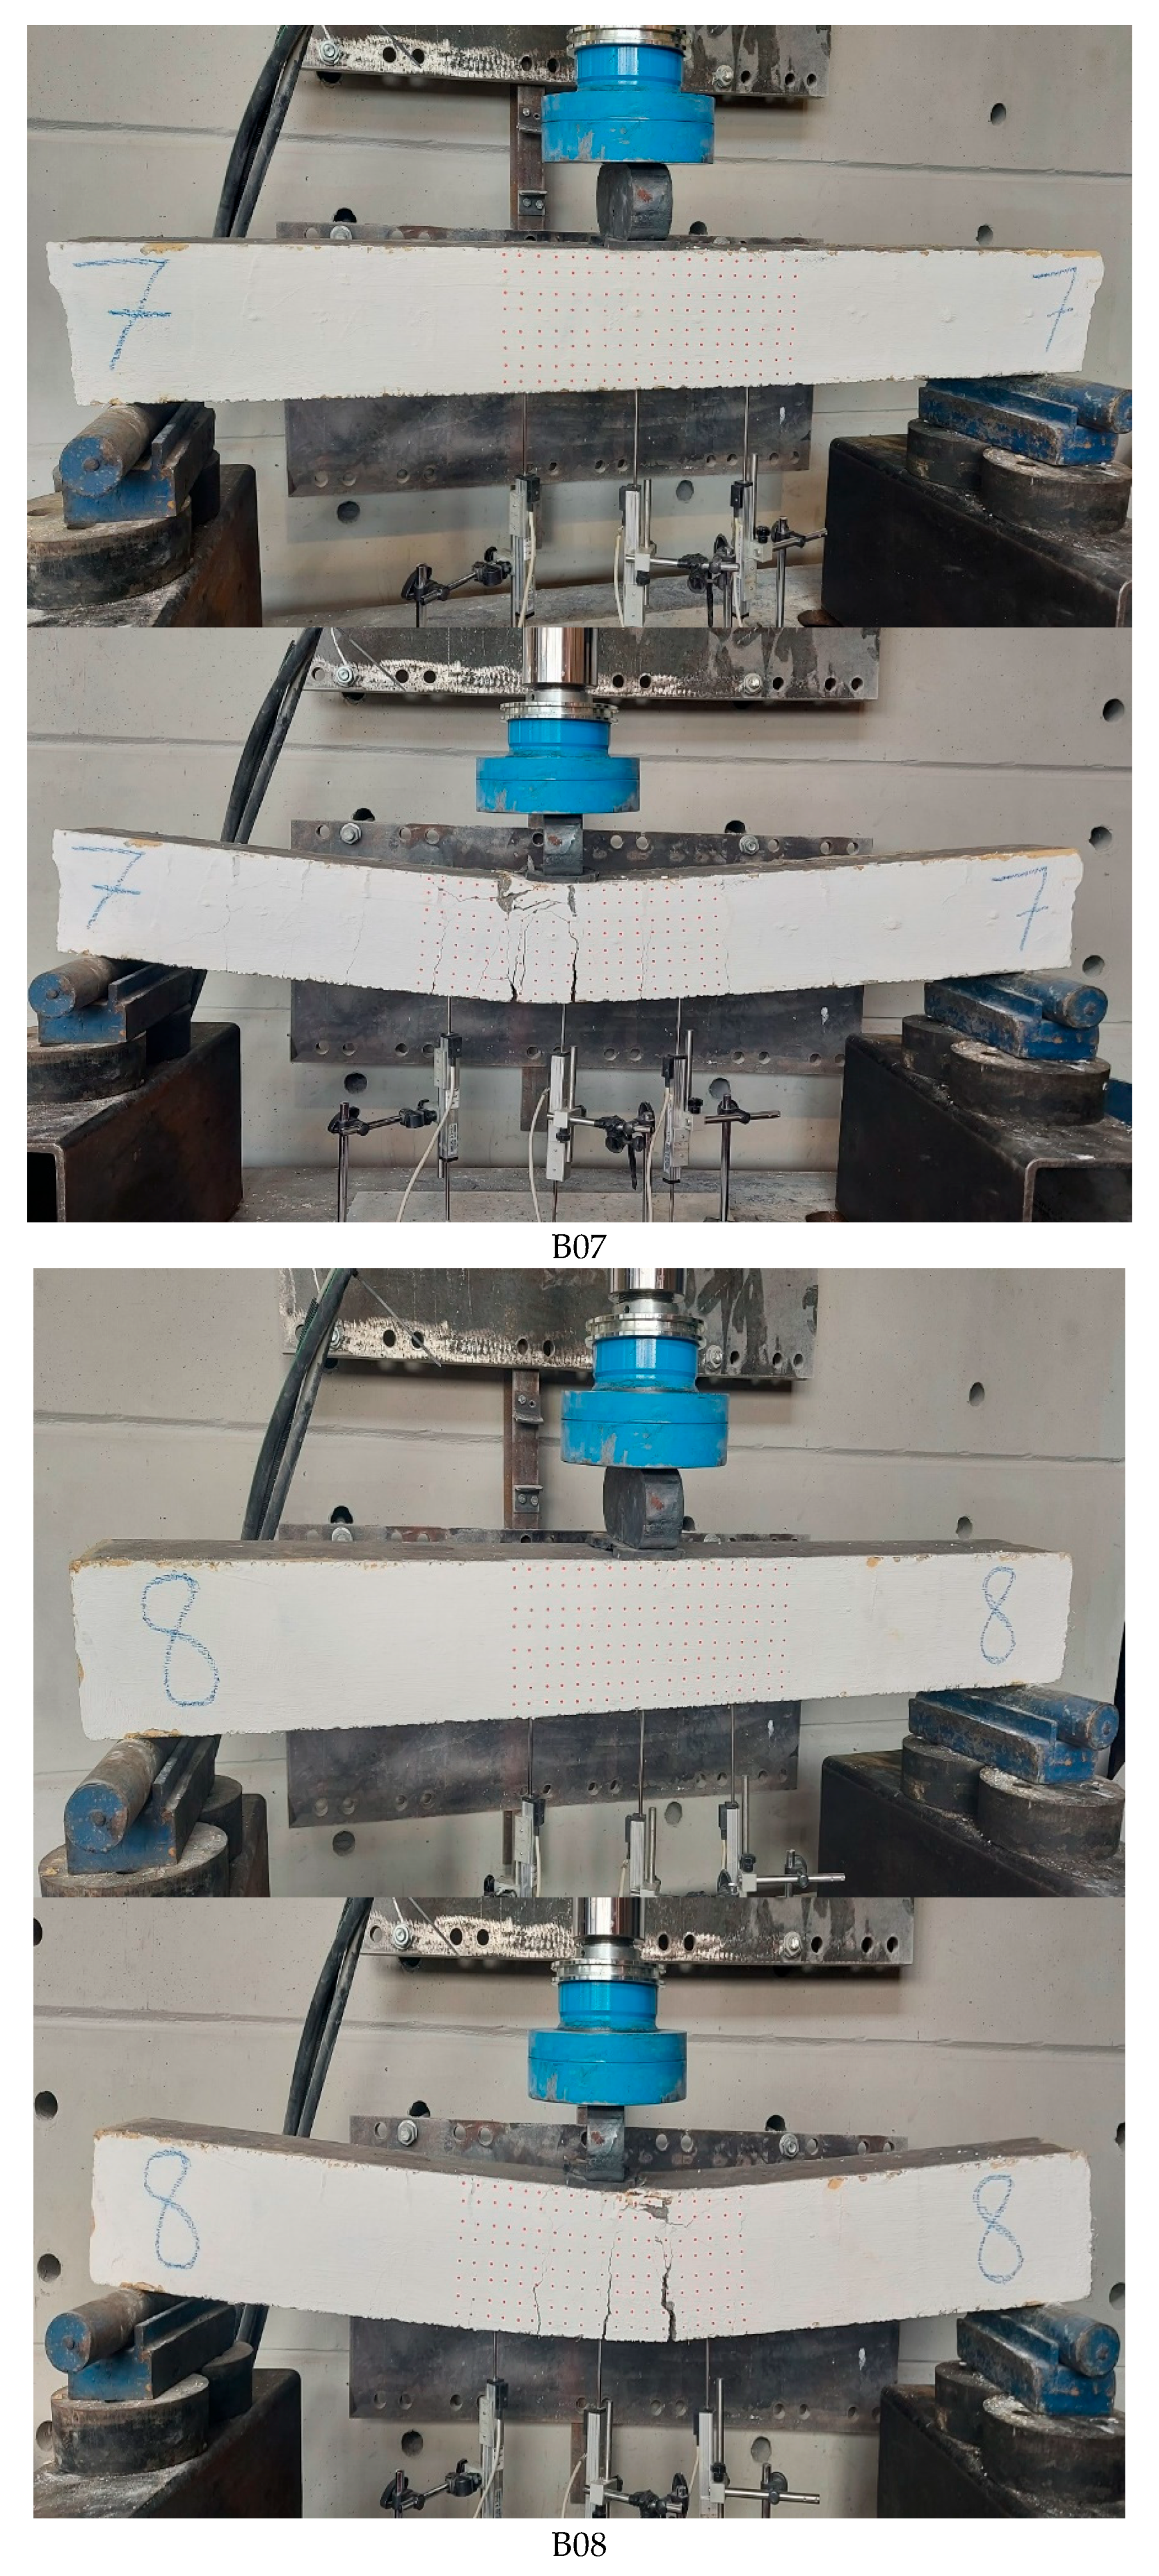
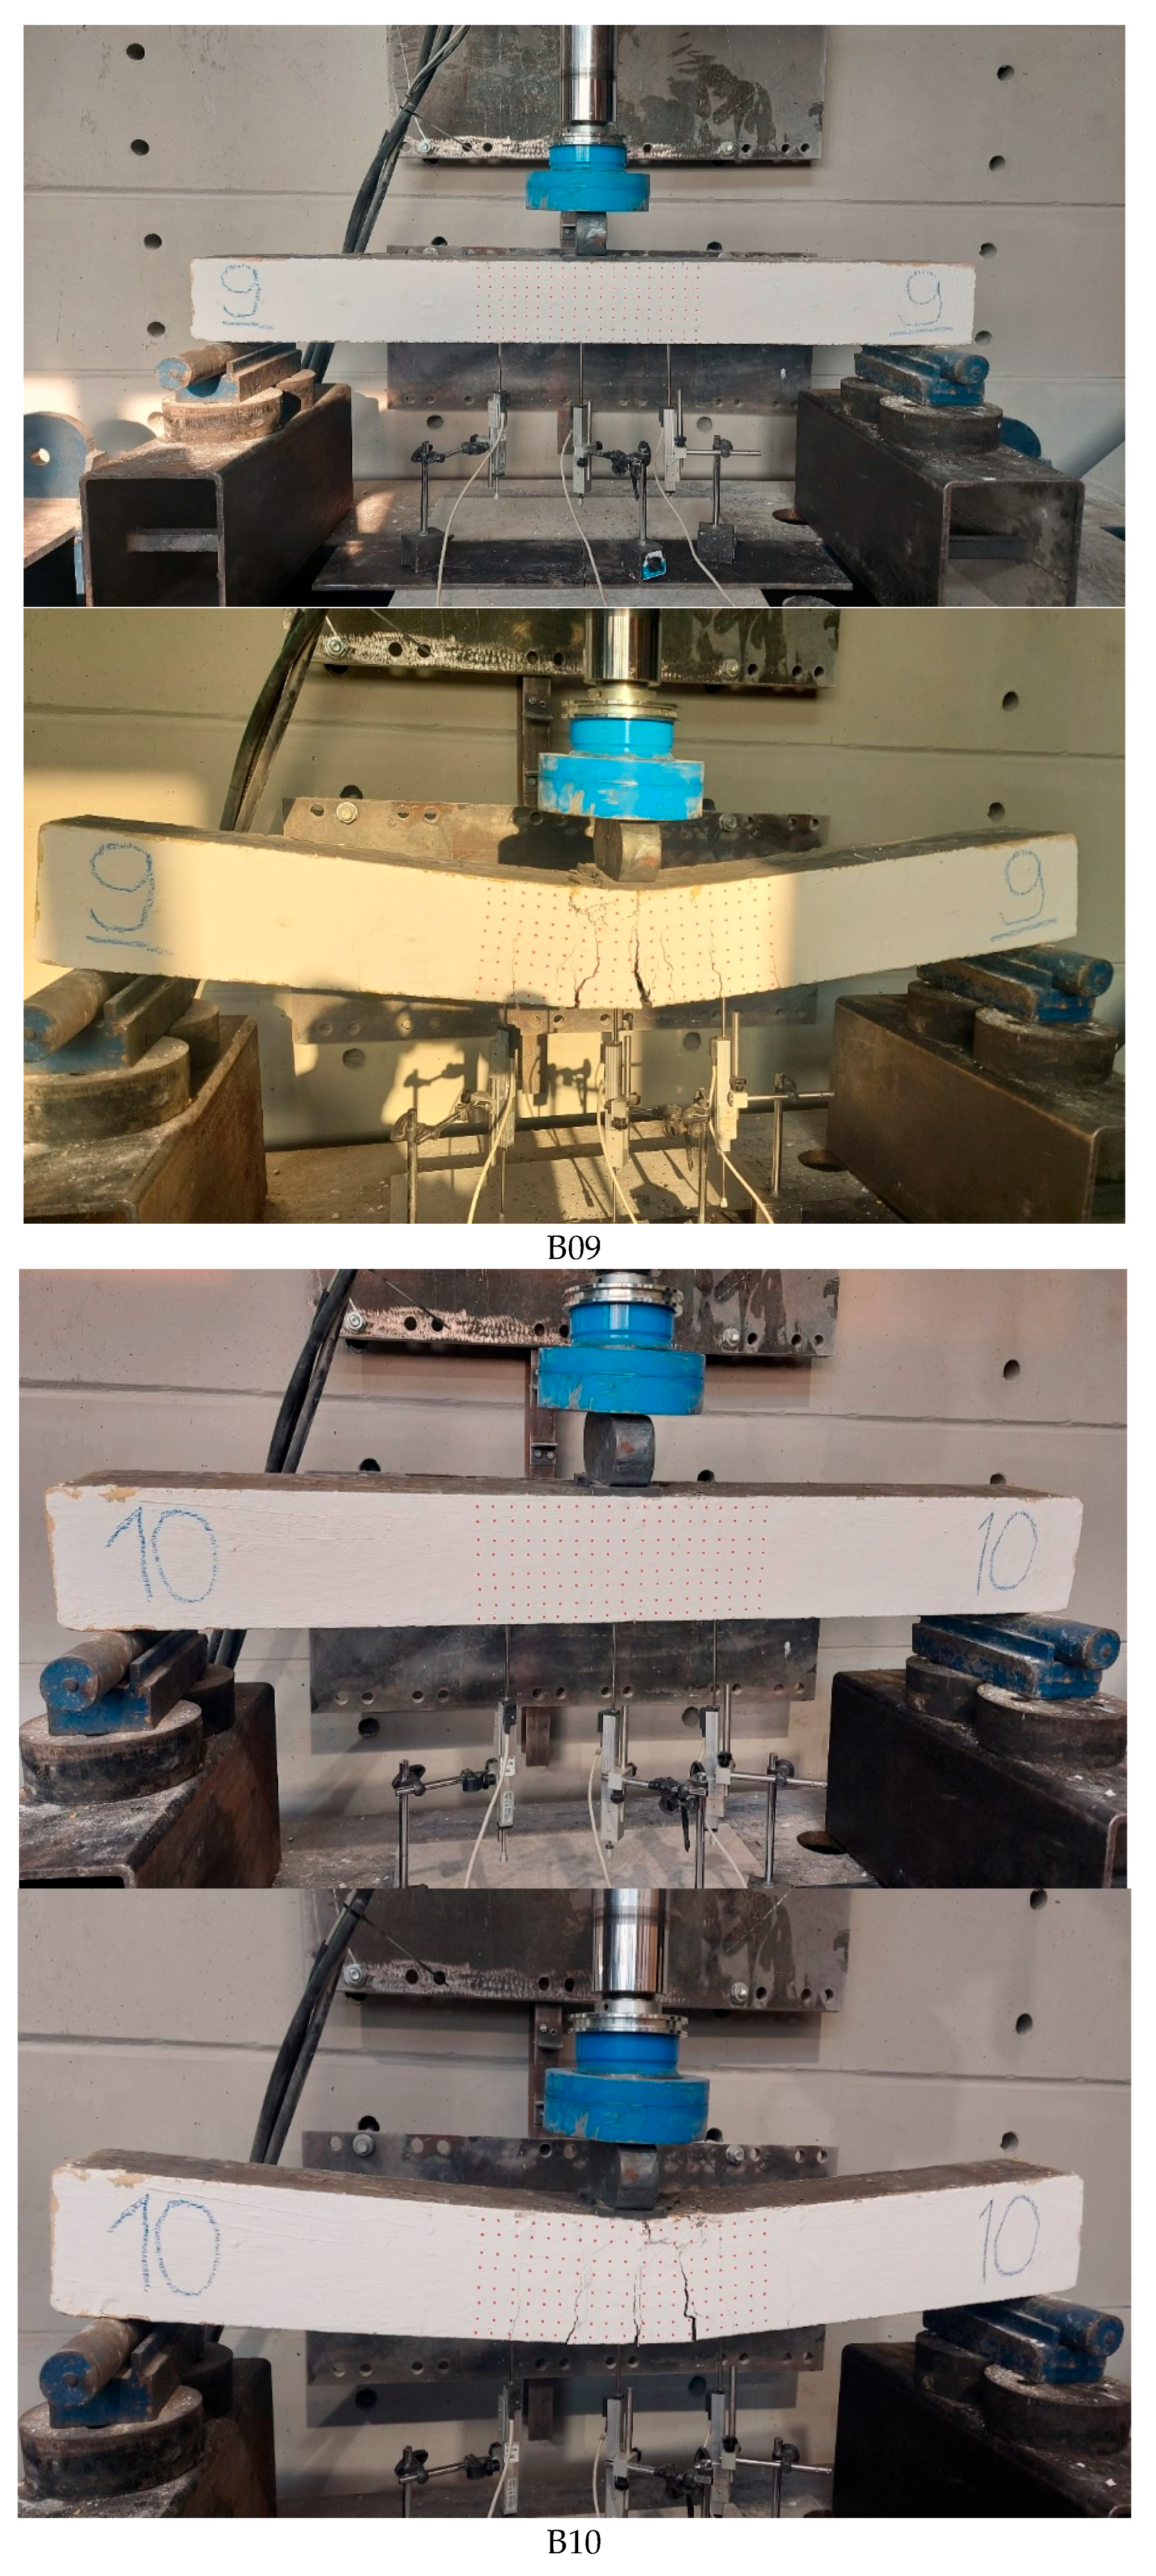
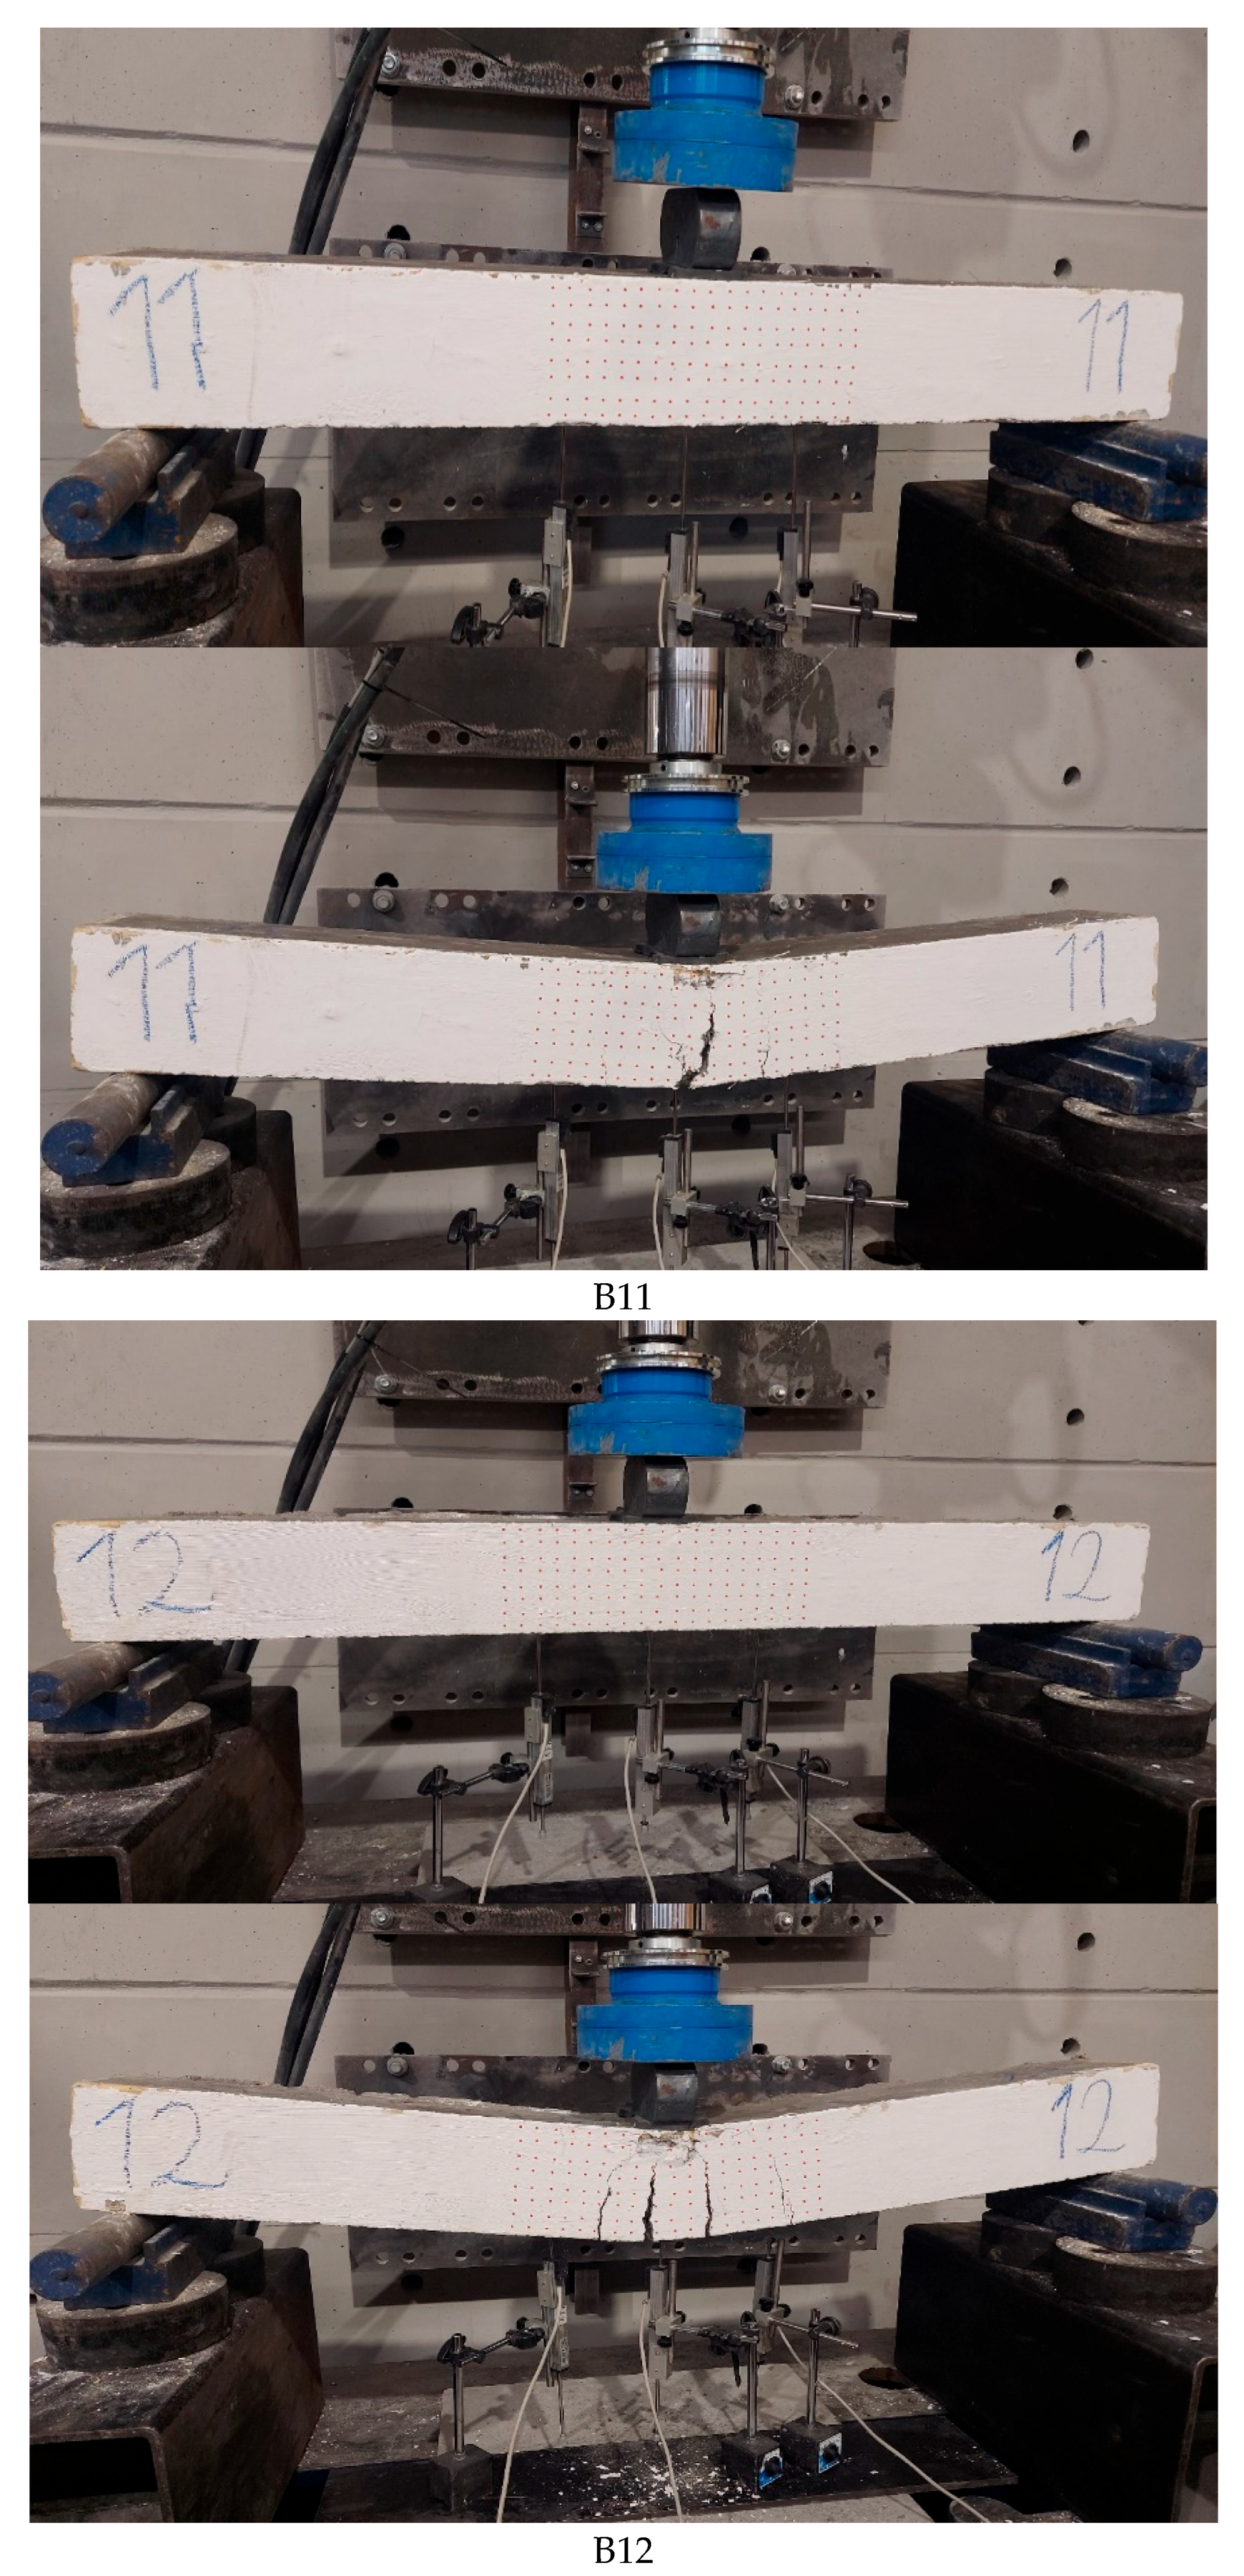
Load–deflection curves of the twelve geopolymer-based composite beams tested under three-point bending loads provide a close insight into the flexural properties under the interaction of matrix integrity, crack resistance, stress redistribution, and post-cracking load transfer mechanisms (Figure 3 and Figure 4, Table 7 and Table 8). In spite of equal geometric properties, reinforcement pattern, and load application, a substantial variation in stiffness, peak load, and post-peak stability is observed in the beams, thus confirming that the controlling parameters are inherent properties and curing microstructural development rather than geometric properties. In the initial stage of loading up to a deflection of approximately 4–6 mm, a linear variation in load and deflection is observed in all beams, indicating an elastic or quasi-elastic region dominated by the intact geopolymer matrix and steel reinforcement in a composite matrix-reinforcement system. The initial stage in all beams has a significantly differing slope, with calculated initial stiffness ranging from 1.75 kN/mm to 6.09 kN/mm, thus indicating more than a threefold difference in stiffness. Beams with higher initial stiffness, such as B01, B06, B11, and B12, attain a load of 15–18 kN at a deflection of 4–5 mm, thus indicating a higher density and continuity in aluminosilicate gel and a higher capacity for tensile stress transfer and delayed microcrack initiation. In contrast, beams B05 and B10 attain a considerably higher load at a deflection of 6–8 mm, thus suggesting a delayed activation of microcracks and a soft internal structure due to porosity, inhomogeneous geopolymerization, or reduced fiber–matrix bonding [26,27]. As loads are applied beyond this stage, a substantial departure from the linear variation is observed in all beams, thus initiating microcrack initiation and a transition from linear elastic to a nonlinear stage; thus, a considerable variation in the load level at which this departure took place is also observed due to crack initiation resistance properties. B03 and B08 continued linear up to a considerably higher load of 22–25 kN, thus indicating delayed crack initiation and higher tensile strength in the geopolymer matrix, whereas in beams B05, B06, B11, and B12, a substantial decrease in stiffness is observed at a lower load of 18–20 kN due to earlier localization of tensile damage in the matrix. This transition stage is of critical mechanics since this is where the distribution of stresses takes place from the matrix to fibers and reinforcement. The maximum load-carrying capacity exhibits a large amount of scattering, with a maximum of about 20.79 kN for B06 to a maximum of 31.47 kN for B03, with an average of about 26.44 kN—nearly a 50% difference between the minimum and maximum capacities of beams. High load-bearing beams B03 and B08 reach their maximum capacities at a lower deflection of nearly 20.73 mm and 21.38 mm, with capacities of about 31.47 kN and 30.79 kN, respectively, which is an indicator of strength-dominated behavior with delayed crack localization coupled with successful transfer of stresses through a developed geopolymer matrix. B09 and B12 reach their peak capacities after large deflections of nearly 41.30 mm for B09 and 37.92 mm for B12, with peak capacities of nearly equal values, but this is an indicator of deformation-dominated behavior where microcracks are formed through a progressive process before alignment into principal bending cracks. Load–deflection curves further indicate noticeable differences through their post-peak regions, with further insight into predominant damage mechanisms happening in the beams. There was no sign of brittle failure for all the beams, indicating stable post-peak crack propagation with significant residual load-carrying capacities.
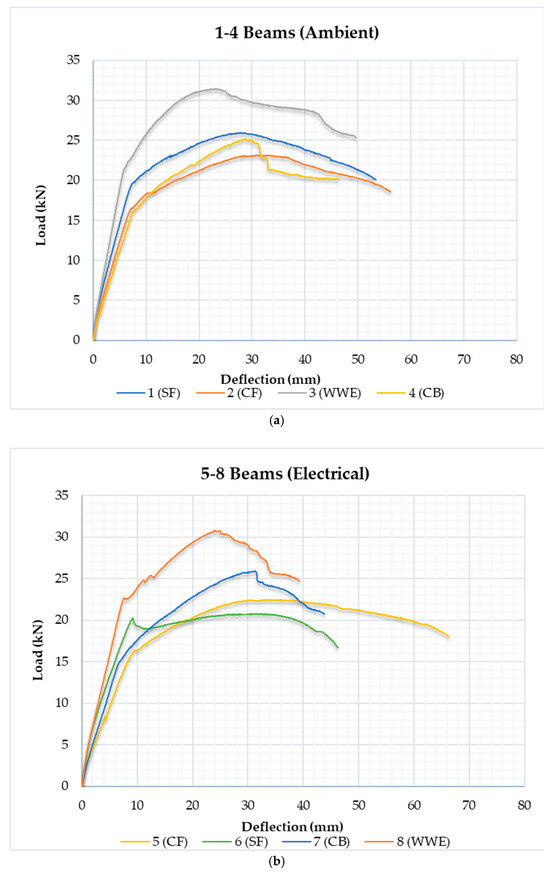
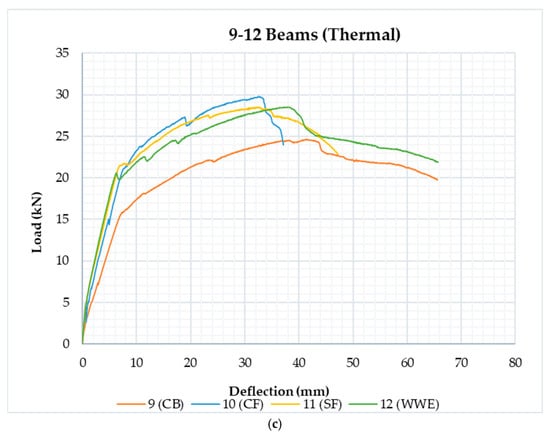
Figure 3.
Load–deflection behavior of geopolymer composite beams under three-point bending: (a) B01–B04, (b) B05–B08, and (c) B09–B12.
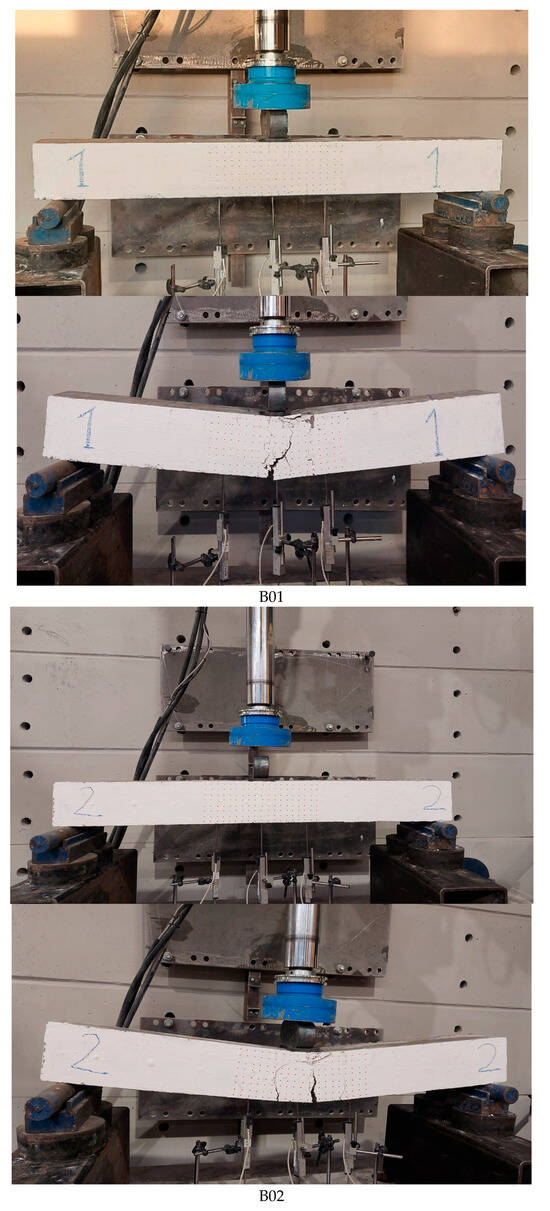
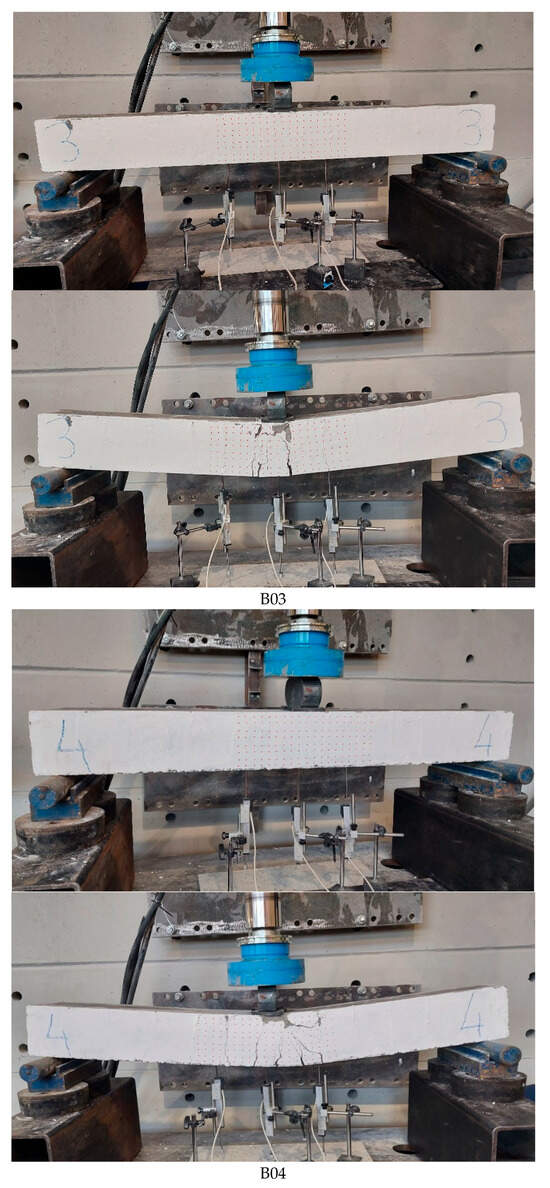
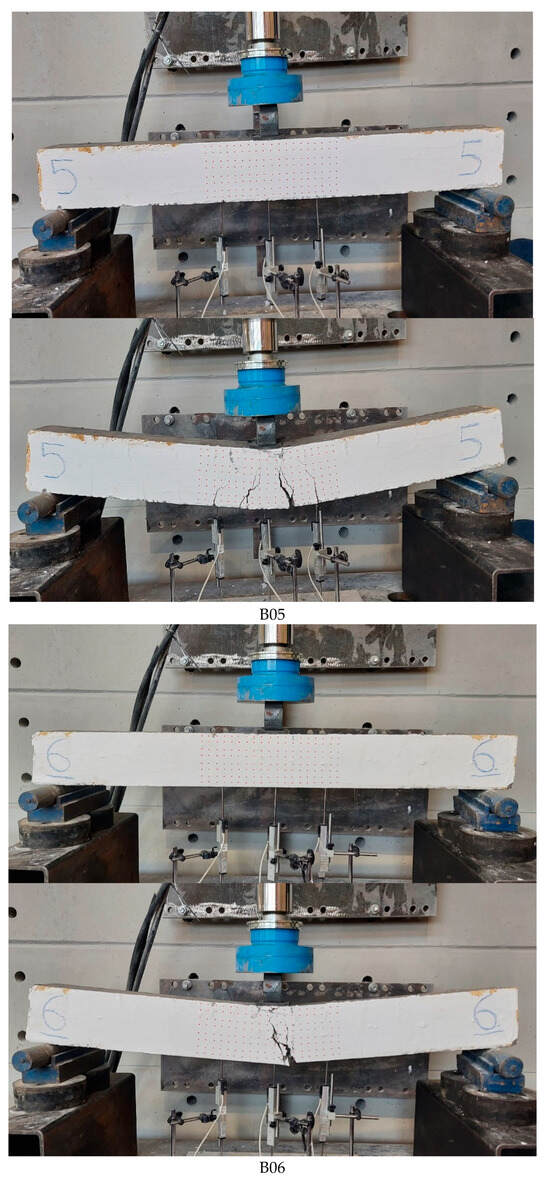
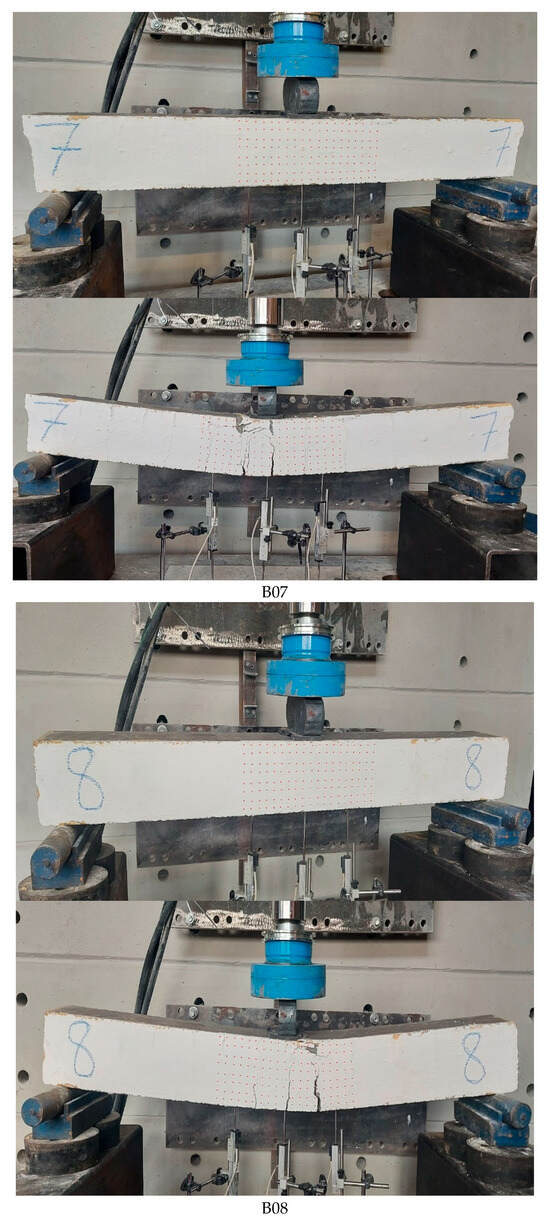
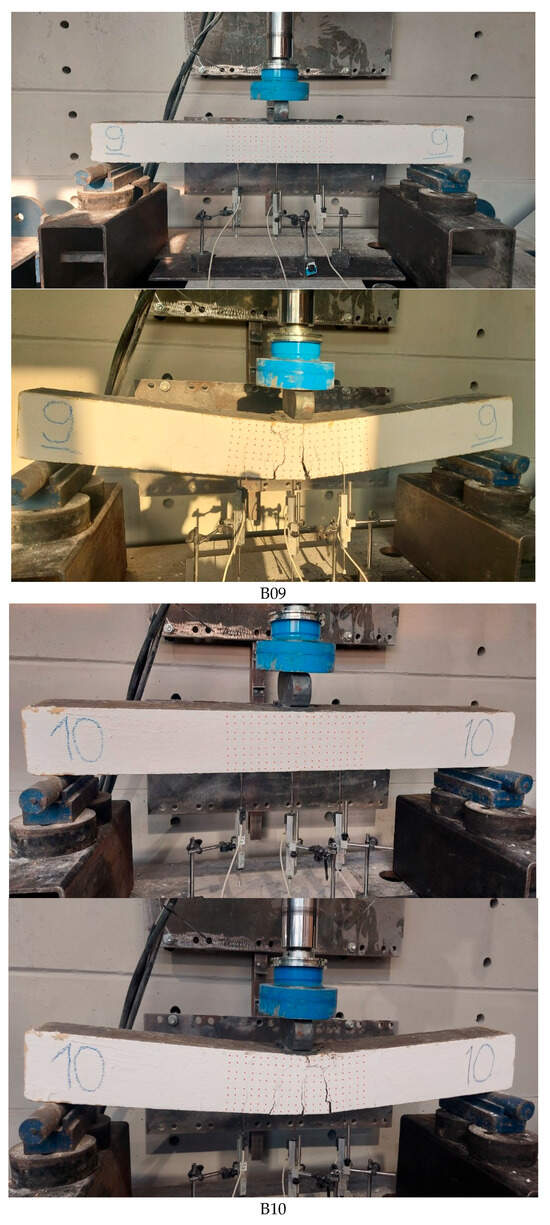
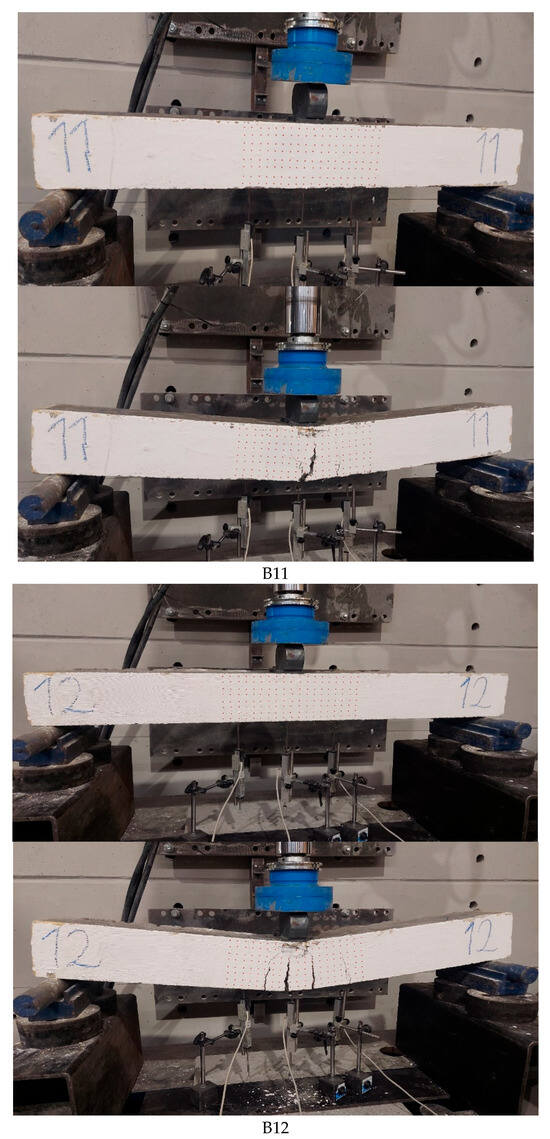
Figure 4.
Flexural test setup and representative failure modes of reinforced geopolymer-based composite beams under three-point bending.
Table 7.
Maximum load values obtained from beam flexural tests.
Table 8.
Failure modes, fracture characteristics, and flexural behavior of geopolymer-based composite beams.
From a mechanics perspective, this is attributed to the bridging of cracks through fiber interaction coupled with progressive yielding of reinforcement, preventing the quick loss of load-carrying capacities. Beams with high capacities, B03 and B08, retain residual capacities of more than 20–22 kN to deflections of nearly 40–50 mm, indicating controlled widening of cracks while simultaneously ensuring continued transfer of loads across sections of potential cracks. Beams with lower capacities, B05, B06, and B09, attain strengths through significantly enhanced capacities of more than 60–70 mm deflections with continued detectable transfer of loads. From mechanics perspective, this is an indicator of damage tolerance through which progressive slowing down of cracks takes place through frictional movements at crack planes. The considerable scatter range of the total energy absorption values, from roughly 749 kN·mm to 1551 kN·mm, further demonstrates that the ultimate load does not fully determine the performance characteristics because structures that are mediocre at ultimate strength could still be more resilient.
When a hierarchical ordering based on the load–deflection response that appropriately factors the fiber type and curing process is considered, the deformation resistances of the beams under study can be systematically arranged according to a physically meaningful framework that evaluates the effectiveness from highest to lowest. According to the specific load–deflection characteristics considered—namely the ultimate deformation limit, the ability to sustain loads beyond the peak point, and the smoothness of the response—the order of the fiber-reinforced series can be defined as metallic fiber-reinforced systems ≫ carbon fibers systems > pure carbon systems, showing that the inclusion of more ductile metallic materials into the composite structure is a decisively more effective deformation-sustaining strategy. From a quantitative point of view, the beams reinforced either with SFs or WWEs present values for the total absorbed energies that differ by approximately 40–70% compared to the least ductile carbon-based systems, while often exceeding 45–55% of the respective specific energies after the peak point, compared to the often less than 30–45% values noted for the carbon fiber and carbon-black-preponderant beams, respectively, clearly underlining that metallic fibers are more efficient deformation-sustaining materials. Considering the load–deflection ordering criterion, the most effective series would place beams like B12 ≫ B05 > B09 > B02 at the top level of the deformation hierarchy, underlining wide deformation plateaus and slow degradation, followed by an intermediate level defined as B03~B08 > B11, where peak loads are sustained at the expenses of early deformation localization, while the less effective group B07 > B04 ≫ B01~B10 would represent the bottom level where strong deformation localization and stiffness-dominant failure behavior would lead to predominantly load–stiffness–controlled deformation responses. Finally, considering the deformation stability and energy-dissipation efficiency ordering criterion on the specific curing processes applied to the beams’ material composition, a second independent ordering criterion becomes discernible where the deformation stability and the deformation-energy dissipation efficiencies, rather than the deformation resistances, become the markers of the curing processes’ effectiveness. According to the most clear-cut effectiveness ordering criterion defined by deformation stability and deformation energies dissipation efficiencies—namely, the deformation stability~deformation energies dissipation efficiencies—electrical curing ≫ others is defined. This ordering would clearly indicate that the application of the electrical curing procedure would result in a deformation-resistance increment of approximately 25–45%, while enforcing deformation stability and reducing deformation response asymmetry at the expense of an early deformation localization. Thermal curing always promotes an improvement in rigidity and peak load by 15–30% relative to ambient curing, though its influence on deformation ability strongly depends on fibers, thereby allowing for 30–50% higher energy absorption with ductile metallic fibers than ambient curing, though it may decrease the post-peak deformation ability by 20–40% for carbon materials due to rapid crack localization in the compact matrix. Performance variation is highest for ambient curing, with differences ranging from ±30% even for the same fibers, admitting both the stiffest materials and moderately ductile materials, thus denoting the lowest flexibility for deformation control. When both hierarchies are considered together, the most efficient structural system will obviously be at the topmost part of metallic fiber reinforcement + electrical curing, thereby securing both resistance to deformation and stability after peak load failure, while metallic fibers + thermal curing lie second, with highest rigidity and acceptable levels of ductility, though carbon materials with ambient curing always stand at the bottommost part of the deformation resistance hierarchy due to their materials prone to rapid crack localization and cohesion loss immediately after peak load. Thus, this sequenced sign comparison clearly indicates that load–deflection resistance is better regulated by bicriteria control, with fibers dictating the post-cracking mechanism of deformation, while curing methods dictate how well and evenly such deformation could be activated, thereby denoting that the most efficient geopolymer beam system should always stand at the topmost part of both hierarchies instead of focusing on tallest peak load resistance alone.
3.2. Stiffness Degradation Behavior
Stiffness degradation behavior was evaluated using the normalized secant stiffness parameter defined in Section 2.4. Regarding the twelve beams, it is apparent that the pattern of stiffness degradation is non-uniform, with different beams following distinct paths, which can now be correctly captured by the normalization of secant stiffness (Ksec_norm) ratios with respect to incremental levels of loading (P) and, more importantly, with stiffer slopes during the softening response. By normalizing the secant stiffness ratios with respect to their 10%Pmax, it is now feasible to compare, on a “shape” basis, the extent of degradation, irrespective of the actual level of each beam’s total stiffness, thereby disclosing how some beams experience overall degradation throughout the stage, while others retain their original stiffness up to near-peak loading conditions, followed by a sudden, abrupt failure. B01 presents the most extreme case of early “stiffness exhaustion,” with a clear, early departure from the “stiffness-preservation” baseline, declining to Ksec_norm ≈ 0.605 at 30%Pmax, then further to ≈0.511 at 50%Pmax but then sooner or later to continue with an earlier, near-sudden decay to ≈0.355 at 70%Pmax, but only ≈0.158 at 90%Pmax (K90/K10 ≈ 0.158), thereby losing fully 84% of this starting point performance prior to arrival at the high-load portion of the stage. Mechanistically, this steeply falling, continuously reducing level assumes a very rapid transition towards the stage where deformation is controlled by cracks, anticipating an early localization process, where, following the onset of tensile cracks, effective overall beam stiffness fails very swiftly due to a preference for ultimately fewer, more dominant overall deformation “bridging” by “reinforcement,” with an impending abandonment of the “matrix” contribution towards overall performance. Conversely, B06 retains the highest level of high-load performance of all twelve beams (Ksec_norm ≈ 0.860 at 30%Pmax, then ≈0.678 at 50%Pmax, then ≈ 0.582 at 70%Pmax, then ≈ 0.531 at 90%Pmax; K90/K10 ≈ 0.531), thus meaning more than 50% retention of overall “normalized” beam performance at 90%Pmax, thereby disclosing an overall “cracking” process, where no catastrophic overall performance decay is assumed on the ascending part of the process, either due to delays in crack “coalescence,” more robust crackspacing, or more effective tension transfer on the “matrix” level prior to the peak stage. However, it has a relatively steep slope in the post-peak region (≈−0.732 kN/mm), which indicates that it is not a case of ‘stiffness preservation’ in the ascending branch but a system that is stiffer until almost reaching a peak but releases capacity relatively quickly after that is a general feature of responses that lie in the region of a strong but not-so-stable matrix phase where a dominant crack eventually influences the softening region. It is extremely valuable to distinguish between two different degradation mechanisms of this kind through a high K90/K10 value and a softening slope: namely, (i) degradation before reaching a peak through a high degree of crack densities and interactions (decay of Ksec_norm), and (ii) degradation after reaching a peak through a high crack-opening speed and efficiency of post-cracking transfer (slope of softening function). The degradation process of B03 is balanced on both sides of a spectrum in every aspect: it preserves relatively high normalized values of stiffness during the process of loading (≈0.741 during 30%Pmax loading, ≈0.692 during 50%Pmax loading, ≈0.618 during 70%Pmax loading, and about 0.388 during 90%Pmax loading; K90/K10 ≈ 0.388), which may indicate that it does not reduce stiffness before reaching a peak and maintains a relatively balanced evolution of matrix-cracking; however, it has a moderate slope of ≈−0.478 kN/mm during softening phases, which is representative of a moderate softening process and not a dramatic reduction as expected through a relatively active but not-so-stable load transfer during softening phases. B07 has a different set of features: it preserves relatively high values of Ksec_norm during mid-to-high loading percentages (≈0.788 during 30%Pmax loading and ≈0.757 during 50%Pmax loading); however, a relatively high degradation occurs as it proceeds towards 90%Pmax loading (≈0.375; K90/K10 ≈ 0.375) and has a relatively steeper softening slope of ≈−0.511 kN/mm; this may indicate that it could act as a system that has a general feature of microcracks that could remain relatively balanced and disperse during initial stages but tend to form a high degree of interactions and localizations after that due to appreciable stiffness degradation and moderate softening phases. B02, B04, and B05 represent a grouping with moderately consistent degradation without extreme values. B02 has ≈0.633 at 30%Pmax and ≈0.577 at 50%Pmax until reaching ≈0.257 at 90%Pmax (K90/K10 ≈ 0.257) with a moderate post-peak slope (≈−0.214 kN/mm), indicating that although the stiffness is lost steadily, the degradation in the post-peak range is relatively slow; this indicates stable opening of the cracks with effective frictional support. B04 has a stable trend (approximately 0.658 at 30%Pmax, 0.626 at 50%Pmax, 0.528 at 70%Pmax, 0.327 at 90%Pmax; K90/K10 ≈ 0.327) with the least magnitude of the post-peak slope in the entire series (approximately −0.114 kN/mm), which strongly indicates that the post-cracking mechanism is extremely stable with slow opening of the cracks. B05 has ≈0.644 at 30%Pmax and ≈0.591 at 50%Pmax until reaching ≈0.318 at 90%Pmax (K90/K10 ≈ 0.318) with a moderate post-peak slope (approximately −0.232 kN/mm), indicating a gradual loss of stiffness as well as softened behavior that often indicates stable interfacial sliding instead of brittle fracture. The set of B09, B11, and B12 emphasizes the existence of yet another mechanism. B09 indicates relatively smaller stiffness degradation in the higher loading (approximately 0.578 at 30%Pmax until reaching 0.211 at 90%Pmax; K90/K10 ≈ 0.211), while the magnitude of the post-peak slope is relatively smaller (approximately −0.132 kN/mm), indicating that the initial stiffness is lost before attaining the maximum loading capacity (which might be due to the onset of micro-cracks), while the subsequent opening of the cracks remains stable with slow damage development that might be well sustained despite the presence of less pre-peak stiffness. B12 follows suit in the post-peak regime (post-peak slope~−0.133 kN/mm, one of the least steep), but with an exceptionally low K90/K10 (~0.152) following a monotonous drop-off trend from ~0.635 at 30%Pmax to ~0.505 at 50%Pmax and ~0.444 at 70%Pmax till reaching ~0.152 at 90%Pmax; this points towards an increasing redistribution of stiffness during loading, which can be analyzed to represent extensive cracking distributions with an increasing stiffness redistribution towards bridging mechanisms, with a gentle slope indicating a stable transfer of stresses post-peak via bridging mechanisms rather than catastrophic failure. B11 follows a similar ‘stiffness shedding + post-peak controlled’ trend (K90/K10~0.219; post-peak slope~−0.62 kN/mm; steeper than B09/B12), indicating an accelerated stiffness loss as it approaches the peak and a more notable post-peak slope than more stable beams. Finally, B10 is an outlier which serves to frame the limits of stiffness degradation with respect to load increase, with maxima for normalized stiffness loss of approximately 0.336 at 30%Pmax, 0.282 at 50%Pmax, 0.259 at 70%Pmax, rising to only 0.149 at 90%Pmax; with corresponding values of K90/K10 of 0.149; simultaneously also portraying the steepest post-peak slope at ~−1.202 kN/mm; this combined trend reflects an accelerated pre-peak stiffness exhaustion coupled with an extremely rapid post-peak deterioration; an altogether consistent trend reflective of highly localized damage coupled with limited bridging capabilities after dominance by a preponderant crack with an equally quick transition into the high-crack-opening-resistance regime. These findings indicate that stiffness degradation under tensions is to be viewed through two convergent but differently focused lenses: (i) a pre-peak stiffness retention quantified through values of Ksec_norm-loss (high retention seen for B06 compared to minimal retention seen for B10/B01), which represent an overview of density-softening effects induced through load increments causing a depletion of global stiffness; (ii) a post-peak stiffness degradation rate quantified through post-peak slope values (least steep for B04/B09/B12 compared to maximally steep for B10/B06/B11), which represent an overview of stability of crack openings coupled with an overview of efficiency of post-cracking force transfer mechanisms through friction resistance/bridging effects. Therefore, the trajectories of the beam-normalized stiffness values presented in Table 9 contribute to a robust method of evaluating the robustness of structures in terms of geopolymer-based composite beams with capabilities of damage localization, ability to disperse cracks, and post-cracking stability not possible with peak load or deformation ability only.
Table 9.
Normalized stiffness retention and post-peak softening characteristics of geopolymer-based composite beams at different load levels.
3.3. Energy Absorption
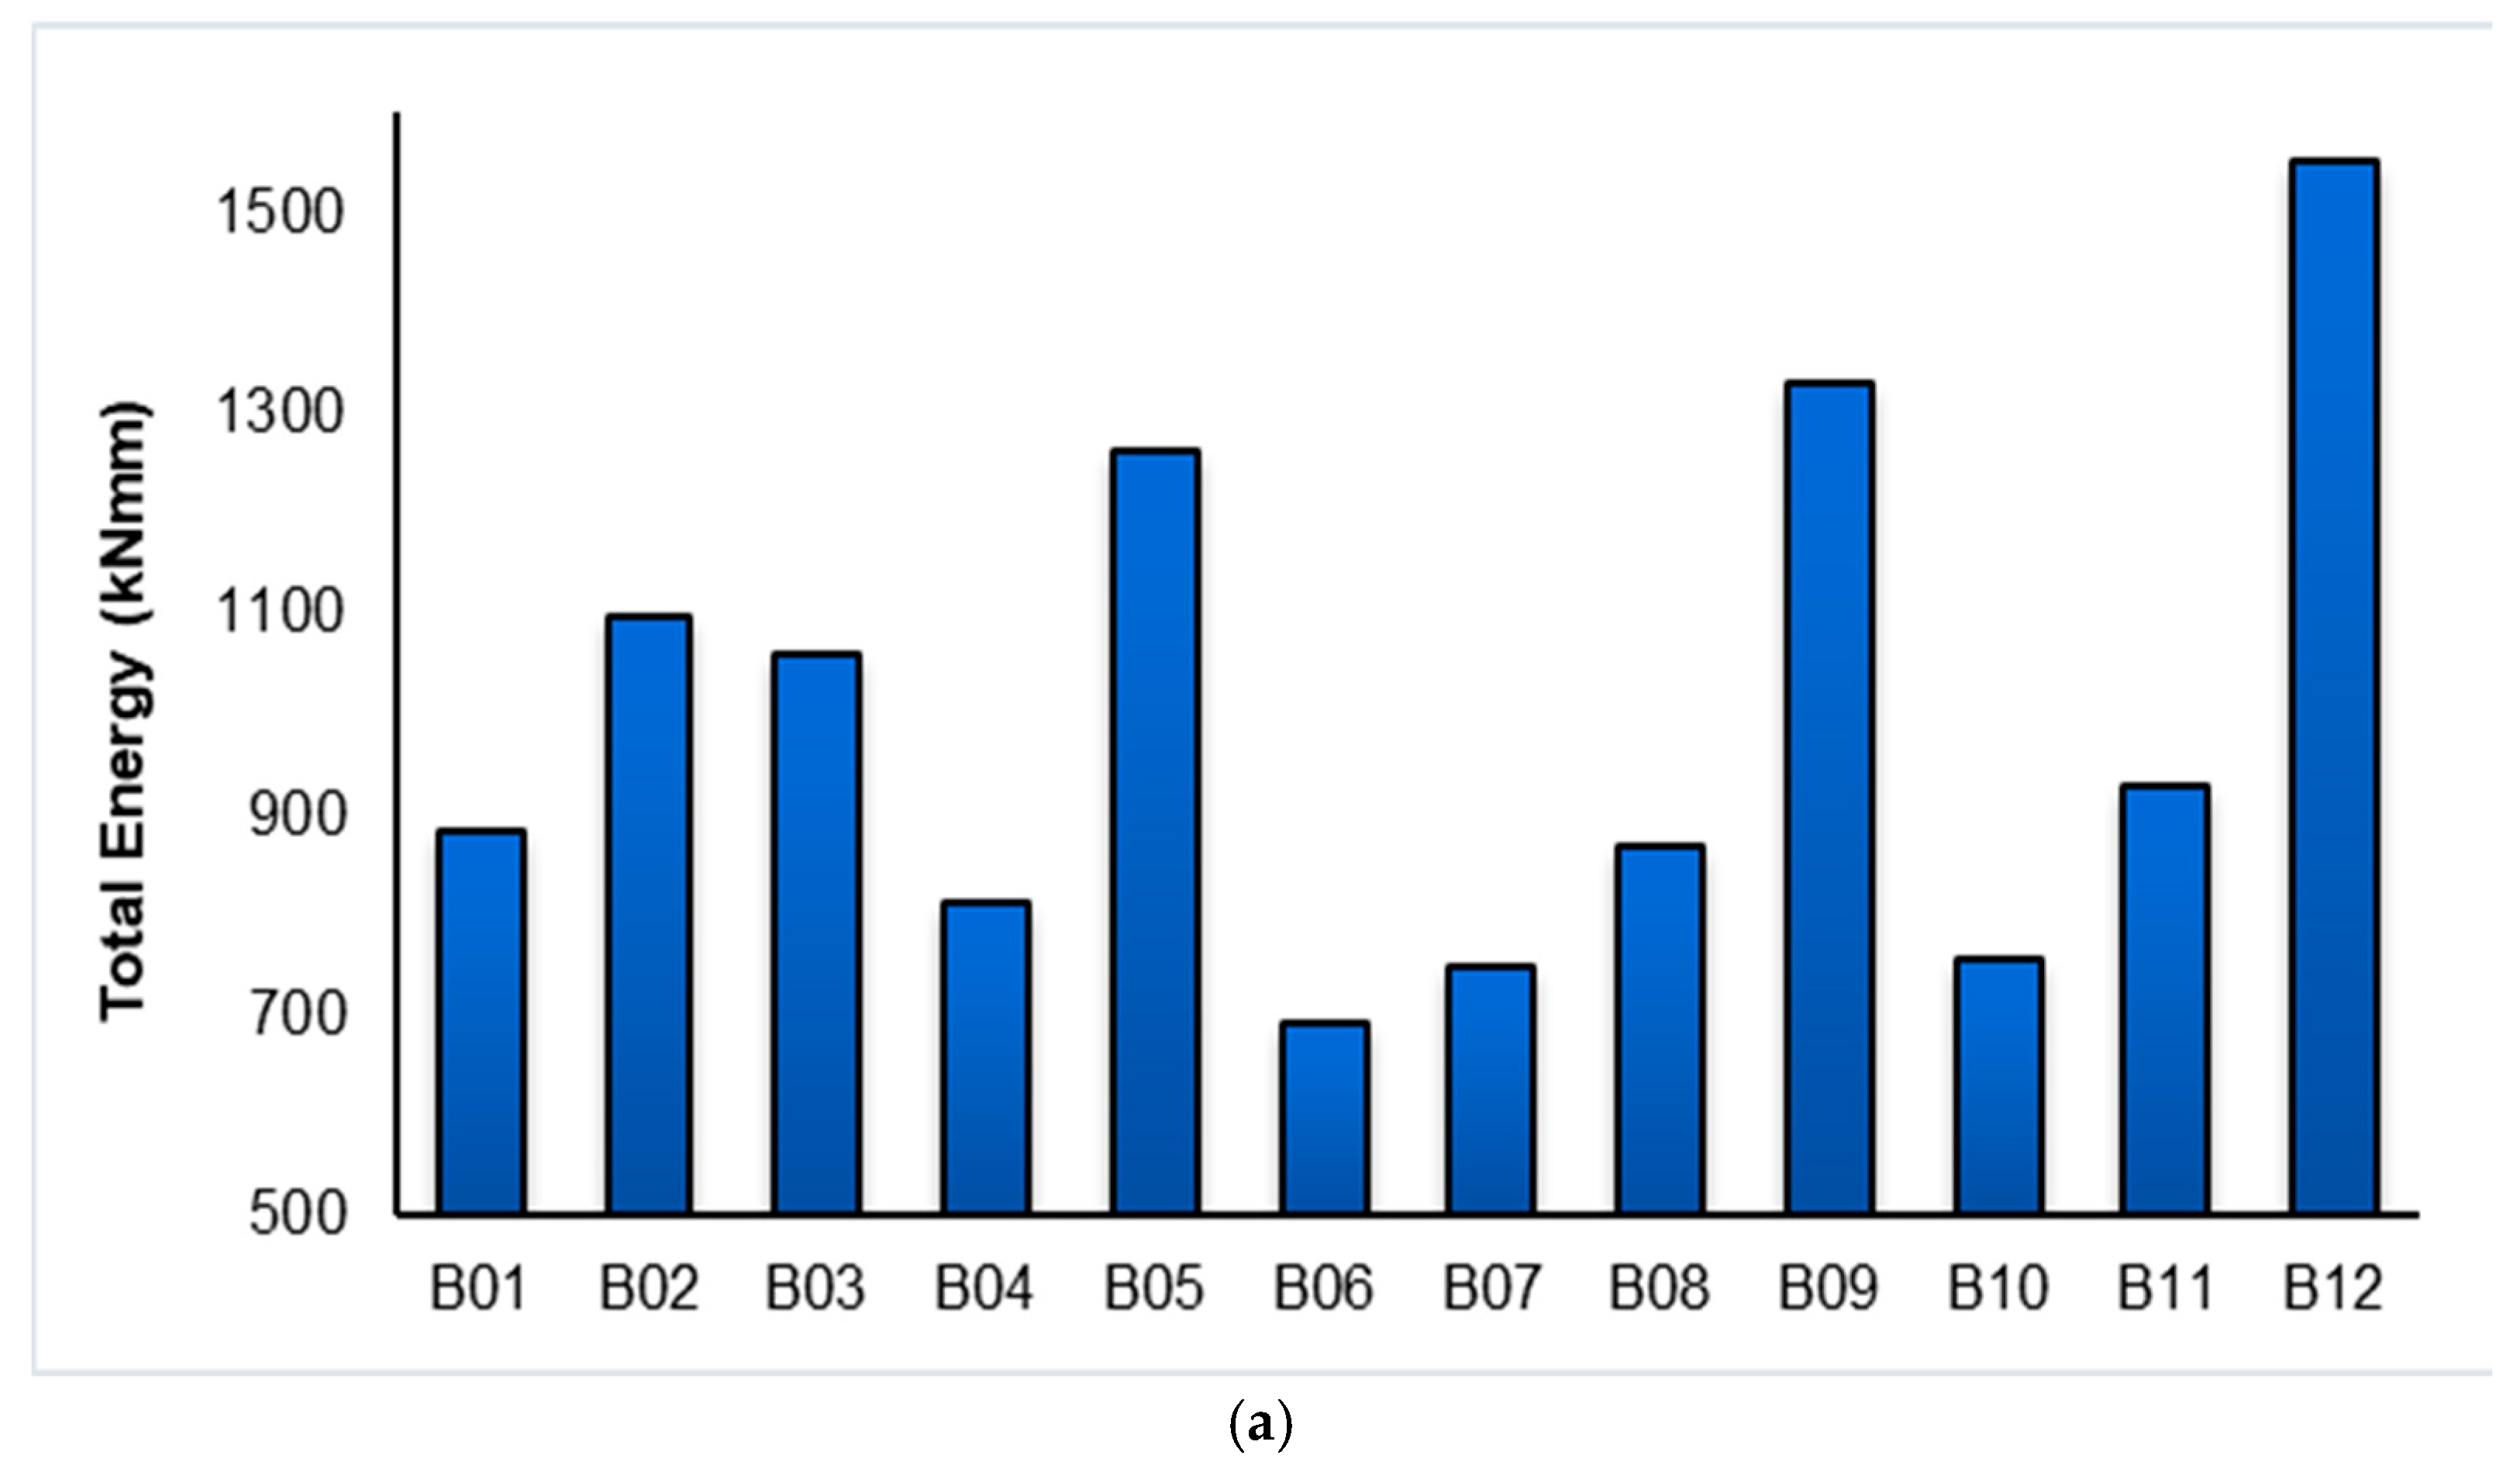
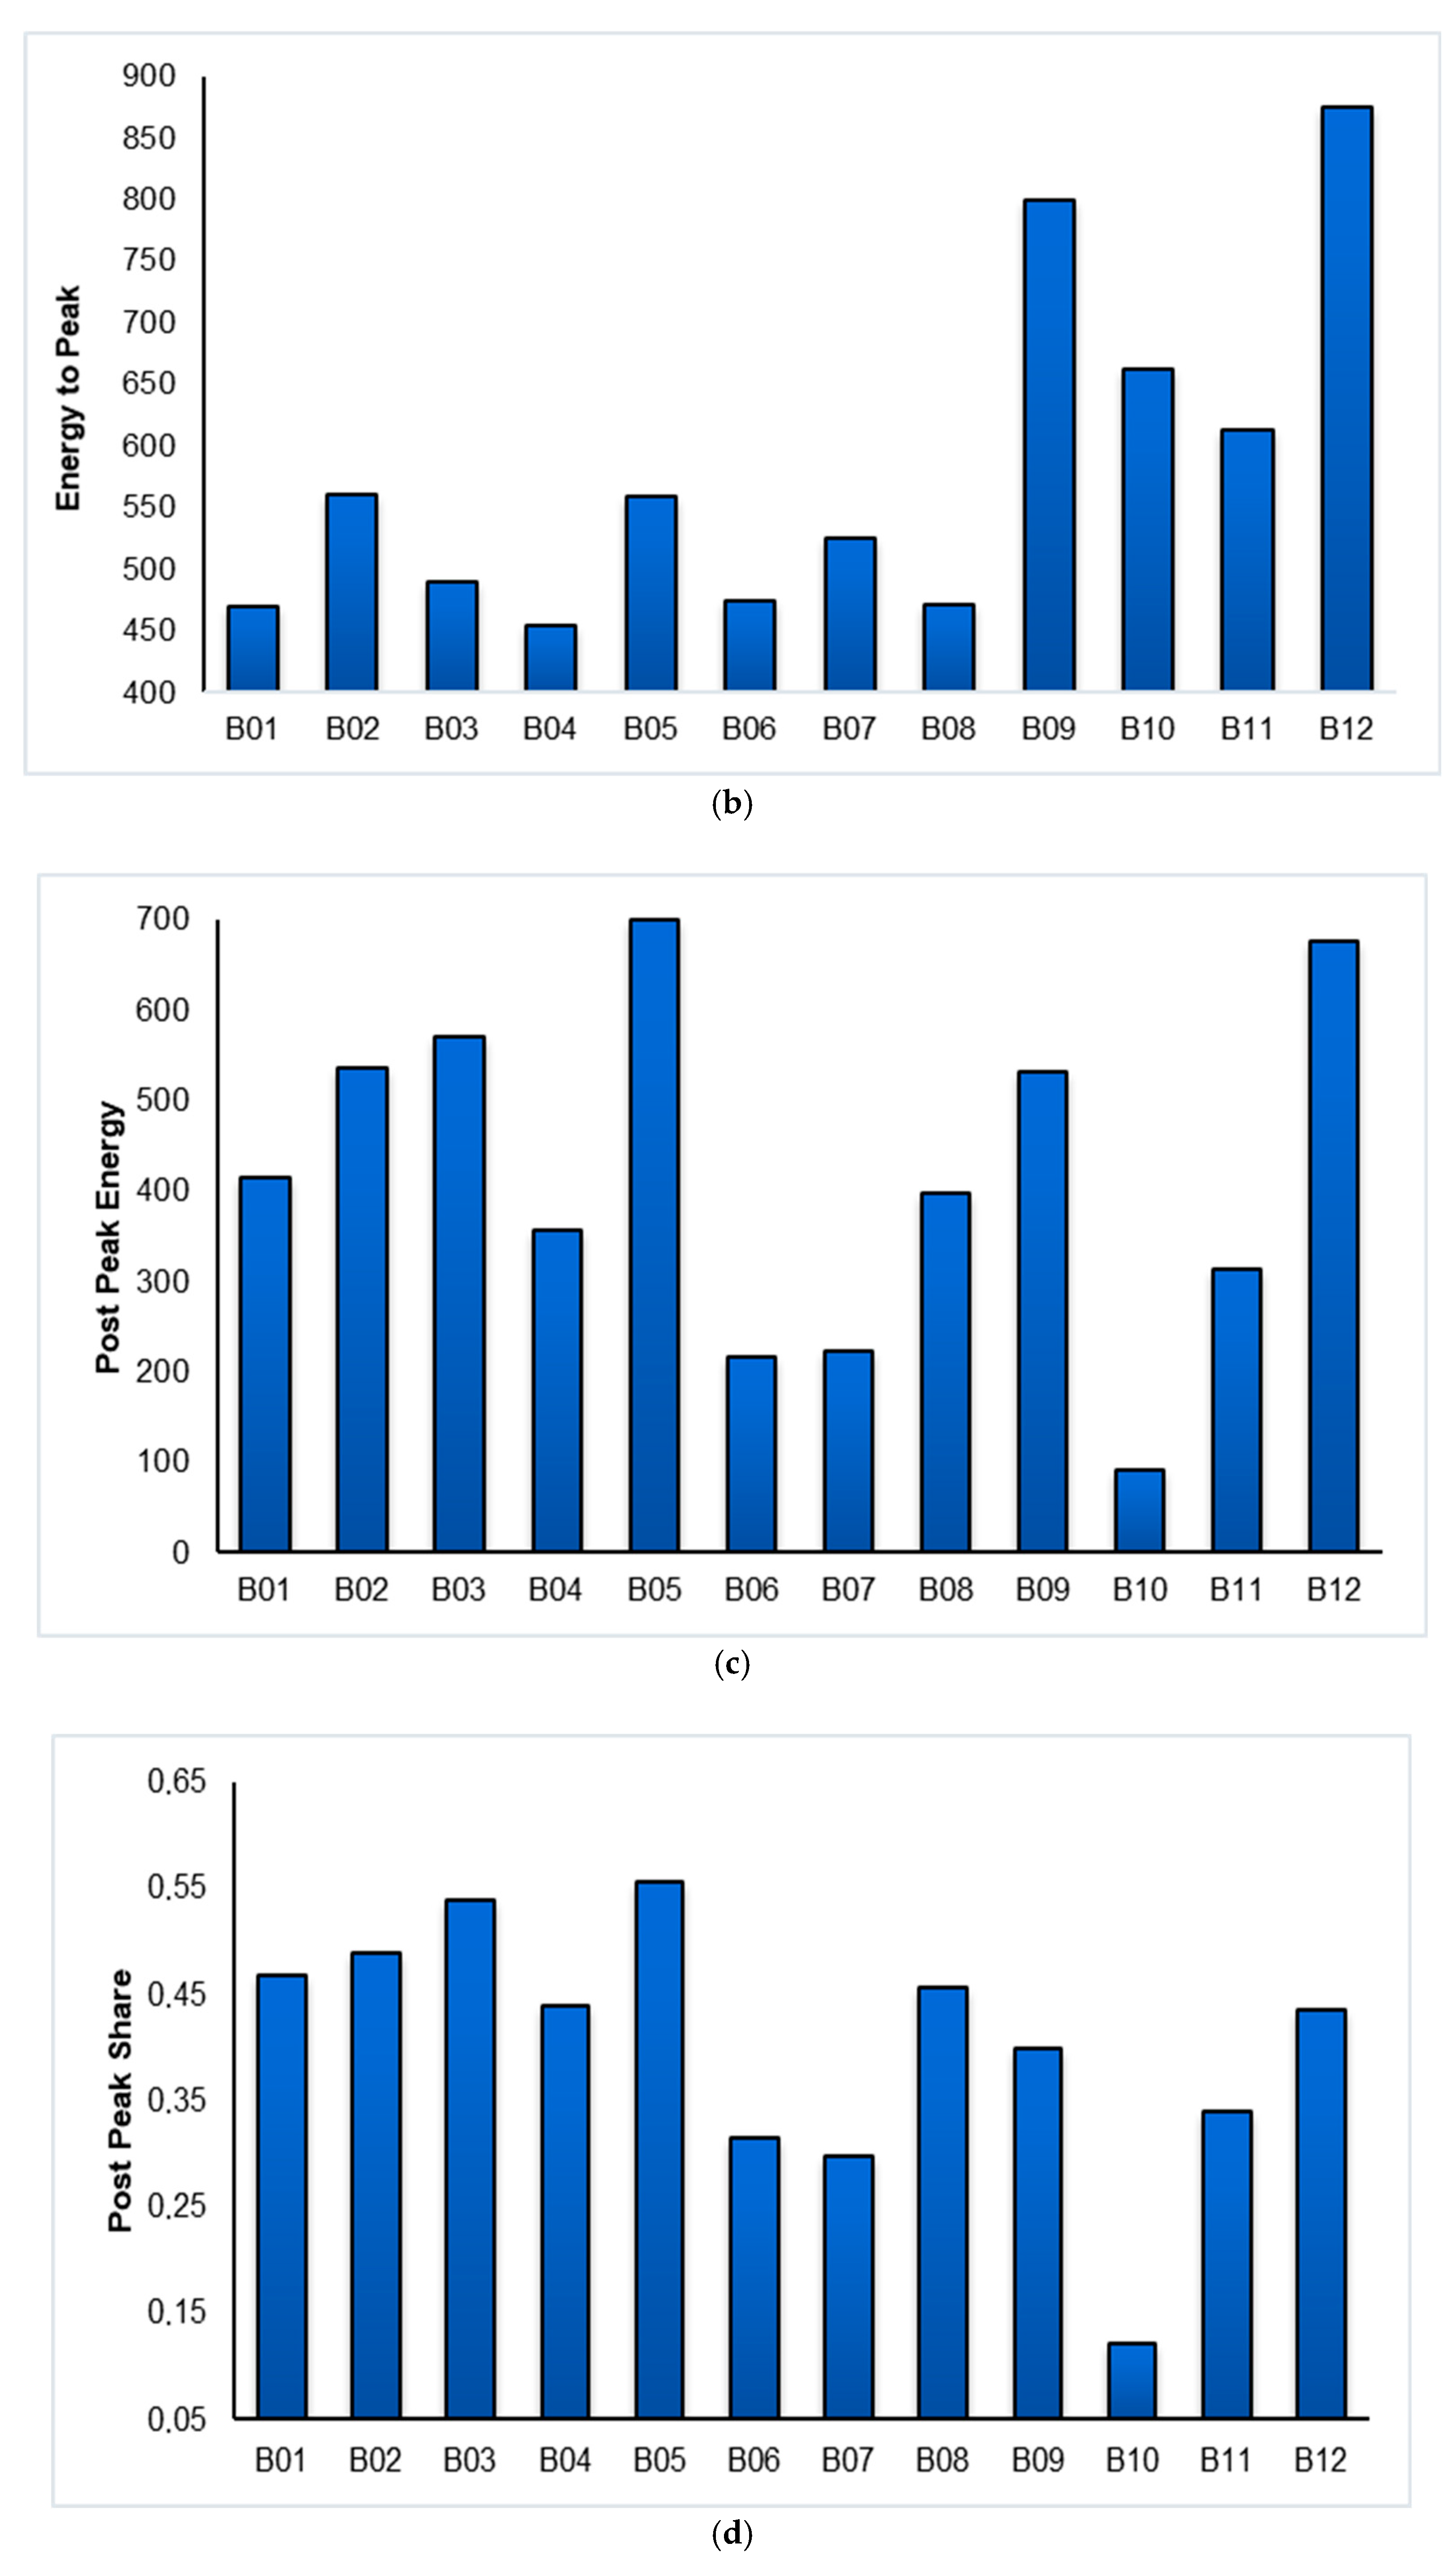
Energy absorption and toughness indices were calculated according to the analytical definitions provided in Section 2.4. These indices enable a standardized evaluation of deformation-related damage evolution. A physical discussion of beam behavior, consequently, should involve energy transfer and aspects of micro-cracking, crack coalescence, and post-peak load transfer modeling. Based upon the energy parameters derived from the load displacement curves (Figure 5), the total energy absorption ranges from 691.25 kN·mm for B06 to 1550.73 kN·mm for B12, and the post-peak energy distribution ranges from a lower value of 0.12 for B10 to values exceeding a higher critical value of 0.55 for B05. B05 and B12, which present higher values of energy absorbed post-peak, 700.84 kN·mm and 675.52 kN·mm, respectively, are not only characterized by higher displacement capacities, which obviously are the primary reasons behind their higher toughness, but are also characterized by microcracking and stable crack opening mechanisms that are dominant during the fracture process. Hence, one may assume that geopolymer matrix activation and bond interfaces are relatively homogeneous, and the crack formation process takes time, allowing for the development and interaction of microcracks prior to the final crack formation, thereby increasing the deformation energy that becomes gradually absorbed through the processes involving interfacial-sliding, gradual fiber de-bonding, and crack-bridging actions, and hence the post-peak displacement domain and the corresponding post-peak energy fraction are gradually increased. The situation, however, is totally different for the other beams, like B10 and B06, characterized by relatively low values of post-peak energy, namely, just 91.64 kN·mm and 217.41 kN·mm, respectively, and are clearly characterized by mechanisms that are totally different, wherein, despite the substantial energy absorption prior to the peak load, namely, an average value of 662.09 kN·mm, and clearly indicating that though the cracking process is initiated, the final crack rapidly controls the situation, and clearly, the systems that are stiffer and not so damage-resistant are characterized by microstructural concepts that are stiffer, wherein the microcracking process is gradually duplicated, thereby limiting the use of the related applied interfaces, and hence the required displacement domain is reduced correspondingly. Therefore, the other beams, such as B01, B02, B03, B04, B08, B09, and B11, clearly lie between the two cases. For instance, B03 possesses a relatively higher post-peak energy value of 570.57 kN·mm with a post-peak share of approximately 0.54, and comparatively medium stiffness degradation, signifying that cracks exist over a substantial length of the beam prior to localization, whereas for B09, despite possessing a relatively lower post-peak share value of 0.40, a substantial total energy absorption capacity of 1331.25 kN·mm is achieved because of a large deformation range attributed to the slow stiffness degradation process. Notably, the excellent agreement between the higher post-peak energy shares and the softer post-peak stiffness degradation confirms that toughness is dependent upon the post-cracking load transfer process, and not the peak load or stiffness values. The beams possessing a slower stiffness degradation process can effectively resist crack openings over a large deformation range, thereby translating imposed deformation into a controlled damage process rather than a catastrophic failure process. These results imply that the uniformity attributed to the curing process and successful matrix and reinforcement interaction play a pivotal role in promoting a stable crack evolution process and superior toughness of geopolymer-based composite beams. Finally, the results attributed to variations in energy absorption capability reflect that toughness is primarily a result of efficient geopolymer matrix damage and interface-controlled crack evolution and redistribution, thereby establishing the pressing need for post-peak energy degradation capability and underlying mechanisms for the assessment of structural robustness characteristics of geopolymer-based composite beams.
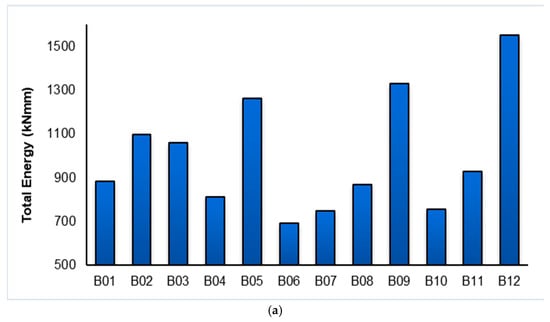
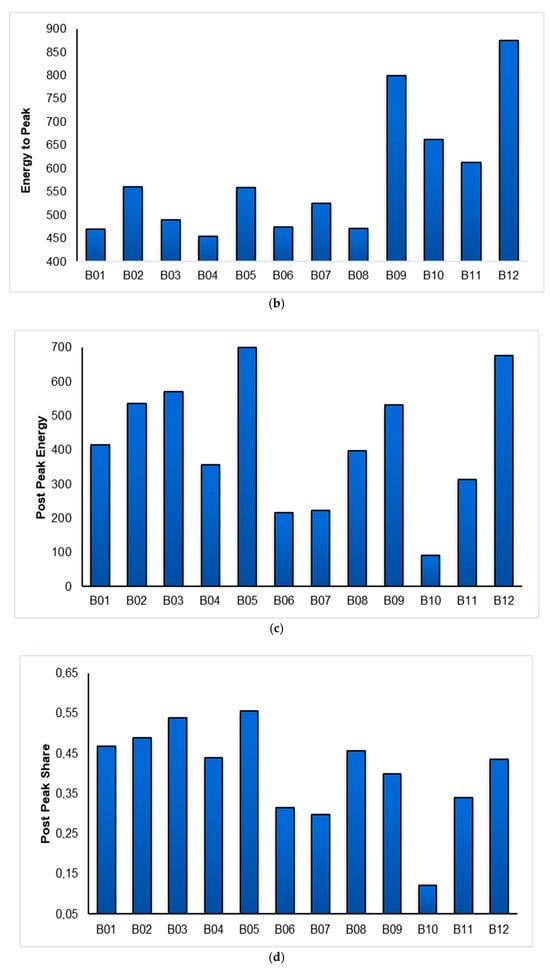
Figure 5.
Energy absorption characteristics of geopolymer-based composite beams under flexural loading. (a) Total energy, (b) pre-peak energy, (c) post-peak energy, and (d) post-peak energy ratio.
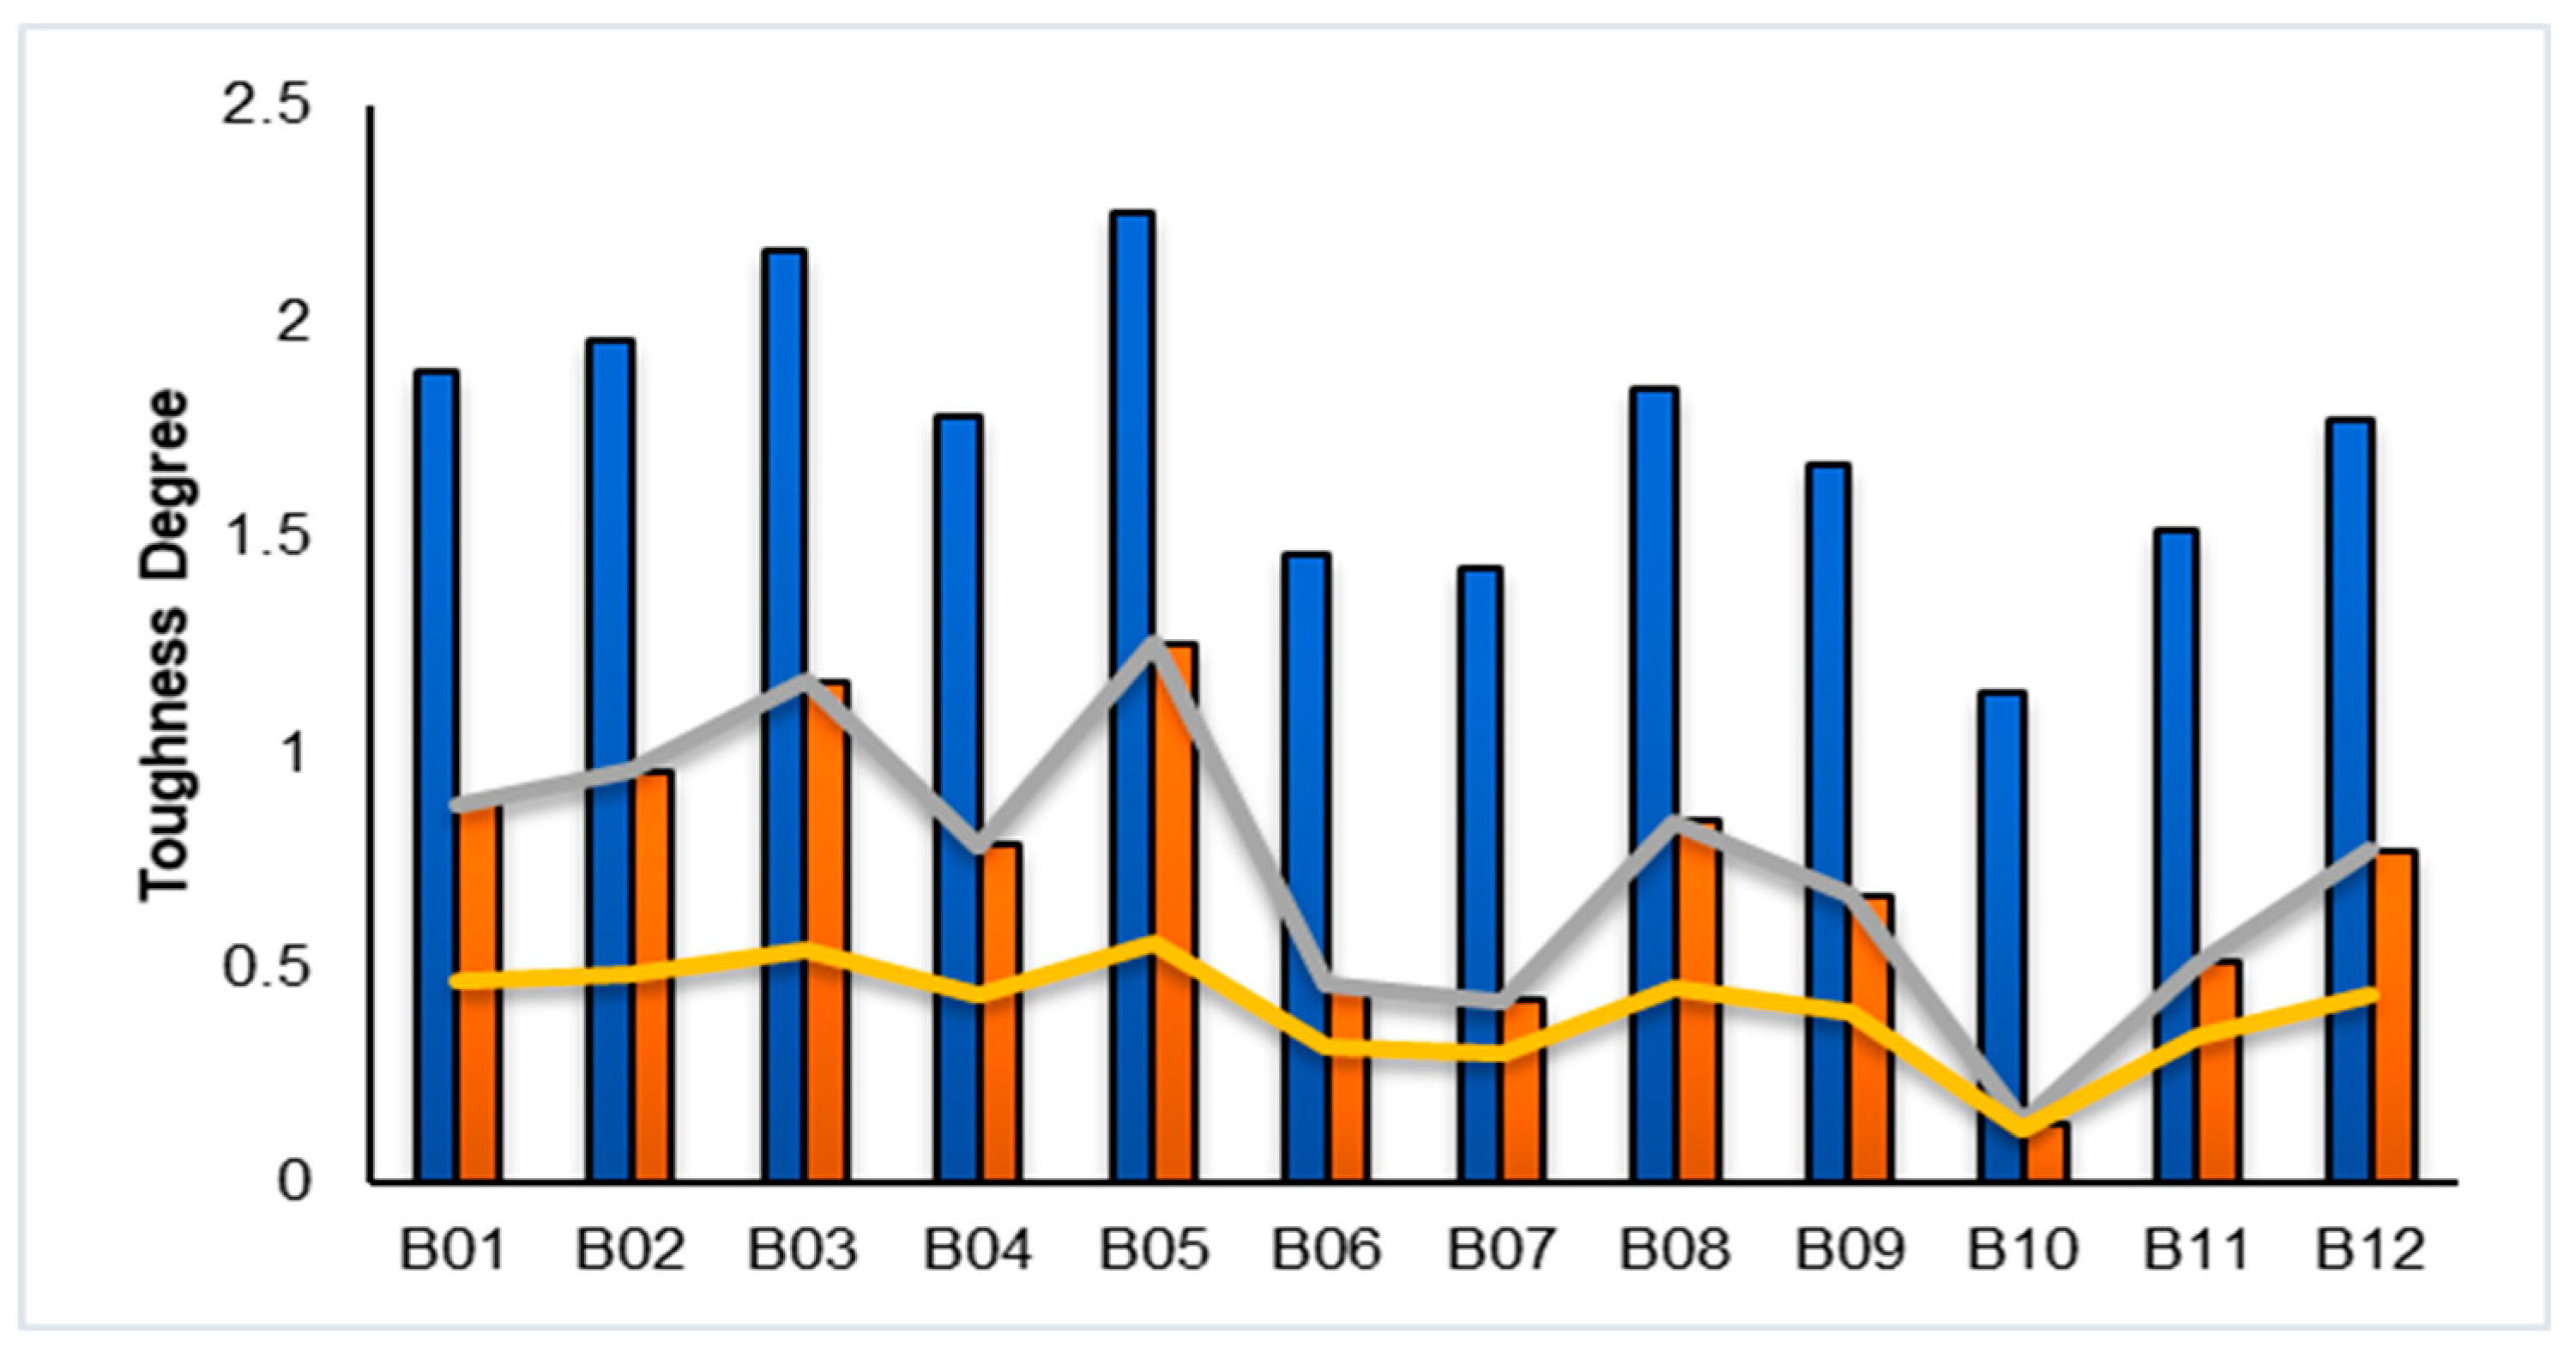
Toughness was assessed using the ratio of total absorbed energy to energy absorbed up to peak load (TR = Etotal/Epeak) and the post-peak toughness ratio, which directly reflects the efficiency of post-cracking deformation energy dissipation (Figure 6). TR values show significant variation among the twelve beams, ranging from approximately 1.14 in B10 to over 2.25 in B12; this clearly demonstrates that the capacity to withstand deformation beyond peak load differs fundamentally among the specimens. B05, B12, and B03 demonstrate the highest toughness degrees, with TR values greater than 2.1, corresponding to post-peak toughness ratios on the order of 1.0–1.25, meaning that these beams are capable of dissipating an amount of energy after peak load that is comparable to, or even greater than, the energy absorbed prior to peak resistance. This behavior reflects a damage evolution mechanism dominated by stable crack opening and progressive engagement of post-cracking load-transfer mechanisms, whereby deformation energy is redistributed over an extended post-peak interval through frictional sliding along crack faces, gradual fiber debonding, and sustained crack-bridging action [28]. In contrast, B10 displays the lowest toughness degree, with a TR value only slightly above unity and a post-peak toughness ratio of approximately 0.14, indicating that nearly all deformation energy is absorbed before or very near the peak load, and that the post-peak regime contributes minimally to overall energy dissipation. Such a response is characteristic of a brittle damage evolution pathway, in which cracking rapidly localizes into a dominant fracture plane, severely limiting the activation of frictional and bridging mechanisms after the peak. B06 and B07 indicate similarly low to moderate toughness degrees, with TR values below 1.5 and post-peak toughness ratios less than 0.5, suggesting that although some post-peak deformation is sustained, the efficiency of post-cracking energy dissipation remains limited due to relatively rapid stiffness degradation and accelerated crack localization. Intermediate toughness behavior is observed in B01, B02, B04, B08, B09, and B11, which exhibit TR values in the range of approximately 1.7–2.0 and post-peak toughness ratios between 0.6 and 0.95. In these specimens, deformation energy is more evenly partitioned between pre-peak and post-peak regimes, indicating a balance between matrix-dominated stiffness prior to cracking and crack-bridging-controlled deformation after peak. This balanced toughness degree suggests that microcracking develops in a relatively distributed manner, delaying crack coalescence and enabling stable post-cracking load transfer without fully suppressing stiffness degradation.
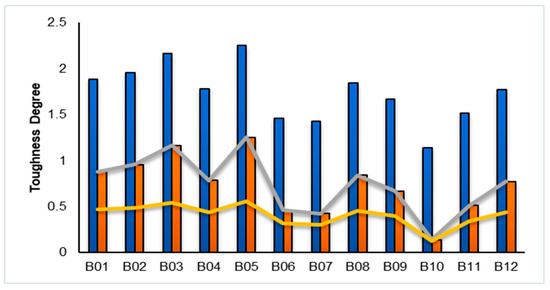
Figure 6.
Comparison of toughness-related indices for the B01–B12 beam series. Blue bars represent the toughness ratio Etotal/Epeak, orange bars indicate the post-peak toughness ratio Epost/Epeak, grey solid lines correspond to the normalized extra toughness (Etotal − Epeak)/Epeak, and yellow solid lines denote the post-peak energy fraction Epost/Etotal. All series are plotted using consistent color and bar/line representations.
3.4. Ductility Behavior
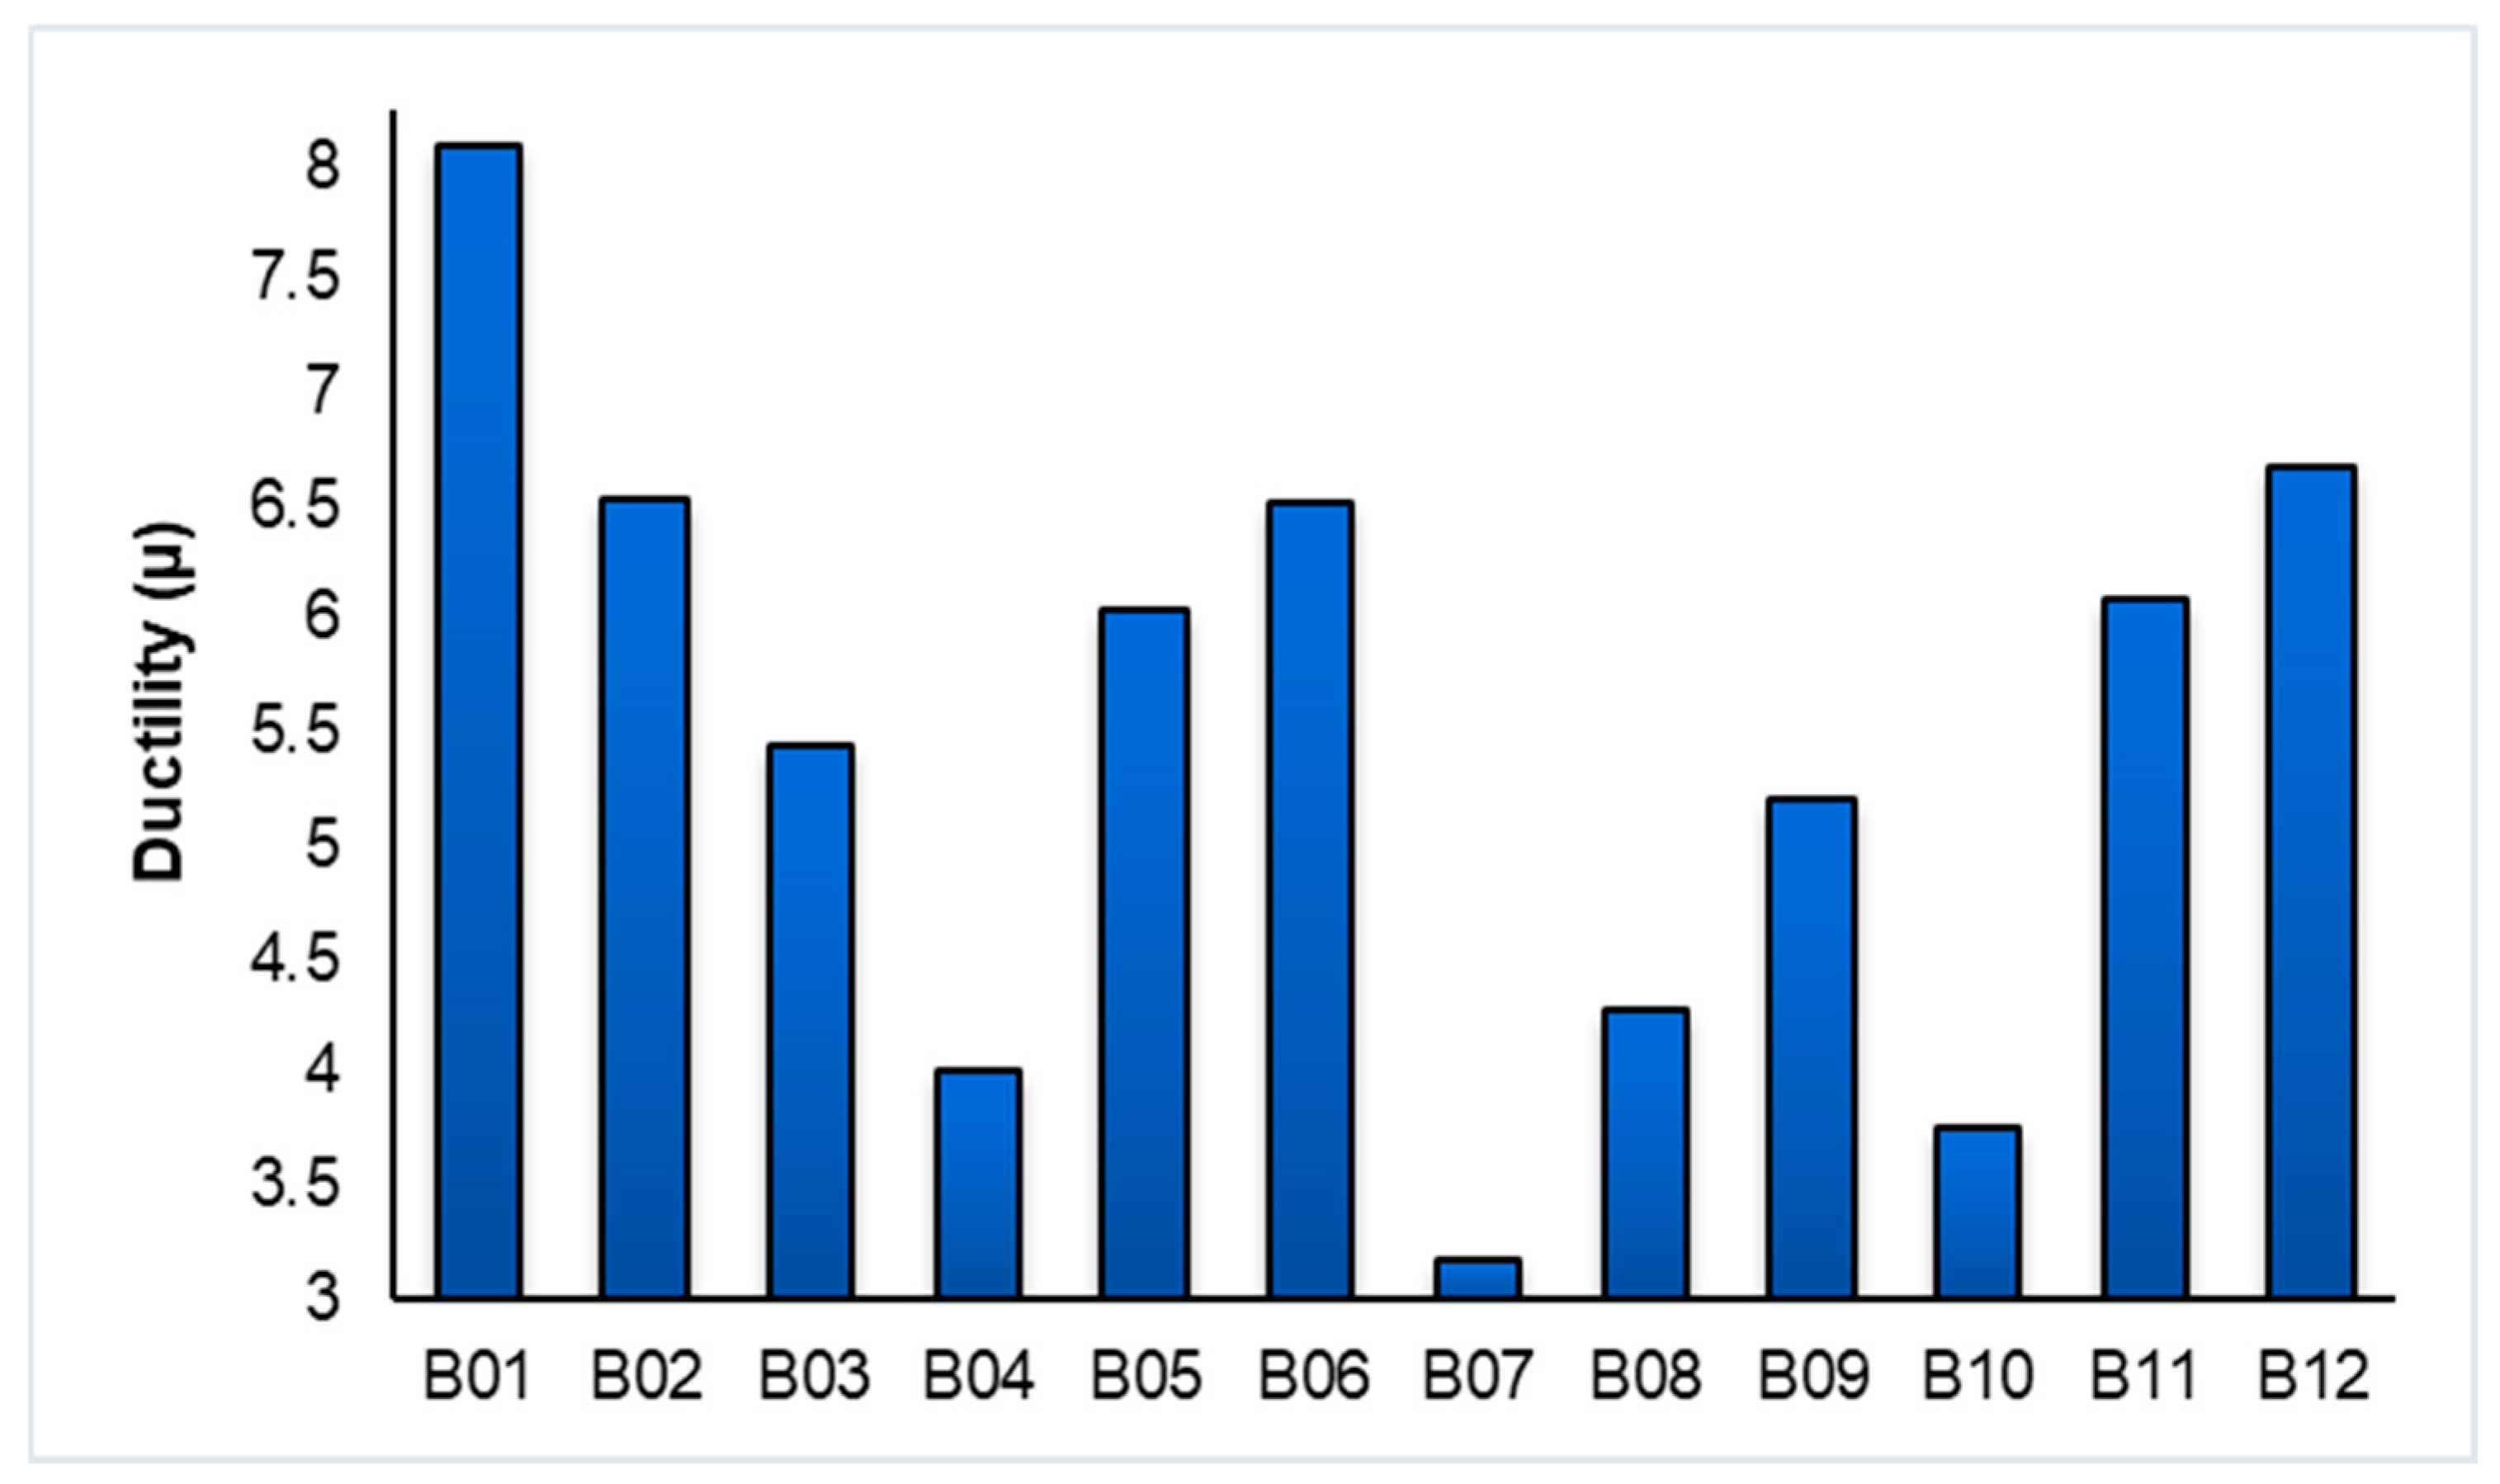
The displacement-based ductility index, defined as μ = d80/dy with dy corresponding to the displacement at 0.75*Pmax on the ascending branch and d80 corresponding to the displacement at 0.80*Pmax on the descending branch, provides a highly sensitive indicator of how each geopolymer-based composite beam accommodates damage after the onset of cracking and how effectively post-cracking load-transfer mechanisms remain active during progressive deformation (Figure 7). Unlike peak load or stiffness parameters, which primarily characterize the response of the uncracked or mildly cracked matrix, the ductility index captures the relative length and stability of the post-cracking deformation regime, thereby reflecting the balance between crack dispersion, crack interaction, and crack localization. The calculated ductility indices span a wide range, from approximately 3.17 in B07 and 3.75 in B10 to as high as 8.09 in B01, indicating more than a twofold variation in deformation capacity among specimens before the post-peak resistance drops to 80% of the maximum load. This wide dispersion cannot be explained by strength differences alone and instead reflects fundamentally different damage evolution pathways. B01, which exhibits the highest ductility (μ ≈ 8.09), achieves this value through the combined effect of an exceptionally low yield displacement (dy = 4.77 mm) and a comparatively large post-peak deformation capacity (d80 = 38.59 mm). This supports that cracking initiates relatively early, but does not immediately trigger crack coalescence or localization; instead, multiple cracks can form and evolve in a stable manner, allowing for deformation to accumulate through gradual crack opening while load transfer is progressively maintained by frictional resistance and bridging mechanisms. In this sense, the high ductility of B01 does not imply delayed cracking, but rather controlled cracking, where damage is spread over a broader deformation interval instead of being concentrated into a single dominant fracture. A similar mechanistic explanation applies to B12 (μ ≈ 6.67, dy = 9.22 mm, d80 = 61.49 mm) and B05 (μ ≈ 6.05, dy = 10.96 mm, d80 = 66.26 mm), both of which reveal very large post-peak displacement capacities. In these beams, the large d80 values suggest that once peak load is reached, the structural system can continue to deform substantially while retaining a high proportion of its load-carrying capacity. This behavior strongly suggests a damage mechanism dominated by stable crack widening and progressive engagement of post-cracking transfer mechanisms, such as interfacial sliding and frictional dissipation along crack faces, rather than by abrupt matrix fracture. The fact that these beams also represent high post-peak energy absorption further confirms that the deformation process in this regime is not merely geometric, but energetically active, with substantial work being dissipated during controlled damage evolution. B02 (μ ≈ 6.53, dy = 8.61 mm, d80 = 56.18 mm) and B06 (μ ≈ 6.51, dy = 5.88 mm, d80 = 38.27 mm) reach similarly high ductility levels through slightly different combinations of yield and post-peak displacements, highlighting that high ductility can arise either from early but stable cracking (low dy combined with moderate d80) or from later cracking followed by an extended post-peak deformation regime (moderate dy combined with large d80). This distinction emphasizes that ductility is not governed by a single parameter but by the relative positioning of yield and post-peak deformation limits along the load–displacement response. In contrast, beams with low ductility values illustrate the mechanical consequences of rapid crack localization. B07 (μ ≈ 3.17, dy = 11.95 mm, d80 = 37.88 mm) exhibits a relatively high yield displacement but a limited post-peak deformation reserve, indicating that although the specimen remains largely intact up to higher deformation levels, once cracking becomes dominant, crack interaction and coalescence occur over a short displacement interval, leading to a rapid reduction in load-carrying capacity. B10 (μ ≈ 3.75, dy = 8.57 mm, d80 = 32.09 mm) represents the most brittle post-peak response among all specimens: despite a substantial energy absorption up to peak, the small d80 value indicates that the beam cannot sustain significant additional deformation once peak load is exceeded. This implies that a dominant crack forms quickly after peak load, severely limiting the activation of frictional and bridging mechanisms and resulting in a steep post-peak decay, which directly translates into a low ductility index. The intermediate ductility responses observed in B03 (μ ≈ 5.43), B09 (μ ≈ 5.21), B11 (μ ≈ 6.08), B08 (μ ≈ 4.27), and B04 (μ ≈ 4.00) reflect transitional damage mechanisms in which cracking is neither excessively delayed nor prematurely localized. In these beams, yield displacements fall within a moderate range, and post-peak deformation capacities are sufficient to permit meaningful damage redistribution, but the stability of crack opening and post-cracking transfer varies from specimen to specimen.
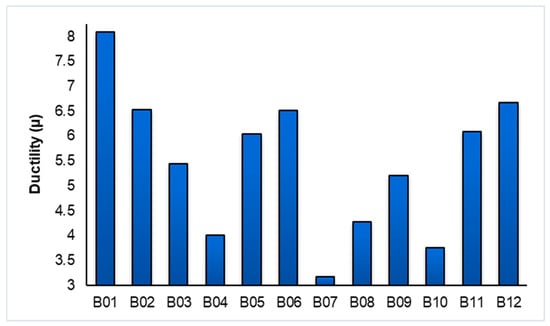
Figure 7.
Displacement-based ductility indices (μ) of geopolymer-based composite beams under flexural loading.
3.5. Slip Behavior
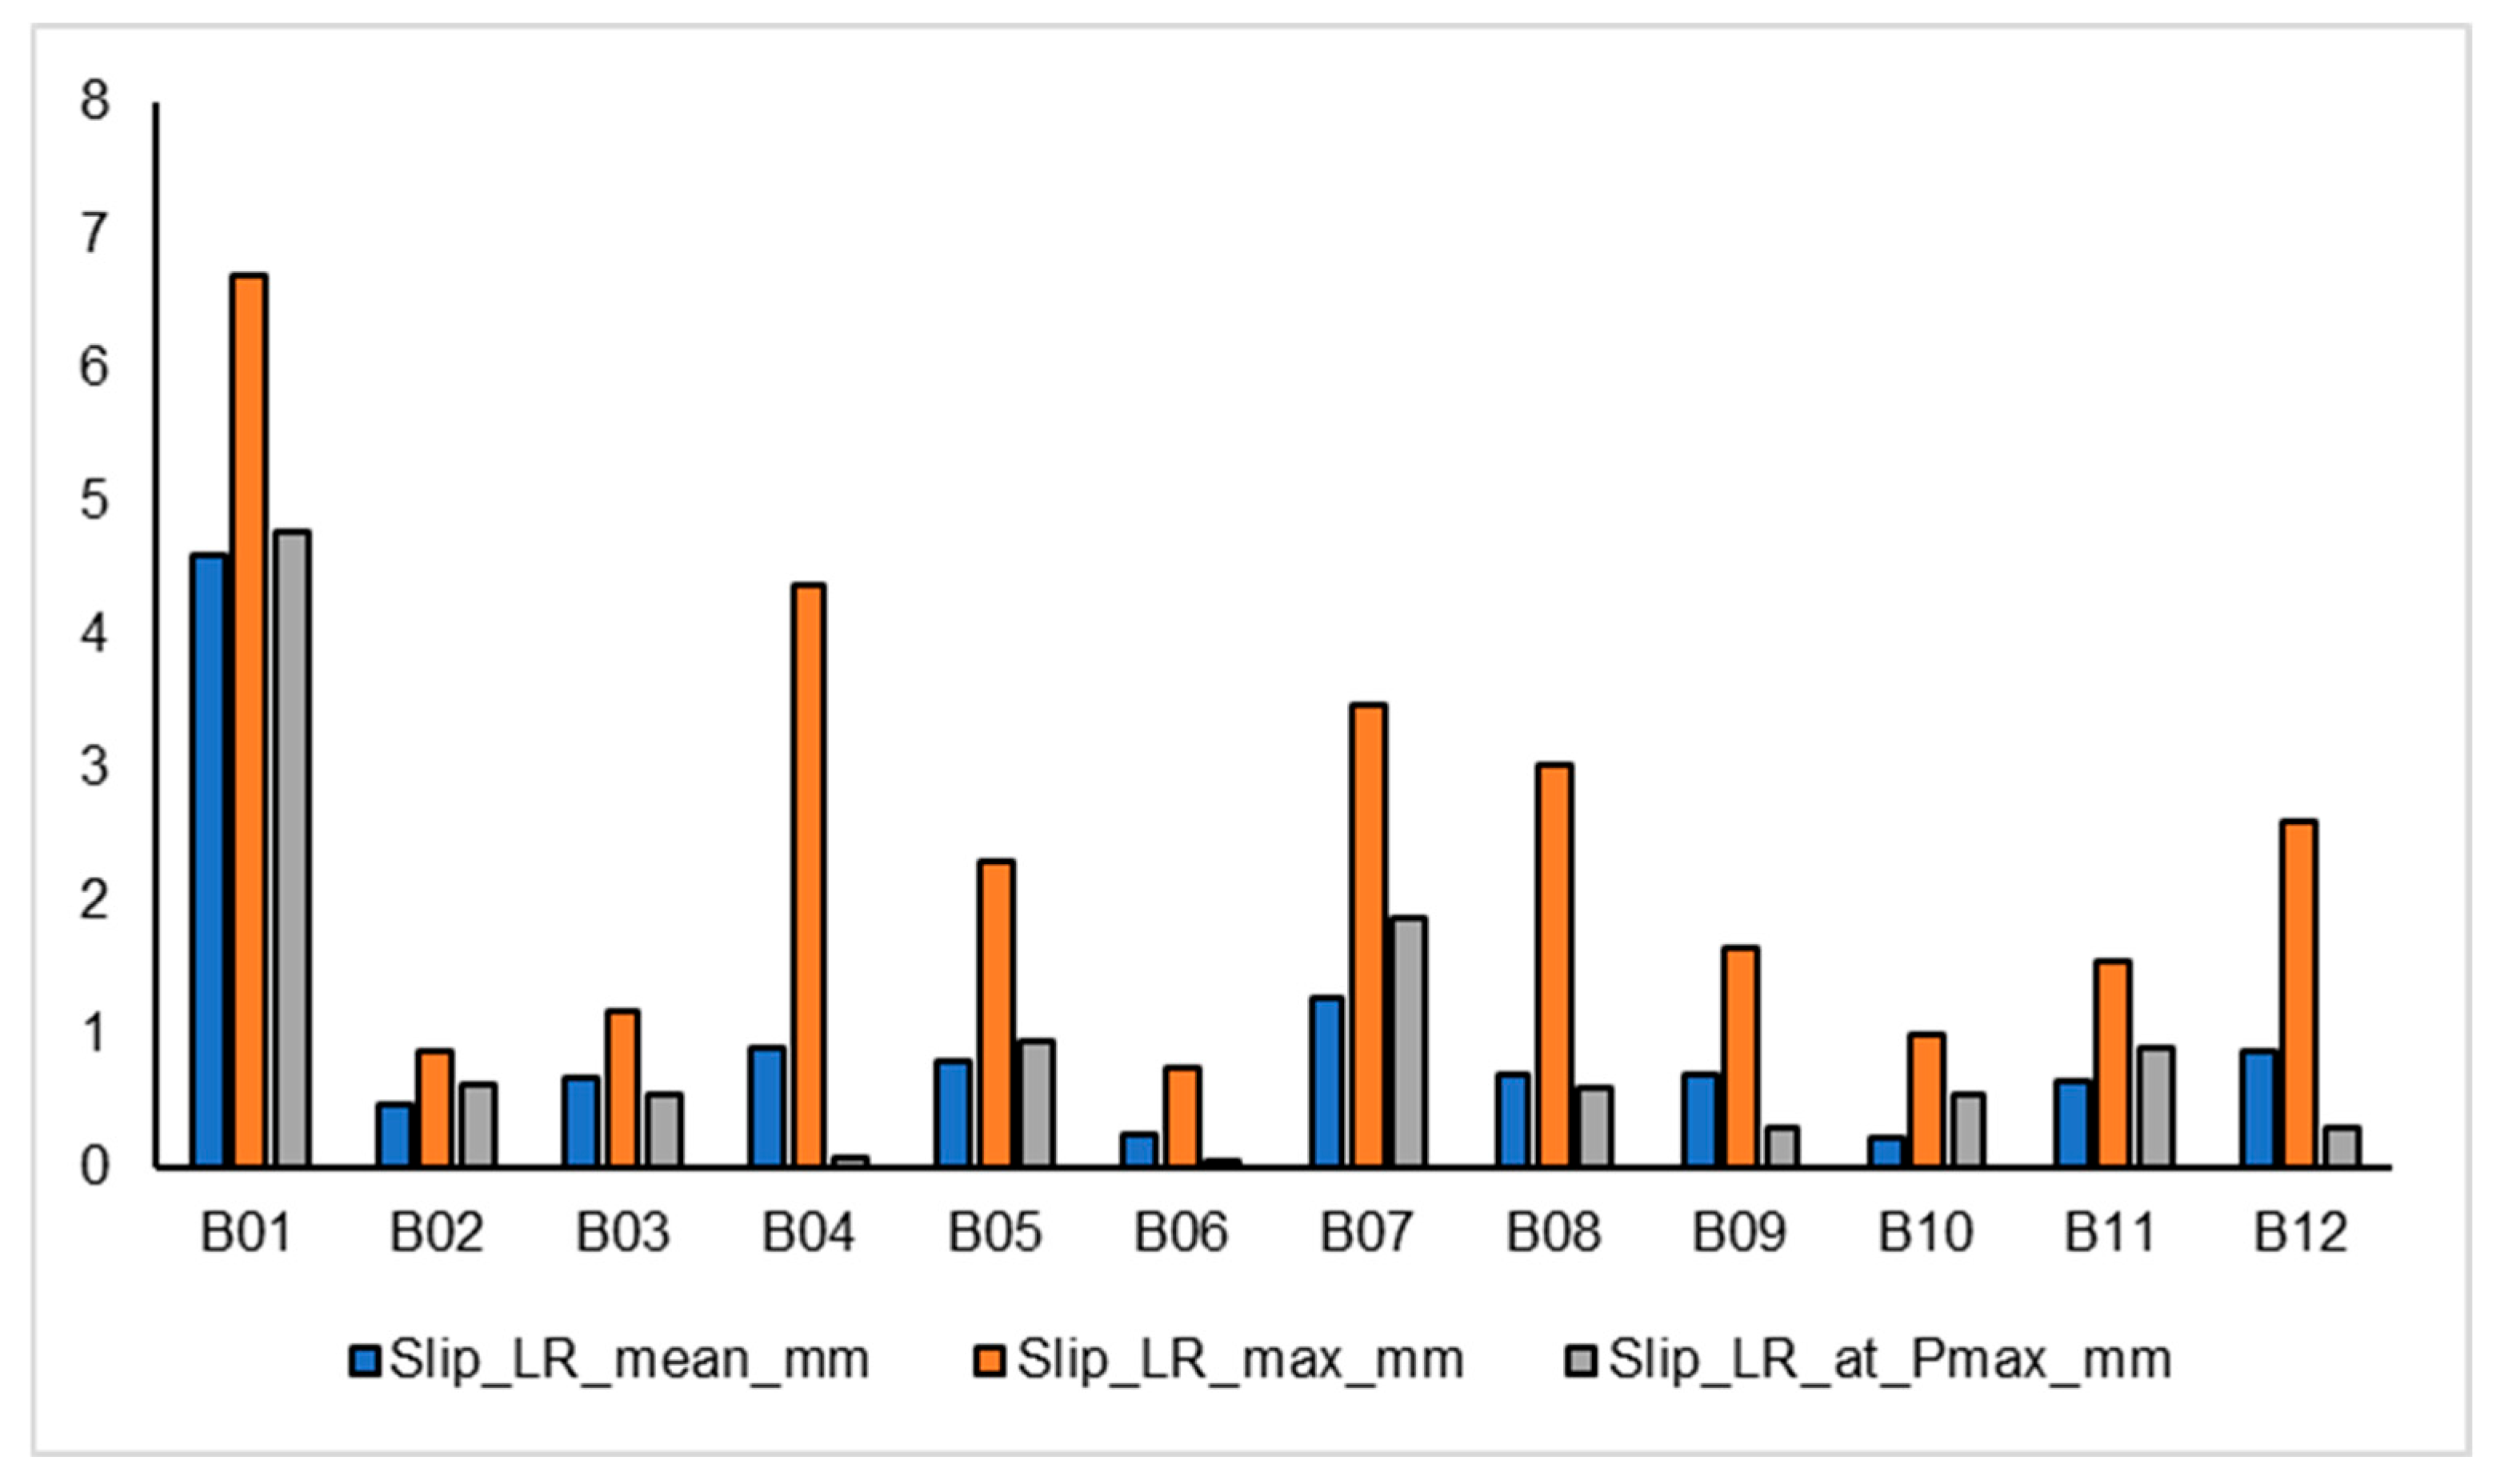
When considering the joint slip response and curing pathway, it is apparent from the data set that deformation asymmetry is neither randomly varying nor solely a characteristic influenced by the curing pathway itself, but rather a deformation rate-dependent trait that represents the time span during which the beam behavior shifts from global compatibility to localization-controlled kinematics. This is clarified by evaluating relative slip parameters (LRmean, LRmax, and LRPmax) and mid-span deviation for ambient-cured (B01 to B04), electrically cured (B05 to B08), and thermally cured (B09 to B12) specimens separately (Figure 8). For ambient-cured specimens, asymmetry variation is most scattered and extreme while being cured under ambient activation conditions; hence, B01 are most critical with highly asymmetrical deformation response throughout (LRmean = 4.603 mm; LRmax = 6.70 mm; and LRPmax = 4.77 mm), along with significantly high mid-span deviation (6.224 mm), reflecting that deformation is characterized by a commanding crack path and a highly nonlinear curvature field even at peak load points. B02 and B03, belonging to their respective cure paths, are characterized by low slip values (B02: LRmean = 0.483 mm; LRmax = 0.89 mm; and LRPmax = 0.62 mm; and for B03: LRmean = 0.683 mm; LRmax = 1.19 mm; and LRPmax = 0.56 mm), indicating that deformation is still symmetric even at peaks due to uniformly distributed cracking for ambient-cured specimens. B04 describe a unique slip response due to their ambient-cured specimens as they indicate less deformation asymmetry at peaks (LRPmax = 0.07 mm), even without significant distortion until they peak at an extremely high negative slip response (LRmax = 4.38 mm), indicating that critical localization dominates mainly during post-peak deformation phases where dominance by a single cracking surface takes place after exhausting post-cured and continuous matrix structure integrity. Compared to the ambient-cured specimens above, electrically cured ones generally have less uncontrolled slip deformation ranges and reduced asymmetry peaks; hence, they are highly prone to deformation compatibility due to their respective curing methods. Specifically, B06 has the most symmetric pattern in the whole series of curves (LRmean = 0.266 mm, LRmax = 0.76 mm, LRPmax = 0.06 mm), which strongly indicates that electrically cured samples offer the best activation symmetry that resists unilateral dominance. However, electrically cured samples do not prevent localization entirely, as noted by the presence of appreciable asymmetry for both B07 and B08 (B07: LRmean = 1.274 mm, LRmax = 3.47 mm, LRPmax = 1.88 mm; B08: LRmean = 0.696 mm, LRmax = 3.02 mm, LRPmax = 0.60 mm), which indicates that the local fiber orientation as well as the crack formation points can influence the deformation to lean toward the strong side even when electrically assisted activation takes place. The beams that received thermal curing show more bimodal distributions, which are common in more dense materials prone to fast unloading or sustained post-peak deformation according to the extent of localization of the material. B09 and B10 show relatively symmetric distributions, especially when considering the values of the slips (B09: LRmean = 0.697 mm, LRmax = 1.65 mm, LRPmax = 0.30 mm; B10: LRmean = 0.238 mm, LRmax = 1.00 mm, LRPmax = 0.56 mm), but the values for B11 and B12 show higher asymmetry levels together with higher mid-span slips (B11: 3.641 mm; B12 = 4.439 mm). In general, the comparison among the different curves, which depend on the type of material, strongly illustrates that the type of material dominates not only the structural resistance but also the way of structural deformation: ambient-cured beams contain the highest variability, which includes the worst case when early asymmetry takes place; electrically cured beams generally offer the best symmetric structural activation, which seems to exhibit less slips; and the beams that received thermal curing either show relatively symmetric short post-peak deformations or mid-span localizations according to the stability of the dominant crack. Therefore, the use of slips provides a physical correlation among the various curves independently of the material, which can possibly give more structural information than the previously discussed global structural resistance due to its direct correlation to the structural compatibility.
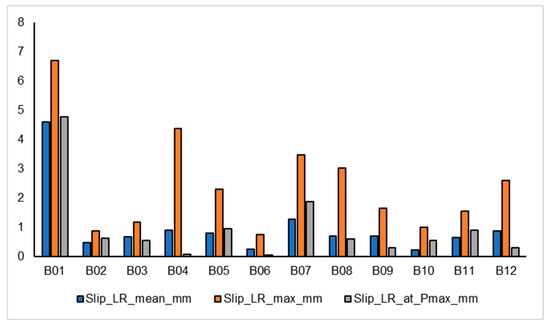
Figure 8.
Comparison of slip behavior of geopolymer-based composite beams under three-point bending.
4. Conclusions
- The peak load values of the geopolymer-based composite beams ranged from about 20.8 kN to 31.5 kN, which is a difference of about 50%, with both beams having the same geometry and reinforcement to validate the dominance of the curing process/microstructure in influencing the performance of the composite material.
- The initial stiffness varied from 1.75 to 6.09 kN/mm, which showed variations of more than threefold, with a higher stiffness retention of up to 90% of Pmax (K90/K10 = 0.53) for electrically cured beams than ambient-cured beams of at least approximately 0.15.
- The values of the total energy absorption capacity varied from about 690 kN·mm to 1550 kN·mm, whereas the post-peak values of the fractions of energy absorbed ranged from 0.12 to 0.55, showing that the toughness of the materials is mostly influenced by post-peak characteristics rather than peak values.
- Ductility ratios (μ = d80/dy) varied largely from approximately 3.2 to about 8.1, where more ductile beams possessed the ability to resist twice the deformation after the peak load to attain 80% failure.
- Total absorbed energy showed an increase of 40 to 70%, while the post-peak toughness ratios also increased considerably for metallic fiber-reinforced geopolymer composite beams compared to carbon-based materials, thus reiterating the effectiveness of ductile metallic components to arrest crack localization.
- The stability induced by electrical curing improved deformation stability by approximately 25–45%, reduced defor-mation asymmetry and slip occurrences, and ensured a more symmetric load–deflection response compared with am-bient and thermal curing.
- The arrangement with maximum stiffness retention capability, combined with metallic fiber reinforcement and electrical curing, was found to be the most optimal configuration, which outperformed all other configurations of curing and fibers.
Since only a single beam was tested for each fiber–curing condition, the results should be interpreted as general trends rather than definitive conclusions. The observed variations may, in part, be attributed to experimental scatter. Further studies incorporating replicate specimens are necessary to statistically quantify the inherent variability.
Author Contributions
Conceptualization, F.U., M.U., B.A., T.B., T.C., M.S.A. and G.A.; Methodology, F.U., M.U., T.B., T.C., M.S.A. and G.A.; Software, F.U., M.U., T.B., T.C., M.S.A. and G.A.; Validation, F.U., M.U., T.B., T.C., M.S.A. and G.A.; Formal analysis, F.U., M.U., B.A., T.B., T.C., M.S.A. and G.A.; Investigation, F.U., M.U., T.B., T.C., M.S.A. and G.A.; Resources, F.U., M.U., B.A., T.B., T.C., M.S.A. and G.A.; Data curation, F.U., M.U., B.A., T.B., T.C., M.S.A. and G.A.; Writing—original draft, F.U., M.U., B.A., T.B., T.C., M.S.A. and G.A.; Writing—review and editing, F.U., M.U., B.A., T.B., T.C., M.S.A. and G.A.; Visualization, F.U., M.U., T.B., T.C., M.S.A. and G.A.; Supervision, M.U.; Project administration, M.U.; Funding acquisition, M.U. All authors have read and agreed to the published version of the manuscript.
Funding
This research received no external funding.
Data Availability Statement
Data is contained within the article. The original contributions presented in this study are included in the article. Further inquiries can be directed to the corresponding author.
Conflicts of Interest
The authors declare no conflicts of interest.
Appendix A. Preliminary Compressive Strength Results
Compressive strength tests were carried out on cubic specimens with dimensions of 100 mm × 100 mm × 100 mm in accordance with TS EN 12390-3. Prior to the main experimental program conducted at the beam scale, a series of preliminary compressive strength tests were performed to verify the feasibility of the selected geopolymer mix design, specimen preparation procedure, and testing configuration. These preliminary tests were primarily intended as pilot trials rather than as a basis for comparative or statistical performance evaluation. The objective of this stage was to ensure that the geopolymer system could achieve compressive strength levels within the expected range and that the loading setup produced stable and reliable measurements before proceeding to large-scale structural testing. However, due to their pilot nature, the specimens were not manufactured with strictly standardized dimensions. Minor variations in specimen geometry, cross-sectional area, and surface flatness were therefore present. Such geometric irregularities are well known to influence stress distribution and calculated compressive strengths, particularly in brittle or quasi-brittle materials such as geopolymer composites. Consequently, a certain degree of scatter was anticipated and observed in the calculated compressive strengths (Figure A1).
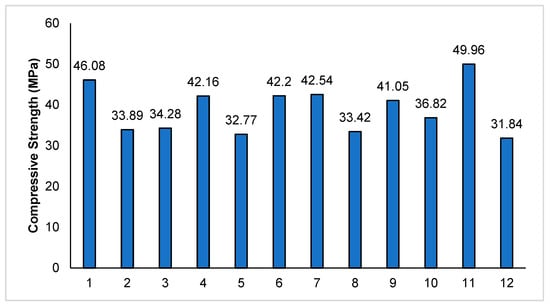
Figure A1.
Compressive strength of geopolymer composites.
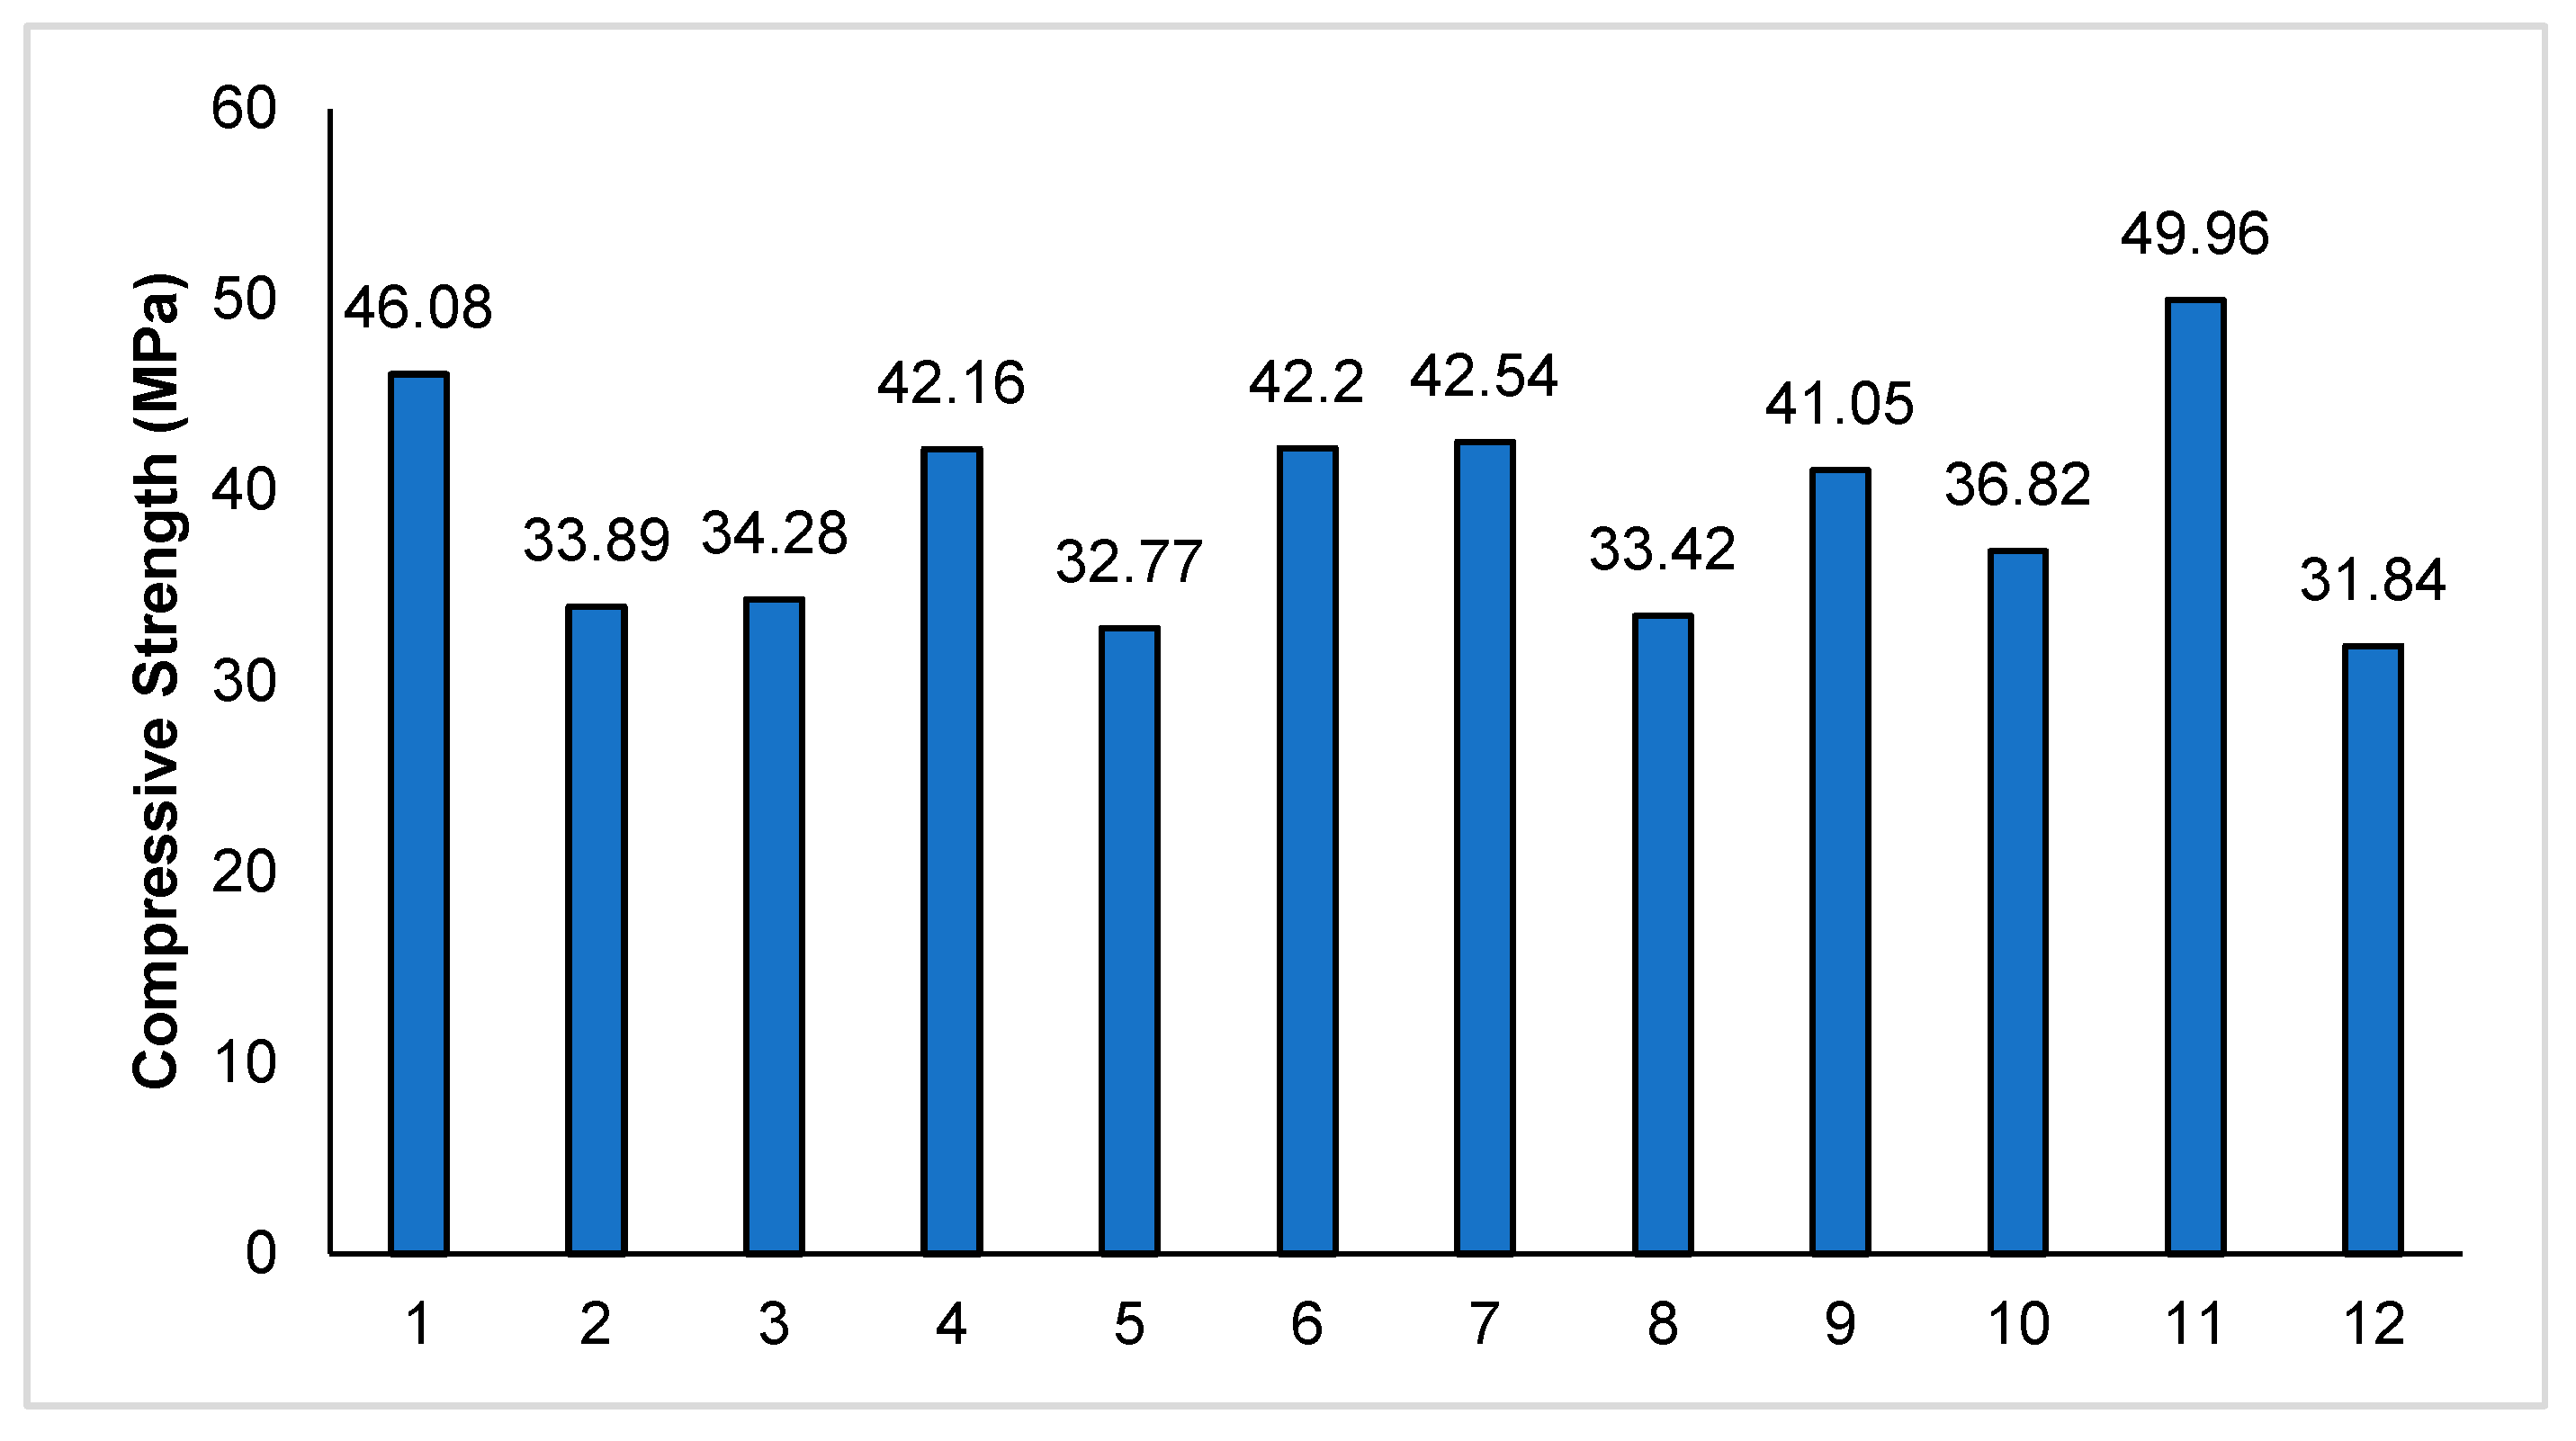
As observed, the compressive strengths exhibited noticeable variation, which can be attributed primarily to differences in specimen dimensions and boundary conditions during loading. In addition, potential surface unevenness and localized stress concentrations at the loading interfaces may have contributed to the dispersion of results. For this reason, the preliminary compression data were not included in the statistical analysis or comparative evaluation presented in the Section 3. Despite the observed scatter, the preliminary tests clearly confirmed that the selected geopolymer formulation was capable of achieving compressive strengths within the target range required for structural applications. The measured strength levels provided sufficient confidence to proceed with the beam-scale experimental program, where standardized specimen geometry, controlled curing regimes, and repeatable testing conditions were strictly enforced. Thus, the preliminary compression tests served as a validation step, ensuring the robustness of the experimental framework and the suitability of the material system prior to detailed structural performance assessment.
References
- Nikbakht, E.; Lok, J.W.W.; Teo, W. Structural behaviour of novel composite beams consisting of geopolymer concrete and high-performance concrete. Structures 2021, 32, 106–115. [Google Scholar] [CrossRef]
- Pham, D.Q.; Nguyen, T.N.; Le, S.T.; Pham, T.T.; Ngo, T.D. The structural behaviours of steel reinforced geopolymer concrete beams: An experimental and numerical investigation. Structures 2021, 33, 567–580. [Google Scholar] [CrossRef]
- Ansari, M.A.; Shariq, M.; Mahdi, F. Structural behavior of reinforced geopolymer concrete beams—A review. Mater. Today Proc. 2024, in press. [Google Scholar]
- Yuan, Y.; Ding, B.; Shi, H.; Wang, Y.; Lin, Y.; Elchalakani, M.; Cai, J. Flexural behaviour of one-part fibre-reinforced geopolymer beams. J. Build. Eng. 2024, 91, 109538. [Google Scholar] [CrossRef]
- Kavitha, K.E.; Seenirajana, M.; Shivasakthivadivelan, R.A.; Udhayasakthi, R.; Reena, L.; Thakur, N. Performance of eco-sustainable geopolymer mortar with neem fibre. Procedia Struct. Integr. 2025, 70, 588–595. [Google Scholar] [CrossRef]
- Rezzoug, A.; Lekloub, N.; Ayed, K.; Maryam, H. Enhancing geopolymer mortars for environmental sustainability: A novel approach using frits and ceramic waste. Next Res. 2024, 1, 100024. [Google Scholar] [CrossRef]
- Bezabih, T.; Sinkhonde, D.; Mirindi, D.; Kiprop, S.; Rihan, M.A.M.; Abdalla, T.A. Teff straw ash as an alternative precursor for sustainable geopolymer mortar: Mechanical, microstructural, and cost analysis. Constr. Build. Mater. 2025, 484, 141864. [Google Scholar] [CrossRef]
- Thakur, S.S.; Abbas, Z.; Bansal, K.; Fathima, K.M.P. Experimental and statistical comparison of fracture and fatigue performance of notched geopolymer and conventional concrete beams. Theor. Appl. Fract. Mech. 2026, 141, 105211. [Google Scholar] [CrossRef]
- Kılıc, M.; Bayrak, B.; Akarsu, O.; Alcan, H.G.; Çelebi, O.; Kaplan, G.; Öz, A.; Aydın, A.C. Strengthening of damaged RC beams using geopolymer concrete layers: Experimental and analytical insights. Eng. Fail. Anal. 2026, 185, 110419. [Google Scholar] [CrossRef]
- Wang, Z.; Xu, J.; Nie, L.; Xia, W.; Huang, Z.; Meng, X. Effect of test voltage and age on the electrical resistivity of carbon fiber reinforced concrete. IOP Conf. Ser. Earth Environ. Sci. 2021, 719, 042004. [Google Scholar] [CrossRef]
- Payakaniti, P.; Pinitsoonthorn, S.; Thongbai, P.; Amornkitbamrung, V.; Chindaprasirt, P. Effects of carbon fiber incorporation on the mechanical and electrical properties of fly ash–based geopolymer composites. Mater. Today Proc. 2018, 5, 14017–14025. [Google Scholar] [CrossRef]
- Zada Farhan, K.; Megat Johari, M.A.; Demirboga, R. Evaluation of the performance of steel fiber reinforced GGBFS-based geopolymer composites under aggressive environmental conditions. Constr. Build. Mater. 2022, 345, 128315. [Google Scholar] [CrossRef]
- Cleven, S.; Raupach, M.; Matschei, T. Electrical resistivity of steel fiber reinforced concrete: Influencing parameters. Materials 2021, 14, 3408. [Google Scholar] [CrossRef] [PubMed]
- Dehghanpour, H.; Yilmaz, K. Influence of specimen size, geometry, and temperature on the electrical resistivity of conductive concrete. Constr. Build. Mater. 2020, 250, 118859. [Google Scholar] [CrossRef]
- Dehghanpour, H.; Yilmaz, K. A sustainable approach for producing cost-effective electrically conductive concrete mixtures: Experimental and finite element study. Cold Reg. Sci. Technol. 2021, 184, 103238. [Google Scholar] [CrossRef]
- Gokcegoz, Y.; Uysal, M.; Canpolat, O.; Arikan, O.; Dilbas, H.; Aygun, B. Electrical curing of metakaolin- and GBFS-based geopolymers: A sustainable technology aligned with the European Green Deal. Materials 2025, 18, 4811. [Google Scholar] [CrossRef]
- Aygun, B.F.; Uysal, M.; Bilir, T.; Cosgun, T.; Dilbas, H. An investigation on physical, mechanical and microstructural properties of electricity-based cured GBFS–FA geopolymer. Constr. Build. Mater. 2025, 458, 139526. [Google Scholar] [CrossRef]
- Aygun, B.F.; Uysal, M.; Bilir, T.; Cosgun, T.; Dilbas, H. Alternating current curing of conductive fly ash–slag geopolymer mortars: Performance, characterization and optimization. Arch. Civ. Mech. Eng. 2025, 25, 46. [Google Scholar] [CrossRef]
- Aygun, B.; Uysal, M.; Cosgun, T.; Bilir, T. Ensuring physicomechanical performance and sustainability in alkali-activated mortars in cold weather regions with ohmic curing method. Mater. Chem. Phys. 2026, 349, 131801. [Google Scholar] [CrossRef]
- Deng, X.; Wang, Z.; Zhao, J.; Bao, X.; Fang, Z.; Shumuye, E.D.; Yang, Z. Experimental and theoretical study on the effects of stirrup ratio and high temperature on BFRP-reinforced geopolymer concrete beams. J. Build. Eng. 2026, 117, 114860. [Google Scholar] [CrossRef]
- Kumar, T.U.; Kumar, M.V.; Lakkaboyana, S.K.; Trilaksana, H.; Ansari, A. Investigation of bond strength and flexural behaviour of geopolymer aggregate concrete beams. Case Stud. Constr. Mater. 2025, 22, e04916. [Google Scholar] [CrossRef]
- Alexander, A.E.; Shashikala, A.P. Behavior of RC beams rehabilitated using carbon textile reinforced geopolymer mortar in flexure. Structures 2024, 69, 107522. [Google Scholar] [CrossRef]
- Kanagaraj, B.; Prathana, S.; Joe, A.; Anand, N.; Naser, M.Z.; Lubloy, E. Flexural behavior and performance assessment of corroded geopolymer concrete beams after fire exposure. Case Stud. Chem. Environ. Eng. 2025, 11, 101232. [Google Scholar] [CrossRef]
- ACI 318-11; Building Code Requirements for Structural Concrete (ACI 318-11) and Commentary. ACI Committee 318, American Concrete Institute: Farmington Hills, MI, USA, 2011.
- TS 500; Requirements for Design and Construction of Reinforced Concrete Structures (TS 500). Turkish Standards Institution: Ankara, Türkiye, 2000.
- Cui, Y.; Chen, S.; Li, L.; Wang, X.; Liu, J. Atomistic insights into the hydration behavior of N-A-S-H gel via Ca2+ substitution: A molecular dynamics simulation study. J. Non-Cryst. Solids 2026, 673, 123892. [Google Scholar] [CrossRef]
- Luo, B.; Su, Y.; Hu, X.; Chen, Z.; Chen, Y.; Ding, X. Strength behavior and microscopic mechanisms of geopolymer-stabilized waste clays considering clay mineralogy. J. Clean. Prod. 2025, 530, 146877. [Google Scholar] [CrossRef]
- Liu, Z.; Qi, X.; Ke, J.; Shu, Z. Enhancing the toughness of ultra-high performance concrete through improved fiber–matrix interface bonding. Constr. Build. Mater. 2025, 491, 142616. [Google Scholar] [CrossRef]
Disclaimer/Publisher’s Note: The statements, opinions and data contained in all publications are solely those of the individual author(s) and contributor(s) and not of MDPI and/or the editor(s). MDPI and/or the editor(s) disclaim responsibility for any injury to people or property resulting from any ideas, methods, instructions or products referred to in the content. |
© 2026 by the authors. Licensee MDPI, Basel, Switzerland. This article is an open access article distributed under the terms and conditions of the Creative Commons Attribution (CC BY) license.