


Abstract
Achieving optimal daylighting is a cornerstone of sustainable architectural design, impacting energy efficiency and occupant well-being. Fast and accurate prediction during the conceptual phase is crucial but challenging. While physics-based simulations are accurate but slow, existing machine learning methods often rely on restrictive parametric inputs, limiting their application across free-form designs. This study presents a novel, geometry-agnostic framework that uses only building facade unfolding diagrams as input to a Generative Adversarial Network (GAN). Our core innovation is a 2D representation that preserves 3D facade geometry and orientation by “unfolding” it onto the floor plan, eliminating the need for predefined parameters or intermediate features during prediction. A Pix2pixHD model was trained, validated, and tested on a total of 720 paired diagram-simulation images (split 80:10:10). The model achieves high-fidelity visual predictions, with a mean Structural Similarity Index (SSIM) of 0.93 against RADIANCE/Daysim benchmarks. When accounting for the practical time of diagram drafting, the complete workflow offers a speedup of approximately 1.5 to 52 times compared to conventional simulation. This work provides architects with an intuitive, low-threshold tool for rapid daylight performance feedback in early-stage design exploration.
1. Introduction
1.1. Background and Research Gap
As a pivotal element in architectural design, daylighting profoundly influences occupants’ visual comfort, health and well-being, as well as building energy consumption [1,2,3]. Obtaining daylight performance feedback during early design stages is crucial, as decisions made at this phase have the greatest impact on final building performance [4,5]. Currently, physics-based simulation (e.g., RADIANCE) is considered the gold standard for daylight assessment. However, its high computational cost restricts opportunities for rapid, iterative design exploration [6,7].
To streamline the evaluation workflow, dynamic simulation methods such as Climate-Based Daylight Modeling (CBDM) have gained traction. CBDM integrates comprehensive information—including geographical location, building geometry, orientation, surrounding context, and material properties—to assess daylight performance through annual, hourly simulations. Yet, its significant computational demands and labor-intensive preparatory modeling remain substantial barriers [8,9,10]. To further expedite the process, Machine Learning (ML) methods have been introduced as surrogate models to facilitate rapid predictions [11].
Early ML models based on Artificial Neural Networks (ANN), such as the work by Han et al. [12], demonstrated accurate predictions of Daylight Autonomy (DA) and Useful Daylight Illuminance (UDI) for rectangular rooms with a single window. However, they could not handle complex geometries involving multiple windows or walls [12]. The study by Nourkojouri et al. [13] incorporated additional parameters like shading device states and internal surface reflectance, covering scenarios with either a single window or three evenly spaced windows. Despite this, it still struggled to predict cases with multiple windows of varied shapes and positions, or corner rooms with fenestration on multiple walls [13]. A core limitation of these models lies in their attempt to describe intricate three-dimensional geometries using a restricted set of numerical values (e.g., room width, depth, and height), inevitably leading to information loss and compromised generalizability.
Subsequent research has sought to improve geometric encoding strategies. Le-Thanh et al. [14] developed an encoding method capable of handling multiple windows on different walls. Nonetheless, all their cases featured fixed sill heights, window heights, and ceiling heights, with only window width being variable, and the model was limited to a maximum of four windows [14]. Wang et al. [15] employed a grid-based approach, converting wall information into binary matrices as ANN input. This method could accommodate up to five windows on one or multiple walls. However, the model was confined to spaces of specific dimensions (30 ft × 30 ft × 10.5 ft) and a single orientation, thus offering limited generalizability [15].
To overcome the input representation bottleneck inherent in ANN models, researchers have turned to conditional Generative Adversarial Networks (cGANs), notably the pix2pixHD framework. This framework excels at image-to-image translation, learning mapping functions from input to output images [16,17]. He et al. [18] applied this framework to annual daylight performance prediction, generating input grayscale maps based on the Manhattan distance from each grid cell to the nearest window on the floor plan. While capable of predicting multi-room, multi-window scenarios, this method also imposed constraints on window height, sill height, and room height. Moreover, the simplistic Manhattan distance calculation limited the richness of fenestration information that could be embedded [18]. Li et al. [19] adopted a more sophisticated solid angle-based encoding method, which allowed for richer geometric information of openings to be embedded into a 2D tensor. Combined with 1D data on surface properties and solar position as multimodal input, it successfully predicted illuminance distributions for specific time instances. However, this encoding process was complex and time-consuming (averaging 7.2 s), its adaptability to varying ceiling heights was not verified, and its applicability for annual simulation outcomes remains limited [19].
In summary, key research gaps persist:
Conflict between Input Representation and Generality: Most ML models rely on low-dimensional parameter vectors or require complex pre-encoding of intermediate features. This approach fails to adequately capture the non-parametric, diverse facade geometries central to architectural creativity, while also introducing workflow complexity [20,21]. A rapid, visual prediction method capable of accepting generic geometric input without manual feature engineering remains underexplored.
Moreover, the early conceptual design phase in architectural practice is inherently grounded in two-dimensional thinking—rapid sketches of plans, sections, and elevations are used to explore form and spatial relationships. This creates a significant disconnect with performance evaluation tools that require complete 3D models as input, disrupting the fluid, iterative nature of conceptual design. Our method directly addresses this workflow gap by using a single 2D drawing—the facade unfolding diagram—as its sole input. This aligns with architects’ native representational methods, allowing daylight performance feedback to be integrated seamlessly into the early, drawing-based stages of design exploration.
Excessive Model Constraints: Existing pix2pixHD-based models often impose stringent limitations on window dimensions, locations, and room heights, diminishing their utility in real-world, variable design scenarios [18,19].
To address these challenges, this study proposes a novel methodology that employs a facade unfolding diagram—a 2D drawing synthesizing the floor plan with the unfolded facade surface—as a universal, information-rich input. This input is paired with Daylight Autonomy (DA) simulation maps to train a conditional Generative Adversarial Network (Pix2pixHD) [16]. The trained model can directly predict daylight performance distributions from the architectural drawing. This approach aims to bypass 3D modeling and physical simulation during inference, providing a fast, intuitive, and geometrically versatile daylight prediction tool for the early design stage.
1.2. Research Objectives and Contributions
This study aims to develop and validate an image-based Generative Adversarial Network (GAN) model for the rapid visualization of Daylight Autonomy (DA) using facade unfolding diagrams. The objectives are fourfold: first, to create a methodological pipeline for generating paired datasets of facade unfolding diagrams and their corresponding DA simulation maps; second, to train and optimize a Pix2pixHD model to learn the mapping between the diagrammatic input and the performance output; third, to quantitatively evaluate the model’s predictive accuracy and computational efficiency against conventional physics-based simulation benchmarks; and fourth, to demonstrate the practical utility of the framework within early-stage architectural design exploration.
The contributions of this work are threefold. First, it introduces the facade unfolding diagram as an innovative, geometry-agnostic 2D representation that serves as a compact proxy for 3D building forms, thereby resolving the dimensionality mismatch often encountered when applying deep learning to architectural geometry. Second, it establishes an end-to-end image-based framework that bypasses the need for parametric inputs and intermediate feature engineering during the prediction phase, enabling a direct translation from a design sketch to a performance map. Third, it provides empirical validation of the framework, demonstrating high predictive fidelity (mean SSIM = 0.93) and a significant acceleration (approximately 1.5 to 52 times faster than the traditional simulation workflow) when the diagram drafting time is accounted for, thereby offering a practical tool for rapid performance feedback in design.
2. Methodology
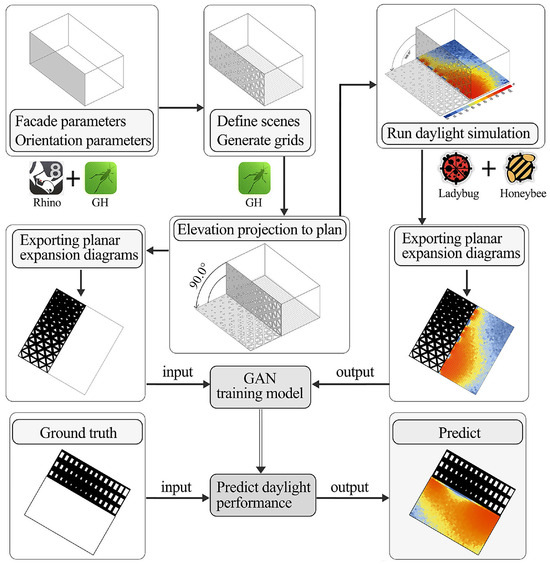
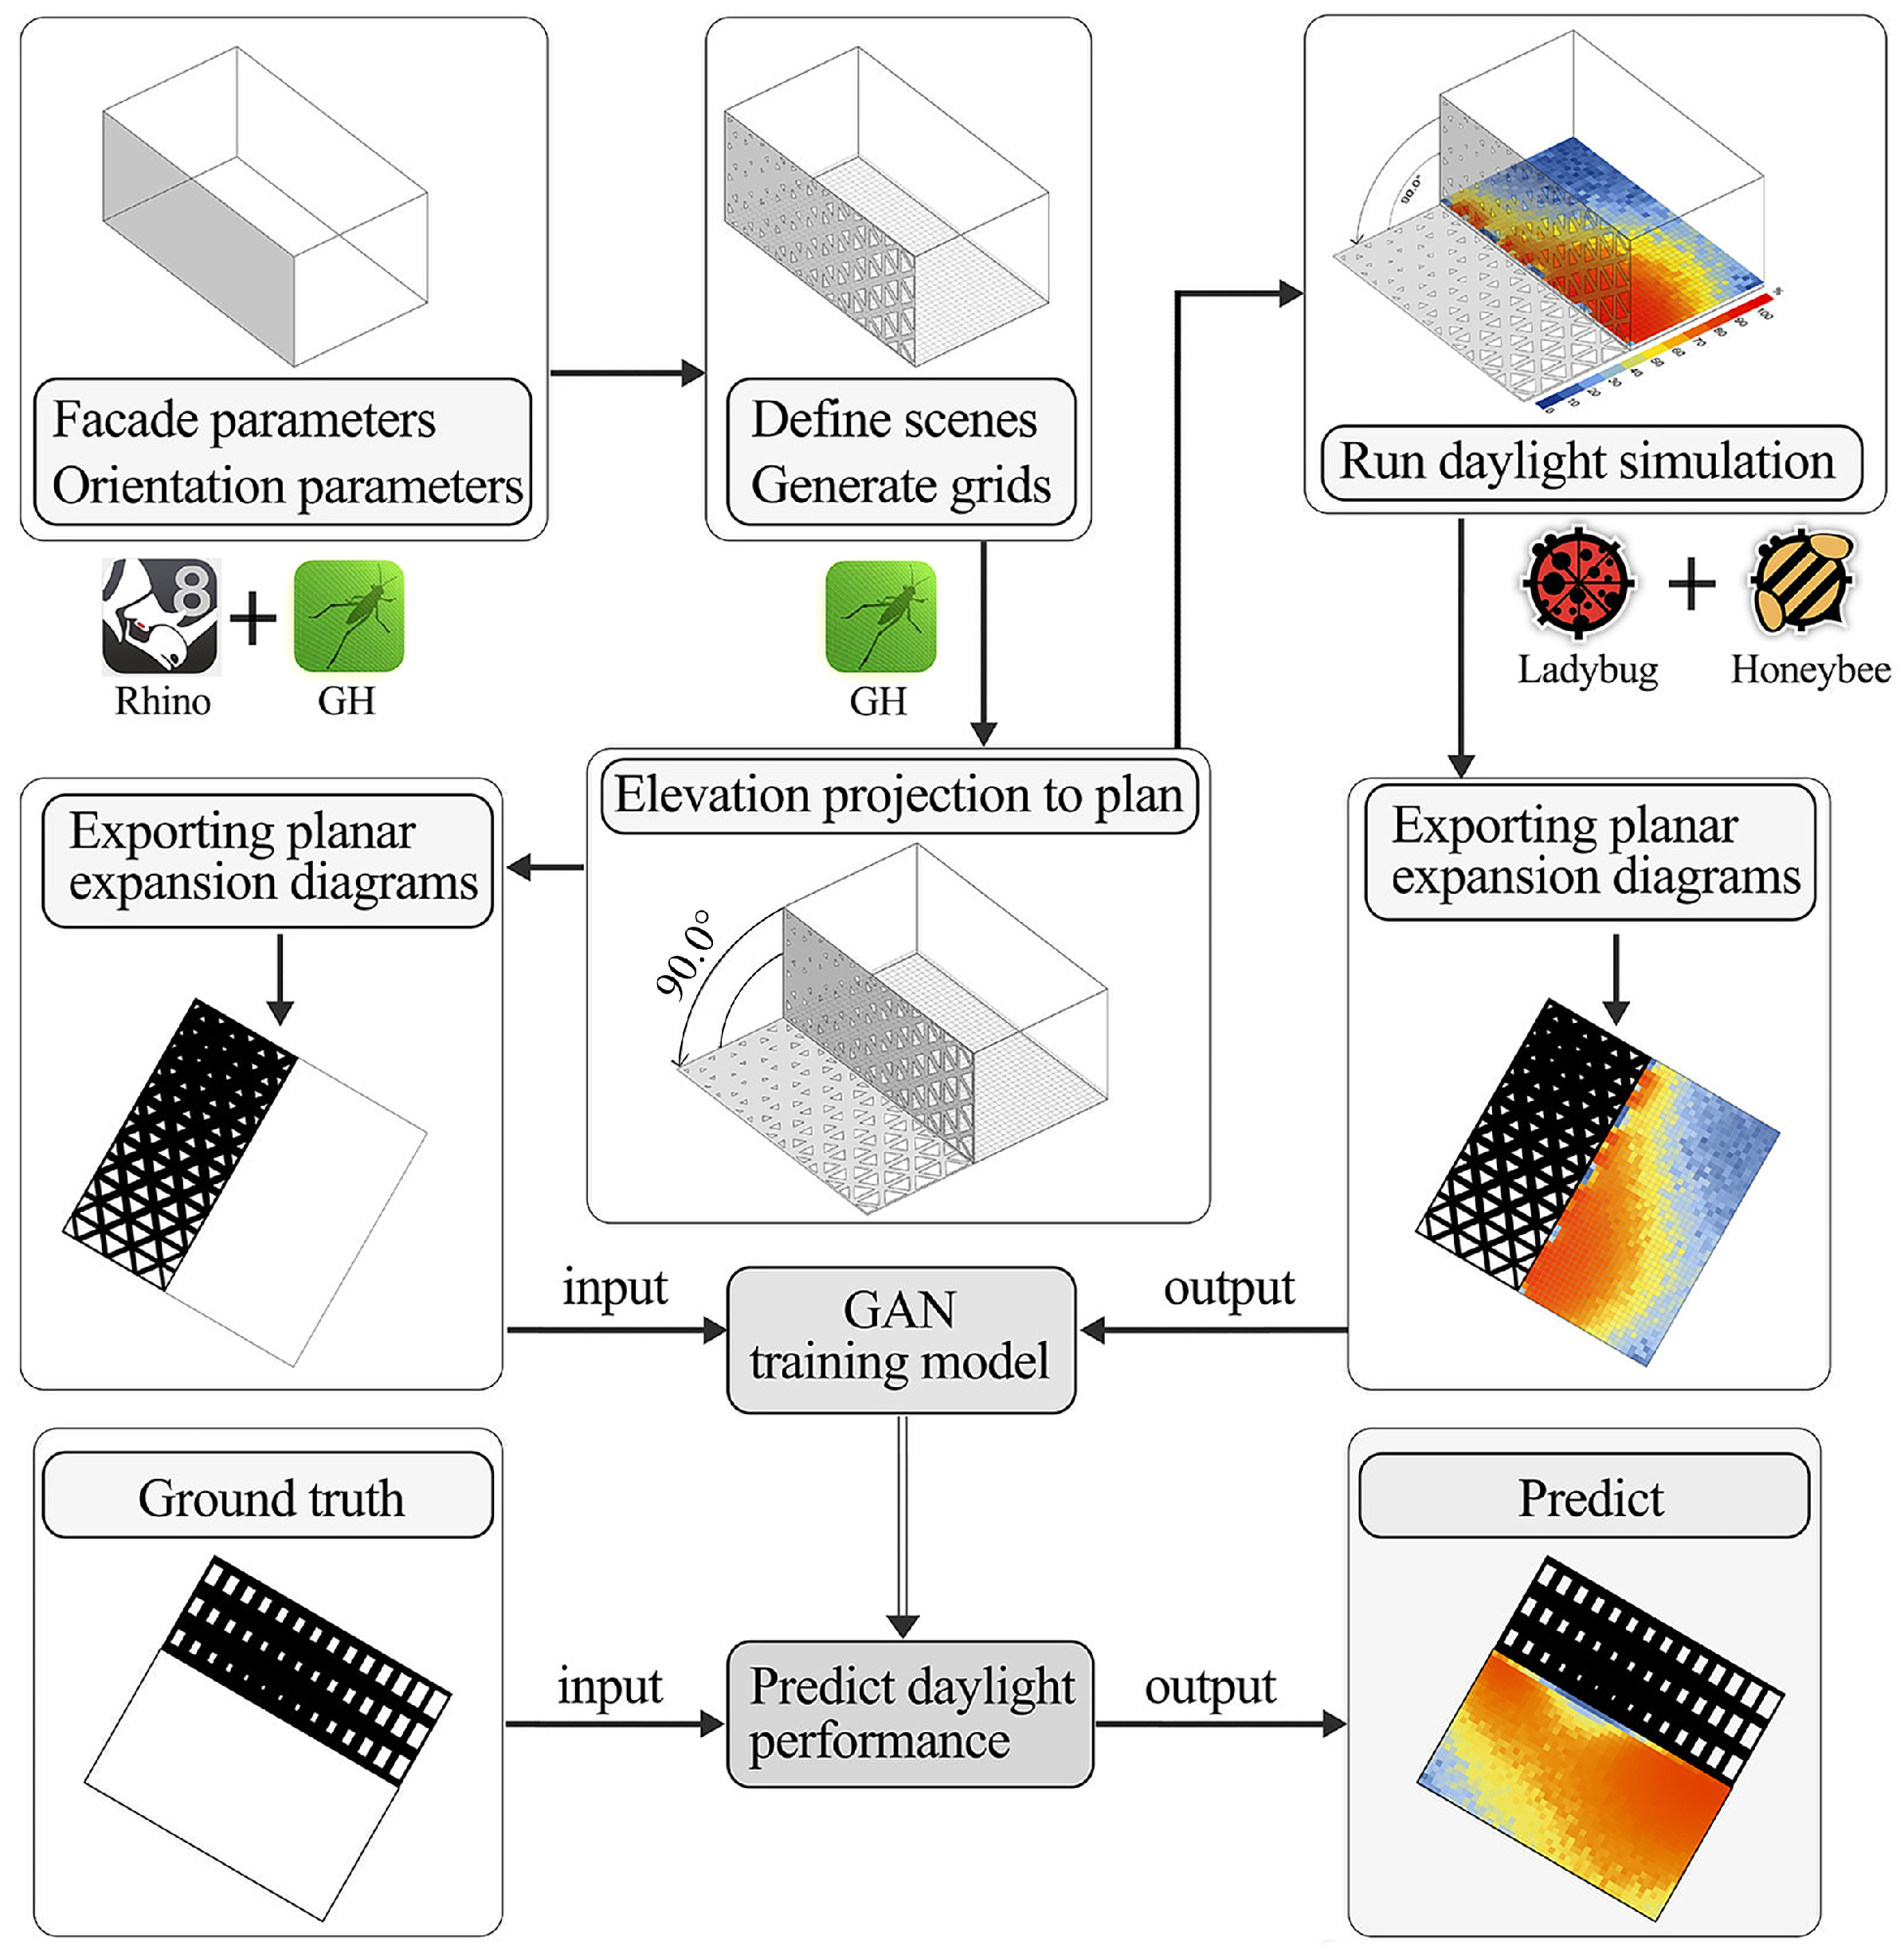
Figure 1 illustrates the overall workflow of this study, which primarily consists of three stages:
Figure 1.
Overview of the workflow.
- Data Generation and Simulation: Diverse building facades and their corresponding “facade-unfolding diagrams” are generated through parametric modeling. The RADIANCE/Daysim engine is then utilized to conduct physical simulations, producing ground-truth Daylight Autonomy (DA) distribution maps. This process constructs a paired image dataset.
- Model Training: Using the facade-unfolding diagrams as input and the DA distribution maps as the target output, a conditional generative adversarial network (Pix2pixHD) is trained to learn the mapping relationship from geometric representation to performance distribution.
- Performance Prediction and Evaluation: The trained model performs rapid inference on new facade-unfolding designs, generating predicted DA maps. A comprehensive evaluation is conducted from both quantitative metrics (e.g., SSIM, MSE) and computational efficiency perspectives.
2.1. Data Generation and Simulation Setup
2.1.1. Parametric Modeling and Facade Unfolding
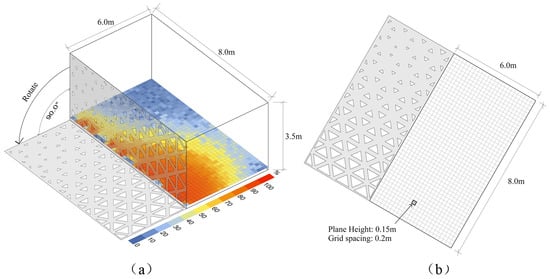
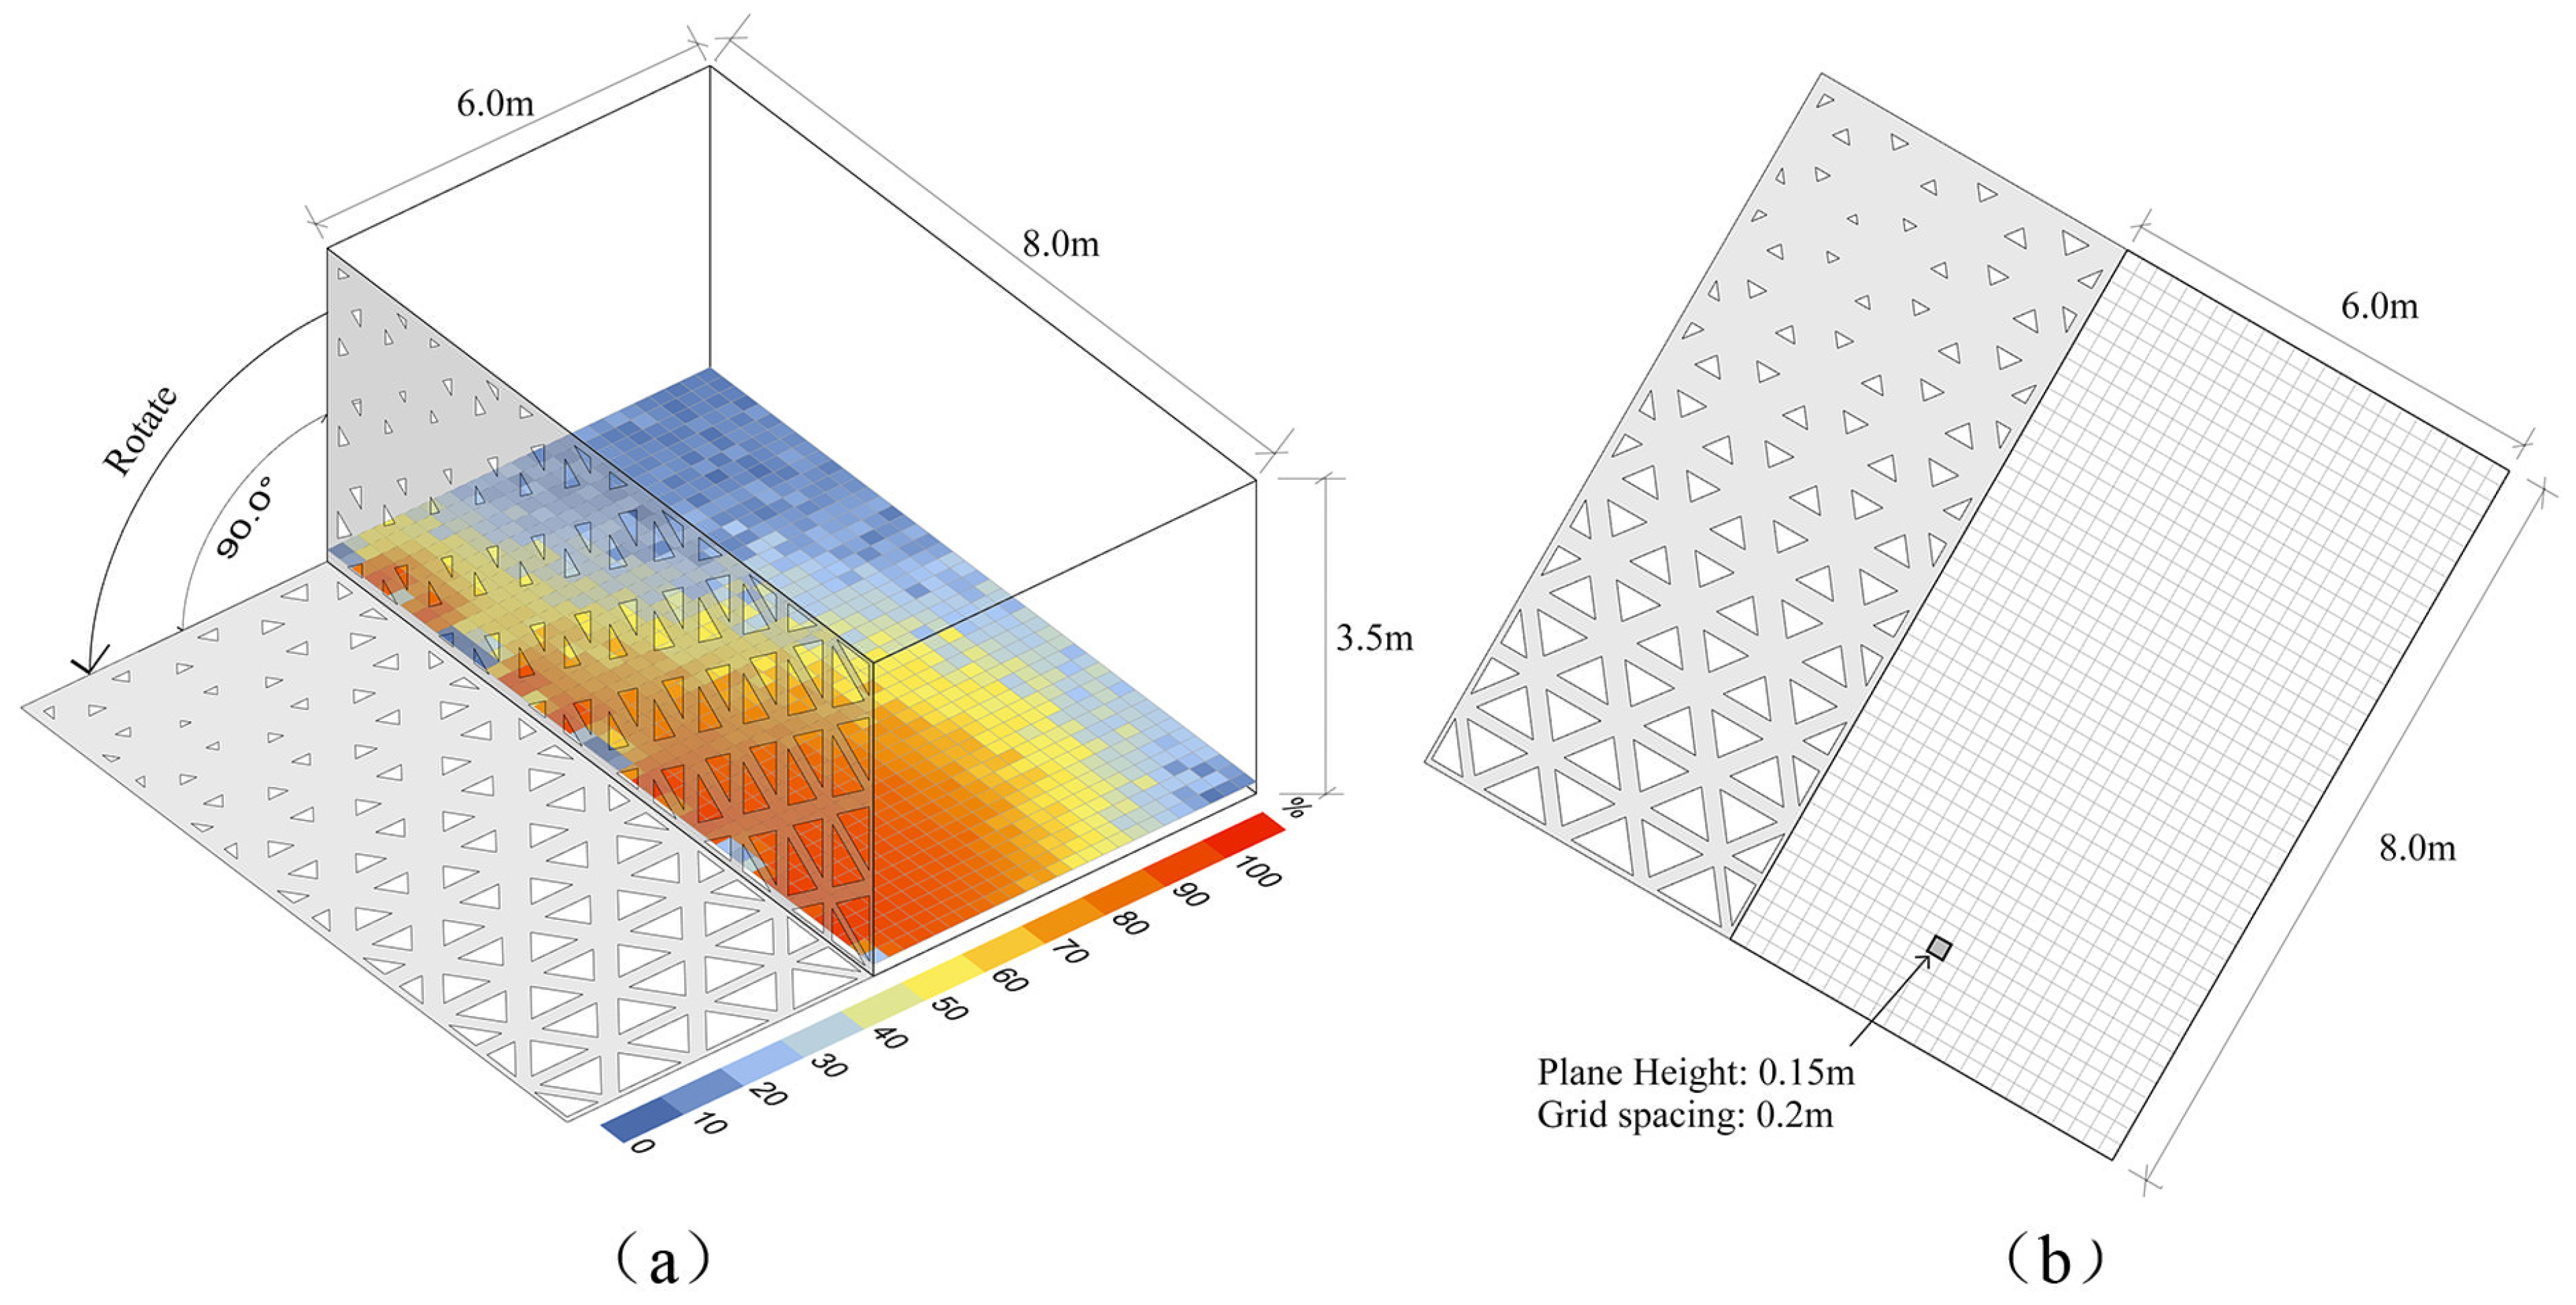
A parametric model of a standard classroom (8 m × 6 m × 3.5 m) was built in Rhinoceros 3D using Grasshopper (version: 1.0.0007). The key step is generating the facade unfolding diagram (Figure 2). For any facade design and orientation, the 3D facade surface is unfolded onto the 2D plane of the floor plan, creating a composite image that retains the plan layout, the undistorted facade geometry, and orientation annotation. Twelve building orientations (0° to 330° in 30° steps) were considered.
Figure 2.
Axonometric (a) and planar unfolding (b) of the test model used for daylighting simulation.
In this study, “Facade Unfolding” specifically refers to a representational method that maps three-dimensional building facade geometry onto its adjacent horizontal two-dimensional floor plan via a single 90-degree rotational transformation. This operation is not intended for the physical unfolding of three-dimensional curved surfaces for manufacturing purposes but rather constitutes a geometric encoding strategy designed to visually associate the spatial information (geometry, fenestration) of a vertical facade with the interior horizontal zone (floor plan) it affects. By “folding” the facade onto the plane, we create a composite 2D image that simultaneously preserves the continuous surface geometry of the facade, its topological adjacency to the interior space, and the building orientation. This representation differs from a simple orthographic elevation because it explicitly encodes the spatial correspondence between “facade and plan”; it also differs from voxel or point cloud representations by being more compact and compatible with architects’ workflows (2D drawing). The term “unfolding” is used to vividly describe the process of laying out vertical information onto a horizontal plane and to emphasize its geometric invariance to building form.
Orientation Encoding Method: In the facade-unfolding diagram, orientation is embedded geometrically without external symbols. Each orientation corresponds to a unique layout of the unfolded facade module within the composite image. The Pix2pixHD model learns this geometric-orientation mapping directly from pixel patterns.
2.1.2. Facade Design Variants
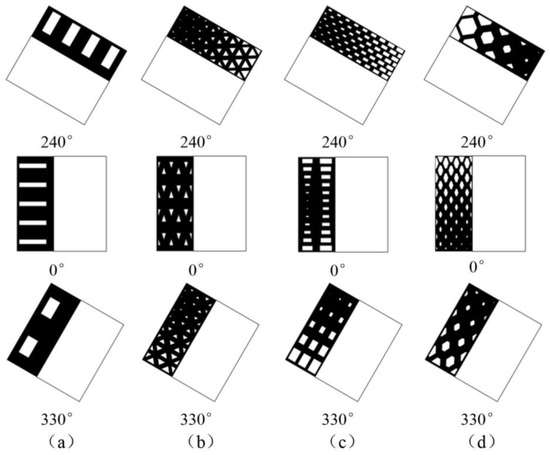
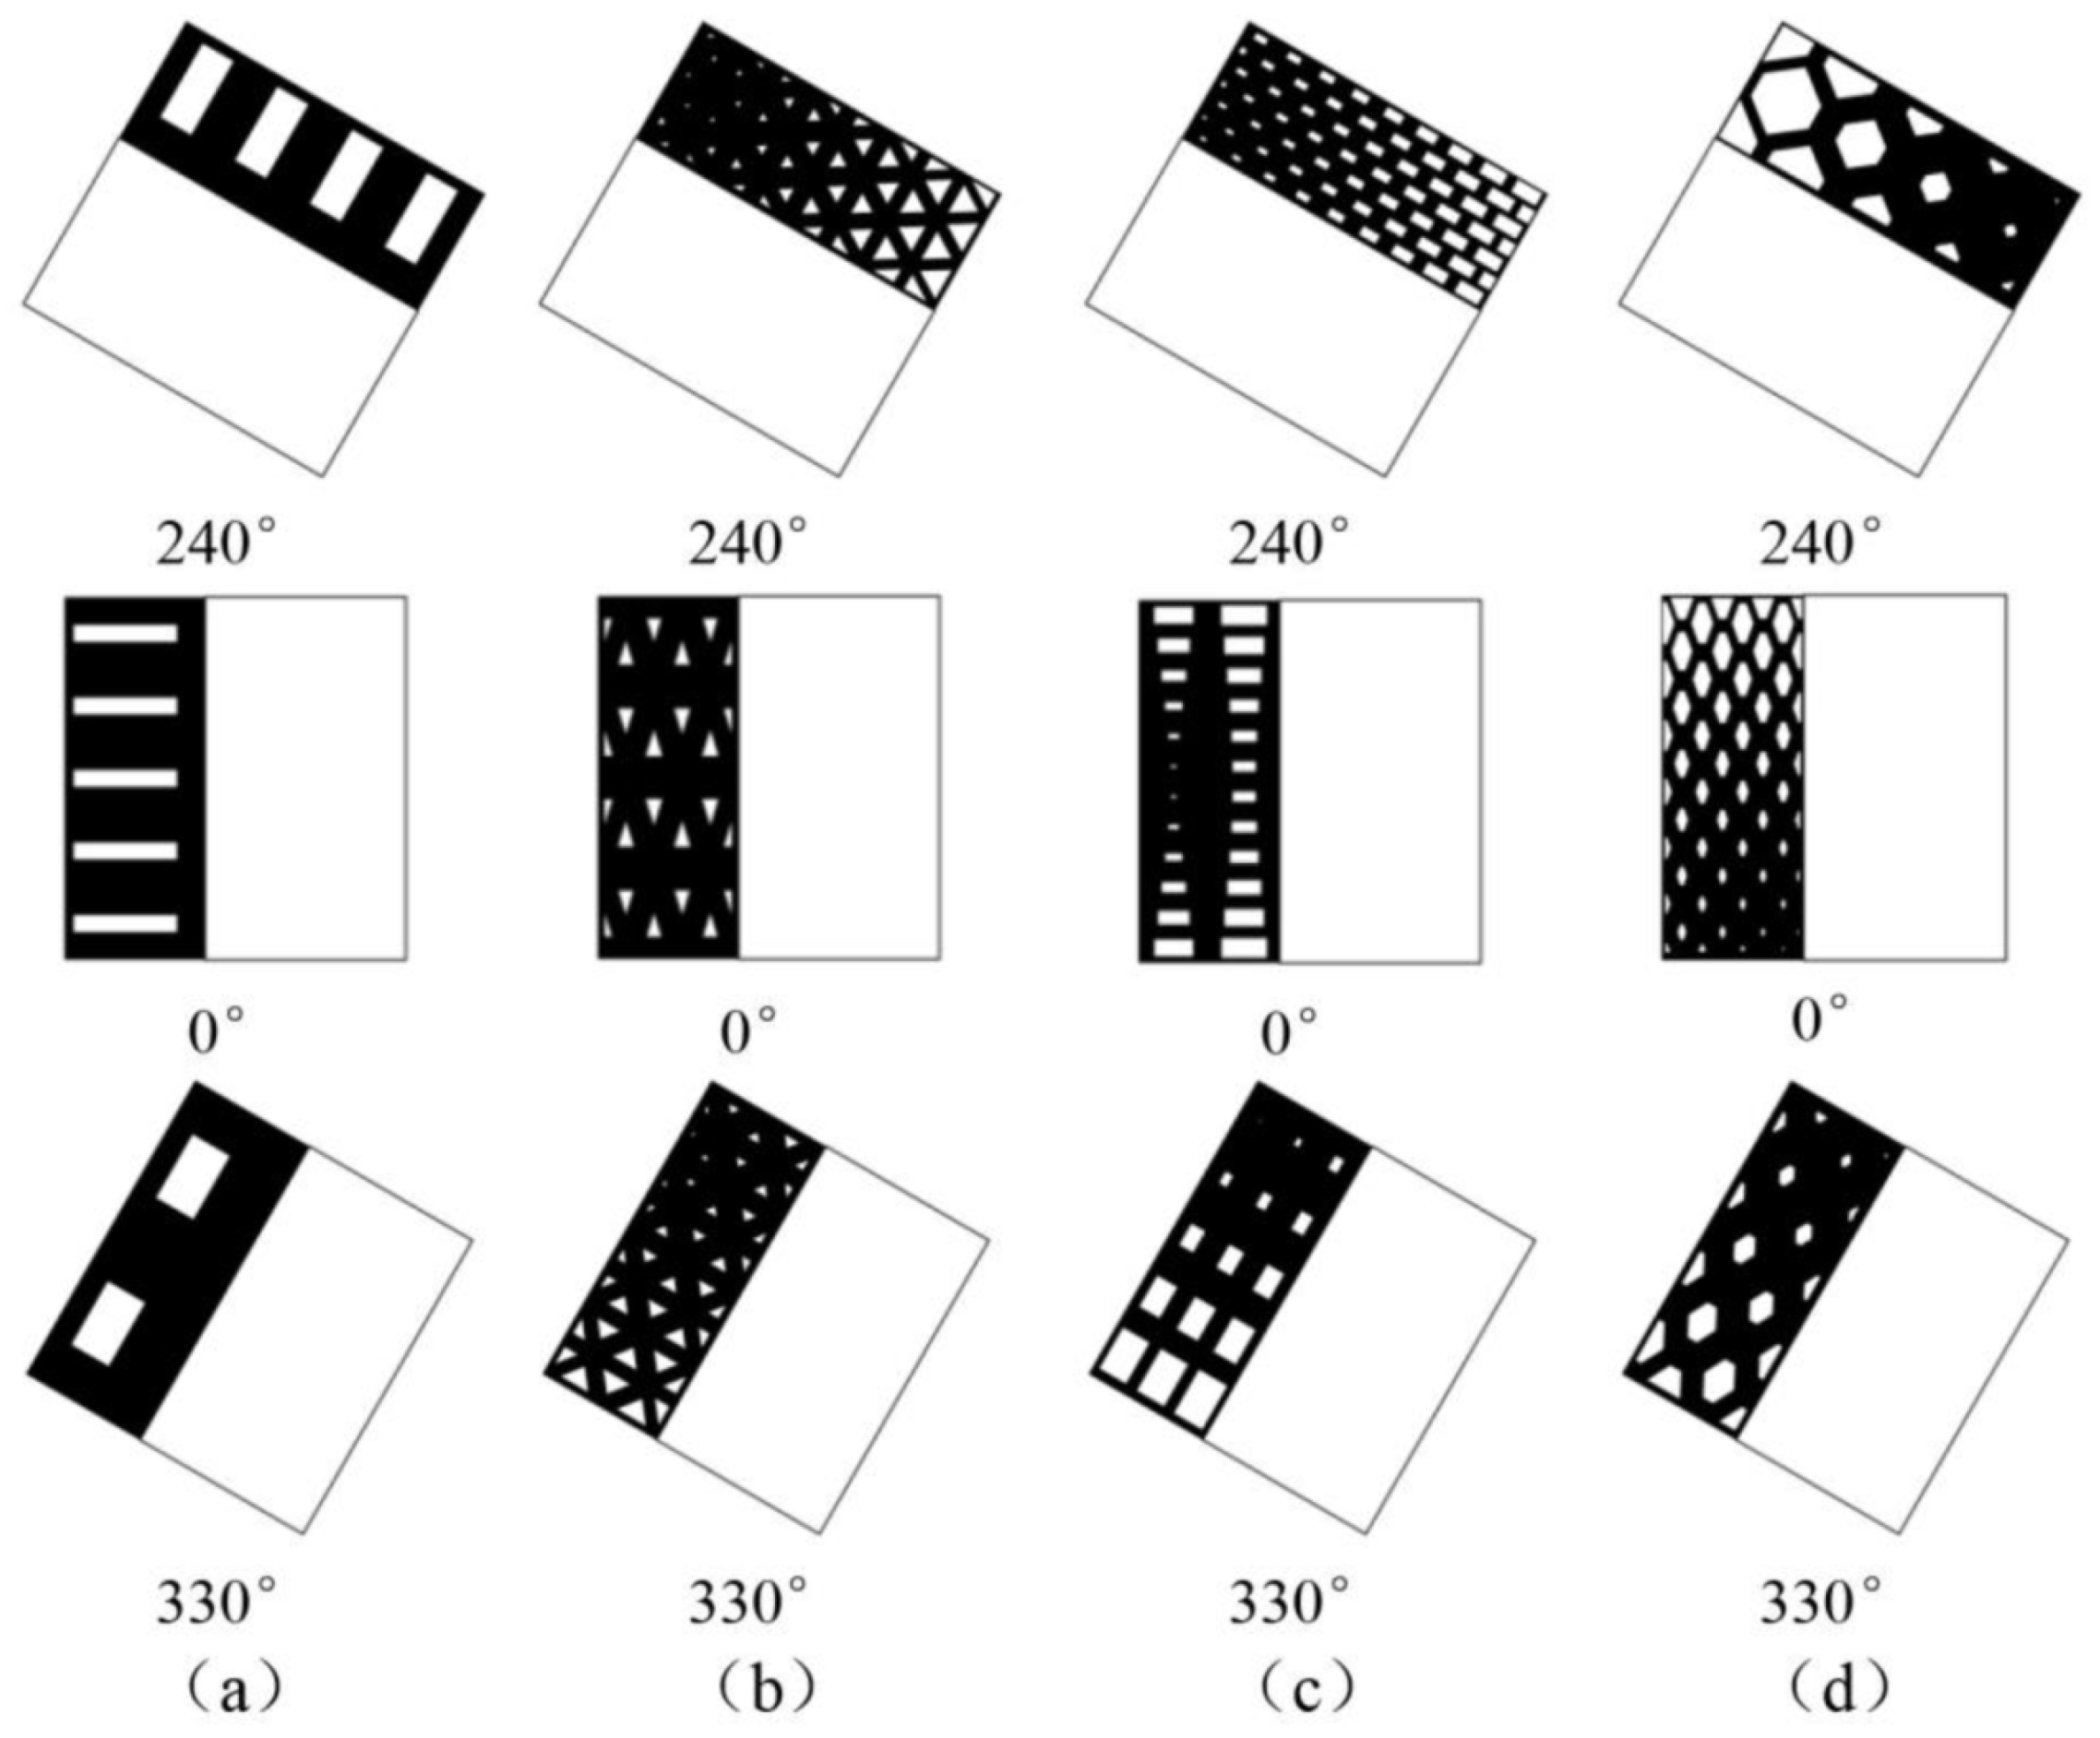
To ensure robustness, 60 distinct facade configurations were created for each orientation (720 total). Designs included both parametric windows and free-form shapes (triangular, rectangular, hexagonal, custom) to maximize geometric diversity, as shown in Figure 3.
Figure 3.
Four main types of parameterized facade forms. (a) Ladybug window-to-wall ratio mode; (b) Multiple triangular fenestration forms; (c) Multiple rectangular fenestration forms; (d) Multiple hexagonal fenestration forms.
2.1.3. Daylight Simulation and Ground Truth Generation
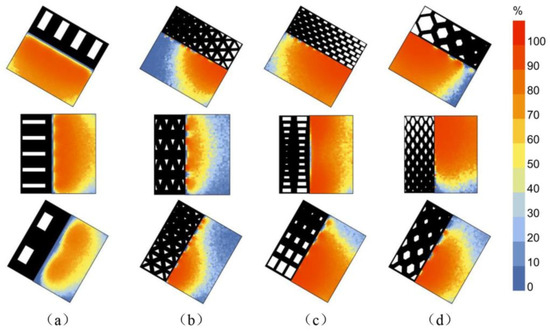
Climate-based daylight simulations were performed for each variant using the Ladybug and Honeybee tools (RADIANCE/Daysim engine) [22]. Key settings included a 0.75 m work plane, 0.2 m analysis grid, and standard material properties. The climate file for Shenyang, China, was used. The output was the Daylight Autonomy (DA) metric [9], visualized as a color-contour map within the floor plan. Figure 4 displays the corresponding DA simulation results for the 12 facade forms in Figure 3, illustrating the target output diversity. Each unique facade unfolding diagram and its DA map formed a paired image for training.
Figure 4.
DA simulation results corresponding to the 12 forms of facades in Figure 3. (a) Ladybug window-to-wall ratio mode; (b) Multiple triangular fenestration forms; (c) Multiple rectangular fenestration forms; (d) Multiple hexagonal fenestration forms.
Rationale for Selecting DA: During the conceptual design phase, one of the primary needs for designers is the rapid assessment and comparison of the overall performance of different schemes in terms of basic daylight availability. Daylight Autonomy (DA), as a time-percentage-based metric, provides a spatial distribution map that intuitively visualizes, in the form of a color-coded map, the proportion of time during which various indoor areas receive sufficient illuminance. This makes it highly suitable for preliminary screening and trend analysis among design alternatives. This study aims to validate the feasibility of the proposed framework in predicting core daylight metrics; therefore, DA was selected as the initial prediction target. We fully acknowledge that a comprehensive daylight comfort evaluation must also include considerations of metrics such as discomfort glare and uniformity, which constitutes an important direction for future work.
2.2. Predictive Model: Pix2pixHD
2.2.1. Model Rationale
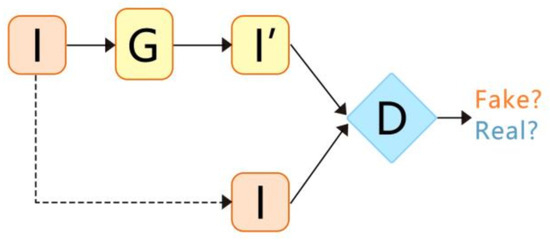
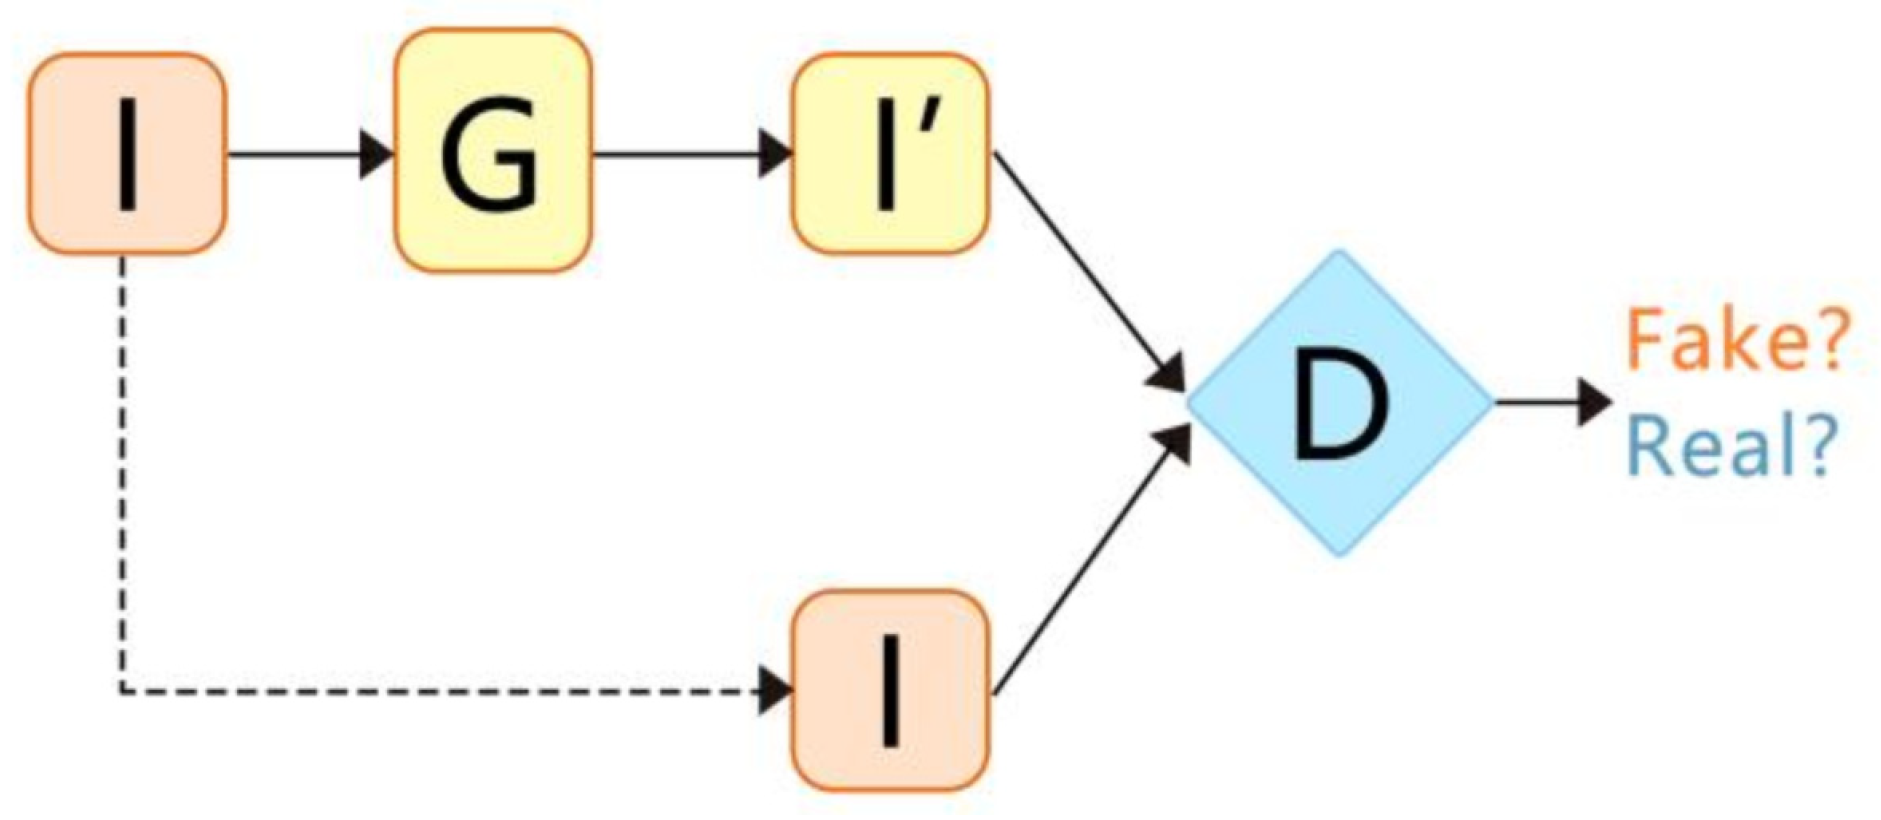
Predicting a daylight performance distribution map from a line drawing of building geometry is fundamentally an image-to-image translation task. This study employs a conditional Generative Adversarial Network (cGAN) framework, which excels at learning mapping functions from input to output image pairs. Among cGAN variants, Pix2pixHD [16] was selected for its proven capability to generate high-resolution, detailed images from semantic inputs. Its conditional setup aligns perfectly with our paired dataset (facade-unfolding diagram → DA map), and its multi-scale discriminator is particularly adept at capturing both local details and global structural patterns—a crucial requirement for modeling the spatial gradients of indoor daylight distribution (Figure 5).
Figure 5.
CGAN Concept.
2.2.2. Architecture, Training Details, and Validation Strategy
Architecture: The generator (G) employs a U-Net-256 backbone with an encoder–decoder structure, processing 256 × 256 pixel images. The discriminator (D) utilizes a multi-scale architecture, assessing image authenticity across different resolutions to enhance the fidelity of generated details.
Data Partitioning and Prevention of Information Leakage: All 720 strictly paired images were randomly split into training (576 pairs), validation (72 pairs), and test (72 pairs) sets at an 80:10:10 ratio. Crucially, all geometric variants of a given facade design (including different orientations) appear exclusively in one of the three sets. This prevents the model from encountering a “seen” facade during testing, ensuring a rigorous evaluation of generalization.
Training Strategy and Hyperparameters:
- Loss Function: The total loss is a weighted sum of conditional adversarial loss (L_cGAN) and L1 reconstruction loss (Equation (1)), with λ = 100 to enforce pixel-level consistency.Ltotal = LcGAN(G,D) + λLL1(G)
- Optimizer: Adam optimizer was used with an initial learning rate of 2 × 10⁻⁴, β1 = 0.5, β2 = 0.999, and batch size = 1.
- Training Process: We monitored validation loss and saved the model weights corresponding to the best performance on the validation set, rather than employing a fixed early-stop criterion.
Data Augmentation: Random horizontal flipping was applied during training—a physically plausible augmentation given the symmetry of many facade designs, improving model robustness.
Rationale for Model Selection: Pix2pixHD was chosen over other image-translation models (e.g., CycleGAN) because its paired-data training paradigm ensures strict structural correspondence between input geometry and output performance maps. This is essential for reliable “geometry-to-performance” mapping in architectural daylight prediction.
2.3. Evaluation Metrics
Model performance was assessed using: Mean Squared Error (MSE), Peak Signal-to-Noise Ratio (PSNR), Structural Similarity Index (SSIM) [23], and Root Mean Square Error (RMSE).
3. Results
3.1. Model Training Convergence
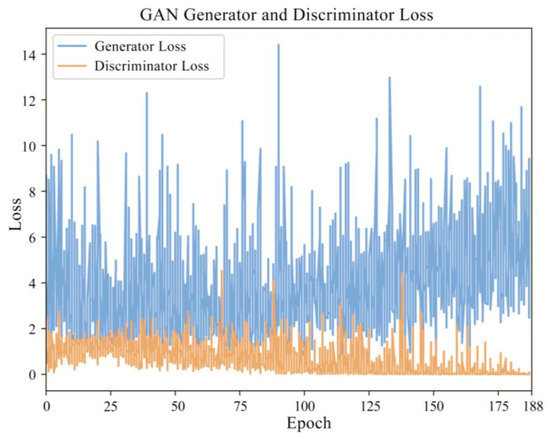
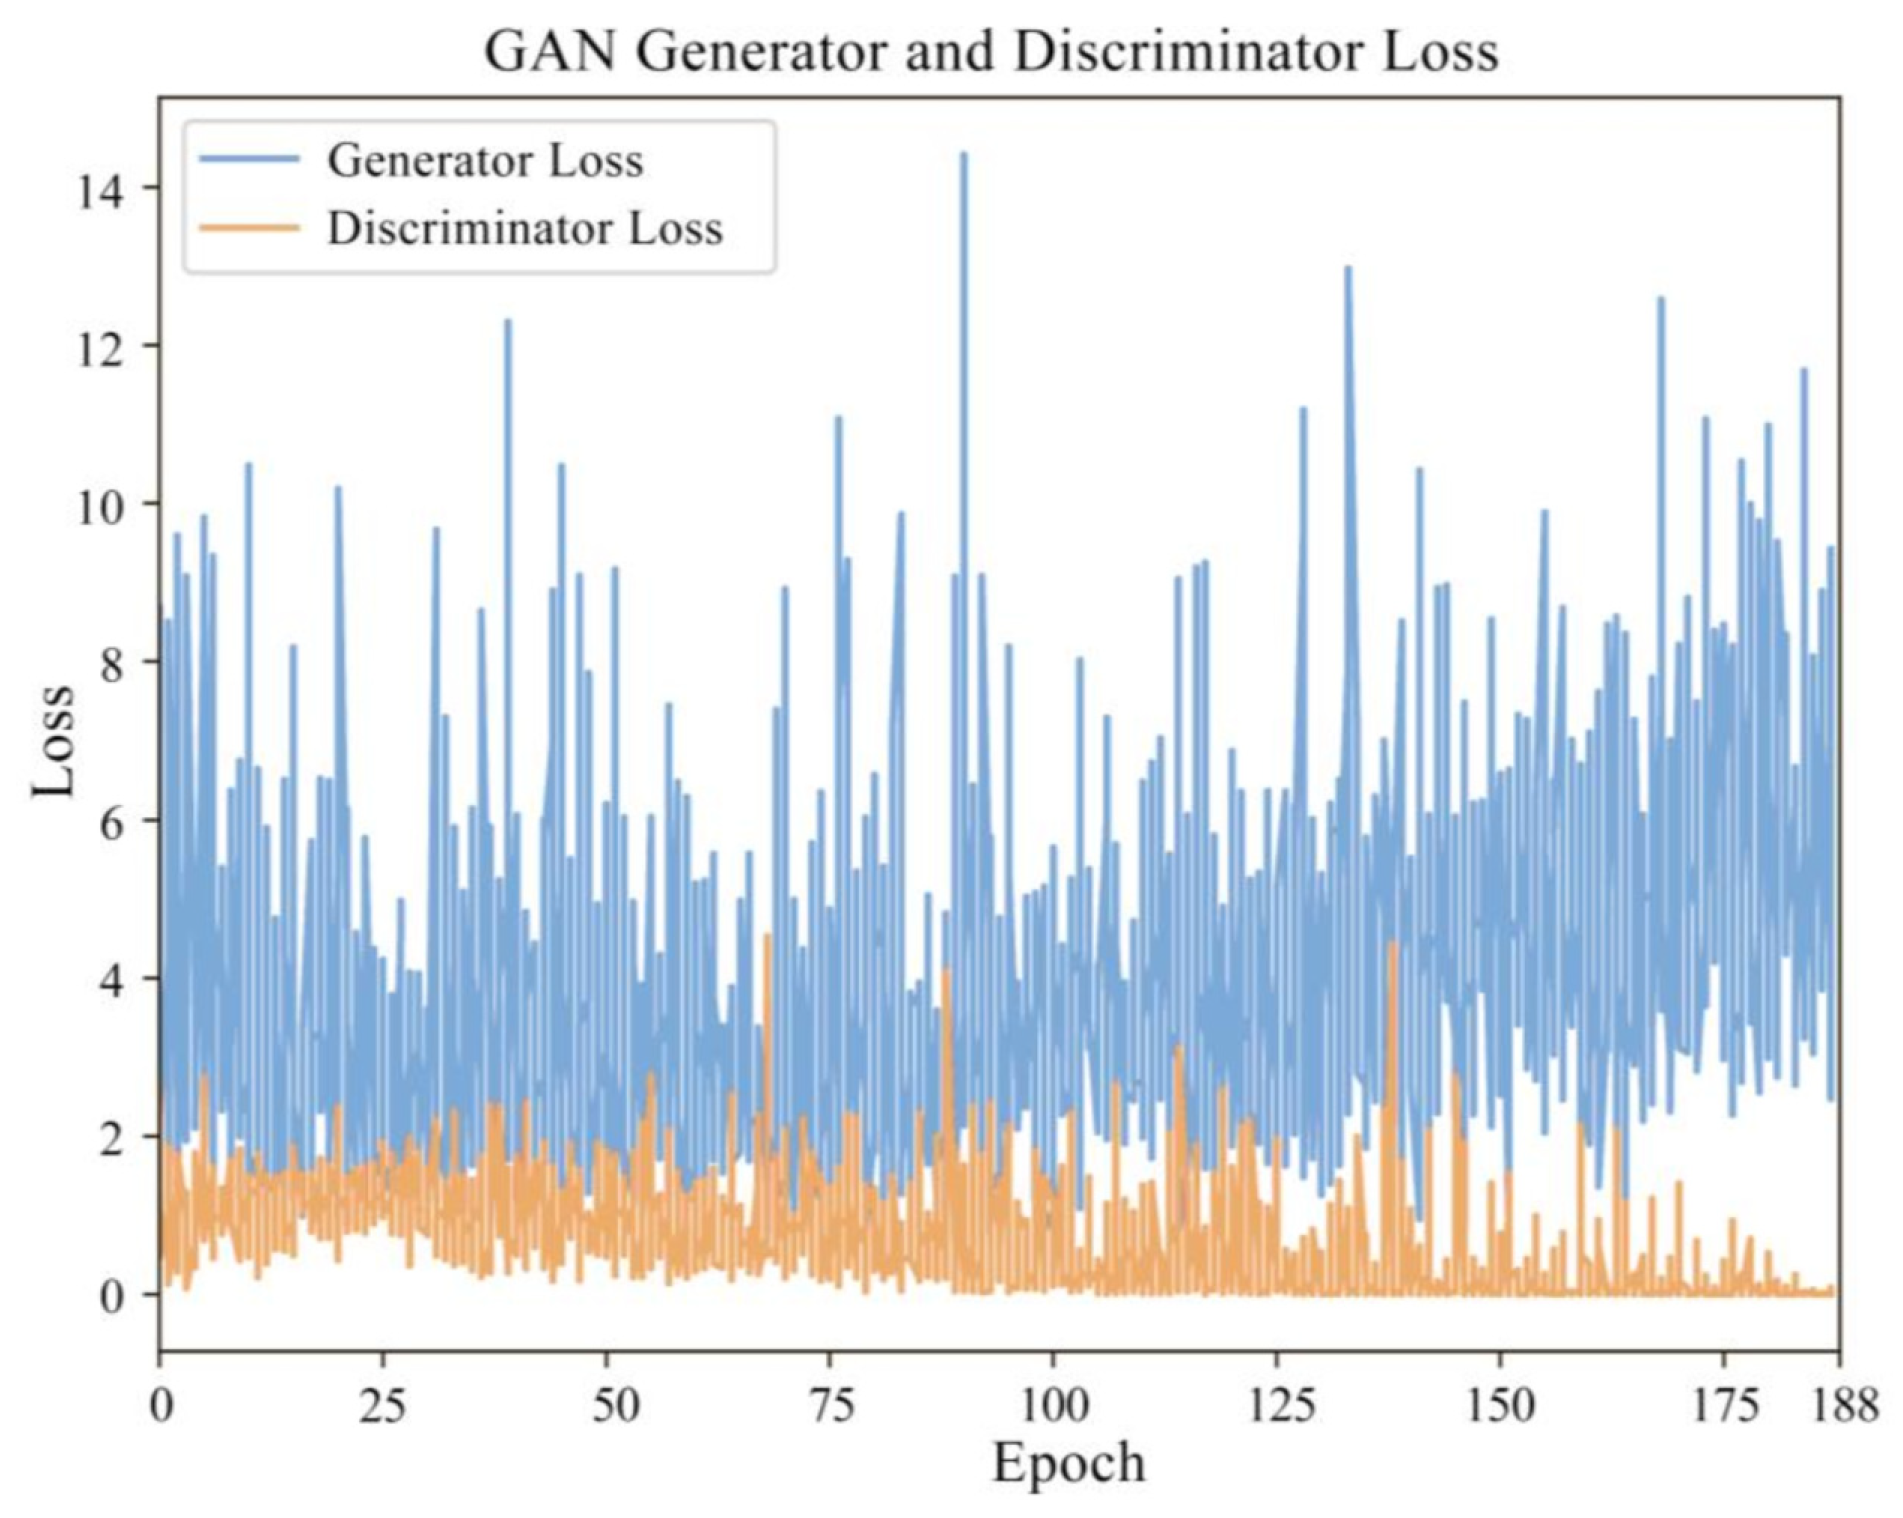
Figure 6 shows the generator and discriminator loss curves. The losses stabilized after ~150 epochs, indicating successful convergence without mode collapse. The model from epoch 188 was selected for evaluation.
Figure 6.
Learning curve of pix2pixHD.
3.2. Predictive Accuracy
Table 1 summarizes the quantitative results. The model achieved a high mean SSIM of 0.93 and a low MSE of 14.95 on the test set, confirming excellent perceptual and pixel-level accuracy.
Table 1.
Evaluation metrics (MSE, RMSE, PSNR, SSIM) for training and test sets.
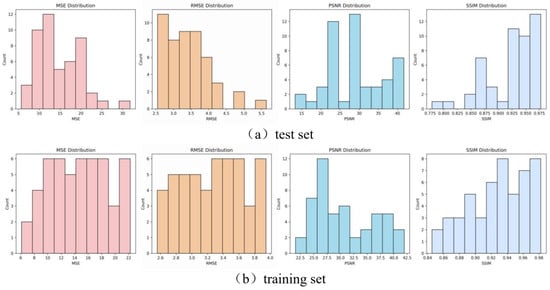
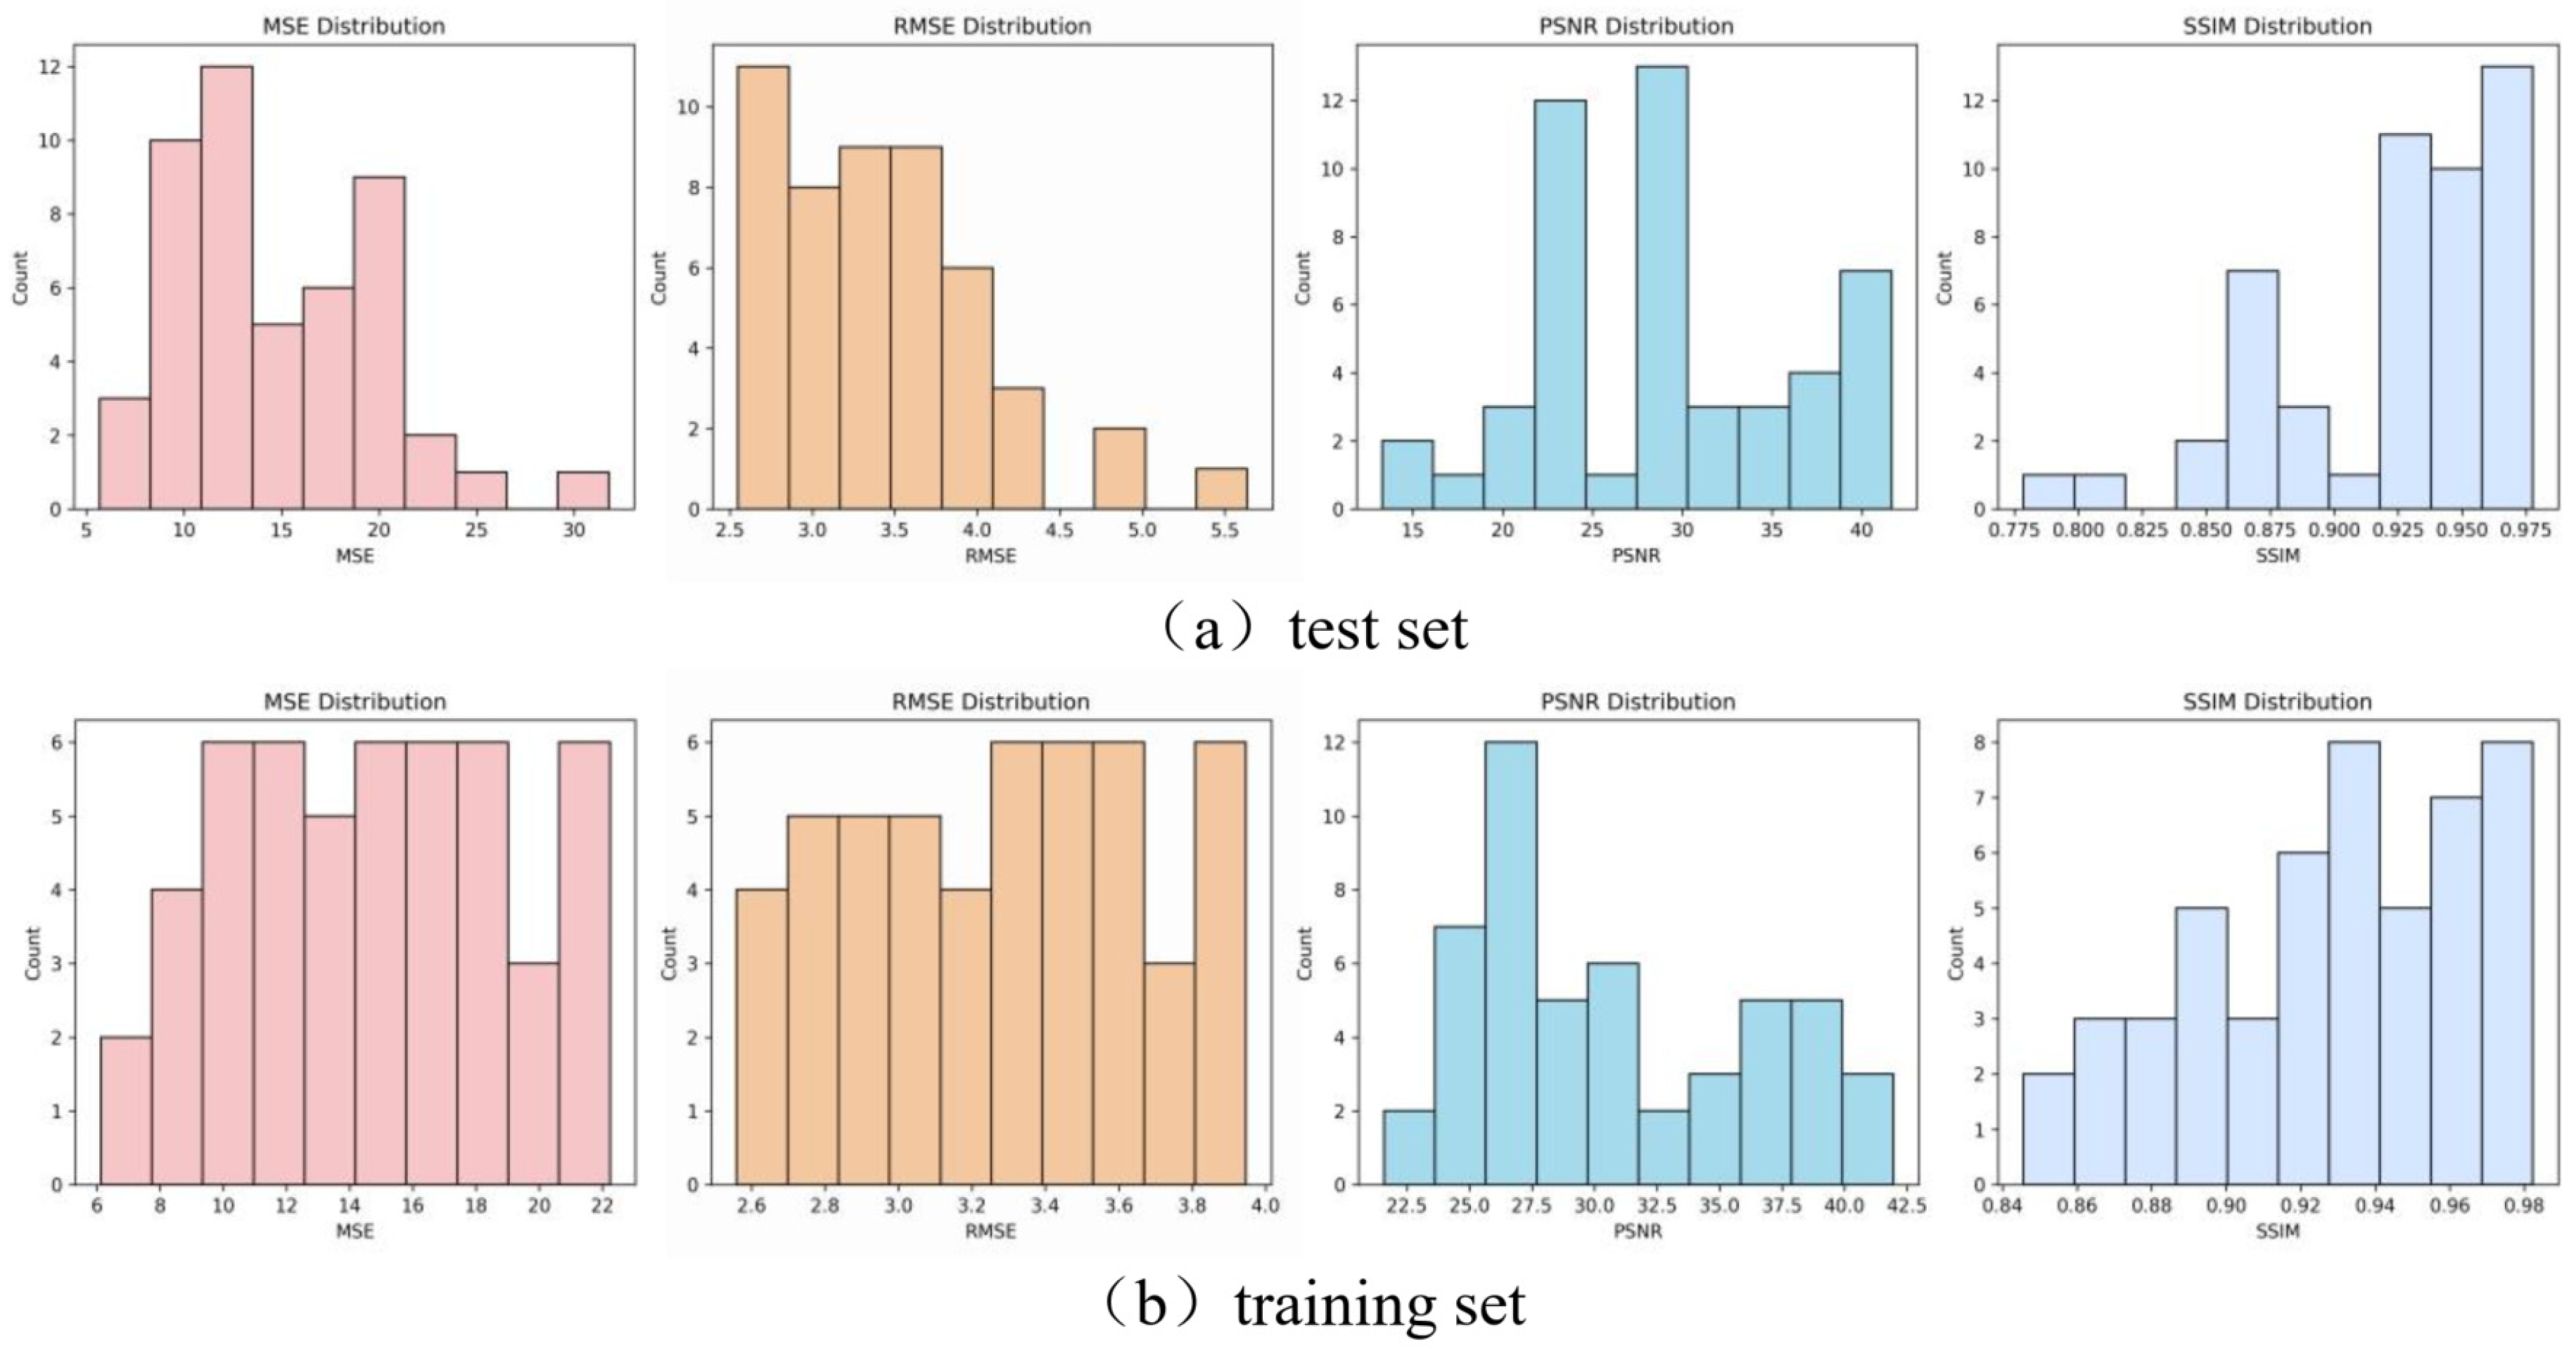
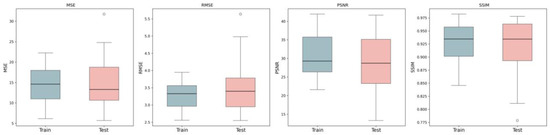
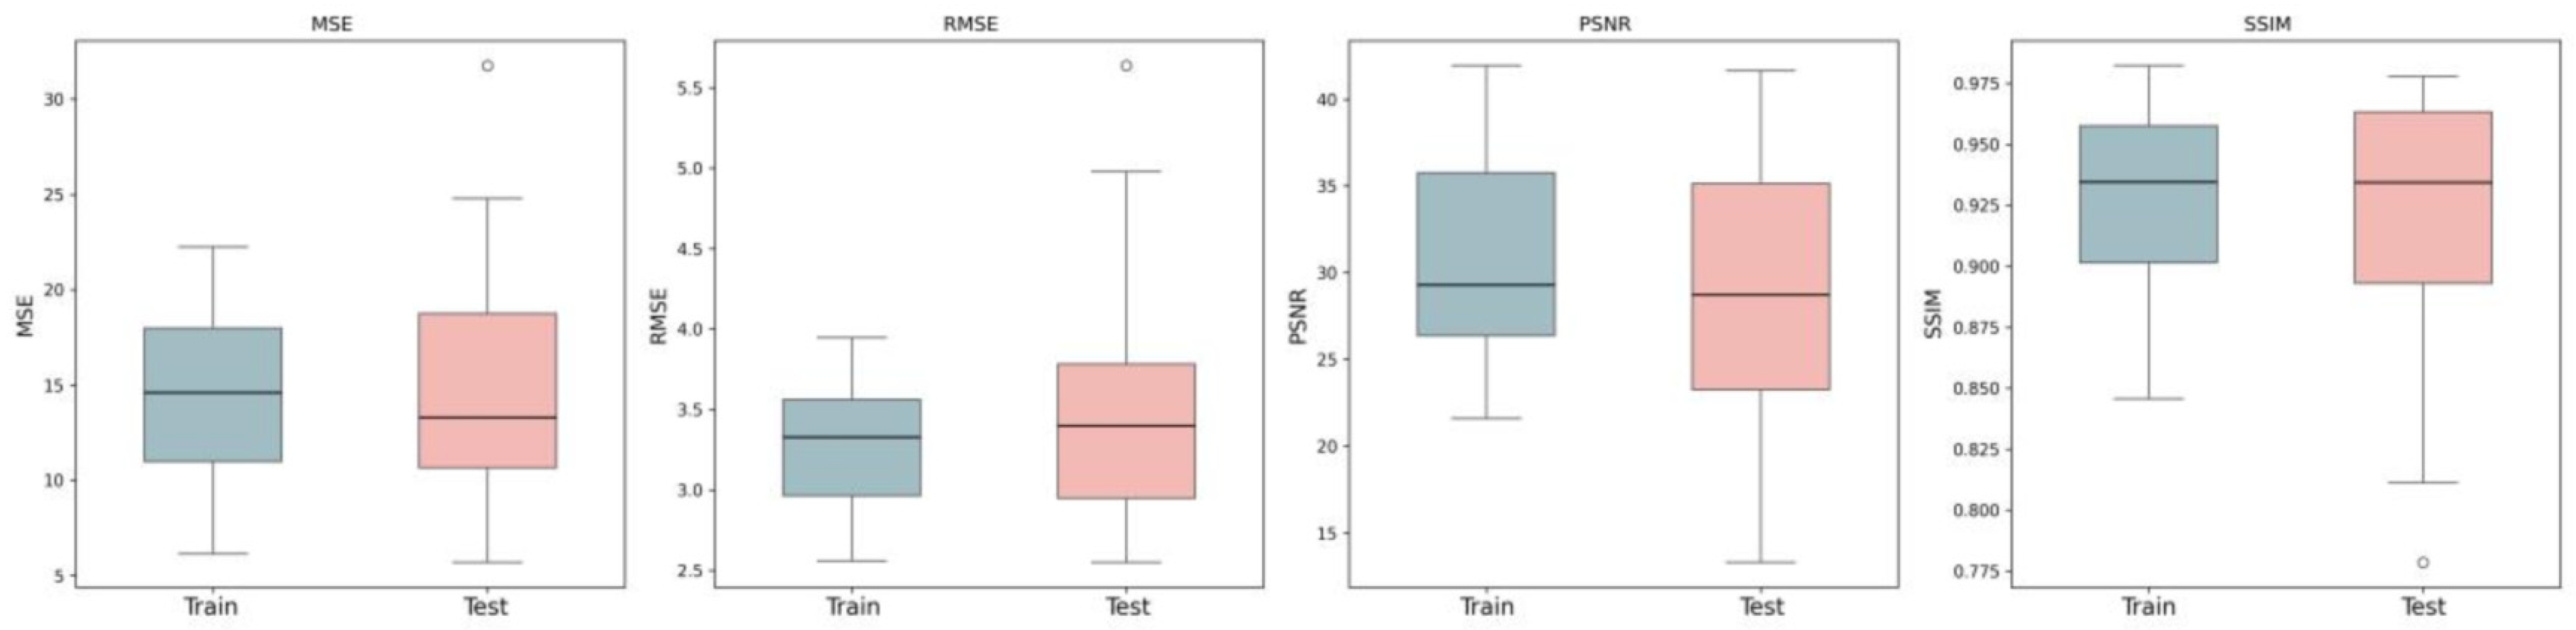
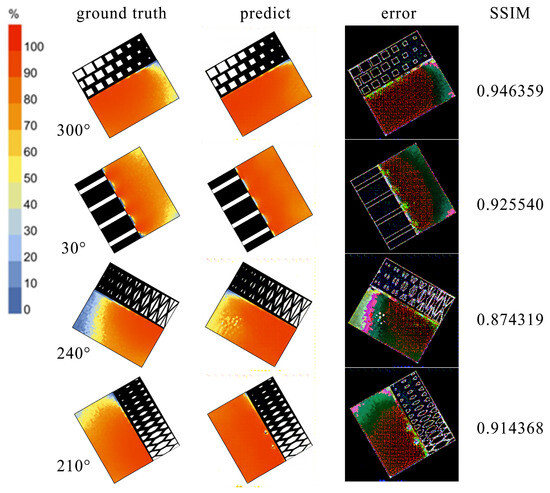
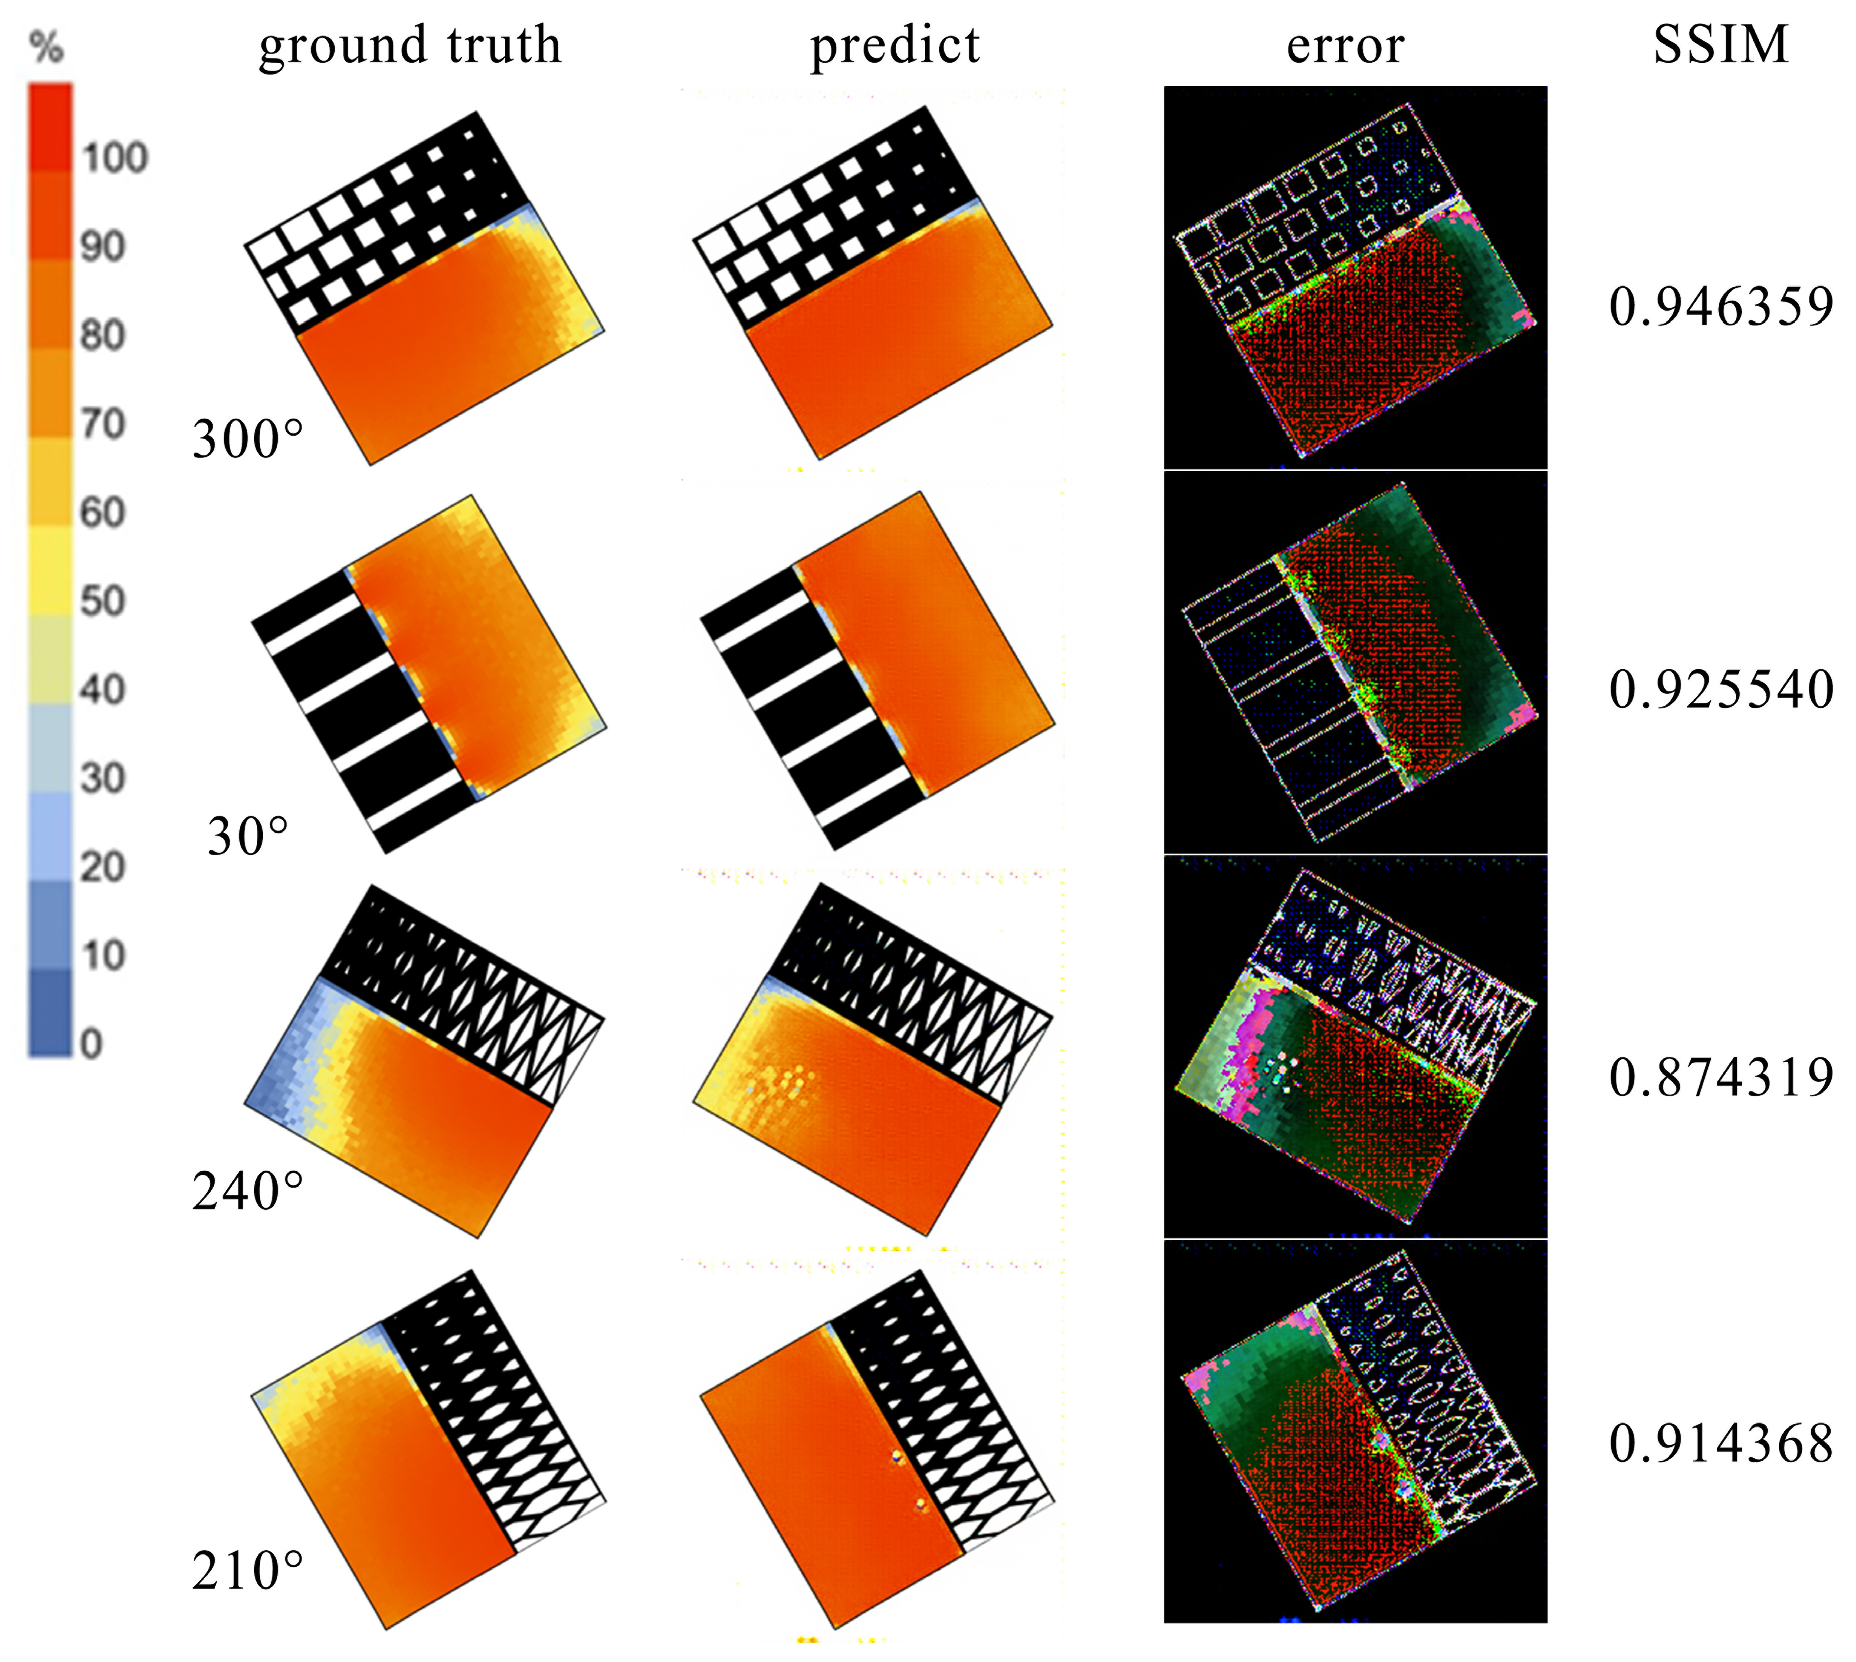
Figure 7 and Figure 8 further illustrate the model’s stability, showing the distribution and box plots of evaluation metrics across the training and test sets, respectively. A qualitative comparison is presented in Figure 9, where predictions for four test cases closely match the ground truth simulations, with high per-image SSIM values.
Figure 7.
Accuracy distribution of test set and training set.
Figure 8.
Model stability analysis of MSE, RMSE, PSNR and SSIM metrics.
Figure 9.
Prediction results and accuracy of DA for four types of facades.
3.3. Computational Efficiency
From the perspective of practical design application, the total time cost of the complete prediction workflow is a key performance metric. Table 2 compares the time breakdown between the traditional simulation workflow and the method proposed in this study. The traditional workflow encompasses all steps from 3D modeling to simulation, with a total duration of approximately 460–993 s. The total time for our proposed prediction pipeline consists of two components: first, the time required to create the “facade-unfolding diagram,” which typically takes between 0.3 and 5 min (18–300 s) for a designer proficient with CAD tools; second, the inference time of the trained GAN model, which remains consistently around 1.1 s. Consequently, the total prediction time ranges from approximately 19.1 to 301.1 s.
Table 2.
The time cost of predictive modeling and simulation calculations.
Compared to traditional simulation, the proposed method achieves a speedup in the vast majority of scenarios (i.e., when diagram creation takes less than 5 min), with an acceleration factor ranging from about 1.5× to 52×. This efficiency gain holds significant value in the early conceptual design stage, where rapid comparison among dozens of facade alternatives is often required. It is important to note that the “Traditional Simulation” time in Table 2 includes potential repetitive 3D modeling and setup time due to design modifications. In contrast, minor design adjustments may only require local edits to the “facade-unfolding diagram,” further reducing its creation time and thereby amplifying the relative efficiency advantage of the prediction pipeline.
4. Discussion
This study aimed to develop a framework for the rapid visual prediction of DA using facade unfolding diagrams and GANs. This section provides an in-depth analysis of the results, elucidates their connection to the research objectives, evaluates the method’s effectiveness and boundaries, and discusses its implications for design practice.
4.1. Validity of the Facade Unfolding Representation
The primary objective was to validate a geometric input representation independent of parameters and intermediate features. The results, showing high predictive accuracy (mean SSIM = 0.93), strongly confirm the proposed “facade unfolding diagram” as an effective information carrier linking 3D building geometry to 2D performance distribution. By “folding” facade geometry onto the floor plan, this representation simultaneously encodes form, layout, and orientation within a standard image format. This transforms the complex physics of architectural daylighting into an image-to-image translation problem, efficiently learned by the mature deep learning model (Pix2pixHD).
4.2. Predictive Accuracy, Speed, and Value for Design Application
The second and third objectives involved validating the model’s accuracy and efficiency. Regarding accuracy, the high Structural Similarity Index (mean SSIM = 0.93) indicates that the predicted DA distribution maps are highly consistent with the benchmark simulations in terms of spatial pattern, contrast, and luminance levels. For designers, a high SSIM value (0.93) indicates that the prediction reliably preserves the visual patterns critical for comparative judgment: it correctly identifies the location and extent of well-lit zones near windows, the gradient of light decay across the room, and the relative performance ranking between different design alternatives. This makes the tool effective for its primary purpose: rapid visual trend analysis in early-stage design. This allows designers to reliably identify “high daylight zones” (e.g., warm-colored areas in Figure 9), “medium daylight zones,” and “low daylight zones” (cool-colored areas) from the predictions, and to intuitively assess and compare the trends in indoor light environment gradients resulting from different facade designs. Regarding speed, the complete prediction workflow, including the time for drawing the unfolding diagram, still achieved a speedup factor of approximately 1.5 to 52 times compared to traditional simulation (460–993 s). This leap in efficiency stems from shifting the costly computational burden of physics-based simulation from each design iteration to a one-time, upfront model training process. This directly addresses the core need for “rapid feedback” in early-stage design, enabling designers to screen and compare the performance of a large number of facade variants within a short time, thereby supporting genuine performance-driven morphological exploration.
4.3. Analysis of Model Learning Behavior and Potential Defects
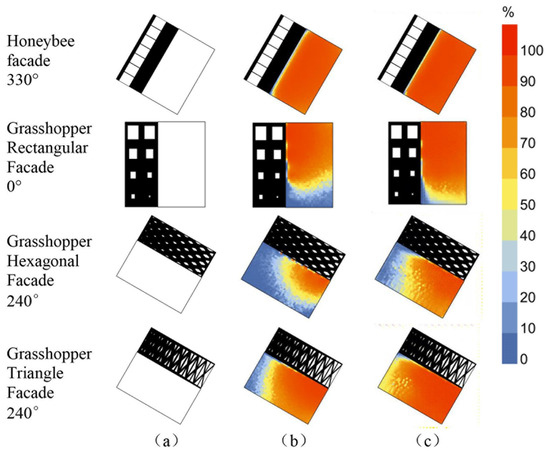
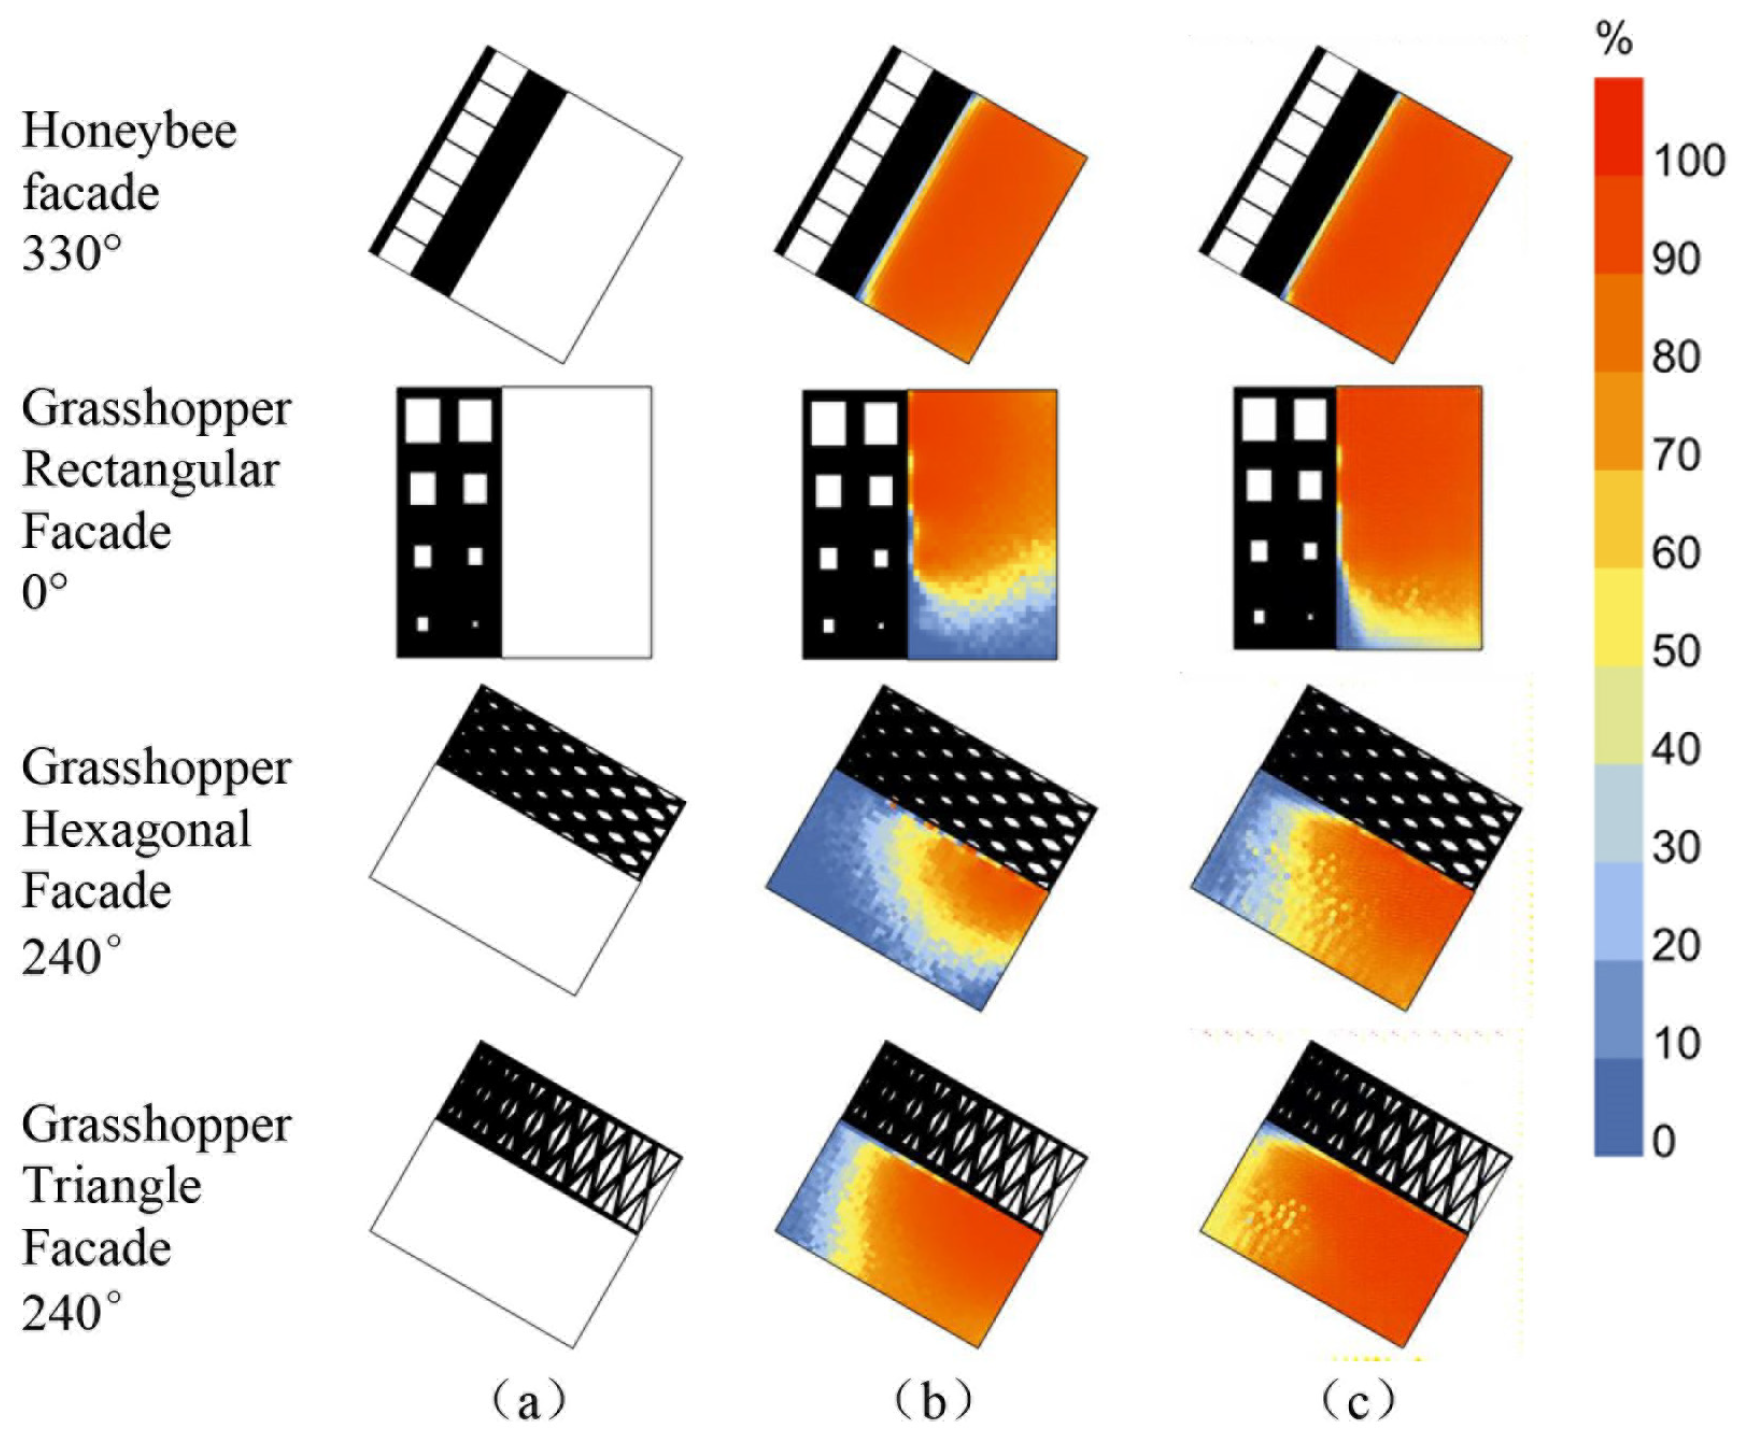
Close observation of the prediction results (e.g., Figure 9 and Figure 10) reveals some systematic model behaviors. For instance, brightness gradients near window edges are sometimes smoothed, and DA values in deep corners may be slightly overestimated. These phenomena suggest that the Pix2pixHD model is more adept at learning strong correlations between geometric patterns and statistical daylight distributions within the dataset, rather than fully replicating the precise physics of ray-tracing. The model is essentially a high-performance, data-driven surrogate, and its predictive capability is highly dependent on the coverage and quality of the training data. This understanding is crucial for defining the method’s scope of application: it performs well within the design space characterized by the training data, but its physical correctness for extrapolation should be viewed with caution.
Figure 10.
(a) Facade unfolding. (b) Simulation results. (c) Prediction results.
Therefore, a key distinction must be made between physical accuracy and design effectiveness. This model is engineered for design effectiveness: it serves as a fast, visually credible surrogate that correctly captures the macro-scale trends of how facade changes affect interior daylight patterns. It is not intended to achieve pixel-perfect physical accuracy, which remains the domain of high-fidelity simulation tools used for final verification and compliance. Its practical value lies in enabling performance-aware morphological exploration during the conceptual stage, where relative comparisons and trend identification are more valuable than absolute numerical precision.
4.4. Implications for Design Practice and Workflow Integration
This method brings concrete changes to the design workflow. First, it significantly lowers the barrier to performance analysis, as the input is merely a 2D unfolding diagram that architects can create using familiar CAD tools or even freehand sketching. Second, it provides intuitive visual feedback (DA visualization) that is easier for designers to understand and utilize than numerical reports. Therefore, this framework is best integrated into the “generate–screen–iterate” loop of the early conceptual design phase, used to quickly eliminate poorly performing schemes and focus on a few promising directions for in-depth, precise simulation validation. We recommend a hybrid design workflow of “AI proxy for rapid exploration + physics simulation for final verification.”
4.5. Limitations, Applicability Boundaries, and Future Work
The proposed facade unfolding representation, while geometry-agnostic for polygonal facades adjacent to a planar floor slab, is not universally applicable. It encounters fundamental challenges with highly curved or non-developable surfaces (e.g., complex double-curved facades), where a lossless 2D unfolding is geometrically impossible. Furthermore, in spaces where daylight is significantly contributed by multiple non-adjacent facades, overhead skylights, or complex internal obstructions, the simplified single “unfolded facade-to-plan” correspondence may fail to capture all critical light paths. Thus, the current framework is primarily suited for the performance screening of side-lit spaces with predominantly planar facade elements.
Despite the positive results, this study has clear limitations, which also point the way for future research:
Generalization Limits: The model was trained on a single room type (classroom) and a single climate (Shenyang). Its transferability to other space types (e.g., deep-plan offices, atria), rooms with multiple facades, or different climate zones remains unverified. Future work requires building diverse datasets and conducting cross-domain generalization studies.
Single Performance Metric: The current framework predicts only Daylight Autonomy (DA). DA primarily reflects the “quantity” of daylight but fails to capture aspects of “quality,” particularly the risk of discomfort glare. In contemporary architecture with extensive glazing, glare control is often a more critical design challenge than ensuring minimum illuminance. The current framework does not cover predictions for metrics like Daylight Glare Probability (DGP), vertical illuminance, or annual light exposure, limiting its application in stages requiring comprehensive comfort assessment. Future extension must develop the model into a multi-task prediction architecture to provide simultaneous visual feedback for DA and key glare indicators.
Static Nature of Input and Output: The current framework handles static geometry and static annual metrics. Future exploration could include the integration of dynamic metrics (e.g., hourly illuminance) or sensitivity to design parameters (e.g., glazing properties) to support richer design decision-making.
Tool Integration: As a research prototype, the current process steps are relatively independent. Developing a plugin seamlessly integrated with mainstream modeling software (e.g., Rhino (version: 7.4)/Grasshopper (version: 1.0.0007)) to automatically generate unfolding diagrams from 3D models and obtain instant predictions would significantly enhance its usability in practice.
5. Conclusions
This study developed and validated an innovative framework based on Generative Adversarial Networks and facade unfolding diagrams for the rapid visual prediction of indoor Daylight Autonomy, under specific classroom typology and climatic conditions. By introducing the “facade unfolding diagram” as a geometry-agnostic 2D representation, the building daylight performance prediction problem is transformed into an image translation task. Utilizing the Pix2pixHD model, high-fidelity DA distribution maps were generated. The model demonstrated high visual fidelity and structural similarity on the test set (mean SSIM = 0.93) and achieved a significant speedup factor of 1.5 to 52 times compared to traditional physics-based simulation within a complete workflow that includes the necessary drawing steps.
The main contributions and design implications of this study are threefold: First, it proposes an input representation method that directly accommodates free-form architectural design without requiring feature engineering. Second, it establishes an end-to-end “sketch-to-performance” prediction pipeline, substantially lowering the technical barrier to obtaining performance feedback in the early design stage. Third, it empirically demonstrates the practical value of this framework for the rapid iteration and comparison of conceptual schemes, providing a new tool for performance-driven morphological generation.
It is essential to position this method as a design-effectiveness tool for early-stage exploration, not as a physics-accuracy tool for final validation. It supplements the design workflow by providing rapid visual feedback for trend analysis and scheme screening, thereby filtering options before committing resources to precise but time-consuming physics-based simulation.
Future research will delve into the following directions: expanding the dataset to include diverse spatial typologies and climates to systematically test and enhance the model’s generalization capability; upgrading the model to a multi-task prediction network to simultaneously assess daylight quantity and glare risk; and ultimately, committing to toolifying this framework by integrating it into parametric design platforms. This will more profoundly empower the architectural creative process, enabling real-time interaction between design and performance feedback.
Author Contributions
J.A.: Conceptualization, Data Curation, Investigation, Methodology, Software, Validation, Visualization, Writing—Original Draft, Writing—Review and Editing. J.Z.: Conceptualization, Supervision, Writing—Review and Editing. X.S.: Data Curation, Investigation, Validation. M.M.: Investigation, Validation. C.D.: Investigation, Writing—Review and Editing. X.Z.: Investigation, Writing—Review and Editing. L.C.: Investigation, Writing—Review and Editing. Z.L.: Data Curation, Software. All authors have read and agreed to the published version of the manuscript.
Funding
This research received no external funding.
Data Availability Statement
The data that support the findings of this study are available from the corresponding author upon reasonable request.
Acknowledgments
We are very grateful to the students and teachers who provided ideas for collecting information.
Conflicts of Interest
The authors declare no conflicts of interest.
References
- Aries, M.; Aarts, M.; van Hoof, J. Daylight and Health: A Review of the Evidence and Consequences for the Built Environment. Light. Res. Technol. 2015, 47, 6–27. [Google Scholar] [CrossRef] [Scilit]
- Boubekri, M. Daylighting, Architecture, and Health: Building Design Strategies, 1st ed.; Elsevier Architectural Press: Amsterdam, The Netherlands; Boston, MA, USA, 2008; ISBN 978-0-7506-6724-1. [Google Scholar]
- Knoop, M.; Stefani, O.; Bueno, B.; Matusiak, B.; Hobday, R.; Wirz-Justice, A.; Martiny, K.; Kantermann, T.; Aarts, M.; Zemmouri, N.; et al. Daylight: What Makes the Difference? Light. Res. Technol. 2020, 52, 423–442. [Google Scholar] [CrossRef] [Scilit]
- Dahlan, A.S.; Eissa, M.A. The Impact of Day Lighting in Classrooms on Students’ Performance. Int. J. Soft Comput. Eng. (IJSCE) 2015, 4, 7–9. [Google Scholar]
- Heschong Mahone Group. Windows and Offices: A Study of Office Worker Performance and the Indoor Environment; Report No. P500-03-082-A-9; New Buildings Institute: White Salmon, WA, USA, 2003; Available online: https://newbuildings.org/resource/windows-and-offices-study-office-worker-performance-and-indoor-environment/ (accessed on 14 January 2025).
- Edwards, L.; Torcellini, P. A Literature Review of the Effects of Natural Light on Building Occupants; National Renewable Energy Laboratory: Golden, CO, USA, 2002. [Google Scholar] [CrossRef] [Scilit]
- Shen, E.; Hu, J.; Patel, M. Energy and Visual Comfort Analysis of Lighting and Daylight Control Strategies. Build. Environ. 2014, 78, 155–170. [Google Scholar] [CrossRef] [Scilit]
- Ayoub, M. 100 Years of Daylighting: A Chronological Review of Daylight Prediction and Calculation Methods. Sol. Energy 2019, 194, 360–390. [Google Scholar] [CrossRef] [Scilit]
- Reinhart, C.F.; Mardaljevic, J.; Rogers, Z. Dynamic Daylight Performance Metrics for Sustainable Building Design. Leukos 2006, 3, 7–31. [Google Scholar] [CrossRef] [Scilit]
- Reinhart, C.F.; Wienold, J. The Daylighting Dashboard—A Simulation-Based Design Analysis for Daylit Spaces. Build. Environ. 2011, 46, 386–396. [Google Scholar] [CrossRef] [Scilit]
- Tzempelikos, A.; Athienitis, A.K. The Impact of Shading Design and Control on Building Cooling and Lighting Demand. Sol. Energy 2007, 81, 369–382. [Google Scholar] [CrossRef] [Scilit]
- Han, Y.; Shen, L.; Sun, C. Developing a Parametric Morphable Annual Daylight Prediction Model with Improved Generalization Capability for the Early Stages of Office Building Design. Build. Environ. 2021, 200, 107932. [Google Scholar] [CrossRef] [Scilit]
- Nourkojouri, H.; Shafavi, N.S.; Tahsildoost, M.; Zomorodian, Z.S. Development of a Machine-Learning Framework for Overall Daylight and Visual Comfort Assessment in Early Design Stages. J. Daylighting 2021, 8, 270–283. [Google Scholar] [CrossRef] [Scilit]
- Le-Thanh, L.; Nguyen-Thi-Viet, H.; Lee, J.; Nguyen-Xuan, H. Machine Learning-Based Real-Time Daylight Analysis in Buildings. J. Build. Eng. 2022, 52, 104374. [Google Scholar] [CrossRef] [Scilit]
- Wang, D.; Place, W.; Hu, J.; Cho, S.; Yu, T.; Zhan, X.; Tian, Z. Unfolding 3D Space into Binary Images for Daylight Simulation via Neural Network. J. Daylighting 2023, 10, 204–213. [Google Scholar] [CrossRef] [Scilit]
- Isola, P.; Zhu, J.-Y.; Zhou, T.; Efros, A.A. Image-to-Image Translation with Conditional Adversarial Networks. In Proceedings of the 2017 IEEE Conference on Computer Vision and Pattern Recognition (CVPR), Honolulu, HI, USA, 21–26 July 2017; pp. 5967–5976. [Google Scholar]
- Abadi, M.; Agarwal, A.; Barham, P.; Brevdo, E.; Chen, Z.; Citro, C.; Corrado, G.S.; Davis, A.; Dean, J.; Devin, M.; et al. TensorFlow: Large-Scale Machine Learning on Heterogeneous Distributed Systems. arXiv 2016, arXiv:1603.04467. [Google Scholar]
- He, Q.; Li, Z.; Gao, W.; Chen, H.; Wu, X.; Cheng, X.; Lin, B. Predictive Models for Daylight Performance of General Floorplans Based on CNN and GAN: A Proof-of-Concept Study. Build. Environ. 2021, 206, 108346. [Google Scholar] [CrossRef] [Scilit]
- Li, X.; Yuan, Y.; Liu, G.; Han, Z.; Stouffs, R. A Predictive Model for Daylight Performance Based on Multimodal Generative Adversarial Networks at the Early Design Stage. Energy Build. 2024, 305, 113876. [Google Scholar] [CrossRef] [Scilit]
- Li, Z.; Chen, H.; Lin, B.; Zhu, Y. Fast Bidirectional Building Performance Optimization at the Early Design Stage. Build. Simul. 2018, 11, 647–661. [Google Scholar] [CrossRef] [Scilit]
- Li, S.; Liu, L.; Peng, C. A Review of Performance-Oriented Architectural Design and Optimization in the Context of Sustainability: Dividends and Challenges. Sustainability 2020, 12, 1427. [Google Scholar] [CrossRef] [Scilit]
- Jakubiec, J.A.; Reinhart, C. DIVA 2.0: Integrating Daylight and Thermal Simulations Using Rhinoceros 3D, DAYSIM and EnergyPlus. In Proceedings of the International Building Simulation Conference 2011 (IBPSA), Sydney, Australia, 14–16 November 2011; Volume 12, pp. 2202–2209. [Google Scholar]
- Wang, Z.; Bovik, A.C.; Sheikh, H.R.; Simoncelli, E.P. Image Quality Assessment: From Error Visibility to Structural Similarity. IEEE Trans. Image Process. 2004, 13, 600–612. [Google Scholar] [CrossRef] [Scilit] [PubMed]

Disclaimer/Publisher’s Note: The statements, opinions and data contained in all publications are solely those of the individual author(s) and contributor(s) and not of MDPI and/or the editor(s). MDPI and/or the editor(s) disclaim responsibility for any injury to people or property resulting from any ideas, methods, instructions or products referred to in the content. |
© 2026 by the authors. Licensee MDPI, Basel, Switzerland. This article is an open access article distributed under the terms and conditions of the Creative Commons Attribution (CC BY) license.