


Abstract
Subway stations are typical underground transitional spaces with complex thermal environments. Existing studies often characterize the comfort zone by temperature alone and lack cross-climate comparisons, limiting practical applicability. To address this, the standard effective temperature (SET*) was adopted in this study as the core index to couple multiple environmental and personal parameters. On-site measurements and questionnaire surveys were conducted in summer in Beijing, located in the cold climate zone, and Suzhou, in the hot-summer and cold-winter zone. Based on 410 samples from Beijing, the neutral SET* was 23.37 °C for concourses and 20.43 °C for platforms, with 80% acceptable ranges of 20.37–26.38 °C and 18.4–24.62 °C, respectively. Optimal thermal sensation was slightly cool, reaching −0.503 in concourses and −0.318 on platforms. Cross-climate comparison revealed a systematic warm-side shift for Suzhou passengers from 181 samples: neutral SET* increased to 26.46 °C in concourses and 23.99 °C on platforms, comfort zones shifted upward to 25.00–28.97 °C and 21.90–27.03 °C, and optimal thermal sensation values of −0.153 and −0.262 indicated weaker cool preference and higher heat tolerance. These findings improve understanding of thermal comfort in subway stations and provide guidance for environmental design.
1. Introduction
With rapid advances in transportation, subway systems have become the preferred mode of public transport for a growing number of people, as their high punctuality and freedom from traffic congestion continue to attract more passengers [1,2]. By 2025, 58 cities in China had opened 382 urban rail transit lines, with a total operating mileage of 13,071 km and an annual passenger volume exceeding 34 billion [3]. However, the rapid expansion of subway systems has led to a sharp increase in energy consumption. Excessive energy use and waste have become an urgent and pressing problem that demands a solution. In 2024, China’s rail transit consumed a total of 27.02 billion kWh of energy, an increase of 6.83% [3]. Among these, station energy consumption accounted for 12.97 billion kWh and train traction consumed 14.15 billion kWh. According to a previous study, the energy consumption intensity of subway stations has surpassed 130 kWh/m2, which is two times that of traditional public buildings [4].
In subway stations, air conditioning is usually operated to ensure passengers’ thermal comfort, and its settings are therefore related to passengers’ thermal comfort. Generally, passengers’ thermal comfort is affected by multiple parameters, including air temperature, humidity, wind speed, and clothing insulation. The most common strategy used in subway stations is to adjust the temperature and humidity setpoint of the air conditioning system. To meet increasingly strict comfort requirements, the temperature setpoint in subway stations during cooling seasons is often maintained at low levels. Multiple studies have shown that such a setting method not only fails to fully satisfy passengers’ thermal comfort needs but also limits the energy-saving potential, undoubtedly leading to significant energy waste [5,6,7,8,9]. Given the large number of subway stations in modern cities, even a slight reduction in the energy consumption of air conditioning systems could yield considerable energy savings. Thus, many researchers have studied the thermal comfort conditions within subway stations under different climate zones in order to guide the operation of air conditioning systems.
2. Literature Review
2.1. Summer Thermal Comfort in Subway Stations Across Climate Zones
At present, the design of air conditioning systems for subway stations follows the GB50157-2013 standard [10], which requires the concourse temperature to be 2–3 °C lower than the outdoor design dry-bulb temperature for air conditioning and the platform temperature to be 1–2 °C below that of the concourse. However, several studies have demonstrated that there are certain differences in thermal comfort within subway stations across different climate zones.
In severe cold regions at high latitudes, researchers have primarily focused on passengers’ thermal comfort and adaptive capacity under low-temperature conditions. Long-term field measurements conducted by Yang et al. [8] in Harbin subway stations revealed that the actual thermal comfort environment in winter deviates considerably from current standards, and the thermal environment could satisfy approximately 70% of passengers. The comfort temperature ranges were 10.6–19.3 °C for corridor, 11.2–19.9 °C for concourse, and 13.8–21.6 °C for platform. Gu et al. [11] conducted a thermal environment and comfort investigation in Changchun subway stations, and their results demonstrated that winter exhibits the worst thermal conditions, and cold air infiltration was a critical factor influencing thermal comfort. This study also identified the 80% acceptable thermal comfort zones in stations and thermoneutral temperatures for different seasons. The 80% thermal comfort range of public areas was 22.3–28.2 °C in summer, 15.8–21.0 °C in the transitional seasons, and 9.8–14.3 °C in winter. Wang et al. [12] adopted a whole-process thermal comfort tracking approach to investigate passengers’ thermal comfort in subway stations. The results showed that the indoor cooling was almost unnecessary because the temperature is already cool, and passengers still maintained high thermal comfort even when the humidity was high, demonstrating significant potential for energy savings. The comfort temperature range was 22.7–27.2 °C for the concourse and 22.8–25.4 °C for the platform.
In cold regions, researchers have turned their attention to passengers’ thermal comfort during summer and transitional seasons. Gu et al. [13] investigated the thermal environment in Xi’an subway stations during autumn, evaluating the humidity environment using the Humidity Perception Vote (HPV) and assessing the thermal environment through a combined approach of the thermal sensation vote (TSV) and the Heat Deficit Rate (HDR). They plotted out the 80% satisfaction temperature and humidity ranges and obtained an autumn thermal environment evaluation index suitable for the Xi’an region by correcting the HDR. Li et al. [14] conducted a comfort assessment of various environments within the subway station using a novel field-based approach based on multimodal physiological signals. Pan et al. [7] conducted on-site measurements in Beijing subway stations. Based on 628 questionnaires, the results demonstrated that passengers’ thermal sensation undergoes significant changes during their subway trips. The 80% acceptable comfort temperature range was 26–29.6 °C at the entrance, 25.5–32 °C in the concourse, 24.5–28.5 °C on the platform, and 24.2–27.6 °C inside the carriage. In addition, although these temperature ranges exceeded the design temperature for summer environmental control stipulated in GB 50157, passengers still considered it acceptable.
In the hot-summer and cold-winter climate zone, summer is characterized by high temperature and high humidity, where the combined effects of climatic factors pose a greater challenge to passenger thermal comfort. Huang et al. [15] established a model for predicting the thermal comfort inside the subway, and, based on this, determined the thermal comfort influencing variables as well as the optimal parameter combinations. Through an on-site investigation of a typical subway station in Changsha, Hu et al. [16] incorporated the influence of passenger dwell time on thermal comfort and found that short-stay passengers were more sensitive to temperature variations, with a comfort range of 24.5–24.8 °C. In contrast, the comfort range of long-stay passengers who had acclimatized to the indoor microclimate broadened to 25.6–26.3 °C, confirming the influence of thermal adaptation on thermal comfort. In the hot-summer and warm-winter zone, the summer lasts for an extended period with particularly intense hot–humid conditions. The annual mean temperature is relatively high, making thermal comfort during the cooling season a research priority. Fang et al. [17] conducted a thermal comfort study in Guangzhou subway stations located in this climate zone. The results showed that the neutral SET* was 21.6 °C at platform and 19.6 °C at the entrance, and the comfort range at platform was 21.6 to 28.8 °C. Chen et al. [9] investigated the thermal environment and thermal comfort in subway stations in a hot-summer and warm-winter zone city Guangzhou through thermal sensation questionnaire surveys. The results from 1481 valid responses showed that passengers have different thermal comfort characteristics among low, medium, and high metabolic rates, with 80% acceptable temperature ranges of 19.07–30.34 °C, 17.10–28.92 °C, and 21.36–28.25 °C, respectively. Regardless of whether it was during peak hours or not, the thermal sensation vote remained within −0.7 < TSV < 0.7, and the thermal comfort range exceeded the 22–27 °C range specified by ISO 7730 [18], demonstrating a high tolerance to heat. Furthermore, Han et al. [19] conducted a study on the thermal environment within Seoul subway stations by combining physical environment measurements with questionnaire surveys. They found that the thermal comfort range in the concourse was 15.9–31.5 °C, further confirming the widespread nature of thermal comfort characteristics in subway stations.
These studies show that passengers’ thermal comfort in subway stations varies substantially across climate zones, station zones, and activity states. Field-measured neutral temperatures and acceptable ranges often deviate from the fixed design assumptions in the current standard, and passengers in many cases accept a wider range of thermal conditions than the standard comfort zone. This suggests that a single nationwide environmental control strategy may not adequately reflect local thermal adaptation. Therefore, in this study, a unified thermal comfort evaluation index was adopted for cross-climate zone comparative analysis to identify the systematic regional differences in passenger thermal comfort, and to provide support for climate-adaptive environmental design.
2.2. Factors Influencing Thermal Comfort in Subway Stations
As a typical large-scale underground public building, the internal thermal environment of a subway station is significantly influenced by the complex train piston ventilation, building structure, and high-density passenger flow, exhibiting pronounced unsteady and spatiotemporally non-uniform characteristics. Factors such as the usage period of subway stations [20], ventilation modes [21], and thermal experience [22,23] have been demonstrated to have certain effect on passengers’ thermal comfort. In recent years, scholars have investigated the thermal comfort mechanisms of subway stations in summer, aiming to reveal the influencing mechanisms of thermal comfort and thereby determine the design temperature for air-conditioning systems within the subway stations.
Existing research indicates that thermal comfort in subway stations is not determined by a single factor, but, rather, results from the combined influence of climatic conditions, building structure, train operations, passenger density, and individual adaptability. Its complexity is far greater than that of conventional indoor spaces. From the perspective of outdoor weather and station depth, a study in Athens has revealed that fluctuations in external temperature can significantly affect the thermal environment inside the station, and the shallower the depth, the more pronounced this effect becomes [24]. This implies that the design of subway stations can hardly be discussed independently of the local climatic context when addressing thermal comfort. Meanwhile, the impact of architectural form and train operations should not be overlooked. The research conducted in Harbin [25] demonstrated that platform door types, the interval of train operation, and even the piston effect can directly alter the temperature and humidity distribution within a station. Furthermore, Chen et al. [26], in Wuhan, through the calculation of thermoneutral temperature and thermal comfort zones, further revealed a significant association between passengers’ thermal sensation and the architectural form of subway stations.
Unlike conventional buildings, passenger flow density and individual adaptability in subway stations add another dimension of complexity to thermal comfort. Kapil et al. [27] incorporated passenger activity levels and crowd density into a thermal comfort prediction framework using an agent-based modeling approach, resulting in a model with good interpretability. Simulation results for a low-density carriage in Shanghai [28] further demonstrated that when occupant density decreases, air velocity becomes the key factor dominating comfort sensation rather than radiation and convection. In transitional buildings such as subway stations, individual thermal adaptation is also a key factor affecting thermal comfort.
Yang et al.’s [29] research found that waiting time significantly affects passengers’ thermal comfort. As passengers moved, the thermal neutral temperature increased from 18.3 °C to 20.3 °C, rising by two degrees. A survey at a UK airport terminal [30] further confirmed from another perspective that the thermal comfort range of transient occupants in transitional spaces is much wider than that of long-term staff. These findings collectively indicate that, in the summer subway station environment, passengers’ thermal comfort and their thermal sensation cannot be measured by temperature alone but should be assessed through a comprehensive consideration of multiple environmental parameters.
2.3. Analysis of Thermal Environment Evaluation Indices in Subway Stations
Based on the unsteady environmental characteristics of subway spaces in summer—high humidity, strong air movement, and highly dynamic passenger flow transitions—selecting a microclimate evaluation index with strong applicability is the core prerequisite for conducting thermal comfort assessments in subway stations. A review of existing studies reveals that the thermal comfort evaluation indices adopted for transportation hubs and transitional spaces are notably diverse yet exhibit obvious limitations.
For thermal comfort evaluation in subway stations, the U.S. Department of Transportation developed the Relative Warmth Index (RWI) and the Heat Deficit Rate (HDR) model. These indices focus on the human heat balance during transitional periods. They can be effectively applied to the assessment of transient thermal environments, and have been widely used for thermal environment evaluation in transient and non-steady-state scenarios.
Zhu et al. [31] employed the dynamic thermal comfort evaluation models RWI and HDR to analyze the environmental characteristics of subway stations and the thermal comfort variation patterns of passengers during station entry and exit. They further investigated the thermal comfort conditions of different evaluation units in public areas across various seasons, and obtained passenger thermal comfort levels under different environmental conditions. However, although the RWI index has been relatively widely applied, it has primarily been used in non-steady-state scenarios in cold environments or regions. When applied to the typical high-temperature and high-humidity conditions of summer, its capacity to account for humidity parameters and evaporative heat dissipation is notably insufficient. Wu et al. [32] conducted a field measurement study using the RWI index to evaluate a transfer station in Beijing during summer. The results showed that the passenger satisfaction rate with the thermal environment was only 13%, and there was a deviation of up to 55% between the average thermal comfort level and the ASHRAE standard value, indicating that the thermal comfort environment in subway stations must be enhanced in summer. Some researchers [33] have applied the predicted mean vote (PMV–PPD) model, adaptive models (such as the ASHRAE standard 55-2020 [34] and EN 15251 [35] adaptive models), and the aPMV model incorporating psychological correction to evaluate thermal comfort in subway stations. The results showed that the PMV–PPD and aPMV models overestimated passengers’ cool sensations, and although the ASHRAE standard 55-2020 [34] and EN 15251 [35] adaptive methods were more lenient, they still could not fully match the actual thermal sensation of passengers.
To overcome these limitations, Zhang et al. [36] argued that relative humidity may serve as the primary parameter for thermal comfort, and based on the existing ventilation performance indicators related to thermal comfort, they proposed a new ventilation performance indicator: Effective Humidity Temperature (EMT). Subsequently, by integrating EMT with the cooling effect of air movement, they further developed the Effective Draft and Moisture Temperature (EDMT), which achieved an accuracy of 96.7–99.2%. Zhang et al. [37] employed RWI and HDR to investigate thermal comfort in railway stations. Their findings indicated that the application of RWI is limited to specific operational scenarios, while HDR is not suitable for station environments. As indicated in the research conclusions of Ding et al. [38], the applicability of RWI and HDR in subway stations remains questionable.
In contrast, the standard effective temperature (SET*) serves as a comprehensive dynamic thermal balance indicator. It not only integrates various physical parameters such as air temperature, average radiant temperature, relative humidity, and air velocity, but it also accounts for changes in clothing insulation and metabolic rate during different passenger phases including entering, waiting, and riding. This index has been adopted by authoritative international standards and has become a preferred reference index in environmental assessment in recent years [39,40].
Zhang et al. [41] considered the thermal adaptation of passengers in five subway stations in Wuhan and used SET* to determine the thermal comfort temperature range in subway stations. Cheung et al. [42] employed SET* to determine the optimal comfort temperature range for semi-outdoor workspaces in Singapore during the hottest months, yielding a result of 25.0–28.0 °C. Negin et al. [43] adopted SET* as a measure of thermal comfort and established a thermal comfort prediction model. Lan et al. [44] evaluated the thermal comfort of indoor spaces in a multistory building based on the SET* index, and derived optimal indoor temperature according to different thermal comfort levels. The choice of index affects the applicability of the conclusions. The steady-state PMV model is suitable for static spaces with uniform environments and occupants at rest for extended periods, while the adaptive model is applicable to spaces where the thermal environment can be adjusted. Based on the above analysis, this study uses the standard effective temperature (SET*) as the main thermal index to fully evaluate the impact of the subway station’s complex transitional environment on human thermal comfort.
2.4. Research Gap
Although the above studies have yielded substantial findings on thermal comfort in subway stations, the following research gaps remain.
- (1)
- When presenting thermal comfort results, existing studies commonly characterize the comfort zone using a single temperature interval, which may not be consistent with the actual situation. As underground transitional spaces, subway stations feature a complex internal thermal environment with significant parameter fluctuations, and passenger thermal comfort is affected by multiple interacting factors. If the comfort zone is expressed solely in terms of temperature while neglecting humidity, air velocity, and other parameters, it may lead to misjudgment of thermal comfort under certain conditions, potentially resulting in passenger complaints.
- (2)
- Existing research has mainly focused on local thermal comfort conditions, but systematic cross-climate comparisons of passenger thermal comfort in subway stations remain limited. Populations from different climatic regions may develop distinct thermal adaptation and psychological expectations, so results obtained from one city cannot be directly extrapolated to another. Without comparative evidence from different climate zones, environmental design for subway stations tends to rely on conservative national standards rather than climate-adaptive strategies.
Therefore, this study selected Beijing in the cold climate zone and Suzhou in the hot-summer and cold-winter climate zone to conduct thermal environment measurements and subjective questionnaire surveys. SET* was adopted as the unified index to determine the thermoneutral temperature and thermal comfort range in the concourse and platform during summer. On this basis, the thermal comfort characteristics and their differences across the two climate zones were compared and analyzed.
3. Material and Methodology
3.1. On-Site Environmental Measurement
To investigate the dynamic thermal environment characteristics of subway stations and the deviations in subjective thermal comfort across different climate zones, this study conducted on-site measurements from July to August 2025 at several subway stations with typical station structures and passenger flow characteristics in Beijing, a representative city of the cold climate zone, and Suzhou, located in the hot-summer and cold-winter zone. The measurement period was from 7:00 to 21:00 every day, covering the morning peak (7:00–9:00), off-peak (9:00–17:00), evening peak (17:00–19:00), and evening off-peak periods. A total of 22 subway stations in Beijing and 8 stations in Suzhou were selected as measurement sites. These stations were selected through stratified sampling based on the construction age of the stations, transfer conditions, and the types of surrounding land use, ensuring the representativeness and diversity of the samples in terms of spatial attributes, thereby reflecting the thermal environment differences among subway stations in different functional areas.
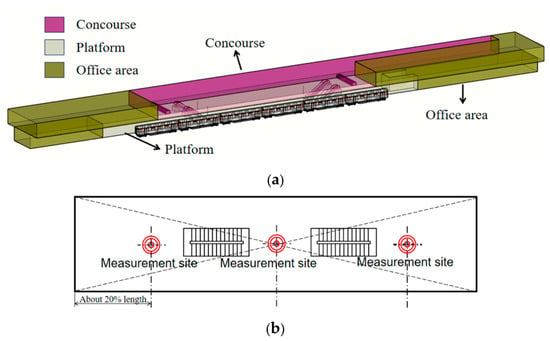
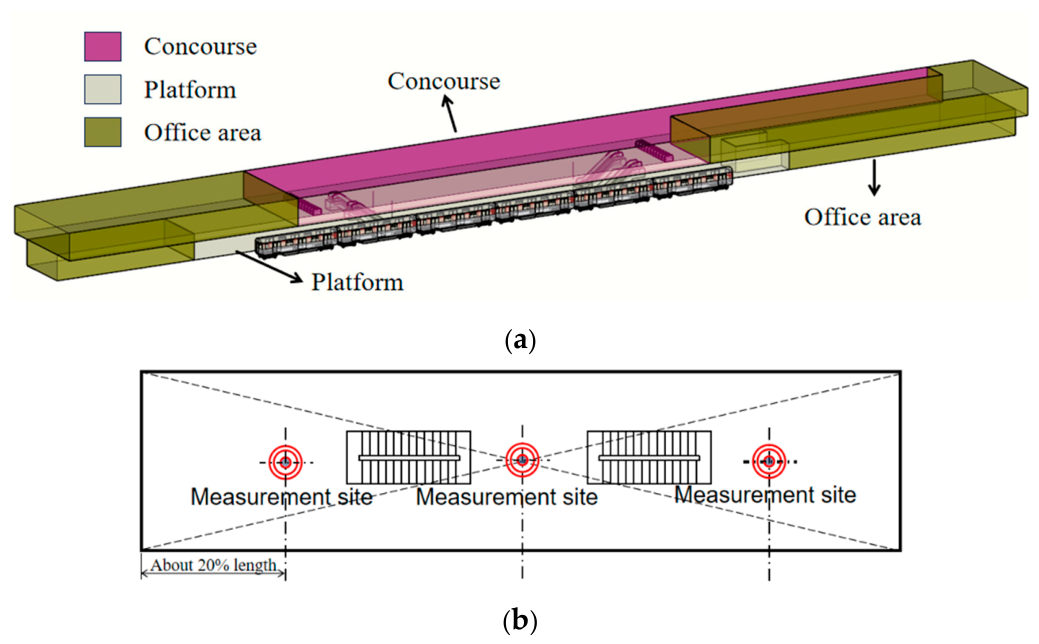
At each station, the measurement sites were distributed outside the subway station, in the concourse, and on the platform. Outdoor measurement sites were positioned within 5 m of the station entrance in an unshaded area. Inside the station, three measurement points were evenly distributed in both the concourse and the platform, respectively. The typical subway station structure and the locations of measurement points in the concourse and on the platform are shown in Figure 1. The measurement parameters included air temperature, air humidity, wind speed, and CO2 concentration. Each measurement site was equipped with a TR-76Ui-S temperature and humidity recorder (T&D Corporation, Matsumoto, Japan) and a Testo 425 hot-wire anemometer (Testo SE & Co. KGaA, Titisee-Neustadt, Germany). The detailed parameters are shown in Table 1.
Figure 1.
Spatial structure and measurement layout of the subway station. (a) Schematic diagram of subway station space. (b) Layout of instruments in both the concourse and the platform.
Table 1.
Measurement instruments and specifications.
During the measurements, all instruments were installed at a height of 1.1 m above the ground [45] and were preheated to stabilize readings before the measurement started, ensuring measurement accuracy. Outdoor environmental parameters were recorded immediately at the entrance after each participant completed the prescribed 5 min outdoor exposure period. Subsequently, when participants arrived at the designated concourse or platform measurement point and filled out the questionnaire, the environmental parameters at that point were recorded simultaneously. The time stamps of outdoor recordings and indoor measurement points were strictly matched to the moment of questionnaire completion, thereby ensuring that each subjective comfort rating was directly linked to the instantaneous thermal environment conditions experienced by the individual at the time of voting, minimizing errors caused by time mismatch.
3.2. Questionnaire Survey
While conducting on-site measurements, a subjective questionnaire survey was also conducted among passengers entering the station. The collection of personal data and experiment study have been validated by the Science and Technology Ethics Committee. The questionnaire consisted of two parts: basic information of the participants and subjective human perceptions. The basic information included gender, height, weight, age, years of residence in the local area, and clothing insulation determined through a standard clothing checklist. The subjective perception survey comprised the thermal sensation vote (TSV) and the thermal comfort vote. The options for heat sensation voting (TSV) were set according to the 7-level scale of ASHRAE Standard 55-2020 [34], ranging from −3 (cold) to +3 (hot), where 0 indicated neutrality. Heat comfort was measured using a 5-level scale [46,47,48]: 0 (comfortable), 1 (slightly uncomfortable), 2 (uncomfortable), 3 (very uncomfortable), 4 (unbearable). This discomfort-oriented scale can more accurately and finely reflect the passengers’ transient thermal comfort state.
The passengers who participated in the survey were recruited at the station entrance. All volunteers who participated in the survey were presented with an informed consent form and agreed to participate. The investigators explained the purpose of the study and obtained informed consent from the participants. Permission to conduct the field measurements and questionnaire surveys was also obtained from the relevant subway station authorities. Before the tests, each participant first underwent a 5 min exposure outside the station to stabilize their perception of the outdoor thermal environment and ensure that all participants had similar thermal experiences at the start of the test. Then, they entered the subway station following the normal procedure, and each participant was guided to the nearest suitable measurement site—either in the concourse or on the platform site according to the entrance location. As passengers usually do not stay in the concourse for a long time in actual situations, passengers at the concourse site immediately filled out the questionnaire upon arrival without an additional exposure time. For passengers at the platform site, they needed to wait for approximately 3 min (this duration was determined based on the average waiting time for subway) before filling out the questionnaire. To reflect the real passenger flow situation and minimize the burden and resistance of the participants, each passenger only received one questionnaire survey.
Clothing insulation was calculated using the insulation values of individual garments provided in ASHRAE Standard 55-2020 [34]. A series of typical summer clothing items (such as short-sleeved T-shirts, thin pants, shorts, skirts, underwear, socks, sandals, sports shoes, etc.) are listed in the questionnaire. The subjects ticked each item according to what they were wearing on that day. The total clothing insulation (clo) was obtained as the arithmetic sum of the insulation values of all individual garments.
3.3. SET* Calculation
To comprehensively characterize the complex dynamic thermal environment within subway stations, the standard effective temperature (SET*) is adopted as the core thermal environment index. The standard effective temperature SET* is based on the human thermal physiological model. Its core principle lies in determining the equivalent temperature in the standard reference environment by solving the heat balance equation and the thermoregulation equation. This is achieved by solving the following system of human thermal balance equation:
- (1)
- Human heat balance equation
M − W = (C + R + Esk) + (Cres + Eres)
- (2)
- Core layer heat balance equation
- (3)
- Skin layer heat balance equation
When calculating SET*, the skin temperature and skin wettedness are first iteratively determined using Equations (1)–(3). These values of skin temperature and skin wettedness are then substituted into the standard environment, where the air temperature that produces the same (Tsk, w) as in the actual environment is solved through reverse iteration. This air temperature is defined as SET*.
In this study, as the subway stations are entirely underground spaces, the mean radiant temperature was assumed to be equal to the air temperature [49,50]. Metabolic rate and clothing insulation were estimated in accordance with ASHRAE standard 55-2020 [34]. The metabolic rate was set to 2.0 met for the concourse (walking at 0.9 m/s) and 1.2 met for the platform (standing, relaxed). Clothing insulation was determined by calculation from the clothing actually worn by each participant, and air velocity input was taken as the average of the recorded wind speeds during questionnaire completion.
This study employed the pythermalcomfort model to calculate SET*. This model incorporates all relevant formulas necessary for SET* computation, and the accuracy of this Python program (Python 3.12, pythermalcomfort 3.8.0) has been validated [51].
4. Result
This section presents the thermal comfort results in detail, using Beijing as the example. The detailed results for Suzhou are presented in Section 5, where the cross-climate differences are discussed.
4.1. Thermal Environment Characteristics
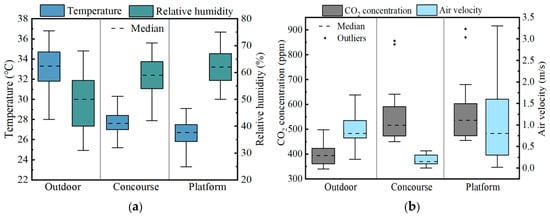
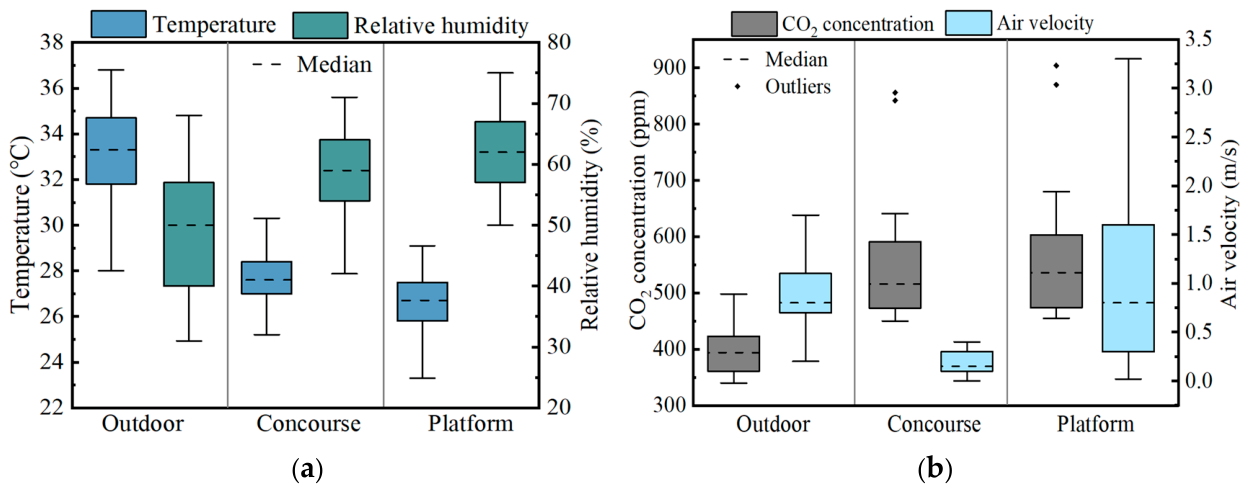
Figure 2a illustrates the distribution of temperature and relative humidity at different measurement sites in the subway station. The data were recorded when participants completed the questionnaire. The measurements were conducted from July to August 2025, between 7:00 and 21:00 each day. The indoor temperature distribution displayed a gradual decline from the entrance toward the interior. The outdoor average temperature was 33.0 °C, whereas the indoor temperature range was 24.6–31.6 °C. Specifically, the mean temperature in the concourse was 27.7 °C, while the platform registered a slightly lower value of 26.9 °C. In contrast, the humidity distribution exhibited an opposite pattern, with the lowest relative humidity observed outdoors. Due to factors such as passenger occupancy and moisture release from the soil, the platform’s average humidity was slightly higher than that of the concourse. Overall, humidity within the station fluctuated significantly, reaching a maximum of 75%, which could negatively affect thermal comfort.
Figure 2.
The distribution of measured environmental parameters in subway stations. (a) Temperature and relative humidity. (b) CO2 concentration and air velocity.
Figure 2b illustrates the notable spatial variations in air velocity. The concourse was spacious and the air velocity was generally low and stable, with an average value of 0.27 m/s. Conversely, air speed on the platform was considerably higher and more unstable, largely driven by the piston effect of passing trains. The average velocity there reached 0.81 m/s, with a peak instantaneous reading of 3.30 m/s. Meanwhile, CO2 concentrations throughout the station were maintained at low levels (below 800 ppm), pointing to effective ventilation that satisfied comfort standards for indoor air quality.
4.2. Statistical Analysis of Subjective Questionnaires
In Beijing, a total of 411 questionnaires were distributed across the concourse and platform within subway stations, of which 410 were valid. Of these valid responses, 217 originated from the platform and 193 from the concourse. The summary of the investigated stations and the questionnaire survey results is presented in Table 2.
Table 2.
Station characteristics and participant distribution.
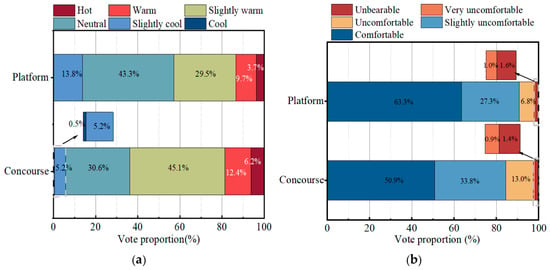
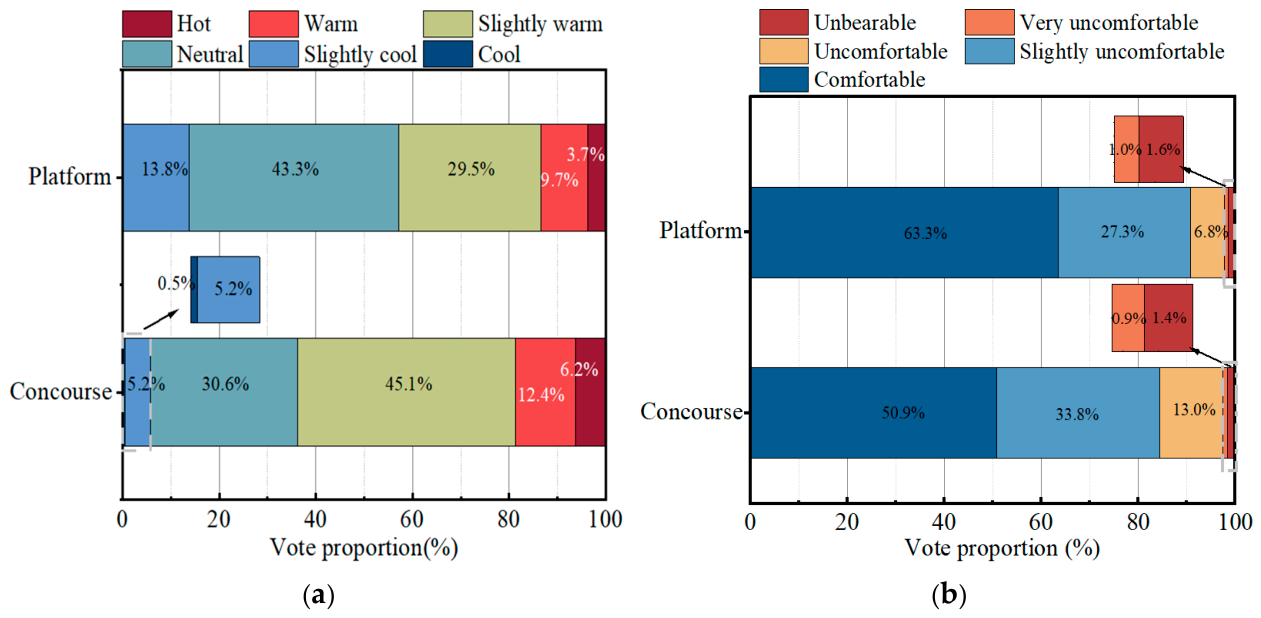
As shown in Figure 3, in terms of thermal sensation vote (TSV), passengers in the concourse generally perceived a warm environment, with the proportion reporting “slightly warm” as high as 45.1%, while only 30.6% voted “neutral”. In contrast, the thermal sensation of platform passengers shifted toward the cooler side, with the “neutral” proportion rising to 43.3% and “slightly cool” increasing to 13.8%. Regarding thermal comfort vote (TCV), the percentage of passengers in a “comfortable” state (TCV = 0) on the platform reached 63.4%, substantially higher than the 50.8% recorded in the concourse. In the concourse, the temperature was generally high, and the relative humidity commonly remained at high levels.
Figure 3.
Results of subjective voting in Beijing subway stations. (a) TSV. (b) TCV.
4.3. Thermal Comfort Analysis Based on SET*
The thermoneutral temperature is defined as the environmental temperature at which occupants feel neither cold nor hot, and it is a basic parameter reflecting thermal sensation needs. Due to individual differences in gender, age, weight, and living habits, thermal sensation votes may differ significantly among passengers even under the same temporal and spatial conditions.
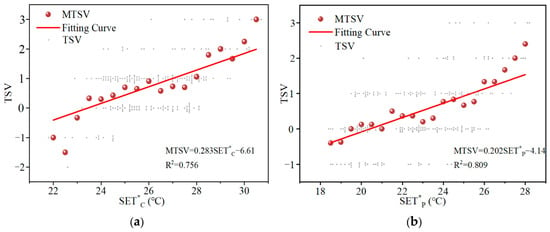
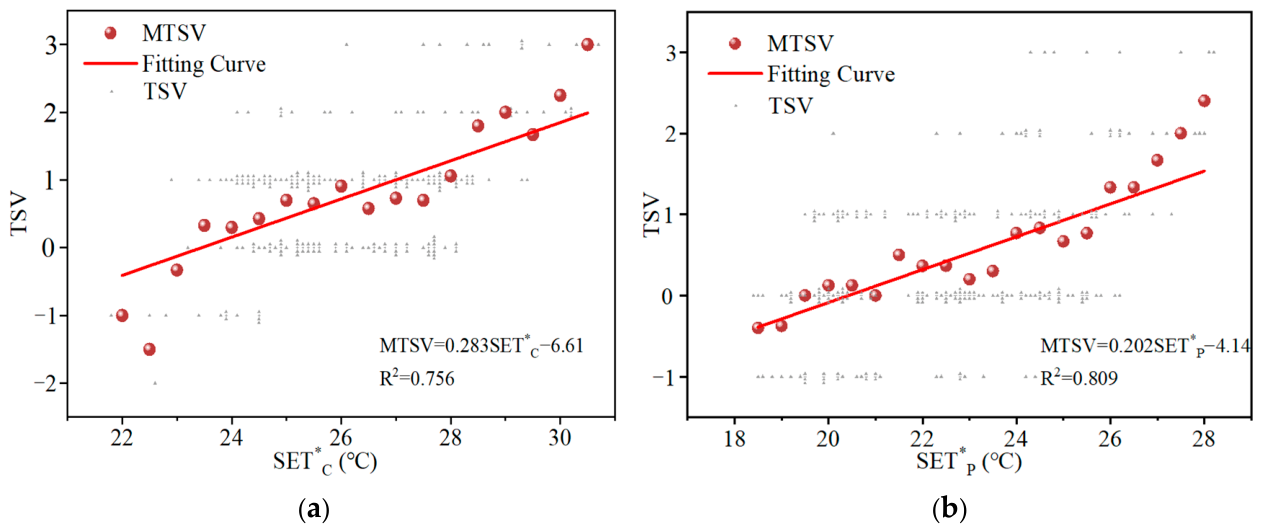
Due to the complex thermal environment inside subway stations, this study introduced the standard effective temperature (SET*) as a comprehensive evaluation index, which can simultaneously reflect air temperature, humidity, air velocity, metabolic rate, and clothing insulation. The thermoneutral SET* was calculated using the bin method. Based on the sample size and the distribution of measured temperatures, the SET* values were divided into several intervals at a step of 0.5 °C. The mean thermal sensation vote (MTSV) for each interval was then obtained by calculating the arithmetic mean of the TSV values of all passengers within that interval, with the interval center SET* as the representative value. On this basis, a linear regression model was established with MTSV as the dependent variable and the interval center SET* as the independent variable. The MTSV–SET* regression results for the concourse and platform are shown in Figure 4. Thermal sensation votes in both the concourse and platform were significantly positively correlated with SET*. The R2 of the two models reached 0.756 and 0.809, respectively, indicating the dominant role of SET* in human thermal sensation. By solving for the SET* value at which MTSV = 0, the thermoneutral SET* was determined to be 23.37 °C in the concourse and 20.43 °C on the platform. The regression equations and thermoneutral SET* values are summarized in Table 3. The thermoneutral SET* values in the two zones differed significantly, with a difference of 2.94 °C. This difference mainly resulted from the different thermal environments of the concourse and platform as well as the thermal adaptation of passengers during the entry process.
Figure 4.
Mean thermal sensation vote against SET* in different station zones. (a) Concourse. (b) Platform.
Table 3.
Thermal neutral SET* calculation for concourse and platform.
Meanwhile, the slopes of the two models exhibited completely different characteristics, directly reflecting the sensitivity of human thermal sensation to changes in SET* under different environments. The slope of the concourse regression model reached 0.283, meaning that for every 1 °C increase in SET*, the mean thermal sensation vote increased sharply by 0.283. In contrast, the slope of the platform model was only 0.202, indicating that concourse passengers were significantly more sensitive to SET* fluctuations. This difference in slopes essentially originated from the differences in dynamic exposure characteristics and physiological metabolic levels between passengers in the two spaces. As a transitional zone, the concourse was characterized by passengers who had just entered the station and were mostly walking, thus showing higher sensitivity to SET*. By comparison, passengers on the platform were mostly standing while waiting, with markedly lower metabolic rates. Moreover, the platform environment experienced greater fluctuations in air velocity caused by trains entering and leaving the station, which made the influence of SET* on thermal sensation more moderate.
To determine the thermal comfort zone, based on the established MTSV–SET* regression equations, an MTSV threshold of ±0.85 was taken as the boundary corresponding to 80% satisfaction according to the PMV–PPD relationship as Equation (4).
PPD = 100 − 95exp(−0.03353PMV4 − 0.2179PMV2)
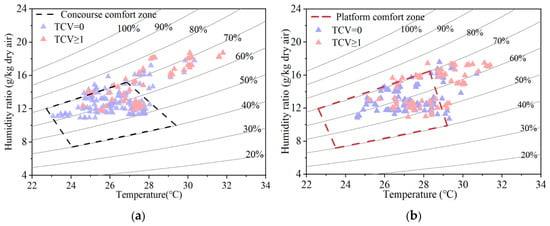
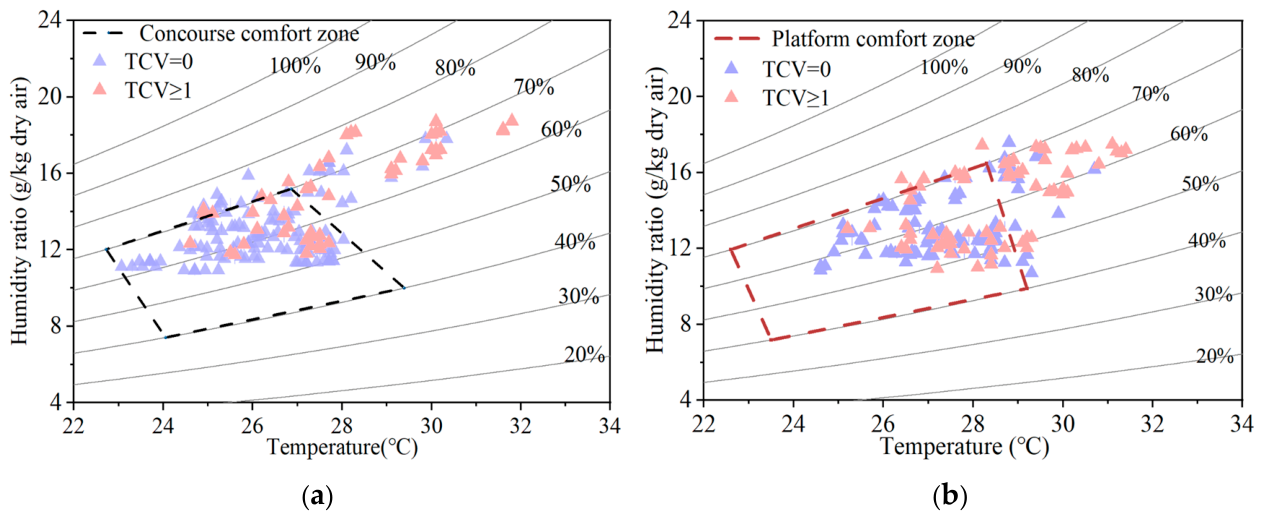
Substituting MTSV = +0.85 and −0.85 into the regression equations for the two zones yielded the 80% acceptable SET* range. For the concourse, the upper limit was 26.38 °C and the lower limit was 20.37 °C. For the platform, the upper limit was 24.62 °C and the lower limit was 16.24 °C. However, the lower boundary for the platform is below the observed minimum SET* of 18.4 °C, indicating that it is an extrapolated estimate beyond the measured data range. As its accuracy cannot be validated by the field measurements, the 80% acceptable range for the platform is taken as 18.40–24.62 °C. Both the upper and lower limits of the acceptable SET* range in the concourse were higher than those on the platform, while the span of the comfort zone in the concourse was narrower than that on the platform. The main reason for this phenomenon is that the concourse has a relatively stable thermal environment. Passengers who have just entered the station are in a state of higher metabolic activity, making their thermal sensation more sensitive to temperature changes. As a result, the comfort zone in the concourse is narrowed and located at higher temperatures. In contrast, the platform environment is more variable, and the combined effects of higher air velocity and lower metabolic rate result in a wider comfort zone located at lower temperature. To visually present the thermal comfort zones of the two areas, the SET* ranges were mapped onto the temperature–humidity coordinate system using the mean environmental parameters at each measurement point. As shown in Figure 5, within the relative humidity range of 40–70%, the thermal comfort zone in the concourse is generally located at higher temperatures, while the platform exhibits a wider temperature range. The figure reveals that the comfortable votes were predominantly distributed in areas with lower temperatures, whereas the uncomfortable votes were distributed in hot and humid regions. On the platform, comfortable votes were more extensively and densely distributed across the entire zone, while discomfort votes were likewise predominantly clustered in hot and humid areas.
Figure 5.
Thermal comfort zone and TCV distribution. (a) Concourse. (b) Platform.
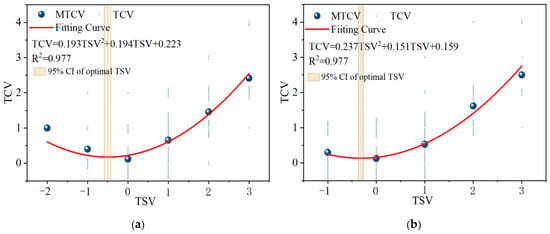
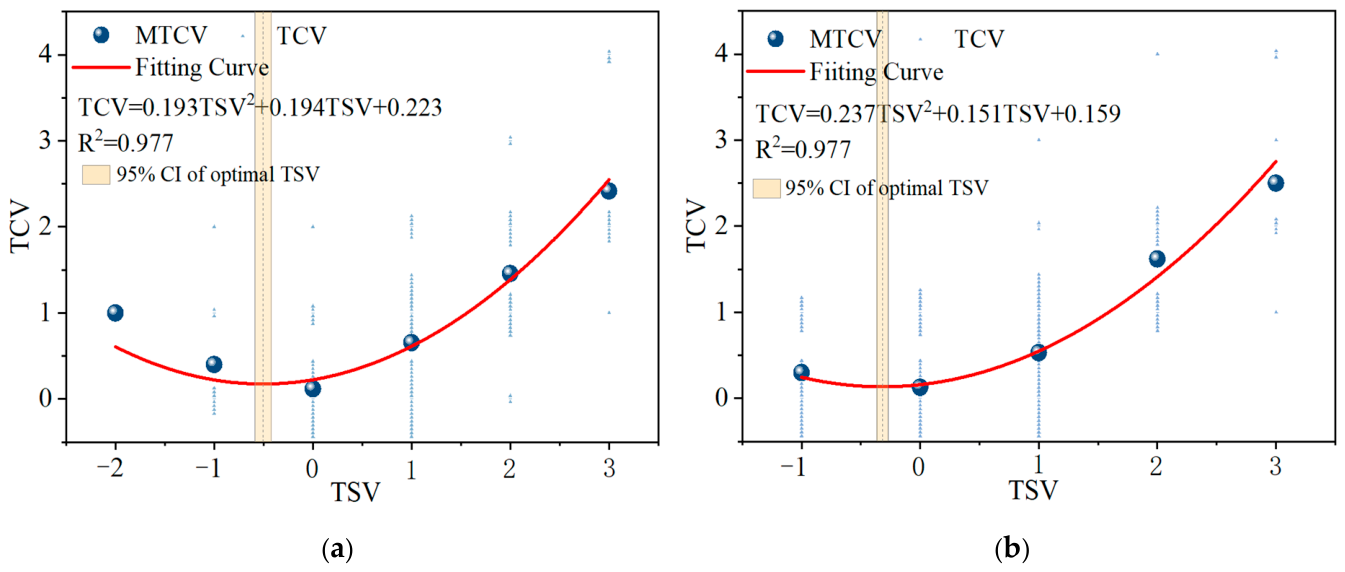
Notably, the neutral temperature is merely the temperature at which the mean thermal sensation vote equals zero, and it is not the temperature at which passengers feel most comfortable. The survey results showed that although approximately 36% of passengers voted “neutral” in thermal sensation, some of them still reported varying degrees of discomfort. Meanwhile, a large number of passengers who voted “slightly cool” (TSV = −1) reported high thermal comfort (TCV = 0). This phenomenon indicates that simple thermal neutrality is not equivalent to optimal thermal comfort. To further analyze the relationship between thermal sensation and thermal comfort, a quadratic polynomial regression was performed between the thermal sensation vote (TSV) levels and the corresponding mean thermal comfort vote (MTCV). A non-linear regression model was established to describe the relationship between subjective discomfort and thermal sensation in the concourse and platform. The relationship between mean thermal sensation and thermal comfort in the concourse and platform is shown in Figure 6.
Figure 6.
Relationship between thermal sensation and thermal comfort. (a) Concourse. (b) Platform.
The results showed that the mean thermal comfort vote and the mean thermal sensation vote exhibited a quadratic relationship in both zones. As the thermal sensation moved from the “cool” side to the “warm” side, the mean discomfort level first decreased, reached a minimum, and then increased again. For the concourse, the minimum MTCV of 0.174 was reached at TSV = −0.503 (95% CI [−0.586, −0.422]), while for the platform, the minimum MTCV of 0.135 was reached at TSV = −0.318 (95% CI [−0.366, −0.270]). The minimum points of both curves were located on the left side of TSV= 0 (slightly cool side), indicating that the most comfortable thermal sensation for passengers in subway stations in summer is not neutral but, rather, a slightly cool state. In addition, even at the optimal thermal sensation corresponding to the minimum points, the mean thermal comfort votes in the concourse and platform still reached 0.174 and 0.135, both of which remained greater than zero. This reflects individual differences and suggests that the average discomfort at the group level cannot be completely eliminated in any environment.
5. Discussion
The thermal sensation of subway passengers is not only constrained by the transient physical microclimate inside the station, but also depends more deeply on their long-term regional climatic thermal adaptation and physiological self-regulation. Individuals who have lived in a specific climate zone for a long time undergo adaptive changes in physiological characteristics and psychological expectations due to climate exposure, thus forming differentiated thermal comfort needs. To examine these cross-climate differences, the field survey data from Suzhou are introduced and compared with the Beijing results presented in Section 4. In Suzhou, a total of 181 valid questionnaires were collected, including 97 from the concourse and 84 from the platform. The surveyed passengers covered a wide range of gender, age, height, and body weight, ensuring the representativeness of the sample. Table 4 presents the subway station characteristics and the distribution of participants in the Suzhou field measurements.
Table 4.
Station characteristics and participant distribution in Suzhou.
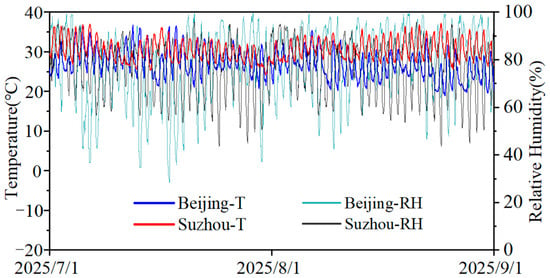
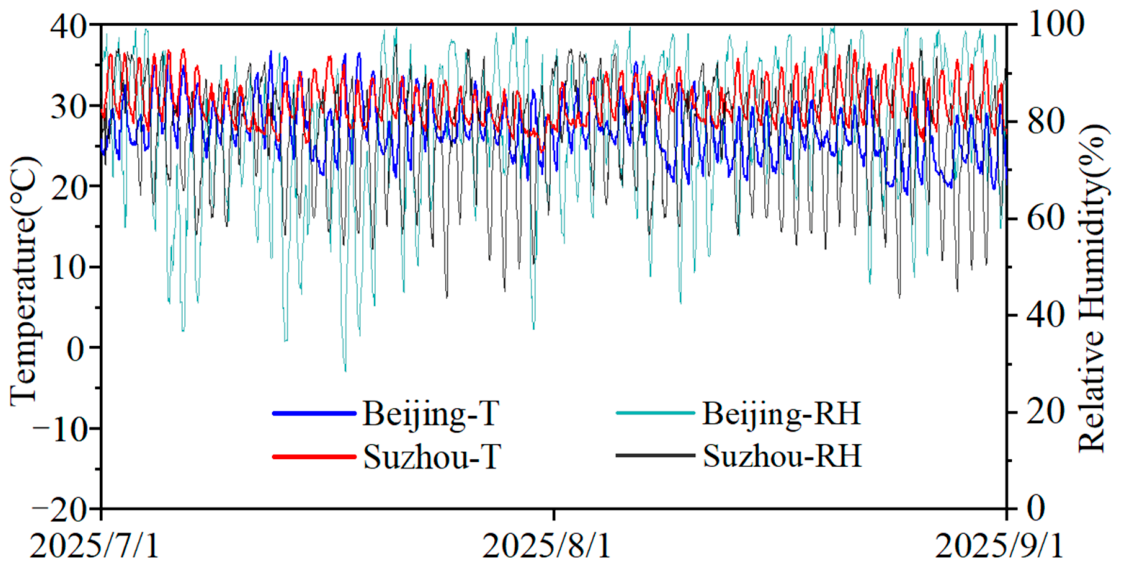
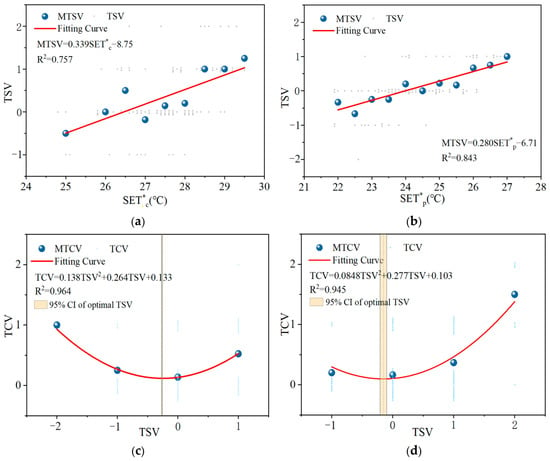
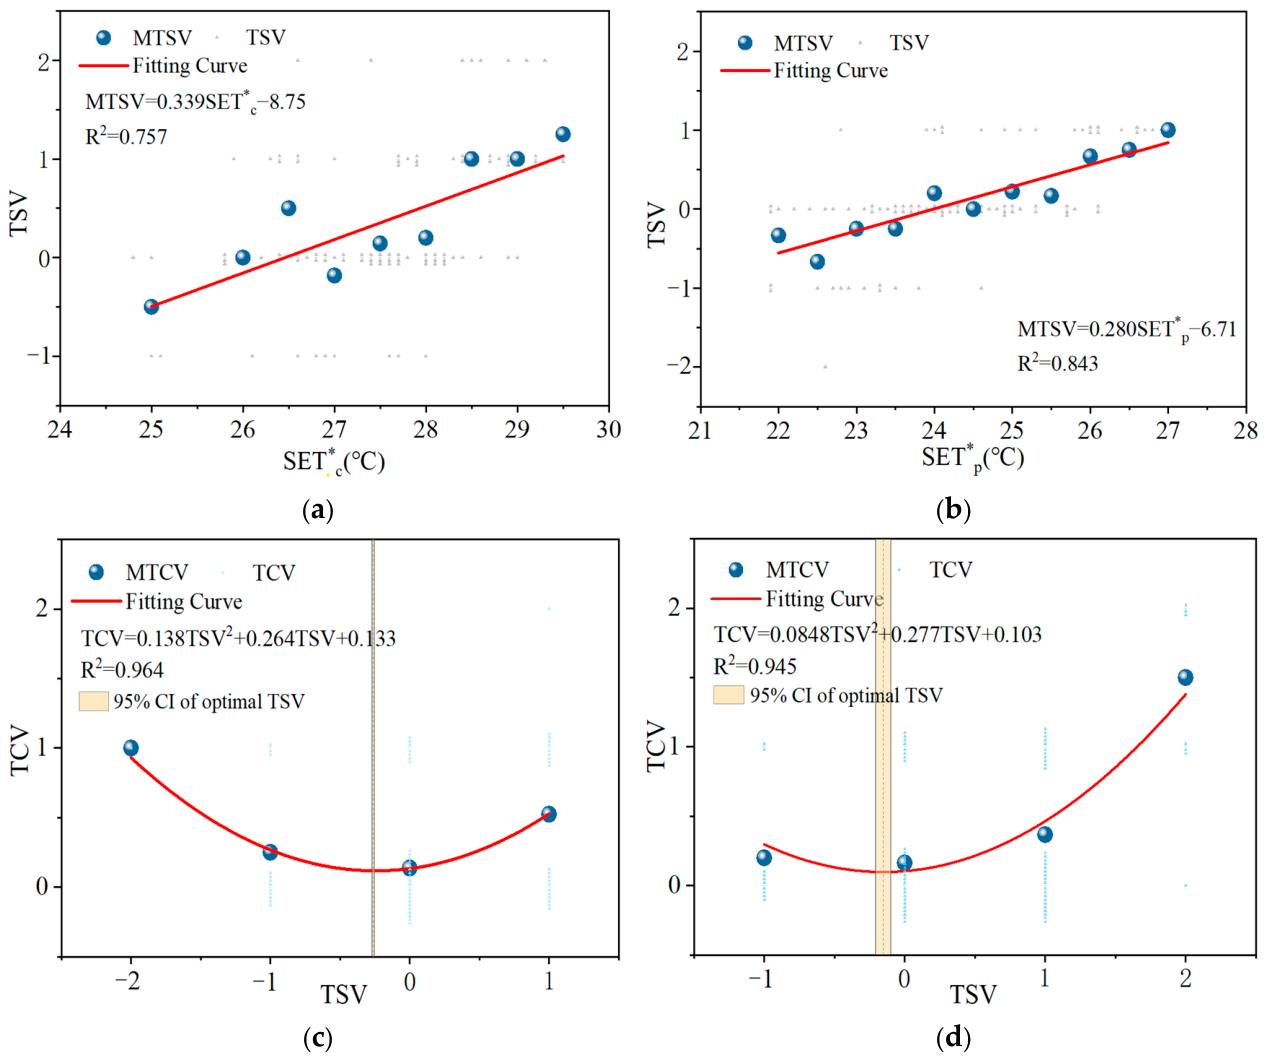
The hourly outdoor air temperatures of the two cities are shown in Figure 7. Suzhou shows higher temperature and a longer duration of hot conditions than Beijing. The measurement point layout, instrument specifications, questionnaire design, and SET* calculation method in Suzhou were consistent with those in Beijing. Table 5 summarizes the thermal comfort parameters for the two cities. The detailed Suzhou results are presented in Figure 8.
Figure 7.
Hourly outdoor air temperature comparison between Beijing and Suzhou.
Table 5.
Comparison of thermal comfort parameters across locations and climate zones.
Figure 8.
Thermal sensation and thermal comfort in Suzhou subway stations. (a) MTSV–SET* in the concourse. (b) MTSV–SET* on the platform. (c) TCV–TSV in the concourse. (d) TCV–TSV on the platform.
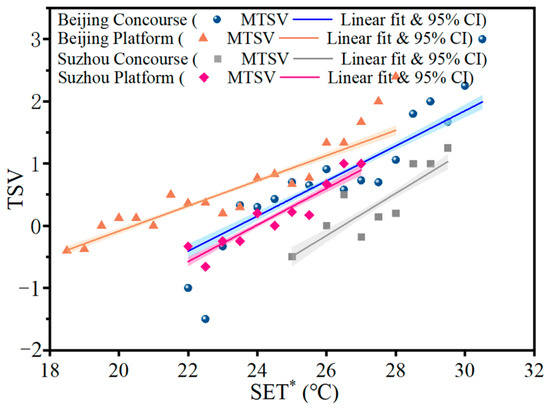
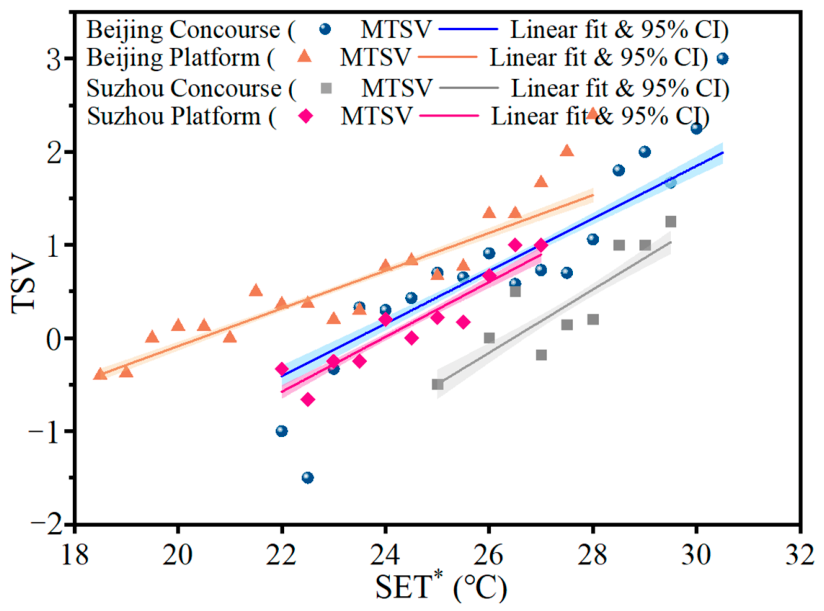
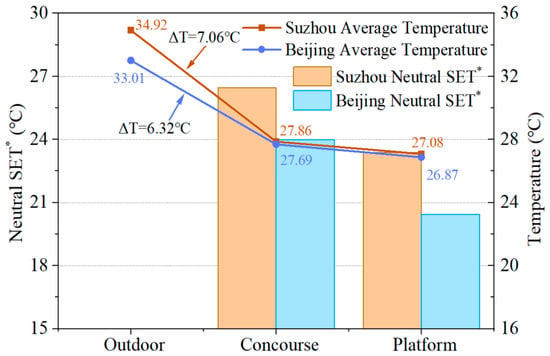
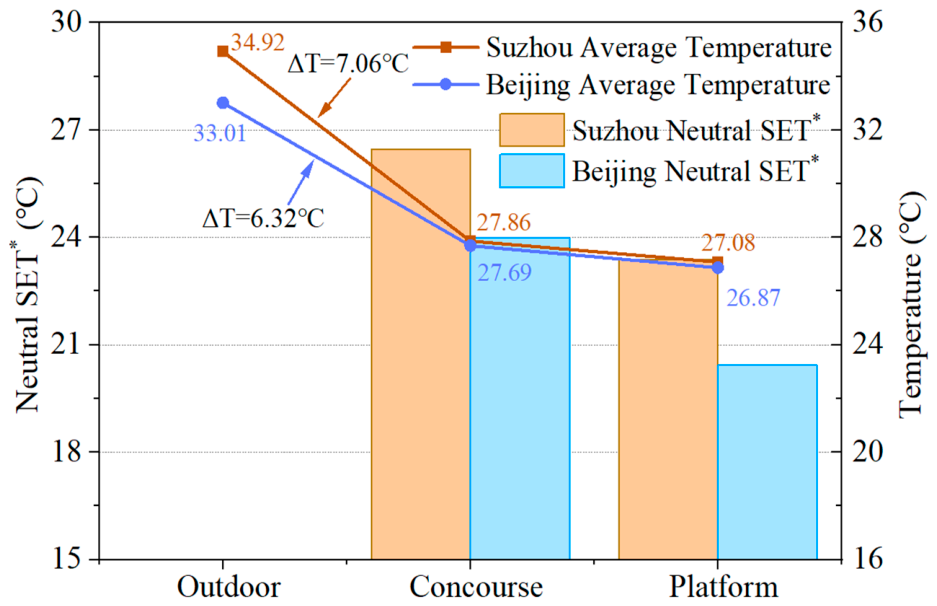
The linear regression relationship between passengers’ thermal sensation vote (TSV) and temperature is shown in Figure 9. Figure 10 shows the comparison of neutral SET* and average temperature between Beijing and Suzhou. There are significant differences in thermal comfort characteristics between the two cities. In terms of thermoneutral SET*, passengers in Suzhou had a significantly higher neutral SET* than those in Beijing in the cold region. The thermoneutral SET* in the Suzhou concourse reached 26.46 °C, which was 3.09 °C higher than that at the same location in Beijing, while the platform value reached 23.99 °C, which was 3.56 °C higher. This cross-regional difference in both physical and subjective perception reflects the reshaping influence of outdoor macroclimatic conditions on passengers’ subjective thermal perception. Suzhou has higher outdoor summer temperatures and a longer duration of high temperatures, and residents are repeatedly exposed to high-temperature and high-humidity environments in daily life. When the neutral state is defined as the subjective temperature point of neither cold nor hot, Suzhou passengers tend to report “neutral” at a higher SET*. Meanwhile, during the process of entering subway stations, passengers in Suzhou experience a greater temperature and humidity drop than those in Beijing. This stronger thermal contrast shock lowers passengers’ temperature expectations for the station interior and psychologically raises the thermoneutral temperature.
Figure 9.
Comparison of TSV linear fits across different station spaces in Beijing and Suzhou.
Figure 10.
Comparison of neutral SET* and average temperature between Beijing and Suzhou.
In terms of thermal sensation sensitivity, the regression slopes of the concourse models (Figure 9) in the two cities were relatively close. The slope was 0.283 for Beijing and 0.339 for Suzhou, an increase of about 19.7%. The 80% acceptable SET* range in the Suzhou concourse was 25.00–28.97 °C, with a span of 3.97 °C, which was narrower than that in Beijing. The entire comfort zone in Suzhou also shifted noticeably toward the warm side. For the platform, the acceptable range in Suzhou was 21.90–27.03 °C, with a span of 5.13 °C, which shifted upward compared with Beijing. Meanwhile, the optimal TSV values in both cities were all located on the slightly cool side. The optimal TSV values were −0.503 and −0.318 for the Beijing concourse and platform, and −0.153 (95% CI [−0.207, −0.101]) and −0.262 (95% CI [−0.269, −0.255]) for Suzhou. Although this indicates that Suzhou passengers also showed a preference for the slightly cool side, the degree was smaller than that in Beijing. The optimal TSV deviated from thermal neutrality toward the slightly cool side, indicating that passengers preferred a slightly cooler environment than neutral and felt most comfortable under such conditions. For subway operators, if the goal is to maximize passenger thermal comfort, the air-conditioning setpoint can be adjusted to slightly below the neutral temperature.
Overall, the thermal comfort characteristics of Suzhou passengers showed a systematic shift compared to Beijing. In the concourse, the higher thermoneutral SET* and the narrower comfort zone together indicate that the thermal comfort characteristics of Suzhou passengers concentrated toward the warm side. On the platform, both the thermoneutral SET* and the thermal comfort zone in Suzhou shifted upward, while the span of the comfort zone narrowed. Based on these differences, the air-conditioning setpoints in the two cities should also be different.
6. Conclusions
This study selected Beijing in the cold climate zone and Suzhou in the hot-summer and cold-winter zone as representative cities. During the high-temperature period in summer, on-site measurements and subjective questionnaire surveys were conducted in the concourse and platform in subway stations. Using the standard effective temperature (SET*) as the core evaluation index, the thermal environment characteristics, thermoneutral temperature, and thermal comfort zones in subway stations were analyzed. Additionally, a cross-climate comparison of passengers’ thermal comfort characteristics was performed. The main conclusions are as follows:
- (1)
- The concourse and platform exhibited markedly different thermal environments. In Beijing, 45% of passengers in the concourse perceived the environment as warm, and the thermal discomfort rate reached 49.2%. On the platform, thermal sensation was more balanced, with 43.3% voting neutral and only 36.6% reporting discomfort. In Suzhou, the discomfort rate was 28.6% and 25%, respectively.
- (2)
- The concourse and platform showed different thermal comfort characteristics, with the thermoneutral SET* consistently higher in Suzhou than in Beijing. In Beijing, the thermoneutral SET* was 23.37 °C in the concourse and 20.43 °C on the platform, while in Suzhou it reached 26.46 °C and 23.99 °C. In addition, concourse passengers responded more intensely to temperature changes than platform passengers.
- (3)
- An 80% acceptable SET* range was calculated based on the questionnaire results. In Beijing, the acceptable range was 20.37–26.38 °C for the concourse and 18.40–24.62 °C for the platform; in Suzhou, the corresponding ranges were 25.00–28.97 °C and 21.90–27.03 °C. In both cities, the optimal thermal sensation deviated from neutrality toward the slightly cool side, with optimal TSV values of −0.503 and −0.318 in Beijing, and −0.153 and −0.262 in Suzhou, indicating a weaker cool preference and higher heat tolerance among Suzhou passengers.
Based on on-site measurement, this study obtained the thermal comfort characteristics and acceptable temperature ranges of passengers in the complex environment of subway stations, and compared the differences between the two climate zones. This shift is consistent with long-term climate adaptation, indicating that climate adaptation is one of the main contributing factors. At the same time, station design, ventilation, air conditioning, and other operational aspects also have some influence on these differences between the two cities. The results provide a foundation for the optimization of thermal environments and the regulation of air-conditioning systems in subway stations. However, this study has limitations that need to be noted: the sample size was limited due to practical difficulties, and only two representative cities from two climate zones were selected, which may limit the generalizability of the findings. Future studies with larger samples are needed to yield more accurate and generalizable conclusions.
Author Contributions
Conceptualization, Y.J.; methodology, Y.J.; software, W.T.; validation, Y.J. and L.Z.; formal analysis, X.Y. and L.Z.; investigation, C.S.; resources, Q.L., S.Y., X.Y. and J.X.; data curation, Q.L., S.Y. and C.S.; writing—original draft, W.T.; writing—review and editing, W.T. and N.Z.; visualization, W.T.; supervision, Y.J., L.Z., N.Z. and J.X.; project administration, Y.J. All authors have read and agreed to the published version of the manuscript.
Funding
This research received no external funding.
Institutional Review Board Statement
The study was conducted in accordance with the Declaration of Helsinki, and approved by the Beijing University of Technology Science and Technology Ethics Committee (protocol code JGXY-202612 and 2 June 2025).
Informed Consent Statement
Informed consent was obtained from all subjects involved in the study.
Data Availability Statement
The data presented in this study are available on request from the corresponding author. The data are not publicly available due to privacy restrictions.
Conflicts of Interest
The authors declare no conflicts of interest.
References
- Mohammadi, A.; Amador-Jimenez, L.; Nasiri, F. A multi-criteria assessment of the passengers’ level of comfort in urban railway rolling stock. Sustain. Cities Soc. 2020, 53, 101892. [Google Scholar] [CrossRef] [Scilit]
- Niu, J.; Zhou, D.; Liang, X.; Liu, T.; Liu, S. Numerical study on the aerodynamic pressure of a metro train running between two adjacent platforms. Tunn. Undergr. Space Technol. 2017, 65, 187–199. [Google Scholar] [CrossRef] [Scilit]
- China Association of Metros. 2024 Annual Statistics and Analysis Report on Urban Rail Transit. Available online: https://www.camet.org.cn/xytj/tjxx/660844283682885.html (accessed on 1 September 2026).
- Guan, B.; Liu, X.; Zhang, T.; Xia, J. Energy consumption of subway stations in China: Data and influencing factors. Sustain. Cities Soc. 2018, 43, 451–461. [Google Scholar] [CrossRef] [Scilit]
- Wang, J.; Yin, Y.; Wei, Z.; Zhai, X. Cooling load analysis based on theory-based models and field tests for VAC system in subway station: A case study. Energy 2025, 314, 134219. [Google Scholar] [CrossRef] [Scilit]
- Ren, Z.; Kim, J.I.; Kim, J. Assessment methodology for dynamic occupancy adaptive HVAC control in subway stations integrating passenger flow simulation into building energy modeling. Energy Build. 2023, 300, 113667. [Google Scholar] [CrossRef] [Scilit]
- Pan, S.; Liu, Y.; Xie, L.; Wang, X.; Yuan, Y.; Jia, X. A thermal comfort field study on subway passengers during air-conditioning season in Beijing. Sustain. Cities Soc. 2020, 61, 102218. [Google Scholar] [CrossRef] [Scilit]
- Yang, B.; Yang, C.; Ni, L.; Wang, Y.; Yao, Y. Field experiment on influence of cold protection technologies on thermal environment of subway station in severe cold region. Build. Environ. 2022, 216, 109055. [Google Scholar] [CrossRef] [Scilit]
- Chen, Z.; Xie, X.; Hu, H.; Zhou, X.; Yang, Y.; Song, W.; Luh, D.B.; Li, X. Field investigation on thermal comfort of metro passengers in hot summer and warm winter zone of China: A case study in Guangzhou. Energy Build. 2024, 320, 114633. [Google Scholar] [CrossRef] [Scilit]
- GB 50157-2013; Code for Design of Metro. China Architecture & Building Press: Beijing, China, 2013.
- Gu, Y.; Zhang, T.; Pan, S.; Meng, X.; Li, G.; Zhao, M.; Wang, C.; Xie, L. Field study of thermal environment and thermal comfort of Changchun Metro. Urban Rail Transit 2019, 32, 25–32. (In Chinese) [Google Scholar] [CrossRef]
- Wang, C.; Li, C.; Xie, L.; Wang, X.; Chang, L.; Wang, X.; Li, H.X.; Liu, Y. Thermal environment and thermal comfort in metro systems: A case study in severe cold region of China. Build. Environ. 2023, 227, 109758. [Google Scholar] [CrossRef] [Scilit]
- Gu, Y.; Ma, Z.; Wang, D.; Huang, Z.; Cui, W.; Qu, C.; Gong, Z.; Tan, Z. Field study on thermal and humidity environment and thermal comfort of metro station in cold regions during autumn and winter: A case study of Xi’an Metro Line 2. Build. Sci. 2023, 39, 70–80. (In Chinese) [Google Scholar] [CrossRef]
- Li, T.; Dong, Z.; Bobylev, N.; Wei, L.; Yuan, H.; Liu, Z.; Yu, L. Assessment of passenger comfort in functional areas of subway station: A multimodal physiological signals approach. Build. Environ. 2026, 295, 114453. [Google Scholar] [CrossRef] [Scilit]
- Huang, K.; Lu, S.; Li, X.; Feng, K.; Chen, W.; Xia, Y. Predicted Mean Vote of subway car environment based on machine learning. Big Data Min. Anal. 2023, 6, 92–105. [Google Scholar] [CrossRef] [Scilit]
- Hu, X.; Li, N.; Gu, J.; He, Y.; Yongga, A. Lighting and thermal factors on human comfort, work performance, and sick building syndrome in the underground building environment. J. Build. Eng. 2023, 79, 107878. [Google Scholar] [CrossRef] [Scilit]
- Fang, Z.; Guo, T.; Li, F.; Feng, X.; Zhai, Z. Built environment and thermal comfort in metro systems: A case study in South China. Tunn. Undergr. Space Technol. 2025, 162, 106621. [Google Scholar] [CrossRef] [Scilit]
- ISO 7730:2005; Ergonomics of the Thermal Environment—Analytical Determination and Interpretation of Thermal Comfort Using Calculation of the PMV and PPD Indices and Local Thermal Comfort Criteria. International Organization for Standardization: Geneva, Switzerland, 2005.
- Han, J.; Kwon, S.-B.; Chun, C. Indoor environment and passengers’ comfort in subway stations in Seoul. Build. Environ. 2016, 104, 221–231. [Google Scholar] [CrossRef] [Scilit]
- Zhang, Y.; Zhang, L. Research on thermal comfort and energy saving strategies of ventilation and air-conditioning system in underground subway station. Railw. Stand. Des. 2019, 63, 178–183. (In Chinese) [Google Scholar] [CrossRef]
- Li, X.; Shi, W.; Liu, Y.; Zhang, N. Optimization strategy for thermal comfort in railway stations above ground level in Beijing. Buildings 2024, 14, 2843. [Google Scholar] [CrossRef] [Scilit]
- Liu, S.; Wu, W.; Sun, X.; Tian, H.; Li, J.; Zhou, R.; Dembele, B.D.; Shen, X. Investigation of temperature and humidity impact on thermal comfort in deep underground tunnel during construction in hot climate: A case study in an underground hydropower station. Tunn. Undergr. Space Technol. 2025, 162, 106669. [Google Scholar] [CrossRef] [Scilit]
- Wang, J.; Wang, Y.; Dong, Q.; Yao, W.; Sun, L.; Zhao, H.; Fei, F. Short-term thermal perception and evaluation model under temperature step changes of building transition spaces. Build. Environ. 2025, 276, 112850. [Google Scholar] [CrossRef] [Scilit]
- Assimakopoulos, N.M.; Katavoutas, G. Thermal comfort conditions at the platforms of the Athens Metro. Procedia Eng. 2017, 180, 925–931. [Google Scholar] [CrossRef] [Scilit]
- Yang, B.; Yang, C.; Ni, L.; Wang, Y.; Yao, Y. Investigation on thermal environment of subway stations in severe cold region of China: A case study in Harbin. Build. Environ. 2022, 212, 108761. [Google Scholar] [CrossRef] [Scilit]
- Chen, X.; Zhang, C. Thermal environment and thermal comfort assessment of elevated subway stations in winter: Taking Wuhan as an example. J. Bee 2024, 52, 142–149. (In Chinese) [Google Scholar] [CrossRef]
- Sinha, K.; Rajasekar, E. Thermal comfort evaluation of an underground metro station in New Delhi using agent-based modelling. Build. Environ. 2020, 177, 106924. [Google Scholar] [CrossRef] [Scilit]
- Li, Q.; Feng, J.; Li, C. Research on thermal comfort and energy consumption of strongly and weakly cooled subway carriages with personnel density. Shanghai Energy Sav. 2024, 807–812. (In Chinese) [Google Scholar] [CrossRef]
- Yang, Y.; Yu, J.; Zhang, D.; Tang, H.; Jiang, W.; Han, L.; Li, J.; Lin, B.; Dong, Y. Spatiotemporal variations in indoor thermal environments and dynamic comfort of passengers in airport terminals during winter. Build. Environ. 2026, 292, 114268. [Google Scholar] [CrossRef] [Scilit]
- Kotopouleas, A.; Nikolopoulou, M. Evaluation of comfort conditions in airport terminal buildings. Build. Environ. 2018, 130, 162–178. [Google Scholar] [CrossRef] [Scilit]
- Zhu, P.; Wang, C.; Tang, X.; Song, H.; Li, X. Research on dynamic thermal comfort evaluation of passengers in underground railway station. Heat. Vent. Air Cond. 2016, 46, 101–104+40. (In Chinese) [Google Scholar]
- Wu, L.; Xia, H.; Wang, X.; Dong, Q.; Lin, C.; Liu, X.; Liang, R. Indoor air quality and passenger thermal comfort in Beijing metro transfer stations. Transp. Res. Part D Transp. Environ. 2020, 78, 102217. [Google Scholar] [CrossRef] [Scilit]
- Cardoso, V.E.M.; Ramos, N.M.M.; Almeida, R.M.S.F.; Barreira, E.; Martins, J.P.; Simões, M.L.; Sanhudo, L. A discussion about thermal comfort evaluation in a bus terminal. Energy Build. 2018, 168, 86–96. [Google Scholar] [CrossRef] [Scilit]
- ASHRAE Standard 55-2020; Thermal Environmental Conditions for Human Occupancy. American Society of Heating, Refrigerating and Air-Conditioning Engineers: Atlanta, GA, USA, 2020.
- EN 15251:2007; Indoor Environmental Input Parameters for Design and Assessment of Energy Performance of Buildings Addressing Indoor Air Quality, Thermal Environment, Lighting and Acoustics. European Committee for Standardization: Brussels, Belgium, 2007.
- Zhang, S.; Lin, Z. Effective Moisture Temperature: Ventilation performance index accounting for effects of air temperature and relative humidity on thermal comfort. Build. Environ. 2023, 243, 110625. [Google Scholar] [CrossRef] [Scilit]
- Zhang, L.; Cao, M.; Li, N.; Luo, L.; Chen, Y.; Li, Z. Applying the RWI/HDR to the thermal comfort of passengers at elevated stations. Build. Environ. 2025, 277, 112807. [Google Scholar] [CrossRef] [Scilit]
- Ding, Y.; Hou, Y. Analysis of indoor environment state characteristics of urban rail transit stations based on actual measurements in Chongqing, China. Energy Build. 2022, 277, 112544. [Google Scholar] [CrossRef] [Scilit]
- Si, X.; Zhang, J.; An, J.; Ma, M.; Du, C.; Zhang, X.; Che, L. Development of an age-sensitive SET* index and predictive thermal sensation model for shopping malls in severe cold regions. Build. Environ. 2025, 285, 113621. [Google Scholar] [CrossRef] [Scilit]
- Zheng, Z.; Zhang, Y.; Mao, Y.; Yang, Y.; Fu, C.; Fang, Z. Analysis of SET* and PMV to evaluate thermal comfort in prefab construction site offices: Case study in South China. Case Stud. Therm. Eng. 2021, 26, 101137. [Google Scholar] [CrossRef] [Scilit]
- Zhang, C.; Wang, M.; He, Y.; Jia, Y.; Wang, Z.; Qin, Y.; Xu, S. Multi-objective optimization of daylighting performance and thermal comfort in elevated subway stations: Integrating field calibration and data-driven analysis. Energy Build. 2026, 369, 117928. [Google Scholar] [CrossRef] [Scilit]
- Cheung, T.; Mihara, K.; Hasama, T. Semi-outdoor workspace in the tropics: Exploring thermal comfort through field measurements and surveys. Indoor Environ. 2025, 2, 100136. [Google Scholar] [CrossRef] [Scilit]
- Nazarian, N.; Fan, J.; Sin, T.; Norford, L.; Kleissl, J. Predicting outdoor thermal comfort in urban environments: A 3D numerical model for standard effective temperature. Urban Clim. 2017, 20, 251–267. [Google Scholar] [CrossRef] [Scilit]
- Xiao, L.; Qin, L.-L.; Wu, S.-Y. Effect of PV-Trombe wall in the multi-storey building on standard effective temperature (SET)-based indoor thermal comfort. Energy 2023, 263, 125702. [Google Scholar] [CrossRef] [Scilit]
- ISO 7726:1998; Ergonomics of the Thermal Environment—Instruments for Measuring Physical Quantities. International Organization for Standardization: Geneva, Switzerland, 1998.
- Jia, X.; Huang, Y.; Cao, B.; Zhu, Y.; Wang, C. Field investigation on thermal comfort of passengers in an airport terminal in the severe cold zone of China. Build. Environ. 2021, 189, 107514. [Google Scholar] [CrossRef] [Scilit]
- Zhang, N.; Cao, B.; Wang, Z.; Zhu, Y.; Lin, B. A comparison of winter indoor thermal environment and thermal comfort between regions in Europe, North America, and Asia. Build. Environ. 2017, 117, 208–217. [Google Scholar] [CrossRef] [Scilit]
- Yang, Z.; Dong, X.; Xiao, H.; Sun, H.; Wang, B.; Shi, W.; Li, X. Investigation of thermal comfort of room air conditioner during heating season. Build. Environ. 2022, 207, 108544. [Google Scholar] [CrossRef] [Scilit]
- Katavoutas, G.; Assimakopoulos, M.N.; Asimakopoulos, D.N. On the determination of the thermal comfort conditions of a metropolitan city underground railway. Sci. Total Environ. 2016, 566–567, 877–887. [Google Scholar] [CrossRef] [Scilit] [PubMed]
- Liu, M.; Gao, N.; Wang, X.; Chang, Y.; Zhao, H.; Zhang, Y.; Wei, X.; Yang, B. Comfort-constrained zonal temperature control for subway platforms under train-induced piston airflow. Build. Environ. 2026, 304, 115118. [Google Scholar] [CrossRef] [Scilit]
- Tartarini, F.; Schiavon, S. pythermalcomfort: A Python package for thermal comfort research. SoftwareX 2020, 12, 100578. [Google Scholar] [CrossRef] [Scilit]

Disclaimer/Publisher’s Note: The statements, opinions and data contained in all publications are solely those of the individual author(s) and contributor(s) and not of MDPI and/or the editor(s). MDPI and/or the editor(s) disclaim responsibility for any injury to people or property resulting from any ideas, methods, instructions or products referred to in the content. |
© 2026 by the authors. Licensee MDPI, Basel, Switzerland. This article is an open access article distributed under the terms and conditions of the Creative Commons Attribution (CC BY) license.