


Abstract
Multi-layer composite confinement structures (MLCCSs) are critical for containing accidental internal explosions, yet conventional design methods cannot capture their three-layer load-redistribution mechanism. Based on a validated fluid–structure interaction (FSI) model, this study investigates four key parameters (the foam-concrete yield strength, interlayer thickness, inner-layer reinforcement ratio, and inner-layer thickness) under 3 and 5 kg TNT charges and develops a simplified design method for MLCCSs with a foamed-concrete interlayer under internal blast. The foam yield strength is found to be the most critical parameter controlling the Mode I/II transition: increasing it reduces the inner-layer displacement but increases the risk of premature outer-layer yielding, challenging the conventional “stronger-is-better” design philosophy and establishing both upper and lower bounds for the foam yield strength. The method is derived from a rigid–plastic inner-layer model and the load-controllability mechanism of the foam interlayer, yielding closed-form expressions for the inner-layer maximum displacement, the minimum required interlayer thickness, and the outer-layer peak hoop strain. The inner-layer maximum displacement is quantitatively validated, with a mean absolute error of 9.50%, while the three remaining outputs are checked for consistency with the numerical results; because the Mode I/II threshold is calibrated from the same numerical dataset, this consistency check is an internal self-consistency test rather than an independent validation of the strain prediction. A step-by-step design procedure incorporating the Mode I/II criterion is proposed and demonstrated on a prospective design example whose configuration is not among the calibration cases. The study provides a rapid screening tool for the preliminary design of MLCCSs.
1. Introduction
Reinforced concrete (RC) containment structures are widely adopted in hazardous material storage, ammunition depots, and industrial facilities to confine accidental internal explosions [1,2,3,4]. Conventional single-layer RC walls, however, are prone to severe spalling, cracking, or even perforation under intense internal blast loads, compromising airtightness and inducing secondary hazards [1,2]. To mitigate this, multi-layer composite confinement structures (MLCCSs)—typically comprising an RC inner layer, an energy-absorbing interlayer (e.g., foamed concrete or aluminum foam), and an RC outer layer—have been proposed, in which the outer layer can be maintained elastic while the inner layer undergoes controlled plastic deformation, thereby preserving overall integrity and airtightness [5]. The energy-absorbing interlayer is the key component that enables this dual-mode behavior, and its material selection has attracted extensive research attention.
Cellular materials, including aluminum foam [6,7,8], foamed concrete [9,10,11], and polyurethane foam [12,13], have been extensively studied as energy-absorbing interlayers owing to their low density and prolonged yield plateau. For aluminum-foam-cored sandwiches, core energy absorption generally scales with density and thickness [6,7,8], and foam interlayers notably enhance the blast resistance of steel–concrete composite walls [8]. Related studies on foam- or vermiculite-filled double-wall containers [14,15] and XPS-foam-cored aluminum-skin sandwiches under shock-tube blast [16] further confirm the effectiveness of cellular materials in mitigating blast effects. In the concrete-based direction, Fang et al. [10,11] proposed the “load-controllability” philosophy for composite protective structures, whereby the peak load transmitted to the primary RC member can be capped at the foam’s yield stress by tailoring the foamed concrete strength and thickness. Yang et al. [17] derived a minimum-thickness formula for foamed-concrete distribution layers based on one-dimensional wave propagation, and Shi et al. [18] developed a plastic–damage constitutive model for foamed concrete under high-pressure blast, later applied to gradient-foam composite protective structures [19]. Graded-core optimization has also been explored for sandwich panels, with core density gradient and plateau-stress ratio shown to noticeably affect the back-face response [20,21]. These studies consistently indicate that interlayer parameters exert a discernible influence on the energy absorption and blast resistance of sandwich/composite systems [22,23,24].
Internal blast loads differ fundamentally from free-field scenarios due to confinement-induced pressure build-up and multiple wave reflections, which intensify structural damage [25,26,27]. Full-scale internal-blast tests on RC single-room structures have revealed five damage-aggravating modes (Model I to Model V), which were quantitatively classified using a dimensionless weighted parameter [28]. Liu et al. [28] conducted full-scale internal-blast tests on an RC single room combined with extended numerical simulations, providing a reference for damage assessment of shear-wall-type rooms. Bai et al. [29] performed reduced-scale internal-blast tests on an RC frame–masonry infill model combined with numerical simulation, and derived an empirical formula for the deflection response of plate components. On the RC box-type and concrete–steel composite side, Guo et al. [25] analyzed the internal-blast load characteristics and dynamic behavior of RC box-type structures, and Cui et al. [2] examined the deformation and failure of concrete–steel tubular structures under internal explosion, both indicating that local damage at the inner face is a key concern. Despite these advances, investigations on multi-layer composite confinement structures under internal blast—where the presence of an energy-absorbing interlayer fundamentally alters the load-transmission path—remain scarce, and the dynamic response characteristics of such systems are still not fully elucidated.
On the design-methodology side, simplified blast-resistant design is routinely performed via single-degree-of-freedom (SDOF) approaches or equivalent-static-load procedures, as codified in UFC 3-340-02 [30] and its predecessor manuals [31]. These methods are calibrated for single-layer RC members under small-to-moderate deformation, where the load–displacement relation is idealized as elastic–perfectly plastic and the blast impulse is directly applied to the bearing member. Extensions of the SDOF framework to RC beam–columns and to sandwich-type configurations have also been reported [32]. For MLCCSs under internal blast, however, the configuration is fundamentally different: the inner RC layer undergoes large plastic deformation while the foamed concrete interlayer exhibits a plateau-then-hardening behavior, reshaping the impulse transmitted to the outer layer which is designed to remain elastic. The three-layer load path—inner plasticity → interlayer compaction → outer elastic—cannot be captured by directly applying UFC 3-340-02 SDOF formulae [33,34,35].
In our recent work, experimental tests on MLCCSs with two types of energy-absorbing interlayers (foamed concrete and sandy soil) under internal blast were reported [5], revealing the macroscopic differences in damage evolution and energy distribution between the two materials. The foamed-concrete specimens exhibited a more stable progressive deformation pattern, with the outer layer remaining elastic under moderate charges. A follow-up numerical study [36] established a validated fluid–structure interaction (FSI) model using LS-DYNA, calibrated against the experimental data [5]. That study identified two distinct failure modes: Mode I (inner-layer-dominated, with the outer layer remaining elastic) and Mode II (outer-layer yielding before the inner layer reaches its deformation limit). However, that study did not conduct a systematic parametric sweep, nor did it propose a design-oriented simplified method—both of which are addressed in the present paper.
The above review reveals two interrelated gaps. First, existing studies on energy-absorbing interlayers and sandwich/composite structures under blast have predominantly focused on planar configurations or external blast scenarios, with parametric analyses calibrated accordingly [37,38]. Systematic parametric investigations on cylindrical reinforced-concrete–foam–reinforced-concrete (RC-foam-RC) confinement structures under internal blast—where the geometry, loading, and failure mechanisms are fundamentally different—are lacking. Second, although simplified design methods (e.g., SDOF approaches) are well established for conventional RC members, no dedicated design method exists for MLCCSs that accounts for the three-layer load redistribution and the Mode I/II failure criterion to guarantee the desired Mode I and enable parameter optimization.
This paper aims to fill this gap by developing a simplified design method for MLCCSs under internal blast, built upon systematic parametric analysis. To the authors’ knowledge, this is the first dedicated simplified formula for RC-foam-RC cylindrical confinement under internal blast with the Mode I/II criterion. The novelties are threefold: (i) a systematic parametric analysis revealing the sensitivity ranking of four key parameters (foam yield strength, interlayer thickness, inner-layer reinforcement ratio, and inner-layer thickness) and the conditions triggering Mode II failure; (ii) a closed-form simplified method based on a rigid–plastic inner layer, load-controllability foam model, and elastic outer shell, yielding explicit expressions for the inner-layer maximum displacement, minimum required interlayer thickness, and outer-layer peak hoop strain; and (iii) the identification of a bounded, cost-optimal interlayer strength together with the minimum thickness it requires, which challenges the conventional “stronger-is-better” design philosophy, demonstrating that excessive foam strength can paradoxically induce premature outer-layer yielding.
It is important to clarify the distinction between the present work and the authors’ preceding studies [5,36]. While [5] provided experimental observations of MLCCSs damage evolution and [36] established a validated FSI model and identified Mode I/II failure, neither study offered a predictive design tool. The present work transcends these descriptive and numerical frameworks by deriving a closed-form, design-oriented simplified method. This method enables engineers to rapidly predict the inner-layer displacement, determine the minimum required interlayer thickness, and verify the Mode I criterion without performing computationally expensive FSI simulations. Hence, the novelty lies in translating previously understood physical phenomena into a practical, quantitative design methodology.
The remainder of this paper is organized as follows. Section 2 briefly recalls the validated numerical model and presents the parametric analysis results. Section 3 derives the simplified design method, assesses it against numerical simulations with attention to the strength of the evidence that each output can support, and demonstrates it on a prospective design example. Section 4 discusses the applicability, limitations, and engineering implications of the proposed method. Section 5 concludes the paper.
2. Parametric Analysis
2.1. Numerical Model Overview
The fluid–structure interaction (FSI) numerical model employed in this study was established and rigorously validated in our companion paper [36]. That work detailed the model geometry, material constitutive laws, mesh convergence study, and benchmark validation against the internal-blast test on the MLCCS prototype with a foamed-concrete interlayer [5]. For completeness and self-contained reading, a condensed summary of the model is given below, and representative validation results are presented separately in Appendix A; the full validation matrix and the mesh-convergence study remain in [36].
The computation uses LS-DYNA explicit dynamics with a 1/8 symmetry model of the cylindrical MLCCS (inner radius Ri = 0.5 m, total length L = 5 m, inner and outer RC layer thicknesses hi = ho = 175 mm, and interlayer thickness hf = 150 mm at the baseline). The explosive charge is placed at the geometric center; TNT (trinitrotoluene) is modeled with the JWL (Jones–Wilkins–Lee) equation of state (EOS) (parameters as given in [30]), and the surrounding air domain uses a linear polynomial EOS. The FSI coupling is realized through the CONSTRAINED_LAGRANGE_IN_SOLID algorithm, with an Eulerian multi-material formulation for air and explosive and a Lagrangian formulation for the RC layers and foam interlayer. Radial mesh size is 5 mm near the blast center, with progressive coarsening along the axis (200 axial elements in total), as verified for both shock propagation and structural response accuracy [36].
Material models are: RC layers use MAT_072R3 (*MAT_CONCRETE_DAMAGE_REL3) with strain-rate enhancement per Malvar–Ross [39] and a reinforcement ratio of 1% (baseline) introduced via the built-in rebar option; the foamed-concrete interlayer uses *MAT_CRUSHABLE_FOAM with the yield-stress–volumetric-strain relation as detailed in [36]; TNT uses *MAT_HIGH_EXPLOSIVE_BURN + JWL; air uses *MAT_NULL + linear polynomial. Boundary conditions: the RC layers and interlayer are connected by automatic surface-to-surface contact, while the end plates share nodes with the RC layers.
Table 1 summarizes the key modeling features. The model predicts the inner-wall reflected pressure, interlayer contact pressures, and the inner/outer radial displacements within 16.4% of the test data for 0.8 kg TNT, with an average absolute error of approximately 9.3% across five charge masses (0.15–0.80 kg) [36], and reproduces the Mode I/II transition observed in the companion experiment [5,36]. The hoop strain at four measurement points agrees within 11%, and the interlayer contact pressures are captured with errors ranging from −24.5% to 9.6% [36]. These quantitative agreements confirm that the numerical framework provides a reliable basis for the subsequent parametric study and simplified design method.
Table 1.
Summary of numerical model settings (detailed in [36]).
Representative graphical validation evidence for the numerical framework is collected in Appendix A (Figure A1), so that the numerical basis of the present study can be assessed without recourse to the companion paper.
With the model thus recalled, the parametric study in the following sections varies four independent parameters—foam-concrete yield strength σp, interlayer thickness hf, inner-layer reinforcement ratio φ, and inner-layer thickness hi—under 3 kg and 5 kg TNT, to quantify their influence on the Mode I/II transition and to provide the empirical basis for the simplified design method in Section 3.
2.2. Effect of Foam-Concrete Yield Strength
To examine the influence of the energy-absorbing interlayer strength on the structural response, four values of foam-concrete yield strength were considered: 1.0, 1.5, 2.0, and 2.5 MPa. The baseline value of 1.0 MPa corresponds to the foamed concrete tested in the companion experiment [5]. The upper bound of 2.5 MPa represents a practical upper limit for structural-grade foamed concrete [17,40], while the intermediate values (1.5 and 2.0 MPa) allow interpolation of the trend. The corresponding density and elastic modulus were assigned according to the experimentally characterized relations [17,40,41], as listed in Table 2. All other geometric and material parameters remained at the baseline values (Section 2.1). Two charge masses, W = 3 kg and 5 kg TNT, were simulated for each value, covering both the small-charge regime where the inner-layer self-resistance dominates and the large-charge regime where the interlayer force becomes decisive.
Table 2.
Foam-concrete material parameters for different yield strengths.
2.2.1. Effect of Foam-Concrete Yield Strength on Radial Displacement
Figure 1 presents the time histories of the inner-layer radial displacement at the blast-center cross-section for different values under 3 kg and 5 kg TNT. For both charge masses, the peak inner-layer displacement decreases with increasing σp, and the time to reach the peak is shortened. However, the reduction is marginal under 3 kg TNT (the peak at σp = 2.5 MPa is 94.4% of that at σp = 1.0 MPa), whereas it becomes substantial under 5 kg TNT (71.6%). This trend reflects the shift in the governing resistance mechanism, which is closely related to the load-bearing mode of the RC-foam-RC composite structure. After the inner layer acquires an initial velocity from the blast impulse, its outward motion is resisted by two forces: the self-resistance of the inner RC layer and the reaction force from the foam interlayer. The latter is directly proportional to the foam yield strength σp. When the charge mass is small, the self-resistance of the inner layer plays a dominant role in limiting the radial expansion, and the contribution of the foam reaction force is relatively minor. As the charge mass increases, the self-resistance of the inner layer becomes less effective in restraining the deformation, while the foam reaction force accounts for an increasing proportion of the total resistance. Consequently, the inner-layer displacement becomes more sensitive to the foam yield strength under larger charges.
Figure 1.
Time-history curves of the structural inner-layer displacement for different energy-absorbing materials: (a) under 3 kg TNT; (b) under 5 kg TNT.
For σp = 1.0 MPa under 5 kg TNT, the peak inner-layer displacement reaches 24.78 mm, at which point the hoop strain of the innermost reinforcing bar exceeds 5%—the commonly accepted ultimate hoop strain for cylindrical RC structures under internal blast [36]. At this moment, the outer layer remains elastic, representing the desired Mode I failure (inner-layer collapse before outer-layer yielding).
Figure 2 shows the corresponding outer-layer displacement time histories. In contrast to the inner layer, the outer-layer peak displacement increases with σp. Under 3 kg TNT, the peak at σp = 2.5 MPa is 1.33 times that at σp = 1.0 MPa; under 5 kg TNT, this factor rises to 3.71. More importantly, for σp = 2.5 MPa under 5 kg TNT, the outer layer develops effective plastic strain before the inner layer reaches its deformation limit, i.e., the structure transitions to Mode II failure (premature outer-layer yielding). Thus, while a stronger interlayer reduces inner-layer deformation, it may inadvertently cause loss of airtightness by inducing premature plastic deformation in the outer layer.
Figure 2.
Time-history curves of the structural outer-layer displacement for different energy-absorbing materials: (a) under 3 kg TNT; (b) under 5 kg TNT.
2.2.2. Effect of Foam-Concrete Yield Strength on Interlayer Contact Pressure
Table 3 and Table 4 list the peak contact pressures at the inner interface (between the inner RC layer and the foam interlayer) and the outer interface (between the foam interlayer and the outer RC layer), respectively, for all combinations of σp and charge mass.
Table 3.
Peak contact pressure at the inner interface (MPa).
Table 4.
Peak contact pressure at the outer interface (MPa).
Before the foam enters the hardening stage, the contact pressures at both interfaces are approximately equal to the foam yield strength σp, confirming the “load-controllability” concept [10,11]. Higher σp leads to earlier attainment of the peak pressure but does not significantly alter the total pressure duration. The transmitted pressure to the outer layer increases almost linearly with σp, which explains the sharp rise in outer-layer displacement observed in Figure 2.
2.2.3. Upper Bound of Foam Yield Strength
The above results reveal a critical trade-off in the selection of σp: a higher σp reduces inner-layer displacement but increases the transmitted pressure to the outer layer. When σp exceeds a certain threshold, the outer layer develops plastic deformation before the inner layer reaches its deformation limit, i.e., the structure transitions from the desired Mode I to the undesirable Mode II. In the present parametric study, this transition occurs at σp ≈ 2.5 MPa under 5 kg TNT (Figure 2). The threshold value is governed by the elastic capacity of the outer RC layer. Therefore, for a given charge mass and structural geometry, the foam yield strength must be kept below this upper bound to ensure outer-layer elasticity. The determination of this bound is embedded in the iterative design procedure presented in Section 3.3 (Step 10), where σp is adjusted until the Mode I criterion is satisfied.
2.3. Effect of Interlayer Thickness
To investigate the influence of the foam-concrete interlayer thickness on the structural response, three values of interlayer thickness hf were considered: 150 mm (baseline), 175 mm, and 200 mm. The baseline thickness of 150 mm was adopted from the experimental prototype [5]. The range of 150–200 mm covers the typical design space for foamed concrete interlayers in containment structures [10,17], where thinner layers risk densification and thicker layers yield diminishing returns. The foam-concrete yield strength was fixed at σp = 1.0 MPa (baseline), and all other geometric and material parameters remained unchanged (Section 2.1). Two charge masses, W = 3 kg and 5 kg TNT, were simulated for each thickness.
2.3.1. Effect of Interlayer Thickness on Radial Displacement
Figure 3 presents the time histories of the inner-layer radial displacement at the blast-center cross-section for different hf values under 3 kg and 5 kg TNT. For both charge masses, the inner-layer displacement curves for the three thicknesses nearly coincide, indicating that increasing the interlayer thickness has negligible influence on the inner-layer peak displacement or the time to reach the peak. This is because the inner-layer motion is governed primarily by the blast impulse and its own structural resistance, rather than by the interlayer stiffness or thickness.
Figure 3.
Time-history curves of the structural inner-layer displacement for different thicknesses of the energy-absorbing layer: (a) under 3 kg TNT; (b) under 5 kg TNT.
Figure 4 shows the corresponding outer-layer displacement time histories. The peak outer-layer displacement decreases only slightly with increasing hf: under 3 kg TNT, the peak at hf = 200 mm is 92.6% of that at hf = 150 mm; under 5 kg TNT, this ratio is 95.9%. However, the time to reach the peak displacement is noticeably delayed as hf increases, due to the longer stress-wave propagation path through the thicker interlayer.
Figure 4.
Time-history curves of the structural outer-layer displacement for different thicknesses of the energy-absorbing layer: (a) under 3 kg TNT; (b) under 5 kg TNT.
2.3.2. Effect of Interlayer Thickness on Interlayer Contact Pressure
Figure 5 compares the contact pressure time histories at the inner and outer interfaces for different hf values under 3 kg and 5 kg TNT. The peak contact pressures at both interfaces are essentially unaffected by the interlayer thickness. However, the onset time, the time to peak, and the termination time of the outer-interface pressure are all delayed with increasing hf, consistent with the extended wave travel distance through the foam layer. The total pressure duration at the outer interface remains largely unchanged.
Figure 5.
Time-history curves of contact pressure for different thicknesses of the energy-absorbing layer. (a) Inner interface under 3 kg TNT. (b) Outer interface under 3 kg TNT. (c) Inner interface under 5 kg TNT. (d) Outer interface under 5 kg TNT.
2.3.3. Minimum Required Interlayer Thickness
The above results demonstrate that, for a given charge mass and inner-layer configuration, increasing the interlayer thickness beyond a certain value yields diminishing returns in reducing the outer-layer response. Conversely, if the interlayer is too thin, the foam may enter the compaction-hardening stage during the inner-layer deceleration, causing the transmitted pressure to exceed σp and potentially triggering premature outer-layer yielding. Therefore, for specified resistance requirements and structural dimensions, there exists a minimum interlayer thickness that provides sufficient energy absorption and impulse attenuation while avoiding foam densification; increasing the thickness beyond this minimum does not further reduce the outer-layer response but does increase material cost. This concept will be revisited in the derivation of the simplified design method in Section 3.
2.4. Effect of Inner-Layer Reinforcement Ratio
To evaluate the influence of the inner-layer reinforcement ratio φ on the structural response, three values of reinforcement ratio were considered: 1% (baseline), 2%, and 3%. The baseline ratio of 1% corresponds to the reinforcement layout in the companion experiment [5]. Ratios of 2% and 3% represent common upper bounds for RC containment structures [41], beyond which steel congestion may hinder construction. The reinforcement was implemented via the built-in rebar option in MAT_072R3, with all other parameters kept at the baseline values (Section 2.1). Two charge masses, W = 3 kg and 5 kg TNT, were simulated for each value.
2.4.1. Effect of Inner-Layer Reinforcement Ratio on Radial Displacement
Figure 6 presents the time histories of the inner-layer radial displacement for different φ values. The peak inner-layer displacement decreases markedly with increasing reinforcement ratio. Under 3 kg TNT, the peak displacement at φ = 3% is 74.4% of that at φ = 1%; under 5 kg TNT, this ratio is 69.9%. The time to reach the peak displacement is also shortened as φ increases, reflecting the enhanced flexural stiffness and energy dissipation capacity of the inner layer.
Figure 6.
Time-history curves of inner-layer displacement for different reinforcement ratios: (a) under 3 kg TNT; (b) under 5 kg TNT.
Figure 7 shows the corresponding outer-layer displacement time histories. The outer-layer peak displacement also decreases with increasing φ, though the effect is less pronounced than for the inner layer. Under 5 kg TNT, the peak outer-layer displacement at φ = 3% is 82.4% of that at φ = 1%. The reduction is attributed to the decreased inner-layer deformation, which in turn reduces the compression demand on the foam interlayer and the impulse transmitted to the outer layer.
Figure 7.
Time-history curves of outer-layer displacement for different reinforcement ratios: (a) under 3 kg TNT; (b) under 5 kg TNT.
2.4.2. Effect of Inner-Layer Reinforcement Ratio on Interlayer Contact Pressure
Figure 8 compares the contact pressure time histories at the inner and outer interfaces for different φ values. The peak contact pressures at both interfaces show little variation with the reinforcement ratio. However, the duration of the contact pressure is noticeably shortened as φ increases, because the stiffer inner layer decelerates more rapidly, reducing the time over which the foam is compressed. This shortening of the pressure pulse contributes to the reduction in outer-layer displacement observed in Figure 7.
Figure 8.
Time-history curves of contact pressure for different reinforcement ratios. (a) Inner interface under 3 kg TNT. (b) Outer interface under 3 kg TNT. (c) Inner interface under 5 kg TNT. (d) Outer interface under 5 kg TNT.
2.5. Effect of Inner-Layer Thickness
To investigate the influence of the inner RC layer thickness on the structural response, three values of inner-layer thickness hi were considered: 175 mm (baseline), 200 mm, and 225 mm. The baseline thickness of 175 mm matches the experimental prototype [5]. The range of 175–225 mm spans typical design practice for RC containment walls [42], where thicker sections increase self-weight and cost. The outer RC layer thickness ho = 175 mm and the interlayer thickness hf = 150 mm was held constant; the foam-concrete yield strength was σp = 1.0 MPa and the reinforcement ratio was φ = 1%. Two charge masses, W = 3 kg and 5 kg TNT, were simulated for each hi value.
2.5.1. Effect of Inner-Layer Thickness on Radial Displacement
Figure 9 presents the time histories of the inner-layer radial displacement for different hi values. The peak inner-layer displacement decreases substantially with increasing inner-layer thickness. Under 3 kg TNT, the peak displacement at hi = 225 mm is 69.6% of that at hi = 175 mm; under 5 kg TNT, this ratio is 61.2%. The time to reach the peak displacement is also shortened as hi increases, due to the greater bending stiffness and mass of the thicker inner layer.
Figure 9.
Time-history curves of inner-layer displacement for different hi values: (a) under 3 kg TNT; (b) under 5 kg TNT.
Figure 10 shows the corresponding outer-layer displacement time histories. The outer-layer peak displacement also decreases with increasing hi, though the effect is more pronounced under the smaller charge. Under 3 kg TNT, the peak outer-layer displacement at hi = 225 mm is 50.7% of that at hi = 175 mm; under 5 kg TNT, this ratio is 86.1%. The weaker influence under the larger charge suggests that when the inner layer undergoes large plastic deformation, the additional stiffness gained from increasing its thickness becomes less effective in limiting the impulse transmitted to the outer layer.
Figure 10.
Time-history curves of outer-layer displacement for different hi values: (a) under 3 kg TNT; (b) under 5 kg TNT.
2.5.2. Effect of Inner-Layer Thickness on Interlayer Contact Pressure
Figure 11 compares the contact pressure time histories at the inner and outer interfaces for different hi values. Under 3 kg TNT, increasing hi reduces both the peak contact pressures and their durations at both interfaces. Under 5 kg TNT, the peak contact pressures remain largely unchanged, but the pressure duration is noticeably shortened as hi increases. This difference arises because, under the larger charge, the foam quickly reaches its yield plateau regardless of the inner-layer stiffness, so the peak pressure is governed by σp rather than by the inner-layer response; however, the stiffer inner layer decelerates faster, reducing the time over which the foam is compressed.
Figure 11.
Time-history curves of contact pressure for different hi values. (a) Inner interface under 3 kg TNT. (b) Outer interface under 3 kg TNT. (c) Inner interface under 5 kg TNT. (d) Outer interface under 5 kg TNT.
2.6. Summary of Parametric Results
The parametric study presented in Section 2.2, Section 2.3, Section 2.4 and Section 2.5 examined the influence of four key parameters on the response of MLCCSs under internal blast. The main findings are summarized as follows:
- Foam-concrete yield strength σp (Section 2.2): Increasing σp reduces the inner-layer displacement but increases the outer-layer displacement and contact pressure. At sufficiently high σp and large charge mass, the failure mode transitions from the desired Mode I (inner-layer collapse before outer-layer yielding) to the undesirable Mode II (premature outer-layer yielding). The critical σp for Mode II initiation depends on the charge mass and the outer-layer elastic capacity.
- Interlayer thickness hf (Section 2.3): Increasing hf has negligible influence on the inner-layer displacement and only a minor effect on the outer-layer peak displacement, but delays the outer-layer response. For given structural dimensions and resistance requirements, a minimum hf exists below which foam densification is expected, while further increases in the thickness do not reduce the outer-layer response.
- Inner-layer reinforcement ratio φ (Section 2.4): Increasing φ effectively reduces both inner- and outer-layer displacements and shortens the contact pressure duration, without altering the peak contact pressure.
- Inner-layer thickness hi (Section 2.5): Increasing hi substantially reduces inner-layer displacement and moderately reduces outer-layer displacement, especially under smaller charges.
Among the four parameters, σp is the most critical for controlling the Mode I/II transition. Its selection is bounded by a dual criterion: an upper bound dictated by the outer layer’s elastic capacity (to avoid Mode II), and a lower bound set by the minimum required interlayer thickness (to avoid foam densification). Interlayer thickness hf governs the margin against foam densification that could also trigger Mode II. The inner-layer reinforcement ratio φ and thickness hi serve as secondary adjustment variables. These observations form the basis for the simplified design method developed in Section 3.
3. Simplified Design Method and Validation
3.1. Structural Response Characteristics
Based on the experimental observations reported in [5], the numerical simulations in [36], and the parametric analysis presented in Section 2, the response of MLCCSs under internal blast can be characterized by the following features:
- Sequential layer motion: The inner RC layer is first accelerated by the blast impulse and moves radially outward, compressing the foam interlayer. Only after the foam is sufficiently compacted does the outer RC layer begin to deform appreciably. The motions of the three layers are therefore temporally separated.
- Outer-layer elasticity requirement: To maintain structural airtightness, the outer RC layer must remain elastic throughout the event. Once the outer layer develops plastic deformation, the structure is deemed to have lost its containment function—this defines the Mode II failure criterion.
- Load-controlling behavior of the foam interlayer: Before the foam enters the compaction-hardening stage, the contact pressure at both the inner and outer interfaces remains approximately equal to the foam yield strength σp regardless of the incident blast intensity. This confirms the “load-controllability” concept [10,11] and implies that the outer layer experiences a pressure pulse whose magnitude is capped at σp.
- Plane-strain dominance: The hoop strain in the inner layer far exceeds the axial strain at the blast-center cross-section, justifying a plane-strain idealization for the inner-layer deformation analysis.
- Large-area foam plasticization: Under typical design charges, the foam interlayer undergoes full plasticization over a significant length along the structural axis. Consequently, the pressure acting on the outer layer can be approximated as a uniformly distributed pulse of magnitude σp and duration ty.
These characteristics motivate the simplifications adopted in the following derivation.
3.2. Derivation of Simplified Method
3.2.1. Basic Assumptions
The following assumptions are made:
- The inner RC layer is treated as a rigid–perfectly plastic ring under plane-strain conditions. Its elastic deformation is neglected compared with the large plastic deformation at the ultimate state.
- The foam interlayer is idealized as a rigid–perfectly plastic material with a constant yield stress σp. Strain-hardening is neglected until the densification strain γ is reached. This idealization is consistent with the load-controllability concept [10,11] and is supported by our previous experimental [5] and numerical [36] investigations, as well as the parametric analysis presented in this paper.
- The outer RC layer remains elastic and is modeled as a thin elastic cylindrical shell under uniform internal pressure.
- The blast impulse IR (per unit area of the inner wall) is instantaneously transferred to the inner layer, imparting an initial radial velocity V0. The subsequent motion of the inner layer is resisted by its own plastic membrane resistance, the foam reaction stress σp, and the quasi-static gas pressure Pg.
- The inner and outer layers are mechanically decoupled by the foam interlayer; the outer layer responds only to the pressure transmitted through the foam.
3.2.2. Initial Velocity of the Inner Layer
Consider a unit-length ring segment of the inner layer subtending a small angle dα. The mass per unit circumferential length μi is given by
where Ri is the inner radius, hi is the thickness, and ρi is the density of the inner RC layer. The mass per unit circumferential length μi is given by Equation (1). The total impulse acting on this segment is IRRidα. Equating the impulse to the change in momentum gives the initial radial velocity V0:
3.2.3. Equation of Motion for the Inner Layer
After acquiring the initial velocity V0, the inner layer moves outward under the action of three forces per unit area: (i) the plastic membrane resistance σh of the RC ring; (ii) the foam reaction stress σp; and (iii) the quasi-static gas pressure Pg inside the containment. The radial equation of motion is
where w is the radial displacement of the inner layer.
For brevity, define the constant deceleration term:
so that Equation (3) simplifies to
3.2.4. Maximum Inner-Layer Displacement
Integrating Equation (5) with the initial conditions w(0) = 0 and gives:
The inner layer comes to rest when , i.e.,:
Substituting Equation (7) into Equation (6) yields the maximum radial displacement of the inner layer:
3.2.5. Plastic Membrane Resistance of the Inner Layer
The dynamic hoop tensile strength of a reinforced concrete ring can be expressed as [42]
where Rc and Rs are the dynamic tensile strengths of concrete and steel, respectively; φ is the reinforcement ratio; and kh is a reduction factor accounting for bond degradation at large deformation (typically taken as 1.2). Following the recommendations for blast-loaded RC cylinders [42], the dynamic strength enhancement factors are taken as 2.0 for concrete and the dynamic tensile strength of the reinforcement steel is taken as 500 MPa.
3.2.6. Minimum Required Interlayer Thickness for Densification Avoidance
To prevent the foam from entering the compaction-hardening stage (which would cause the transmitted pressure to exceed σp), the interlayer must be thick enough to accommodate the inner-layer displacement without full densification. Let γ be the densification strain of the foam. The required minimum interlayer thickness is
Here, ke is a conservative safety factor accounting for practical uncertainties such as local strain concentration, material variability, and three-dimensional effects. It provides a design margin so that the selected interlayer thickness exceeds the theoretical minimum; the value may be adjusted based on material characterization and project risk. For a given charge mass and inner-layer configuration, any interlayer thickness greater than hf,min provides no additional benefit in reducing the outer-layer response, while a thickness smaller than hf,min risks triggering Mode II failure. The value ke = 1.2 adopted in the present study corresponds to a 20% thickness margin, and its effect can be read directly from Equation (10), since hf,min is linear in ke: increasing ke from 1.2 to 1.5 raises the computed minimum thickness by 25%, while decreasing it to 1.0 lowers it by 17%. The effect of ke on the design outcome is therefore limited to a proportional rescaling of the thickness requirement; it is applied only to the interlayer thickness, never to the Mode I strain criterion of Equation (13), and the margin it provides in the assessment cases and in the design example is quantified in Section 3.4 and Section 3.5.
3.2.7. Outer-Layer Elastic Response
The outer RC layer is treated as a thin elastic cylindrical shell. Under the transmitted pressure pulse (idealized as a rectangular pulse of magnitude σp and duration ty), the radial displacement is obtained from the Duhamel integral:
where ρo and ho are the density and thickness of the outer layer, Ro = Ri + hi + hf + ho/2 is the mid-surface radius of the outer shell, and is the natural frequency of the ring (E being the elastic modulus of concrete). The pressure duration ty can be approximated as
where tc = hf/cf is the stress-wave transit time through the foam interlayer (negligible for typical thicknesses).
ty = tf − tc ≈ tf (when tf ≫ tc)
The peak outer-layer hoop strain is then:
εθ,peak = umax/Ro
The structure satisfies the Mode I design criterion if εθ,peak ≤ εallowable, where εallowable is the allowable hoop strain of the outer RC layer. A single value, εallowable = 8.0 × 10⁻⁴, is adopted here for all configurations, calibrated on the Mode I/II transition observed in the parametric study of Section 2.2.3. Being a calibrated quantity rather than a first-principles material constant, it is stated explicitly so that the criterion can be re-anchored if the outer-layer material or the required performance level changes.
3.3. Step-by-Step Design Procedure
Based on the simplified method derived in Section 3.2, a step-by-step design procedure for MLCCSs under internal blast is proposed. The procedure ensures that the structure operates in the desired Mode I (inner-layer collapse before outer-layer yielding) while avoiding unnecessary conservatism in the interlayer design.
Step 1: Define design inputs
- Design charge mass W (kg TNT);
- Inner radius of the containment Ri (m);
- Total internal volume V (m3);
- Material properties: concrete tensile strength ft, steel yield strength fy, foam-concrete yield strength σp (initial trial value);
- Geometric parameters: inner-layer thickness hi, outer-layer thickness ho, interlayer thickness hf (initial trial values);
- Reinforcement ratio of the inner layer φ.
Step 2: Calculate blast impulse
Determine the specific impulse IR (Pa·s) acting on the inner wall. The following sources are recommended in order of priority:
- Experimental data or validated numerical simulations—Direct measurement or high-fidelity FSI simulation results for the specific geometry and charge mass should be used whenever available.
- Empirical formulas—When test or simulation data are unavailable, the impulse can be estimated using empirical formulas. For cylindrical confined explosions, the following formula is calibrated based on numerical simulations validated by experimental data [43]:
This formula is calibrated for 0.1 ≤ Ri/W1/3 ≤ 0.97. Its applicability outside this range should be verified. Alternatively, general-purpose empirical formulas such as UFC 3-340-02 [30] may be used, with due consideration of their underlying assumptions and applicable ranges.
- 3.
- Simplified relations—Other simplified relations calibrated for specific geometries may also be employed, provided their validity for the target configuration is confirmed.
For the present geometry (Ri = 0.5 m, L = 5 m), the impulse value for 5 kg TNT is 8264 Pa·s obtained from the validated FSI model [36].
Step 3: Compute inner-layer initial velocity
Using Equation (2), compute the inner-layer initial velocity V0.
Step 4: Estimate quasi-static gas pressure
For a fully contained explosion, the quasi-static gas pressure can be estimated as [44]
where W is in kg and V is in m3. This formula assumes a fully sealed containment vessel with no venting or pressure relief. For structures with openings, vents, or blow-off panels, the actual quasi-static gas pressure will be lower, and the above formula will overestimate Pg, leading to a conservative (safe-side) prediction of inner-layer displacement.
Pg = 1.34 W/V (MPa)
Step 5: Compute plastic membrane resistance of the inner layer
Using Equation (9), compute the plastic membrane resistance σh, with Rc = 2.0ft (dynamic tensile strength of concrete), Rs = 500 MPa (dynamic yield strength of steel), and kh = 1.2.
Step 6: Compute deceleration parameter and maximum inner-layer displacement
Using Equations (4) and (8), compute the deceleration parameter K and the maximum inner-layer displacement wmax.
Step 7: Check inner-layer failure criterion
If wmax exceeds the allowable inner-layer displacement wallow (corresponding to the ultimate hoop strain of the reinforcement, typically 5% strain), the inner layer fails in Mode I as intended. If wmax < wallow, the inner layer is underutilized and the design may be overly conservative—consider reducing hi or φ. Note that an underutilized inner layer (wmax < wallow) does not violate the Mode I criterion; it merely indicates potential for design optimization (e.g., reducing hi or φ).
Step 8: Determine the minimum required interlayer thickness
Using Equation (10), determine the minimum required interlayer thickness hf,min.
Select hf ≥ hf,min, since any thickness beyond hf,min provides no additional reduction in the outer-layer response (Section 3.2.6), the smallest available thickness satisfying this constraint is the economical choice.
Step 9: Compute outer-layer peak hoop strain
Using Equations (11)–(13), compute the peak outer-layer hoop strain εθ,peak. The pressure pulse on the outer layer is idealized as a rectangular pulse of magnitude σp and duration ty.
Step 10: Verify Mode I criterion
Check:
where εallowable is the allowable hoop strain of the outer RC layer (Section 3.2.7). If satisfied, the design achieves Mode I. If not, adjust σp or hf and return to Step 6.
εθ,peak < εallowable
Selection criterion for σp: The foam yield strength σp must satisfy a dual-bound criterion:
- Lower bound (σp,min): Determined by the minimum interlayer thickness. A lower σp leads to larger wmax, requiring a thicker interlayer hf,min to avoid densification. If hf,min exceeds the practical or cost-effective limit, σp should be increased.
- Upper bound (σp,max): Governed by the elastic capacity of the outer layer. It is the maximum σp for which εθ,peak < εallowable is satisfied in Step 10. Exceeding this bound triggers Mode II failure.
The designer should iterate σp within the range [σp,min, σp,max] to optimize for cost, weight, or constructability; the utilization requirement of Step 7 may further restrict this range from above, as demonstrated in the design example (see Section 3.5).
Step 11: Output design parameters
Finalize σp, hf, hi, and φ that satisfy all criteria.
3.4. Numerical Assessment
To assess the accuracy of the simplified method, the predicted inner-layer maximum displacements are compared with the numerical results from the parametric study for five representative cases covering a range of σp and φ values under 5 kg TNT. The comparison is presented in Table 5.
Table 5.
Comparison of inner-layer maximum displacement: simplified method vs. numerical simulation (5 kg TNT).
The displacement predicted by the simplified method remains within the ±15% working tolerance of the numerical results in all five cases. The error exhibits a clear trend: the method overpredicts wmax when the displacement is large (Cases 1 and 2, where the inner layer undergoes significant plastic deformation) and underpredicts wmax when the displacement is small (Cases 4 and 5, where the elastic deformation of the inner layer and the finite stress-wave transit time through the foam become non-negligible relative to the total displacement).
The mean absolute error across the five cases is 9.50%, with a maximum of 14.3%. Only this displacement output is compared quantitatively; the remaining outputs of the method are assessed in Section 3.4 for consistency with the same numerical framework, as described below. An error band of ±15% is adopted internally as a working tolerance for preliminary screening, not as an established acceptance criterion that the method is claimed to satisfy; no such external criterion is available, and the band is stated explicitly only so that the reader can judge the method against it. Its justification is one of purpose rather than of precedent: the method is offered as a screening tool, to be used in place of repeated FSI simulation during option screening. Within this purpose, the simplified method provides a practical tool for the preliminary sizing of MLCCSs under internal blast, with the understanding that final designs should be verified by numerical simulation, particularly when operating near the Mode I/II boundary.
The comparison above addresses only the inner-layer maximum displacement. The simplified method also delivers three further design-critical outputs (the minimum required interlayer thickness, the outer-layer peak hoop strain, and the Mode I/II classification, the latter returned by the Step 10 comparison of the outer-layer peak hoop strain with the allowable hoop strain), and these must be checked for consistency with the numerical results before the method can be used with confidence as a design tool. Table 6 therefore extends the comparison of Table 5 to all four outputs, using the same set of FSI results.
Table 6.
Comparison of the four design-critical outputs of the simplified method with the FSI results (5 kg TNT; hi = ho = 175 mm and hf = 150 mm in all cases).
The minimum required interlayer thickness computed from Equation (10), evaluated with the safety factor ke = 1.2, a densification strain γ = 0.60, and wmax taken from Equation (8), lies between 29.3 mm and 56.4 mm over the five cases. The thickness actually adopted in the numerical model, hf = 150 mm, therefore exceeds the computed minimum by a factor of 2.6 or more in every case, and no densification of the interlayer is expected. This is consistent with the interlayer volumetric strain extracted from the FSI results, which remains below the densification strain in all five cases.
The outer-layer peak hoop strain obtained from Equations (11)–(13), evaluated with E = 32.5 GPa and ρo = 2500 kg/m3 for the outer RC layer, is compared in Table 6 with the peak hoop strain extracted from the outer RC layer at the blast-center cross-section of the FSI model. The closed-form strain exceeds the FSI value by 25–32% at the three lowest foam grades (Cases 1–3), agrees with it within 4% at σp = 2.0 MPa (Case 4), and falls 11% below it at σp = 2.5 MPa (Case 5), where both values exceed the threshold and the classification is unaffected. The mean absolute deviation is about 20%, considerably larger than that of the displacement output; the ±15% working tolerance stated above therefore applies to the displacement, whereas the strain output is used through the Mode I/II classification. The overprediction at low foam grades is conservative for the Mode I criterion. It is also noted that the closed-form strain is identical for Cases 1 and 2: under the load-controllability idealization, the transmitted pressure is capped at σp and the pulse duration enters the evaluation only through the conservative rectangular-pulse amplification, so the dependence on the inner-layer reinforcement ratio is not resolved. The small difference present in the FSI results (256 versus 243 με) is of second order and lies well inside the conservative bias of the prediction.
The Mode I/II classification returned by the Step 10 criterion, εθ,peak ≤ εallowable = 8.0 × 10⁻⁴, reproduces the mode actually observed in the FSI results in all five cases: Cases 1–4 are classified as Mode I and Case 5 (σp = 2.5 MPa) as Mode II, in agreement with the transition identified independently from the parametric study in Section 2.2.3. Because εallowable is anchored on that transition (Section 3.2.7), this agreement is not by itself an independent validation of the numerical value of the threshold; what the comparison establishes is that a single calibrated threshold, applied through the closed-form Equation (13), reproduces the observed classification over the whole σp range examined, and that the closed-form strain follows the same ordering as the FSI response.
It should be noted that the FSI results used for the comparison in Table 6 are obtained from the same modeling framework as the parametric study, so the comparison establishes consistency between the simplified method and the numerical model rather than independent physical validity. The outer-layer hoop strain and the densification state were obtained by post-processing the existing FSI results; no additional numerical simulations were performed for this purpose.
3.5. Prospective Design Example and Numerical Assessment
3.5.1. Design Brief and Optimization Criterion
The procedure of Section 3.3 is now applied prospectively to a design brief that does not coincide with any of the five cases used for assessment in Section 3.4. The design charge is W = 5 kg TNT; the containment geometry is Ri = 0.5 m and L = 5 m, for which the specific impulse on the inner wall is IR = 8264 Pa·s (obtained from the validated FSI model, Step 2); the inner layer is hi = 175 mm with reinforcement ratio φ = 1% as fixed by the prototype of [5]; and the interlayer thickness is restricted to the practical range 150–200 mm. To make the example prospective by construction, the brief further requires the adopted thickness to differ from the 150 mm used in all five assessment cases of Section 3.4 and to coincide with one of the other thicknesses analyzed in Section 2.3 (175 or 200 mm), so that the assessment of Section 3.5.3 can use an existing FSI result without new simulations. The design objective is to select the foam-concrete grade σp and the interlayer thickness hf that satisfy all three design constraints of Section 3.3 while minimizing material cost. The optimization criterion is therefore stated explicitly: minimize the foam grade, subject to (i) the inner layer remaining fully utilized (wmax ≥ wallow, Step 7), (ii) the interlayer not densifying (hf ≥ hf,min, Step 8), and (iii) the outer RC layer remaining elastic (εθ,peak ≤ εallowable, Step 10). Within the practical envelope, the densification constraint is non-binding and the structural response is only weakly sensitive to hf (Section 2.3), so the thickness is fixed by the material-cost criterion within the admissible set defined above (Step 8).
3.5.2. Execution of the Design Procedure
Steps 1–11 of Section 3.3 are executed in order; the intermediate quantities are collected in Table 7.
Table 7.
Step-by-step execution of the design procedure for the prospective design example (W = 5 kg TNT, Ri = 0.5 m, L = 5 m, hi = ho = 175 mm, φ = 1%).
Steps 3–6 proceed exactly as set out in Section 3.3: μi = 257.0 kg/m from Equation (1); V0 = 16.08 m/s from Equation (2); Pg = 1.706 MPa for the internal volume V = 3.927 m3, and σh = 8.17 MPa from Equation (9); with Rc = 2.0ft (ft = 2.4 MPa, the tensile strength of the prototype concrete [5]), Rs = 500 MPa and kh = 1.2; Equations (4) and (8) then give K = −4.85×10³ m/s2 and wmax = 26.64 mm at σp = 1.0 MPa.
Step 7 gives wallow = 0.05 Ri = 25.0 mm (the 5% hoop-strain limit of the reinforcement). Since wmax = 26.64 mm exceeds wallow, the inner layer reaches its deformation limit and the design attains the intended Mode I collapse of the inner layer rather than an under-utilized configuration. Solving wmax = wallow gives σp = 1.11 MPa, so any foam grade above this value leaves the inner layer under-utilized.
Step 8 gives hf,min = 53.1 mm, comfortably below the available 150–200 mm range, so the densification constraint is satisfied throughout the practical envelope. Since the structural response is only weakly sensitive to hf within this range (Section 2.3), the material-cost criterion favors the smallest admissible thickness. With 150 mm excluded by the design brief, the procedure returns hf = 175 mm, the smaller of the two remaining thicknesses for which an FSI result exists (Section 2.3). The adopted value provides a factor of 3.3 over the computed minimum and therefore a substantial margin against densification, and because it differs from the thickness of all five validation cases, the resulting design constitutes a prospective prediction rather than a repetition of an already assessed configuration (Section 3.5.3).
Step 9 gives umax = 0.309 mm and εθ,peak = 330 με, evaluated at Ro = 0.9375 m for the adopted configuration (hf = 175 mm). In Step 10, this satisfies εθ,peak < εallowable = 800 με, so the outer RC layer remains elastic and the Mode I criterion is met. Solving the same criterion for σp returns the upper bound of the dual-bound window for this geometry, σp,max = 2.43 MPa.
For Step 11, the dual-bound window is evaluated as follows. The upper bound, σp,max = 2.43 MPa, is governed by the elastic capacity of the outer layer: above this value, the transmitted pressure drives the outer-layer hoop strain beyond εallowable and Mode II ensues. The lower bound would be set by the densification requirement of Equation (10): a lower foam grade enlarges the inner-layer displacement and, hence, the computed minimum thickness. For this geometry, the thickness requirement never binds: the computed minimum of 53.1 mm is only about one third of the smallest available thickness (150 mm), and it would remain below half of that value even at ke = 1.5. The available thickness therefore imposes no lower bound on σp. Within this window, the utilization requirement of Step 7 imposes a further ceiling: wmax ≥ wallow = 25.0 mm is satisfied only for σp ≤ 1.11 MPa, tighter than the Mode II bound. The design point is therefore selected at σp = 1.0 MPa with hf = 175 mm, the lowest foam grade for which the constitutive behavior has been characterized experimentally [5], combined with the smallest thickness admitted by the design brief, as determined in Step 8. The resulting design sits at σp/σp,max = 0.41 of the upper bound.
3.5.3. Numerical Assessment of the Resulting Design
The configuration returned by the procedure (σp = 1.0 MPa, hf = 175 mm, hi = 175 mm, φ = 1%, W = 5 kg TNT) is not one of the five cases used for assessment in Section 3.4, all of which have hf = 150 mm; this difference is by construction, as required by the design brief. A numerical result for this configuration is nevertheless available from the parametric study of Section 2.3, and is used here to check the design prediction. Since this FSI result is produced by the same modeling framework used for calibration and validation, the check is independent of the five assessment cases in terms of configuration, though not of the numerical model itself. Four design-critical outputs are compared with the FSI results: the inner-layer maximum displacement, the occurrence of foam densification, the outer-layer peak hoop strain, and the resulting failure mode.
The predicted inner-layer maximum displacement is 26.64 mm. The FSI peak inner-layer displacements computed for hf = 150, 175 and 200 mm under 5 kg TNT are 24.78, 24.96 and 24.97 mm, respectively, within 0.8% of one another, confirming that the inner-layer response is essentially insensitive to hf (Figure 3). The numerical value for the adopted configuration is therefore 24.96 mm, and the prediction is about 7% higher, the same order as the corresponding entry of Table 5 (Case 2); this is expected, because the inner-layer displacement is governed by the blast impulse and by the inner-layer resistance rather than by hf. No densification of the interlayer occurred, consistent with the adopted thickness being about 3.3 times the computed hf,min = 53.1 mm. The outer-layer peak radial displacement in the FSI result is 0.219 mm, corresponding to a peak hoop strain of about 234 με at the mid-surface radius Ro = 0.9375 m through the same kinematic relation as Equation (13); the closed-form prediction of 330 με is therefore conservative. The outer layer remained elastic, i.e., Mode I, in agreement with the Step 10 prediction.
3.5.4. Remarks on the Design Outcome
Applied prospectively, the design procedure selected the lowest-cost foam grade satisfying all three design constraints, and it did so within the dual-bound window rather than by trial and error. Because Table 7 lists every intermediate quantity, the design can be audited step by step, and the sensitivity of the outcome to σp, ke, γ or εallowable can be read directly from the corresponding equation (for example, the linear dependence of hf,min on ke and its inverse dependence on γ).
For this geometry, the design is governed by the requirement to utilize the inner layer (Step 7) rather than by the elastic capacity of the outer layer, which retains a margin of a factor of 2.4. Since the inner layer is the sacrificial component, a larger deformation would by itself dissipate more energy; the deformation that can be credited in design is nevertheless limited by the ultimate hoop strain of the reinforcement, commonly taken as about 5% for cylindrical RC structures under internal blast (Section 2.2.1), beyond which the reinforcement approaches rupture and the layer can no longer be relied upon to remain a coherent membrane. This requirement imposes a utilization ceiling within the dual-bound window (σp ≤ 1.11 MPa, Step 7), tighter than the Mode II bound of 2.43 MPa, and the selected grade σp = 1.0 MPa places wmax = 26.64 mm marginally above wallow = 25.0 mm: the inner layer is fully but not excessively utilized.
4. Discussion
4.1. Applicability of the Simplified Method
The simplified design method proposed in Section 3 is derived from the fundamental physics of MLCCSs under internal blast—sequential layer motion, load controllability of the foam interlayer, and elastic outer-layer requirement—rather than from empirical curve-fitting to a specific dataset. As such, the formulation contains no coefficient fitted to a particular geometry or charge mass. Whether this property is sufficient for the equations to remain applicable to other cylindrical MLCCS geometries and material parameters cannot be established within the present study: the method has been examined numerically only through variations in one parameter at a time at Ri = 0.5 m and 3–5 kg TNT, and the coupled-parameter conditions under which the idealizations of Section 3.2.1 break down have not been mapped. Accordingly, no applicability beyond the ranges examined here and listed below is claimed in this work; the broader applicability suggested by the structure of the equations is put forward as a hypothesis to be tested, and the coupled-parameter assessment required for this purpose is identified as future work (Section 4.2 and Section 4.6).
In the present study, the method has been assessed against numerical simulations, within which the inner-layer displacement is quantitatively reproduced and the remaining outputs are consistent with the numerical model, for the following ranges: inner radius Ri = 0.5 m, charge mass W = 3~5 kg TNT, foam-concrete yield strength σp = 1.0~2.5 MPa, interlayer thickness hf = 150~200 mm, inner-layer reinforcement ratio φ = 1%~3%, and inner-layer thickness hi = 175~225 mm. For applications outside these ranges, the following components require re-calibration:
- The specific impulse as a function of charge mass and geometry (Step 2 of the design procedure);
- The quasi-static gas pressure for different containment volumes;
- The dynamic strength enhancement factors for materials if different materials are used.
With these re-calibrations, the method can be extended to other structural scales and loading conditions without modification of its core analytical framework. For critical applications, final designs should be verified by detailed numerical simulations or experimental testing.
The two charge masses were not chosen to span the full range of internal-blast threats, but to bracket the design envelope of the MLCCS prototype tested in [5] and to cover the two response regimes identified in Section 2.2: at the smaller charge the response is governed by the inner layer’s own resistance, whereas at the larger charge the pressure transmitted through the interlayer becomes decisive. Wider charge ranges, stand-off effects and different aspect ratios are identified as future work in Section 4.6. Correspondingly, the numerical value of the mode-transition threshold reported here, σp,cr ≈ 2.5 MPa, is specific to Ri = 0.5 m under 5 kg TNT and must not be transferred to other geometries or charge masses. What is expected to transfer is the dual-bound mechanism itself: an upper bound set by the elastic capacity of the outer layer, and a lower bound set by the admissible inner-layer deformation and the minimum required interlayer thickness.
The behavior of the method can nevertheless be expressed in terms that do not depend on the absolute scale of the structure. Equations (2), (4), (8), (10) and (13) reduce to a small set of dimensionless groups: the mass ratio (2Ri + hi)/(2Ri) in Equation (2); the two resistance-to-inertia ratios σhμi/[ρi(Ri + hi/2)PgRi] and σp(Ri + hi)/(PgRi), which together determine the sign and magnitude of the deceleration parameter K in Equation (4); the geometric ratios hi/Ri, ho/Ri and hf/Ri; the densification ratio ke/γ in Equation (10); and the outer-layer flexibility ratio 2σpRo/(Eho), which is the dimensionless form of the Mode I criterion of Equation (13). Within the assessment window of the present study, these groups take the values (2Ri+hi)/(2Ri) = 1.175; σhμi/[ρi(Ri+hi/2)PgRi] = 1.675; σp(Ri + hi)/(PgRi) = 0.79 − 1.98; hi/Ri = ho/Ri = 0.35 and hf/Ri = 0.30 − 0.40; ke/γ = 2.0; and 2σpRo/(Eho) = 3.2 × 10⁻⁴ − 8.0 × 10⁻⁴. The response predicted by the method is governed by the values of these groups rather than by the absolute geometry, so a configuration with a different Ri but comparable group values should be reproduced by the same closed-form equations without modification. This proposition is consistent with the absence of any constant fitted to Ri = 0.5 m anywhere in the formulation; it has not, however, been verified numerically in the present study, and it is therefore identified as a specific target for the coupled-parameter assessment recommended in Section 4.6.
4.2. Limitations and Sources of Uncertainty
Several simplifications in the proposed method introduce uncertainty:
- Rigid–plastic idealization of the inner layer: When the inner-layer displacement is small (e.g., Cases 4 and 5 in Table 5), the elastic deformation constitutes a non-negligible fraction of the total displacement. The simplified method tends to underestimate wmax in these cases (error up to −14%), partly attributable to the neglect of elastic deformation. An underprediction of this kind is non-conservative: the required interlayer thickness increases linearly with wmax through Equation (10), so a predicted displacement smaller than the actual value leads to an interlayer thinner than required and, hence, to an under-protected design. The underpredictions remain inside the ±15% working tolerance of Section 3.4, and they are largest precisely where the rigid–plastic idealization is least accurate, that is, where the elastic contribution to the total displacement is not negligible. They should therefore be treated as a bias to be removed by numerical verification of the final design (as already required in Section 3.4), rather than as a margin.
- Instantaneous impulse transfer: The assumption that the entire blast impulse is instantaneously converted into the inner-layer initial velocity neglects the finite rise time of the pressure pulse. For very short-duration impulses, this approximation is reasonable; for longer-duration impulses, it may overestimate the peak displacement.
- Uniform foam yield stress: The foam is assumed to exhibit a perfectly plastic plateau up to the densification strain. In reality, the plateau may not be perfectly flat, and local strain concentrations can cause earlier hardening. The safety factor in Equation (10) partially accounts for this.
- Quasi-static gas pressure: The simple formula is an approximation. For structures with significant venting or leakage, the actual gas pressure may be lower, and the inner-layer displacement would be overestimated.
- Single-blast scenario for pristine structures: The method addresses only a single internal explosion acting on a pristine structure with no initial damage. Successive explosions, pre-damaged conditions, or structures with existing cracks or corrosion are not covered. The proposed design equations are strictly applicable only to new, undamaged MLCCSs; their extension to damaged or aged structures would require additional assessment.
- Single-parameter-variation basis: The parametric analysis in Section 2 varies each parameter independently while holding the other three at their baseline values. Because the inner-layer plasticity, foam compaction, and outer-layer elastic response are coupled through a sequential load-transfer path, this one-at-a-time approach does not capture potential interaction effects when multiple parameters deviate simultaneously. The assessment in Table 5 reflects this: Cases 2–5 differ essentially only in σp, while Case 1 differs from Case 2 only in φ. The reported accuracy (mean absolute error 9.50%) therefore applies to single-parameter variations; the method’s predictive accuracy under coupled multi-parameter conditions remains to be verified. Within this scope, the proposed equations are intended for preliminary design and parameter screening, and final designs involving significant simultaneous deviations from the baseline should be checked by detailed FSI simulation or experimental testing.
- Constant dynamic enhancement factors: The dynamic tensile strength enhancement factors for concrete (×2.0) and steel (500 MPa) are taken as fixed constants following Chen [42], consistent with the recommendations of UFC 3-340-02 [30] and Krauthammer [32]. These values are appropriate for the loading rates considered in the present study, but may require recalibration for significantly different charge masses or standoff distances where the strain rate regime changes substantially.
4.3. Comparison with Existing Design Approaches
Traditional blast-resistant design for RC structures follows the SDOF approach codified in UFC 3-340-02 [30]. While the SDOF method is well-established for single-layer RC members, it cannot capture the three-layer load-redistribution mechanism of MLCCSs for two reasons:
- The SDOF method assumes that the blast impulse acts directly on the structural member, whereas in MLCCSs, the impulse is first absorbed by the inner layer, then transmitted through the foam, and, finally, applied to the outer layer.
- The SDOF method does not distinguish between Mode I and Mode II failures; it treats all plastic deformation as acceptable, which contradicts the airtightness requirement of containment structures.
- The proposed method explicitly addresses these gaps by introducing:
- A sequential load-transfer model that accounts for the inner-layer plastic deformation and foam compaction before the outer layer responds.
- A Mode I/II failure criterion that guarantees the outer layer remains elastic.
Compared with the fully numerical approach (FSI simulation), the proposed method reduces the computational cost from hours to seconds, making it suitable for preliminary design and parametric sweeps.
4.4. Engineering Implications
The parametric study reveals that the foam-concrete yield strength is the most influential parameter controlling the Mode I/II transition. A common misconception is that a stronger interlayer always improves blast resistance; the present results show that beyond a certain σp, the outer layer becomes the weak link. The proposed method provides a quantitative tool for selecting the σp that maximizes inner-layer energy absorption without jeopardizing the outer-layer elasticity.
The existence of a minimum required interlayer thickness (Equation (10)) implies that simply increasing the foam thickness is an inefficient strategy for improving blast resistance once that minimum is met. Design effort should instead focus on tuning σp and the inner-layer reinforcement ratio.
4.5. Strategies for Enhancing Overall Blast Resistance
The blast resistance of MLCCSs is ultimately limited by the elastic capacity of the outer RC layer. Once the outer layer yields (Mode II), the structure loses its airtightness irrespective of the inner-layer and interlayer design. Therefore, enhancing the overall blast resistance requires increasing the elastic limit of the outer layer. Several strategies are available:
- (a)
- Increasing outer-layer thickness ho: This directly reduces the peak hoop strain εθ,peak (Equation (13)) by increasing the shell stiffness. The trade-off is increased structural weight and cost.
- (b)
- Using high-strength concrete or fiber-reinforced concrete for the outer layer: A higher tensile strength raises the allowable strain εallowable, allowing the outer layer to withstand a larger transmitted impulse before yielding. Fiber reinforcement also improves crack control. The drawback is higher material cost and potentially reduced ductility.
- (c)
- Applying external prestressing to the outer layer: Circumferential prestressing introduces compressive hoop stresses that offset the tensile stresses induced by the blast, effectively raising the net tensile capacity. This approach can significantly increase the elastic limit without increasing thickness. However, it adds construction complexity and long-term maintenance requirements.
- (d)
- Optimizing the interlayer properties: Since the transmitted pressure to the outer layer is capped at σp (Section 3.2.1), reducing σp is the most direct way to protect the outer layer. However, as shown in Section 2.2, a lower σp leads to larger inner-layer deformation, requiring a thicker interlayer to avoid foam densification. The chosen σp balances these two competing effects.
Among these strategies, options (a) and (d) are the most practical for conventional construction, while (b) and (c) offer pathways for higher-performance designs. The proposed simplified method can be readily adapted to evaluate the effect of these strategies by adjusting the input parameters (ho, εallowable, σp) in the design procedure (Section 3.3). A quantitative comparison of these strategies using the proposed simplified design method, with properly characterized material parameters and prestress levels, is beyond the scope of the present study and is planned as part of our ongoing research on MLCCS blast mitigation.
4.6. Future Work
The following extensions are recommended for future research:
- Generalization to other geometries: The method should be calibrated for different aspect ratios (L/Ri) and absolute sizes to broaden its applicability, with the assessment extended from the present single-parameter variations to coupled variations in geometry and charge mass, so that the dimensionless groups identified in Section 4.1 can be tested directly.
- Multi-parameter coupling assessment: Systematic combined variations of σp, hf, φ, and hi should be simulated (and, ideally, tested) to quantify interaction effects and to verify the simplified method under coupled conditions. This constitutes a direct follow-up to the present study.
- Other interlayer materials: The same framework can be adapted for aluminum foam, polymeric foam, or granular materials by replacing the foam constitutive law.
- Multi-hit scenarios: Extending the method to account for cumulative damage from successive explosions would enhance its relevance for military and industrial applications.
- Probabilistic treatment: Incorporating uncertainties in material properties and blast loading into a reliability-based design format.
5. Conclusions
This paper has presented a systematic parametric analysis and a simplified design method for multi-layer composite confinement structures (MLCCSs) with a foamed-concrete interlayer under internal blast. The main conclusions are drawn as follows.
- Parametric analysis quantified the influence of four key parameters on the structural response. Among them, the foam-concrete yield strength σp is the most critical parameter controlling the Mode I/II transition: increasing σp reduces inner-layer displacement but increases outer-layer displacement and transmitted energy. Beyond a threshold value, the structure transitions from the desired Mode I (inner-layer collapse before outer-layer yielding) to the undesirable Mode II (premature outer-layer yielding). This threshold is jointly governed by the elastic capacity of the outer RC layer and the charge mass: a larger charge mass lowers the critical σp, while a stronger outer layer (higher ho or ft) raises it. The interlayer thickness hf has negligible influence on displacement peaks but determines the timing of the outer-layer response and the margin against foam densification. The inner-layer reinforcement ratio φ and thickness hi serve as secondary adjustment variables that effectively reduce both inner- and outer-layer displacements.
- A novel, closed-form simplified design method was derived, which, for the first time, translates the complex three-layer load-redistribution mechanism into a practical engineering design tool. The method yields closed-form expressions for the inner-layer maximum displacement wmax, the minimum required interlayer thickness hf,min, and the outer-layer peak hoop strain εθ,peak. A step-by-step design procedure incorporating the Mode I/II criterion was proposed. The method is based on the following core assumptions: (i) rigid–perfectly plastic inner layer under plane-strain conditions; (ii) rigid–perfectly plastic foam interlayer with load-controllability behavior; (iii) elastic outer-layer response; and (iv) instantaneous impulse transfer to the inner layer. Applications involving significantly different geometries, charge masses, or material types should recalibrate the relevant input parameters as discussed in Section 4.1.
- Assessment against numerical simulations for five representative cases covering σp = 1.0~2.5 MPa under 5 kg TNT showed that the simplified method predicts the inner-layer maximum displacement with a mean absolute error of 9.50%, the ±15% band being an internally adopted working tolerance for preliminary screening rather than an acceptance criterion. Because the Mode I/II threshold is calibrated from the same numerical dataset (Section 3.2.7), the agreement in mode classification is an internal self-consistency check and not an independent quantitative validation of the strain prediction. The method tends to overpredict the displacement for large-deformation cases (conservative for design) and underpredict for small-deformation cases (non-conservative but within acceptable bounds).
- Application of the procedure to a prospective design brief whose configuration is not included in the assessment set (Section 3.5) selected a foam-concrete grade of σp = 1.0 MPa together with an interlayer thickness of 175 mm as the combination that minimizes the foam grade subject to inner-layer utilization, the densification constraint and outer-layer elasticity.
- Engineering implications: The study corrects the misconception that a stronger interlayer always improves blast resistance; beyond a critical σp (upper bound), the outer layer becomes the weak link. The existence of a minimum required interlayer thickness implies that simply increasing the foam thickness is an inefficient design strategy once that minimum is met. The proposed method provides a rapid screening tool for preliminary design, reducing computational cost from hours (full FSI simulation) to seconds.
It should be noted that the simplified design method proposed herein has been assessed against numerical simulations from the same FSI modeling framework, and has not yet been independently verified; the quantitative claim it supports is limited to the inner-layer displacement, while the remaining outputs are checked for consistency only. As part of the authors’ ongoing series of studies on MLCCSs, independent experimental validation constitutes the next step: the proposed method will be used to design a new MLCCS configuration, which will then be verified through independent full-scale or reduced-scale internal-blast tests. The results of this verification will be reported in a future publication. Furthermore, because the parametric study and the assessment in Table 5 are based on a single-parameter-variation approach, the accuracy of the design equations under simultaneous multi-parameter variations has not yet been established; their use should therefore be restricted to preliminary design and parameter screening, with final coupled-parameter designs verified by detailed simulation or experimentation.
Author Contributions
Conceptualization, P.N. and D.T.; methodology, P.N.; software, P.N.; validation, P.N., B.Y. and D.T.; formal analysis, P.N. and B.Y.; investigation, P.N. and B.Y.; resources, D.T.; data curation, P.N.; writing—original draft preparation, P.N.; writing—review and editing, D.T., P.N. and B.Y.; visualization, P.N.; supervision, D.T.; project administration, D.T.; funding acquisition, P.N. All authors have read and agreed to the published version of the manuscript.
Funding
This research was funded by the Shandong Xiehe University High-Level Talent Scientific Research Startup Funding Project (Grant No. SDXHQD2025008).
Data Availability Statement
The original contributions presented in this study are included in the article. Further inquiries can be directed to the corresponding author.
Conflicts of Interest
The authors declare no conflicts of interest.
Appendix A. Representative Validation of the Numerical Framework
Figure A1.
Representative validation of the FSI model used in the present study, reproduced from [36] with attribution. (a) Measured and computed inner-wall reflected pressure time histories at the blast-center cross-section for 0.3 kg TNT charges; (b) measured and computed inner-wall reflected pressure time histories at the blast-center cross-section for 0.8 kg TNT charges; (c) measured and computed hoop-strain time history at measurement point H1 (Model 1, foamed-concrete interlayer, 0.8 kg TNT); (d) computed contact-pressure time histories at the inner and outer interfaces of the foamed-concrete interlayer (Model 1, 3 kg TNT), illustrating the capping of the transmitted pressure at the foam yield stress; the experimental comparison of the interlayer contact pressures (0.8 kg TNT) is given in Table A2.
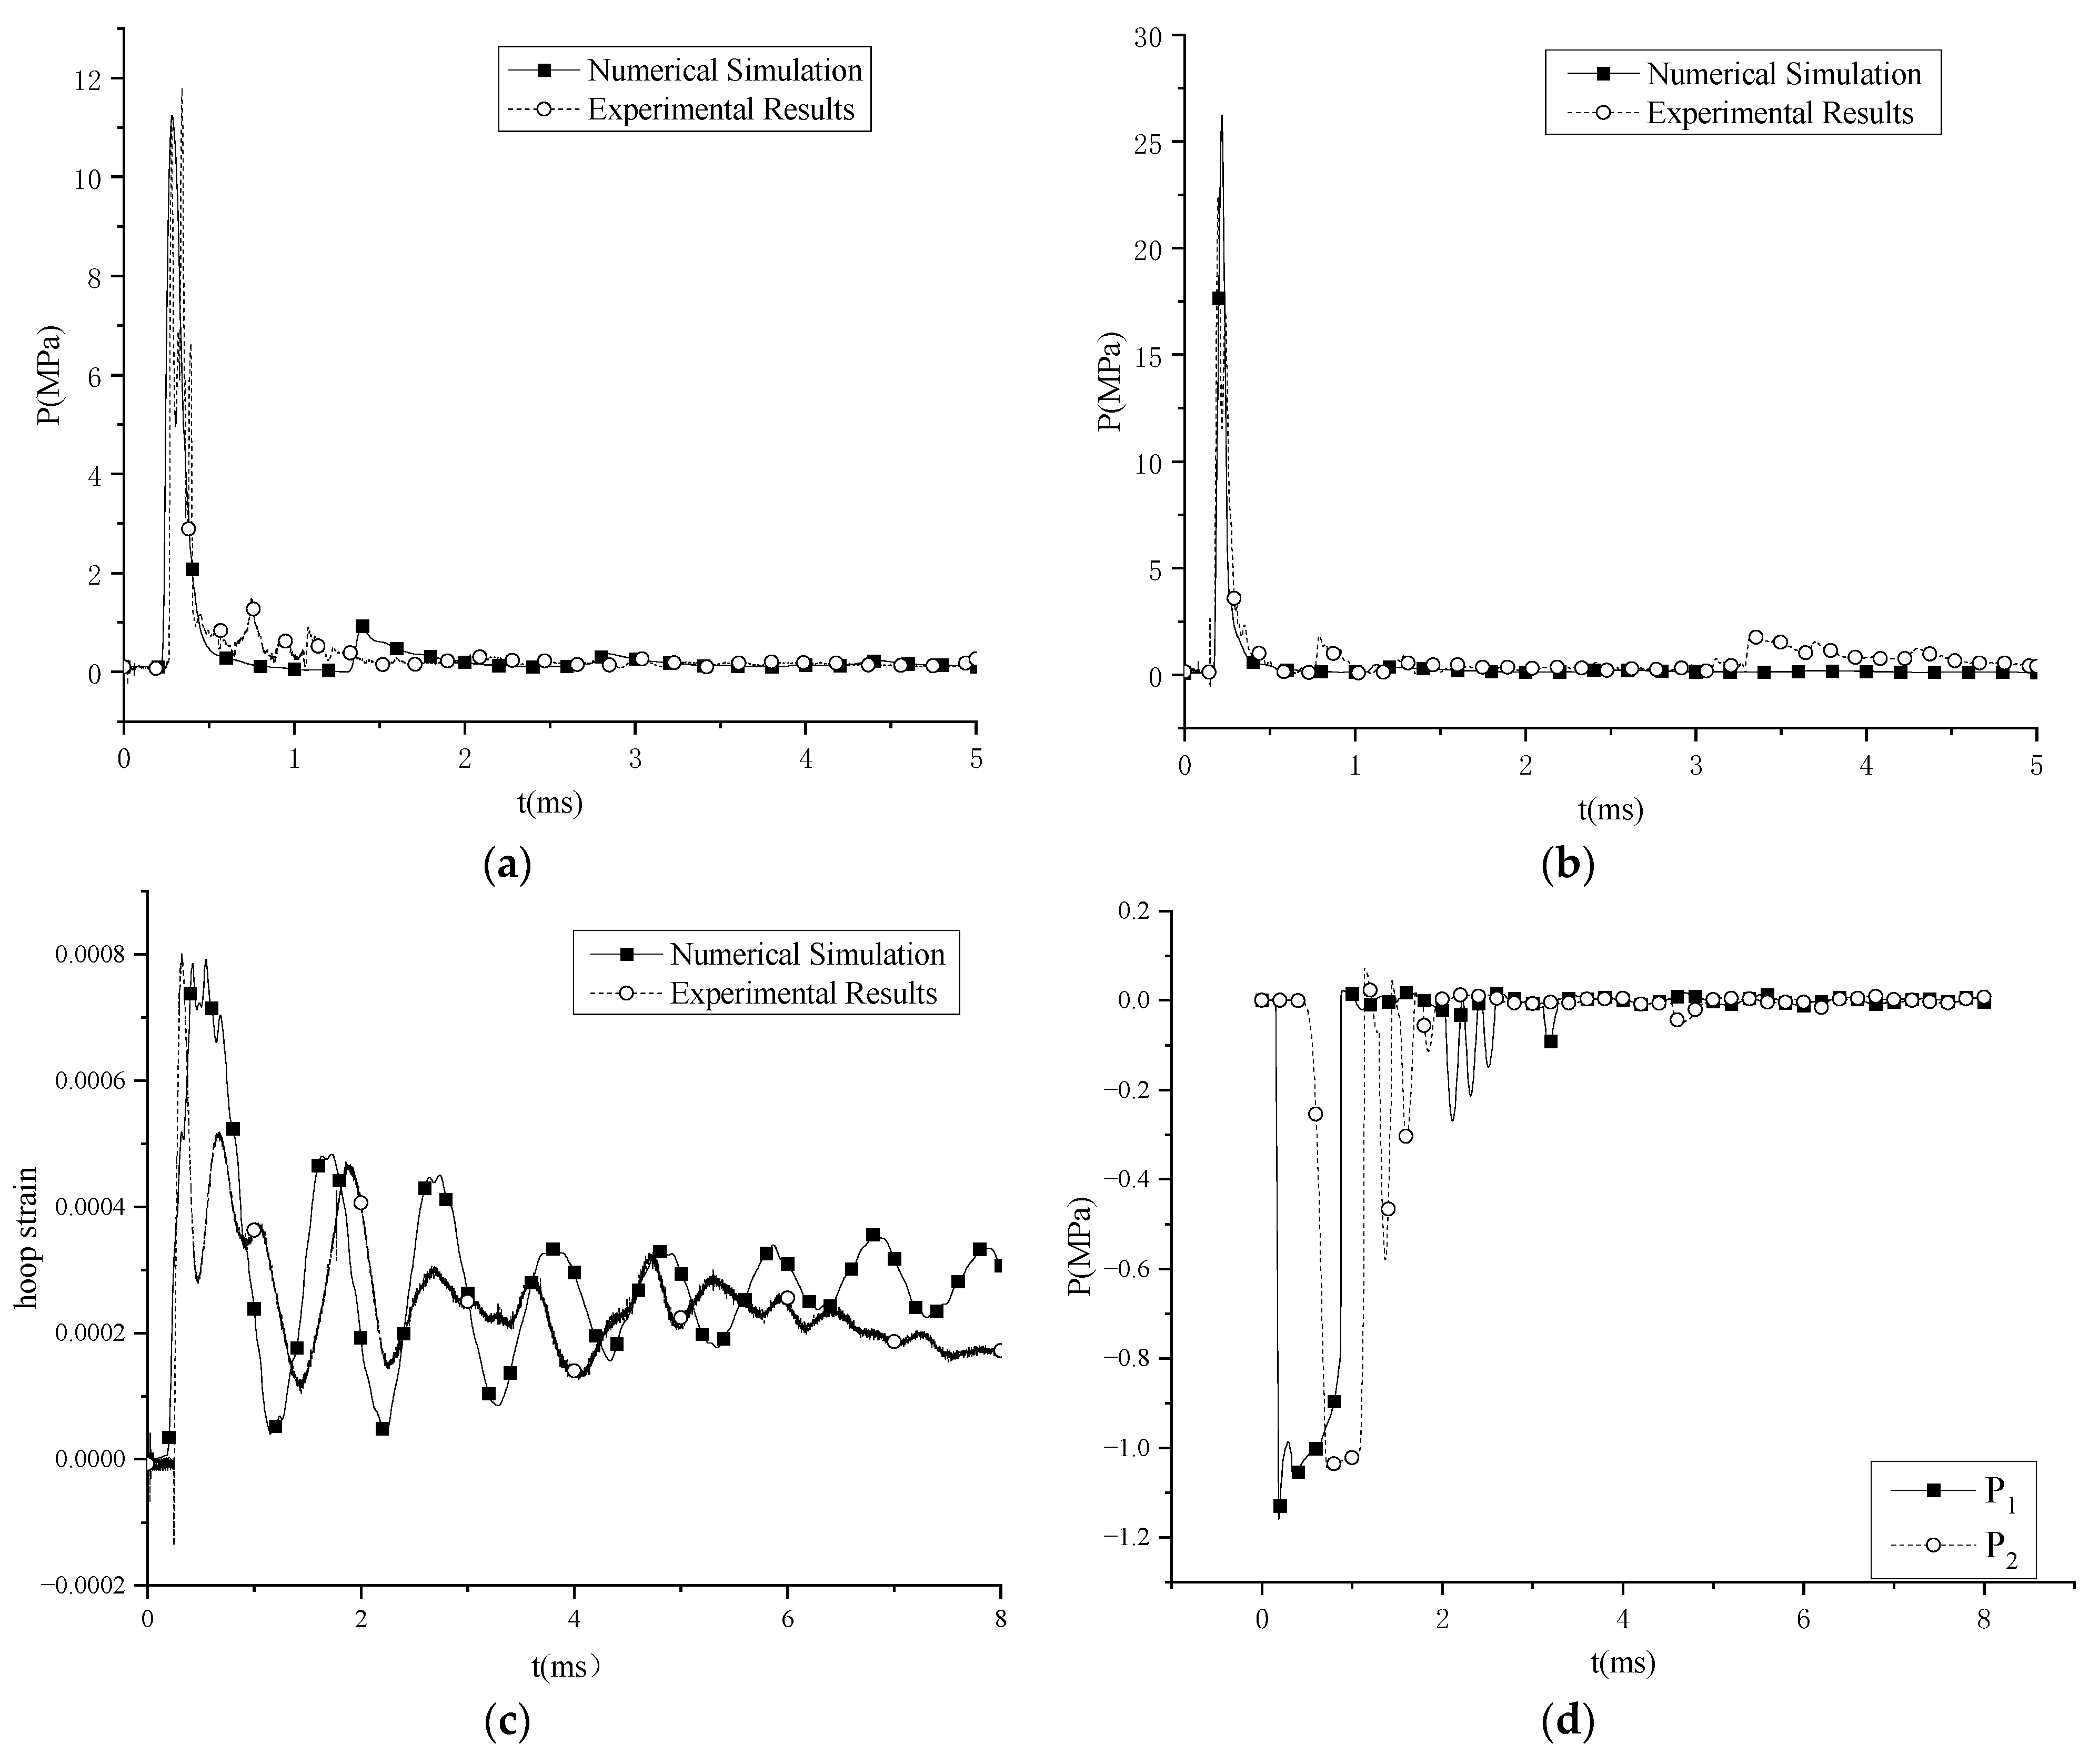
Figure A1 and Table A1 and Table A2 collect the representative validation evidence for the numerical framework, reproduced with attribution from [36]. These are the data from which the error metrics quoted in Section 2.1 are obtained: panels (a) and (b) document the blast-loading input (peak overpressures within 16.4%, average absolute error about 9.3% over five charge masses), panel (c) and Table A1 document the structural strain response (within 11% at the four instrumented points), and panel (d) and Table A2 document the interlayer stress transfer that underlies the load-controllability idealization of Section 3.2.1. The mesh-convergence study and the complete validation matrix, including the damage evolution of the tested models, remain in [36].
Table A1.
Measured and computed peak hoop strains at the four instrumented points (Model 1, 0.8 kg TNT) [36].
Table A2.
Measured and computed peak contact pressures at the foamed-concrete interlayer interfaces (Model 1, blast-center cross-section, 0.8 kg TNT) [36].
References
- Li, J.; Lu, Y.; Feng, X.; Wu, H. Analysis of internal explosion load characteristics and dynamic behavior in RC box structures. Explos. Shock Waves 2026, 46, 013101. [Google Scholar] [CrossRef]
- Cui, Y.; Wang, F.; Hu, H.; Xiong, Y.; Chen, P. Research on Deformation and Failure Law of Concrete Reinforced Steel Cylinder under Internal Blast Loading. Acta Armamentarii 2016, 37, 75–80. [Google Scholar]
- Liu, W.; Zhang, D.; Cheng, S.; Ma, Y. Progress in Research on Explosion Containers. Mod. Appl. Phys. 2023, 14, 61–69. [Google Scholar] [CrossRef]
- Hu, J.; Dong, Q.; Hu, B.; Ren, Y.; Huang, G. Research Progress on Internal Blast Effects and Dynamic Mechanical Behavior of Explosion Containment Vessels. Chin. J. Energ. Mater. 2024, 32, 986–1008. [Google Scholar] [CrossRef]
- Ning, P.; Tang, D. Experimental Study on Multi-Layer Composite Confinement Structures with Different Energy-Absorbing Layers Subjected to Internal Explosion. Buildings 2026, 16, 2114. [Google Scholar] [CrossRef] [Scilit]
- Gu, W.; Xu, J.; Liu, J.; Chen, J.; Hu, Y. Blast Resistance of Multi-Layer Aluminum-Foam Sandwich Panels. Chin. J. Energ. Mater. 2017, 25, 240–247. [Google Scholar] [CrossRef]
- Zhu, F.; Zhao, L.M.; Lu, G.X.; Wang, Z. Structural Response and Energy Absorption of Sandwich Panels with an Aluminum Foam Core Under Blast Loading. Adv. Struct. Eng. 2008, 11, 525–536. [Google Scholar] [CrossRef] [Scilit]
- Yun, N.R.; Shin, D.H.; Ji, S.W.; Shim, C.S. Experiments on Blast Protective Systems Using Aluminum Foam Panels. KSCE J. Civ. Eng. 2014, 18, 2153–2161. [Google Scholar] [CrossRef] [Scilit]
- Gao, Y.; Zu, X.; Huang, Z.; Huang, C. Dynamic Response and Energy Absorption Characteristic of Foam Concrete Under Blast Loading. J. Ballist. 2025, 37, 85–92. [Google Scholar] [CrossRef]
- Fang, Q.; Gao, C.; Kong, X.Z. A New Composite Protective Structure with Controllable Load on Main Load-Bearing Structure (I): Anti-Blast Mechanism. Explos. Shock Waves 2024, 44, 3–15. [Google Scholar] [CrossRef]
- Fang, Q.; Gao, C.; Kong, X.Z. A New Composite Protective Structure with Controllable Load on Main Load-Bearing Structure (II): Influence Factors and Design Philosophy. Explos. Shock Waves 2025, 45, 18–29. [Google Scholar] [CrossRef]
- Xu, H.; Qin, Y.; Zhang, W. Dynamic performance of polyurethane foam materials and their application in the field of engineering blast resistance. Prot. Eng. 2023, 45, 58–64. [Google Scholar]
- Zhang, Y. Testing and numerical simulation of the antiknock energy absorption of polyurethane foam aluminum composite structure. Explos. Shock Waves 2022, 42, 045101. [Google Scholar] [CrossRef]
- Li, X.; Guo, Z.; Li, Z.; Wang, Q. To Explore the Performance of Reducing Noise in Explosion-containment Vessel Designed of Composite Structure. Coal Mine Blasting 2016, 4, 15–18. [Google Scholar]
- Li, X.; Li, X.; Guo, Z. Discussion on Vibration Energy Dissipation Design of Explosion-Containment Vessel. Coal Mine Blasting 2017, 2, 1–3. [Google Scholar]
- Brekken, K.A.; Reyes, A.; Berstad, T.; Langseth, M.; Børvik, T. Sandwich Panels with Polymeric Foam Cores Exposed to Blast Loading: An Experimental and Numerical Investigation. Appl. Sci. 2020, 10, 9061. [Google Scholar] [CrossRef] [Scilit]
- Yang, Y.; Kong, X.; Fang, Q.; Gao, C. A calculation method for the minimum thickness of a foam concrete distribution layer under blast load. Explos. Shock Waves 2023, 43, 121–135. [Google Scholar] [CrossRef]
- Shi, S.; Kong, X.; Fang, Q. A Plastic-Damage Material Model for Foam Concrete Under Blast Loads. Int. J. Impact Eng. 2023, 177, 104596. [Google Scholar] [CrossRef] [Scilit]
- Shi, S.; Kong, X.; Fang, Q.; Yang, Y.; Gao, C. Application of Plastic-Damage Material Model for Foam Concrete in Composite Protective Structure. Explos. Shock Waves 2024, 44, 025101. [Google Scholar] [CrossRef]
- Wang, E.; Li, Q.; Sun, G. Computational Analysis and Optimization of Sandwich Panels with Homogeneous and Graded Foam Cores for Blast Resistance. Thin-Walled Struct. 2020, 147, 106494. [Google Scholar] [CrossRef] [Scilit]
- Zhang, R.; Zhou, B.; Zhi, X.; Fan, F.; Zheng, D.; Song, Y.; Yang, D. Experimental and Numerical Study of Foam Sandwich Panels Under TNT and Gas Explosions. Thin-Walled Struct. 2025, 216, 113688. [Google Scholar] [CrossRef] [Scilit]
- Yang, Y.; Kong, X.; Fang, Q. Non-dimensional analysis on blast wave propagation in foam concrete: Minimum thickness to avoid stress enhancement. Def. Technol. 2024, 36, 30–46. [Google Scholar] [CrossRef] [Scilit]
- Zhou, H.; Li, H.; Wang, Z.; Yan, D.; Wang, W.; Zhang, G.; Cheng, Z.; Sun, S.; Wang, M. Experimental investigation on the anti-detonation performance of composite structure containing foam geopolymer backfill material. Def. Technol. 2025, 43, 304–318. [Google Scholar] [CrossRef] [Scilit]
- Shang, W.; Huang, Z.; Zu, X.; Xiao, Q.; Jia, X. Influence Mechanism of Foamed Concrete Coating Thickness on the Blast Resistance of RC Walls. Materials 2022, 15, 5473. [Google Scholar] [CrossRef] [Scilit] [PubMed]
- Guo, X.; Li, Y.; McCrum, D.P.; Hu, Y.; Bai, Z.; Zhang, H.; Li, Z.; Wang, X. A Reinforced Concrete Shear Wall Building Structure Subjected to Internal TNT Explosions: Test Results and Numerical Validation. Int. J. Impact Eng. 2024, 190, 104950. [Google Scholar] [CrossRef] [Scilit]
- Shang, H.; Guo, W.; Li, Y.; Pang, W.; Liu, H. Experimental Study on the Damage Mechanism of Reinforced Concrete Shear Walls Under Internal Explosion. Appl. Sci. 2026, 16, 48. [Google Scholar] [CrossRef] [Scilit]
- Zhou, Y.; Zheng, R.; Wang, W.; Hu, Y.; Bai, Z.; Yao, H.; Li, X. Damage Effect of RC Frame–Masonry Wall Structures Subjected to Internal Explosion. Chin. J. High Press. Phys. 2025, 39, 095301. [Google Scholar] [CrossRef]
- Liu, J.; Wang, W.; Li, Y.; Xu, Z.; Zhou, Y. Blast resistance of reinforced concrete single room under internal explosive load. Explos. Shock Waves 2025. Epub ahead of printing. [Google Scholar] [CrossRef]
- Bai, Z.; Zhou, Y.; Zheng, R.; Hu, Y.; Qi, W.; Cui, Q.; Li, Y. Analysis of Internal Explosion Dynamic Response of RC Frame-masonry Infill Wall Structure and Machine Learning Prediction Model. Acta Armamentarii 2025, 46, 250762. [Google Scholar]
- UFC 3-340-02; Unified Facilities Criteria (UFC): Structures to Resist the Effects of Accidental Explosions. Department of Defense of the United States of America (DoD): Washington, DC, USA, 2008.
- TM 5-855-1; Fundamentals of Protective Design for Conventional Weapons. US Army Technical Manual. HQ Dept of the Army: Washington, DC, USA, 1986.
- Krauthammer, T. Modern Protective Structures; CRC Press: Boca Raton, FL, USA, 2008. [Google Scholar]
- Zhang, T.; Liu, Z.; Li, S.; Lei, J.; Wang, Z. Elastic-plastic response for the foam-filled sandwich circular tube under internal blast loading. Int. J. Impact Eng. 2024, 188, 104945. [Google Scholar] [CrossRef] [Scilit]
- Li, J.; Zheng, Y.; Li, P.; Liu, Y.; Zhang, J.; Wang, H. Damage assessment of multi-layered concrete under internal explosion: A coupled numerical approach. Int. J. Impact Eng. 2026, 209, 105540. [Google Scholar] [CrossRef] [Scilit]
- Wattad, O.; Grisaro, H. A simplified decoupled methodology for predicting the blast response of foam-cladded structures. Int. J. Impact Eng. 2026, 212, 105666. [Google Scholar] [CrossRef] [Scilit]
- Ning, P.; Tang, D. Dynamic Response and Failure Mechanisms of Multi-Layer Composite Confined Structures Under Internal Blast Loading. Buildings 2026, 16, 2821. [Google Scholar] [CrossRef] [Scilit]
- Yang, J.; Hao, Y.; Peng, D.; Shi, J.; Zhang, Y. Machine Learning-Based Methods for Predicting the Structural Damage and Failure Mode of RC Slabs Under Blast Loading. Buildings 2025, 15, 1221. [Google Scholar] [CrossRef] [Scilit]
- Shankabattula, V.; Swain, A.K.; Sawant, V.A. Dynamic and Sensitivity Analysis of Blast-Resistant Aluminum Foam Sandwich Panel. Mech. Adv. Mater. Struct. 2026, 33, 2663047. [Google Scholar] [CrossRef] [Scilit]
- Malvar, L.J.; Ross, C.A. Review of Strain Rate Effects for Concrete in Tension. ACI Mater. J. 1998, 95, 735–739. [Google Scholar] [CrossRef] [Scilit] [PubMed]
- Yang, Z.; Cai, C.; Zhai, J. Research on Backfill Materials for Tunnels Against Ground-Penetrating Explosions; The Third Research Institute of the Corps of Engineers: Luoyang, China, 1992.
- Gibson, L.J.; Ashby, M.F. Cellular Solids: Structure and Properties, 2nd ed.; Cambridge University Press: Cambridge, UK, 1997; pp. 110–122. [Google Scholar] [CrossRef] [Scilit]
- Chen, J.J. Study on Blast Resistance Performance of Confined Structures Under Close-In Internal Explosion Effects; Postdoc-toral Report; PLA University of Science and Technology: Nanjing, China, 2004. [Google Scholar]
- Ning, P.; Yan, B.; Shen, Z. Explosion load characteristics of cylindrical charges in confined structures. J. Proj. Rocket. Missile Guid 2026. Available online: https://link.cnki.net/urlid/61.1234.TJ.20260806.1127.006 (accessed on 10 September 2026).
- Moir, D.C. Safety Analysis of the M-2 Confinement Systems; LA-TM-264; Los Alamos National Laboratory: Los Alamos, NM, USA, 1979.
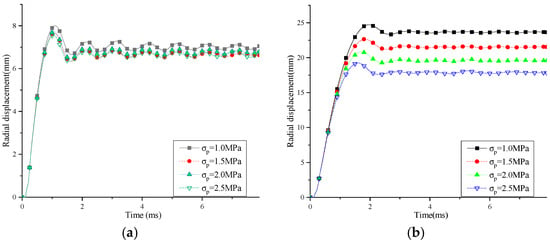
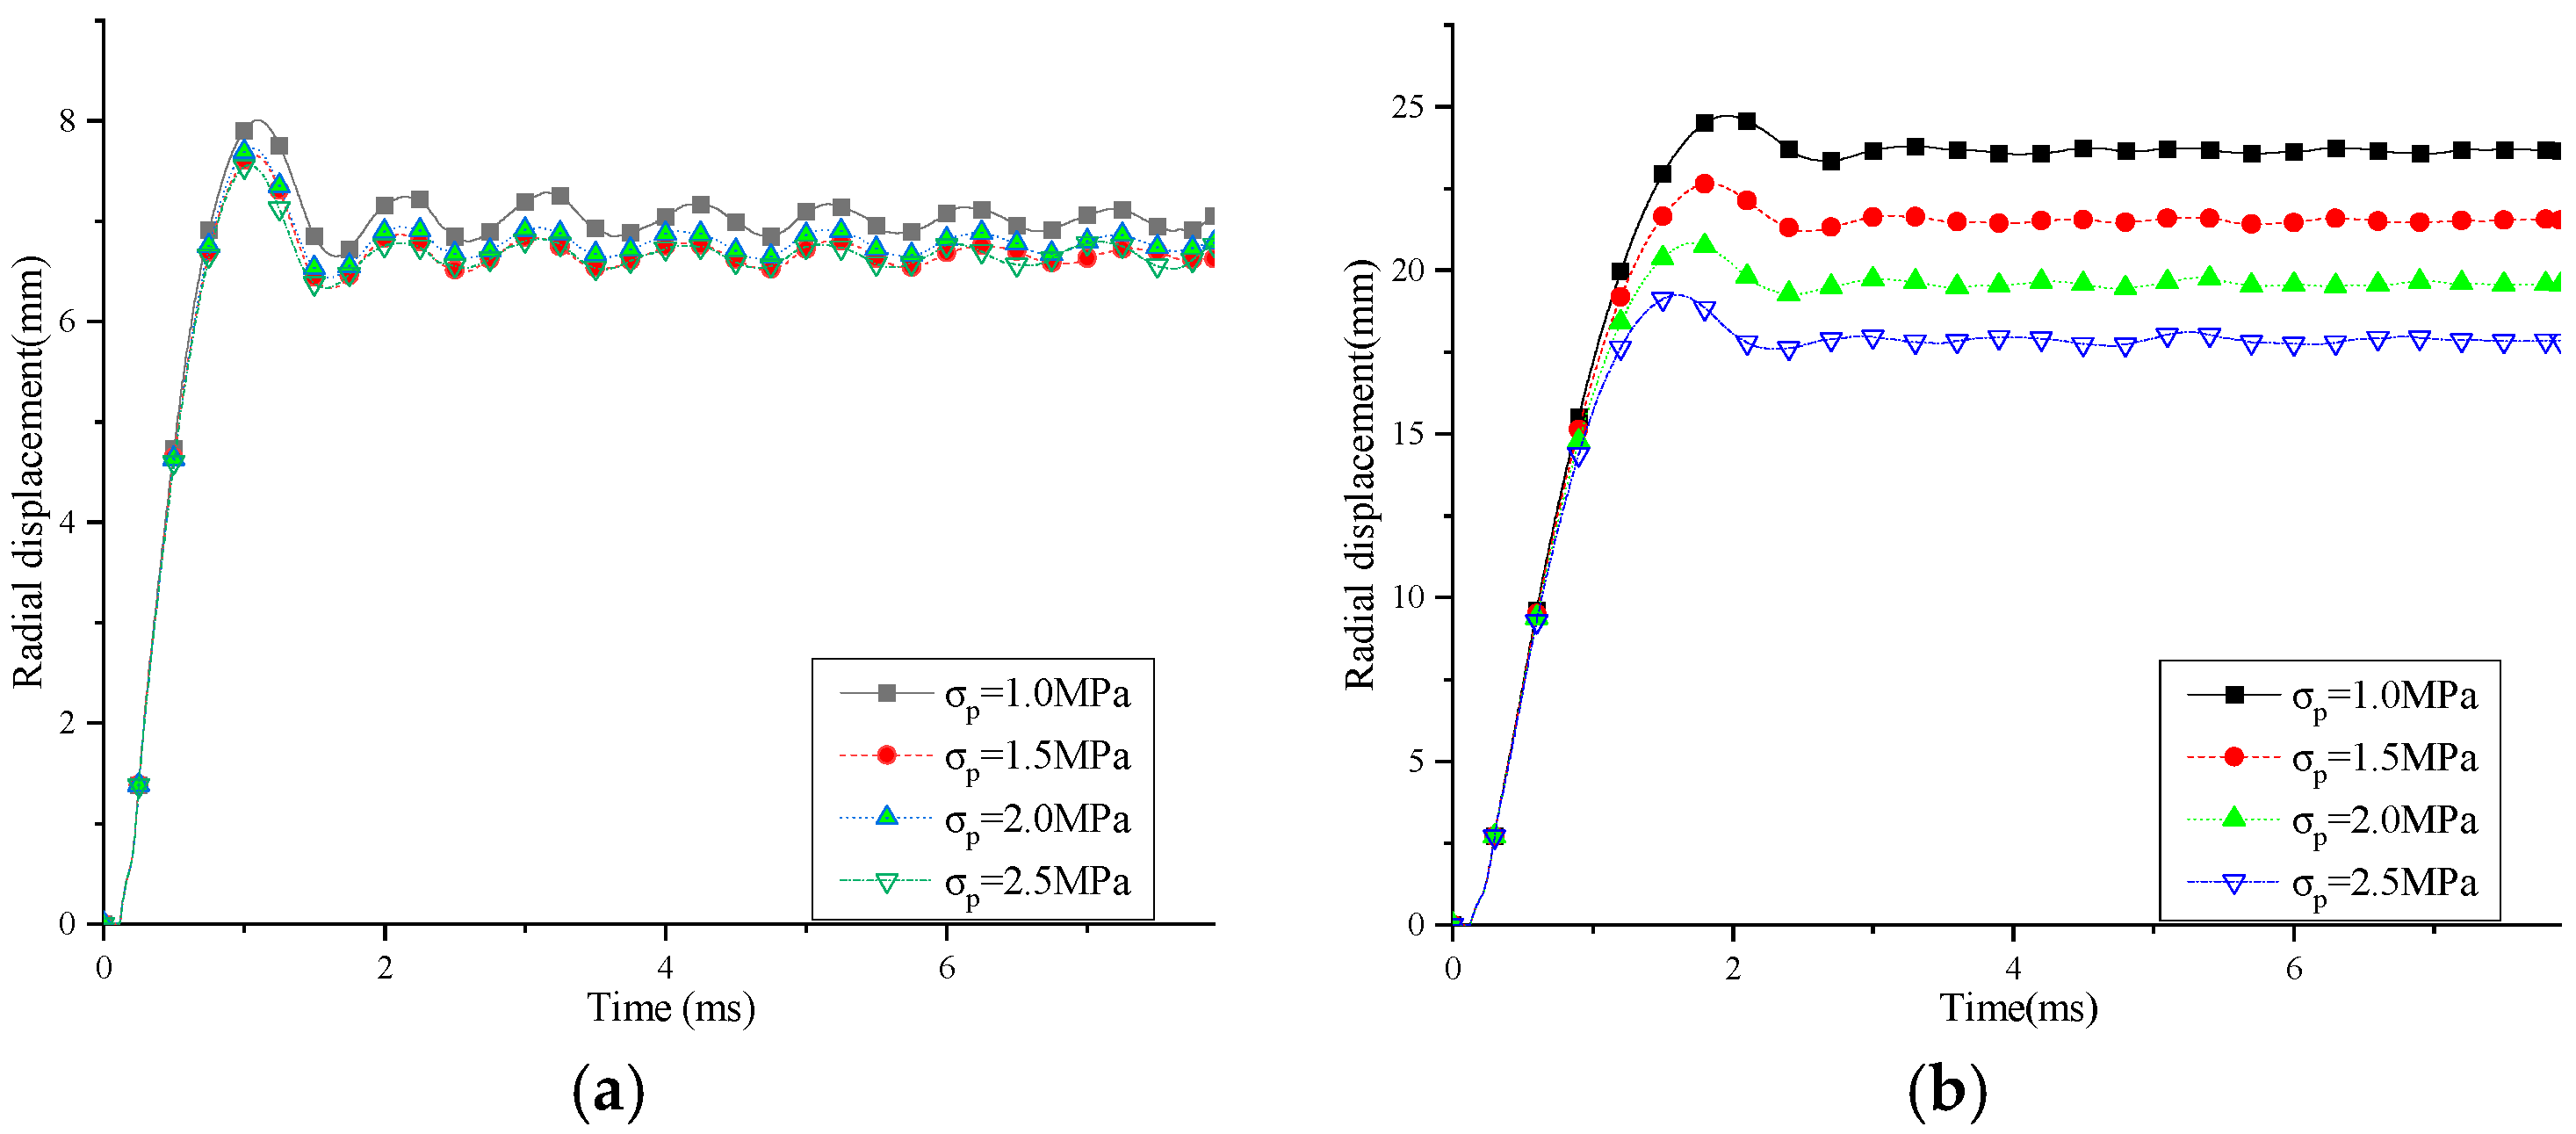
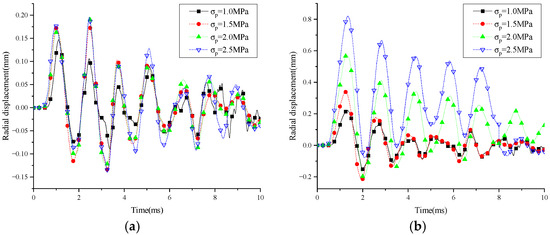
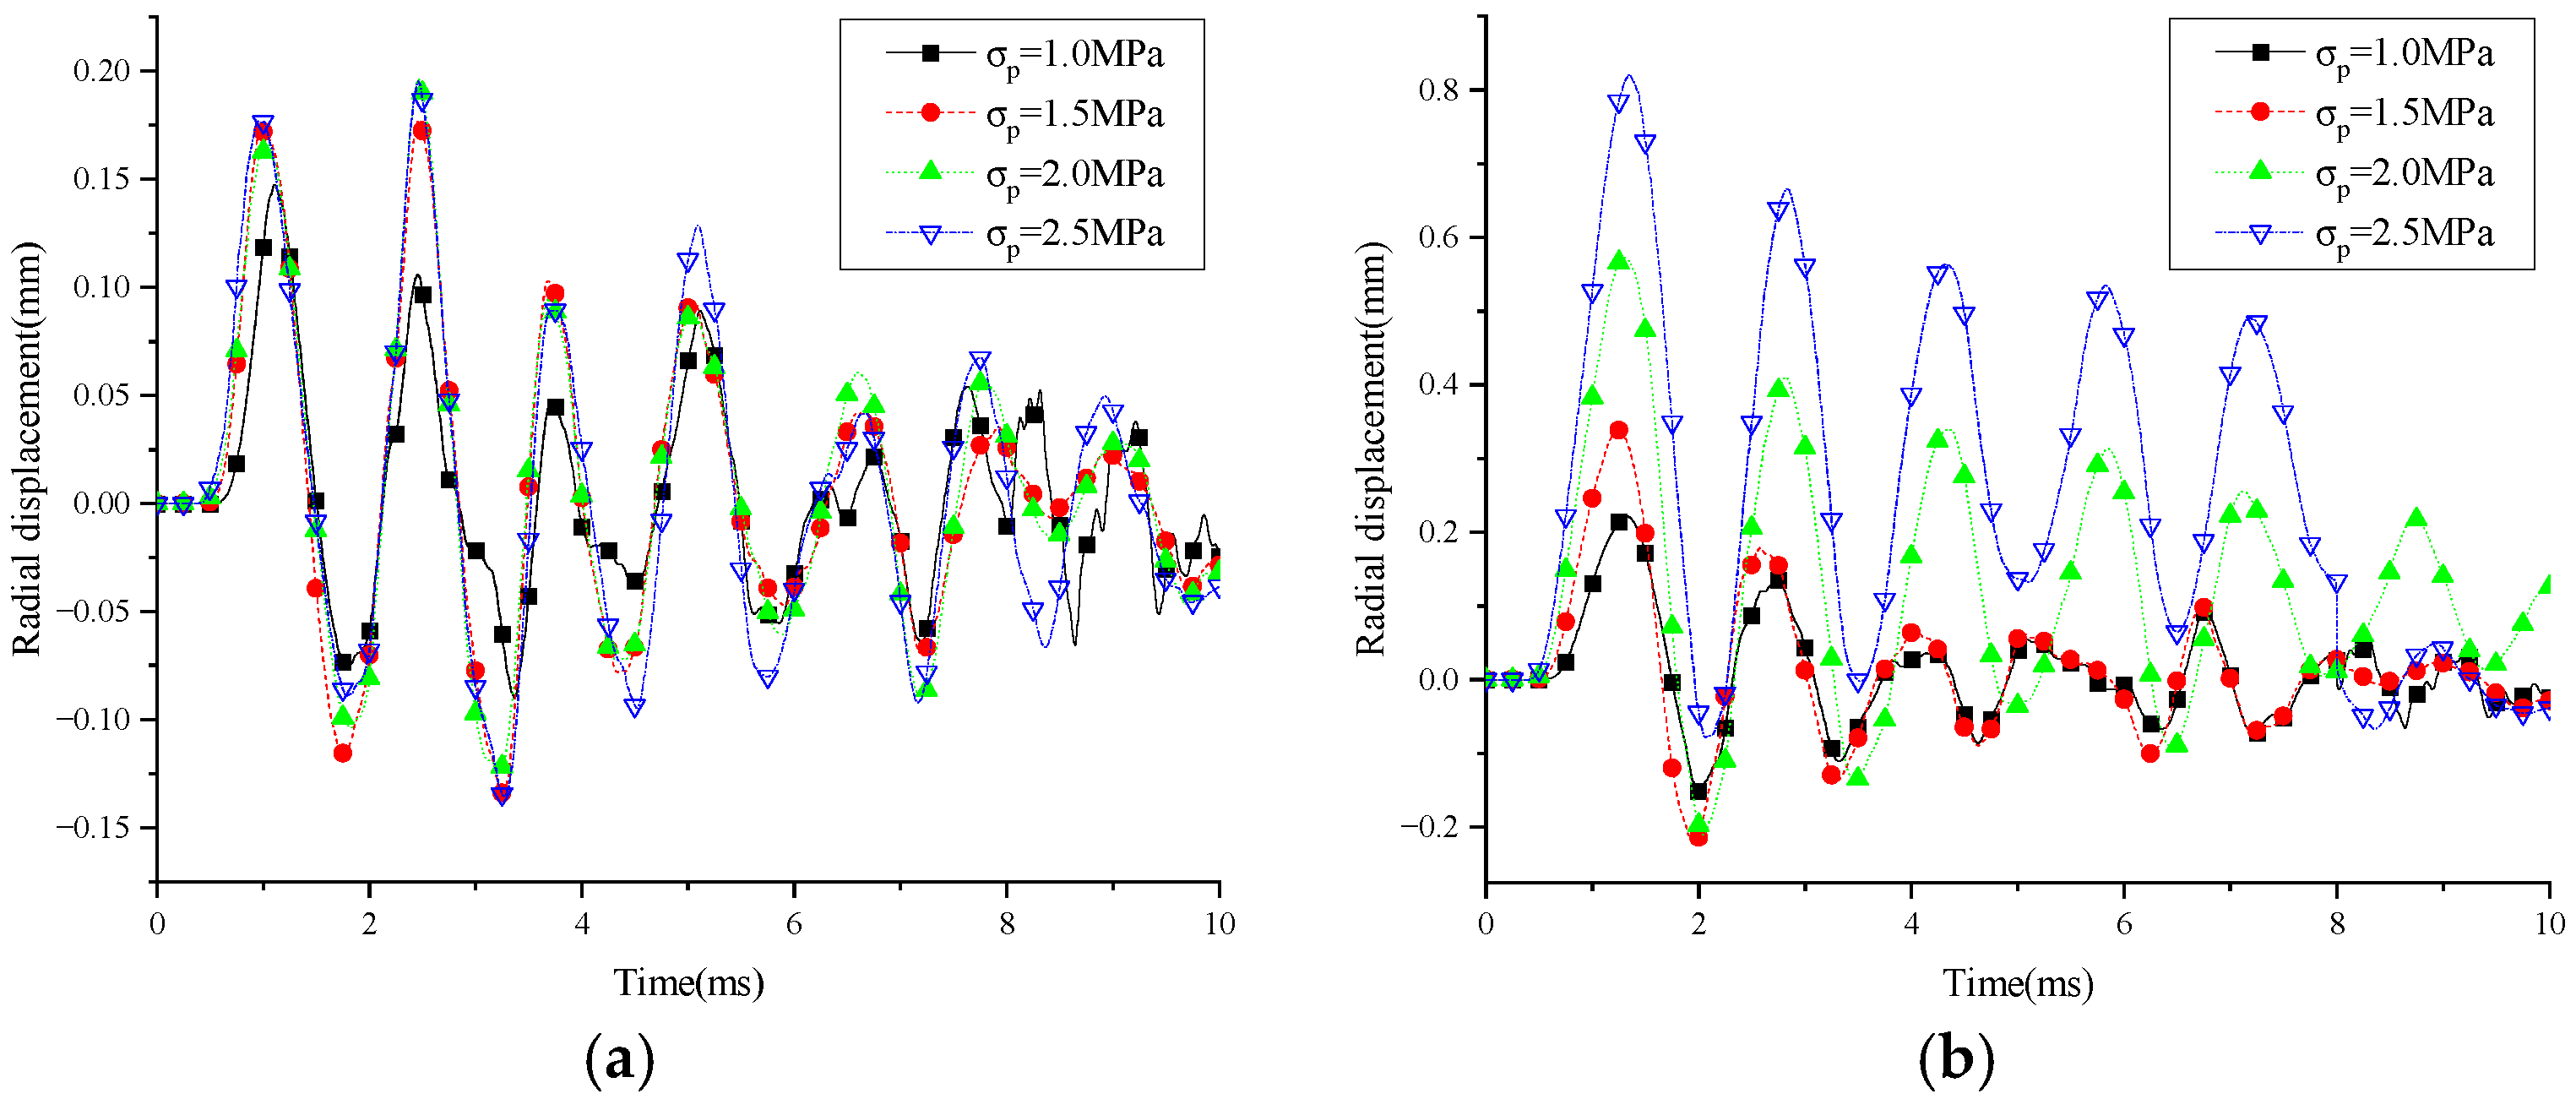
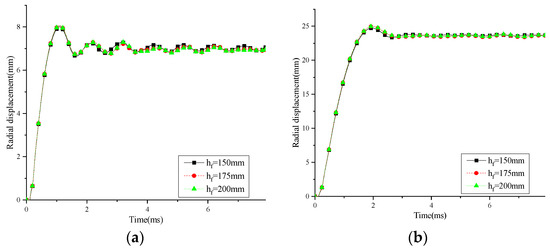
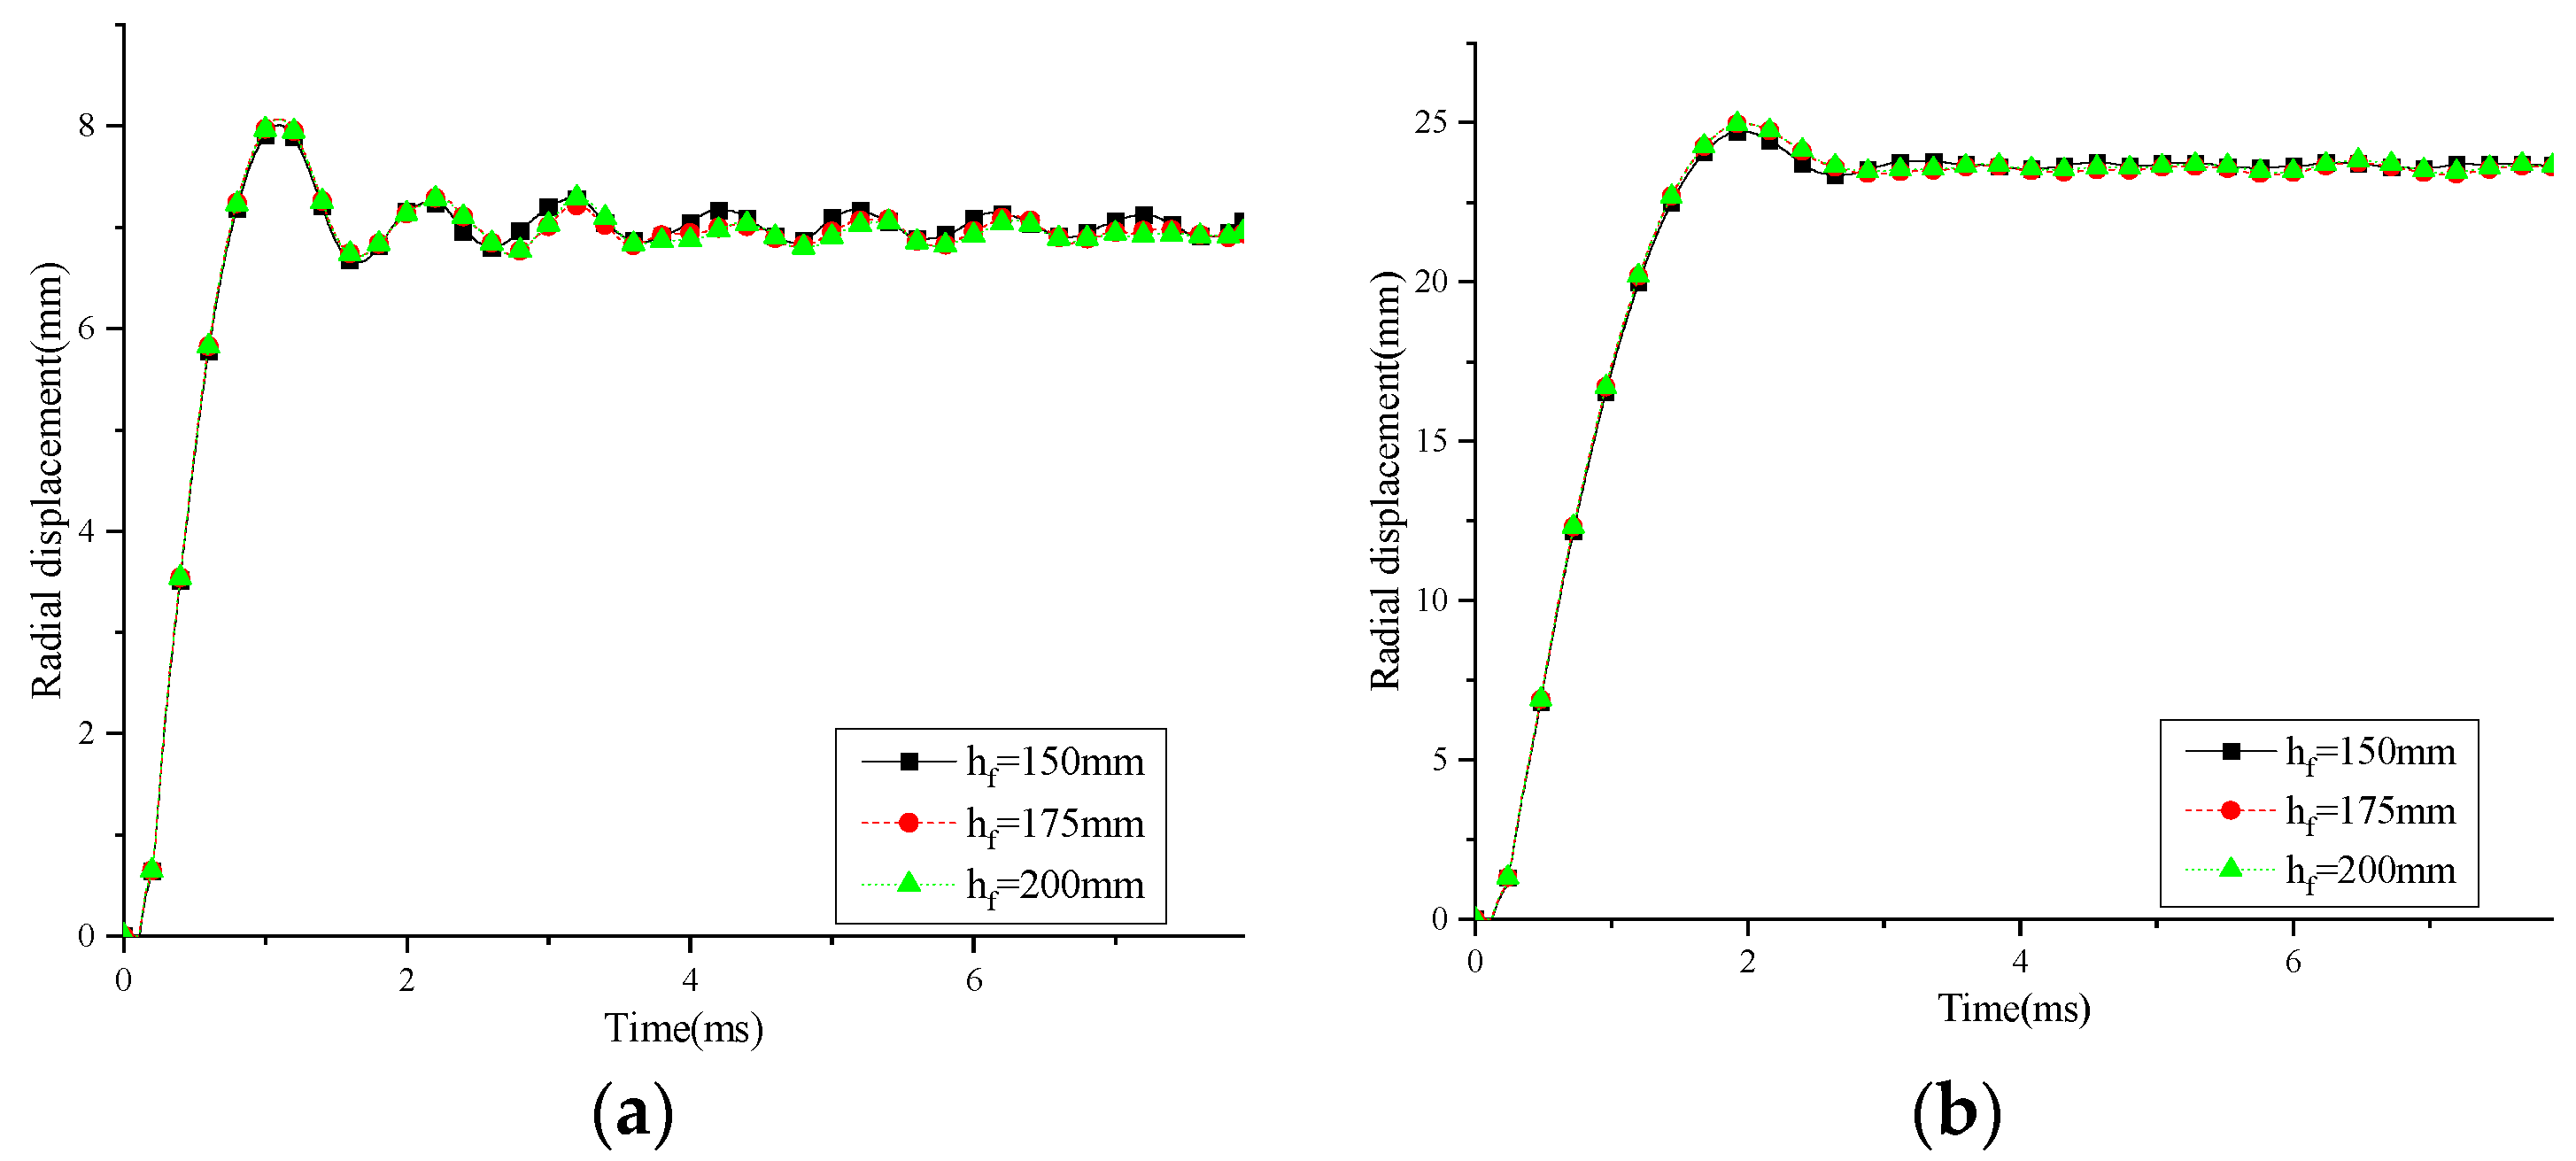
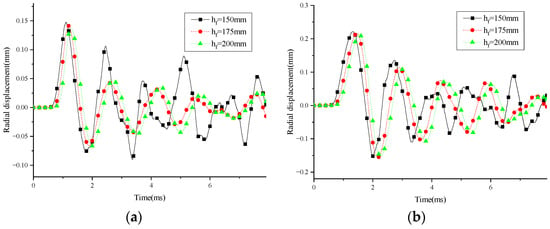
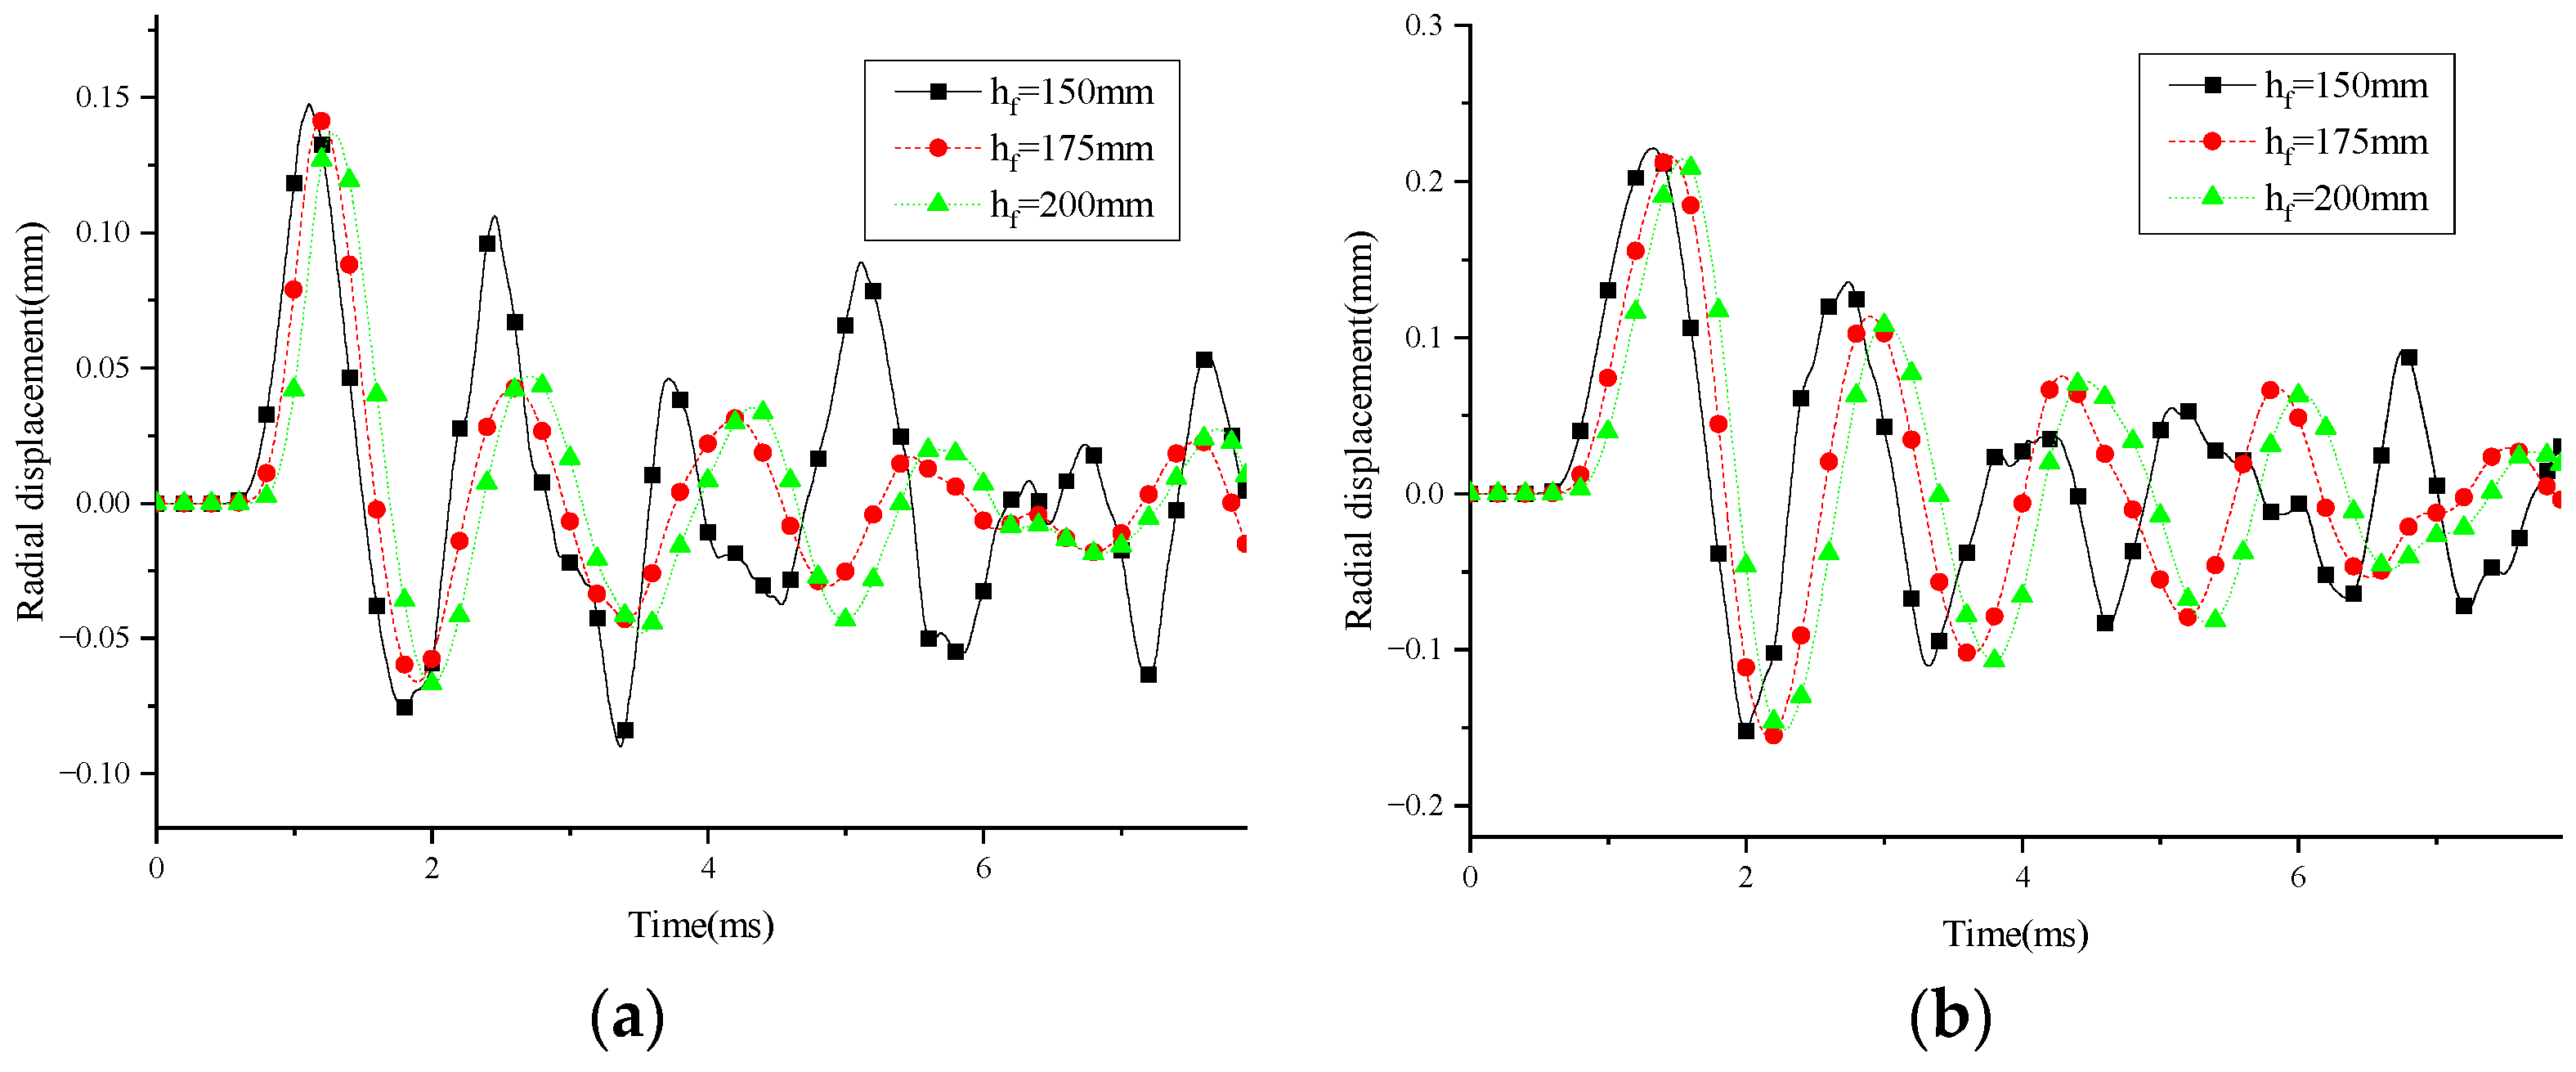
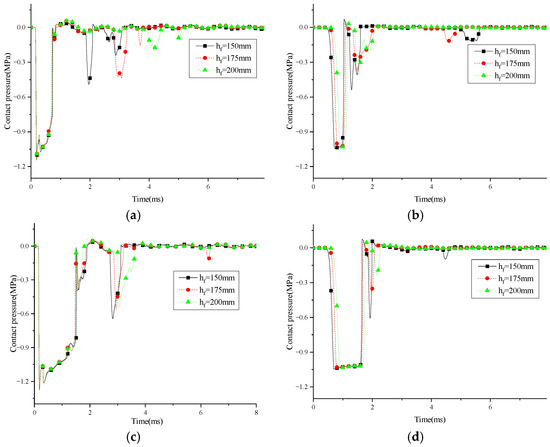
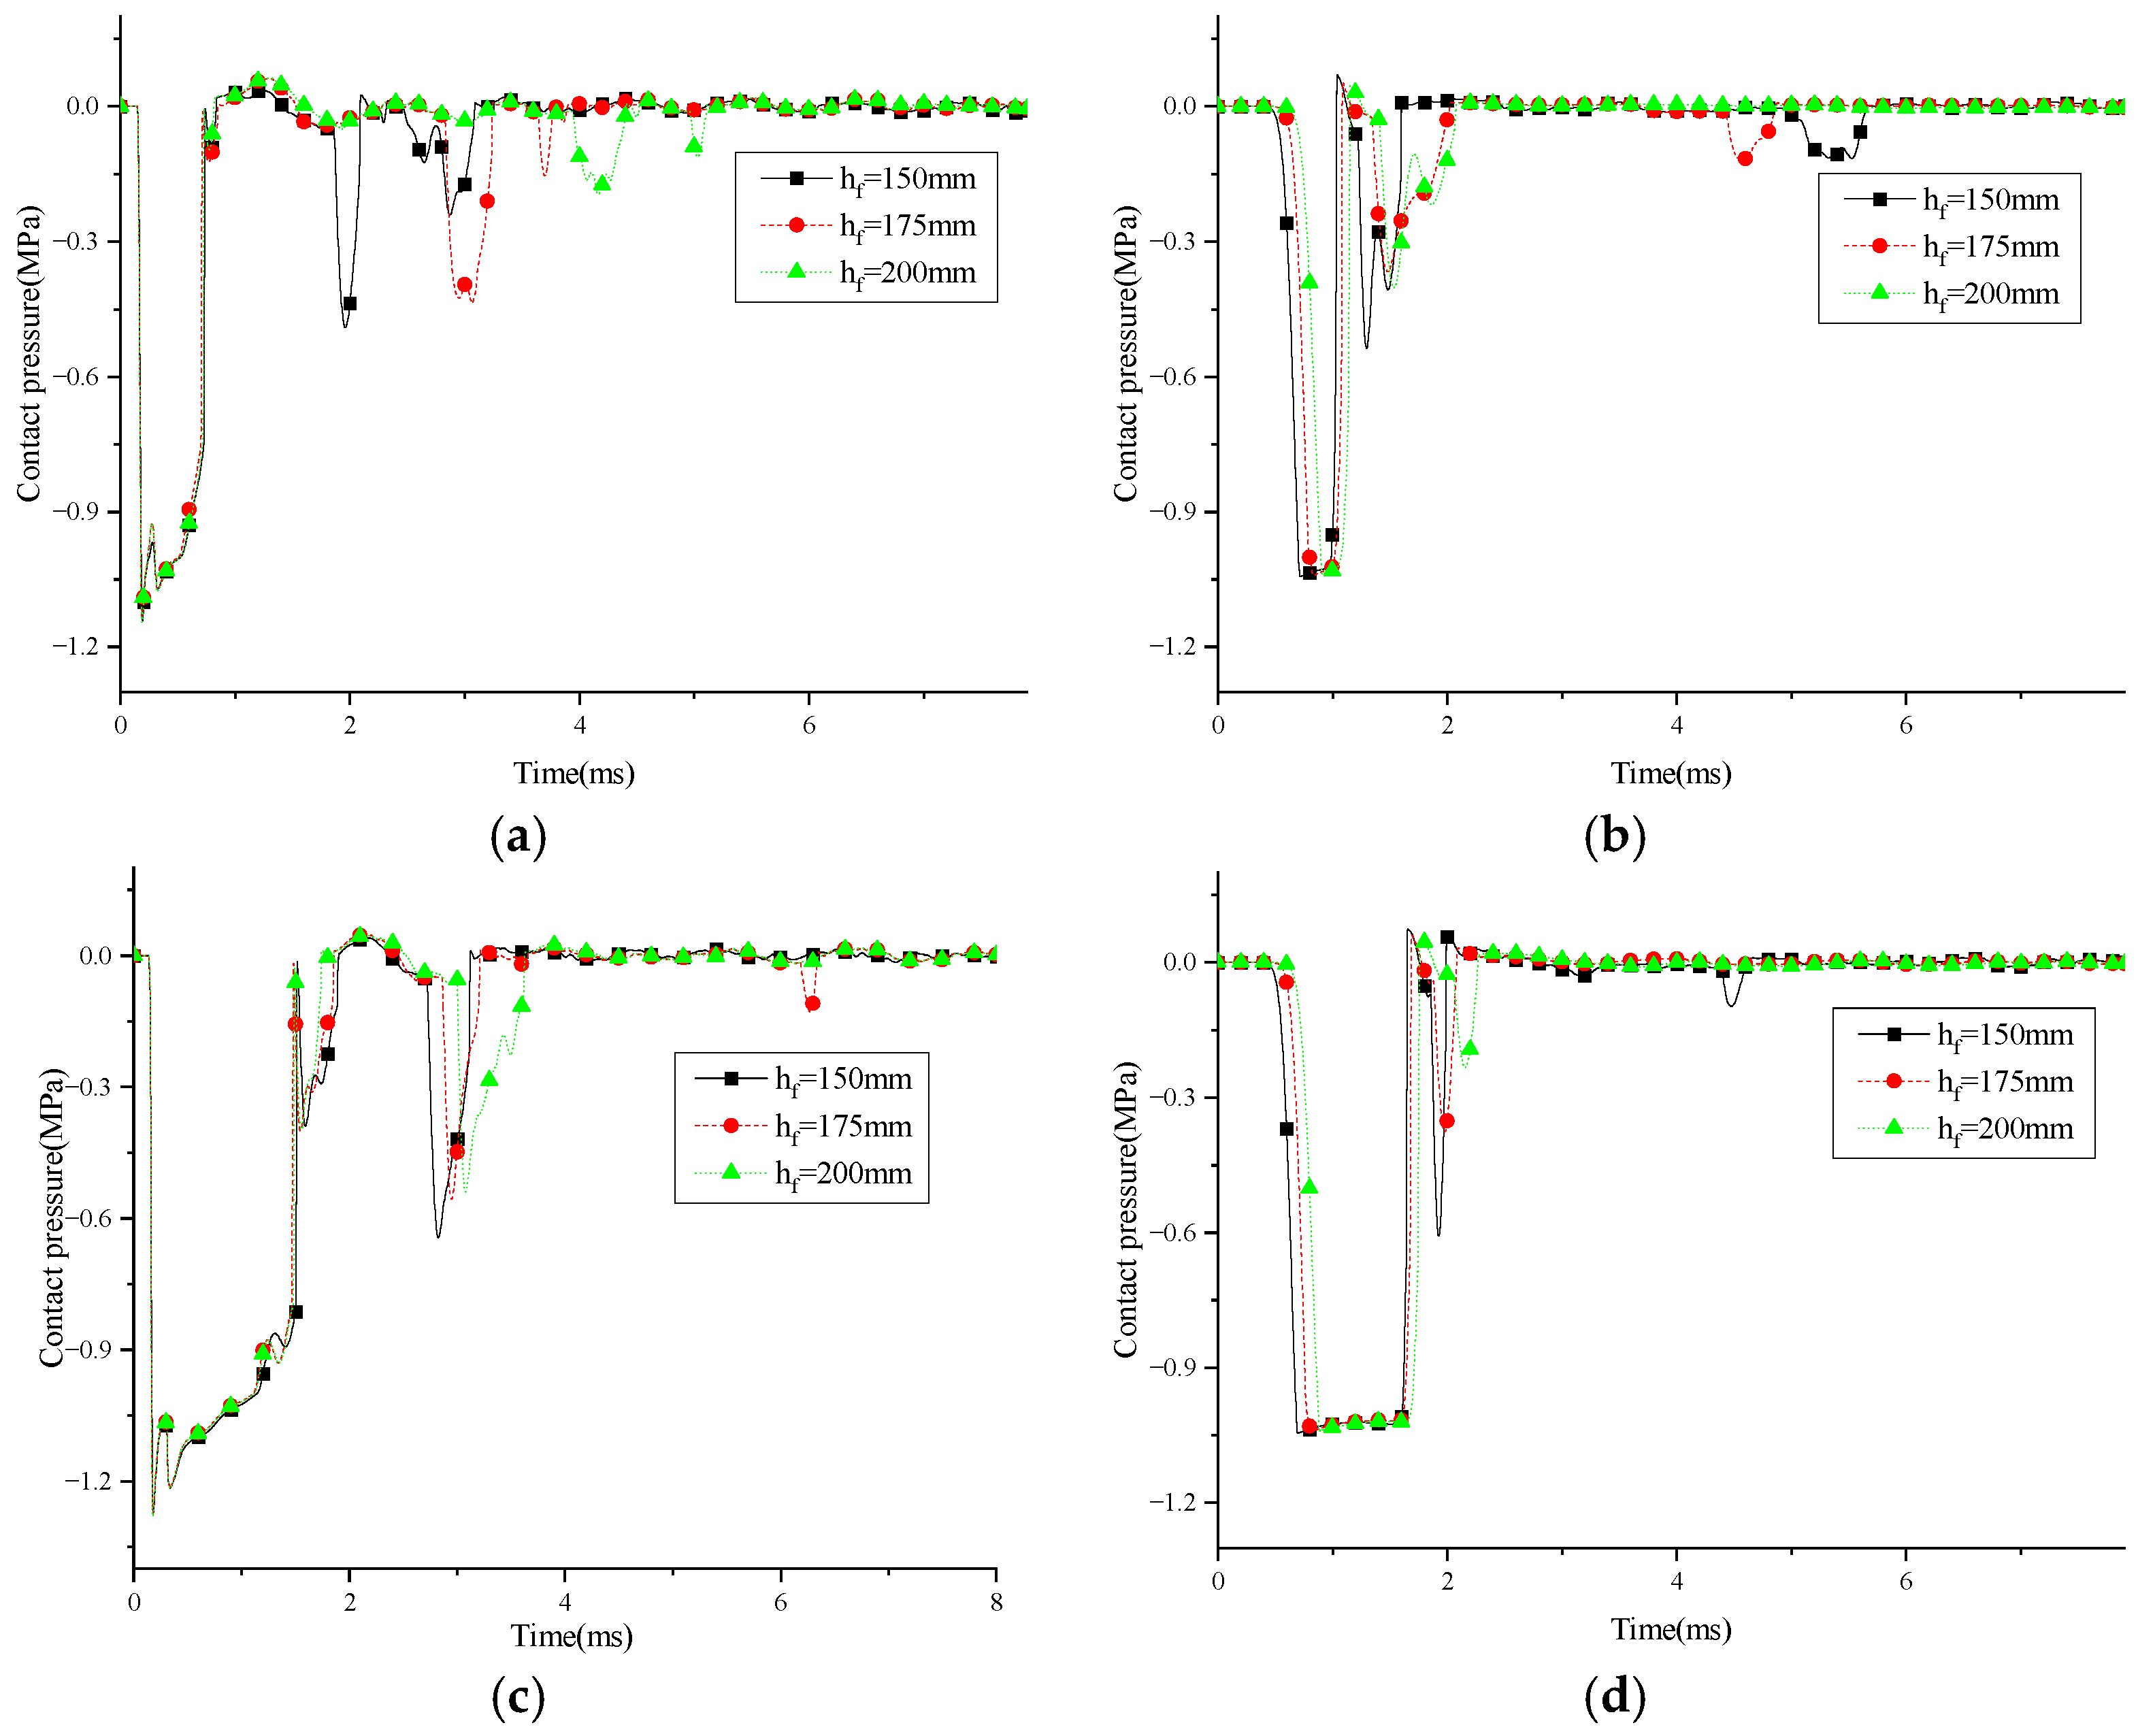
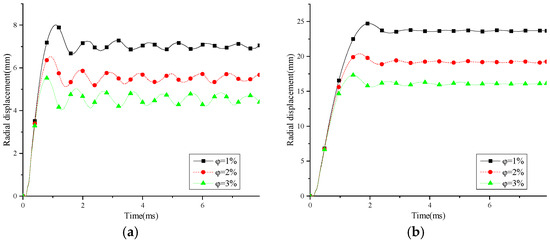
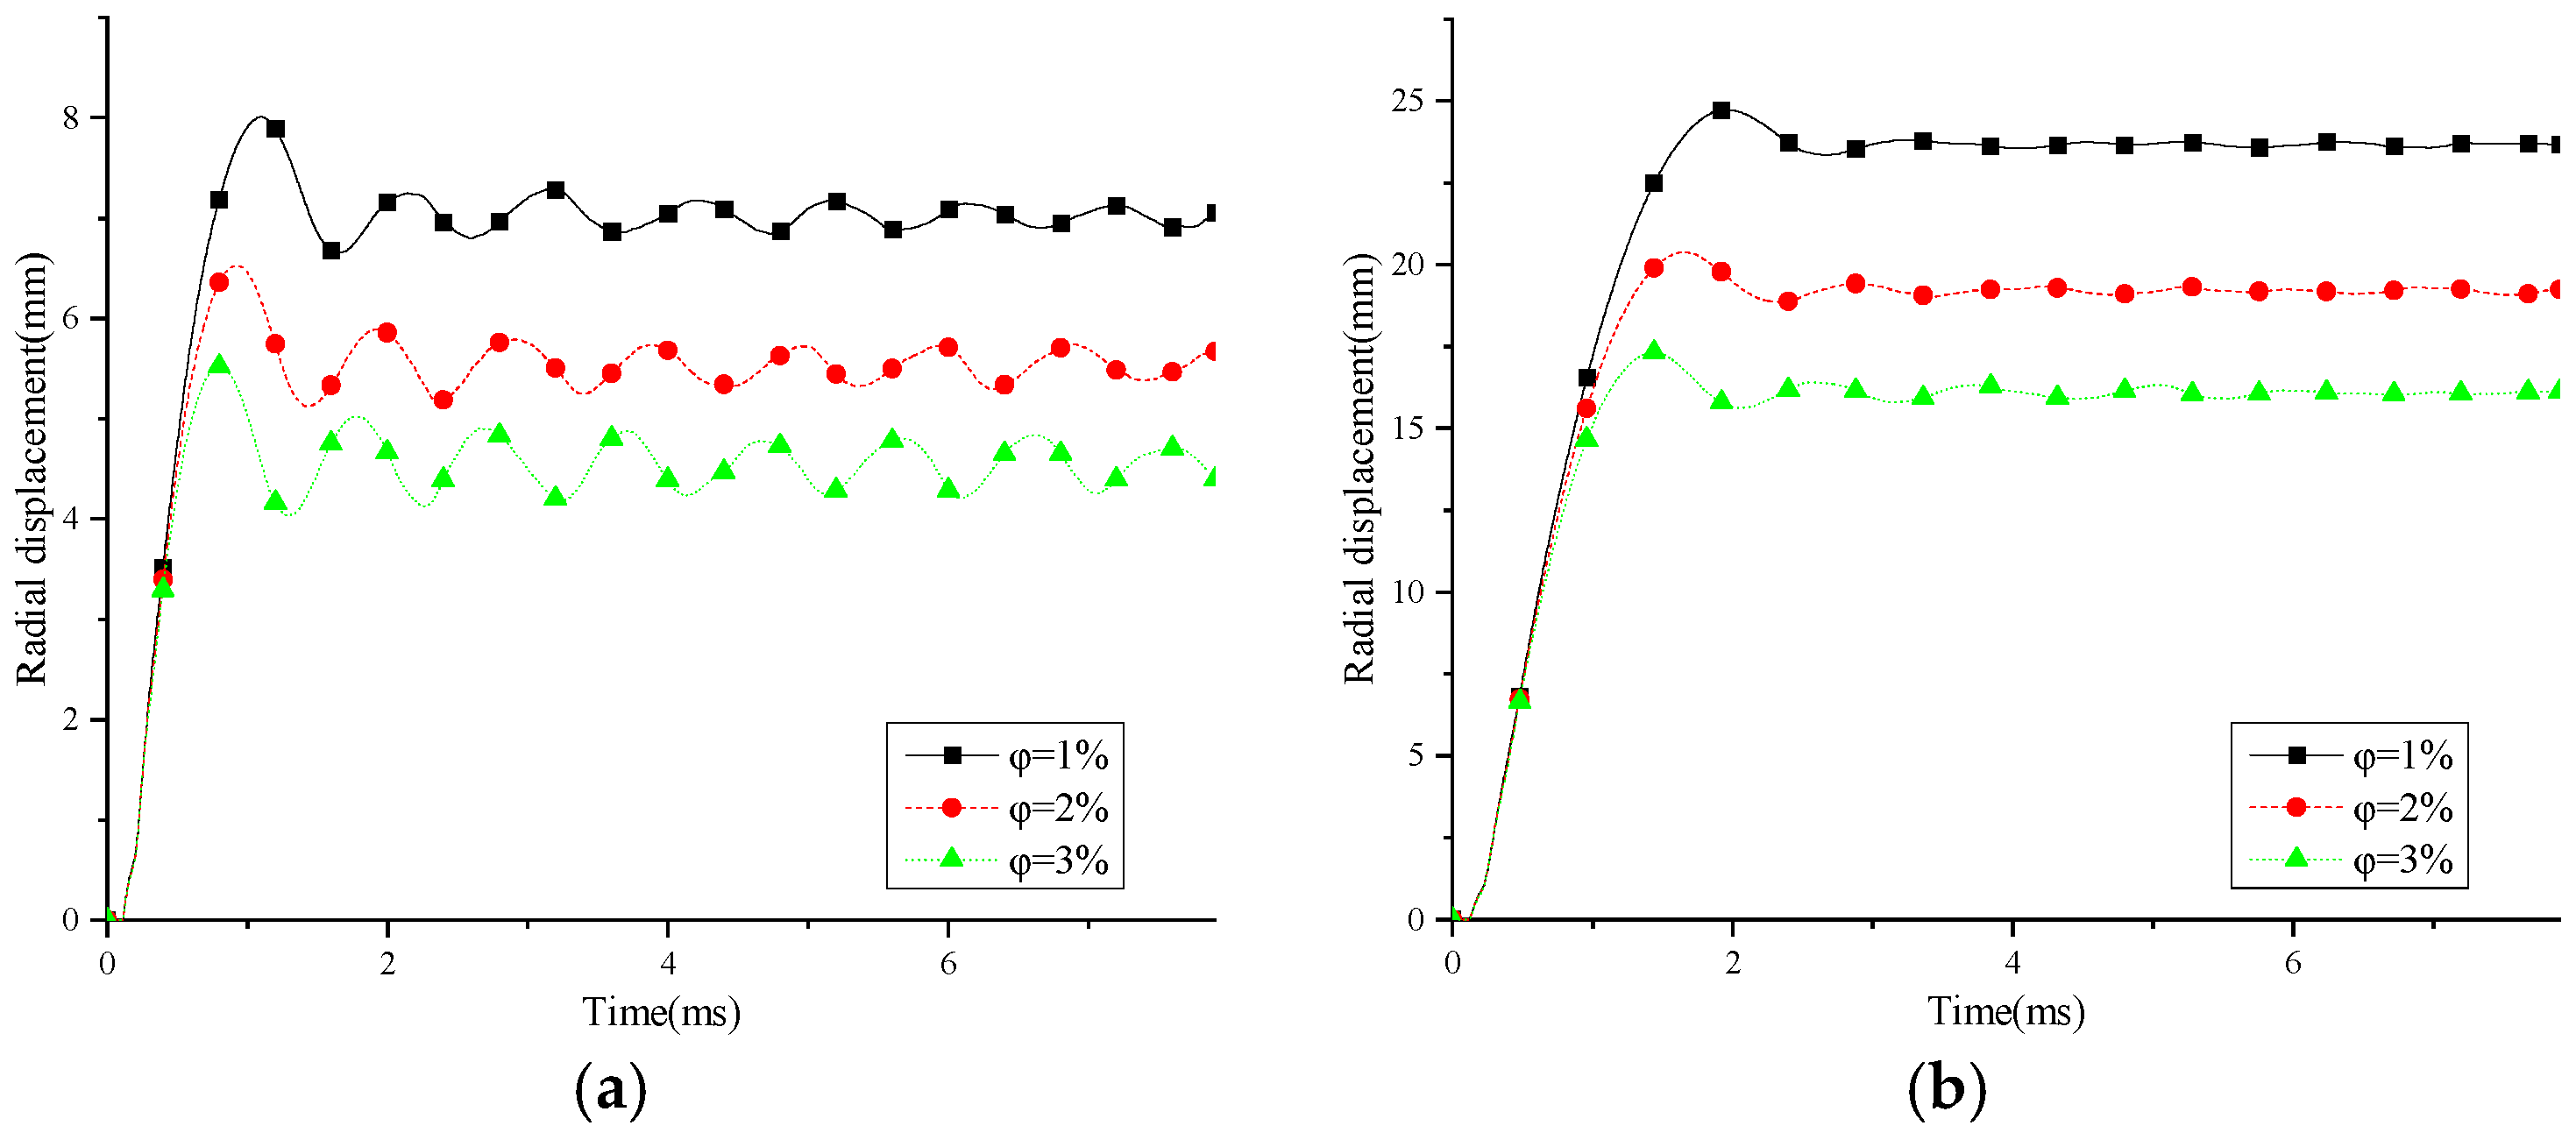
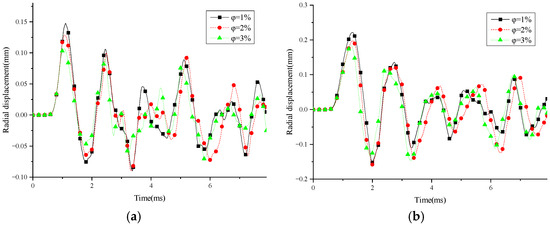
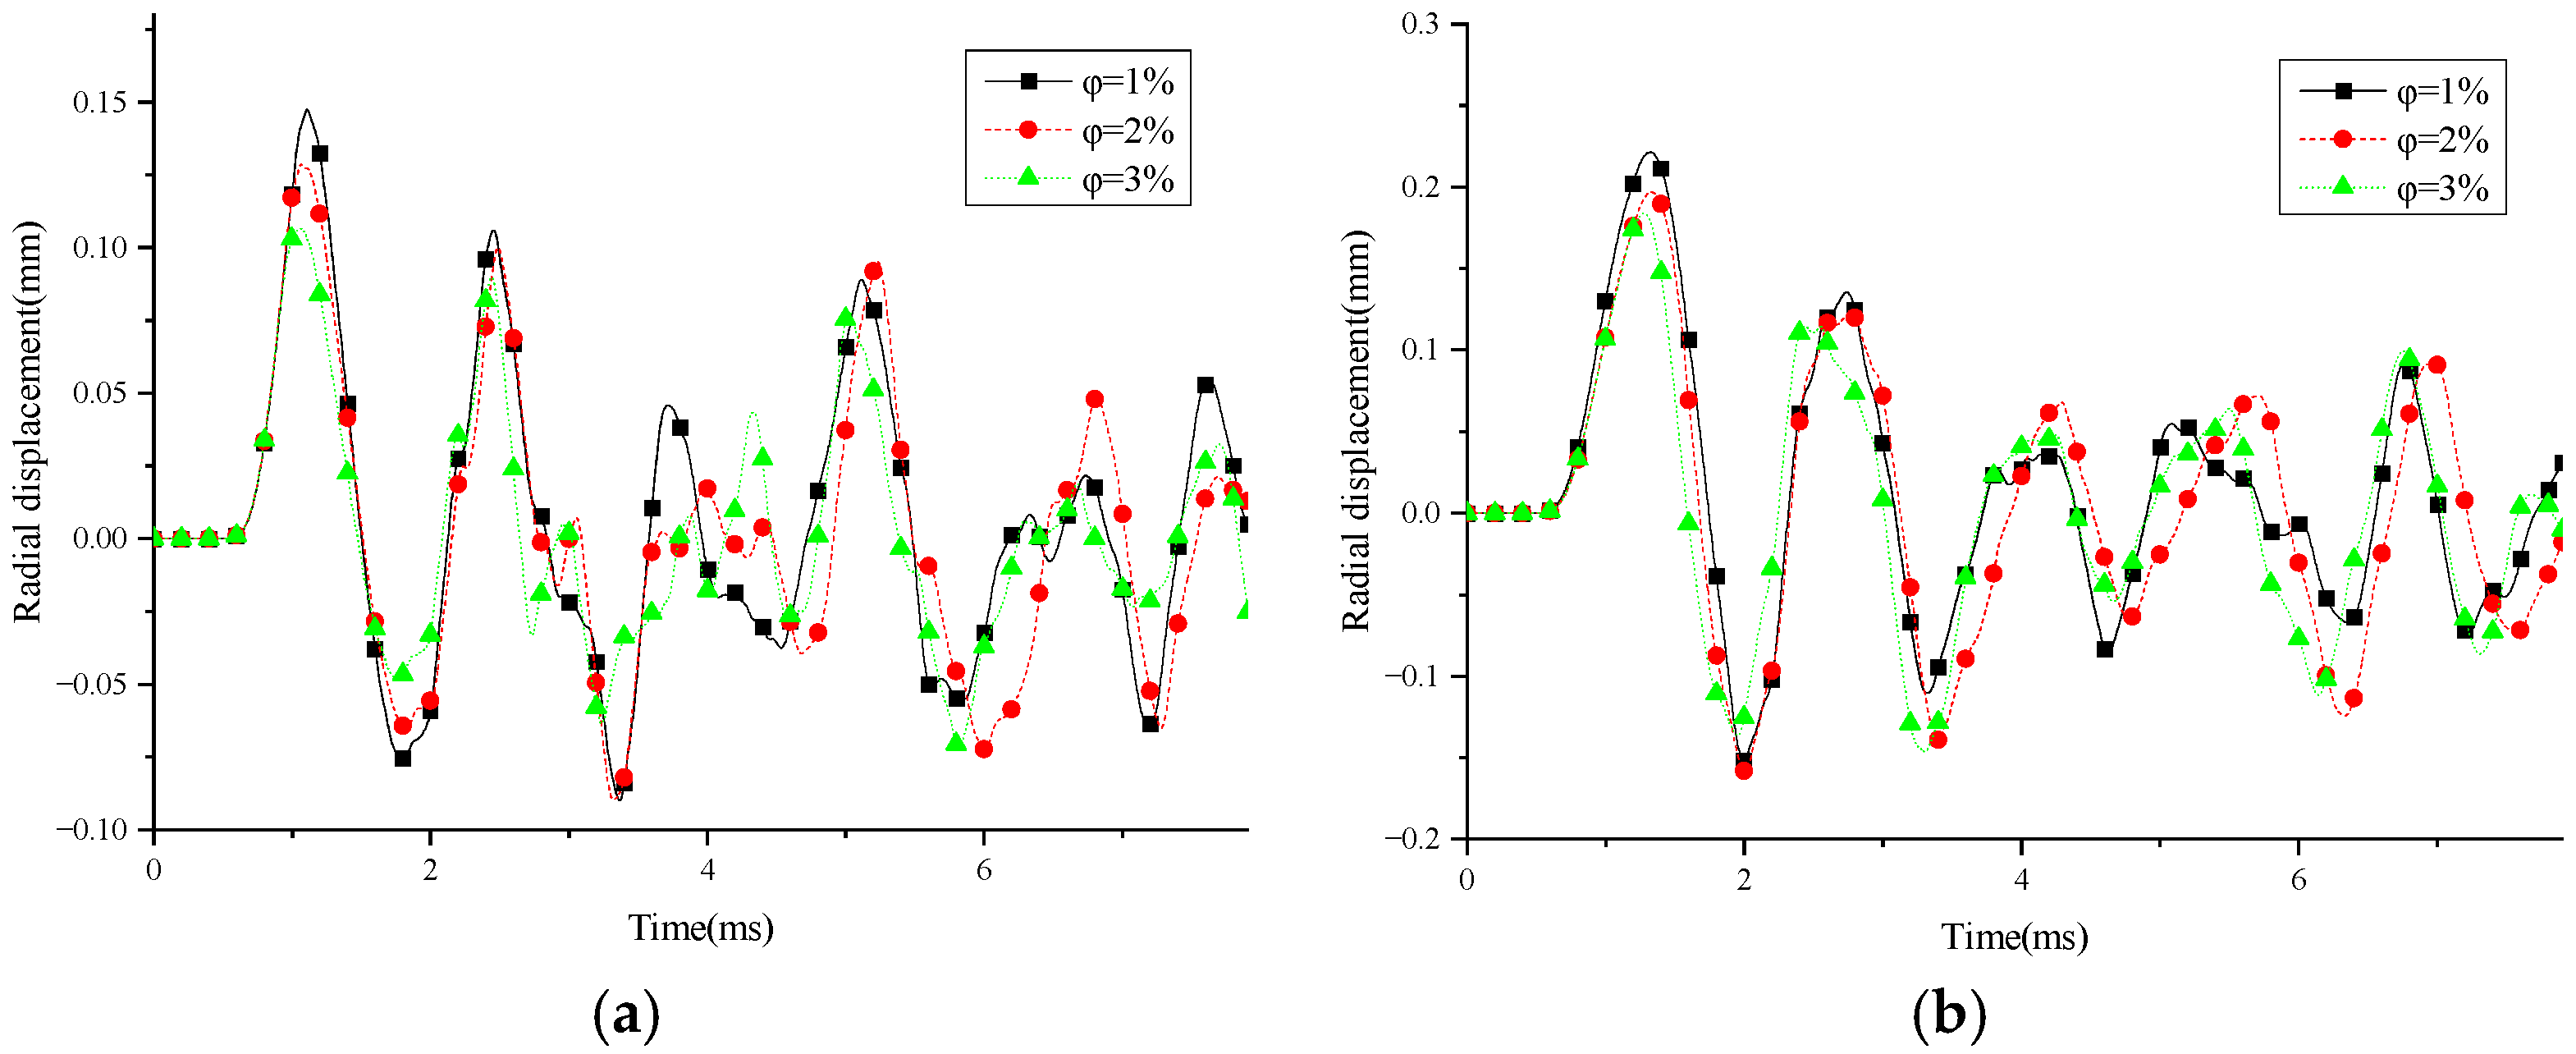
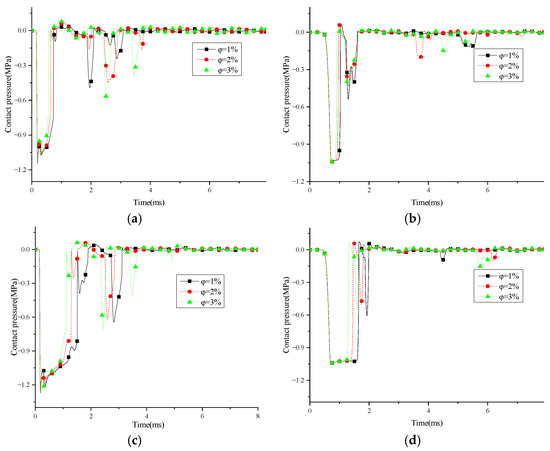
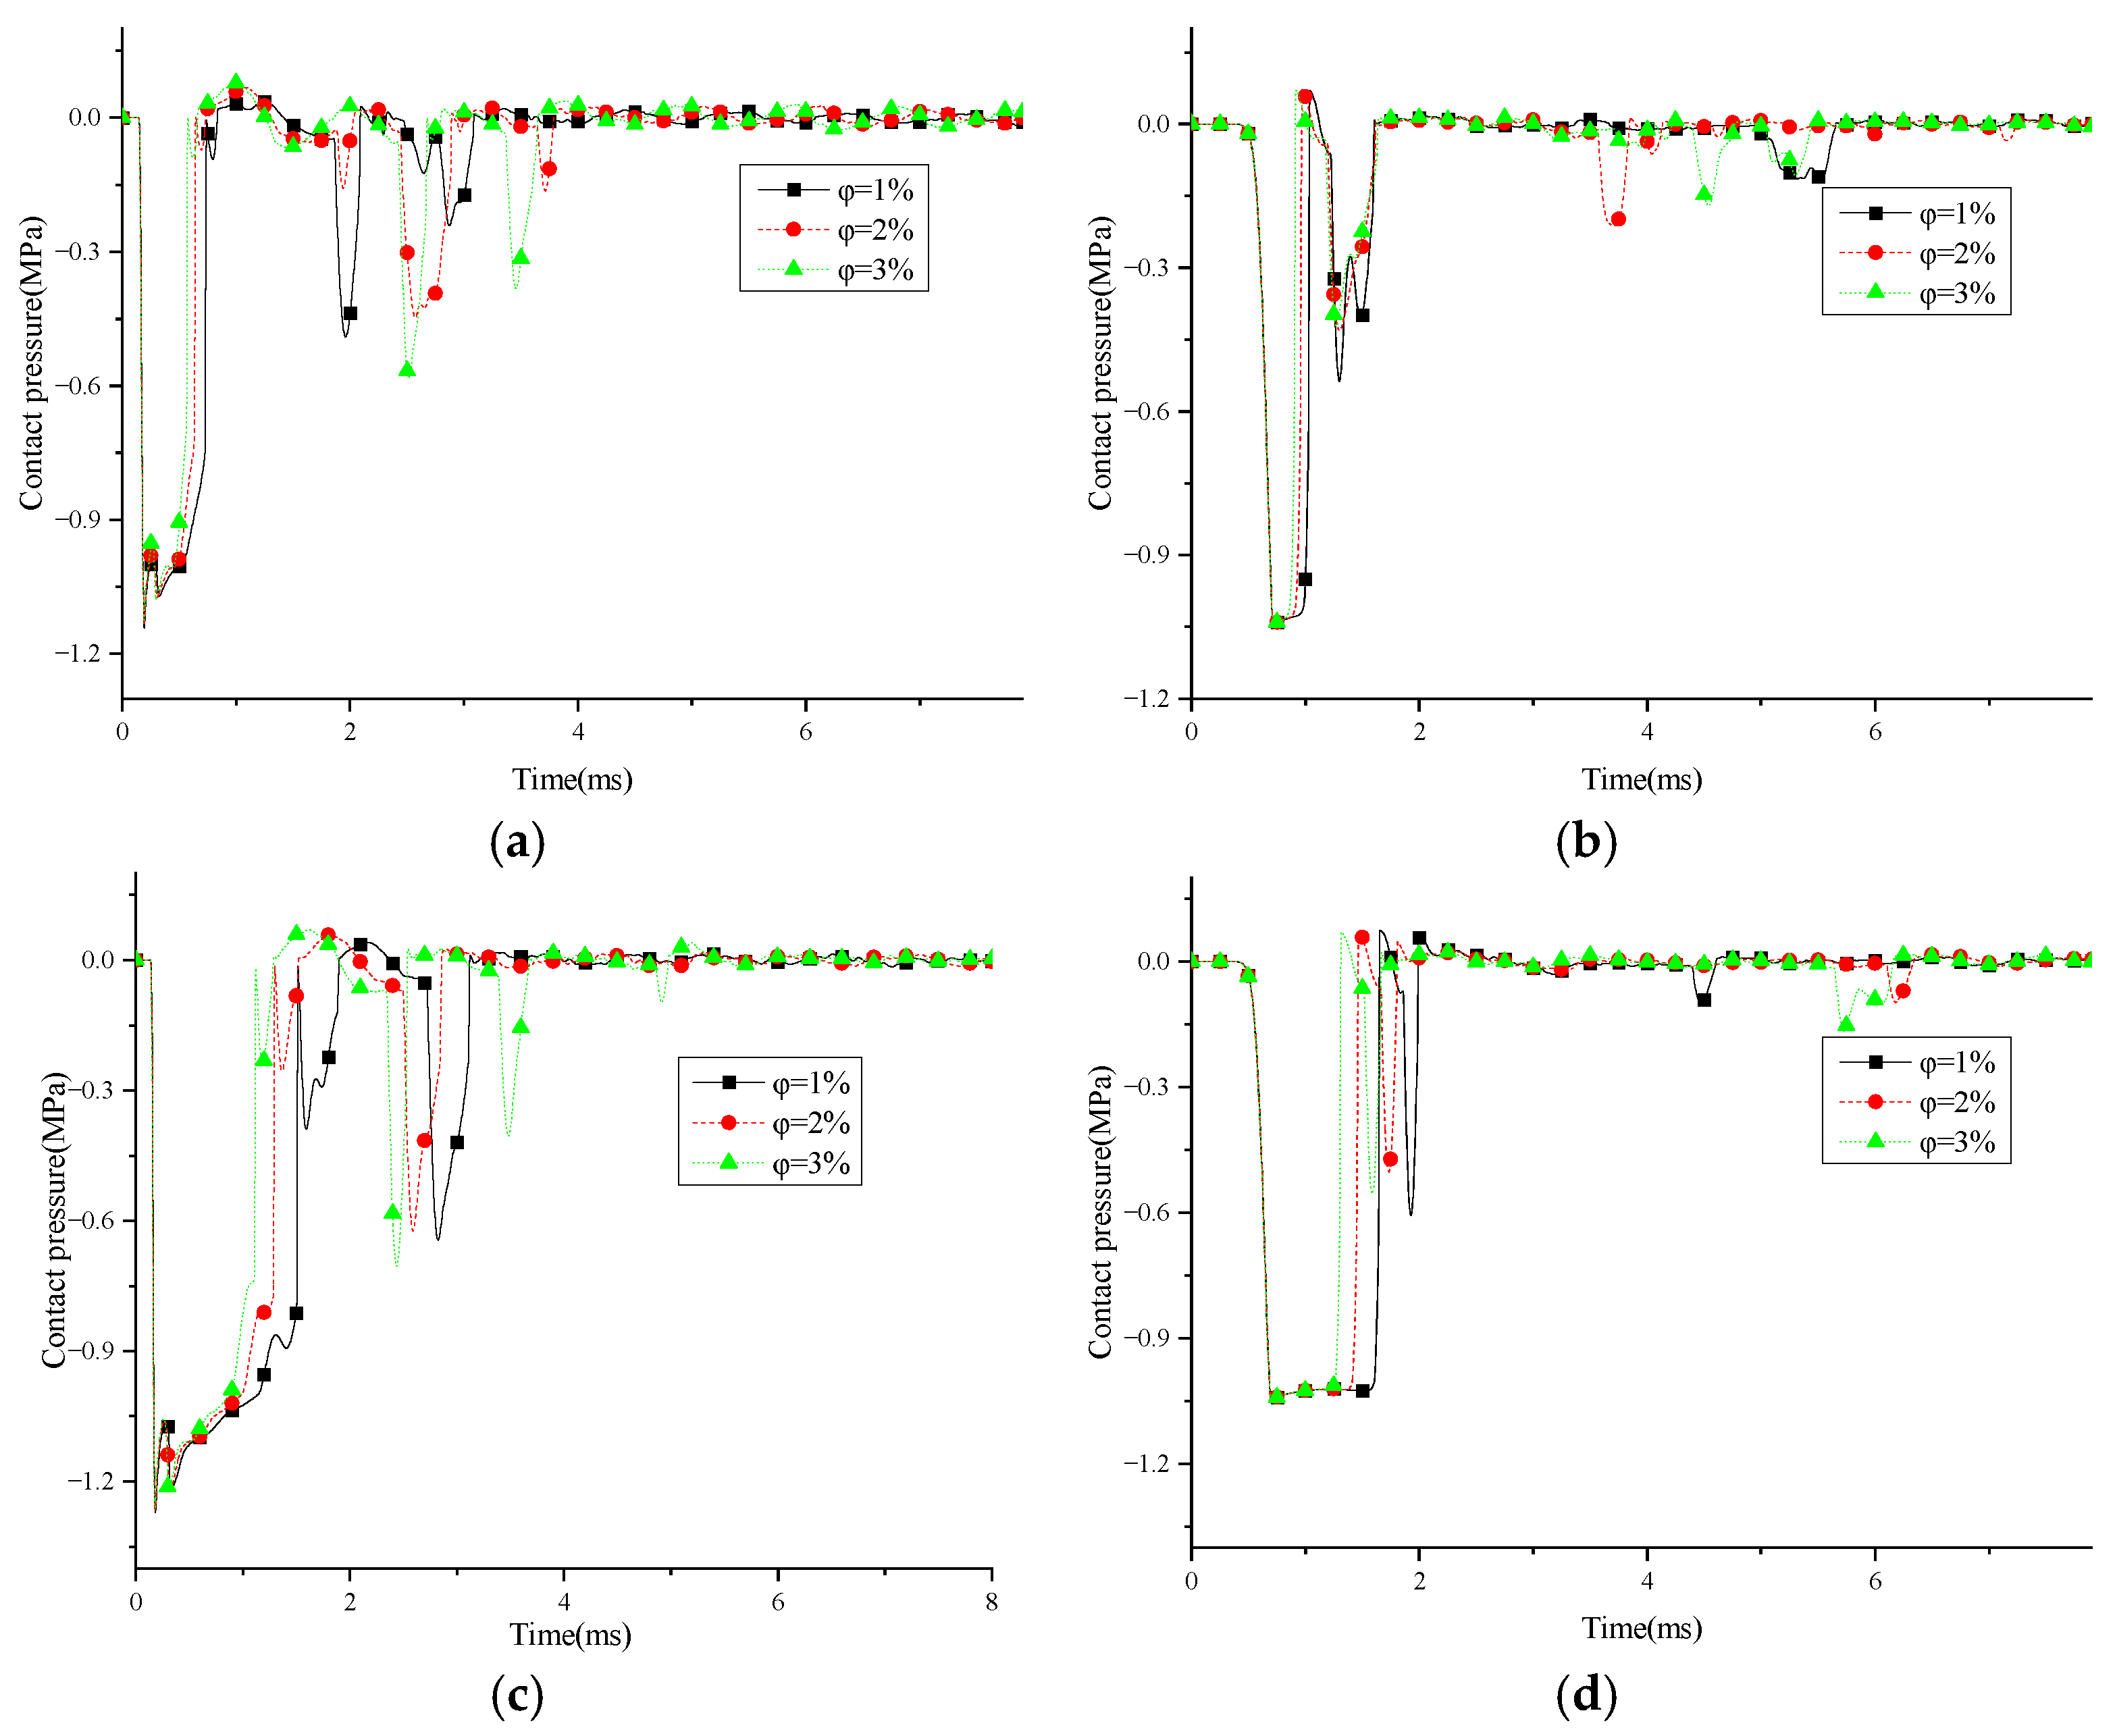
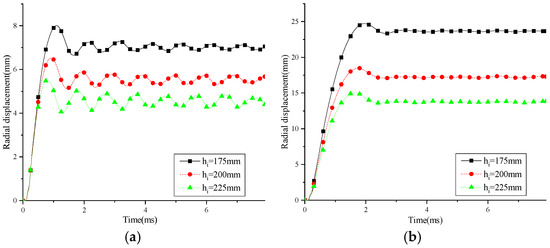
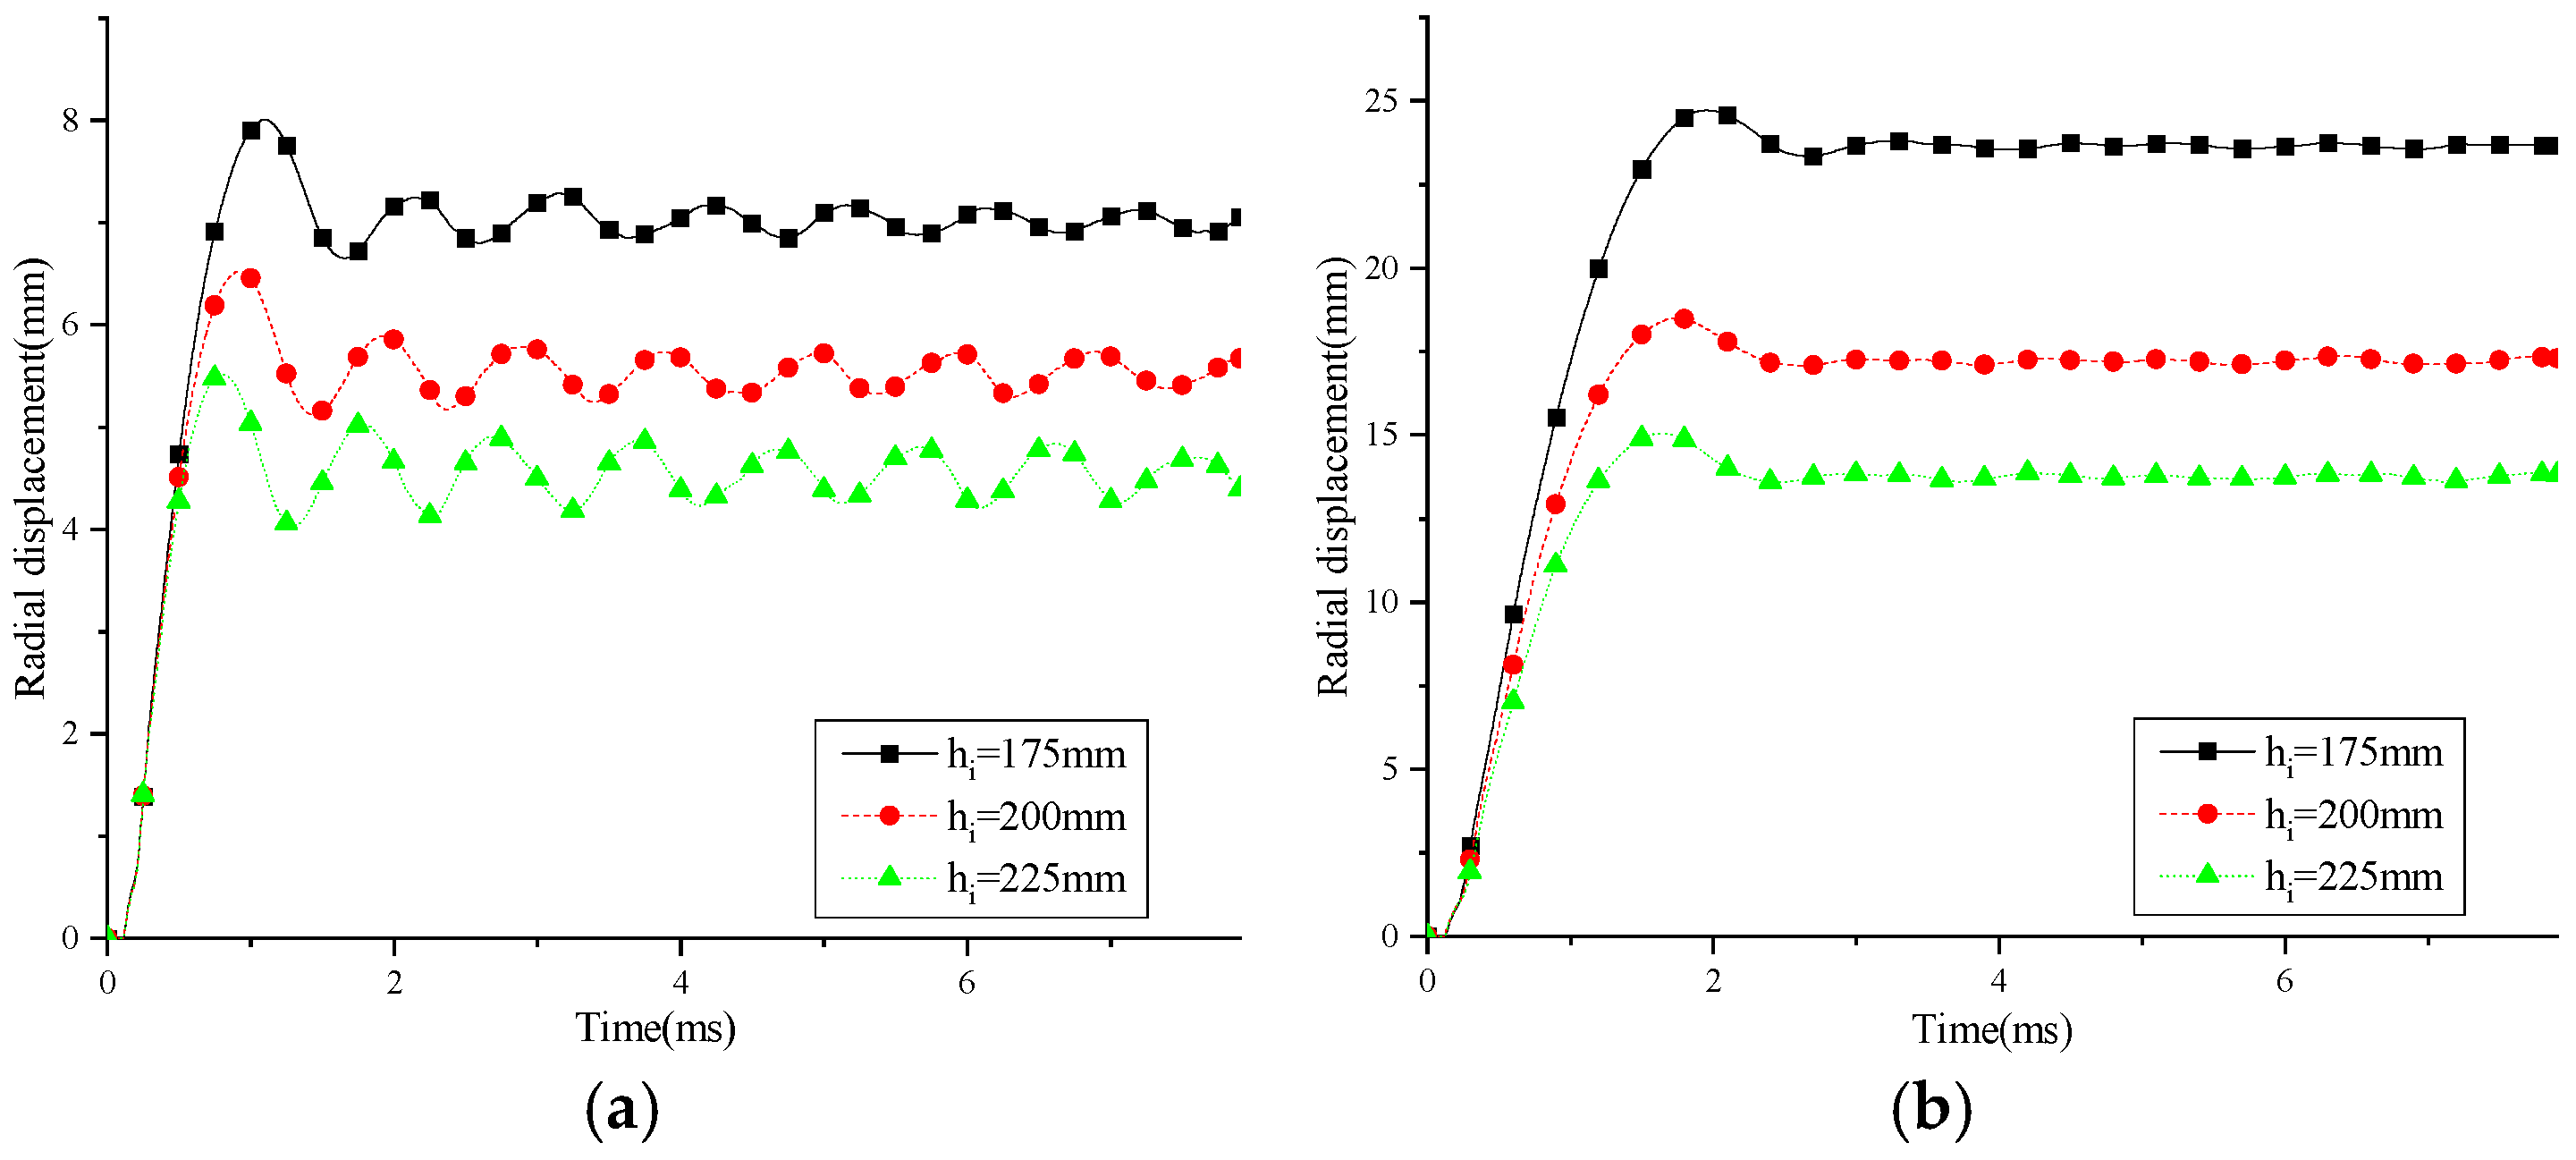
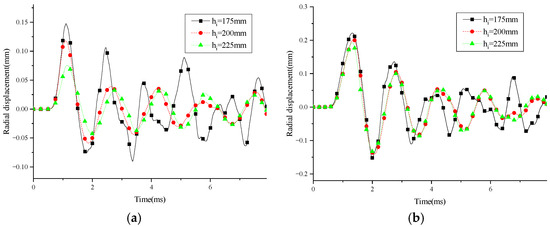
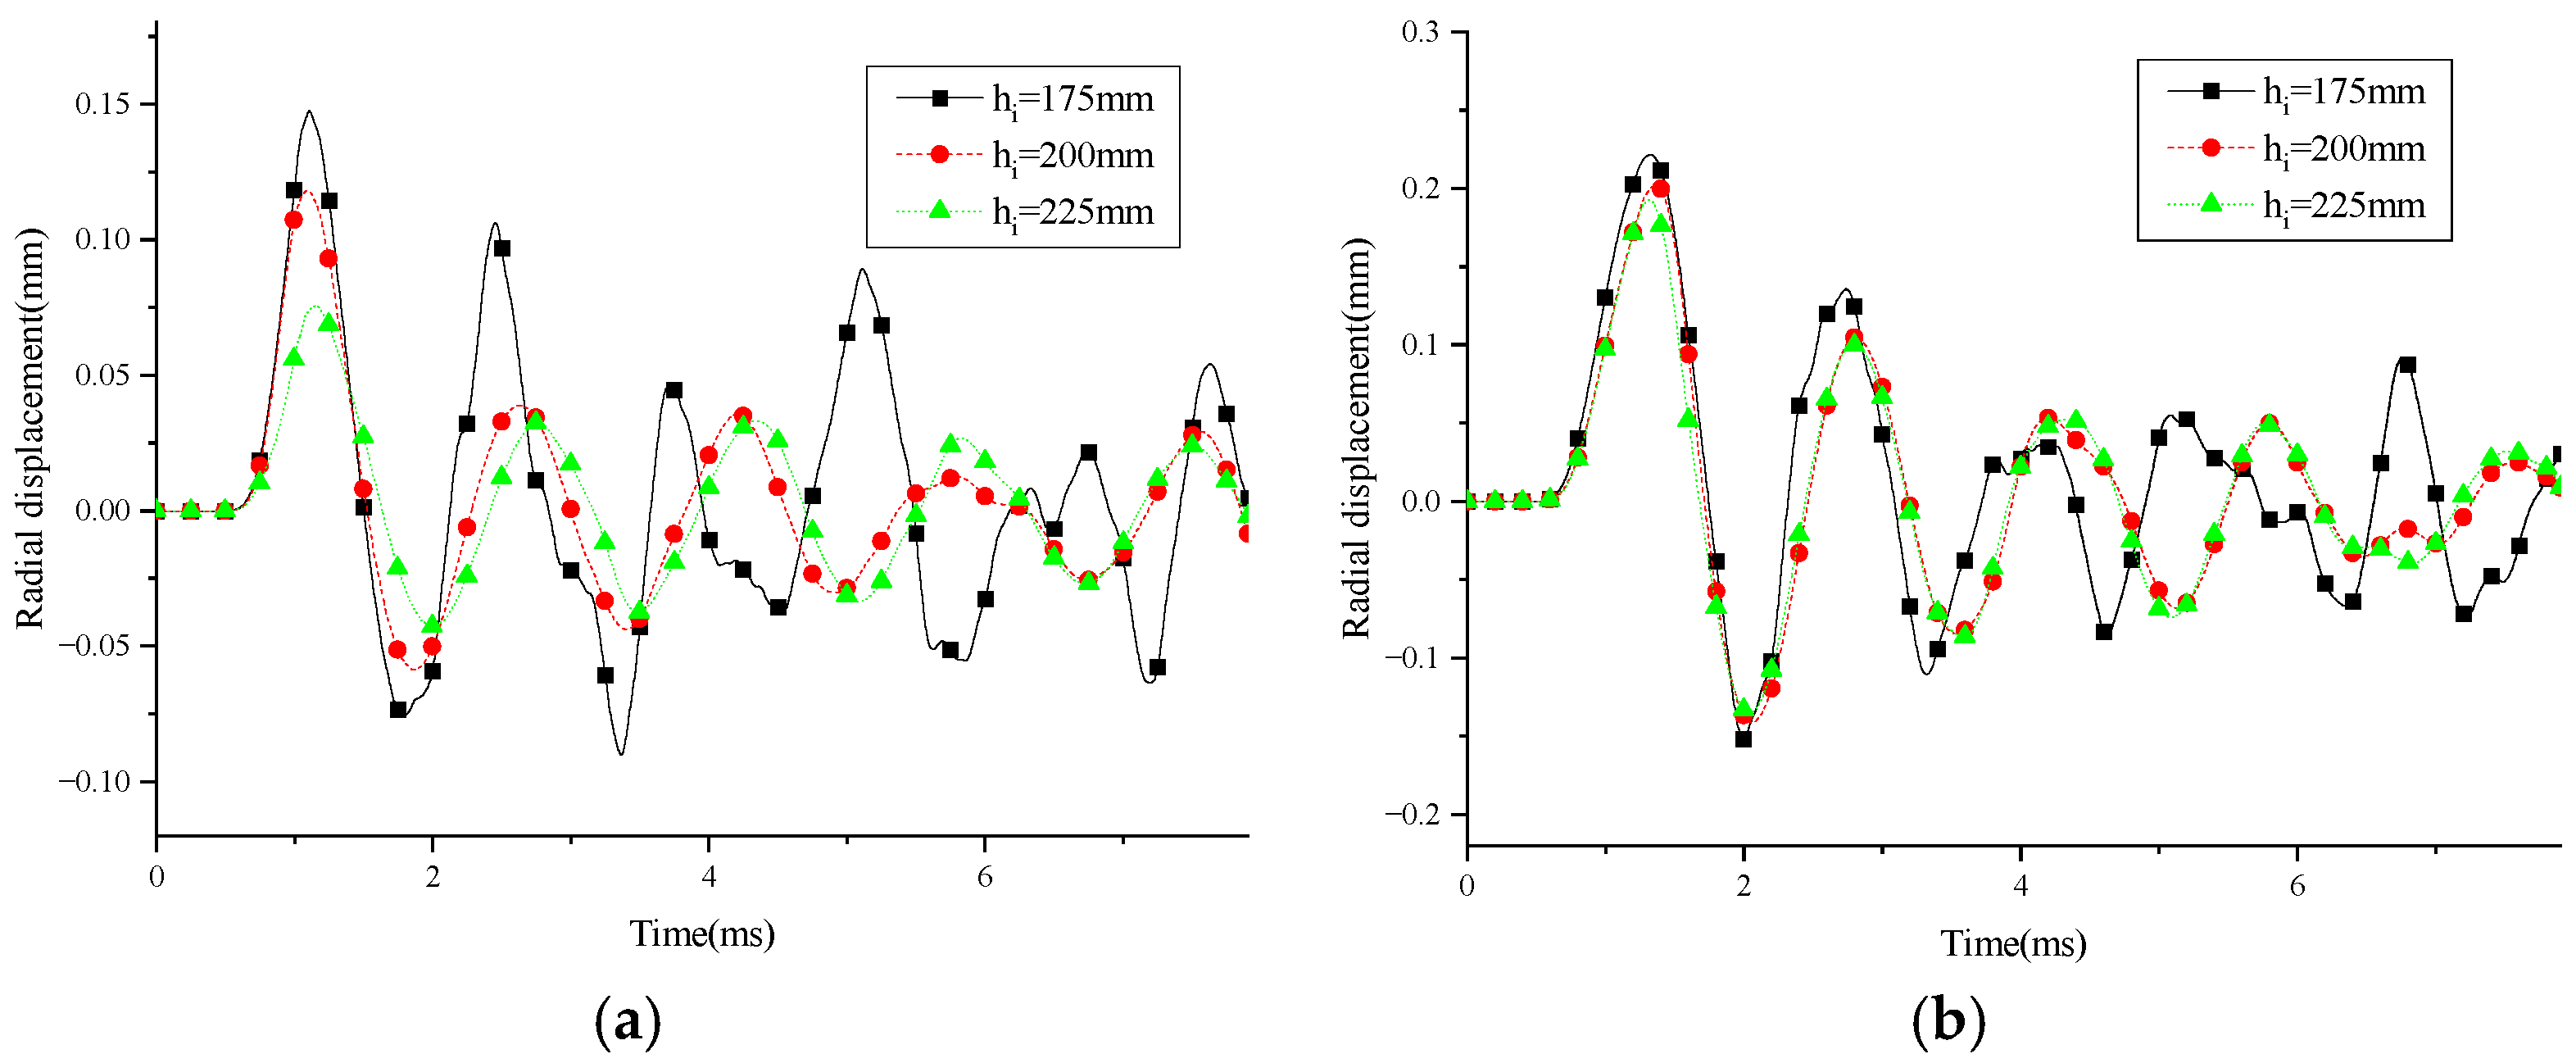
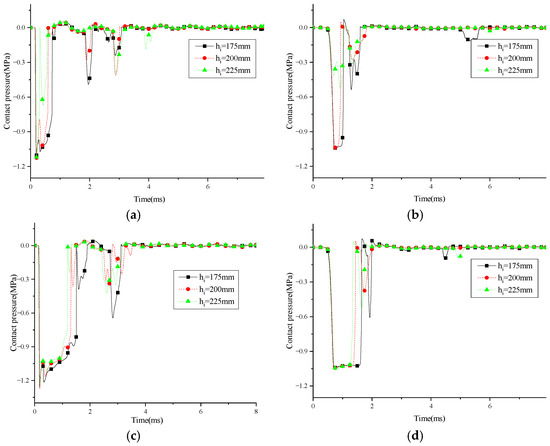
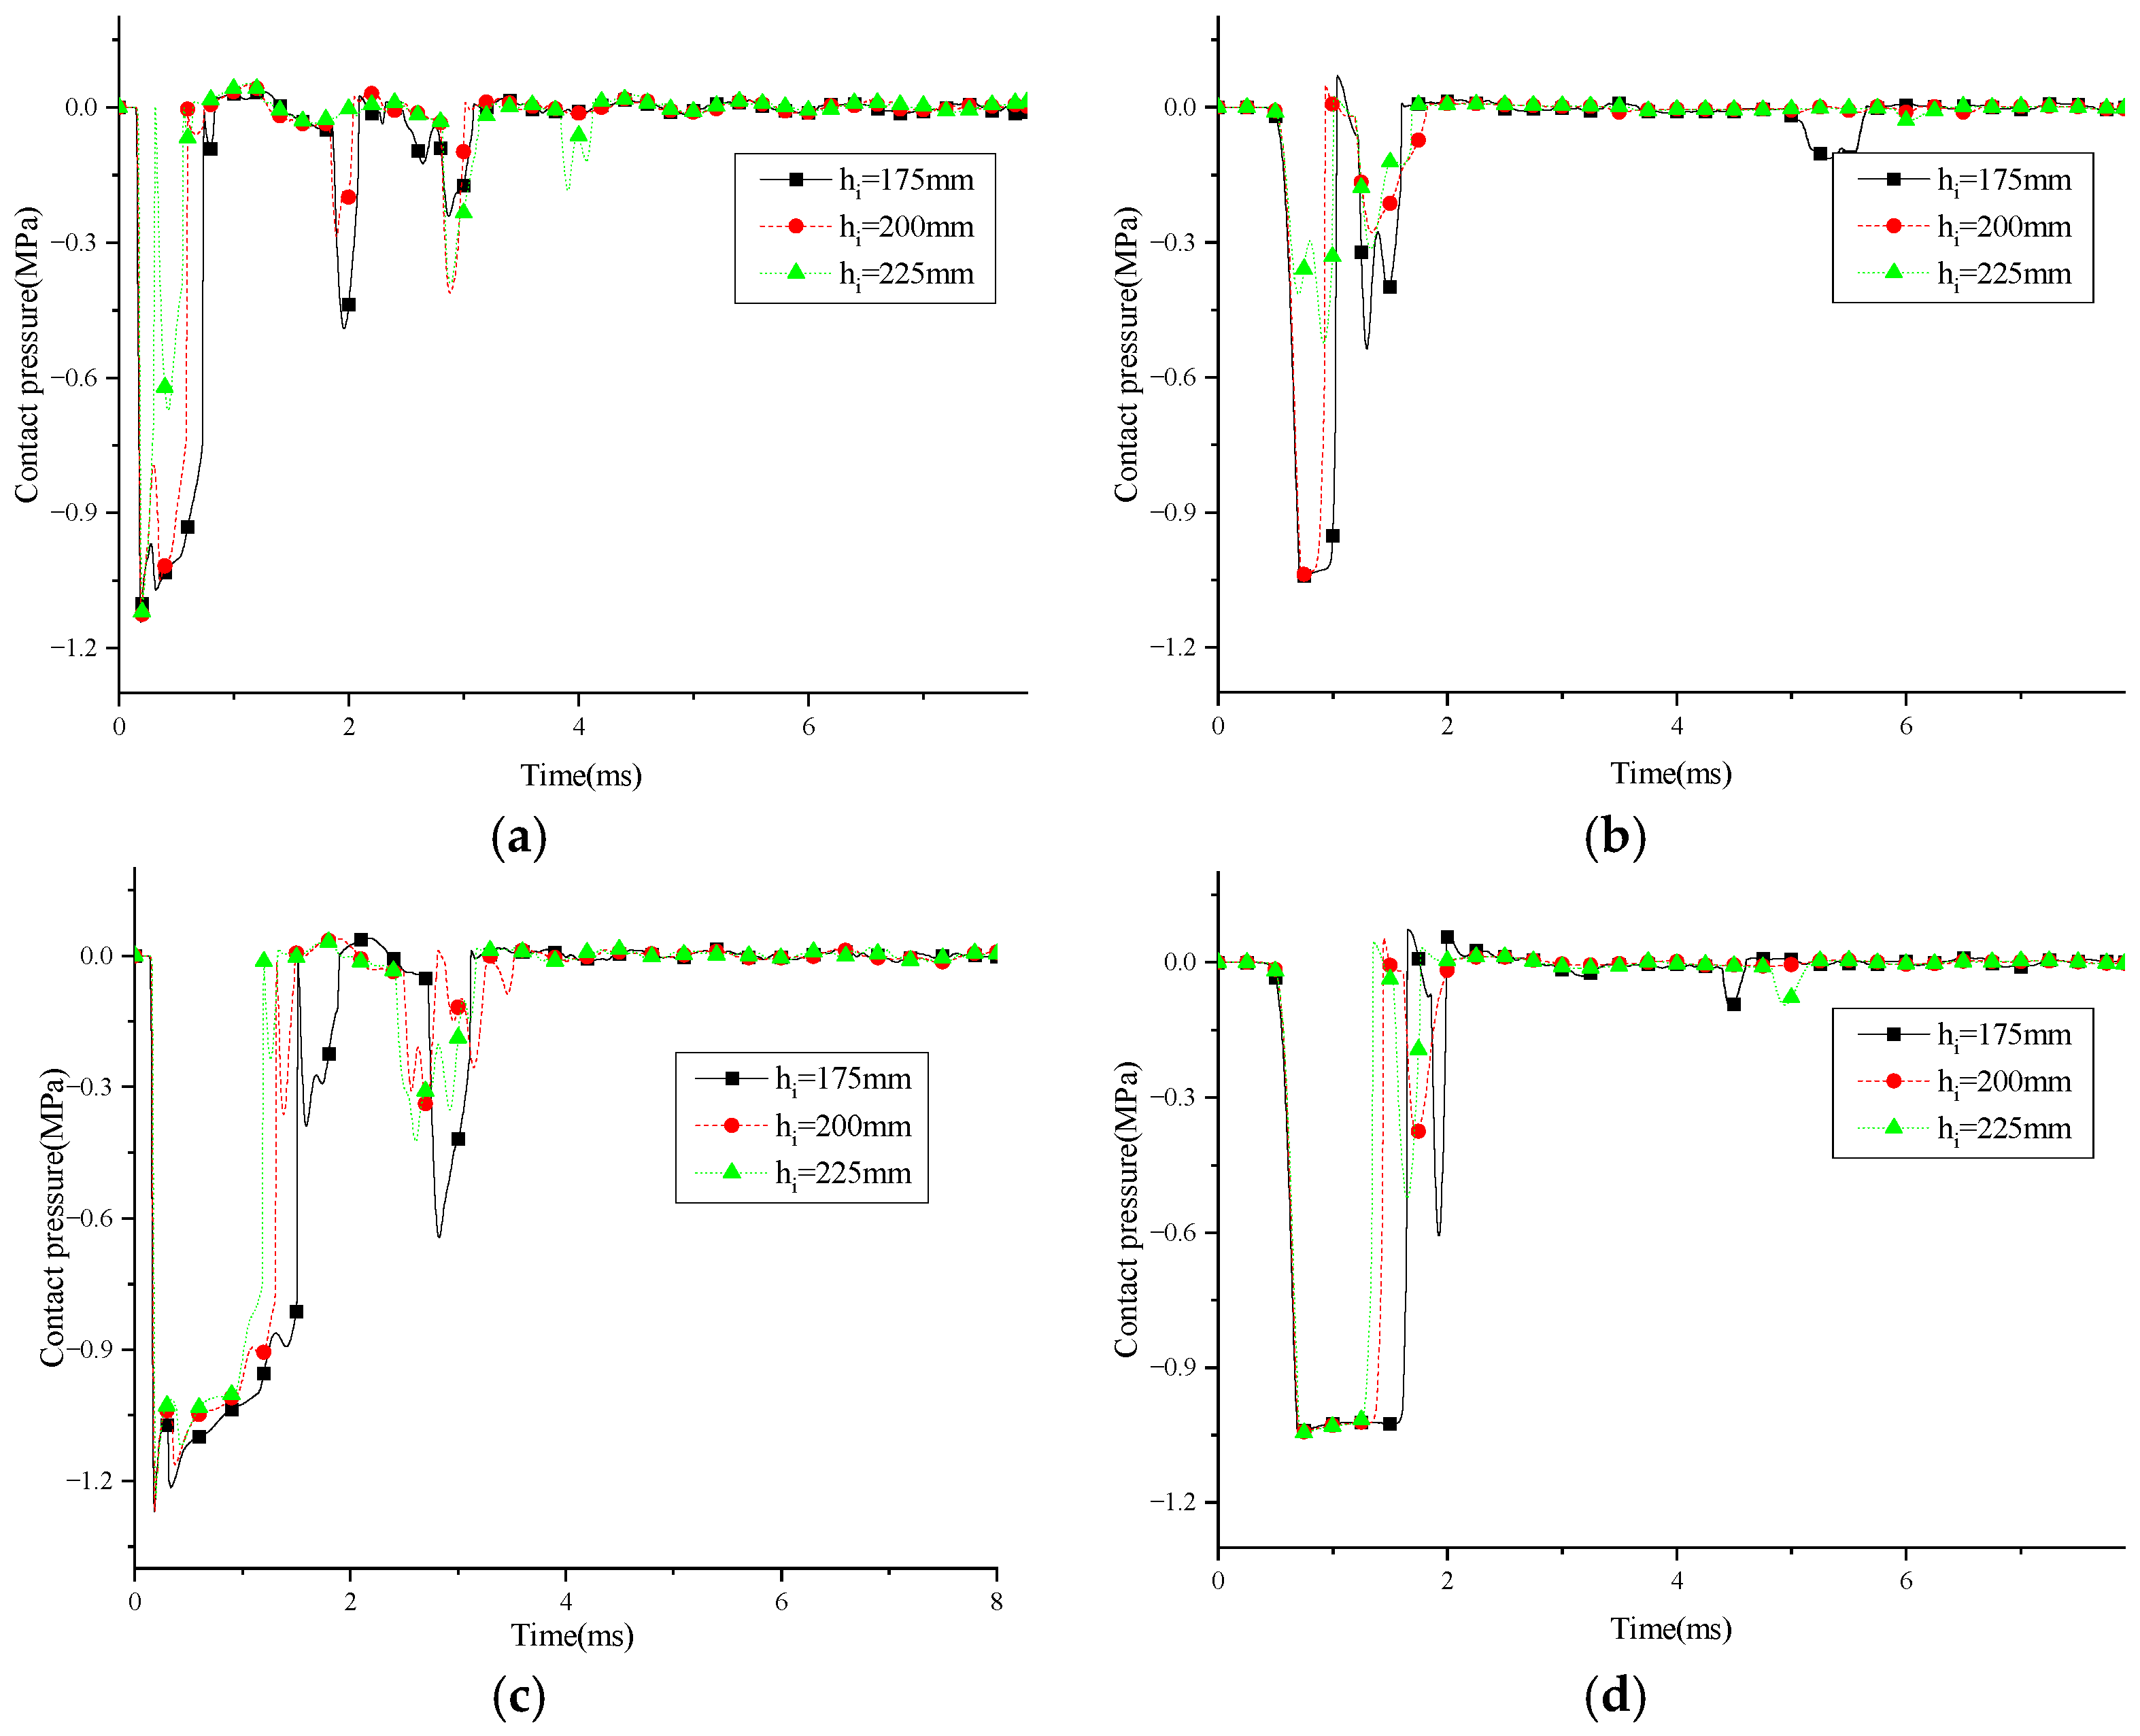

Disclaimer/Publisher’s Note: The statements, opinions and data contained in all publications are solely those of the individual author(s) and contributor(s) and not of MDPI and/or the editor(s). MDPI and/or the editor(s) disclaim responsibility for any injury to people or property resulting from any ideas, methods, instructions or products referred to in the content. |
© 2026 by the authors. Licensee MDPI, Basel, Switzerland. This article is an open access article distributed under the terms and conditions of the Creative Commons Attribution (CC BY) license.