


Abstract
Decarbonizing cement and concrete production requires multiple simultaneous strategies, since no single technology is sufficient. Two approaches dominate: low-carbon cement with reduced clinker content (supply-side) and low-cement concrete and structures delivering a given service through efficient design (demand-side). Direct comparisons between paths remain rare. Literature shows incompatible baselines, system boundaries, and functional units, and several studies are bounded at the factory gate (i.e., excluding demand-side measures). Despite the limitations, this paper attempts an explicit comparison of technical potential and burdens for stakeholders. Three outcomes emerge: (1) Complementarity: supply-side measures dominate impact but demand-side efficiency remains indispensable for net zero. (2) Asymmetric cost and risk burdens: supply-side costs concentrate in few actors that pass and dilute them downstream, whereas demand-side responsibility disperses across designers, contractors, and owners lacking incentives, contractual mechanisms and liability protection; the apparent lower risk of low-carbon cement is institutional, not technical. (3) Interconnected gaps sustain the imbalance and bound the present analysis: non-harmonised LCA conventions, cost-pass-through evidence limited to one residential case, absent data on willingness-to-pay and carbon-performance liability, and policy instruments targeting material rather than functional level. Demand-side action lags not on technical performance but on lack of means to verify, budget, insure and reward it.
1. Introduction
The construction industry faces unprecedented pressure to decarbonize, with cement and concrete production responsible for 7% of global CO2 emissions [1]. About 50% of these emissions are process emissions (calcination of limestone), which cannot be eliminated with the use of alternative fuels or increasing efficiency, placing cement production among the hard-to-abate sectors [2]. Global demand peaked in 2024, particularly driven by developing economies [3]. The sector therefore faces significant pressure to solve its structural carbon emission problem, which is simultaneously technological, economic, institutional, and political.
A broad range of technical pathways is addressed in the literature. On the production scale, clinker substitution with supplementary cementitious materials (SCMs) has been the classical approach, later also complemented with novel alternative binders, alternative fuels, kiln efficiency, and carbon capture, utilisation and storage (CCUS). On the side of use, mix optimisation, performance-based specification, structural optimisation, and component reuse have been explored for their potential to reduce the quantity of binder and concrete needed for a demanded performance. A combined approach integrating this family of solutions seems natural, but the level of agreement on the sequencing and combination of strategies is insufficient, and the question of who bears the cost as the sector decarbonizes remains unanswered [4,5].
The problem is not new, and its framing has evolved over the years, conditioning stakeholders’ perception of each particular pathway. Conventional literature frames blended cements as an engineering problem, verifying conformity with performance requirements despite their lower clinker content [6]. The Paris Agreement shifted the framing in 2015 towards net-zero roadmaps and techno-economic assessment. Then, new technical solutions attracted more attention, such as those based on calcined clays [7]. Soon after, the 2020s brought three converging approaches: demand-side dematerialisation and component reuse as a serious alternative to materials innovation; policy and procurement became central drivers of decarbonisation (particularly in Europe); and stakeholder and value-chain framings displaced pure technology evaluations [8,9]. The present review focuses on this third aspect, to treat cement not as an isolated material problem but as a multicomponent system involving interlinked technical, economic and institutional dynamics [9].
Two archetypal decarbonisation pathways can be defined. “Low-carbon cement,” developed by cement producers, refers to supply-side reformulations intended to lower emissions per unit mass of binder. “Low-cement concrete and structures” denotes demand-side improved efficiency to lower the binder and concrete embodied per delivered functional unit, involving optimisation by concrete producers, designers, specifiers, and standards bodies. The two types of answer to the problem operate at different nodes of the same value chain. A consequential difference between them derives from their relationships to the distribution of cost, risk, and regulatory pressure across stakeholders.
The distribution of costs matters because decarbonization pressure is not perceived uniformly across the value chain. Recent regulatory instruments increasingly target the material. For example, the European Union’s Carbon Border Adjustment Mechanism (CBAM) [10] charges imports considering the embedded emissions of clinker, and Environmental Product Declarations (EPDs) [11] define a declared per-product carbon. Such instruments create strong and clear incentives for producers while disengaging the dispersed actors defining the material demand. The result is that decarbonisation measures do not create the same burden for the various stakeholders in the cement and concrete value chain.
Four unresolved research challenges follow from the previous framing:
- Comparability: the two pathways are assessed with different metrics and system boundaries, so the question of which delivers more mitigation per unit of delivered function cannot be answered under current conventions. This is a measurement-theoretical problem rather than an engineering one. Additional case studies cannot resolve it.
- Attribution: double counting for hybrid measures that combine a lower clinker factor with a more efficient structure is common. The underlying flaw is the lack of agreement on the assignment rules for the mitigation.
- Incidence: the residual liability is decisive for adoption, and this distributional problem is largely absent in the literature.
- Institutional endogeneity: standards, contracts and insurance practice are largely missed in the existing comparative assessment, which focuses almost entirely on material behaviour.
Comparisons framed only in terms of technical potential tend to reproduce, rather than test, the prevailing preference for supply-side measures, while disregarding the previous four problems. Within this context, the present study pursues three interrelated objectives:
- to compare low-carbon cement and low-cement concrete as decarbonization pathways across technical, environmental, economic, and stakeholder dimensions;
- to map how the carbon cost burden is distributed unevenly across the cement–concrete–construction value chain;
- and to assess the potential prevalence of policy instruments towards the supply-side pathway.
2. Analytical Framework and Attribution Rule
Four components of the implementation of decarbonisation strategies deserve attention: impact in terms of the amount of emissions, cost, risk, and incentive alignment. A measure may score well under one lens and poorly under another. The first lens seems to have been comparatively much more resolved in the literature than the other three.
Figure 1 maps the two pathways across stages in the value chain, providing some examples for single-pathway measures and orders of magnitude for corresponding actors.
Figure 1.
The two decarbonization pathways mapped onto the cement-concrete-construction value chain and onto the factors of the emissions identity of Equation (1). Actor counts are orders of magnitude at national scale and follow the qualitative stakeholder assessment of Habert et al. [12]. Own elaboration; no element of any published figure is reproduced.
Hybrid measures involving both low carbon cement and low cement concrete or structures are also possible. The comparative analysis between the two pathways requires avoiding double-counting, and a rule for the attribution of mitigation is needed. Equation (1) deconstructs the carbon emissions per functional unit into three factors.
The first factor is the domain of the supply-side measures, acting on the second and the third factors, which are the domain of the demand-side measures. The relative reductions in each factor multiply with the others. A hybrid solution may involve two or three factors, but the credit of each measure is attributed depending on the factor on which it intervenes. A low-clinker cement used in a packing-optimised mix within an optimised slab is credited once in each factor following their corresponding indicators. Then, no saving is counted twice, and each saving is attributed to the correct stakeholder. A single measure may change two factors simultaneously; e.g., high-strength concrete raises binder content per m3 while lowering the volume required per functional unit, the net effect is reported as such, but it can be deconstructed between the product of the two changes. A water-reducing admixture that allows a reduction in paste content in concrete made with a calcined-clay cement with a lower clinker factor can equally be decomposed, with the reduction in emissions per functional unit into the emission reduction per ton of binder and the binder reduction per volume of concrete. The pathway to which a measure belongs is decided by the factor of Equation (1) on which it acts.
3. Value-Chain Perspectives on Cement and Concrete Decarbonisation
The supply-side and demand-side decarbonization pathways originate on two parallel views [5]. Supply-side measures define how the binder is produced; demand-side measures define the volumes of binder and concrete that are used. Demand-side interventions are perceived as the least exploited in the approach of current policies. Estimations place most of the contribution for cutting down carbon emissions by 2050 to the supply-side pathway, reaching up to 80% cuts from baseline [5], and suggest that the remaining 20% cut is only achievable via more efficient use of cement and concrete. Despite the fact that the highest impact comes from the supply side, the contribution from demand-side efficiency is not marginal and it constitutes a necessary condition for net zero.
In this context, the level at which carbon is measured and managed differs for each pathway. Material-level efficiency aims at reducing the embodied carbon per amount of material (e.g., tonne of cement, m3 of concrete), while functional efficiency focuses on reducing impact per functional unit (e.g., m2 of floor, supported kN, service life span). The two approaches can diverge sharply. For example, high-strength concrete with high cement content per m3 may reduce the embodied carbon per m2 of floor if it leads to, e.g., a thinner slab [13,14]. Most metrics and policies concern material indicators, which are comparatively simpler, more reproducible, and more traceable computations than structural or functional indicators. The level of simplicity privileges the supply-side pathway, while the demand-side benefits are potentially made invisible by the accounting instruments.
The value chain runs from clinker and cement producers through concrete producers, structural designers, architects, contractors and demolition firms to clients and building owners [12,15]. These groups differ significantly by orders of magnitude in number (i.e., from a few clinker producers at national level to a large population of clients and users) and correspondingly in individual leverage. For example, a single kiln adopting the use of alternative fuels exerts far more impact per decision than any single building project. This structural asymmetry cannot be disregarded in the analyses.
Each pathway and its features require an analysis through four lenses: emissions, costs, risks, and incentives. A measure can score well on one of these aspects while poorly in another (e.g., low emissions yet poorly on incentive alignment). Current literature generally fails in such integrated analysis, and it is common that low measured material-level emissions are interpreted as evidence of an efficient strategy, without paying attention to potential implementation barriers derived from the conditions for corresponding actors in terms of the efficiency of existing incentives, prevalence of residual risks, and associated economic costs.
4. Low-Carbon Cement as a Supply-Side Pathway
4.1. Clinker Substitution, Supplementary Cementitious Materials (SCMs) and Alternative Binders
As mentioned, clinker substitution is the most mature decarbonization lever in the sector. Replacing a fraction of clinker with SCMs (e.g., ground granulated blast-furnace slag (GGBS), fly ash, calcined clay, limestone) reliably reduces CO2 per tonne of binder. Such reduction can reach 25–50% while maintaining, and in some respects improving, performance [7,16,17]. The most recent and promising SCM-based binder is limestone calcined clay cement (LC3), in which the synergy between calcined clay and limestone allows clinker factors near 0.5 with CO2 reductions of about 30–40% relative to ordinary Portland cement [18]. Shah et al. (2022) [19] estimate that full exploitation of available amounts of SCMs could allow at least 50% clinker substitution with domestic supply, avoiding a maximum of 1.3 Gt CO2 per year globally.
Supply is the main constraint for blended cements. The most used high-quality SCMs are industrial by-products of declining industries in Europe. Due to European decarbonisation policies, the availability of fly ash falls with coal-fired power, and that of GGBS with primary steelmaking [6,17]. Other regions remain quite heavily reliant on coal-based electricity (coal supplied 33% of world electricity in 2025 [20]) and using the blast-furnace-basic oxygen route for producing steel (70% of world crude steel [21]). The real constraint outside Europe is still allocation and ratio of fly ash and blast-furnace slag (e.g., only 27% of fly ash produced in India goes to the cement industry [22], China already produces approximately 1.9 more cement than its total potential domestic production of SCMs [19]). Then, calcined clay and, more recently, carbonated recycled concrete fines have consolidated as emerging research themes. They became convincing replacements for reducing SCMs tied to shrinking industries [19]. Moreover, a secondary constraint is allocation [23]. As by-products, the emissions credited to each SCM depend on allocation rules affecting Life Cycle Assessment.
It has been long since the classical conception of a universal cement type stopped holding. Nowadays, the cement type is decided based on local supply and performance. Cement types have been progressively defined by European Standards as a reflection of the increasing diversification of the market (Figure 2). The proliferation of notations should not, however, be read as market penetration. Despite the steady growth of standardised cement types in Europe since 1990, the average clinker factor in the region has remained close to 0.77 [24]. For minimising environmental impact, the application and level of clinker substitution require interrelated optimisation. Knight et al. (2023) [25] show that optimising the use and replacement level of a limited SCM supply across a portfolio of mixes is more effective to reduce environmental impact compared to applying a uniform maximum substitution rate in every mix. The literature shows agreement that the limitations to reductions in emissions via SCM blending require additional efforts in terms of de-risking the use of novel SCMs and simultaneously favouring their implementation via demand-side actions [26,27]. The upper threshold for SCM blending means that full replacement of clinker is not achievable; this is the reason why the contribution from the demand-side pathway cannot be treated as optional.
Figure 2.
Evolution in the number of cement types in European standards, 1990–2026. Counts are of distinct cement-type notation (e.g., CEM II/A-S), following the original convention of EN standards [28,29,30,31,32,33,34]. Strength classes are not multiplied in, and sulfate-resisting common cements introduced in EN 197-1 (2011) are not counted as separate types to the N-type cements.
Additional to blended cement systems, there are a multitude of alternative binders (e.g., alkali-activated materials, calcium sulfoaluminate (CSA) cements, and carbonatable binders). Despite their theoretical potential (estimating cuts of up to 40–70% of binder emissions [6,35,36]), in practice they face similar supply constraints to those of SCMs. This adds up to performance validation gaps, and legislation bottlenecks that slow their market entry.
4.2. Process Efficiency, Fuel Switching, and Carbon Capture
Process measures (e.g., increased thermal efficiency, alternative fuels, CCUS) complete the supply-side routes. At present, kiln efficiency levels are close to thermodynamic limits and offer little unexploited potential [37]. Alternative fuels reduce the demand for fossil energy, but they do not address process emissions. The only supply-side option capable of addressing the calcination emissions directly is CCUS. This solution is previewed with a massive contribution after 2030 towards net zero in 2050 [38]. Mineral carbonation leads to technical solutions such as carbonated recycled aggregates [39], carbon-cured precast elements [40], and carbonated SCMs [41]. However, the real climate benefit depends strongly on the CO2 source used in the process, permanence assumptions, and accounting rules. The emission reductions therefore remain conditional on infrastructure and carbon-accounting systems. This is not minor at all, to the extent it keeps the economic aspect unresolved. Mineral carbonation only becomes attractive provided a meaningful additional profit is obtained via storage-certification and favourable market conditions (e.g., €32 net profit per tonne of cement estimated by [42] when processing carbonated SCMs as partial cement replacement).
A risk that follows from the capital intensity of this route deserves attention. Capture installations are amortised over decades and, once built, create an interest in maintaining the clinker throughput that justifies them. System-dynamics analysis indicates that early, mature measures can dominate a decarbonization trajectory even when later measures have greater ultimate potential [43]. Also, deployment modelling for the European cement sector shows that public support at the scale required by first-of-a-kind plants is itself a policy commitment of long duration [44,45]. There is therefore a genuine risk that large-scale CCUS becomes a technological lock-in that defers demand-side dematerialisation, not because the two are technically exclusive but because they compete for the same public budgets, the same regulatory attention, and the same decarbonization narrative. The risk is asymmetric. Unlike demand-side measures, CCUS does not change how much material construction uses, nor its dependence on clinker. It removes the process emission and nothing else. It seems convenient that CCUS comes after the measures that reduce the clinker required, not instead of them.
4.3. Standardisation, Scalability, and Market Constraints
The cement and concrete industry is a highly regulated sector. Technological transitions in the construction sector are typically slow in comparison with other sectors, partly because of the extended process to reach consensus. Some decades ago, a decisive progress towards low-carbon cement was achieved with the spectrum of common cements defined in EN 197-1 [28] (from CEM I with >95% clinker to CEM V). More recently, EN 197-5:2021 [29] added CEM II/C-M and CEM VI categories that enable high substitution (clinker contents to roughly 50% and below) and EN 197-6 [30] incorporated additional sources of SCM based on recycled materials. This means that much of the low-carbon cement pathway can be specified within existing, familiar conformity frameworks, but solutions face significant barriers whenever they cannot be framed within these boundaries. Given the large number of candidate SCMs, dedicated standards for each class become difficult to manage. Performance-based standards allow industry to explore local available SCMs without waiting for time-consuming changes on prescriptive standards [46]. Limitations created by definitions based on mineral composition can be overcome by specifying performance levels instead. This approach has been implemented in North America [47] and some Latin American countries [48], and several examples demonstrated its potential to reduce carbon footprint of cement [49,50,51]. However, its adoption still faces difficulties for market acceptance due to customary conceptions and outdated specifications [51].
Overall, the supply-side pathway is technically mature for blended cements, including novel LC3 cements, less so for alternative binders and CCUS. An expanding standards architecture is necessary, but this is a relatively slow process and strategies such as performance-based specifications for cements avoid such a barrier. Other binding constraints are local availability of SCMs, the cost and infrastructure of CCS, and the qualification of novel chemistries. For example, the Brevik plant in Norway, operating since 2025, is the first cement plant worldwide able to capture at industrial scale 50% of its CO2 emissions. It handles 400 ktonnes CO2/year [52], at an investment cost of 4.9 billion NOK, of which roughly 80% was publicly funded, and 10 yr operating costs of about 1.2 billion NOK from which the state covers 75–100% of eligible costs [44]. This gives a cost of 6.1 billion NOK for 4 Mt CO2 captured, i.e., roughly 1500 NOK/t CO2 (~€140/t CO2, undiscounted, excluding transport and storage), against an EU allowance of about 83 €/ton CO2 in 2026. On a capital basis, the investment corresponds to €1130 per annual tonne of capture capacity, roughly twice the cost assumed in European deployment modelling [45] and also exceeding the estimations for amine capture at cement plants in [53]. The contrast is expected for a first-of-a-kind project, but it indicates that the potential for cost reduction deserves significant attention for CCS to be treated as a deployable option across the sector [44]. Thus, the near-term reductions are dominated by mature solutions for clinker substitution by SCMs, while additional cuts depend on technologies with incomplete readiness. Net zero cannot be realistically achieved on the supply side alone [27,54].
5. Low-Cement Concrete: The Demand-Side Pathway
5.1. Reduction of Binder Intensity and Performance-Based Mix Design
The first observation for the demand-side pathway is that many cement-based materials, and concrete in particular, contain more cement than their performance levels require. There are two main reasons for this. In the case of structural elements, prescriptive specifications indicate minimum binder contents and reward relatively early-age strength (a common maximum of 28 days). The level of industrialisation of the sector is still behind those in other sectors, and a significant volume of construction is done on-site, with increased levels of waste production and lower levels of optimisation compared to industrial settings. Engineering the particle-size distribution of aggregates and especially fines to minimise voids allows substantial binder reduction without loss of mechanical performance, even without contribution of reactive SCMs to microstructure development [55]. Robalo et al. [56] demonstrated viable low-cement concretes with up to about 70% binder reduction by optimising compactness and assisting with superplasticisers. These are mature, limited-technology interventions whose barriers are specification and acceptance rather than materials science. However, such optimisation strategies can only be reliably implemented in industrial setups, highlighting the importance of further industrialisation in the construction sector.
5.2. Structural Optimisation and Efficient Design
Regulation specifies performance compliance at the age of 28 days, among which compressive strength is the most common. Such approach is merely conventional, and it was established when Portland cement without SCMs was the norm. This made sense at that time, as further development of microstructure after 28 days was not significant enough to justify additional extensions in verification of compliance. Nowadays, blended cements are the norm, and most SCMs react at later ages, making most of their contribution to microstructure after the age of 28 days. Specifying strength at later ages (e.g., 56 or 90 days rather than 28 days) would exploit the late pore refinement of such blended systems, indicating another regulatory barrier. Machine-learning-assisted mix design targeting 90-day strength has been shown to cut cement content by roughly 10% [57].
Structural design can also contribute to larger gains upstream. Belizario-Silva et al. [58] provided a wide empirical benchmark for Brazilian reinforced-concrete structures of 35–140 kg CO2/m2, showing that buildings of the same height can differ four-fold in embodied carbon as a result of designer choice. Olsson et al. [59] presented estimations of percentage reductions of up to 76% of cement-and-concrete greenhouse-gas emissions and 65% of cement demand via engineering and structural-design decisions alone. At the building scale, Hafez et al. [14] also show that adding up interventions such as waffle slabs, span reduction, and low-binder concrete can cut down the embodied carbon of a mid-rise building roughly 75% (from about 232 to 58 kg CO2e/m2). The figures may need some verification but they remain informative. The implication that the design decision may be the single largest lever makes it surprising that this is also one of the least incentivised strategies by current policy.
A further potential source of savings on the demand-side is derived from the safety margins that are prescribed and accumulate along the chain. On-site concrete mixes are routinely designed to be stronger, i.e., richer in binder content, than the basic level. This is because conformity requires complying with a target strength above the characteristic value. It is common practice in engineering. A clear example is EN 1992-1-1 [60], which applies a partial increasing factor of 1.5 to concrete (against 1.15 for steel), with reductions permitted (in its Annex A [60]) that are rarely invoked.
Precast production provides an industrial setting with lower variability and risk, creating more scope for practitioners to implement the reductions. In this respect, greater industrialisation in the sector can lead directly to reduced cement consumption in concrete production. A proactive policy example is provided by the Argentine code for concrete structures, which links permitted strength margins to the producer’s quality control regime (following the same logic as Eurocode 2’s Annex A [60]). It distinguishes between producers with and without certified quality systems. Highly penalising the lack of quality control with larger margins (i.e., more cement content and higher costs) promotes reductions in the variability of the strength of products. The specified strength, defined as the value under which a certain fractile of results are expected to fall, can be computed to a lower value after rising this fractile value from the historical 5% to 10% after a quality assurance system is implemented. The reduced variability for the strength of products can help saving up to 40 kg CO2eq/m3 concrete [61].
Cutting on indirect emissions is also possible. For formwork, designers commonly consider utilisation ratios around 80% of the code allowance for repeating uses. Such over-design must also be accounted for within the material efficiency of cement-based concrete [62], and its removal depends on a cultural rather than a technical change. Many other examples can be considered, in all cases derived from who carries the consequence of being wrong rather than any structural necessity. Since all over-design margins are multiplicative, even modest improvements at a certain level have a noticeable impact on carbon efficiency.
5.3. Reuse, Circularity and Material Efficiency
Circularity approaches have evolved to better address waste hierarchy. Many strategies for recycling waste concrete are available [63], but reusing structural components rather than recycling them into low-grade aggregate started receiving more attention in recent years. Monolithism in concrete construction is still the norm, but modular construction with prefab elements has led to significant development of cold joints. Such joints can also be adapted to favour deconstruction and limit damage to such elements. Küpfer et al. [64] demonstrate that cutting and reusing reinforced-concrete slabs from existing buildings can reduce embodied carbon up to 80%, down to as low as about 5 kg CO2/m2 floor. Such approaches are extremely efficient for carbon savings and also dematerialization, but they require the creation of new supply chains, feasibility in terms of technical specifications and design, and contracting expertise that are not yet present at scale.
There are also studies presenting less optimistic results on the demand-side strategies. Almasailam et al. [13] indicated that the increase in cement content to reach higher-strength concrete can nullify the structural saving with less volume of concrete. The level of efficiency of the design depends on the functional unit under consideration. Demand-side reductions (such as the 76% of [59]) are not guaranteed but conditional to the specific case.
Low-cement concrete also brings operational challenges. Lowering the cement paste volume in concrete can reduce workability, increase the risk of early cracking, and slow strength development. As a result, improved quality control in terms of curing, water content control, and additional compliance testing becomes more critical, yet it is not always straightforward to implement under on-site conditions. In addition, prescriptive codes often mandate minimum cement contents and can limit radical approaches when these are perceived risky in terms of compliance and liability. Designers and contractors specifying reduced binder content face additional exposure for any underperformance, frequently without contractual mechanisms that would allow them to profit from the carbon reduction. These obstacles involve economic, contractual, and cultural aspects that put pressure on these dispersed actors who are the least able to bear them.
6. Comparative Assessment of Decarbonization Pathways
The two pathways are definitely complementary. There is no single route that can fully decarbonize the sector, and even if the supply-side measures could reach up to, e.g., 80% of the needed reduction, the remaining 20% requires demand-side efficiency [5]. The largest demand-side contributions identified by Watari et al. [5] come from material-efficient design (9%), more intensive use of buildings and infrastructure (11%) and service-life extension (4%), and their analysis indicates that demand-side action deployed at high technical potential removes the need for mass CCS deployment altogether. Georgiades et al. [37] assess European cement production alone through prospective life cycle assessment, attributing by 2050 and relative to 2020 some 42% to clinker substitution, 25% to alternative fuels and 12% to improved kiln efficiency, which combine to about 58% without carbon capture and 88% with it. This particular study is bounded at the factory gate and does not address demand-side measures at all. Bataille et al. [65], focusing on the Global South (cases of India, Brazil, and South Africa), find substantial mitigation potential on both the production side (58–71%) and the demand side (13–26%) under current-policy scenarios. However, the fact that countries are still building basic infrastructure means that the production side may deliver more short-term cumulative mitigation, because it can be addressed through a small number of high-capacity actors, whereas demand-side material efficiency will require decades of educational and regulatory efforts. This is an important contrast to Europe-centric optimism regarding the demand-side action. The institutional capacity to coordinate dispersed actors is weaker in the Global South, making the atomisation problem more acute. Habert et al. [12] argue that the contribution of all stakeholders across the whole supply chain could reach about 50% emissions reduction if they are all engaged, even without heavy investment in new industrial infrastructure or modification of existing standards. The atomisation issue may be underrepresented in their estimations, as the stakeholder diversity is not leveraged across the value chain.
Figure 3 illustrates the predominance of the potential on the supply side. The values are not directly comparable because the estimations differ in baseline, system boundary, scope, and time horizon (Table 1). Because this comparison is merely illustrative, in Figure 3b, the estimates from [5] and [65] are expressed as a share of the total abatement in those same reports (the only normalisation that the published information allows), although under their own corresponding baselines and boundaries. Such normalisation is not feasible for [12,37,59]. Still, the mitigation potential consistently shows three to four times the contribution potential on the demand side.
Figure 3.
Reported potentials for supply-side and demand-side actions. Note: The representation is illustrative for the consistent dominance of the supply-side potential, and direct comparison between values must consider that the studies differ in baseline, system boundary, scope, and time horizon. Sources: Watari et al. (2022) [5], Bataille et al. (2023) [65], Georgiades et al. (2023) [37], Olsson et al. (2023) [59], Habert et al. (2020) [12].
Table 1.
Geographic scope, system boundary, baseline and horizon of studies reporting mitigation potentials for the two pathways.
The sequencing, emphasis, and expected actions are still a matter of discussion, considering the local conditions for various dimensions (Table 2). The contrast in terms of weaknesses and strengths of each strategy is stronger in terms of principal actors (and atomisation level), standardisation, and ability to pass costs downstream. The only dimensions in which the demand-side potential shows some advantages over the supply-side potential are the primary decarbonisation mechanism (as the demand-side can contribute mitigating both carbon and material intensity), and typical reported CO2 reduction (although these values must be read in the context of respective methodological approaches).
Table 2.
Heatmap and side-by-side comparison of the low-carbon cement (supply-side) and low-cement concrete (demand-side) pathways across various dimensions.
Habert et al. [12] established the most realistic decarbonization strategies through the full value-chain of cement and concrete. Marginal gains accumulate as efforts from the various stakeholders materialise. Within each group of stakeholders, the environmental efficiency level for a given strategy would also be very variable. This adds up to the significant number of cement types and cement-based products in the market.
The qualitative assessment by Habert et al. [12] addresses the various types of stakeholders and their potential actions towards decarbonization in terms of number of actors, available investment, market penetration and applicability, and carbon reduction for each technology. Comparatively speaking, the number of actors is characteristic for each type of stakeholder, with the clients being the most numerous and the clinker production sector being the least. With fewer stakeholders, the individual level of impact increases when, e.g., a cement plant implements low carbon technologies compared to low carbon technologies implemented in the construction of a certain building.
Moreover, incentives (regulatory and economic) are very variable across the value-chain, with cement producers receiving the highest regulatory pressure but being able to pass the burden through cost additions, and clients receiving the least pressure but seeing the impact on the cost they need to afford. Such regulatory and economic pressure is captured by the available investment, and it can be translated into a certain investment attractiveness for further decarbonization. At the same time, for the various possible actions towards decarbonization, a certain level of decarbonization potential can be defined based on the level of market penetration, applicability, and carbon reduction for the technology.
Based on the qualitative stakeholder assessment of Habert et al. [12], an analysis of the structural asymmetry between pathways is presented in Figure 4. Each decarbonization action is addressed by its investment attractiveness (a proxy for the regulatory and economic pull on that actor) and by the relative individual leverage of the actor (the inverse of the number of actors who must act). The bubble areas are proportional to the decarbonization potential of each action, calculated as its carbon-reduction score multiplied by its market-penetration score (both transcribed from the qualitative assessment of Habert et al. [12]). Bubble areas are comparable with one another but carry no absolute units. Supply-side actions (CCUS, clinker substitution, alternative cements) occupy the high-leverage, high-attractiveness upper region, whereas demand-side actions (structural optimisation, optimised design, mix optimisation, recycling) are positioned in the low-leverage, low-attractiveness lower-left. This offers a clear and consequential pattern aligned with previous analysis in Table 1.
Figure 4.
Stakeholder leverage and decarbonization potential across the value chain, re-analysed from data in [12]. Supply-side actions concentrate in the high-leverage, high-attractiveness region; demand-side actions cluster in the low-leverage, low-attractiveness region despite comparable decarbonization potential, reflecting the atomisation of demand-side actors.
The closer the technology is to the upper-right corner and the its larger bubble, the highest its potential impact of singular implementation for the decarbonization roadmap of the sector. The fact that low-carbon concrete/construction technologies group in the bottom-left corner is a result of the significant atomisation of the value-chain in this segment, resulting in low bargaining power at individual level. The decarbonisation potential may be similar to actions in the segment of the value-chain corresponding to low-carbon cement, but their impact would demand additional effort and policy actions to reach a similar impact to that of actions on the top-right corner.
Notably, the fact that carbon capture and storage sits in the large-investment attractiveness zone deserves additional discussion. These technologies are commonly addressed as expensive decarbonization alternatives when compared with other options. Still, the cement industry indicates them as the viable solution to achieve net zero emissions [68]. To some extent, this may be read as a result of coping with the fact that full clinker substitution is not achievable, and a fraction of process emissions remains unavoidable. The implementation of CCS in the sector under current conditions means a measurable impact on production costs. It is not yet clear whether CCS will be able to contribute to the decarbonisation strategy while keeping costs competitive, and much progress in this field is still needed towards the implementation of such reductions.
The decarbonization potential of demand-side actions, even when considered broadly comparable to that of several supply-side actions, demands additional coordination, incentive, and policy effort for its realization to overcome the low bargaining power of atomised actors. The main contrast between the two pathways does not lie in what they could deliver, but on how easily the prevailing institutional structure lets them deliver it.
The literature agrees that no single technology suffices, that clinker substitution is the most mature and immediately deployable lever, and that demand-side efficiency is necessary for net zero. It remains unresolved on three others. The magnitude of demand-side potential is variable depending on the source. Olsson et al. [59] indicate potential reduction up to 76% in great contrast with results from Bataille et al. [65] of 13–26%. This gap is partly explained by the specific geography and boundary. Approaches for quantification of CO2 uptake via carbonation are inconsistent across studies, and this is an obstacle to the significant potential shift in the supply–demand balance. The comparative ranking of technology efficiency is unstable across LCA conventions (see more details in next section), a fact that is not trivial considering that they determine which pathway is presented as the more advantageous.
A growing body of work argues that the comparison cannot be settled on techno-economic grounds alone, because the sector is a socio-technical system in which technologies, business models, regulations and professional cultures evolve together. Griffiths et al. [8] argue that incumbency, lock-in, and the slow turnover of standards and skills shape which decarbonization options get adopted at least as much as their abatement cost does. System-dynamics modelling reinforces the point. Ige et al. [43] show that cumulative emissions are determined not only by the introduction of mitigation measures but also by the way they interact with each other, i.e., not just by their static potential. As a result, early, mature measures can dominate the decarbonisation trajectory even when later measures have greater ultimate potential. Kumar et al. [69] similarly argue that reaching net-zero cement requires systems thinking that aligns strategic policy with the structure of the value chain rather than optimising single technologies in isolation. The contrast between supply and demand sides is not so much in terms of engineering potential as it is of incentive and institutional design.
7. Life Cycle Assessment Challenges in Cross-Strategy Assessment
Comparisons between strategies are as reliable as the LCAs that feed them. Research on LCA does not always make its own limitations transparent. Inconsistent system boundaries, functional units, and allocation rules undermine the reliability of comparisons across systems [70,71]. Consequently, two methodologically defensible studies can rank the same pair of technologies in opposite orders. Any assertion that one pathway is more carbon efficient than another must specify the convention under which the claim is valid. A summary of LCA methodological possible choices and their effect on cross-strategy comparison is presented in Table 3.
The functional unit is the most consequential choice. Mass-specific and volume-specific units benefit low-binder and low-clinker mixes; strength-specific units can change that ranking; service-life-specific units can change it further. Van den Heede and De Belie [70] demonstrated that mass- versus strength- versus service-life-based functional units may reverse the ranking of green concrete mixes. Another direct example of this for graphene-amended cementitious composites flips solutions from environmentally worse to better depending on whether the functional unit is normalised by volume, strength or durability [72]. The demand-side pathway is defined by functional efficiency and is therefore systematically undervalued by the material-level (per-mass) units that dominate current practice and policy.
Boundary choices matter almost as much as the functional unit. Cradle-to-gate boundaries are typical in Environmental Product Declarations in Europe. In these, the use and end-of-life phases in which durable low-binder options recover their advantage and in which carbonation re-absorbs a portion of the original calcination CO2 are disregarded. The wide variation in uses and construction practices makes it unfeasible to address stages later than gate. The accounting treatment of this carbonation uptake is decisive [5]. Literature still needs to mature and offer consistent approaches in terms of the carbon sink potential of cement-based infrastructure and avoid the significant inconsistencies in terms of how much residual mitigation the demand side can offer. Carbonation was historically addressed mostly as a durability issue, with assessments of the progress of the carbonation front but lacking quantifications on the amount of CO2 effectively taken up [73]. Such research also focused mostly on Portland cement without supplementary cementitious materials, and the most common low-carbon cements in the current market are highly underrepresented even though their carbonation behaviour is quite different from CEM I [74]. Insufficient availability of data is part of the current difficulties to extend boundaries in LCA.
Because SCMs are industrial by-products, the emissions allocated to them depend on the allocation rule chosen (i.e., mass, economic, cut-off or system expansion). Van den Heede and De Belie [23] showed that economic allocation coefficients for fly ash of 4.3% (as proposed for Canada, 2017, by Seto et al. [75]) make low-carbon cement options with high-volume fly ash replacement no longer environmentally worthwhile in comparison with CEM I. Teh et al. [76] provide a clear demonstration of this by using hybrid input–output LCA. A higher greenhouse-gas estimate is systematically found for Portland cement and all concrete types than process-based LCA yields. Results for geopolymer concrete change dramatically depending on the allocation rules for emissions from fly ash and slag. As primary steel and coal power decline, the economic value (i.e., the economically allocated burden) of slag and fly ash will rise, so the actual outcome is also dynamic over time.
Two methodological advances intend to mitigate these problems. Prospective LCA models procure consider background systems (e.g., cleaner grids, alternative fuels) rather than freezing present conditions. This is essential for 2050 claims, provided the significant changes already expected in the next couple of decades ([37,77]). Probabilistic LCA propagates uncertainty rather than reporting single point estimates. Huang et al. [78] report 14–29% life-cycle-cost reductions for LC3 concretes with 80–100% probability, and Sambataro et al. [79] derive country-specific European benchmarks with standard deviations two-to-seven times smaller than generic background databases, together with a quantified reduction of roughly 7–9 kg CO2eq per tonne per one-per-cent clinker reduction. These are exactly the tools required for a credible cross-strategy comparison, but they are not yet standard.
Table 3.
Principal LCA methodological choices and their effect on cross-strategy comparison.
An illustrative example of the magnitude of these effects is given in Table 4. A comparison for the same structural floor made with three binder options is presented: M1, strength class C35 with CEM I; M2, strength class C35, with CEM III/B with 70% ground granulated blast-furnace slag; and M3, strength class C50, with LC3-50 cement. The most favourable mix (lowest Global Warming Potential) is M2 under a volume-based or surface-based functional unit, M3 under a strength-normalised unit or if the slag carries an economic allocation of part of the blast-furnace burden instead of a cut-off. The ranking of the same two mixes reverses depending on each of these four defensible conventions. These values are indicative and lie within published ranges, but they work as an example that the choice of convention carries distributional consequences, with volume-based units systematically favouring the supply-side pathway while function-based units systematically favour the demand-side one.
Table 4.
Illustrative effect of the functional unit and of the allocation rule on the ranking of three binder options delivering the same structural floor. M1: CEM I, 340 kg/m3, C35. M2: CEM III/B with 70% GGBS, 360 kg/m3, C35. M3: LC3-50, 340 kg/m3, C50. Values are indicative and lie within the ranges reported in published EPD analyses [80,81] and allocation studies [23,75,76].
A claim that low-carbon cement and low-cement concrete impose different burdens on different stakeholders presupposes comparable LCAs as an input, and that input does not yet exist. A harmonised convention (an agreed functional unit and allocation protocol designed specifically for stakeholder-burden comparison, ideally probabilistic and prospective) would be a substantial contribution and a precondition for evidence-based policy. Until it exists, comparative carbon claims should be read as convention-dependent rather than absolute.
8. The Carbon Cost Burden Across Stakeholders
Rootzén and Johnsson decompose how cement carbon-abatement costs propagate along the value chain up to end-use as a residential building. Their central finding is that cost impact decreases substantially at each transformation stage, from limestone to final end-use (Figure 5). The endpoint dilution for the completed building (1%) is an estimation for a residential case [66]. The intermediate stages are derived from the cost of the structure for this residential case (cement represents approximately 18% of ready-mix concrete cost, considering 340 kg cement/m3 concrete at a reference cement price; concrete represents approximately 45% of the cost of the structure, considering 0.63 m3 concrete/m2 building and a cost of 158 €/m3 concrete and a total cost for the structure of 220 €/m2). A large relative cost shock at the kiln becomes almost imperceptible at the building, with a near-doubling of the cement price raising the total cost of a residential building by only about one per cent. Another assessment of a bridge built with CCS-based cement and steel also found an increase of about 1% in total construction cost (linked to a reduction of ~51% in the CO2 associated with construction [67]). These two independent studies of different asset types, which converging on the same order of magnitude, suggest the acceptable generalisation of the dilution mechanism. Such results are considered strong evidence of decarbonization costs being affordable for the sector.
Figure 5.
Schematic dilution of a carbon-abatement cost shock along the value chain. Endpoint +1% of total building cost is from Rootzén and Johnsson [66] for a residential case; intermediate stages are estimations based on relative costs.
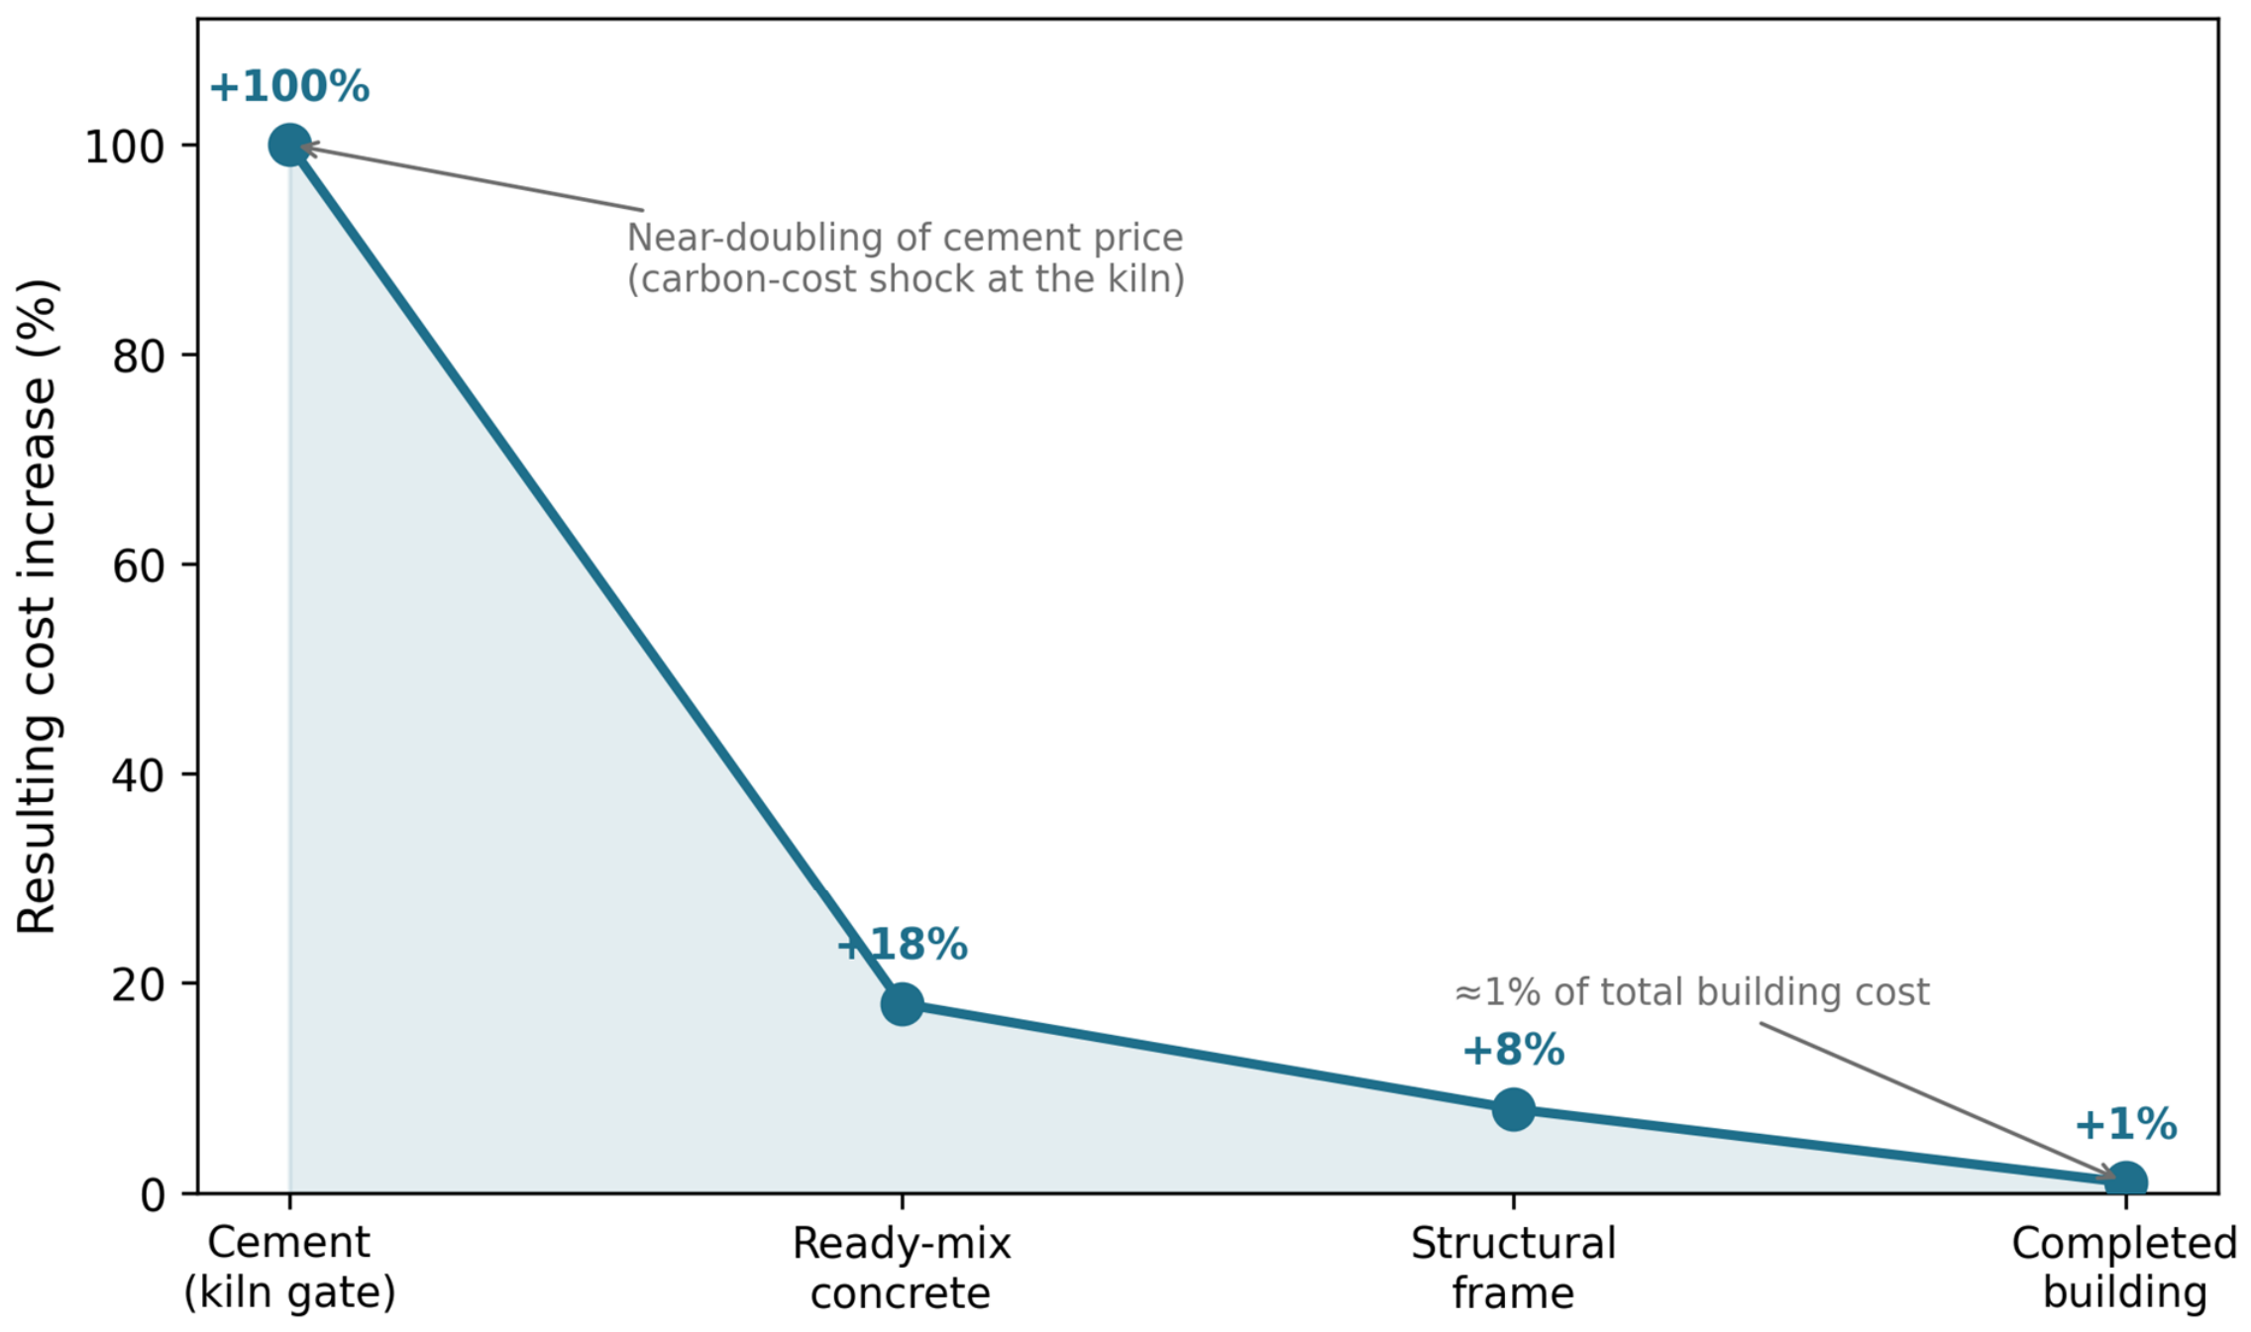
Deviation from the residential and bridge cases would be largest when cement costs account for a substantially different share of the cost of the functional unit. By replacing the CO2 term in Equation (1) by the term “decarbonisation cost”, the decarbonisation cost per tonne of cement can be used to estimate the equivalent decarbonisation cost per functional unit. Consequently, cement content per functional unit and total cost per functional unit determine the dilution of decarbonisation costs of each construction typology compared to residential buildings or bridges. Two examples showing notable differences are concrete pavements and marine structures.
A continuously reinforced concrete motorway pavement in Belgium used about 105–112 kg of cement per m2 of pavement (0.23 m slab at 400 kg/m3 over a 0.25 m cement-treated base at 50–80 kg/m3 [82,83]). At a cement cost of ~90 €/t, this represents 10–14% of the pavement construction cost, estimated at 83–94 €/m2 [84]. A 60–100% rise in cement price due to decarbonisation costs would raise the cost per lane-km by 6–14%. This is roughly ten times the ~1% found for buildings and bridges in [66,67].
Marine structures cover a wide range of cost exposures because their functional units may range from pure civil works to energy assets, for which equipment dominates the cost. A marine quay wall such as the Deurganckdok in Antwerp, 26 m height and 5230 m length, consumed approximately 1.29 Mm3 of concrete [85]. At ~350 kg of cement per m3 of concrete, this corresponds to 85 t cement per m of wall, with a cement-attributable cost of 7.65 k€ compared with a total construction cost of 110–220 k€/m of wall, i.e., roughly 4–12% of the cost. In this case, a 60–100% rise in the cement price would raise the cost of the wall by 3–12%, also above the ~1% previously reported. At the other extreme, a gravity-base foundation for a 5 MW offshore wind turbine at Thornton Bank used 1085 m3 of concrete with 450 kg/m3 of CEM III [86], equivalent to about 98 t of cement per MW, which represents only 0.4–0.6% of the installed cost of offshore wind, estimated at 2.8 k€/kW [87]. The dilution of costs depends on the specific type of marine structure.
To varying degrees, the distributional sting of decarbonization costs is often overlooked. The cost vanishes as it is passed downstream and spread across a building’s much larger cost base. The aggregated affordability should, however, not be presented as neutral incidence. The stakeholders at the end of the value chain paying, e.g., an additional one per cent are not the actors who could capture value from carbon efficiency.
Cement producers receive the greatest regulatory pressure and entail the greatest pass-through ability. These actors are few, capital-intensive, and visible to regulators (with CBAM and the EU ETS targeting them directly), but their position allows them to embed decarbonisation costs in product prices that dilute downstream [66]). Their decarbonization economics are increasingly beneficial as carbon is priced. Clinker substitution has developed relatively fast in such capital-intensive sector because it lowers both emissions and cement cost. This has fuelled investment in novel SCMs and blended systems such as LC3 systems in recent decades, as an efficient route to further reduce clinker factors even with declining availability of slag and fly ash. Nowadays, CO2 mineralisation or CCS are technologies still to be upscaled, and the main reason for this is that for them to become profitable the right policy needs to be implemented [42,88,89]. A more direct contribution comes from CO2 uptake of cement-based products via natural carbonation. There are current methodologies for this accounting, implying zero impact on production costs, but their reliability is still under discussion. Their main risks are the capital and stranded-asset exposure of CCS, and product-qualification risk for novel binders, not the everyday liability that weights on downstream actors.
The beneficial framing of the business cases for mineralisation and CCS is conditional on carbon prices, storage certification and off-take markets that policy must create [42,89]. The incentive to invest in decarbonisation technologies is itself a policy variable. Additionally, concentration gives those big players power to act beyond the ability to pass costs downstream. From an innovation-ecosystem perspective, Stokke et al. [90] show that upstream suppliers such as cement producers can actively shape the public-procurement environment in which they compete. The level of concentration makes cement producers easy to regulate but also makes them effective at shaping the rules, with a potential roadmap-authorship bias (see next section).
Concrete producers occupy an intermediate position. They can implement SCM substitution and mix optimisation within existing practice. Carbon with increasing value should lead to low-clinker and optimised mixes being commercially advantageous. An important aspect to consider is that in the current environment cement producers have become important actors at the level of concrete producers as well. This helped optimising the value chain logistics but also facilitated the transfer of environmental and economic costs between the two levels within multicompany structures. Small players still exist and promote sectorial interests via federated organisations. Such organisations have, however, a reduced capacity for coordination and fast adaptation to new rules. The absorption of the performance and quality-control risk of reduced-clinker mixes with the propagation of low-clinker cements is a clear example of this. Small producers remain using high clinker cements or higher cement contents in mixes in proportion to their lower level of technification and investment capacity. Concrete producers are more numerous and less concentrated than cement producers, with some players also well aligned with the perspective of cement producers. As a result, their individual bargaining power and ability to pass costs on reduce significantly.
Designers and specifiers exert substantial influence over embodied carbon [14,58]. However, they encounter some of the weakest incentives and the greatest exposure to liability. A list of examples of mechanisms acting on liability for designers, specifiers, and contractors is presented in Table 5, together with the decarbonization measures covered and their limitations. A designer who specifies an optimised structural system assumes professional-liability risk for any under-performance, frequently without a contractual mechanism to be rewarded for the carbon saved. This combination of high leverage and high risk without compensation is the most significant weakness of the demand-side adoption problem.
Contractors inherit execution and defect risk. Designers and specifiers must ensure that their optimised choices are correctly implemented in the field. For example, low-binder concretes demand stricter site control as it involves greater liability risks derived from any consolidation, cracking or strength non-conformity. Because they are numerous and operate on thin margins, contractors have little incentive to pioneer demand-side approaches and strong incentive to default to proven, prescriptively specified mixes against the intention of designers.
Clients and owners face the least direct regulatory pressure but ultimately absorb the decarbonization cost (i.e., the residual one per cent estimated by Rootzén and Johnsson [66]. However, they hold, as a whole, a significant decarbonization potential. Such potential is, however, divided among a very large number of weakly coordinated decision-makers. The cost faced and residual-value uncertainty significantly reduce the willingness to pay for lower-carbon construction.
The incidence of the burden also differs sharply by geography, which the Europe-centric literature can obscure. In economies still building out basic infrastructure, the same atomisation problem is compounded by weaker institutional capacity to coordinate dispersed actors. Then, the production side with a small number of actors is both the easier short-term target and the one most exposed to trade instruments like CBAM [65,91]. In such settings, the “one per cent” affordability estimation from Figure 5 may not hold, due to differences in the regional cost base of construction, the structure of the contracting market, and the elasticity of demand. The cost-burden problem is in reality more variable than presented in Figure 5, with individual curve shapes depending on typology and region.
Table 6 presents asymmetries across stakeholders, indicating the different levels of regulatory pressure, cost pass-through ability, and individual leverage concentrating upstream. Adoption risk concentrates downstream, i.e., on designers, contractors and owners, reducing their feasibility and investment attractiveness, as already described in Figure 4. Miller et al. [15] frame engagement of stakeholders as the binding constraint, with most solutions being economically viable only once carbon is priced. Carbon pricing reaches the upstream actors far more effectively than the downstream ones.
Table 5.
Mechanisms in current practice that act on the liability exposure of downstream actors implementing decarbonisation measures.
Table 6.
The stakeholder asymmetry matrix.
The main gap in the data remains at the level of willingness to pay the decarbonisation costs. The policy literature assumes stakeholder engagement. The engineering literature assumes that end-users will buy the best available product. There is, however, no evidence on how much carbon reduction costs contractors, specifiers and owners would actually be willing to pay. Some industry surveys try to reflect the willingness of respondents to pay a premium for CO2 reductions, but such data still requires independent verification. More solid cost-burden studies are necessary to develop effective strategies and policy for the various building typologies.
9. Policy Instruments and Their Embedded Biases
Among policies, carbon pricing generally beats regulation and voluntary instruments on both efficiency and innovation [2,100]. However, cement and concrete markets are concentrated and exposed to trade, so carbon pricing alone makes carbon leakage more likely and must therefore be paired with border protection. Pricing also acts most strongly where emissions are concentrated and measurable (i.e., at the kiln) and only weakly on the dispersed and hardly measurable decisions that drive material demand. Thus, carbon pricing leans on the supply-side by construction of this instrument.
The EU CBAM is the most direct example of an instrument designed for a specific path. It taxes imports based on their embedded emissions, which are directly defined by clinker content. Producers are thus incentivised to lower clinker factors [101]. CBAM can reduce carbon leakage; however, it raises EU ETS prices and can penalise EU downstream exporters not covered by the mechanism [101,102]. A key point is that CBAM assesses carbon at the material level (i.e., per tonne of clinker), therefore rewarding low-carbon cement while disregarding design approaches that use less cement.
European Green Public Procurement [103,104,105,106] and American Buy Clean ([107,108], discontinued in 2025 [109]) mandates are potentially powerful levers, because public buyers can demand low-carbon outcomes at scale. Busch et al. [110,111] identified green procurement and the shift from prescriptive design to performance-based specifications as the two most impactful actions. As a limitation, in practice most instruments focusing on procurement and EPD-threshold use indicators for declared carbon per material unit, which again rewards improvements at the material level rather than dematerialisation. Moreover, the supporting EPD infrastructure is still immature on its own. Systematic analyses of published concrete and cement EPDs [80,81] showed that coefficient ranges can be used for benchmarking and target-setting. However, EPDs are not yet standardised enough to be compared reliably across manufacturers [112,113]. Procurement that leans on non-comparable EPDs inherits their unreliability. This is critical because upstream suppliers may actively shape procurement ecosystems to their advantage [90] and existing implementations display wide cross-country variations [114].
The pattern across instruments is consistent (Table 7 and Figure 6). Most deployed instruments (CBAM, EPD thresholds, carbon pricing) act at the material level and structurally favour supply-side measures; functional instruments remain rare and immature. Lower carbon per tonne or per cubic metre is normally rewarded, and only less mature instruments (e.g., performance-based specifications, whole-building embodied-carbon caps) operate at the functional level where demand-side efficiency resides. A political-economy explanation for this pattern derives from meta-analysis of decarbonization roadmaps [4], which suggests that industry-authored roadmaps may systematically emphasise cement-side strategies while non-industry roadmaps may be more inclusive of concrete-side dematerialisation. In their analysis of cement and concrete innovation in the Netherlands, Wesseling and Van der Vooren [115] argued that roadmaps are used by incumbent actors to lobby against policies which incentivise disruptive change, and instead, they are used to help maintain the status quo. The strength of this evidence still needs reinforcement. A systematic corpus-based analysis with quantitative text-mining may prove whether or not authorship predicts the emphasis of decarbonization roadmaps across a representative corpus. The roadmap-authorship bias should therefore be best treated as a well-supported hypothesis rather than as a measured effect.
Table 7.
Policy instruments, the level at which they act, their mechanisms and principal limitations.
Figure 6.
Decarbonization policy instruments arrayed on the material-to-function targeting spectrum.
These conclusions transfer only partly to the Global South. The instruments discussed assume three conditions that are not general: a carbon price that reaches the plant, an auditable declaration system, and procurement with the capacity to enforce material thresholds. Where these are missing, a material-level instrument has nothing to act through, and the binding constraints are different ones: the cost of finance for plant conversion, the informality of much construction activity, and the absence of benchmark data [65,91,117]. Two asymmetries follow. CBAM acts on exporters outside the EU without giving them the revenue recycling or free allocation available inside it [101,102]. The demand-side pathway, limited in Europe by specification culture and liability, is limited here by the capacity to coordinate dispersed actors, a harder constraint that no current instrument addresses [65]. However, transfer is not one-way. A good example of this is the faster adoption of calcined clay and LC3 systems in Latin America, Africa, and India than in Europe [118,119,120,121,122,123,124,125]. Thus, the regions that produce most of the policy literature do not always coincide with those that have the most extensive practical experience.
Moving to function-based instruments depends on benchmarking infrastructure that is not yet available. Whole-building embodied-carbon caps require credible reference values for kg CO2 per square metre, and the EPD literature shows both the promise and the immaturity of the data (which is also difficult and more complex to corroborate or audit than material indicators). Asdrubali et al. [116] benchmark embodied carbon across insulation, masonry, steel, and stone, placing the contribution of concrete in context, while Sambataro et al. [79] show that country-specific probabilistic benchmarks are achievable. Without such benchmarks being standardised and mandated, function-level instruments lack the measurement base that material-level instruments already possess. This is a further structural reason for the supply-side bias.
A shift towards performance- and function-based policy means, e.g., replacing prescriptive minimum-binder rules with performance specifications, coupling whole-building embodied carbon caps with EPD thresholds for each separate material, or rewarding whole carbon efficiency independently of where it occurs in the chain. Ultra-low-carbon concrete pathways need coherent policy integration rather than isolated technical fixes [69,126]. Such instruments would be effective in capitalising on demand-side savings, but their design is difficult. Performance specification shifts liability onto specifiers, and whole-building caps requires benchmarking data that is not yet available. An appropriate transition for cement-dependent regions and workers adds additional constraints [8]. In any case, without these actions the policy architecture will continue to reward the easiest material-level pathway and keep the demand-side pathways underexploited.
10. Discussion
Overall, the literature agrees on three main points (e.g., [5,12,15,54]):
- no single technology can decarbonize the cement and concrete sector;
- further lowering clinker factors in cement is the most mature and immediately scalable lever;
- and demand-side efficiency is necessary for reaching net zero.
There are, however, several unresolved debates. These are not resolved by additional reviews such as the present. Instead, they require harmonised methods and new primary data. Among the most impactful, it is worthy highlighting the following:
- ○
- the magnitude of demand-side potential is still in debate and partly an artefact of geography and boundary choices [59,65]; this seems natural as the quality of baseline data is low;
- ○
- carbonation uptake is a main unresolved and very necessary input for decarbonisation; current data are yet inconsistent and consequential [5];
- ○
- the comparative ranking of technologies is very dependent on choices of functional units and allocation rules [71,72,76];
- ○
- and the empirical evidence for cost-burden and willingness-to-pay claims is very scarce (with only a few examples such as in [66]).
The recurring claim that decarbonization pressure makes low-carbon cement intrinsically less risky than low-cement concrete deserves some rethinking before validating the first one as a clear priority for stakeholders. It is true that low-carbon cement enjoys established standards (EN 197-1, EN 197-5), proven performance, insurer familiarity, and concentrated actors able to pass costs downstream, while aggressive cement reduction carries performance, liability, and codification risks borne by dispersed actors. This should not be directly translated into the interpretation of a reduced risk for the former. The risk asymmetry must also address the contrast in standards maturity, contractual structure, liability allocation, and incentive design. The simplicity of reducing clinker factor in comparison with demand-side strategies seems to have translated into an institutional artefact that should not be interpreted as evidence that low-carbon cement is climatically or technically superior. Demand-side actions hold comparable decarbonization potential, but such strategies still lack institutional support. Without comparable approaches, the effectiveness of both pathways cannot be compared. To read the asymmetry as a reason to deprioritise demand-side action is to mistake a fixable feature of the current system for a property of the technologies, and to risk establishing the very bias that roadmap meta-analysis identifies [4]. Under present institutions low-carbon cement represents the lower-risk choice for most individual stakeholders, which is precisely why reducing risk on the demand side should be the immediate priority for policy and contracting.
Most of research in the field has addressed the technology questions, but open questions remain, mostly at the level of upscaling studies. Some of the most relevant concern:
- Methodological gaps: A critical methodological need is a harmonised LCA convention for cross-strategy comparison. An agreed functional unit and allocation protocol, ideally prospective and probabilistic, must be designed for stakeholder-burden analysis [71,76]. This feeds from a second related gap, which is durability and long-term field performance. Most alternative cements and low-binder concretes are characterised at 28 or 90 days, with little decade-scale field data, which feeds directly into the functional-unit problem. The CO2 uptake potential of blended cements remains underexplored, and estimations are still made based on experimental data collected from mixes containing CEM I [11,127].
- CO2 uptake allocation: Beyond quantification, where the CO2 uptake is capitalised along the value chain is a distributional question for cement-based products. Although EN 16757 [11] assigns carbonation uptake to in-use (B1) and end-of-life (C3/C4/D) modules, no framework establishes which actor along the value chain capitalises the credit, nor how it reconciles with carbon costs prices at gate under CBAM, ETS, and Green Public Procurement/Buy Clean. This means that schemes are possible under which the actor who is bearing the carbon cost and the actor capturing the uptake credit do not coincide. Three allocation principles are available, and they differ in their incentive properties rather than in their accounting validity. Under a producer principle, the uptake credit is allocated to the actor that placed the binder on the market. This aligns the credit with the actor that bears the gate-level carbon cost under CBAM and the EU ETS, but it rewards an outcome that the producer no longer controls after delivery. Under an asset-owner principle, the credit is allocated to the owner of the structure while carbonation occurs. This matches the physical location of the uptake and the assignment of carbonation in EN 16757 [11] to modules B1 and C3/C4/D, but it links the reward to an actor without influence over the binder chemistry. Under a shared principle, the credit is divided between the two according to the proportions of uptake attributable to composition and to exposure conditions, respectively. Further research is needed to establish which of these options best aligns the allocation of credits with the distribution of burdens and incentives along the value chain.
- Empirical cost pass-through across typologies: Cost results for residential buildings [66] have been cited extensively across various typologies. Commercial, industrial, infrastructure, and precast typologies have very different cement intensities and cost elasticities. The ~1% finding cannot be assumed to transfer directly, and replication and extension across typologies is still pending.
- Stakeholder willingness-to-pay and behavioural economics: Willingness-to-pay is essentially unstudied with rigorous methods. This entails research on the sociological and economic factors underlying the issue. Interdisciplinary research on the topic is scarce. Conjoint and discrete-choice experiments with the actual decision-makers (e.g., specifiers, contractors, owners) would replace the assumed engagement present in policy literature and the assumed uptake present in engineering literature. Current premium figures in circulation remain unsupported by factual evidence.
- Institutional, contractual and insurance mechanisms: The allocation of carbon risk in contracts and insurance is almost disregarded. A rare example is Assaad [128] addressing the US legal context. The European and Global South cases are not yet analysed. Liability for under-performance due to, e.g., a designer specifying a given CO2 reduction is not differentiated from other causes. The effects of such context on the adoption of decarbonisation pathways is a decisive determinant of real-world outcomes. It seems easy to imagine that, from the perspective of specifiers, CO2 reduction may be perceived with effects similar to those of corner-cutting or negligent practices in terms of risk, but quantitative data are needed to verify such assumptions.
- Geographic gaps: Europe dominates the existing literature. Current predictions are an overwhelming result of extrapolation of data to the Global South, precisely the regions that are expected to have the larger share of emissions in the coming decades. Latin America, Sub-Saharan Africa, and much of South and Southeast Asia are under-represented relative to their share of future demand [48,91,117], even as projections estimate the participation of developing countries excluding China with emissions of 1.4–3.8 Gt from cement by 2050 [129]. The introduction of CBAM opens new questions. The response of Global-South cement-exporting economies to such measures is still to be measured, as well as the willingness of Global-South end-users to pay a green premium if, e.g., producers adapt their production to European standards. The progress towards decarbonisation in some respects is also more favourable in the opposite direction. A good example of this is the much faster adoption of calcined clay and LC3 systems in developing countries in South America [118,119,120] and Africa [121,122,123], and India [124,125] than in Europe (where ground granulated blast-furnace slag and fly ash continue as main supplementary cementitious materials).
- Lack of integration across the value chain: No integrated model exists of how carbon cost is redistributed across the value chain under the simultaneous operation of CBAM, Buy Clean, performance-based specifications, EPD thresholds, and ETS pricing. As shown in Figure 6, these instruments span across the material-to-function targeting spectrum, meaning different decision makers are involved for each instrument. The various decision makers are not necessarily aligned, and the combinations are only optimised by price mechanisms and competitiveness. Because the instruments are being deployed together, their joint incidence and the actor who ultimately bears the cost is not yet well understood. De-risking policies would be informed by a coupled techno-economic and value-chain incidence model. Such knowledge gap is necessary to unify two framings that have been kept separate so far: the supply-versus-demand dichotomy [5] and the industry-versus-non-industry roadmap bias [4] describe the same imbalance but from different angles. They could be connected within a model of carbon-cost redistribution across the value chain.
Table 8 summarises these research gaps and indicates potential directions towards completion, as well as the most natural actors to achieve such goals. Three criteria can be used to establish a priority order in the short term (2026–2035): enabling dependency (gaps for which their resolution is a precondition for resolving others), feasibility with existing methods and industrial infrastructure, and relevance to already deployed instruments. On these criteria, the first tier comprises the harmonised LCA convention, the willingness-to-pay evidence, and the contractual and insurance mechanisms for carbon-risk allocation. The second tier comprises the CO2-uptake allocation rule, the replication of cost pass-through across building typologies, and the geographic gaps, each of which requires primary data collection but no methodological development. The third tier comprises the integrated value-chain incidence model and the systematic analysis of roadmap authorship (both of which depend on inputs produced by the first two tiers). This ranking must be interpreted as an argument about sequencing rather than about importance.
Table 8.
Research gaps, their significance, potential directions towards improvement, and the primary stakeholders suited to address them.
Neither pathway is sufficient on its own. When assessed against a common baseline, supply-side measures provide most of the mitigation potential, approximately 75–80%, but this also represents their practical ceiling. Reaching net zero therefore depends on the remaining reductions being delivered through demand-side efficiency. The scientific analysis brings attention to three needs: an attribution rule based on the emissions identity that avoids double counting; a normalisation procedure that distinguishes genuine differences in mitigation potential from artefacts of system boundaries; and the reframing of pathway risk as an institutional variable rather than an inherent material property. Economically, abatement costs are highly diluted when reaching the completed asset value, so the main constraint is not affordability but who ultimately bears the cost. Technologically, the asymmetry is different. The supply side primarily requires investment, whereas the demand side requires permission, verification, and industrialisation. Both pathways are therefore necessary, but their barriers differ.
11. Conclusions
Low-carbon cement and low-cement concrete are best understood as complementary interventions at different nodes of the same value chain. Both are necessary for net zero. The evidence is consistent that supply-side reformulation can further deliver a significant near-term reduction, but that demand-side efficiency is also indispensable for closing the remaining gap. The pathways differ less in what they could achieve than in the facilitations that the prevailing institutions open for them.
The state-of-the-art reveals that the cost and risk burdens of the two pathways are structurally asymmetric. Supply-side costs concentrate at a few actors where costs can be diluted and passed downstream, representing about one per cent of building cost for the specific case of residential use. The demand-side responsibility is dispersed across many designers, contractors, and owners who receive little incentive in spite of their large aggregate potential. This adds up to the weakest contractual mechanisms and the sharpest liability exposure of these actors. There is a widespread perception of low-carbon cement being less risky than low-carbon concrete, which is a direct reflection of the institutional landscape, but it might be misleading in guiding strategy. Such asymmetry is not intrinsic but constructed, mainly based on practical reasons for implementation. An appropriate response would be to de-risk the demand side rather than to continue overfocusing on the supply side pathway. The evidence does not support achieving decarbonisation via a single pathway. Instead, it supports building the institutions that let both pathways deliver.
In practice, the uptake of technologies for the demand-side levers (e.g., binder-efficient mix design through particle packing, specification and acceptance at later ages, the tighter quality control required by lower binder contents require) depends on what is permitted and verified rather than on further materials development. For specifiers and clients, the decisive instruments are contractual and insurance mechanisms that define, reward and cover carbon performance, together with performance-based specifications, rather than additional incentives at the material level.
The imbalance in the agenda is framed by a number of gaps:
- cross-strategy LCA comparisons are unreliable due to the lack of harmonised functional units, boundaries, and allocation rules;
- protocols for CO2 uptake allocation establish which life-cycle module carbonation credit sits in, but not which actor along the chain captures it, allowing inconsistencies between the party bearing the carbon cost and the party claiming the uptake credit;
- empirical cost-pass-through evidence is almost absent beyond a single residential case;
- there is a lack of rigorous evidence on the willingness-to-pay among real decision-makers concerning low-carbon cement and concrete;
- decarbonisation risks are reinforced by the lack of research on how carbon-reduction risk and liability are allocated in contracts and insurance;
- global estimations are based on data geographically biassed, with the added concern that large contributors in the coming decades may not be properly represented in the literature;
- the policy instruments now being deployed target carbon at the material level, reinforcing the supply-side bias;
- despite estimations, a convincing model is lacking for the redistribution of carbon costs across misaligned decision-makers.
Funding
The author acknowledges financial support by the Flemish Agency for Innovation and Entrepreneurship (VLAIO) through MateriNex for the DOC-CEM project (HBC.2025.0561).
Data Availability Statement
No new experimental data were generated in this study. The data plotted in figures were transcribed from, or derived from, the cited publications. The processed intermediate values are available from the corresponding author upon reasonable request.
Acknowledgments
The advice of Nele De Belie for the completion of this manuscript is greatly appreciated. Claude Opus 4.8 (Antrophic) and Microsoft 365 Copilot were used exclusively for grammar and style improvements, and the content was further reviewed and edited by the author. All intellectual content is the author’s own.
Conflicts of Interest
The author declares no conflicts of interest.
Abbreviations
The following abbreviations are used in this manuscript:
| SCM | supplementary cementitious material |
| CCUS | carbon capture, utilization and storage |
| CBAM | Carbon Border Adjustment Mechanisms |
| EPD | Environmental Product Declaration |
| GGBS | Ground granulated blast-furnace slag |
| LC3 | Limestone calcined clay cement |
| CSA | Calcium sulfoaluminate |
| LCA | Life cycle assessment |
| EU ETS | European Union Emissions Trading System |
References
- International Energy Agency. Technology Roadmap—Low-Carbon Transition in the Cement Industry; International Energy Agency: Paris, France, 2018; Available online: https://www.iea.org/reports/technology-roadmap-low-carbon-transition-in-the-cement-industry (accessed on 1 September 2026).
- Rissman, J.; Bataille, C.; Masanet, E.; Aden, N.; Morrow, W.R.; Zhou, N.; Elliott, N.; Dell, R.; Heeren, N.; Huckestein, B.; et al. Technologies and policies to decarbonize global industry: Review and assessment of mitigation drivers through 2070. Appl. Energy 2020, 266, 114848. [Google Scholar] [CrossRef] [Scilit]
- Rutkowski, E.; Pitt, H.; Larsen, K. The Global Cement Challenge; Rhodium Group: New York, NY, USA, 2024; Available online: https://rhg.com/research/the-global-cement-challenge/ (accessed on 8 June 2026).
- Marsh, A.; Dillon, T.; Bernal, S. Cement and concrete decarbonisation roadmaps—A meta-analysis within the context of the United Kingdom. RILEM Tech. Lett. 2023, 8, 94–105. [Google Scholar] [CrossRef] [Scilit]
- Watari, T.; Cao, Z.; Hata, S.; Nansai, K. Efficient use of cement and concrete to reduce reliance on supply-side technologies for net-zero emissions. Nat. Commun. 2022, 13, 4158. [Google Scholar] [CrossRef] [Scilit] [PubMed]
- Gartner, E. Industrially interesting approaches to “low-CO2” cements. Cem. Concr. Res. 2004, 34, 1489–1498. [Google Scholar] [CrossRef] [Scilit]
- Scrivener, K.; Martirena, F.; Bishnoi, S.; Maity, S. Calcined clay limestone cements (LC3). Cem. Concr. Res. 2018, 114, 49–56. [Google Scholar] [CrossRef] [Scilit]
- Griffiths, S.; Sovacool, B.K.; Furszyfer Del Rio, D.D.; Foley, A.M.; Bazilian, M.D.; Kim, J.; Uratani, J.M. Decarbonizing the cement and concrete industry: A systematic review of socio-technical systems, technological innovations, and policy options. Renew. Sustain. Energy Rev. 2023, 180, 113291. [Google Scholar] [CrossRef] [Scilit]
- Miller, S.A.; Juenger, M.; Kurtis, K.E.; Weiss, J. Cement and Alternatives in the Anthropocene. Annu. Rev. Environ. Resour. 2024, 49, 309–335. [Google Scholar] [CrossRef] [Scilit]
- European Commission. Regulation (EU) 2023/956 of the European Parliament and of the Council of 10 May 2023 establishing a carbon border adjustment mechanism. Off. J. Eur. Union 2023, L130, 52–104. [Google Scholar]
- EN 16757; Sustainability of Construction Works—Environmental Product Declarations—Product Category Rules for Concrete and Concrete Elements. CEN: Brussels, Belgium, 2022.
- Habert, G.; Miller, S.A.; John, V.M.; Provis, J.L.; Favier, A.; Horvath, A.; Scrivener, K.L. Environmental impacts and decarbonization strategies in the cement and concrete industries. Nat. Rev. Earth Environ. 2020, 1, 559–573. [Google Scholar] [CrossRef] [Scilit]
- Almasailam, F.; Purnell, P.; Black, L. Factors affecting the carbon footprint of reinforced concrete structures. Mater. Struct. 2025, 58, 116. [Google Scholar] [CrossRef] [Scilit]
- Hafez, H.; Bajić, P.; Aidarov, S.; Malija, X.; Drewniok, M.; Purnell, P.; Tošić, N. Parametric study on the decarbonization potential of structural system and concrete mix design choices for mid-rise concrete buildings. Mater. Struct. 2024, 57, 85. [Google Scholar] [CrossRef] [Scilit]
- Miller, S.A.; Habert, G.; Myers, R.J.; Harvey, J.T. Achieving net zero greenhouse gas emissions in the cement industry via value chain mitigation strategies. One Earth 2021, 4, 1398–1411. [Google Scholar] [CrossRef] [Scilit]
- De Belie, N.; Soutsos, M.; Gruyaert, E. Properties of Fresh and Hardened Concrete Containing Supplementary Cementitious Materials; Springer: Cham, Switzerland, 2018; Volume 25. [Google Scholar]
- Juenger, M.C.; Snellings, R.; Bernal, S.A. Supplementary cementitious materials: New sources, characterization, and performance insights. Cem. Concr. Res. 2019, 122, 257–273. [Google Scholar] [CrossRef] [Scilit]
- Avet, F.; Li, X.; Scrivener, K. Determination of the amount of reacted metakaolin in calcined clay blends. Cem. Concr. Res. 2018, 106, 40–48. [Google Scholar] [CrossRef] [Scilit]
- Shah, I.H.; Miller, S.A.; Jiang, D.; Myers, R.J. Cement substitution with secondary materials can reduce annual global CO(2) emissions by up to 1.3 gigatons. Nat. Commun. 2022, 13, 5758. [Google Scholar] [CrossRef] [Scilit] [PubMed]
- Fulghum, N.; Suarez, W.; Altieri, K.; Rangelova, K. Global Electricity Review; EMBER: London, UK, 2026; Available online: https://ember-energy.org/app/uploads/2026/04/Global-Electricity-Review-2026.pdf (accessed on 1 September 2026).
- World Steel Association. World Steel in Figures; World Steel Association: Brussels, Belgium, 2025; Available online: https://worldsteel.org/wp-content/uploads/World-Steel-in-Figures-2025.pdf (accessed on 1 September 2026).
- IANS. Waste Management: India Generates Massive 340.11 Million Tonnes of Fly Ash, Utilising 332 Million Tonnes. Free Press Journal. Available online: https://www.freepressjournal.in/business/waste-management-india-generates-massive-34011-million-tonnes-of-fly-ash-utilising-332-million-tonnes (accessed on 1 September 2026).
- Van den Heede, P.; De Belie, N. Effects of Accelerated Carbonation Testing and by-Product Allocation on the CO2-Sequestration-to-Emission Ratios of Fly Ash-Based Binder Systems. Appl. Sci. 2021, 11, 2781. [Google Scholar] [CrossRef] [Scilit]
- Marmier, A. Decarbonisation Options for the Cement Industry; Publications Office of the European Union: Brussels, Belgium, 2023; Available online: https://op.europa.eu/en/publication-detail/-/publication/26698fec-9165-11ed-b508-01aa75ed71a1/language-en (accessed on 21 September 2026).
- Knight, K.A.; Cunningham, P.R.; Miller, S.A. Optimizing supplementary cementitious material replacement to minimize the environmental impacts of concrete. Cem. Concr. Compos. 2023, 139, 105049. [Google Scholar] [CrossRef] [Scilit]
- Althoey, F.; Ansari, W.S.; Sufian, M.; Deifalla, A.F. Advancements in low-carbon concrete as a construction material for the sustainable built environment. Dev. Built Environ. 2023, 16, 100284. [Google Scholar] [CrossRef] [Scilit]
- Barbhuiya, S.; Kanavaris, F.; Das, B.B.; Idrees, M. Decarbonising cement and concrete production: Strategies, challenges and pathways for sustainable development. J. Build. Eng. 2024, 86, 108861. [Google Scholar] [CrossRef] [Scilit]
- NBN EN 197-1; Cement. Composition, Specifications and Conformity Criteria for Common Cements. CEN: Brussels, Belgium, 2011.
- NBN EN 197-5; Cement-Part 5: Portland-Composite Cement CEM II/C-M and Composite Cement CEM VI. CEN: Brussels, Belgium, 2021.
- NBN EN 197-6; Cement-Part 6: Cement with Recycled Building Materials. CEN: Brussels, Belgium, 2023.
- NBN EN 14216; Cement-Composition, Specifications and Conformity Criteria for Very Low Heat Special Cements. CEN: Brussels, Belgium, 2015.
- NBN EN 413-1; Masonry Cement-Part 1: Composition, Specifications and Conformity Criteria. CEN: Brussels, Belgium, 2011.
- NBN EN 14647; Calcium Aluminate Cement-Composition, Specifications and Conformity Criteria (+AC:2006). CEN: Brussels, Belgium, 2006.
- NBN EN 15743+A1; Supersulfated Cement-Composition, Specifications and Conformity Criteria. CEN: Brussels, Belgium, 2015.
- Rafi, M.; Poloju, K.K.; Tarin, M.; Hussain, A.N. Low-Carbon Concrete: A Comprehensive Review of Strategies for Reducing the Construction Industry’s Environmental Impact. J. Build. Mater. Sci. 2025, 7, 162–179. [Google Scholar] [CrossRef] [Scilit]
- Supriya; Chaudhury, R.; Sharma, U.; Thapliyal, P.C.; Singh, L.P. Low-CO2 emission strategies to achieve net zero target in cement sector. J. Clean. Prod. 2023, 417, 137466. [Google Scholar] [CrossRef] [Scilit]
- Georgiades, M.; Shah, I.H.; Steubing, B.; Cheeseman, C.; Myers, R.J. Prospective life cycle assessment of European cement production. Resour. Conserv. Recycl. 2023, 194, 106998. [Google Scholar] [CrossRef] [Scilit]
- CEMBUREAU. From Ambition to Deployment: The Road Travelled, Pathways and Levers to Scale Up Our Net Zero Ambition; CEMBUREAU: Brussels, Belgium, 2024; Available online: https://www.cembureau.eu/library/reports/cembureau-s-net-zero-roadmap/ (accessed on 20 June 2026).
- Villagran-Zaccardi, Y.; Ellwood, L.; Perumal, P.; Torrenti, J.M.; Zhao, Z.; Bernard, E.; Hanein, T.; Ling, T.C.; Wang, W.; Zhang, Z.; et al. Carbonated recycled concrete aggregates in construction: Potential and bottlenecks identified by RILEM TC 309-MCP. Mater. Struct. 2024, 58, 20. [Google Scholar] [CrossRef] [Scilit]
- Rostami, V.; Shao, Y.; Boyd, A.J. Carbonation Curing versus Steam Curing for Precast Concrete Production. J. Mater. Civ. Eng. 2012, 24, 1221–1229. [Google Scholar] [CrossRef] [Scilit]
- Winnefeld, F.; Leemann, A.; German, A.; Lothenbach, B. CO2 storage in cement and concrete by mineral carbonation. Curr. Opin. Green Sustain. Chem. 2022, 38, 100672. [Google Scholar] [CrossRef] [Scilit]
- Strunge, T.; Renforth, P.; Van der Spek, M. Towards a business case for CO2 mineralisation in the cement industry. Commun. Earth Environ. 2022, 3, 59. [Google Scholar] [CrossRef] [Scilit]
- Ige, O.E.; Von Kallon, D.V.; Desai, D. Carbon emissions mitigation methods for cement industry using a systems dynamics model. Clean Technol. Environ. Policy 2024, 26, 579–597. [Google Scholar] [CrossRef] [Scilit]
- GASSNOVA. Based on Longship: Potential for Cost Reductions in the CCS Value Chain. 2025. Available online: https://gassnova.no/app/uploads/sites/6/2025/09/Ny080925_ENG_Endelig_Ekstern-rapport-Kostnader.pdf (accessed on 1 September 2026).
- Emanuelsson, A.H.; Rootzén, J.; Johnsson, F. Deployment of carbon capture and storage in the cement industry—Is the European Union up to shape? Int. J. Greenh. Gas Control 2025, 146, 104442. [Google Scholar] [CrossRef] [Scilit]
- John, V.M.; Quattrone, M.; Abrão, P.C.; Cardoso, F.A. Rethinking cement standards: Opportunities for a better future. Cem. Concr. Res. 2019, 124, 105832. [Google Scholar] [CrossRef] [Scilit]
- ASTM C1157-08; Standard Performance Specification for Hydraulic Cement. ASTM: West Conshohocken, PA, USA, 2008.
- Villagrán Zaccardi, Y.A.; Pareja, R.; Rojas, L.; Irassar, E.F.; Torres-Acosta, A.; Tobón, J.; John, V.M. Overview of cement and concrete production in Latin America and the Caribbean with a focus on the goals of reaching carbon neutrality. RILEM Tech. Lett. 2022, 7, 30–46. [Google Scholar] [CrossRef] [Scilit]
- Ecocem. Ecocem Achieves ASTM C1157 Certification, Signaling U.S. Market Readiness for Breakthrough Low-Carbon Cement. Available online: https://www.ecocemglobal.com/en-us/ecocem-achieves-astm-c1157-certification-signaling-u-s-market-readiness-for-breakthrough-low-carbon-cement/ (accessed on 10 June 2026).
- Lopez, S.; Dufalla, N. Concrete Pavement with Portland-Limestone Cement, Coal Ash, Optimized Aggregate Gradations, and Recycled Concrete Aggregate in Colorado; National Concrete Pavement Technology Center: Ames, IA, USA, 2026; Available online: https://www.intrans.iastate.edu/wp-content/uploads/2025/03/CDOT_case_study.pdf (accessed on 10 June 2026).
- Hooton, D.; Sutter, L. Revising specifications to enable new materials and adapting to performance of low-clinker concretes. In Proceedings of the Eighth International Conference on Durability of Concrete Structures, Edinburgh, UK, 15–17 October 2025. [Google Scholar]
- Beumelburg, C. World Premiere at Heidelberg Materials: Opening of CCS Facility in Norway Marks New Era of Sustainable Construction. Available online: https://www.heidelbergmaterials.com/en/pr-2025-06-18 (accessed on 10 June 2026).
- Gardarsdottir, S.O.; De Lena, E.; Romano, M.; Roussanaly, S.; Voldsund, M.; Pérez-Calvo, J.-F.; Berstad, D.; Fu, C.; Anantharaman, R.; Sutter, D.; et al. Comparison of Technologies for CO2 Capture from Cement Production—Part 2: Cost Analysis. Energies 2019, 12, 542. [Google Scholar] [CrossRef] [Scilit]
- Nehdi, M.L.; Marani, A.; Zhang, L. Is net-zero feasible: Systematic review of cement and concrete decarbonization technologies. Renew. Sustain. Energy Rev. 2024, 191, 114169. [Google Scholar] [CrossRef] [Scilit]
- John, V.M.; Damineli, B.L.; Quattrone, M.; Pileggi, R.G. Fillers in cementitious materials—Experience, recent advances and future potential. Cem. Concr. Res. 2018, 114, 65–78. (In English) [Google Scholar] [CrossRef] [Scilit]
- Robalo, K.; Soldado, E.; Costa, H.; do Carmo, R.; Alves, H.; Júlio, E. Efficiency of cement content and of compactness on mechanical performance of low cement concrete designed with packing optimization. Constr. Build. Mater. 2021, 266, 121077. [Google Scholar] [CrossRef] [Scilit]
- Shahrokhishahraki, M.; Malekpour, M.; Mirvalad, S.; Faraone, G. Machine learning predictions for optimal cement content in sustainable concrete constructions. J. Build. Eng. 2024, 82, 108160. [Google Scholar] [CrossRef] [Scilit]
- Belizario-Silva, F.; Costa Reis, D.; Carvalho, M.; Leopoldo e Silva França, R.; John, V.M. Material intensity and embodied CO2 benchmark for reinforced concrete structures in Brazil. J. Build. Eng. 2024, 82, 108234. [Google Scholar] [CrossRef] [Scilit]
- Olsson, J.A.; Miller, S.A.; Alexander, M.G. Near-term pathways for decarbonizing global concrete production. Nat. Commun. 2023, 14, 4574. [Google Scholar] [CrossRef] [Scilit] [PubMed]
- EN 1992-1-1:2004; Eurocode 2: Design of Concrete Structures—General Rules and Rules for Buildings. CEN: Brussels, Belgium, 2004.
- Snell, L.; Obla, K.; Carino, N. Excessive Overdesign of Concrete Mixtures for Strength—Causes and Solutions. Concr. Int. 2024, 46, 49–55. [Google Scholar] [CrossRef] [Scilit]
- Shanks, W.; Dunant, C.F.; Drewniok, M.P.; Lupton, R.C.; Serrenho, A.; Allwood, J.M. How much cement can we do without? Lessons from cement material flows in the UK. Resour. Conserv. Recycl. 2019, 141, 441–454. [Google Scholar] [CrossRef] [Scilit]
- Villagrán-Zaccardi, Y.A.; Marsh, A.T.M.; Sosa, M.E.; Zega, C.J.; De Belie, N.; Bernal, S.A. Complete re-utilization of waste concretes–Valorisation pathways and research needs. Resour. Conserv. Recycl. 2022, 177, 105955. [Google Scholar] [CrossRef] [Scilit]
- Küpfer, C.; Bertola, N.; Fivet, C. Reuse of cut concrete slabs in new buildings for circular ultra-low-carbon floor designs. J. Clean. Prod. 2024, 448, 141566. [Google Scholar] [CrossRef] [Scilit]
- Bataille, C.; Stiebert, S.; Hebeda, O.; Trollip, H.; McCall, B.; Vishwanathan, S.S. Towards net-zero emissions concrete and steel in India, Brazil and South Africa. Clim. Policy 2023, 26, 744–759. [Google Scholar] [CrossRef] [Scilit]
- Rootzén, J.; Johnsson, F. Managing the costs of CO2 abatement in the cement industry. Clim. Policy 2016, 17, 781–800. [Google Scholar] [CrossRef] [Scilit]
- Subraveti, S.G.; Rodríguez Angel, E.; Ramírez, A.; Roussanaly, S. Is Carbon Capture and Storage (CCS) Really So Expensive? An Analysis of Cascading Costs and CO2 Emissions Reduction of Industrial CCS Implementation on the Construction of a Bridge. Environ. Sci. Technol. 2023, 57, 2595–2601. [Google Scholar] [CrossRef] [Scilit] [PubMed]
- GCCA. Concrete Future-Roadmap to Net Zero. The GCCA 2050 Cement and Concrete Industry Roadmap for Net Zero Concrete. 2022. Available online: https://gccassociation.org/concretefuture/wp-content/uploads/2022/10/GCCA-Concrete-Future-Roadmap-Document-AW-2022.pdf (accessed on 1 June 2026).
- Kumar, S.; Gangotra, A.; Barnard, M. Towards a Net Zero Cement: Strategic Policies and Systems Thinking for a Low-Carbon Future. Curr. Sustain./Renew. Energy Rep. 2025, 12, 5. [Google Scholar] [CrossRef] [Scilit]
- Van den Heede, P.; De Belie, N. Environmental impact and life cycle assessment (LCA) of traditional and ‘green’ concretes: Literature review and theoretical calculations. Cem. Concr. Compos. 2012, 34, 431–442. [Google Scholar] [CrossRef] [Scilit]
- Olsson, J.A.; Miller, S.A.; Kneifel, J.D. A review of current practice for life cycle assessment of cement and concrete. Resour. Conserv. Recycl. 2024, 206, 107619. [Google Scholar] [CrossRef] [Scilit]
- Jiang, Z.; Ozbulut, O.E.; Arce, G.; Colosi, L.M. Accounting for decarbonization impacts across the full life cycle of alternative concrete materials: A case-study for graphene-amended cementitious composites. J. Clean. Prod. 2024, 482, 144186. [Google Scholar] [CrossRef] [Scilit]
- Gluth, G.; Bernal, S. RILEM TC CUC: Carbon dioxide uptake by concrete during and after service life—Opening Letter. RILEM Tech. Lett. 2025, 9, 61–67. [Google Scholar] [CrossRef] [Scilit]
- Vollpracht, A.; Gluth, G.J.G.; Rogiers, B.; Uwanuakwa, I.D.; Phung, Q.T.; Villagran Zaccardi, Y.; Thiel, C.; Vanoutrive, H.; Etcheverry, J.M.; Gruyaert, E.; et al. Report of RILEM TC 281-CCC: Insights into factors affecting the carbonation rate of concrete with SCMs revealed from data mining and machine learning approaches. Mater. Struct. 2024, 57, 206. [Google Scholar] [CrossRef] [Scilit]
- Seto, K.E.; Churchill, C.J.; Panesar, D.K. Influence of fly ash allocation approaches on the life cycle assessment of cement-based materials. J. Clean. Prod. 2017, 157, 65–75. [Google Scholar] [CrossRef] [Scilit]
- Teh, S.H.; Wiedmann, T.; Castel, A.; de Burgh, J. Hybrid life cycle assessment of greenhouse gas emissions from cement, concrete and geopolymer concrete in Australia. J. Clean. Prod. 2017, 152, 312–320. [Google Scholar] [CrossRef] [Scilit]
- Terán-Cuadrado, G.; Tahir, F.; Nurdiawati, A.; Almarshoud, M.A.; Al-Ghamdi, S.G. Current and potential materials for the low-carbon cement production: Life cycle assessment perspective. J. Build. Eng. 2024, 96, 110528. [Google Scholar] [CrossRef] [Scilit]
- Huang, X.; Huang, Z.; Zhou, Y.; Hu, R.; Hu, B. Life cycle assessment and cost analysis of LC3 concrete considering sustainability and uncertainty. J. Build. Eng. 2025, 102, 111960. [Google Scholar] [CrossRef] [Scilit]
- Sambataro, L.; Bre, F.; Ukrainczyk, N.; Koenders, E.A.B. Environmental benchmarks for the European cement industry. Sustain. Prod. Consum. 2024, 45, 429–449. [Google Scholar] [CrossRef] [Scilit]
- Anderson, J.; Moncaster, A. Embodied carbon of concrete in buildings, Part 1: Analysis of published EPD. Build. Cities 2020, 1, 198–217. [Google Scholar] [CrossRef] [Scilit]
- Anderson, J.; Moncaster, A. Using an analysis of concrete and cement EPD: Verification, selection, assessment, benchmarking and target setting. Acta Polytech. CTU Proc. 2022, 33, 20–26. [Google Scholar] [CrossRef] [Scilit]
- FEBELCEM. Cementgebonden Funderingen Voor Wegen—Eigenschappen en Toepassingen. 2004. Available online: https://febelcem.be/app/uploads/2025/10/33nl_fondations.pdf (accessed on 30 June 2026).
- Concrete Europe. Rehabilitation of the Antwerp Ring Road. 2014. Available online: https://www.theconcreteinitiative.eu/case-studies/43-rehabilitation-of-the-antwerp-ring-road (accessed on 21 September 2026).
- Beeldens, A. Life Cycle Cost Analysis of Continuously Reinforced Concrete Pavements (CRCP)—A Comparative Study; Institut für Stahlbetonbewehrung (ISB) e.V: Düsseldorf, Germany, 2022. [Google Scholar]
- KOKW. Vijftig Jaar Bouwkundige Realisaties Waaslandhaven. Available online: https://www.kokw.be/figuren/50wlh/Deurganckdok.pdf (accessed on 21 September 2026).
- Peire, K.; Nonneman, H.; Bosschem, E. Gravity base foundations for the Thornton Bank Offshore Wind Farm. Terra Aqua 2009, 115, 19–29. [Google Scholar]
- International Renewable Energy Agency. Renewable Power Generation Costs in 2023; International Renewable Energy Agency: Abu Dhabi, United Arab Emirates, 2024. [Google Scholar]
- Pisciotta, M.; Pilorgé, H.; Davids, J.; Psarras, P. Opportunities for cement decarbonization. Clean. Eng. Technol. 2023, 15, 100667. [Google Scholar] [CrossRef] [Scilit]
- Ripley, K.M.; Saadi, F.H.; Burke, Z.L.H. Cost-motivated pathways towards near-term decarbonization of the cement industry. RSC Sustain. 2025, 3, 255–263. [Google Scholar] [CrossRef] [Scilit]
- Stokke, R.; Kristoffersen, F.S.; Stamland, M.; Holmen, E.; Hamdan, H.; De Boer, L. The role of green public procurement in enabling low-carbon cement with CCS: An innovation ecosystem perspective. J. Clean. Prod. 2022, 363, 132451. [Google Scholar] [CrossRef] [Scilit]
- Camargo-Bertel, A.A.; Hincapie, D.; Pugliese, V.; Gonzalez-Quiroga, A.; Pupo-Roncallo, O. Decarbonizing the cement industry in Latin America and the Caribbean: A comprehensive review of strategies, barriers, and policies. Energy Convers. Manag. X 2025, 26, 100956. [Google Scholar] [CrossRef] [Scilit]
- Anglian Water. Anglian Water’s @one Alliance Celebrates 20 Years of Alliancing Ahead of £3bn AMP8 Programme. Available online: https://www.anglianwatergroup.co.uk/news/anglian-waters-one-alliance-celebrates-20-years-of-alliancing-ahead-of-ps3bn-amp8-programme (accessed on 21 September 2026).
- NEC. NEC4 Secondary Option X29: Nature and Climate. Available online: https://www.neccontract.com/resources/x29-nature-and-climate (accessed on 21 September 2026).
- The Chancery Lane Project. Construction: Procuring Materials and Carbon Budgets (Tristan’s Clause). Available online: https://chancerylaneproject.org/clauses/construction-procuring-materials-and-carbon-budgets/ (accessed on 21 September 2026).
- NBN B 15-100; Methodology for the Assessment and the Validation of the Fitness for Use of Cements or Additions of Type 2 for Concrete. NBN: Brussels, Belgium, 2008.
- De Schutter, G. Belgian Implementation of the ECPC-Concept Following EN 206-1, XII International Conference on Durability of Building Materials and Components (DBMC), Porto, Portugal. 2011. Available online: https://www.irbnet.de/daten/iconda/CIB22523.pdf (accessed on 20 June 2026).
- Connaughton, J.; Collinge, W. Delivering More for Less Under the IPI Model: Trialling IPI on a Live Construction Project: Learning from Advance II at Dudley College; University of Reading: Reading, UK, 2018. [Google Scholar]
- UK GBC. Integrated Project Insurance. Available online: https://ukgbc.org/resources/integrated-project-insurance/ (accessed on 21 September 2026).
- FFB. Techniques Courantes ou non Courantes: Quelle Assurabilité Pour vos Travaux ? Available online: https://www.ffbatiment.fr/gestion-entreprise/comptabilite-banque-assurances/mes-assurances-professionnelles/dossier/techniques-courantes-ou-non-courantes-quelle-assurabilite-pour-vos-travaux (accessed on 21 September 2026).
- Di Filippo, J.; Karpman, J.; DeShazo, J.R. The impacts of policies to reduce CO2 emissions within the concrete supply chain. Cem. Concr. Compos. 2019, 101, 67–82. [Google Scholar] [CrossRef] [Scilit]
- Bellora, C.; Fontagné, L. EU in search of a Carbon Border Adjustment Mechanism. Energy Econ. 2023, 123, 106673. [Google Scholar] [CrossRef] [Scilit]
- Zhong, J.; Pei, J. Carbon border adjustment mechanism: A systematic literature review of the latest developments. Clim. Policy 2023, 24, 228–242. [Google Scholar] [CrossRef] [Scilit]
- European Parliament and Council. Directive 2014/24/EU of the European Parliament and of the Council of 26 February 2014 on Public Procurement and Repealing Directive 2004/18/EC Text with EEA Relevance; European Parliament and Council: Brussels, Belgium, 2014.
- Dodd, N.; Garbarino, E.; Gama Caldas, M. Green Public Procurement Criteria for Office Building Design, Construction and Management—Procurement Practice Guidance Document; Publications Office of the European Union: Brussels, Belgium, 2016; Available online: https://data.europa.eu/doi/10.2791/858761 (accessed on 21 September 2026).
- European Parliament and Council. Regulation (EU) 2024/1735 of the European Parliament and of the Council of 13 June 2024 on Establishing a Framework of Measures for Strengthening Europe’s Net-Zero Technology Manufacturing Ecosystem and Amending Regulation (EU) 2018/1724 (Text with EEA Relevance); European Parliament and Council: Brussels, Belgium, 2024.
- European Parliament and Council. Regulation (EU) 2024/3110 of the European Parliament and of the Council of 27 November 2024 Laying Down Harmonised Rules for the Marketing of Construction Products and Repealing Regulation (EU) No 305/2011 (Text with EEA Relevance); European Parliament and Council: Brussels, Belgium, 2024.
- Environmental Protection Agency. U.S. EPA Criteria for Product Category Rules (PCRs) to Support the Label Program for Low Embodied Carbon Construction Materials (EPA’s PCR Criteria) (Version 1—2024); Environmental Protection Agency: Washington, DC, USA, 2024.
- Office of the Federal Chief Sustainability Officer of the U.S. White House. Federal Buy Clean Initiative. Available online: https://www.sustainability.gov/archive/biden46/buyclean/index.html (accessed on 21 September 2026).
- U.S. White House. Unleashing American Energy. Available online: https://www.whitehouse.gov/presidential-actions/2025/01/unleashing-american-energy/ (accessed on 21 September 2026).
- Busch, P.; Kendall, A.; Murphy, C.W.; Miller, S.A. Literature review on policies to mitigate GHG emissions for cement and concrete. Resour. Conserv. Recycl. 2022, 182, 106278. [Google Scholar] [CrossRef] [Scilit]
- Busch, P.; Kim, A.; Murphy, C.W.; Miller, S.A. Policy mechanisms to decarbonize cement production: Through the lens of California. Environ. Res. Infrastruct. Sustain. 2025, 5, 025003. [Google Scholar] [CrossRef] [Scilit]
- Cruz Juarez, R.I.; Finnegan, S. The environmental impact of cement production in Europe: A holistic review of existing EPDs. Clean. Environ. Syst. 2021, 3, 100053. [Google Scholar] [CrossRef] [Scilit]
- Waldman, B.; Huang, M.; Simonen, K. Embodied carbon in construction materials: A framework for quantifying data quality in EPDs. Build. Cities 2020, 1, 625–636. [Google Scholar] [CrossRef] [Scilit]
- Lingegård, S.; Olsson, J.A.; Kadefors, A.; Uppenberg, S. Sustainable Public Procurement in Large Infrastructure Projects—Policy Implementation for Carbon Emission Reductions. Sustainability 2021, 13, 11182. [Google Scholar] [CrossRef] [Scilit]
- Wesseling, J.H.; Van der Vooren, A. Lock-in of mature innovation systems: The transformation toward clean concrete in the Netherlands. J. Clean. Prod. 2017, 155, 114–124. [Google Scholar] [CrossRef] [Scilit]
- Asdrubali, F.; Grazieschi, G.; Gandola, D.M. The Role of Environmental Product Declarations in the Decarbonization of Building Materials and Components. Energies 2025, 18, 1308. [Google Scholar] [CrossRef] [Scilit]
- Uratani, J.M.; Griffiths, S. A forward looking perspective on the cement and concrete industry: Implications of growth and development in the Global South. Energy Res. Soc. Sci. 2023, 97, 102972. [Google Scholar] [CrossRef] [Scilit]
- Vieira, S. História da Produção e Uso de Argila Calcinada como Constituente fo Cimento no Brasil, Simpósio Brasileiro de Ciência do Cimento (SBCC). 2025. Available online: https://eventos.antac.org.br/sbcc/article/view/6659 (accessed on 20 June 2026).
- Avellaneda, C. Cementos Avellaneda’s calcined clay kiln conversion. Int. Cem. Rev. 2021, 52–54. [Google Scholar]
- Global Cement. Ternary Cements—The Future is Now! Available online: https://www.globalcement.com/news/11178-ternary-cements-the-future-is-now (accessed on 20 June 2026).
- Bell, P. African Cement Producers Increasingly Turn to LC3 Production. Available online: https://www.cemnet.com/News/story/176080/african-cement-producers-increasingly-turn-to-lc3-production.html (accessed on 1 September 2026).
- Bell, P. Nova Cimangola Prepares to Launch LC3 Production. Available online: https://www.cemnet.com/News/story/176032/nova-cimangola-prepares-to-launch-lc3-production.html (accessed on 1 September 2026).
- Bell, P. Thyssenkrupp Polysius Wins Order for Cimpor Ghana’s Calcined Clay Plant. Available online: https://www.cemnet.com/News/story/175712/thyssenkrupp-polysius-wins-order-for-cimpor-ghana-s-calcined-clay-plant.html (accessed on 21 September 2026).
- IS 18189:2023; Portland Calcined Clay Limestone Cement—Specification. Bureau of Indian Standards: New Delhi, India, 2023.
- Global Cement. JK Lakshmi Launches LC3 Cement. Available online: https://www.globalcement.com/news/20406-jk-lakshmi-launches-lc3-cement (accessed on 1 September 2026).
- Arthur, C.; Onuche, P.U.O.; Yusuf, M.; Animashaun, T.; Boansi, S.O.; Adewale, K.; Bart-Addison, C.E. Decarbonizing Concrete: Ultra-Low-Carbon Pathways and Policy Integration. Sci. J. Eng. Technol. 2025, 2, 134–142. [Google Scholar] [CrossRef] [Scilit]
- Lagerblad, B. Carbon Dioxide Uptake During Concrete Life Cycle—State of the Art; Report CBI 2:2005; Swedish Cement and Concrete Research Institute: Stockholm, Sweden, 2005; p. 46. [Google Scholar]
- Assaad, R.H. Examining Low-Carbon Material Initiatives: Existing Policies, Impacts on the Procurement of Projects, Current Challenges, and Potential Solutions to Reduce Embodied Carbon in the Construction Industry. J. Leg. Aff. Disput. Resolut. Eng. Constr. 2024, 16, 04523060. [Google Scholar] [CrossRef] [Scilit]
- Cheng, D.; Reiner, D.M.; Yang, F.; Cui, C.; Meng, J.; Shan, Y.; Liu, Y.; Tao, S.; Guan, D. Projecting future carbon emissions from cement production in developing countries. Nat. Commun. 2023, 14, 8213. [Google Scholar] [CrossRef] [Scilit] [PubMed]
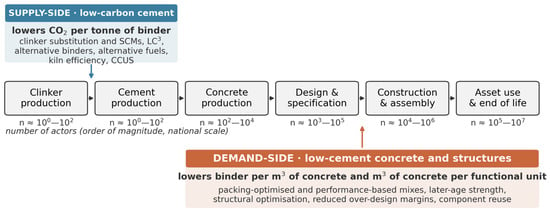
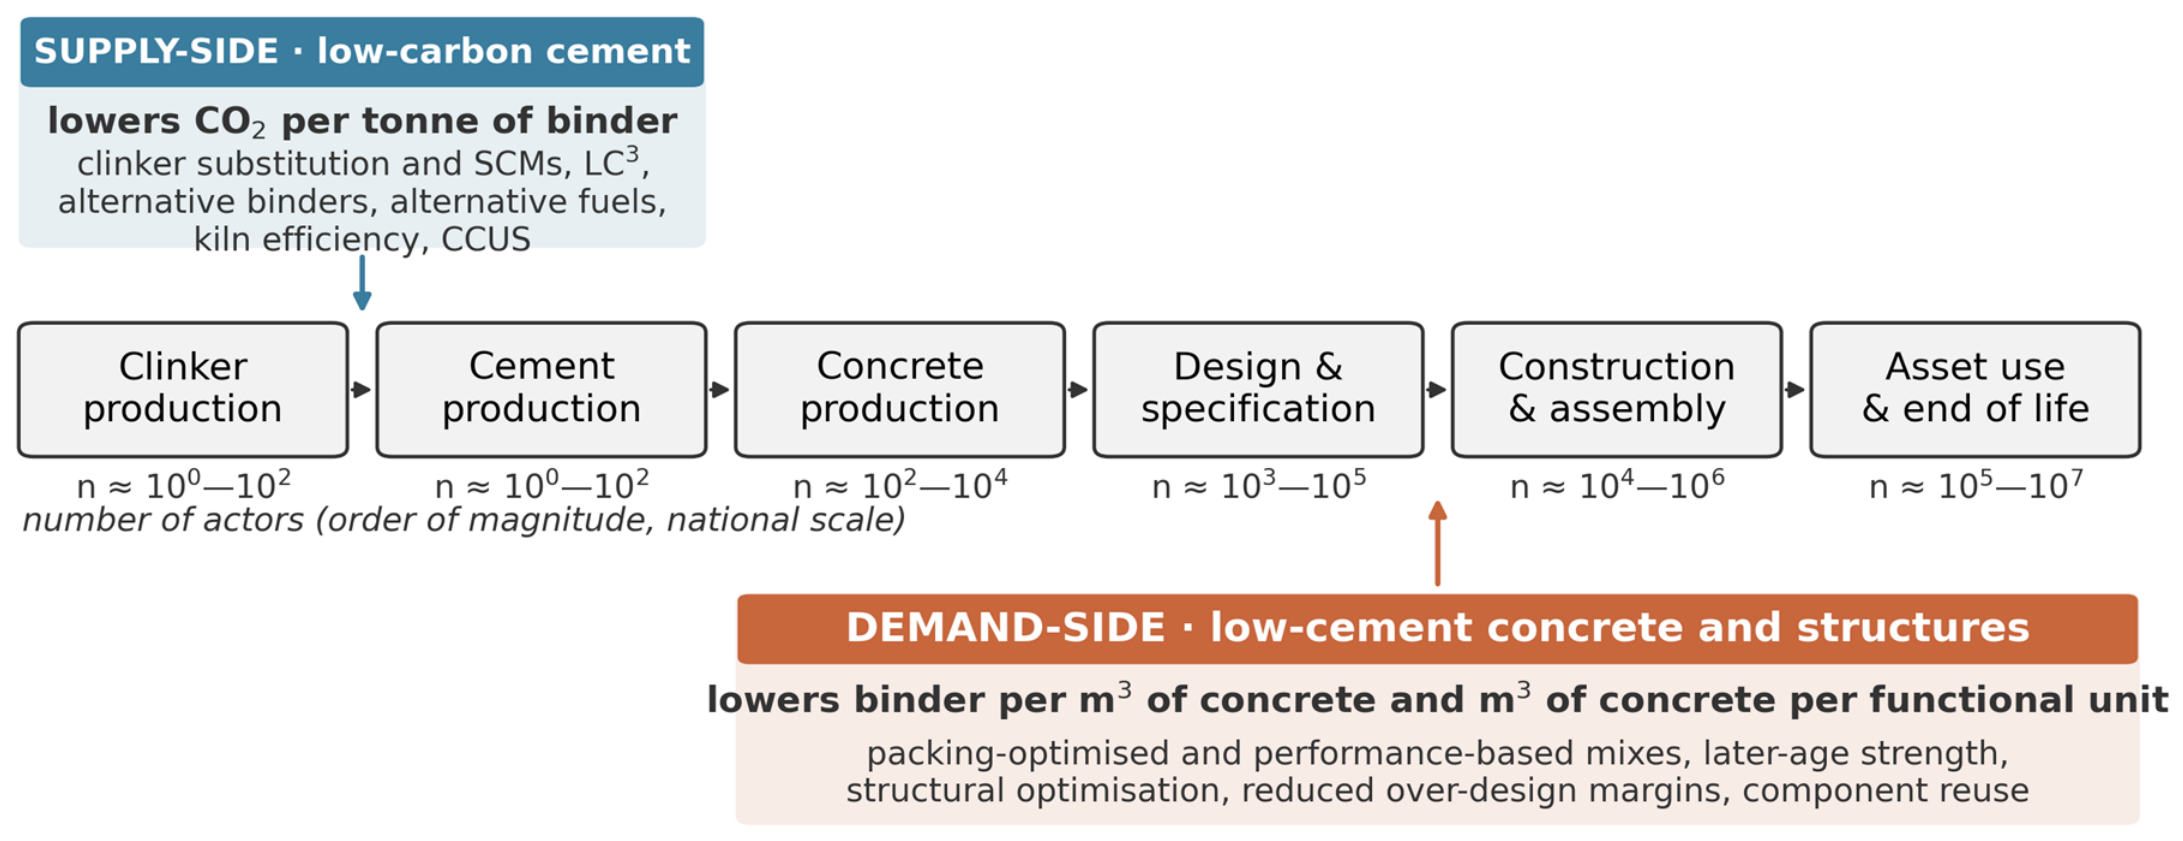
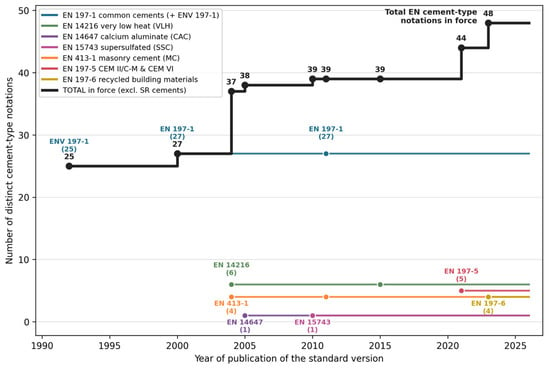
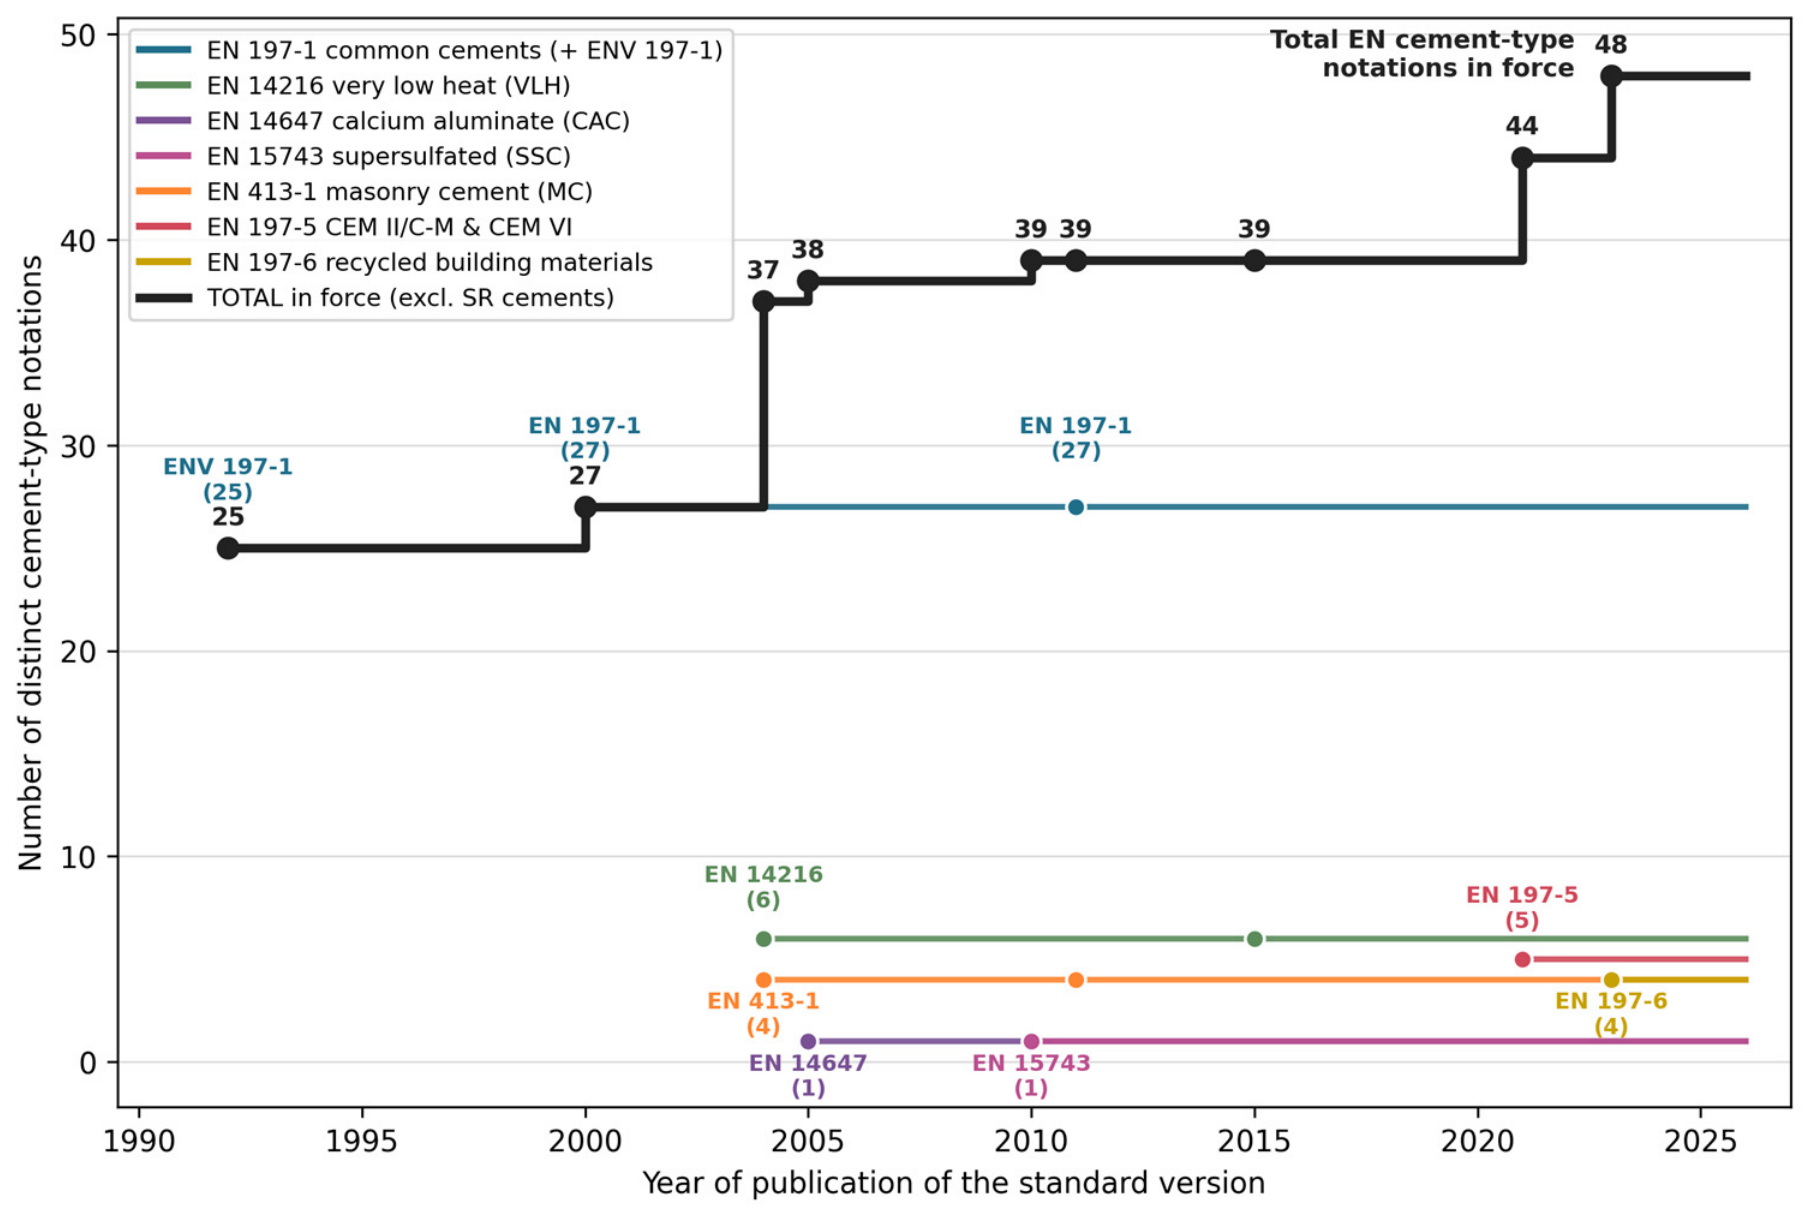
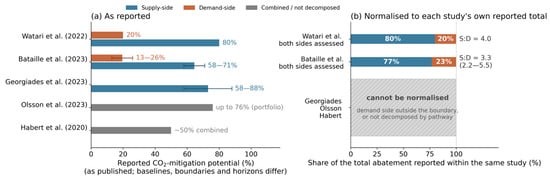
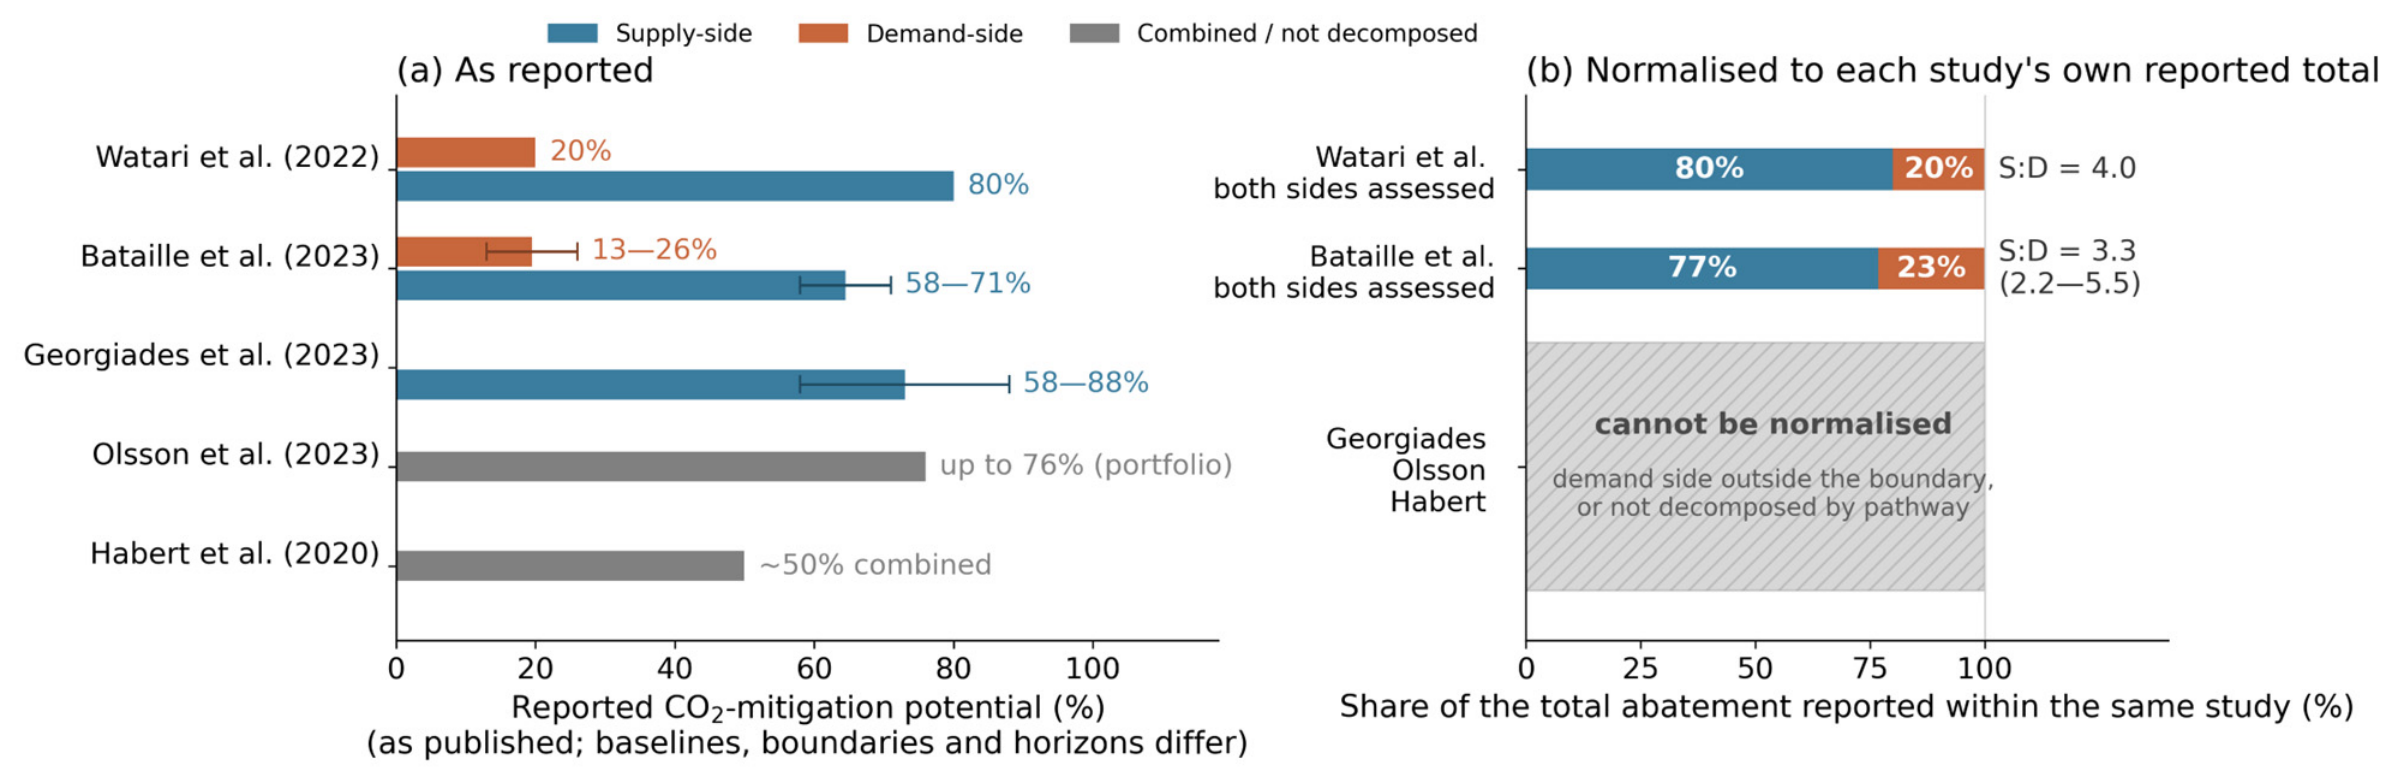
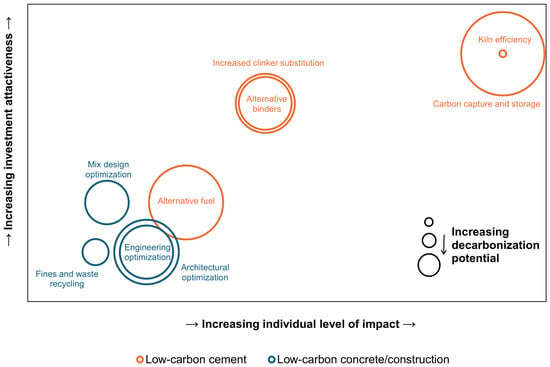
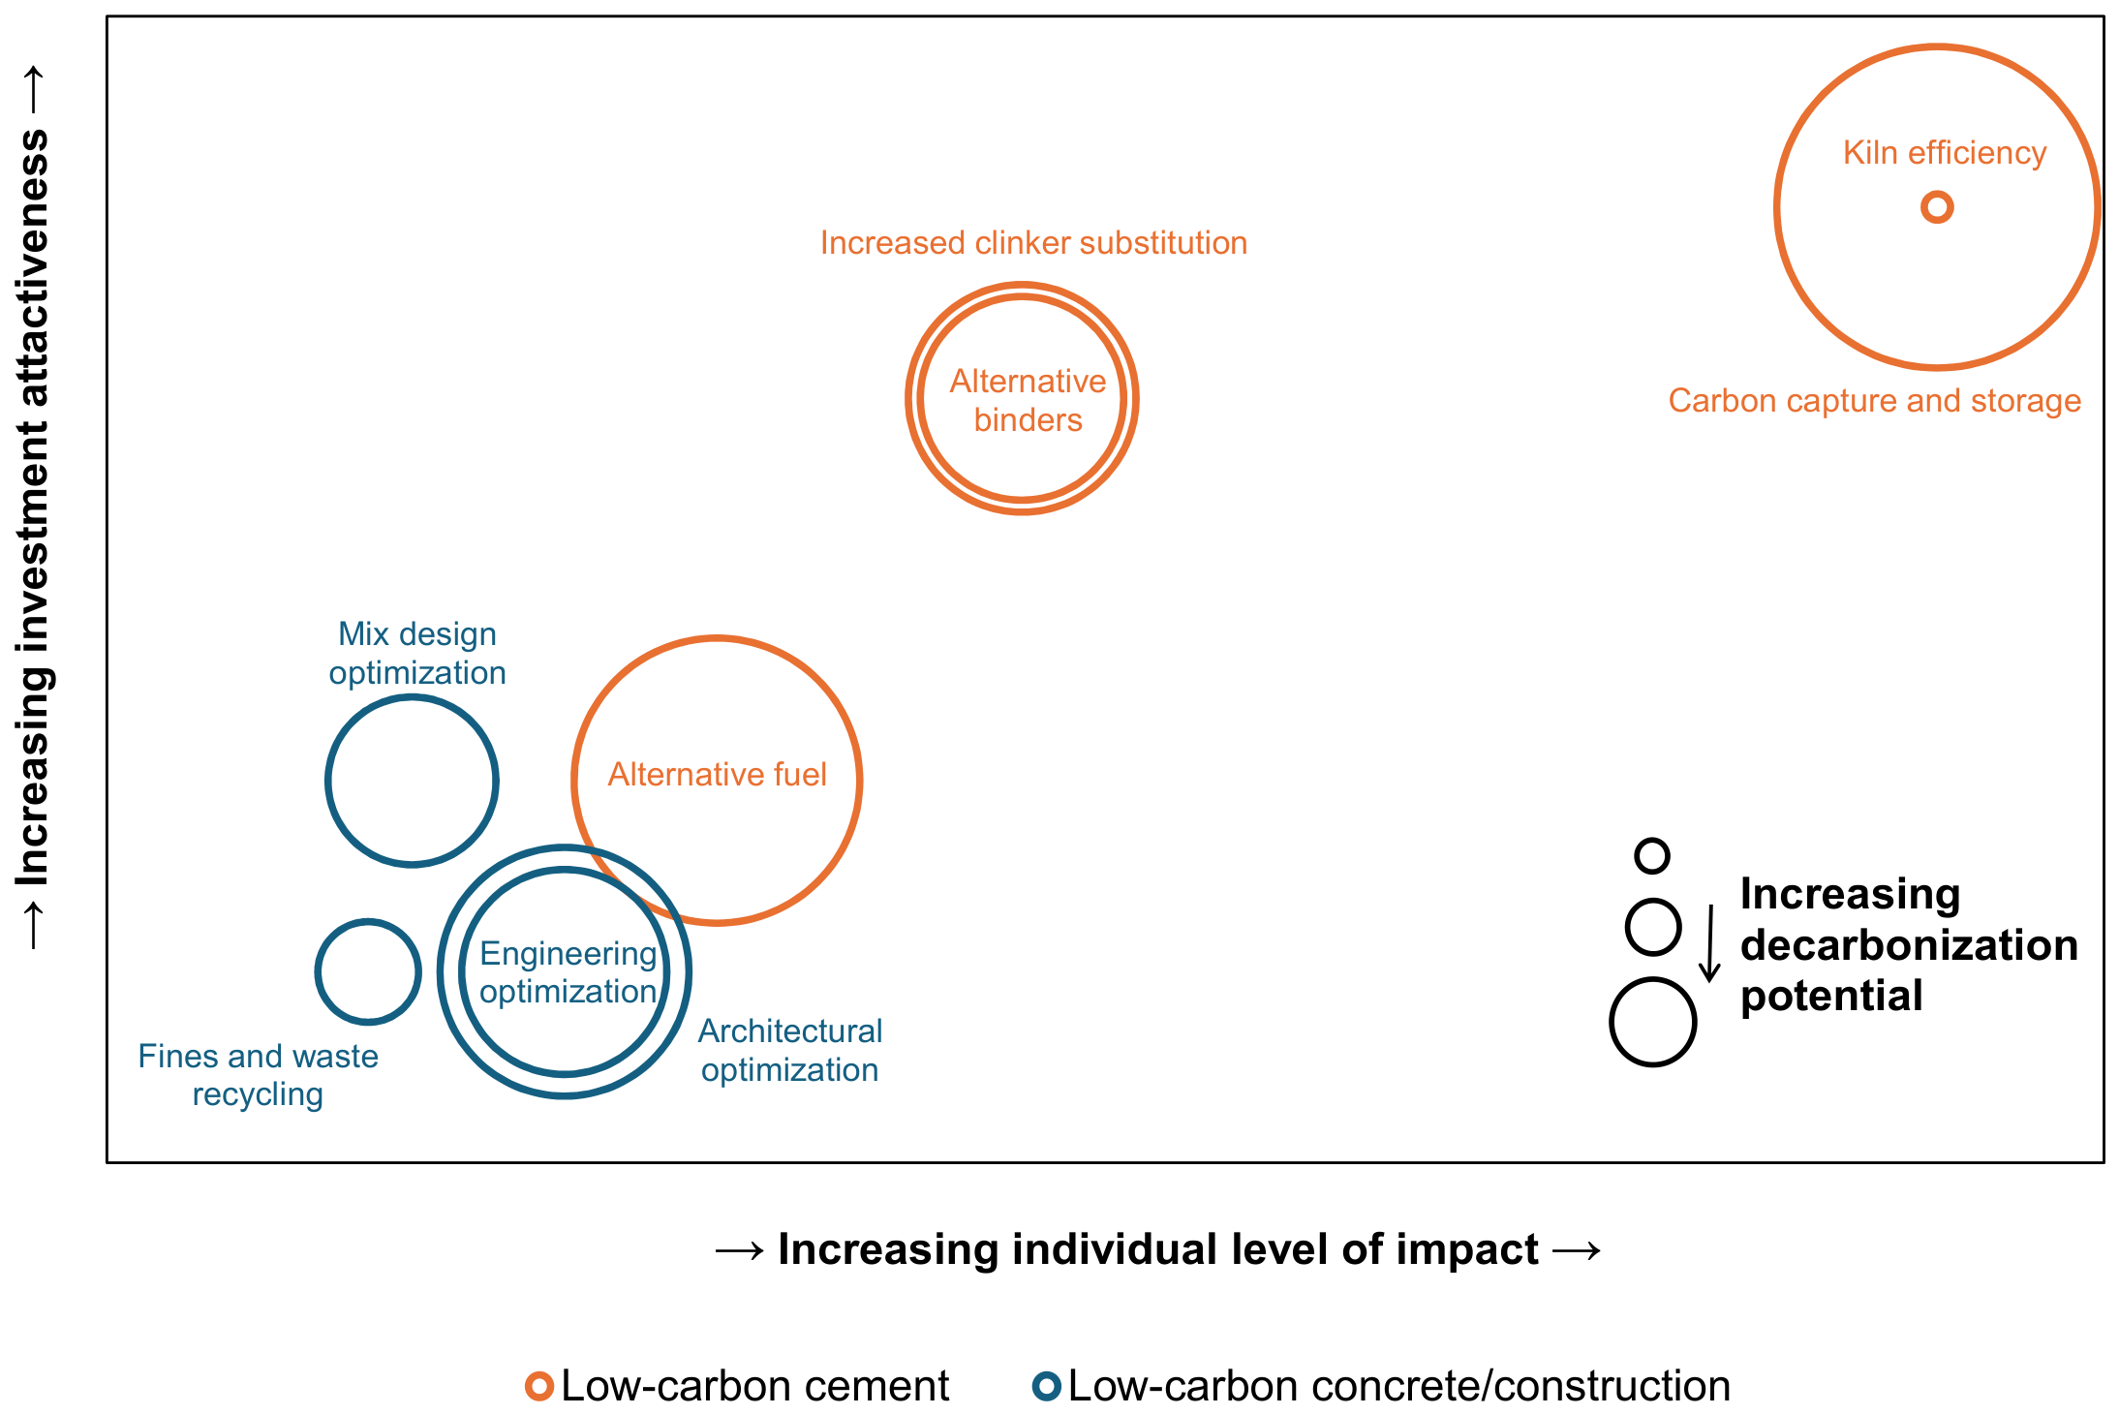
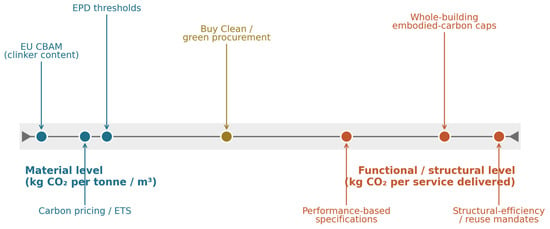
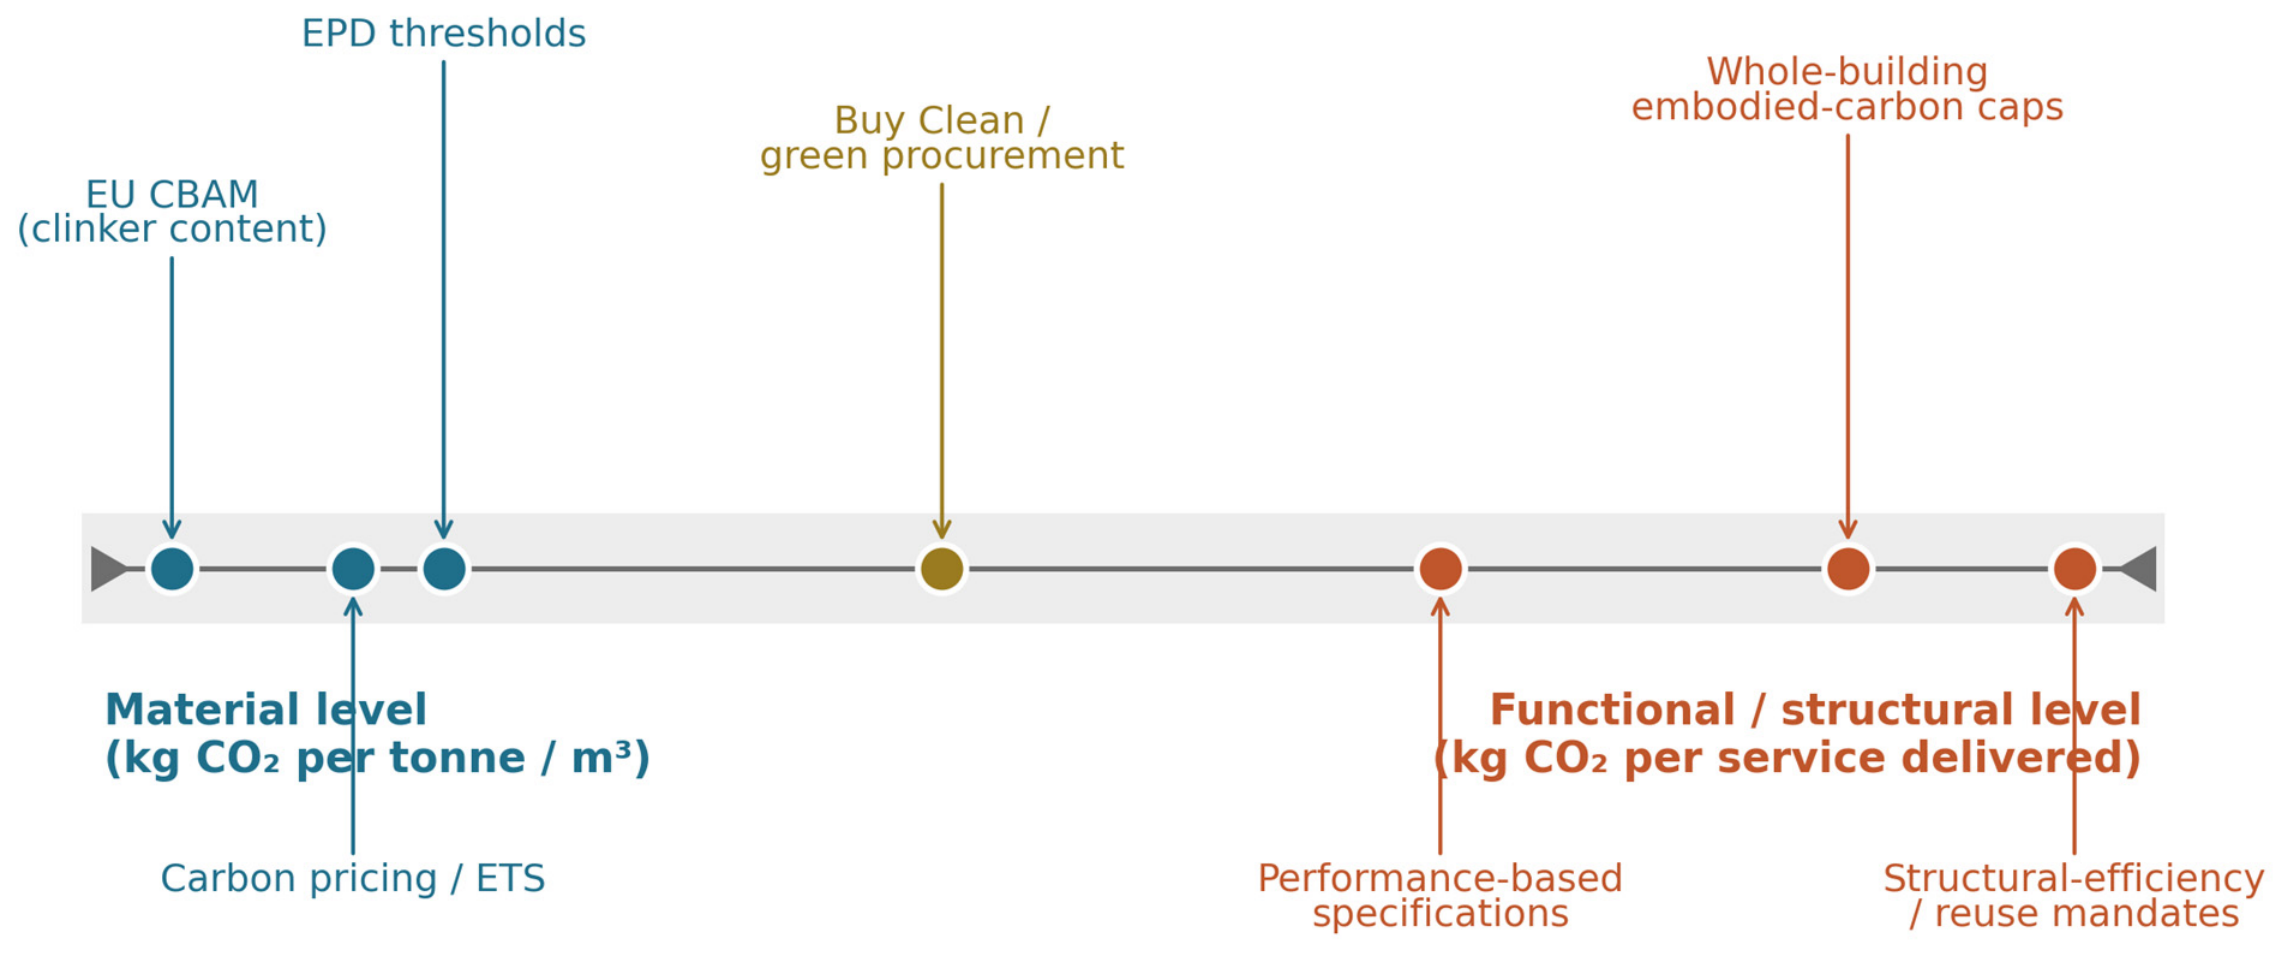

Disclaimer/Publisher’s Note: The statements, opinions and data contained in all publications are solely those of the individual author(s) and contributor(s) and not of MDPI and/or the editor(s). MDPI and/or the editor(s) disclaim responsibility for any injury to people or property resulting from any ideas, methods, instructions or products referred to in the content. |
© 2026 by the author. Licensee MDPI, Basel, Switzerland. This article is an open access article distributed under the terms and conditions of the Creative Commons Attribution (CC BY) license.