


Abstract
Cemented sand and gravel (CSG), widely used in dams and cofferdams, is susceptible to fracture under coupled seepage and mechanical loading. This study combines wedge-splitting experiments and mesoscale numerical simulations to investigate the hydro-mechanical fracture behavior of CSG under crack-face water pressures of 0, 0.02, 0.05, 0.10, 0.15, and 0.20 MPa. A coupled model was developed by integrating the lattice discrete particle model (LDPM) with discrete poromechanics. In this framework, deformation and fracture of the solid phase are resolved through interactions among polyhedral cells, while water transport is represented by a dual-lattice seepage network and coupled to the solid response through the effective stress principle. After calibration using triaxial compression tests, the model was used to simulate pore-pressure evolution, crack initiation, and crack propagation. The results show that increasing hydraulic pressure accelerates crack propagation and localizes the fracture process zone, leading to more brittle failure. The peak load, initial fracture energy, and effective process-zone length all decrease with increasing water pressure. The simulated mean peak loads agree well with the experimental results, with relative errors of 0.26–6.58%, while the internal water-pressure histories recorded by three embedded sensors are reproduced with root-mean-square errors of 3.4–11.2%. The size-effect analysis further shows that the nominal strength follows Bažant’s size-effect law, confirming the quasibrittle nature of CSG fracture under seepage coupling. These results provide a mesoscale basis for evaluating fracture safety and optimizing seepage-control measures in CSG dams and cofferdams.
1. Introduction
Cemented sand and gravel (CSG) is increasingly used in hydraulic and transportation projects because of its low cost, relatively low environmental impact, and reliable mechanical performance [1,2]. Previous studies have mainly focused on its strength, shear resistance, cracking, and fracture behavior [2,3]. Recent studies have further shown that the macro–mesoscopic failure of CSG is governed by the aggregate–matrix interface [4], and a statistical damage constitutive model has been proposed to describe its strength and damage evolution [5]. Multiscale methods have also been applied to investigate CSG dams and their thermal response [6,7]. However, CSG structures such as dams and cofferdams are subjected to sustained mechanical loads and seepage simultaneously. Hydraulic pressure can influence crack initiation, propagation, and failure patterns, while creep, shrinkage, and other time-dependent effects further affect long-term performance [8,9]. Therefore, the coupled seepage–stress fracture behavior of CSG must be considered in structural safety and seepage-control design.
Mesoscale simulation methods are effective for analyzing failure in quasibrittle materials. The lattice discrete particle model (LDPM) has been widely used to describe the heterogeneous structure and fracture behavior of concrete and similar cement-based materials [10,11,12,13,14]. Previous studies have shown that hydraulic pressure can reduce fracture resistance and alter crack development [15,16]. However, existing hydro-mechanical models generally describe fractures as continuum damage zones or explicitly tracked discontinuities, with permeability changes introduced through prescribed empirical laws [15,17,18,19,20]. These approaches do not fully capture the interaction between individual crack openings and flow redistribution in the heterogeneous aggregate structure of CSG.
This study develops a coupled seepage–stress model by integrating LDPM with discrete poromechanics. The model explicitly represents the aggregate skeleton and polyhedral-cell fracture behavior at the mesoscale. Crack opening is directly linked to fracture permeability through the cubic law within a dual-lattice flow network, allowing permeability evolution to result from the simulated fracture process. The model is validated using wedge-splitting tests under controlled water pressure, considering the complete force–CMOD response, crack patterns, peak load, and pressure histories recorded by three embedded sensors.
The effects of water pressure are examined in terms of crack propagation, internal pressure development, load–CMOD response, and size effect. Section 2 introduces LDPM and its calibration using triaxial compression tests. Section 3 presents the wedge-splitting experiments. Section 4 describes the coupled hydro-mechanical formulation, model validation, and size-effect analysis. The results and conclusions are discussed in Section 5 and Section 6.
2. Simulation of Triaxial Compression Tests Using the LDPM
2.1. Construction of the LDPM
The lattice discrete particle model (LDPM), originally developed by Cusatis et al. [13,14], is a discrete mesoscale approach for representing the mechanical behavior and fracture evolution of heterogeneous cementitious materials. Owing to its mesoscale formulation, the model is capable of capturing both stress transfer and crack development under different loading scenarios.
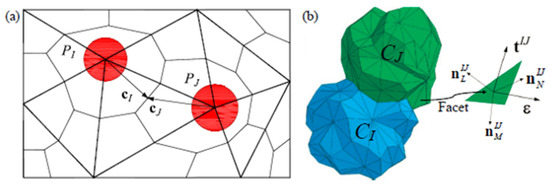
In the construction of the LDPM mesostructure, spherical aggregate particles are first generated randomly in accordance with the prescribed particle size distribution of the material. Based on the spatial arrangement of these particles, Delaunay tetrahedralization is then employed to define the topological connections among neighboring particles, thereby creating a network of mesoscopic lattice elements around the aggregates. After the facet-based constitutive laws are assigned, the interaction between adjacent particles can be described through stress and strain transfer across the lattice facets. The mesoscopic element model of two adjacent particles, CJ and CI, is shown in Figure 1.
Figure 1.
Representative mesostructural features of the LDPM: (a) tessellation of the mesoscale domain; (b) LDPM polyhedral cell system formed by two neighboring aggregate particles.
When the material response remains elastic, the normal and shear tractions acting on each lattice facet are taken to vary linearly with the corresponding strain components, i.e., tN = ENeN; tM = ETeM; tL = ETeL, where EN is the normal elastic modulus, and α = EN/ET denotes the ratio between the normal and shear stiffnesses. To represent inelastic behavior, the constitutive description in LDPM is divided into two main parts.
(1) Fracture under tensile-shear loading, corresponding to eN > 0: The equivalent strain on the meso-facet is defined as and the associated equivalent stress is written as The strength boundary of the equivalent stress is expressed as , where the parameter ω accounts for the interaction between the normal and shear components and is given by , . The softening modulus is written as , where lt is the characteristic tensile length, l is the distance between aggregate particles, and nt is the softening exponent. A parabolic strength envelope is adopted to describe the transition from tension to shear, i.e., in which rst = σs/σt represents the ratio of shear strength to tensile strength.
(2) Compression-induced pore collapse and compaction, corresponding to eN < 0: In LDPM, pore collapse and subsequent compaction are described by a normal stress boundary that depends on strain. The compressive stress boundary, denoted by σbc(εD,εV), is formulated as a function of the volumetric strain εV and deviatoric strain εD. It is assumed that the compressive boundary initially evolves linearly to capture pore collapse and yielding. Specifically, when 0 ≤ −εV ≤ εc1, σbc = σc0 + ⟨−εV − εc0⟩Hc(rDV), where σc0 is the mesoscopic compressive yielding stress, εc0 is the compressive strain corresponding to the onset of pore collapse, rDV is the ratio between volumetric and deviatoric strain, and Hc(rDV) is the initial hardening modulus. After this stage, an exponential evolution law is employed to describe compaction and rehardening: σbc = σc1(rDV)exp[(−εV − εc1)Hc(rDV)/σc1(rDV)], where σc1(rDV) = σc0 + (εc1 − εc0)Hc(rDV), and εc1 denotes the compressive strain at the onset of rehardening.
2.2. Triaxial Compression Tests and Numerical Simulation
In the present study, CSG specimens were produced using a cement (Conch Cement Co., Ltd., Wuhu, China) content of 100 kg/m3 and a water/cement ratio equal to 1.0, while the aggregate dosage was fixed at 2130 kg/m3. Medium-to-coarse sand (Liuhe District Sand and Gravel Supplier, Nanjing, China) was adopted as the fine aggregate, while crushed stone served as the coarse aggregate (Liuhe District Sand and Gravel Supplier, Nanjing, China). The aggregate grading was specified such that sand and stone accounted for 20% and 80% of the total aggregate, respectively. Within the stone fraction, particles smaller than 5 mm accounted for 3%, particles of 5–10 mm accounted for 20%, particles of 10–20 mm accounted for 35%, and particles of 20–40 mm accounted for 42%. The aggregate gradation and particle shape have a significant influence on the mechanical properties of CSG [21], which is the basis of the gradation adopted here.
The aggregates were first sieved according to the prescribed gradation. Subsequently, the cementitious material, fine and coarse aggregates, and water were mixed uniformly in accordance with the designed mix proportion. The mixture was then placed into a cylindrical mold in five layers and compacted by vibration rolling. The mold had a diameter of 300 mm and a height of 700 mm. After curing for 28 days, the specimens were subjected to triaxial compression tests.
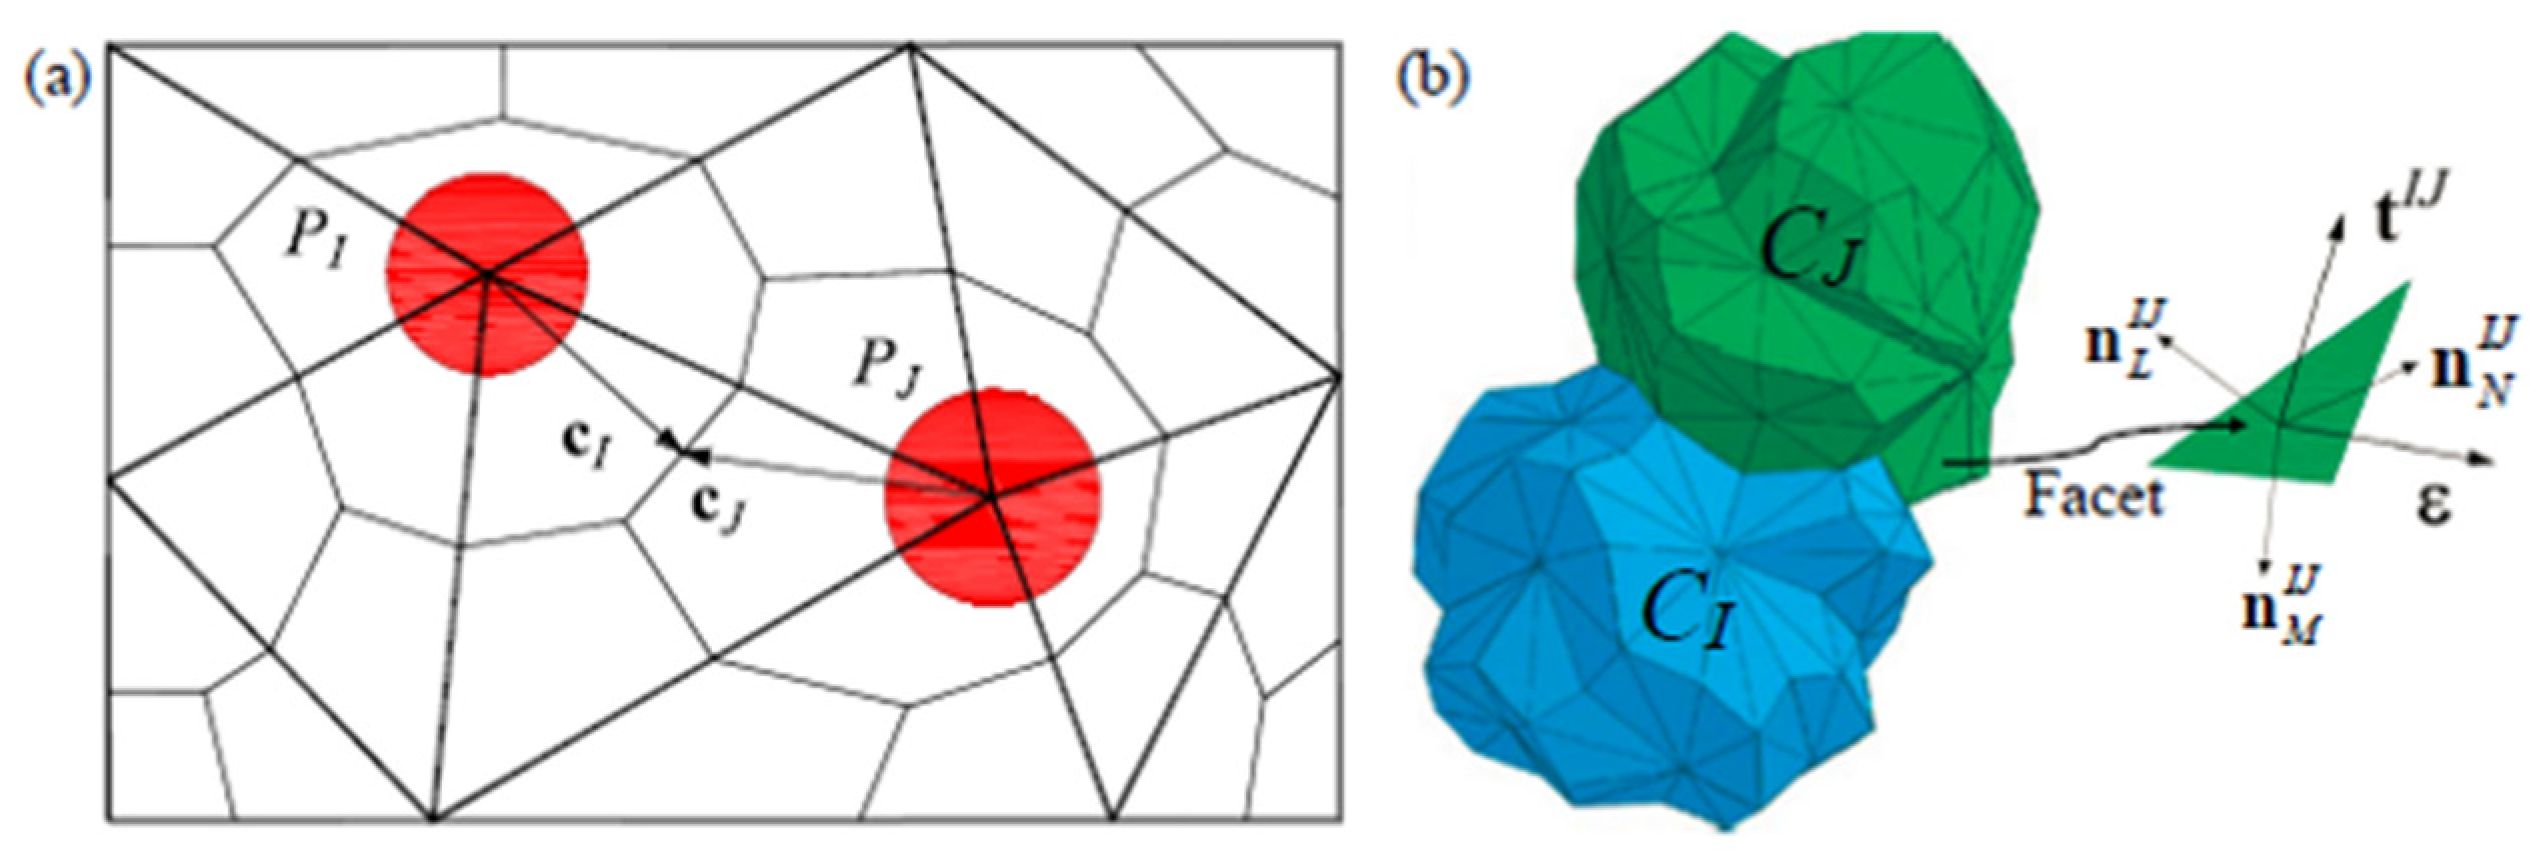
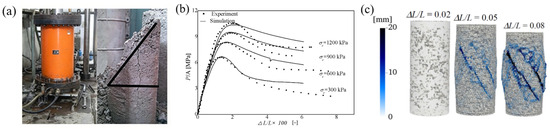
For the triaxial compression tests, each specimen was first wrapped with a rubber membrane and then installed in an airtight pressure chamber. After consolidation to the target confining pressure, axial compression was applied vertically by means of a loading rod at a constant rate of 2 mm/min. The test was stopped when the measured stress tended to level off. The test apparatus and the corresponding failure mode are presented in Figure 2a.
Figure 2.
Triaxial compression tests: (a) test setup and broken specimen; (b) stress versus axial strain curves for experiment and simulation; (c) simulated crack pattern at σc = 300 kPa, shown as a representative case.
The LDPM parameters were identified through numerical reproduction of the triaxial compression tests performed at confining pressures σc of 300, 600, 900, and 1200 kPa. The simulation procedure involved two successive stages. In the first stage, consolidation loading was applied to both the lateral boundary and the top surface of the specimen. In the second stage, the prescribed confining pressure was maintained on the cylindrical lateral surface, while axial loading was introduced by assigning a constant downward velocity to the top surface. A comparison between the experimental and simulated deviatoric stress–axial strain responses is shown in Figure 2b. The simulated crack patterns obtained at σc = 600, 900, and 1200 kPa were similar to that at σc = 300 kPa, all exhibiting an inclined shear band at approximately 30° to the loading direction; for brevity, only the σc = 300 kPa case is shown in Figure 2c. Overall, the simulation results reproduce the experimental behavior well.
Based on the above calibration, the final LDPM parameters were determined as follows: EN = 1500 MPa, α = 0.167, σt = 0.7 MPa, lt = 90 mm, nt = 0.2, σs/σt = 2.7 and σc0 = 20 MPa. Because LDPM uses a common meso-facet constitutive framework for compression and tension, the parameters σt, lt, nt, and σs/σt were identified jointly with the other mechanical parameters from the peak strength, post-peak response, confining-pressure dependence, and shear-band development. They should therefore be regarded as an indirectly constrained parameter set rather than as independently measured tensile properties; a single triaxial test would not uniquely determine them. Their applicability to tensile fracture was subsequently assessed without recalibration through wedge-splitting simulations, which reproduced the force–CMOD response, crack pattern, peak load, and internal pressure histories.
The LDPM discretization was determined from the CSG mesostructure, and because the constitutive law is written per unit facet area with lt as a calibrated material parameter, the model is resolution-independent to first order; any residual resolution effect is absorbed during calibration through lt and σt. The same gradation and discretization were used in the triaxial calibration and wedge-splitting simulations, and the variability associated with random particle arrangements was bounded by five independent realizations (SD = 69–100 N at H = 500 mm, COV = 2.7–5.1%; Table 1 and Table 2).
Table 1.
Statistical summary of the peak load and RMSE of pressure histories from the wedge-splitting tests at different hydraulic-pressure levels.
Table 2.
Statistical summary of the peak load from five statistically independent mesostructure realizations at different specimen sizes and hydraulic-pressure levels.
3. Seepage–Stress Coupling Tests on Cemented Sand and Gravel Material
3.1. Experimental Program
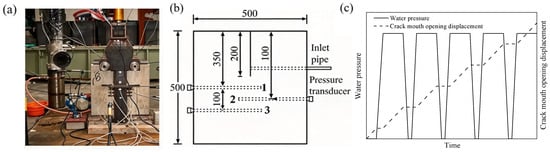
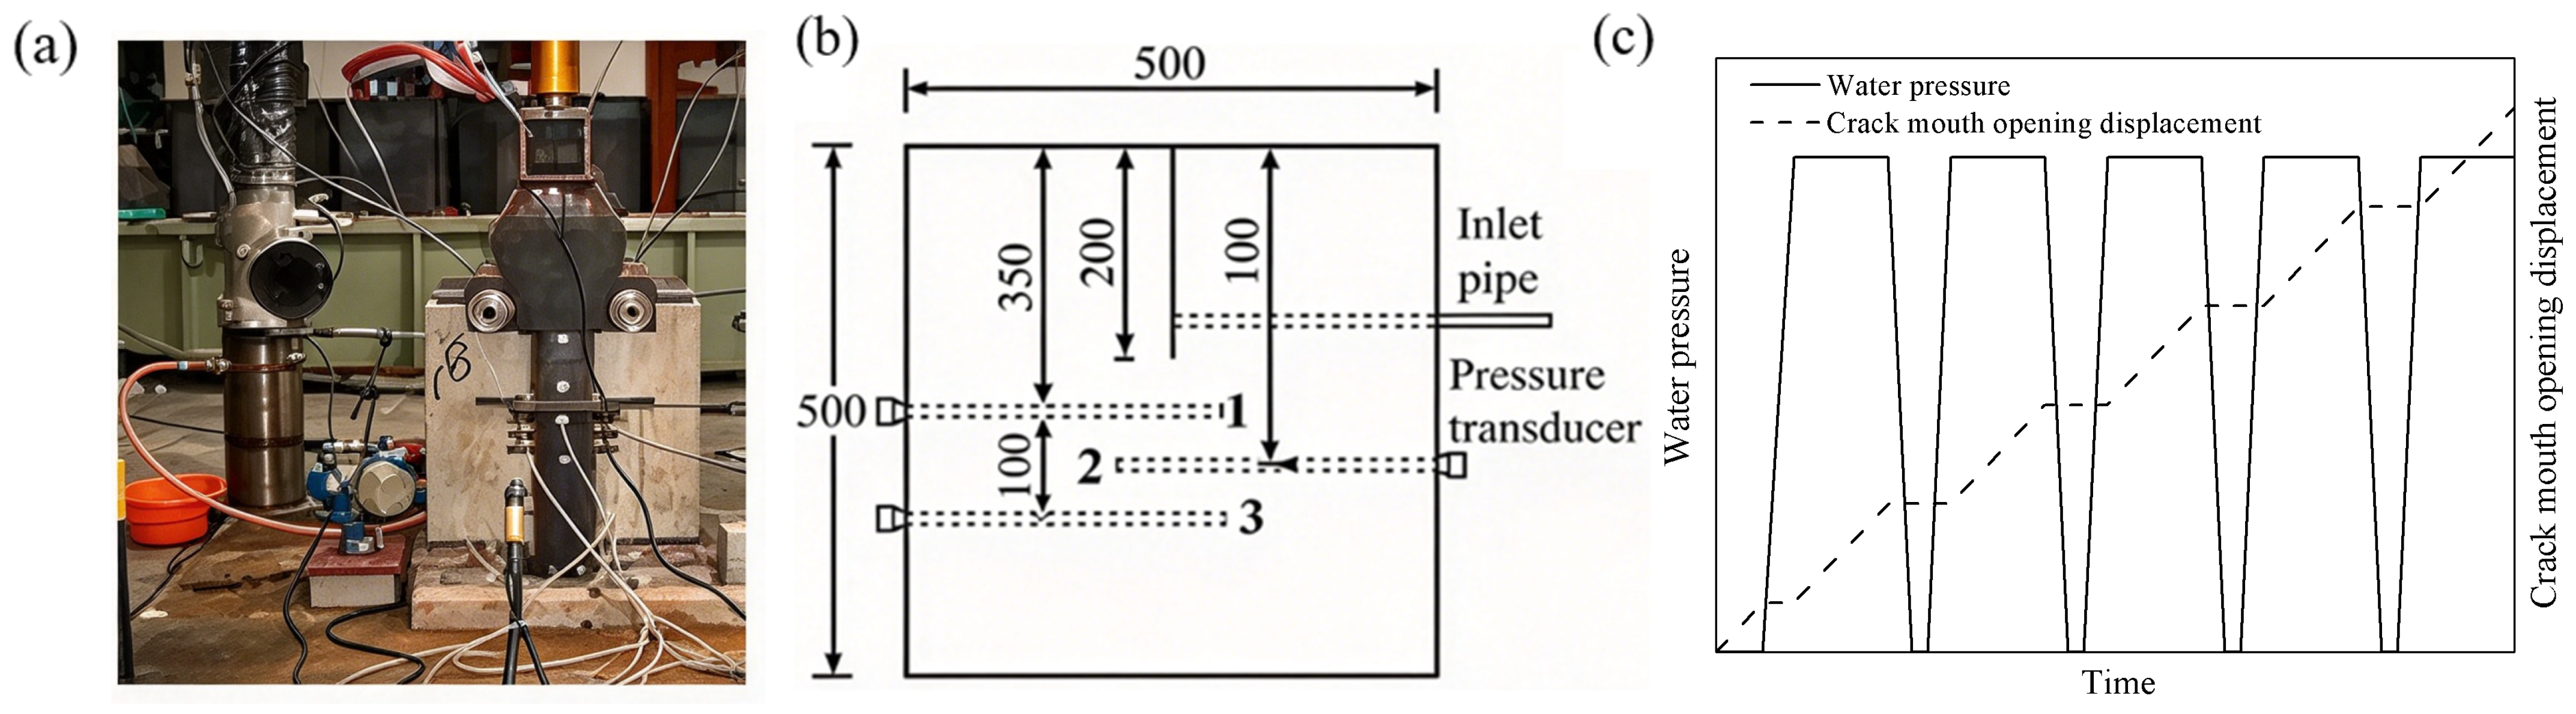
Three pressure transducers, denoted T1, T2, and T3, were installed 50, 100, and 150 mm ahead of the initial notch tip, respectively, to monitor the internal water pressure. The wedge-splitting specimens were 500 mm × 500 mm × 200 mm in length, width, and thickness, with a 200-mm-deep pre-notch. The test setup and specimen geometry are shown in Figure 3.
Figure 3.
Wedge-splitting test: (a) experimental configuration; (b) schematic of the apparatus with dimensions in millimeters; (c) loading procedure.
The specimens were vacuum-saturated and then immersed in water until reaching constant mass. All surfaces except the pre-notch were sealed with an impermeable epoxy membrane, restricting water ingress to the notch. Perimeter leakage was negligible. Before mechanical loading, water pressure was applied until the pressure readings stabilized, establishing the initial hydraulic equilibrium consistent with the numerical boundary conditions in Section 4.2.
A constant-CMOD cyclic loading procedure based on Brühwiler and Saouma [18] was adopted. In each cycle, the CMOD was first increased under zero water pressure and then held constant while the target water pressure was applied. The water pressure was subsequently maintained while the CMOD was increased to the next prescribed level. Finally, the CMOD was held constant while the water pressure was unloaded to zero, and the load increased to the peak value of the cycle. This procedure was repeated until failure. The load F and CMOD were continuously recorded, and the F–CMOD curve was obtained by connecting the peak points of successive cycles.
The applied water pressures were 0, 0.02, 0.05, 0.10, 0.15, and 0.20 MPa. This range corresponds to hydraulic heads of approximately 2~20.4 m and covers the pressure levels relevant to CSG dams and cofferdams. The lowest non-zero pressure was included to capture the nonlinear response associated with partial crack pressurization, whereas pressures above 0.20 MPa exceeded the capacity of the sealing and pressure-control system. Three replicate specimens were tested at each pressure level, giving a total of 18 specimens.
All specimens were produced from the same batch and cured under identical conditions.
3.2. Experimental Results
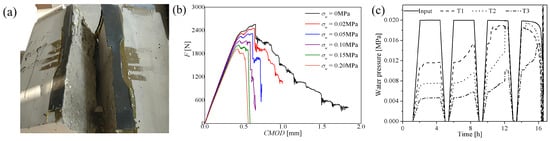
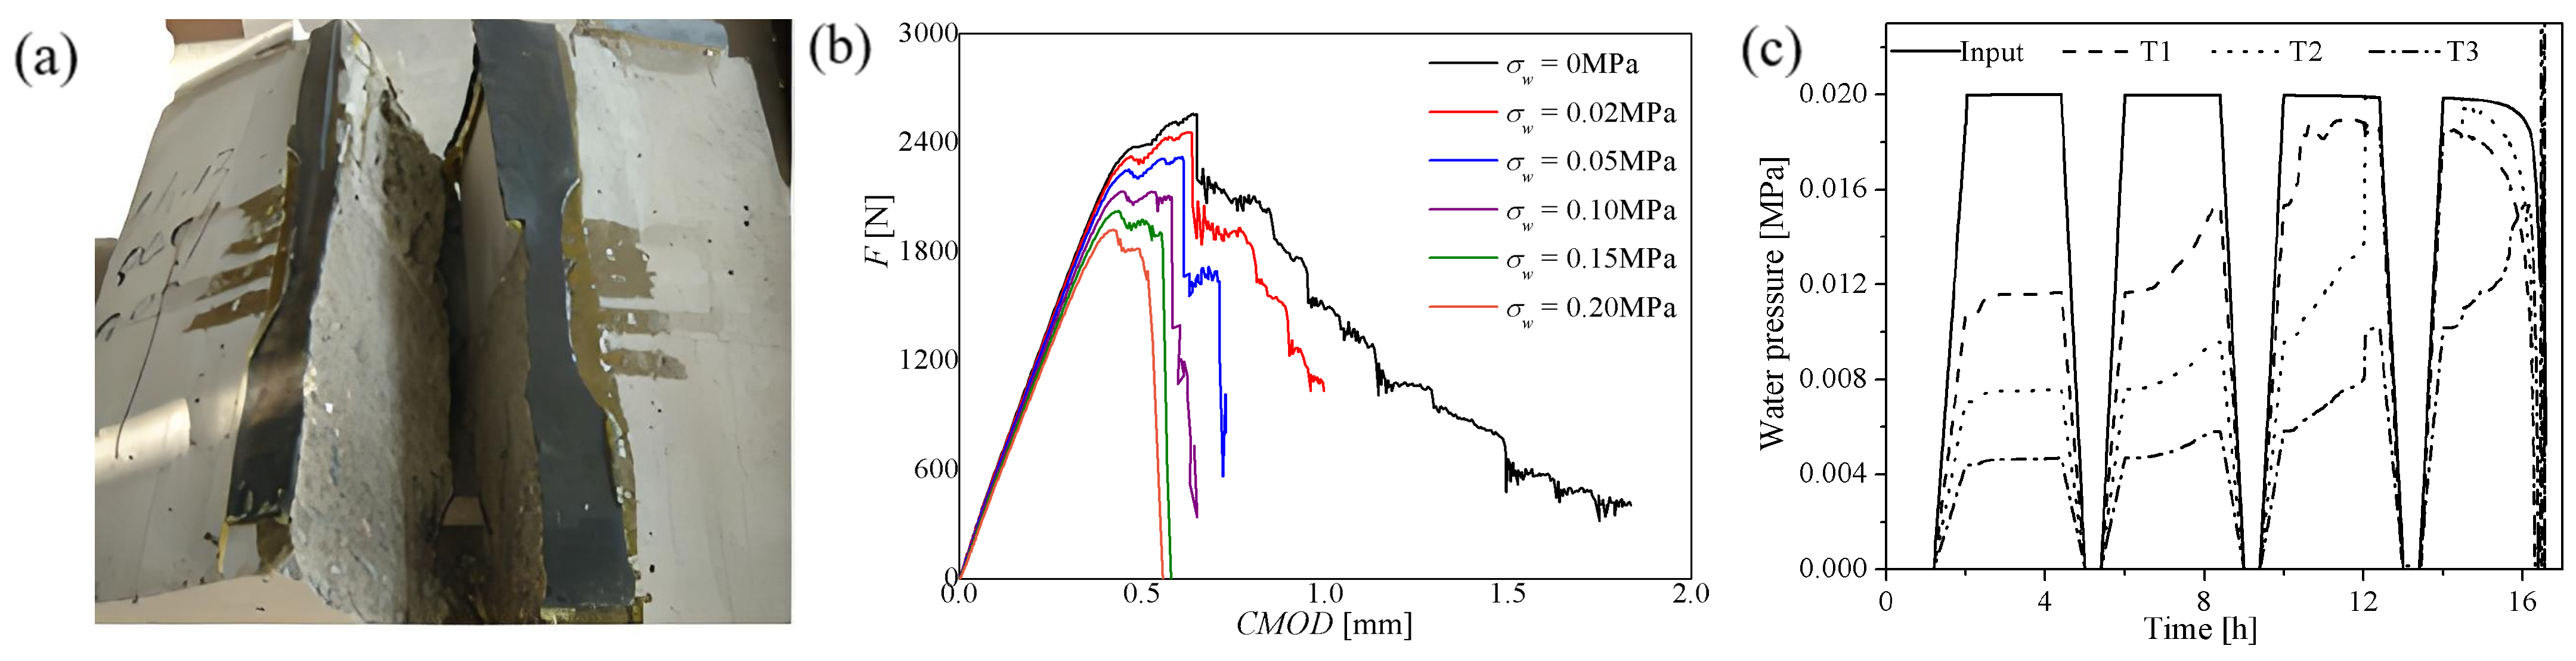
The fracture pattern is shown in Figure 4a. Table 1 summarizes the mean peak load, standard deviation, and coefficient of variation (COV), while Figure 4b presents the mean F–CMOD curves.
Figure 4.
Results from the wedge-splitting tests: (a) specimen after fracture; (b) mean load–CMOD responses at various hydraulic pressures, obtained by averaging three replicate specimens at each pressure level; (c) pressure measured during the test (σw = 0.02 MPa).
Increasing water pressure reduced the peak load and the corresponding CMOD and produced a steeper post-peak response. In contrast, the initial F–CMOD slopes changed little with water pressure, consistent with the results of Brühwiler and Saouma [16]. At small CMOD, the ligament remained largely intact, and the crack opening was too small for appreciable pressure penetration; consistently, the T1–T3 readings remained far below the applied pressure, and the pressurized crack-face area was negligible. Thus, the initial response was mainly governed by the stiffness of the uncracked ligament and specimen geometry.
As the crack opened and propagated, fracture permeability increased according to the cubic law, κc = wc2/12, allowing the pressure front to advance toward the crack tip. Water pressure then acted over an increasing crack-face area, reducing the external load required for fracture and accelerating post-peak crack propagation. The peak load decreased from 2553 N at zero pressure to 1873 N at 0.20 MPa, a reduction of 26.6%. The peak load decreased monotonically with water pressure. The standard deviation ranged from 53 to 85 N and the COV from 2.1% to 4.0%, both substantially smaller than the pressure-induced decrease in peak load. Therefore, the observed reduction was primarily caused by hydraulic pressure rather than material variability.
Figure 4c shows three stages of pressure evolution. Initially, pressures increased approximately linearly and decreased from T1 to T3, indicating limited crack growth. Subsequently, the sensor responses became nonlinear, especially at T1, reflecting crack initiation and increased permeability in the damaged zone. Finally, the measured pressures rapidly approached the applied pressure and then dropped to zero, indicating crack propagation past all sensors and complete failure. The number of cycles to failure also decreased with increasing pressure, from four cycles at 0.02 MPa to two cycles at 0.10 MPa.
4. Seepage–Stress Coupling Simulation of CSG
4.1. Seepage–Stress Coupling Model
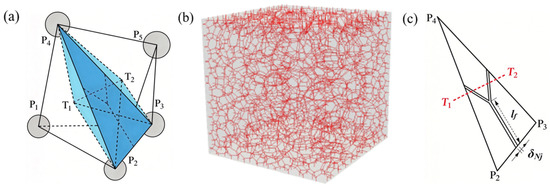
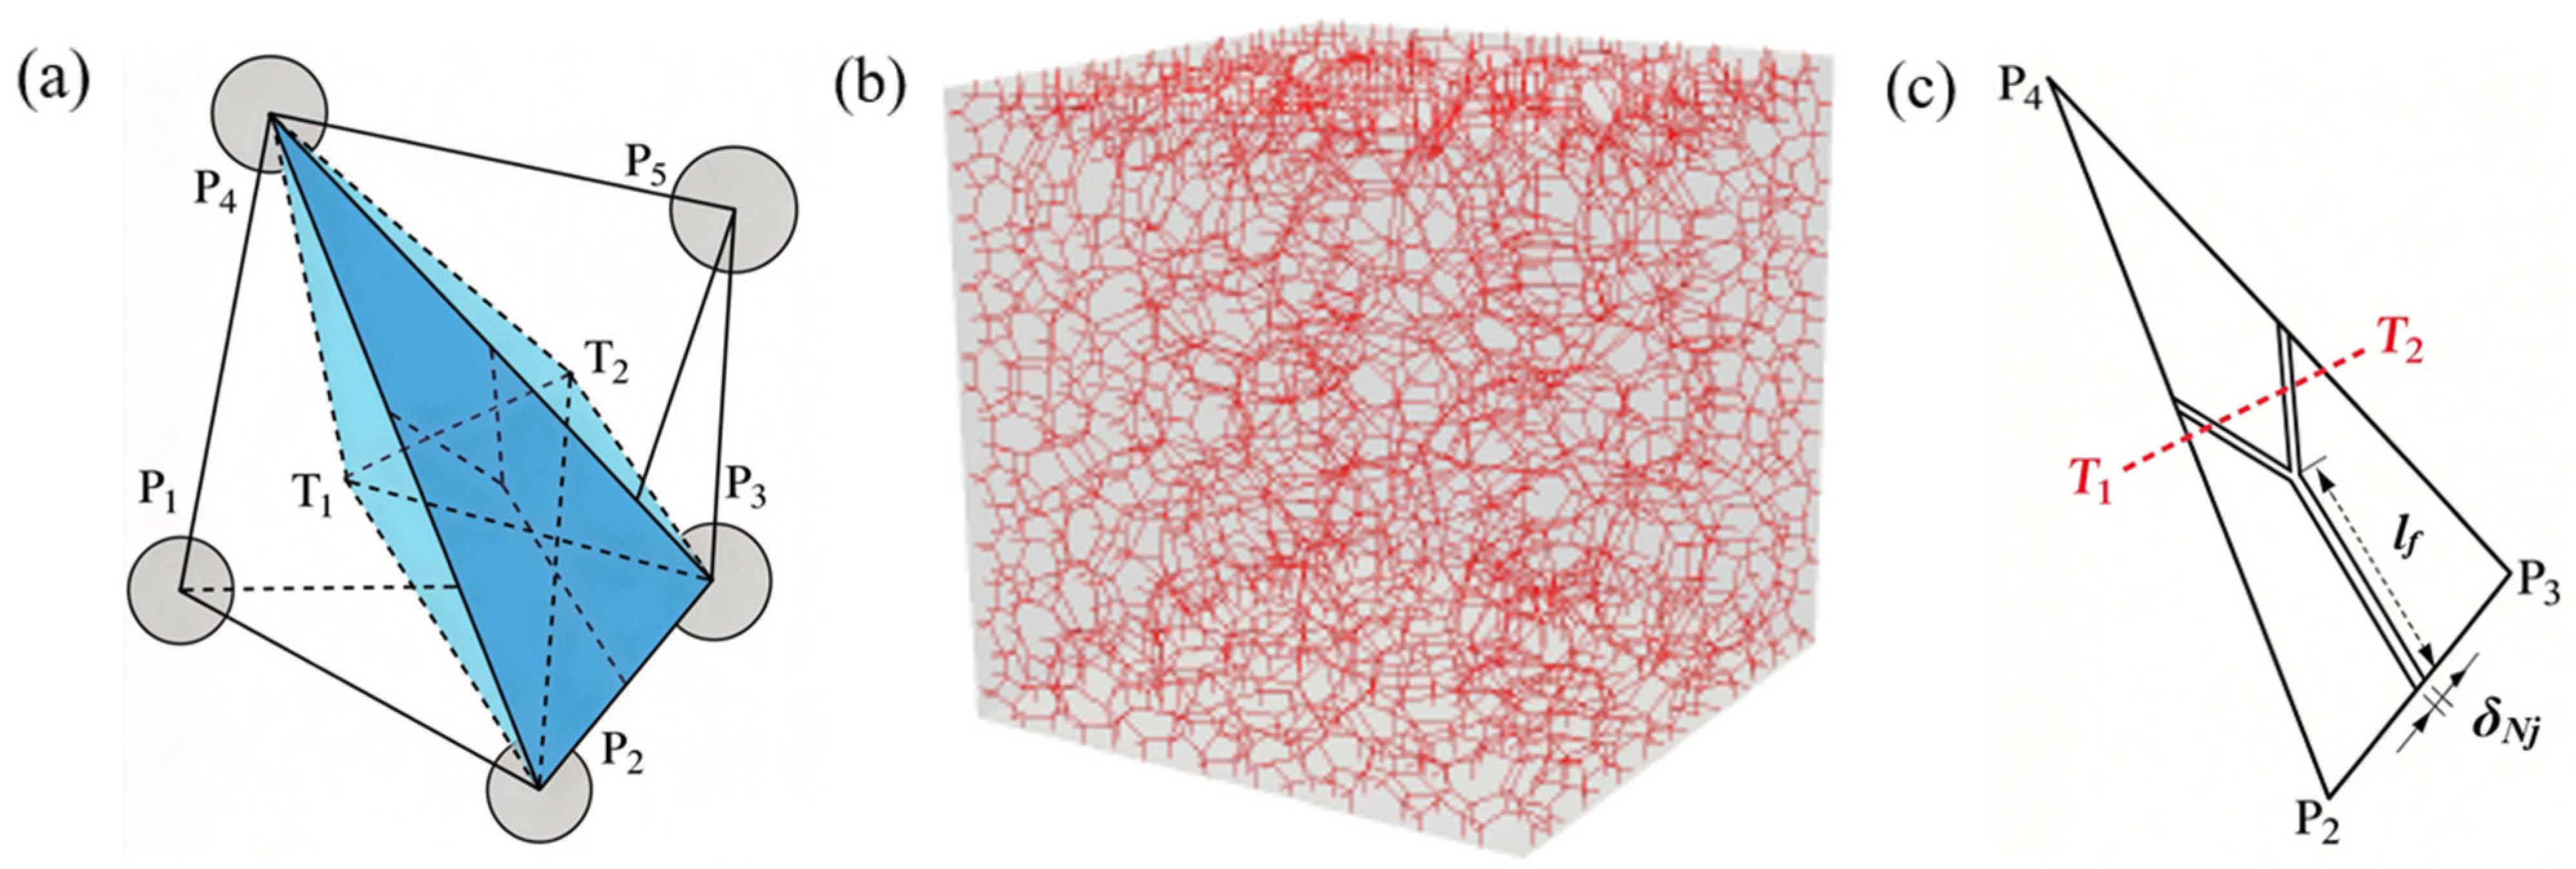
The coupled hydro-mechanical behavior was simulated by combining discrete poromechanics with LDPM [22,23,24,25,26]. A dual-lattice scheme was used to describe the solid skeleton and fluid transport network. Fluid lattice elements (FLEs) were generated by connecting the centroids of adjacent tetrahedra, as shown in Figure 5a. Together with the solid lattice, these elements form a network for seepage throughout the mesostructure (Figure 5b).
Figure 5.
Mesostructure of the M-LDPM: (a) a fluid lattice element and its related control volumes (the blue areas); (b) fluid lattice network; (c) cracked triangular face and schematic of normal crack opening (the dotted lines represent a flow lattice element (FLE)).
The coupling was formulated using effective stress theory:
where t is the overall stress vector, while ts corresponds to the portion carried by the solid phase, and tw = σwn denotes the hydraulic stress vector. Here, the Biot coefficient b was assumed equal to 1. This assumption is reasonable for CSG because its skeleton bulk modulus is much smaller than that of its mineral grains. Using E = 1500 MPa and ν = 0.2, the skeleton bulk modulus K is approximately 0.83 GPa, whereas the aggregate bulk modulus Ks is 37–76 GPa, giving b = 1 − K/Ks ≈ 0.98. Therefore, adopting b = 1 has a negligible influence on the predicted response.
t = ts − btw
The material was assumed to be fully saturated, and water was treated as a slightly compressible Newtonian fluid under isothermal conditions. For two adjacent tetrahedra, the line connecting their material points defines an FLE of length L. The corresponding tetrahedral control volumes are denoted by V1 and V2. Based on mass conservation, the water mass balance for each control volume Vi is expressed as
Here, denotes the rate of change of water mass within a control volume, and Q represents the fluid flux crossing the common facet. Both quantities are separated into the contributions of the intact region and the cracked region; that is, and Q = Qu + Qc.
For elements that remain uncracked, the fluid mass change rate is expressed as
In this formulation, Vi is subjected to a water pressure σwi, while εi denotes its volumetric strain; Mb corresponds to the Biot modulus, and the initial water density ρw0 is specified as 1000 kg/m3. Mb characterizes the coupled compressibility of the solid–fluid system and is distinct from the bulk modulus of water, Kw; Mb = 5.0 GPa. The flux in the intact domain follows Darcy’s law:
where κ0 denotes the intrinsic permeability, μw is the viscosity of water, An is the area of the shared facet, L is the distance between the two neighboring material points, and is the mean water density.
For cracked elements, the fluid mass variation is expressed as
where Vci is the crack volume, Kw is the bulk modulus of water (Kw = 2.15 GPa), and ρwi is the water density. Assuming steady laminar flow through the crack, the crack flow rate is written as
For intact facets, κc is replaced by κ0. Once tensile cracking occurs, the fracture permeability is determined from the cubic law κc = wc2/12, where wc is the normal crack opening. To avoid excessive conductance in fully opened facets, κc was limited to 106 κ0, which corresponds to an equivalent crack opening of approximately 9.3 μm (with κ0 = 7.2 × 10⁻¹⁸ m2) [24,27]. Fully cracked facets are substantially more open than this value, so they are effectively maintained at the imposed hydraulic pressure. Sensitivity analyses confirmed that increasing the limit produced no measurable change in the peak load, while reducing it to 104 κ0 produced changes smaller than the scatter among mesostructure realizations.
For each time step, the mechanical solver takes the computed pore-pressure field as an input, and the seepage solver, in turn, updates its state variables from the crack opening and volume change predicted by the mechanical calculation [25]. Accordingly, the interaction between seepage and deformation is resolved in a fully coupled hydro-mechanical framework.
4.2. Simulation Results
During the simulations, the water pressure was fixed at zero on all boundaries except along the initial crack. A monotonically increasing CMOD-controlled displacement was applied under each constant hydraulic-pressure level. The resulting F–CMOD envelope was compared with the experimental envelope reconstructed by connecting the peak-load points of successive loading cycles. This comparison is appropriate because cyclic unloading mainly affects hysteretic energy dissipation, whereas the peak-load envelope is governed by the current effective-stress state and accumulated damage.
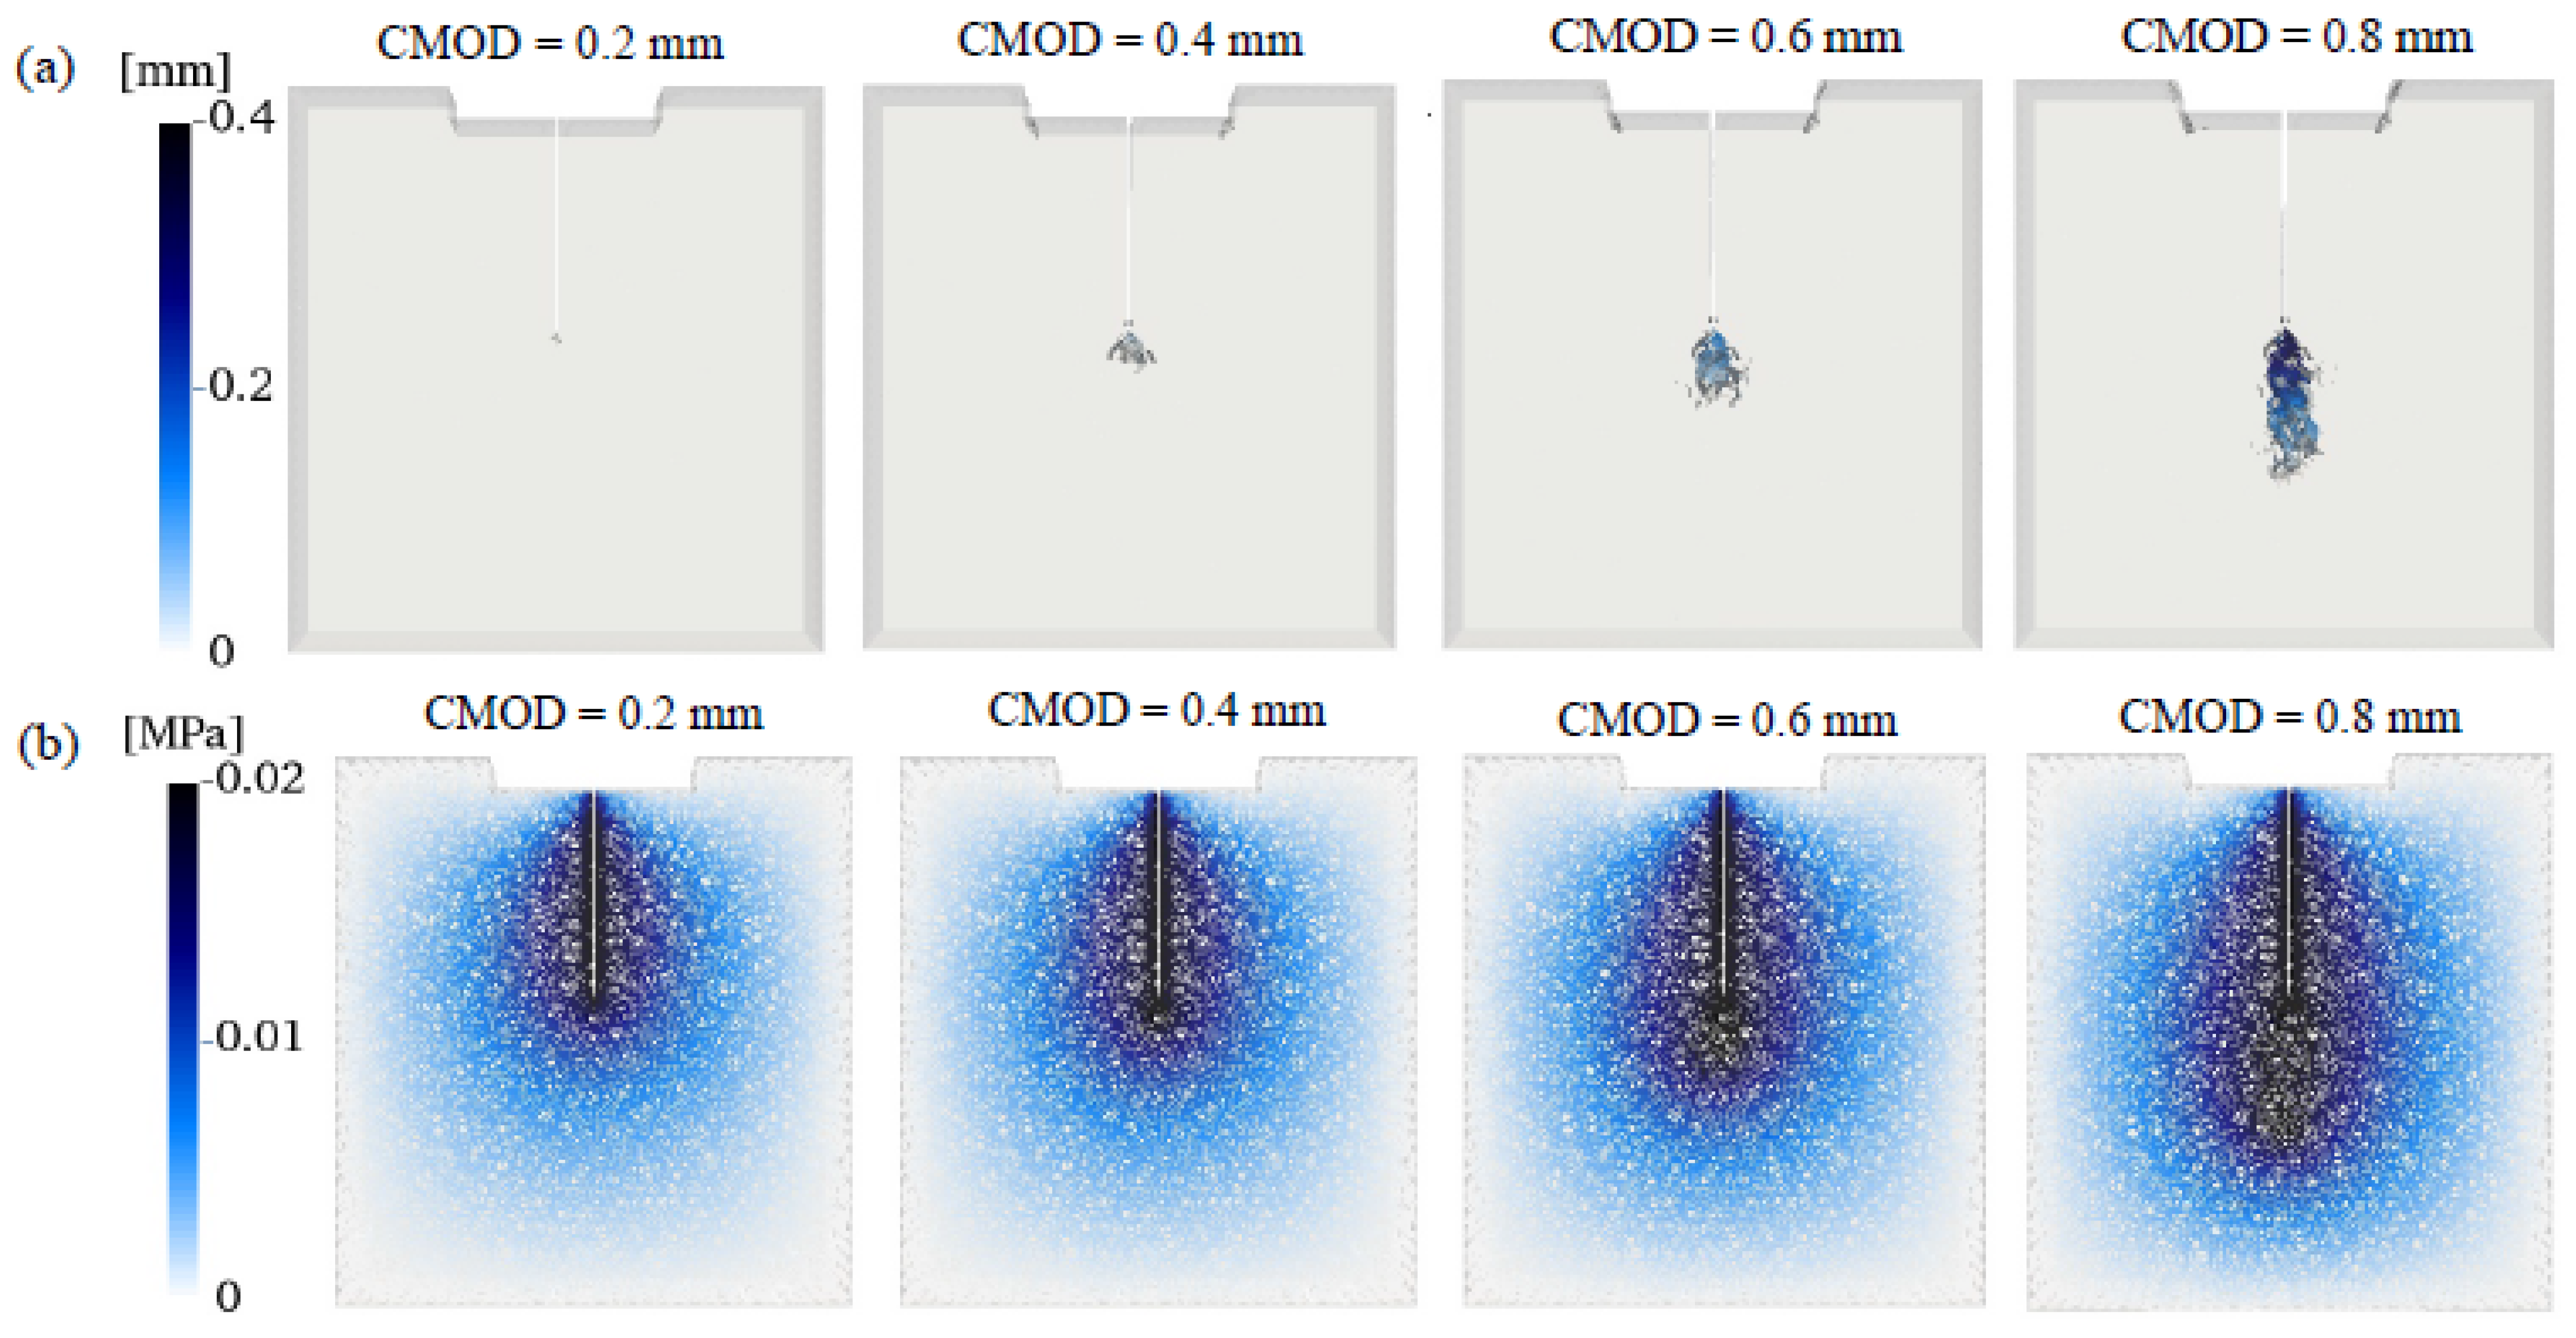
For σw = 0.02 MPa, the simulated crack evolution and water-pressure distribution are shown in Figure 6. Cracking initiated at the tip of the prefabricated notch and propagated downward as the CMOD increased.
Figure 6.
Modeling results: (a) opening of the fracture under σw = 0.02 MPa; (b) distribution of hydraulic pressure when σw = 0.02 MPa.
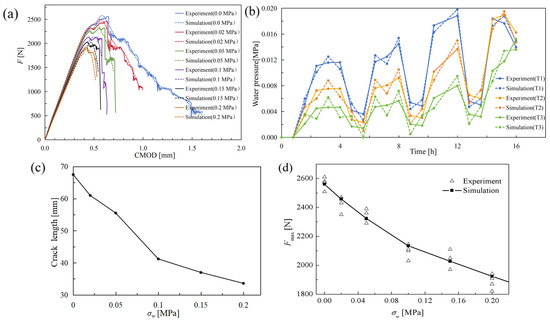
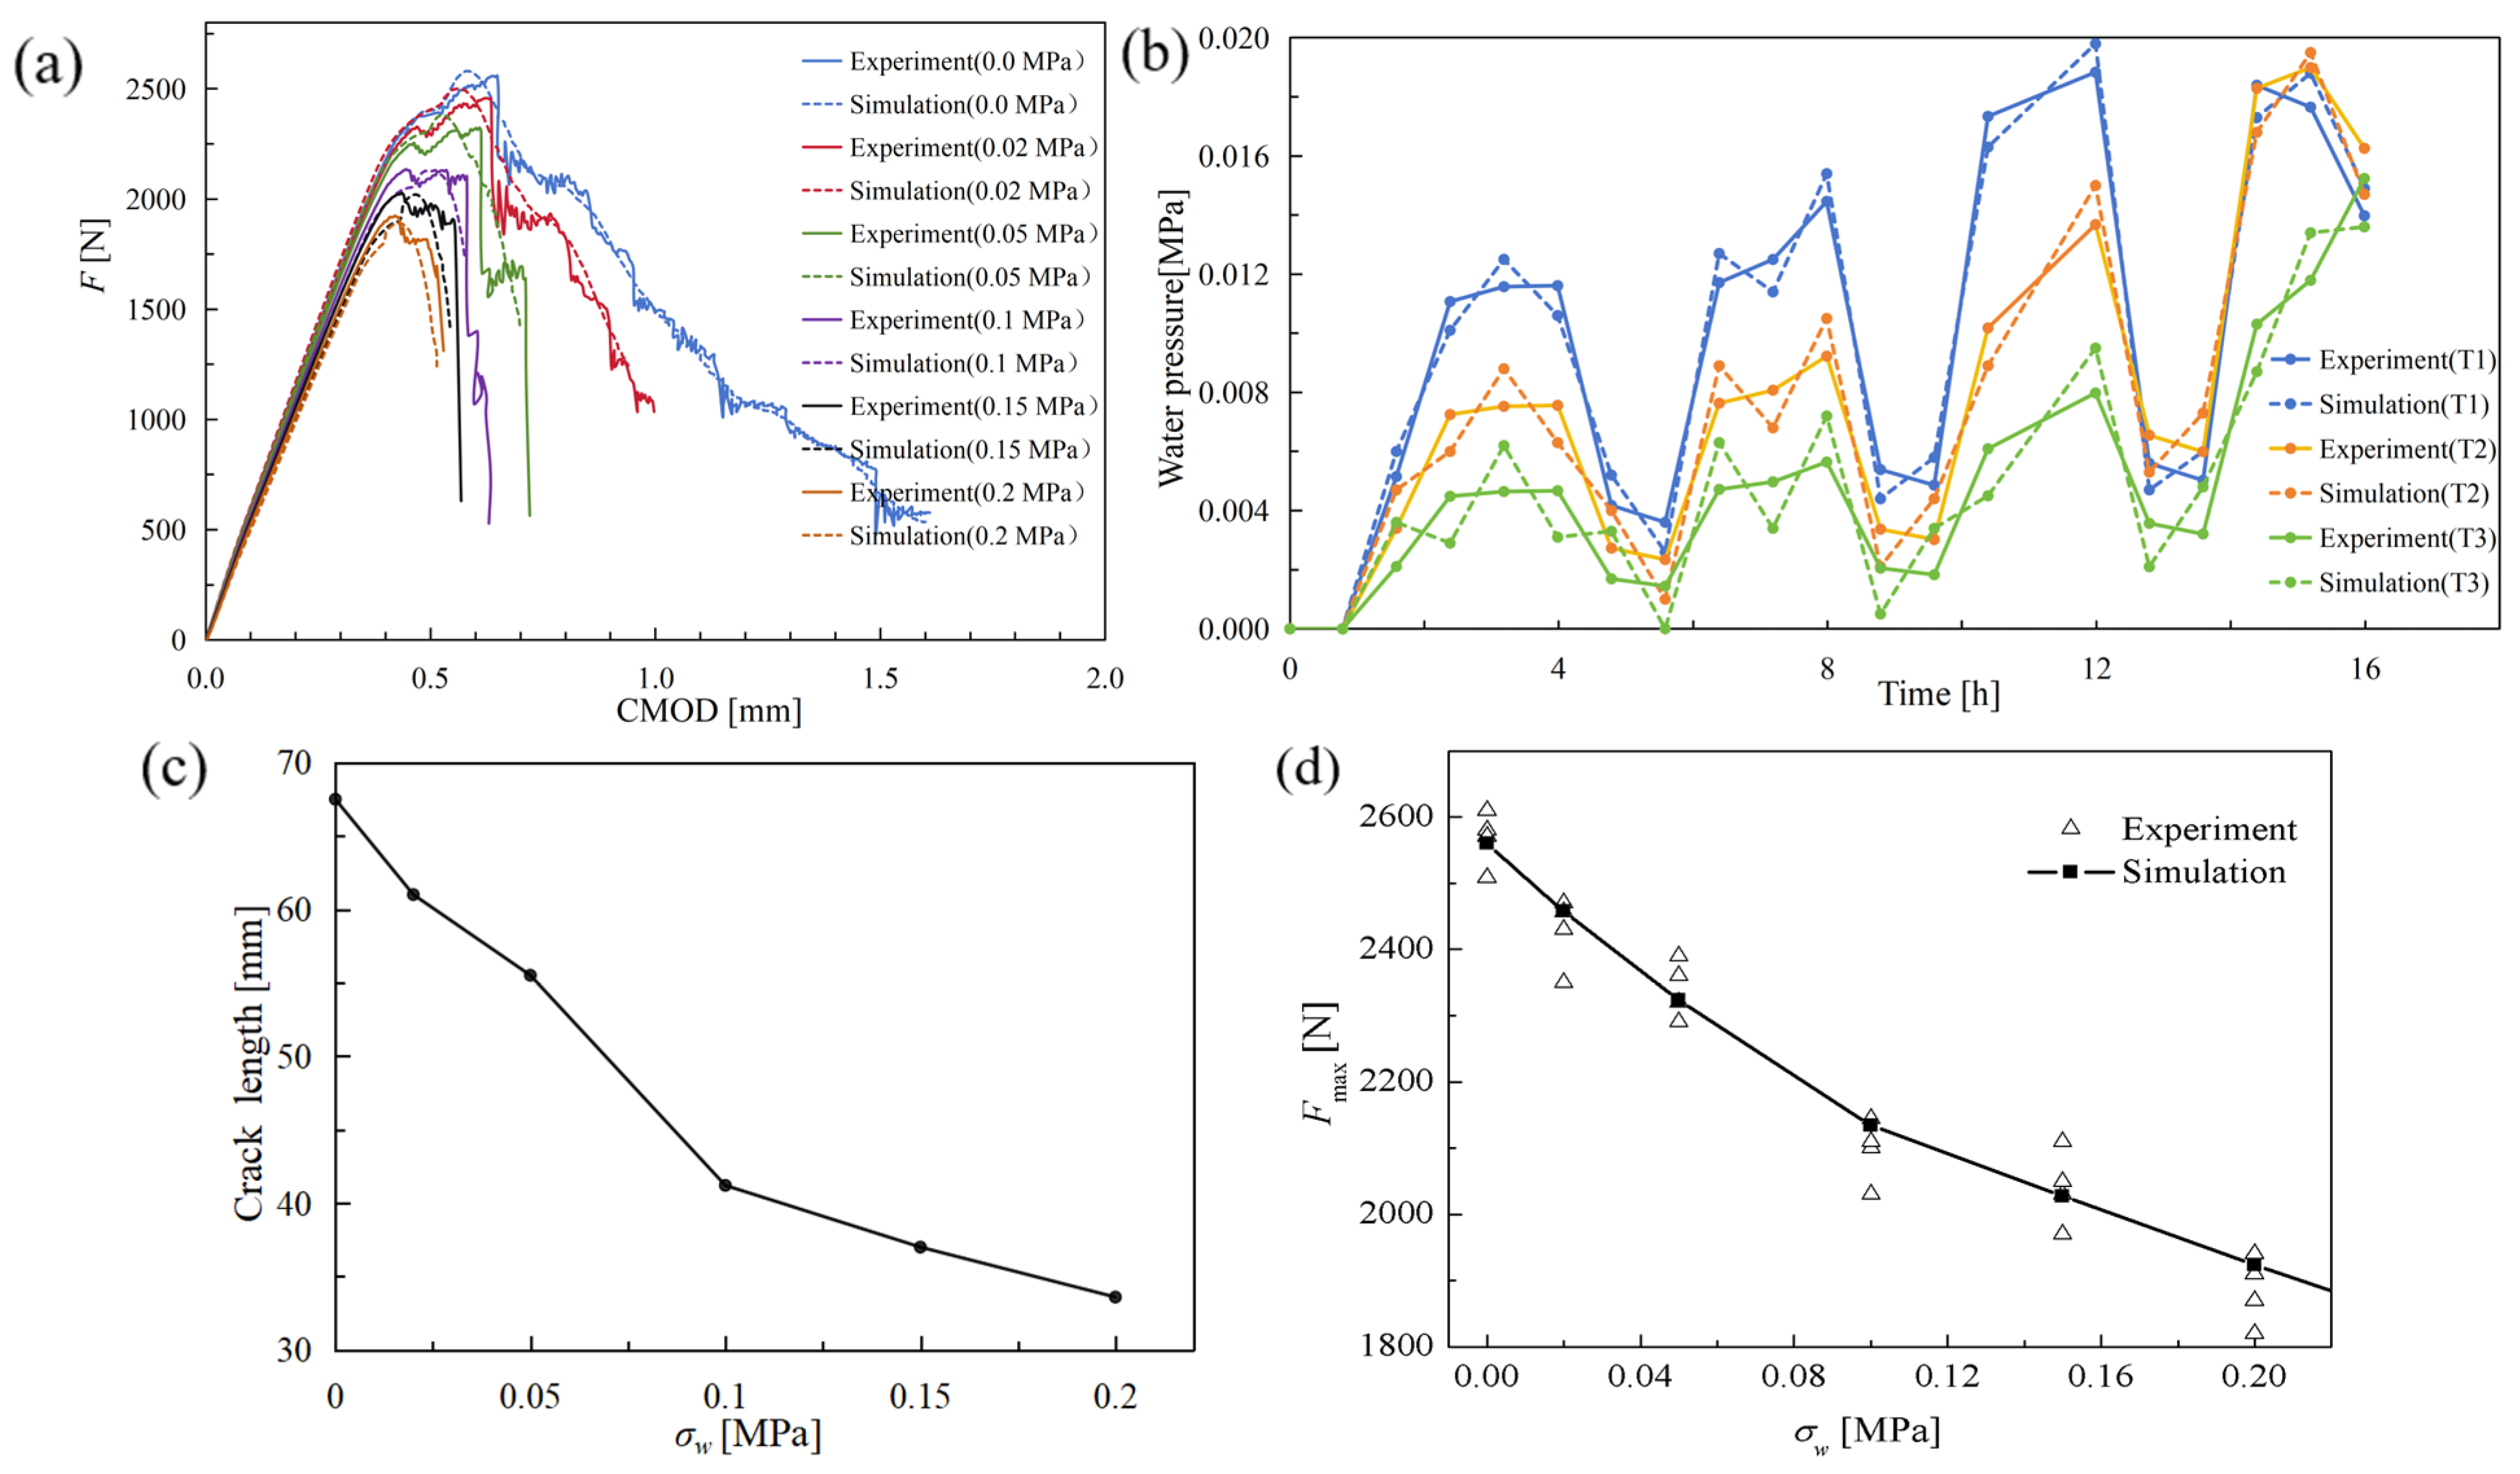
Figure 7a compares the complete experimental and numerical F–CMOD curves at the different hydraulic-pressure levels. The simulations reproduced the initial stiffness, peak load, and post-peak softening response with reasonable accuracy. Figure 7b compares the measured and predicted pressure histories at T1, T2, and T3 under σw = 0.02 MPa. The simulations captured the main experimental features, including the approximately linear pressure increase before crack initiation, the nonlinear response during crack propagation, and the rapid pressure rise followed by a sudden drop at failure.
Figure 7.
Comprehensive validation of the coupled model: (a) comparison of the complete experimental and numerical F–CMOD curves at various hydraulic pressures; (b) comparison of measured and simulated pressure histories at T1, T2, and T3 (σw = 0.02 MPa); (c) fracture length at maximum applied load as a function of water pressure; (d) comparison of peak loads obtained from tests and simulations.
Figure 7c presents the crack length at peak load as a function of water pressure. The crack length decreased with increasing hydraulic pressure, indicating a reduction in the extent of the fracture process zone. Figure 7d compares the experimental peak loads with the simulated values, which represent the mean results from five independent mesostructure realizations.
The quantitative comparisons are summarized in Table 1. The relative error of the simulated mean peak load ranged from 0.26% to 6.58%, corresponding to absolute deviations of 6.6–138.6 N. The simulations slightly overestimated the experimental peak loads at all pressure levels, but the deviations remained within the combined experimental and numerical scatter. The RMSE of the predicted pressure histories ranged from 3.4% to 11.2% of the applied water pressure and generally increased with both the hydraulic pressure and the distance from the crack tip. At σw = 0.02 MPa, the RMSE values at T1, T2, and T3 were 5.2%, 6.5%, and 7.8%, respectively. At the highest pressure level of 0.20 MPa, these values increased to 7.9%, 9.1%, and 11.2%.
Overall, the M-LDPM framework reproduced the complete F–CMOD response, internal pressure evolution, crack propagation, and pressure-dependent reduction in peak load with satisfactory accuracy.
4.3. Size-Effect Analysis
To investigate the influence of specimen size on the hydro-mechanically coupled fracture behavior of CSG, wedge-splitting specimens with characteristic heights H = 250, 500, 1000, and 2000 mm were simulated. The out-of-plane thickness was kept constant at D = 200 mm, and the relative notch depth was fixed at a/H = 0.4. For each specimen size and hydraulic-pressure level (σw = 0, 0.02, 0.05, 0.10, 0.15, 0.20 MPa), five statistically independent mesostructure realizations were analyzed. The particle-size distribution, specimen geometry, and LDPM parameters were kept unchanged, while different random seeds were used for aggregate placement. The H = 500 mm model corresponds to the experimental specimen geometry used in Section 3. Therefore, its simulated peak loads are consistent with the results compared with the experiments in Table 1 and Figure 7d.
For each realization, the peak load Fmax was extracted from the F–CMOD curve. The mean value, standard deviation (SD), and coefficient of variation (COV) were then calculated. The results are summarized in Table 2. The COV ranged from 2.08% to 6.94%, with an average of approximately 3.8%, indicating that the random mesostructure introduced a limited but measurable level of scatter. The mean peak loads were therefore used for the subsequent size-effect analysis.
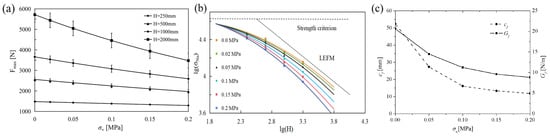
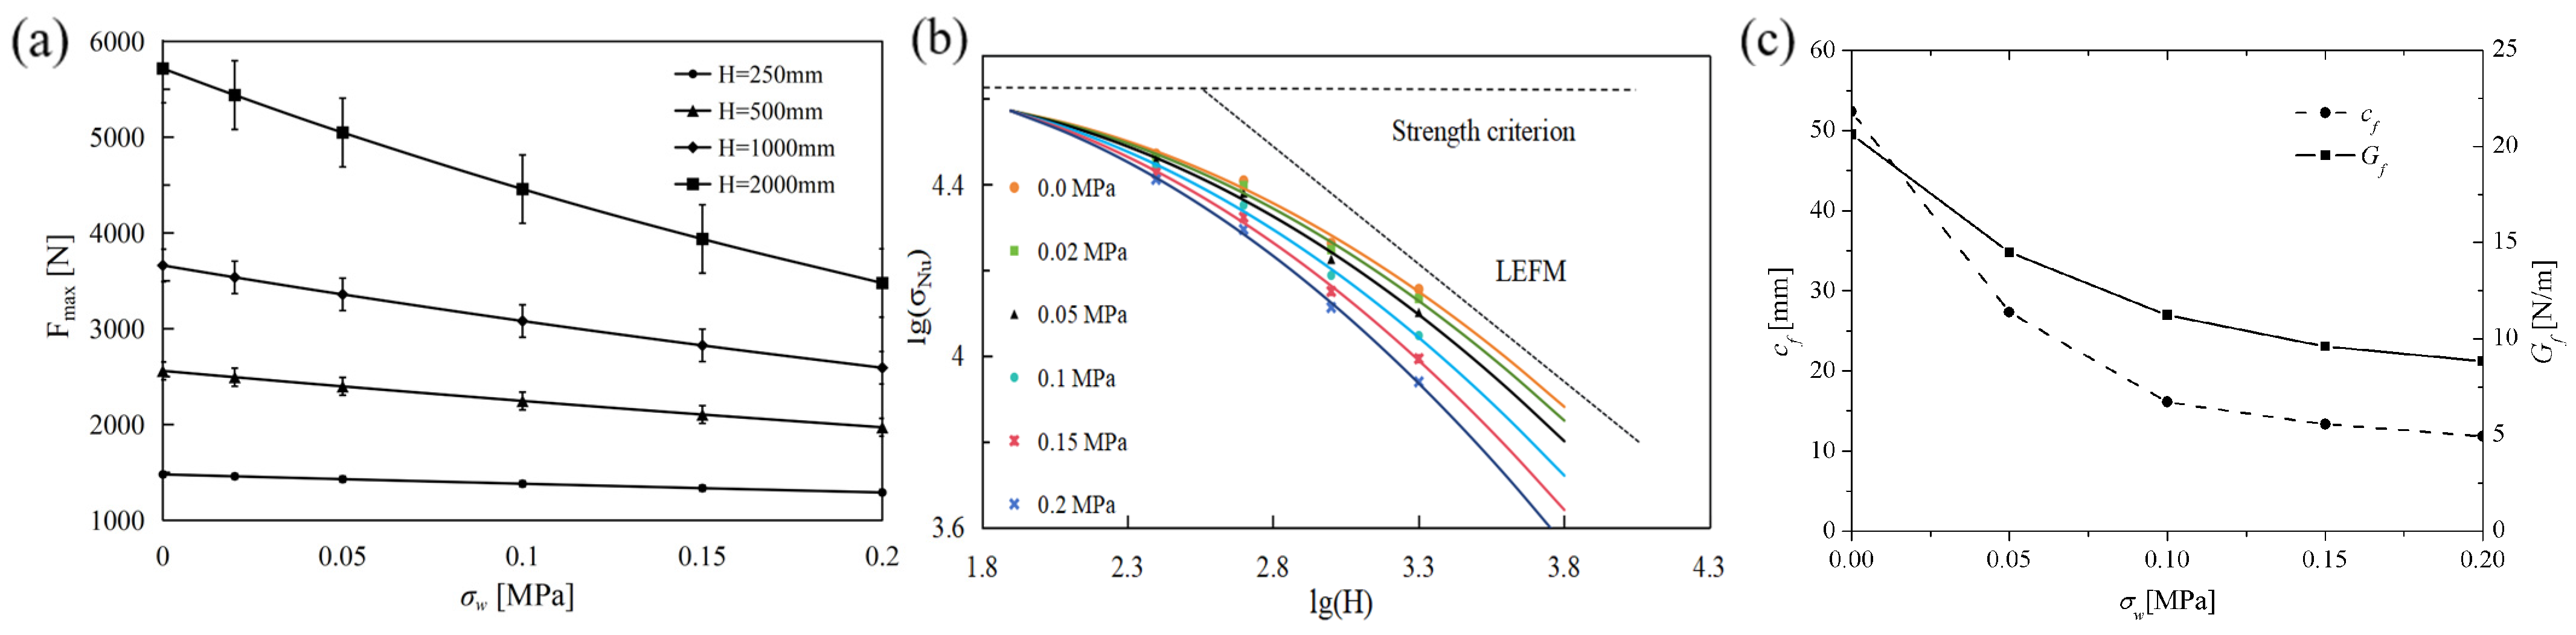
Figure 8a shows the variation in peak load with specimen size and hydraulic pressure. For a given specimen size, the peak load decreased as the water pressure increased. In contrast, for a given pressure level, the peak load increased with specimen size. The pressure-dependent peak loads were fitted using exponential functions:
Figure 8.
Size-dependent response: (a) peak-load variation with hydraulic pressure for different specimen sizes, with error bars representing ±1 SD from five realizations; (b) comparison between the simulated nominal strengths and Bažant-type size-effect predictions; and (c) variation in fracture energy and the characteristic fracture-process-zone length with hydraulic pressure.
For H = 250 mm,
For H = 500 mm,
For H = 1000 mm,
For H = 2000 mm,
Here, (i = 250, 500, 1000, 2000) denotes the peak load on the load–CMOD curve for specimens with heights of 250, 500, 1000, and 2000 mm, respectively, in units of N.
Equations (7)–(10) are empirical descriptions of the simulated results and are applicable only within the investigated range of 250 ≤ H ≤ 2000 mm and σw ≤ 0.20 MPa. They should not be extrapolated directly to dam-scale structures. The increase in the fitted decay coefficient with specimen size indicates that the influence of hydraulic pressure becomes more pronounced as the specimen size increases.
Following the method of Bažant and Planas [28,29,30], the peak load was converted into nominal strength: σNu = Fmax/(DH), where D and H denote the specimen thickness and height, respectively. The variation in nominal strength with specimen size was described by Bažant’s law: . Here, σ0 and H0 are the two governing coefficients used to quantify the size-effect response. The fitting results under different hydraulic pressures show a clear trend: with increasing water pressure, σ0 gradually rises, while H0 continuously decreases. Specifically, σ0 increases from 0.0412 MPa at zero water pressure to 0.0566 MPa at 0.20 MPa, whereas H0 drops from 291 mm to 66.0 mm over the same pressure range. This evolution indicates that water pressure has a pronounced influence on the size-effect characteristics of CSG material.
The simulated nominal strengths and the corresponding Bažant fits are presented in Figure 8b. The data agree well with the proposed law, with R2 values between 0.992 and 0.998 and an average of 0.996 over all pressure levels. By comparison, direct LEFM fits produced lower R2 values, ranging from 0.811 to 0.989, with an average of 0.916. The deviation from the LEFM asymptote is particularly evident for the smallest specimens, for which the fracture-process-zone length is not negligible relative to the specimen size. These results confirm that the CSG fracture response is governed by a quasibrittle size effect rather than by pure LEFM scaling.
Although H and the notch length a = 0.4 H were scaled, the thickness D was kept constant. The models are therefore not fully three-dimensionally similar. This configuration is appropriate for evaluating the in-plane size effect described by Bažant’s law. The thickness satisfies D/lt ≈ 2.2 and D/da ≈ 5.0, where lt = 90 mm is the LDPM internal length, and da = 40 mm is the maximum aggregate size. Thus, the thickness is sufficiently large for the fracture process zone to develop through the specimen thickness without introducing a dominant thickness-size effect.
The fitted parameters were further used to estimate the fracture energy Gf and the effective characteristic length cf:, , where E is Young’s modulus, g0 is the dimensionless energy-release function, and is its derivative evaluated at the initial notch ratio [31,32]. For a/H = 0.4, g0 = 2.241 and = 12.63, so that . The calculated cf decreased from approximately 52 to 12 mm as the hydraulic pressure increased from 0 to 0.20 MPa. The corresponding variation in Gf and cf is shown in Figure 8c. Here, cf represents the energy-equivalent length of the fracture process zone obtained from the size-effect fit; it should not be interpreted as the instantaneous length of the locally damaged region.
For large structures (H ≫ H0), Bažant’s law approaches . Using the fitted parameters, the ratio of the nominal strength at σw = 0.20 MPa to that under dry conditions approaches approximately 0.654 for very large structures. This corresponds to an approximate 35% reduction in nominal fracture strength. At the laboratory scale, the reduction is approximately 23.0%, increasing from 12.8% at H = 250 mm to 39.2% at H = 2000 mm. Therefore, structural size amplifies the influence of hydraulic pressure, and both factors should be considered in the safety assessment of CSG dams and cofferdams.
5. Discussion
Hydraulic pressure significantly affects the fracture behavior of CSG. As the pressure increases, crack propagation becomes faster and more localized, while the peak load, initial fracture energy, and effective fracture-process-zone length decrease. This behavior results from pressure-induced changes in crack-tip stress redistribution and damage evolution.
The LDPM–discrete poromechanics framework reproduced the load–CMOD response, crack evolution, and internal pressure histories with satisfactory accuracy. The successful transfer of parameters calibrated from triaxial compression tests to wedge-splitting simulations further demonstrates the robustness of the model.
The simulated results also show a clear quasibrittle size effect, which is well described by Bažant’s size-effect law. The influence of hydraulic pressure becomes more pronounced as the specimen size increases. Therefore, both hydraulic pressure and structural size should be considered in the safety assessment of CSG hydraulic structures.
The present study is limited to monotonic hydraulic loading, isothermal conditions, and a constant out-of-plane thickness. Cyclic seepage, thermal effects, thickness-dependent behavior, and larger-scale three-dimensional structures should be investigated in future work.
6. Conclusions
This study investigated the fracture behavior of cemented sand and gravel (CSG) under coupled seepage and mechanical loading using wedge-splitting tests and mesoscale numerical simulations. A hydro-mechanical coupling model was developed by combining the lattice discrete particle model (LDPM) with a dual-lattice seepage network. The main conclusions are as follows:
(1) Increasing the crack-face pressure from 0 to 0.20 MPa reduced the mean peak load from 2553 to 1873 N, corresponding to a 26.6% decrease. The effective process-zone length decreased from approximately 52 to 12 mm, and the initial fracture energy decreased by approximately 57%.
(2) The proposed model reproduced the experimental peak loads with relative errors of 0.26–6.58% and the internal pressure histories with RMSE values of 3.4–11.2%.
(3) The fracture response remained quasibrittle. Bažant’s size-effect law produced an average R2 of 0.996, compared with 0.916 for a pure LEFM fit.
(4) Hydraulic pressure has a stronger influence on larger specimens. The peak load decreased by 23.0% at the laboratory scale, while the predicted reduction in nominal fracture strength reached approximately 35% at large structural scale. Hydraulic pressure and structural size should therefore be considered together, and effective seepage control is essential for improving the reliability of CSG hydraulic structures.
This study establishes the relationship between crack evolution, permeability variation, and internal water-pressure development, providing a useful reference for fracture-safety assessment and seepage control in CSG dams and cofferdams. Future studies should consider a wider range of material compositions, loading conditions, and hydraulic boundary conditions, as well as larger-scale tests to further validate the engineering applicability of the model.
Author Contributions
Conceptualization, J.C. and X.C.; methodology, W.L.; software, J.C. and W.L.; validation, J.C.; writing—original draft preparation, J.C.; writing—review and editing, W.L.; funding acquisition, J.C. All authors have read and agreed to the published version of the manuscript.
Funding
This research was funded by the Qing Lan Project of Jiangsu Province (2025), the Jiangsu Provincial Industry-University-Research Cooperation Project (BY20250299), and the Research Start-up Fund for High-Level Talents of Nanjing Vocational Institute of Transport Technology (JG2513).
Data Availability Statement
The original contributions presented in the study are included in the article, further inquiries can be directed to the corresponding author.
Acknowledgments
Part of this research was carried out using the Quest high-performance computing resources at Northwestern University. Jiaojiao Chen gratefully acknowledges Gianluca Cusatis for his prompt and valuable guidance on LDPM-related research during her stay at Northwestern. During the preparation of this manuscript, the authors did not use GenAI tools for generating text, data, or graphics.
Conflicts of Interest
The authors declare no conflicts of interest.
Abbreviations
The following abbreviations are used in this manuscript:
| CSG | Cemented sand and gravel |
| LDPM | Lattice discrete particle model |
| CMOD | Crack mouth opening displacement |
| FPZ | Fracture process zone |
References
- Amini, Y.; Hamidi, A.; Asghari, E. Shear strength-dilation characteristics of cemented sand-gravel mixtures. Int. J. Geotech. Eng. 2014, 8, 406–413. [Google Scholar] [CrossRef] [Scilit]
- Yang, J.; Cai, X.; Pang, Q.; Guo, X.W.; Wu, Y.L.; Zhao, J.L. Experimental study on the shear strength of cement-sand-gravel material. Adv. Mater. Sci. Eng. 2018, 2018, 2531642. [Google Scholar] [CrossRef] [Scilit]
- Zhang, X.; Chen, F.; Huang, H.; Liu, Z.; Li, R.; Guo, L. Study on the investigation of crack identification and spatio-temporal distribution in cemented sand and gravel materials. Structures 2025, 80, 109769. [Google Scholar] [CrossRef] [Scilit]
- Qian, L.; Guo, X.; Liu, Q.; Cai, X.; Zhang, X. Macro-mesoscopic failure mechanism based on a direct shear test of a cemented sand and gravel layer. Buildings 2024, 14, 4078. [Google Scholar] [CrossRef] [Scilit]
- Ren, H.; Cai, X.; Wu, Y.; Jing, P.; Guo, W. A study of strength parameter evolution and a statistical damage constitutive model of cemented sand and gravel. Materials 2023, 16, 542. [Google Scholar] [CrossRef] [Scilit] [PubMed]
- Zhong, L.; Zhang, Y.; Guo, L.; Zhang, J. Research on multiscale simulation methods for thermal response of cemented sand-gravel dams. Appl. Sci. 2026, 16, 6723. [Google Scholar] [CrossRef] [Scilit]
- Chen, J.; Cai, X.; Yang, J.; Cusatis, G. Centrifuge modeling testing and multiscale analysis of cemented sand and gravel dams. Constr. Build. Mater. 2019, 223, 605–615. [Google Scholar] [CrossRef] [Scilit]
- Wang, Y.; Khan, M.; Uy, B.; Katwal, U.; Tao, Z.; Thai, H.T.; Ngo, T. Long-term performance of steel-concrete composite wall panels under axial compression. Structures 2024, 64, 106606. [Google Scholar] [CrossRef] [Scilit]
- Chi, Y.H.; Wang, Y.T.; Hai, L.T.; Zeng, X.; Chen, B.W.; Chen, B.S. Numerical modelling and design of square concrete-filled QN1803 stainless steel tubular stub columns under axial compression. Adv. Steel Constr. 2025, 21, 327–335. [Google Scholar]
- Cusatis, G.; Bažant, Z.P.; Cedolin, L. Confinement-shear lattice model for concrete damage and fracture. Theory. J. Eng. Mech. 2003, 129, 1439–1448. [Google Scholar] [CrossRef] [Scilit]
- Cusatis, G.; Bažant, Z.P.; Cedolin, L. Confinement-shear lattice model for concrete damage and fracture. II: Calibration and verification. J. Eng. Mech. 2003, 129, 1449–1458. [Google Scholar]
- Cusatis, G.; Cedolin, L. Two-scale study of concrete fracturing behavior. Eng. Fract. Mech. 2007, 74, 3–17. [Google Scholar] [CrossRef] [Scilit]
- Cusatis, G.; Pelessone, D.; Mencarelli, A. Lattice discrete particle model (LDPM) for failure behavior of concrete. Theory. Cem. Concr. Compos. 2011, 33, 881–890. [Google Scholar] [CrossRef] [Scilit]
- Cusatis, G.; Pelessone, D.; Mencarelli, A. Lattice discrete particle model (LDPM) for failure behavior of concrete. II: Calibration and validation. Cem. Concr. Compos. 2011, 33, 891–905. [Google Scholar] [CrossRef] [Scilit]
- Li, X.; Che, X.; Li, H.; Qi, C. A meso-macro method of evaluating water content effect on direct tensile fracture in brittle rocks. KSCE J. Civ. Eng. 2024, 28, 1513–2152. [Google Scholar] [CrossRef] [Scilit]
- Brühwiler, E.; Saouma, V.E. Fracture energy of concrete under water pressure. J. Eng. Mech. 1995, 121, 710–716. [Google Scholar]
- Xu, C.; Han, L.; Wang, K.; Chen, X. THMD coupling model for water-conducting fracture zones of mines based on dual-porosity media. Int. J. Geomech. 2025, 25, 04025052. [Google Scholar] [CrossRef] [Scilit]
- Koohbor, B.; Fischer, P.; Fahs, M.; Jardani, A.; Younes, A.; Jourde, H. A discrete fracture model for coupled simulation of water flow and electrical current in fractured vadose zone. J. Hydrol. 2025, 651, 132590. [Google Scholar] [CrossRef] [Scilit]
- Shahbazi, A.; Saeidi, A.; Chesnaux, R.; Rouleau, A. An index based on fracture length and aperture to predict groundwater inflow rates in tunnels excavated in fractured rock. Transp. Geotech. 2024, 45, 101217. [Google Scholar] [CrossRef] [Scilit]
- Li, H.; Wang, S. A coupled variational phase-field and multiphase flow model for hydraulic fracturing in quasi-brittle materials. Acta Geotech. 2026. [Google Scholar] [CrossRef] [Scilit]
- Guo, L.; Wu, Z.; Zhong, L.; Luo, Y. Effect of aggregate characteristics on properties of cemented sand and gravel. Sci. Eng. Compos. Mater. 2023, 30, 20220220. [Google Scholar] [CrossRef] [Scilit]
- Rezakhani, R.; Alnaggar, M.; Cusatis, G. Multiscale homogenization modeling of alkali-silica-reaction damage in concrete. In Proceedings of the FraMCoS-9, Berkeley, CA, USA, 29 May–1 June 2016. [Google Scholar]
- Rezakhani, R.; Zhou, X.; Cusatis, G. Adaptive multiscale homogenization of the lattice discrete particle model. Int. J. Solids Struct. 2017, 125, 50–67. [Google Scholar] [CrossRef] [Scilit]
- Li, W.; Rezakhani, R.; Jin, C.; Zhou, X.; Cusatis, G. A multiscale framework for the simulation of the anisotropic mechanical behavior of shale. Int. J. Numer. Anal. Methods Geomech. 2017, 41, 1494–1522. [Google Scholar] [CrossRef] [Scilit]
- Li, W.; Zhou, X.; Carey, J.W.; Frash, L.P.; Cusatis, G. Multiphysics lattice discrete particle modeling of shale. Rock Mech. Rock Eng. 2018, 51, 3963–3981. [Google Scholar] [CrossRef] [Scilit]
- Shen, L.; Li, W.; Zhou, X.; Feng, J.; Di Luzio, G.; Ren, Q.; Cusatis, G. Multiphysics lattice discrete particle model for the simulation of concrete thermal spalling. Cem. Concr. Compos. 2020, 106, 103457. [Google Scholar] [CrossRef] [Scilit]
- Sousa, J.L.A.O.E.; Bittencourt, T.N. Experimental analysis of fracture processes in concrete. J. Braz. Soc. Mech. Sci. 2001, 23, 545–550. [Google Scholar] [CrossRef] [Scilit]
- Bažant, Z.P.; Xi, Y. Statistical size effect in quasi-brittle structures: I. Is Weibull theory applicable? J. Eng. Mech. 1991, 117, 2609–2622. [Google Scholar] [CrossRef] [Scilit]
- Bažant, Z.P.; Planas, J. Fracture and size effect in quasibrittle structures. Int. J. Solids Struct. 1996, 33, 2963–2980. [Google Scholar]
- Bažant, Z.P.; Planas, J. Fracture and Size Effect in Concrete and Other Quasibrittle Materials; CRC Press: Boca Raton, FL, USA, 1998. [Google Scholar]
- Hillerborg, A.; Modéer, M.; Petersson, P.E. Analysis of crack formation and crack growth in concrete by means of fracture mechanics and finite elements. Cem. Concr. Res. 1976, 6, 773–782. [Google Scholar] [CrossRef] [Scilit]
- Petersson, P.E. Crack Growth and Development of Fracture Zones in Plain Concrete and Similar Materials; Report TVBM; Lund University: Lund, Sweden, 2004. [Google Scholar]

Disclaimer/Publisher’s Note: The statements, opinions and data contained in all publications are solely those of the individual author(s) and contributor(s) and not of MDPI and/or the editor(s). MDPI and/or the editor(s) disclaim responsibility for any injury to people or property resulting from any ideas, methods, instructions or products referred to in the content. |
© 2026 by the authors. Licensee MDPI, Basel, Switzerland. This article is an open access article distributed under the terms and conditions of the Creative Commons Attribution (CC BY) license.