


Abstract
Owing to various uncertainty factors during the construction process, foundation pit engineering is prone to crisis situations and various risks, and thus quick and rational decisions on construction risk control options must be made. In response to the phenomenon that the evaluation values of certain indicators in the decision making of deep foundation pit support schemes may be missing, this paper proposes a decision making method for construction risk control schemes that combines prospect theory with evidence theory. The method establishes a prospect decision matrix based on a decision indicator system for deep foundation pit construction risk control schemes, taking the decision maker’s desired goal for the project as the reference point; the indicator prospect values of each scheme are then used as evidence, and the belief intervals of all schemes are obtained through evidence synthesis to serve as the basis for scheme decision making. This method enriches the existing theoretical framework for the decision making of engineering construction risk control schemes. Compared with existing decision models, the decision method proposed in this paper exhibits the following distinctive features: First, the method accommodates decision situations in which some attribute evaluation values are missing, without requiring the missing values to be interpolated with precise values, fuzzy numbers, interval numbers, or probability distributions, and without necessarily discarding the decision attributes containing missing values, reflecting its better decision adaptability. Second, the degree of information incompleteness, i.e., the number of missing values, is intuitively reflected in the decision results, demonstrating the method’s better information fidelity and model interpretability. Third, the method incorporates behavioral factors such as the target expectation and risk attitude of the decision maker into the decision making process, and can objectively reveal the influence of these factors on the decision results through sensitivity analysis, thereby providing a basis for the decision maker to select the decision results more rationally. Combined with the analysis of a large-scale underground pit project, the results show that this method is not constrained by the completeness or incompleteness of the evaluation information of the indicators, and by taking the decision maker’s reasonable expectation as the reference point, it proves more reasonable than methods that take the absolute optimum or the worst value as the ideal reference point for scheme decision making. The method developed in this study can be applied to the decision making of risk control schemes in similar underground engineering or other civil engineering projects.
1. Introduction
With the rapid development and utilization of urban underground space in China, an increasing number of foundation pit projects must be constructed in densely built urban areas. Excavation support is a critical component of deep excavation engineering. The quality of the support scheme not only affects the cost and construction schedule of the excavation project but also plays a decisive role in ensuring the safety of the entire construction process and the protection of the surrounding environment. Therefore, selecting the optimal support scheme from multiple feasible alternatives based on specific engineering characteristics is a practical problem worthy of in-depth study.
Currently, the primary decision making methods for deep foundation pit support schemes include the following: (1) methods that rank alternatives by comparing the relative membership degree (degree of superiority) of each candidate scheme against the optimal scheme, such as the gray multi-objective decision making optimization model [1], the optimization model based on gray Euclidean theory [2], the fuzzy analytic hierarchy process [3], the fuzzy comprehensive evaluation model [4,5], the fuzzy gray relational projection model [6], and the improved TOPSIS method [7,8]; (2) the analytic network process (ANP), which optimizes and ranks alternatives by comparing their limit supermatrix priority values [9]; (3) a distance discrimination model based on a large number of engineering case studies [10]; (4) a method that transforms scheme evaluation indicators into set pair analysis connection numbers and then ranks the alternatives by comparing the magnitudes of these connection numbers [11,12]; and (5) multi-attribute decision making methods based on mathematical programming [13,14], among others.
The shortcomings of the aforementioned methods primarily manifest in two aspects. First, they require that the evaluation information for the support scheme indicators be fully known, meaning that all such information must be expressible in the form of precise values, fuzzy numbers, or interval numbers. However, due to uncertain geotechnical conditions, complex surrounding environments, and insufficient decision making experience, it is inevitable that some schemes may have unknown evaluation values for certain indicators, resulting in null values [15]. For instance, for a newly proposed foundation pit support scheme, it is often difficult to estimate its construction period due to limited available empirical data. In such cases, rather than providing an unfounded estimate, it is more reasonable to treat the value as unknown information. Second, previous decision making methods have regarded the subjective factors of decision makers—such as risk attitude and the assessment of decision indicator importance—as “interference” with the decision results, attempting to eliminate this “interference” through various means. However, the purpose of decision research is to serve decision makers, and decisions that disregard those they are intended to serve are bound to be rejected or poorly received. According to previous studies, different risk attitudes held by decision makers can exert a decisive influence on the final decision outcome [16,17,18,19]. In view of this, the present study adopts the perspective of the decision maker, incorporating their risk attitude toward incomplete information and their assessment of the importance of various decision indicators into the decision making process for deep foundation pit support schemes. Accordingly, a decision making method for deep foundation pit support schemes based on prospect–evidence theory under incomplete information conditions is proposed.
The remainder of this paper is structured as follows. Section 2 provides a review of the related literature. Some relevant concepts of evidence theory and prospect theory are briefly introduced in Section 3. The basic model and some related notations are introduced for the matching problem in Section 4. Section 5 proposes a decision making method for supporting schemes for deep foundation pits. An illustrative example is offered in Section 6 to show the utility and effectiveness of the method. Finally, Section 7 summarizes this paper and proposes some suggestions about future work.
2. Literature Review
This paper is related to the following two streams of the literature: (1) the development and application of evidence theory; and (2) the application of prospect theory in decision making.
Evidence theory is an imprecise reasoning theory that extends the basic event space of probability theory to the power set, referred to as the frame of discernment, and constructs a basic probability assignment (BPA) function on this basis [20]. On the one hand, it can more accurately represent subjective uncertain information; on the other hand, it can fuse evidence in the absence of prior information, thereby reducing the uncertainty in alternative selection. Current research on evidence theory primarily focuses on two aspects. The first is the determination of the BPA function: for example, Di et al. calculated the membership degrees of different evaluation grades based on cloud models and constructed BPA functions (mass functions) for different attributes of alternatives from different experts [21]; Xia et al. defined belief entropy as a measure of the uncertainty contained in each piece of evidence [22]. The second is evidence fusion and correction: for example, Shen et al. noted that the Dempster combination rule tends to produce results that contradict reality when handling highly conflicting evidence, and adopted the proportional conflict redistribution rule to define an improved evidence combination formula [23]; Li and Xiao proposed a conflicting evidence combination method based on an improved distance function and Tsallis entropy, taking into account the influence of the amount of evidential information and the differences among evidence on information fusion [24].
In order to reduce the complexity of information fusion computation, Bauer proposed a D1-algorithm and empirically demonstrated that the algorithm can effectively reduce the computational complexity of evidence theory [25]. Kreinovich et al. attempted to use Monte Carlo methods to reduce the computational complexity of evidence theory [26]. Jousselme et al. establish approximation rules by calculating the distance between the original reliability function and the approximate reliability function, and compare the effectiveness of this approximation algorithm with Monte Carlo methods [27]. Haenni and Lehmann proposed a Dempster–Shafer confidence function approximation method based on the concept of Incomplete Belief Potentials, which provides a good solution for reducing the computational complexity of evidence theory [28].
In terms of application, evidence theory is currently mainly used in fields such as expert systems, information fusion, risk assessment, and multi-attribute decision analysis. Representative achievements include the pig disease diagnosis expert system developed by Xu [29]; foreign exchange trading expert system based on rule-based evidence reasoning [30]; an interpretable classifier developed using D-S evidence theory [31]; risk assessment of subway deep foundation pit construction based on evidence-based reasoning algorithm [32]; risk assessment of ship collision based on evidence theory [33]; tunnel fire detection method based on improved evidence theory [34]; fused decision rules of multi-intuitionistic fuzzy information systems based on the D-S evidence theory and three-way decisions [35]; multi-attribute group decision -making based on evidence theory [36], etc.
In the previous literature, when assigning probabilities to the focal points of various evaluation indicators, a predetermined evaluation level vector was usually used as a reference point, and it was assumed that the utility values corresponding to each evaluation level were known. This is inconsistent with the decision making context of deep foundation pit support schemes. A feasible deep excavation support plan must be obtained within the target framework expected by the owner. In other words, when selecting a support plan, the contractor should not only consider their own factors, but more importantly, meet the owner’s expectations for the project. Otherwise, it will be difficult to gain the owner’s approval.
Prospect theory was first proposed by Kahneman and Tversky in 1979 as a descriptive paradigm decision model, which describes the behavior exhibited by people in the process of making risky decisions [37]. This behavior is inconsistent with traditional expected value theory and expected utility theory; that is, they become risk-seeking when faced with “loss” but risk-averse when faced with “gain”. Among them, the establishment and changes in reference points affect people’s feelings of gain and loss, and thus affect their decision making. In recent years, research on multi-attribute decision making methods based on prospect theory has achieved significant results. For example, Arcangelo et al. proposed a multi-attribute decision making method based on risk benefit ratio and prospect theory to address the issue of expected utility theory not considering the irrationality of decision maker in actual decision making [17]. Wu et al. addressed mixed multi-attribute decision making problems with decision objectives, taking into account the psychological behavior of ddecision makers [18]. Using the decision objectives as a reference level, they standardized the exact number, interval number, and linguistic variables, provided a benefit-loss decision matrix, and evaluated each option. Neslihan et al. established a profit matrix and loss matrix based on the decision objective for multi-attribute decision making problems where both attribute values and probabilities are interval numbers. They ranked the solutions by calculating their prospect values according to prospect theory [19]. Although many scholars have combined evidence theory with prospect theory to address multi-attribute decision making (MADM) problems—for instance, Xiaohui et al. [38] proposed a prospect theory-based evidential reasoning assessment method under a hesitant picture fuzzy linguistic sets (HPFLSs) environment. Ramisetty et al. [39] presented a decision support system based on a descriptive decision making model that attempts to resolve issues in the Dempster–Shafer theory (DST), such as basic probability assignment computation and conflicting evidence combination. Tiantian et al. [40] proposed an intuitionistic fuzzy decision method based on prospect theory and the evidential reasoning approach, targeting MADM problems in which the criterion values are intuitionistic fuzzy numbers and the attribute weight information is unknown; and Lili et al. [41] developed a multi-attribute group decision making method with multigranular unbalanced hesitant fuzzy linguistic term sets based on prospect theory and evidence theory—no research to date has conducted an in-depth investigation into the situation where decision information contains null values. That is, how the presence of null values in certain decision criteria differentially affects the decision results remains a research gap. Furthermore, in the context of deep foundation pit support scheme decision making, what impacts would decision makers’ different risk attitudes and their different weight assignments to the evaluation criteria have on the selection of the optimal support scheme? These questions are addressed by the present study. Compared with existing decision models, the decision method proposed in this study exhibits the following distinctive features:
First, this method allows for decision situation that some attribute evaluation values are “null”, and does not need to interpolate the “null” with an accurate number, fuzzy number, interval number or probability distribution, and does not necessarily simply discard the decision attribute with “null”, which reflects that this method has better decision adaptability.
Second, the degree of information incompleteness, that is, the number of “null values”, can be intuitively reflected in the decision results, which reflects that this method has better information fidelity and model interpretability.
Moreover, this method integrates behavioral factors such as the target expectation and risk attitude of the decision maker into the decision making process and can objectively reflect the influence of these factors on the decision making results through sensitivity analysis so as to provide a basis for the decision maker to select the decision making results more rationally.
3. Preliminaries
This section introduces some basic concepts about the evidence theory and prospect theory.
3.1. Evidence Theory
Evidence theory is a theoretical framework that integrates multi-source evidence information for decision making. The core idea of this model is rooted in the uncertainty underlying the development and evolution of events. By extending traditional Bayesian probability, it introduces a basic probability assignment (BPA) function—also referred to as the belief function—which can more accurately represent incomplete information and subjective uncertainty [20].
Definition 1.
For any decision problem, let all possible outcomes be represented as a set ; that is, is a non-empty finite set and the elements are mutually exclusive; then is called the recognition framework. is a power set of , representing all possible sets in , and there are elements in it, which can be represented as . If there is a set function ( is a power set of ) satisfies and , then m is said to be the basic probability assignment on the recognition framework, where A is called the focal element; , is called the basic probability assignment value of A (Abbreviated as BPA), that is to say, the degree to which evidence supports the occurrence of event A.
Definition 2.
If is the recognition framework and
is any subset of the recognition framework, denoted as , and satisfies , , then
is called the reliability function of , representing the degree of trust in evidence for
being true;
is called the similarity of , indicating the degree to which
is not denied.
Definition 3.
Assuming and
are two basic reliability allocation functions on the same recognition framework, the Dempster evidence fusion rule is defined as follows:
Among them, K is the conflict coefficient, representing the degree of conflict between m1 and m2, and . When K = 0, it indicates that there is no conflict between m1 and m2; When K = 1, it indicates a complete conflict between m1 and m2.
3.2. Prospect Theory
Prospect theory was proposed by Kahneman and Tversky based on the bounded rationality hypothesis [37]. Its core idea is that decision makers have a reference dependence on the judgment of gains and losses when making scheme choices; that is, there are different risk attitudes in the face of gains or losses. It is expressed as follows using a value function:
where implies gain, implies loss, and are the risk preference coefficients that satisfy and ; the higher the value of and , the more likely the decision makers are to take risks. is the loss aversion coefficient, and means the decision makers are sensitive to the risk of loss. The higher the value of , the more risk-averse when decision makers facing losses.
4. Problem Description
In this section, we describe the problem of decision making for supporting schemes for deep foundation pits. The representations of parameters and variables in this problem are defined.
4.1. Description of the Problem
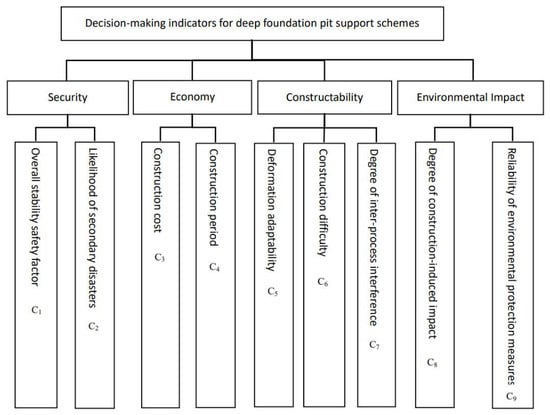
Based on previous research findings [1,2,3,4,5,6,7,8,9], the decision making for deep foundation pit support schemes is generally evaluated from four dimensions: security, economy, constructability, and environmental impact. However, the criteria adopted in the existing literature are of engineering reference value only; they cannot directly guarantee mutual independence among criteria. Therefore, the correlation among criteria must be fully considered during the selection process: strongly coupled and highly redundant criteria can significantly undermine the credibility of decision results. To this end, on the basis of previous research findings, this study further conducts an engineering-mechanism-level identification and discrimination from the perspectives of the physical connotations of criteria [42,43], the objects of risk characterization, and the sources of information acquisition, with the aim of eliminating those strongly redundant criteria whose physical meanings substantially overlap or whose risk-driving mechanisms share the same origin. After screening, nine decision criteria are obtained, which are described in detail as follows:
Security. Security is typically the primary factor considered by decision makers, as any scheme that lacks adequate security guarantees cannot be selected as the optimal solution, regardless of its superiority in other aspects. According to the relevant provisions on foundation pit support security in the Technical Specification for Building Foundation Pit Support (JGJ 120-2012), the security of a scheme is primarily evaluated by its overall stability and the potential secondary disasters that may result from its failure [44]. Secondary disasters include but are not limited to casualties, cracking of buildings adjacent to the foundation pit, and road subsidence. For simplicity, this paper evaluates the security of alternative schemes using two indicators: the overall stability safety factor (C1) and the likelihood of secondary disasters resulting from scheme failure (C2).
Economy. Economy refers to the total cost of a support scheme over its entire lifecycle, from implementation to demolition. This total cost is not only related to direct construction costs but also closely linked to the construction duration of the support scheme. Generally, a longer construction period corresponds to poorer economic performance, while a shorter construction period yields better economic performance. Therefore, this paper selects two indicators—construction cost (C3) and construction period (C4)—to characterize the economic performance of each alternative scheme.
Constructability. Constructability refers to the ease with which a support scheme can be implemented. A scheme with good constructability generally involves fewer construction procedures and simpler techniques, with minimal interference or cross-operations among different processes during construction. In addition, according to the Technical Specification for Building Foundation Pit Support (JGJ 120-2012) [44], foundation pit excavation should follow the principle of “layered excavation, with support installed prior to excavation of the next layer.” A scheme with good constructability typically involves fewer excavation layers and relatively greater thickness per layer, exhibiting better deformation adaptability. Therefore, this paper selects three indicators to measure the constructability of each alternative scheme: the deformation adaptability of the scheme (C5), the difficulty of construction (C6), and the degree of mutual interference among construction processes (C7).
Environmental impact. Environmental impact primarily concerns the degree of disruption that the implementation of a support scheme imposes on the surrounding environment, including noise and dust during construction, as well as traffic-related effects on residents’ daily travel. Excavation support is a temporary engineering work. From the decision maker’s perspective, it is undesirable for such temporary works to have a significant impact on the surrounding environment; where impacts are unavoidable, more reliable environmental protection measures are expected to minimize their extent. Therefore, the degree of environmental impact caused by construction (C8) and the reliability of environmental protection measures (C9) are selected as two indicators to measure the environmental impact of each alternative scheme.
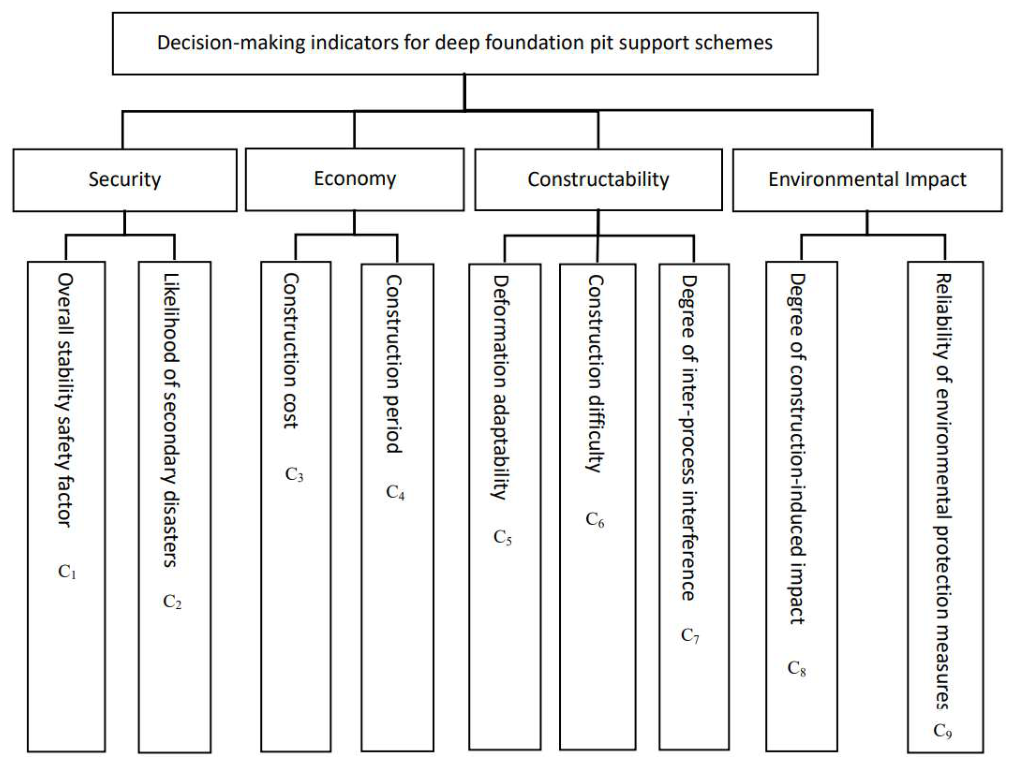
Based on the above description, a decision making indicator system for deep foundation pit support schemes is constructed as shown in Figure 1.
Figure 1.
Decision making index system for risk control scheme.
4.2. Notations
The following notations are used throughout this paper for the decision making problem of deep foundation pit support schemes:
—Evaluated value of the i-th alternative under the j-th decision indicator, where i = 1, 2, …, t and j = 1, 2, …, n; t denotes the number of alternative schemes, and n denotes the number of decision indicators; according to Figure 1, n = 9;
—The decision maker’s expectation (or target value) for the j-th decision indicator;
—The distance between the evaluated value of the j-th indicator for alternative i and the decision maker’s expectation for the j-th decision indicator;
—Benefit-based and cost-based decision indicators, respectively;
—Weights of the decision indicators, satisfying: , .
5. A Decision Making Model for Selecting Support Schemes
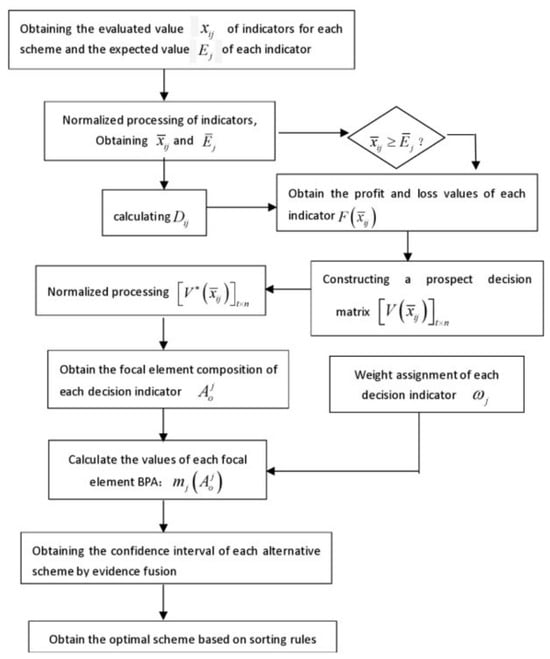
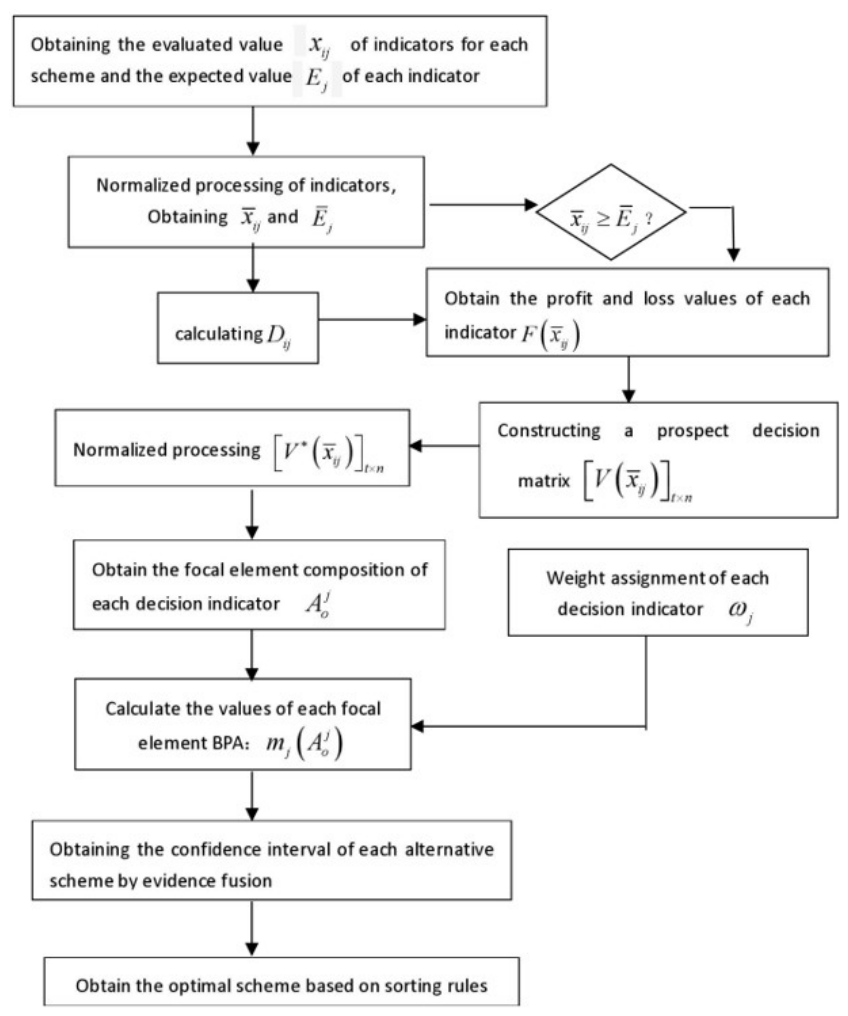
The framework of the proposed decision making process for support scheme selection is illustrated in Figure 2.
Figure 2.
The framework of the decision making method.
5.1. Formal Transformation and Normalization of Indicators
As shown in Figure 1, some decision indicators are quantitative indicators expressible as precise values or interval numbers—such as construction cost and construction duration—while others are qualitative indicators describable only through linguistic terms—such as the difficulty of construction and the degree of environmental impact from construction. Therefore, the decision making for deep foundation pit support schemes constitutes a hybrid multi-attribute decision making problem. To uniformly represent the uncertainty inherent in different types of indicator values and to facilitate their synthesis, this paper first transforms the initial values of mixed-type indicators into the form of interval numbers as follows.
Let the indicator value denote the evaluation value of the j-th decision indicator for the i-th scheme, and let denote the decision maker’s expectation for the j-th decision indicator. Without loss of generality, we assume that , , where , and is the total number of schemes; j = 1, 2, …, n and n is the total number of decision indicators.
(1) When and are precise values, suppose that and ; that is, the interval number forms of and are and , respectively, where U and L denote the upper and lower boundaries of the interval number, respectively.
(2) When and are interval numbers, their interval number forms remain unchanged, i.e., and , respectively, and there are and .
(3) When and are linguistic variables, it is assumed that the linguistic variable takes values in a predefined linguistic term set S, i.e., , where denotes the (f + 1)-th linguistic term in S, T is a positive even number, and S contains T + 1 elements in total. For example, when T = 6, corresponds to the seven linguistic terms “very low,” “low,” “relatively low,” “medium,” “relatively high,” “high,” and “very high,” respectively. S is ordered in nature, that is, when f > g and , indicating that the state is superior to the state . Then and are converted into interval numbers as and , respectively, where and denote the state ordinals of the linguistic variables and , respectively.
In addition, in a hybrid multi-attribute decision making problem, indicator attributes can be further categorized into benefit type and cost type, denoted as CB and CC, respectively; for the benefit type, larger attribute values are preferable, whereas for the cost type, smaller attribute values are preferable. Therefore, to eliminate the influence of different physical dimensions on the decision results, the transformed and must be further normalized using the following method:
Suppose that , , then the normalization formula is:
The data normalization process yields the scenario decision matrix , and the expected vector .
5.2. Constructing Prospective Decision Matrix
According to the principle of prospect theory, the decision maker calculates the distance between the evaluated value of the indicators of each case and the reference point to obtain the profit and loss value of each indicator and uses this as the basis to establish the prospect decision matrix . It should be noted that multiple methods exist for measuring the distance between interval numbers, such as the Euclidean distance method, the Hausdorff distance method, the interval center-based distance method, and the interval intersection-based similarity distance method. Different methods emphasize different dimensional characteristics of intervals, and no universally optimal method exists. In this study, the positive or negative sign of an indicator’s gain or loss is independently determined by the interval center-width (S-K) ranking criterion [45], and the distance measure is used solely to quantify the gain–loss magnitude of the evaluated interval relative to the reference-point interval (i.e., the overall degree of deviation). The Hausdorff distance considers only the maximum deviation of interval boundaries and tends to lose the offset information of the other boundary; the interval center-based distance method ignores the uncertainty represented by the interval width; and the interval intersection-based similarity distance method captures only the topological relationship of interval intersection on a one-dimensional number axis, failing to reflect the numerical deviation of interval boundaries. Interval overlap or separation is merely a geometric topological property of intervals and is not used as a basis for judging the magnitude of gain or loss in this model. Therefore, this paper adopts the standardized Euclidean distance method to calculate the distance between each alternative’s indicator values and the reference point, with the specific steps as follows:
(1) Comparing the sizes of and
Suppose that
According to [45], when , if , then ; if , then . When , if , then ; if , then , if , then .
Calculate the distance between the evaluated value of indicator and the desired value of indicator for each alternative:
Based on the relationship between the magnitudes of and , the gain or loss value of each indicator relative to the reference point was obtained.
Here, when , is the gain of indicator value relative to expected value . When , is the loss of indicator value relative to the expected value . Considering that decision makers do not have the same risk attitudes towards gains and losses, a prospective decision matrix is created, where denotes the prospective value of the j-th indicator for the i-th scenario, which is calculated as follows:
where the parameters α and β indicate the degrees of concavity and convexity of the prospect value function V, respectively. That is, the decision maker exhibits a concave function in the face of gains, reflecting risk aversion, and a convex function in the face of losses, reflecting risk preference; 0 < α < 1 and 0 < β < 1. The parameter θ indicates the degree of the decision maker’s loss aversion, θ > 1; a larger value of θ implies a stronger degree of risk aversion in the face of losses. According to Birnbaum [46] and He [47], the values α = β = 0.88 and θ = 2.25 can effectively characterize the behavioral preference characteristics of the majority of decision makers; therefore, this paper adopts these suggested values in the subsequent case study.
5.3. Determine the Focal Element Composition of Each Indicator
From the prospect decision matrix, the prospect value represents the decision maker’s perceived utility of option i on indicator j at a given level of expectation: , perceived as a gain, , perceived as a loss. Obviously, the larger the prospective value is, the greater the likelihood (probability distribution value) that the decision maker will choose option i under indicator j. Therefore, if the probability distribution value of a solution under a certain indicator is regarded as a piece of evidence, the credibility of the solution to be the optimal solution can be obtained through evidence synthesis. On this basis, the decision on the optimal solution can be achieved by comparing the size of the credibility of each solution. The specific steps are as follows:
(1) Normalizing the prospect decision matrix
Currently, the most commonly used normalization method is the Max–Min method. However, this method transforms the minimum prospect value in each indicator column into zero during normalization, thereby failing to effectively distinguish it from the case where the indicator value is unknown. Taking indicator from the case study in Section 6 as an example, if the Max–Min method is adopted, the normalized column vector for this indicator is , meaning that the prospect value of alternative under indicator is normalized to 0. In the subsequent calculation of the BPA for each focal element, a zero value plays no role in the computation and cannot be effectively distinguished from a null value. Therefore, this paper adopts a Logistic normalization method to standardize the prospect decision matrix:
Let is the prospect decision matrix after normalization.
Obviously, falls into the interval (0,1). Larger prospect values (gain situation) produce higher output values indicating stronger evidence support, while smaller prospect values (loss situation) yield values close to zero for weak support.
(2) Determine the focal element composition of each decision indicator
Due to the influence of incomplete information, the decision maker cannot provide the indicator evaluation values for certain alternatives, thereby resulting in a normalized prospect decision matrix that is an incomplete judgment matrix, where null values are denoted by #.
Setting the set of all alternatives as a recognition framework, and defining that for , , and , then and belong to the same focal element if holds.
From this, the composition of the focal elements under each decision indicator can be determined as (; , ).
(3) Calculation of BPA for each focal element
Given that the weight of each decision indicator is and satisfies , , then the basic probability assignment value of the focal element under each decision indicator is:
It should be noted that denotes the basic probability assignment considering the weight of each criterion, whereas represents the basic probability assignment without considering criterion weights. Obviously, satisfies the requirements of Definition 1.
Due to the complexity of objective phenomena and the limitations of human cognition, the sum of the basic probability assignment values for the focal elements under each decision indicator obtained above is less than 1, i.e., , which indicates that there is an overall uncertainty of recognition. In this paper, this part of the basic probability assigned value is assigned to the recognition framework itself, indicating the degree of support for all the support options, and is involved in the evidence fusion calculation, in order to make full use of the information obtained and reduce the uncertainty in the decision making process.
5.4. Determination of Confidence Intervals for Each Option
The probability assignment values of the focal elements under the individual decision indicators are obtained through the above steps, followed by evidence synthesis to determine the probability assignment values of each focal element under the composite indicator, which in turn calculates the confidence intervals of the alternatives. According to Definition 3, multiple basic probability assignment values are synthesized into a single probability assignment value using Dempster’s law of evidence synthesis, calculated as:
where denotes the degree of conflict between the individual pieces of evidence; the larger the value of K, the greater the degree of conflict between the pieces of evidence.
Further, according to Definition 2, the trust level and likelihood of truth of each alternative () are determined to be, respectively:
Then the confidence interval of the alternative consisting of and is .
5.5. Determination of the Optimal Support Scheme
The belief interval of each alternative reflects the degree of belief that the alternative is the optimal scheme; therefore, the optimal scheme can be identified by comparing the belief intervals of all alternatives, as follows:
For if the belief intervals of and are , and , respectively, the degree to which is superior to is:
, , and the ranking rules of alternatives are as follows:
(1) If , then alternative is superior to , denoted ;
(2) If , then alternative is inferior to , denoted ;
(3) If , then alternatives and are indifferent to each other, denoted as ;
(4) For any three alternatives, e.g., , and , if and , then alternative is superior to , denoted as . Accordingly, a complete ranking of all support schemes () is obtained, in which the top-ranked scheme is the optimal support scheme.
6. Example Illustration
This section presents an example to demonstrate the decision making method proposed by this paper. Furthermore, we compare our decision making method with the traditional approach to show the difference.
6.1. Project Overview and Description of Dangerous Conditions
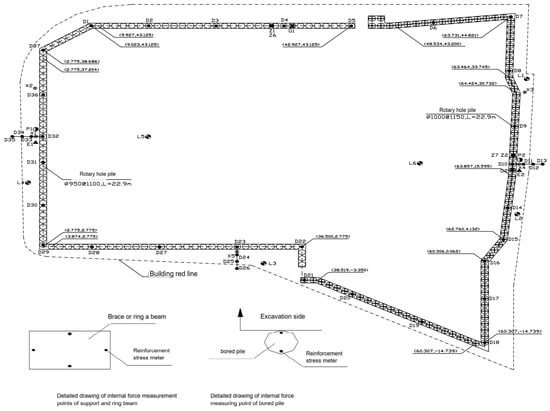
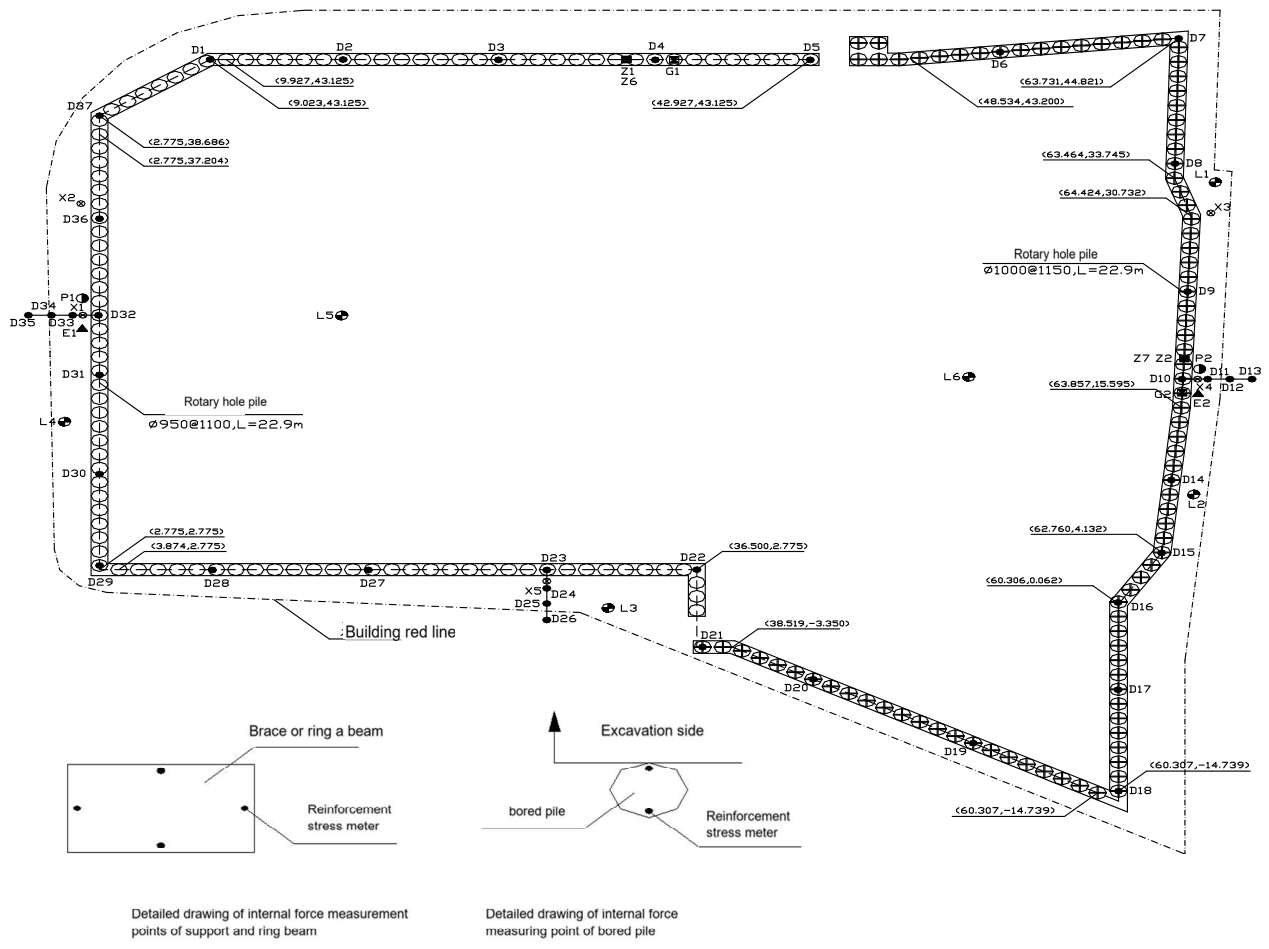
A large-scale high-rise commercial building deep foundation pit project in Shanghai is located in the old city where the surrounding commercial bustle, road congestion, and various underground pipelines are intertwined to ensure the safety of the construction of the project has greater difficulties. The enclosure structure adopted a system of drilled pile retaining walls and soil mixing pile walls to stop water. The design pit was 10.0 m deep, with two horizontal supports. The first horizontal support is reinforced concrete support, the section size of east–west and north–south buttresses is 1000 × 700 mm, the axis position is 1.5 m from the ground surface, and the enclosing cofferdam section size is 1200 × 800 mm; the second horizontal support is designed as Φ 609 × 16 mm steel pipe support, the axis position is 7.15 m from the ground surface, the enclosing cofferdam is still a reinforced concrete enclosing cofferdam with a section size of 1500 × 800 mm; the columns are 4L140 steel lattice frames in part above the pit bottom and bored piles below the pit bottom. The local pit bottom stratum was reinforced with a 4500 mm deep soil mixing pile wall, and the reinforcement zone was close to the enclosure structure and 4200 mm wide. The engineered piles had a reinforcing effect on the remaining part of the pit bottom soil. The pit construction monitoring layout is illustrated in Figure 3.
Figure 3.
Monitoring layout of deep excavation construction in a large commercial building.
During excavation, large settlement displacements (18 mm and 32 mm, respectively) occurred at the bored piles on the east side of the pit and 12.5 m away from the pit circumference, which exceeded the risk warning value. The reason for analyzing this project is that the deep wells used for the drainage of the pit caused the groundwater level outside the pit to drop, which led to significant solidification and settlement of the strata. Subsequently, several days of heavy rain caused the settlement of large cracks and a certain amount of water, resulting in the water seepage phenomenon. In view of the above dangerous situation, the following three risk control schemes can be adopted: two-fluid grouting to stop water + Φ 1000@800 bored pile(), high-pressure rotary piling to stop water+ Φ 500@1200 steel pipe (), and freezing method to stop water + Φ 1000@800 bored pipe (), two-fluid grouting to stop water + Φ 800@1000 steel pipe ().
6.2. Decision Making of Scheme
After the danger occurred, the project department quickly set up an expert group together with the owner, designer, supervisor, and other units, according to the decision making index system of the deep foundation pit construction risk control scheme shown in Figure 1, the evaluation results of which are listed in Table 1.
Table 1.
Evaluating values of the decision index of four supporting schemes.
When the expert group makes a decision, it not only evaluates the indicators of each scheme but also gives the expectation value of each decision indicator by taking into account the characteristics of the dangerous situation, construction conditions, and other factors. Only these expectations are often reflected through the way of giving instructions, setting targets and so on. For this dangerous situation, the expert group provides the expectation vector of indicators E = {1.8, relatively low, [6.0, 8.0], [180, 240], relatively high, relatively low, relatively low, relatively low, relatively high}. Meanwhile, the weights W = {0.15, 0.09, 0.2, 0.14, 0.2, 0.05, 0.04, 0.06, 0.07} of each decision indicator were obtained by applying hierarchical analysis. Furthermore, the initial values of the indicators and the expected values of the indicators for each scheme were normalized according to Equations (4) and (5). The decision matrices of the processed schemes are listed in Table 2.
Table 2.
Scheme decision matrix for the normalized processing.
The normalized indicator expectation vector {[0.57, 0.57], [0, 0.50], [0.64, 1], [0.33, 1], [0, 0.50], [0.33, 0.67], [0, 0.33], [0.33, 0.67], [0, 0.50]}.
The prospective decision matrix of the options is obtained using Equations (6)–(13), as listed in Table 3.
Table 3.
Prospect decision matrix.
According to Definition 2, the same perspective values under an indicator are combined into the same focal element, and Equations (14)–(16) are applied to calculate the basic probability assignment values of Joules contained in each indicator. The results are presented in Table 4.
Table 4.
The composition of focal elements and their basic probability allocation values for each indicator.
Using Equations (17)–(19) for evidence synthesis, the confidence interval of each scheme is scheme [0.036, 0.501]; scheme [0.089, 0.489]; scheme [0.105, 0.513]; and scheme [0.104, 0.532]. From the scheme sorting rule, it can be observed that ; that is, adopting two-fluid grouting to stop water +Φ800@1000 steel pile is the most optimal risk control scheme.
Based on the above decision results, after the construction of steel pipe piles on the foundation pit sidewall on site, two types of solutions—cement grout solution and sodium silicate (water glass) solution—were injected into the soil at that location. Utilizing the rapid-setting characteristic of the cement–sodium silicate double-fluid grout, the grout was injected under high pressure into the gaps between piles and the surrounding soil to completely seal off the seepage channels, thereby consolidating the soil around the foundation pit to form a composite foundation and a water-sealing curtain. The grouting parameters were as follows:
(1) Hole layout: Quincunx-pattern grouting holes were arranged near the leakage points with a spacing of 0.5 m; the grouting area was 5.5 m × 30 m. Grouting depth: The grouting was applied from 4.8 m below the ground surface in a single pass.
(2) Grouting pressure: 0.1–0.8 MPa; Grouting volume: as specified by the design, it shall not be less than 10–12% of the soil volume.
(3) Grout mix ratio: water: cement: sodium silicate = 1:1:0.6.
In fact, after adopting the above risk control scheme, the risks of this project were effectively controlled, and cracks, water leakage, and settlement no longer occurred, which fully demonstrates that the decision method proposed in this paper is feasible.
6.3. Impact of Incomplete Information on Programmatic Decision Making
To further analyze the impact of incomplete information on scheme decision making, a known indicator evaluation value in Table 1 is now replaced with unknown information to examine the resulting changes in the belief intervals of the alternatives. Due to space limitations, this paper takes the deformation adaptability of alternative as an illustrative example. Assuming that the decision maker’s evaluation of the deformation adaptability of alternative is unknown while all other conditions remain unchanged, the belief intervals of the alternatives are recalculated using the proposed method as follows: alternative [0.036, 0.501]; alternative [0.138, 0.499]; alternative [0.095, 0.465]; and alternative [0.104, 0.532]. According to the ranking rule, . From the calculation results, it is readily observed that when the deformation adaptability of alternative changes from known to unknown, the belief degree of alternative decreases, that of alternative increases, and that of alternative and remains unchanged. The underlying reason is as follows: when the indicator value changes from known to unknown, the focal element composition of indicator and its probability assignment values undergo a redistribution, with = 0.112, = 0.088, and = 0.8. Evidently, after the change, becomes a separate focal element participating in the basic probability assignment, and the degree of evidential support it receives (0.088) is identical to that of before the change (0.088). In other words, when the indicator value changes from known to unknown, the evidence that originally supported alternative now supports only alternative this is the primary reason for the increase in the belief degree of alternative and the decrease in that of alternative . Furthermore, in terms of the probability assignment values, the probability supporting alternative and the probability supporting the frame of discernment remain unchanged before and after the information change; this result also explains why, when the indicator value changes from known to unknown, only the belief interval of alternative and change while that of alternative and remain unchanged.
6.4. Influence of Indicator Weights on Decision Results
From the decision maker’s perspective, this paper directly assigns the weights of each decision indicator by the decision maker, which is a typical subjective weighting method. Such methods are often criticized by many researchers [48,49,50,51,52,53,54] for being susceptible to excessive influence from subjective factors in weight assignment. Next, this paper investigates the impact of indicator weights on decision results from two aspects: the comparison between subjective and objective weighting methods, and the sensitivity of indicator weights:
6.4.1. Impact of Subjective and Objective Weighting Methods
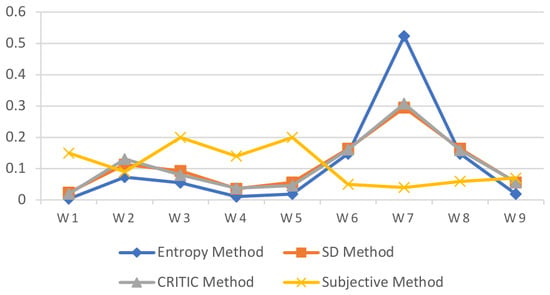
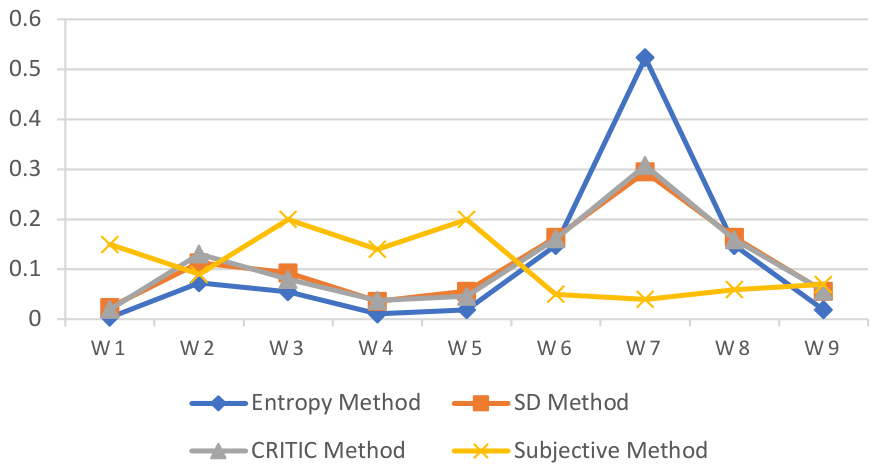
This paper selects three objective weighting methods—the Entropy Method, the Standard Deviation (SD) Method, and the Criteria Importance Through Intercriteria Correlation (CRITIC) Method—and compares their results with those obtained from the subjective weighting method. The weighting procedures of the Entropy Method can be found in references [55,56,57], the SD Method in reference [58], and the CRITIC Method in reference [59]. It is worth noting that because objective weighting methods do not permit null values among the evaluation indicators, the missing indicator values must be assigned before performing objective weighting. Assuming , ‘relatively low’, ‘relatively high’, other indicator values are shown in Table 1, obtain the weight values of indicators under different weighting methods, as shown in Figure 4.
Figure 4.
Comparison of index weights under different weighting methods.
In the case where the evaluation information of each indicator is known, the decision results obtained by using the objective weighting method and subjective weighting method are shown in Table 5.
Table 5.
Comparative analysis of decision making results obtained by different weighting methods.
From Figure 4 and Table 5, it can be seen that the weight values of the indicators obtained by different weighting methods are also different from each other. If the weight values of each indicator are sorted in order of magnitude, the order of magnitude of the indicator weights obtained by the three objective weighting methods is relatively consistent. Especially, the similarity of the indicator weight values obtained by the SD method and the CRITIC method is high. The reason is that objective weighting methods usually measure the degree of influence of each attribute indicator on the decision results based on the degree of difference or correlation between sample data. The greater the degree of influence, the greater the weight value, and vice versa. On the other hand, there are significant differences between subjective weighting values and the three objective weighting results. This is mainly because subjective weighting values are more influenced by decision makers’ risk attitudes and preferences for decision attributes, rather than the differences in the data itself. This is also the main reason why subjective weighting methods have been criticized by researchers. However, it cannot be arbitrarily assumed that objective weighting is superior to subjective weighting, as any decision that can be implemented must first be adopted by the decision maker, and objective weighting that completely ignores subjective factors may not necessarily be the result that the decision maker wants to see. As for how to find a more effective balance between the two, it is no longer within the scope of this article. Interested readers can refer to literature such as [57,58,59].
6.4.2. Sensitivity of Indicator Weights
To investigate the degree to which fluctuations in each indicator weight affect the evaluation results of the support schemes, this paper employs a single-factor weight sensitivity analysis, i.e., keeping the weights of the remaining eight indicators unchanged, selecting the j-th indicator in turn, and perturbing its weight within the range of −100% to +100%. After each weight update, the comprehensive evaluation values of all alternatives are recalculated, yielding a series of evaluation rankings that vary with the weight. The position variance is used to quantify the difference in the evaluation rankings before and after the perturbation; a larger position variance indicates that the change in the indicator weight causes a greater disturbance to the final decision result, meaning the indicator is more sensitive, and vice versa. The impact of each indicator weight fluctuation on the decision results is shown in Table 6, where 0 indicates no change in ranking; 0.5 and 1 indicate changes in alternative rankings, with larger values representing greater degrees of ranking change caused by the perturbation.
Table 6.
Sensitivity analysis of indicator weights.
As shown by the weight sensitivity analysis results in Table 6, the nine evaluation indicators exhibit significant differences in their impact on the decision results for deep foundation pit support schemes. Indicator is a highly sensitive indicator; a decrease in its weight can readily alter the preference ranking of the alternatives, making it the core indicator affecting the decision results. Indicators and are moderately sensitive, perturbing the decision results only when their weights are significantly increased. Indicators , , and are weakly sensitive, causing ranking changes only under extreme weight perturbation scenarios. Indicators , , and are non-sensitive indicators; the evaluation rankings of the alternatives remain unchanged under wide weight fluctuations ranging from −100% to +100%. This indicates that in the decision making for this project, particular attention should be paid to ensuring the accuracy of the weight assigned to the highly sensitive indicator , while for the non-sensitive indicators , , and , minor deviations in their weights will not alter the final scheme selection.
6.5. Influence of Decision Makers’ Risk Attitudes on Decision Results
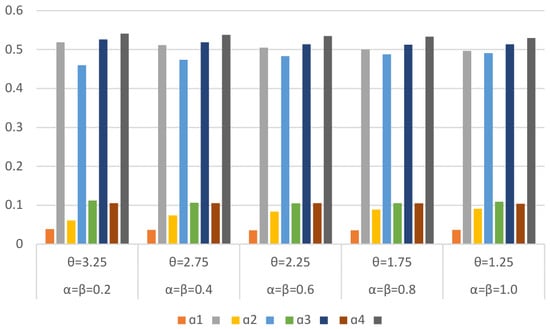
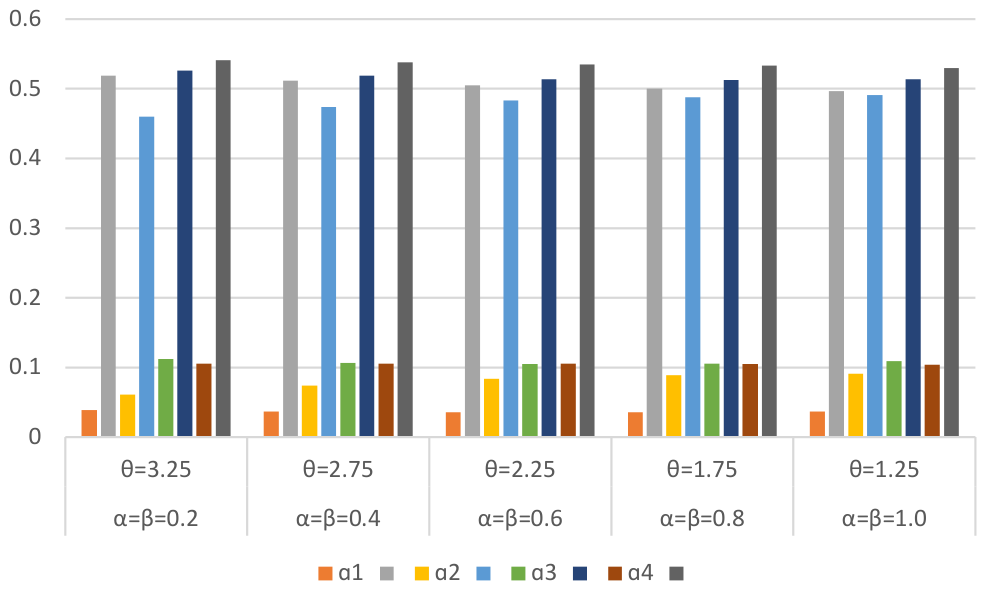
The influence of decision makers’ risk attitude on decision making results is mainly reflected in the values of parameters such as , and . Among them, indicates the decision maker’s degree of loss aversion; when > 1, the larger is, the greater the degree of risk aversion of the decision maker in the face of the loss. and are risk attitude factors, and the larger the value, the greater it means that the decision maker’s degree of risk preference. For the convenience of analysis, this paper takes .
As can be seen in Figure 5, the decision maker’s risk attitude affects the confidence intervals of the four schemes to a comparable degree, and there are no instances of significant changes in the confidence intervals of a scheme due to changes in the decision maker’s risk attitude. However, in terms of the ranking of the four schemes, when the decision maker’s risk attitude factor or 0.4 and the corresponding risk aversion factor or 2.75, is superior to ; apart from that, is superior to . However, regardless of the change in the decision maker’s risk attitude, is the optimal option. In other words, in the decision situation of this case, the decision maker’s risk attitude has no effect on the choice of the optimal decision.
Figure 5.
Influence of decision makers’ risk attitude on the belief interval of four schemes.
6.6. Comparison of This Paper’s Method with Traditional Methods
Apply the method proposed in this article to references [12,40,60], respectively. Among them, reference [12] is the application of a vector projection model based on complex operations of connection numbers (COCN) in the optimization of foundation pit support schemes; Reference [40] provides an example of using multi-attribute decision making methods to optimize liner shipping companies under an intuitionistic fuzzy environment (MADM: multi-attribute decision making under intuitionistic fuzzy environment); Reference [60] discusses the application of multi-objective decision making (MODM) methods in the optimization of precision agriculture data analysis platforms. The comparison between our method and traditional methods in three different application fields is shown in Table 7.
Table 7.
Comparative analysis of the method in this paper with methods in other references.
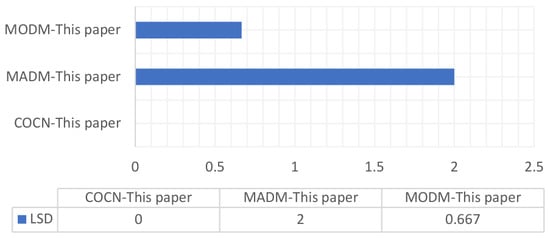
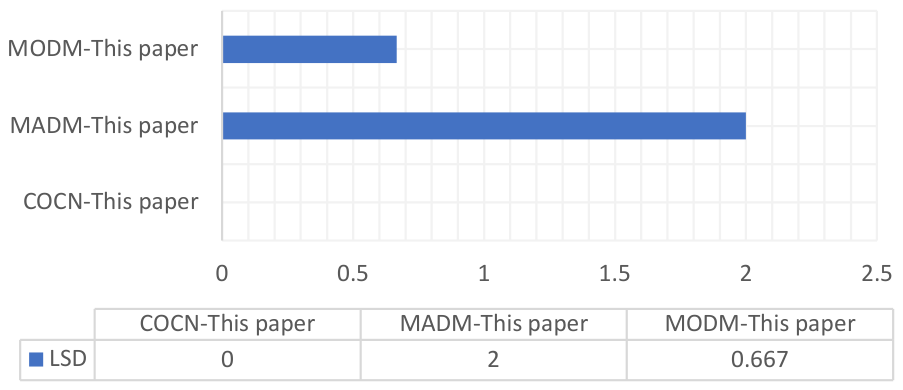
Table 7 shows that there are certain extent differences between the results obtained using our method and traditional methods in different application areas. These differences were quantified using the Location Square Deviation (LSD) method [61], as shown in Figure 6.
Figure 6.
Comparative analysis of the traditional method and this paper based on LSD.
From Figure 6, it can be seen that the bit variance between the method proposed in this paper and the results obtained in reference [12] is 0, indicating the best similarity between the two. The second highest is the bit variance of 0.667 with reference [60], followed by a bit variance of 2 with reference [40]. Does this mean that the method proposed in this article is not suitable for the optimal selection of shipping companies? This article further compares the results obtained by this method with those obtained by the other three methods listed in reference [40] and compares the computational results of the MADM method with these three methods, as shown in Table 8. Note: In order to illustrate the effectiveness and superiority of the proposed MADM method, this reference [40] lists three other methods (Wang’s method, Decision IFWA-based method, and Prospect IFWA-based method).
Table 8.
Comparative analysis of the method in this paper with other methods in reference [40].
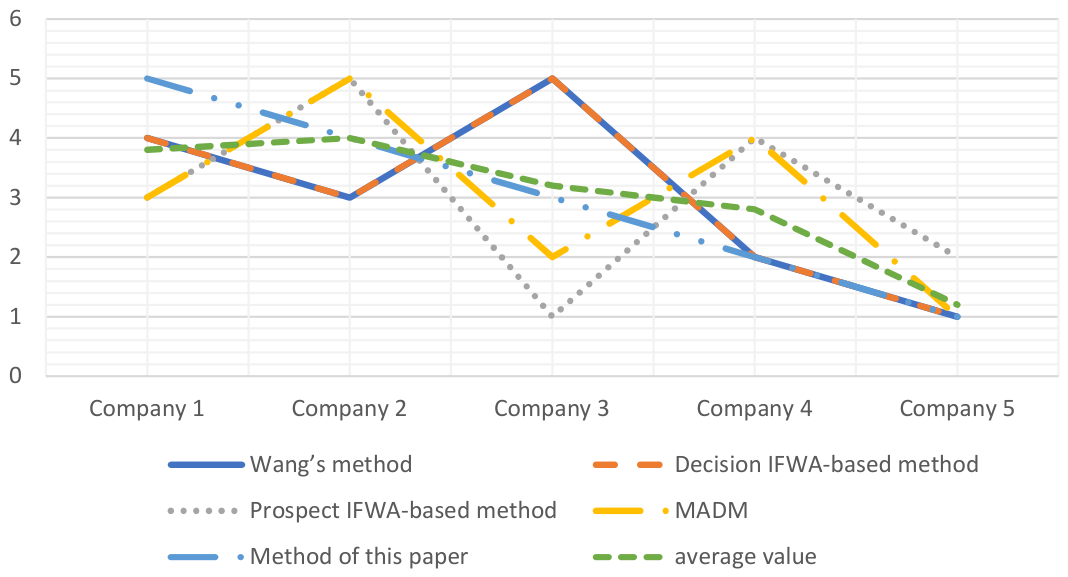
Table 8 shows that, except for the Prospect IFWA-based method, the other four methods can achieve the same results in making decisions for the optimal liner shipping company. This indicates that the method proposed in this paper is suitable for the optimization of liner shipping companies. More intuitively, the sorting results obtained by each method are represented by a line graph, as shown in Figure 7.
Figure 7.
Comparative analysis of the results in selection of liner shipping companies with different methods.
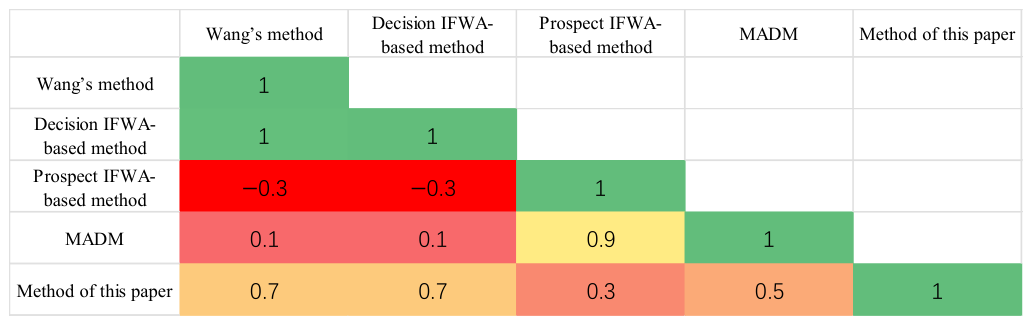
Figure 7 shows that the company ranking results obtained by the method proposed in this article have a consistent trend with the other four methods; that is, from the average ranking values of each company, the ranking values from company 1 to company 5 approximately decrease. Furthermore, the Pearson correlation coefficient of the ranking results of each method is calculated, as shown in Figure 8.
Figure 8.
Pearman correlation analysis of the results obtained using different methods.
In Figure 8, the color gradient from red to green represents Pearson correlation coefficients ranging from −1 to 1. Green denotes high positive correlation, red indicates negative correlation, and yellow/orange correspond to moderate and weak positive correlation. The number in each cell is the pairwise Pearson correlation coefficient. It can be seen that the correlation coefficients between the method proposed in this paper and the other four methods are all positive, with a minimum of 0.3. This indicates that the compatibility of the method proposed in this paper with other methods is good. In other words, the method proposed in this paper can not only be used alone for the optimization of shipping companies but also as a reference for use with other methods without considering the conflict between methods (in the case of negative Pearson coefficients).
7. Conclusions and Future Works
7.1. Conclusions
To address the phenomenon that the indicator evaluation values of certain schemes may be missing in the decision making of deep foundation pit support schemes and to enable rapid and reasonable decision making on risk control schemes when a deep foundation pit construction crisis occurs, this paper proposes a decision making method for deep foundation pit construction risk control schemes by combining prospect theory with evidence theory. This method further broadens and enriches the theoretical system and methods for the decision-making and implementation of risk control schemes in foundation pit support construction. The method is applied to a specific engineering example, and the following conclusions are obtained:
(1) Employing prospect theory for the decision making of deep foundation pit support schemes takes into account the owner’s expectations for the project, which is consistent with the actual decision making context of support scheme selection. Taking the owner’s expectation for each indicator as the reference point, the prospect decision matrix is established by measuring the distance between each alternative and the reference point; the prospect value of each indicator is then taken as evidence, and evidence theory is employed to synthesize the indicator evidence, yielding the belief interval of each alternative. The optimal scheme is subsequently identified according to the interval ranking rules. The case study demonstrates that the proposed method is feasible.
(2) When incomplete information changes, it causes the redistribution of the focal element composition of the corresponding indicator and its probability assignment values, which in turn exerts a certain impact on the decision of deep foundation pit support schemes. The example analysis shows that when the indicator value changes from known to unknown, the evidence originally supporting scheme becomes supportive of only scheme , which is the main reason for the increase in the belief degree of scheme and the decrease in that of scheme . In addition, in terms of the probability assignment values, the probability supporting scheme , as well as the probability supporting the frame of discernment , remains unchanged before and after the information change; this result explains why, when the indicator value changes from known to unknown, only the belief interval of scheme and change while that of scheme and remains unchanged. Therefore, collecting evaluation information of schemes through multiple channels and reducing the amount of unknown information is an important way to improve the credibility of the decision results.
(3) There are both subjective and objective weighting methods for decision indicators, and different weighting methods exert a certain impact on the final decision results. The example analysis shows that the indicator weights obtained by different weighting methods differ from one another. When the indicator weights are ranked by magnitude, the weights obtained by different objective weighting methods are relatively consistent in their ranking, yet differ considerably from the subjective weighting results. The reason is that objective weighting methods generally measure the influence of each attribute indicator on the decision results based on the degree of difference or correlation among the sample data: the greater the influence, the larger the weight value, and vice versa. In contrast, subjective weights are more influenced by the decision maker’s risk attitude and preference for decision attributes, and are independent of the differences inherent in the data themselves.
(4) Different risk attitudes of the decision maker lead to different belief intervals of the alternatives; however, this does not imply that a change in the decision maker’s risk attitude will necessarily alter the optimal decision result, and the case study in this paper serves as a good illustration of this point.
(5) The proposed method is applied to three different engineering fields, which verifies that it is not only applicable to the decision making of deep foundation pit support schemes but also to other multi-attribute decision-making contexts.
7.2. Limitations and Future Works
In this paper, the evaluation indicator values are uniformly transformed into the form of interval numbers. However, whether expressing qualitative indicator values in terms of intervals is the best practice remains to be demonstrated. Currently, qualitative indicator evaluation values can be expressed not only as interval numbers, but also as fuzzy numbers, intuitionistic fuzzy numbers, interval-valued intuitionistic fuzzy numbers, and so on. It would be interesting to explore whether adopting different representation forms would yield different decision making results. Furthermore, a comparison with traditional decision making methods reveals that different indicator normalization methods may also exert an impact on the decision making results. How different indicator normalization methods affect the final decision making results for the same project case warrants further investigation in the future.
Author Contributions
Conceptualization, D.W.; Methodology, D.W.; Software, Y.M.; Validation, D.W.; Formal analysis, H.P. and Y.P.; Investigation, Y.M.; Resources, Y.P.; Writing—review and editing, D.W.; Supervision, H.P. All authors have read and agreed to the published version of the manuscript.
Funding
This research was funded by the Department of Agriculture and Rural Affairs of Jiangxi Province (20224BBG71024) and the Science and Technology Project of Jiangxi Provincial Department of Housing and Urban Rural Development (Jiangxi Construction Research [2023] No. 13).
Data Availability Statement
The data presented in this study are openly available in the foundation pit at 10.1038/s41598-026-49976-0].
Acknowledgments
The authors acknowledge the financial support from the Key Research and Development Scheme in Jiangxi Province (No. 20224BBG71024) and the Science and Technology Project of Jiangxi Provincial Department of Housing and Urban Rural Development (Jiangxi Construction Research [2023] No. 13). The authors would like to thank them for their support.
Conflicts of Interest
The authors declare no conflicts of interest.
References
- Mei, N.F.; Luo, X.D.; Jiang, N.; Fan, X.Y.; Dai, Z.W.; Luo, H. Establishment and Application of Grey Multi-objective Decision-making Optimization Model for Foundation Pit Supporting Schemes. J. Cent. South Univ. (Sci. Technol.) 2013, 44, 1982–1987. (In Chinese) [Google Scholar]
- He, Y.B.; Qin, W.; Yang, W. Optimization of Supporting Schemes for Deep Foundation Pit Based on Combined Weight and Grey Euclid Theory. J. Saf. Sci. Technol. 2016, 12, 94–97. [Google Scholar] [CrossRef]
- Zhou, H.; Cao, P. A Fuzzy AHP Approach to Select Supporting Schemes for City Foundation Pit in Soft Soil. J. Cent. South Univ. (Sci. Technol.) 2012, 43, 3582–3588. (In Chinese) [Google Scholar]
- Jin, T.L.; Zhang, P.X.; Niu, Y.D. Integrating Combination Weighting of Game Theory and Fuzzy Comprehensive Evaluation for Selecting Deep Foundation Pit Support Scheme. Buildings 2024, 14, 619. [Google Scholar] [CrossRef] [Scilit]
- Yang, Z.S.; Tao, J.X.; Pan, H.K. The Supporting Scheme Selection of Deep Foundation Pit Based on Fuzzy Optimization Theory. Appl. Mech. Mater. 2014, 54, 1492–1496. [Google Scholar] [CrossRef] [Scilit]
- Xie, Q.M.; Ding, M.W.; Tan, B. Study on an Optimal Model of Support Schemes of Deep Foundation Pit Based on Intuitive Fuzzy Set-VIKOR Theory and Its Application. J. Wu Han Univ. Technol. 2023, 45, 71–79. [Google Scholar] [CrossRef]
- Jing, W.Q.; Song, S.P.; Li, Y. Application of TOPSIS-AISM Interpretation Model in Support Scheme Optimization for Foundation Pit. Saf. Environ. Eng. 2023, 30, 76–83. [Google Scholar] [CrossRef]
- Issa, U.; Saeed, F.; Miky, Y. Hybrid AHP-Fuzzy TOPSIS Approach for Selecting Deep Excavation Support System. Buildings 2022, 12, 295. [Google Scholar] [CrossRef] [Scilit]
- Zhang, H.Q.; Cai, Q. Deep foundation pit supporting scheme based on ANP. J. Henan Univ. (Nat. Sci.) 2014, 44, 113–117. [Google Scholar] [CrossRef]
- Li, B.H.; Zhou, J.; Shi, X.Z. Fisher Discriminant Analysis Model for Selecting the Retaining Structure Type of Deep Foundation Pit. J. Chong Qing Univ. 2011, 34, 109–116. [Google Scholar] [CrossRef]
- Li, L.X.; Feng, H.G. A comprehensive evaluation method of interval supporting schemes for foundation pit based on connection number of set pair analysis and its application. Math. Pract. Theory 2015, 45, 132–138. (In Chinese) [Google Scholar]
- Tan, Q.Y.; Sun, P.G. A Vector Projection Model for Evaluation of Foundation Pit Support Schemes with Intervals Based on Complex Operations of Connection Number and its Application. Math. Pract. Theory 2019, 49, 245–255. [Google Scholar]
- Wang, W.Z.; Ren, M.L.; Yi, Q. Optimization of Foundation Pit Support Scheme with Interval Index Based on Possibility Degree. J. WUT (Inf. Manag. Eng.) 2019, 41, 485–490. (In Chinese) [Google Scholar]
- Shen, H.Y.; Zhu, X.X. Evaluation of Soft Deep Foundation Pit Supporting Scheme Based on Lattice Order Decision Theory. J. Civ. Eng. Manag. 2017, 34, 132–137. [Google Scholar] [CrossRef]
- Fortes, I.; Morales, R. Inductive learning models with missing values. Math. Comput. Model. 2006, 44, 790–806. [Google Scholar] [CrossRef] [Scilit]
- Sun, B.Z.; Zhang, S.; Yang, J.N. Optimal Decision Model for the Supporting Scheme of the Deep Foundation Pit Based on the Prospect Theory and BWM. J. Saf. Environ. 2021, 21, 70–77. [Google Scholar] [CrossRef]
- Arcangelo, C.; Raffaele, P.; Christian, E. A Collaborative Clinical Analysis Service Based on Theory of Evidence, Fuzzy Linguistic Sets and Prospect Theory and Its Application to Craniofacial Disorders in Infants. Future Gener. Comput. Syst. 2017, 67, 230–241. [Google Scholar] [CrossRef] [Scilit]
- Wu, A.P.; Li, H.; Dong, M. A Novel Two-stage Method for Matching the Technology Suppliers and Demanders Based on Prospect Theory and Evidence Theory Under Intuitionistic Fuzzy Environment. Appl. Soft Comput. J. 2020, 95, 106553. [Google Scholar] [CrossRef] [Scilit]
- Yilmaz, N.; Kalaycioglu, C. Can Prospect Theory Predict the Decision Making by Professionals? Evidence from the Pharmaceutical Industry. Int. J. Appl. Behav. Econ. 2016, 5, 24–47. [Google Scholar] [CrossRef] [Scilit]
- Dempster, A.P. Upper and Lower Probabilities Induced by a Multivalued Mapping. Ann. Math. Stat. 1967, 38, 325–339. [Google Scholar] [CrossRef] [Scilit]
- Di, P.; Ni, Z.C.; Yin, D.L. A Multi-attribute Decision Making Optimization Algorithm Based on Cloud Model and Evidence Theory. Syst. Eng.-Theory Pract. 2021, 41, 1061–1070. [Google Scholar]
- Xia, J.; Feng, Y.Q.; Liu, L. An Evidential Reliability Indicator-based Fusion Rule for Dempster-Shafer Theory and Its Applications in Classification. IEEE Access. 2018, 6, 24912–24924. [Google Scholar] [CrossRef] [Scilit]
- Shen, Y.N.; Zhang, J.B. Comprehensive Performance Evaluation Model Based on Improved Evidence Theory and Its Application. Oper. Res. Manag. Sci. 2022, 31, 132–137. (In Chinese) [Google Scholar]
- Li, H.W.; Xiao, F.Y. A Method for Combining Conflicting Evidence with Improved Distance Function and Tsallis Entropy. Int. J. Intell. Syst. 2020, 35, 1814–1830. [Google Scholar] [CrossRef] [Scilit]
- Bauer, M. Approximation Algorithms and Decision Making in the Dempster-Shafer Theory of Evidence- An Empirical Study. Int. J. Approx. Reason. 1997, 17, 217–237. [Google Scholar] [CrossRef] [Scilit]
- Kreinovich, V.; Bernat, A.; Borrett, W. Monte-Carlo Methods Make Dempster-Shafer Formalism Feasible. In Advances in the Dempster-Shafer Theory of Evidence; John Wiley & Sons, Inc.: Hoboken, NJ, USA, 1994; pp. 175–191. [Google Scholar]
- Jousselme, A.-L.; Grenier, D.; Bosse, E. Analyzing Approximation Algorithms in the Theory of Evidence; International Society for Optics and Photonics: Bellingham, WA, USA, 2002; pp. 65–74. [Google Scholar] [CrossRef] [Scilit]
- Haenni, R.; Lehmann, N. Resource Bounded and Anytime Approximation of Belief Function Computations. Int. J. Approx. Reason. 2002, 31, 103–154. [Google Scholar] [CrossRef] [Scilit]
- Xu, F.; Zheng, X.P.; Zhang, J. A Hybrid Reasoning Mechanism Integrated Evidence Theory and Set Pair Analysis in Swine-Vet. Expert Syst. Appl. 2010, 37, 7086–7093. [Google Scholar] [CrossRef] [Scilit]
- Ludmila, D.; Pavel, S.; Krzysztof, K. A Forex Trading Expert System Based on a New Approach to the Rule-Base Evidential Reasoning. Expert Syst. Appl. 2016, 51, 1–13. [Google Scholar] [CrossRef] [Scilit]
- Sergio, P.; Nelson, B.; Horacio, S. Applying Dempster–Shafer Theory for Developing a Flexible, Accurate and Interpretable Classifier. Expert Syst. Appl. 2020, 148, 113262. [Google Scholar] [CrossRef] [Scilit]
- Wei, D.J.; Xu, D.S.; Zhang, Y. A Fuzzy Evidential Reasoning-Based Approach for Risk Assessment of Deep Foundation Pit. Tunn. Undergr. Space Technol. 2020, 97, 103232. [Google Scholar] [CrossRef] [Scilit]
- Wang, N.X.; Yuen Kum, F.; Yuan, J. Ship Collision Risk Assessment: A Multi-Criteria Decision-Making Framework Based on Dempster–Shafer Evidence Theory. Appl. Soft Comput. 2024, 162, 111823. [Google Scholar] [CrossRef] [Scilit]
- Wang, H.Y.; Shi, Y.K.; Chen, L. A Tunnel Fire Detection Method Based on an Improved Dempster-Shafer Evidence Theory. Sensors 2024, 24, 6455. [Google Scholar] [CrossRef] [Scilit]
- Feng, T.; Mi, S.J.; Zhang, S.P. Fused Decision Rules of Multi-Intuitionistic Fuzzy Information Systems Based on the D-S Evidence Theory and Three-Way Decisions. Int. J. Fuzzy Syst. 2024, 27, 528–549. [Google Scholar] [CrossRef] [Scilit]
- Yao, S.; Guo, Y.J.; Huang, W.Q. An Approach of Multi-Attribute Group Decision Making with Incomplete Linguistic Assessment Information. J. Syst. Eng. 2011, 26, 460–467. [Google Scholar] [CrossRef] [Scilit]
- Kahneman, D.; Tversky, A. Prospect Theory: An Analysis of Decision Under Risk. Econometric 1979, 47, 263–291. [Google Scholar] [CrossRef] [Scilit]
- Wu, X.H.; Yang, L. Hesitant Picture Fuzzy Linguistic Prospects Theory-Based Evidential Reasoning Assessment Method for Digital Transformation Solution of Small and Medium-Sized Enterprises. Complex Intell. Syst. 2024, 10, 59–73. [Google Scholar] [CrossRef] [Scilit]
- Kavya, R.; Christopher, J. Interpretable Systems Based on Evidential Prospect Theory for Decision-Making. Appl. Intell. 2023, 53, 1640–1665. [Google Scholar] [CrossRef] [Scilit]
- Bao, T.T.; Xie, X.L.; Long, P.Y. MADM Method Based on Prospect Theory and Evidential Reasoning Approach with Unknown Attribute Weights Under Intuitionistic Fuzzy Environment. Expert Syst. Appl. 2017, 88, 305–317. [Google Scholar] [CrossRef] [Scilit]
- Rong, L.L.; Wang, L.; Liu, P.D. Supermarket Fresh Food Suppliers Evaluation and Selection with Multigranularity Unbalanced Hesitant Fuzzy Linguistic Information Based on Prospect Theory and Evidential Theory. Int. J. Intell. Syst. 2022, 37, 1931–1971. [Google Scholar] [CrossRef] [Scilit]
- Wu, G.; Tan, Y.; Xu, Z.; Yuan, Z.; Zhang, J.; He, Y.; Wang, C. XAI-Aided Method for Accurately Assessing the Stability of Unlined Double Tunnels in Rock Masses. Transp. Geotech. 2026, 61, 102052. [Google Scholar] [CrossRef] [Scilit]
- Wu, G.; Tan, Y.; Zeng, J.; Zheng, J.; Zhang, R.; Liu, Y.; Yue, S. Laboratory Tests of an Eccentrically Loaded Strip Footing Above Single Underlying Void. J. Build. Eng. 2025, 111, 113211. [Google Scholar] [CrossRef] [Scilit]
- JGJ120—2012; Technical Specification for Retaining and Protection of Building Foundation Excavations. Ministry of Housing and Urban Rural Development of the People’s Republic of China: Beijing, China, 2012.
- Ishibuchi, H.; Tanaka, H. Multiobjective programming in optimization of the interval objective function. Eur. J. Oper. Res. 1990, 48, 219–225. [Google Scholar] [CrossRef] [Scilit]
- Birnbaum, M.H. Three new tests of independence that differentiate models of risky decision making. Manag. Sci. 2005, 51, 1346–1358. [Google Scholar] [CrossRef] [Scilit]
- He, X.D.; Zhou, X.Y. Portfolio choice under cumulative prospect theory: An analytical treatment. Manag. Sci. 2011, 57, 315–331. [Google Scholar] [CrossRef] [Scilit]
- Wei, D.J.; Li, Y.X.; Zhang, Y. An Interval Evidential Reasoning-based Approach for Selecting Supporting Scheme for Deep Foundation Pit. J. Highw. Transp. Res. Dev. 2023, 40, 127–134. [Google Scholar]
- Xin, F. Uncertain Multi-attribute Decision Making With Interval Certitude Degree and Prospect Theory. J. Interdiscip. Math. 2018, 21, 783–793. [Google Scholar] [CrossRef] [Scilit]
- Moradi, S.; Yousefi, H.; Noorollahi, Y. Multi-criteria Decision Support System for Wind Farm Site Selection and Sensitivity Analysis: Case Study of Alborz Province, Iran. Energy Strategy Rev. 2020, 29, 100478. [Google Scholar] [CrossRef] [Scilit]
- Zeng, S.Z.; Chen, S.M.; Fan, K.Y. Interval-valued Intuitionistic Fuzzy Multiple Attribute Decision Making Based on Nonlinear Programming Methodology and TOPSIS Method. Inf. Sci. 2020, 506, 424–442. [Google Scholar] [CrossRef] [Scilit]
- Xiong, B.B.; Chen, H.X.; An, Q.X. A Multi-Objective Distance Friction Minimization Model for Performance Assessment Through Data Envelopment Analysis. Eur. J. Oper. Res. 2019, 279, 132–142. [Google Scholar] [CrossRef] [Scilit]
- Yu, Y.; Ding, H.; Tong, L.; Xu, C.; Lin, C.; Liu, Z.; Pu, X. Elastic Metasurfaces for Scholte Waves at Fluid–Poroelastic Interfaces. Int. J. Mech. Sci. 2026, 321, 111657. [Google Scholar] [CrossRef] [Scilit]
- Ding, H.; Lin, C.; Xu, C.; Lim, C.; Liu, Z.; Yu, Y.; Tong, L. A Quasi-Zero Stiffness Locally Resonant Metamaterial with Tunable Low-Frequency and Wide Bandgap. Eng. Struct. 2026, 361, 122891. [Google Scholar] [CrossRef] [Scilit]
- Zhang, M.J.; Wan, Y.M.; Li, L.H. A General Evidential Reasoning Algorithm for Multi-attribute Decision Analysis under Interval Uncertainty. Eur. J. Oper. Res. 2017, 257, 1005–1015. [Google Scholar] [CrossRef] [Scilit]
- NG, C.Y. An Evidential Reasoning-based AHP Approach for the Selection of Environmentally-friendly Designs. Environ. Impact Assess. Rev. 2016, 61, 1–7. [Google Scholar] [CrossRef] [Scilit]
- Li, Z.; Luo, Z.J.; Wang, Y. Suitability Evaluation System for the Shallow Geothermal Energy Implementation in Region by Entropy Weight Method and TOPSIS Method. Renew. Energy 2022, 184, 564–576. [Google Scholar] [CrossRef] [Scilit]
- Deng, H.P.; Chung-Hsing, Y.; Willis, R.J. Inter-Company Comparison Using Modified TOPSIS with Objective Weights. Comput. Oper. Res. 2000, 27, 963–973. [Google Scholar] [CrossRef] [Scilit]
- Wang, Y.M.; Luo, Y. Integration of Correlations with Standard Deviations for Determining Attribute Weights in Multiple Attribute Decision Making. Math. Comput. Model. 2010, 51, 1–12. [Google Scholar] [CrossRef] [Scilit]
- Ngakan, N.K.K.; Bedir, T.; Cagatay, C. Multi-Criteria Decision Analysis Approach for Selecting Feasible Data Analytics Platforms for Precision Farming. Comput. Electron. Agric. 2023, 209, 107869. [Google Scholar] [CrossRef] [Scilit]
- Bajusz, D.; Rácz, A.; Héberger, K. Why is Tanimoto index an appropriate choice for fingerprint-based similarity calculations? J. Cheminformatics 2015, 7, 20. [Google Scholar] [CrossRef] [Scilit]

Disclaimer/Publisher’s Note: The statements, opinions and data contained in all publications are solely those of the individual author(s) and contributor(s) and not of MDPI and/or the editor(s). MDPI and/or the editor(s) disclaim responsibility for any injury to people or property resulting from any ideas, methods, instructions or products referred to in the content. |
© 2026 by the authors. Licensee MDPI, Basel, Switzerland. This article is an open access article distributed under the terms and conditions of the Creative Commons Attribution (CC BY) license.