


Abstract
Stationary occupants modify the vibration of lightweight floors and grandstands, yet predicted responses depend on how the stationary human is represented. This study examines model-form effects among a conventional separative model (SM), a reduced integrative model (RIM), and a full integrative model (FIM) under rhythmic jumping. A population standing-human program comprising 55 measured structural frequency-response-function (FRF) datasets, of which 50 were retained after quality control, is combined with a re-analysis of previously acquired standing-and-jumping measurements and a multi-harmonic frequency-domain parametric study. Under matched independent five-parameter calibration, the median complex-FRF normalized root-mean-square error (NRMSE) values were 0.0705, 0.0786, and 0.0738 for the SM, RIM, and FIM, respectively. In contrast, a no-refit RIM inheriting the FIM parameter set gave 0.3196, demonstrating substantial calibration compensation across model forms. The rhythmic-jumping re-analysis further showed that no single formulation provided the closest structural-response prediction across all tested frequencies and response metrics. Over the parametric domain, the maximum structural-response discrepancies relative to the FIM reference were 146.67% and 117.10% for the SM and RIM at 1% structural damping, 43.79% and 42.51% at 3%, and 32.52% and 29.84% at 5%. The corresponding analytical human-coordinate discrepancies reached 135.92% and 101.08%, 46.15% and 40.93%, and 37.87% and 37.85%. At 3% damping, the largest resolved interior critical jumping-frequency shifts were 0.21 and 0.19 Hz for the structural response and 0.20 and 0.14 Hz for the human-coordinate response. Mechanism analyses linked the representative structural and human-coordinate discrepancies to third-harmonic alignment with the upper coupled mode, giving discrepancies of 42.1% and 24.1%, respectively. Robustness checks showed comparatively stable sampled-grid 95th-percentile trends across the FIM population BMR interquartile range and under changes in contact ratio, harmonic truncation, and frequency resolution. The results show that sensitivity to stationary-human model form is output- and resonance-specific: simplified formulations may be useful for screening, but model-form effects become important near lightly damped resonances, prescribed activity frequencies, and threshold-sensitive assessments.
1. Introduction
1.1. Background
Human-induced vibration remains an important serviceability concern for lightweight floors, grandstands, and other assembly structures subjected to walking, jumping, dancing, and synchronized crowd activity. A broad review of human–structure interaction (HSI) identified two complementary directions of coupling: structural motion can alter human-induced forces, while occupants can modify the dynamic properties of the structures they occupy [1]. For stadia and similar assembly structures, vibration serviceability has also been organized in a source–path–receiver framework, in which the excitation, the occupied structural system, and the human receiver must be considered together [2]. This framework provides a useful basis for distinguishing evidence obtained at the individual, controlled-interaction, crowd/full-scale, and real-building levels.
At the individual laboratory level, standing-human biodynamics are strongly frequency-dependent. Apparent-mass measurements show that the vertical response of a standing person can be represented by low-order dynamic models and that the identified properties vary with posture and excitation conditions [3]. Coupled HSI experiments have further shown that equivalent standing-human properties can be identified from the structural frequency-response function (FRF) of an occupied vibrating system, including the characteristic two-resonance behavior of a highly damped two-degree-of-freedom (2DOF) system [4]. These results support treating a stationary occupant as a dynamic subsystem of the coupled structure-human system rather than as a purely static added mass, while also showing that identified equivalent properties depend on the experimental and modeling framework.
Controlled experiments provide complementary evidence for passive and active interaction. For passive occupants, tests on a vibrating concrete floor showed substantial increases in damping and shifts in apparent resonant frequency, with corroborating observations from a full-scale floor occupied by several hundred people [5]. Tests on a lightly damped staircase likewise demonstrated that passive standing occupants can measurably alter modal frequencies and substantially increase damping [6]. For active occupants, jumping experiments on perceptibly moving structures showed that structural motion changes contact ratio and harmonic force content [7], and subsequent jumping and bobbing tests demonstrated systematic dependence on structural properties and human-to-structure mass ratio [8]. More recent experiments have quantified changes in rhythmic-jumping behavior caused by vertical support motion [9]. Passive stationary-human dynamics and active adaptation of the excitation are therefore distinct interaction mechanisms, even though both contribute to the broader HSI problem.
At the crowd and full-scale levels, the interaction becomes more complex. Full-scale grandstand measurements have shown mode splitting and substantial damping changes when a large crowd is present [10], while in-service monitoring during an international football match demonstrated crowd-dependent changes in natural frequencies and damping ratios [11]. Recent event-floor experiments with large synchronized groups further show that response depends on crowd coordination, activity, and occupied-system dynamics [12]. Spectral studies of rhythmic crowd activity highlight the importance of imperfect synchronization, intra- and inter-subject variability, and closely spaced structural modes [13]. Laboratory crowd studies have shown that equivalent human parameters depend on posture and occupancy condition [14], and crowd-jumping analyses have extended HSI modeling to multiple structural modes, separate active and passive human components, and person-to-person variability [15]. Random-field and stochastic load models provide additional descriptions of spatial–temporal correlation and jump-to-jump variability [16,17]. Recent small-group stationary-HSI experiments further indicate that group-equivalent parameters cannot in general be obtained by direct averaging of parameters identified from individuals [18]. These studies provide the scale context for interpreting controlled single-person model-form results in relation to crowd applications.
Within stationary-human modeling, alternative formulations have been developed for the same coupled physical scenario. Ji et al. derived integrative standing-human representations from a continuous-body description on a vibrating structure [19]. Zhou et al. subsequently compared separative and integrative formulations and showed that the principal distinction lies in the mass-matrix representation, including coupling-associated inertia terms that alter the coupled modal properties [20]. In a broader vertical-HSI setting, Caprani and Ahmadi demonstrated that alternative human representations can lead to materially different structural-response predictions [21]. These studies establish that model form matters, but they do not answer a more specific calibration-versus-prediction question: when different stationary-human formulations achieve similar agreement with the same measured structural FRF after equivalent calibration, do they remain predictively equivalent under the same multi-harmonic rhythmic excitation? This question motivates the controlled comparison developed in the present study.
Engineering interpretation also depends on the excitation source and on the response quantity used for serviceability assessment. Interaction-based serviceability studies have shown that accounting for human dynamics can change predicted occupied modal properties and structural response [22]. Vertical vibration in real buildings can also arise from non-human sources: accelerometric observations from fixed-base and base-isolated buildings during the 2025 Potenza earthquake sequence identified interactions between vertical ground motion, superstructure response, and floor-system frequencies [23], while full-scale measurements in a multistory building above railway lines demonstrated transmission of train-induced vibration through the building and amplification associated with floor resonances [24]. Established vibration-serviceability guidance employs response measures appropriate to different assessment objectives, including structural acceleration and frequency-weighted human-exposure measures [25,26,27,28].
1.2. Research Questions and Contributions
The relationship between the present investigation and the authors’ earlier work is summarized in Table 1. Zhao’s PhD thesis [29] and the subsequent article by Zhao and Ji (2025) [30] established the integrative 2DOF response framework and reported the previously acquired standing-and-jumping program. Zhao and Zhang (2026) [18] examined individual-to-crowd consistency using a separate program of single-person and small-group stationary-HSI tests. The population calibration program used in the present study is distinct from those datasets: 55 standing-human FRF datasets were measured, 50 were retained after experiment-only quality control, and the retained data were used for matched independent five-parameter calibration of the separative model (SM), reduced integrative model (RIM), and full integrative model (FIM). The previously acquired 10.07 Hz standing-and-jumping measurements [29,30] are then re-analyzed separately for the controlled model-form structural-response comparison under common rhythmic-jumping conditions.
Table 1.
Relationship of the present study to the authors’ previous work and the provenance of the experimental datasets.
Against this background, the present study addresses three related questions. First, when SM, RIM, and FIM are calibrated independently to the same measured structural FRFs using equivalent five-parameter procedures, can they achieve comparable calibration agreement, and if so, does that agreement imply predictive equivalence under rhythmic excitation? Second, how does stationary-human model form affect the governing structural response, analytical human-coordinate response, and critical jumping frequency under identical multi-harmonic loading? Third, where model-form discrepancies occur, can they be explained through changes in coupled modal placement and harmonic alignment? The FIM is used as the controlled reference for inter-model discrepancy calculations rather than as experimental ground truth.
The study contributes a matched population-level calibration comparison of all three model forms against the same retained structural FRFs; a no-refit RIM route that inherits the FIM parameter set while suppressing the coupling-associated inertia terms for mechanistic isolation; re-analysis of the previously acquired standing-and-jumping measurements under common excitation conditions; response-specific model-form discrepancy maps for the structural and analytical human coordinates; resolved critical jumping-frequency shifts; and modal–harmonic decomposition linking inter-model differences to coupled-mode relocation and discrete harmonic alignment. The resulting evidence distinguishes calibration agreement from predictive equivalence and identifies regions in which response predictions are relatively insensitive or sensitive to the stationary-human model form.
2. Theoretical Framework
2.1. Stationary-Human Model Formulations
The physical scenario consists of a dominant vertical structural mode subjected to rhythmic jumping while supporting a passive stationary occupant. The structure is represented by a single-modal coordinate with modal mass , natural frequency and damping ratio . The stationary human contributes one additional dynamic coordinate, resulting in a two-degree-of-freedom HSI system. For the three model forms illustrated in Figure 1, the structural and human-coordinate displacements measured from static equilibrium are denoted by and , respectively.
Figure 1.
Three stationary-human representations used in the model-form comparison: (a) separative model (SM); (b) reduced integrative model (RIM), retaining the support-mass contribution while omitting the coupling-associated mass contribution; and (c) full integrative model (FIM), retaining the complete coupling-associated mass terms.
The three stationary-human formulations share the same general equation of motion,
where ∈ {SM, RIM, FIM}. The excitation acts directly on the structural coordinate,
The damping and stiffness matrices share the same topology across the three formulations:
with
For the controlled response comparisons in Section 3.2 and Section 4, the three formulations are assigned the same human natural frequency and damping ratio. The human-coordinate modal mass is used consistently to define the human stiffness and damping terms, so that the formulation difference is isolated in the mass representation.
Model form enters through the mass matrix. For the conventional separative model,
In the SM, the structural and human coordinates are inertially separated: the support-mass contribution and the coupling-associated mass terms are absent from the mass matrix.
The reduced integrative model (RIM) is introduced as a controlled diagnostic formulation that retains the support-mass contribution and the human modal mass while omitting the remaining coupling-associated mass contribution:
The full integrative model restores the complete coupling-associated mass contribution:
Here, denotes the measured whole-body mass of the stationary participant, whereas and are generalized participating and modal mass quantities associated with the first vertical human-body mode; they are not independently weighed physical masses. In the integrative formulation, the body mass ratio is defined as . Following Ji et al. [19], the ratio is prescribed, giving
Thus, for a measured , the fitted BMR determines the two generalized human-mass quantities used in the RIM and FIM. Because and are inferred through the selected model formulation rather than measured independently, they are treated here as model-calibration quantities rather than uniquely identified physiological mass fractions. The RIM-to-FIM relation can then be written as
where contains both the off-diagonal inertial-coupling terms and the associated correction to the structural-coordinate mass term. The RIM is therefore not obtained by simply setting the FIM off-diagonal entries to zero. As summarized in Table 2, the sequence SM RIM FIM is used as a controlled mechanism path and is not assumed to provide a monotonic intermediate approximation.
Table 2.
Physical content and role of the three stationary-human formulations in the controlled model-form analysis.
2.2. Rhythmic-Jumping-Load Representation
The rhythmic-jumping force is represented as a periodic multi-harmonic excitation,
where and are the amplitude and phase of the -th dynamic harmonic, respectively, is the fundamental jumping angular frequency, and is the number of retained harmonics.
The contact ratio denotes the fraction of one jumping period during which contact is maintained. A unit-mean periodic half-sine contact pulse is used to generate the harmonic coefficients in Equation (10): during the contact phase the force follows a half-sine profile, while it is zero during the flight phase. The pulse amplitude is scaled so that its mean over the complete jumping period is unity. The non-zero harmonic amplitudes and phases are obtained from the standard Fourier decomposition of this periodic pulse. The zero-frequency component affects only the static equilibrium and is therefore excluded from the dynamic equations. Thus, “unit-mean excitation” refers to this common normalized scale with an arbitrary absolute force level; root-mean-square (RMS) values are reported on that scale, whereas model-form sensitivity metrics are dimensionless percentages.
2.3. Dynamic Response Formulation
Because all three formulations are linear, each harmonic of the prescribed jumping force can be solved independently in the frequency domain and the resulting mean-square contributions can then be superposed. For the n-th jumping harmonic,
The complex dynamic-stiffness matrix of model j is
The complex displacement-amplitude vector is
The corresponding structural and human-coordinate acceleration amplitudes are
Since the retained harmonic frequencies are distinct integer multiples of the fundamental jumping frequency, their cross terms vanish when the mean square is evaluated over an integer number of fundamental cycles. The RMS acceleration of coordinate ∈ {S,H} is therefore
Equation (15) provides a common RMS response measure for the structural and human coordinates. In each controlled comparison, the same prescribed jumping load and the same identified structural and human parameters are supplied to the SM, RIM and FIM; differences in the calculated responses therefore arise from their alternative mass representations and the associated coupled dynamics.
3. Experimental Investigation and Model-Form Evidence
3.1. Population Standing-Human FRF Calibration
A population standing-human modal-test program was assembled from 55 measured datasets acquired on the vertically moving SDOF test rig used in the authors’ earlier experimental work [29,30]. For the cross-form calibration, the measured structural modal mass was held fixed, while the structural natural frequency and damping ratio were estimated jointly with the stationary-human parameters under the same bounds for each independently calibrated formulation. The population dataset therefore provides a common structural-FRF target for population-level identification and model-form comparison.
The rig consisted of a platform supported by a pair of steel cantilevers and constrained to predominantly vertical motion by low-friction linear guide bearings. An APS 113 shaker (APS Dynamics, Inc., San Juan Capistrano, CA, USA) was used to provide harmonic excitation. Each participant stood individually on the platform during testing, and structural acceleration was measured on the platform. Harmonic excitation was applied over 3–12 Hz to construct the complex structural acceleration FRF for each participant. The experimental setup and standing-human test configuration are shown in Figure 2.
Figure 2.
Experimental setup for the present standing-human FRF program: (a) cross-sectional configuration of the vertically moving SDOF test rig [29] and (b) standing-human FRF test configuration.
Before model fitting, experiment-only quality control was applied to the 55 standing-human FRF records. Three data-quality indicators were considered: median coherence over the analyzed 3–12 Hz range, the fraction of analyzed frequency points with coherence of at least 0.80, and the valid-data fraction. For each indicator, a cohort-relative quality score was obtained from its position among the 55 records, and the three contributions were weighted by 55%, 35%, and 10%, respectively, to form an overall quality score. The 50 records with the highest overall scores were retained for the population analysis. No model-fit error or fitted model parameter was used in the quality-control procedure. The retained sample comprised 41 male and 9 female participants. Age was 25 [24, 28] years (range 22–66 years), height was 1.73 [1.70, 1.80] m, whole-body mass was 71.85 [63.83, 82.25] kg, and body mass index was 23.54 [21.40, 26.85] kg/m2, where bracketed values denote [Q1, Q3]. Participants stood normally on the platform and wore shoes during the tests.
For each retained dataset, the measured whole-body mass was fixed. In the independently calibrated SM, the single-human-coordinate mass term appearing in Equations (4) and (5) was treated as a free effective mass, denoted , rather than being constrained by the integrative BMR relations in Equation (8). Accordingly, the SM identified , whereas the independently calibrated RIM and FIM each identified . All three formulations were fitted to the same measured complex structural FRF with the same fixed , the same frequency interval, matched bounds on , , and , and 30 multi-start optimizations. This matched five-parameter calibration provides a like-for-like comparison of independently calibrated structural-FRF agreement across the three model forms. For the integrative formulations, was prescribed following Ji et al. [19]. Consequently,
Thus, once and are specified, and are uniquely determined. In the controlled response comparisons of Section 3.2 and Section 4, the SM instead uses the common human-coordinate modal mass derived from the prescribed integrative parameter set, so that the comparison is conducted with matched human parameters.
Two RIM routes are retained for distinct purposes. The independently calibrated RIM is refitted with the same five-parameter freedom as the FIM to assess its model-specific structural-FRF agreement under matched calibration conditions. The no-refit RIM instead inherits the complete participant-specific FIM parameter set and is generated solely by suppressing the coupling-associated inertia terms. The former assesses independently calibrated structural-FRF agreement, whereas the latter provides a controlled mechanistic isolation.
Parameter identification was performed in MATLAB (R2024b) using bounded nonlinear least squares (lsqnonlin). The natural frequencies and damping ratios reported in Table 3 were identified simultaneously from the measured complex structural FRFs rather than extracted from a separate single-signal decay. Specifically, the real and imaginary parts of the model-measurement residual were minimized together over 3–12 Hz so that both FRF magnitude and phase contributed to the objective. Thirty multi-start optimizations were performed for every participant and independently calibrated formulation, with the minimum-residual solution retained. The common bounds were for , for , for , and for ; the mass-related bounds were for in the SM and for in the RIM and FIM. Complex-FRF NRMSE, defined as the Euclidean norm of the complex model-measurement residual normalized by the Euclidean norm of the measured complex FRF, was the primary fit metric. FRF coherence was used only as part of the pre-fitting experimental quality-control procedure described above and was not used as a fitting weight. Population quantities are reported as median [Q1, Q3] because the fitted parameters are bounded and need not be symmetrically distributed.
Table 3.
Population calibration parameters and complex structural-FRF agreement for the 50 retained quality-controlled participant datasets.
For the FIM BMR profile-objective assessment, BMR was fixed successively over the prescribed profile grid and the remaining four calibration parameters were re-optimized against the same measured complex structural FRF using the same residual objective. At each fixed BMR, the relative objective increase was referenced to that participant’s minimum five-parameter objective, and the participant-level profiles were summarized by their median and interquartile limits. For each participant, the widths of the BMR regions producing no more than 5% and 10% objective increase were also calculated as descriptive identifiability diagnostics; these profile widths are not probabilistic confidence intervals.
Figure 3 and Table 3 summarize the population structural-FRF calibration results and the associated BMR profile-objective assessment for the 50 retained quality-controlled datasets. Under matched five-parameter calibration, the median complex-FRF NRMSE was 0.0705 [0.0619, 0.0823] for the SM, 0.0786 [0.0706, 0.0893] for the RIM, and 0.0738 [0.0650, 0.0845] for the FIM. Thus, all three formulations achieved broadly similar structural-FRF agreement after independent calibration. Importantly, these fits use the same measured structural FRFs and the same fixed structural modal mass . The fitted and values in Table 3 are formulation-specific calibration estimates that were allowed to adjust under identical bounds; their differences therefore reflect parameter compensation within alternative model forms rather than different physical structures or different experiments.
Figure 3.
Population standing-human calibration evidence based on 50 retained quality-controlled participant datasets: (a) measured structural acceleration FRFs and the population median; (b) measured and independently calibrated FIM FRF for representative retained participant (body mass 48.0 kg); (c) measured FRF for the same participant together with the independently calibrated SM, independently calibrated RIM, independently calibrated FIM, and the no-refit RIM obtained by suppressing the FIM coupling-associated inertia terms without refitting; and (d) relative increase in the FIM profile objective as BMR is fixed across the prescribed range, shown for the participant-level median and interquartile limits (Q1 and Q3). For the profile assessment in panel (d), BMR was fixed at each prescribed grid value for each participant while the remaining four calibration parameters were re-optimized against the same complex structural FRF before the participant-level summary was formed.
The two RIM routes clarify the role of calibration compensation. When the RIM was independently calibrated, its median complex-FRF NRMSE was 0.0786 [0.0706, 0.0893], comparable in scale with the independently calibrated SM and FIM. In contrast, when the participant-specific FIM parameters were retained and only the coupling-associated inertia terms were suppressed, the no-refit RIM median complex-FRF NRMSE increased to 0.3196 [0.2781, 0.3680]. Independent RIM refitting reduced this error by a median of 76.09%. The contrast between the independently calibrated and no-refit RIM shows the extent to which parameter refitting compensates for formulation differences. When the FIM parameter set is held fixed, suppressing the coupling-associated inertia terms substantially alters the coupled structural FRF.
The fitted stationary-human parameters varied across formulations despite their similar independently calibrated FRF errors. For the SM, the median human natural frequency and damping ratio were [5.8179, 6.9442] and [10.749, 19.868]. The independently calibrated RIM gave [5.8267, 6.8439] and [16.762, 25.321], while the FIM gave [5.3434, 6.7122] and [20.160, 29.550]. For the controlled response sweeps in Section 4, the FIM population-median values, , and are adopted as a common reference parameter set for model-form comparison; the FIM is not treated as experimental ground truth.
The mass-related calibration quantities show stronger model dependence. The SM effective-mass ratio had a median of 0.2951 [0.2102, 0.4292], whereas the FIM BMR was 0.7491 [0.6600, 0.8908]. The independently calibrated RIM gave a BMR of 0.9990 [0.9850, 0.9990], with 34 of the 50 fits reaching the upper BMR bound. The FIM profile-objective assessment in Figure 3d shows an interior region of comparatively low objective increase around the population calibration range, while the widening of the profile away from this region and the participant-level interquartile spread indicate finite parameter uncertainty and participant-dependent identifiability. These mass-related quantities are therefore interpreted as model-specific calibration parameters rather than uniquely identified physiological mass fractions.
The participant-level FIM profiles quantify the remaining identifiability limitation. Under the formal five-parameter calibration, 8 of the 50 retained FIM fits reached the BMR upper bound of 0.999, compared with 34 of 50 independently calibrated RIM fits. For the FIM, the BMR region producing no more than a 5% objective increase had a median width of 0.125 [0.075, 0.200]; using a 10% criterion, the median width was 0.175 [0.125, 0.275]. Within the no-more-than-5% profile region, the corresponding range of re-optimized human natural frequency had a median width of 0.180 Hz [0.094, 0.308], while the range of re-optimized human damping ratio had a median width of 2.95 percentage points [1.92, 4.80]. These finite profile widths show that near-equivalent structural-FRF fits can be obtained through compensating changes among the mass-related and human-dynamic parameters. Thus, under the matched five-parameter calibration adopted here, the FIM does not exhibit the strong population-level upper-bound concentration observed for the independently calibrated RIM. However, the structural FRF alone does not uniquely constrain the generalized human-mass quantities at practically equivalent fit levels, indicating finite practical identifiability; the stronger boundary concentration in the RIM further shows that this behavior is formulation-dependent.
Because the SM and FIM were evaluated on the same retained participants, the calibration-error comparison was also assessed on a paired basis. Defining , the median paired difference was −0.003372, with a participant-level percentile-bootstrap 95% confidence interval of [−0.006787, −0.001325]. The two-sided Wilcoxon signed-rank test gave with rank-biserial effect size −0.5514; the SM had the lower complex NRMSE for 37 of 50 participants and the FIM for 13 of 50. The absolute difference in calibration error is small; this comparison therefore characterizes calibration agreement rather than predictive performance.
Overall, the population FRF results show that the SM, RIM and FIM can all achieve similar agreement with the same measured structural FRFs after independent five-parameter calibration. Such agreement does not demonstrate equivalence of the underlying mass representations, because formulation-specific parameters can compensate during calibration. The marked deterioration of the no-refit RIM provides the complementary mechanistic evidence: when the FIM parameter set is held fixed, suppressing the coupling-associated inertia terms substantially alters the coupled structural FRF. It is therefore necessary to examine whether these model-form differences lead to different predictions of structural and human-coordinate responses under rhythmic excitation.
3.2. Re-Analysis of Previously Acquired Rhythmic-Jumping Measurements and Model-Form Response Comparison
The standing-and-jumping measurements previously reported in [29,30] are re-analyzed here as an experimental reference for comparing the model-form-dependent structural-response predictions of the SM, RIM, and FIM under identical rhythmic-jumping conditions. The dataset comprises the identified rig and standing-human properties, measured jumping loads, and the corresponding structural displacement and acceleration responses.
3.2.1. Previously Acquired Standing-And-Jumping Dataset
The previously reported standing-and-jumping program [29,30] used a vertically moving SDOF test rig with a modal mass of 252 kg, natural frequency of 10.07 Hz, and damping ratio of 7.2%. The standing participant had a whole-body mass of 81 kg. For the re-analysis of the previously acquired standing-and-jumping dataset, the stationary participant was represented using a natural frequency of 5.1132 Hz, a damping ratio of 21.689%, and a BMR of 0.85155, with a prescribed mass ratio of 1.36. A second participant with a body mass of 95 kg performed rhythmic jumping at nominal frequencies of 1.8, 2.0, and 2.2 Hz.
Structural acceleration was measured on the platform, an ACT linear variable differential transformer (LVDT) (RDP Electrosense Ltd., Wolverhampton, UK) measured vertical displacement, and an Entran force transducer (Entran Devices, Inc., Fairfield, NJ, USA) was used in the jumping-force recovery. The measured signals were low-pass filtered at 20 Hz. Two repeated records were available at each jumping frequency. The experimental configuration is shown in Figure 4, and the parameters and test conditions used in the present re-analysis are summarized in Table 4.
Figure 4.
Experimental configuration for rhythmic jumping with a standing participant.
Table 4.
Parameters and test conditions used for the re-analysis of the previously acquired standing-and-jumping measurements [29,30].
3.2.2. Jumping-Load Characterization and Analytical Comparison
The jumping participant had a body mass of 95 kg and performed rhythmic jumping at nominal frequencies of 1.8, 2.0, and 2.2 Hz. Two repeated records were available at each frequency. A common 30 s interval was analyzed for all six records. For each repeat, the achieved jumping frequency and contact ratio were estimated from the recovered jumping-force history. The two-repeat mean contact ratios were 0.4422, 0.3839, and 0.3942 at 1.8, 2.0, and 2.2 Hz, respectively.
The analytical excitation used for the principal model comparison was based on the periodic half-sine load representation defined in Equation (10). For each experimental repeat, a unit-mean half-sine pulse was constructed using the corresponding measured contact ratio, and the first five harmonics were retained. Five harmonics were used because the higher-order components are dynamically relevant for the present rig; in particular, the fifth harmonic of the approximately 2.0 Hz jumping excitation lies close to the 10.07 Hz structural natural frequency.
To examine the influence of excitation modeling independently of the stationary-human model form, an additional measured-force-derived representation was constructed from the same six experimental records. The first five complex Fourier coefficients were identified directly from each recovered force record by harmonic least-squares analysis. The same achieved jumping frequency was used for the measured-force-derived and half-sine representations of each repeat. Figure 5 compares the corresponding dynamic load factors of the first five harmonics. The measured-force-derived coefficients show clear differences from the idealized half-sine representation across the retained harmonics and also exhibit repeat-to-repeat variability. The measured-force-derived representation is used as an excitation-model sensitivity audit, with the stationary-human parameters held fixed.
Figure 5.
First-five-harmonic dynamic load factors of the measured-force-derived and idealized half-sine jumping-load representations at nominal jumping frequencies of (a) 1.8 Hz, (b) 2.0 Hz, and (c) 2.2 Hz. R1 and R2 denote the two repeated tests at each frequency.
For the subsequent response comparison, the SM, RIM, and FIM are evaluated using the same excitation, structural properties, and stationary-human parameters within each test condition, so that the comparison isolates the effect of stationary-human model form. The idealized half-sine five-harmonic input is retained for the principal analysis, whereas the measured-force-derived five-harmonic input is evaluated separately as an excitation-model audit. This allows the influence of load representation on model-experiment agreement to be distinguished from the model-form discrepancy among the three formulations.
3.2.3. Structural-Response Comparison
Figure 6 compares the measured structural-response metrics with the SM, RIM, and FIM predictions obtained using the idealized half-sine five-harmonic excitation. The experimental results are expressed as the mean and sample standard deviation (SD) of the two repeated tests at each nominal jumping frequency. Structural displacement is characterized by the mean cycle peak-to-peak value, whereas structural acceleration is characterized by RMS.
Figure 6.
Comparison of measured and predicted structural responses under the idealized half-sine five-harmonic excitation at nominal jumping frequencies of 1.8, 2.0, and 2.2 Hz: (a) mean cycle peak-to-peak displacement and (b) RMS acceleration. Experimental results are shown as the mean ± SD of the two repeated tests.
The experimental measurements show good repeatability in displacement across the three jumping frequencies and in acceleration at 1.8 and 2.0 Hz. The mean cycle peak-to-peak displacements were 4.1907 ± 0.0056, 5.0410 ± 0.0204, and 4.9218 ± 0.0622 mm at 1.8, 2.0, and 2.2 Hz, respectively. The corresponding RMS accelerations were 0.859632 ± 0.007395, 1.021108 ± 0.010690, and 1.109125 ± 0.079102 m/s2. Greater repeat-to-repeat variability was observed in the acceleration response at 2.2 Hz, as indicated by the larger standard deviation.
Under the half-sine five-harmonic excitation, the three model forms give relatively similar displacement predictions. At 1.8 Hz, the displacement errors range from 0.77% to 7.77%, increasing to 10.79–17.96% at 2.0 Hz and 14.13–15.69% at 2.2 Hz. The acceleration response exhibits substantially greater sensitivity to jumping frequency and model form. The acceleration errors remain between 6.22% and 12.35% at 1.8 Hz but increase to 66.82–93.15% at 2.0 Hz and 44.00–70.07% at 2.2 Hz. The model giving the closest prediction also changes with response quantity and jumping frequency; no single formulation provides the smallest error under all test conditions.
The influence of excitation representation is further evident from the measured-force-derived five-harmonic predictions in Table 5. For structural acceleration, replacing the idealized half-sine coefficients with the measured-force-derived coefficients substantially reduces the prediction errors at 2.0 and 2.2 Hz. At 2.0 Hz, the errors decrease to 29.98%, 29.34%, and 34.08% for the SM, RIM, and FIM, respectively, while at 2.2 Hz they become 30.66%, 34.47%, and 33.27%. This improvement is not observed at 1.8 Hz, where the acceleration errors increase to approximately 49–54%. The displacement predictions likewise show no systematic improvement across the three frequencies.
Table 5.
Measured structural responses and predictions from the SM, RIM, and FIM under the idealized half-sine and measured-force-derived five-harmonic excitation representations.
These results demonstrate that the representation of the jumping load can materially affect the predicted structural response, particularly the acceleration response near harmonically sensitive conditions. However, the influence of excitation representation varies with jumping frequency and response quantity. Within each test condition, the same excitation, structural properties, and stationary-human parameters are applied to the SM, RIM, and FIM; the differences among their predictions therefore reflect the effect of stationary-human model form under otherwise common conditions. Together with the population FRF results in Section 3.1, the response comparisons show that similar agreement with measured structural FRFs does not necessarily lead to equivalent predictions under multi-harmonic rhythmic excitation. The model-form discrepancy is both response-specific and frequency-dependent, providing the basis for the controlled parametric analysis in Section 4.
4. Parametric Analysis of Model-Form Effects
The experimental comparisons in Section 3 show that stationary-human model form can alter predicted structural response even when the three formulations are evaluated under the same excitation and parameter set. A broader controlled parameter study is therefore used here to quantify where the SM and RIM depart from the FIM comparison reference, how those discrepancies depend on structural damping and mass ratio, and which modal–harmonic mechanisms govern the differences.
4.1. Dimensionless Formulation and Parameter Domain
The parametric study was formulated as a controlled comparison in which structural properties, the common population-based human parameters, the jumping-load representation, and the jumping-frequency grid were identical for the FIM, RIM, and SM. The FIM serves as the common comparison reference because it retains the complete coupling-associated inertia terms, while all other inputs are matched across the three formulations. The following dimensionless coordinates were used to organize the parameter space:
Here, is the human-to-structure mass ratio, is the human-to-structure frequency ratio, and is the jumping-to-structure frequency ratio. For harmonic order , measures the alignment of with the structural frequency. The contour maps retain and as the displayed coordinates because they remain directly interpretable in hertz and mass ratio, whereas and are used to interpret modal–harmonic alignment.
To place the structural and human-coordinate responses on a common dimensionless scale, the RMS acceleration from Equation (15) was normalized by the mean dynamic-force scale of the unit-mean periodic jumping pulse:
In Equation (18), is the common mean excitation-force scale, identifies the structural or human response coordinate, and identifies the stationary-human model. Because the same positive normalization is applied to all three models at each parameter point, the scaling does not alter either the governing excitation condition or the relative model-form comparison. The human-coordinate RMS is used as an analytical response quantity and is not equated with a standardized vibration-comfort metric.
For each parameter combination, the governing RMS response and corresponding critical jumping frequency were obtained over the discrete search set spanning :
Using FIM as the common comparison reference, the absolute relative model-form discrepancy was defined by
The associated signed shift in the critical jumping frequency was defined as
A negative-signed shift indicates that the comparison model predicts the governing response at a lower jumping frequency than FIM, whereas a positive-signed shift indicates an upward shift. If the maximizer occurs at either end of , that result is flagged as boundary-controlled. Only comparisons for which both FIM and the comparison model have interior maxima are interpreted as resolved critical-frequency shifts.
Table 6 summarizes the parameter domain and baseline numerical settings used for the principal scans. A baseline contact ratio of 0.40, which lies within the range measured in the jumping experiment, was adopted for the principal analysis. The common human baseline comprises the population-median FIM values established in Section 3.1. To assess sensitivity to the mass representation without changing the remaining human or structural settings, BMR was additionally varied over the FIM population interquartile range from 0.6600 to 0.8908, with the population median of 0.7491 retained as the principal baseline. The human natural frequency, human damping ratio, and prescribed generalized-mass relations defined in Equation (8) were held unchanged during this BMR sensitivity analysis. Contact ratio, harmonic truncation, and jumping-frequency increment are examined separately in the robustness assessment of Section 4.6.
Table 6.
Parameter domain and baseline settings used in the parametric analysis.
4.2. Governing Structural Response
The governing structural response in Equation (19) was evaluated with at every combination. The corresponding values from Equation (20) quantify the absolute relative model-form discrepancy of the SM and RIM with respect to the FIM under identical forcing, parameter grids, and maximization rules.
Figure 7 maps this discrepancy for = 1%, 3%, and 5%. At 1% damping, the maximum SM–FIM and RIM–FIM discrepancies are 146.67% and 117.10%, respectively. These maxima occur where the FIM structural response is 30.01% and 26.05% of the maximum FIM response within the same damping slice, respectively, indicating that the large relative discrepancies are not caused by a vanishingly small FIM reference response.
Figure 7.
Absolute relative model-form discrepancy in the governing structural RMS acceleration over the (, ) domain: (a) SM–FIM, = 1%; (b) RIM–FIM, = 1%; (c) SM–FIM, = 3%; (d) RIM–FIM, = 3%; (e) SM–FIM, = 5%; and (f) RIM–FIM, = 5%. Color denotes (%); black curves delineate changes in the governing critical-frequency branch, and stars identify the domain maxima. The FIM is the controlled comparison reference.
Increasing structural damping reduces the most severe discrepancies. At = 3%, the maxima are 43.79% for SM–FIM and 42.51% for RIM–FIM; at = 5%, they are 32.52% and 29.84%, respectively. The corresponding FIM response levels at the SM maxima are 96.01% and 92.94% of the slice maxima, whereas the RIM maxima occur at lower levels of 6.82% and 9.69%. The latter should therefore be interpreted as localized worst-case ratios rather than as uniformly large response differences across the domain.
The narrow high-discrepancy bands follow parameter combinations where a retained jumping harmonic approaches a coupled modal branch or where the governing branch changes. The black curves mark these branch transitions, and their proximity to sharp discrepancy gradients shows that model form acts primarily through modal detuning and redistribution of harmonic participation. Starred domain maxima are retained for a conservative domain summary; where they occur on a scan boundary, their location is not interpreted as a resolved interior resonance.
4.3. Governing Human-Coordinate Response
The same governing-response operator was applied with . The corresponding values quantify the absolute relative model-form discrepancy in the analytical human-coordinate RMS acceleration on the common dimensionless response scale defined by Equation (18).
Figure 8 shows the corresponding human-coordinate maps. For = 1%, the maximum SM–FIM and RIM–FIM discrepancies are 135.92% and 101.08%, respectively, and the FIM response levels at those maxima are 23.36% and 23.49% of the slice maximum. At = 3%, the corresponding maxima are 46.15% and 40.93%; at = 5%, they are 37.87% and 37.85%.
Figure 8.
Absolute relative model-form discrepancy in the governing human-coordinate RMS acceleration over the (, ) domain: (a) SM–FIM, = 1%; (b) RIM–FIM, = 1%; (c) SM–FIM, = 3%; (d) RIM–FIM, = 3%; (e) SM–FIM, = 5%; and (f) RIM–FIM, = 5%. Color denotes (%); black curves delineate changes in the governing critical-frequency branch, and stars identify the domain maxima.
The topology of the human-coordinate maps is not a simple copy of the structural-response maps. Broad regions of non-negligible extend beyond the narrow resonance-transition bands. At 3% damping, the FIM response level at the SM maximum is 76.99% of the slice maximum, whereas the RIM maximum occurs at only 4.87%; at 5% damping, the unconstrained maxima for both comparisons occur at approximately 5.07% of the FIM slice maximum. After requiring the FIM response to be at least 10% of the slice maximum, the 5% damping maxima remain 36.31% for SM–FIM and 28.27% for RIM–FIM, confirming material model-form sensitivity beyond the smallest-response region.
Several high-damping maxima occur at the edge of the or range. These boundary or low-reference-level cases bound the scanned domain but should not be interpreted as typical responses. More generally, structural agreement does not guarantee human-coordinate agreement because model form changes both coupled modal placement and coordinate-specific participation.
The associated model-dependent shifts in critical jumping frequency are examined in Section 4.4 using the stricter resolved-interior criterion.
4.4. Critical Jumping-Frequency Shifts
Amplitude discrepancies alone do not indicate whether model form also changes the location of the governing excitation condition. The signed shift defined in Equation (21) was therefore evaluated for both and . Negative values correspond to a lower critical jumping frequency than the FIM reference and positive values to a higher one. For the results reported below, a shift is regarded as resolved only when both compared models have interior maxima.
Figure 9 shows resolved interior critical jumping-frequency shifts at = 3% for the structural and human-coordinate responses. Boundary-controlled points are excluded from the colored shift field and are shown as gray/outlined regions rather than being treated as resolved resonance shifts.
Figure 9.
Resolved interior shift in the critical jumping frequency at = 3%: (a) governing structural response, SM–FIM; (b) governing structural response, RIM–FIM; (c) governing human-coordinate response, SM–FIM; and (d) governing human-coordinate response, RIM–FIM. Color denotes the signed difference between the comparison-model and FIM critical jumping frequencies; blue and red indicate lower and higher resolved critical frequencies relative to FIM, respectively. Gray/outlined regions indicate that either model has its governing maximum at a search boundary and are not assigned a resolved shift.
For the structural response, the largest resolved interior shifts are 0.21 Hz for SM–FIM and 0.19 Hz for RIM–FIM. The alternating positive and negative bands closely follow the branch-transition regions in Figure 7, showing that a simplified formulation can select a different governing harmonic or nearby coupled branch even when adjacent response amplitudes are similar.
For the human-coordinate response, the corresponding resolved maxima are 0.20 Hz for SM–FIM and 0.14 Hz for RIM–FIM. Their spatial pattern is related to, but not identical with, the structural map because the governing harmonic depends on coordinate-specific modal participation as well as on the coupled modal frequencies.
The frequency-shift and amplitude-discrepancy maps must therefore be interpreted together: a small critical-frequency shift does not guarantee a small amplitude discrepancy, while a relatively large shift can occur within a narrow branch transition. The two diagnostics address different consequences of model form.
Boundary-controlled cases remain informative for screening the prescribed 1.5–2.8 Hz interval, but they are censored domain results. A wider or adaptively refined frequency search would be required before interpreting those cases as unconstrained resonance relocation.
4.5. Modal Shift and Harmonic-Resonance Mechanism
The discrepancy maps in Figure 7 and Figure 8 and the resolved-shift map in Figure 9 identify where model-form effects occur, whereas Figure 10 illustrates how they arise. Two representative parameter points are examined: an S point associated with a pronounced structural-response discrepancy and an H point associated with a pronounced human-coordinate discrepancy. For each point, the coupled modal frequencies are compared with the governing harmonic frequency, the complete response spectra are shown over the jumping-frequency range, and the harmonic contributions are evaluated at the peak selected by each model.
Figure 10.
Modal and harmonic mechanisms at representative points: (a) structural modal–harmonic alignment; (b) human modal–harmonic alignment; (c) structural-response spectra; (d) human-coordinate response spectra; (e) structural harmonic contributions; and (f) human-coordinate harmonic contributions. In the alignment panels, crosses denote the governing harmonic frequency and colored markers denote the coupled modes; the response and contribution panels compare FIM, RIM, and SM.
At the S point ( = 0.03, = 7.40 Hz, and = 1%), the upper coupled mode lies close to the governing third harmonic. The structural spectra in Figure 10c show a lower FIM peak than the RIM and SM peaks, and Figure 10e confirms that the third harmonic dominates the response in all three formulations. The maximum model-form discrepancy at this point is 42.1%. The difference is therefore traced to model-dependent detuning of the upper coupled mode relative to the same discrete loading harmonic, rather than to a uniform scaling of all harmonic components.
At the H point ( = 0.03, = 8.25 Hz, and = 5%), the governing third harmonic also lies close to the upper coupled mode. The FIM human-coordinate spectrum in Figure 10d rises above the RIM and SM spectra, and Figure 10f shows the largest third-harmonic contribution for FIM. The model-form discrepancy at this point is 24.1%. This contrast shows that the same modal–harmonic detuning mechanism can increase or decrease a response depending on the response coordinate and modal participation.
Together, the two representative cases establish a common mechanism: changing the mass-matrix formulation changes the coupled modal properties and coordinate-specific participation; this alters the alignment of discrete jumping-load harmonics with the coupled modes; and the resulting detuning changes both response amplitude and the excitation frequency at which the governing response occurs. A universal conservative ordering of FIM, RIM, and SM therefore does not exist.
4.6. Robustness of the Model-Form Response Patterns
The robustness of the model-form discrepancy patterns and modal–harmonic interpretations identified in Section 4.2, Section 4.3, Section 4.4 and Section 4.5 was assessed against three loading and numerical controls that can influence a harmonic parametric study: the contact ratio used to define the jumping-load waveform, the retained harmonic order, and the jumping-frequency increment. In addition, a population-grounded BMR sensitivity analysis was performed at the FIM population Q1, median, and Q3 values of 0.6600, 0.7491, and 0.8908, respectively. For this analysis, the human natural frequency (6.2197 Hz), human damping ratio (24.995%), generalized-mass relations defined in Equation (8), and complete external parameter domain were held unchanged, while only the BMR-dependent generalized-mass ratios were updated. This one-at-a-time variation is intended as a controlled BMR sensitivity check rather than a joint propagation of population parameter uncertainty. For all robustness and sensitivity checks, both the domain maximum and the 95th percentile over the sampled parameter grid were monitored. The latter is a descriptive grid statistic under the uniform sampling used here and is not a probabilistic engineering percentile.
Figure 11a,b shows that the contact ratio mainly affects the most localized SM–FIM extremes. As the contact ratio increases from 0.35 to 0.45, the structural SM–FIM maximum decreases from 178.02% to 140.52% and the human-coordinate maximum from 165.01% to 128.54%, whereas the corresponding RIM–FIM maxima remain near 117% and 101%, respectively. The 95th percentiles over the sampled parameter grid vary much less than these extremes. Thus, the assumed pulse shape affects the magnitude of isolated worst-case peaks but does not remove the broader model-form discrepancy pattern.
Figure 11.
Robustness of the structural and human-coordinate model-form discrepancy metrics: (a) structural response versus contact ratio; (b) human-coordinate response versus contact ratio; (c) structural response versus retained harmonic order ; (d) human-coordinate response versus retained harmonic order ; (e) structural response versus jumping-frequency increment; and (f) human-coordinate response versus jumping-frequency increment. Solid curves show domain maxima and dashed curves show the 95th percentile over the sampled parameter grid; blue denotes SM–FIM and orange denotes RIM–FIM.
The population-grounded BMR sensitivity analysis gives a similar distinction between localized extrema and the broader discrepancy field. At the BMR Q1, median, and Q3 values, the sampled-grid 95th percentiles of the structural SM–FIM discrepancy were 56.09%, 54.51%, and 52.41%, respectively, while the corresponding RIM–FIM values were 46.92%, 46.79%, and 46.53%. For the analytical human-coordinate response, the corresponding 95th percentiles were 33.47%, 32.31%, and 30.23% for SM–FIM and 30.17%, 29.40%, and 28.49% for RIM–FIM. The domain maxima varied more strongly over the same BMR range, spanning 146.67–157.44% and 105.54–135.79% for the structural SM–FIM and RIM–FIM comparisons, respectively, and 129.21–148.04% and 90.36–118.37% for the corresponding analytical human-coordinate comparisons. Thus, BMR influences the magnitude of localized worst-case discrepancies, whereas the sampled-grid 95th-percentile trends remain comparatively stable over the population interquartile range.
The harmonic-order study in Figure 11c,d shows convergence once the fifth harmonic is retained. Increasing from five to six or eight changes the domain maxima only negligibly and produces only small changes in the sampled-grid 95th percentiles. Figure 11e,f gives the complementary frequency-step check using = 0.020, 0.010, and 0.005 Hz. The structural maxima and all RIM–FIM maxima are unchanged to the reported precision; the human-coordinate SM–FIM maximum changes only from 135.92% at 0.010 Hz to 136.50% at 0.005 Hz. The six-harmonic representation and 0.01 Hz frequency increment adopted in the principal analysis are therefore numerically adequate for the reported comparisons.
Overall, the sensitivity checks preserve the principal response patterns and mechanisms established in Section 4.2, Section 4.3, Section 4.4 and Section 4.5. The sampled-grid 95th-percentile trends remain comparatively stable over the population BMR interquartile range and under changes in contact ratio, harmonic truncation, and jumping-frequency resolution, whereas localized domain maxima are more condition-sensitive, particularly to BMR and contact ratio. These results indicate that the broader model-form discrepancy pattern is not dependent on the single-median-BMR baseline or on the selected harmonic truncation and frequency-grid resolution. Nevertheless, localized worst-case ratios require more cautious interpretation when the assumed BMR or contact ratio changes, when the FIM reference response is relatively small, or when the governing peak is boundary controlled.
5. Discussion
5.1. Principal Findings and Response-Specific Model-Form Effects
The results distinguish calibration agreement from predictive equivalence. Under matched five-parameter calibration, the independently calibrated SM, RIM, and FIM all reproduce the same population structural FRFs with broadly similar agreement, with median complex NRMSE values of 0.0705, 0.0786, and 0.0738, respectively. In contrast, the no-refit RIM, which inherits the participant-specific FIM parameter set and differs only through suppression of the coupling-associated inertia terms, gives a substantially larger median NRMSE of 0.3196. The comparison therefore indicates that model-specific parameter adjustment can compensate for differences in mass representation within the calibration observable, whereas holding the parameter set fixed exposes the dynamical effect of the omitted inertia terms.
That calibration compensation does not ensure agreement under rhythmic jumping. For the structural response, the largest SM–FIM and RIM–FIM model-form discrepancies are 146.67% and 117.10% at 1% structural damping, 43.79% and 42.51% at 3%, and 32.52% and 29.84% at 5%. The values above 100% occur at finite FIM response levels rather than at a vanishing denominator, although they remain localized resonance-sensitive extremes. At higher damping, some RIM–FIM domain maxima occur where the FIM response is relatively small and should therefore be interpreted as localized worst-case ratios rather than as evidence of uniformly large response differences.
The analytical human-coordinate response is at least as model-dependent. The corresponding maximum SM–FIM and RIM–FIM discrepancies are 135.92% and 101.08% at 1% structural damping, 46.15% and 40.93% at 3%, and 37.87% and 37.85% at 5%. The structural and human-coordinate discrepancy fields also have different spatial patterns. Consequently, agreement in structural response cannot be used as a proxy for agreement in the analytical human coordinate.
Taken together, these findings support an output- and resonance-specific interpretation of model-form sensitivity. The SM can remain useful when the required structural response lies in a low-sensitivity region, but that use is conditional rather than universal. The RIM is most informative as a controlled diagnostic formulation because comparison of its independently calibrated and no-refit routes separates calibration compensation from the effect of coupling-associated inertia terms. It should not be interpreted as a necessarily monotonic intermediate approximation between the SM and FIM.
5.2. Critical Jumping-Frequency Shifts and Modal–Harmonic Mechanism
The signed critical-frequency maps add information that cannot be inferred from response-amplitude discrepancies alone. Across the parameter plane, the SM and RIM can shift the critical jumping frequency to either side of the FIM value; the direction of the shift therefore changes with mass ratio, structural frequency, damping, and response coordinate. Regions for which either model reaches its maximum at the 1.5–2.8 Hz search boundary are not assigned a resolved interior shift. This distinction is important because a boundary-controlled optimum describes only the tested interval and should not be interpreted as an unconstrained resonance relocation.
The mechanism is the interaction between model-dependent coupled modes and the discrete loading harmonics. At the representative structural-response point with a human-to-structure mass ratio of 0.03, structural frequency of 7.40 Hz, and 1% structural damping, the upper coupled mode lies close to the governing third harmonic. The FIM structural peak is lower than the corresponding RIM and SM peaks, and the third harmonic dominates all three responses; the maximum model-form discrepancy at this point is 42.1%. At the representative human-coordinate response point with the same mass ratio, structural frequency of 8.25 Hz, and 5% damping, the governing third harmonic again lies close to the upper coupled mode, but the FIM human-coordinate peak exceeds those of the RIM and SM; the corresponding discrepancy is 24.1%.
These two cases show that the same underlying detuning mechanism can increase or decrease the response depending on the response coordinate and modal participation. Changing the mass-matrix formulation changes the coupled modal properties, which changes the alignment between a discrete jumping-load harmonic and the coupled modes, and in turn changes both the response amplitude and the excitation frequency at which the governing response occurs. A universal conservative ordering of the SM, RIM, and FIM therefore does not exist. Assessments tied to a prescribed activity frequency or narrow frequency band should examine the pointwise detuning response rather than relying only on a domain-wide maximum.
5.3. Engineering Model-Selection Guidance
For practical screening, the structural model-form discrepancy can be divided into descriptive bands: low sensitivity below 5%, moderate sensitivity from 5% to below 10%, and high sensitivity at or above 10%. These bands are not serviceability acceptance limits; they summarize the consequence of stationary-human model choice within the present comparison. The actual acceptance limit must come from the applicable vibration standard, design guidance, or project-specific criterion.
Structural damping is a strong modifier of model sensitivity but is not a universal safeguard. The largest discrepancies occur for the 1% damping slice, so lightly damped floors and grandstands require particular care near harmonic resonance. At higher damping, an SM calculation can be useful for preliminary structural screening in regions where the discrepancy is small, but the simplified-model result should be checked against the FIM reference when the response lies near an acceptance threshold, when the activity frequency is close to a sharply tuned peak, or when the decision depends on a narrow frequency range. The RIM is most useful for mechanism diagnosis rather than as a default prediction model.
For analyses that explicitly require the analytical human coordinate, the comparison should retain the FIM as the controlled reference formulation because human-coordinate discrepancy is not inferred reliably from structural agreement.
The distinction between isolated maxima and the 95th percentile over the sampled parameter grid is also useful for reporting. The robustness and sensitivity checks show that the sampled-grid 95th-percentile trends are comparatively stable over the FIM population BMR interquartile range and with respect to contact ratio, harmonic truncation, and jumping-frequency step, whereas isolated maxima can change more strongly, particularly with BMR and contact ratio. The maximum is therefore useful for conservative resonance screening, while the sampled-grid 95th percentile provides a more stable descriptive summary of the broader parameter field; it should not be interpreted as a probabilistic engineering percentile.
To illustrate how stationary-human model form can affect a serviceability decision near a prescribed response threshold, the upper value of the 4–7%g peak-acceleration range recommended in AISC Design Guide 11 for an affected occupancy classified as “rhythmic activity only” was adopted as the criterion for an illustrative threshold-sensitive case [25]. SCI P354 also cites this AISC range while noting that no single generally agreed acceptance criterion exists for structures subjected to rhythmic crowd activity [26]. The case is intentionally illustrative rather than statistically representative and was selected from within the investigated parameter domain to examine a condition close to the chosen response threshold.
The RMS acceleration used in the preceding model-form analysis provides a common response measure for comparing the three formulations. However, the unweighted RMS quantities defined in Equation (15), particularly the analytical human-coordinate RMS acceleration, are not themselves standardized human-vibration comfort measures; formal assessments under ISO 2631-1 and BS 6472-1 require frequency weighting and the corresponding exposure-based assessment procedure [27,28]. For the present engineering illustration, structural peak acceleration was therefore used to remain consistent with the peak-acceleration criterion adopted from AISC Design Guide 11 and SCI P354. The peak structural acceleration was obtained from the same complex six-harmonic response solution by superposing the retained harmonic acceleration components over one fundamental jumping period with their amplitudes and phases preserved and taking the maximum absolute value of the reconstructed steady-state acceleration.
Using the population-median stationary-human natural frequency, damping ratio, and BMR reported in Table 6, the illustrative system has a structural modal mass of 100,000 kg, a structural natural frequency of 8.43 Hz, 5% structural damping, a human-to-structure mass ratio of 0.16, a jumping frequency of 2.8 Hz, a contact ratio of 0.35, a per-jumper static weight of 785 N, six retained harmonics, and 19 synchronized jumpers. The human-to-structure mass ratio of 0.16 represents the equivalent passive stationary-human mass included in the lumped HSI subsystem, whereas the 19 synchronized jumpers constitute the separate active excitation source. The example therefore represents an equivalent single-mode HSI calculation rather than a direct simulation of a specified crowd arrangement. The predicted peak structural accelerations are 7.1289%g for the SM, 7.2338%g for the RIM, and 6.0315%g for the FIM. Relative to the selected 7%g criterion, the same modeled case therefore exceeds the limit for the SM and RIM but remains below it for the FIM. When the number of synchronized jumpers is varied with the remaining parameters unchanged, the first exceedance occurs at 19 jumpers for the SM and RIM and at 23 jumpers for the FIM; jumper counts from 19 to 22 therefore form a model-sensitive decision interval. This example demonstrates that stationary-human model form can change an engineering serviceability decision when the predicted response lies close to a stated acceptance threshold; the selected 7%g value represents the upper end of the cited rhythmic-activity range rather than a universal serviceability limit. The resulting response-specific model-selection guidance is summarized in Table 7.
Table 7.
Response-specific guidance for selecting a stationary-human model.
5.4. Relation to the Experimental Evidence and Previous HSI Studies
The experimental and parametric components have complementary roles. The population FRF program shows that different stationary-human formulations can fit the same structural observable after independent identification. The previously acquired standing-and-jumping measurements then provide a structural-response check under a realistic multi-harmonic input, while the parameter study extends the comparison beyond the tested specimen. Read together, these components show why a good structural FRF fit is necessary but insufficient evidence for predictive equivalence under a different loading condition.
The jumping-load audit also shows that excitation representation contributes to model-experiment discrepancy. Replacing the idealized half-sine harmonics with coefficients derived from the measured force records substantially reduces the acceleration error at 2.0 and 2.2 Hz, but not at 1.8 Hz, and does not consistently improve displacement. Load representation is therefore one source of discrepancy rather than a complete explanation. The fact that the closest stationary-human model changes with response quantity and jumping frequency further argues against assigning predictive superiority from a single test condition.
The FIM is used throughout Section 4 as a controlled comparison reference, not as experimental ground truth. It retains the complete coupling-associated mass terms among the three formulations considered here, but its generalized human-mass parameters are identified through the selected model and remain subject to finite identifiability. The profile-objective assessment in Figure 3d, together with the formulation-dependent fitted mass quantities, supports interpreting these parameters as model-calibration quantities rather than uniquely identified physiological mass fractions. Accordingly, the reported percentages are inter-model discrepancies relative to the FIM reference. The participant-level profile widths quantified in Section 3.1 further show that an interior population-median BMR does not imply unique identification for individual datasets.
The modal splitting and damping changes reported for occupied structures [10], together with the frequency- and mass-ratio dependence established in stationary-HSI studies [19,29], provide a consistent context for the modal–harmonic behavior observed here. The individual-to-crowd study in [18] further shows that equivalent stationary-human parameters can retain systematic group-level behavior for small standing groups within the integrative framework. The present results extend this evidence by showing that model-form choice can change not only structural-response amplitude but also the analytical human-coordinate response and the activity frequency at which each response is maximized. This extension should nevertheless be interpreted within the single-coordinate and small-group evidence base rather than as direct validation for dense crowds.
5.5. Scope, Limitations and Future Work
The analytical framework uses a linear single-mode structural oscillator, one vertical stationary-human coordinate, frequency-independent parameters within each case, and a prescribed periodic jumping load. It does not represent active postural feedback, nonlinear joint behavior, time variation in human parameters, loss of contact beyond the prescribed load model, interaction among multiple stationary occupants, or coupling among multiple structural modes. These simplifications are appropriate for controlled model-form comparison but limit direct extrapolation to dense crowds, strongly nonlinear jumping, or multimode structures.
The rhythmic-jumping experimental comparison is also deliberately limited in scope. It uses one standing participant and one jumping participant, three nominal jumping frequencies, two repeated tests per frequency, and a rig damping ratio of 7.2%. The largest parametric discrepancies occur for the 1% damping slice, which was not directly reproduced by the experimental rig. The experimental results therefore support the structural-response comparison for the tested configuration but do not constitute direct validation of the most lightly damped parametric extremes.
The repeated tests quantify short-term repeatability but do not constitute a complete metrological uncertainty budget. Uncertainty associated with sensor calibration, force recovery, identified structural damping, contact-ratio estimation, and fitted human parameters was not propagated jointly through the response maps. The larger acceleration scatter at 2.2 Hz and the sensitivity of localized maxima to contact ratio show that these experimental and loading uncertainties can matter near resonance. Future uncertainty analysis should distinguish measurement uncertainty, parameter-identification uncertainty, load-model uncertainty, and stationary-human model-form discrepancy rather than combining them into a single error term.
Only structural response was measured in the rhythmic-jumping experiment, so the human-coordinate comparisons in Section 4 remain analytical rather than directly validated. In addition, similar structural FRFs can arise from different parameter combinations, as illustrated by the formulation-dependent calibration results and the finite-width BMR profile. Independent human-motion measurements would be needed both to reduce this identifiability ambiguity and to test coordinate-specific predictions. Any connection between the modeled human coordinate and standardized comfort metrics would also require the appropriate frequency weighting and metric definition. This calibration-identifiability limitation is distinct from numerical search robustness: the multi-start procedure reduces sensitivity to local optimization minima but does not remove the finite profile ambiguity.
Future work should combine synchronized structural, force, and human-motion measurements; propagate population and measurement uncertainty through all three formulations; extend the analysis to multiple occupants and multiple structural modes; and examine nonlinear or time-varying contact. Wider or adaptively refined jumping-frequency searches would help separate genuine interior peak relocation from boundary effects. Full-scale floor and grandstand studies are also needed to test whether the response-specific model-form patterns identified here persist under realistic spatial crowd distributions and multimode structural dynamics.
6. Conclusions
This study combined population standing-human FRF calibration, re-analysis of previously acquired rhythmic-jumping measurements, and a multi-harmonic parametric analysis to examine how stationary-human model form influences structural and analytical human-coordinate responses. The main conclusions are as follows:
1. Under matched five-parameter calibration, the independently calibrated SM, RIM, and FIM achieved broadly similar agreement with the same measured population structural FRFs, with median complex NRMSE values of 0.0705, 0.0786, and 0.0738, respectively. In contrast, the no-refit RIM gave a median NRMSE of 0.3196 when the participant-specific FIM parameter set was inherited without re-optimization. Similar calibration agreement can therefore coexist with different mass representations, while holding the parameter set fixed exposes the dynamical consequence of the omitted coupling-associated inertia terms.
2. Structural-response model-form discrepancy is greatest in lightly damped, resonance-sensitive cases. Relative to the FIM comparison reference, the maximum SM–FIM and RIM–FIM discrepancies are 146.67% and 117.10% at 1% structural damping, 43.79% and 42.51% at 3%, and 32.52% and 29.84% at 5%. Increasing damping reduces the most severe amplification but does not eliminate model-form sensitivity across the investigated domain.
3. The analytical human-coordinate response is similarly model-dependent and cannot be inferred from structural agreement. The corresponding maximum SM–FIM and RIM–FIM discrepancies are 135.92% and 101.08% at 1% structural damping, 46.15% and 40.93% at 3%, and 37.87% and 37.85% at 5%. The structural and human-coordinate discrepancy fields have different spatial patterns, showing that response sensitivity to model form depends on the response quantity being assessed. These human-coordinate comparisons remain analytical.
4. Model form changes the critical jumping frequency as well as the response amplitude. At 3% structural damping, the largest resolved interior shifts relative to the FIM are 0.21 Hz for SM–FIM and 0.19 Hz for RIM–FIM in the structural response, and 0.20 Hz and 0.14 Hz, respectively, in the human-coordinate response. The shift changes sign across the parameter plane, so boundary-controlled optima must be distinguished from resolved interior resonances before frequency relocation is interpreted physically.
5. The governing mechanism is modal–harmonic detuning. At the representative structural-response point with a human-to-structure mass ratio of 0.03, structural frequency of 7.40 Hz, and 1% structural damping, the third harmonic governs and the model-form discrepancy is 42.1%. At the representative human-coordinate response point with the same mass ratio, structural frequency of 8.25 Hz, and 5% damping, the third harmonic again governs, but the discrepancy is 24.1% and the ordering of the model responses is reversed. A universal conservative ordering of the SM, RIM, and FIM therefore does not exist.
6. The broader discrepancy patterns remain comparatively stable over the population BMR interquartile range and under harmonic truncation and jumping-frequency-grid refinement, whereas the most localized maxima are more sensitive to BMR and contact ratio. These results support an output- and resonance-specific model-selection strategy: the SM can serve as a conditional structural-screening surrogate in low-sensitivity regions, the RIM is most useful as a diagnostic formulation for isolating mass-representation effects, and the FIM should be included as the common reference formulation when low damping, resonance tuning, or threshold sensitivity makes the omitted inertia terms consequential.
Author Contributions
C.Z.: Conceptualization, Data Curation, Investigation, Methodology, Validation, Writing—Original Draft. Q.Z.: Resources, Writing—Review and Editing. All authors have read and agreed to the published version of the manuscript.
Funding
This work was supported by the Research Project Supported by Shanxi Scholarship Council of China (Grant No. 2026-205), the Fund Program for the Scientific Activities of Selected Returned Overseas Professionals in Shanxi Province (Grant No. 20260060), and the Academic Research Projects of Taiyuan University (Grant Nos. 25TYKY113 and 25TYQN11).
Institutional Review Board Statement
The study was conducted in accordance with the Declaration of Helsinki and was approved by Research Ethics Committee 1 of The University of Manchester (project identification code: ethics/16305; date of approval: 23 August 2016).
Informed Consent Statement
Informed consent for participation was obtained from all subjects involved in the study.
Data Availability Statement
Data are contained within the article.
Conflicts of Interest
The authors declare that they have no known competing financial interests or personal relationships that could have appeared to influence the work reported in this paper.
References
- Sachse, R.; Pavic, A.; Reynolds, P. Human-structure dynamic interaction in civil engineering dynamics: A literature review. Shock Vib. Dig. 2003, 35, 3–18. [Google Scholar] [CrossRef] [Scilit]
- Jones, C.A.; Reynolds, P.; Pavic, A. Vibration serviceability of stadia structures subjected to dynamic crowd loads: A literature review. J. Sound Vib. 2011, 330, 1531–1566. [Google Scholar] [CrossRef] [Scilit]
- Matsumoto, Y.; Griffin, M.J. Mathematical models for the apparent masses of standing subjects exposed to vertical whole-body vibration. J. Sound Vib. 2003, 260, 431–451. [Google Scholar] [CrossRef] [Scilit]
- Hashim, R.; Ji, T.; Mandal, P.; Zhang, Q.; Zhou, D. Human-structure interaction experiments to determine the dynamic properties of the standing human body in vertical vibration. Structures 2020, 26, 934–946. [Google Scholar] [CrossRef] [Scilit]
- Brownjohn, J.M.W. Energy dissipation from vibrating floor slabs due to human-structure interaction. Shock Vib. 2001, 8, 315–323. [Google Scholar] [CrossRef] [Scilit]
- Busca, G.; Cappellini, A.; Manzoni, S.; Tarabini, M.; Vanali, M. Quantification of changes in modal parameters due to the presence of passive people on a slender structure. J. Sound Vib. 2014, 333, 5641–5652. [Google Scholar] [CrossRef] [Scilit]
- Yao, S.; Wright, J.R.; Pavic, A.; Reynolds, P. Experimental study of human-induced dynamic forces due to jumping on a perceptibly moving structure. J. Sound Vib. 2006, 296, 150–165. [Google Scholar] [CrossRef] [Scilit]
- Harrison, R.E.; Yao, S.; Wright, J.R.; Pavic, A.; Reynolds, P. Human jumping and bobbing forces on flexible structures: Effect of structural properties. J. Eng. Mech. 2008, 134, 663–675. [Google Scholar] [CrossRef] [Scilit]
- Abraham, N.M.; Williams, G.; Zivanovic, S. Impact of vertical vibrations on human rhythmic jumping. Structures 2023, 57, 105154. [Google Scholar] [CrossRef] [Scilit]
- Ellis, B.R.; Ji, T. Human-structure interaction in vertical vibrations. Proc. Inst. Civ. Eng. Struct. Build. 1997, 122, 1–9. [Google Scholar] [CrossRef] [Scilit]
- Reynolds, P.; Pavic, A. Vibration performance of a large cantilever grandstand during an international football match. J. Perform. Constr. Facil. 2006, 20, 202–212. [Google Scholar] [CrossRef] [Scilit]
- Baumann, V.; Adelaide, L.; Argoul, P. Crowd-structure interaction on building floors for event use-An experimental study. Infrastructures 2026, 11, 123. [Google Scholar] [CrossRef] [Scilit]
- El Asri, Y.; Couchaux, M.; Hjiaj, M.; Lukic, M. Spectral modelling approach for crowd-rhythmic activities performed on steel-concrete composite floors. Eng. Struct. 2024, 299, 117066. [Google Scholar] [CrossRef] [Scilit]
- Salyards, K.A.; Hua, Y. Assessment of dynamic properties of a crowd model for human-structure interaction modelling. Eng. Struct. 2015, 89, 103–110. [Google Scholar] [CrossRef] [Scilit]
- Xiong, J.; Chen, J.; Caprani, C. Spectral analysis of human-structure interaction during crowd jumping. Appl. Math. Model. 2021, 89, 610–626. [Google Scholar] [CrossRef] [Scilit]
- Xiong, J.; Chen, J. Random field model for crowd jumping loads. Struct. Saf. 2019, 76, 197–209. [Google Scholar] [CrossRef] [Scilit]
- Racic, V.; Pavic, A. Stochastic approach to modelling of near-periodic jumping loads. Mech. Syst. Signal Process. 2010, 24, 3037–3059. [Google Scholar] [CrossRef] [Scilit]
- Zhao, C.; Zhang, Q. Experimental assessment of the individual-to-crowd consistency of a stationary human-structure interaction model. Buildings 2026, 16, 2836. [Google Scholar] [CrossRef] [Scilit]
- Ji, T.; Zhou, D.; Zhang, Q. Models of a standing human body in vertical vibration. Proc. Inst. Civ. Eng. Struct. Build. 2013, 166, 367–378. [Google Scholar] [CrossRef] [Scilit]
- Zhou, D.; Han, H.; Ji, T.; Xu, X. Comparison of two models for human-structure interaction. Appl. Math. Model. 2016, 40, 3738–3748. [Google Scholar] [CrossRef] [Scilit]
- Caprani, C.C.; Ahmadi, E. Formulation of human-structure interaction system models for vertical vibration. J. Sound Vib. 2016, 377, 346–367. [Google Scholar] [CrossRef] [Scilit]
- Shahabpoor, E.; Pavic, A.; Racic, V. Structural vibration serviceability: New design framework featuring human-structure interaction. Eng. Struct. 2017, 136, 295–311. [Google Scholar] [CrossRef] [Scilit]
- Ditommaso, R.; Ponzo, F.C. Vertical ground-motion effects in base-isolated buildings: Preliminary observations from twin fixed-base and base-isolated structures during the 18 March 2025 Potenza sequence. Buildings 2026, 16, 482. [Google Scholar] [CrossRef] [Scilit]
- Sanayei, M.; Kayiparambil, P.A.; Moore, J.A.; Brett, C.R. Measurement and prediction of train-induced vibrations in a full-scale building. Eng. Struct. 2014, 77, 119–128. [Google Scholar] [CrossRef] [Scilit]
- American Institute of Steel Construction (AISC). Vibrations of Steel-Framed Structural Systems Due to Human Activity, 2nd ed.; Steel Design Guide 11; AISC: Chicago, IL, USA, 2016. [Google Scholar]
- Smith, A.L.; Hicks, S.J.; Devine, P.J. Design of Floors for Vibration: A New Approach; SCI P354; Steel Construction Institute: Ascot, UK, 2009. [Google Scholar]
- ISO 2631-1:1997; Mechanical Vibration and Shock-Evaluation of Human Exposure to Whole-Body Vibration-Part 1: General Requirements. International Organization for Standardization (ISO): Geneva, Switzerland, 1997.
- BS 6472-1:2008; Guide to Evaluation of Human Exposure to Vibration in Buildings—Part 1: Vibration Sources Other Than Blasting. British Standards Institution: London, UK, 2008.
- Zhao, C. Predicting Responses of a Human-Structure Interaction System Subjected to Rhythmic Crowd Loads. Ph.D. Thesis, The University of Manchester, Manchester, UK, 2023. [Google Scholar]
- Zhao, C.; Ji, T. Predicting responses of a human-structure interaction system subjected to rhythmic crowd loads. J. Build. Eng. 2025, 116, 114522. [Google Scholar] [CrossRef] [Scilit]
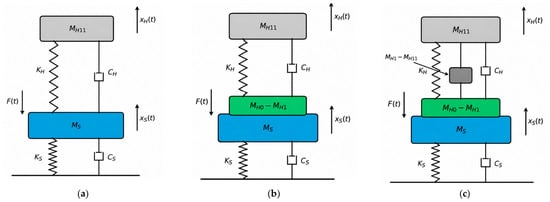
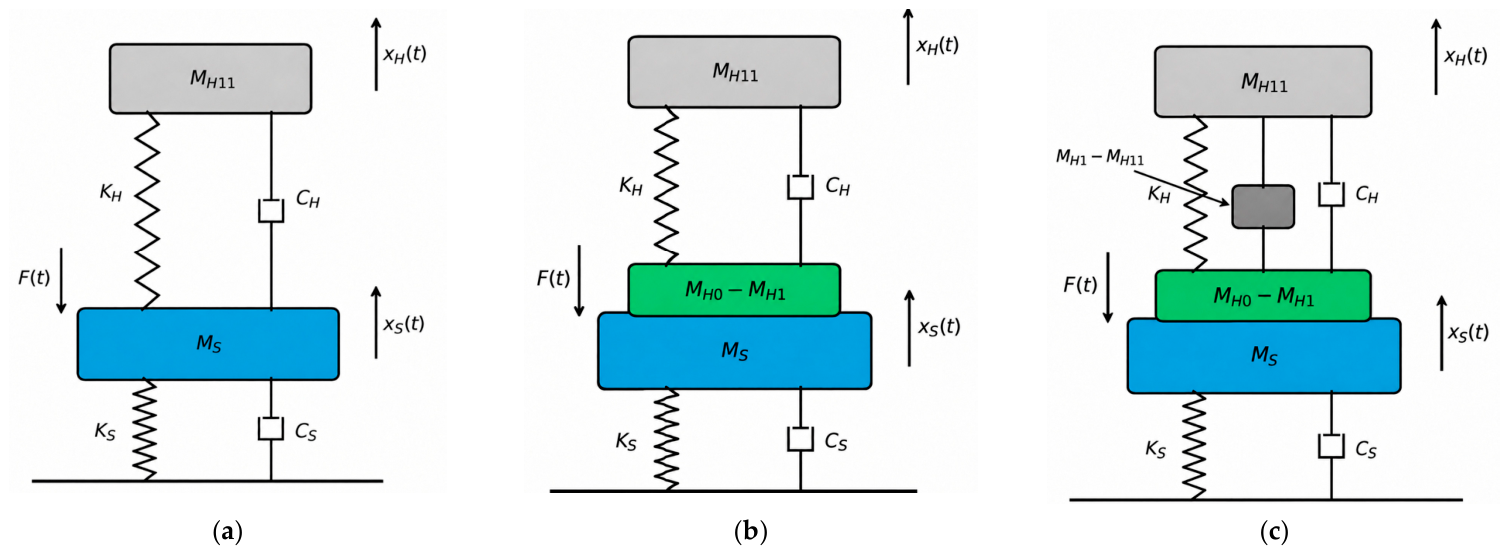
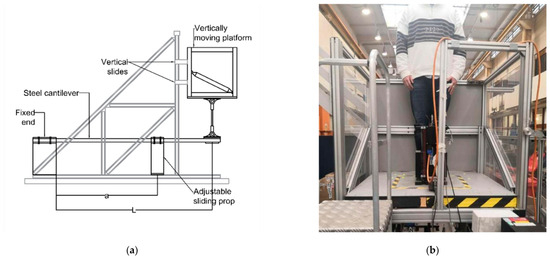
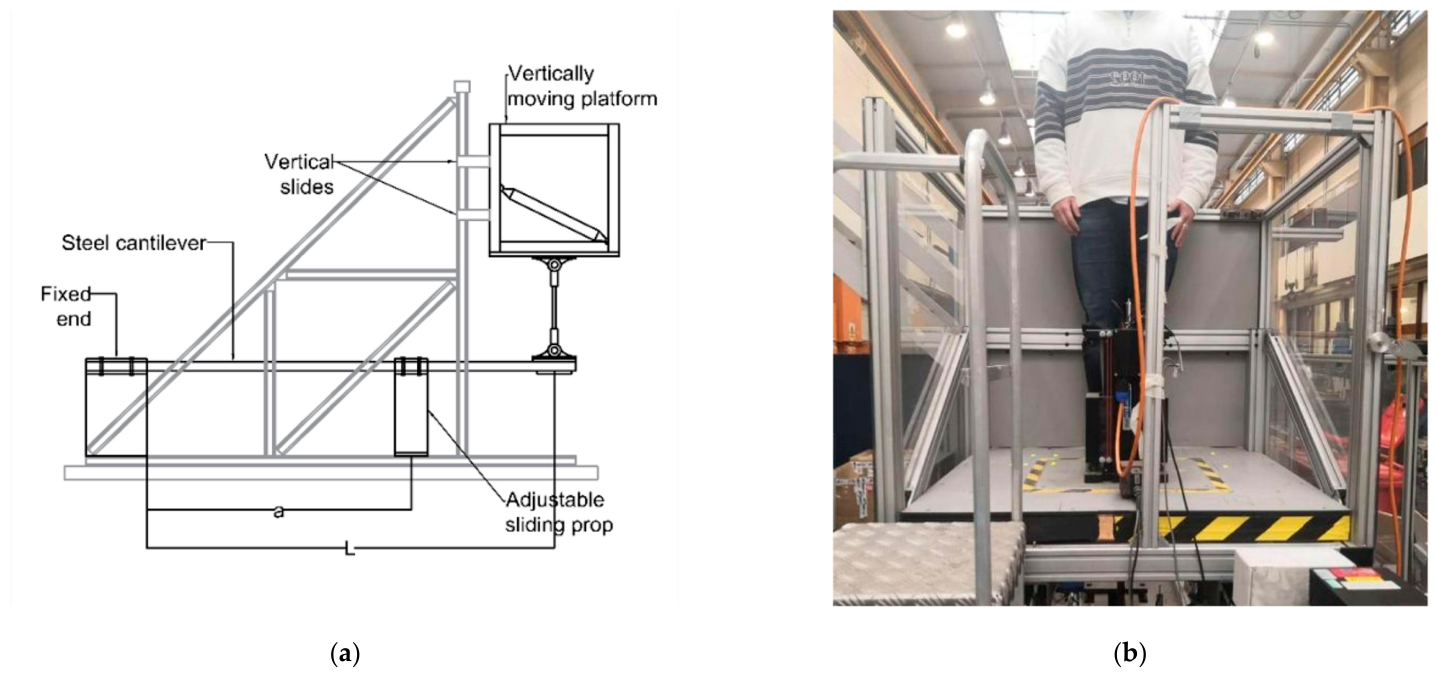
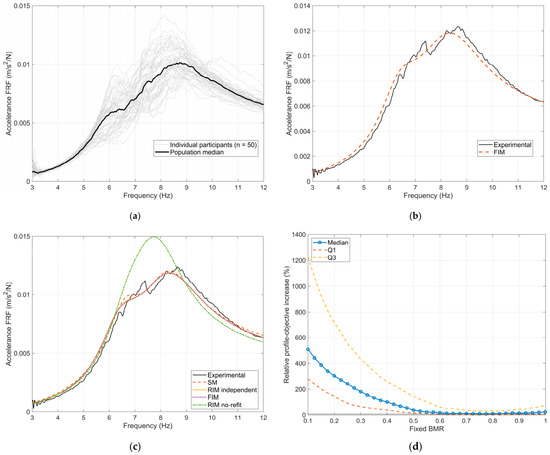
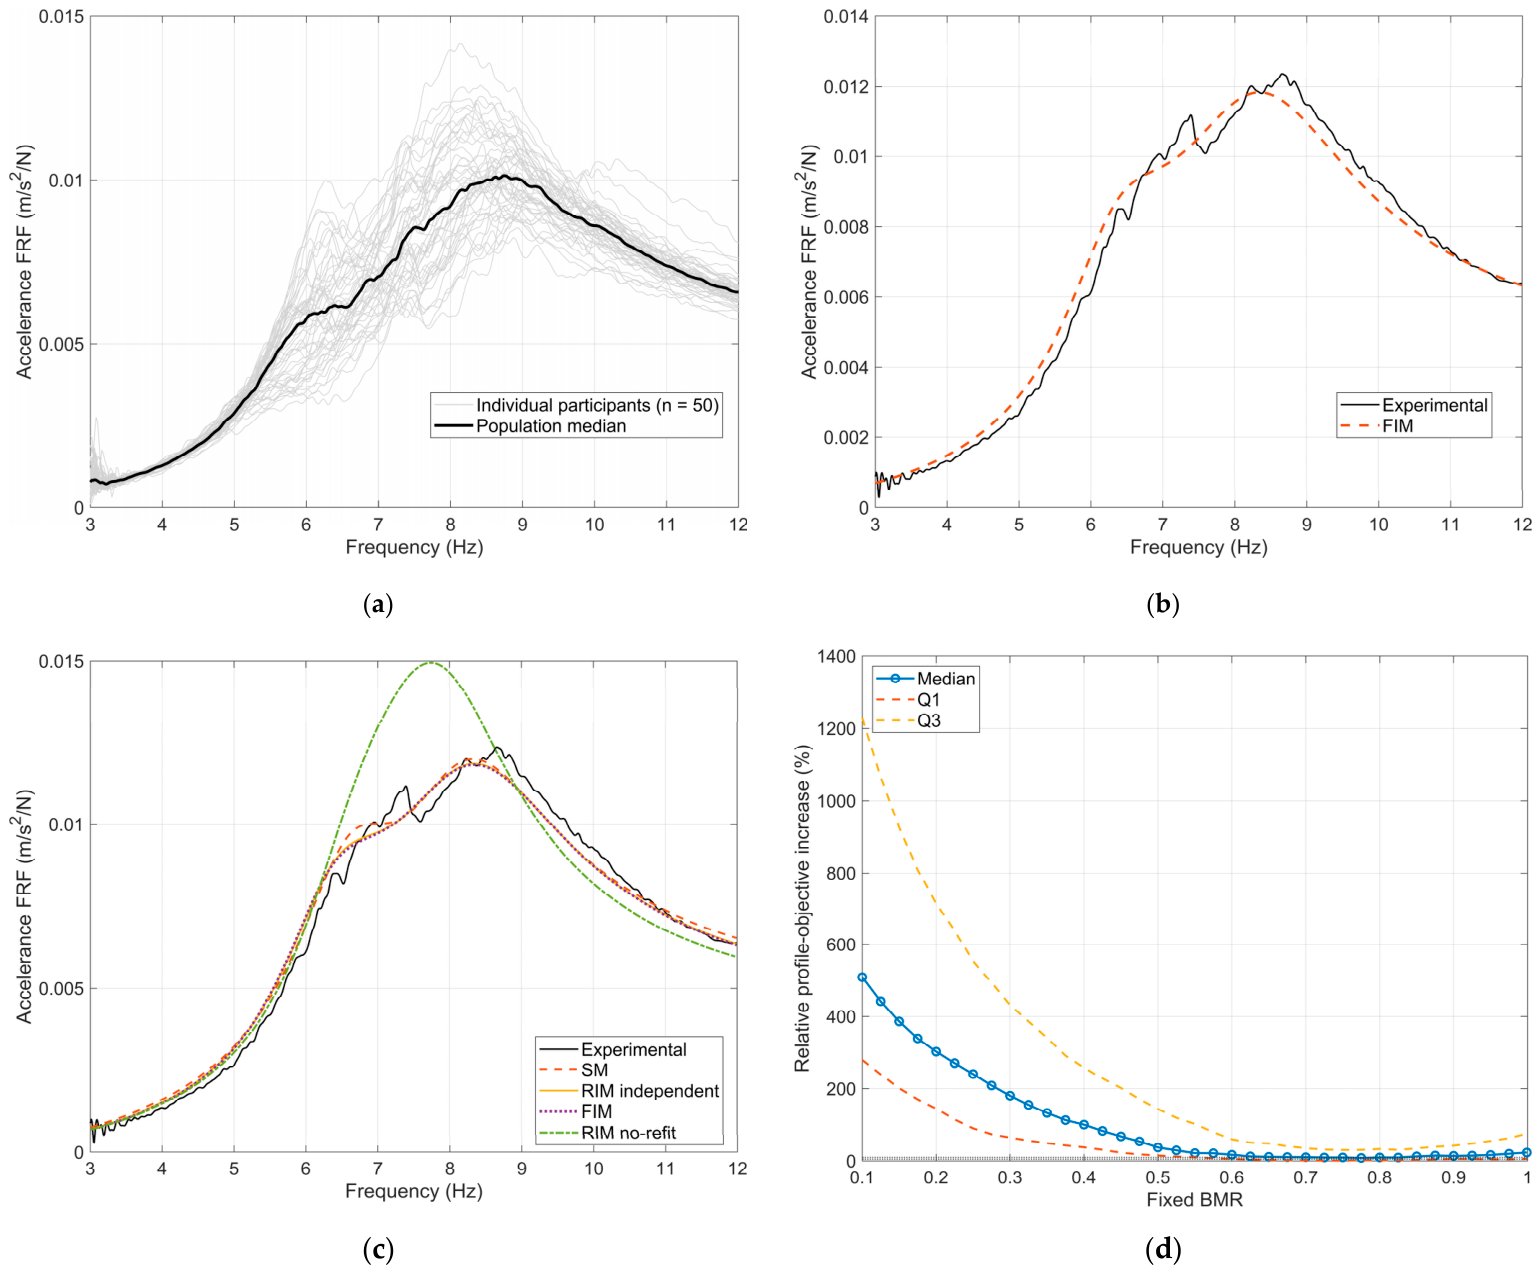
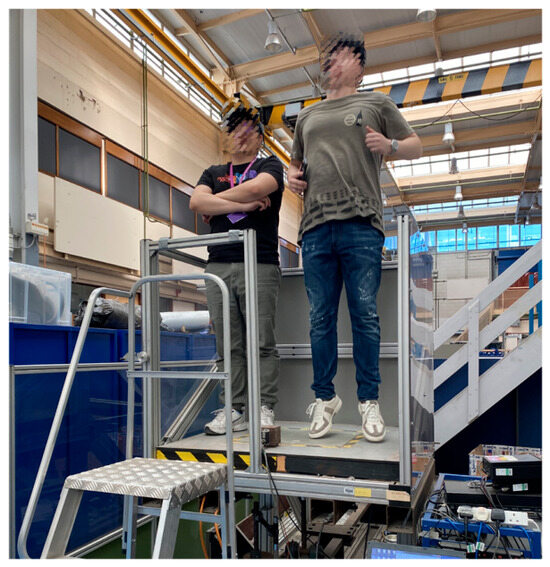
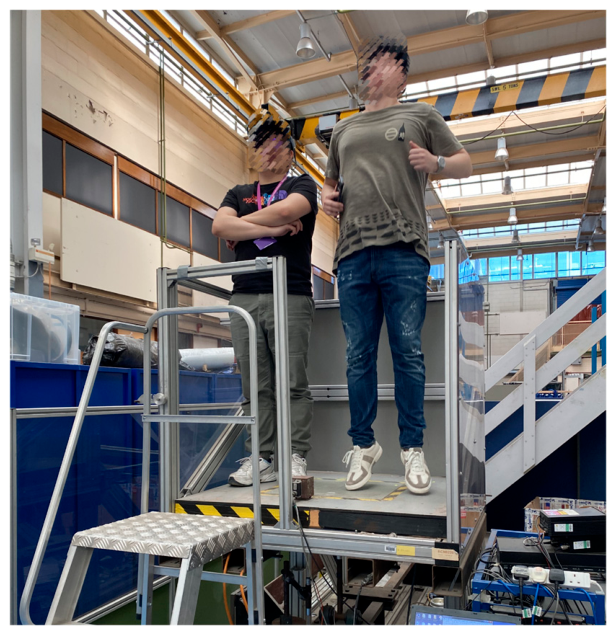
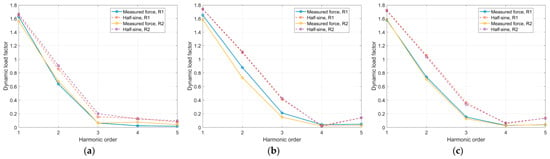
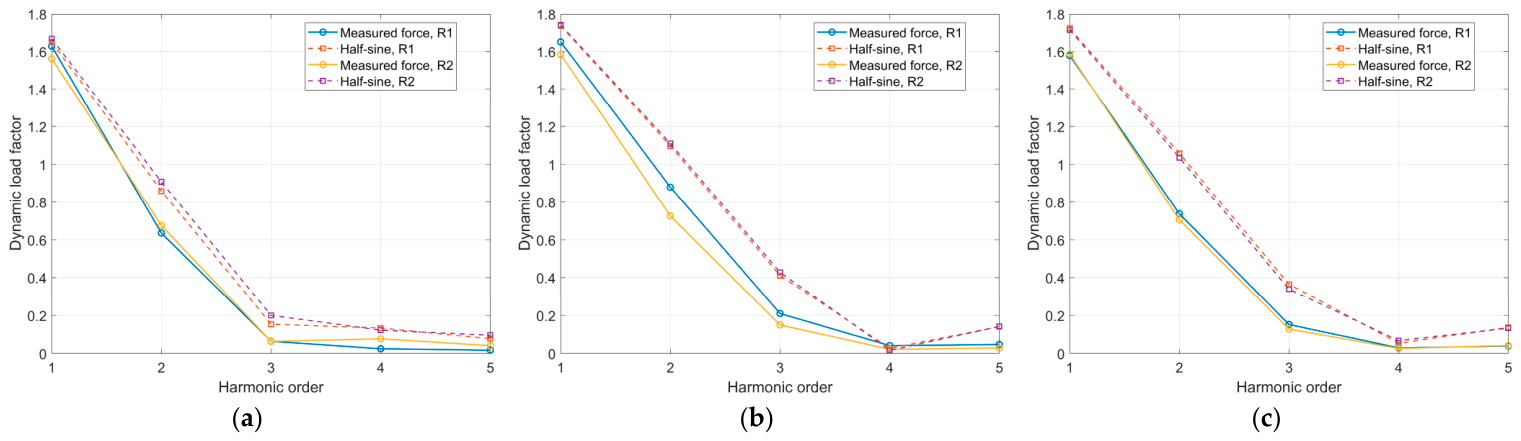
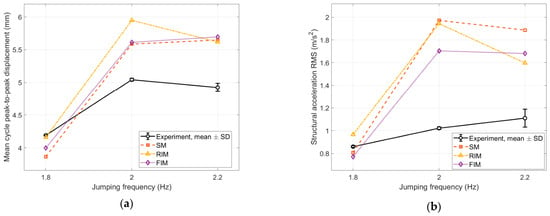
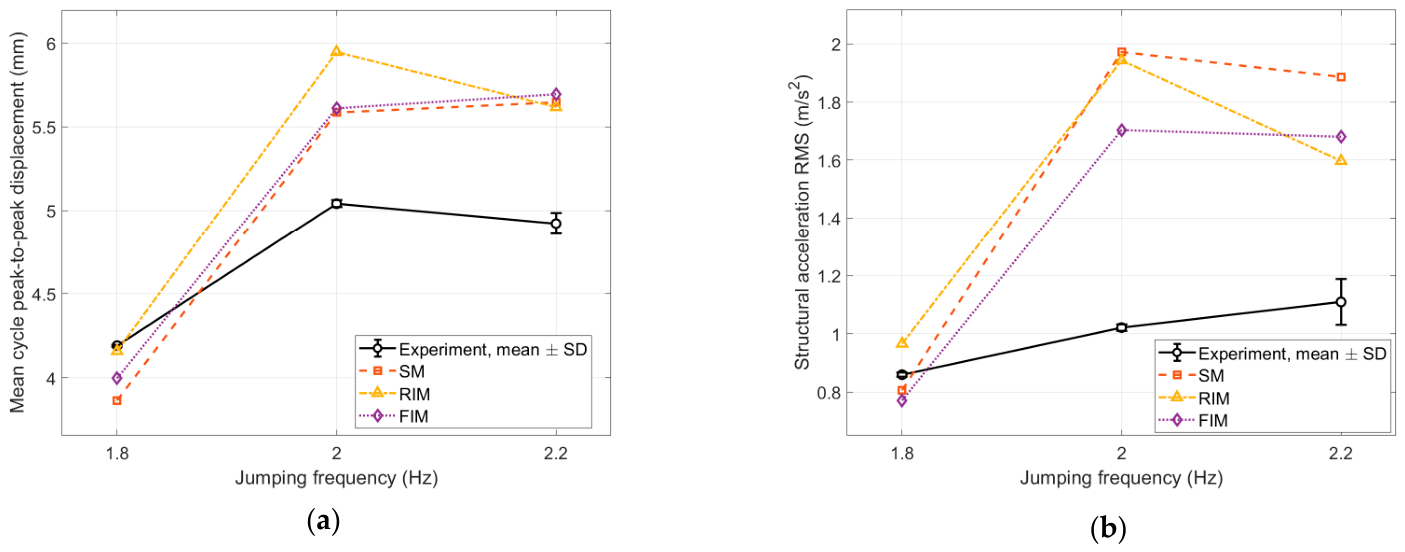
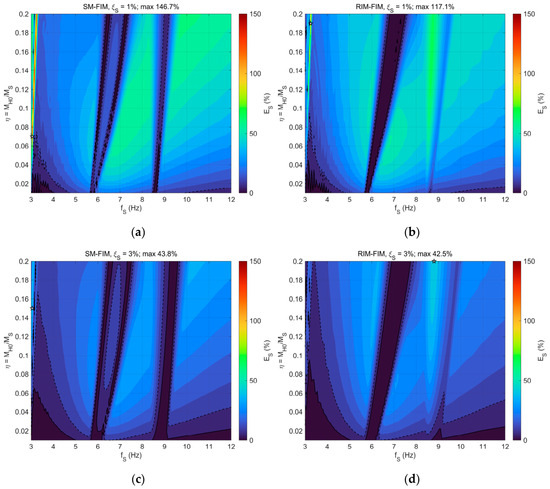
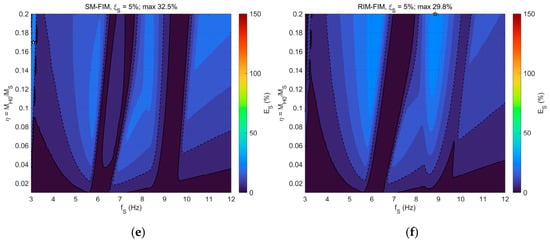
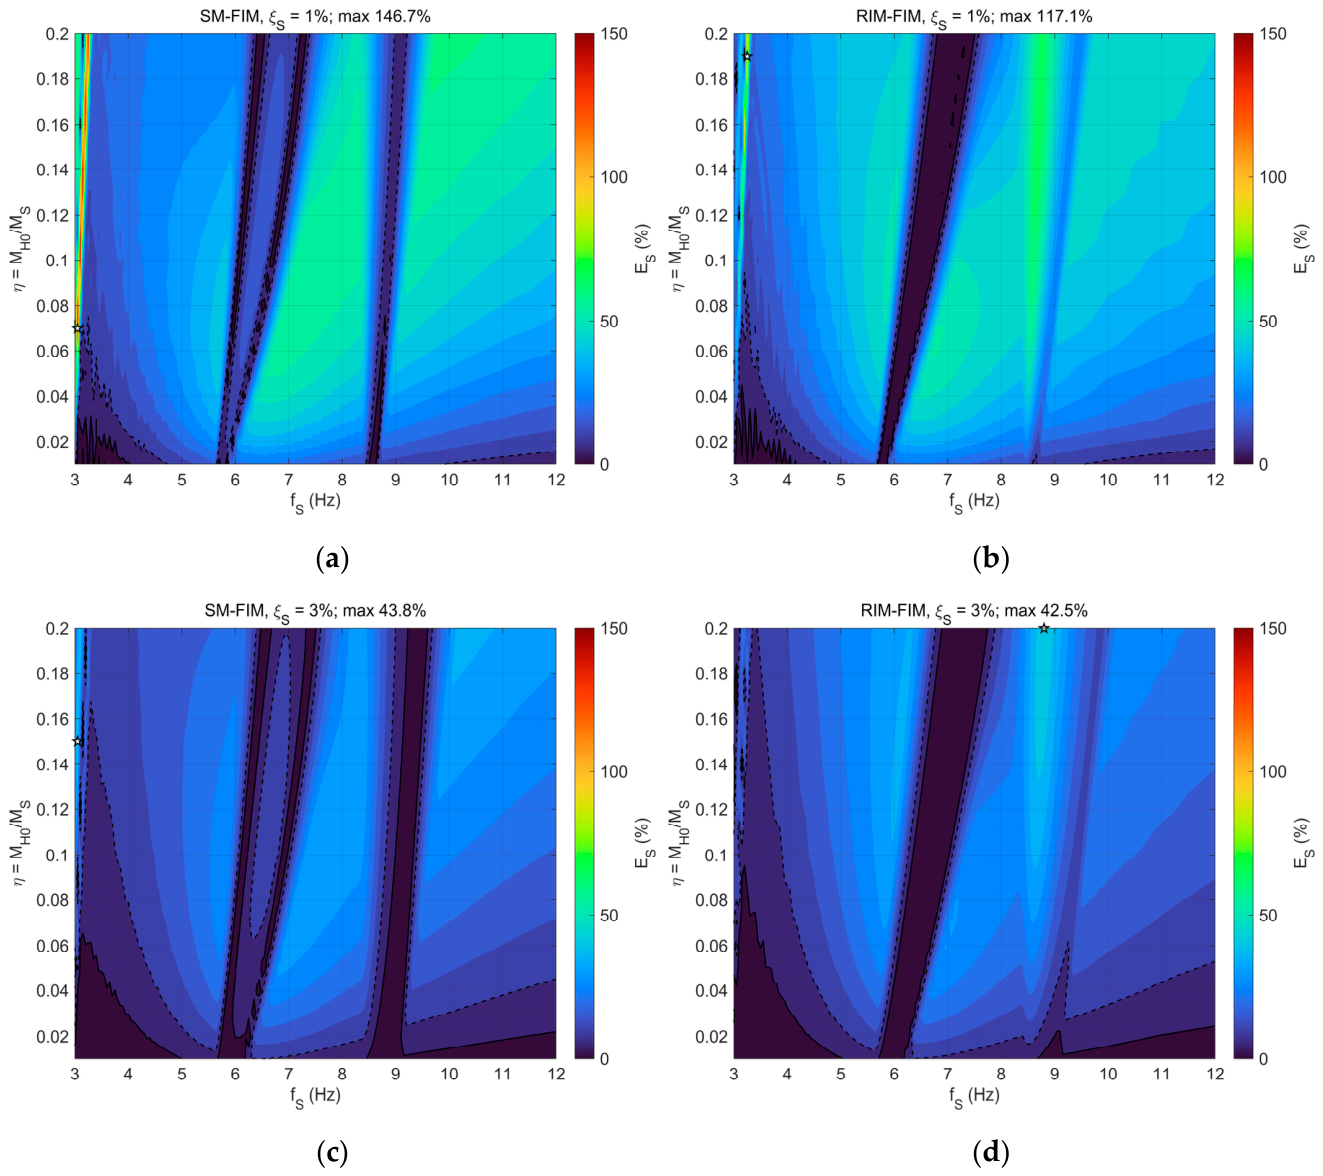
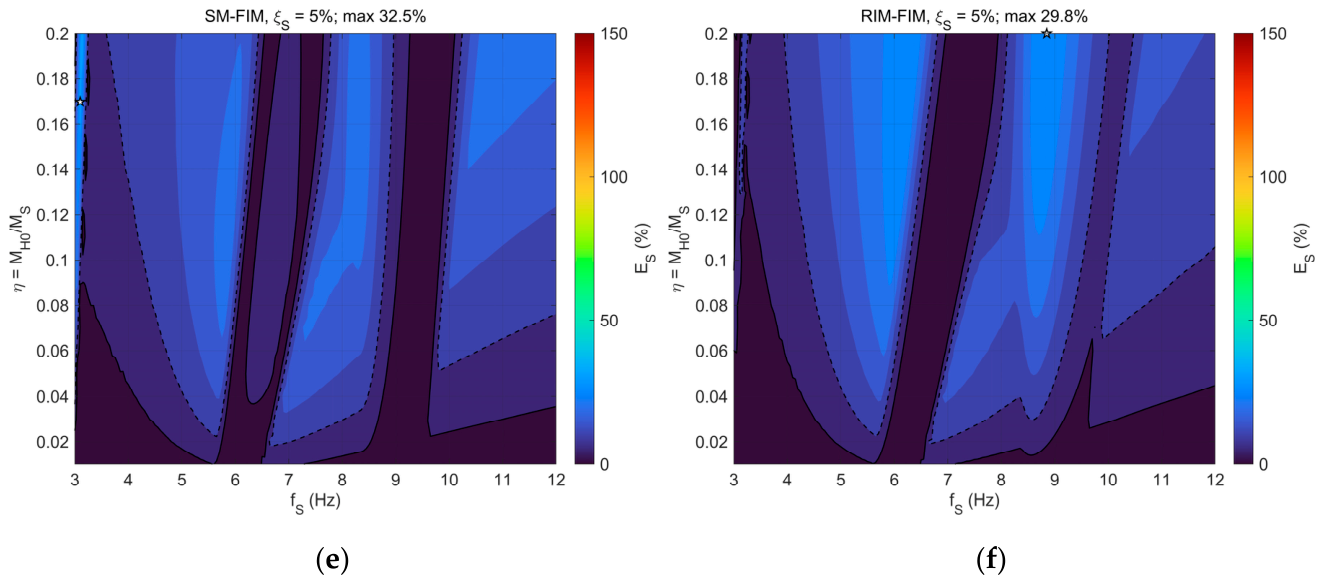
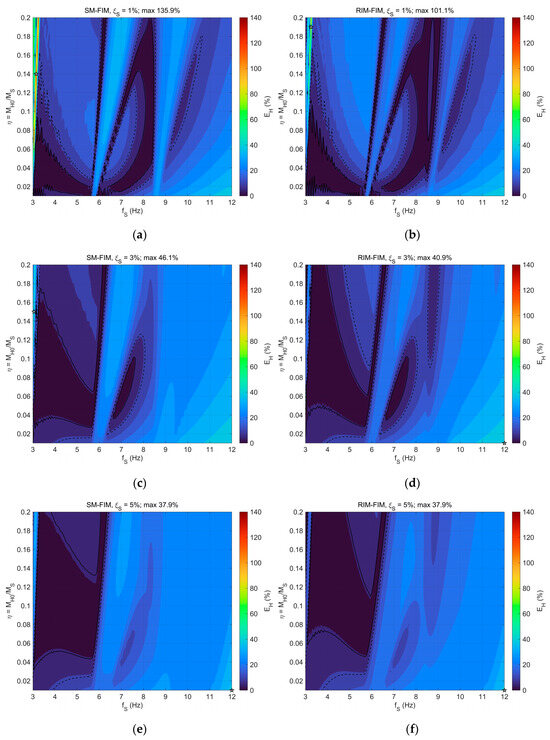
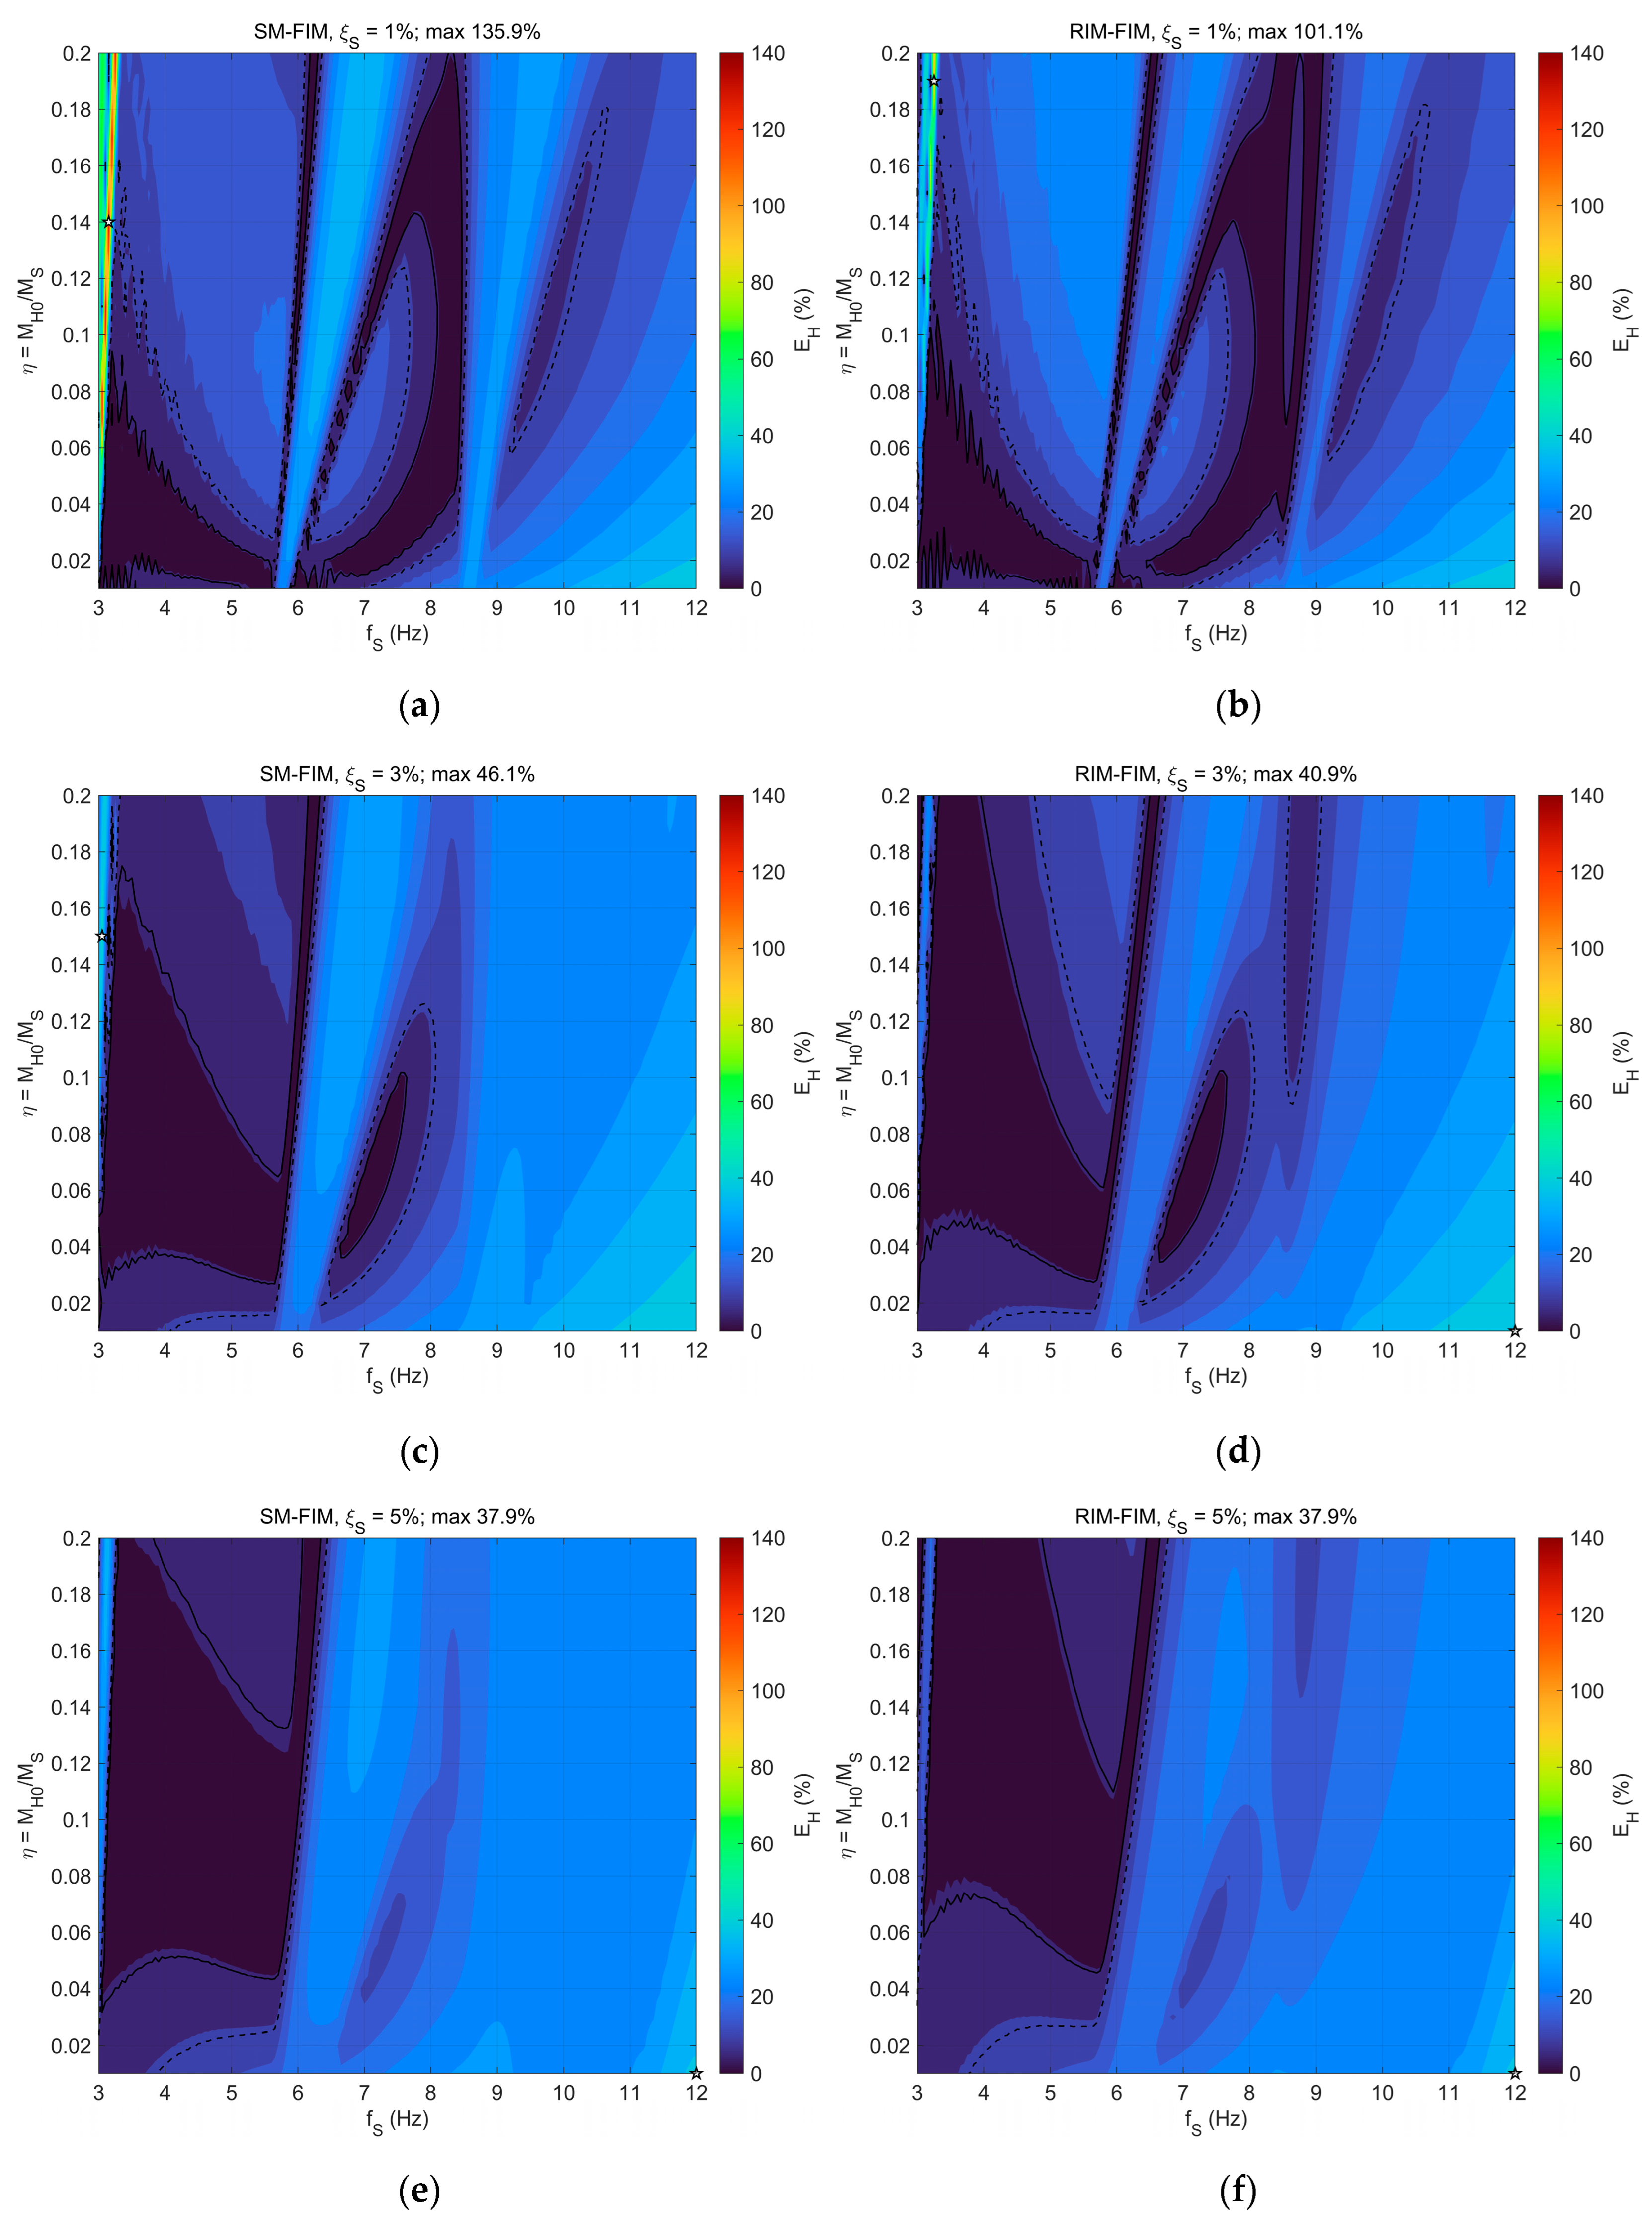
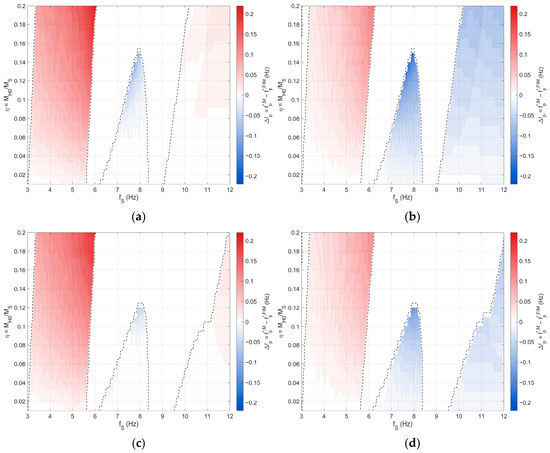
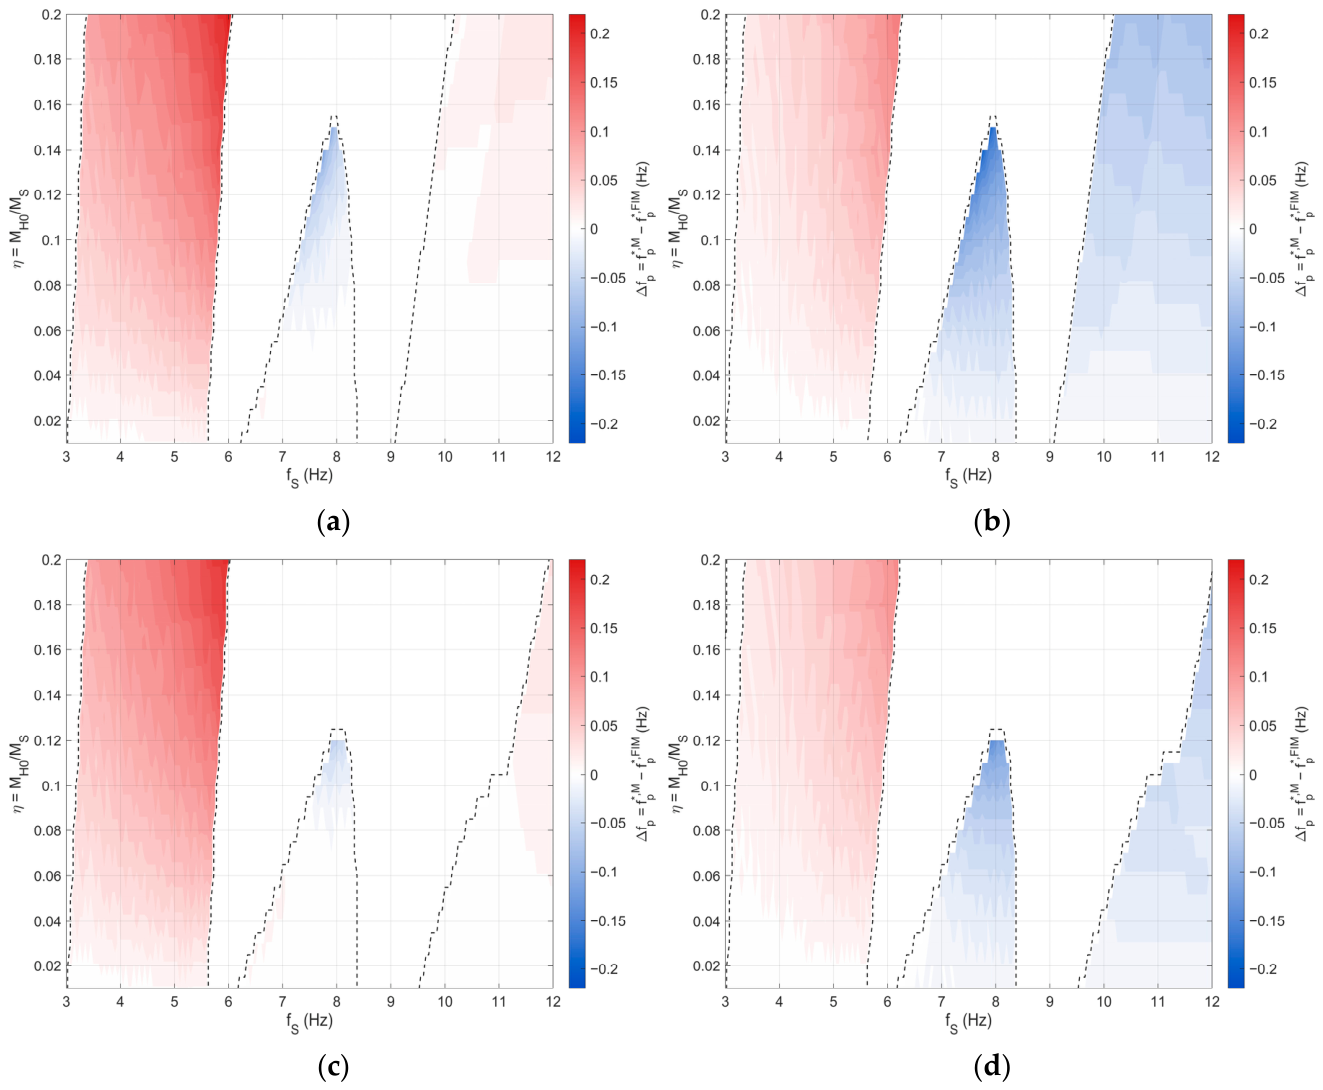
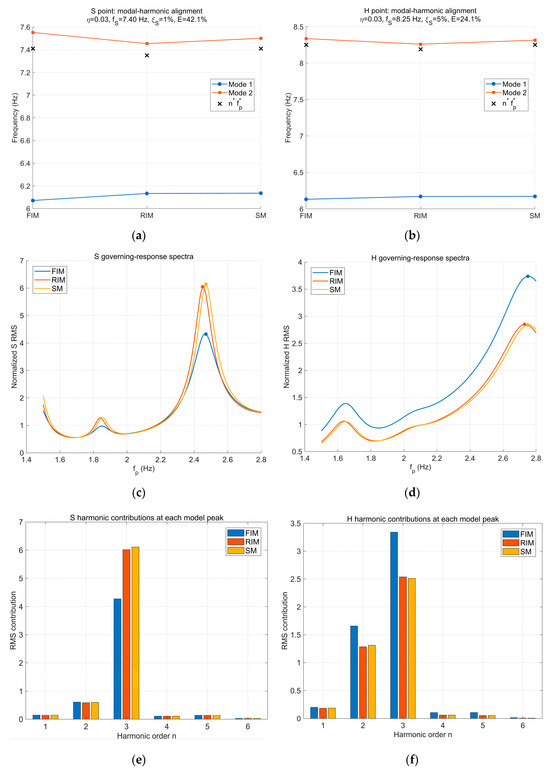
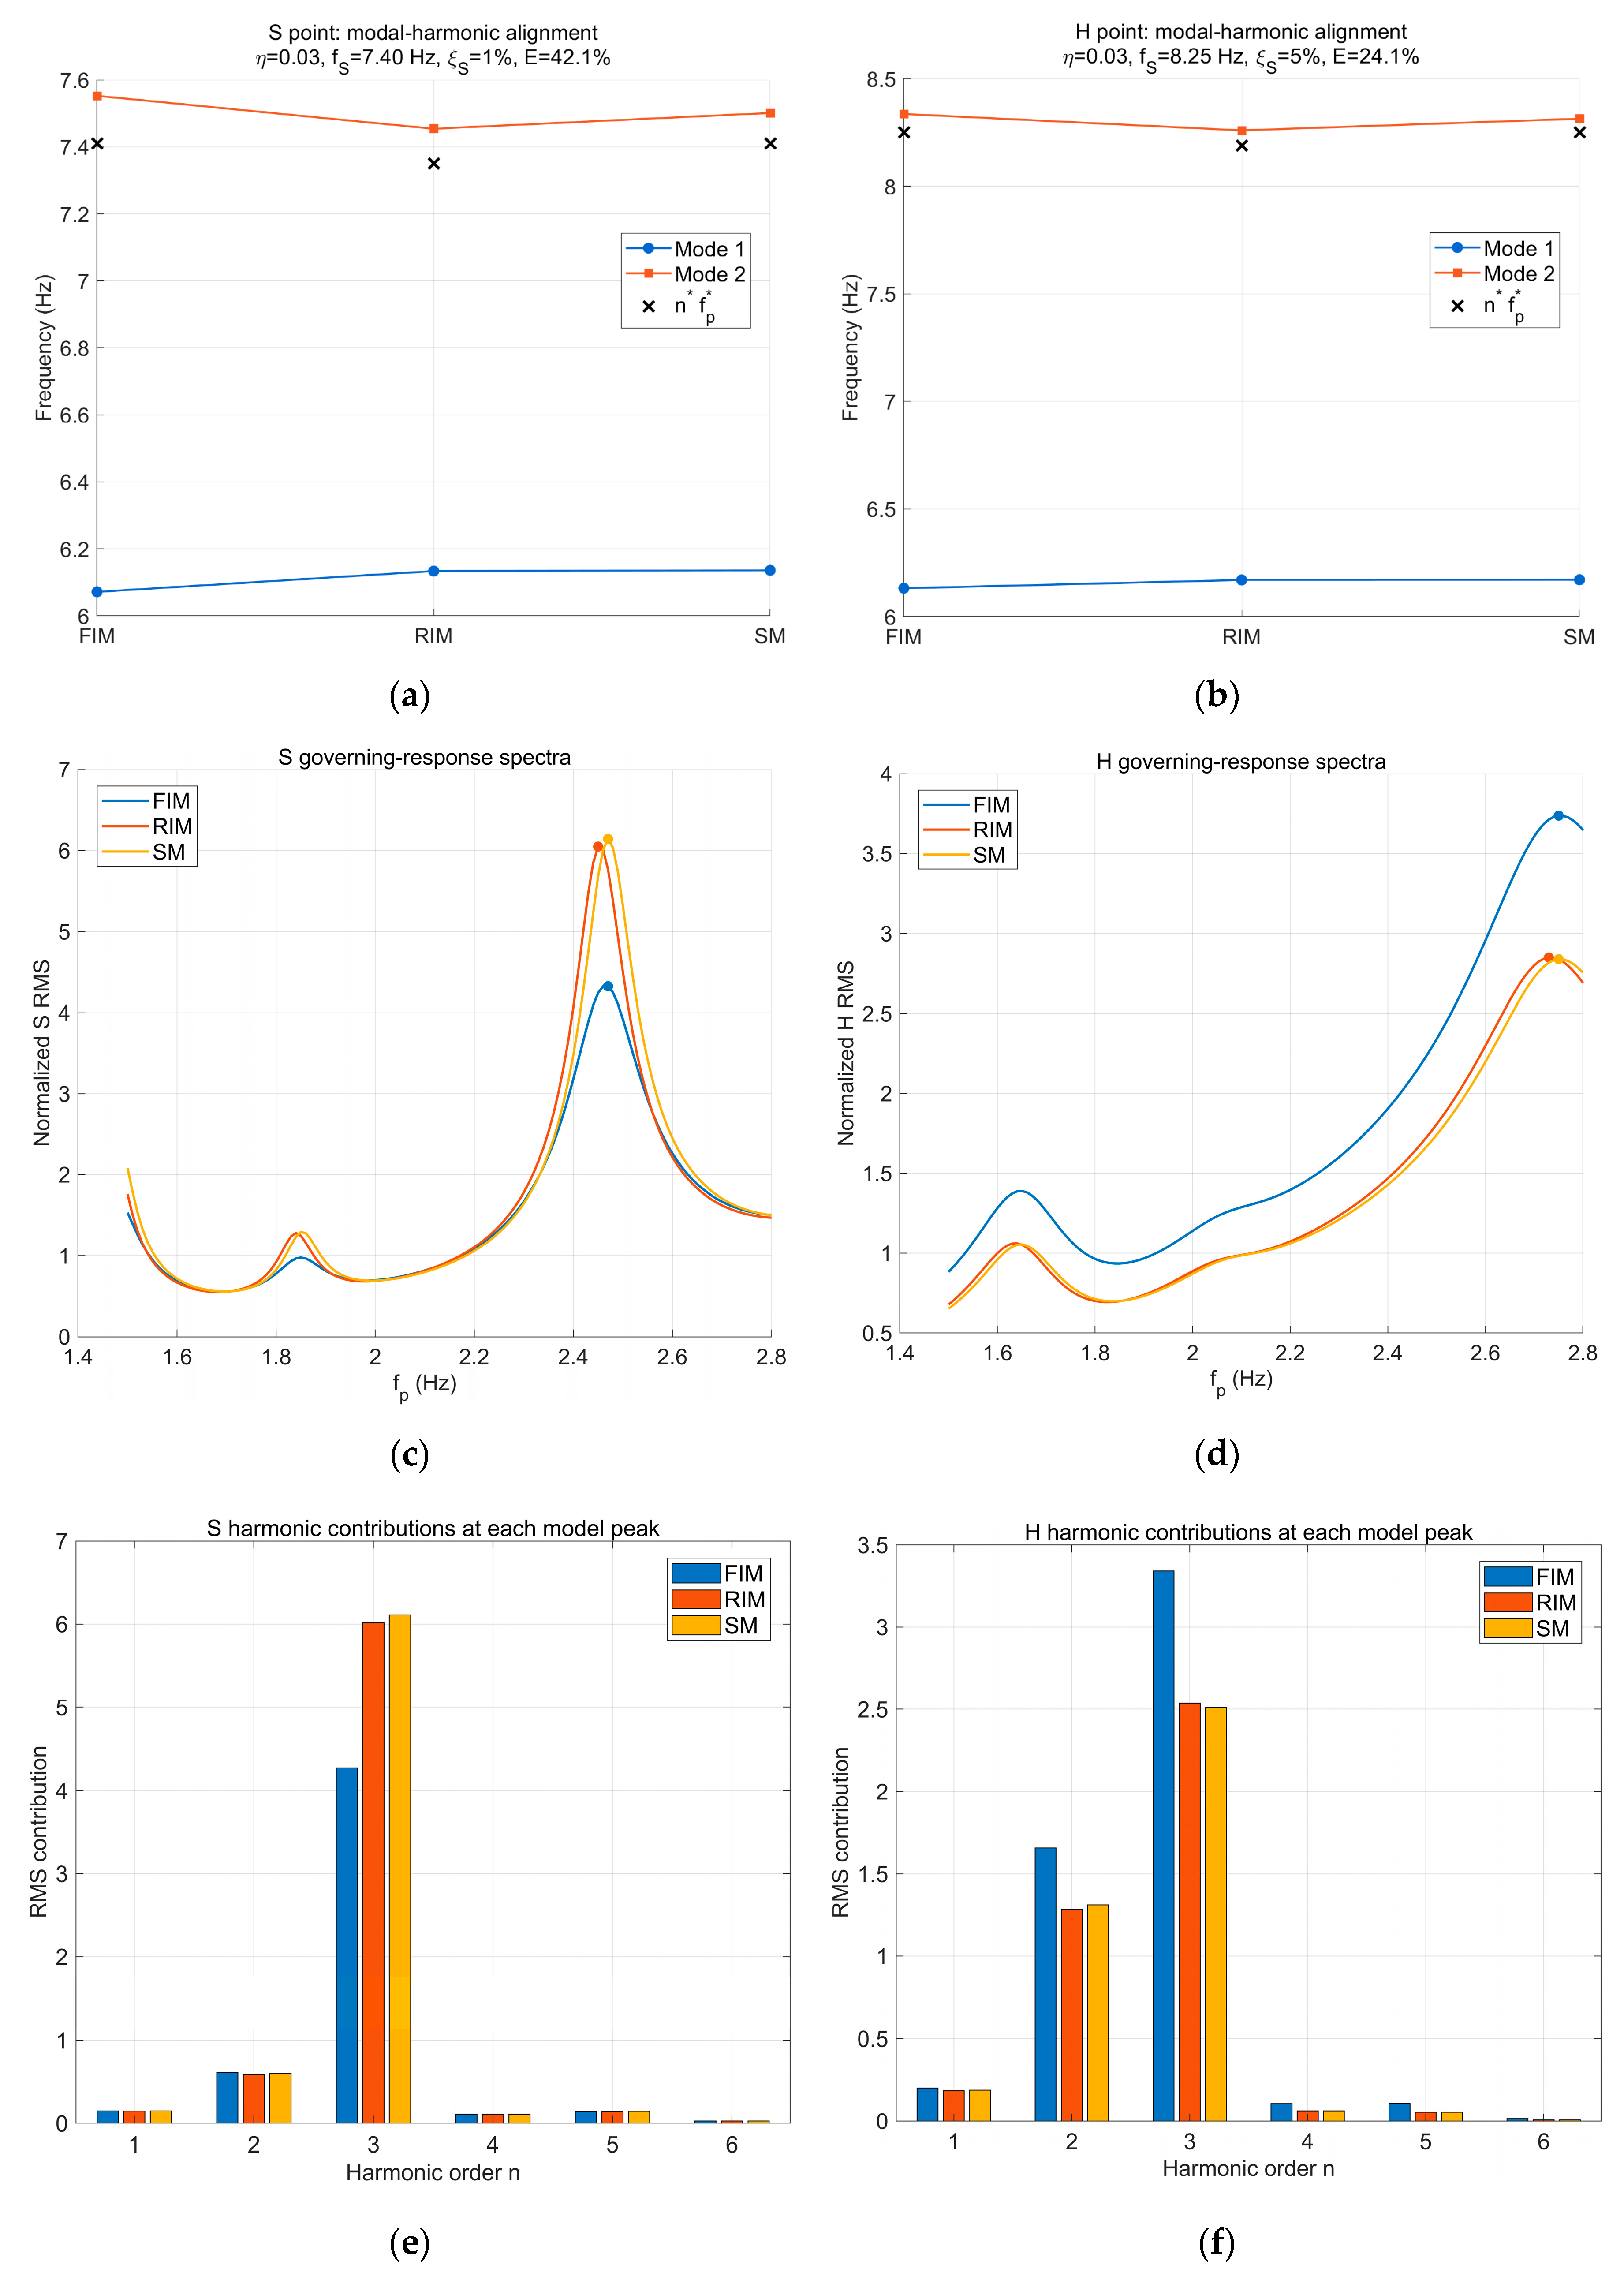
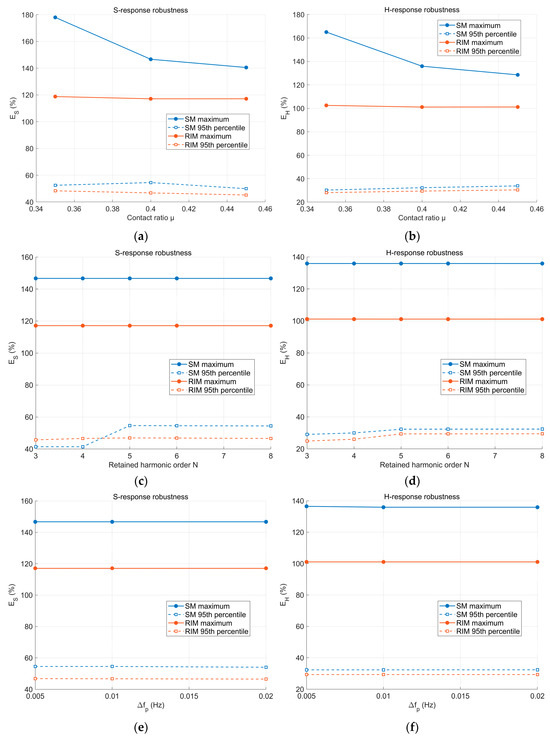
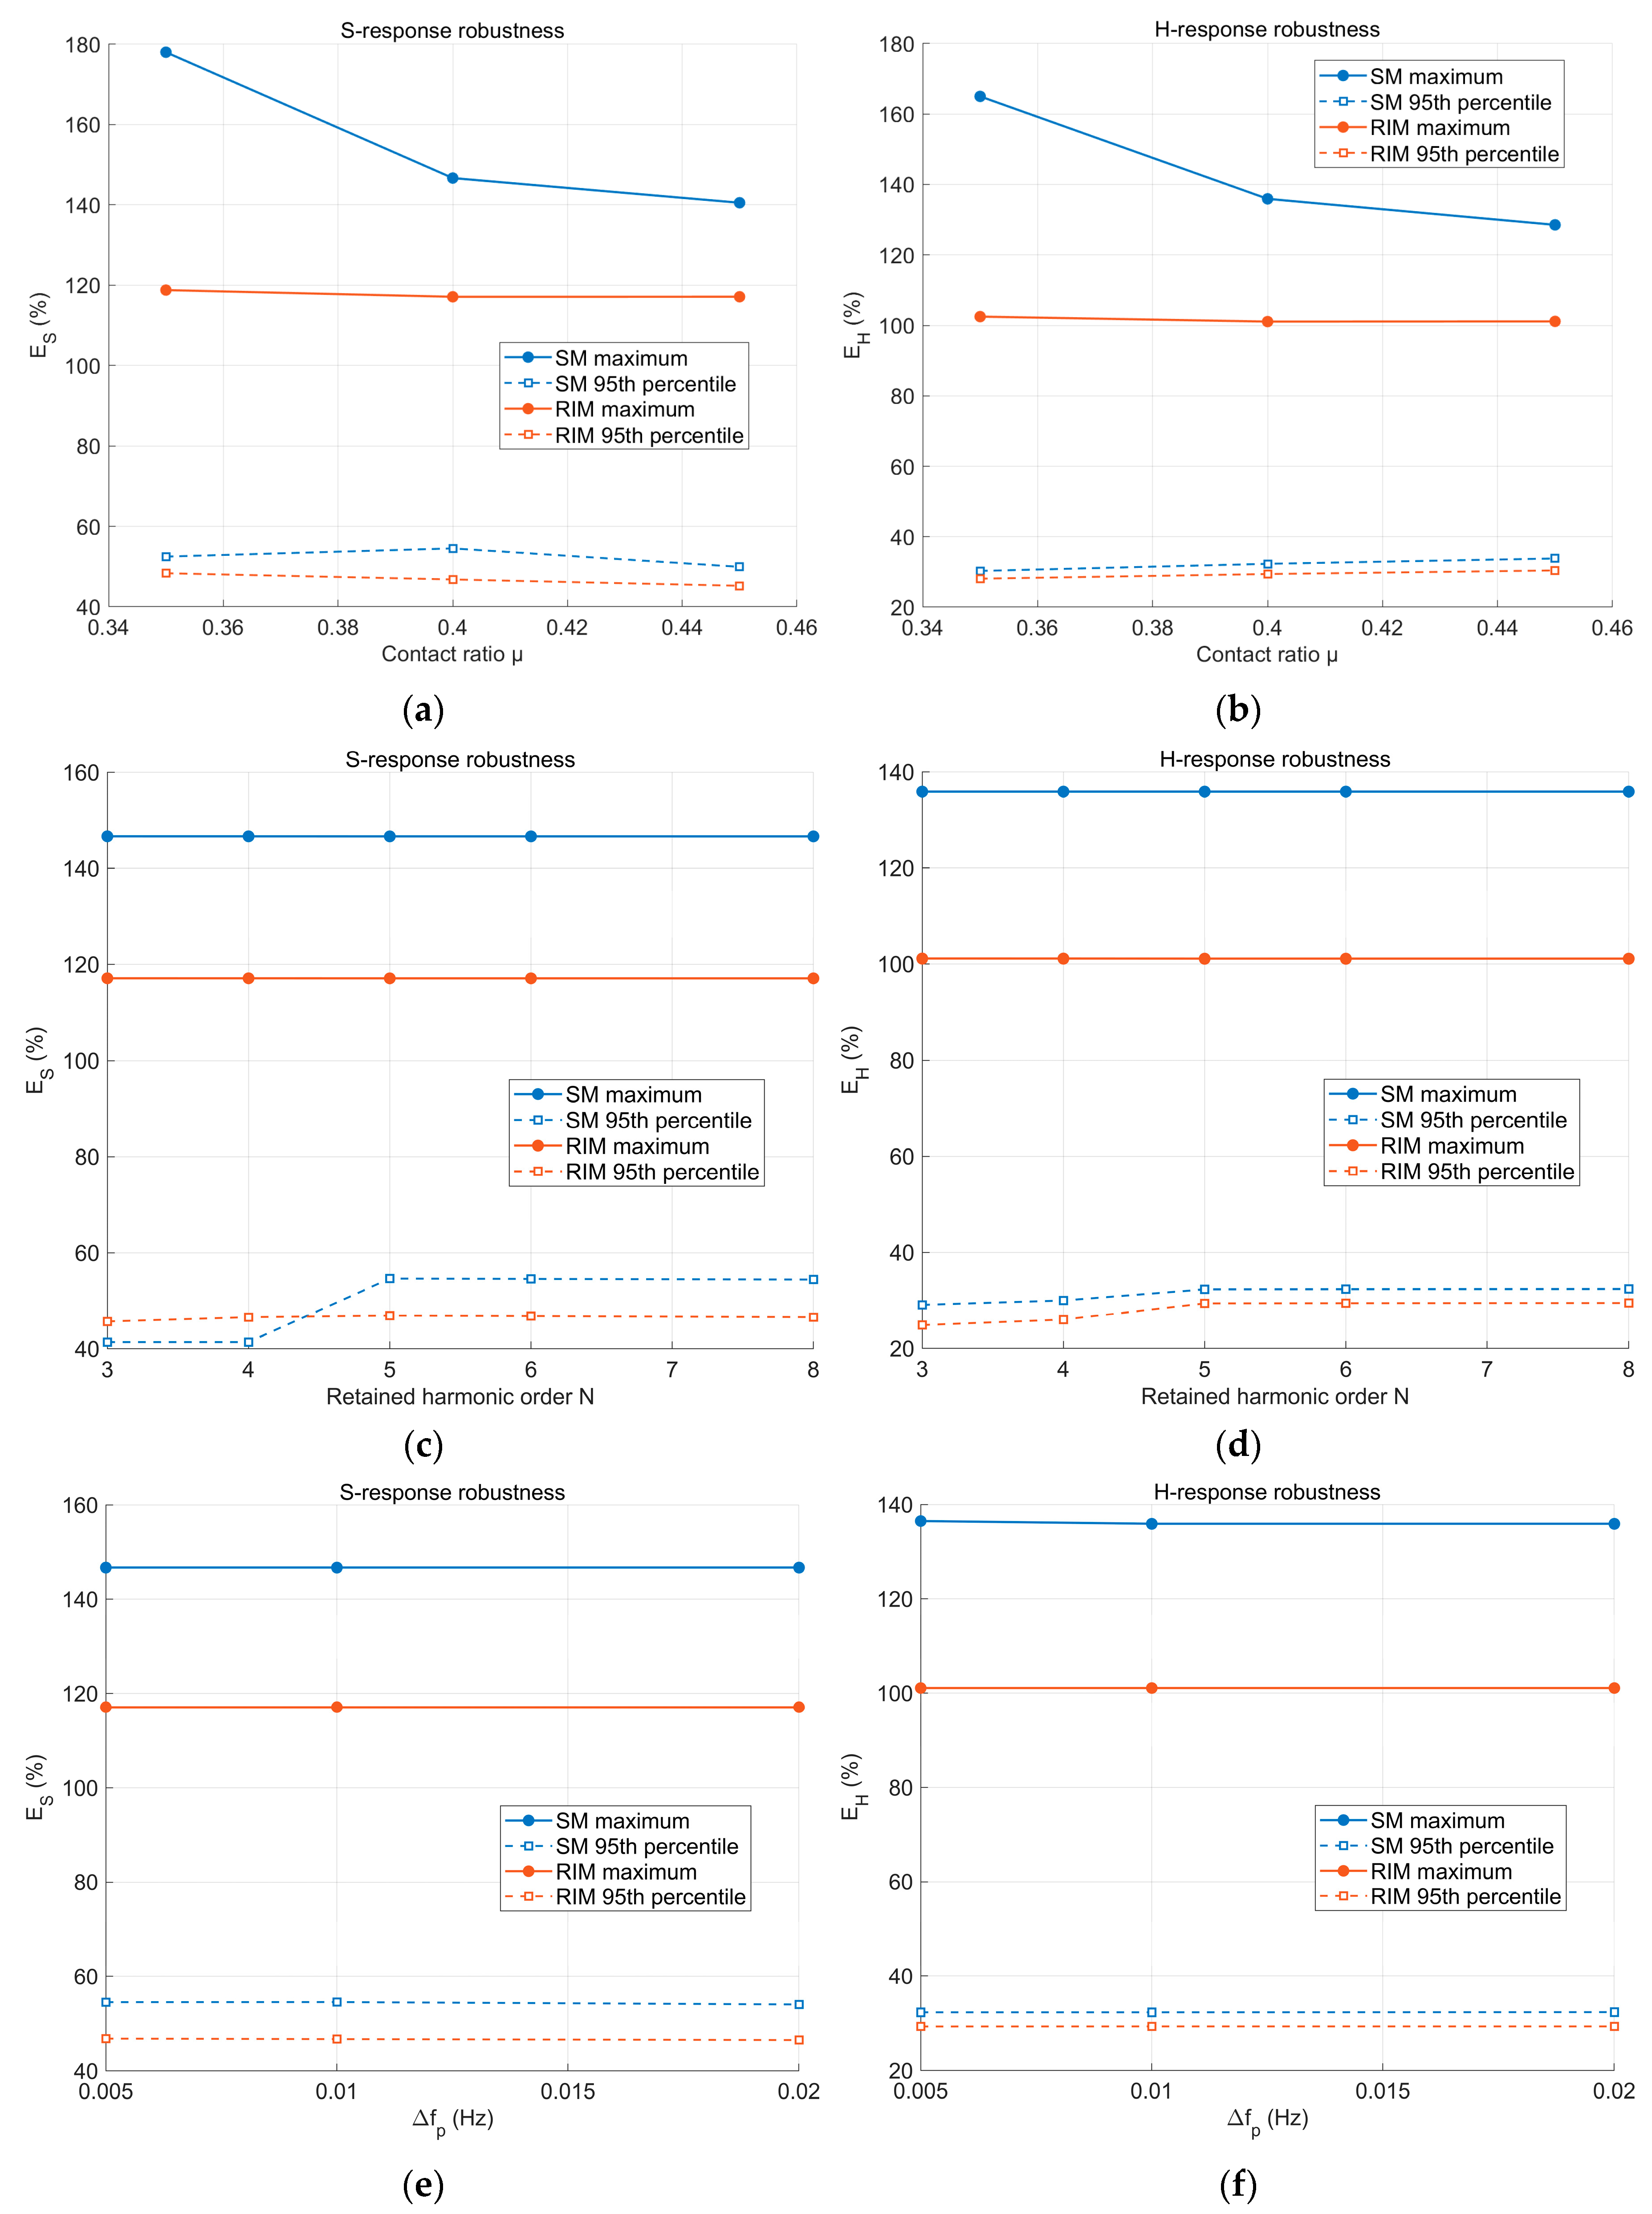

Disclaimer/Publisher’s Note: The statements, opinions and data contained in all publications are solely those of the individual author(s) and contributor(s) and not of MDPI and/or the editor(s). MDPI and/or the editor(s) disclaim responsibility for any injury to people or property resulting from any ideas, methods, instructions or products referred to in the content. |
© 2026 by the authors. Licensee MDPI, Basel, Switzerland. This article is an open access article distributed under the terms and conditions of the Creative Commons Attribution (CC BY) license.