


Abstract
Virtual trial assembly (VTA), an alternative to physical trial assembly, has been used in many projects owing to its advantages of low time consumption and low cost. However, the existing methods based on the terrestrial laser scanner struggle with noise, incomplete boundaries, and arbitrary initial poses, making them impractical for steel members of long-span suspension bridges with bolted connections. Therefore, this study proposes a novel method combining robust circle fitting and matching constrained based on multiple features. Firstly, alpha shape and DBSCAN algorithms precisely extract hole boundaries from unstructured point clouds. Secondly, a Huber loss model optimized via Iteratively Reweighted Least Squares (IRLS) extracts hole centers, effectively overcoming measurement noise and local defects. Thirdly, integrating global polar coordinates and local topological descriptors establishes reliable correspondences without prior pose information. Finally, singular value decomposition calculates the optimal rigid transformation matrix for spatial alignment. The results show the novel method consistently outperforms common Least Squares (LS), Pratt, Taubin, and Random Sample Consensus (RANSAC) algorithms regarding feature extraction stability. Evaluated exclusively upon the specific point cloud dataset acquired in this study, the proposed algorithm achieved a minimal internal registration Root Mean Square Error (RMSE) of 0.148 mm and a Mean Absolute Error (MAE) of 0.076 mm. These specific algorithmic residuals confirm highly reliable relative computational consistency for the tested bridge components, though extensive validations remain necessary for generalized field conditions.
1. Introduction
Prefabricated steel structures and bridge engineering have become increasingly prominent in modern civil engineering, owing to their notable advantages in factory prefabrication, construction efficiency, quality control, and environmental sustainability [1]. This industrialized construction mode demonstrates broad application prospects in large-scale bridges, steel structure workshops, and complex joint engineering. However, prefabricated structures impose exceedingly high requirements on component manufacturing precision and on-site assembly accuracy [2]. Typically, in multi-component connection scenarios, minute geometric deviations can easily lead to the accumulation of overall assembly errors, which in turn severely impairs installation efficiency and service performance [3]. Therefore, pre-evaluating the spatial matching relationships and verifying the assemblability of components before they are transported to the construction site is a critical step that directly affects construction quality and schedules [4]. Traditional physical trial assembly is not only time consuming and labor intensive but also often impractical when components are excessively large or constrained by site conditions [5].
To overcome the limitations of traditional trial assembly methods, VTA technology, based on Terrestrial Laser Scanning (TLS) and point cloud reconstruction, has garnered significant attention in the field of intelligent construction. Early developments include the computerized assembly test system proposed by a Japanese company in 2002 [6], which utilized charge-coupled device imaging to acquire component geometry and simulate bridge assembly using measured and design data, thereby verifying final configuration accuracy, dimensional consistency, and connection conditions. Later, Case et al. [7] introduced algorithmic improvements for VTA by employing general procrustes analysis [8] to optimize the rigid-body transformation between as-designed and as-built point sets, minimizing geometric discrepancies through rotation and translation, and reporting a 65–70% reduction in inspection time compared with contact-based approaches. Subsequently, Maset et al. [9] extended classical orthogonal procrustes analysis to an affine form for evaluating geometric tolerances such as parallelism in large-scale components, improving the capability to assess consistency between fabricated surfaces and design specifications. However, the accuracy of VTA is not only governed by the employed algorithms but is also strongly dependent on the quality and density of measurement data, while most early studies relied on sparse discrete survey points, limiting geometric fidelity. With the development of TLS technology [4,10,11], dense 3D point clouds with millimeter-level precision can now be rapidly acquired through high-frequency laser scanning, enabling detailed reconstruction of structural geometry [12,13]. TLS-based VTA typically constructs as-built models from scanned point clouds of prefabricated components and compares them with design models [14,15,16]. In parallel, building information modeling (BIM) has been widely integrated into VTA as a digital structural representation, where Zhou et al. [17] developed a BIM-based VTA framework for steel components by updating and comparing scanned data with as-designed models, while Zhou et al. [18] further proposed reverse modeling of point clouds into BIM for assembly evaluation. Wang et al. [16] extended BIM-based VTA to complex bolted steel structures for geometric inspection, and Jiang et al. [15] applied extended orthogonal procrustes analysis to align scanned point clouds with BIM models for precast concrete components to quantify cumulative deviations. Guo et al. [19] further introduced semantic segmentation and 3D bounding box estimation to automate VTA for prefabricated concrete frames. Nevertheless, most existing studies mainly focus on deviations between as-built and as-designed models, rather than interaction inconsistencies between matching prefabricated components during actual assembly, thus emphasizing manufacturing errors instead of true assemblability of bridge segments. This approach not only effectively mitigates the risk of on site rework but also improves construction efficiency and assembly quality. Currently, VTA has been progressively applied in engineering fields such as steel bridges, steel box girders, and large prefabricated joints, serving as a key technological approach for promoting the digitalization and intelligentization of engineering construction [20].
Bolt holes are key assembly constraint features in the VTA process of prefabricated steel structures. Their center positions directly govern the relative spatial relationships between components and determine the final assembly accuracy [21]. Particularly in the assembly process of gusset plate connections, dimensional deviations and misalignment of bolt holes are primarily induced by a combination of fabrication tolerances, measurement uncertainties, and accumulated errors during multi-stage manufacturing and handling processes. As reported in previous studies on steel bridge fabrication and assembly accuracy control [22], machining tolerances in drilling operations, thermal deformation during welding, and elastic–plastic deformation during component handling can all contribute to initial geometric inconsistencies of bolt hole positions relative to the design model. In addition, surveying and data acquisition errors may further amplify perceived deviations in virtual assembly environments [23]. During the assembly stage, these initial deviations propagate through rigid-body alignment processes, leading to compounded positional offsets between corresponding bolt holes in mating components. Therefore, accurately and robustly extracting bolt-hole centers from complex engineering point clouds and establishing reliable hole-to-hole correspondences constitute the core steps to achieving high-precision VTA [9].
Extensive research has been conducted on the extraction and matching of bolt hole features. At present, widely used circle fitting methods can be generally classified into three categories including algebraic circle fitting, geometric circle fitting, and robust circle fitting [24]. Algebraic circle fitting methods, including classical approaches such as Kasa, Pratt, and Taubin formulations, estimate circle parameters by minimizing algebraic (rather than geometric) distances, which typically leads to closed-form or efficiently solvable linearized systems. Although these methods are computationally attractive, their objective functions do not directly correspond to Euclidean geometric errors, making them sensitive to data scaling, noise distribution, and point sampling density. In particular, the algebraic residuals implicitly introduce bias when point distributions are non-uniform, which may result in systematic deviations in estimated center coordinates and radius, especially under high-noise or partial arc conditions commonly encountered in engineering measurements. Conversely, geometric circle fitting improves accuracy by minimizing Euclidean distances but relies on complex non-linear iterative algorithms (e.g., Gauss–Newton), leading to high computational complexity and sensitivity to initial values [25]. To improve stability in complex engineering environments, robust circle fitting methods incorporating strategies like RANSAC and the Huber loss function have gained traction in recent years due to their effectiveness in suppressing outlier interference [26]. However, existing research on VTA still exhibits notable limitations in practical applications, as illustrated in Figure 1. Most existing robust algorithms focus on generalized geometric model fitting. Studies addressing the synergistic application of bolt-hole feature extraction and VTA in the presence of complex engineering point clouds, which are heavily characterized by severe noise and local missing data, remain relatively insufficient [15]. Furthermore, during the hole feature matching phase, traditional methods predominantly rely on simple nearest-neighbor searches or sorting strategies. These conventional methods struggle to adapt to complex conditions such as component rotation, local feature absence, and noise perturbations [14]. Consequently, under conditions of complex point cloud noise and defects, the lack of a comprehensive algorithm for hole extraction and matching that combines high robustness with high precision restricts further improvements in overall VTA accuracy [27].
Figure 1.
VTA challenge of bolted connection components.
Focusing on complex engineering point cloud data, this study proposes a VTA method based on robust circle fitting and bolt hole feature matching. To address challenges in the VTA process, including noise interference, incomplete boundaries, and varying component poses, the proposed approach establishes a complete pipeline ranging from low level feature extraction to high level spatial registration. Specifically, the raw point cloud is first preprocessed and projected onto a principal plane, followed by the precise extraction of hole boundaries combining the shape and DBSCAN algorithms. Secondly, a robust circle fitting model based on the Huber loss function is introduced and optimized via IRLS to enhance hole center extraction accuracy in environments with noise and outliers. Building upon this, a hole center feature descriptor integrating polar coordinate information and local topological structures is constructed, and the optimal correspondences between holes are determined through a multi-feature constrained matching cost function. Finally, the Singular Value Decomposition (SVD) algorithm is utilized to solve for the optimal rigid transformation matrix, thereby achieving high-precision VTA between components.
Through multiple sets of comparative experiments and robustness analyses, the superior performance and practicality of the proposed method under complex noise environments and defective point cloud conditions are verified. The main contributions of this paper are as follows:
- (1)
- A robust circle fitting method tailored for heavily contaminated engineering point clouds is proposed. By introducing an adaptive threshold driven by Median Absolute Deviation (MAD) within the Huber optimization framework, it effectively overcomes the sensitivity of traditional algebraic methods to asymmetric noise and boundary occlusion, enhancing the relative accuracy and stability of hole center extraction without requiring manual data cleaning.
- (2)
- A pose invariant feature matching method integrating global polar coordinates and local neighborhood topological structures is developed. By completely bypassing dense surface point matching, it achieves fully automated geometric pairing that exhibits strong robustness against arbitrary component rotation, extreme measurement noise, and global centroid shifts induced by local feature absences.
- (3)
- A complete autonomous VTA framework spanning from micro level robust feature extraction to global spatial registration is established. By utilizing Singular Value Decomposition for rigid transformation and strict mathematical residual evaluation, highly reliable relative spatial alignment is achieved on real bridge gusset plate point clouds, successfully transitioning structural verification from interactive visualization to quantifiable algorithmic consistency.
2. Materials and Methods
To address issues such as noise interference, hole boundary incompleteness, and arbitrary initial poses of components encountered during the pre-assembly of prefabricated steel structures in complex engineering environments, this paper proposes a VTA methodological framework based on robust circle fitting and multi-feature constrained matching, as illustrated in Figure 2. Utilizing the initial point clouds of components acquired by a TLS as data input, this method aims to achieve high-precision automatic registration and the quantitative evaluation of assembly quality within a virtual space. The proposed comprehensive workflow primarily comprises the following four key steps:
Figure 2.
General framework of the method.
- (1)
- Point Cloud Preprocessing and Fine Extraction of Hole Boundaries
Given the massive data volume and background noise inherent in raw point clouds, the acquired component point clouds are first subjected to filtering and Region of Interest (ROI) extraction [28]. Subsequently, the point clouds of critical connection interfaces are projected onto a local principal 2D plane via plane fitting. Based on this, boundary points with distinct geometric features are identified and extracted utilizing specific algorithms. The DBSCAN density clustering algorithm is then introduced to separate the scattered boundary points into independent bolt-hole point cloud clusters [29]. This effectively eliminates irrelevant background interference and establishes a solid data foundation for subsequent high-precision feature extraction.
- (2)
- High-Precision Extraction of Bolt-hole Centers Based on Robust Optimization
Traditional algebraic or geometric fitting methods are highly prone to center shifting when faced with local incompleteness, deformation, and outlier interference commonly found in actual engineering point clouds [30]. To counteract this, this module constructs a robust circle fitting model based on the Huber loss function, which effectively down-weights the influence of large-error outliers on the fitting results by defining a threshold function. Furthermore, the IRLS algorithm is employed for non-linear optimization, achieving the high-precision and highly stable extraction of the true geometric center coordinates and radii of bolt holes under complex defective conditions.
- (3)
- Automatic Bolt-hole Matching Constrained by Multiple Features
After obtaining the hole center point sets for the master and slave components, traditional distance threshold-based matching methods easily fail, given that the initial rotational and translational poses of the components in the digital space are unknown [23]. Therefore, this step proposes constructing a hole center feature descriptor that integrates polar coordinate information and local topological structures to comprehensively capture the spatial relative relationships between holes. Construction of a multi-feature matching cost function covering distance, angle and structural similarity facilitates the calculation of globally optimal correspondence assignments. The realized automatic hole matching delivers favorable robustness when components undergo rotation or translation and when partial local features are unavailable.
- (4)
- Spatial Rigid Registration and Assembly Quality Evaluation
Based on the precise correspondences of homologous holes established in Step (3), the SVD algorithm is utilized to compute the objective function, solving for the rigid transformation matrix (rotation matrix R and translation vector T) between the master and slave components [18]. This transformation matrix is then applied to accurately map the point clouds of the components to be assembled into a unified coordinate system, completing the physical alignment in the virtual space. Finally, the residual distances between the aligned corresponding assembly points (bolt-hole centers) are calculated and compared against engineering allowable tolerances to generate a quantitative assembly compliance report.
2.1. Point Cloud Preprocessing and Fine Extraction of Hole Boundaries
Raw point cloud measurements collected via TLS generally feature large data scales and inherently include device noise, ambient interferences and unrelated background elements [31]. Furthermore, the thickness and surface roughness of the steel components introduce interference in the subsequent extraction of bolt-hole features. Therefore, prior to high-precision circle fitting, the raw point clouds must undergo refined preprocessing and dimensionality-reduction segmentation to accurately isolate independent bolt-hole boundary point cloud clusters [32]. The workflow of this section sequentially comprises denoising and down sampling, principal plane extraction and 2D projection, edge feature extraction, and instance clustering, as illustrated in Figure 3.
Figure 3.
Point cloud preprocessing and hole boundary extraction. (a) The original node plate point cloud after segmentation; (b) The point cloud after denoising; (c) The point cloud extracted by alpha shape boundary; (d) The point cloud after hole separation by DBSCAN.
To improve computational efficiency and isolate the target features, the raw point cloud is first down sampled using a voxel grid filter and denoised via the Statistical Outlier Removal (SOR) algorithm. Next, because the bolt holes are distributed on planar components, the RANSAC algorithm is applied to fit and extract the principal load-bearing plane (Pplane), effectively removing irrelevant non-coplanar structures and points from the inner walls of the bolt holes.
To eliminate scanning errors in the thickness direction and reduce dimensionality, Principal Component Analysis (PCA) is performed on . By calculating the covariance matrix and projecting the points along the normal vector n onto the plane spanned by the principal orthogonal eigenvectors, a local 2D point set P2D is established.
Subsequently, the alpha shape algorithm is utilized on P2D to detect the boundary points, encompassing both the outer contour of the plate and the internal bolt-hole edges. To separate these mixed boundary points, the DBSCAN clustering algorithm is employed to group the points into independent clusters. Finally, the outer boundary and pseudo-defect clusters are automatically identified and excluded based on prior geometric constraints (e.g., bounding box size and point count thresholds). This workflow yields n independent and cleaned bolt-hole boundary point cloud clusters, , which serve as the inputs for the subsequent circle-fitting module.
2.2. High-Precision Extraction of Bolt Hole Center Based on Robust Optimization
In the VTA framework, the geometric centers of bolt holes serve as the core feature points that dictate the accuracy of spatial registration. However, owing to the surface reflections of steel components, blind spots of laser scanners, and manufacturing defects at plate edges, the bolt-hole boundary point cloud clusters isolated in the previous section inevitably encompass local deformations, boundary defects, and outlier noise. Traditional least-squares algebraic or geometric fitting methods are highly sensitive to these anomalies, which can easily induce severe deviations in hole center extraction [12]. To address this, this section proposes a robust circle fitting algorithm based on the Huber loss function. Solved via non-linear optimization using the IRLS method, this approach achieves high-precision hole extraction in complex noise environments.
First, the mathematical model for the geometric fitting of the bolt hole is formulated. Let the 2D boundary point set of the k-th bolt hole be denoted as , where m is the number of points in this point cloud cluster. The circle parameters to be determined are represented by the parameter vector , where denotes the center coordinates and r is the radius.
Compared to algebraic distances, orthogonal geometric distances can more authentically reflect errors in physical space. To suppress outlier interference during circle fitting, the geometric residual is optimized under the robust Huber loss function . The optimization objective dynamically transitions from an L2 norm for inliers () to an L1 norm for outliers (), effectively curbing the leverage effect of noisy boundary points without manual data cleaning [33].
By introducing an equivalent weight function [34], the weight of each point can be expressed as:
Through dynamic down-weighting, this mechanism effectively curbs the drag of severely deviated feature points on the model parameters while preserving the fitting accuracy of high-quality inliers.
Considering the significant variations in noise levels (scales) across different scanning batches and components, employing a fixed empirical threshold often lacks generalization capability [35]. Therefore, this study introduces the MAD to perform an adaptive and robust estimation of the noise scale :
where the constant coefficient 1.4826 is utilized to make it an unbiased estimator of the standard deviation under the assumption of a normal distribution. Subsequently, the Huber threshold is set to . Based on statistical heuristics, the tuning constant is set to k = 1.345. This value not only ensures that the algorithm maintains 95% asymptotic efficiency for Gaussian noise but also exhibits extraordinary robustness against outliers that deviate from a normal distribution [36].
During the solution process, since the geometric residual function is highly non-linear with respect to the parameter vector , the Gauss–Newton method is embedded within the IRLS framework for optimization. First, the computationally efficient Kasa algebraic fitting method is employed to obtain the initial parameter vector . In each iteration, the residual vector e and the Jacobian matrix J under the current parameters are computed. The elements of the i-th row of J are derived as follows:
Subsequently, the adaptive threshold and the weight matrix W are updated based on MAD, and the model parameters are updated by solving the incremental equation
This process is repeated iteratively until the L2 norm of the parameter increment reaches the predefined convergence threshold or the maximum number of iterations is met. The final output optimal parameters represent the finely extracted, high-precision hole center coordinates, as shown in Figure 4. This algorithm effectively resolves the impact of uneven point cloud quality on hole localization accuracy, laying a reliable foundation for subsequent pre-assembly deviation analysis. The pseudocode is presented in Algorithm 1.
| Algorithm 1. Huber Loss + IRLS Circle Fitting Pseudocode | |
| Line | Pseudocode |
| Require | 2D points tuning constant (e.g., 1.345); tolerance (e.g., ); maximum iterations (e.g., 50) |
| Ensure | Circle parameters |
| 1 | % ————— Initialization (Algebraic circle fit) ————— |
| 2 | |
| 3 | |
| 4 | |
| 5 | % ————— IRLS with Huber loss ————— |
| 6 | while and do |
| 7 | % —— Compute residuals (geometric distances) —— |
| 8 | |
| 9 | |
| 10 | % —— Robust scale estimation (MAD) —— |
| 11 | (s 1.4826 |
| 12 | if then |
| 13 | |
| 14 | end if |
| 15 | Huber threshold |
| 16 | % —— Huber weights —— |
| 17 | for to do |
| 18 | if then |
| 19 | |
| 20 | else |
| 21 | |
| 22 | end if |
| 23 | end for |
| 24 | |
| 25 | % —— Jacobian —— |
| 26 | |
| 27 | |
| 28 | % —— IRLS update (Gauss–Newton) —— |
| 29 | |
| 30 | |
| 31 | |
| 32 | end while |
| 33 | % ————— Return result ————— |
| 34 | return |
Figure 4.
Bolt-hole Fitting and Center Extraction. (a) Point cloud of bolt holes; (b) Circle obtained by IRLS fitting of the Huber loss function.
To ensure the absolute reproducibility of the proposed digital assembly framework, the specific hyperparameter values utilized throughout the feature extraction and robust optimization modules must be explicitly declared. Although there are slight differences in these parameters across different point cloud scales, following the parameter selection of Nurunanbi et al. [25], within a specific heuristic range, our algorithm can still maintain good operational stability. The explicit parameter values adopted for the system evaluations detailed in Section 3 are comprehensively summarized in Table 1.
Table 1.
Calculation of algorithm parameter configuration.
2.3. Automatic Bolt-Hole Matching Constrained by Multiple Features
In the VTA process, after extracting the bolt-hole centers of the master and slave components, establishing precise point-to-point correspondences between them is a prerequisite for achieving spatial registration. However, in actual engineering applications, the initial translational and rotational poses of the master and slave components in the virtual space are often arbitrary. Furthermore, due to scanning blind spots or local defects, the hole feature point sets may be incomplete. Traditional nearest-neighbor search algorithms based on Euclidean distance thresholds are highly susceptible to failure under such conditions [38].
To overcome the aforementioned challenges, this section proposes an automatic hole matching algorithm integrating global polar coordinate features and local topological features, as illustrated in Figure 5. This algorithm constructs feature descriptors invariant to rigid transformations and achieves highly robust feature alignment by optimizing a global matching cost matrix.
Figure 5.
Schematic diagram of the automatic hole position matching principle with multiple feature constraints.
First, to eliminate the influence of discrepancies in the initial spatial positions of the master and slave components, coordinate centralization must be performed on the extracted hole center point sets [12]. Let the 2D hole center point sets of the master and slave components be denoted as and , respectively (due to potential defects, the number of holes N and M may be unequal). The centroid coordinates of the point sets are calculated , and all hole centers are translated to a local coordinate system with the centroid as the origin. This decouples the matching process entirely from absolute coordinates. This operation effectively achieves the translational invariance of the features, making them solely dependent on the relative spatial distribution of the hole clusters.
Subsequently, to further address the impact of rotation, the centralized Cartesian coordinate system is converted into a polar coordinate system to construct polar coordinate features that reflect the global macroscopic distribution of the hole clusters [35]. For any centralized hole point , its polar radius strictly possesses rigid rotational invariance, while its polar angle reflects the azimuthal distribution of the hole. Considering that severe hole absences in a component may cause a centroid shift and invalidate the global polar features, this study introduces local neighborhood structural information to enhance the discriminative power of the descriptor. A local topological feature vector is defined for each hole, where represents the Euclidean distance between the point and its k-th nearest neighbor calculated using the k-nearest neighbors algorithm [39]. Because relative distances do not change with the translation or rotation of the coordinate system, this local topological feature exhibits strong rigid transformation invariance and robust resistance to local missing data interference.
By cascading and fusing the aforementioned dimensions, a five-dimensional higher-order feature descriptor vector is constructed for each bolt hole. This vector comprehensively quantifies the distribution patterns of the bolt holes from both macroscopic and microscopic scales. Based on these high-dimensional features, the matching cost function between any two holes from the master and slave point sets is defined as the weighted sum of the radial cost, angular cost, and topological cost:
where
Radial cost: , which measures the relative deviation of the distance to the centroid;
Angular cost: (Note: 2π periodicity processing must be considered during actual calculation. Additionally, when initial rotation exists, it can be corrected via principal component alignment or by introducing relative angular differences);
Topological cost: , which utilizes the L2 norm to evaluate the degree of geometric shape discrepancy.
To eliminate the dimensional discrepancies among the three distinct cost metrics, a standard normalization procedure is executed prior to the weighted summation. Following the approach of Saab et al. [40], extensive preliminary evaluations were conducted in various defect scenarios, the weighting coefficients applied in our system-level experiments were rigorously calibrated to , , and . This specific parameter configuration intentionally assigns a dominant priority to the local topological cost. From a geometric perspective, when scanning blind spots cause severe component absences, the global centroid inevitably shifts. This shift substantially degrades the reliability of both radial and angular features. Conversely, the local neighborhood topology remains strictly invariant under rigid spatial transformations. Consequently, elevating the specific weight of provides a mathematically justifiable strategy to ensure exceptional matching stability under highly contaminated engineering conditions. In the equation, are normalized weighting coefficients (satisfying ). Because local topological features are more robust against centroid shifts, in scenarios with severe point cloud incompleteness, the success rate of matching can be guaranteed by dynamically increasing the weight of .
Finally, the feature matching problem is transformed into an optimal assignment problem of a bipartite graph. This study constructs a global cost matrix of size N × M and employs a greedy algorithm based on global cost sorting for the solution. The algorithm first performs global sorting of all possible matching pairs in the matrix from the lowest to the highest cost, sequentially selecting the point pair with the current minimum cost as a candidate matching relationship. During the selection process, real-time conflict detection and occupancy marking are executed to ensure that each point is matched only once. By traversing the cost matrix and executing the aforementioned greedy strategy, the algorithm ultimately outputs the optimal list of hole matching pairs . While ensuring matching accuracy, this mechanism effectively reduces the computational overhead during the VTA of large-span, multi-joint components.
2.4. Spatial Rigid Registration and Assembly Quality Evaluation
Because components possess arbitrary initial poses upon scanning in the digital environment, calculating the rotation matrix and translation vector between the source and target point clouds via mathematical optimization becomes an essential step after successfully pairing the homologous holes. Local optimization techniques, such as the Iterative Closest Point (ICP) algorithm, frequently converge to local minima and require significant computational resources. To circumvent these specific drawbacks, this section constructs an absolute orientation model founded on the criterion of least squares. Subsequently, the SVD algorithm is utilized to extract an exact analytical solution. This methodological approach ultimately achieves highly precise and stable spatial rigid registration [14].
The SVD algorithm is utilized to extract the optimal rotation matrix R and translation vector t by performing singular value decomposition on the cross-covariance matrix H under the least-squares criterion. To evaluate the final alignment accuracy, the RMSE of the matched hole centers is computed as the quantitative evaluation metric.
To establish a rigorous and practically relevant quality evaluation framework, the mathematical residuals derived from the rigid registration process are explicitly benchmarked against formal bridge construction specifications. In standard heavy steel construction, the allowable geometric misalignment tolerance for high strength bolted joints is conventionally restricted to a maximum threshold of 2 mm. Within the proposed computational pipeline, the assembly evaluation module continuously monitors the maximum absolute spatial deviation across all paired bolt hole centers following the SVD transformation. If the maximum individual hole deviation strictly remains below this specified 2 mm tolerance boundary, the virtual assembly system formally issues an automated approval status. Conversely, if any single localized residual exceeds this regulatory threshold, the algorithm triggers a geometric anomaly alert. These criteria-driven mechanisms ensure that the digital assembly outcomes are directly coupled with established physical manufacturing standards, thereby providing quality inspectors with an actionable and compliant diagnostic metric prior to component shipment.
3. Experiments and Results
This section presents systematic qualitative and quantitative evaluation experiments to comprehensively verify the performance of the proposed algorithm during the VTA of actual engineering point clouds. Specifically, the method relies on robust circle fitting combined with matching constrained by multiple features. These experiments encompass baseline accuracy testing, robustness analysis under complex conditions, and performance evaluation regarding the spatial registration of the entire system.
3.1. Experimental Data and Preprocessing
Gusset plates and flange interfaces from actual prefabricated steel structures were selected as the experimental subjects in this study. Unstructured point cloud data of the component surfaces were acquired utilizing a highly precise terrestrial laser scanner, as illustrated in Figure 6. To ensure complete experimental transparency and re-producibility, the specific hardware and geometric parameters of the dataset are detailed explicitly. The raw data were captured using a Leica Scan Station P50 device (Leica Geosystems AG, Heerbrugg, Switzerland), which provides a nominal ranging accuracy of 3 mm at a distance of 50 m. During the field acquisition at the Huang jue Tuo Yangtze River Bridge construction site, the equipment was positioned at an approximate scanning distance of 20 m from the target structures. To minimize spatial occlusions, 4 independent scanning stations were established featuring varying incidence angles reaching up to 45°. This configuration yielded a dense point cloud, achieving an average spatial point spacing of approximately 1 mm on the component surfaces. The specific experimental dataset evaluated in this study comprises two independent massive steel gusset plates. These panels have a uniform physical thickness of 20 mm. Additionally, they contain multiple groups of bolt holes distributed according to strict engineering specifications, with each manufactured bolt hole having a diameter of 30 mm. The point cloud volume for a single component remains on the order of 106 points, encompassing multiple bolt hole clusters distributed according to strict engineering specifications. Due to the complexity of actual field environments and the physical limitations of the optical sensor, the raw data inevitably contain surface reflection noise, hole incompleteness caused by scanning blind spots, and outlier interference from surrounding attachments.
Figure 6.
Experimental data collection. (a) Total station data collection; (b) Point cloud data collection; (c) Total station reflector; (d) P50 target; (e) The positions where all reflectors are attached; (f) Details of the node plate; (g) True aperture measurement.
To acquire accurate geometric information of the bridge structure, a hybrid measurement system integrating a total station and TLS was employed. As shown in Figure 7a, several control points were established around the structure and measured using the total station to provide high-precision spatial references. These control points were subsequently used for coordinate transformation and accuracy assessment of the laser-scanned point clouds. The TLS was then utilized to capture the complete three-dimensional geometry of the bridge assembly, generating a dense point cloud containing structural components and their spatial relationships (Figure 7b). Furthermore, local regions containing critical bolted connections were extracted from the global point cloud. These refined point cloud subsets were used for bolt-hole localization and subsequent digital preassembly deviation evaluation.
Figure 7.
Experimental data acquisition and point cloud representation of the bridge assembly structure. (a) Layout of control points for the total station; (b) 3D point cloud of the bridge structure obtained using TLS.
To enhance the computational efficiency of subsequent algorithms and isolate irrelevant background information, the raw point clouds were first subjected to voxel grid-based down sampling and SOR filtering, following the workflow detailed in Section 2.1. Subsequently, the PCA algorithm was employed to fit and extract the principal load-bearing plane of the gusset plate, orthogonally projecting the 3D spatial point clouds onto a 2D local coordinate system. Finally, the alpha shape edge detection and DBSCAN density clustering algorithms were sequentially applied to precisely segment the boundary point sets of individual bolt holes, providing standardized inputs for the subsequent tests.
With the discrete boundary clusters successfully isolated during preprocessing, the subsequent imperative step is to evaluate the stability of the feature extraction algorithm. Because raw construction datasets inherently contain structural artifacts, the evaluation directly subjects the algorithms to severe noise injection to validate their ultimate environmental resilience.
3.2. Robustness Analysis Under Complex Noise Conditions
To systematically evaluate the superior performance of the proposed robust algorithm integrating the Huber loss and IRLS optimization, four classical techniques widely utilized within computer vision and reverse engineering were selected as comparative baselines. These established approaches are explicitly justified and selected for our comparative framework because they represent the most prominent paradigms of mathematical fitting, providing a rigorous standard against which to evaluate our geometric residual optimization.
Specifically, the standard LS method minimizes algebraic distance using basic linear approximations. Building upon this foundational concept, the Pratt algorithm introduces an improved algebraic distance optimization by incorporating a constraint matrix to prevent trivial solutions. This addition enhances numerical stability compared to basic algebraic formulations. Furthermore, the Taubin method addresses the inherent statistical bias of basic algebraic fitting by introducing a normalization constraint, effectively transforming the algebraic minimization into a generalized eigenvalue problem. Finally, the RANSAC algorithm is included to represent robust statistical estimation based on iterative geometric consensus and random sampling.
Collectively, these selected methodologies encompass three major strategic paradigms consisting of algebraic approximation, geometric optimization, and statistical robust estimation. This diverse and mathematically comprehensive selection ensures exceptional representativeness, establishing an absolutely rigorous benchmark for the subsequent comparative evaluations.
To quantitatively evaluate the fitting accuracy, the geometric residual from a data point to the fitted circumference is defined. The following three statistical metrics are employed for quantitative analysis: RMSE, MAE, and Standard Deviation (STD) of the residuals:
Furthermore, in order to rigorously assess the spatial accuracy of the fitting boundary, this method employs the specific evaluation index referred to in Equation (7). This index is called the Absolute Radius Error (RAE), and its fundamental basis is the G steel structure quality acceptance standard GB 50205-2020 [41].
RAE is a key physical indicator for evaluating the final success degree of the robust fitting process. In practical engineering applications, if the roundness obtained deviates from the structural design drawing in terms of size, merely achieving mathematical smooth convergence is far from sufficient. Therefore, only when the absolute error of the calculated radius is strictly controlled within the preset tolerance range specified in the above standards (<0.5 mm), can the fitting result be scientifically determined as highly successful and in line with the structural requirements.
To practically demonstrate the application of this radial evaluation metric, the robust optimization algorithm was applied to a representative steel gusset plate from the experimental dataset. The visual outcomes of the boundary detection and mathematical fitting procedures are illustrated in Figure 8. The coordinate distribution of the extracted hole clusters, alongside a magnified local view of the boundary fitting, are presented to observe the disturbance rejection behavior of the algorithm. According to the engineering blueprint provided in Figure 8c, the nominal design diameter for these specific structural bolt holes is 30 mm, yielding a nominal design radius of 15 mm. Upon executing the Huber optimization, the calculated mathematical radius for the locally magnified hole converged to 14.74 mm. Consequently, the resulting RAE evaluates to 0.26 mm. Because this specific dimensional deviation falls below the 0.5 mm compliance threshold established previously, the geometric fitting result generally indicates structural acceptability for this specific sample. While comprehensive physical validations remain necessary, this preliminary metric suggests that the computationally derived perimeters align reasonably well with the physical boundaries required for mechanical assembly.
Figure 8.
Bolt hole detection and robust circle fitting results applied to a representative steel gusset plate. (a) Fitting result graph; (b) Detail view of single hole; (c) Real design drawing.
During the manufacturing and transportation processes, actual components frequently develop surface scratches and welding slag attachments, leading to severe deformations in the point clouds. To investigate the ultimate performance of each algorithm under harsh conditions, severe interference data were artificially injected into the raw bolt-hole boundary point sets to construct extreme stress tests:
Outlier Injection: 10% of the points in the boundary set were randomly selected, and their coordinates were randomly shifted outward or inward by significant distances to simulate severe incompleteness and welding slag.
Gaussian Noise Perturbation: For the remaining 90% of the boundary points, Gaussian random noise with a standard deviation ranging from 0.001 to 0.005 was injected to simulate the high-frequency equipment noise of the scanner.
To mitigate randomness and thoroughly assess the stability of the fitting algorithms under complex interference, the noise-injection experiment was run independently for 50 repetitions. The mean, standard deviation (SD), and 95% confidence intervals (CI) of the evaluation metrics across these 50 trials are summarized in Table 2. Furthermore, a non-parametric Wilcoxon signed-rank test was conducted at a significance level of α = 0.05 to mathematically evaluate the statistical significance of the differences between the proposed method and the baseline approaches.
Table 2.
Noise enhancement method comparison.
As reported in Table 2, the proposed Robust method consistently outperforms the baseline techniques, achieving a mean RMSE of 0.148 ± 0.0096 mm and a mean MAE of 0.0076 ± 0.0053 mm. Notably, there is no overlap between the 95% confidence intervals of the proposed method and those of any baseline algorithms. For instance, the upper bound of the RMSE interval for the Robust method (0.158 mm) remains strictly below the lower bound of the next-best method, Pratt (0.266 mm). These results provide rigorous mathematical confirmation that the accuracy and stability improvements of the proposed robust framework are highly statistically significant rather than being a product of stochastic variations in noise distribution. Figure 9 compares three key indicators: the RMSE, MAE and STD of the error.
Figure 9.
Comparison of accuracy of different circle fitting methods after noise addition.
Traditional algebraic and geometric fitting techniques (LS, Pratt, and Taubin) demonstrate extreme sensitivity to noise. Because these methods inherently lack an outlier rejection mechanism, the injected noise severely distorted their global optimization processes. Consequently, their error metrics deteriorated drastically; for instance, the RMSE of the Taubin method soared to 0.298 mm, while the MAE of the LS method remained at an unacceptable level of 0.273 mm. Furthermore, all three traditional methods yielded an STD as high as 0.283 mm, indicating that the noise interference resulted in highly divergent error distributions.
Although the RANSAC algorithm can effectively identify the consensus inlier set—substantially reducing its MAE to 0.185 mm compared to traditional methods—the Robust method proposed herein further pushes the limits of accuracy. Specifically, the Robust method achieved the lowest RMSE (0.148 mm) and an extremely low MAE (only 0.076 mm). From a quantitative perspective, compared to the worst-performing Taubin method, the proposed algorithm reduced the RMSE by 50.3%; compared to the widely used LS method, it dramatically slashed the MAE by an impressive 72.2%.
Furthermore, it is necessary to recognize the inherent limitations of employing artificially injected outliers and Gaussian perturbations to evaluate algorithmic robustness. Although these mathematically controlled stress tests successfully verified the theoretical stability of the proposed Huber optimization mechanism, they cannot fully replicate the extreme complexities encountered during actual TLS operations. Raw point clouds captured on active construction sites are frequently plagued by highly asymmetric physical anomalies. These include heterogeneous point densities, severe occlusions, adverse incidence angle effects, and specular reflections emanating from polished steel surfaces. Additionally, partial visibility of internal hole walls and mixed pixel phenomena near sharp geometric boundaries introduce unpredictable measurement artifacts that basic synthetic noise models fail to capture. Because conducting comprehensive empirical evaluations across diverse scanning distances, varying angular resolutions, and fluctuating environmental conditions was not feasible within the current experimental scope, the ultimate resilience of this framework against pure physical scanning anomalies remains partially unverified.
Figure 10, Table 3, and the associated data tables detail a comparison of the RMSE for the five circle fitting algorithms across five different test holes on the gusset plate. Comprehensive evaluation indicates that the proposed robust method exhibits the best overall performance, consistently maintaining the lowest error levels across all test scenarios.
Figure 10.
Comparison of errors for each hole using different methods.
Table 3.
Error per hole for different methods.
Conventional algebraic and geometric fitting algorithms including LS, Pratt and Taubin methods show pronounced susceptibility to changing data characteristics. Taking the measurement results acquired at Hole 3 as an instance, error curves corresponding to conventional fitting algorithms contain prominent abrupt peaks. The RMSE of the Taubin method and LS method rises sharply to 0.255 mm and 0.245 mm separately. The developed robust algorithm produces remarkably different outcomes by substantially mitigating strong noise disturbances, with the RMSE limited to merely 0.146 mm. Within this extreme measurement condition, the robust algorithm delivers obvious precision enhancement, which reaches around 42.6% compared with the Taubin method and roughly 40.2% relative to the LS method.
Furthermore, although the RANSAC algorithm exhibited commendable accuracy in specific cases, its random sampling nature led to prominent unpredictability. At Hole 1, the error of RANSAC was the highest among all methods (0.205 mm), whereas the Robust method maintained high precision (0.152 mm), representing a 25.9% reduction in error.
Beyond superior absolute accuracy, the most core advantage of the proposed Robust method lies in its excellent cross-scenario stability. While the error curves of the other four algorithms fluctuate violently with the characteristics of different hole positions, the trajectory of the Robust method is flat. From a statistical perspective, the error range (the difference between the maximum and minimum values) of the Robust method across the five holes is strictly confined to a mere 0.026 mm (ranging from 0.134 mm to 0.160 mm), whereas the fluctuation range of the Taubin method is as high as 0.092 mm.
The error radar chart presented in Figure 11, along with the data in Table 4, visually compares the comprehensive performance of the five circle fitting methods. Within this chart, a smaller polygonal envelope area indicates superior overall fitting accuracy for a given algorithm. It is evident that for metrics reflecting central tendency, including the RMSE, Median Absolute Error (MEDAE), and STD, the proposed Robust method tightly converges toward the center. This specific performance surpasses that of the traditional LS, Taubin, and Pratt approaches. Consequently, these results confirm that the Robust method delivers precise and stable fitting results across the vast majority of valid data points classified as inliers.
Figure 11.
Comparison of Radar Chart Accuracy using Different Methods. The evaluation indicators were normalized using min–max normalization. Since all indicators represent fitting errors, the normalized score was calculated as denotes the original value of each indicator. Therefore, a larger radar score indicates better fitting performance.
Table 4.
Overall performance evaluation of different methods.
It is noteworthy that, similar to RANSAC, the proposed Robust method exhibits a relatively higher value for the Maximum Absolute Error (MAXE) metric. Analyzed in-depth from the perspective of robust estimation theory, this is not a flaw in the algorithm, but rather the inevitable mathematical manifestation of its strong noise-resistance capability. Traditional non-robust methods (e.g., LS, Taubin) lack an outlier penalty mechanism; consequently, their fitted models are forcibly “dragged” by severe outliers. In an attempt to compromise globally, they seek to pull down the single worst error, resulting in a superficially smaller MAXE. However, this comes at the severe cost of completely destroying the overall fitting accuracy (manifested as extremely high RMSE and MEDAE). In contrast, the Robust method proposed herein successfully identifies and suppresses these severe outliers, adhering strictly to the true data distribution. Therefore, the distance between the genuinely fitted circular arc and those down-weighted outliers naturally remains large, which is logically reflected as a higher MAXE.
Remarkably, our method exhibits high performance stability under extreme disturbances, outperforming competing methods with an RMSE increase of under 15%. This resilience stems from the Huber loss-based piecewise penalty mechanism. While maintaining quadratic optimization for Gaussian-perturbed inliers to guarantee precision, the Huber function transitions to a linear penalty for outliers exceeding the MAD-based adaptive threshold. Combined with dynamic IRLS weighting, this mechanism effectively nullifies the leverage effect of outliers by assigning them infinitesimal weights. Such experimental evidence underscores the exceptional robustness of the proposed framework in challenging real-world environments.
While the robust circle fitting successfully secures micro geometric stability, the overall digital assembly relies equally on the subsequent matching and global transformation strategies. Therefore, a comprehensive ablation study is conducted next to independently quantify the specific contribution of these remaining algorithmic components.
3.3. Ablation Study on Key Algorithmic Modules
To rigorously quantify the individual performance contributions of the core algorithmic components and to prove that the proposed framework extends fundamentally beyond basic engineering integration, a comprehensive ablation study was conducted. This evaluation isolates the specific impact of the robust fitting, feature matching, and global registration modules.
First, regarding the feature extraction module, the quantitative ablation comparing the proposed robust Huber optimization against traditional methods was extensively detailed previously in Section 3.2. Under extreme noise injection, removing the dynamic weight truncation mechanism and reverting to standard Least Squares resulted in a severe performance degradation, specifically increasing the MAE by fifty six percent. This conclusively isolates the robust fitting module as the primary contributor to micro-level geometric stability.
Second, an ablation experiment was performed to evaluate the matching strategy. We compared the proposed high-dimensional descriptor against a conventional Nearest Neighbor search and a partial descriptor utilizing only polar coordinates. Under ideal conditions, all three strategies successfully matched the homologous holes. However, when severe point cloud incompleteness and centroid shifts were artificially introduced to simulate scanning blind spots, the Nearest Neighbor approach failed completely due to spatial misalignment. The partial polar descriptor also exhibited a significant mismatch rate due to the altered global centroid. Only the complete descriptor fusing polar coordinates with local neighborhood topology maintained a flawless assignment success rate. This confirms that the topological component is indispensable for preventing matching ambiguity under defective engineering conditions.
To evaluate the robustness of the proposed descriptor under realistic engineering degradation conditions, a series of artificial defects were introduced into the original point clouds to simulate uncertainties commonly encountered during laser scanning and digital pre-assembly of steel structures. The simulated degradation includes local point loss, centroid deviation, local geometric distortion, and hole localization uncertainty.
To systematically evaluate the performance limits and robustness of the algorithm under various non-ideal conditions, multiple sets of controlled degradation experiments were designed and conducted, covering single-factor parameter variations as well as multi-variable combined stress tests. Specifically, a local point loss rate of 0%, 20%, and 40% was introduced to simulate the incomplete point cloud issues caused by occlusion, limited scanning view angles, and invisible areas during field data collection. A centroid offset of 0, 10, and 20 mm was applied to the target point cloud to simulate the coordinate deviations and rough registration errors between different scanning stations. Additionally, a local geometric perturbation of 3–4 mm was introduced to reproduce the local structural inconsistencies caused by incomplete boundary observations and surface measurement differences. Finally, Gaussian positioning noise with a standard deviation of up to 5 mm was added at the center of the extracted bolt hole, to simulate the uncertainty caused by point measurement noise and geometric fitting errors. These degradation parameters were evaluated separately as independent variables, and also combined together to establish three different levels of assembly stress (mild, moderate, and severe), in order to comprehensively test the operational boundaries of the algorithm.
Under these degraded conditions, the original topological correspondence between bolt holes was preserved while the geometric consistency of the observations was intentionally reduced, providing a fair benchmark for evaluating the discriminative capability of different matching strategies. A hole correspondence was considered successful when the Euclidean distance between the matched hole centers was within 2 mm. For the 24 Gusset plates in the two sections (with a total of 88 bolt holes), the matching results of the corresponding holes are shown in Table 5.
where represents the total number of holes, and represents the number of successfully matched holes. The reference hole center, and is the center of the hole obtained through matching.
Table 5.
Matching results of holes under simulated defects.
The main reasons for the failed matching of the holes are as follows: Firstly, at positions where the boundaries are severely obstructed, the Alpha Shape algorithm is unable to reconstruct the complete circular contour, thereby introducing systematic eccentricity bias into the estimated hole center. Secondly, holes located near the edges of the sheet or near local welding attachments are affected by edge reflections and isolated outliers, which damages the DBSCAN density clustering and subsequently distorts the robust circle fitting process. Finally, when multiple degradation factors such as point missing, centroid translation, geometric perturbation, and positioning noise act simultaneously, they cumulatively distort the multi-feature descriptors. This multi-dimensional distortion leads to the collapse of the distinguishing boundaries in the global cost matrix, making the cost of correct matching no longer significantly lower than that of incorrect candidates, thereby delineating the operational boundary of the purely geometric-driven matching paradigm.
To systematically evaluate the robustness and boundaries of the matching algorithms under non-ideal, symmetric, and degenerate industrial conditions, a controlled feature degradation framework categorized into five severity levels (D0 to D4) was established. Starting from the baseline configuration (D0, original cost matrix), spatial noise is progressively introduced, and geometric cues are systematically obscured. Level D1 introduces Gaussian feature noise with a standard deviation equal to 5% of the baseline feature scale. Level D2 increases this noise to 10% and suppresses the directional feature weights to reduce local angular distinctiveness. At Level D3, the noise level is raised to 20%, and a repetitive local layout is constructed to simulate structural ambiguity. Level D4 represents the most challenging scenario, featuring a strictly symmetric/mirrored hole configuration combined with 30% feature noise. Each degradation level is subjected to 50 independent Monte Carlo trials. The performance of the four algorithms, Nearest Neighbor (NN), Greedy Search, Hungarian, and Auction is evaluated quantitatively across four metrics: total matching cost, optimality rate (the probability of identifying the global minimum), the number of mismatched associations, and computational execution time. The specific results are shown in Table 6 and Table 7.
Table 6.
The specific running time and cost under condition D0.
Table 7.
Matching results under different hole layout and degradation conditions of features.
On the original gusset-plate cost matrix, all four algorithms returned the same total cost of 0.0838, indicating that the greedy solution coincided with the global optimum for this particular dataset. However, this result should not be generalized to symmetric or repetitive layouts. The additional controlled-degradation experiments showed that the optimality rate of greedy matching decreased as feature ambiguity increased, whereas the Hungarian consistently recovered the minimum-cost assignment. Accordingly, the proposed VTA framework adopts the Hungarian solver as a measure for precise allocation, while the greedy strategy remains available as a computationally efficient preliminary solution.
3.4. System-Level Evaluation of VTA for Gusset Plates
Following the validation of high precision and reliability in hole-center feature extraction, the proposed method was applied to the global digital pre-assembly of two real steel gusset plates. The workflow strictly adheres to the established methodology: (1) extracting the master and slave hole sets from the two components; (2) automatically establishing non-destructive hole matching relationships using a multi-feature constrained cost function that integrates polar and topological features; and (3) employing the SVD algorithm to solve for the rigid transformation matrix (R and t) for spatial alignment of the point clouds.
To comprehensively evaluate the performance of digital pre-assembly, in addition to geometric error indicators (RMSE, mean square error, and maximum error), the hole integrity metric (Hole DOC) was also adopted. Similar to the DOC proposed by Wang et al. [42] for evaluating matching quality, these metrics quantify the completeness of both feature correspondence and surface alignment during digital preassembly. The Hole DOC evaluates the ratio of successfully matched bolt holes.
The Hole DOC is defined as:
where denotes the number of successfully matched bolt holes and is the total number of bolt holes expected to be matched.
Combining the geometric accuracy based on RMSE, this integrity indicator provides a comprehensive assessment of the quality of VTA by evaluating the accuracy of feature correspondence.
The evaluation metrics presented in Table 8 quantify the scalability and registration error growth of the proposed VTA framework as the assembly scales up. Because spatial registration strictly requires a matching pair of master and slave components, the baseline unit consists of 2 plates. The evaluation progressively expands from this baseline to 4, 8, 12, and 24 simultaneously registered plates comprising up to 88 constrained bolt holes across the two adjacent bridge sections.
Table 8.
Multi-component registration error.
The mean hole error increased from 0.30 mm for two plates to 1.47 mm for 24 plates. A monotonic increase was observed as the number of simultaneously registered components increased. A square-root growth model provided a reasonable descriptive fit:
where N denotes the number of registered plates. This model is used only to describe the observed trend and is not intended as a universal error-propagation law.
The increase in error with assembly scale is attributed to the accumulation of local manufacturing deviations, scanning uncertainty, and small rotational errors. For a component located at distance r from the effective rotation center, a small angular error produces an approximate positional displacement . When multiple components are registered sequentially or within a common global frame, these local contributions accumulate and become more evident at the outer extremities of the assembly. The scale experiment quantitatively confirms this propagation behavior, while the maximum hole error for 24 plates remains below the 2.0 mm acceptance threshold used in the present engineering evaluation. The proposed method controls the accumulated error within the tested scale, but does not eliminate error growth with increasing assembly size.
Figure 12 presents the final VTA results and the corresponding quantitative evaluations. As illustrated in the 3D scatter plot (Figure 12a), after the rigid transformation driven by the extracted geometric features, the transformed Plate A (blue) achieves excellent spatial alignment with target Plate B (gray). The homogeneous mixture of the two point clouds indicates high consistency in surface registration. More importantly, the hole centers of plate A (green circles) and plate B (orange squares), which serve as key connection features, exhibit near-perfect spatial overlap, directly verifying the reliability of the preceding robust feature extraction algorithm.
Figure 12.
Evaluation of VTA effect: (a) Assembly effect of two-node plates; (b) Error of hole alignment between two components; (c) Assembly quality evaluation report.
To clarify the quantitative metrics presented, the hole index displayed along the horizontal axis of Figure 12b corresponds directly to the discrete homologous hole pairs successfully associated by the global cost matrix assignment algorithm detailed previously. The vertical axis evaluates the absolute spatial Euclidean distance between the geometric centers of each matched pair following the rigid transformation. Furthermore, the automated approval status designated as PASS in Figure 12c is derived using strict engineering tolerance criteria. Specifically, the absolute 3D spatial coordinates of the 10 representative control bolt holes (as laid out in Figure 8a), measured directly in the field using a high-precision total station, were utilized as the physical ground truth. Following the global SVD rigid-body transformation, the coordinate sets of these 10 aligned hole centers extracted from the point cloud were quantitatively compared against their corresponding total station measurements. The validation results show that the spatial coordinate deviations between the VTA-aligned hole centers and the total station ground-truth coordinates yielded a MAD of 0.85 mm, with a Maximum Deviation of 1.42 mm. Because these independent deviations strictly remain below the conventional 2.0 mm regulatory tolerance threshold mandated by GB 50205-2020, the PASS decision-making process is successfully validated by external physical measurements. This cross-verification successfully transitions our virtual trial assembly framework from a relative registration assessment to a verified physical acceptability decision.
The rigid body transformation results obtained after the pre-assembling of the node plates (Section 2.4 of this article) can accurately guide the spatial alignment of the entire component, as shown in Figure 13. The rotation matrix R and the translation matrix t are as follows:
Figure 13.
Complete component VTA results.
Following the rigid transformation utilizing SVD, the average spatial residual between matched hole centers demonstrates exceptional internal algorithmic consistency. Crucially, the maximum mathematical deviations are suppressed below the conventional 2 mm tolerance mandated by standard bridge construction codes. By effectively creating a substantial safety margin against inevitable physical manufacturing variances, these precise computational metrics indicate that the components possess a high probability of successful physical assembly. The stability of the derived assembly pose is further evidenced by the microscopic rotation angles operating at a magnitude of 10−4 alongside appropriate normal translations. Consequently, this methodology demonstrates immense potential as a highly efficient digital alternative to traditional manual trial assembly within intelligent construction workflows.
To quantitatively evaluate the generalization ability of the proposed framework and verify its sensitivity to heterogeneous operating conditions, we conducted a series of systematic control experiments using the obtained high-precision point cloud dataset. Given the physical limitations of the structural components of other bridge projects, we performed computational variations and down sampling on the existing dataset to simulate four key deterioration dimensions: hole spacing, density, scanning angle, and point density. The detailed results are presented in Table 9.
Table 9.
The influence of controlled data changes on the extraction error of the hole center.
The controlled experiments indicate that the proposed method is relatively insensitive to moderate changes in hole spacing, but its performance degrades when point density decreases or the scanning incidence angle becomes large. This behavior is consistent with the loss of visible circular boundary points and increased partial occlusion under oblique scanning.
To further evaluate the practical applicability of the proposed digital assembly framework, the computational efficiency of each processing stage was quantitatively analyzed. All experiments were conducted on a desktop computer equipped with an AMD Ryzen 7 6800H processor (3.20 GHz) and 16 GB RAM, running MATLAB R2024a under a 64-bit Windows operating system. All algorithms were implemented without parallel computing or GPU acceleration and executed on a single CPU core. Each structural component originally contained approximately 106 raw points. Prior to feature extraction, voxel-grid down sampling was performed to preserve the geometric characteristics of the bolt-hole regions while reducing the point cloud to approximately 104 points, thereby improving computational efficiency without affecting the assembly accuracy. The average execution time is shown in Table 10.
Table 10.
The running time of each part of the algorithm.
The results show that, without affecting the center error and assembly error of the holes, removing irrelevant noise points from the point cloud can roughly save 4 times the running time. Among all processing stages, point cloud preprocessing, boundary extraction, and robust circle fitting constitute the main computational cost, while feature matching and rigid body transformation based on SVD take less than 2 s in total. Since all calculations are completed on a single CPU core without using parallel computing or GPU acceleration, through algorithm optimization and hardware acceleration, the running time is expected to be further shortened.
4. Discussion
In practical applications of VTA, point clouds acquired in manufacturing environments frequently suffer from severe outliers. Previous research often relies on random sampling or manual data cleaning to mitigate these artifacts [21]. However, our results demonstrate that traditional algebraic approaches suffer from severe center deviation errors under extreme noise. This aligns with recent studies highlighting the vulnerability of quadratic penalty mechanisms in classical LS methods [43]. Conversely, the optimization algorithm integrating the Huber loss and IRLS introduced herein actively suppresses disturbance. Furthermore, traditional global registration literature heavily utilizes the ICP algorithm [44]. Recent studies confirm that such iterative techniques frequently converge to local optima when processing featureless smooth steel plates [45]. By diverging from dense point matching, we proposed a matching strategy strictly constrained by discrete bolt holes. Utilizing a multi-dimensional descriptor fusing polar coordinates and local topology, this approach guarantees a globally optimal assignment entirely independent of initial spatial poses [23].
Based on this discrete feature registration paradigm, our comparative evaluations strategically prioritized the robust extraction of circular features over conventional global registration algorithms. This specific evaluation focus is driven by the fundamental mathematical architecture of our framework. By utilizing SVD, the system mathematically guarantees a closed-form global optimum once the homologous points are successfully paired. Consequently, the unpredictable iterative sliding inherent in dense point cloud matching is completely bypassed. The ultimate spatial alignment accuracy of the entire VTA pipeline becomes exclusively dependent on the robustness of the underlying circle fitting procedure. Therefore, demonstrating the superior disturbance rejection capabilities of our Huber optimization algorithm inherently and rigorously substantiates the overall reliability of the complete VTA system.
A critical interpretation of the resulting quantitative metrics reveals the practical engineering significance of this robust extraction. As documented in the final evaluations, when matching a single gusset plate, the maximum deviation of the original point cloud was 0.634 mm, while the maximum residual of hole matching was 0.53 mm, showing a significant difference; when matching all gusset plates, the maximum deviation of the original point cloud was 1.83 mm, while the maximum residual of hole matching was 1.64 mm. This numerical difference mathematically proves the macroscopic smoothing effect of the proposed Huber optimization. While raw point clouds contain isolated extreme outliers generating the higher peak, the robust algorithm successfully truncates these anomalies, computing the geometric center based exclusively on the consensus of the pristine inliers. Evaluated against the Chinese National Standard GB 50205, which restricts the allowable misalignment tolerance for high strength bolted connections to a maximum of 2 mm. However, our maximum registered error is 1.62 mm, which meets the assembly requirements.
To establish absolute scientific transparency, it is essential to explicitly define the operational boundaries of the proposed framework. Geometrically, the current algorithmic pipeline operates on three strict prerequisites. The spatial projection module assumes predominantly planar interfaces, making it vulnerable to severely deformed plates or complex non planar joints. The robust optimization module strictly assumes circular geometries and cannot process intentionally elongated slotted holes. Moreover, the topological matching strategy relies on spatial asymmetry and may encounter assignment ambiguity in perfectly symmetric repetitive hole patterns. Structurally, the rigid registration model assumes no deformation occurs during assembly. However, for beams with extended spans, deformable alterations induced by intrinsic weight or thermal variations are inevitable, necessitating future incorporation of finite element analysis. additionally, as point cloud scales continue to expand, subsequent work must explore fully integrated three dimensional semantic segmentation utilizing deep learning to prevent computational bottlenecks.
Beyond geometric and computational scalability, the practical deployment of VTA in multi-stakeholder BIM ecosystems introduces critical challenges regarding secure data sharing and collaborative privacy preservation. Different collaborative parties naturally require varying levels of information detail. To control access to these sensitive geometric datasets without risking intellectual property leakage, future implementations of the collaborative VTA workflow can integrate privacy-preserving cryptographic frameworks. Specifically, the extracted 3D coordinate vectors of the bolt-hole centers can be treated as a secret and partitioned using algebraic–geometric secret-sharing schemes, such as those proposed by Chen and Cramer [46]. Because the spatial alignment primarily involves linear algebraic operations (such as matrix multiplication and covariance estimation within the SVD solver), these calculations can be executed directly on the secret-shared coordinate vectors over finite fields via Secure Multi-Party Computation. Furthermore, to enforce rigorous access control over large-scale connection nodes, we can deploy the uniform secret-sharing model developed by Morteza and Chou [47], which optimizes access functions under explicit information leakage and recoverability thresholds. This model mathematically minimizes the shared data sizes while strictly bounding unauthorized geometric information leakage below a predefined threshold. To further optimize the transmission efficiency of highly dimensional coordinate arrays in decentralized BIM networks, strongly multiplicative ramp secret-sharing schemes, such as those formulated by Chen et al. [48], can be utilized to allow the heavy secret vectors to lie in an extension field while keeping the distributed shares in a small base field. Under such joint cryptographic protocols, the collaborative VTA pipeline will securely output only the final rigid transformation matrix (R, t) and deviation metrics to the contractor and owner, while mathematically guaranteeing that the manufacturer’s raw coordinates remain completely shielded and private.
5. Conclusions
To address the inefficiencies and spatial constraints of traditional physical trial assembly, and to overcome the extreme sensitivity of existing digital assembly methods to noise and arbitrary initial poses, this paper proposes an automated framework for prefabricated steel structures. Based on systematic comparative experiments and theoretical analysis, the primary conclusions are summarized as follows.
- (1)
- A highly robust hole extraction algorithm was developed by integrating the Huber loss function with IRLS optimization to establish a robust circle fitting model. By comparing with the measured aperture, the RAE value was 0.26 mm, and the fitting result was acceptable. Compared to conventional LS, Pratt, and RANSAC, the proposed model effectively mitigates the impact of significant outliers through an adaptive weight truncation mechanism. The algorithm maintains exceptional relative computational consistency even under challenging conditions characterized by 10% local defects and severe environmental noise. Consequently, this approach mitigates the issue of feature shifts resulting from degraded scanned point clouds.
- (2)
- A spatially invariant and defect-tolerant matching mechanism was established. A high-dimensional feature descriptor was constructed by fusing global polar coordinates with local neighborhood topology. In conjunction with a cost function constrained by multiple features and a greedy assignment strategy, this method robustly addresses the challenges of arbitrary initial translation and rotation. It achieves highly reliable automated geometric pairing, substantially reducing the risk of mismatching and convergence to local optima caused by local geometric incompleteness.
- (3)
- An automated quality evaluation workflow was implemented. Optimal spatial rigid alignment between structural components was mathematically achieved utilizing the SVD algorithm. System evaluation indicates that the proposed framework has a maximum point cloud error of 1.83 mm after all gusset plates are aligned. While extensive physical validations across diverse structures are strictly required for industrial deployment, this methodology demonstrates tremendous potential as a foundational digital framework to eventually supplement or partially replace traditional physical trial assembly within intelligent construction workflows.
Despite the outstanding precision and algorithmic robustness demonstrated in this study, it is necessary to explicitly acknowledge the limitations regarding the scale of the current experimental dataset. Because all controlled variations were generated from the existing two-component dataset, they should be interpreted as sensitivity analyses rather than independent cross-project validation. Validation on components with different thicknesses, contours, hole arrangements, and acquisition environments remains necessary. Future research endeavors must expand the dataset to encompass a wider variety of complex bridge components and heterogeneous scanning environments to fully validate the universal applicability of this digital assembly framework.
Author Contributions
Conceptualization, L.Z. and Z.X.; methodology, L.Z. and Z.X.; software, J.W. and L.T.; validation, S.Z.; Formal analysis, R.F. and S.Z.; Investigation, L.Z. and J.W.; Writing—original draft preparation, J.W.; Writing—review and editing, L.Z. and J.W.; Visualization, L.T.; Supervision, Z.X. and S.Z.; Funding acquisition, R.F. All authors have read and agreed to the published version of the manuscript.
Funding
This research is supported by the National Natural Science Foundation of China (Grant No. 52508330), the Science and Technology Research Program of Chongqing Municipal Education Commission (Grant No. KJQN202400735) and State Key Laboratory of Bridge Safety and Resilience (Grant 2024SKLBSR-DW010).
Data Availability Statement
The raw data supporting the conclusions of this article will be made available by the authors on request.
Conflicts of Interest
Author Li Tian was employed by the company China Railway Construction Bridge Engineering Bureau Group Co., Ltd. The remaining authors declare that the research was conducted in the absence of any commercial or financial relationships that could be construed as a potential conflict of interest.
References
- Nguyen, D.-C.; Jeon, C.-H.; Roh, G.; Shim, C. BIM-Based Preassembly Analysis for Design for Manufacturing and Assembly of Prefabricated Bridges. Autom. Constr. 2024, 160, 105338. [Google Scholar] [CrossRef] [Scilit]
- Xu, C.; Xiong, W.; Zhu, Y.; Cai, C.S. A Point Cloud Virtual Trial Assembly Method for Preventive Quality Control of Prefabricated Bridge. Struct. Control. Health Monit. 2025, 2025, 8861887. [Google Scholar] [CrossRef] [Scilit]
- Tan, Y.; Chen, L.; Wang, Q.; Li, S.; Deng, T.; Tang, D. Geometric Quality Assessment of Prefabricated Steel Box Girder Components Using 3D Laser Scanning and Building Information Model. Remote Sens. 2023, 15, 556. [Google Scholar] [CrossRef] [Scilit]
- Kim, M.-K.; Thedja, J.P.P.; Wang, Q. Automated Dimensional Quality Assessment for Formwork and Rebar of Reinforced Concrete Components Using 3D Point Cloud Data. Autom. Constr. 2020, 112, 103077. [Google Scholar] [CrossRef] [Scilit]
- Long, L.; Liu, W.; Xu, S.; Shi, P.; Zhang, C.; Deng, L. Automated Alignment Deviation Measurement for Precast Concrete Assembly Using Point Cloud-Image Fusion. Autom. Constr. 2025, 180, 106540. [Google Scholar] [CrossRef] [Scilit]
- Tamai, S.; Yagata, Y.; Hosoya, T. New Technologies in Fabrication of Steel Bridges in Japan. J. Constr. Steel Res. 2002, 58, 151–192. [Google Scholar] [CrossRef] [Scilit]
- Case, F.; Beinat, A.; Crosilla, F.; Alba, I.M. Virtual Trial Assembly of a Complex Steel Structure by Generalized Procrustes Analysis Techniques. Autom. Constr. 2014, 37, 155–165. [Google Scholar] [CrossRef] [Scilit]
- Crosilla, F.; Beinat, A. Use of Generalised Procrustes Analysis for the Photogrammetric Block Adjustment by Independent Models. ISPRS J. Photogramm. Remote Sens. 2002, 56, 195–209. [Google Scholar] [CrossRef] [Scilit]
- Maset, E.; Scalera, L.; Zonta, D.; Alba, I.M.; Crosilla, F.; Fusiello, A. Procrustes Analysis for the Virtual Trial Assembly of Large-Size Elements. Robot. Comput.-Integr. Manuf. 2020, 62, 101885. [Google Scholar] [CrossRef] [Scilit]
- Li, D.; Liu, J.; Feng, L.; Zhou, Y.; Liu, P.; Chen, Y.F. Terrestrial Laser Scanning Assisted Flatness Quality Assessment for Two Different Types of Concrete Surfaces. Measurement 2020, 154, 107436. [Google Scholar] [CrossRef] [Scilit]
- Xu, C.; Xiong, W.; Tang, P.; Cai, C.S. Automated Flatness Assessment for Large Quantities of Full-Scale Precast Beams Using Laser Scanning. Comput. Civ. Infrastruct. Eng. 2024, 39, 1868–1885. [Google Scholar] [CrossRef] [Scilit]
- Zhang, H.; Zhu, Y.; Xiong, W.; Cai, C.S. Point Cloud Registration Methods for Long-Span Bridge Spatial Deformation Monitoring Using Terrestrial Laser Scanning. Struct. Control. Health Monit. 2023, 2023, 2629418. [Google Scholar] [CrossRef] [Scilit]
- Tang, P.; Huber, D.; Akinci, B.; Lipman, R.; Lytle, A. Automatic Reconstruction of As-Built Building Information Models from Laser-Scanned Point Clouds: A Review of Related Techniques. Autom. Constr. 2010, 19, 829–843. [Google Scholar] [CrossRef] [Scilit]
- Li, D.; Liu, J.; Feng, L.; Zhou, Y.; Qi, H.; Chen, Y.F. Automatic Modeling of Prefabricated Components with Laser-scanned Data for Virtual Trial Assembly. Comput. Civ. Infrastruct. Eng. 2021, 36, 453–471. [Google Scholar] [CrossRef] [Scilit]
- Jiang, Y.; Shu, J.; Ye, J.; Zhao, W. Virtual Trail Assembly of Prefabricated Structures Based on Point Cloud and BIM. Autom. Constr. 2023, 155, 105049. [Google Scholar] [CrossRef] [Scilit]
- Wang, Y.-G.; He, X.-J.; He, J.; Fan, C. Virtual Trial Assembly of Steel Structure Based on BIM Platform. Autom. Constr. 2022, 141, 104395. [Google Scholar] [CrossRef] [Scilit]
- Zhou, Y.; Wang, W.; Luo, H.; Zhang, Y. Virtual Pre-Assembly for Large Steel Structures Based on BIM, PLP Algorithm, and 3D Measurement. Front. Eng. Manag. 2019, 6, 207–220. [Google Scholar] [CrossRef] [Scilit]
- Zhou, Y.; Han, D.; Hu, K.; Qin, G.; Xiang, Z.; Ying, C.; Zhao, L.; Hu, X. Accurate Virtual Trial Assembly Method of Prefabricated Steel Components Using Terrestrial Laser Scanning. Adv. Civil. Eng. 2021, 2021, 9916859. [Google Scholar] [CrossRef] [Scilit]
- Guo, M.; Guo, S.; Meng, Q.; Liu, M.; Wang, J.; Cui, C.; Zhang, X. Intelligent Virtual Trial Assembly of Prefabricated Frame Structures for Large and Complex Construction Scenes. Autom. Constr. 2025, 172, 106047. [Google Scholar] [CrossRef] [Scilit]
- Tan, Y.; Li, S.; Wang, Q. Automated Geometric Quality Inspection of Prefabricated Housing Units Using BIM and LiDAR. Remote Sens. 2020, 12, 2492. [Google Scholar] [CrossRef] [Scilit]
- Cheng, G.; Liu, J.; Cui, N.; Hu, H.; Xu, C.; Tang, J. Virtual Trial Assembly of Large Steel Members with Bolted Connections Based on Point Cloud Data. Autom. Constr. 2023, 151, 104866. [Google Scholar] [CrossRef] [Scilit]
- Chen, L.-H.; Liang, D.; Huang, H.-B.; Su, L.-C.; Wang, B. Steel-Truss Assembly Accuracy Analysis Based on Error Propagation and Stochastic Simulation. Int. J. Steel Struct. 2025, 25, 609–621. [Google Scholar] [CrossRef] [Scilit]
- Zhang, Z.; Liang, D.; Huang, H.; Sun, L. Virtual Trial Assembly of Large Steel Members with Bolted Connections Based on Multiscale Point Cloud Fusion. Comput. Civ. Infrastruct. Eng. 2024, 39, 2619–2641. [Google Scholar] [CrossRef] [Scilit]
- Lin, S.; Jusko, O.; Härtig, F.; Seewig, J. A Least Squares Algorithm for Fitting Data Points to a Circular Arc Cam. Measurement 2017, 102, 170–178. [Google Scholar] [CrossRef] [Scilit]
- Nurunnabi, A.; Sadahiro, Y.; Laefer, D.F. Robust Statistical Approaches for Circle Fitting in Laser Scanning Three-Dimensional Point Cloud Data. Pattern Recognit. 2018, 81, 417–431. [Google Scholar] [CrossRef] [Scilit]
- Wang, X.; Yan, X.; Luo, Q. Adaptive Square-Root Extended Cubature Kalman Filter Based on Huber M−estimation for Multi-AUV Cooperative Navigation. Measurement 2025, 249, 117035. [Google Scholar] [CrossRef] [Scilit]
- Liu, J.; Cui, N.; Cheng, G.; Li, D.; Ma, X.; Liao, Y. Towards the Automated Virtual Trial Assembly of Large and Complex Steel Members Using Terrestrial Laser Scanning and BIM. Eng. Struct. 2023, 291, 116448. [Google Scholar] [CrossRef] [Scilit]
- Lee, C.; Ko, D.; Maru, M.B.; Jang, K.; Choi, W.; Cha, G.; Park, S. UAV LiDAR Bridge Point Cloud Dataset and Hybrid Deep Learning Framework for Robust Semantic Segmentation. Autom. Constr. 2026, 188, 107045. [Google Scholar] [CrossRef] [Scilit]
- Hu, Z.; Brilakis, I. Matching Design-Intent Planar, Curved, and Linear Structural Instances in Point Clouds. Autom. Constr. 2024, 158, 105219. [Google Scholar] [CrossRef] [Scilit]
- Thomas, G.; Deepak Lawrence, K. A Comparative Study of Center Searching and Circle Fitting Approaches for Roundness Evaluation. Measurement 2026, 257, 118722. [Google Scholar] [CrossRef] [Scilit]
- Xu, Y.; Wang, Y.; Yang, J.; Yu, T.; Zhang, J. Semantic-Guided Automatic Data Acquisition for Terrestrial Laser Scanners in Civil Engineering. Autom. Constr. 2025, 177, 106337. [Google Scholar] [CrossRef] [Scilit]
- Liang, D.; Zhang, Z.; Guo, B.; Wang, B.; Wang, X. Extraction of Feature Information from Point Cloud of Large Volume Steel Truss Members. Adv. Civil. Eng. 2024, 2024, 5891852. [Google Scholar] [CrossRef] [Scilit]
- Xiang, Y.; Liu, S.; Huang, Z.; Jin, S. A Hybrid Iterative Method for Geometric Error Identification of Complex Surfaces Based on On-Machine Measurement Point Clouds. Measurement 2026, 274, 121351. [Google Scholar] [CrossRef] [Scilit]
- Zhu, X.; Hossain, M.M.; Li, J.; Zhang, B.; Xu, C. Weight Coefficient Calculation through Equivalent Ray Tracing Method for Light Field Particle Image Velocimetry. Measurement 2022, 193, 110982. [Google Scholar] [CrossRef] [Scilit]
- Xiao, J.; Zhang, J.; Adler, B.; Zhang, H.; Zhang, J. Three-Dimensional Point Cloud Plane Segmentation in Both Structured and Unstructured Environments. Robot. Auton. Syst. 2013, 61, 1641–1652. [Google Scholar] [CrossRef] [Scilit]
- Liu, Y.; Yao, J.; Xu, Z.; Liang, J.; Long, Z.; Li, Z.; Gong, Y. Improved Ultrasonic Absolute Stress Measurement Based on Optimized Wavelet Transform and Cross-Correlation Algorithm. Measurement 2025, 246, 116638. [Google Scholar] [CrossRef] [Scilit]
- Qin, Y.; Fang, X. On the Exact and Efficient Solution of the Huber Function for Measurement Applications. Measurement 2023, 207, 112416. [Google Scholar] [CrossRef] [Scilit]
- Cao, Z.; Xu, Y.; Li, W.; Xia, Q.; Zhang, J. 3D Virtual Closure Assembly for a Cable-Stayed Bridge via Partial Point Cloud Registration. Autom. Constr. 2026, 187, 106912. [Google Scholar] [CrossRef] [Scilit]
- Yang, B.; Zang, Y. Automated Registration of Dense Terrestrial Laser-Scanning Point Clouds Using Curves. ISPRS J. Photogramm. Remote Sens. 2014, 95, 109–121. [Google Scholar] [CrossRef] [Scilit]
- Saab, S.; Saab, K.; Phoha, S.; Zhu, M.; Ray, A. A Multivariate Adaptive Gradient Algorithm with Reduced Tuning Efforts. Neural Netw. 2022, 152, 499–509. [Google Scholar] [CrossRef] [Scilit] [PubMed]
- GB 50205-2020; Standard for Acceptance of Construction Quality of Steel Structures. China Planning Press: Beijing, China, 2020.
- Wang, Q.; Cheng, J.C.P.; Sohn, H. Automated Estimation of Reinforced Precast Concrete Rebar Positions Using Colored Laser Scan Data. Comput. Civ. Infrastruct. Eng. 2017, 32, 787–802. [Google Scholar] [CrossRef] [Scilit]
- Huber, P.J. Robust Statistics. In Wiley Series in Probability and Mathematical Statistics; Wiley: New York, NY, USA, 1981; ISBN 978-0-471-41805-4. [Google Scholar]
- Besl, P.J.; McKay, N.D. A Method for Registration of 3-D Shapes. IEEE Trans. Pattern Anal. Mach. Intell. 1992, 14, 239–256. [Google Scholar] [CrossRef] [Scilit]
- Pomerleau, F.; Colas, F.; Siegwart, R.; Magnenat, S. Comparing ICP Variants on Real-World Data Sets: Open-Source Library and Experimental Protocol. Auton. Robot. 2013, 34, 133–148. [Google Scholar] [CrossRef] [Scilit]
- Chen, H.; Cramer, R. Algebraic Geometric Secret Sharing Schemes and Secure Multi-Party Computations over Small Fields. In Advances in Cryptology—CRYPTO 2006; Dwork, C., Ed.; Lecture Notes in Computer Science; Springer: Berlin/Heidelberg, Germany, 2006; Volume 4117, pp. 521–536. ISBN 978-3-540-37432-9. [Google Scholar]
- Morteza, A.; Chou, R.A. Constrained Optimization of Access Functions in Uniform Secret Sharing. In 2025 IEEE International Symposium on Information Theory (ISIT); IEEE: Ann Arbor, MI, USA, 2025; pp. 1–6. [Google Scholar]
- Chen, H.; Cramer, R.; Goldwasser, S.; De Haan, R.; Vaikuntanathan, V. Secure Computation from Random Error Correcting Codes. In Advances in Cryptology—EUROCRYPT 2007; Naor, M., Ed.; Lecture Notes in Computer Science; Springer: Berlin/Heidelberg, Germany, 2007; Volume 4515, pp. 291–310. ISBN 978-3-540-72539-8. [Google Scholar]
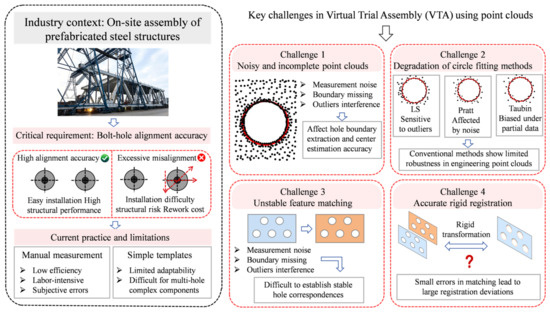
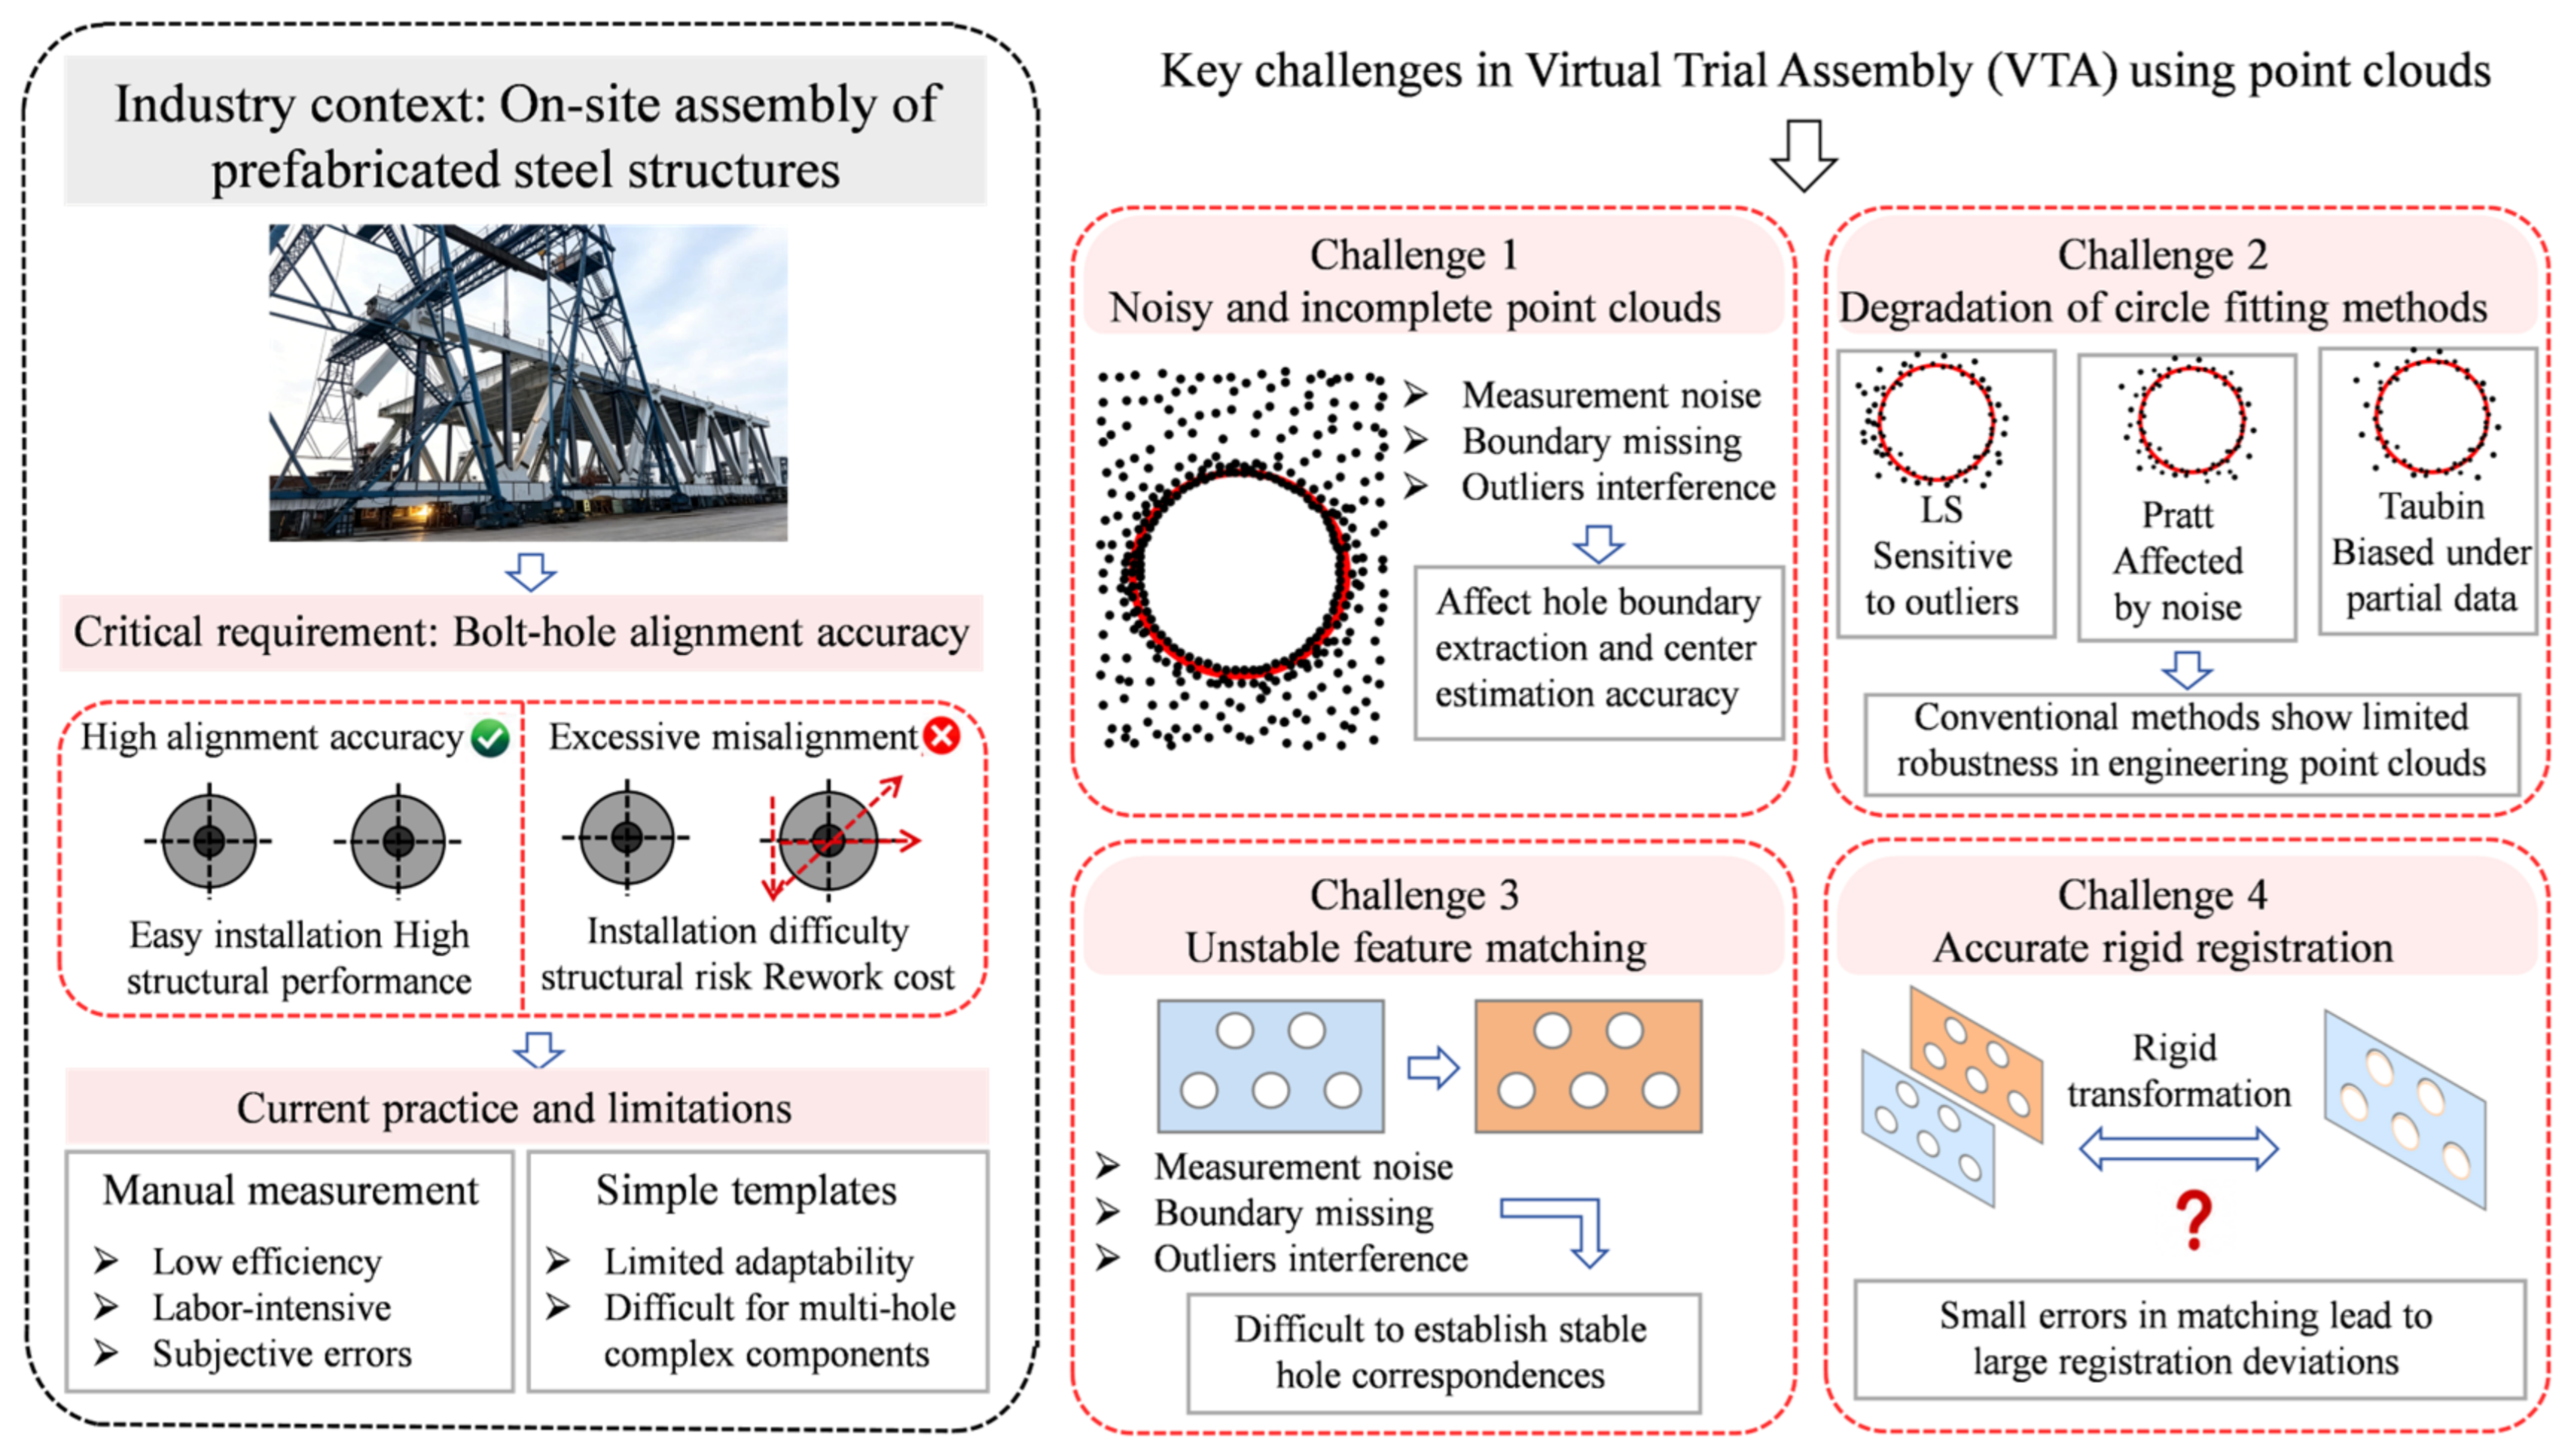
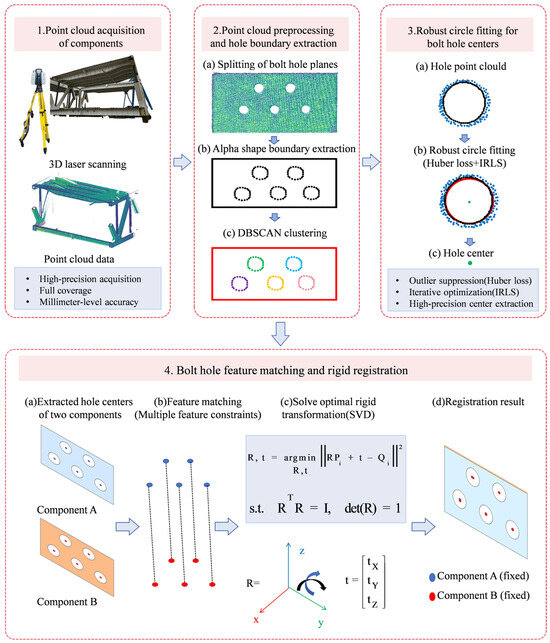
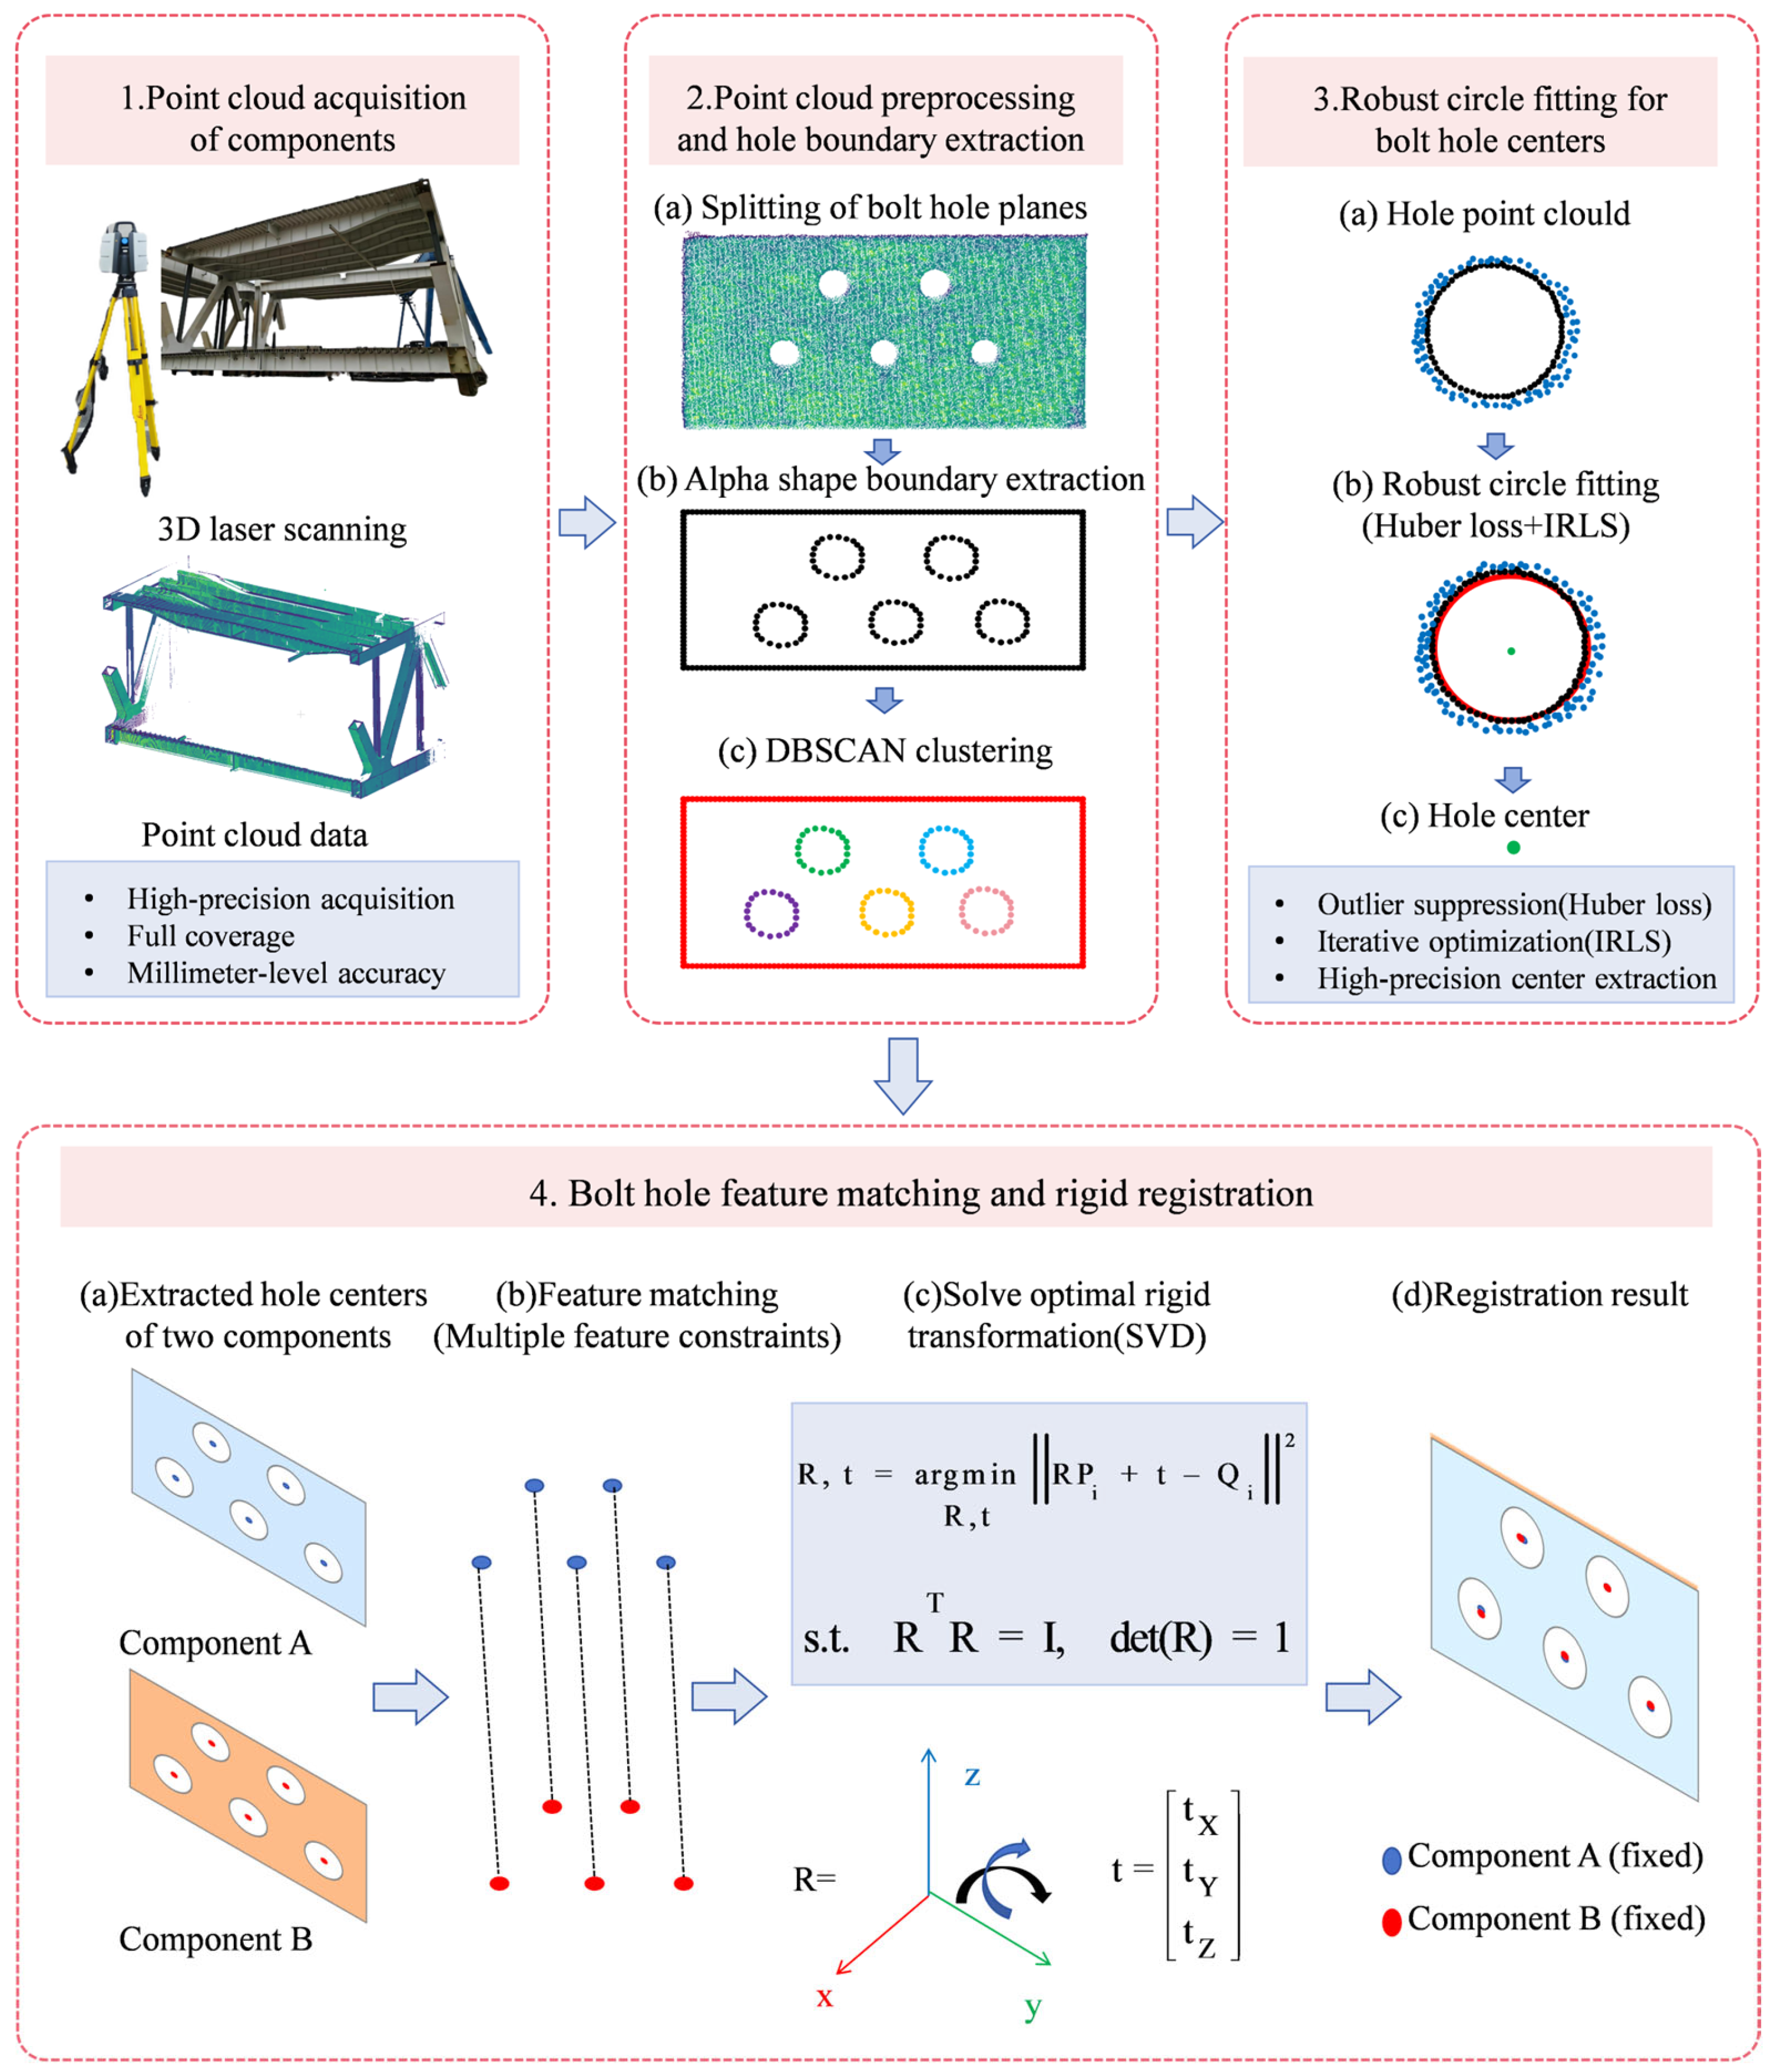
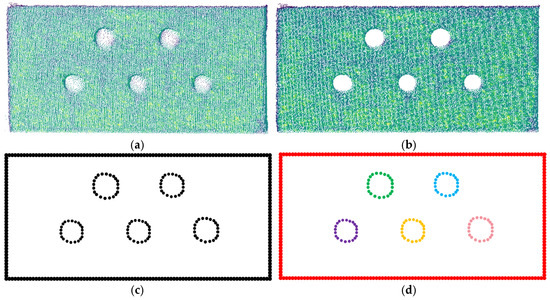
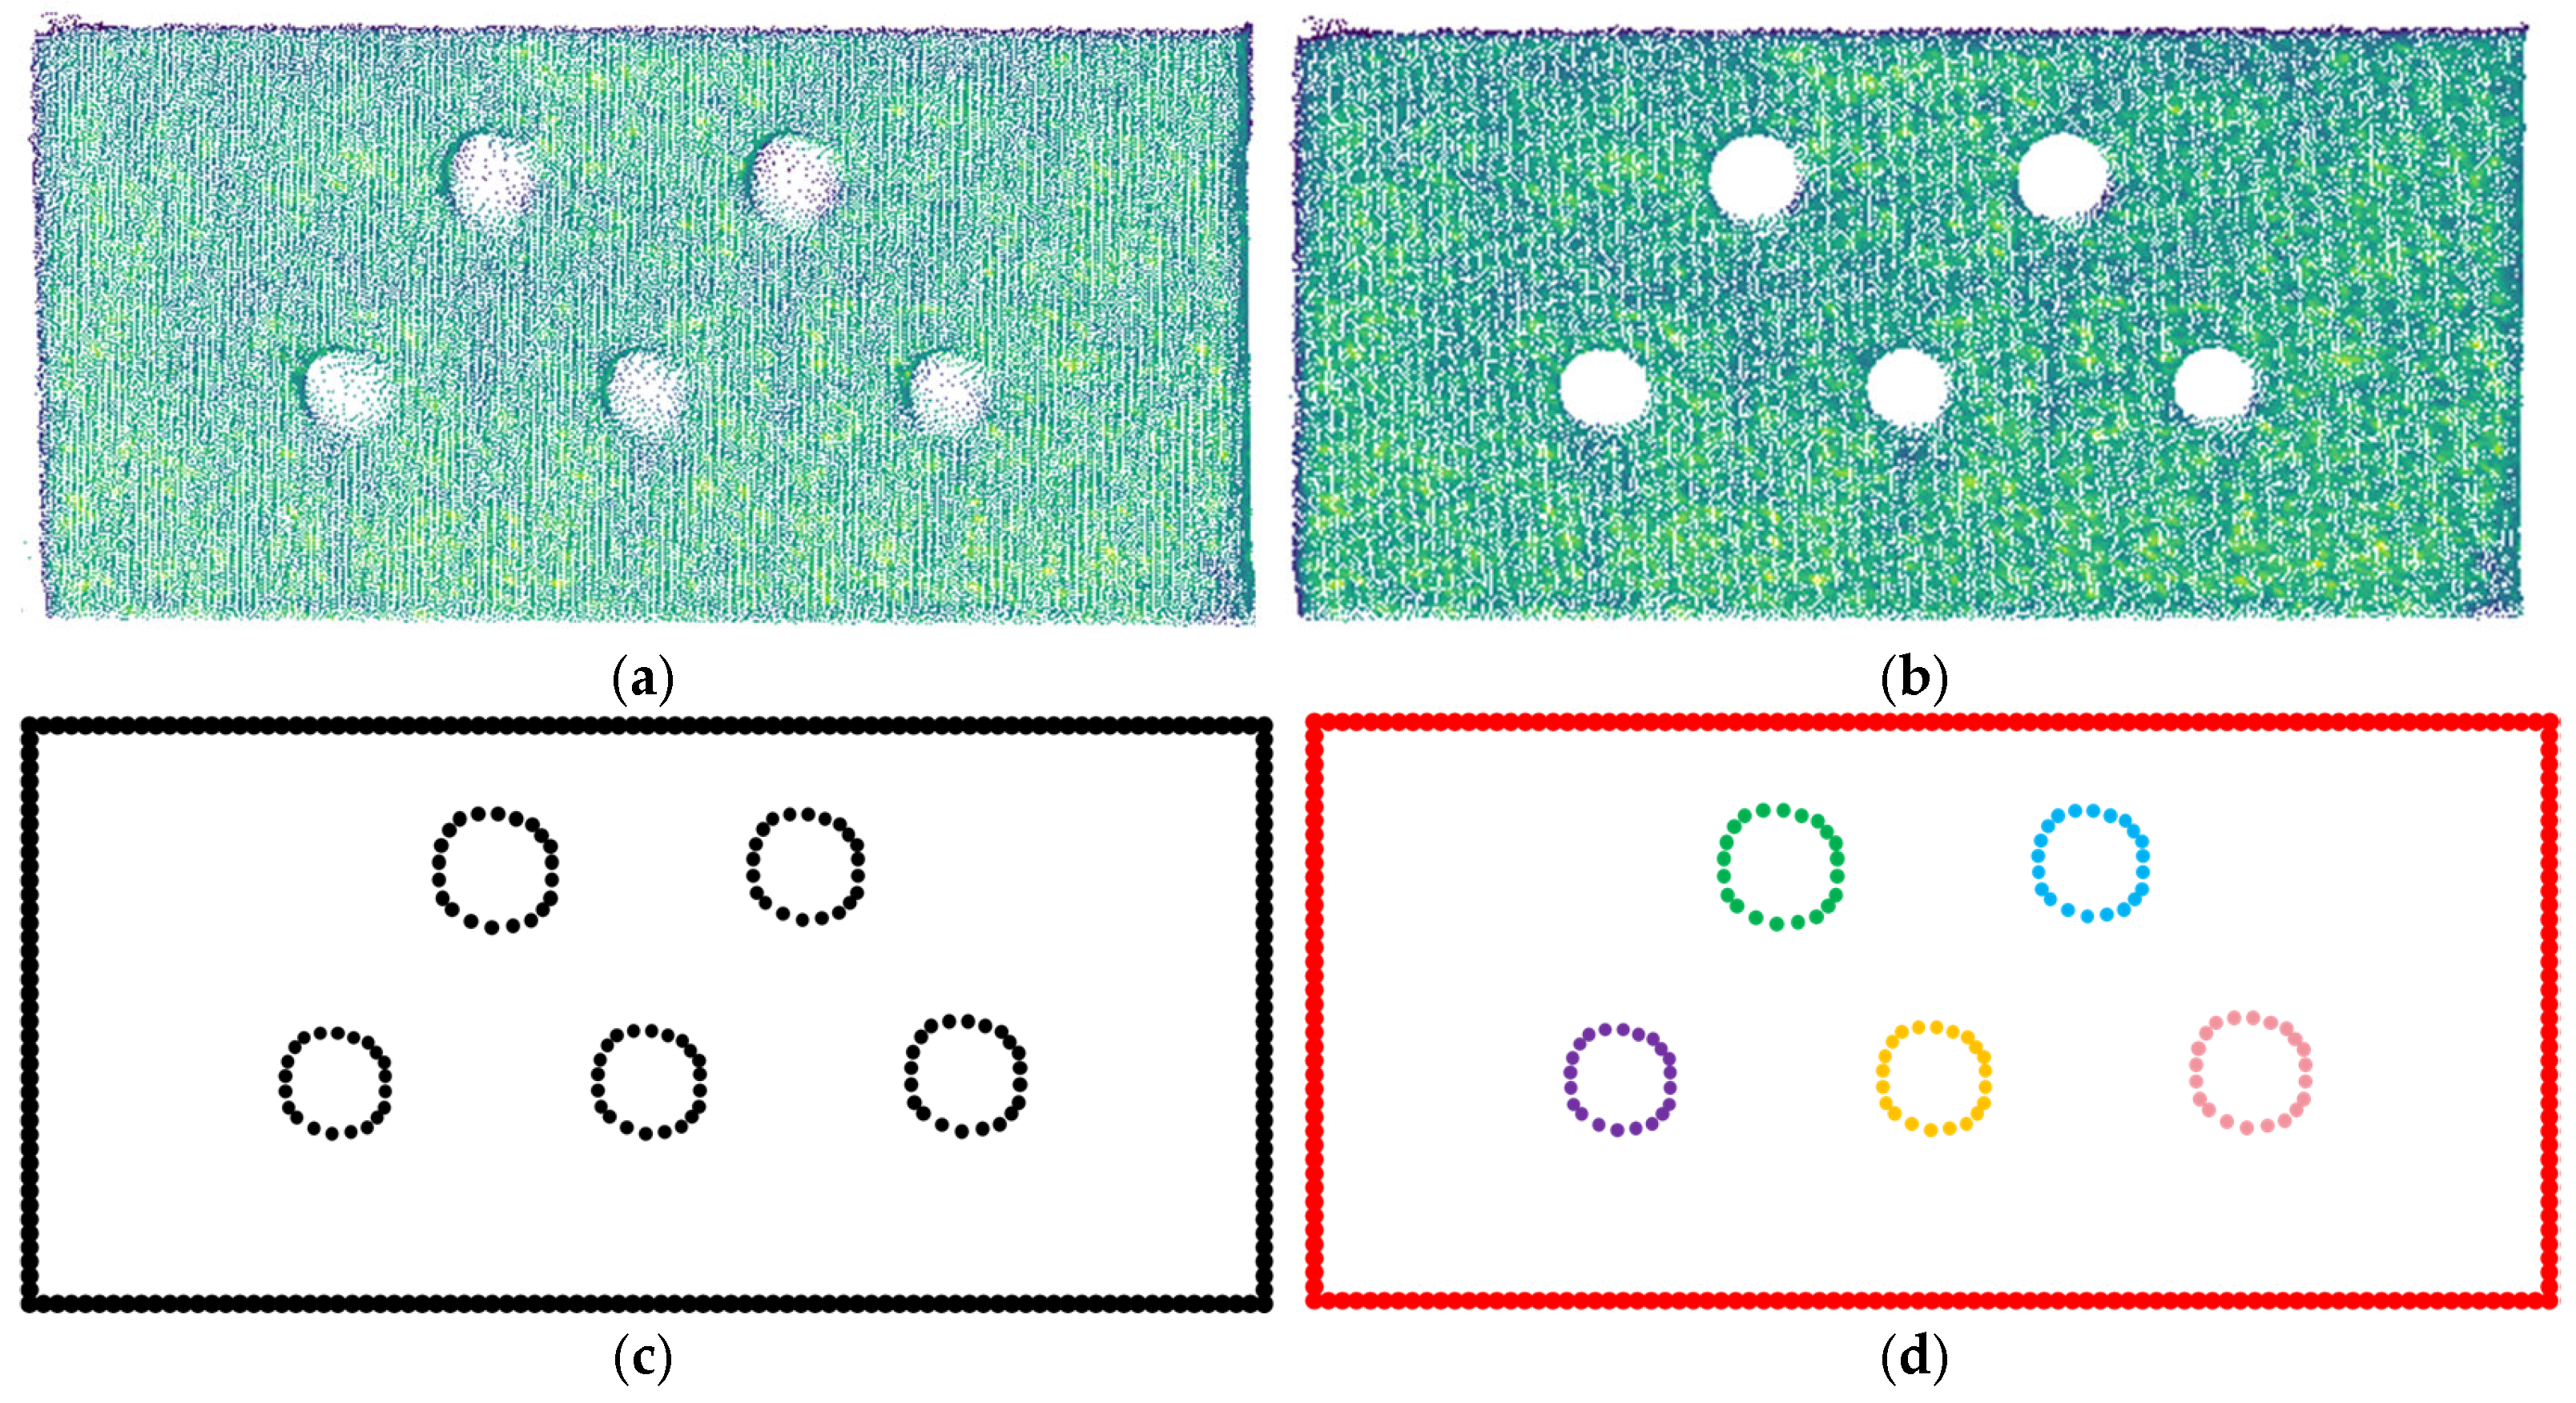
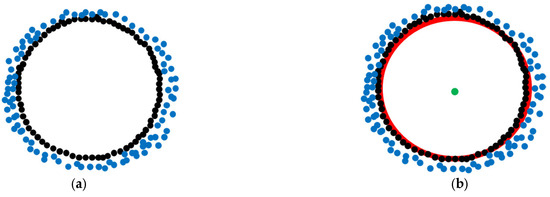
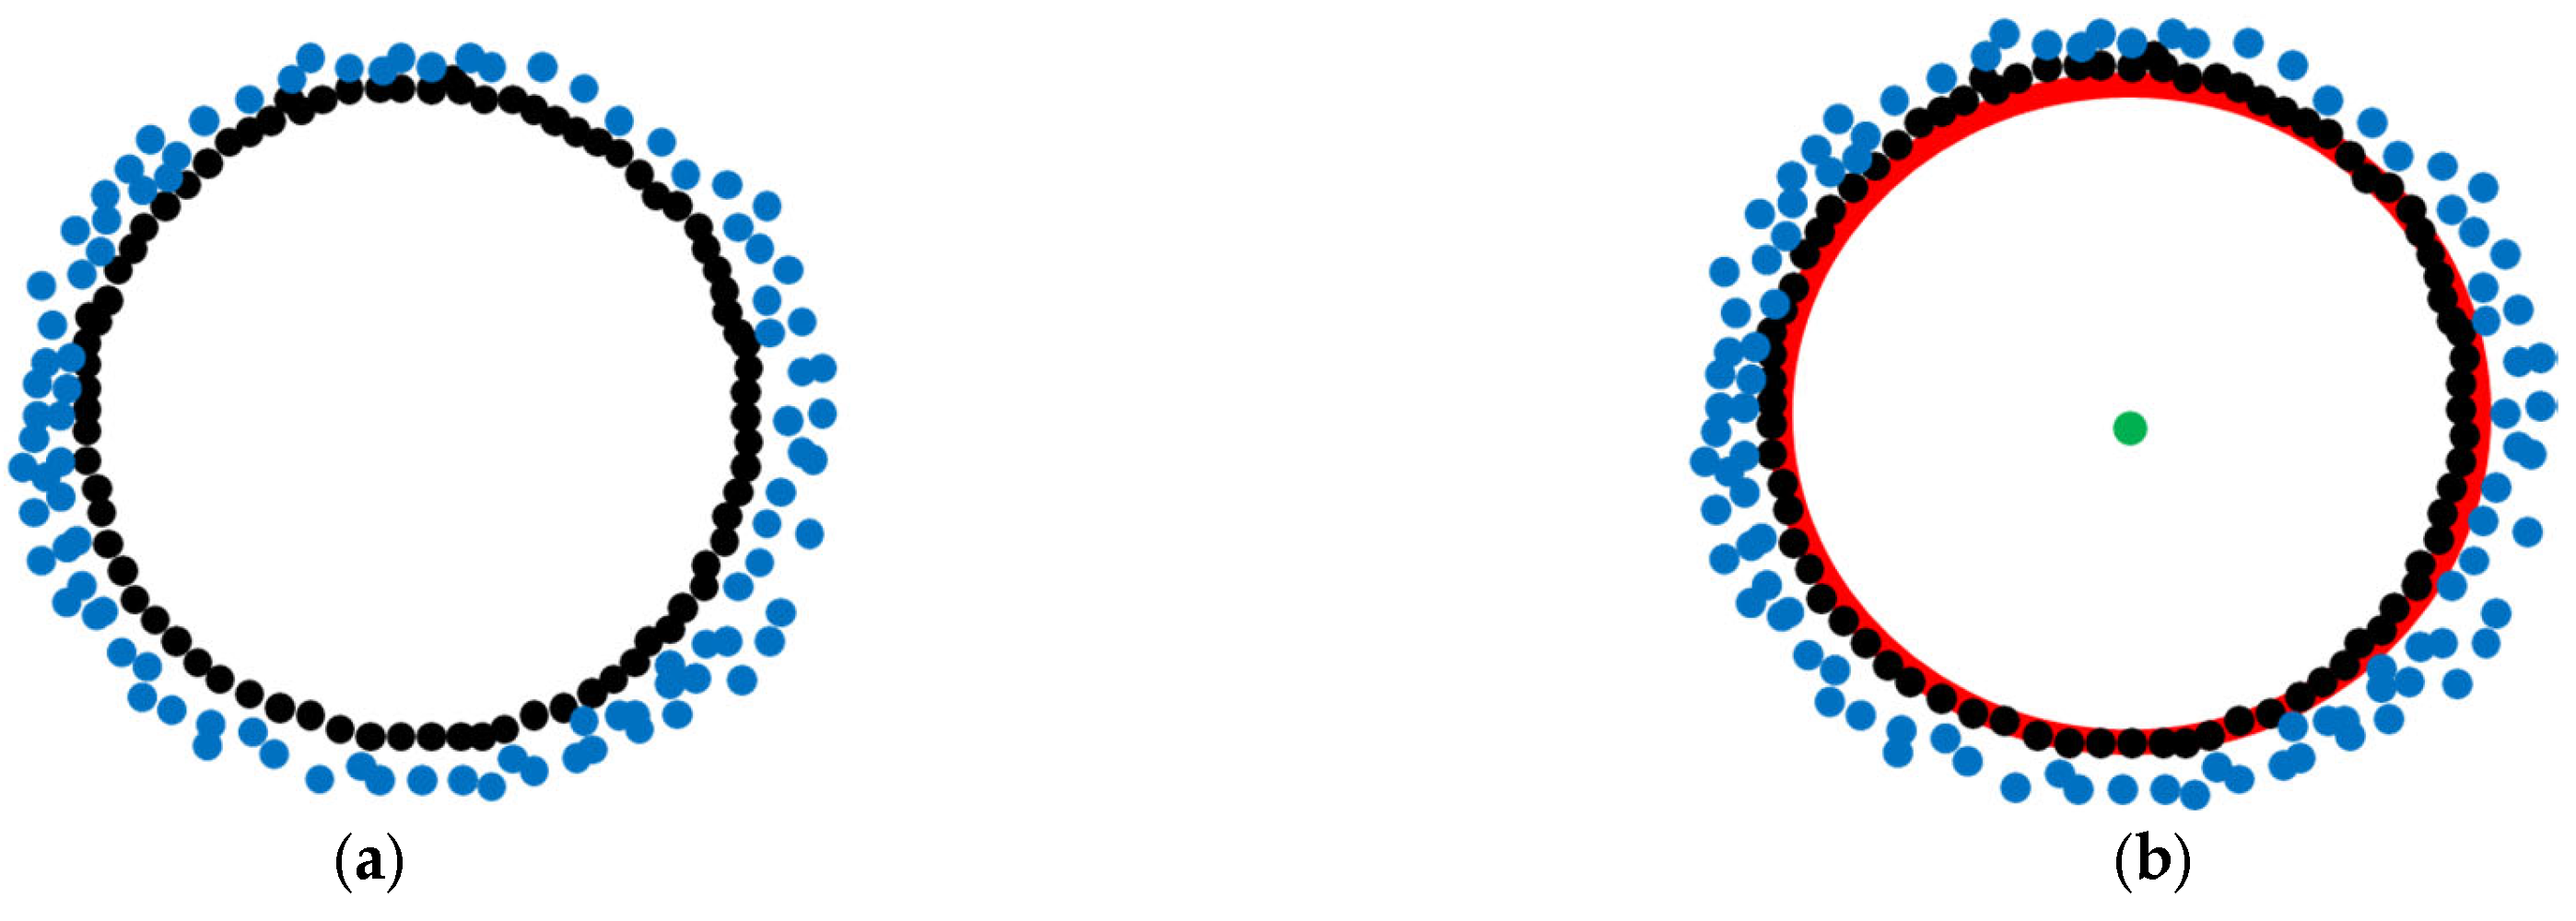
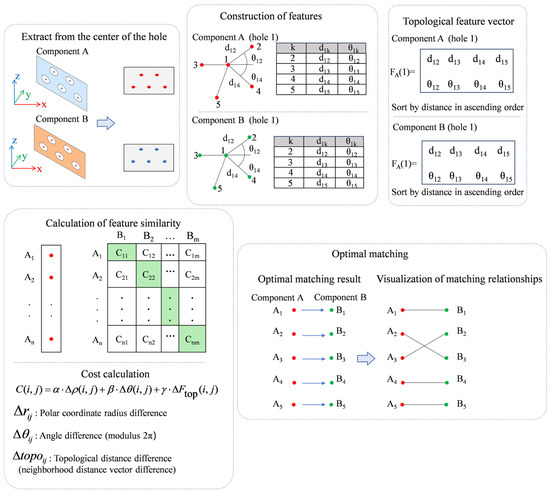
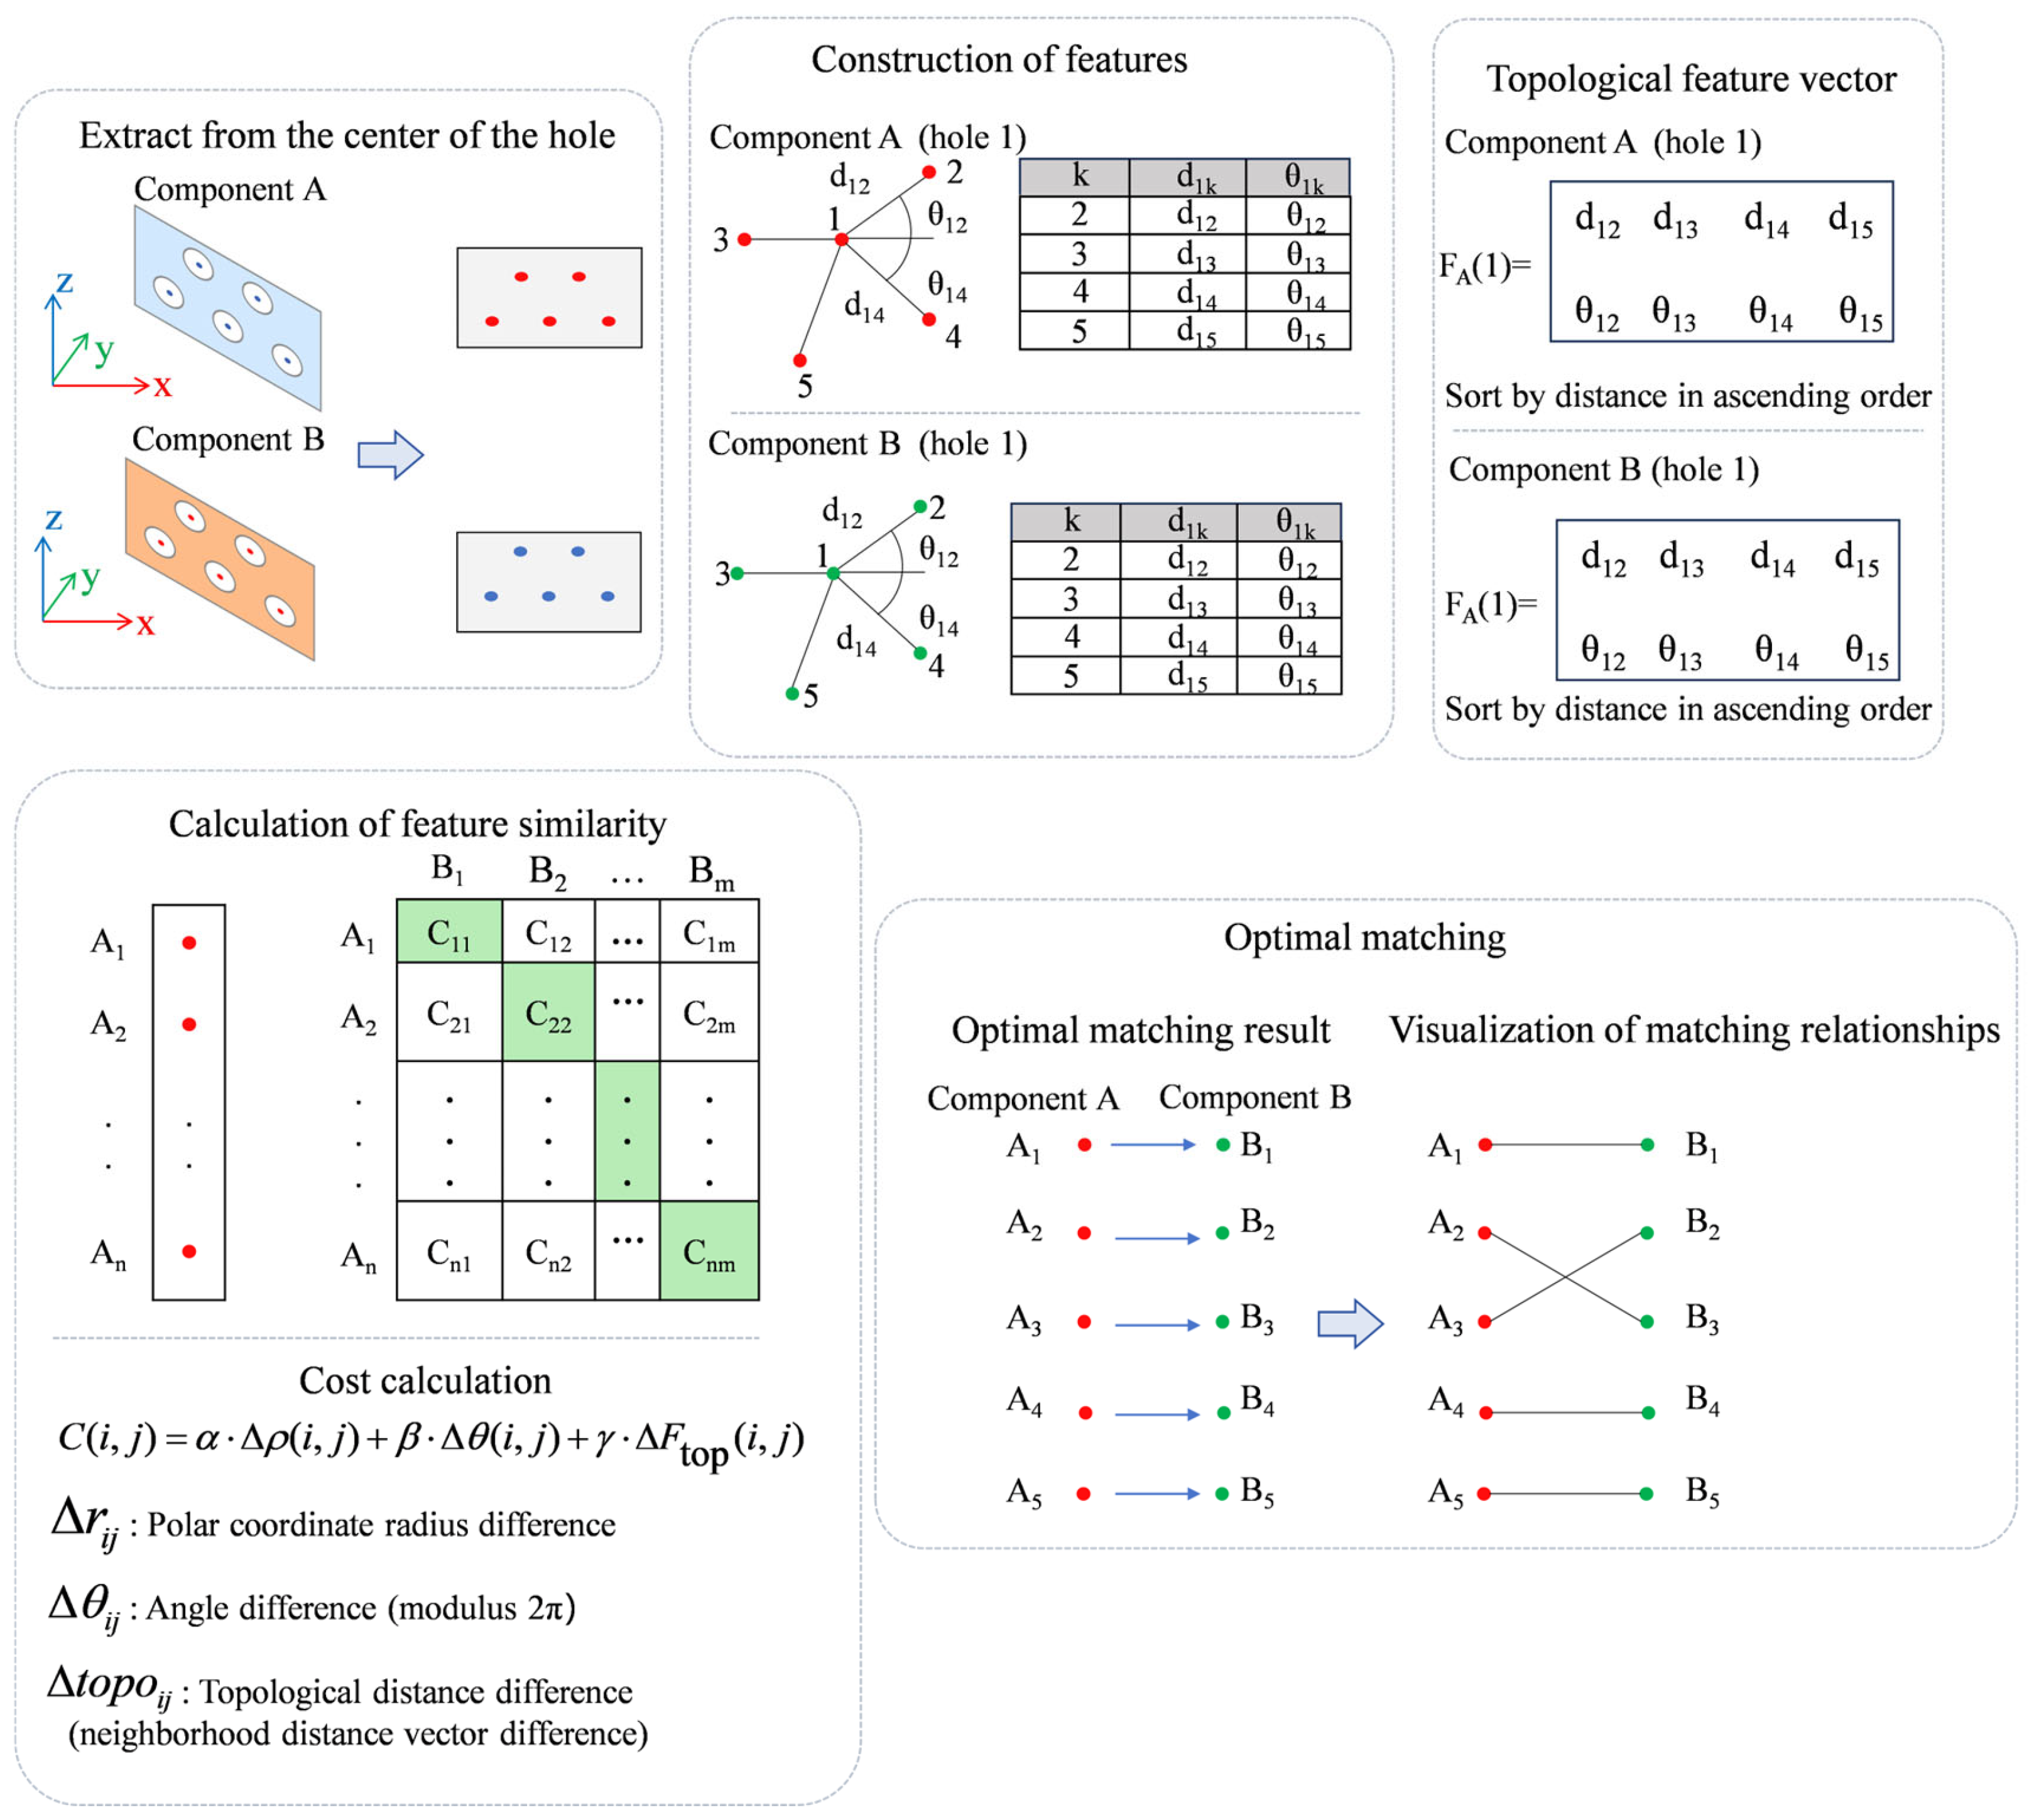
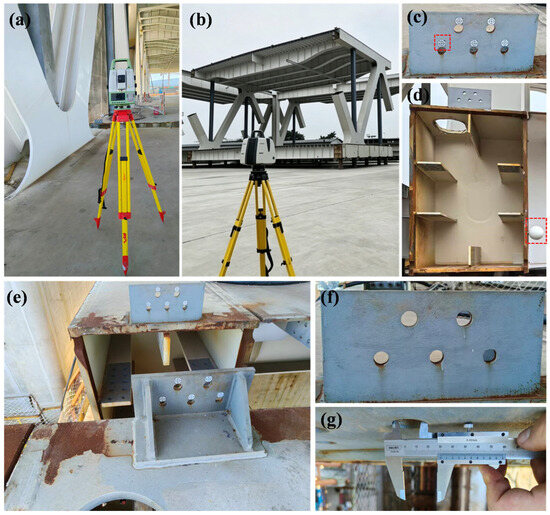
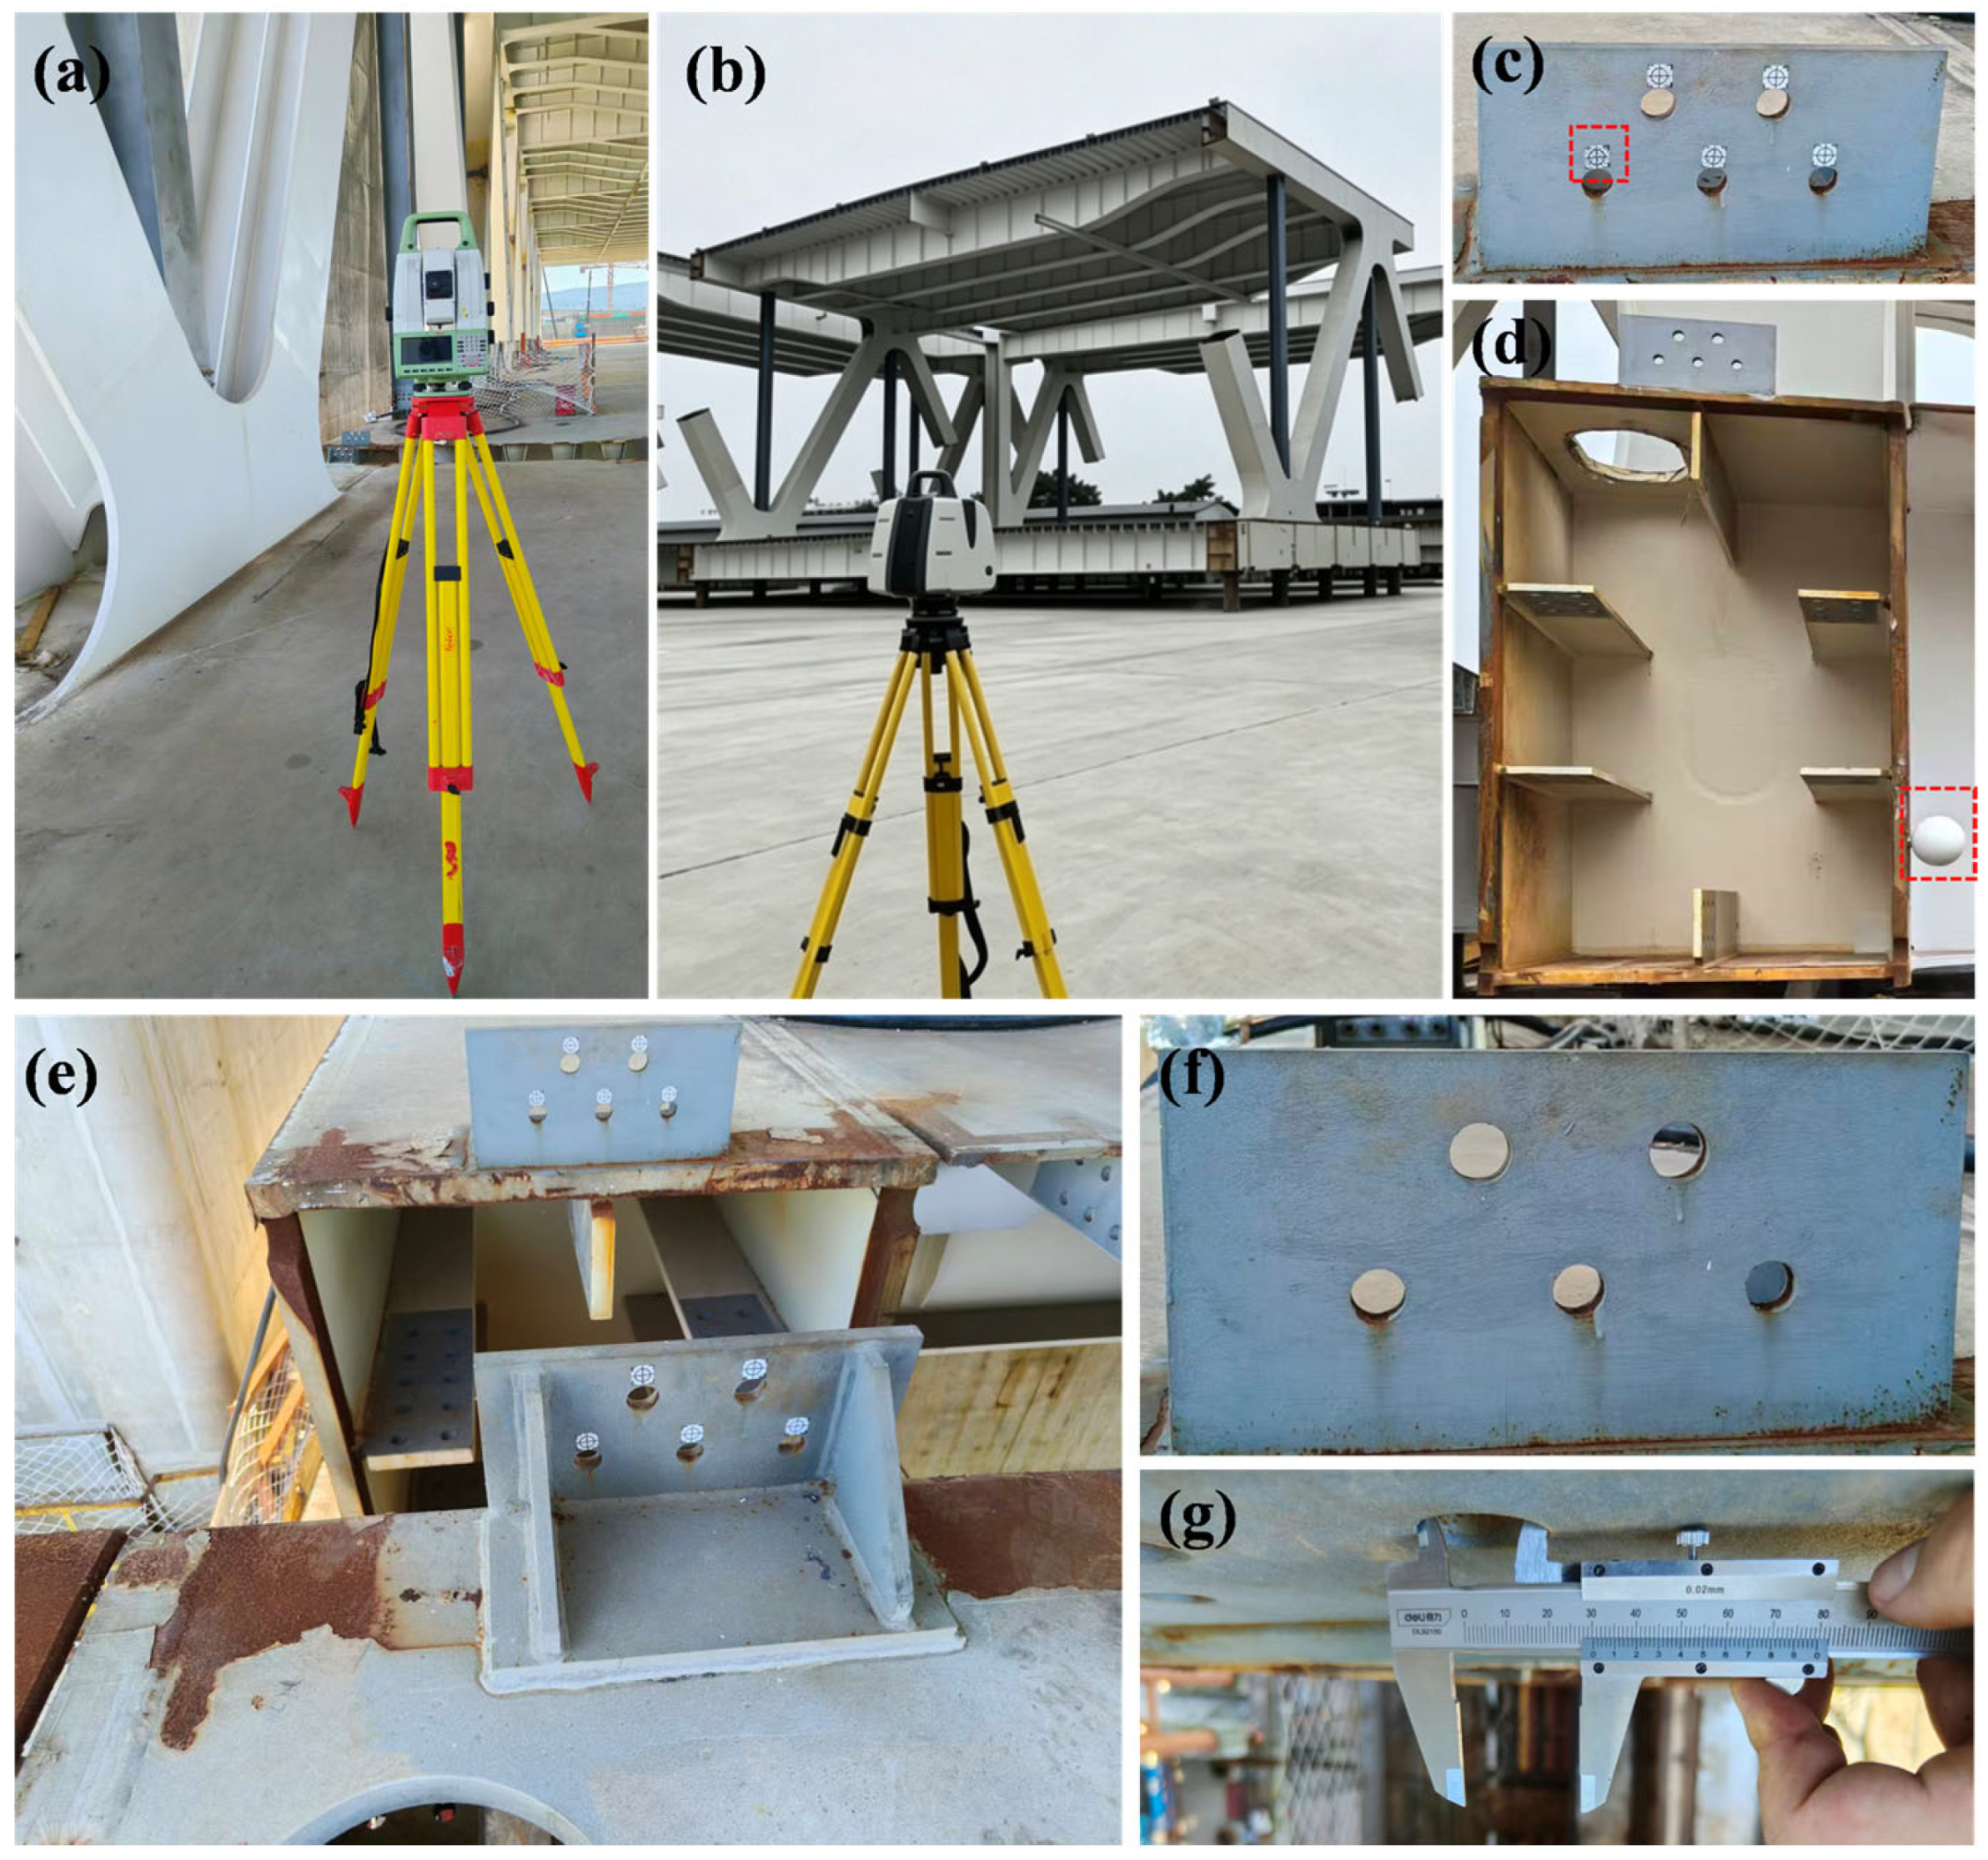
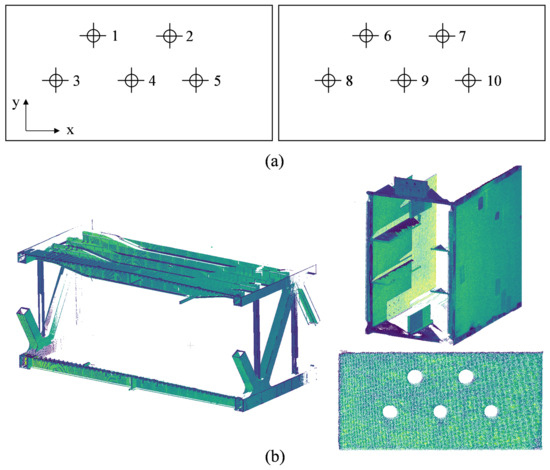
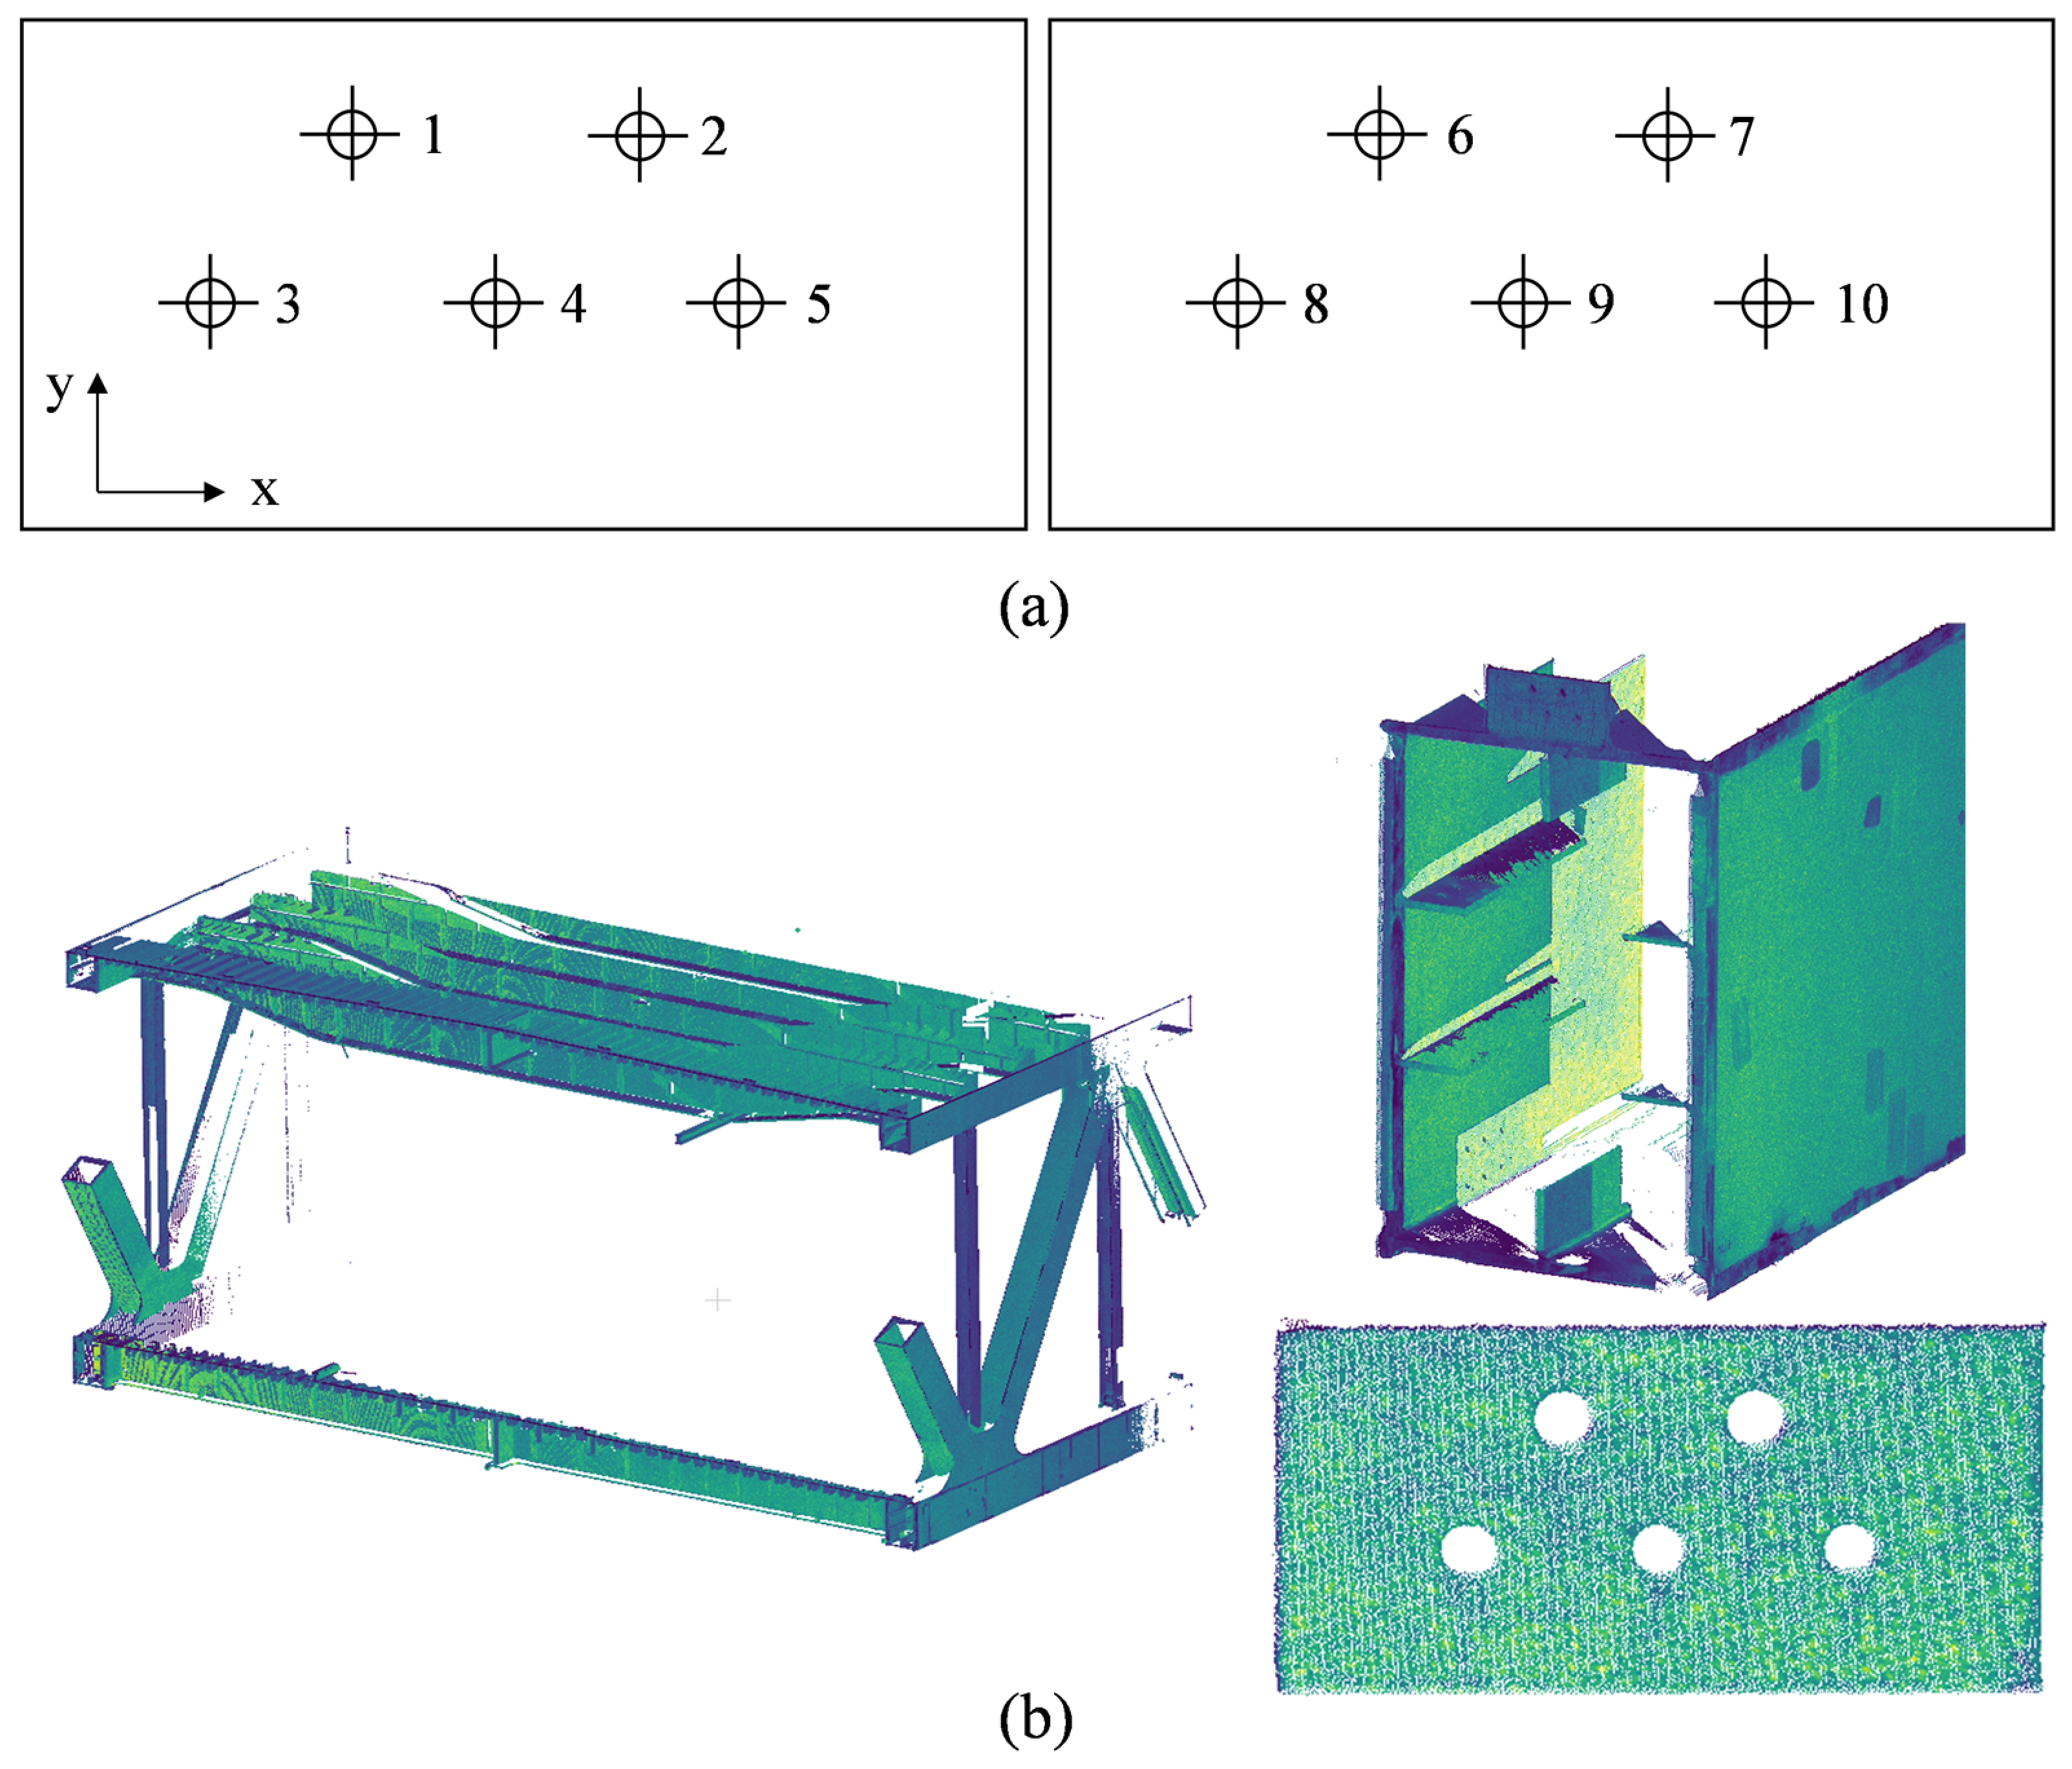
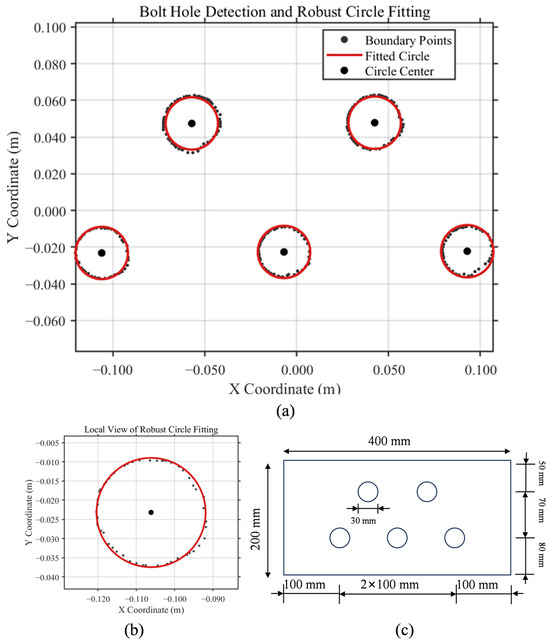
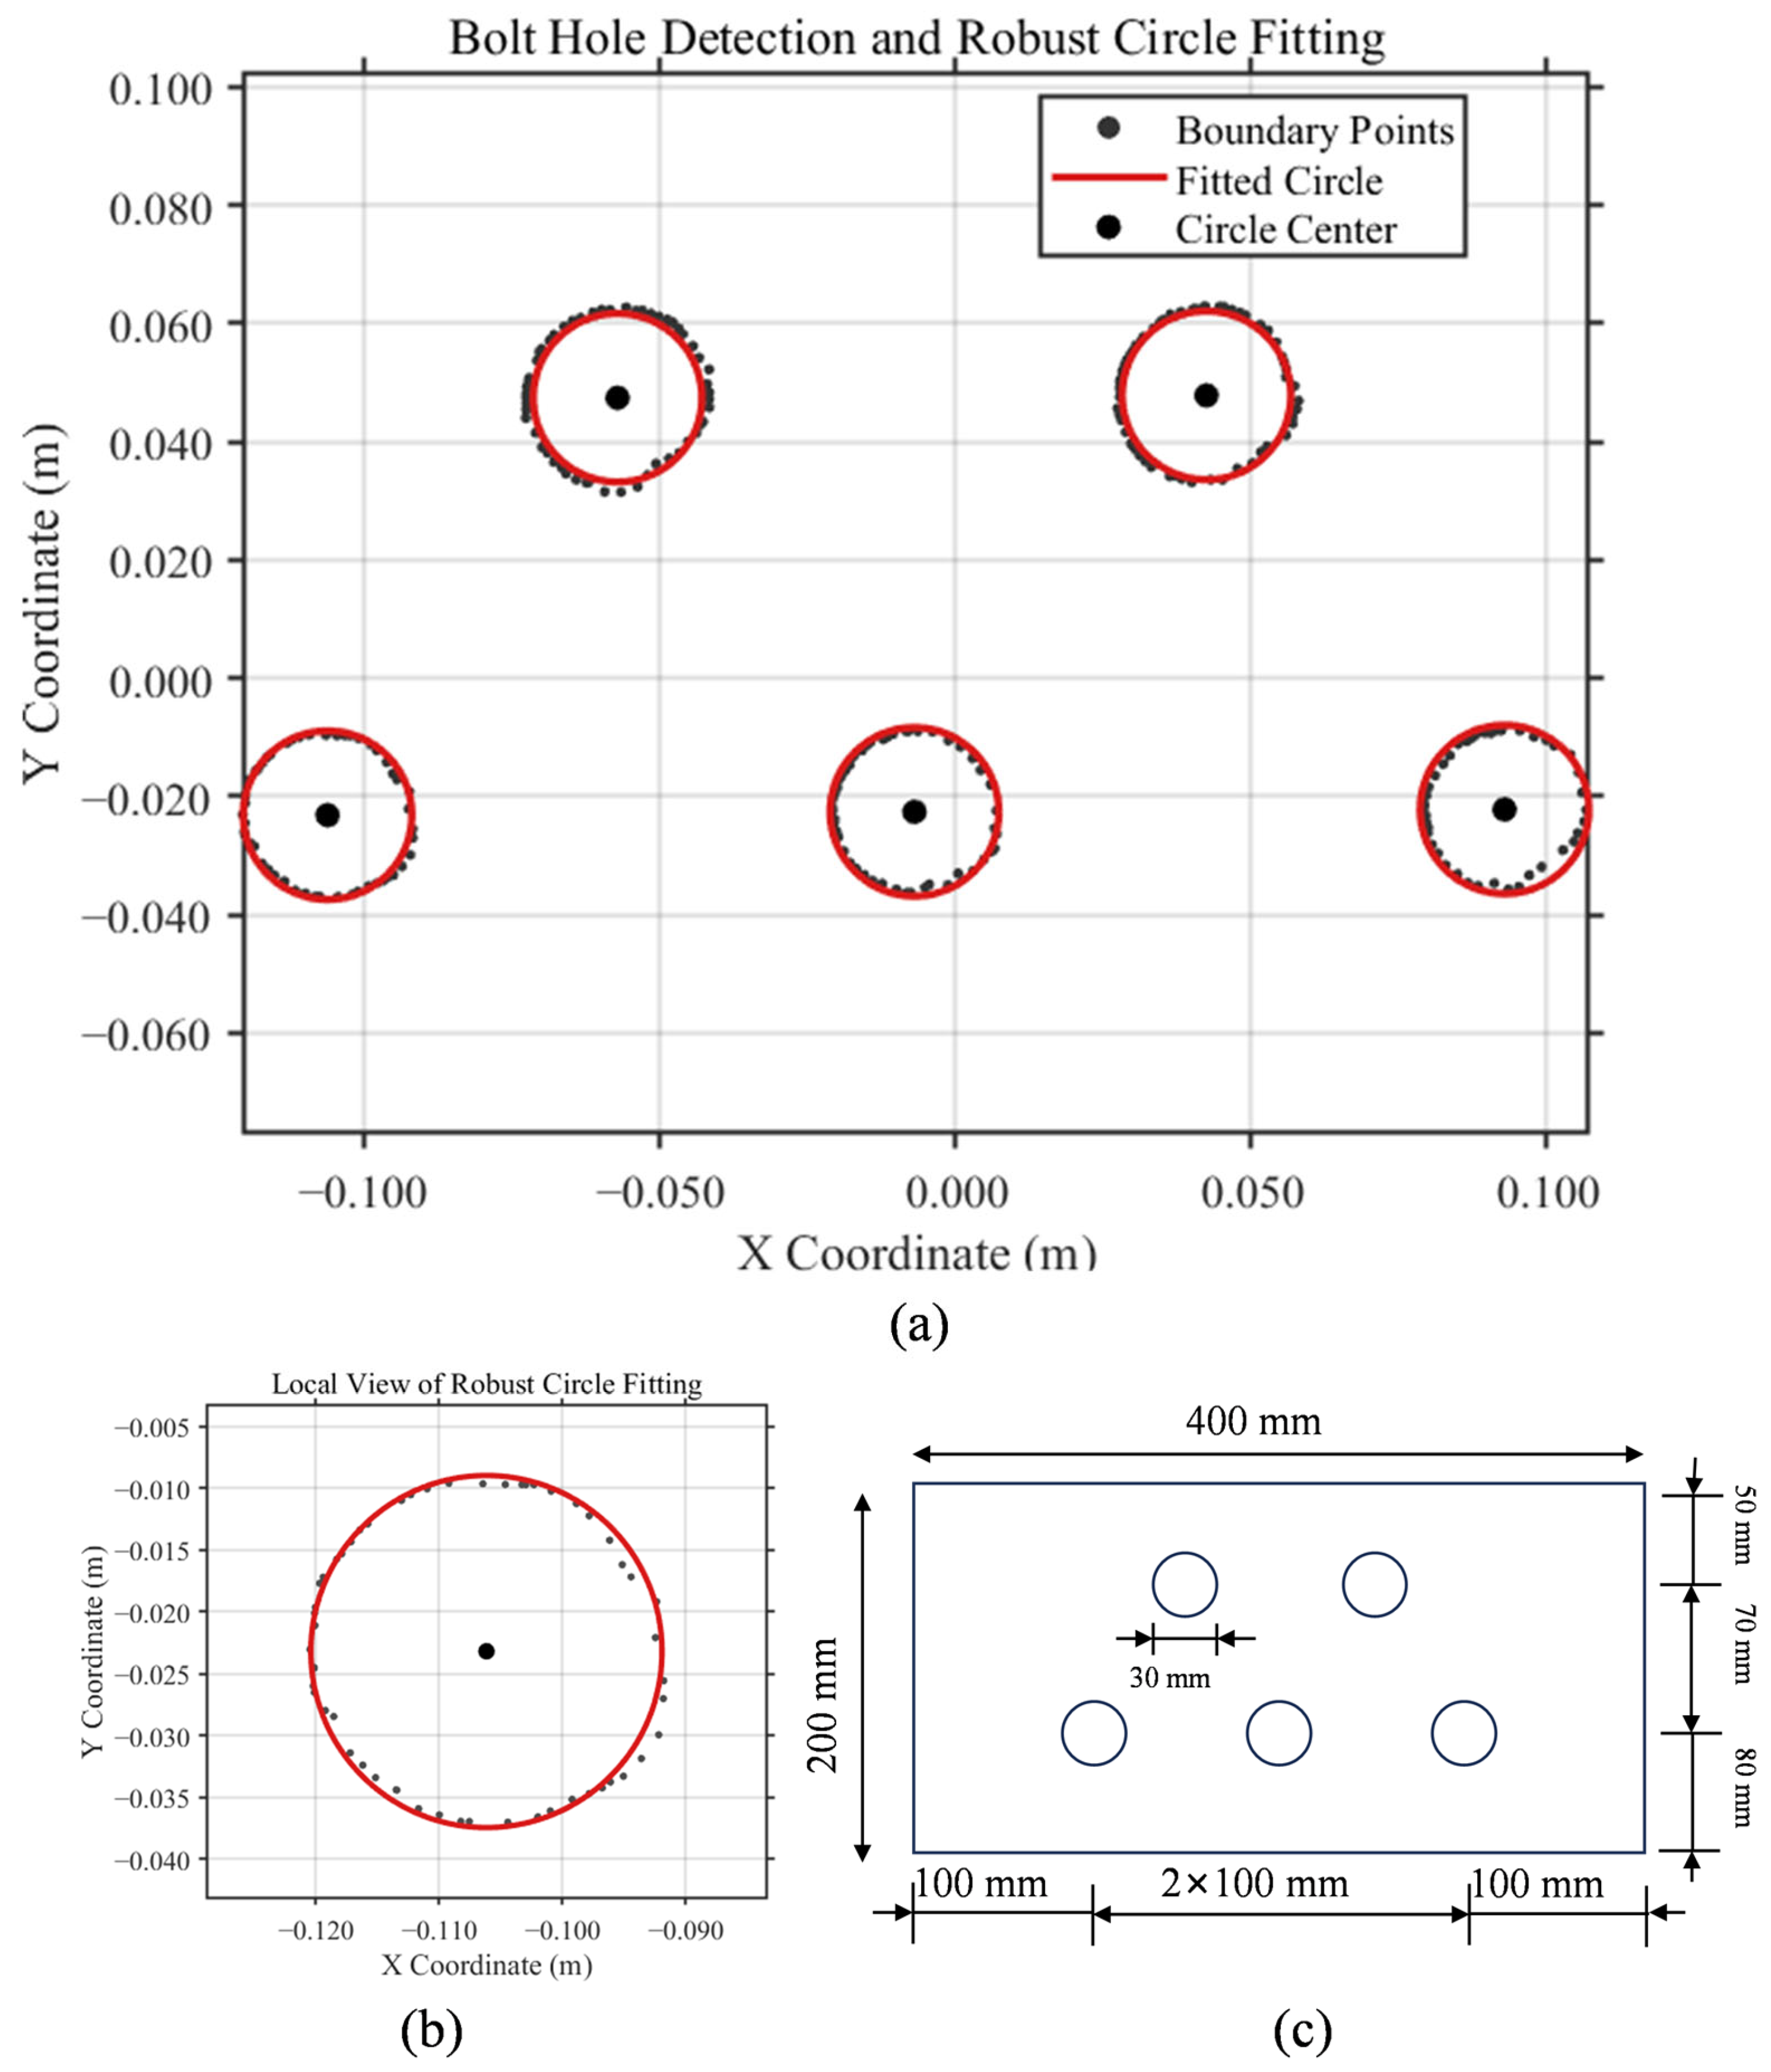
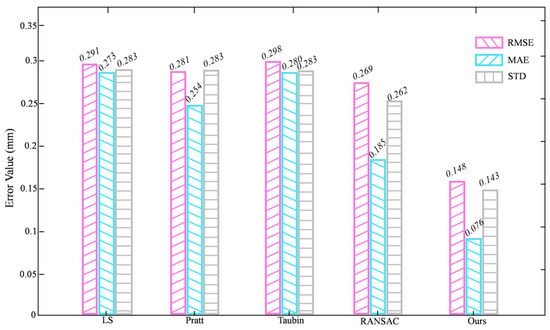
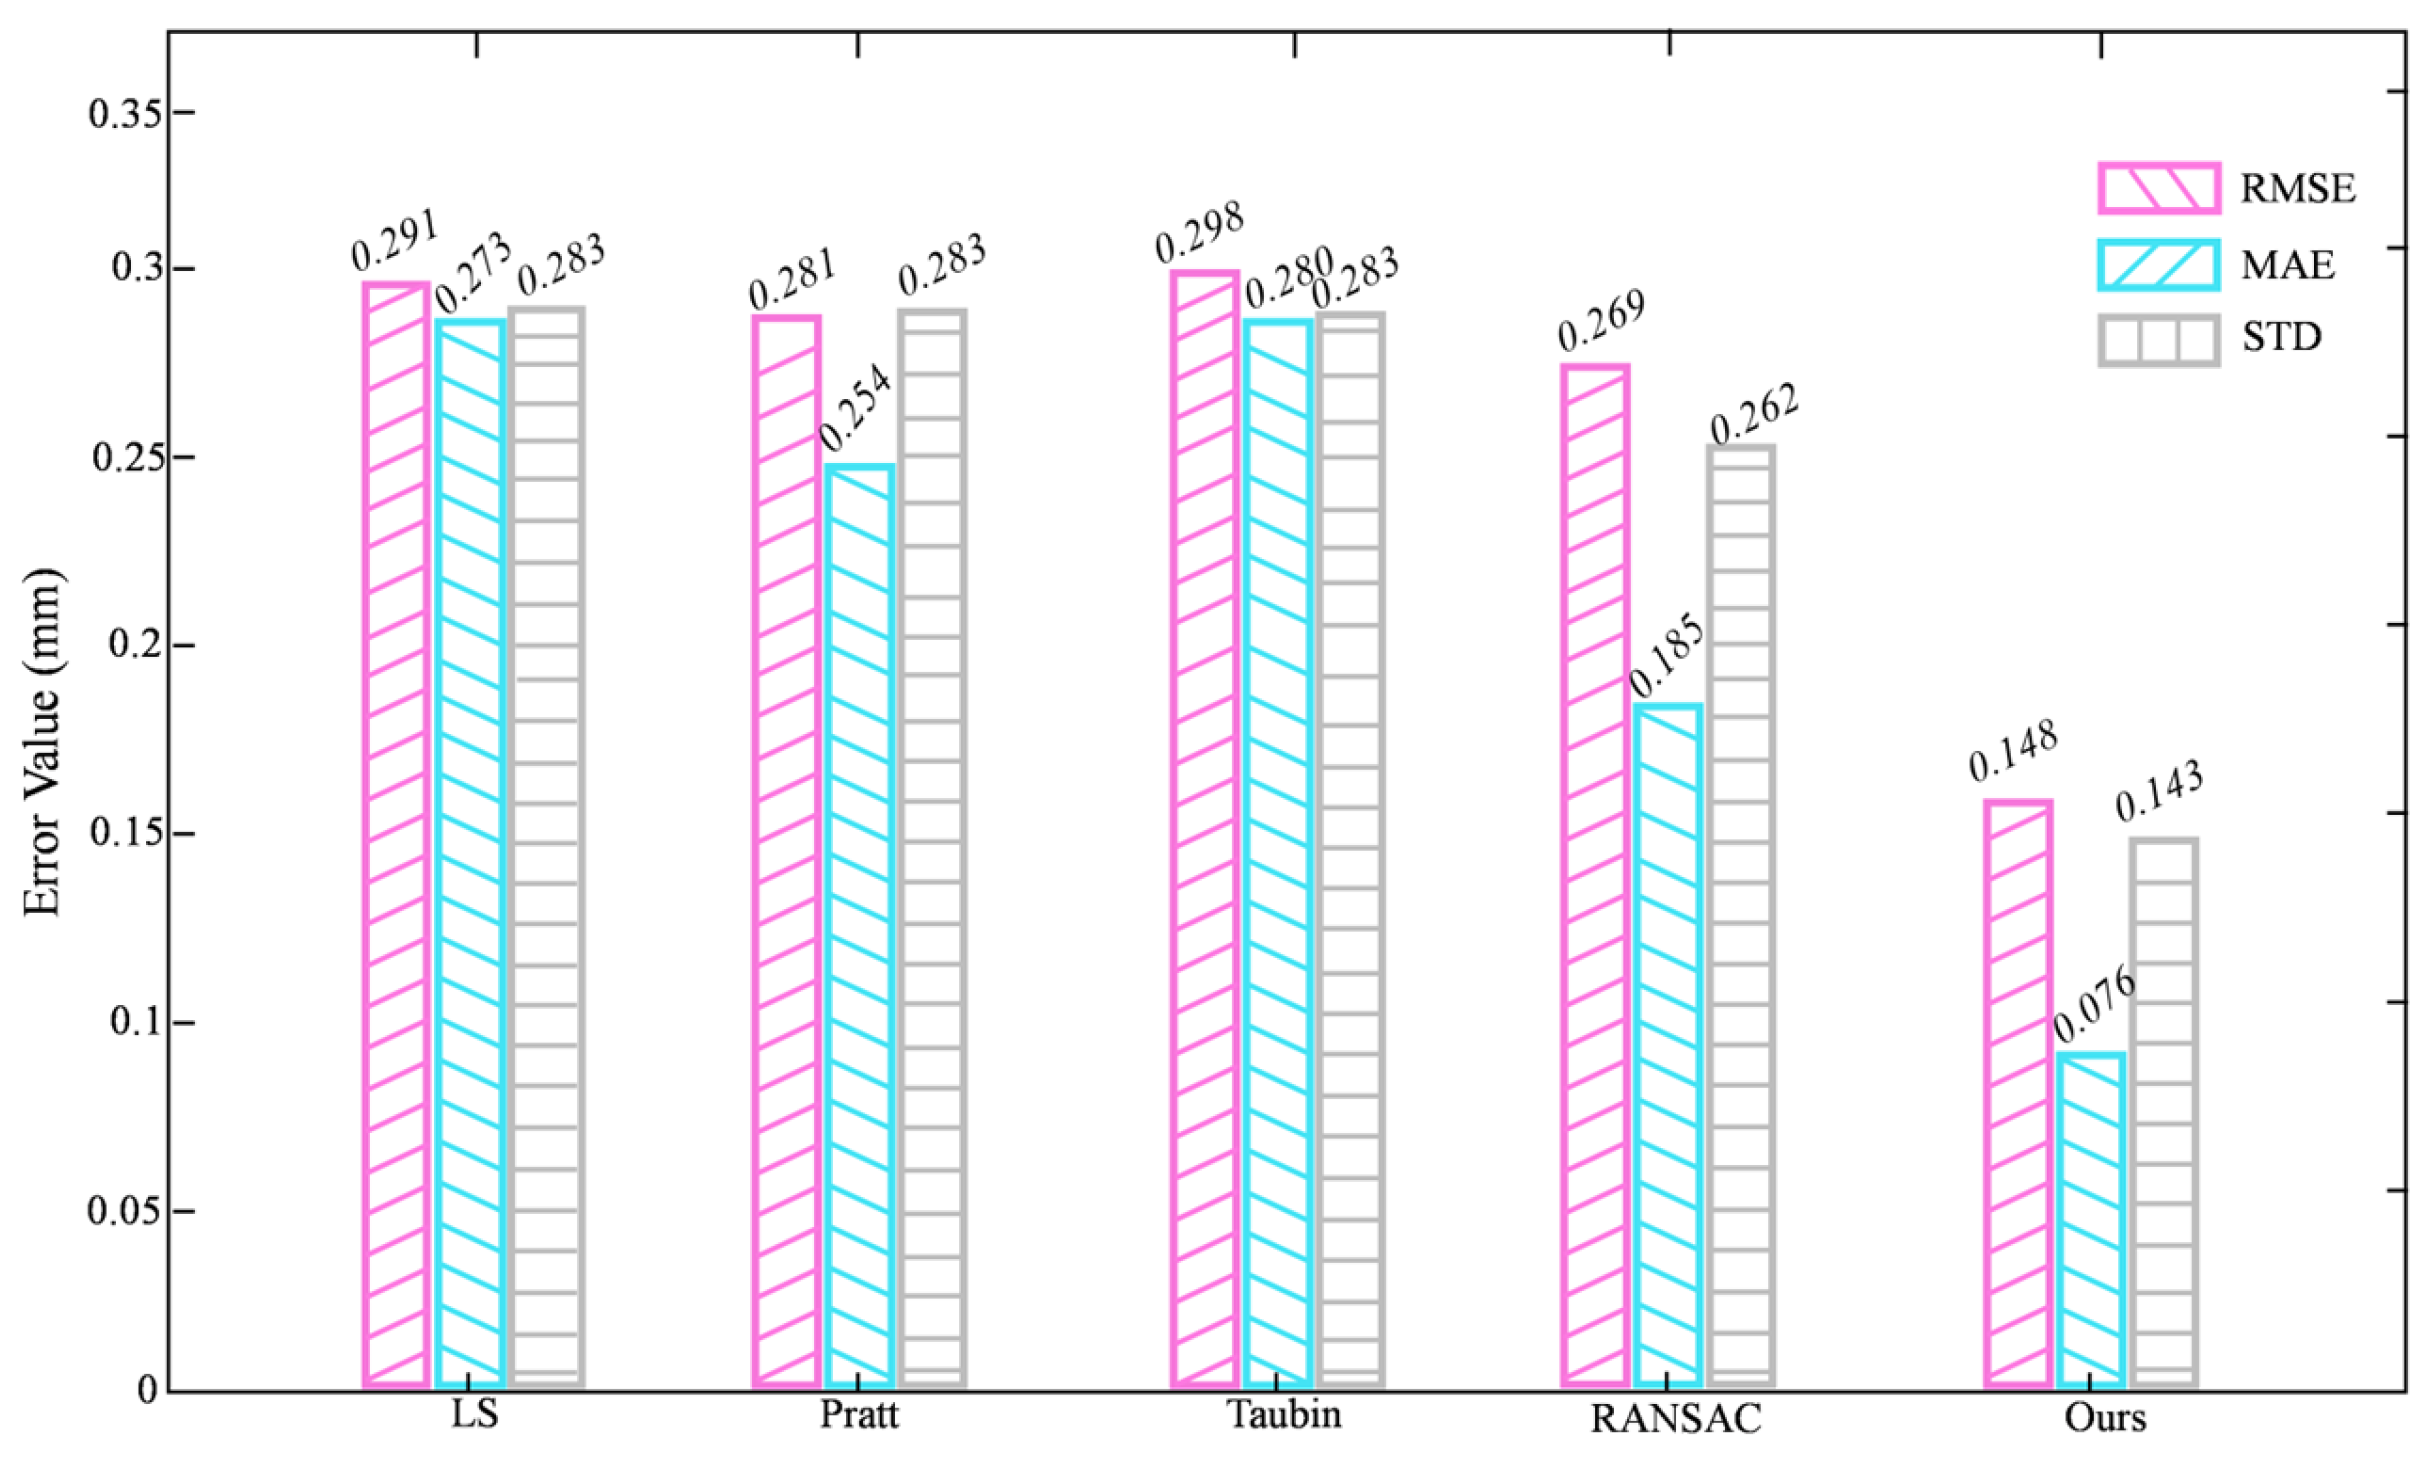
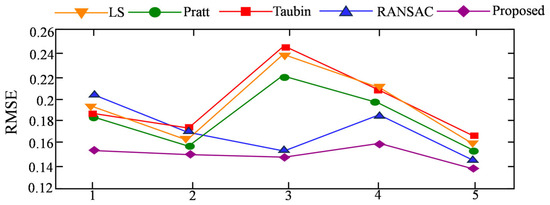
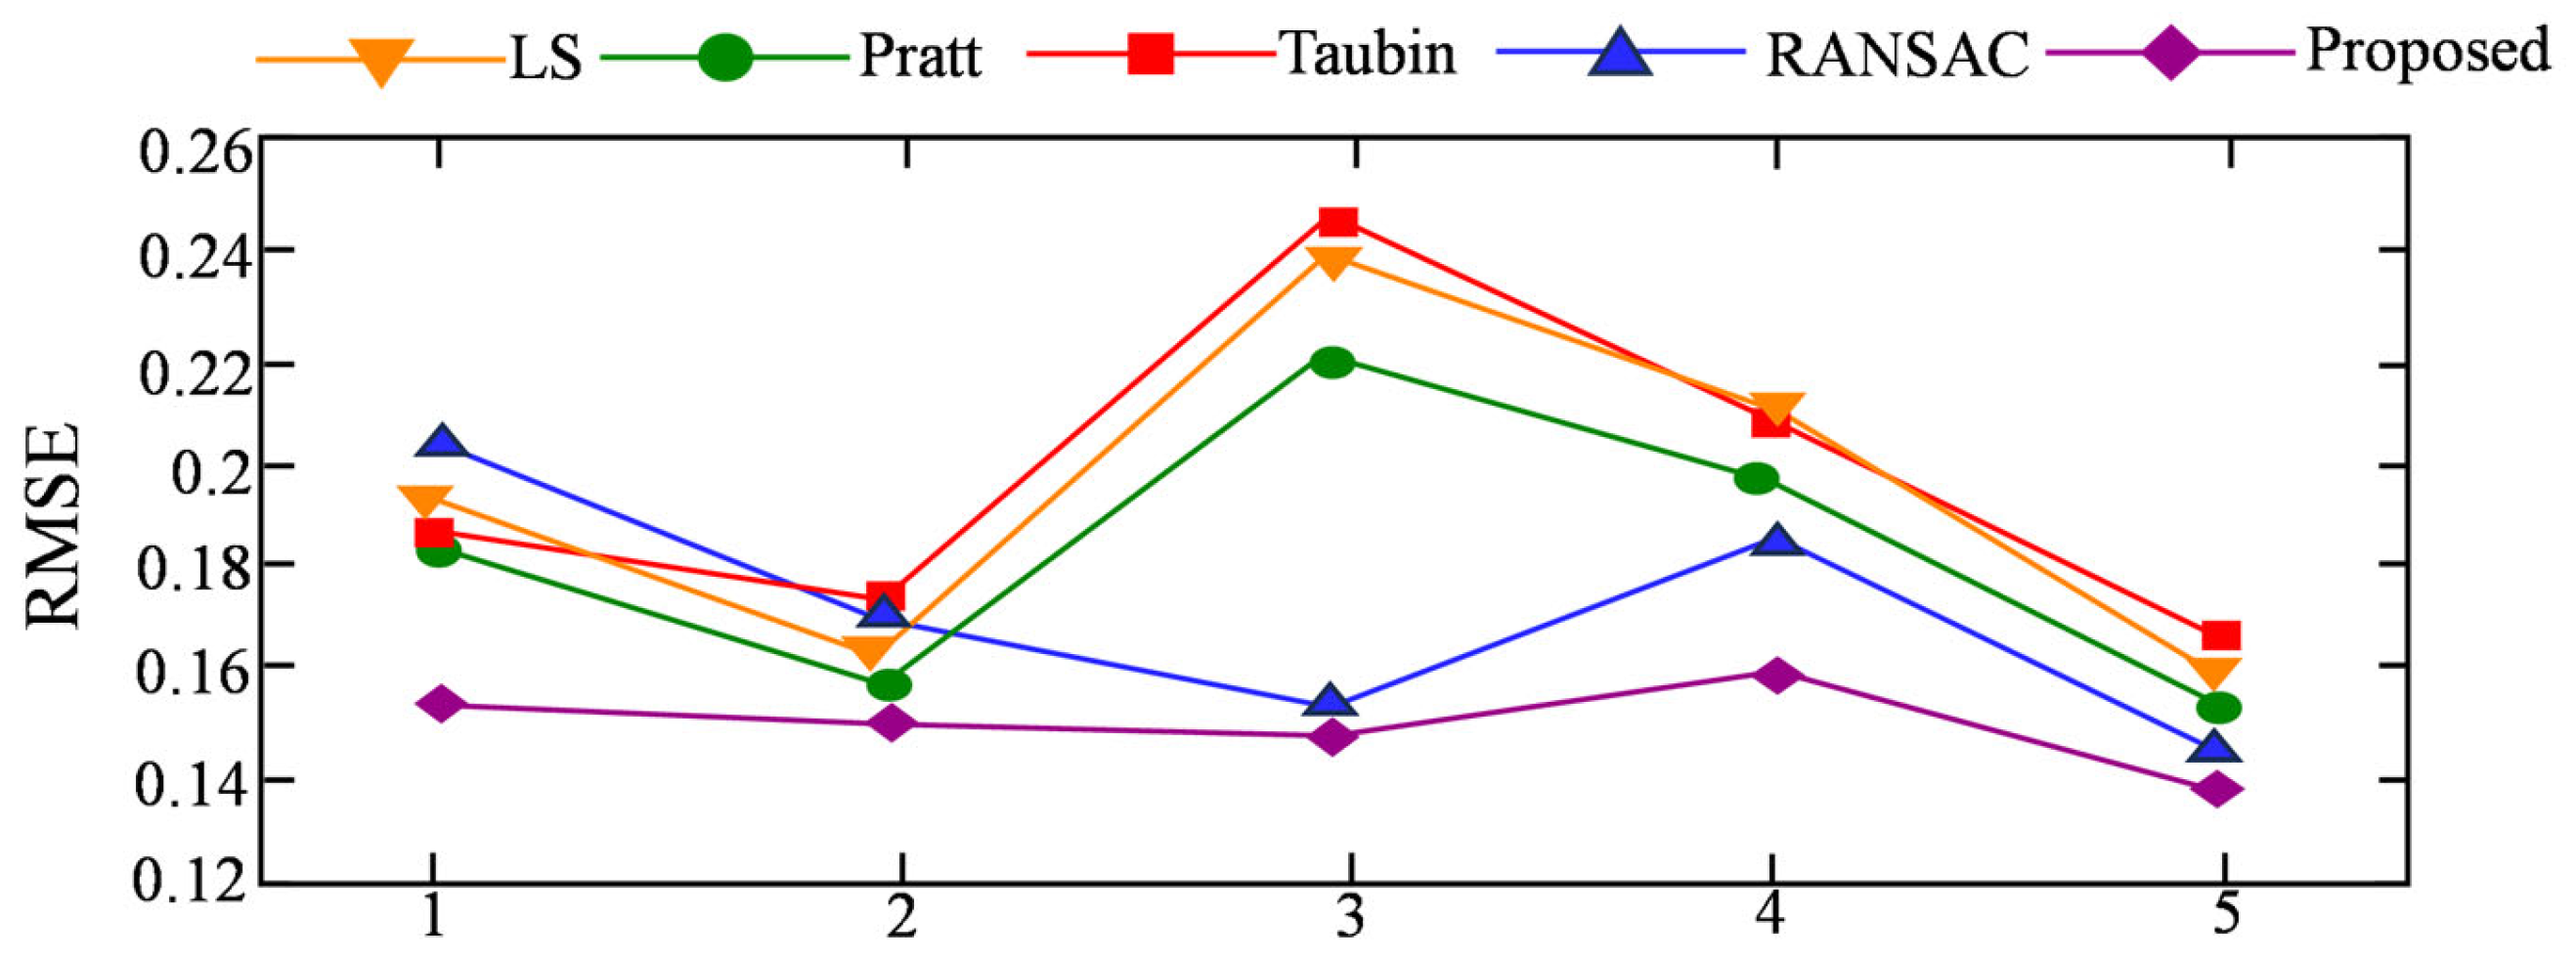
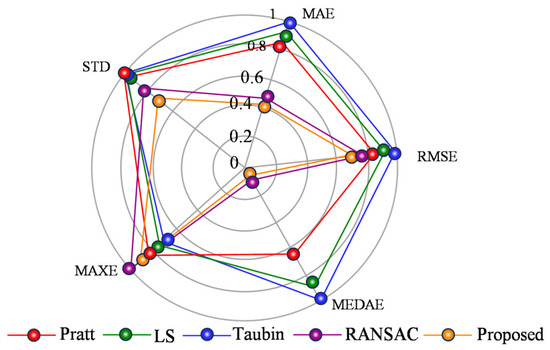
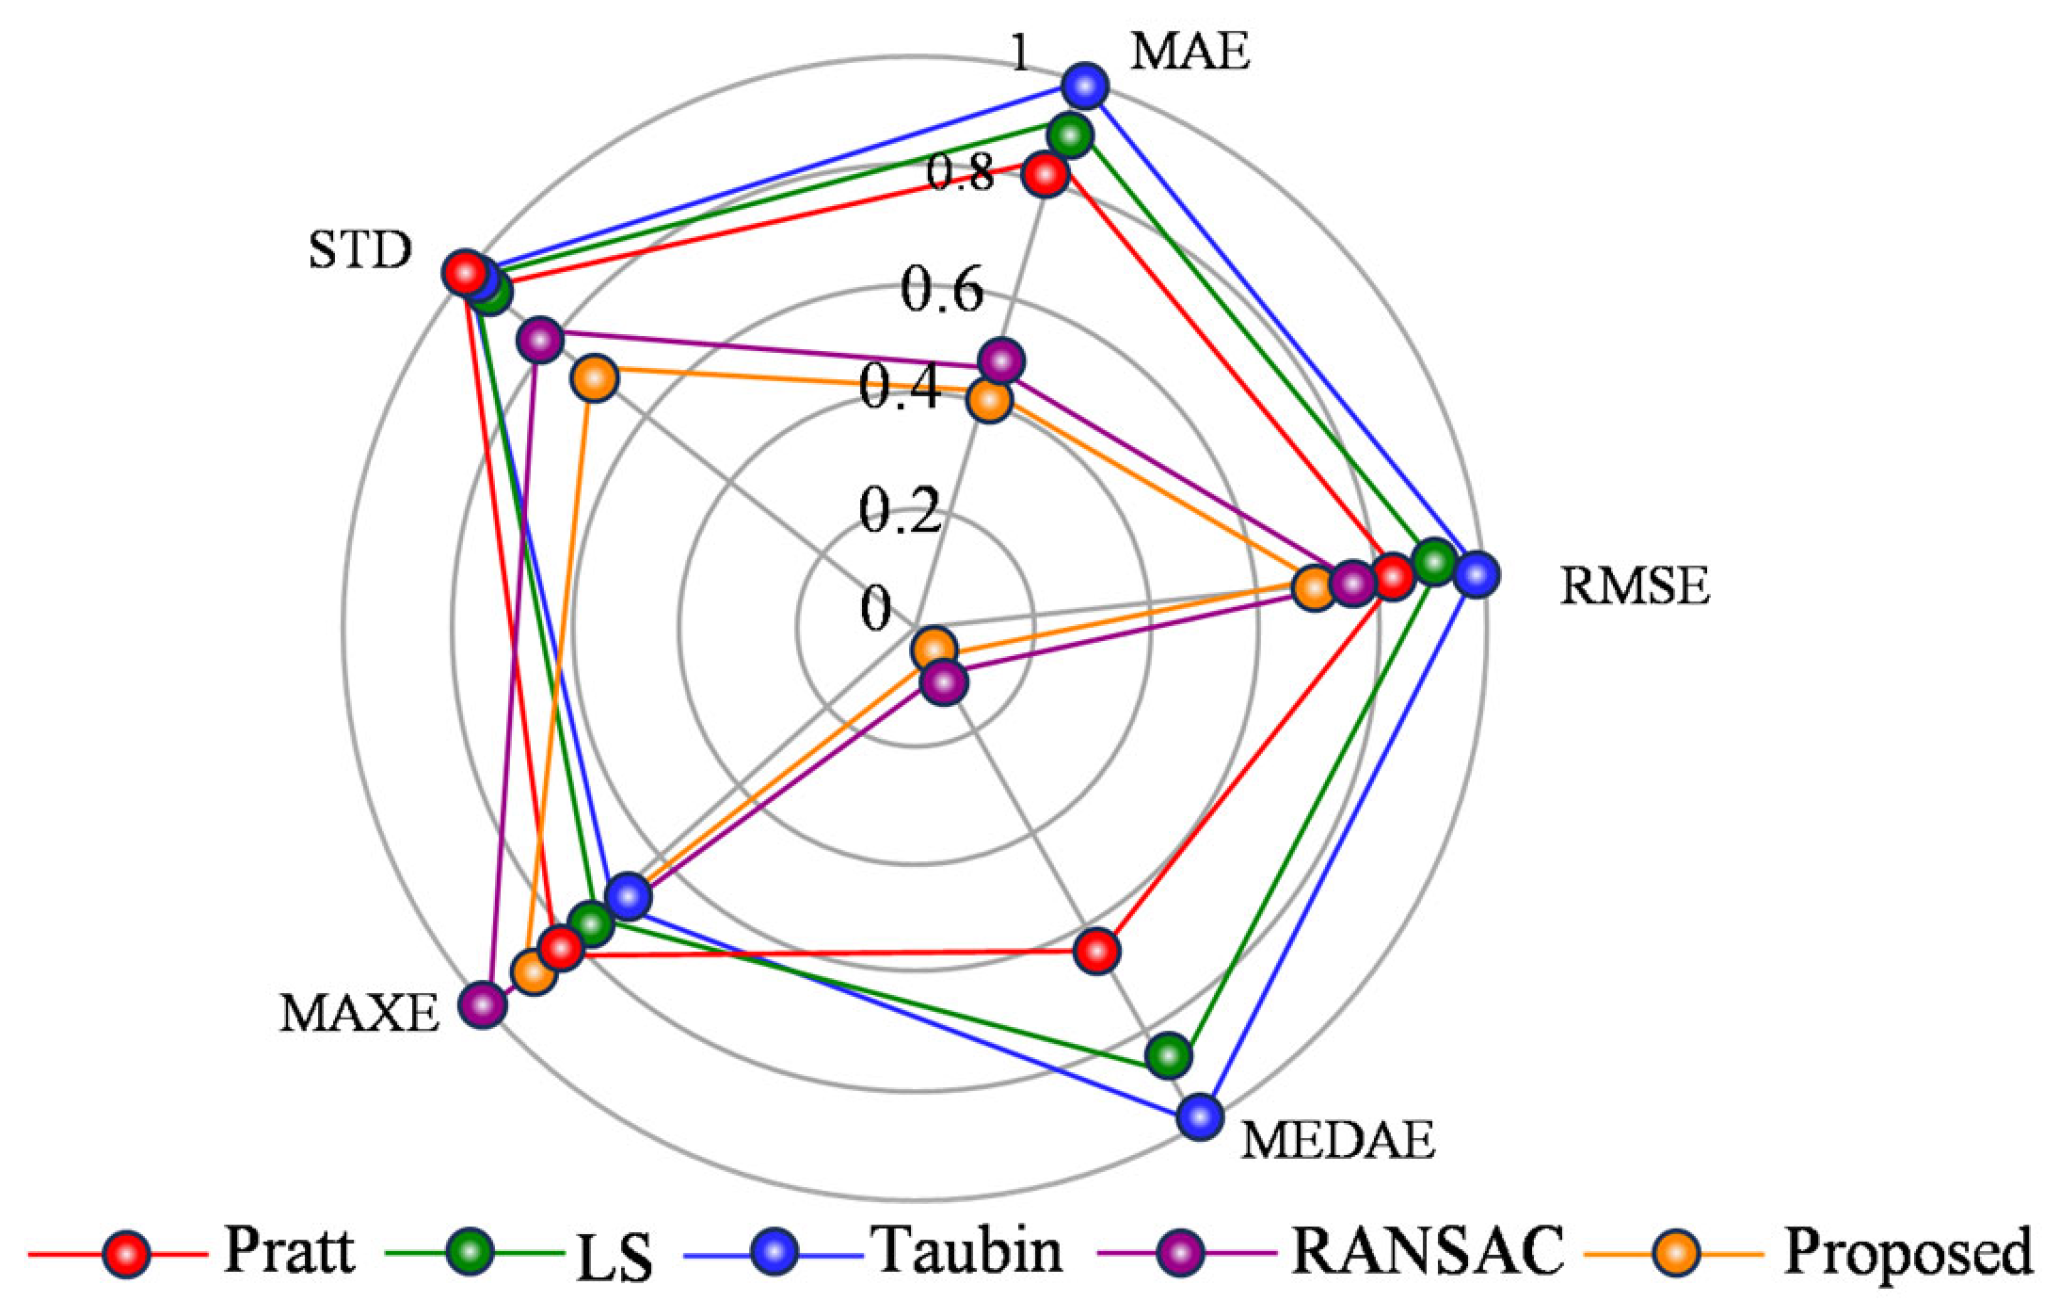
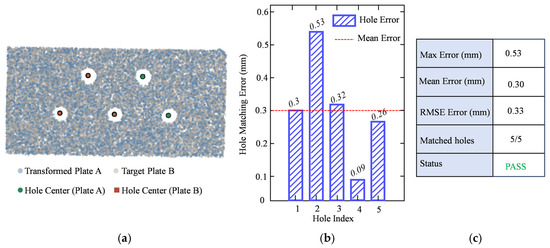
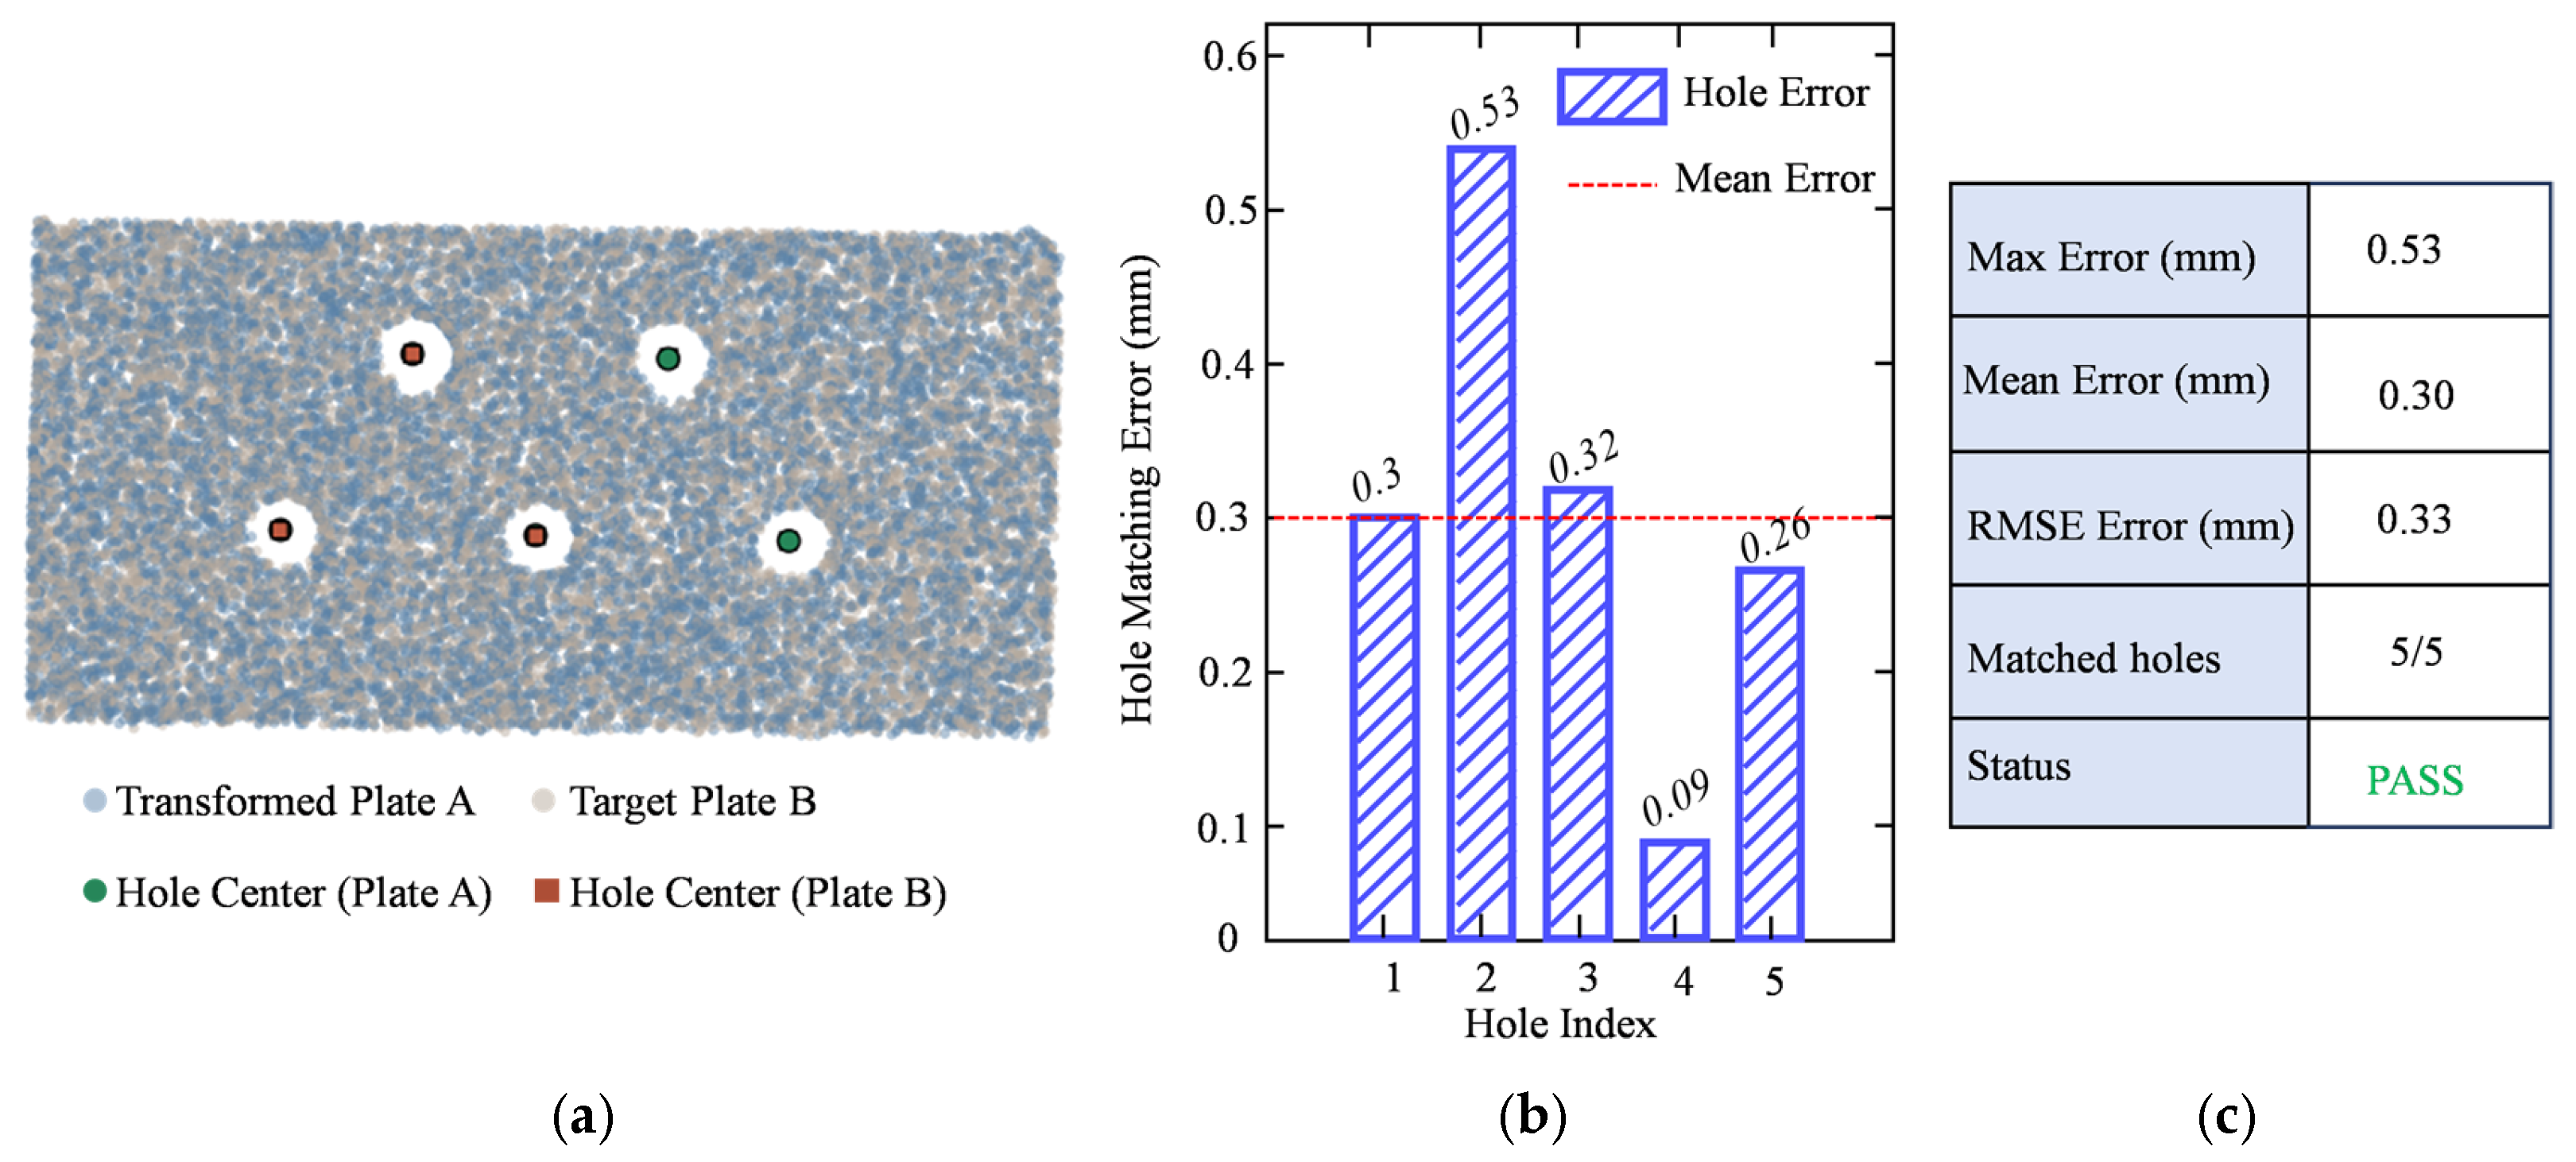
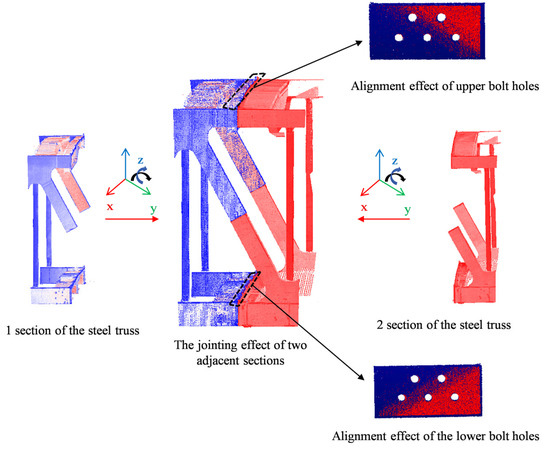
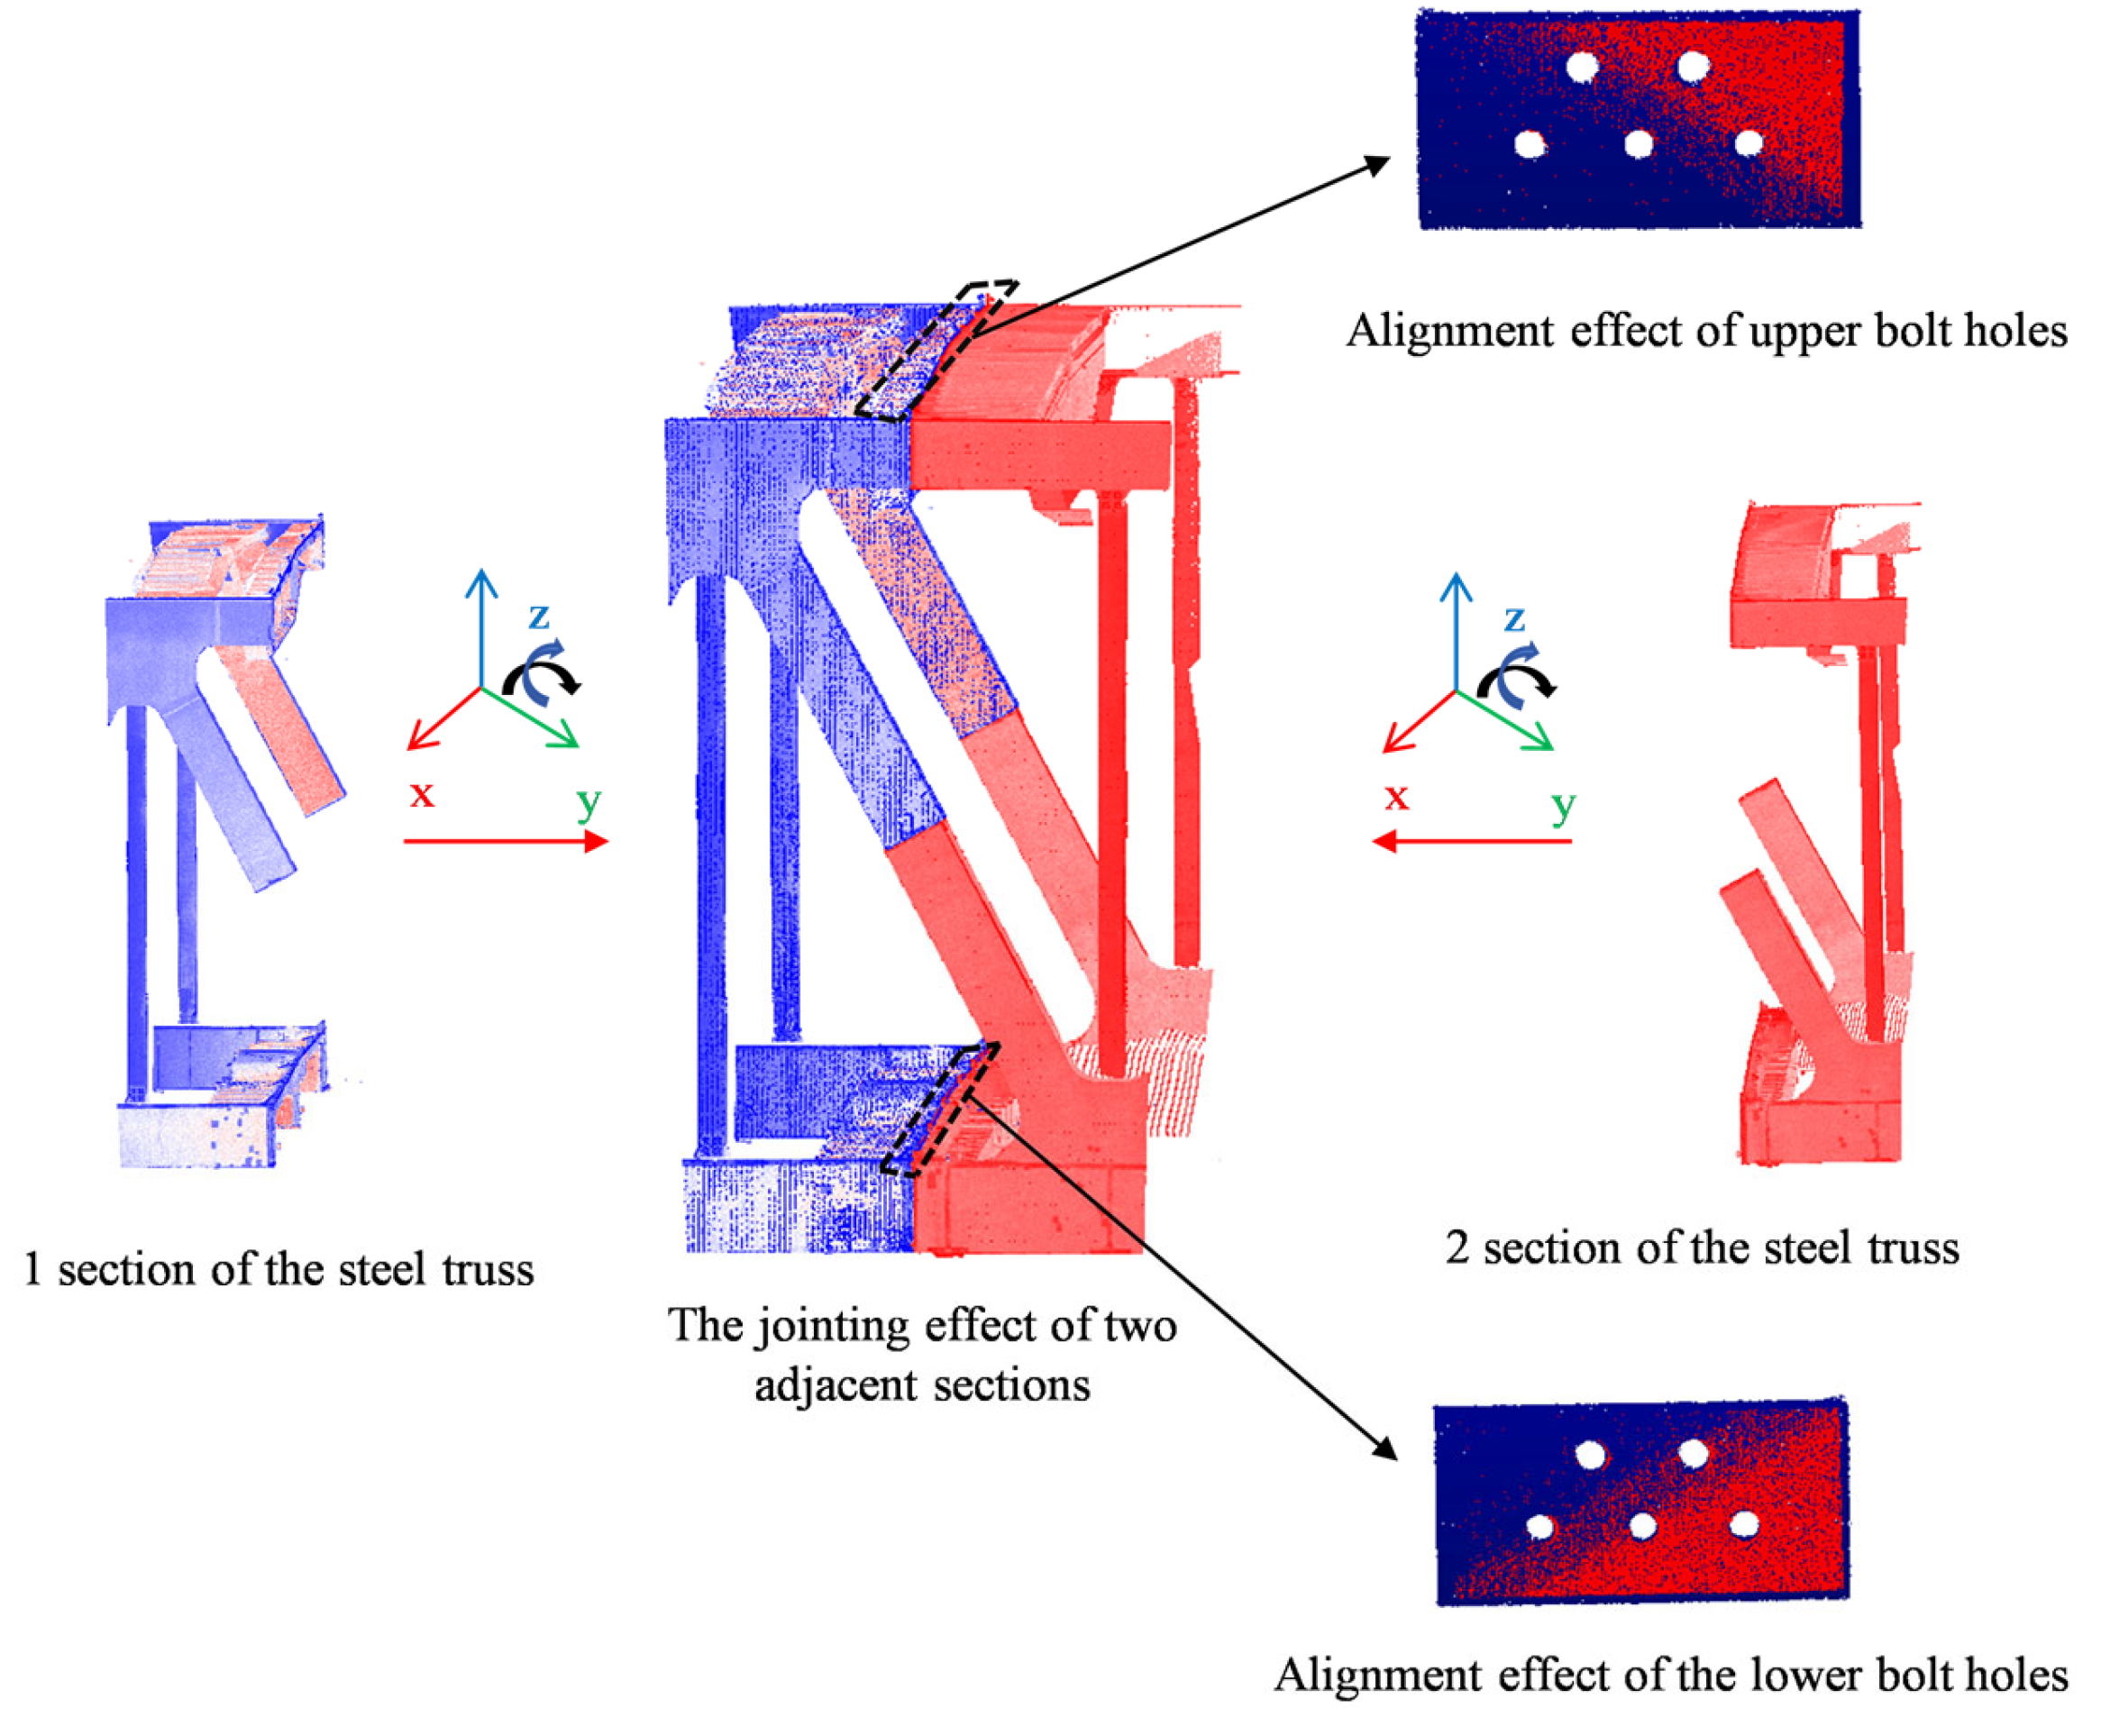

Disclaimer/Publisher’s Note: The statements, opinions and data contained in all publications are solely those of the individual author(s) and contributor(s) and not of MDPI and/or the editor(s). MDPI and/or the editor(s) disclaim responsibility for any injury to people or property resulting from any ideas, methods, instructions or products referred to in the content. |
© 2026 by the authors. Licensee MDPI, Basel, Switzerland. This article is an open access article distributed under the terms and conditions of the Creative Commons Attribution (CC BY) license.