


Abstract
The development of green buildings is essential to the low-carbon transition of the construction industry. As an important financial instrument linking green insurance with green building development, green building performance insurance (GBPI) addresses the “performance gap” between the actual operational performance of buildings and design targets. However, it remains at the pilot stage, and stakeholders’ willingness to participate remains limited. Based on evolutionary game theory, this study establishes a tripartite evolutionary game model involving the local government, insurance companies, and construction enterprises. Through theoretical derivation and numerical simulation, the study examines how initial probabilities and key parameters influence the evolution of the three stakeholders’ behavioral strategies. Monte Carlo analysis is used to assess the robustness of the main evolutionary outcomes under parameter uncertainty. Sobol sensitivity analysis further examines parameter interactions. The model results indicate that the local government plays a pivotal role in promoting green building performance insurance. Higher premium subsidy rates are associated with a greater fiscal burden for the local government, whereas higher actual premium rates are associated with lower payoffs for construction enterprises. These findings suggest that effective promotion requires a dynamic balance among the local government’s fiscal capacity, the operational sustainability of insurance companies, and the affordability of premiums for construction enterprises.
1. Introduction
Against the backdrop of China’s dual-carbon goals, the construction industry is undergoing a critical period of reform development and structural transformation. Green buildings are widely regarded as the future direction of building development. The floor area of newly constructed green buildings increased from 4 million m2 in 2011 to 2 billion m2 in 2024. New urban green buildings accounted for 97.9% of total new urban buildings in 2024, while the cumulative number of projects awarded green building labels reached approximately 25,000. China is projected to add 1.6–2.0 billion m2 of new building floor area annually, with more than 30 billion m2 of additional floor area expected by 2030 [1]. The existing support model, which relies primarily on government subsidies, is increasingly inadequate to meet the growing financing needs of the green building industry. Market-based financing mechanisms such as green finance are therefore needed to provide sustained support for the industry’s long-term development [2].
China first explicitly called for the development of green building performance insurance (GBPI) in the April 2024 Guiding Opinions on Promoting the High-Quality Development of Green Insurance [3]. The Ministry of Housing and Urban-Rural Development issued an announcement in September 2024 concerning partial revisions to the national standard Assessment Standard for Green Building (GB/T 50378-2019) [4]. The revised standard incorporated GBPI into its scoring framework, thereby further promoting the application of insurance mechanisms in the green building sector. Green insurance is an integral component of the green finance system. It not only strengthens market confidence but also serves as an effective instrument for promoting the large-scale development of green buildings [5,6]. GBPI is a key green insurance product that addresses the “performance gap” between the actual operational performance and design targets of green buildings. By combining risk protection with credit enhancement, it provides financial protection for green building performance and alleviates financing constraints.
GBPI is an emerging form of green insurance in China. In recent years, pilot programs have gradually expanded from economically developed coastal provinces such as Zhejiang and Shandong to inland provinces such as Hunan and Guizhou. However, GBPI remains at an early stage of market development. At present, only 15% of property insurance companies nationwide offer this product, and overall market participation remains limited. The promotion of GBPI involves multiple stakeholders with differing demands regarding market returns, cost allocation, and risk sharing. Their willingness to participate and strategic choices directly influence the effectiveness of its market adoption. Stakeholders continually adjust their strategies in response to expected payoffs and the behavior of others. Consequently, the promotion of GBPI exhibits pronounced dynamic evolutionary characteristics. However, relevant stakeholders have yet to establish an effective mechanism for reconciling economic interests with social responsibility. Therefore, encouraging stakeholders to adopt green practices and strengthening willingness to cooperate are essential to advancing the coordinated development of green insurance and green building development in China. This study examines the strategic behavior of the core stakeholders in GBPI and establishes a tripartite evolutionary game model. Numerical simulations are conducted to analyze how initial strategy probabilities and key parameters influence the evolution of stakeholder strategies. The findings provide a scientific foundation for encouraging stakeholders to adopt active strategies and advancing the sustainable development of green buildings.
The subsequent sections of this paper are structured as follows: Section 2 reviews the relevant literature, identifies the limitations of existing research, and presents the primary contributions of this study. Section 3 analyzes the interest relationships among the stakeholders, formulates the model assumptions, establishes the tripartite evolutionary game model, and evaluates its stability. Section 4 conducts numerical simulations to examine the effects of initial strategy probabilities and key parameters on the evolution of the tripartite system. It further applies Monte Carlo analysis to assess robustness under parameter uncertainty and Sobol sensitivity analysis to examine parameter interactions. Section 5 discusses the findings and limitations. Section 6 summarizes the main conclusions of the study.
2. Literature Review
2.1. Status of Green Buildings
The U.S. Green Building Council defines a green building as one that provides occupants with a comfortable living environment throughout its life cycle while minimizing adverse impacts on ecosystems and the environment [7]. China’s Assessment Standard for Green Building redefined the concept of green buildings by shifting the focus from the conservation of energy, land, water, and materials and environmental protection to an integrated approach incorporating both human-centered and ecological considerations, with the aim of promoting harmony among buildings, people, and nature [8,9].
Existing studies have primarily examined the factors influencing green building promotion and the motivations of stakeholders. Dwaikat et al. identified the high cost of green buildings as a critical factor influencing stakeholder decision-making [10]. Hu et al. applied the BP-WINGS method to data on China’s green building industry, identifying investment in technology as the principal factor influencing green building development and policy incentives as a major factor [11]. Debrah et al. identified the stakeholders involved in green finance for building development, including financial institutions, building professionals, housing authorities, developers, and trust institutions [12]. Chen et al. analyzed the strategic interactions among multiple stakeholders in green credit-supported retrofits of existing buildings and found that the strategic choices of governments, energy service companies, banks, and building owners were interdependent [13]. Li et al. analyzed the strategic evolution of stakeholders involved in green building technologies across different life-cycle stages and revealed that state-owned enterprises relied on policy support, whereas private enterprises focused on market returns and risk expectations [14]. An et al. found that green building development in China relies excessively on government support and that green building financing faces a series of barriers [15].
2.2. Development of Green Building Insurance
Green building insurance has emerged as an important financial instrument for advancing the high-quality development of green buildings [16]. It is a form of insurance specifically designed for green building projects, providing risk management and protection throughout the design, construction, operation, and maintenance stages [17].
Other countries began applying green insurance in the building sector earlier than China. In 2006, Fireman’s Fund launched the world’s first green building insurance product by combining green building property insurance with green building upgrade coverage [18]. Stricker et al. noted that green insurance can integrate sustainability objectives into the insurance value chain through product design, risk management, and related activities [19]. Malifete et al. showed that insurance can reduce green building investment risks through risk pricing, underwriting, and capital allocation [2]. Töppel et al. quantitatively compared the risk-mitigation effects of energy efficiency insurance and energy performance contracts [20]. Brown et al. found that energy performance contracts are constrained by performance shortfalls and contractual performance risks, whereas insurance-backed performance guarantees can enhance the viability of performance-based energy service models [21]. Baltuttis et al. analyzed the pricing, underwriting, and portfolio risks of Energy Efficiency Insurance, showing that diversified underwriting can reduce overall risk [22]. Giraudet et al. found that imperfectly observable service quality may lead to moral hazard and underprovision of quality, and examined energy-savings insurance as a potential solution to such incentive problems [23]. Mbokane et al. noted that banks support green building projects through financial instruments such as green loans and green bonds [16]. Devine and McCollum found that green financing projects can obtain lower interest rates and more favorable loan terms [24]. Leutner et al. indicated that green building attributes can translate into financing advantages through loan pricing [25].
Green building insurance emerged relatively late in China and remains comparatively underdeveloped. Wan et al. showed that energy performance guarantees can transfer performance risks in commercial building projects, while performance insurance can further mitigate related financial risks [26]. Mo et al. analyzed the investment and financing challenges facing the development of green building insurance from a macro perspective, introduced the concept of credit enhancement through green insurance, and emphasized the importance of coordinating policy and financial instruments [5]. He et al. employed time-series econometric methods and found that green insurance can more effectively ensure that the actual energy performance of green buildings meets expected levels, thereby facilitating green credit financing for buildings [27]. The People’s Insurance Company of China and the Paulson Foundation signed a memorandum of cooperation on green building insurance in 2017, marking China’s first attempt to use insurance mechanisms to promote green buildings on a large scale [28]. Zhu et al. examined China’s first GBPI project in Huzhou and established an integrated “insurance–service–technology–credit” model that supports full-process participation in the construction and management of green star-rated building projects [29]. Zhang et al. found that insurance mechanisms can effectively increase enterprises’ willingness to participate in green building projects [30]. She et al. applied push–pull theory to develop a framework of factors influencing the acceptance of green housing insurance and found that external pull factors such as premium subsidies had a significantly stronger effect on homeowners’ willingness to accept the insurance than internal push factors [31].
2.3. Green Building Stakeholder Strategies
Green building development involves multiple stakeholders whose behavioral strategies influence one another. Therefore, existing studies have applied evolutionary game theory to analyze the behavioral strategies and dynamic evolution of green building stakeholders [32,33,34].
International studies have applied game theory to analyze strategic interactions among stakeholders in green building and environmental insurance contexts. Cohen et al. [35] analyzed the strategic relationships among the government, builders, and homebuyers in Israel’s green building market. Their findings showed that government incentives can alter stakeholder payoffs and promote green building development. Colivicchi et al. incorporated insurance coverage into an evolutionary game model of environmentally responsible enterprises, demonstrating that insurance mechanisms can influence the dynamic evolution of firms’ green strategies [36].
Among domestic studies, Lu et al. established an evolutionary game model involving the government and developers, demonstrating that dynamic subsidy policies were more effective than alternative incentive strategies in promoting the transition to green buildings [37]. Yin et al. modeled the interactions between the supply and demand sides of green building development [38]. Chen et al. applied game theory to examine enterprises’ green behavior under different incentive and regulatory scenarios, showing that an active government stance is essential for the implementation of green buildings [39]. Li et al. further incorporated banks as independent stakeholders into a four-party evolutionary game of green housing, showing that government–bank collaboration can influence the strategic choices of other stakeholders [40]. Shao et al. [41] found that weak cooperation and information asymmetry reduced stakeholders’ willingness to pay and market demand for green insurance. They therefore proposed establishing a coordination mechanism and strengthening policy safeguards. Chen et al. developed a tripartite evolutionary game model to examine strategic interactions among stakeholders in highway construction projects. They further employed Monte Carlo simulation to assess the robustness of evolutionary outcomes and Sobol sensitivity analysis to identify the key parameters [42].
2.4. Literature Commentary
Existing studies on green building development, green building insurance, and multi-stakeholder behavioral evolution have made substantial progress and provided a solid foundation for further research. Nevertheless, several limitations remain: (1) Green building development in China remains heavily dependent on government fiscal support. Market mechanisms for supporting green building development through green finance remain underdeveloped. (2) Existing studies have focused primarily on GBPI pilot implementation, but research on stakeholder behavior remains limited. (3) Existing studies have primarily established evolutionary game models to analyze the evolution of stakeholder strategies in green building development or general green insurance. However, stakeholder strategy evolution in GBPI remains underexplored from a tripartite evolutionary game perspective.
The main contributions of this study are threefold: (1) This study positions GBPI as a distinct object of inquiry and examines stakeholder behavior within this emerging green financial mechanism, thereby extending GBPI research beyond pilot case studies to multi-stakeholder strategic interactions. (2) By incorporating insurance companies as independent financial stakeholders with a risk-management role, this study establishes a tripartite evolutionary game model comprising the local government, insurance companies, and construction enterprises. (3) This study combines a tripartite evolutionary game model with Monte Carlo uncertainty analysis and Sobol sensitivity analysis to examine GBPI stakeholder strategy evolution, assess the robustness of evolutionary outcomes under parameter uncertainty, and identify key parameter interactions.
3. Tripartite Evolutionary Game Model
3.1. Stakeholder Analysis
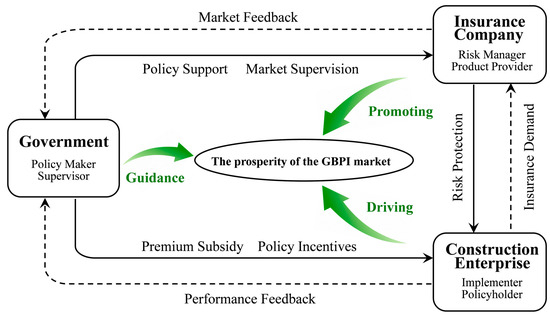
Active government promotion is a prerequisite for the market-oriented development of GBPI. As both a policymaker and a market regulator, the local government provides policy support and premium subsidies to insurance companies and construction enterprises. Insurance companies serve as providers of GBPI and assume responsibility for risk management.
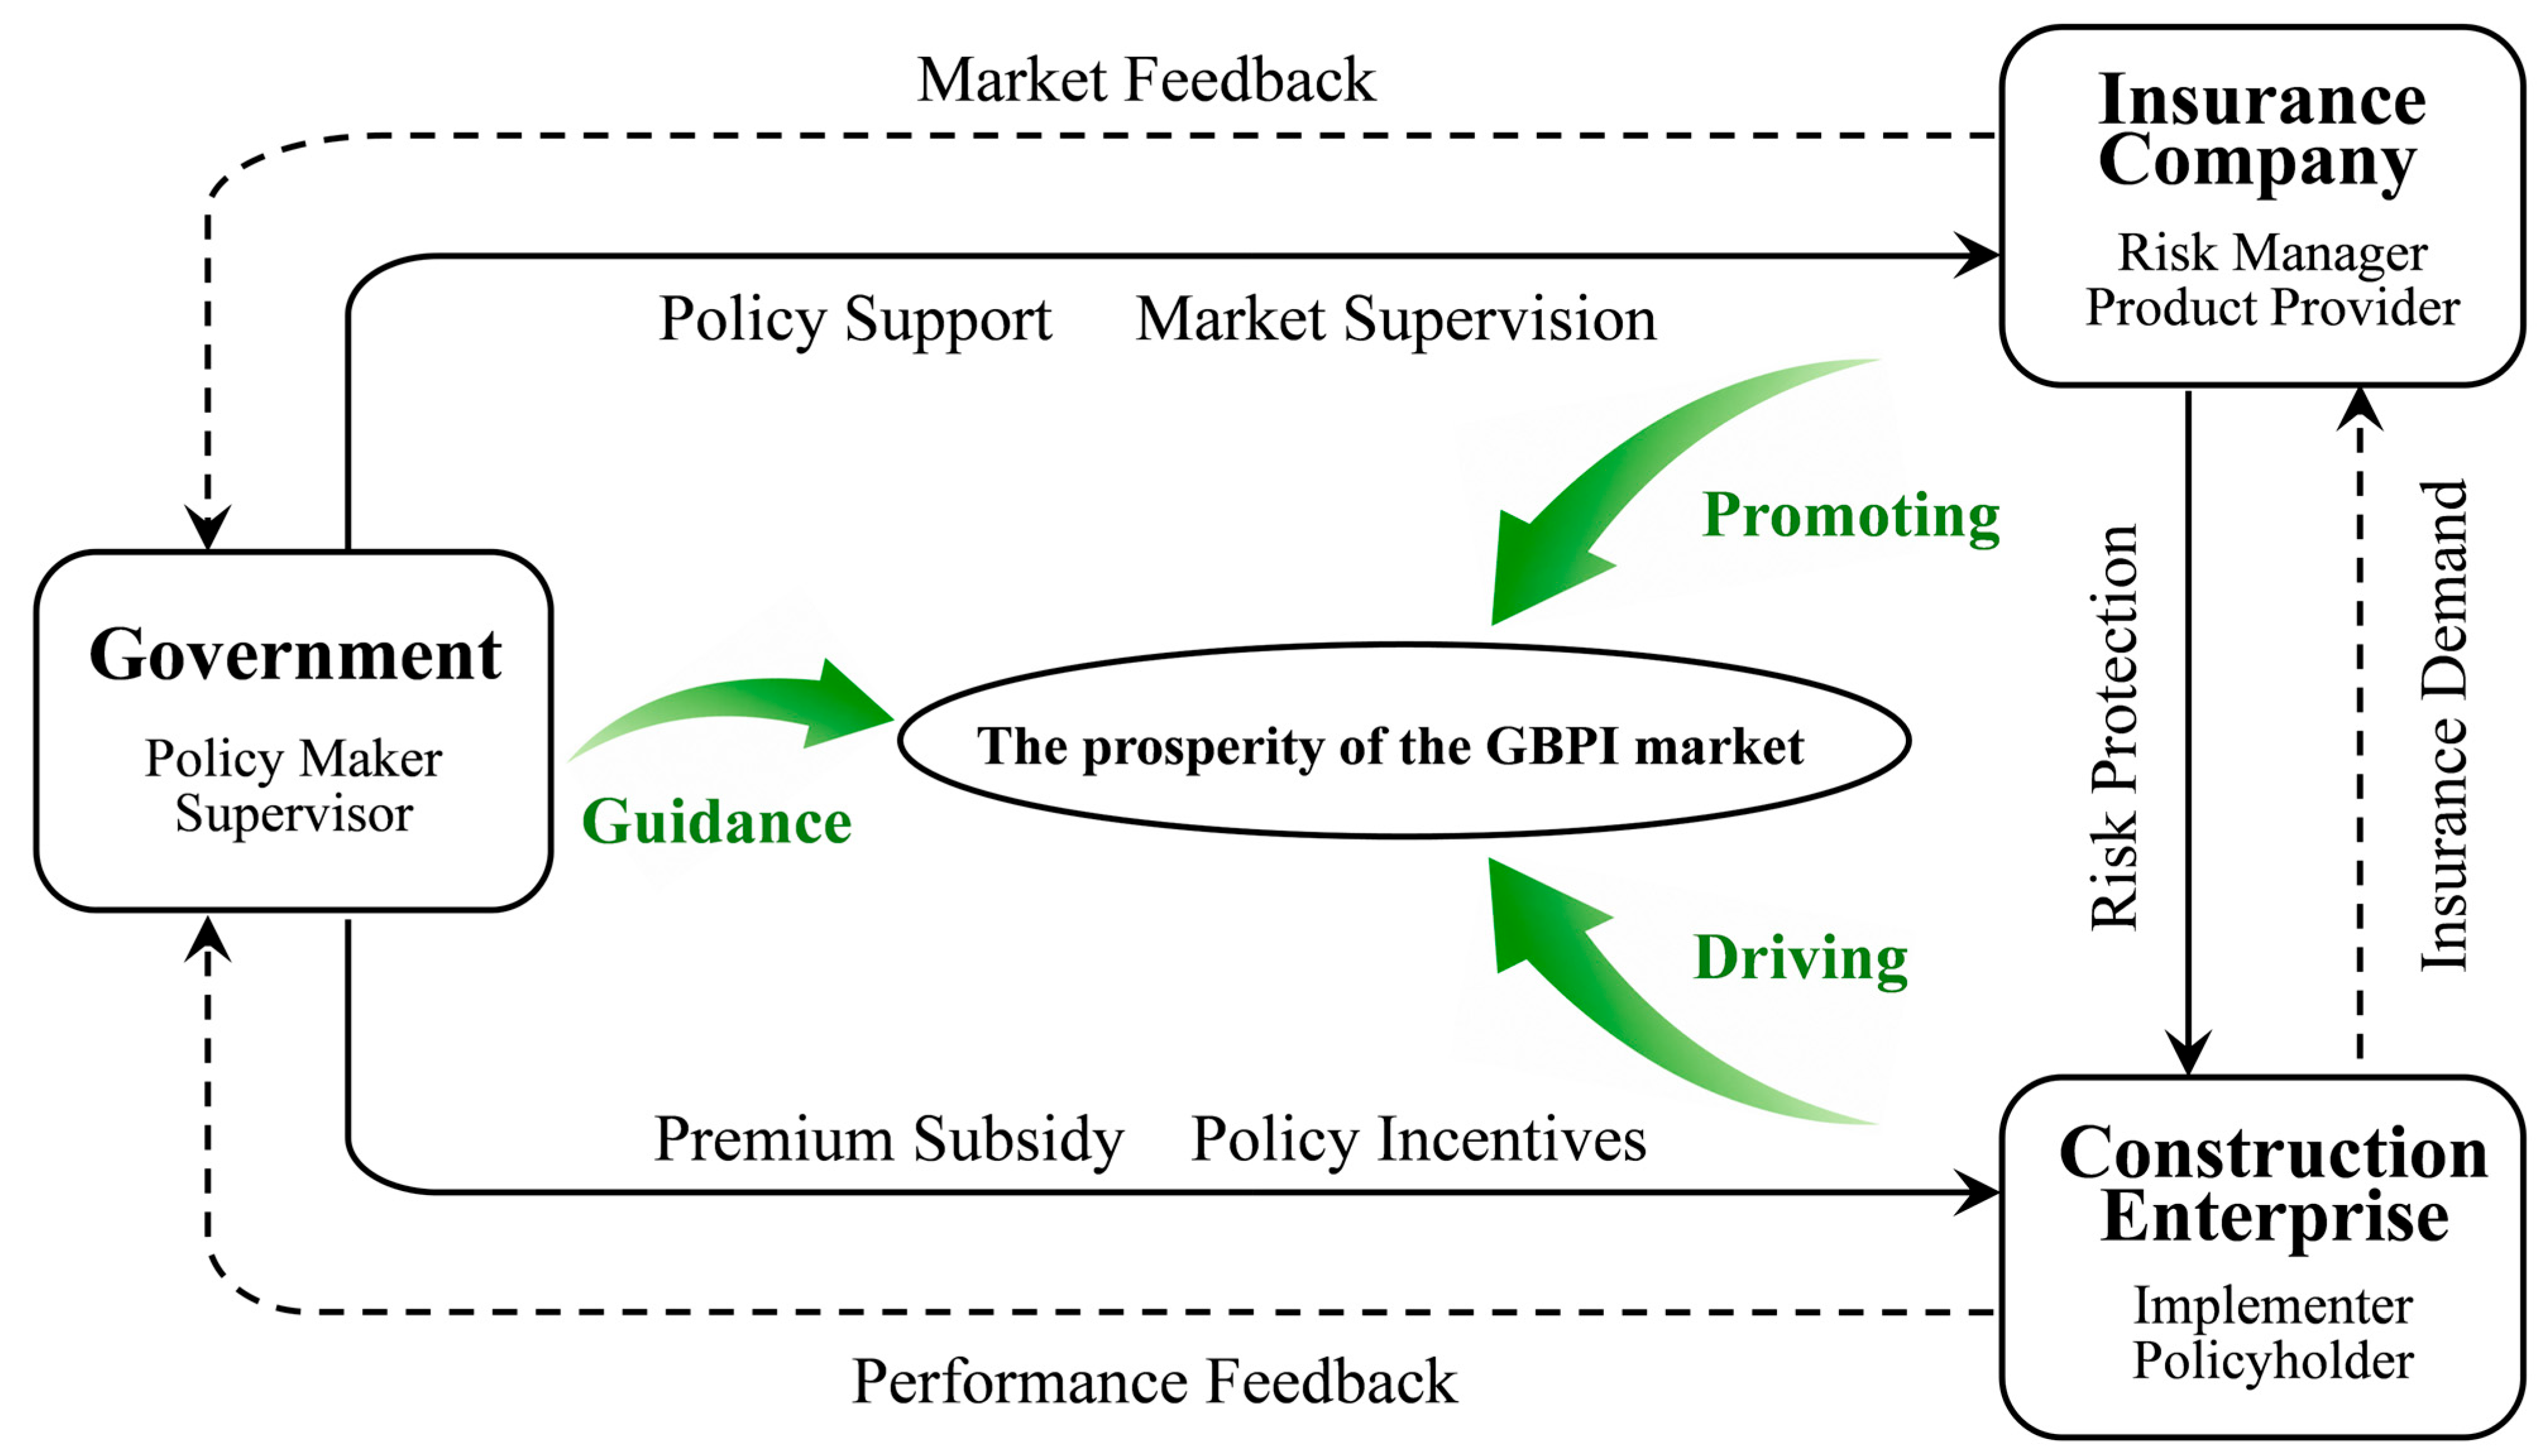
Under government policy guidance, they provide risk protection and credit enhancement for green building projects. Construction enterprises are the policyholders of GBPI and are responsible for building performance. The local government, insurance companies, and construction enterprises play distinct but interrelated roles in promoting GBPI. Their interactions facilitate the wider adoption of GBPI and contribute to the sustainable development of green buildings. The interaction mechanism among the three stakeholders is illustrated in Figure 1.
Figure 1.
Interaction mechanism among the local government, insurance companies, and construction enterprises.
3.2. Model Assumptions
This study applies evolutionary game theory to analyze the conflicts of interest and strategy choices among the local government, insurance companies, and construction enterprises. It then specifies the relevant model assumptions. Table 1 presents the definitions of the model parameters.
Table 1.
Description of symbols in the tripartite evolutionary game model for green building performance insurance (GBPI).
Assumption 1.
The participants in the evolutionary game model of GBPI are the local government, insurance companies, and construction enterprises. All three participants are boundedly rational and seek to maximize their own payoffs. During strategic interactions, each stakeholder gradually adjusts its strategy according to the relative payoffs associated with alternative strategies.
The payoff structure is based on current GBPI policies and publicly available information from pilot projects. It captures the core benefit–cost relationships underlying the strategic choices of the three stakeholders. The specific payoff components for each stakeholder are as follows:
- (1)
- The local government’s payoff is defined as overall benefits minus overall costs. Overall benefits comprise economic benefits, policy performance, and social benefits. Economic benefits include the expansion of the green building industrial chain, increased investment, and higher fiscal revenue generated by the promotion of GBPI. Policy performance includes progress in GBPI pilot implementation, the effectiveness of incentive policies such as premium subsidies, and the attainment of assessment targets related to carbon peaking and carbon neutrality. Social benefits include improvements in environmental quality resulting from energy conservation and emission reduction in green buildings, as well as employment growth driven by the development of the green building industry. Overall costs comprise the government management costs incurred in promoting GBPI and premium subsidy expenditures for construction enterprises. Management costs include publicity and regulatory costs, and the premium subsidy rate is constrained by the local government’s fiscal capacity.
- (2)
- The insurance company’s payoff is defined as revenues minus costs. Specifically, net profit is derived from premium income after deducting operating costs, expected claim costs, and initial fixed costs. The actual premium rate represents the pricing outcome associated with risk assessment and actuarial pricing. The operating cost rate captures operating expenditures associated with underwriting and management. The loss ratio reflects the expected claim burden arising from the provision of GBPI. The initial fixed cost covers expenditures on product development, market promotion, and technical services for risk prevention. Accordingly, the effects of underwriting risk, pricing, claims, and operating costs on the insurance companies’ payoff are represented through these reduced-form parameters rather than being explicitly modeled as separate components.
- (3)
- The construction enterprise’s payoff is determined by the net profit generated from green building projects. Its net profit rate reflects the level of profitability after deducting operating costs, maintenance costs, financing costs, and technology adoption costs. After purchasing GBPI, the construction enterprise also bears the premium cost after government subsidies. In addition, the risk protection and credit enhancement provided by GBPI influence the enterprise’s payoff through loan increments under different strategy combinations.
Assumption 2.
During the pilot implementation of GBPI, the sizes of the three stakeholder populations within a given region are assumed to remain relatively stable, with no large-scale market entry or exit. Each stakeholder group is therefore normalized to a unit mass, and probability variables are used to characterize its strategy distribution. At time t, the strategy sets of the local government, insurance companies, and construction enterprises are {active promotion, passive promotion}, {active provision, passive provision}, and {purchase, non-purchase}, respectively. denotes the probability that the local government adopts the active promotion strategy, represents the probability that insurance companies adopt the active provision strategy, and indicates the probability that construction enterprises adopt the purchase strategy, where . The probabilities that the three stakeholders adopt their opposing strategies are , , and , respectively.
Assumption 3.
The insurance companies’ payoff from providing GBPI is, where . Under the economically feasible GBPI pilot scenario examined in this study, the construction enterprises’ payoff from purchasing GBPI is , where . The condition defines the scope of the analyzed pilot scenario and should not be interpreted as a universal assumption about construction enterprises’ purchasing behavior.
Assumption 4.
Under different strategy combinations, construction enterprises’ loan increments follow either or . Given insufficient evidence on the relative effects of policy support and insurance credit enhancement in improving financing conditions, this study does not impose a strict ordering between and . The local government’s overall benefits follow either or , with no strict ordering imposed between and .
Assumption 5.
The evolutionary game parameters are allowed to vary within reasonable ranges under different scenarios and parameter uncertainty. Other time-varying exogenous shocks are excluded from the model.
3.3. Model Formulation
3.3.1. Game Tree of Stakeholder Strategies
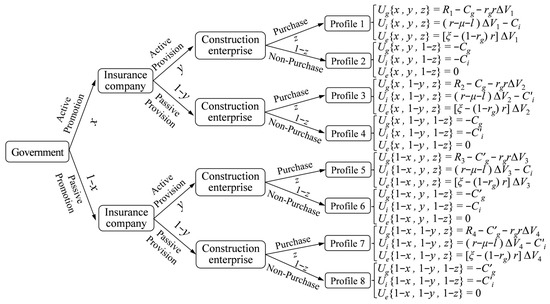
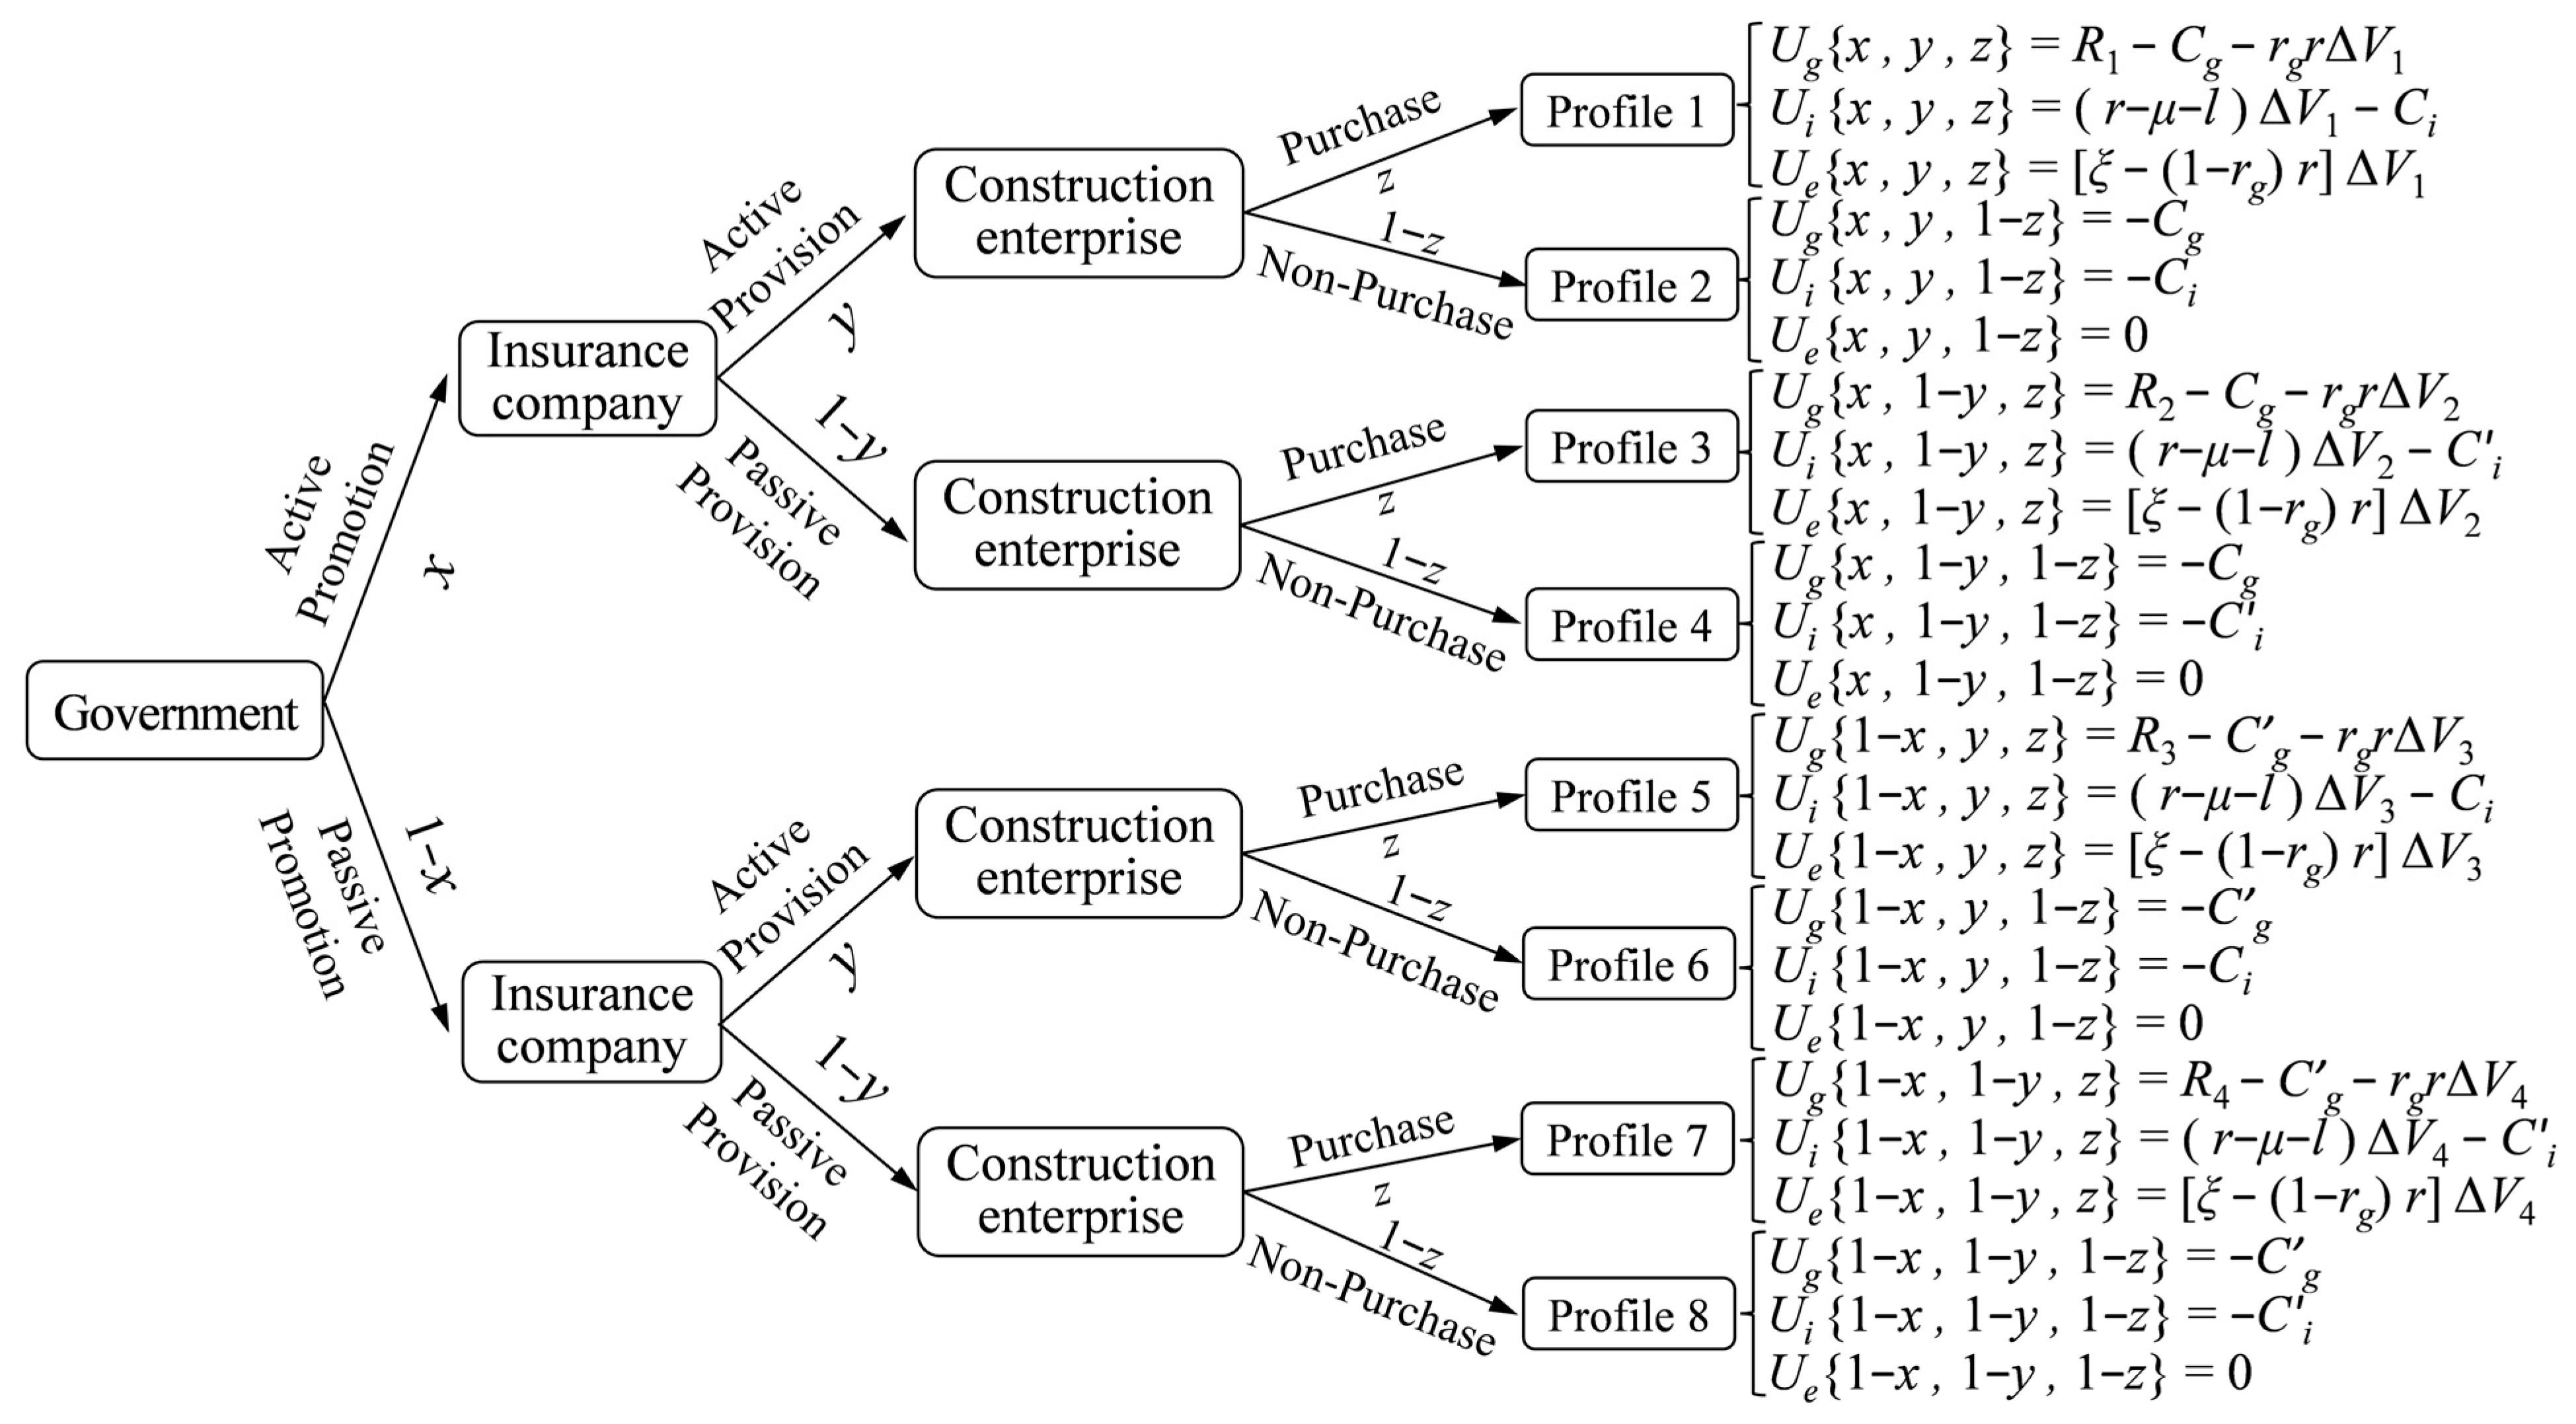
Based on the above assumptions, when , , and each take a value in {0,1}, the tripartite game has eight possible pure-strategy combinations, as shown in Figure 2. The payoffs of the local government, insurance companies, and construction enterprises, denoted by , , and , respectively, are calculated according to the following rules: . Substituting the parameters in Table 1 into the above calculation rules yields the tripartite payoff functions for the strategy combinations shown in Figure 2. denotes the local government’s payoff when the local government adopts active promotion, insurance companies adopt active provision, and construction enterprises purchase GBPI. The remaining payoff functions are interpreted analogously.
Figure 2.
Game tree of the tripartite evolutionary game.
3.3.2. Stakeholder Payoffs and Replicator Dynamics Equations
In evolutionary game theory, the fitness of a strategy refers to the expected payoff obtained by a stakeholder from adopting that strategy under a given population strategy distribution. The stakeholder’s average fitness is the weighted average of the fitness values of all strategies, with the corresponding strategy probabilities as weights.
denotes the fitness of the local government’s active promotion strategy, denotes the fitness of its passive promotion strategy, and denotes its average fitness.
| (1) | ||
| = | ||
| (2) | ||
| = | ||
| (3) |
denotes the fitness of insurance companies’ active provision strategy, denotes the fitness of their passive provision strategy, and denotes their average fitness.
| (4) | ||
| = | ||
| (5) | ||
| = | ||
| (6) |
denotes the fitness of construction enterprises’ purchase strategy, denotes the fitness of their non-purchase strategy, and denotes their average fitness.
| (7) | ||
| = | ||
| (8) | ||
| (9) |
The replicator dynamics equations for the local government, insurance companies, and construction enterprises are denoted by F(x), F(y), and F(z), respectively.
| (10) | ||
| = | ||
| (11) | ||
| = | ||
| (12) | ||
| = | ||
3.4. Model Stability Analysis
3.4.1. Unilateral Stabilization
From the local government’s replicator dynamic equation:
- (1)
- If , then , and the system is stable for any .
- (2)
- If , only when or .
The first-order partial derivative of with respect to is given by:
- (3)
- If and , then is locally asymptotically stable.
- (4)
- If and , then is locally asymptotically stable.
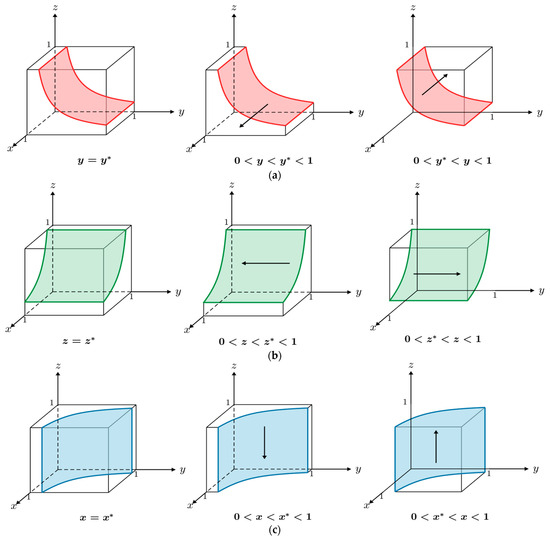
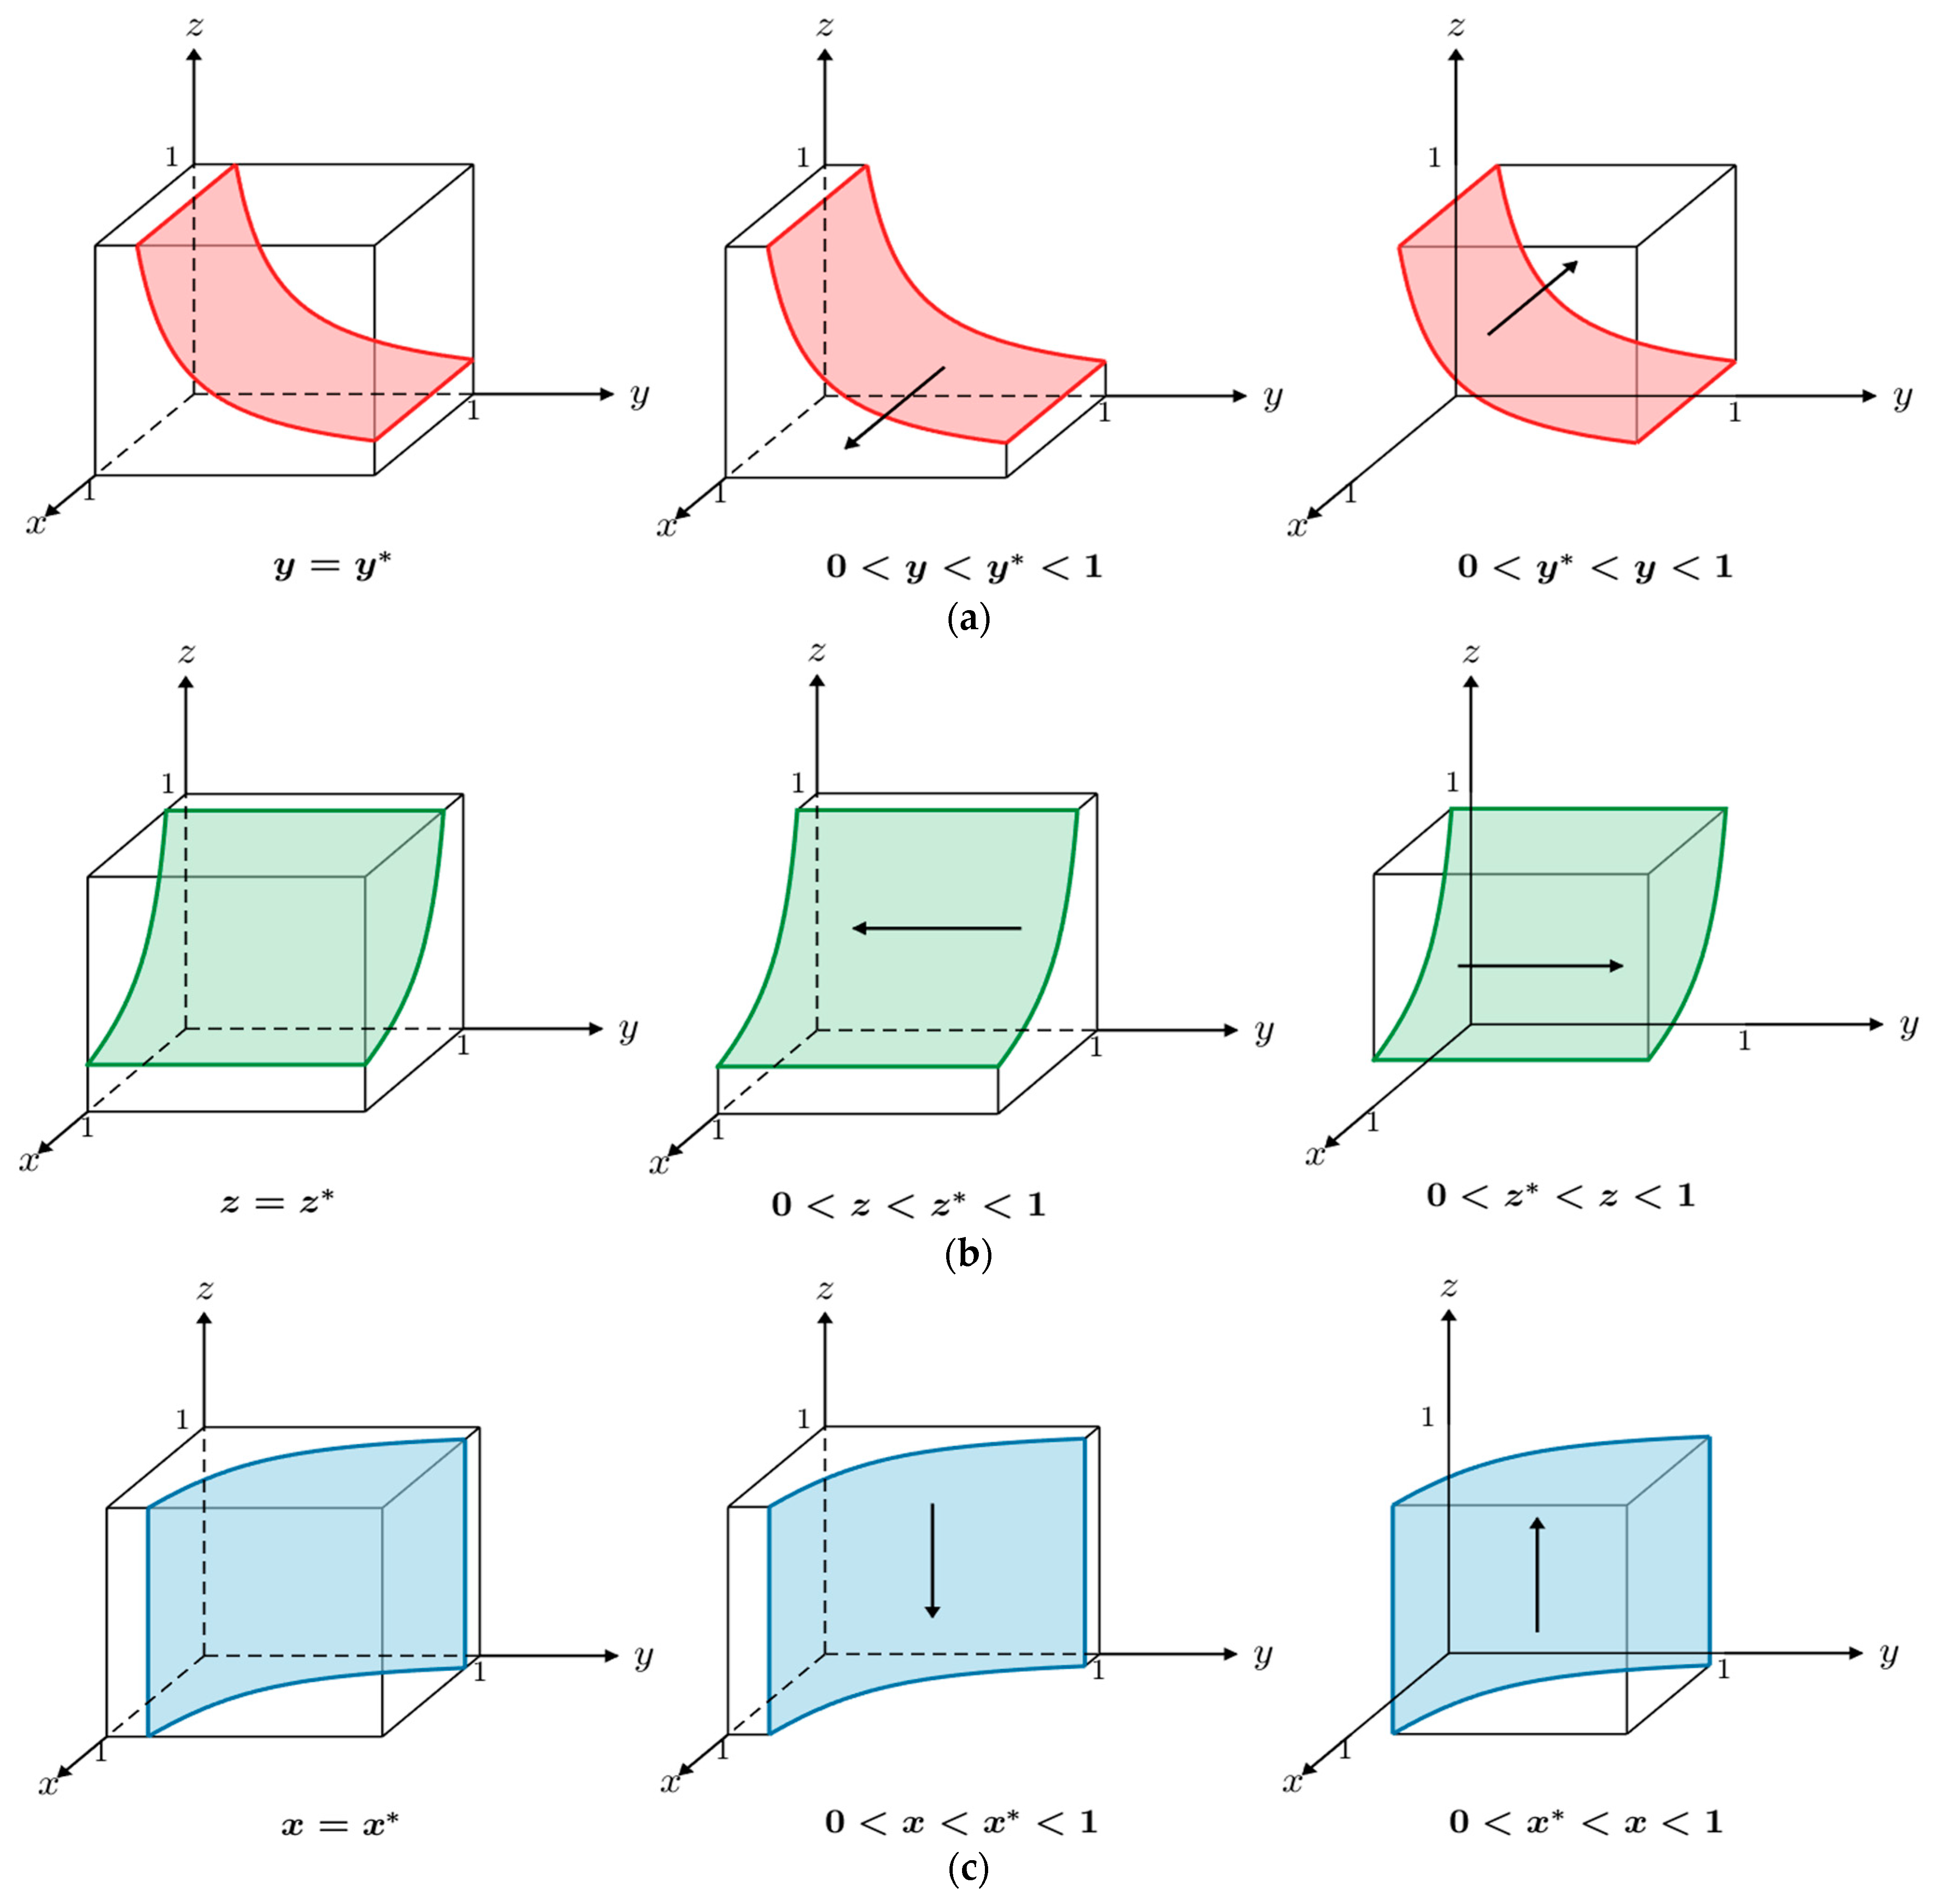
The strategy space is divided by the plane . In the region where , is a locally asymptotically stable equilibrium, indicating that the local government tends to adopt the active promotion strategy. In the region where , is a locally asymptotically stable equilibrium, indicating that the local government tends to adopt the passive promotion strategy, as shown in Figure 3a. Similar analyses are conducted for insurance companies and construction enterprises, determining their respective local stability conditions and equilibrium regions, also shown in Figure 3b,c.
Figure 3.
Phase diagrams of evolutionary strategies: (a) Local government; (b) Insurance companies; (c) Construction enterprises. The superscript * denotes the threshold value of the corresponding strategy probability, which separates different stability regions.
3.4.2. Multilateral Stabilization
Combining Equations (10)–(12) yields the system of replicator dynamics equations for the three GBPI stakeholders: the local government, insurance companies, and construction enterprises. The equilibrium points of the system are obtained by simultaneously solving , , and .
According to evolutionary game theory, an asymptotically stable equilibrium in a multi-population evolutionary game must be a strict Nash equilibrium [43]. Each pure-strategy equilibrium and its stability correspond directly to a specific strategy profile of the three stakeholder populations. Accordingly, this study examines the stability of the following eight pure-strategy equilibrium points: , , , , , , , and .
According to Lyapunov’s first method, the local stability of an equilibrium point is determined by the eigenvalues of the system’s Jacobian matrix [44]. If all eigenvalues satisfy , the equilibrium point is locally asymptotically stable. If at least one eigenvalue satisfies , the equilibrium point is unstable. If one or more eigenvalues satisfy while all nonzero eigenvalues are negative, the stability of the equilibrium point cannot be determined by this method. Therefore, for the tripartite evolutionary game among the local government, insurance companies, and construction enterprises to attain an asymptotically stable state, all three eigenvalues of the corresponding Jacobian matrix must have negative real parts. The Jacobian matrix is constructed from the first-order partial derivatives of , , and with respect to , , and .
The Jacobian matrix is evaluated at each of the eight pure-strategy equilibrium points, yielding the corresponding eigenvalues shown in Table 2. The eigenvalue analysis indicates that , , , and are unstable equilibrium points. The asymptotic stability of , , , and is analyzed in the following four cases.
Table 2.
Eigenvalues of the pure-strategy equilibrium points.
Case I: When , is locally asymptotically stable. Under the insurance company’s passive provision strategy, if , then . Under the local government’s passive promotion strategy, if , then . According to assumption 3, . Although this equilibrium may satisfy the stability conditions, it corresponds to a strategy profile in which the local government passively promotes GBPI, insurance companies passively provide GBPI, and construction enterprises purchase GBPI. Under this strategy profile, the market lacks the necessary policy support and an effective supply of insurance, making it difficult for the construction enterprise’s willingness to purchase GBPI to translate into an actual insurance transaction. Consequently, lacks practical relevance.
Case II: When , is locally asymptotically stable. Under the insurance company’s passive provision strategy, if , then . Under the local government’s active promotion strategy, if , then . According to assumption 3, . This equilibrium corresponds to a strategy profile in which the local government actively promotes GBPI, insurance companies passively provide GBPI, and construction enterprises purchase GBPI.
Case III: When , is locally asymptotically stable. Under the insurance company’s active provision strategy, if , then . Under the local government’s passive promotion strategy, if , then . According to assumption 3, . This equilibrium corresponds to a strategy profile in which the local government passively promotes GBPI, insurance companies actively provide GBPI, and construction enterprises purchase GBPI.
Case IV: When , is locally asymptotically stable. Under the insurance company’s active provision strategy, if , then . Under the local government’s active promotion strategy, if , then . According to assumption 3, . This equilibrium corresponds to a strategy profile in which the local government actively promotes GBPI, insurance companies actively provide GBPI, and construction enterprises purchase GBPI.
In summary, , , and may be locally asymptotically stable under their respective parameter conditions.
4. Numerical Simulation Analysis
4.1. Parameter Settings
GBPI in China remains at the pilot stage, and publicly available case and market data are still limited. Consequently, some model parameters cannot be directly derived from statistical data. The baseline parameter values are calibrated on multiple sources of evidence. (1) Directly observable parameters are determined from GBPI policy documents and publicly available pilot data. (2) Parameters for which direct GBPI data are unavailable are calibrated using evidence from green building research, construction insurance market data, relevant literature, and scenario assessments. (3) For overall benefit and financing variables that cannot be directly observed, relative baseline levels are determined according to their economic meanings and the available empirical evidence.
In the numerical simulations, all parameters enter the model as dimensionless values. Specifically, and are expressed as dimensionless relative values that represent the relative magnitudes of financing, cost, and benefit factors, rather than actual monetary amounts. The parameters and are also treated as dimensionless in the model calculations. The baseline value of is determined from premium subsidy rates in GBPI pilot regions. is calibrated using empirical evidence from green building studies. The relative baseline levels of the remaining parameters are determined based on relevant policies, GBPI pilot cases, construction insurance market data, and related literature. Because some parameters are represented by dimensionless relative values, the numerical simulations in this study are interpreted as illustrative scenario analyses. These simulations are primarily used to examine the dynamic evolution of the three stakeholders’ strategies under different parameter scenarios. The initial parameter values were set as follows: , , , , , , , , , , , , , , , , and .
4.2. Tripartite Evolutionary Dynamics Under Different Initial Strategy Probabilities
Numerical simulations were conducted in MATLAB R2021b based on the tripartite replicator dynamics Equations (10)–(12) and parameter values. The simulations analyzed the evolution of the three GBPI stakeholders’ behavioral strategies under the initial scenario.
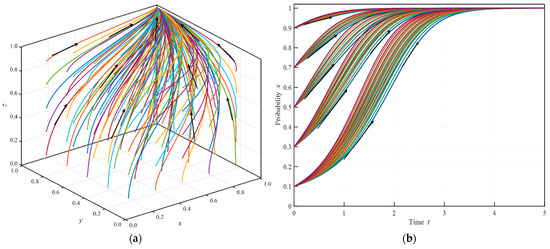
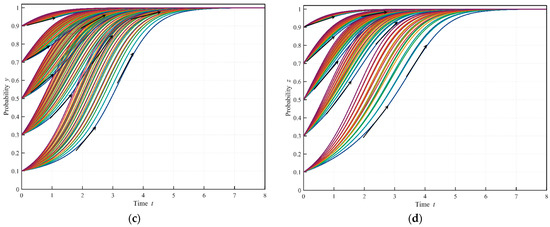
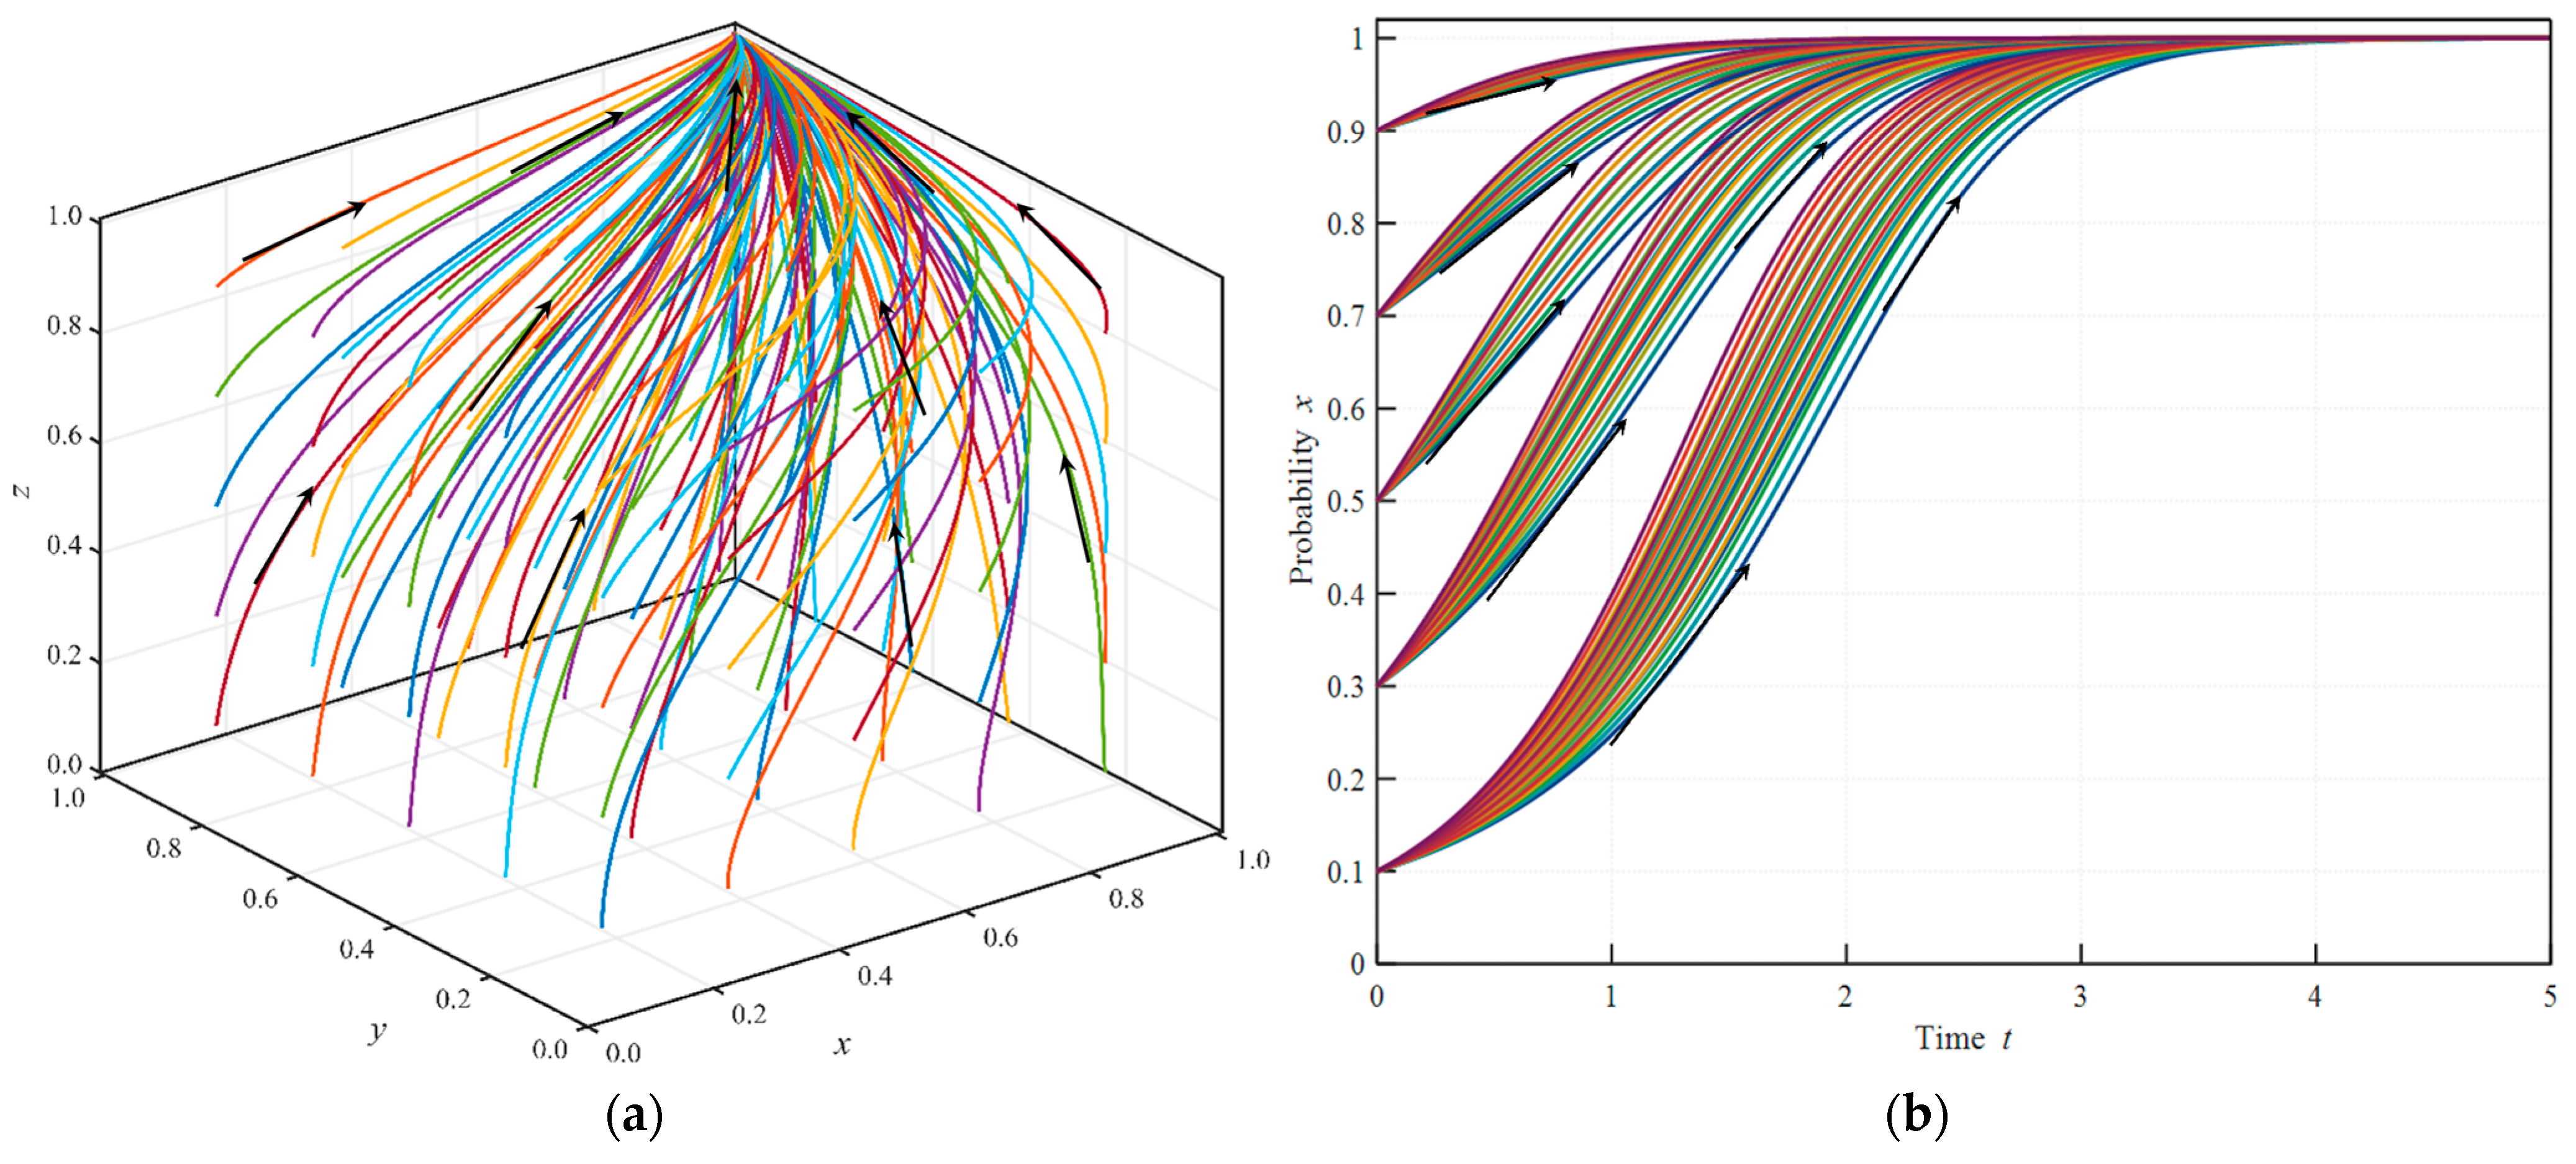
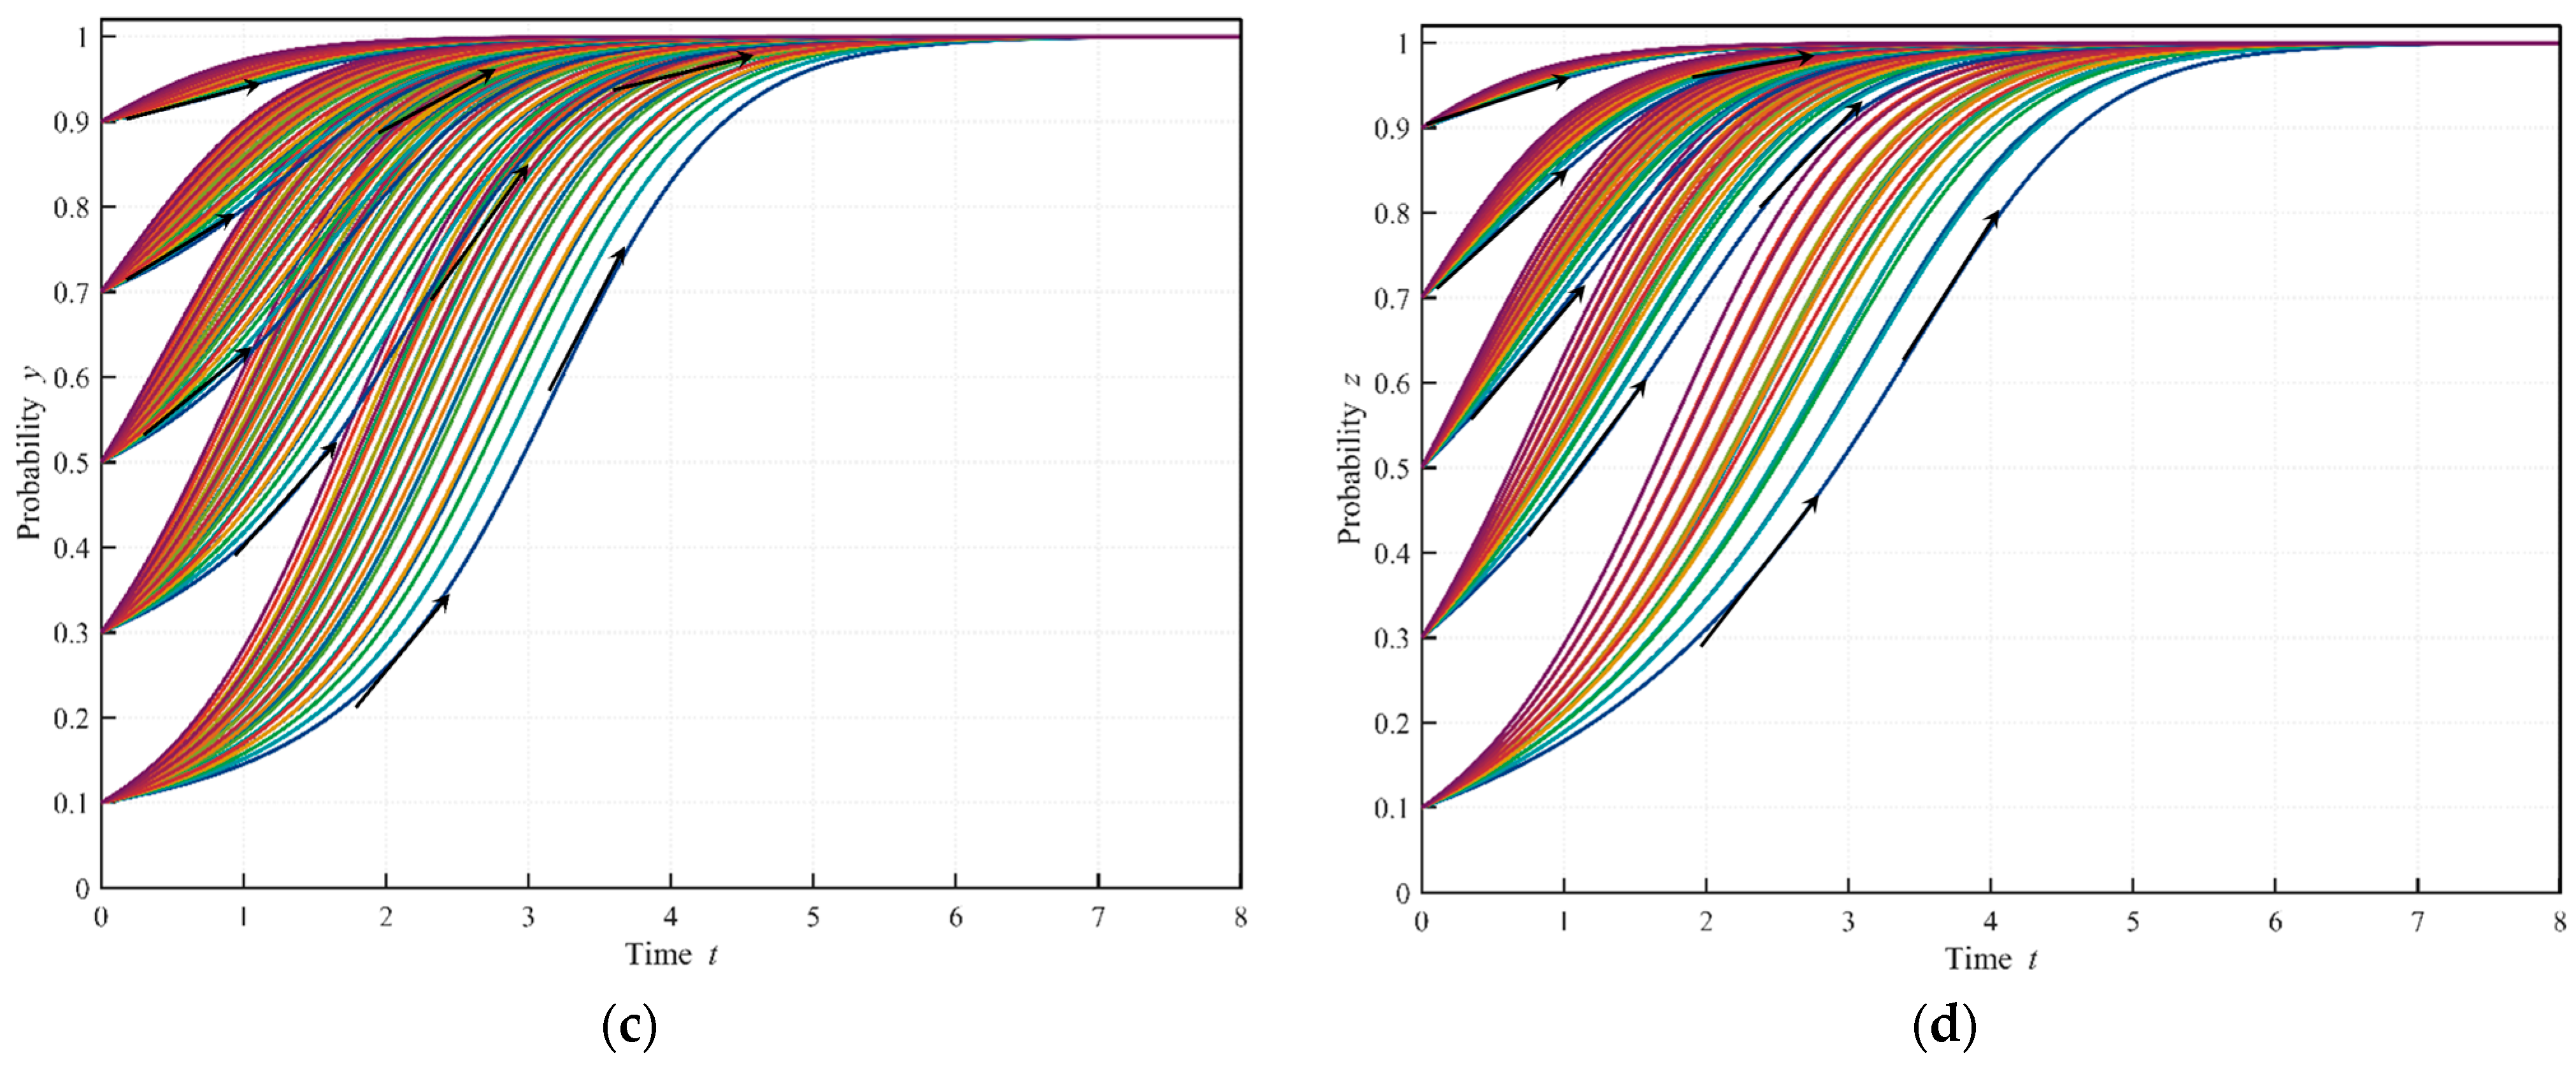
As shown in Figure 4, different combinations of initial strategy probabilities lead to variations in convergence speeds and evolutionary trajectories. However, the system converges to in all cases. The local government exhibits the shortest convergence time, followed by construction enterprises, whereas insurance companies require the longest convergence time. Higher overall initial strategy probabilities among the three stakeholders accelerate the convergence of the system.
Figure 4.
Evolutionary dynamics under different initial strategy probabilities: (a) Evolutionary trajectories of the tripartite system in the strategy space (x, y, z); (b) Local government, x(t); (c) Insurance companies, y(t); (d) Construction enterprises, z(t).
4.3. Effects of Individual Stakeholders’ Initial Willingness on Evolutionary Dynamics
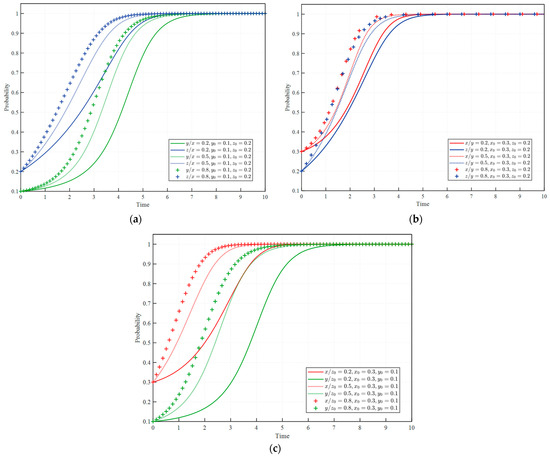
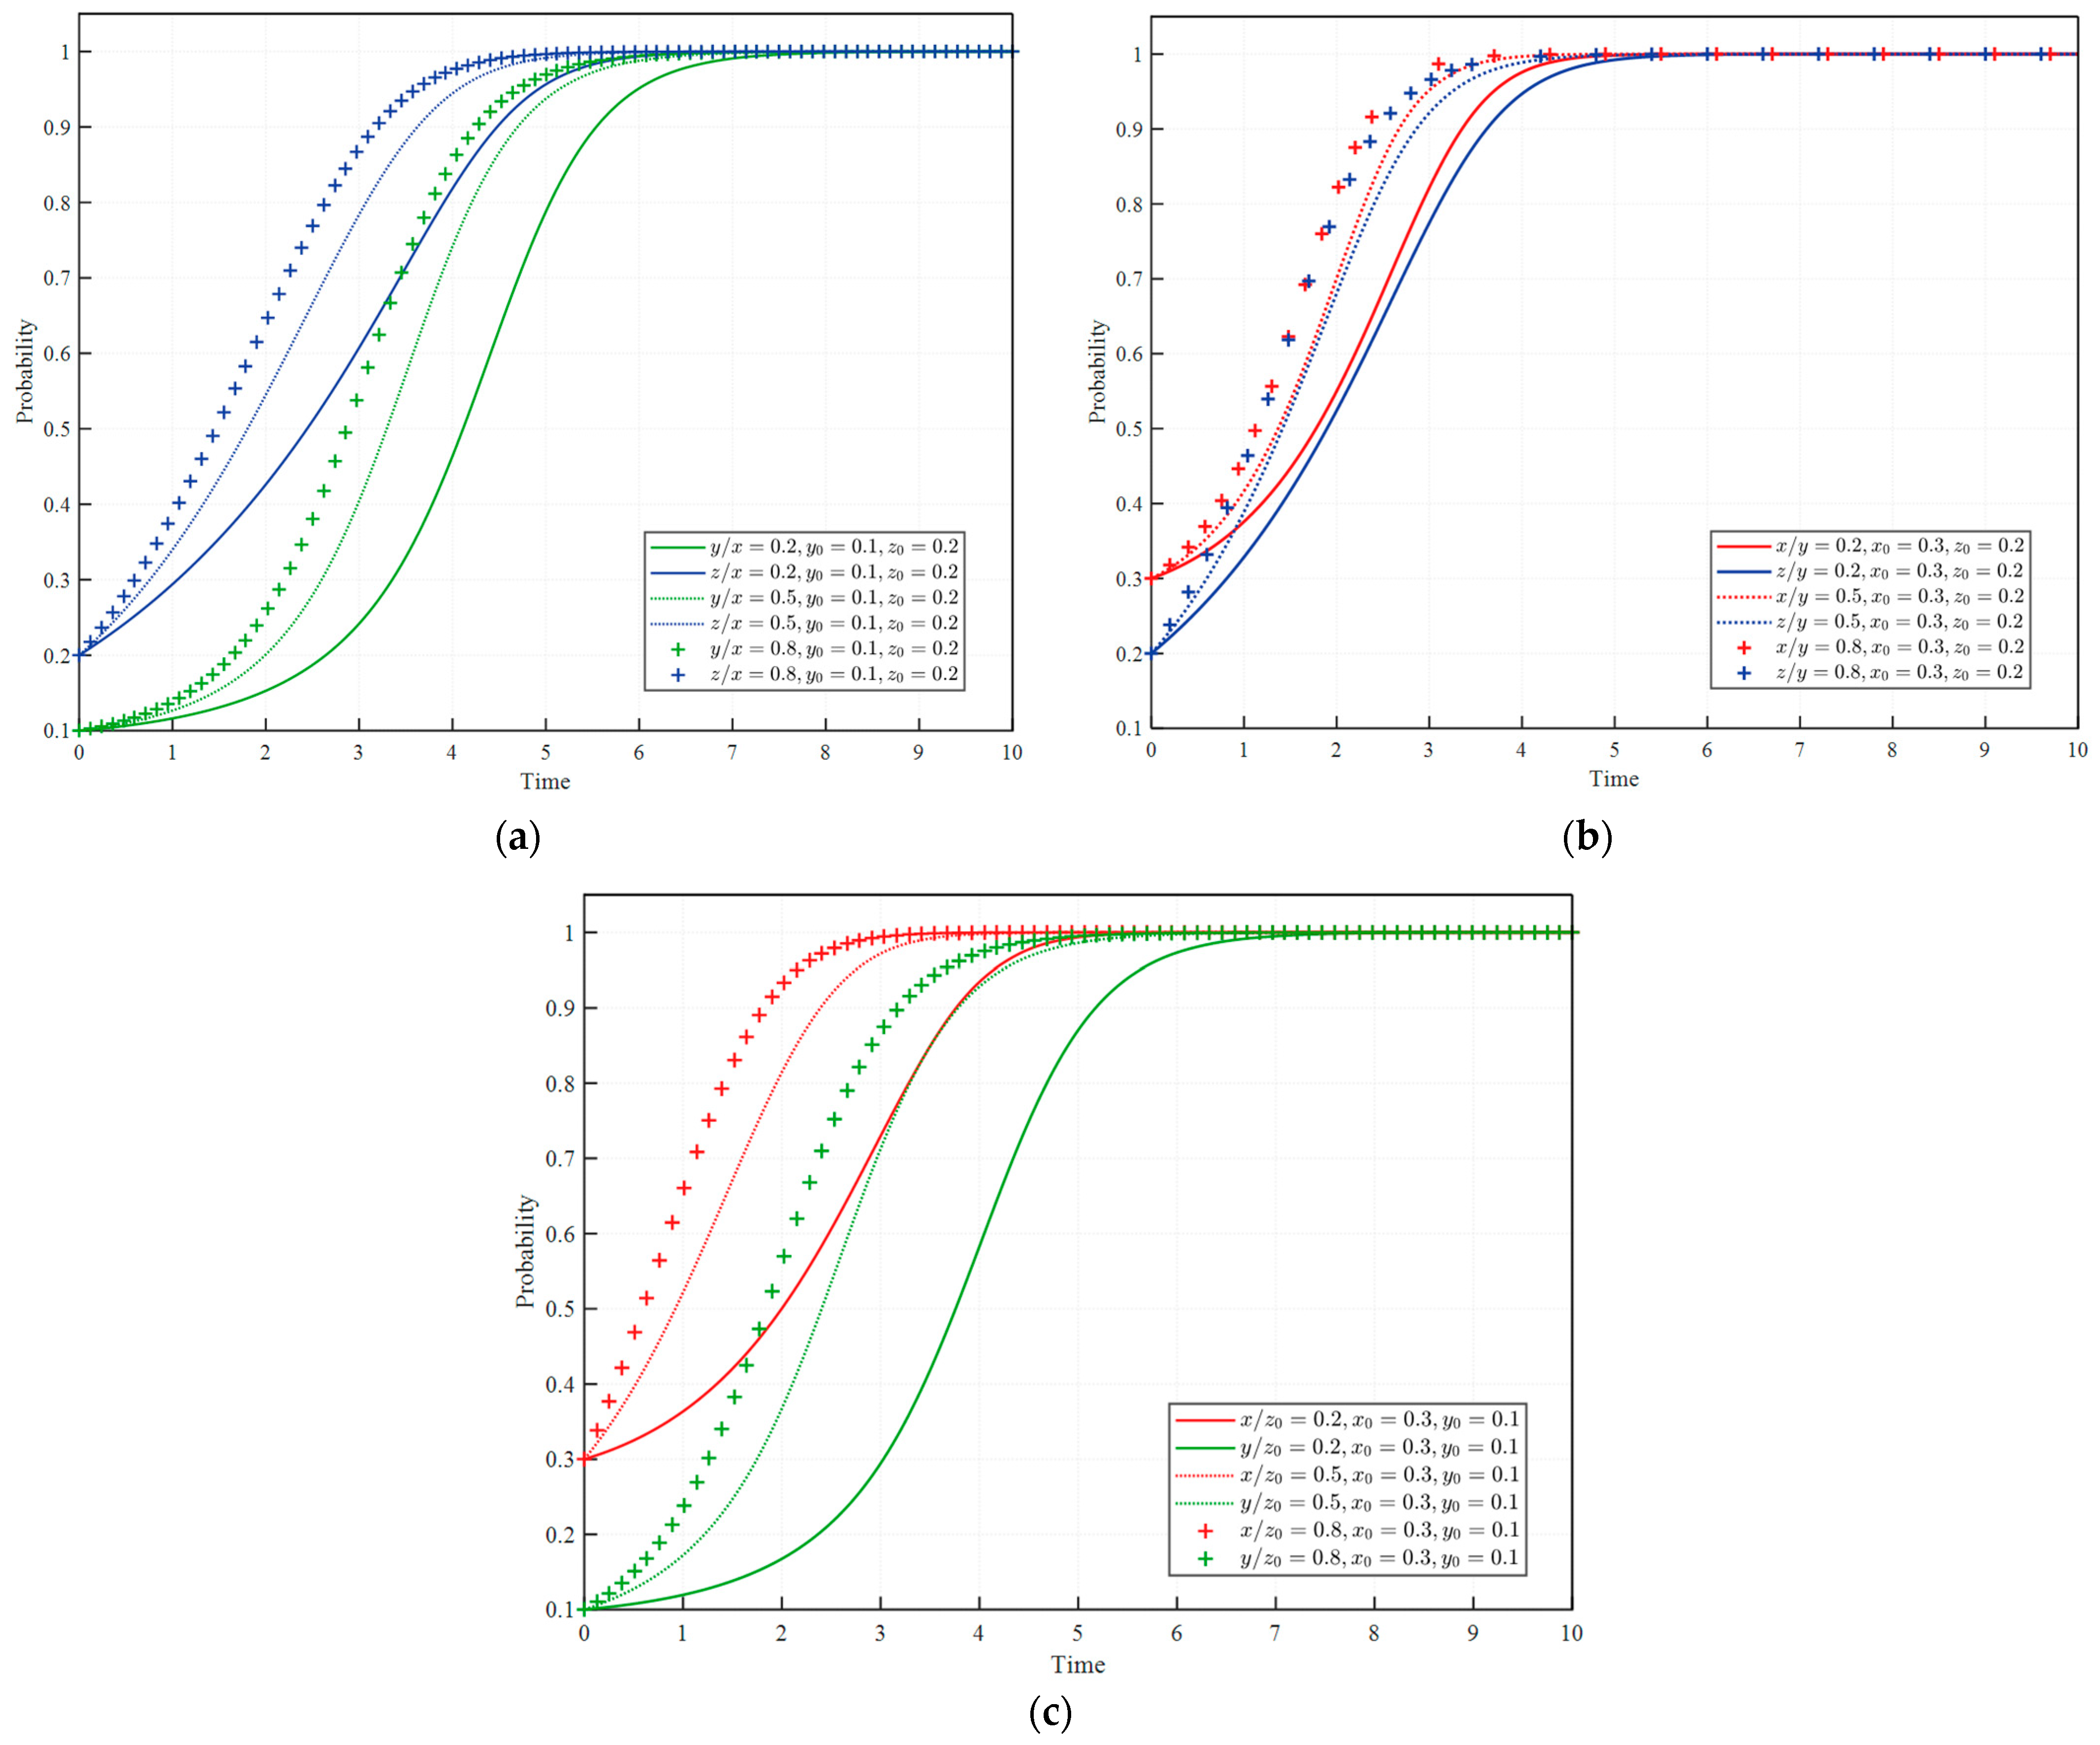
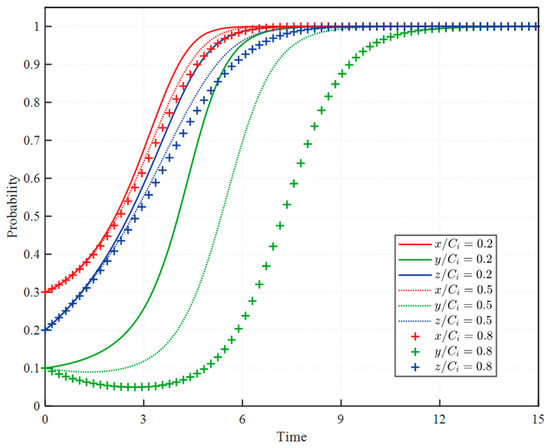
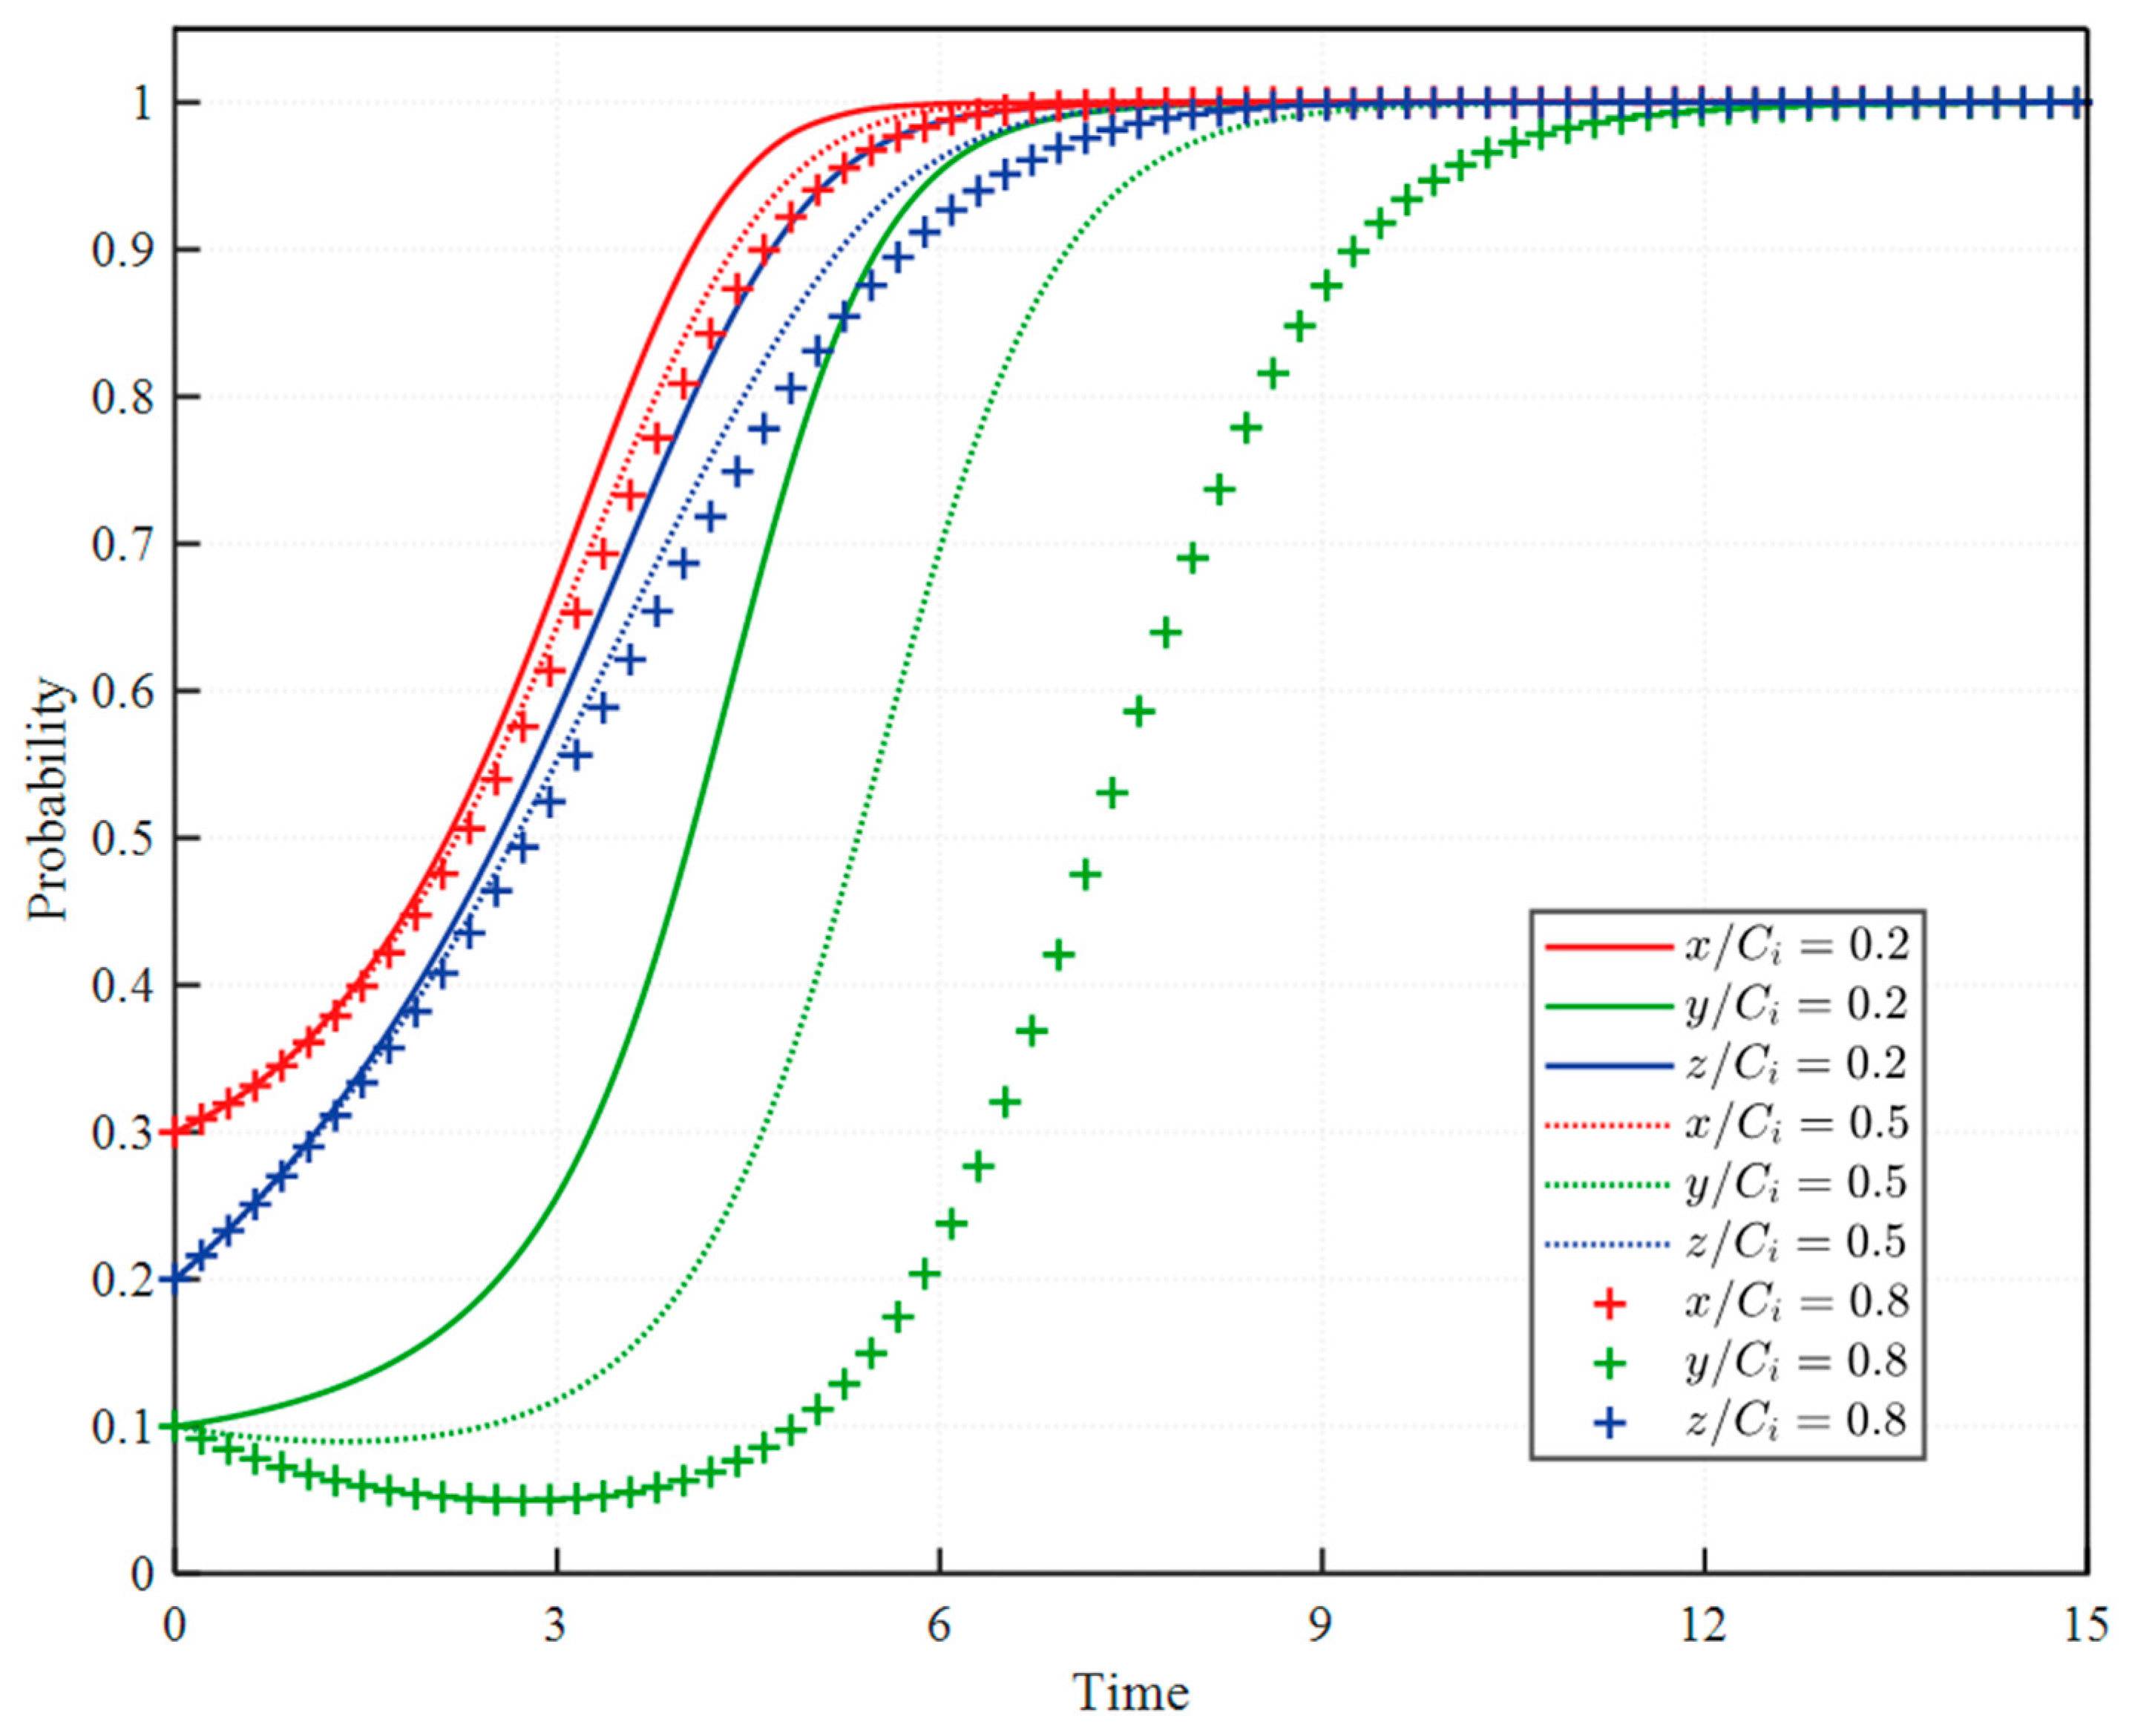
GBPI remains at the pilot stage in China, and the three stakeholders differ in their initial willingness to participate. The green building market is still developing, and green insurance services face insufficient demand from construction enterprises and limited supply from insurance companies [45]. Against this background, insurance companies face substantial uncertainty in product development and market promotion, resulting in the lowest initial willingness to provide GBPI. Construction enterprises benefit from government premium subsidies that reduce their insurance costs. Their initial willingness is therefore slightly higher than that of insurance companies. As the policymaker, the local government exhibits the highest initial willingness to promote GBPI among the three stakeholders. Therefore, the initial strategy probabilities of the three stakeholders are set to , , and , and numerical simulations are conducted using the parameter values specified in Section 4.1. For each stakeholder, its initial willingness to adopt the active strategy is set to a high (0.8), medium (0.5), or low (0.2) level to examine the resulting changes in the strategies of the other two stakeholders.
As shown in Figure 5, the model results indicate that stronger initial willingness of any one stakeholder to adopt its active strategy is associated with faster convergence of the other two stakeholders toward their respective active strategies. Changes in the initial willingness of individual stakeholders affect the evolutionary trajectories and convergence speeds of the system but do not alter the final stable equilibrium within the examined scenarios.
Figure 5.
Effects of each stakeholder’s initial willingness on the strategy evolution of the other two stakeholders. Baseline values are . In each panel, one stakeholder’s initial willingness is varied among 0.2, 0.5, and 0.8, while the other two remain at their baseline values: (a) Local government, ; (b) Insurance companies, ; (c) Construction enterprises, .
4.4. Effects of Key Parameters on Evolutionary Dynamics
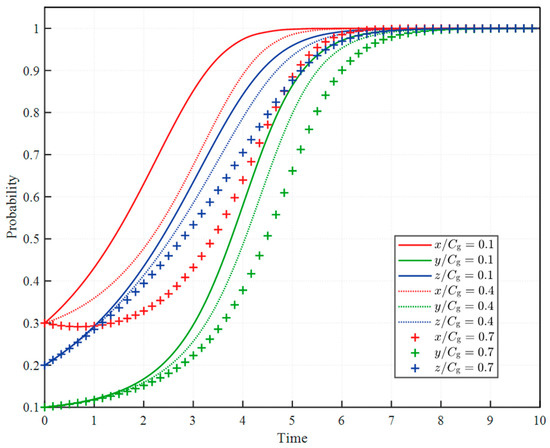
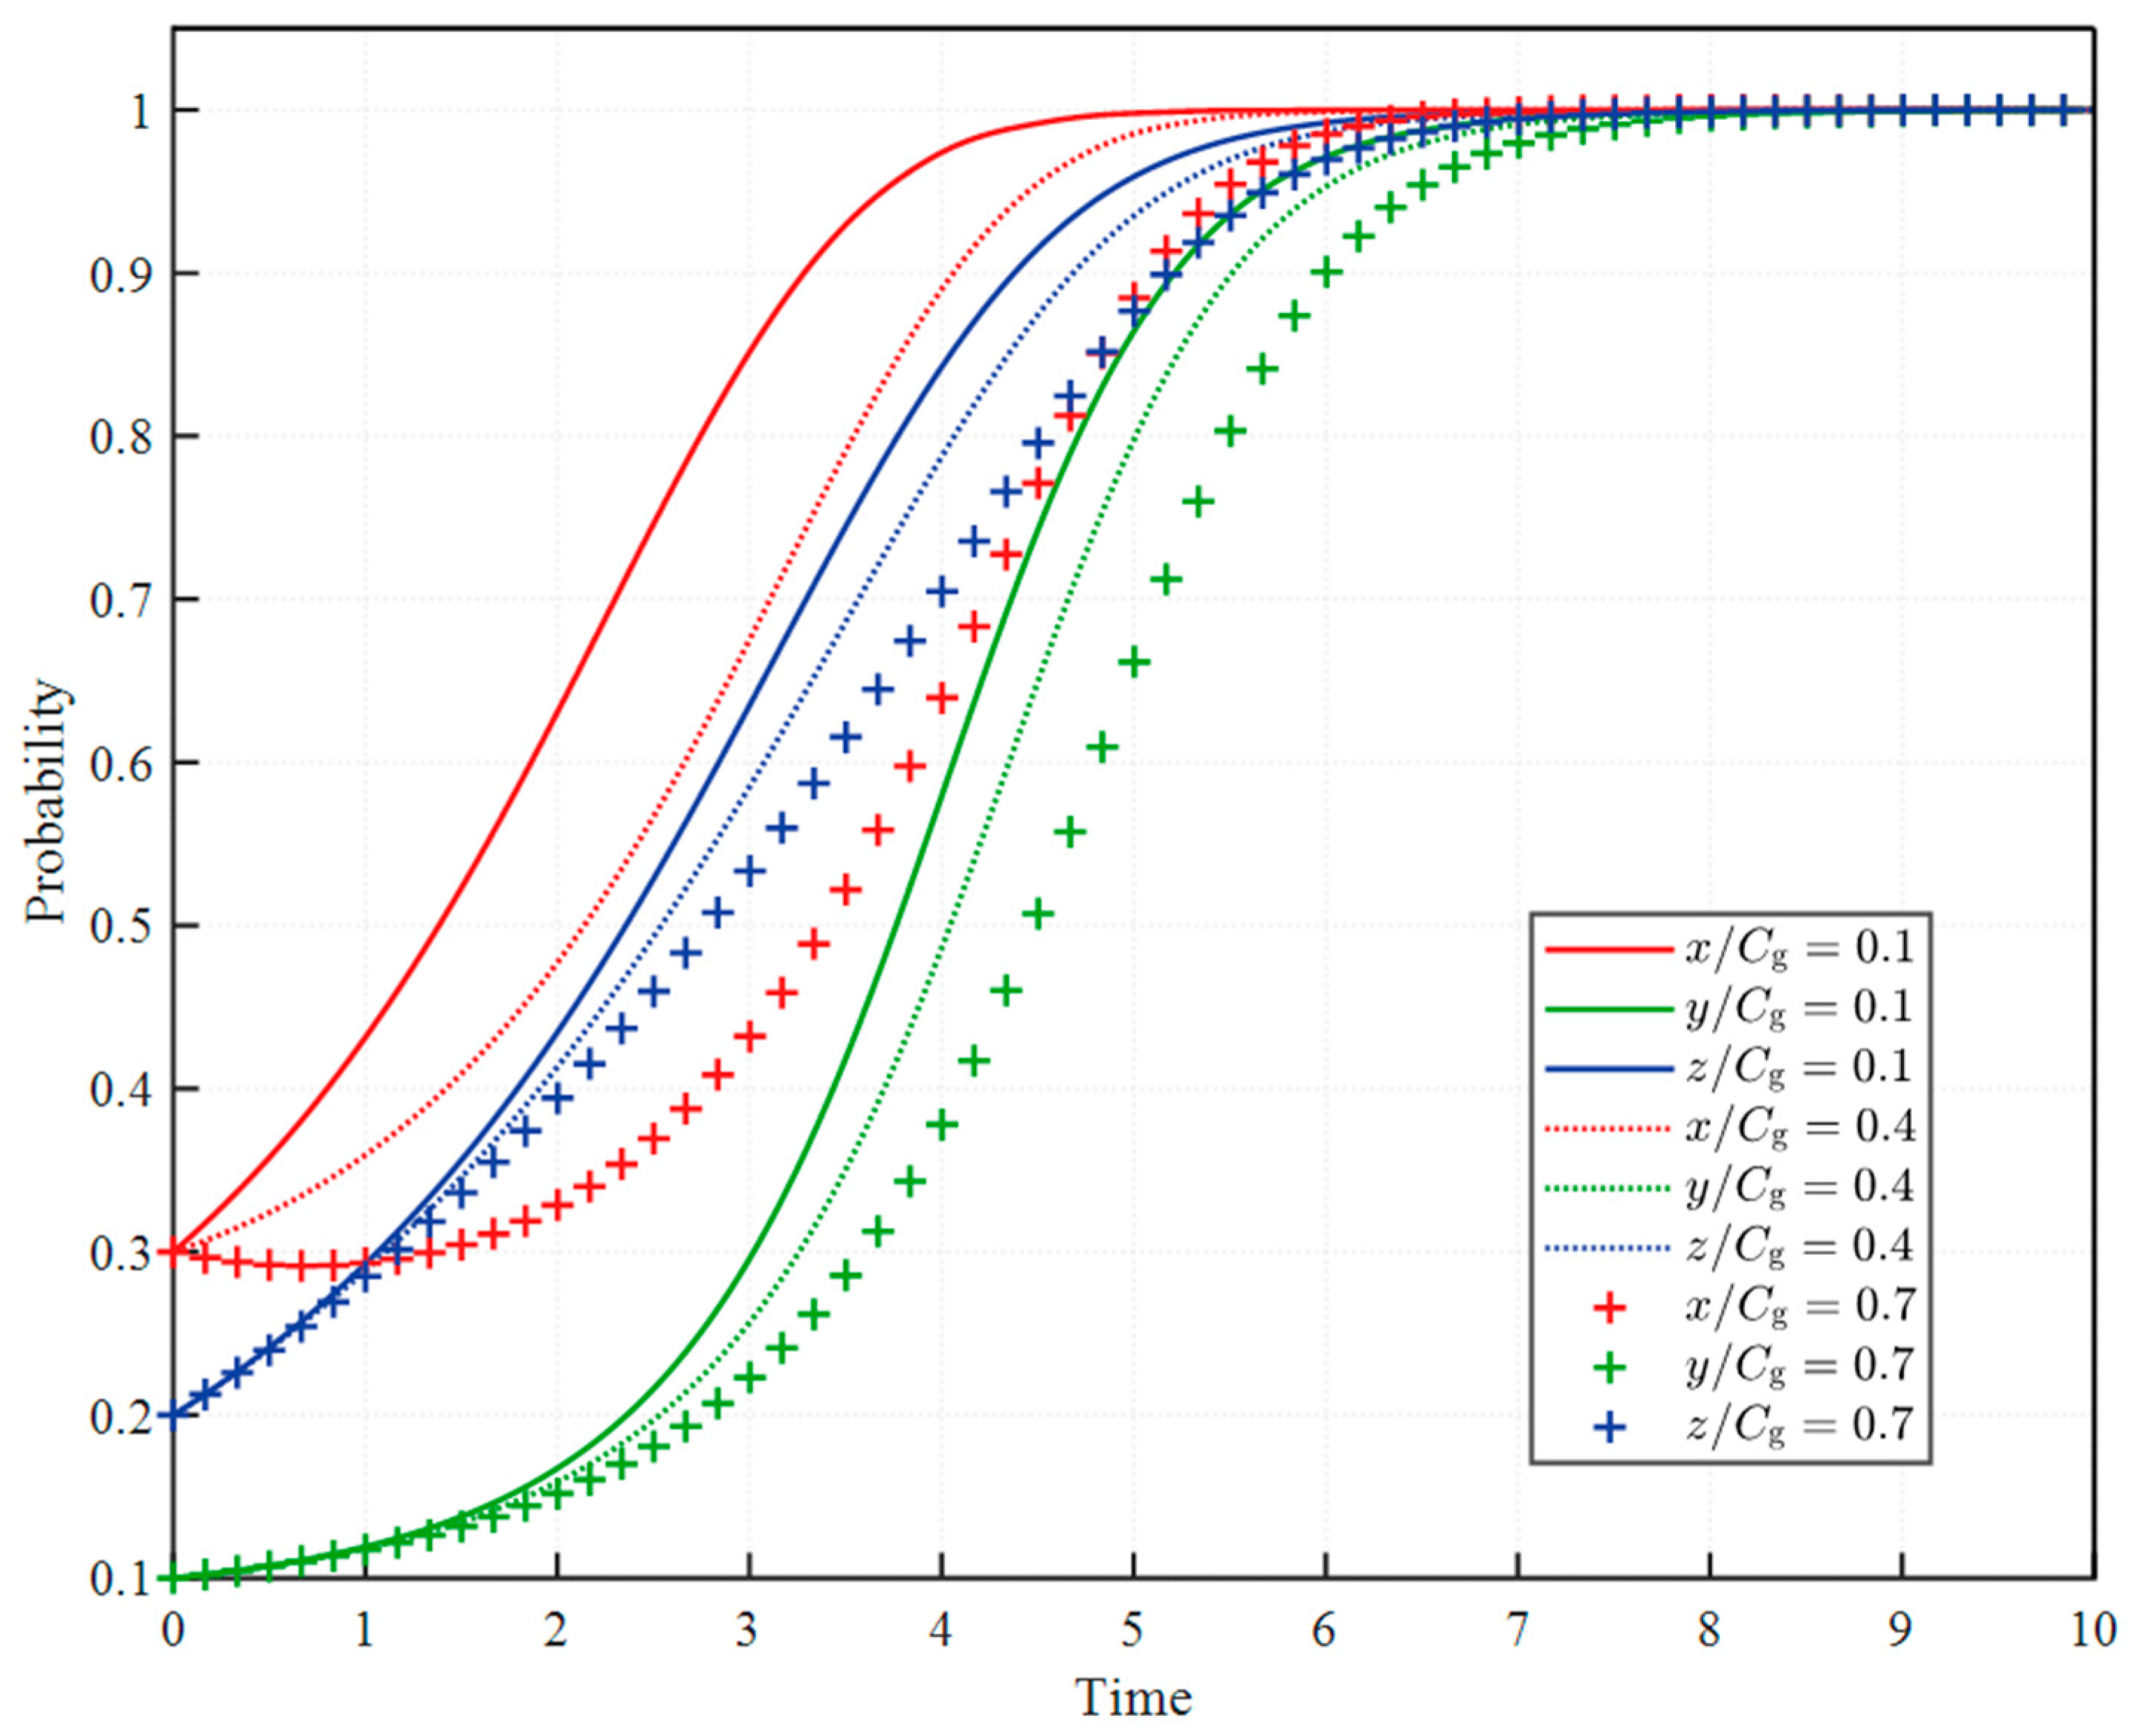
4.4.1. Effects of the Premium Subsidy Rate on the Evolutionary Dynamics of Insurance Companies and Construction Enterprises
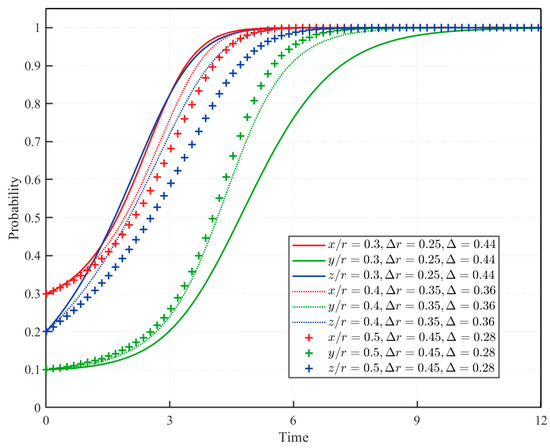
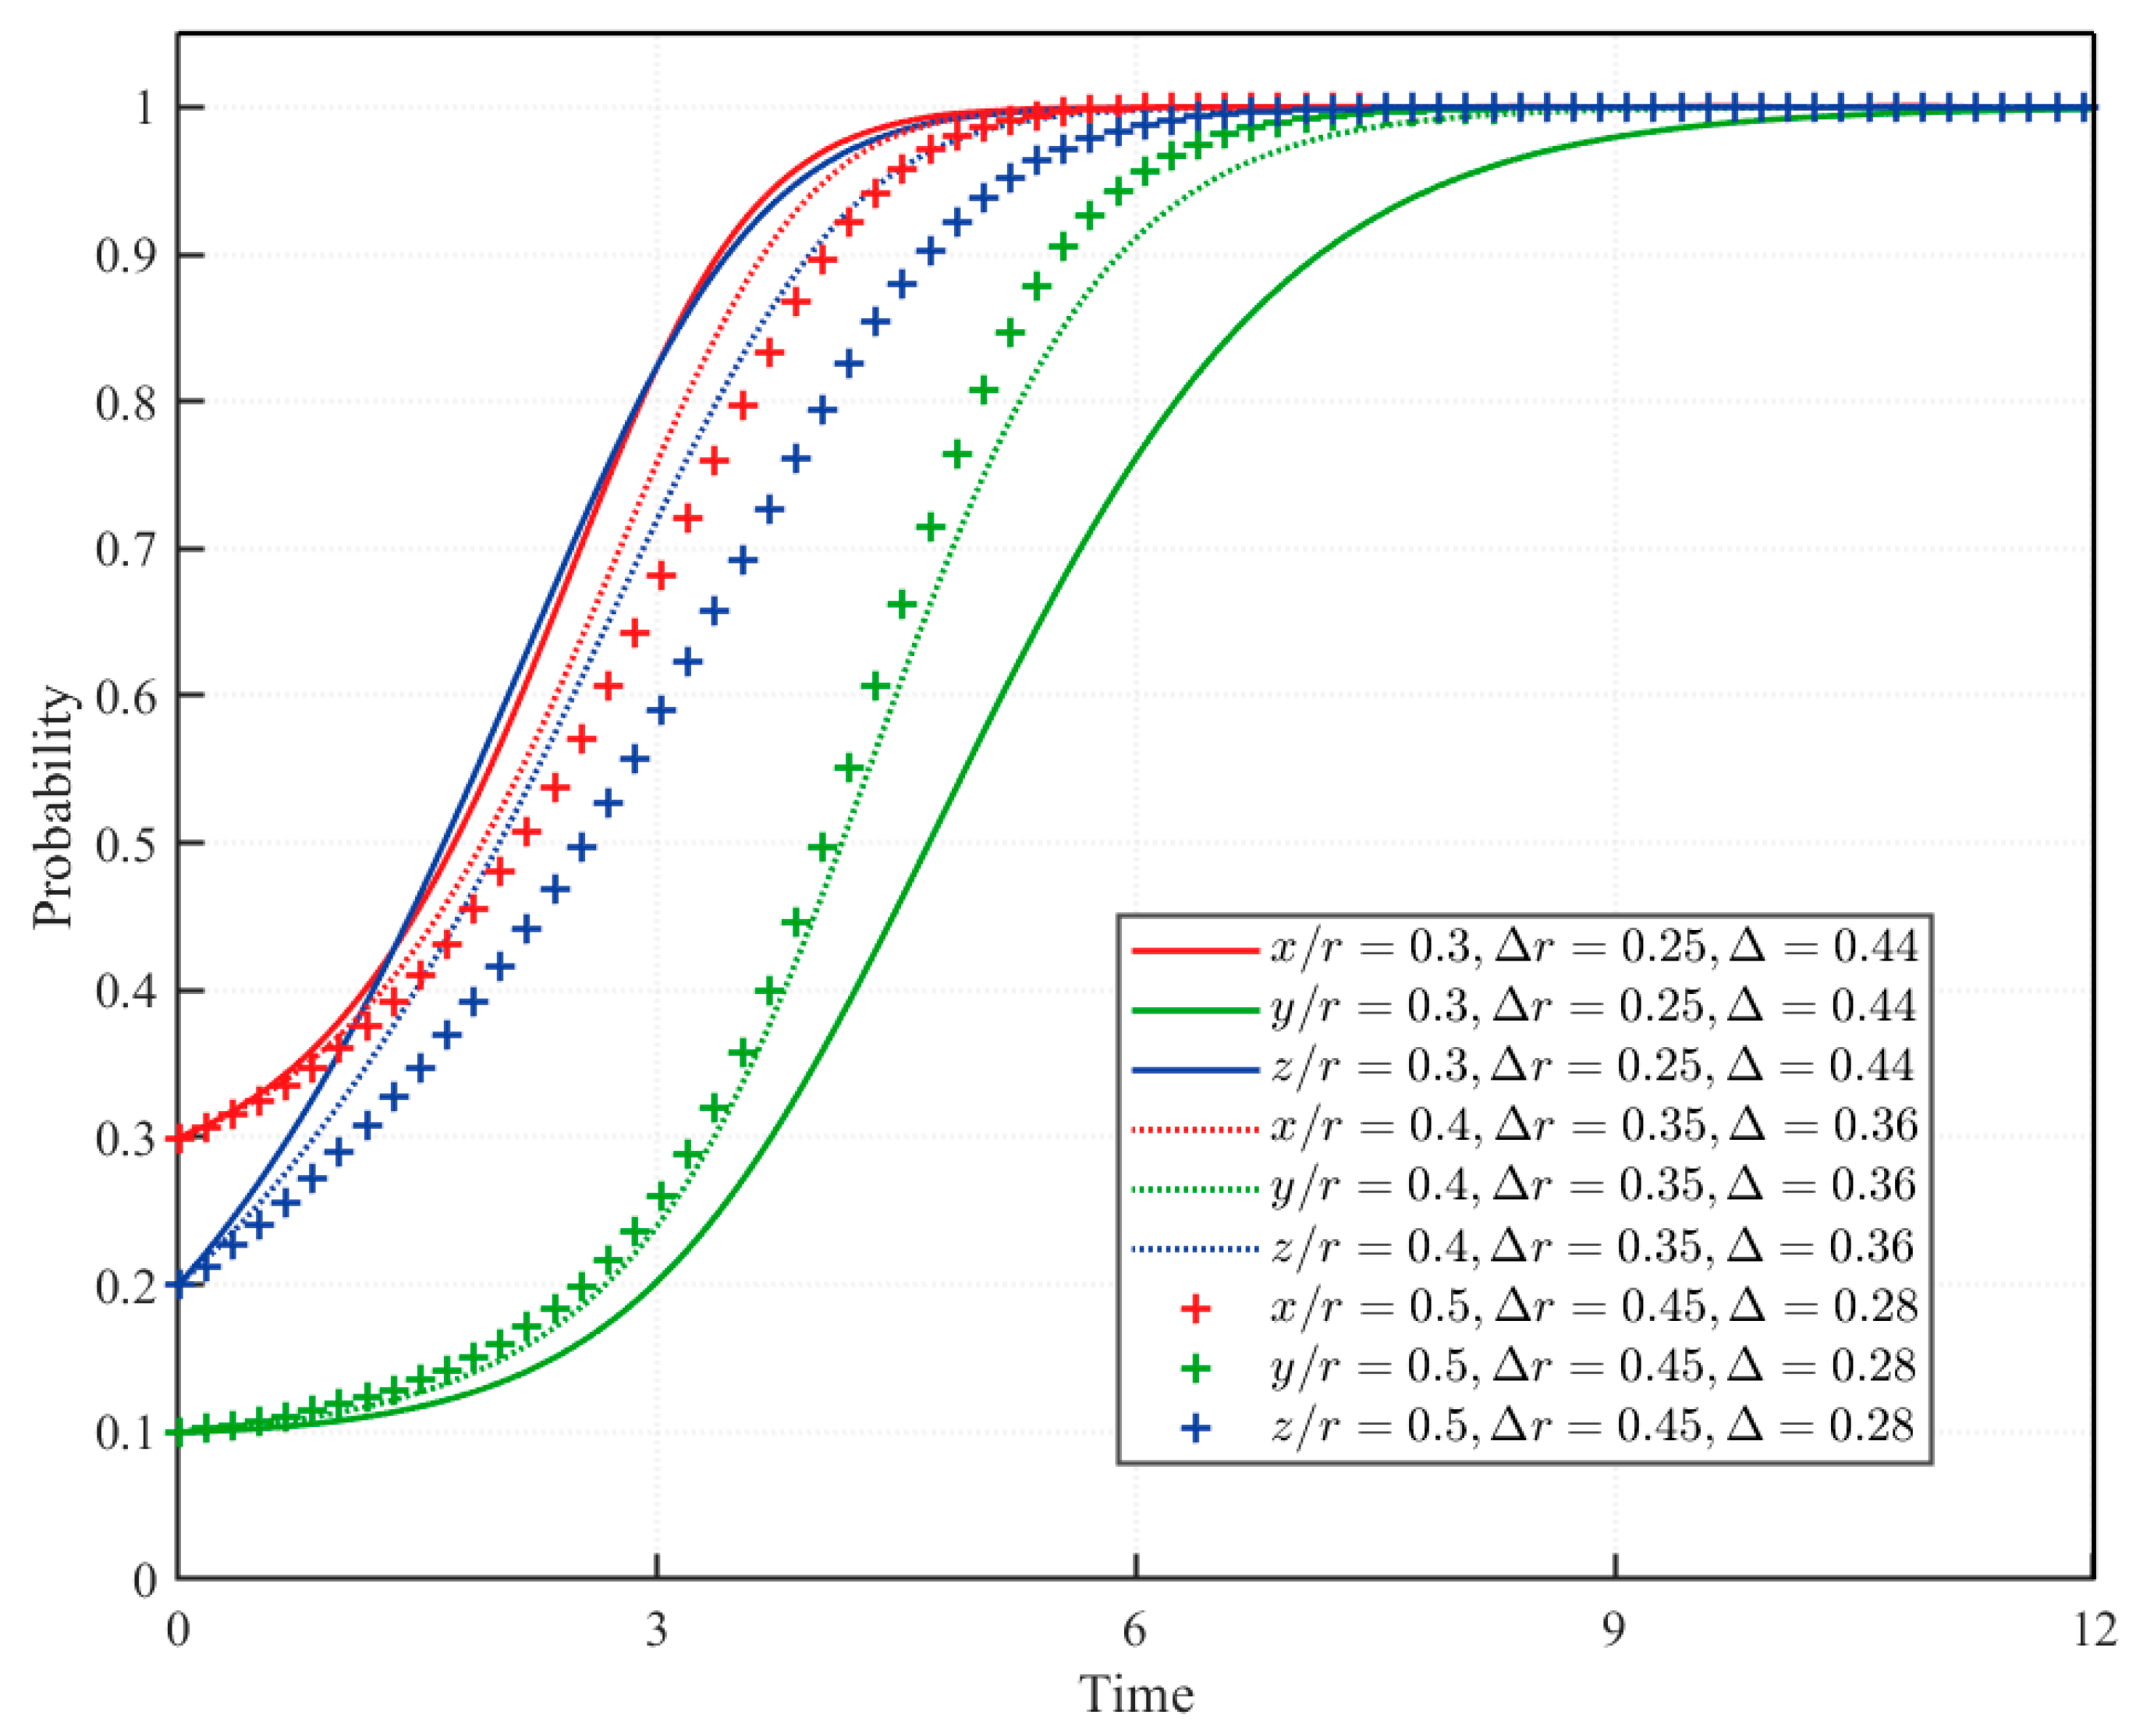
GBPI is currently being piloted at the local level, with the premium subsidy rate treated as an exogenous parameter. Its value is uniformly determined by the local government based on approvals from higher-level authorities, local green building development targets, and fiscal capacity. It is independent of the local government’s current promotion choice and serves as a predetermined condition for cost–benefit assessment and strategy selection. As changes, the construction enterprise’s net profit rate, , changes accordingly.
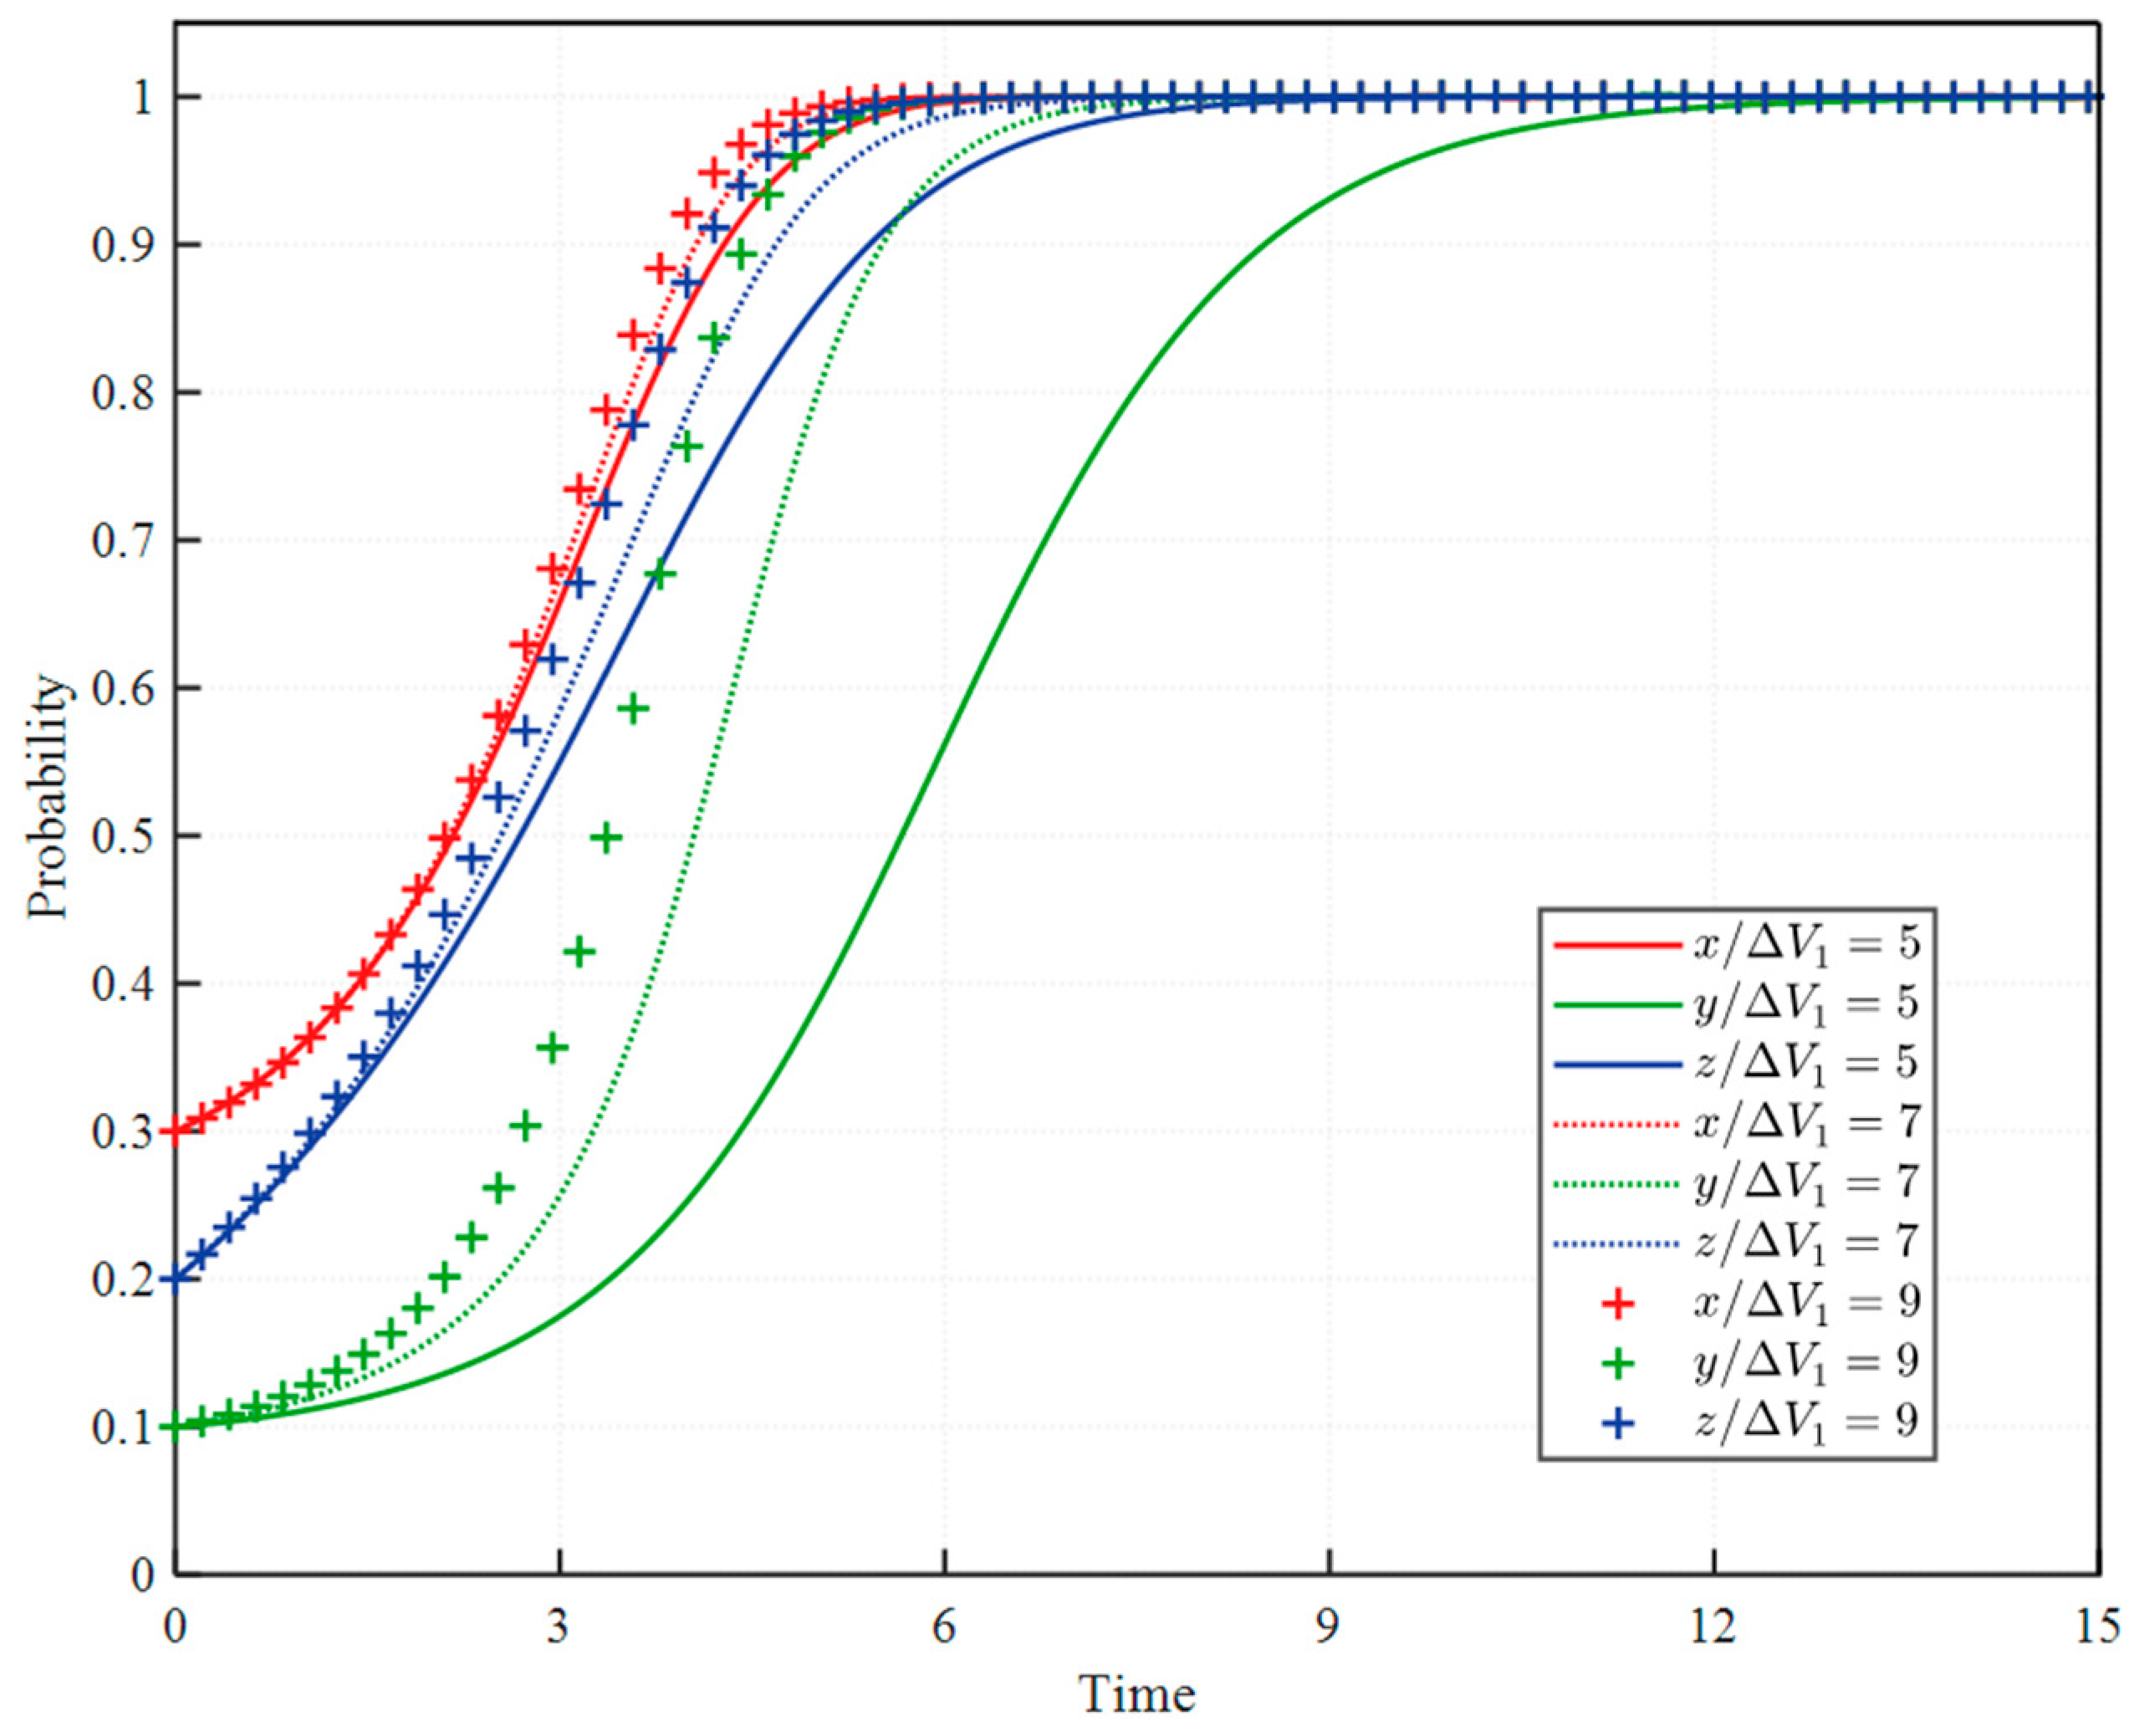
As shown in Figure 6, the model results indicate that higher values of are associated with faster convergence of all three stakeholders toward their respective active strategies, with more pronounced increases in convergence speed observed for construction enterprises and insurance companies. The final stable equilibrium remains unchanged. A higher premium subsidy rate is associated with a lower premium burden for construction enterprises. As increases, the construction enterprises’ net profit rate, , and corresponding net profits, , also increase, which is associated with a stronger incentive to purchase GBPI. Stronger willingness of construction enterprises to purchase GBPI is associated with more favorable payoff conditions for insurance companies and a stronger incentive to adopt the active provision strategy.
Figure 6.
Tripartite strategy evolution under different premium subsidy rates.
4.4.2. Effects of the Premium Subsidy Rate and Overall Benefits on the Local Government’s Evolutionary Dynamics
The local government’s net payoff is . To identify the direct effect of the premium subsidy rate on the local government’s evolutionary dynamics, this section establishes a controlled scenario. When varies, all other parameters are held constant, and the construction enterprise’s net profit rate, , is fixed at its baseline value. This setting isolates the indirect effect of on the local government through changes in the construction enterprise’s net profits and strategic choices, thereby allowing the direct effect of changes in the premium subsidy rate on the evolution of the local government’s strategy to be examined separately.
As shown in Figure 7a, when is increased incrementally from 0.1, the local government converges progressively more slowly toward the active promotion strategy, indicating a negative relationship between and the convergence speed. This variation affects convergence dynamics but does not alter the final equilibrium. The model results indicate that higher premium subsidy rates are associated with higher fiscal expenditure and lower payoff for the local government.
Figure 7.
Evolution of the local government’s strategy under different parameter values: (a) Effect of the premium subsidy rate; (b) Effect of the local government’s overall benefits.
Without additional benefits to offset the initial fiscal outlay, the local government’s incentive to sustain premium subsidies will weaken, making it difficult to continue incentivizing construction enterprises to purchase GBPI. Figure 7b shows the effect of on the local government’s evolutionary dynamics, with all other parameters held constant. represents the model-specific decision threshold at which the local government’s overall benefits equal the relevant costs and should not be interpreted as an empirically estimated economic threshold. When , the overall benefits are insufficient to offset the costs, and the local government ultimately converges toward the passive promotion strategy. When , the overall benefits are sufficient to offset the costs, and the local government ultimately converges toward the active promotion strategy. Thus, crossing the model-specific decision threshold changes the final equilibrium. Above the threshold, further increases in are mainly associated with faster convergence toward the active promotion strategy.
4.4.3. Effects of the Management Cost on Evolutionary Dynamics
As shown in Figure 8, the model results indicate that higher values of are associated with slower convergence of the local government, insurance companies, and construction enterprises toward their respective active strategies. This change in convergence speed is most pronounced for the local government, whereas the changes for insurance companies and construction enterprises are comparatively limited.
Figure 8.
Tripartite strategy evolution under different management costs.
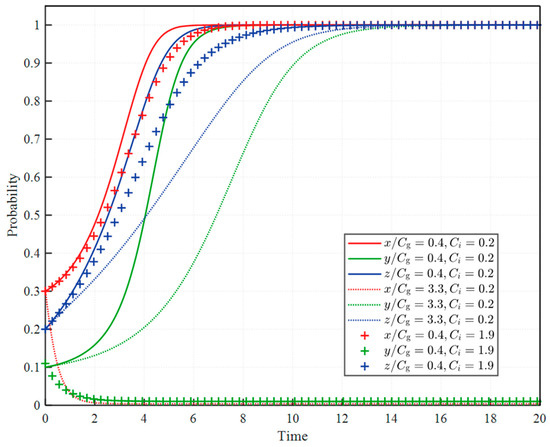
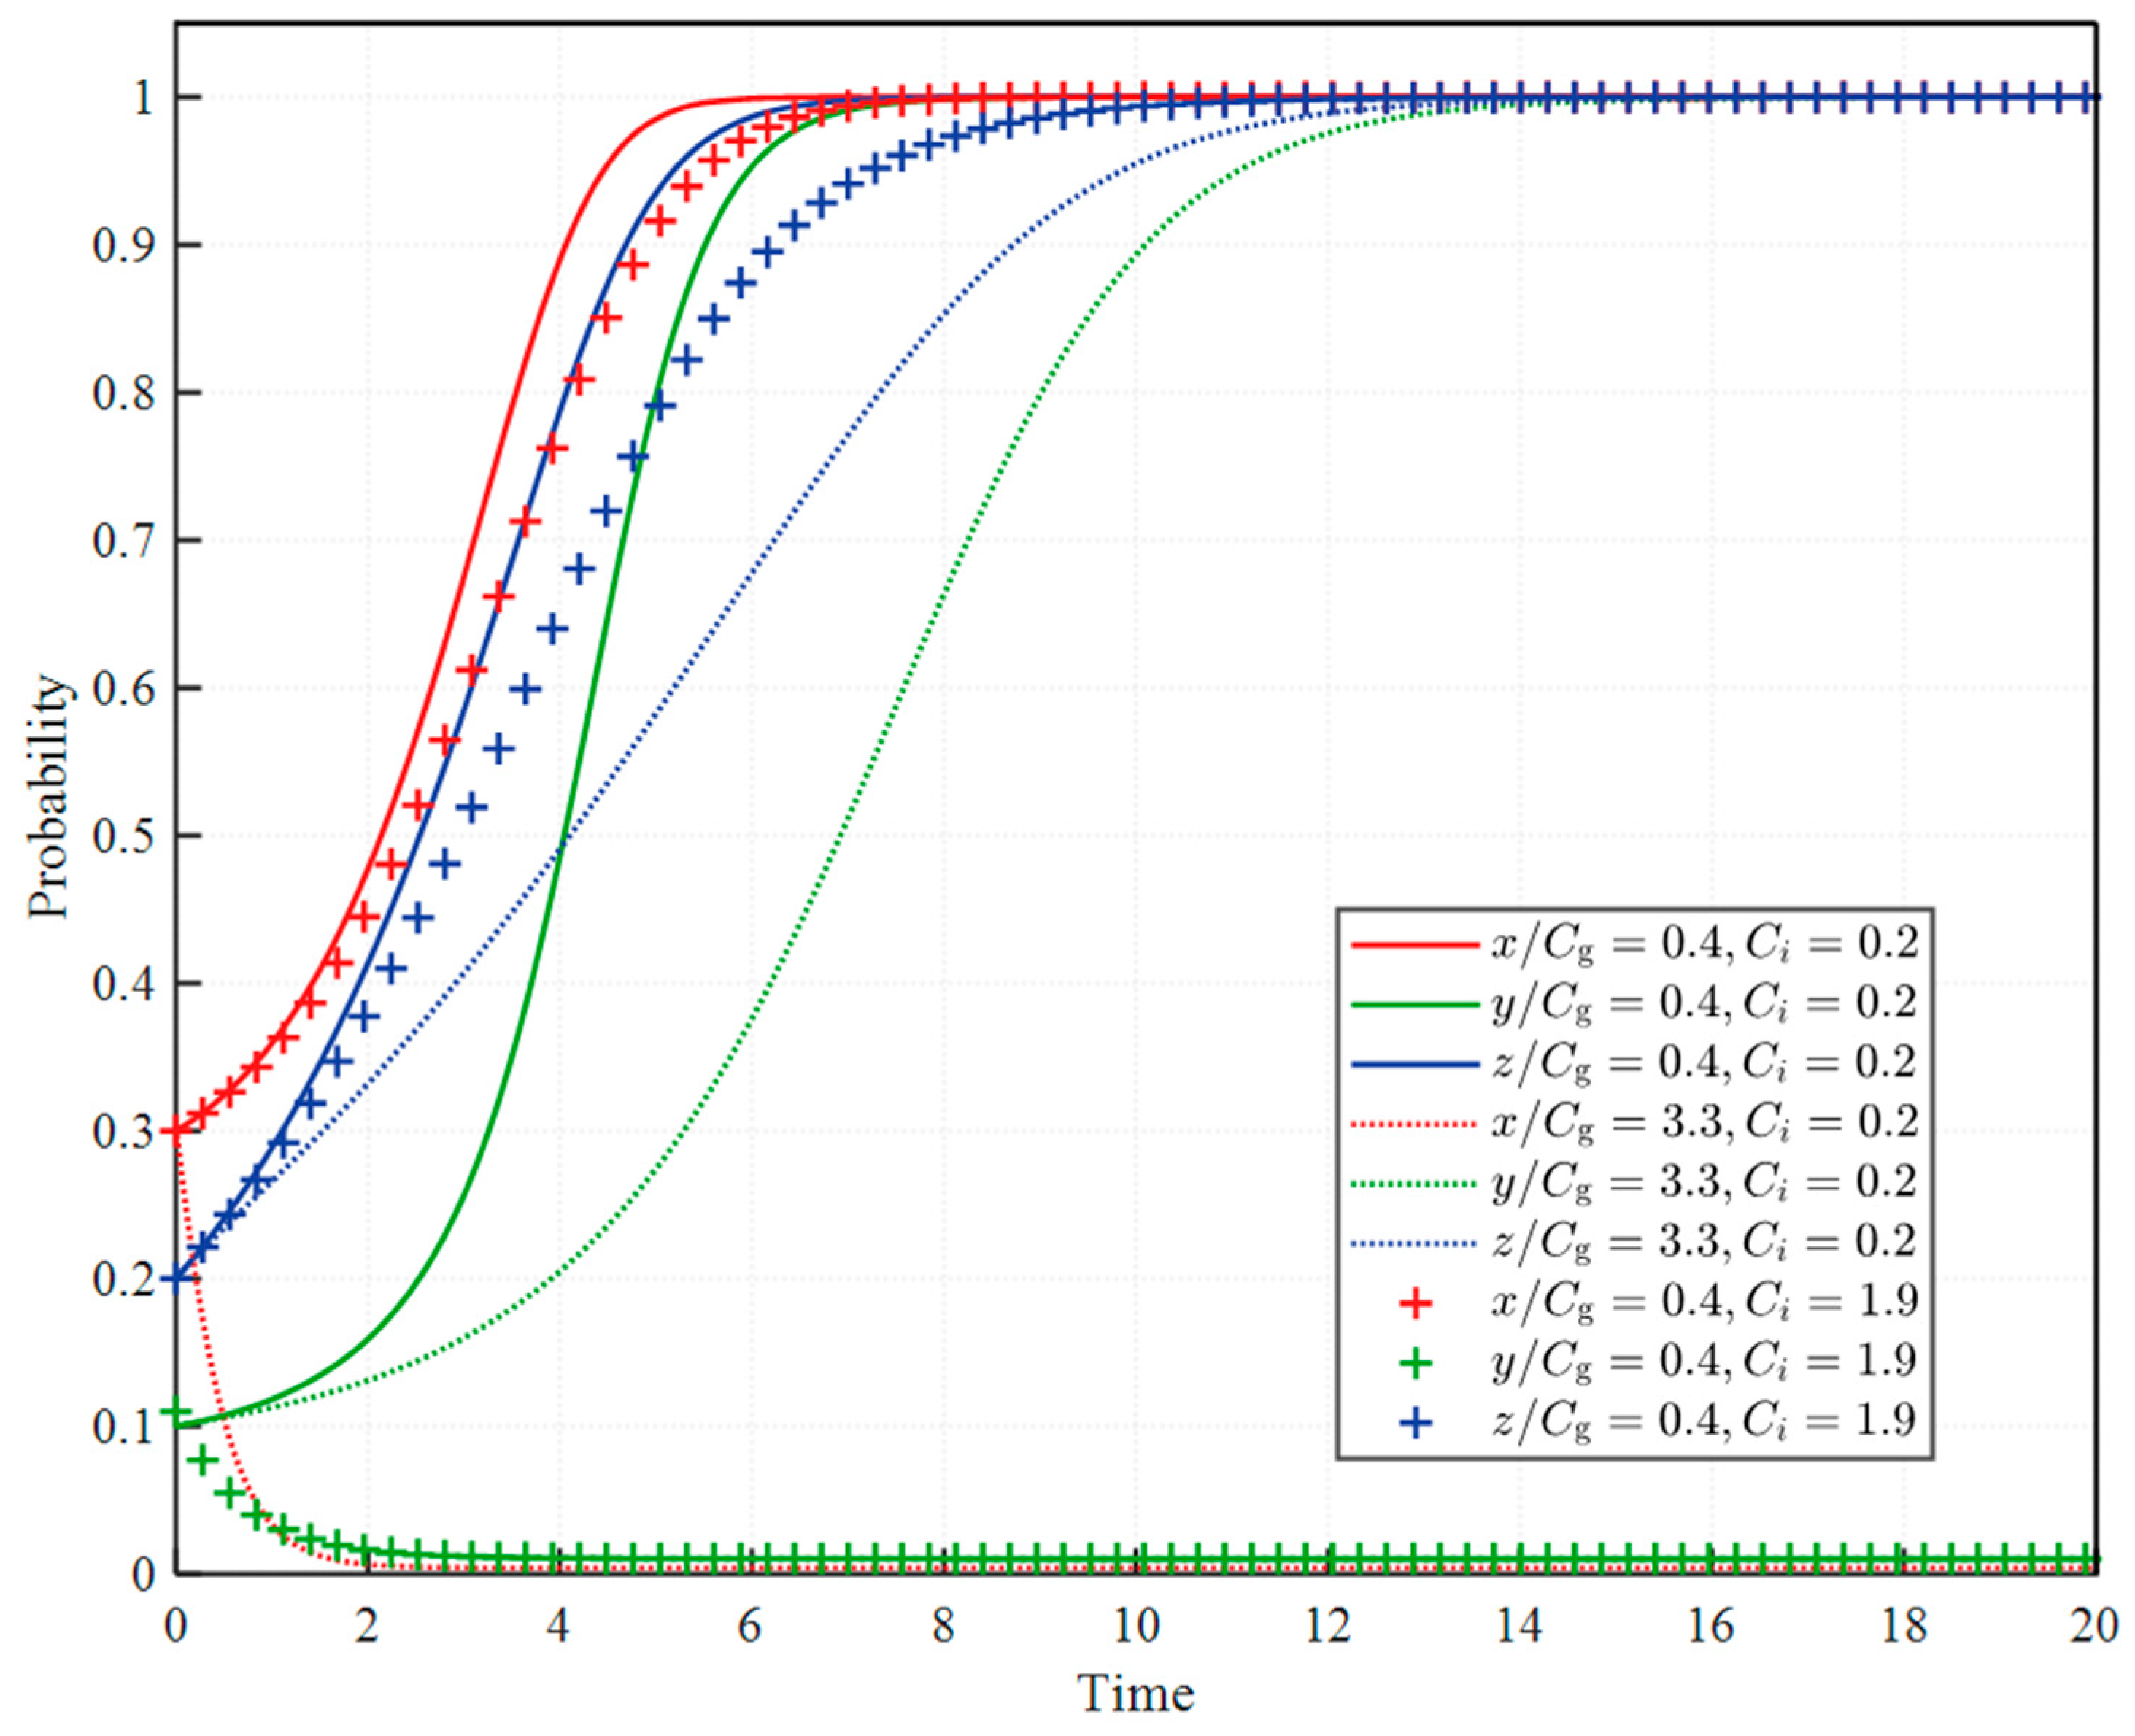
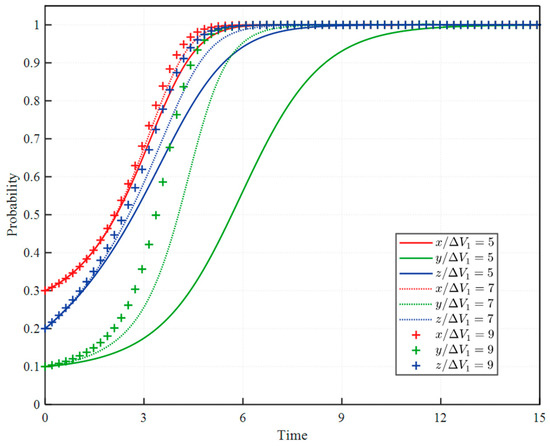
The model results in Figure 9 indicate that when reaches 3.3, the local government converges toward the passive promotion strategy. represents a model-specific decision threshold and should not be interpreted as an empirically estimated economic threshold. Below this threshold, higher values of are associated with slower convergence toward the stable equilibrium but do not alter the final stable equilibrium. When exceeds this threshold, the local government converges toward the passive promotion strategy, indicating a change in the final equilibrium.
Figure 9.
Tripartite strategy evolution beyond the cost threshold.
4.4.4. Effects of the Initial Fixed Cost on Evolutionary Dynamics
The model results indicate that higher values of are associated with slower convergence of insurance companies toward the active provision strategy, whereas the slowdown in convergence is comparatively modest for the local government and construction enterprises. Figure 10 shows that higher values of are associated with an initial decline followed by a subsequent rise in the probability that insurance companies will adopt the active provision strategy. The model results indicate that higher initial fixed costs are associated with a less favorable early-stage payoff for active provision, corresponding to a weaker incentive for insurance companies to adopt the active provision strategy. Stronger willingness among construction enterprises to purchase GBPI is associated with higher expected returns from insurance provision. These higher returns help offset insurance companies’ initial fixed costs and are associated with a subsequent rebound in the probability of active provision after its initial decline.
Figure 10.
Tripartite strategy evolution under different initial fixed costs.
The model results in Figure 9 indicate that when reaches 1.9, insurance companies converge toward the passive provision strategy. represents a model-specific decision threshold and should not be interpreted as an empirically estimated economic threshold. Below this threshold, higher values of are associated with slower convergence of insurance companies toward the active provision strategy but do not alter the final stable equilibrium. When reaches or exceeds this threshold, insurance companies converge toward the passive provision strategy, indicating a change in the final stable equilibrium.
4.4.5. Effects of the Actual Premium Rate on Evolutionary Dynamics
The insurance companies’ net margin from providing GBPI, , increases with , whereas the construction enterprises’ net profit rate from purchasing GBPI, , decreases with . As shown in Figure 11, the model results indicate that higher values of are associated with faster convergence of insurance companies toward the active provision strategy, whereas the local government and construction enterprises exhibit slower convergence toward their respective active strategies. The slowdown is more pronounced for construction enterprises. These changes in convergence speed do not alter the final stable equilibrium. A higher actual premium rate is associated with higher premium costs and a lower net profit rate for construction enterprises, corresponding to slower convergence toward the purchase strategy.
Figure 11.
Tripartite strategy evolution under different actual premium rates.
4.4.6. Effects of the Loan Increments on Evolutionary Dynamics
The model results in Figure 12 indicate that higher values of are associated with faster convergence of the three stakeholders toward their respective active strategies. The increase in convergence speed is most pronounced for insurance companies and comparatively modest for the local government and construction enterprises. These changes in convergence speed do not alter the final stable equilibrium. For the local government, , where represents the premium subsidy expenditure and constitutes an additional cost. Under the baseline parameter settings, the insurance companies’ net margin, , exceeds the construction enterprises’ net profit rate, . Accordingly, insurance companies exhibit a higher convergence speed than construction enterprises.
Figure 12.
Tripartite strategy evolution under different loan increments.
4.5. Uncertainty and Sensitivity Analysis
4.5.1. Monte Carlo Uncertainty Analysis
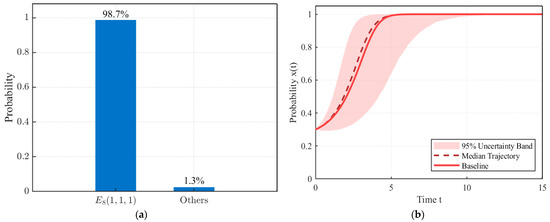
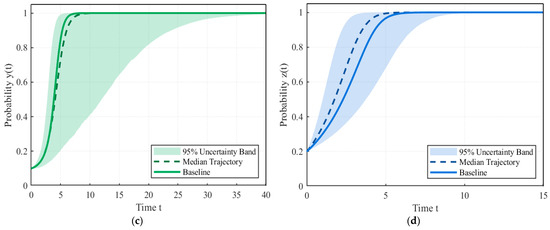
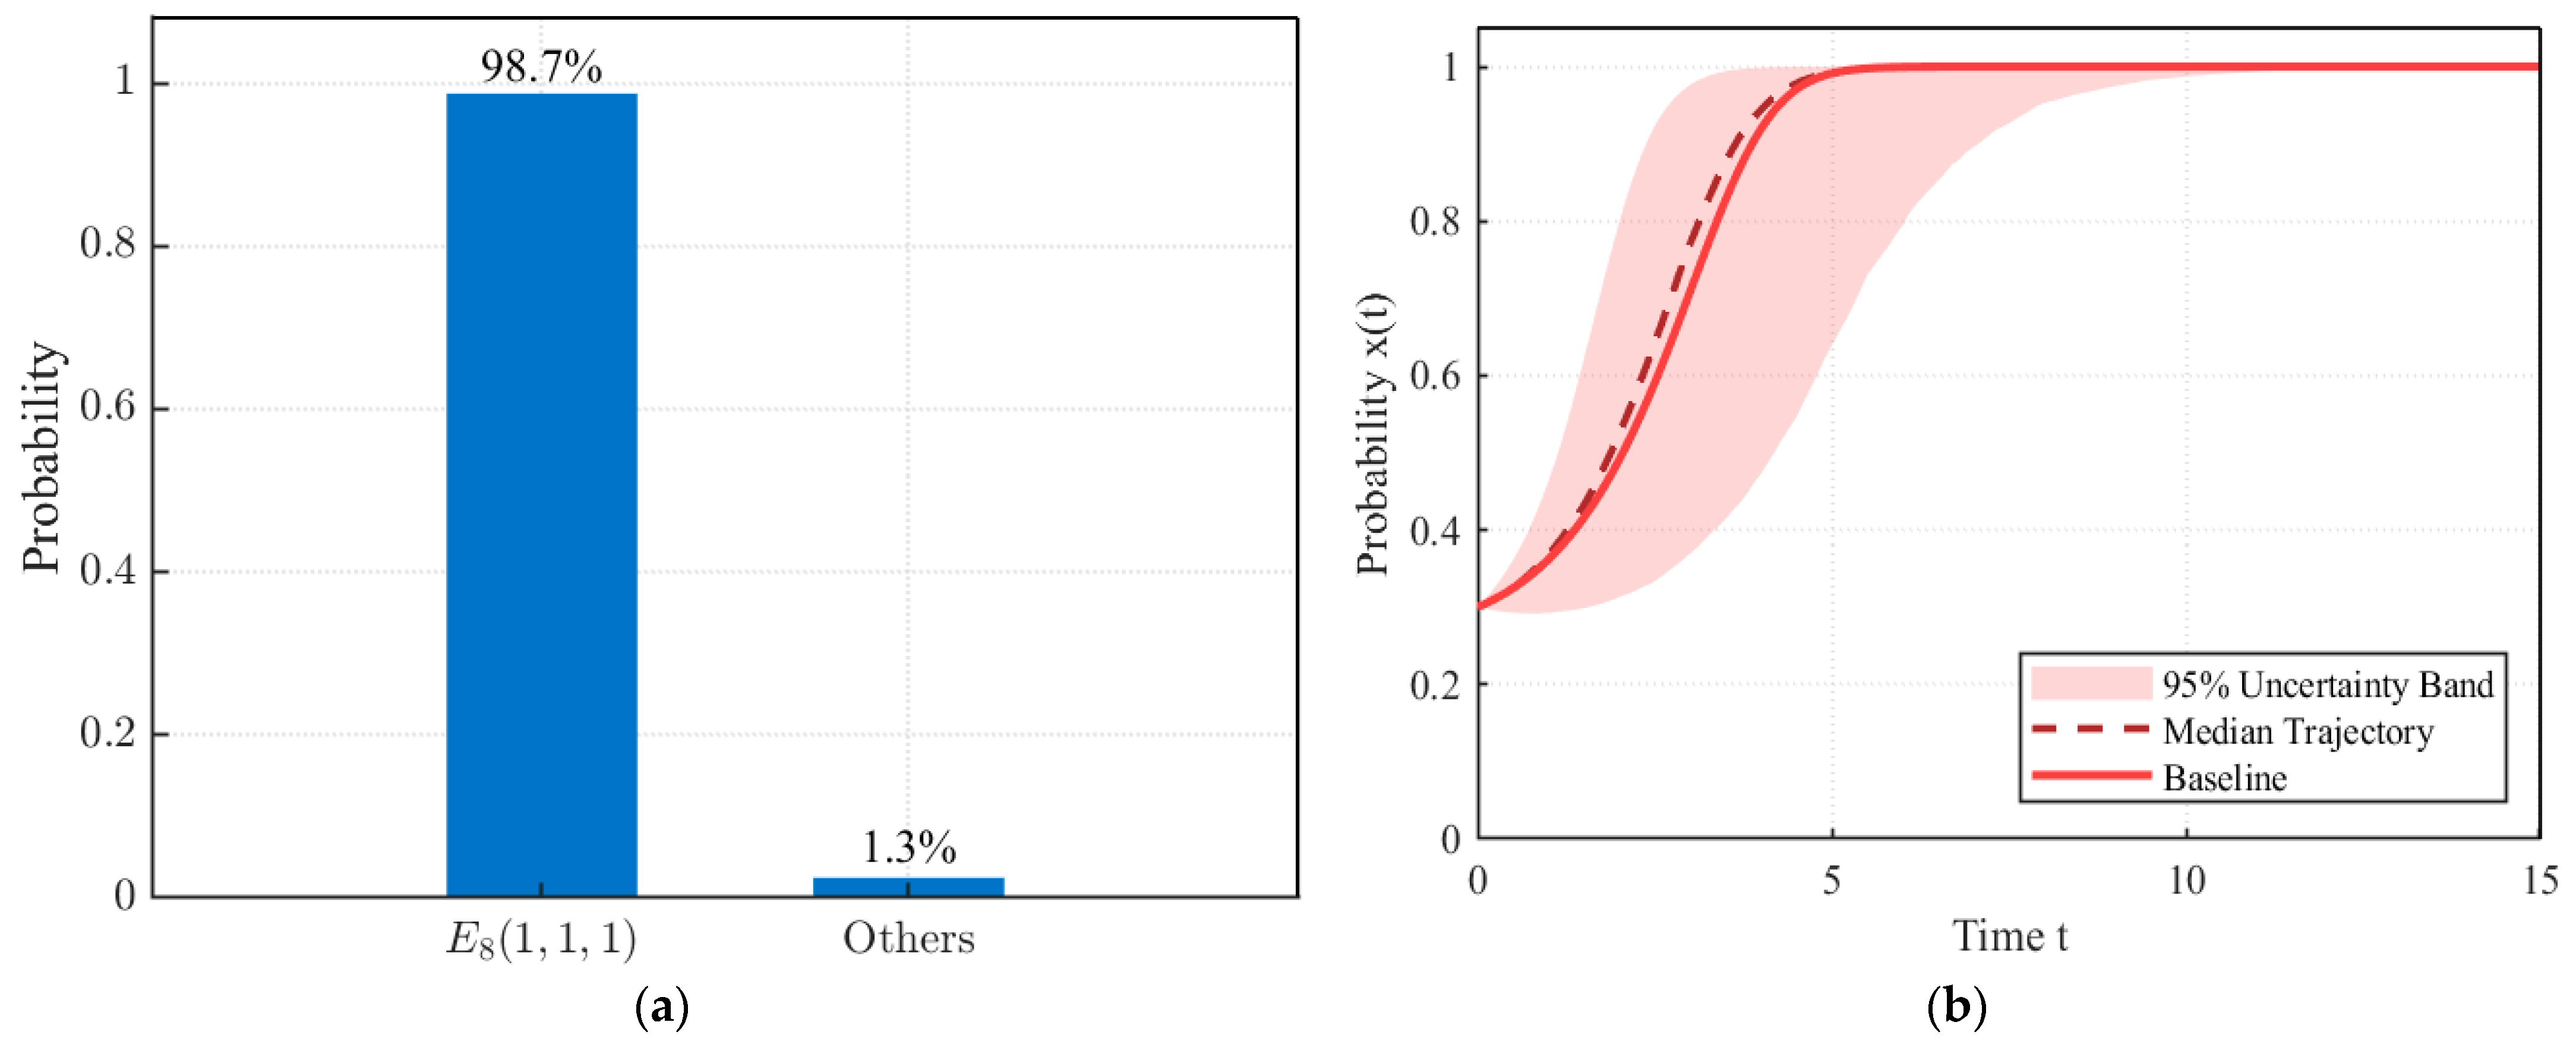
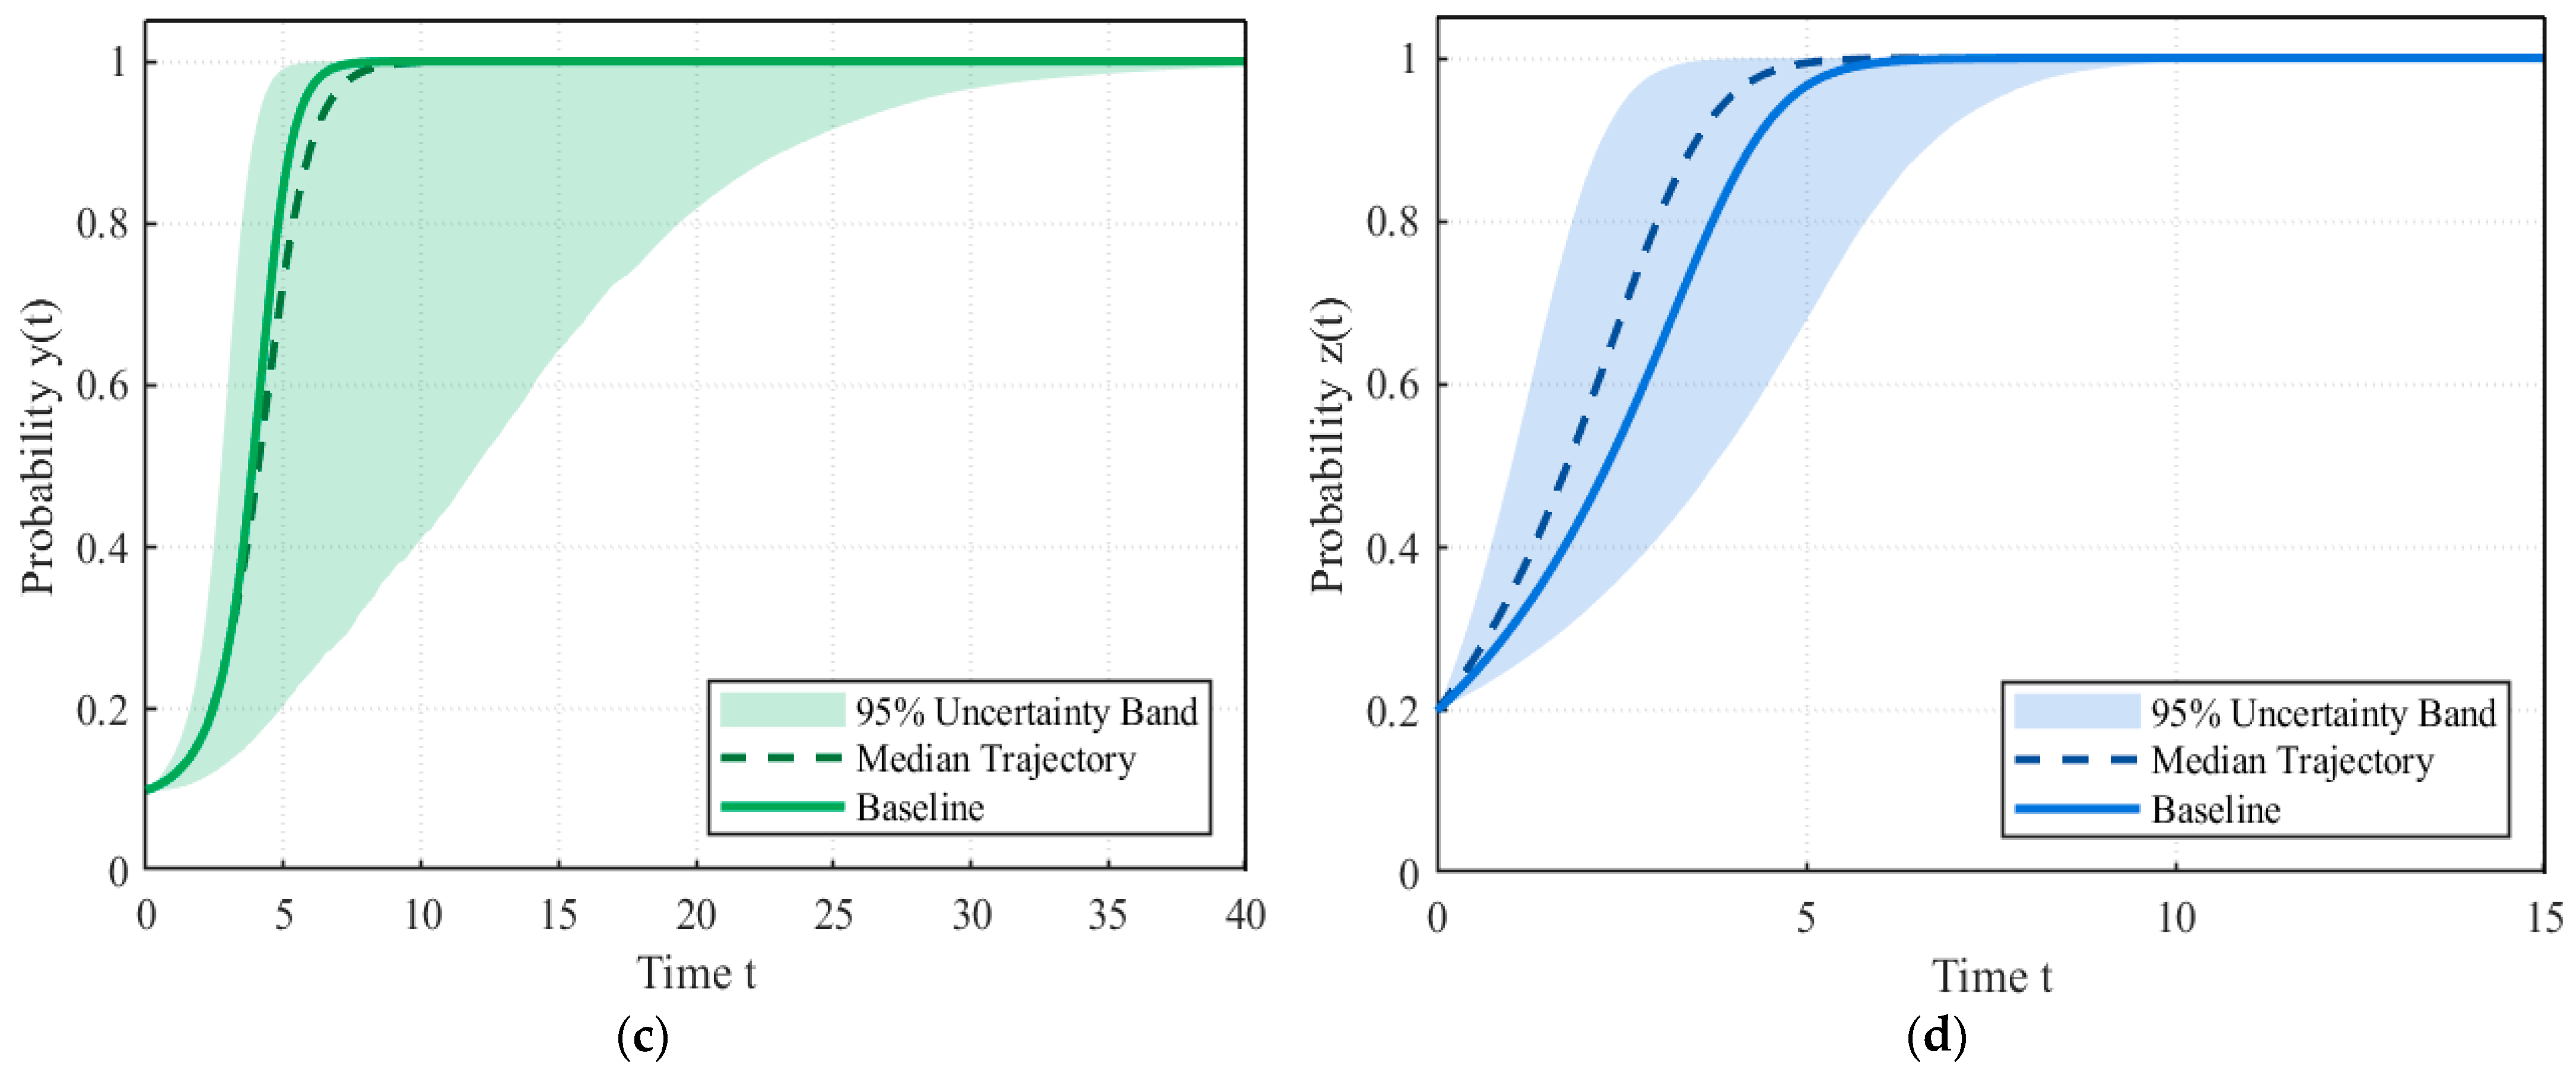
To assess the robustness of the main findings under parameter uncertainty, reasonable ranges for all parameters are determined based on policy documents, real-world cases, relevant studies, and expert assessments. Latin hypercube sampling is applied within these ranges to generate 5000 parameter combinations. Each parameter combination is substituted into Equations (10)–(12) for Monte Carlo simulation. Each simulation produces complete dynamic trajectories for the local government, insurance companies, and construction enterprises. The 5000 simulations therefore yield 5000 final equilibrium outcomes and 5000 sets of and trajectories. To characterize the distribution of these trajectories under parameter uncertainty, the median and the 2.5th and 97.5th percentiles are calculated at each time point, yielding the median trajectories and 95% uncertainty bands.
As shown in Figure 13a, 98.7% of the 5000 simulations ultimately converge to , while only 1.3% converge to other states. This result indicates that, within the selected parameter ranges and under the assumed payoff structure, is a robust convergence outcome of the model under joint parameter variation. This finding is model-based and should not be interpreted as empirical confirmation of actual GBPI market outcomes. Figure 13b–d show that the median trajectories of the local government, insurance companies, and construction enterprises follow the same overall evolutionary direction as the baseline trajectories. They ultimately converge toward their respective active strategies. Among the three stakeholders, insurance companies exhibit a markedly wider uncertainty band and slower convergence, indicating greater sensitivity of their convergence dynamics to parameter uncertainty. Overall, parameter uncertainty primarily affects the evolutionary trajectories and convergence speed, whereas remains the dominant final equilibrium within the examined parameter ranges. These results further support the robustness of the model-based evolutionary outcomes.
Figure 13.
Monte Carlo robustness analysis under parameter uncertainty: (a) Distribution of final equilibrium outcomes; (b) Local government; (c) Insurance companies; (d) Construction enterprises. Solid lines represent baseline trajectories, dashed lines represent median trajectories, and shaded areas represent 95% uncertainty bands.
4.5.2. Sobol Sensitivity Analysis
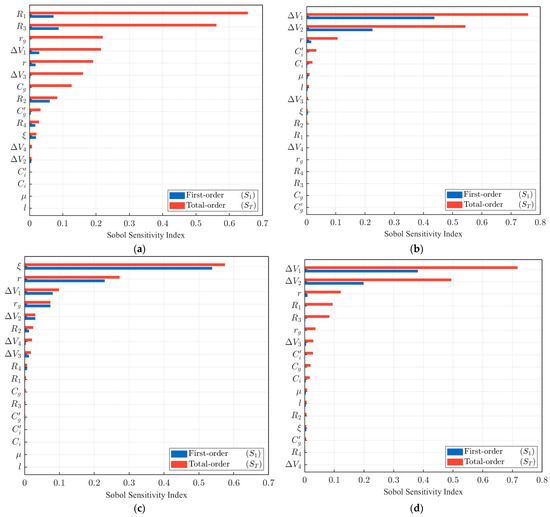
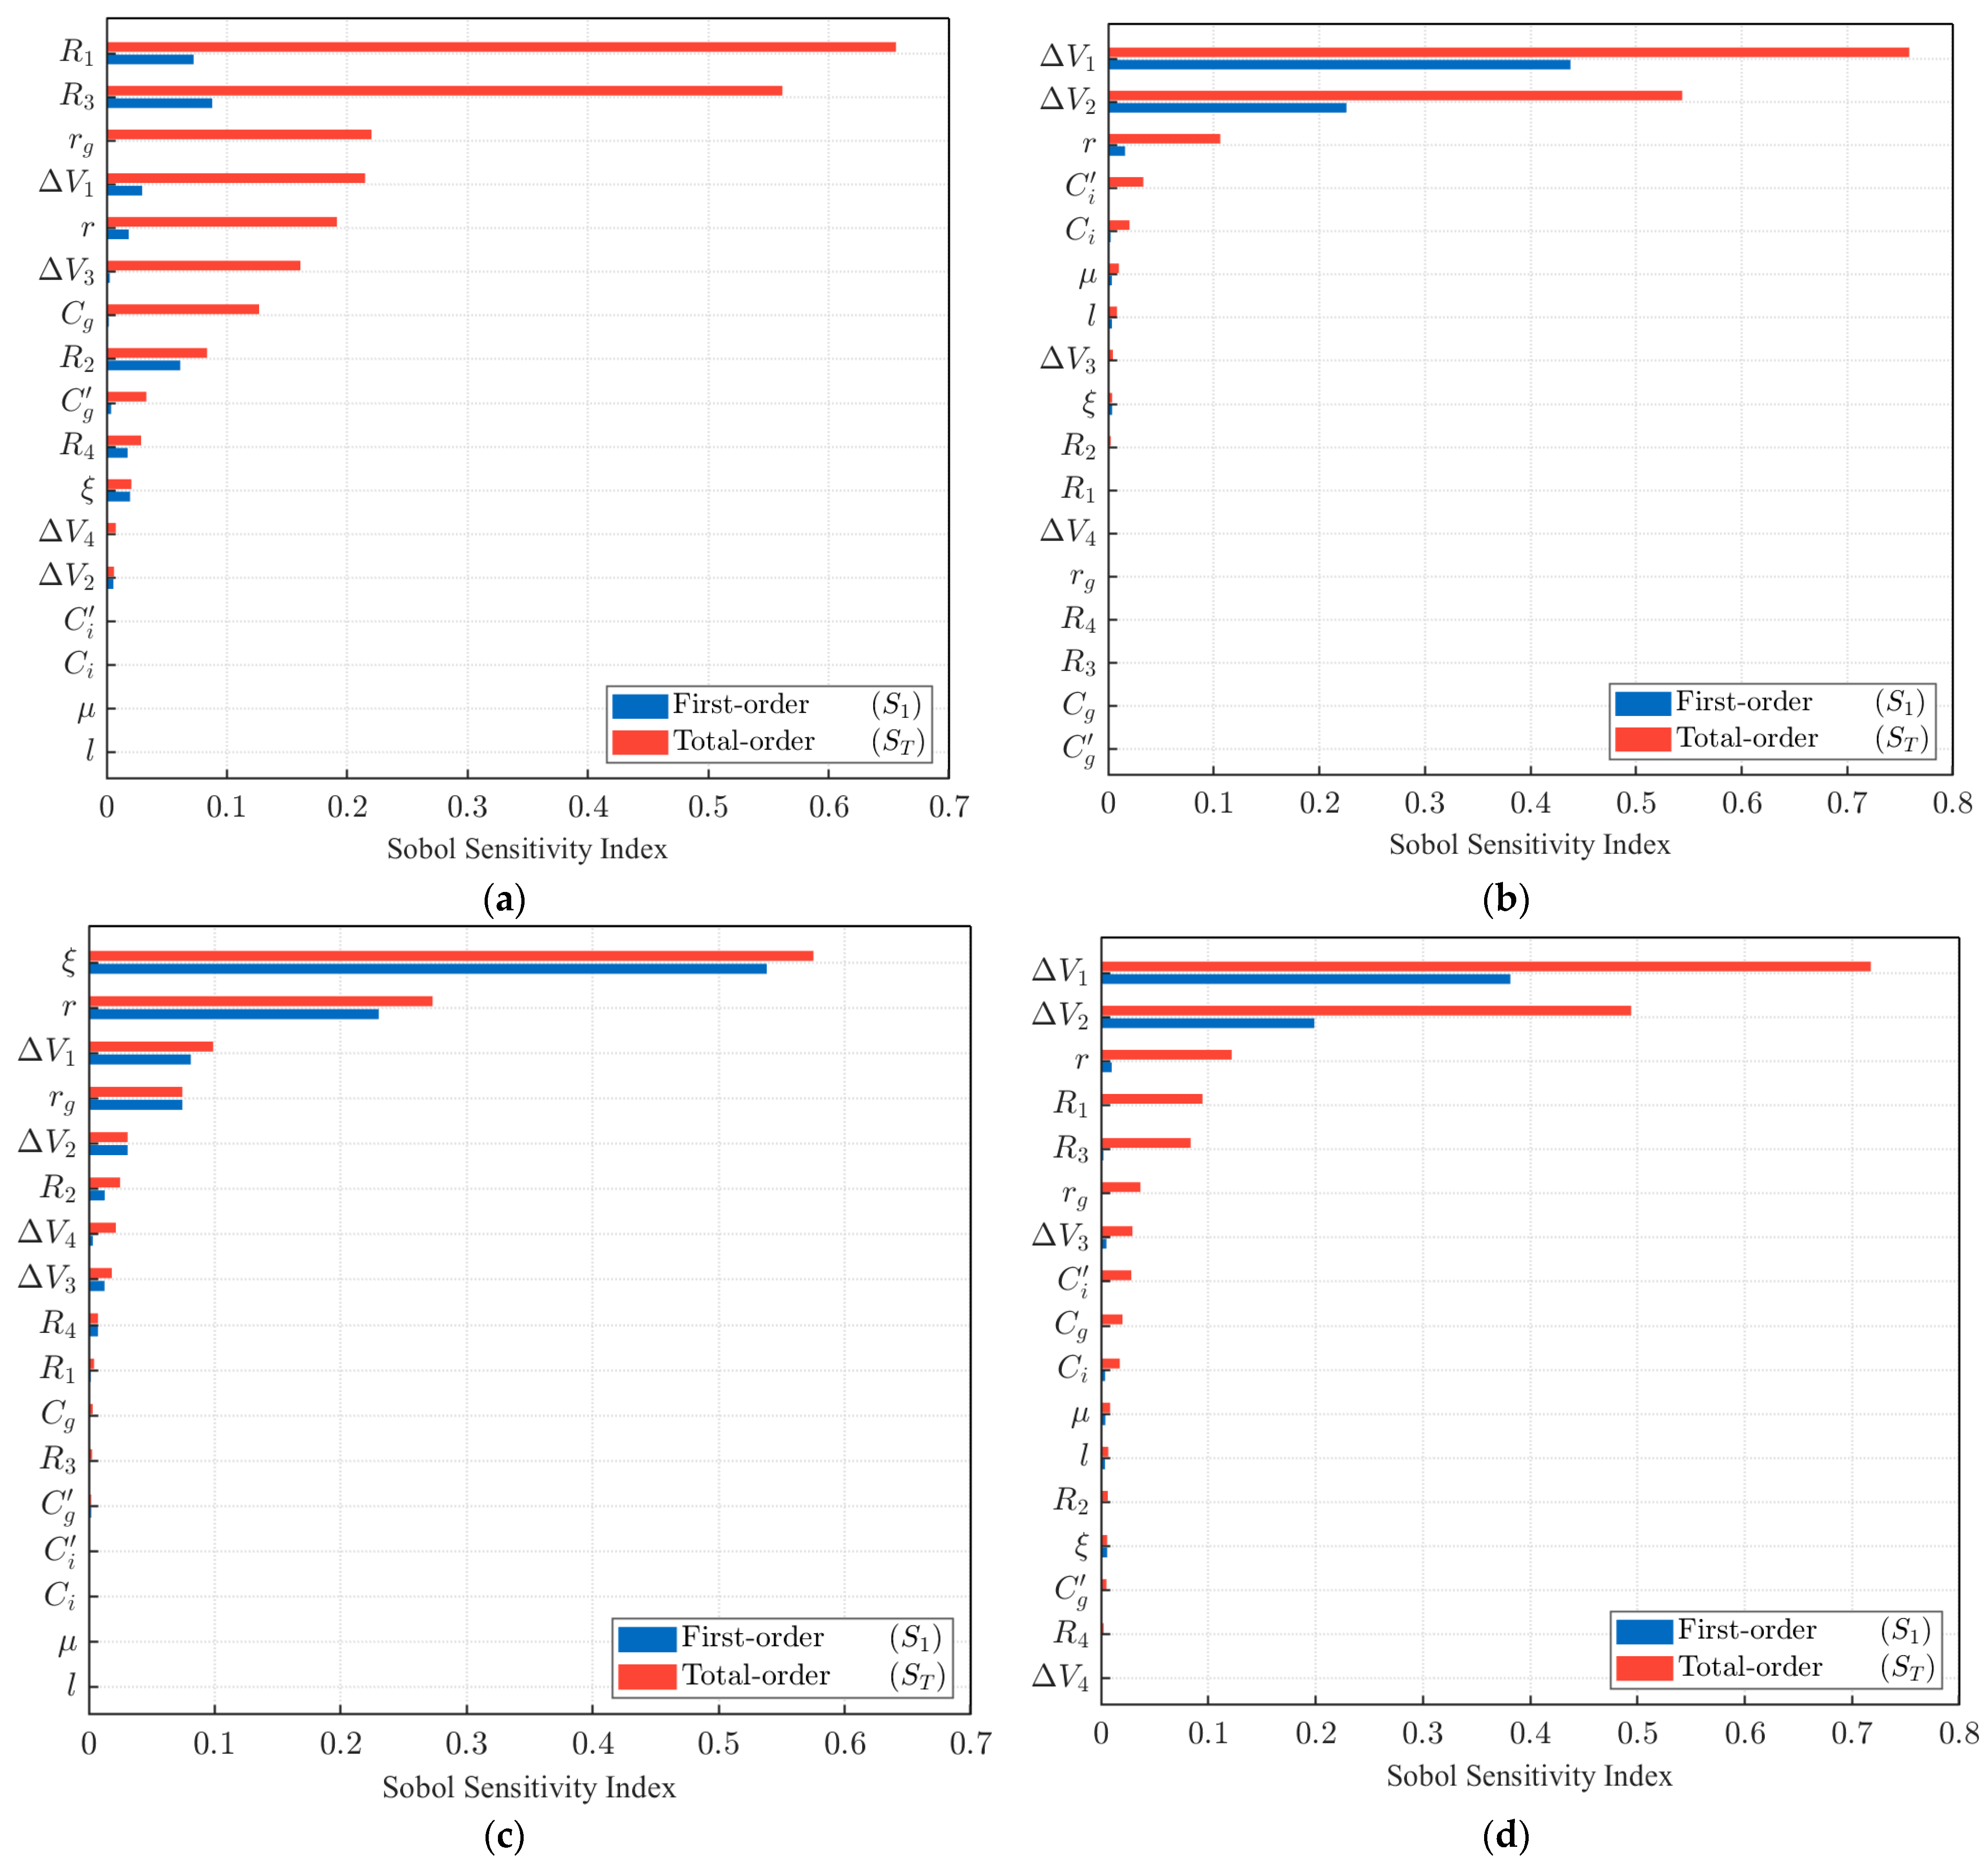
To examine interactions among different parameters, this study employs Sobol sensitivity analysis on 17 uncertain parameters. The Sobol analysis adopts the same parameter ranges as the Monte Carlo analysis. The parameters are assumed to be mutually independent and uniformly distributed over their respective ranges. Parameter samples are generated using the Saltelli full second-order sampling design based on Sobol low-discrepancy sequences, with a base sample size of . The convergence times of the local government, insurance companies, construction enterprises, and the overall system, denoted by and , respectively, are used as output measures. Accordingly, the Sobol indices quantify the contributions of individual parameters and their interactions to variations in convergence time. For each parameter, the first-order sensitivity index and the total-order sensitivity index are calculated. Specifically, represents the individual contribution of a parameter. captures both its individual effect and all interaction effects involving that parameter. Accordingly, reflects the overall contribution of these interactions.
As shown in Figure 14, the convergence time of the local government is primarily influenced by and , while and also exhibit relatively high total effects. The convergence time of insurance companies is mainly influenced by and , whereas that of construction enterprises is primarily affected by and . The overall system convergence time is most sensitive to and . For several parameters, is substantially higher than , indicating that interaction effects make non-negligible contributions to their overall influence.
Figure 14.
Sobol sensitivity analysis of convergence times: (a) Local government (); (b) Insurance companies (); (c) Construction enterprises (); (d) Overall system (). Bars represent first-order () and total-order () indices, with parameters ranked in descending order of .
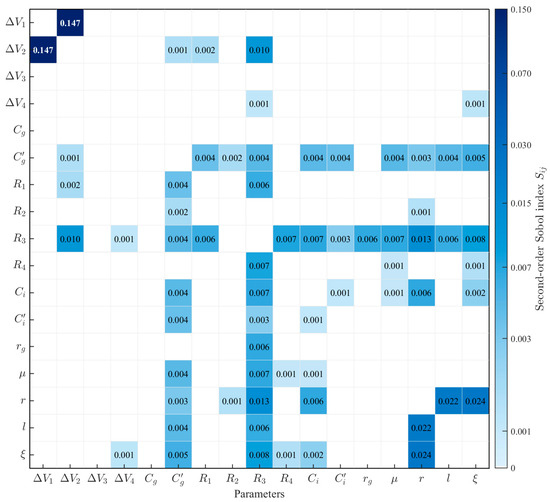
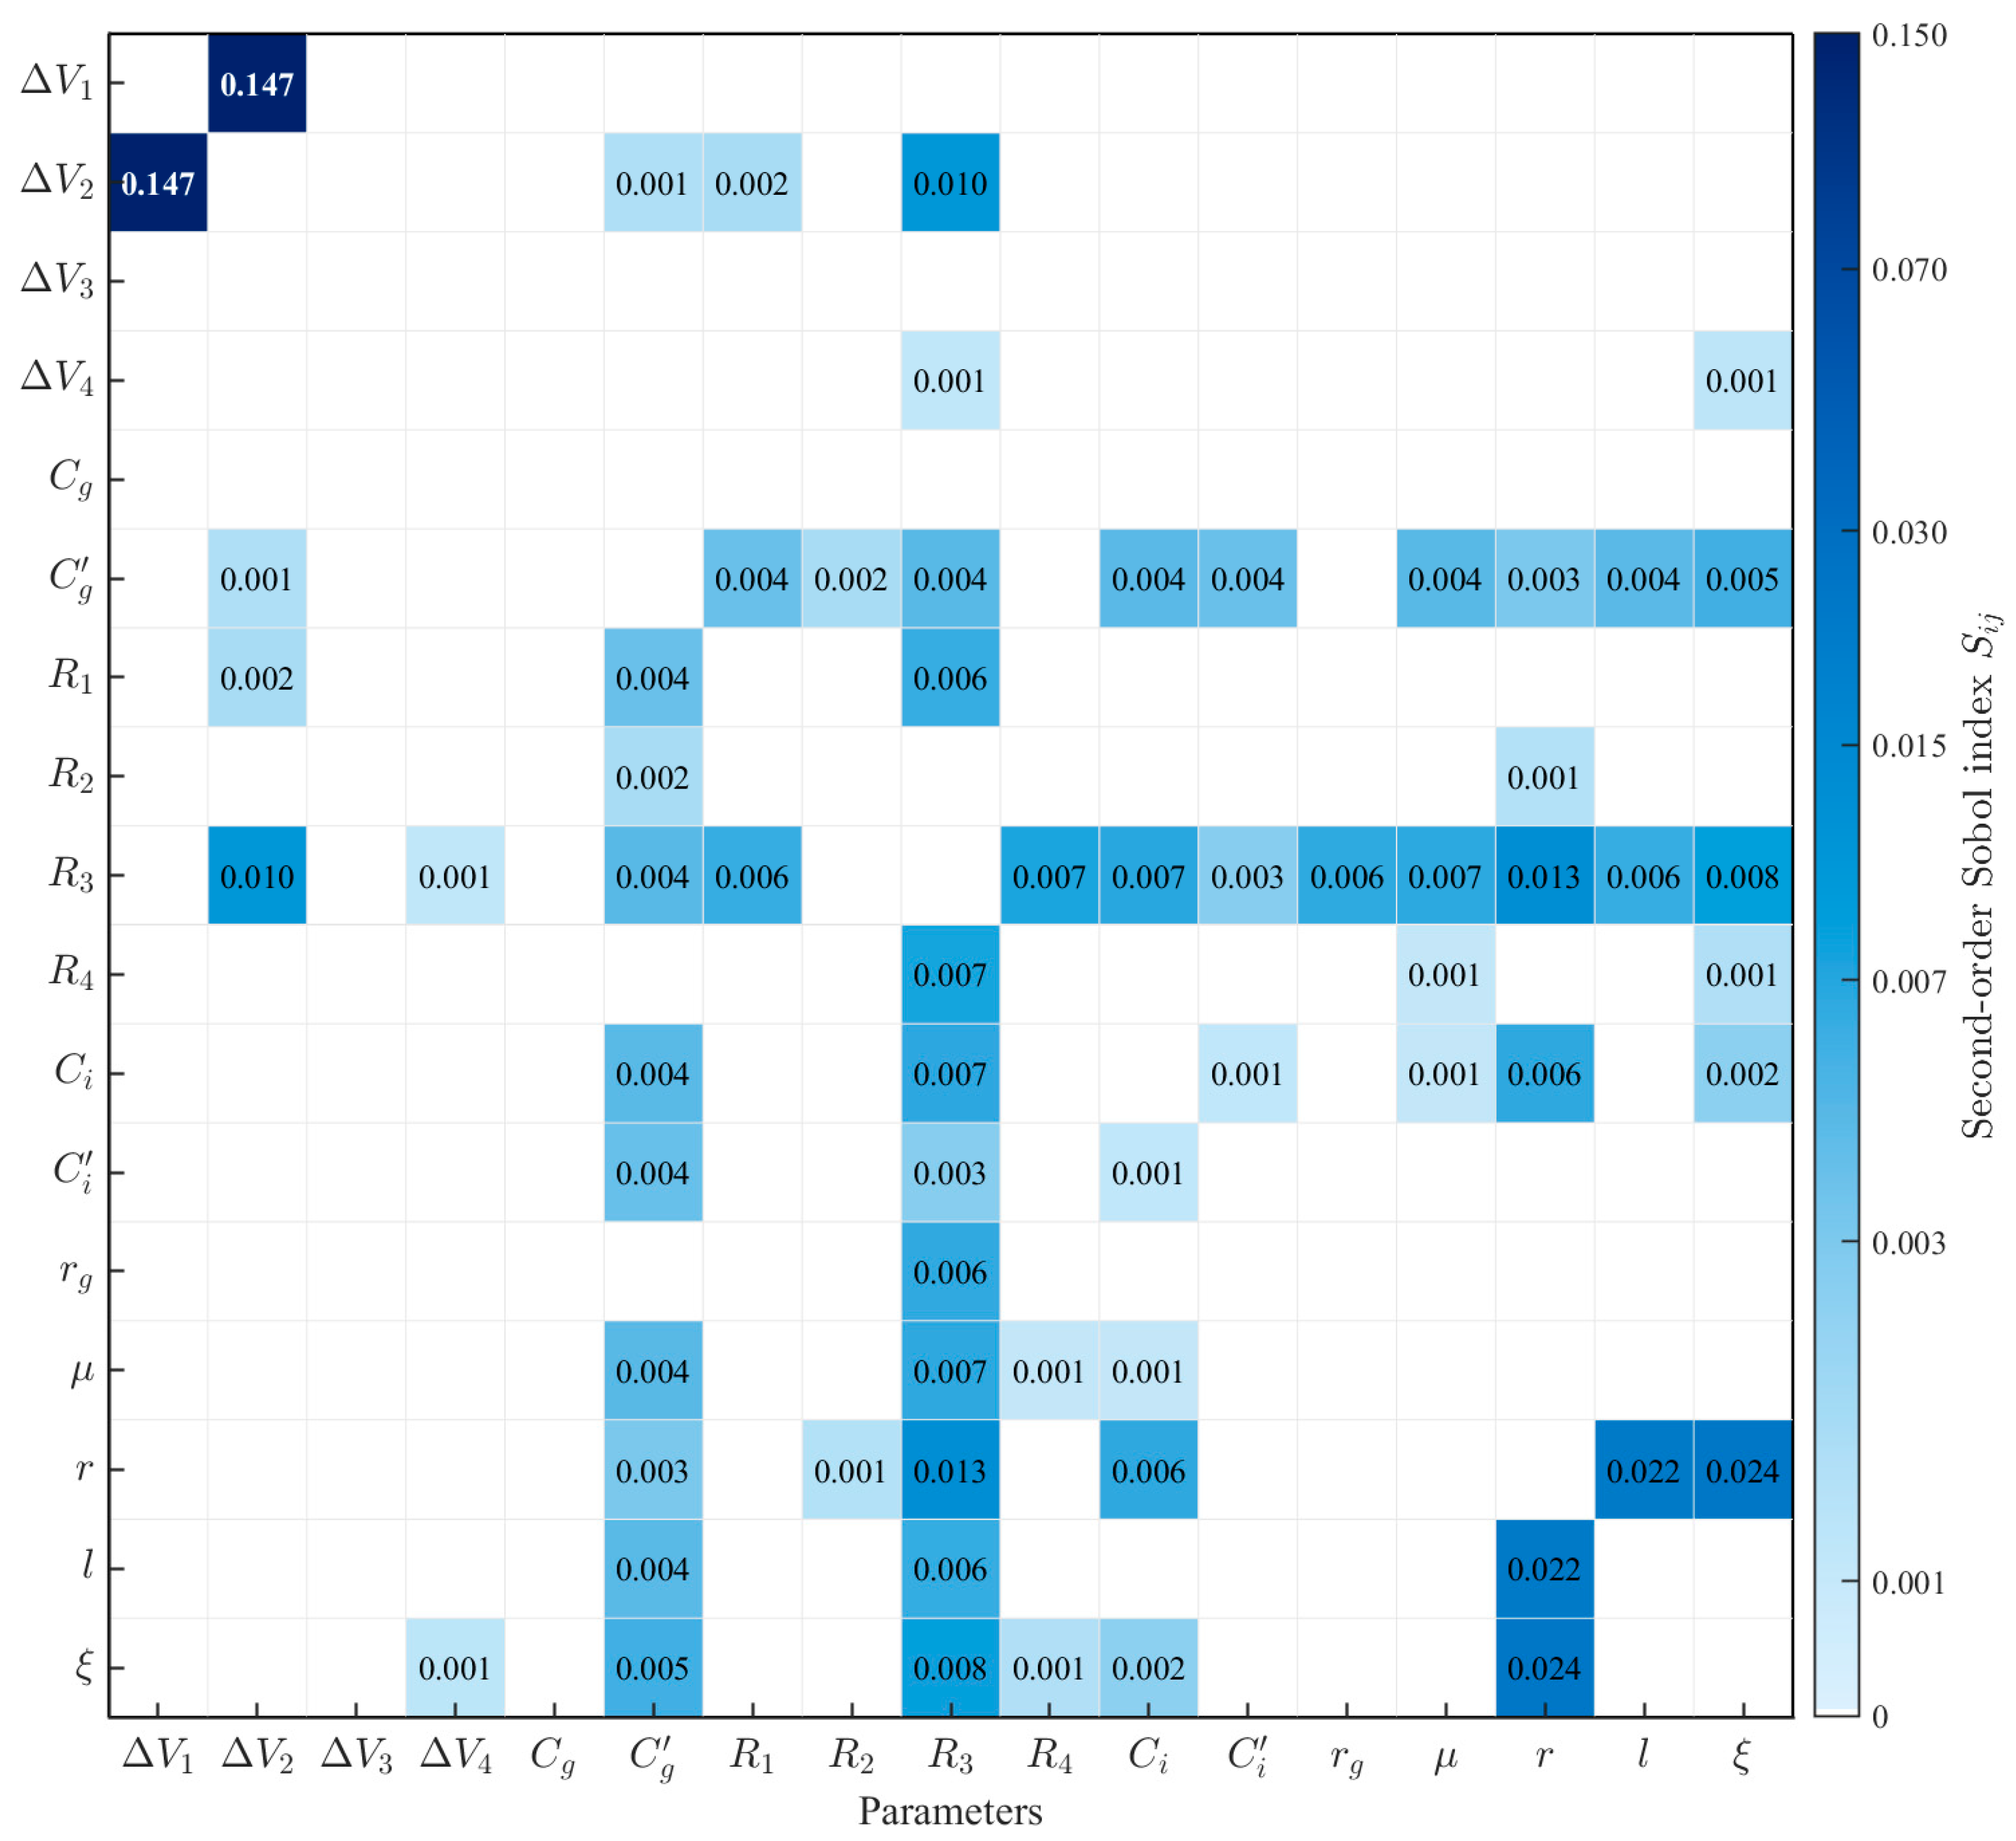
To further identify interactions between specific parameter pairs, the second-order Sobol sensitivity index is calculated using the system convergence time as the output. As shown in Figure 15, the interaction between and is the most pronounced, with , whereas the interactions between the remaining parameter pairs are generally weak. represents the loan increment under active government promotion and active GBPI provision by insurance companies, whereas represents the loan increment under active government promotion but passive GBPI provision by insurance companies. The two parameters characterize the extent of financing improvement associated with different insurance provision strategies under active government promotion. Their difference reflects the additional financing and credit enhancement effect generated by the active provision of GBPI.
Figure 15.
Second-order Sobol interaction indices for system convergence time. Each represents the proportion of variance in the system convergence time attributable to the interaction between parameters and . Cell values show , and color intensity indicates its magnitude.
The Sobol analysis reveals a relatively strong second-order interaction between and , indicating that their interaction has a non-negligible effect on the system’s convergence time. In the model, these two parameters jointly affect the relative payoff advantage of active over passive provision for insurance companies and further influence the financing benefits obtained by construction enterprises through the purchase of GBPI.
Within the model and parameter ranges considered in this study, this result indicates that, under active government promotion, the extent to which policy support can be translated into momentum for GBPI market development depends partly on whether the insurance mechanism can generate substantive credit enhancement and financing improvements.
5. Discussion
Based on the tripartite evolutionary game model involving the local government, insurance companies, and construction enterprises and the numerical simulation results, the following discussion focuses on the behavioral strategies of GBPI stakeholders.
(1) The model reveals a coordinated interaction mechanism among the local government, insurance companies, and construction enterprises. Local government policy support reduces the cost incurred by construction enterprises in purchasing GBPI, thereby expanding demand for GBPI. Rising market demand, in turn, provides insurance companies with stronger incentives to adopt the active provision strategy. The resulting expansion of insurance supply enhances the risk protection and credit enhancement available to green building projects, thereby increasing construction enterprises’ payoffs. These interactions create a positive feedback mechanism in which government policy support, insurance supply, and construction enterprises’ demand for GBPI reinforce one another. Under the specified model assumptions, represents a stable strategy profile when the corresponding parameter conditions are satisfied.
(2) The numerical simulation results reveal two distinct types of parameter effects: effects on convergence dynamics and effects on the final equilibrium. Changes in initial willingness, the premium subsidy rate, the actual premium rate, and loan increments mainly affect evolutionary trajectories and convergence speeds within the examined scenarios without altering the final stable equilibrium. By contrast, the local government’s overall benefits, management costs, and insurance companies’ initial fixed costs can alter the final equilibrium when their respective model-specific decision thresholds are crossed.
The model results regarding initial willingness are consistent with Su et al., who found that the initial state does not determine the system’s ultimate evolutionary direction [32]. A higher premium subsidy rate is associated with a greater fiscal burden for the local government, which is consistent with Wang et al.’s finding that excessively high subsidy levels may reduce the government’s willingness to implement active policies [46]. In contrast to Xue et al.’s finding that green credit may weaken the government’s willingness to adopt an active strategy when promoting enterprise innovation [33], larger loan increments are associated with faster convergence in this model. This difference may arise because green credit represents a relatively independent financial mechanism, whereas the loan increments associated with GBPI reflect the combined influence of policy support, insurance-based credit enhancement, and construction enterprises’ purchase of GBPI. The cost effects identified in this study extend Li et al.’s finding that higher costs discourage stakeholders from adopting active strategies [14].
(3) The model incorporates insurance companies as independent financial stakeholders. Existing studies have demonstrated the importance of financial institutions in green building financing and highlighted the limited attention paid to financial stakeholders in evolutionary game models of green building development [16]. From a risk-management perspective, insurance companies face underwriting, pricing, and claims risks. Deviations in actual building performance from expected targets constitute the core performance risk covered by GBPI. Through risk protection and economic compensation, the insurance mechanism transfers part of the economic consequences arising from performance shortfalls from construction enterprises to insurance companies. The risk-management function of GBPI extends beyond economic compensation after risks materialize. It may also help reduce deviations in green building performance through prior risk assessment and risk pricing, as well as performance monitoring and risk reduction services during project implementation. Risk protection and credit enhancement may also improve the financing conditions of construction enterprises. Therefore, insurance companies serve not only as risk bearers within the GBPI mechanism but also as key actors linking risk identification, risk control, and risk transfer.
(4) Several model-informed policy implications emerge from the analysis. First, the model indicates that the cost burdens borne by the local government and insurance companies should be carefully considered, particularly when management costs or initial fixed costs approach their respective model-specific decision thresholds. Second, the model indicates that the premium subsidy rate and the actual premium rate have different effects on the payoffs of the three stakeholders, with subsidies easing the premium burden on construction enterprises but increasing the local government’s fiscal burden, while higher premium rates increase insurance companies’ returns but reduce construction enterprises’ net profits. Accordingly, the model results suggest that the effective promotion of GBPI may depend on achieving a dynamic balance among the government’s fiscal capacity, the operational sustainability of insurance companies, and the affordability of premiums for construction enterprises, rather than simply increasing either the premium subsidy rate or the actual premium rate.
As GBPI remains at the pilot stage in China, relevant literature and empirical data are still limited. First, the tripartite evolutionary game model developed in this study does not incorporate other relevant stakeholders, such as banks, third-party assessment institutions, and building owners. In particular, banks’ financing support plays an important role in the promotion of GBPI. Due to limitations in the available data, banks have not been included as participants in the model. Second, this study is primarily based on China’s policy environment, and its findings should not be directly generalized to Europe, the United States, or developing countries and regions elsewhere. Third, the assumption limits the model’s ability to represent the endogenous trade-off between construction enterprises’ purchase and non-purchase strategies. Finally, the results of this study should be interpreted as model-based behavioral implications rather than as empirical evidence of actual stakeholder behavior. Future research could incorporate additional stakeholders and project-level empirical data, while further examining factors such as regional heterogeneity, reserve requirements, portfolio risk, opportunity costs, and the value of insurance protection.
6. Conclusions
- (1)
- The model reveals a coordinated interaction mechanism among the local government, insurance companies, and construction enterprises. Local government policy support, insurance provision, and construction enterprises’ demand for GBPI can reinforce one another, forming a positive feedback mechanism.
- (2)
- Under the baseline parameter setting, the system converges to . The model results indicate that changes in initial willingness, the premium subsidy rate, the actual premium rate, and loan increments mainly affect evolutionary trajectories and convergence speeds without altering the final stable equilibrium, whereas the local government’s overall benefits, management costs, and insurance companies’ initial fixed costs can change the final equilibrium when their respective model-specific decision thresholds are crossed. Higher premium subsidy rates are associated with a greater fiscal burden for the local government, whereas higher actual premium rates are associated with lower payoffs for construction enterprises.
- (3)
- A principal model-informed policy implication is that effective GBPI promotion may depend on balancing the local government’s fiscal capacity, the operational sustainability of insurance companies, and the affordability of premiums for construction enterprises.
- (4)
- A key limitation of this study is the limited availability of project-level empirical data on GBPI in China, which constrains direct empirical validation of the model. The findings should therefore be interpreted as model-based behavioral implications rather than as empirical evidence of actual stakeholder behavior.
Author Contributions
Conceptualization, X.C. and D.X.; software, X.C.; validation, J.D., Y.L. and Z.W.; formal analysis, X.C. and Y.L.; investigation, J.D., Y.L. and Z.W.; data curation, D.X. and J.D.; writing—original draft preparation, X.C.; writing—review and editing, X.C. and D.X.; visualization, D.X. and J.D.; supervision, D.X. All authors have read and agreed to the published version of the manuscript.
Funding
This research was funded by the Innovation Program for Post-graduate Students of Chongqing University of Science and Technology. Grant number: YKJCX2520724.
Data Availability Statement
Data is contained within the article.
Conflicts of Interest
The authors declare no conflicts of interest.
Abbreviation
The following abbreviation is used in this manuscript:
| GBPI | Green Building Performance Insurance |
References
- Wang, X.; Sun, Y. A Study on the Green Building Performance Insurance Model. China Econ. Trade Her. 2025, 2, 85–87. [Google Scholar]
- Malifete, L.; Adekunle, S.; Aigbavboa, C.; Mushavhanamadi, K. Sustainable insurance as a catalyst for green building investments in Africa. Front. Sustain. Cities 2026, 8, 1798602. [Google Scholar] [CrossRef] [Scilit]
- National Financial Regulatory Administration. Guiding Opinions on Promoting the High-Quality Development of Green Insurance. Available online: https://www.gov.cn/zhengce/zhengceku/202404/content_6947537.htm (accessed on 7 June 2026).
- GB/T 50378-2019; Announcement on Partial Revisions to the Green Building Evaluation Standard. Ministry of Housing and Urban-Rural Development of the People’s Republic of China: Beijing, China, 2024. Available online: https://www.mohurd.gov.cn/gongkai/zc/wjk/art/2024/art_17339_779172.html (accessed on 7 June 2026).
- Mo, Z. Recommendations for Green Insurance to Support the Large-Scale Development of Green Buildings. Constr. Sci. Technol. 2017, 9, 18–19. [Google Scholar] [CrossRef]
- Liu, P.; Lin, B.; Zhou, H.; Li, X.; Papachristos, G. Effect of green finance on the green transformation of China’s building sector: A system dynamics assessment for targeted financing instruments and policies. Energy 2025, 334, 137845. [Google Scholar] [CrossRef] [Scilit]
- U.S. Green Building Council. What Is Green Building? Available online: https://www.usgbc.org/articles/what-green-building?utm (accessed on 7 June 2026).
- Li, J. Thinking about the Whole-process Management Mode ofGreen Buildings under the New Situation. Build. Sci. 2020, 36, 174–179. [Google Scholar] [CrossRef]
- Liu, J.; Wang, Y.; Wang, Y.; Wang, D. Challenges and Recommendations for the Development of the Green Building Design Standards System. Bull. Natl. Nat. Sci. Found. China 2023, 37, 360–363. [Google Scholar] [CrossRef]
- Dwaikat, L.N.; Ali, K.N. Green buildings life cycle cost analysis and life cycle budget development: Practical applications. J. Build. Eng. 2018, 18, 303–311. [Google Scholar] [CrossRef] [Scilit]
- Hu, W.; Kong, D.; He, X. Analysis on Influencing Factors of Green Building Development Based on BP-WINGS. Soft Sci. 2020, 34, 75–81. [Google Scholar] [CrossRef]
- Debrah, C.; Chan, A.P.C.; Darko, A. Green finance gap in green buildings: A scoping review and future research needs. Build. Environ. 2022, 207, 108443. [Google Scholar] [CrossRef] [Scilit]
- Chen, L.; Zhang, M.; Zhao, S. Game analysis of the multiagent evolution of existing building green retrofitting from the perspective of green credit. Discret. Dyn. Nat. Soc. 2021, 2021, 5560671. [Google Scholar] [CrossRef] [Scilit]
- Li, J.; Xu, N.; Liu, Q.; Zhao, H. How to Promote the Application of Green Construction Technologies in the Chengdu-Chongqing Economic Circle: A Tripartite Evolutionary Game Analysis. Buildings 2026, 16, 62. [Google Scholar] [CrossRef] [Scilit]
- An, G. Exploring Pathways for Green Finance Innovation Under Carbon Neutrality Goals. South China Financ. 2021, 2, 3–12. [Google Scholar]
- Mbokane, L.; Reinink, M.; Ntakana, K.; Modley, L.-A. Financing green buildings in South Africa: The role of financial institutions and green finance incentives. Front. Sustain. Cities 2026, 8, 1758057. [Google Scholar] [CrossRef] [Scilit]
- Liu, X. Effectively leverage the enabling role of green insurance in achieving carbon peak and carbon neutrality goals. Financ. View 2022, 2, 52–54. [Google Scholar]
- Yang, P.; Qin, Y.; Wei, P.; Liu, B. International Experience and China’s Practices in Financial Support for Green Building Development. Hebei Financ. 2023, 11, 3–6+68. [Google Scholar] [CrossRef]
- Stricker, L.; Pugnetti, C.; Wagner, J.; Zeier Röschmann, A. Green Insurance: A Roadmap for Executive Management. J. Risk Financ. Manag. 2022, 15, 221. [Google Scholar] [CrossRef] [Scilit]
- Töppel, J.; Tränkler, T. Modeling energy efficiency insurances and energy performance contracts for a quantitative comparison of risk mitigation potential. Energy Econ. 2019, 80, 842–859. [Google Scholar] [CrossRef] [Scilit]
- Brown, D.; Hall, S.; Martiskainen, M.; Davis, M.E. Conceptualising domestic energy service business models: A typology and policy recommendations. Energy Policy 2022, 161, 112704. [Google Scholar] [CrossRef] [Scilit]
- Baltuttis, D.; Töppel, J.; Tränkler, T.; Wiethe, C. Managing the risks of energy efficiency insurances in a portfolio context: An actuarial diversification approach. Int. Rev. Financ. Anal. 2020, 68, 101313. [Google Scholar] [CrossRef] [Scilit]
- Giraudet, L.-G.; Houde, S.; Maher, J. Moral Hazard and the Energy Efficiency Gap: Theory and Evidence. J. Assoc. Environ. Resour. Econ. 2018, 5, 755–790. [Google Scholar] [CrossRef] [Scilit]
- Devine, A.; McCollum, M. Advancing energy efficiency through green bond policy: Multifamily green mortgage backed securities issuance. J. Clean. Prod. 2022, 345, 131019. [Google Scholar] [CrossRef] [Scilit]
- Leutner, S.; Gloria, B.; Bienert, S. Is there a green discount in commercial real estate lending? J. Prop. Invest. Financ. 2024, 42, 411–434. [Google Scholar] [CrossRef] [Scilit]
- Wan, S.; Liu, Y.; Ding, G.; Runeson, G.; Er, M. Risk allocation for energy performance contract from the perspective of incomplete contract: A study of commercial buildings in China. Int. J. Clim. Change Strateg. Manag. 2022, 15, 457–478. [Google Scholar] [CrossRef] [Scilit]
- He, W.; Liu, P.; Lin, B.; Zhou, H.; Chen, X. Green finance support for development of green buildings in China: Effect, mechanism, and policy implications. Energy Policy 2022, 165, 112973. [Google Scholar] [CrossRef] [Scilit]
- Wang, Y.; Xiang, F.; Xie, Z. Insurance Accelerating Coordinated Development of Green Building and Green Finance. Constr. Sci. Technol. 2020, 20, 44–47. [Google Scholar] [CrossRef]
- Zhu, W.; Feng, X. Innovative Green Building Performance Insurance Helps Achieve Carbon Neutrality Goals in the Construction Sector. In Zhejiang Insurance Papers Compilation; PICC Property&Casualty Insurance Huzhou Branch: Huzhou, China, 2022; pp. 31–32. [Google Scholar]
- Zhang, X.; Zheng, L.; He, F.; Wang, W. Analysis and Suggestions on Insurance Mechanism in Promoting the High-quality Development of Green Building. Constr. Sci. Technol. 2020, 9, 68–69+73. [Google Scholar] [CrossRef]
- She, Y.; Pu, N.; Wang, Y.; Li, J.; Peng, X.; Lv, Q.; Ma, M. Drivers for the Acceptance of Green Housing Insurance from the Perspective of House Owners. Buildings 2025, 15, 1241. [Google Scholar] [CrossRef] [Scilit]
- Su, Y.; Zhang, Z. Evolutionary Game Analysis on the Promotion of Green Buildings in China Under the “Dual Carbon” Goals: A Multi-Stakeholder Perspective. Buildings 2025, 15, 1392. [Google Scholar] [CrossRef] [Scilit]
- Xue, S.; Qian, J.; Fang, J. Research on the Evolutionary Game Theory of Green Technological Innovation in Construction Companies Under the “Dual Carbon” Objectives. Buildings 2025, 15, 3826. [Google Scholar] [CrossRef] [Scilit]
- Xiao, Y.; Yu, Y.; Cui, M.; Ji, H. A Game Theoretical Analysis of the Evolution of Decision-Making Behavior Among Green Building Stakeholders Based on a System Dynamics Model. Chin. J. Syst. Sci. 2024, 32, 54–59. [Google Scholar]
- Cohen, C.; Pearlmutter, D.; Schwartz, M. A game theory-based assessment of the implementation of green building in Israel. Build. Environ. 2017, 125, 122–128. [Google Scholar] [CrossRef] [Scilit]
- Colivicchi, I.; Iannucci, G. The Environmental Responsibility of Firms and Insurance Coverage in an Evolutionary Game. Dyn. Games Appl. 2023, 13, 801–818. [Google Scholar] [CrossRef] [Scilit]
- Lu, X.; Yang, C.; Ma, W.; Yang, H. Evolutionary game analysis on governments and developers’ behavioral strategies: Impact of dynamic incentives for green building. Energy Build. 2025, 336, 115631. [Google Scholar] [CrossRef] [Scilit]
- Yin, S.; Li, B.; Xing, Z. The governance mechanism of the building material industry (BMI) in transformation to green BMI: The perspective of green building. Sci. Total Environ. 2019, 677, 19–33. [Google Scholar] [CrossRef] [Scilit] [PubMed]
- Chen, F.; Wu, B.; Lou, W. An evolutionary analysis on the effect of government policies on green R & D of photovoltaic industry diffusion in complex network. Energy Policy 2021, 152, 112217. [Google Scholar] [CrossRef] [Scilit]
- Li, Q.; Qian, T.; Hua, Q.; Min, J.; Zhao, Y.; Wang, Q.; Long, R. Collaboration and regulation: A dual regulatory game for the sustainable development of green housing. Res. Int. Bus. Financ. 2025, 74, 102697. [Google Scholar] [CrossRef] [Scilit]
- Shao, C.; Luo, Y. A Study on the Background, Drivers, and Policy Support for the Development of Green Insurance from a Dynamic Game Theory Perspective. J. Beijing Univ. Chem. Technol. (Soc. Sci. Ed.) 2018, 2, 6–13. [Google Scholar]
- Chen, C.; Tang, X. Strategies of Metaverse Safety Training in Highway Construction Projects: A Tripartite Evolutionary Game. Buildings 2025, 15, 4083. [Google Scholar] [CrossRef] [Scilit]
- Ritzberger, K.; Weibull, J.W. Evolutionary selection in normal-form games. Econom. J. Econom. Soc. 1995, 63, 1371–1399. [Google Scholar] [CrossRef] [Scilit]
- Lyapunov, A.M. The general problem of the stability of motion. Int. J. Control 1992, 55, 531–534. [Google Scholar] [CrossRef] [Scilit]
- Chao, L.; Deng, X. A Study on a Synergistic Mechanism for Engineering Performance Guarantees and Insurance Against Potential Defects in Construction Quality Based on Evolutionary Game Theory. J. Tsinghua Univ. (Sci. Technol.) 2026, 66, 888–897. [Google Scholar] [CrossRef]
- Wang, X.; Guo, F.; Zhang, B.; Li, Y. Environmental pollution liability insurance policy and corporate green innovation: The effect of environmental governance and internal governance. Econ. Anal. Policy 2025, 88, 476–491. [Google Scholar] [CrossRef] [Scilit]

Disclaimer/Publisher’s Note: The statements, opinions and data contained in all publications are solely those of the individual author(s) and contributor(s) and not of MDPI and/or the editor(s). MDPI and/or the editor(s) disclaim responsibility for any injury to people or property resulting from any ideas, methods, instructions or products referred to in the content. |
© 2026 by the authors. Licensee MDPI, Basel, Switzerland. This article is an open access article distributed under the terms and conditions of the Creative Commons Attribution (CC BY) license.